3d-modeling of deformed halite hopper crystals by object basedimage analysis
TRANSCRIPT
3D-modeling of deformed halite hopper crystals by Object BasedImage Analysis
Christoph Leitner a,n, Peter Hofmann b, Robert Marschallinger b
a Ludwig-Maximilians University – Department of Earth and Environmental Sciences, Luisenstrasse 37, 80333 Munich, Germanyb University of Salzburg – Department of Geoinformatics, Schillerstraße 30, 5020 Salzburg, Austria
a r t i c l e i n f o
Article history:Received 27 April 2014Received in revised form19 August 2014Accepted 20 August 2014Available online 28 August 2014
Keywords:OBIASVM3D modelingHaliteHopper crystalsAccuracy assessment
a b s t r a c t
Object Based Image Analysis (OBIA) is an established method for analyzing multiscale and multi-dimensional imagery in a range of disciplines. In the present study this method was used for the 3Dreconstruction of halite hopper crystals in a mudrock sample, based on Computed Tomography data.To quantitatively assess the reliability of OBIA results, they were benchmarked against a corresponding“gold standard”, a reference 3D model of the halite crystals that was derived by manual expertdigitization of the CT images. For accuracy assessment, classical per-scene statistics were extended toper-object statistics. The strength of OBIA was to recognize all objects similar to halite hopper crystalsand in particular to eliminate cracks. Using a support vector machine (SVM) classifier on top of OBIA,unsuitable objects like halite crystal clusters, polyhalite-coated crystals and spherical halite crystals wereeffectively dismissed, but simultaneously the number of well-shaped halites was reduced.
& 2014 Elsevier Ltd. All rights reserved.
1. Introduction
The non-destructive 3D-reconstruction of geological objectsfrom X-ray computed tomography (CT) is of major importance togeosciences (Mees et al., 2003). Besides impressive applications inpaleontology and the detection of other peculiar well-preservedstructures, CT-derived 3D models are superior for reconstructingthe fabric of deformed rocks. In the current context the spectraland geometrical properties of halite hopper crystals, as inferredfrom CT, were used to automatically identify suitable crystals for alater strain analysis.
Deformed halite cubes in lithified sediment occur worldwide (e.g.Haidinger, 1847; Görgey, 1912; Haude, 1970; Gornitz and Schreiber,1981; Benison and Goldstein, 2000; Kendall, 2000). Halite is a cubicmineral that crystallizes as cubes, as far as crystal growth is notinhibited. In non-consolidated sediment, e.g. mud, halite crystallizesas euhedral cubes with reduced sides in a hoppered shape, asobserved in the Dead Sea (Gornitz and Schreiber, 1981). Similarhalite hopper crystals occur in Alpine rock salt deposits. Their shapescomprise tetragonal bodies, rhombohedrons, parallelepipeds or mix-tures of these (Görgey, 1912). Halite deforms under low stressconditions (e.g. Urai et al., 2008) and it can be plausibly assumed
that the Alpine halite hopper crystals were deformed by plasticcreep. As such, by reconstructing the shape of halite crystals the formand orientation of the average strain ellipsoid can be deduced.
In previous work (Leitner et al., 2013) we used the shape ofhalite hopper crystals embedded in mudrock for deformationanalysis. A sample comprising mudrock with halite hopper crystalswas subject to CT scanning, yielding a stack of gray level images.Although the crystals in the CT images could be readily identifiedby the eye, perturbing noise prevented the use of standard pixel-based image processing for the extraction of crystal shapes. In theabove, first approach the contours of the halite hopper crystalswere traced manually on each image. From this image stack, a 3Dmodel of the halite hopper crystals was compiled which thenserved for strain analysis.
The present study is based on the same CT scan, but this time weused Object Based Image Analysis (OBIA) for the automatic extrac-tion and analysis of halite crystals. OBIA is a widespread andmatured method to process remotely sensed images and multi-dimensional (3Dþt) life science image data (Blaschke et al., 2012),with geological applications emerging in the recent years(Marschallinger and Hofmann, 2010, Marschallinger et al., 2011,Fadel et al., in press). While manual tracing is time consuming,error-prone and hard to reproduce, an OBIA-based 3D-reconstruc-tion is controlled by transparent and reproducible rule-sets. The CTimages were first automatically classified according to halite crystalfeatures, followed by a 3D reconstruction of halite crystals. An OBIArule set was developed that can be re-applied to similar data
Contents lists available at ScienceDirect
journal homepage: www.elsevier.com/locate/cageo
Computers & Geosciences
http://dx.doi.org/10.1016/j.cageo.2014.08.0100098-3004/& 2014 Elsevier Ltd. All rights reserved.
n Corresponding author. þ49 89 2180 6524.E-mail addresses: [email protected] (C. Leitner),
[email protected] (P. Hofmann),[email protected] (R. Marschallinger).
Computers & Geosciences 73 (2014) 61–70
(see Appendix A). The paper in hand discusses the advantages andarising problems of OBIA for the automated reconstruction of halitecrystals embedded in mudrock.
2. Materials and methods
2.1. Halite hopper crystals and X-ray computed tomography
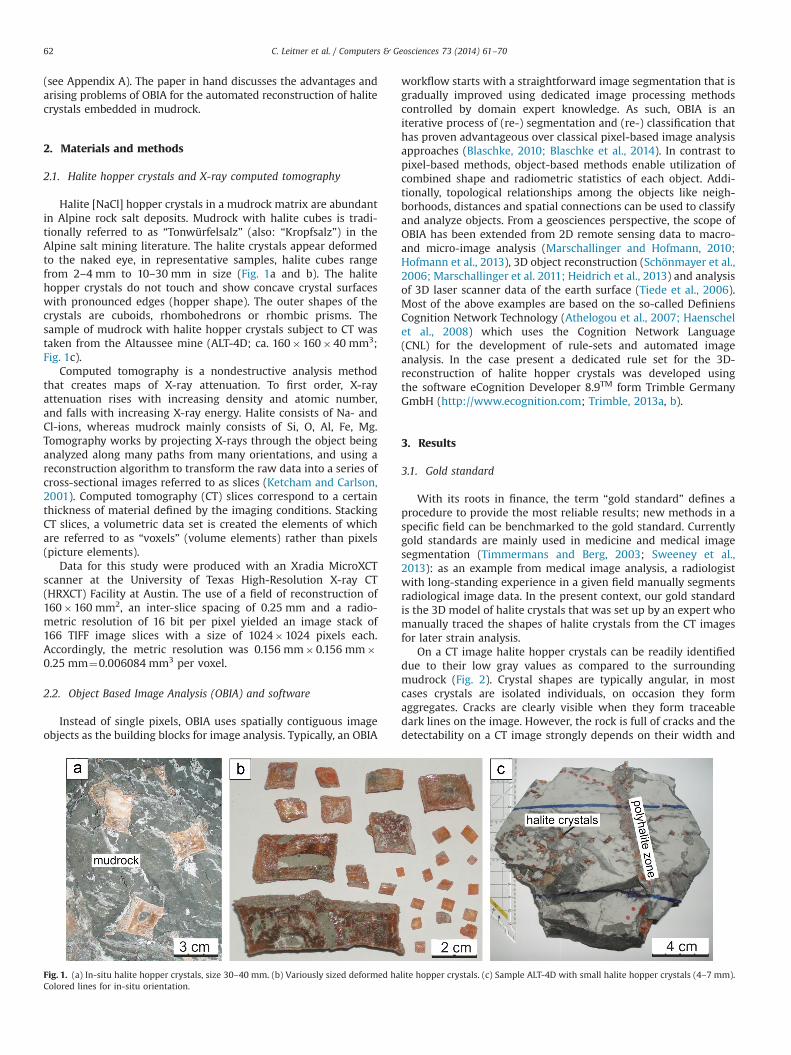
Halite [NaCl] hopper crystals in a mudrock matrix are abundantin Alpine rock salt deposits. Mudrock with halite cubes is tradi-tionally referred to as “Tonwürfelsalz” (also: “Kropfsalz”) in theAlpine salt mining literature. The halite crystals appear deformedto the naked eye, in representative samples, halite cubes rangefrom 2–4 mm to 10–30 mm in size (Fig. 1a and b). The halitehopper crystals do not touch and show concave crystal surfaceswith pronounced edges (hopper shape). The outer shapes of thecrystals are cuboids, rhombohedrons or rhombic prisms. Thesample of mudrock with halite hopper crystals subject to CT wastaken from the Altaussee mine (ALT-4D; ca. 160�160�40 mm3;Fig. 1c).
Computed tomography is a nondestructive analysis methodthat creates maps of X-ray attenuation. To first order, X-rayattenuation rises with increasing density and atomic number,and falls with increasing X-ray energy. Halite consists of Na- andCl-ions, whereas mudrock mainly consists of Si, O, Al, Fe, Mg.Tomography works by projecting X-rays through the object beinganalyzed along many paths from many orientations, and using areconstruction algorithm to transform the raw data into a series ofcross-sectional images referred to as slices (Ketcham and Carlson,2001). Computed tomography (CT) slices correspond to a certainthickness of material defined by the imaging conditions. StackingCT slices, a volumetric data set is created the elements of whichare referred to as “voxels” (volume elements) rather than pixels(picture elements).
Data for this study were produced with an Xradia MicroXCTscanner at the University of Texas High-Resolution X-ray CT(HRXCT) Facility at Austin. The use of a field of reconstruction of160�160 mm2, an inter-slice spacing of 0.25 mm and a radio-metric resolution of 16 bit per pixel yielded an image stack of166 TIFF image slices with a size of 1024�1024 pixels each.Accordingly, the metric resolution was 0.156 mm�0.156 mm�0.25 mm¼0.006084 mm3 per voxel.
2.2. Object Based Image Analysis (OBIA) and software
Instead of single pixels, OBIA uses spatially contiguous imageobjects as the building blocks for image analysis. Typically, an OBIA
workflow starts with a straightforward image segmentation that isgradually improved using dedicated image processing methodscontrolled by domain expert knowledge. As such, OBIA is aniterative process of (re-) segmentation and (re-) classification thathas proven advantageous over classical pixel-based image analysisapproaches (Blaschke, 2010; Blaschke et al., 2014). In contrast topixel-based methods, object-based methods enable utilization ofcombined shape and radiometric statistics of each object. Addi-tionally, topological relationships among the objects like neigh-borhoods, distances and spatial connections can be used to classifyand analyze objects. From a geosciences perspective, the scope ofOBIA has been extended from 2D remote sensing data to macro-and micro-image analysis (Marschallinger and Hofmann, 2010;Hofmann et al., 2013), 3D object reconstruction (Schönmayer et al.,2006; Marschallinger et al. 2011; Heidrich et al., 2013) and analysisof 3D laser scanner data of the earth surface (Tiede et al., 2006).Most of the above examples are based on the so-called DefiniensCognition Network Technology (Athelogou et al., 2007; Haenschelet al., 2008) which uses the Cognition Network Language(CNL) for the development of rule-sets and automated imageanalysis. In the case present a dedicated rule set for the 3D-reconstruction of halite hopper crystals was developed usingthe software eCognition Developer 8.9TM form Trimble GermanyGmbH (http://www.ecognition.com; Trimble, 2013a, b).
3. Results
3.1. Gold standard
With its roots in finance, the term “gold standard” defines aprocedure to provide the most reliable results; new methods in aspecific field can be benchmarked to the gold standard. Currentlygold standards are mainly used in medicine and medical imagesegmentation (Timmermans and Berg, 2003; Sweeney et al.,2013): as an example from medical image analysis, a radiologistwith long-standing experience in a given field manually segmentsradiological image data. In the present context, our gold standardis the 3D model of halite crystals that was set up by an expert whomanually traced the shapes of halite crystals from the CT imagesfor later strain analysis.
On a CT image halite hopper crystals can be readily identifieddue to their low gray values as compared to the surroundingmudrock (Fig. 2). Crystal shapes are typically angular, in mostcases crystals are isolated individuals, on occasion they formaggregates. Cracks are clearly visible when they form traceabledark lines on the image. However, the rock is full of cracks and thedetectability on a CT image strongly depends on their width and
Fig. 1. (a) In-situ halite hopper crystals, size 30–40 mm. (b) Variously sized deformed halite hopper crystals. (c) Sample ALT-4D with small halite hopper crystals (4–7 mm).Colored lines for in-situ orientation.
C. Leitner et al. / Computers & Geosciences 73 (2014) 61–7062
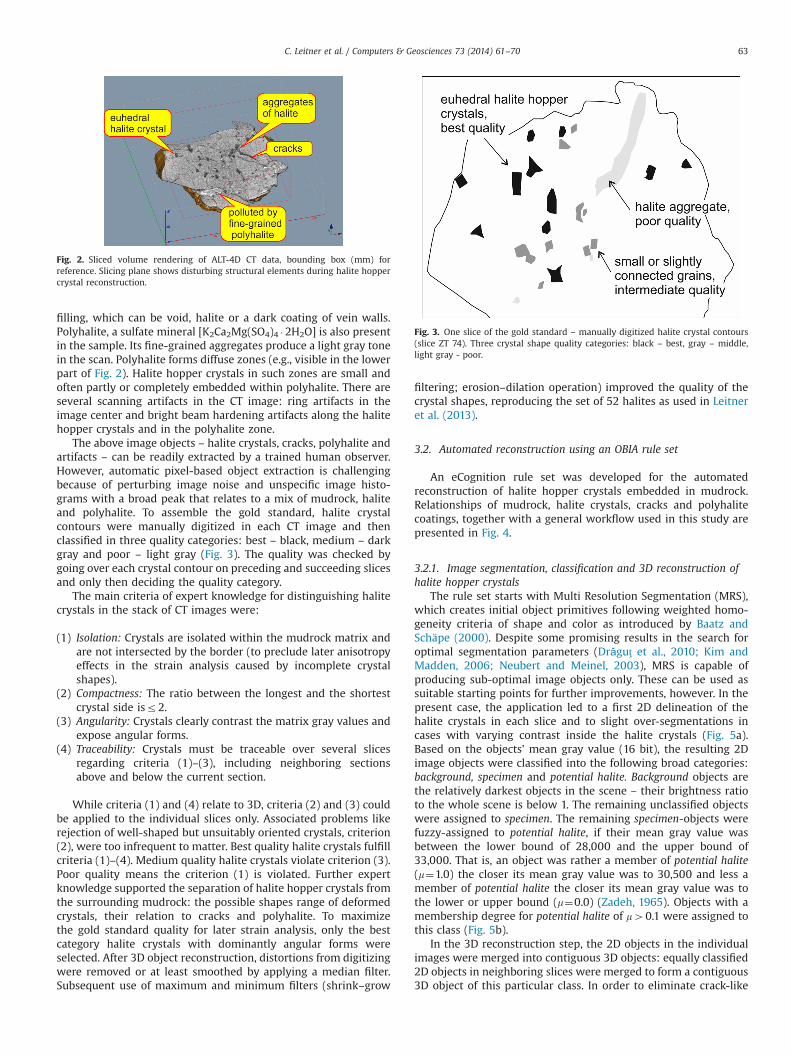
filling, which can be void, halite or a dark coating of vein walls.Polyhalite, a sulfate mineral [K2Ca2Mg(SO4)4 �2H2O] is also presentin the sample. Its fine-grained aggregates produce a light gray tonein the scan. Polyhalite forms diffuse zones (e.g., visible in the lowerpart of Fig. 2). Halite hopper crystals in such zones are small andoften partly or completely embedded within polyhalite. There areseveral scanning artifacts in the CT image: ring artifacts in theimage center and bright beam hardening artifacts along the halitehopper crystals and in the polyhalite zone.
The above image objects – halite crystals, cracks, polyhalite andartifacts – can be readily extracted by a trained human observer.However, automatic pixel-based object extraction is challengingbecause of perturbing image noise and unspecific image histo-grams with a broad peak that relates to a mix of mudrock, haliteand polyhalite. To assemble the gold standard, halite crystalcontours were manually digitized in each CT image and thenclassified in three quality categories: best – black, medium – darkgray and poor – light gray (Fig. 3). The quality was checked bygoing over each crystal contour on preceding and succeeding slicesand only then deciding the quality category.
The main criteria of expert knowledge for distinguishing halitecrystals in the stack of CT images were:
(1) Isolation: Crystals are isolated within the mudrock matrix andare not intersected by the border (to preclude later anisotropyeffects in the strain analysis caused by incomplete crystalshapes).
(2) Compactness: The ratio between the longest and the shortestcrystal side isr2.
(3) Angularity: Crystals clearly contrast the matrix gray values andexpose angular forms.
(4) Traceability: Crystals must be traceable over several slicesregarding criteria (1)–(3), including neighboring sectionsabove and below the current section.
While criteria (1) and (4) relate to 3D, criteria (2) and (3) couldbe applied to the individual slices only. Associated problems likerejection of well-shaped but unsuitably oriented crystals, criterion(2), were too infrequent to matter. Best quality halite crystals fulfillcriteria (1)–(4). Medium quality halite crystals violate criterion (3).Poor quality means the criterion (1) is violated. Further expertknowledge supported the separation of halite hopper crystals fromthe surrounding mudrock: the possible shapes range of deformedcrystals, their relation to cracks and polyhalite. To maximizethe gold standard quality for later strain analysis, only the bestcategory halite crystals with dominantly angular forms wereselected. After 3D object reconstruction, distortions from digitizingwere removed or at least smoothed by applying a median filter.Subsequent use of maximum and minimum filters (shrink–grow
filtering; erosion–dilation operation) improved the quality of thecrystal shapes, reproducing the set of 52 halites as used in Leitneret al. (2013).
3.2. Automated reconstruction using an OBIA rule set
An eCognition rule set was developed for the automatedreconstruction of halite hopper crystals embedded in mudrock.Relationships of mudrock, halite crystals, cracks and polyhalitecoatings, together with a general workflow used in this study arepresented in Fig. 4.
3.2.1. Image segmentation, classification and 3D reconstruction ofhalite hopper crystals
The rule set starts with Multi Resolution Segmentation (MRS),which creates initial object primitives following weighted homo-geneity criteria of shape and color as introduced by Baatz andSchäpe (2000). Despite some promising results in the search foroptimal segmentation parameters (Drǎguţ et al., 2010; Kim andMadden, 2006; Neubert and Meinel, 2003), MRS is capable ofproducing sub-optimal image objects only. These can be used assuitable starting points for further improvements, however. In thepresent case, the application led to a first 2D delineation of thehalite crystals in each slice and to slight over-segmentations incases with varying contrast inside the halite crystals (Fig. 5a).Based on the objects' mean gray value (16 bit), the resulting 2Dimage objects were classified into the following broad categories:background, specimen and potential halite. Background objects arethe relatively darkest objects in the scene – their brightness ratioto the whole scene is below 1. The remaining unclassified objectswere assigned to specimen. The remaining specimen-objects werefuzzy-assigned to potential halite, if their mean gray value wasbetween the lower bound of 28,000 and the upper bound of33,000. That is, an object was rather a member of potential halite(m¼1.0) the closer its mean gray value was to 30,500 and less amember of potential halite the closer its mean gray value was tothe lower or upper bound (m¼0.0) (Zadeh, 1965). Objects with amembership degree for potential halite of m40.1 were assigned tothis class (Fig. 5b).
In the 3D reconstruction step, the 2D objects in the individualimages were merged into contiguous 3D objects: equally classified2D objects in neighboring slices were merged to form a contiguous3D object of this particular class. In order to eliminate crack-like
Fig. 2. Sliced volume rendering of ALT-4D CT data, bounding box (mm) forreference. Slicing plane shows disturbing structural elements during halite hoppercrystal reconstruction.
Fig. 3. One slice of the gold standard – manually digitized halite crystal contours(slice ZT 74). Three crystal shape quality categories: black – best, gray – middle,light gray - poor.
C. Leitner et al. / Computers & Geosciences 73 (2014) 61–70 63
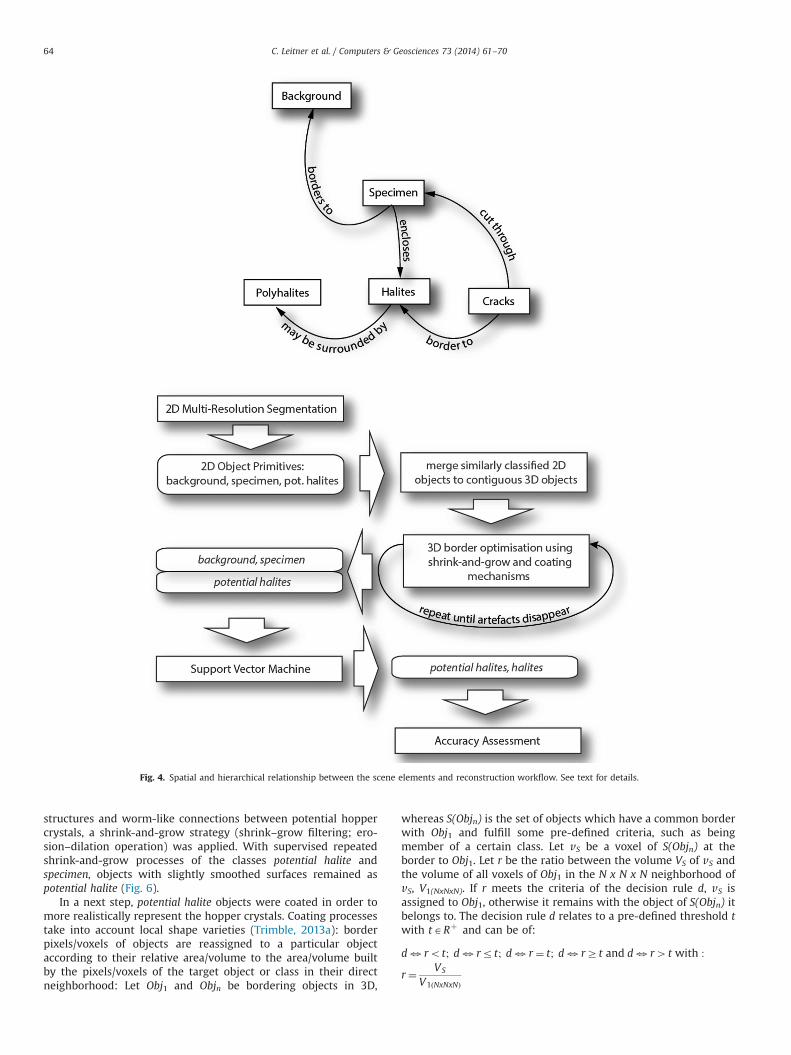
structures and worm-like connections between potential hoppercrystals, a shrink-and-grow strategy (shrink–grow filtering; ero-sion–dilation operation) was applied. With supervised repeatedshrink-and-grow processes of the classes potential halite andspecimen, objects with slightly smoothed surfaces remained aspotential halite (Fig. 6).
In a next step, potential halite objects were coated in order tomore realistically represent the hopper crystals. Coating processestake into account local shape varieties (Trimble, 2013a): borderpixels/voxels of objects are reassigned to a particular objectaccording to their relative area/volume to the area/volume builtby the pixels/voxels of the target object or class in their directneighborhood: Let Obj1 and Objn be bordering objects in 3D,
whereas S(Objn) is the set of objects which have a common borderwith Obj1 and fulfill some pre-defined criteria, such as beingmember of a certain class. Let vS be a voxel of S(Objn) at theborder to Obj1. Let r be the ratio between the volume VS of vS andthe volume of all voxels of Obj1 in the N x N x N neighborhood ofvS, V1(NxNxN). If r meets the criteria of the decision rule d, vS isassigned to Obj1, otherwise it remains with the object of S(Objn) itbelongs to. The decision rule d relates to a pre-defined threshold twith tARþ and can be of:
d3rot; d3rrt; d3r¼ t; d3rZt and d3r4t with :
r¼ VS
V1ðNxNxNÞ
Fig. 4. Spatial and hierarchical relationship between the scene elements and reconstruction workflow. See text for details.
C. Leitner et al. / Computers & Geosciences 73 (2014) 61–7064
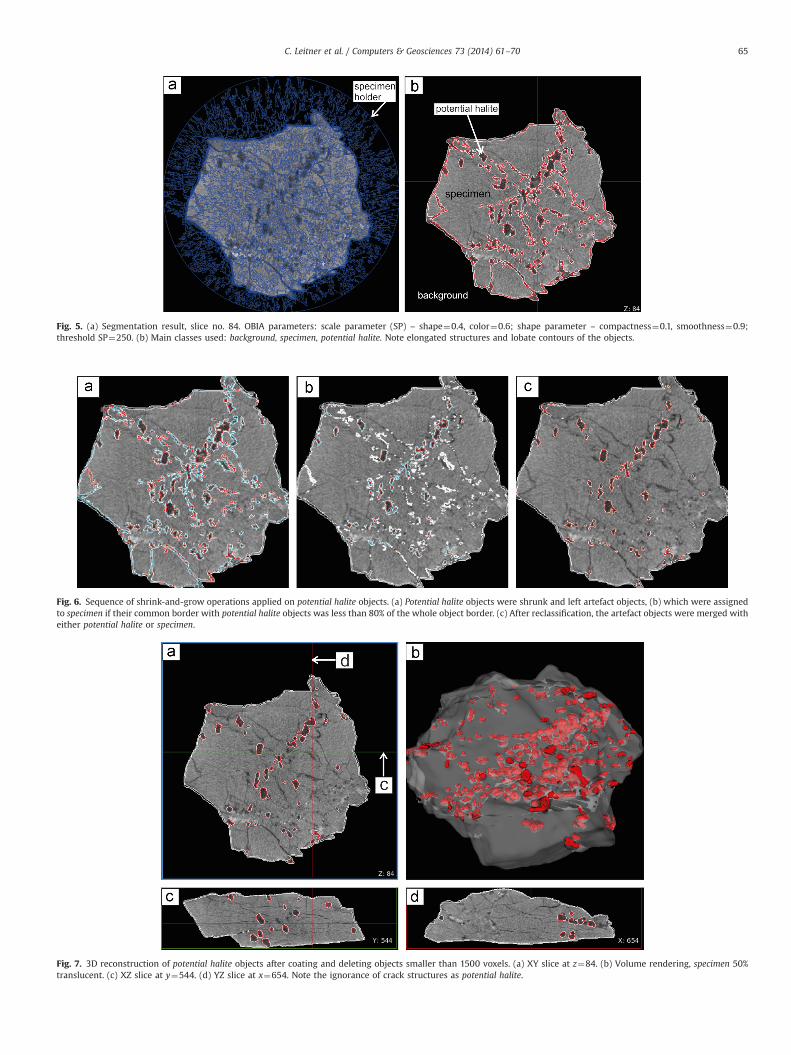
Fig. 5. (a) Segmentation result, slice no. 84. OBIA parameters: scale parameter (SP) – shape¼0.4, color¼0.6; shape parameter – compactness¼0.1, smoothness¼0.9;threshold SP¼250. (b) Main classes used: background, specimen, potential halite. Note elongated structures and lobate contours of the objects.
Fig. 6. Sequence of shrink-and-grow operations applied on potential halite objects. (a) Potential halite objects were shrunk and left artefact objects, (b) which were assignedto specimen if their common border with potential halite objects was less than 80% of the whole object border. (c) After reclassification, the artefact objects were merged witheither potential halite or specimen.
Fig. 7. 3D reconstruction of potential halite objects after coating and deleting objects smaller than 1500 voxels. (a) XY slice at z¼84. (b) Volume rendering, specimen 50%translucent. (c) XZ slice at y¼544. (d) YZ slice at x¼654. Note the ignorance of crack structures as potential halite.
C. Leitner et al. / Computers & Geosciences 73 (2014) 61–70 65
Due to uncertainties arising from geometrical CT resolution,potential halite objects with a volume below 1500 voxels (9.13 mm³)were deleted, leading to a final number of 184 potential halite objects(Fig. 7).
3.2.2. Selecting suitable image objects according to their 3Dproperties
Extracting euhedral, deformed halite hopper crystals just bytheir gray values is impracticable. It is rather the combination withtheir shape and the spatial context of the whole specimen thatallows an expert to clearly identify them in the image. The classpotential halite contains many 3D objects, which an expert wouldnot consider as hopper crystals, or which at least, would not beused in later deformation analysis.
In order to filter the most suitable halite crystals from the initialpotential halite objects, we applied the Support Vector Machine(SVM) implemented in eCognition. SVM is a popular approach forsupervised learning (Tzotsos and Argialas, 2008; Otukei andBlaschke, 2010; Russell and Norvig, 2010; Abe, 2010; Zhu et al.,2014). SVM identifies structures in higher dimensional featurespace. The “learning” step creates a function that separates at leasttwo classes of objects in feature space. For training purposes classrepresentatives of well-shaped halite crystals (halite) and insuffi-ciently well-shaped crystals (remaining potential halite) wereinteractively selected. The feature space is defined by brightness,roundness, compactness, rectangular fit, elliptic fit, shape index,density and asymmetry parameters (Trimble, 2013a). The kerneltype chosen for the SVM was a Radial Basis Function (RBF) withthe parameters γ¼0 and C¼2. Thereby, γ determines the shape ofthe RBF-kernel in the feature space with γ40, while C acts as theso-called cost parameter which determines the width of theclasses' transition zones in feature space (Amari and Wu, 1999;Chapelle et al., 2002; Hsu and Lin, 2002). In eCognition, if γ is¼0,it is automatically set to γ¼1/n with n¼dimension of the featurespace used. In our particular case, the RBF kernel function reads:
Kðx; xiÞ ¼ exp �19jjx�xijj2
� �
Further readings on the choice of input parameters for SVMclassifiers can be found in Chapelle et al. (2002), Cherkassky andMa (2004), Friedrichs and Igel (2005).
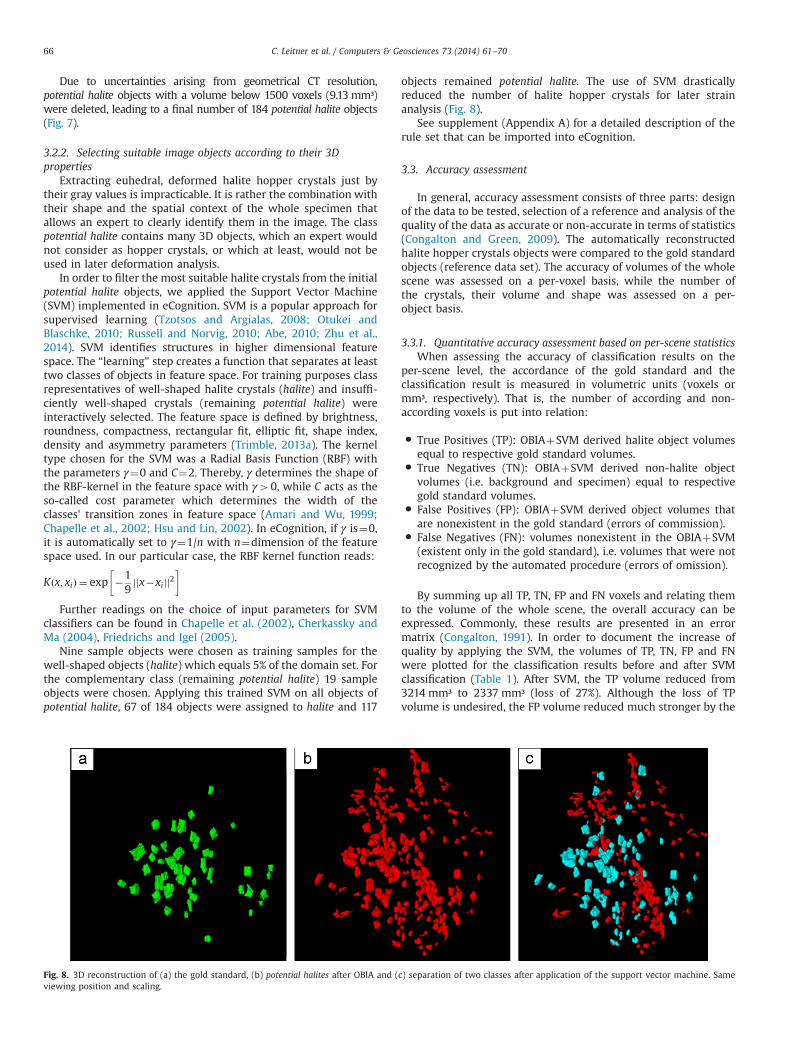
Nine sample objects were chosen as training samples for thewell-shaped objects (halite) which equals 5% of the domain set. Forthe complementary class (remaining potential halite) 19 sampleobjects were chosen. Applying this trained SVM on all objects ofpotential halite, 67 of 184 objects were assigned to halite and 117
objects remained potential halite. The use of SVM drasticallyreduced the number of halite hopper crystals for later strainanalysis (Fig. 8).
See supplement (Appendix A) for a detailed description of therule set that can be imported into eCognition.
3.3. Accuracy assessment
In general, accuracy assessment consists of three parts: designof the data to be tested, selection of a reference and analysis of thequality of the data as accurate or non-accurate in terms of statistics(Congalton and Green, 2009). The automatically reconstructedhalite hopper crystals objects were compared to the gold standardobjects (reference data set). The accuracy of volumes of the wholescene was assessed on a per-voxel basis, while the number ofthe crystals, their volume and shape was assessed on a per-object basis.
3.3.1. Quantitative accuracy assessment based on per-scene statisticsWhen assessing the accuracy of classification results on the
per-scene level, the accordance of the gold standard and theclassification result is measured in volumetric units (voxels ormm³, respectively). That is, the number of according and non-according voxels is put into relation:
� True Positives (TP): OBIAþSVM derived halite object volumesequal to respective gold standard volumes.
� True Negatives (TN): OBIAþSVM derived non-halite objectvolumes (i.e. background and specimen) equal to respectivegold standard volumes.
� False Positives (FP): OBIAþSVM derived object volumes thatare nonexistent in the gold standard (errors of commission).
� False Negatives (FN): volumes nonexistent in the OBIAþSVM(existent only in the gold standard), i.e. volumes that were notrecognized by the automated procedure (errors of omission).
By summing up all TP, TN, FP and FN voxels and relating themto the volume of the whole scene, the overall accuracy can beexpressed. Commonly, these results are presented in an errormatrix (Congalton, 1991). In order to document the increase ofquality by applying the SVM, the volumes of TP, TN, FP and FNwere plotted for the classification results before and after SVMclassification (Table 1). After SVM, the TP volume reduced from3214 mm³ to 2337 mm³ (loss of 27%). Although the loss of TPvolume is undesired, the FP volume reduced much stronger by the
Fig. 8. 3D reconstruction of (a) the gold standard, (b) potential halites after OBIA and (c) separation of two classes after application of the support vector machine. Sameviewing position and scaling.
C. Leitner et al. / Computers & Geosciences 73 (2014) 61–7066
application of SVM from 8591 mm³ to 3150 mm³ (loss of 63%).The FN volume, which is 1676 mm³ of the gold standard, was notdetected by the SVM. On the other side, a volume of 613,541 mm³was correctly identified as non-halite (TN).
The error matrix shows several parameters that describe theaccuracy of the classification. The Overall Accuracy (OA) definesthe ratio between the correctly classified entities (i.e. TPþTN)relative to all entities. Due to the dominance of mudrock inthe specimen, the OA is strongly biased in both classifications(98% before SVM and 99% after SVM). Further parameters derivedare precision (positive predictive value) and recall (sensitivity)(Melamed et al., 2003; Powers, 2011):
precision¼ TPTPþFP
recall¼ TPTPþFN
Before SVM, only 27% of the voxels classified as halite wereclassified correctly with regard to the gold standard. After SVM,the precision increased to 43%. The accuracy of recall before SVMwas 80%, meaning 80% of the gold standard volumes overlappedwith the result of the automated OBIA halite reconstruction result.However, after SVM, recall decreased to 58%, meaning that theSVM dismissed many objects that were part of the gold standard.
3.3.2. Qualitative accuracy assessment based on per-object statisticsOBIA enables accuracy assessment on a per-object basis to
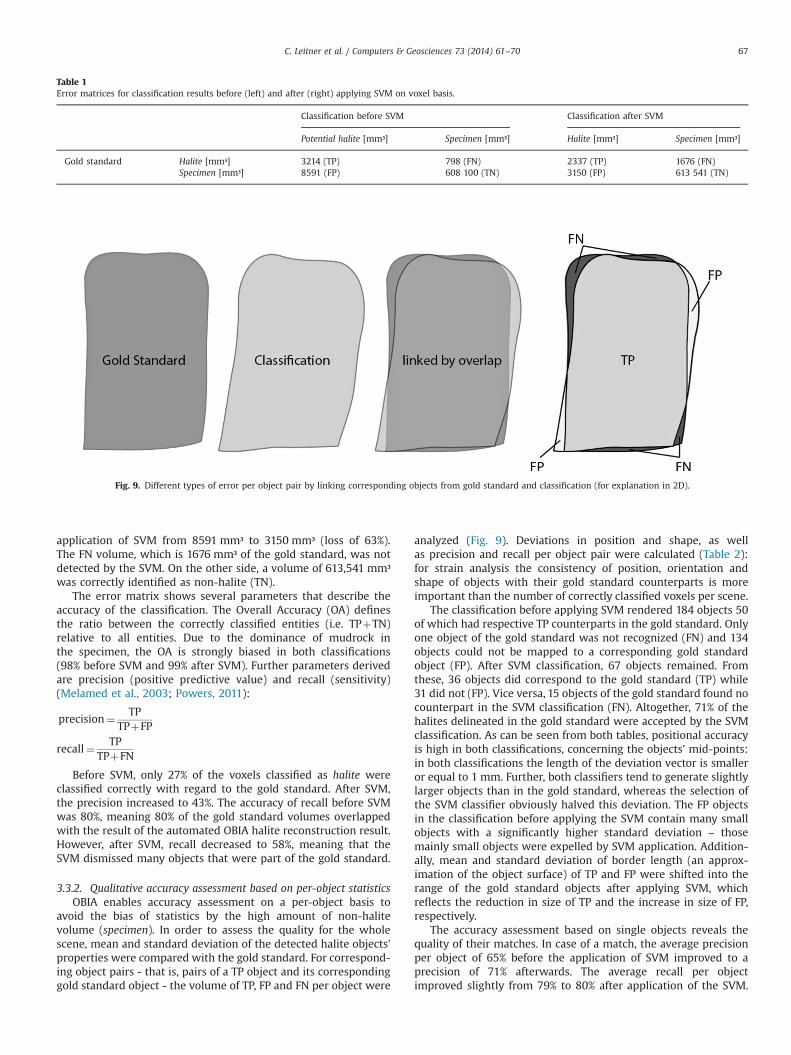
avoid the bias of statistics by the high amount of non-halitevolume (specimen). In order to assess the quality for the wholescene, mean and standard deviation of the detected halite objects'properties were compared with the gold standard. For correspond-ing object pairs - that is, pairs of a TP object and its correspondinggold standard object - the volume of TP, FP and FN per object were
analyzed (Fig. 9). Deviations in position and shape, as wellas precision and recall per object pair were calculated (Table 2):for strain analysis the consistency of position, orientation andshape of objects with their gold standard counterparts is moreimportant than the number of correctly classified voxels per scene.
The classification before applying SVM rendered 184 objects 50of which had respective TP counterparts in the gold standard. Onlyone object of the gold standard was not recognized (FN) and 134objects could not be mapped to a corresponding gold standardobject (FP). After SVM classification, 67 objects remained. Fromthese, 36 objects did correspond to the gold standard (TP) while31 did not (FP). Vice versa, 15 objects of the gold standard found nocounterpart in the SVM classification (FN). Altogether, 71% of thehalites delineated in the gold standard were accepted by the SVMclassification. As can be seen from both tables, positional accuracyis high in both classifications, concerning the objects' mid-points:in both classifications the length of the deviation vector is smalleror equal to 1 mm. Further, both classifiers tend to generate slightlylarger objects than in the gold standard, whereas the selection ofthe SVM classifier obviously halved this deviation. The FP objectsin the classification before applying the SVM contain many smallobjects with a significantly higher standard deviation – thosemainly small objects were expelled by SVM application. Addition-ally, mean and standard deviation of border length (an approx-imation of the object surface) of TP and FP were shifted into therange of the gold standard objects after applying SVM, whichreflects the reduction in size of TP and the increase in size of FP,respectively.
The accuracy assessment based on single objects reveals thequality of their matches. In case of a match, the average precisionper object of 65% before the application of SVM improved to aprecision of 71% afterwards. The average recall per objectimproved slightly from 79% to 80% after application of the SVM.
Table 1Error matrices for classification results before (left) and after (right) applying SVM on voxel basis.
Classification before SVM Classification after SVM
Potential halite [mm³] Specimen [mm³] Halite [mm³] Specimen [mm³]
Gold standard Halite [mm³] 3214 (TP) 798 (FN) 2337 (TP) 1676 (FN)Specimen [mm³] 8591 (FP) 608 100 (TN) 3150 (FP) 613 541 (TN)
Fig. 9. Different types of error per object pair by linking corresponding objects from gold standard and classification (for explanation in 2D).
C. Leitner et al. / Computers & Geosciences 73 (2014) 61–70 67
Both values were determined on a per-object basis by countingeach object's TP, FP and FN volumes (mm3).
4. Discussion
The gold standard was created with the idea to provide a set ofhalite crystals usable for subsequent strain analysis (Leitner et al.,2013). The inherent expert knowledge was the basis for selectingonly the best quality hopper crystals. The gold standard remainedunquestioned during the accomplishment of the accuracyassessment.
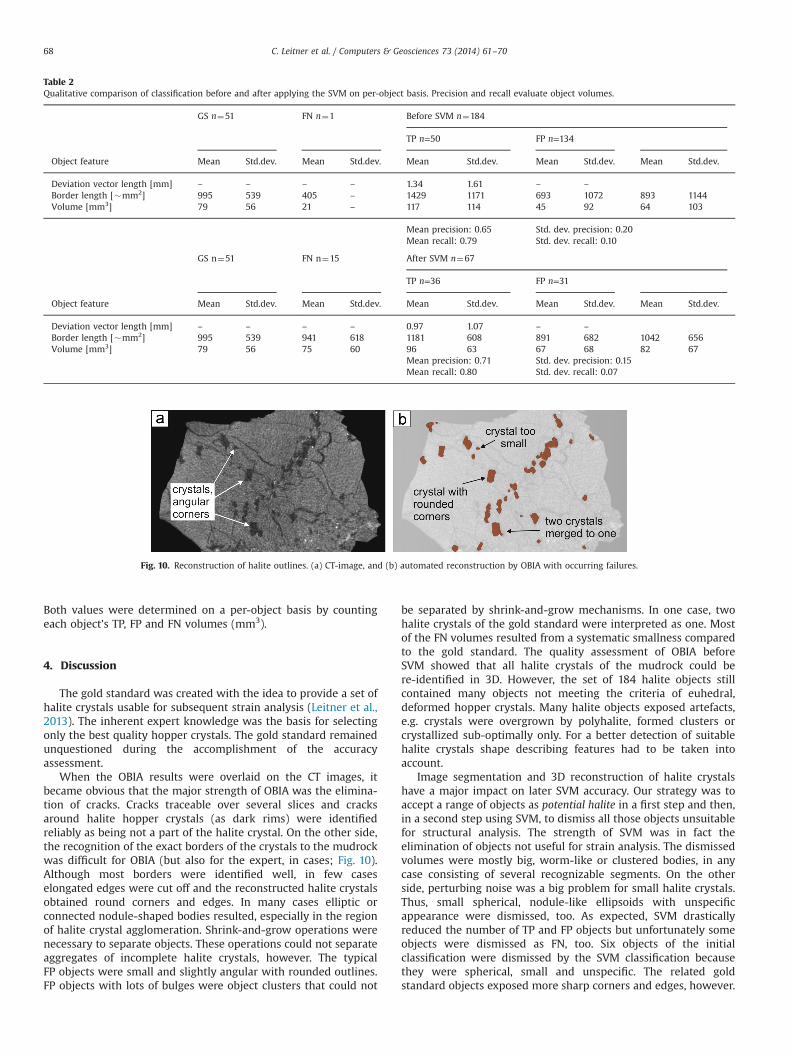
When the OBIA results were overlaid on the CT images, itbecame obvious that the major strength of OBIA was the elimina-tion of cracks. Cracks traceable over several slices and cracksaround halite hopper crystals (as dark rims) were identifiedreliably as being not a part of the halite crystal. On the other side,the recognition of the exact borders of the crystals to the mudrockwas difficult for OBIA (but also for the expert, in cases; Fig. 10).Although most borders were identified well, in few caseselongated edges were cut off and the reconstructed halite crystalsobtained round corners and edges. In many cases elliptic orconnected nodule-shaped bodies resulted, especially in the regionof halite crystal agglomeration. Shrink-and-grow operations werenecessary to separate objects. These operations could not separateaggregates of incomplete halite crystals, however. The typicalFP objects were small and slightly angular with rounded outlines.FP objects with lots of bulges were object clusters that could not
be separated by shrink-and-grow mechanisms. In one case, twohalite crystals of the gold standard were interpreted as one. Mostof the FN volumes resulted from a systematic smallness comparedto the gold standard. The quality assessment of OBIA beforeSVM showed that all halite crystals of the mudrock could bere-identified in 3D. However, the set of 184 halite objects stillcontained many objects not meeting the criteria of euhedral,deformed hopper crystals. Many halite objects exposed artefacts,e.g. crystals were overgrown by polyhalite, formed clusters orcrystallized sub-optimally only. For a better detection of suitablehalite crystals shape describing features had to be taken intoaccount.
Image segmentation and 3D reconstruction of halite crystalshave a major impact on later SVM accuracy. Our strategy was toaccept a range of objects as potential halite in a first step and then,in a second step using SVM, to dismiss all those objects unsuitablefor structural analysis. The strength of SVM was in fact theelimination of objects not useful for strain analysis. The dismissedvolumes were mostly big, worm-like or clustered bodies, in anycase consisting of several recognizable segments. On the otherside, perturbing noise was a big problem for small halite crystals.Thus, small spherical, nodule-like ellipsoids with unspecificappearance were dismissed, too. As expected, SVM drasticallyreduced the number of TP and FP objects but unfortunately someobjects were dismissed as FN, too. Six objects of the initialclassification were dismissed by the SVM classification becausethey were spherical, small and unspecific. The related goldstandard objects exposed more sharp corners and edges, however.
Fig. 10. Reconstruction of halite outlines. (a) CT-image, and (b) automated reconstruction by OBIA with occurring failures.
Table 2Qualitative comparison of classification before and after applying the SVM on per-object basis. Precision and recall evaluate object volumes.
GS n¼51 FN n¼1 Before SVM n¼184
TP n=50 FP n=134
Object feature Mean Std.dev. Mean Std.dev. Mean Std.dev. Mean Std.dev. Mean Std.dev.
Deviation vector length [mm] – – – – 1.34 1.61 – –
Border length [�mm2] 995 539 405 – 1429 1171 693 1072 893 1144Volume [mm3] 79 56 21 – 117 114 45 92 64 103
Mean precision: 0.65 Std. dev. precision: 0.20Mean recall: 0.79 Std. dev. recall: 0.10
GS n¼51 FN n¼15 After SVM n¼67
TP n=36 FP n=31
Object feature Mean Std.dev. Mean Std.dev. Mean Std.dev. Mean Std.dev. Mean Std.dev.
Deviation vector length [mm] – – – – 0.97 1.07 – –
Border length [�mm2] 995 539 941 618 1181 608 891 682 1042 656Volume [mm3] 79 56 75 60 96 63 67 68 82 67
Mean precision: 0.71 Std. dev. precision: 0.15Mean recall: 0.80 Std. dev. recall: 0.07
C. Leitner et al. / Computers & Geosciences 73 (2014) 61–7068
Crystals exposed bulges somewhere adjacent of the clear outlinesof the crystal. In other places, the SVM classifier accepted similarirregularities of the crystals. A short look at Table 2 reveals theproperties of TP, FN and FP were similar and therefore denotes thevery narrow distinction between being a member of the classhalite or not.
5. Conclusions
Object Based Image Analysis was used for the 3D reconstruc-tion of halite hopper crystals in a mudrock sample from CT data.The strength of OBIA was to recognize all objects similar to halitehopper crystals and in particular to eliminate cracks. A number of184 potential halite objects were initially outlined in the sample.
In a second step a SVM classifier was applied which dismissedobjects unsuitable for later strain analysis like clusters, polyhalite-coated crystals and spherical halites. SVM reduced the numberof potential halite objects to 67, which is close to the number ofpre-selected 52 halite objects in Leitner et al. (2013).
To assess the accuracy and quality of the automatically recon-structed halite objects, the results before and after applying SVMwere compared to a manually generated gold standard. Classicalper-scene statistics based on single voxels were accomplished andadditionally, a per-object statistics was conducted, which allowsassessment of the object individual quality.
Results show that the application of SVM improves the overallquality of halite reconstruction but simultaneously only accepts71% of halite crystals delineated in the gold standard. Reasonsmight be the strong perturbing noise, the elimination of cornersand edges by the shrink-and-grow process and the narrowdistinction between well formed/non-sufficiently well formedcrystals in the multi dimensional feature space.
Acknowledgments
We thank Franz Neubauer for the possibility to use facilities atthe Department of Geography and Geology, University of Salzburg.We gratefully acknowledge the work of an anonymous reviewerand the detailed review of Richard Ketcham.
Appendix A. Supporting information
Supplementary data associated with this article can be found inthe online version at http://dx.doi.org/10.1016/j.cageo.2014.08.010.
References
Abe, S., 2010. Support vector machines for pattern classification, Advances inComputer Vision and Pattern Recognition, second edn. Springer, London p. 473.
Amari, S., Wu, S., 1999. Improving support vector machine classifiers by modifyingkernel functions. Neural Netw. 12, 783–789. http://dx.doi.org/10.1016/S0893-6080(99)00032-5.
Athelogou, M., Baatz, M., Binnig, G., Schäpe, A., Schmidt, G., 2007. Definienscognition network technology – a novel multi modal image analysis techniquefor automatic identification and quantification of biological image contents. In:Frischknecht, F., Shorte, S.L. (Eds.), Imaging Cellular and Molecular BiologicalFunctions. Springer, Berlin, Heidelberg, pp. 407–421.
Baatz, M., Schäpe, A., 2000. Multiresolution segmentation: an optimizationapproach for high quality multi-scale image segmentation. In: Strobl, J.,Blaschke, T., Griesebner, G. (Eds.), Angewandte Geographische Informations-verarbeitung, vol. XII. Wichmann, Karlsruhe, pp. 12–23.
Benison, K.C., Goldstein, R.H., 2000. Sedimentology of ancient saline pans: anexample from the Permian Opeche shale, Williston Basin, North Dakota, U.S.A. J.Sediment. Res. 70, 159–169. http://dx.doi.org/10.1306/2DC40907-0E47-11D7-8643000102C1865D.
Blaschke, T., 2010. Object based image analysis for remote sensing. ISPRS J. Photo-gramm. Remote Sens. 65, 2–16. http://dx.doi.org/10.1016/j.isprsjprs.2009.06.004.
Blaschke, T., Schrott, L., Marschallinger, R., Neubauer, F., Koch, A., Beinat, E.,Heistracher, T., Reich, S., Leitner, M., Donert, K., 2012. Geographic informationscience as a common cause for interdisciplinary reseach. In: Gensel, J.,Josselin, D., Vandenbroucke (Eds.), Bridging the Geographic InformationSciences. Springer, Berlin, Heidelberg, pp. 411–427. http://dx.doi.org/10.1007/978-3-642-29063-3_22.
Blaschke, T., Hay, G.J., Kelly, M., Lang, S., Hofmann, P., Addink, E., Feitosa, R.Q., vander Meer, F., van der Werff, H., van Coillie, F., Tiede, D., 2014. Geographic object-based image analysis – towards a new paradigm. ISPRS J. Photogramm. RemoteSens. 87, 180–191. http://dx.doi.org/10.1016/j.isprsjprs.2013.09.014.
Chapelle, O., Vapnik, V., Bousquet, O., Mukherjee, S., 2002. Choosing multipleparameters for support vector machines. Mach. Learn. 46, 131–159.
Cherkassky, V., Ma, Y., 2004. Practical selection of SVM parameters and noiseestimation for SVM regression. Neural Netw. 17 (1), 113–126. http://dx.doi.org/10.1016/S0893-6080(03)00169-2.
Congalton, R.G., 1991. A review of assessing the accuracy of classifications ofremotely sensed data. Remote Sens. Environ. 37, 35–46.
Congalton, R.G., Green, K., 2009. Assessing the Accuracy of Remotely SensedData: Principles and Practices, second edn. CRC/Taylor & Francis, Boca Raton, FLp. 183.
Drǎguţ, L., Tiede, D., Levick, S.R., 2010. ESP: a tool to estimate scale parameter formultiresolution image segmentation of remotely sensed data. Int. J. Geogr. Inf.Sci. 24, 859–871. http://dx.doi.org/10.1080/13658810903174803.
Fadel, I., van der Meijde, M., Kerle, N., Lauritson, N., 2014. 3D object-oriented imageanalysis in 3D geophysical modelling: analysing the central part of the EastAfrican Rift System. Int. J. Appl. Earth Obs. Geoinf. , http://dx.doi.org/10.1016/j.jag.2013.11.004 (in press).
Friedrichs, F., Igel, C., 2005. Evolutionary tuning of multiple SVM parameters.Neurocomputing 64, 107–117. http://dx.doi.org/10.1016/j.neucom.2004.11.022.
Görgey, R., 1912. Zur Kenntnis der Kalisalzlager von Wittelsheim im Ober-Elsaß.Tsch. Mineral. Petrogr. Mitt. 31, 339–468.
Gornitz, V.M., Schreiber, B.C., 1981. Displacive halite hoppers from the dead sea:some implications for ancient evaporite deposits. J. Sediment. Petrol. 51,787–794.
Haenschel, C., Linden, D., Oertela, V., Rotarska-Jagiela, A., Schönmeyer, R., Vogeley,K., 2008. The corpus callosum in schizophrenia – volume and connectivitychanges affect specific regions. Neuroimage 39, 1522–1532.
Haidinger, W., 1847. Über die Pseudomorphosen nach Steinsalz. Naturwissenschaf-tliche Abh. I, 65–78.
Haude, R., 1970. Die Entstehung von Steinsalz-Pseudomorphosen. Neues Jahrb.Geol. Paläontol. Monatshefte, 1–10.
Heidrich, A., Schmidt, J., Zimmermann, J., Saluz, H.P., 2013. Automated segmenta-tion and object classification of CT images: application to in vivo molecularimaging of avian embryos. Int. J. Biomed. Imag. 2013 , http://dx.doi.org/10.1155/2013/508474 (Article ID 508474, 10 pp.).
Hofmann, P., Marschallinger, R., Unterwurzacher, M., Zobl, F., 2013. Marbleprovenance designation with object image analysis: state-of-the-art rock fabriccharacterization from petrographic micrographs. Austrian J. Earth Sci. 106/2,40–49.
Hsu, C.-W., Lin, C.-J., 2002. A comparison of methods for multiclass support vectormachines. IEEE Trans. Neural Netw. 13, 415–425.
Kendall, A.C., 2000. Compaction in halite-cemented carbonates – the Dawson BayFormation (Middle devonian) of Saskatchewan, Canada. Sedimentology 47,151–171.
Ketcham, R.A., Carlson, W.D., 2001. Acquisition, optimization and interpretation ofX-ray computed tomographic imagery: applications to the geosciences. Com-put. Geosci. 27, 381–400.
Kim, M., M. Madden, 2006. Determination of optimal scale parameters for alliance-level forest classification of multispectral IKONOS images. In: Proceedings ofthe 1st International Conference on Object-based Image Analysis (OBIA 2006).
Leitner, C., Neubauer, F., Marschallinger, R., Genser, J., Bernroider, M., 2013. Originof deformed halite hopper crystals, pseudomorphic anhydrite cubes andpolyhalite in Alpine evaporates (Austria, Germany). Int. J. Earth Sci. 102,813–829. http://dx.doi.org/10.1007/s00531-012-0836-6.
Marschallinger R., Hofmann, P., 2010. The application of object based image analysisto petrographic micrographs. In: Méndez-Vilas, A., Díaz. J. (Eds.). Microscopy:Science, Technology, Applications and Education, vol. II, pp. 1526–1532.
Marschallinger, R., Hofmann, P., Daxner-Höck, G., Ketcham, R.A., 2011. Solidmodeling of fossil small mammal teeth. Comput. Geosci. 37, 1364–1371. http://dx.doi.org/10.1016/j.cageo.2010.07.011.
Mees, F., Swennen, R., Van Geet, M., Jacobs, P. (Eds.), 2003. Applications of X-rayComputed Tomography in the Geosciences, 215. Geological Society SpecialPublication, London, p. 252.
Melamed, I.D., Green, R., Turian, J.P. Precision, 2003. Recall of Machine Translation.In: Proceedings NAACL-Short ‘03 Proceedings of the 2003 Conference of theNorth American Chapter of the Association for Computational Linguistics onHuman Language Technology: companion volume of the Proceedings of HLT-NAACL 2003, short papers, vol. 2, pp. 61–63.
Neubert, M., G. Meinel, 2003. Evaluation of Segmentation Programs for HighResolution Remote Sensing Applications. In: Proceedings of the Joint ISPRS/EARSeLWorkshop “High Resolution Mapping from Space”, Hannover, Germany,6–8 October 2003.
Otukei, J.R., Blaschke, T., 2010. Land cover change assessment using decision trees,support vector machines and maximum likelihood classification algorithms.Int. J. Appl. Earth Obs. Geoinf. 12, 27–31. http://dx.doi.org/10.1016/j.jag.2009.11.002.
C. Leitner et al. / Computers & Geosciences 73 (2014) 61–70 69

Powers, D.M., 2011. Evaluation: from precision, recall and F-measure to ROC,informedness, markedness and correlation. J. Mach. Learn. Technol. 2 (1), 37–63.
Russell, S.J., Norvig, P., 2010. Artificial Intelligence: A Modern Approach, third edn.Hardcover, Prentice Hall p. 1152.
Schönmeyer, R., Prvulovic, D., Rotarska-Jagiela, A., Haenschel, C., Linden, D.E.J.,2006. Automated segmentation of lateral ventricles from human and primatemagnetic resonance images using cognition network technology. Magn. Reson.Imag. 24, 1377–1387.
Sweeney, E.M., Shinohara, R.T., Shiee, N., Mateen, F.J., Chudgar, A.A., Cuzzocreo, J.L.,Calabresi, P.A., Pham, D.L., Reich, D.S., Crainiceanu, C.M., 2013. OASIS isautomated statistical inference for segmentation, with applications to multiplesclerosis lesion segmentation in MRI. NeuroImage: Clin. 2, 402–413. http://dx.doi.org/10.1016/j.nicl.2013.03.002.
Tiede, D., Lang, S., Hoffmann, C., 2006. Supervised and forest type-specific multi-scale segmentation for a one-level-representation of single trees. Int. Arch.Photogramm. Remote Sens. Spat. Inf. Sci. vol. XXXVI-4/C42 (CD-ROM).
Timmermans, S., Berg, M., 2003. The challenge of evidence-based medicine andstandardization in health care, The Gold Standard. Temple University Press,Philadelphia.
Trimble (Ed.), 2013a. eCognition Developer 8.9 Reference Book, Trimble, Munich,pp. XXIIþ416.
Trimble (Ed.), 2013b. eCognition Developer 8.9 User Guide, Trimble, Munich,pp. VIIþ248.
Tzotsos, A., Argialas, D., 2008. Support vector machine classification for object-based image analysis. In: Blaschke, Th., Lang, S., Hay, G.J. (Eds.), Object-BasedImage Analysis. Springer, Berlin, Heidelberg, pp. 663–677.
Urai, J.L., Schléder, Z., Spiers, C.J., Kukla, P.A., 2008. Flow and transport properties ofsalt rocks. In: Littke, R., Bayer, U., Gajewski, D., Nelskamp, S. (Eds.), Dynamics ofComplex Intracontinental Basins. The Central European Basin System. Springer,Berlin, pp. XXIV–520.
Zadeh, L.A., 1965. Fuzzy Sets. Inf. Control 8, 338–353.Zhu, L., Xiao, P., Feng, X., Zhang, X., Wang, Z., Jiang, L., 2014. Support vector
machine-based decision tree for snow cover extraction in mountain areas usinghigh spatial resolution remote sensing image. J. Appl. Remote Sens. 8 (1),084698. http://dx.doi.org/10.1117/1.JRS.8.084698.
C. Leitner et al. / Computers & Geosciences 73 (2014) 61–7070