centennial climate variability virginia tidewater (chesapeake bay)
TRANSCRIPT
Virginia Journal of Science
Volume 63, Issue 3 & 4
Fall & Winter 2012
A Centennial Record of Paleosalinity Change in theTidal Reaches of the Potomac and Rappahannock
Rivers, Tributaries to Chesapeake Bay
Neil E. Tibert , Lindsay J. Walker , William P. Patterson , J.1 1 2
Bradford Hubeny , Emma Jones , Olivia R. Cooper3 1 1
Department of Earth and Environmental Sciences, University of1
Mary Washington, Fredericksburg, Virginia 22401.Department of Geological Sciences, University of Saskatchewan,2
Saskatoon Saskatchewan, Canada.Department of Geological Sciences, Salem State University, Salem,3
Massachusetts 01970
ABSTRACT
Gravity and push cores from the Potomac and Rappahannock Rivers
(Virginia Tidewater) were collected from central and proximal estuarine
zones with known seasonal salinity stratification. The lowermost
microfossil associations in the cores comprise alternating ostracode
populations of Cyprideis salebrosa and Cytheromorpha. This microfossil
association gives way to an oligohaline association dominated by the
freshwater ostracode Darwinula stevensoni. Stable oxygen isotope values
(ä O) of Rapphannock Cyprideis salebrosa are highly variable ranging18
between -6.6 to -3.2‰ VPDB. ä O values for Potomac Cytheromorpha18
fuscata range from -8.2 to -3.2‰ VPDB. Positive excursions in ä O values18
are synchronous with population peaks for both Cyprideis and
Cytheromorpha indicative of increased marine influence and/or higher
salinities. Microfossil paleoecology coupled with oxygen isotope values
record a marked shift towards gradual freshening and deterioration of the
salinity structure in the tidal tributaries during the mid-to late 19 century.th
We attribute these trends to both decadal climate trends and aggressive
land use practices in the Chesapeake Bay watershed during the late 19 toth
middle 20th centuries.
INTRODUCTION
Estuaries are physically, chemically, and biologically complex environments at the
convergence of continental and marine processes. In the Chesapeake Bay, the recent
combination of anthropogenic watershed modification and sea-level rise are forcing
mechanisms that have potentially influenced mixing of fresh and marine waters in the
tidal reaches of the major tributaries (Colman and Bratton 2003; Boon 2012). To test
Corresponding author: Neil E. Tibert, [email protected]
112 VIRGINIA JOURNAL OF SCIENCE
this hypothesis, sediment cores were collected from the proximal and central reaches
of the Potomac and Rappahannock estuaries for microfossil and stable isotopic
analyses. Paleosalinity indicators were established on the basis of ostracode
paleoecology (population abundances and pore morphometrics) and oxygen isotope
values (ä O). The paleosalinity trends were considered in the context of sedimentation18
history based on Cs dating, organic matter concentrations, and magnetic137
susceptibility of collected cores. Cumulative results of these analyses indicate that
salinity gradients in both estuaries have changed markedly since the beginning of the
19 century which is suggestive of anthropogenic influence on estuarine processes inth
the Chesapeake Bay.
BACKGROUND
Geographic Location
The Chesapeake Bay is the largest estuarine system in the United States that is
located between Virginia and Maryland on the Atlantic Coastal Plain (Colman and
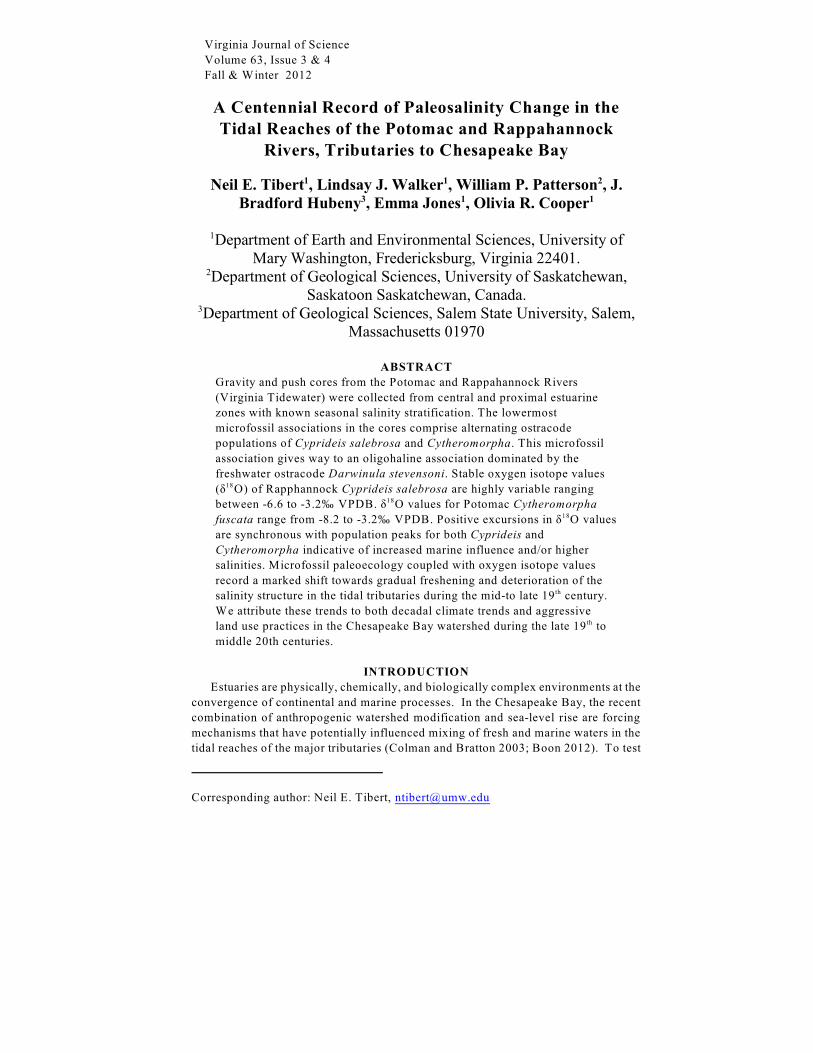
Mixon 1988). This study focuses on the upper tidal reaches of the Potomac and
Rappahannock Rivers where they transition from estuarine-to fluvial conditions (Fig.
1). Sediment cores were collected near the boundary between proximal (oligohaline)
and central estuary (mesohaline) near Aquia Creek in the Potomac estuary and
Blandfield Point in the Rappahannock estuary (Ellison and Nichols 1970, 1976; Ellison
FIGURE 1. Sediment cores were collected from the Potomac and Rappahannock
estuaries, both of which are tributaries to Chesapeake Bay, the largest estuary in the
eastern United States (Colman and Mixon, 1988).
Centennial Record of Paleosalinity Change 113
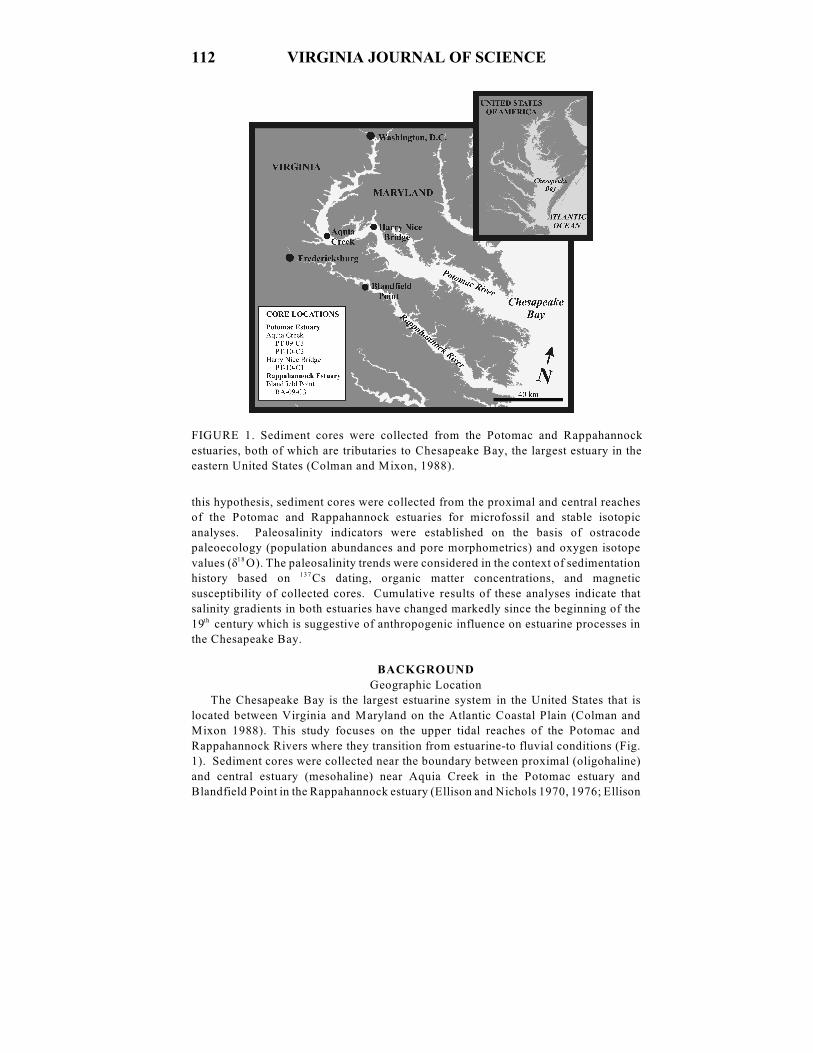
1972; USEPA 1998). Since the 1980s, these estuaries have produced the highest annual
sediment yields for all major Chesapeake Bay tributaries (Langland and Cronin 2003).
In general, the relatively high sedimentation rates in Chesapeake Bay are related to
ongoing sea-level rise and anthropogenic watershed modification (Fig. 2) (Colman and
Mixon 1988; Brush 1989; Colman and Bratton 2003; Boon and others 2010; Boon
2012).
Estuarine Circulation
The convergence of fluvial and marine waters creates a dynamic circulation pattern
that impacts sedimentary processes in estuarine environments. Where freshwater
outflow meets incoming saltwater in a partially mixed estuary like the Chesapeake Bay,
the seasonal halocline (salinity gradient) forms a relatively impermeable surface to
sediment transport that frequently coincides with the estuarine turbidity maximum
(ETM)(Langland and Cronin 2003). In the Potomac estuary, the maximum extent of
saltwater intrusion occurs near Aquia Creek (Elliott 1976). In the Rappahannock
estuary, the maximum extent of saltwater intrusion occurs near Blandfield Point
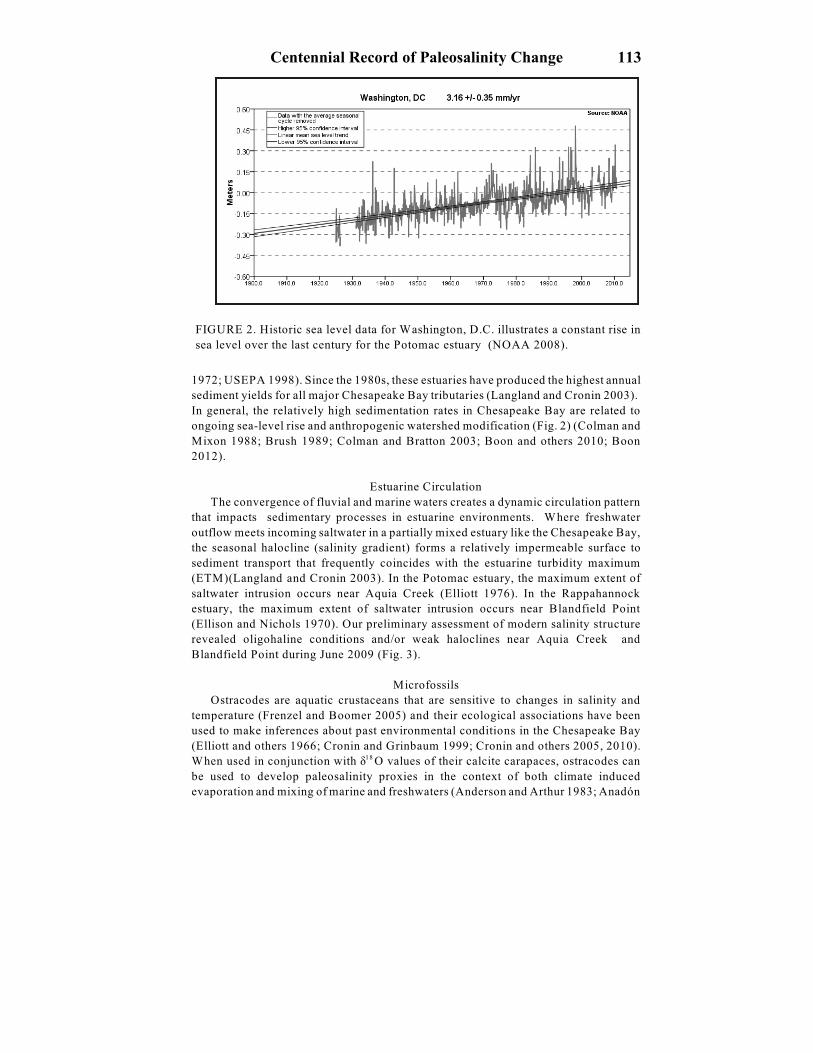
(Ellison and Nichols 1970). Our preliminary assessment of modern salinity structure
revealed oligohaline conditions and/or weak haloclines near Aquia Creek and
Blandfield Point during June 2009 (Fig. 3).
Microfossils
Ostracodes are aquatic crustaceans that are sensitive to changes in salinity and
temperature (Frenzel and Boomer 2005) and their ecological associations have been
used to make inferences about past environmental conditions in the Chesapeake Bay
(Elliott and others 1966; Cronin and Grinbaum 1999; Cronin and others 2005, 2010).
When used in conjunction with ä O values of their calcite carapaces, ostracodes can18
be used to develop paleosalinity proxies in the context of both climate induced
evaporation and mixing of marine and freshwaters (Anderson and Arthur 1983; Anadón
FIGURE 2. Historic sea level data for Washington, D.C. illustrates a constant rise in
sea level over the last century for the Potomac estuary (NOAA 2008).
114 VIRGINIA JOURNAL OF SCIENCE
and others 2002; Holmes and Chivas 2002; Ito and others 2003). Studies by Medley
and others (2008) demonstrated that the shape of the sieve pores on the external surface
of the carapace (Type C of Puri 1974) varies significantly with salinity which further
improves the potential for past salinity determinations using ostracoda.
METHODS
Sediment cores were collected from the Rappahannock and Potomac estuaries with
Ogeechee and Gravity (Wildco Inc.) corers (Fig. 1). The longer Ogeechee cores (>100
FIGURE 3. Late spring salinity (mg/L) and temperature ( C) profiles measured fromo
the (A) Potomac and (B) Rappahannock estuaries. This analysis was part of an
unpublished assessment of water quality during June 2009.
Centennial Record of Paleosalinity Change 115
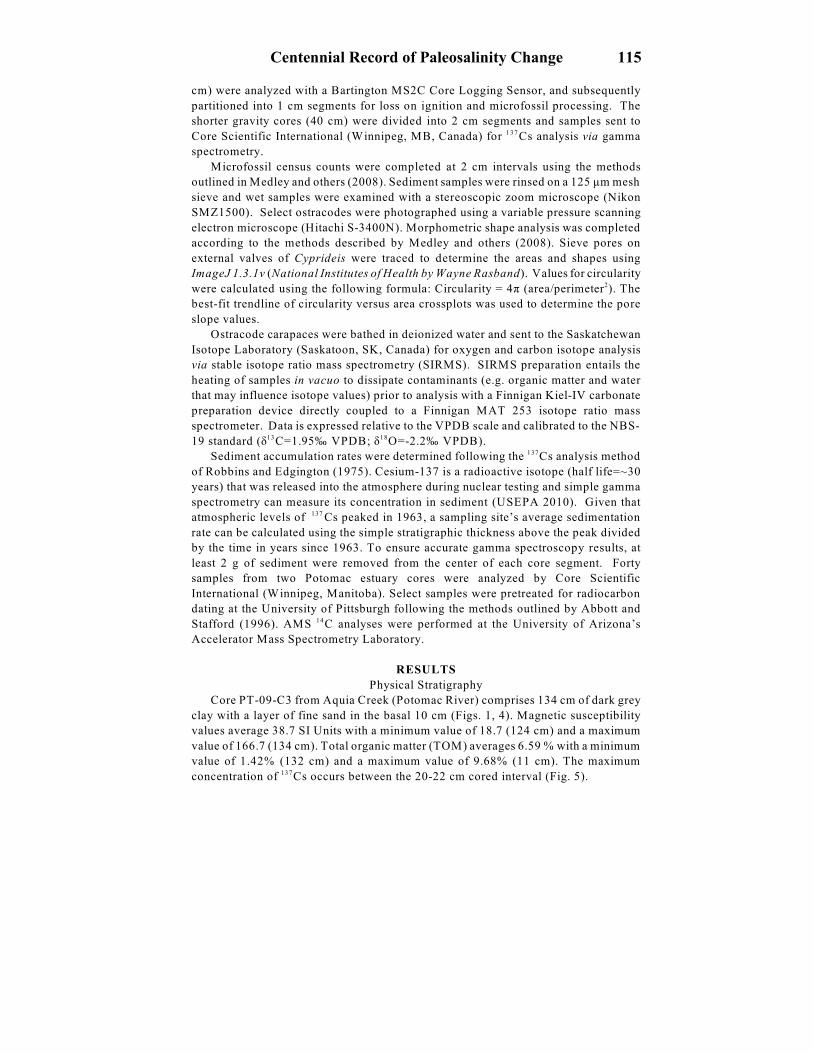
cm) were analyzed with a Bartington MS2C Core Logging Sensor, and subsequently
partitioned into 1 cm segments for loss on ignition and microfossil processing. The
shorter gravity cores (40 cm) were divided into 2 cm segments and samples sent to
Core Scientific International (Winnipeg, MB, Canada) for Cs analysis via gamma1 3 7
spectrometry.
Microfossil census counts were completed at 2 cm intervals using the methods
outlined in Medley and others (2008). Sediment samples were rinsed on a 125 ìm mesh
sieve and wet samples were examined with a stereoscopic zoom microscope (Nikon
SMZ1500). Select ostracodes were photographed using a variable pressure scanning
electron microscope (Hitachi S-3400N). Morphometric shape analysis was completed
according to the methods described by Medley and others (2008). Sieve pores on
external valves of Cyprideis were traced to determine the areas and shapes using
ImageJ 1.3.1v (National Institutes of Health by Wayne Rasband). Values for circularity
were calculated using the following formula: Circularity = 4ð (area/perimeter ). The2
best-fit trendline of circularity versus area crossplots was used to determine the pore
slope values.
Ostracode carapaces were bathed in deionized water and sent to the Saskatchewan
Isotope Laboratory (Saskatoon, SK, Canada) for oxygen and carbon isotope analysis
via stable isotope ratio mass spectrometry (SIRMS). SIRMS preparation entails the
heating of samples in vacuo to dissipate contaminants (e.g. organic matter and water
that may influence isotope values) prior to analysis with a Finnigan Kiel-IV carbonate
preparation device directly coupled to a Finnigan MAT 253 isotope ratio mass
spectrometer. Data is expressed relative to the VPDB scale and calibrated to the NBS-
19 standard (ä C=1.95‰ VPDB; ä O=-2.2‰ VPDB).13 18
Sediment accumulation rates were determined following the Cs analysis method137
of Robbins and Edgington (1975). Cesium-137 is a radioactive isotope (half life=~30
years) that was released into the atmosphere during nuclear testing and simple gamma
spectrometry can measure its concentration in sediment (USEPA 2010). Given that
atmospheric levels of Cs peaked in 1963, a sampling site’s average sedimentation137
rate can be calculated using the simple stratigraphic thickness above the peak divided
by the time in years since 1963. To ensure accurate gamma spectroscopy results, at
least 2 g of sediment were removed from the center of each core segment. Forty
samples from two Potomac estuary cores were analyzed by Core Scientific
International (Winnipeg, Manitoba). Select samples were pretreated for radiocarbon
dating at the University of Pittsburgh following the methods outlined by Abbott and
Stafford (1996). AMS C analyses were performed at the University of Arizona’s14
Accelerator Mass Spectrometry Laboratory.
RESULTS
Physical Stratigraphy
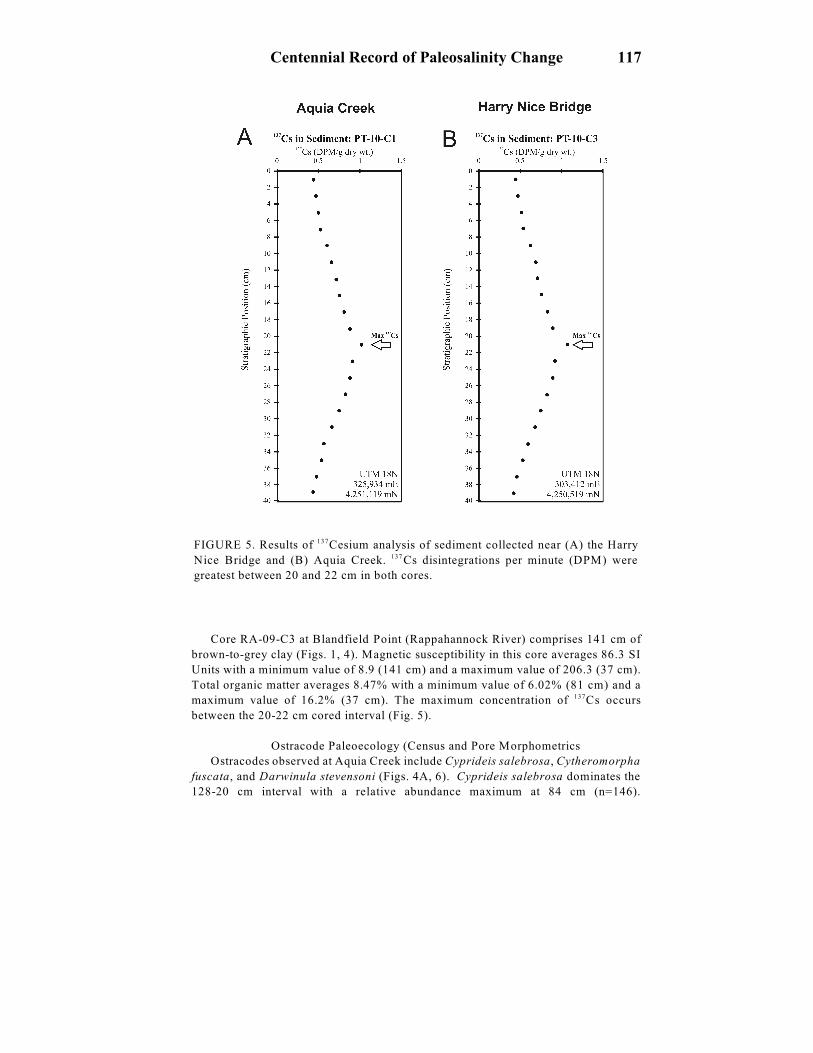
Core PT-09-C3 from Aquia Creek (Potomac River) comprises 134 cm of dark grey
clay with a layer of fine sand in the basal 10 cm (Figs. 1, 4). Magnetic susceptibility
values average 38.7 SI Units with a minimum value of 18.7 (124 cm) and a maximum
value of 166.7 (134 cm). Total organic matter (TOM) averages 6.59 % with a minimum
value of 1.42% (132 cm) and a maximum value of 9.68% (11 cm). The maximum
concentration of Cs occurs between the 20-22 cm cored interval (Fig. 5).137
116 VIRGINIA JOURNAL OF SCIENCE
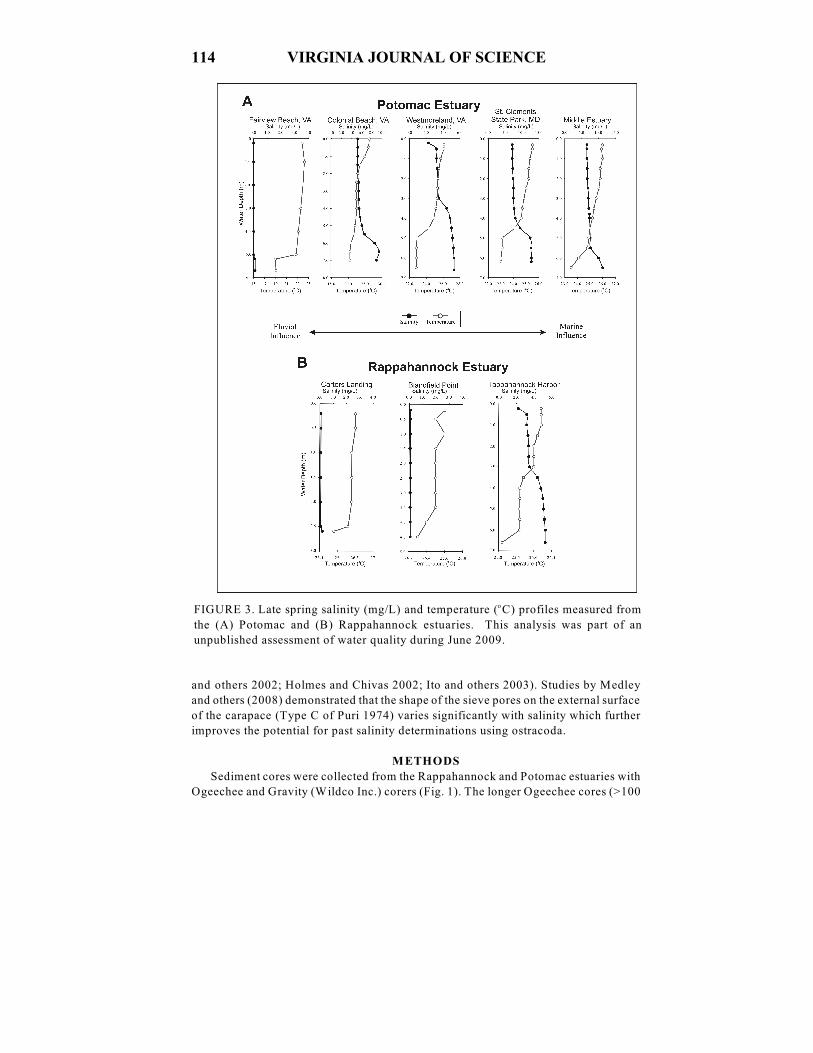
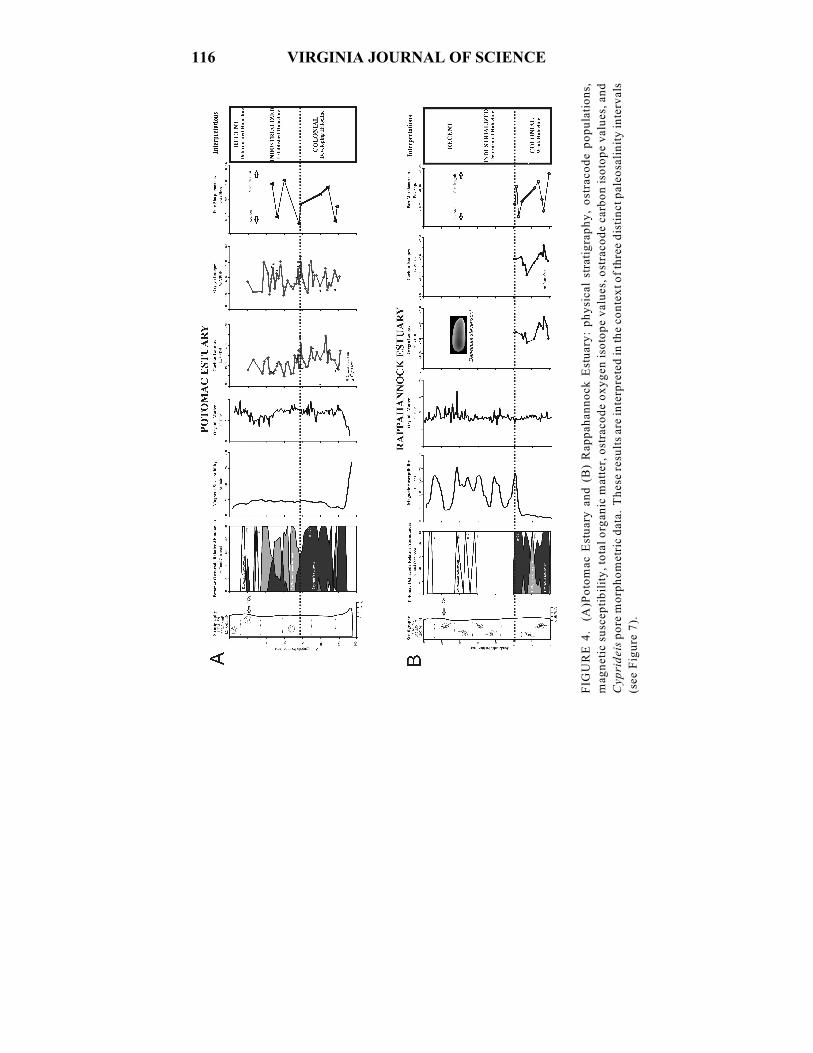
FIG
UR
E 4
. (
A)P
oto
mac
Est
uar
y a
nd
(B
) R
app
ahan
no
ck E
stu
ary
: p
hy
sica
l st
rati
gra
ph
y,
ost
raco
de
po
pu
lati
on
s,
mag
net
ic s
usc
epti
bil
ity
, to
tal
org
anic
mat
ter,
ost
raco
de
ox
yg
en i
soto
pe
val
ues
, o
stra
cod
e ca
rbo
n i
soto
pe
val
ues
, an
d
Cyp
rid
eis
po
re m
orp
ho
met
ric
dat
a. T
hes
e re
sult
s ar
e in
terp
rete
d i
n t
he
con
tex
t o
f th
ree
dis
tin
ct p
aleo
sali
nit
y i
nte
rval
s
(see
Fig
ure
7).
Centennial Record of Paleosalinity Change 117
Core RA-09-C3 at Blandfield Point (Rappahannock River) comprises 141 cm of
brown-to-grey clay (Figs. 1, 4). Magnetic susceptibility in this core averages 86.3 SI
Units with a minimum value of 8.9 (141 cm) and a maximum value of 206.3 (37 cm).
Total organic matter averages 8.47% with a minimum value of 6.02% (81 cm) and a
maximum value of 16.2% (37 cm). The maximum concentration of Cs occurs137
between the 20-22 cm cored interval (Fig. 5).
Ostracode Paleoecology (Census and Pore Morphometrics
Ostracodes observed at Aquia Creek include Cyprideis salebrosa, Cytheromorpha
fuscata, and Darwinula stevensoni (Figs. 4A, 6). Cyprideis salebrosa dominates the
128-20 cm interval with a relative abundance maximum at 84 cm (n=146).
FIGURE 5. Results of Cesium analysis of sediment collected near (A) the Harry137
Nice Bridge and (B) Aquia Creek. Cs disintegrations per minute (DPM) were137
greatest between 20 and 22 cm in both cores.
118 VIRGINIA JOURNAL OF SCIENCE
Cytheromorpha fuscata is relatively common within the 118-20 cm interval with a
relative abundance maximum at 70 cm (n=30). Darwinula stevensoni is sparsely
distributed with single valves observed above the 116 cm position (Fig. 4A).
Ostracodes at Blandfield Point include Cyprideis salebrosa, Cytheromorpha curta
and Darwinula stevensoni. Cyprideis salebrosa is relatively common within the 139-
101 cm interval with a relative abundance maximum at 107 cm (n=52) (Fig. 4B).
Cytheromorpha curta is sparsely distributed with relative abundance peaks at 123 cm
and 121 cm. Darwinula stevensoni is sparsely distributed with occurrences above the
57 cm position (Fig. 4B).
Valves of Cyprideis salebrosa from the Potomac River were analyzed for pore
morphometric shape at nine stratigraphic positions within the 118-46 cm interval (Fig.
4A). An average of 39 pores were measured per ostracode valve whereas the
calculated pore slope values that range from -0.0062 at 60 cm to -0.0011 at 76 cm.
Valves of C. salebrosa from Blandfield Point (RA-09-C3) were selected for pore
analyses at nine stratigraphic positions between 139-101 cm (Fig. 4A). An average of
43 pores were measured per ostracode whereas pore slope values range from -0.0054
at 139 cm to -0.0009 at 105 cm and exhibit a trend toward more positive slope values
in the uppermost core.
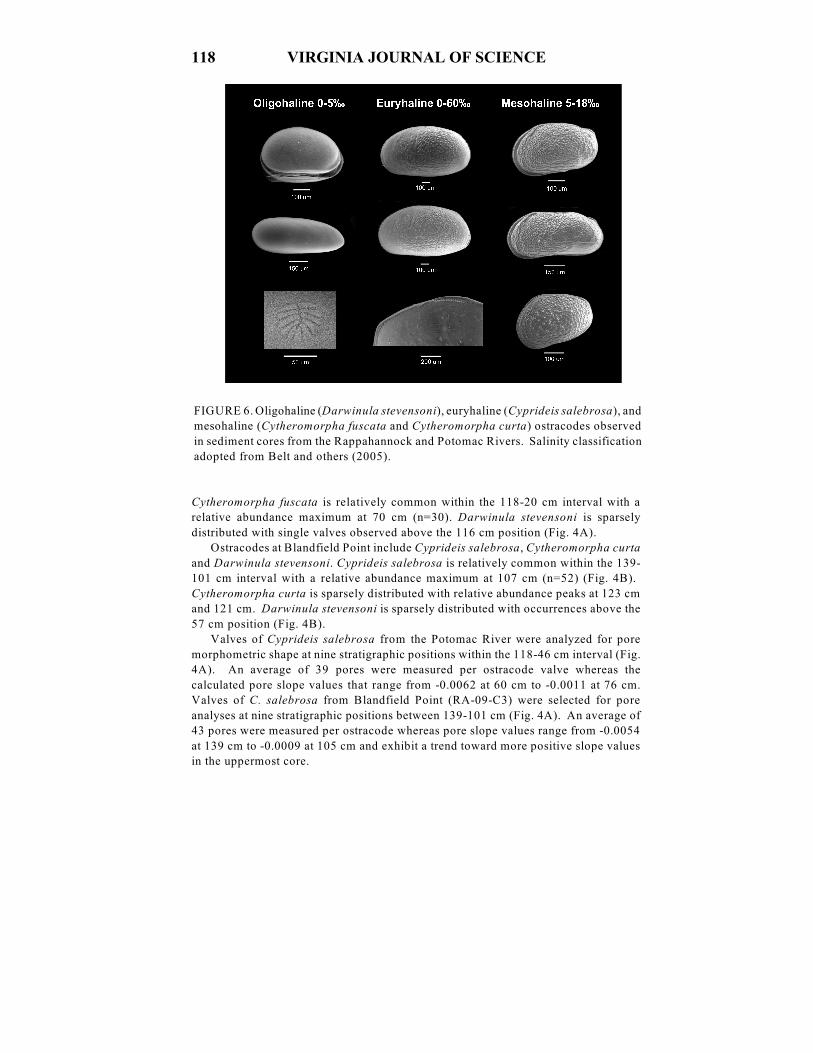
FIGURE 6. Oligohaline (Darwinula stevensoni), euryhaline (Cyprideis salebrosa), and
mesohaline (Cytheromorpha fuscata and Cytheromorpha curta) ostracodes observed
in sediment cores from the Rappahannock and Potomac Rivers. Salinity classification
adopted from Belt and others (2005).
Centennial Record of Paleosalinity Change 119
Oxygen and Carbon Stable Isotope Values
Cytheromorpha fuscata
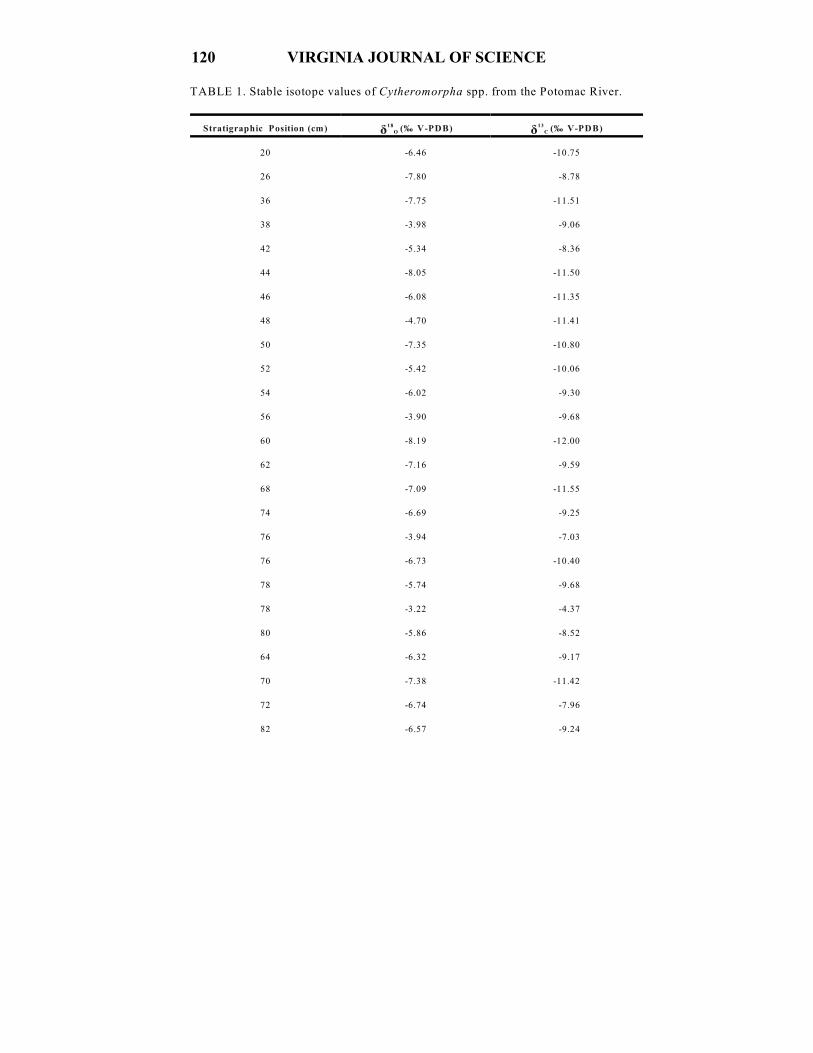
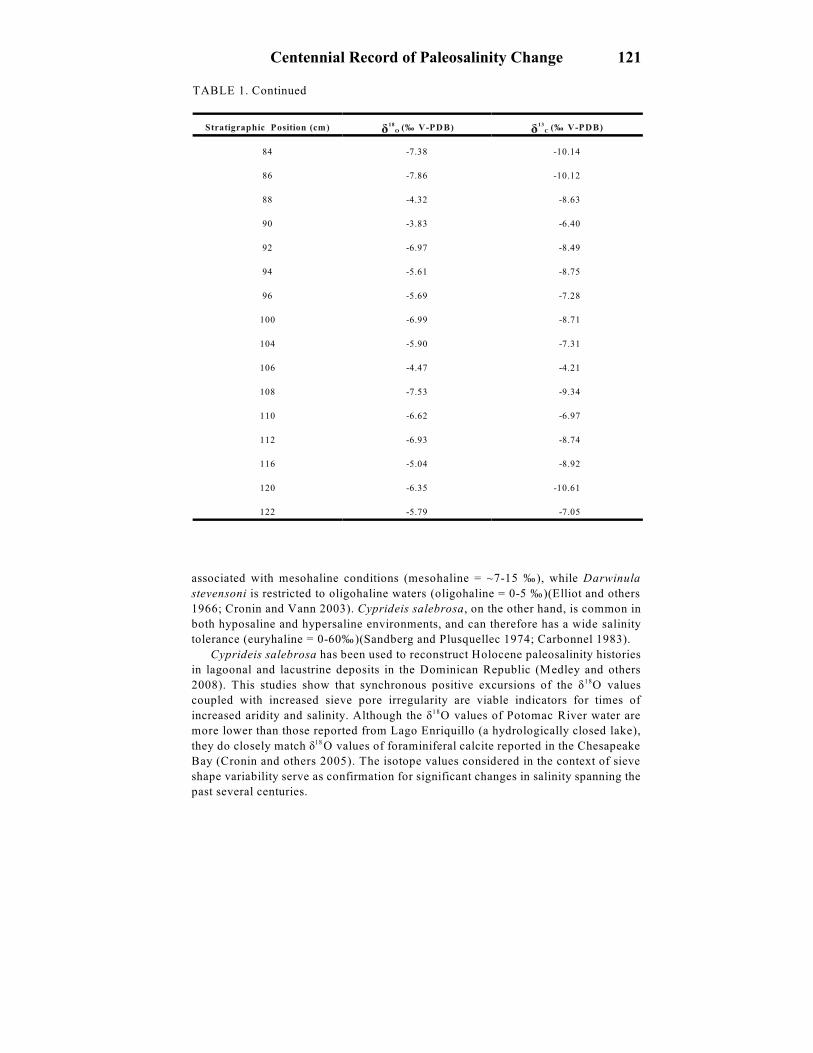
Oxygen isotope values measured in valves of Cytheromorpha fuscata at Aquia
Creek average -6.1‰ VPDB . The minimum ä O value is -8.2‰ VPDB (60 cm) and18
the maximum value is -3.2‰ VPDB (78 cm) (Table 1)(Fig. 4A). ä O values are18
variable with the highest values recorded within the 122-78 cm and 57-38 cm intervals.
Values decrease significantly above the 36 cm position.
Carbon isotope values for C. fuscata average -9.1‰ VPDB . The minimum ä C 13
value is -12.0‰ VPDB (60 cm) and the maximum value is -4.2‰ VPDB (106
cm)(Table 1)(Fig. 4A). ä C values are most positive at the core’s base, and gradually13
decreasing from -7.0 to -12.0‰ VPDB above the 78 cm position. Prominent positive
excursion peaks mark the 78 and 106 cm positions (Fig. 4A).
Cyprideis salebrosa
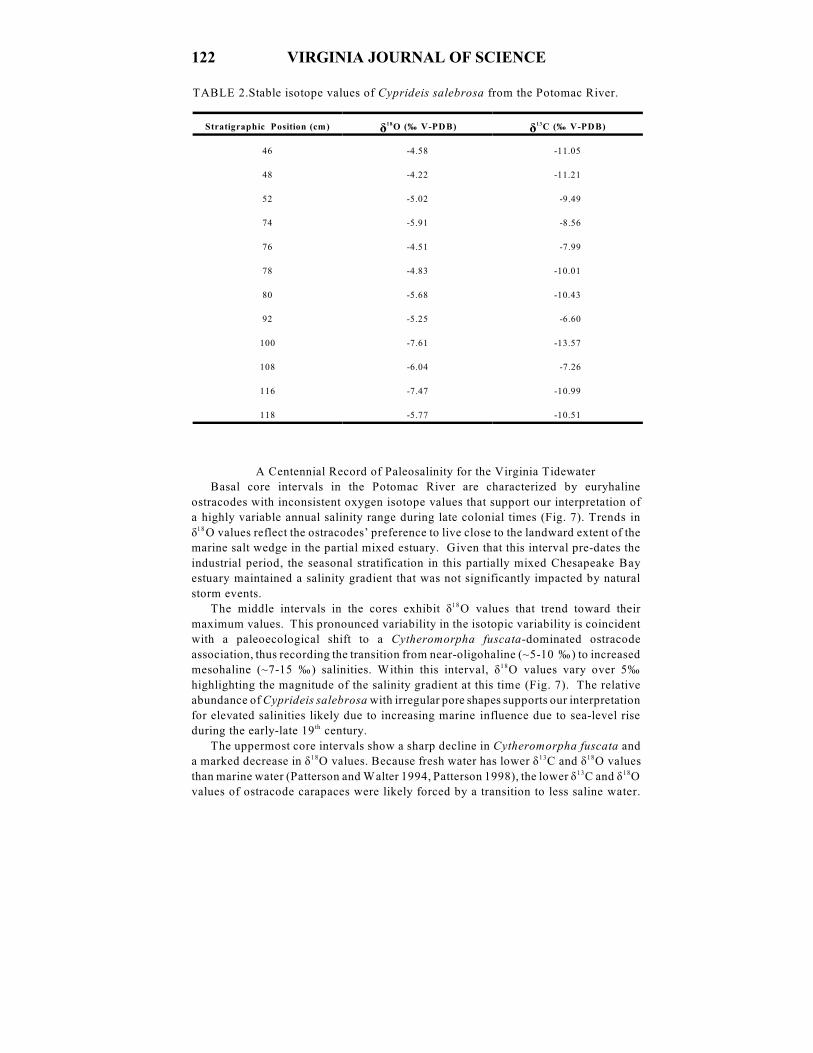
Oxygen isotope values of Cyprideis salebrosa at Aquia creek average -5.6‰
VPDB. The minimum ä O value is -7.6‰ VPDB (100 cm) and the maximum value18
is -4.2‰ VPDB (48 cm) (Table 2)(Fig. 4A). ä O values of Cyprideis salebrosa18
gradually become higher in the top of the core. ä O values of Cyprideis salebrosa18
valves from Blandfield Point average -5.1‰ VPDB. The minimum value is -6.6‰
VPDB (115 cm) and the maximum value is -3.2‰ VPDB (134 cm) (Table 3)(Fig. 4B).
Carbon isotope values of Cyprideis salebrosa at Aquia Creek are more positive at
the base of the core and shift to more negative values above the 78 cm position (Fig.
4A). ä C values average -9.8‰ VPDB. The minimum value is -13.6‰ VPDB (10013
cm) and the maximum value is -6.6‰ VPDB (92 cm) (Table 2) (Fig. 4A). ä C values13
at Blandfield Point average -6.4‰ VPDB . The minimum value is -9.7‰ VPDB (115
cm) and the maximum value is -3.6‰ VPDB (134 cm) (Figure 4B). The maxima of
both ä O and ä C are synchronous with both trending to lower values within the 134-18 13
115 cm interval (Table 3) (Fig. 4B).
Core Geochronology and Sedimentation Rates
Gravity cores (PT-10-C1 and PT-10-C3) collected from the Potomac estuary yield
maximum Cs decay rates between 20 and 22 cm that indicates an average137
sedimentation rate of 0.45 cm/yr since 1963 (Fig. 5). An earlier Cs study at1 3 7
Blandfield Point (Rappahannock River) (Baliwag and others 2010) yielded an average
sedimentation rate of the 0.54 cm/yr (see Tibert and others 2013). A single AMS C14
radiometric date from a core in the Rappahannock River (upstream of Blandfield Point)
yielded an uncorrected date of 245±15 that suggests a longer term sedimentation rate
of 0.36 cm/yr. The collective summary of the sedimentation rates and the AMS C in14
the Rappahannock and Potomac Rivers indicates basal core ages that approximate
middle-to late 18th century colonial times (1767±15).
DISCUSSION/INTERPRETATIONS
Paleosalinity Indicators
Ostracodes reported from the tidal reaches of the Potomac and Rappahannock
Rivers have well known ecological tolerances in estuarine environments (Frenzel and
Boomer 2005). Species of Cytheromorpha, including C. fuscata and C. curta, are often
120 VIRGINIA JOURNAL OF SCIENCE
TABLE 1. Stable isotope values of Cytheromorpha spp. from the Potomac River.
Stratigraphic Position (cm)
ä O 18 (‰ V-PDB) ä C
13 (‰ V-PDB)
20 -6.46 -10.75
26 -7.80 -8.78
36 -7.75 -11.51
38 -3.98 -9.06
42 -5.34 -8.36
44 -8.05 -11.50
46 -6.08 -11.35
48 -4.70 -11.41
50 -7.35 -10.80
52 -5.42 -10.06
54 -6.02 -9.30
56 -3.90 -9.68
60 -8.19 -12.00
62 -7.16 -9.59
68 -7.09 -11.55
74 -6.69 -9.25
76 -3.94 -7.03
76 -6.73 -10.40
78 -5.74 -9.68
78 -3.22 -4.37
80 -5.86 -8.52
64 -6.32 -9.17
70 -7.38 -11.42
72 -6.74 -7.96
82 -6.57 -9.24
Centennial Record of Paleosalinity Change 121
associated with mesohaline conditions (mesohaline = ~7-15 ‰), while Darwinula
stevensoni is restricted to oligohaline waters (oligohaline = 0-5 ‰)(Elliot and others
1966; Cronin and Vann 2003). Cyprideis salebrosa, on the other hand, is common in
both hyposaline and hypersaline environments, and can therefore has a wide salinity
tolerance (euryhaline = 0-60‰)(Sandberg and Plusquellec 1974; Carbonnel 1983).
Cyprideis salebrosa has been used to reconstruct Holocene paleosalinity histories
in lagoonal and lacustrine deposits in the Dominican Republic (Medley and others
2008). This studies show that synchronous positive excursions of the ä O values18
coupled with increased sieve pore irregularity are viable indicators for times of
increased aridity and salinity. Although the ä O values of Potomac River water are18
more lower than those reported from Lago Enriquillo (a hydrologically closed lake),
they do closely match ä O values of foraminiferal calcite reported in the Chesapeake18
Bay (Cronin and others 2005). The isotope values considered in the context of sieve
shape variability serve as confirmation for significant changes in salinity spanning the
past several centuries.
TABLE 1. Continued
Stratigraphic Position (cm)
ä O 18 (‰ V-PDB) ä C
13 (‰ V-PDB)
84 -7.38 -10.14
86 -7.86 -10.12
88 -4.32 -8.63
90 -3.83 -6.40
92 -6.97 -8.49
94 -5.61 -8.75
96 -5.69 -7.28
100 -6.99 -8.71
104 -5.90 -7.31
106 -4.47 -4.21
108 -7.53 -9.34
110 -6.62 -6.97
112 -6.93 -8.74
116 -5.04 -8.92
120 -6.35 -10.61
122 -5.79 -7.05
122 VIRGINIA JOURNAL OF SCIENCE
A Centennial Record of Paleosalinity for the Virginia Tidewater
Basal core intervals in the Potomac River are characterized by euryhaline
ostracodes with inconsistent oxygen isotope values that support our interpretation of
a highly variable annual salinity range during late colonial times (Fig. 7). Trends in
ä O values reflect the ostracodes’ preference to live close to the landward extent of the18
marine salt wedge in the partial mixed estuary. Given that this interval pre-dates the
industrial period, the seasonal stratification in this partially mixed Chesapeake Bay
estuary maintained a salinity gradient that was not significantly impacted by natural
storm events.
The middle intervals in the cores exhibit ä O values that trend toward their18
maximum values. This pronounced variability in the isotopic variability is coincident
with a paleoecological shift to a Cytheromorpha fuscata-dominated ostracode
association, thus recording the transition from near-oligohaline (~5-10 ‰) to increased
mesohaline (~7-15 ‰) salinities. Within this interval, ä O values vary over 5‰18
highlighting the magnitude of the salinity gradient at this time (Fig. 7). The relative
abundance of Cyprideis salebrosa with irregular pore shapes supports our interpretation
for elevated salinities likely due to increasing marine influence due to sea-level rise
during the early-late 19 century.th
The uppermost core intervals show a sharp decline in Cytheromorpha fuscata and
a marked decrease in ä O values. Because fresh water has lower ä C and ä O values18 13 18
than marine water (Patterson and Walter 1994, Patterson 1998), the lower ä C and ä O13 18
values of ostracode carapaces were likely forced by a transition to less saline water.
TABLE 2.Stable isotope values of Cyprideis salebrosa from the Potomac River.
ä äStratigraphic Position (cm) O (‰ V-PDB) C (‰ V-PDB) 18 13
46 -4.58 -11.05
48 -4.22 -11.21
52 -5.02 -9.49
74 -5.91 -8.56
76 -4.51 -7.99
78 -4.83 -10.01
80 -5.68 -10.43
92 -5.25 -6.60
100 -7.61 -13.57
108 -6.04 -7.26
116 -7.47 -10.99
118 -5.77 -10.51
Centennial Record of Paleosalinity Change 123
Sedimentation rates during this interval indicate an average rate of 0.45 cm/yr that also
corresponds to a paleoecological shift to the freshwater ostracode Darwinula
stevensoni. Population shifts, pore shape analyses, and isotope trends indicate
decreased salinity and weakening salinity gradient near Aquia Creek during the early
20 century (Figs. 4, 7).th
Climate Forcing and Sediment Loading
Cronin and others (2005) evaluated oxygen and carbon isotopes from calcareous
foraminifera, and magnesium-calcium ratios from ostracode carapaces that generally
oscillate in-phase for the last ~150 years in the Chesapeake Bay. Similar in-phase
variations characterize the isotope record from Rappahannock and Potomac ostracodes
(e.g., ä O and ä C maxima at 78 cm) (Fig. 4). The variability in our paleosalinity18 13
proxy indicators suggests that global climatic events, including the last vestiges of the
Little Ice Age (Cronin and others 2003), may have influenced late 18 and early 19th th
century salinity variability in both the Rapphannock and Potomac estuaries. Cronin and
Vann (2003) and Cronin and others (2005, 2010) analyzed ostracode and foraminifera
populations collected from the mouth of the Patuxtent estuary. Their results indicate
that decadal climate variability in the Chesapeake Bay is potentially influenced by the
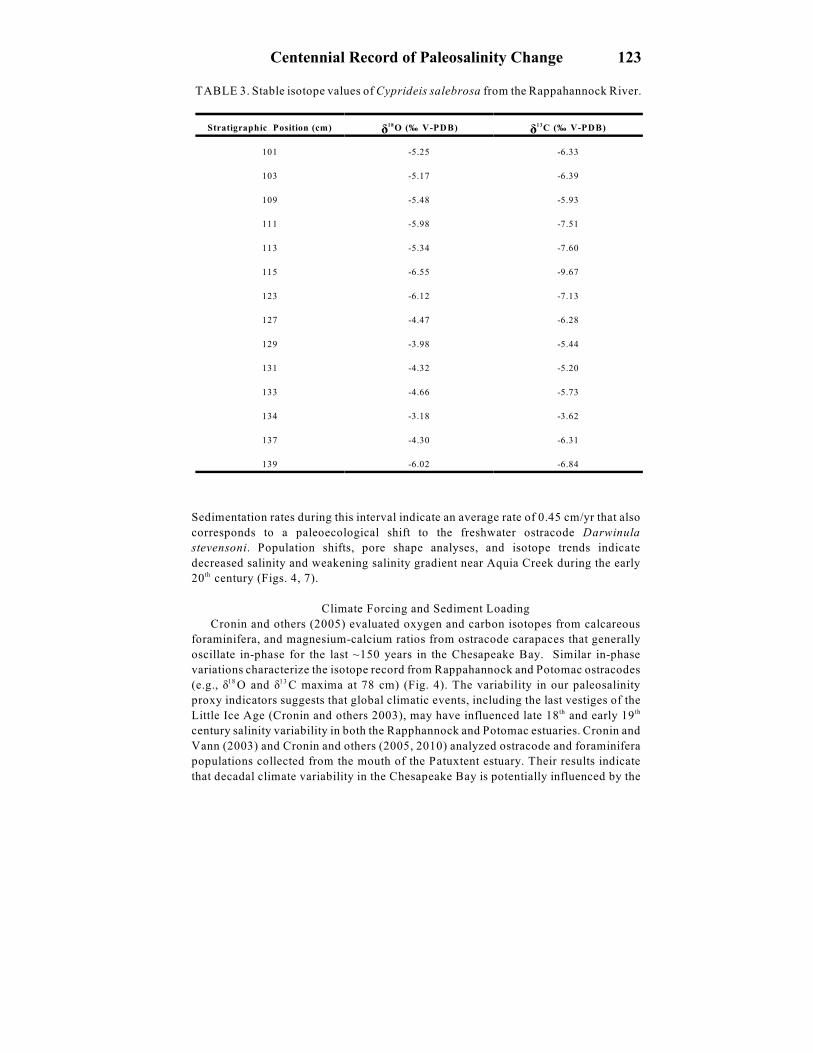
TABLE 3. Stable isotope values of Cyprideis salebrosa from the Rappahannock River.
ä äStratigraphic Position (cm) O (‰ V-PDB) C (‰ V-PDB) 18 13
101 -5.25 -6.33
103 -5.17 -6.39
109 -5.48 -5.93
111 -5.98 -7.51
113 -5.34 -7.60
115 -6.55 -9.67
123 -6.12 -7.13
127 -4.47 -6.28
129 -3.98 -5.44
131 -4.32 -5.20
133 -4.66 -5.73
134 -3.18 -3.62
137 -4.30 -6.31
139 -6.02 -6.84
124 VIRGINIA JOURNAL OF SCIENCE
North Atlantic Oscillation and possibly El Niño Southern Oscillation (ENSO). The
apparent decadal variability in our paleosalinty data substantiates their hypothesis.
Between 1983 and 2000, the Rappahannock and Potomac Rivers produced the
greatest average annual sediment yields for all major Chesapeake Bay tributaries
(Langland and Cronin 2003). Sedimentation rates and patterns are variable across the
bay due to its tributaries’ variable physiographic identities and land use histories (Brush
1989; Langland and Cronin 2003). Brush (1989) linked recently altered sedimentation
rates and patterns in Chesapeake Bay tributaries to aggressive post-colonial land
development. However, the amount of this “legacy sediment” stored in Chesapeake
Bay watersheds, as well as time required for it to reach the bay, currently remains
unquantified (Langland and Cronin 2003).
CONCLUSIONS
The paleosalinity history for the Potomac and Rappahannock Rivers is likely related
to both natural climate change and anthropogenic forcing mechanisms. The initial shift
from euryhaline-to mesohaline dominated ostracode associations was attributed to
increasing salinity associated with ongoing Holocene sea-level rise. Despite the
increasing marine influence due sea-level rise, sediment deposited in the tidal reaches
during the 20 century was characterized by increased abundances of oligohalineth
ostracodes with decreasing ä O and ä C values. While the exact cause of decreasing18 13
salinity during a period of 20th century is unknown, our results corroborates the
hypothesis that anthropogenically-induced salinity change, post-Industrial times, has
had a significant impact on seasonal salinity gradient development in the tidal reaches
of the Potomac and Rappahannock Rivers.
ACKNOWLEDGEMENTS
The research presented herein is the result of a senior theses completed by student
author LJW completed at the University of Mary Washington. We’d like to thank
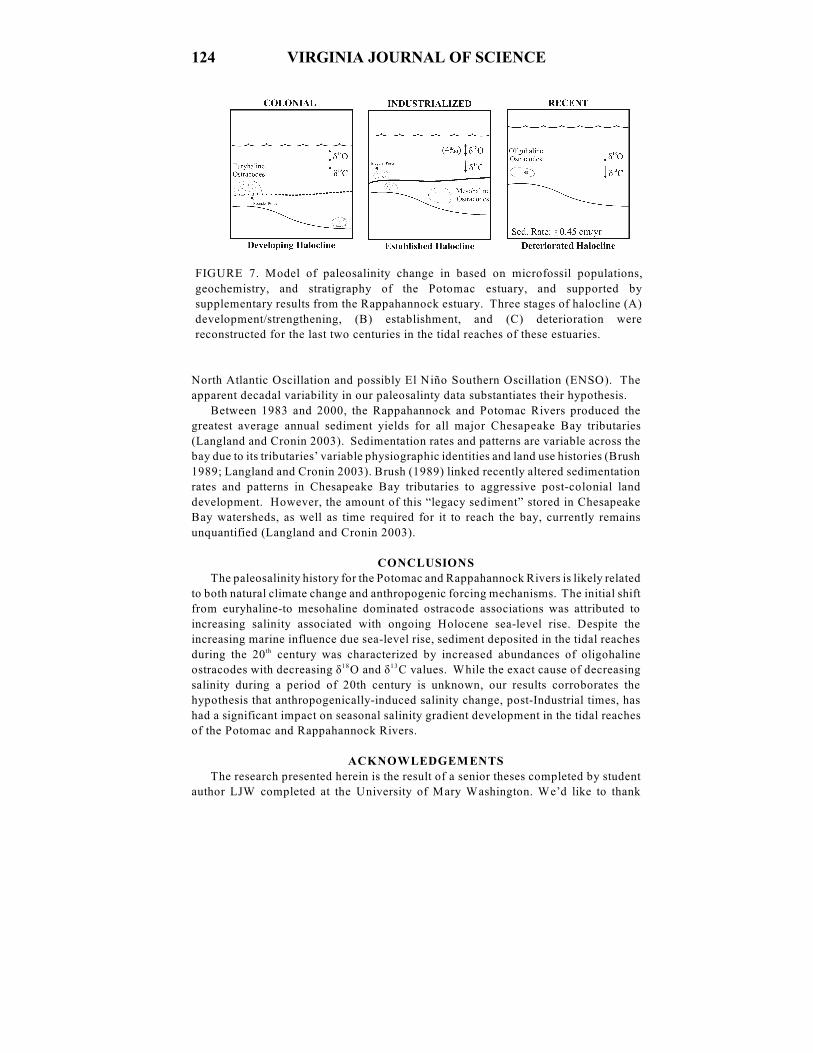
FIGURE 7. Model of paleosalinity change in based on microfossil populations,
geochemistry, and stratigraphy of the Potomac estuary, and supported by
supplementary results from the Rappahannock estuary. Three stages of halocline (A)
development/strengthening, (B) establishment, and (C) deterioration were
reconstructed for the last two centuries in the tidal reaches of these estuaries.
Centennial Record of Paleosalinity Change 125
Olivia Cooper, Nate Winston, Fila Baliwag, and Henry Talley for their contributions
to this data set. We acknowledge financial support provided by the University of Mary
Washington with Faculty Development Grants awarded to NET and Undergraduate
Research Grants awarded to LIW, ORC, and HT. The UMW Summer Science Institute
provided funding to LJW and EJ to support their research during the summer of 2009.
We also would like to thank Dr. Ben Kisila (UMW) for his help with Cs137
methodologies and the many discussions regarding the sedimentation history for our
sites. Thanks to Dinka Besic at the Saskatchewan Isotope Laboratory for loading and
analyzing samples for stable isotope values. A special thanks to Joe Cutry and his crew
at the UMW Auto Shop who helped us maintain safe and operational conditions on the
UMW research boat. Thanks to the anonymous reviewers for their thoughtful
comments that helped to improve the final version of this manuscript.
LITERATURE CITED
Abbott, M.B., and Stafford, T .W. 1996. Radiocarbon Geochemistry of Modern and
Ancient Arctic Lake Systems, Baffin Island, Canada: Quaternary Research
45:300-311.
Anadón P., Gliozzi E., and Mazzini I. 2002. Paleoenvironmental reconstruction of
marginal marine environments from combined paleoecological and
geochemical analyses on ostracods. In: J Holmes and A Chivas (Eds.), The
Ostracoda: Applications in Quaternary research geophysical monograph, 131
(pp. 227-247). Washington, DC: American Geophysical Union.
Anderson T.F., and Arthur M.A., 1983. Stable isotopes of oxygen and carbon and their
applications to sedimentologic and paleoenvironmental problems. In: MA
Arthur, TF Anderson, IR Kaplan, and LS Land (Eds.), Stable Isotopes in
Sedimentary Geology SEPM Short Course No. 10 (pp. 1-151). Tulsa, OK:
SEPM.
Baliwag F., Wilson L., and Odhiambo B.K. 2010. Analysis of long term effects of
mining on fluvial systems: A case study on the Rappahannock River system
and the fate of old tailings of the Kelly Gold Mine, Virginia. GSA Abstracts
with Programs 42(1):182.
Belt E.S., Tibert N.E., Curran H.A., Diemer J.A., Hartman J.H., Kroeger T.J., and
Harwood D.M. 2005. Evidence for marine influence on a low-gradient
coastal plain: Ichnology and invertebrate paleontology of the lower Tongue
River Member (Fort Union Formation, middle Paleocene), western Williston
Basin, U.S.A. Rocky Mountain Geology 40(1):1-24.
Boon, J.D. 2012. Evidence of Sea Level Acceleration at U.S. and Canadian Tide
Stations, Atlantic Coast, North America: Journal of Coastal Research
28(6):1437-1445.
Boon J.D., Brubaker J.M., and Forrest D.R. 2010. Chesapeake Bay land subsidence
and sea level change: An evaluation of past and present trends and future
outlook. Special Report No. 424 in Applied Marine Science and Ocean
Engineering, Virginia Institute of Marine Science, Gloucester Point, VA.
Bratton J.F., Colman S.M., and Seal R.S. II. 2003. Eutrophication and carbon sources
in Chesapeake Bay over the last 2700 years: Human impacts in context.
Geochimica et Cosmochimica Acta, 67(18):3385-3402.
126 VIRGINIA JOURNAL OF SCIENCE
Brush G.S. 1989. Rates and patterns of estuarine sediment accumulation: Limnology
and Oceanography, 34(7):1235-1246.
Carbonnel G. 1983. Morphométrie et hypersalinité chez Cyprideis torosa (Jones)
(Ostracoda, actuel) dans les salines de Santa-Pola (Alicante, Espagne):
Scientifique Géologie Bulletin 36(4):211-219. Strasbourg.
Colman, S.M. and Bratton, J.F. 2003. Anthropogenically induced changes in sediment
and biogenic silica fluxes in Chesapeake Bay: Geology 31(1):71-74.
Colman S.M. and Mixon R.B. 1988. The record of major Quaternary sea-level changes
in a large coastal plain estuary, Chesapeake Bay, eastern United States:
Palaeogeography, Palaeoclimatology, and Palaeoecology 68:99-116.
Cronin T.M., Hayo K., Thunell R.C., Dwyer G.S., Saenger C., Willard D.A. 2010. The
Medieval Climate Anomaly and Little Ice Age in Chesapeake Bay and the
North Atlantic Ocean: Palaeogeography, Palaeoclimatology, Palaeoecology
297:299–310.
Cronin T.M., Dwyer G.S., Kamiya T., Schwede S., and Willard D.A. 2003. Medieval
Warm Period, Little Ice Age and 20th century temperature variability from
Chesapeake Bay: Global and Planetary Change 36:17-29.
Cronin T.M., Thunell R., Dwyer G.S., Saenger C., Mann M.E., Vann C., and Seal II
R.R. 2005. Multiproxy evidence of Holocene climate variability from
estuarine sediments, eastern North America: Paleoceanography 20: PA4006,
doi:10.1029/2005PA001145.
Cronin T.M. and Vann C.D. 2003. The sedimentary record of climatic and
anthropogenic influence on the Patuxent estuary and Chesapeake Bay
ecosystems: Estuaries 26:196-209.
Dalrymple R.W., Zaitlin B.A., and Boyd R. 1992. Estuarine facies models; Conceptual
basis and stratigraphic implications: Journal of Sedimentary Research
62(6):1130-1146.
Elliott A.J. 1976. The circulation and salinity distribution of the upper Potomac
estuary: Chesapeake Science 17(3):141-147.
Elliott H.A., Ellison R., and Nichols M.M. 1966. Distribution of recent Ostracoda in
the Rappahannock Estuary, Virginia: Chesapeake Science, 7(4):203-207.
Ellison R.L. 1972. Ammobaculites, foraminiferal proprietor of the Chesapeake Bay
estuaries. In: BW Nelson (Ed.), Environmental Framework of Coastal Plain
Estuaries: Geological Society of America Memoir 133:247-262.
Ellison R.L. and and Nichols M.M. 1970. Estuarine foraminifera from the
Rappahannock River, Virginia: Contributions from the Cushman Foundation
for Foraminiferal Research 21:1-17.
Ellison, R.L. and Nichols, M. M. 1976. Modern and Holocene Foraminifera in the
Chesapeake Bay Region: Maritime Sediments 1:131-151.
Frenzel P. and Boomer I. 2005. The use of ostracods from marginal marine, brackish
waters as bioindicators of modern and Quaternary environmental change:
Palaeogeography, Paleoclimatology, Palaeoecology 225: 68-92.
Holmes JA, and Chivas AR, (2002). Ostracod shell chemistry—Overview. In: J
Holmes and A Chivas (Eds.), The Ostracoda: Applications in Quaternary
research geophysical monograph, 131 (pp. 185-204). Washington, DC:
American Geophysical Union.
Centennial Record of Paleosalinity Change 127
Ito E., De Deckker R, and Eggins M. 2003. Ostracodes and their shell chemistry:
Implications for paleohydrologic and paleoclimatologic applications. In: LE
Park and LE Smith (Eds.), Bridging the Gap: Trends in the Ostracode
Biological and Geological Sciences (pp. 116-152). Paleontological Society.
New Haven, CT.
Kemp, A.C., Horton, B.P., Culver, S.J., Corbett, D.R., van de Plassche, O., Gehrels,
W.R., Douglas, B.C. and Parnell, A.C. 2009. Timing and magnitude of recent
accelerated sea-level rise (North Carolina, United States): Geology
37(11):1035-1038.
Langland M, and Cronin T (Eds.), (2003). A summary report of sediment processes
in Chesapeake Bay and watershed. U.S. Geological Survey Water-Resources
Investigations Report 03-4123. New Cumberland, PA.
Medley P., Tibert N.E., Patterson W.P., Curran H.A., Greer L., and Colin J.P. 2008.
Paleosalinity history of a middle Holocene lagoonal and lacustrine deposits
in the Enriquillo Valley, Dominican Republic based on pore morphometrics
and isotope geochemistry of Ostracoda: Micropaleontology 53(5):409-419.
Patterson W.P. 1999. Oldest isotopically characterized fish otoliths provide insight to
Jurassic continental climate of Europe: Geology 27(3):199-202.
2Patterson, W.P. and Walter L.M. 1994. Depletion of d C in seawater 3CO on modern13
carbonate platforms: significance for the carbon isotopic record of carbonates:
Geology 22:885-888.
Puri H.S. 1974. Normal pores and the phylogeny of Ostracoda: Geoscience and Man
6:137-151.
National Oceanic and Atmospheric Administration (NOAA). 2008. Mean sea level
t r e n d s f o r s t a t i o n s i n V i r g i n i a : T i d e s a n d C u r r e n t s
http://tidesandcurrents.noaa.gov/index.shtml.
Robbins J.A. and Edgington D.N. 1975. Determination of recent sedimentation rates
in Lake Michigan using Pb-210 and Cs-137: Geochimica et Cosmochimica
Acta 39:285-304.
Rosenfeld A. and Vesper, B. 1977. The variability of the sieve-pores in Recent and
fossil species of Cyprideis torosa (Jones 1850) as an indicator for salinity and
palaeosalinity. In: Loeffler, H., and Danielopol, D. L., Eds., Aspects of
Ecology and Zoogeography of Recent and Fossil Ostracoda. The Hague: Dr
W. Junk b.v., p. 55-67.
Sandberg P.A. and Plusquellec P.L. 1974. Notes on the anatomy and passive dispersal
of Cyprideis (Cytheracea, Ostracoda): Geoscience and Man 6:1-26.
Scott D.B., Medioli F.S., and Schafer C.T. 2001. Monitoring in coastal environments
using foraminifera and thecameobian indicators: Cambridge University Press,
Cambridge, New York.
Tibert N.E., Hubeny J.B., Abbott M., Kiker J.M., Walker, L.J., and McKenzie S. 2013.
Latest Holocene sedimentation rates and sea level history for the tidal marshes
of the Potomac and Rappahannock rivers, tributaries to Chesapeake Bay:
Virginia Journal of Science 63(3):91-109.
United States Environmental Protection Agency (USEPA), 2010. Cesium. Retrieved
from http://www.epa.gov/rpdweb00/radionuclides/cesium.html

128 VIRGINIA JOURNAL OF SCIENCE
United States Environmental Protection Agency (USEPA), 1998. Condition of the
Mid-Atlantic estuaries (Publication No. EPA 600-R-98-147): U.S.
Government Printing Office, Washington, DC.
Wolman MG, (1967). A cycle of sedimentation and erosion in urban river channels.
Geografiska Annaler Series A, Physical Geography 49(2): 385-395.