rocha'pear firmness predicted by a vis/nir segmented model
TRANSCRIPT

‘
Aa
b
c
d
a
ARA
KDPPNS
1
moffrtA
lpba
0d
Postharvest Biology and Technology 51 (2009) 311–319
Contents lists available at ScienceDirect
Postharvest Biology and Technology
journa l homepage: www.e lsev ier .com/ locate /postharvbio
Rocha’ pear firmness predicted by a Vis/NIR segmented model
na M. Cavacoa,∗, Pedro Pintoc,d, M. Dulce Antunesa, Jorge Marques da Silvab, Rui Guerrac
CDCTPV, Universidade do Algarve, Campus de Gabelas, 8005-139 Faro, PortugalCEB, Faculdade de Ciências da Universidade de Lisboa, Ed. C2, Campo Grande, 1749-016 Lisboa, PortugalCEOT, Universidade do Algarve, Campus de Gambelas, 8005-139 Faro, PortugalInstituto de Soldadura de Qualidade, Taguspark, Oeiras, Av. Prof. Doutor Cavaco Silva, 33, 2740-120 Porto Salvo, Portugal
r t i c l e i n f o
rticle history:eceived 3 June 2008ccepted 30 August 2008
eywords:iffuse reflectanceostharvestyrus communis L.on-invasivehelf-life
a b s t r a c t
We present a segmented partial least squares (PLS) prediction model for firmness of ‘Rocha’ pear (Pyruscommunis L.) during fruit ripening under shelf-life conditions. Pears were collected from three differentorchards. Orchard I provided the pears for model calibration and internal validation (set 1). These weretransferred to shelf-life in the dark at 20 ± 2 ◦C and 70% RH, immediately after harvest. External valida-tion was performed on the pears from the other two orchards (sets 2 and 3), which were stored underdifferent conditions before shelf-life. Fruit was followed in the shelf-life period by visible/near infraredreflectance spectroscopy (Vis/NIRS) in the range 400–950 nm. The correlation between firmness and thereflectance at some wavelength bands was markedly different depending on ripening stage. A segmentedpartial least squares model was then constructed to predict firmness. This PLS model has two segments:(1) unripe and ripening/ripe pears (high firmness); (2) over-ripe pears (low firmness). The prediction isdone in two steps. First, a full range model (full model) is applied. When the full model prediction givesa low firmness value, then the over-ripe model is applied to refine the prediction. The full model is rea-sonably significant in regression terms, robust, but allows only a coarse quantitative prediction (standard
deviation ratio, SDR = 2.48, 1.50 and 2.40 for sets 1, 2 and 3, respectively). Also, RMSEP% = 139%, 91% and56%, indicating large relative errors at low firmness values. The segmented model improved moderatelythe correlation, and the values of RMSEC, RMSEP and SDR; it improved significantly the RMSEP% (29%,55% and 31%), providing an improvement of the relative prediction errors at low firmness values. Thismethod improves the ordinary PLS models. Finally, we tested whether chlorophyll alone was enough fornessf the
Fird2
ba(e2
a predictive model for firmexplain the performance o
. Introduction
Assessment of ‘Rocha’ (Pyrus communis L.) pear ripening is ofajor concern in both pre- and postharvest long-term storage peri-
ds. Currently, this depends on the destructive determination ofruit firmness through pressure tests using a penetrometer on theruit surface. ‘Rocha’ pears are considered at harvest optimal matu-ity when fruit have a firmness of 55–65 N (Alexandre, 2001), athe optimal eating ripe stage when firmness is ∼20 N (Isidoro andlmeida, 2006), and are considered over-ripe at lower values.
The pattern of softening and ripening of ‘Rocha’ pear closely fol-
ows the climacteric ethylene rise (Fonseca et al., 2004a). Whenre-climacteric ‘Rocha’ fruit are not exposed to low temperaturesefore a shelf-life period, they do not ripen or soften uniformly,cquiring in many cases a rubbery texture (Fonseca et al., 2005).∗ Corresponding author. Tel.: +351 289 800900x7614; fax: +351 289800066.E-mail address: [email protected] (A.M. Cavaco).
oer7n
bp
925-5214/$ – see front matter © 2008 Elsevier B.V. All rights reserved.oi:10.1016/j.postharvbio.2008.08.013
, but the results showed that the absorption of chlorophyll alone does notPLS models.
© 2008 Elsevier B.V. All rights reserved.
urthermore, although while not loosing their capacity to ripen, ass the case with the ‘Anjou’ variety (Wang and Mellenthin, 1975),ipening of ‘Rocha’ pears is influenced by storage atmosphere con-itions (Sánchez and Morais, 2001; Galvis-Sánchez et al., 2003,004).
Visible/near infrared reflectance spectroscopy (Vis/NIRS) haseen used to assess firmness in a wide number of fruit such aspples (Zude et al., 2006), kiwifruit (Clark et al., 2004), peachesSlaughter, 1995), watermelon (Tian et al., 2007), grapes (Herrerat al., 2003), oranges (Cayuela, 2008), and tomatoes (Shao et al.,007). In particular, the influence of the fruit development stagen the relationship between mechanical and spectral optical prop-rties has been described in apple (Zude-Sasse et al., 2000). Also,ecent work has shown that NIR spectroscopy (wavelengths above
80 nm) failed to provide an appropriate prediction model for firm-ess of ‘Conference’ pears (Nicolaï et al., 2008).A typical fruit reflectance spectrum contains information onoth absorption and scattering. While absorption is related to theresence of chemical components, scattering is related to the size,
3 logy a
stmardottaims
mppeo
2
2
dtnoaI
wvP(uwD
oRps9Rot
s
TD‘
OCIEE
Ns
ot
2
VrrmOihfbcO4usbfss(ic
2
wd(sweat
2
2ac
12 A.M. Cavaco et al. / Postharvest Bio
hape and microstructure of the tissue (Nicolaï et al., 2007). Scat-ering results from multiple refractions at phase changes inside the
aterial, particularly at the cell wall interfaces since they inducebrupt changes in the refractive index (McGlone et al., 1997). Theoles of scattering and absorption in the production of R spectra areifferent. Indeed, the scattering process affects the intensity levelf the R spectrum rather than the shape, this being more relatedo the absorption process (Nicolaï et al., 2007). Hence, the informa-ion provided by NIR spectroscopy is mainly determined by thebsorption. Recent investigations enhance the scattering-relatednformation through multispectral or hyperspectral imaging, by
easuring also the spatial profile of the backscattered light inten-ity on the fruit surface (Lu, 2004; Qing et al., 2008).
The main goal of this study was the construction of a seg-ented partial least squares (PLS) model for firmness of ‘Rocha’
ears during ripening under shelf-life conditions. We present thehysiological justification and validate the model with internal andxternal fruit sets, demonstrating that this method improves therdinary PLS models.
. Materials and methods
.1. Fruit
Pear fruit (P. communis L. cv. Rocha) were collected from threeifferent orchards. Orchard I, located in Mafra (Portugal), providedhe pears for model calibration and internal validation (set 1). Exter-al validation was performed using different sets of pears from twother orchards: orchard II (set 2), located also in Mafra (Portugal),nd orchard III (set 3), located 60 km north, separate from orchardsand II, in Cadaval (Portugal).
Pears ranging from 71 to 295.6, 114.2–224.5 and 116.3–162.2 gere collected from orchards I, II and III, respectively, at har-
est ripening stage (Alexandre, 2001), by the end of August 2007.ears were immediately transported to commercial packinghousesFrutoeste/Mafra or Coopval/Cadaval), and hand-sorted to selectndamaged fruit. Pears from orchards II and III were further treatedith Imazalil (commercial dose) and drenched with 636 mg L−1
PA.Fruit set 1 (157 pears) were immediately transferred from
rchard I to shelf-life conditions in the dark at 20 ± 2 ◦C and 70%H and evaluated regularly, using 10–20 fruit per assay, over a 46 deriod. Fruit sets 2 (70 pears) and 3 (60 pears) underwent differenttorage conditions before shelf-life, namely, 7 months at 0 ◦C, RH0–95% and CA (1.5 kPa O2 + 0.5 kPa CO2), and 8 months at −0.5 ◦C,H 94–96% and CA (2 kPa O + 0.5 kPa CO ), respectively. Shelf-life
2 2f sets 2 and 3 was 13 and 18 d, respectively. The distribution statis-ics of all fruit sets are presented in Table 1.The first measurements started after 24 h of equilibration underhelf-life conditions. All measurements were carried out on two
able 1istributional statistics of data sets used for model calibration and validation of
Rocha’ pear firmness (N).
Firmness (N)
Samples indices
N Mean S.D. Max Min
rchard I full set 157 36.7 26.6 77.5 1.5alibration set 105 36.7 26.7 77.5 1.5
nternal validation set 1 52 36.6 26.5 72.6 2.2xternal validation set 2 70 20.4 15.6 50.6 9.7xternal validation set 3 60 22.7 18.9 65.4 3.8
o statistically significant difference (p < 0.05) was found among the various fruitets.
csh1w2bwtMirt
nsbSa
nd Technology 51 (2009) 311–319
pposite sides on the equator of each pear. Each value representshe average of the two positions and is presented as the fruit value.
.2. Vis/NIR reflectance spectroscopy
The spectroscopic measurements were taken with an opticalis/NIR spectrometer (USB4000-VIS-NIR, Ocean Optics, USA), in theange 350–1035 nm with an average resolution of 1.4 nm (opticalesolution imposed by the entrance slit of 25 �m). All the measure-ents were taken with an integrating sphere (IS) (ISP-50-8-R-GT,cean Optics, USA), in the 0◦/d SCI configuration (quasi-normal
ncidence, specular component included). Light from a tungsten-alogen source (HL-2000-FHSA, Ocean Optics, USA) was sent to the
ruit through an optical fibre and the re-emerging light collectedy a second fibre and sent to the spectrometer. For acquisition, pro-essing and calibration, specific software was used (Spectra Suite,cean Optics, USA). The low radiation from the light source below00 nm and the low sensitivity of the CCD camera in the lower andpper (<400 and > 950 nm) parts of the spectrum produced a lowignal to noise ratio and determined the useful wavelength rangeetween 400 and 950 nm. Each fruit spectrum was recorded as dif-use reflectance (R), by averaging 5 scans, taking 2 s to measure eachide of a pear. R was calculated automatically taking the raw samplepectrum (RS), the dark spectrum (RD) and the reference spectrumRR) (Spectralon white surface, WS-1, Ocean Optics, USA), accord-ng to R = 100(RS − RD)/(RR − RD). All Vis/NIRS measurements werearried out in the dark at 20 ± 2 ◦C.
.3. Fruit quality attributes
Immediately after spectra acquisition, sampled pear fruit wereeighed and the respective surface colour determined at threeifferent positions around the fruit equator with a colorimeterMinolta CR-200 Chroma meter, Japan) in the CIE L*a*b* colourpace. Firmness was determined by puncture, after skin removal,ith a Chatillon Force TCD200, Digital Force Gauge Dfis50 pen-
trometer, (Chatillon, USA) fitted with an 8 mm diameter plungert a depth of 7 mm. Dry matter (DM, %) was assessed after dryinghe pulp and fruit peel separately at 60 ◦C for at least 3 d.
.4. Data analysis
The raw spectra obtained from the spectrometer consisted of685 data points (3648 in the full range), corresponding to theverage software resolution of 0.19 nm. However, only the opti-al resolution of about 1.4 nm should be taken into account. Thisorresponds to approximately 8 pixels in the spectrometer CCDensor and a corresponding data reduction to ∼360 points. Weave further introduced a factor of ∼3 obtaining a final spectra with14 wavelength data points. These Vis/NIR spectra were correlatedith firmness using the partial least squares algorithm (Wold et al.,
001). The PLS was implemented by us in FORTRAN and validatedy reproducing the results of Geladi and Kowalski (1986), a paperith a working example. Data manipulation and auxiliary calcula-
ions were performed in MATLAB® (The MathWorks, Inc., Natick,A, USA, 1998). Other data pre-treatments were also tried. This
ncluded the calculation of the derivative spectra and their loga-ithmic transformation. However, no advantage was found in usinghese procedures.
From set 1, 105 pears were used for calibration and 52 for inter-
al validation. The model was then applied to set 2 (60 pears) andet 3 (70 pears), for external validation. All data sets were comparedy a one-way ANOVA for a significant level of p < 0.05 (SigmaStat 2.0,PSS Science, USA) and found statistically equivalent, despite theirpparent differences in means and ranges (Table 1). Model perfor-
logy and Technology 51 (2009) 311–319 313
m(boctto
3
3a
a2esa((4s
t2ohsaa2atb
phr(arn
wo
(
(
Fig. 1. Correlation of ‘Rocha’ firmness with the reflectance at each individual wave-l((
(
(
(
(
A.M. Cavaco et al. / Postharvest Bio
ance was expressed as root mean squared errors of calibrationRMSEC) and prediction (RMSEP), and the correlation coefficient (r)etween the predicted and measured parameter. For the calculationf RMSEC a “leave two out” procedure was adopted. We have alsoalculated the RMSEP% (RMSEP calculated with the relative errors),he standard deviation ratio (SDR = �valid/RMSEP, where �valid ishe standard deviation of the validation set) and the percentagef predictions with error below 30% [denoted % (error< 30%)].
. Results and discussion
.1. Relations between the reflectance spectra and fruit softeningnd ripening physiology
Firmness, determined by pressure testing, has been shown to ben excellent indicator of ‘Rocha’ maturity on the tree (Alexandre,001), and of ripening stage during shelf-life after storage (Cavacot al., 2008). The latter was confirmed in fruit sets 2 and 3, whichhowed uniform decreasing firmness values during a shelf-life ofbout 3 weeks (data not shown). Yet, as reported by Fonseca et al.2005), ‘Rocha’ pears transferred directly to shelf-life after harvestas in set 1), exhibited a non-uniform softening rate, showing after6 d the same probability of finding firm and soft pears (data nothown).
In general, softening of ‘Rocha’ pears coincides with the climac-eric rise, reaching optimal eating ripe stage at a firmness of around0 N (Isidoro and Almeida, 2006), after which they are consideredver-ripe and/or post-climacteric. Fruit ripening and softening,owever, are complex processes and in ‘Rocha’ pears, softeningeems to be a consequence of progressive cell wall modificationnd disassembly by enzyme action, leading to the solubilisationnd depolymerisation of pectins and hemicellulases (Fonseca et al.,004b, 2005 and references therein). The flesh softening leads tolower opacity, increasing light penetration depth and decreasing
he level of diffuse reflectance. However, this scattering effect maye obscured by absorption effects.
We have found that the plot of the correlation r(�) between theear firmness (F) and the reflectance (R) is a good way to understandow ripening contributes to the reflectance spectra obtained. Cor-elations were calculated for three cases: (i) all pears (solid line);ii) only for pears with firmness >10 N (high-F range) (open circles);nd (iii) only for pears with firmness <10 N (black circles) (low-Fange). These pears belonged to set 1, since the external sets shouldot influence the model construction.
In order to make the discussion simpler and more systematic,e can list physiological mechanisms and their respective effects
n r(�), depicted in Fig. 1.
1) Light absorption by chlorophylls (Chl). In vivo, Chla absorbs inthe ranges of 400–450 and 650–700 nm, while Chlb absorbs at450–500 and 600–650 nm. Fruit ripening involves a decrease inthe fruit peel total chlorophyll content (Merzlyak et al., 1999).Hence, firmness decreases in parallel with decrease in Chl con-tent, suggesting that as absorption by chlorophyll decreases,R increases. Thus, Chl absorption is negatively correlated withfirmness, since firmness and reflectance vary in opposite direc-tions. This type of reasoning will be applied to the otherfactors.
2) Light absorption by chlorophylls and carotenoids at
400–500 nm. Firmness decreases in parallel with a decreasein absorption in the 400–500 nm range until reaching a min-imum and then remains constant, reflecting the retention ofcarotenoids during ripening (data not shown) (Merzlyak et al.,1999). This implies that R increases and then keeps constant.ength, r(�). (©) Correlation made only with pears with firmness higher than 10 Nset 1); (�) correlation made only with pears with firmness lower than 10 N (set 1);–) correlation made with the entire set of orchard I pears.
This absorption is negatively correlated with firmness in thehigh-F range and non-correlated in the low-F range.
3) Softening results mainly from cell disassembly and loosening.Firmness decreases with decrease in an initial sharp cell phaseseparation, and with this decrease, scattering decreases and Rwill decrease. This effect is positively correlated with firmnessfor all wavelengths.
4) Light absorption by carbohydrates. Absorption by carbohy-drates in the band 800–1050 nm is well known (Williamsand Norris, 1987). The by-products of cell wall degradationabsorb above 900 nm and induce extra absorption in this band(Kacuráková et al., 2000; Wilson et al., 2000; McCann et al.,2007). Hence, firmness decreases as concentrations of sugarsand/or cell wall disassembly by-products increase, absorptionabove 900 nm increases, and R above 900 nm decreases. Thiseffect is positively correlated with firmness above 900 nm,while the by-products are not yet being re-used (see next point).This corresponds approximately to the high-F range condition.
5) Allocation of both soluble carbohydrates and cell wall disas-sembly by-products to consumption pathways. At a later stageof ripening, at the climacteric peak and post-climacteric stage,both the soluble sugars as well as the by-products of cellwall disassembly enter the glycolytic flux and other pathwaysoccurring in senescence, their content decreasing significantly(Hadfield and Bennett, 1997; Duque and Arrabaca, 2002; Valle-Guadarrama et al., 2004). This process is important for thelow-F range. Thus, firmness decreases as concentrations ofsoluble carbohydrates and cell wall disassembly by-productsdecrease because of allocation to consumption pathways, andthus absorption above 900 nm decreases and R above 900 nmincreases. This effect is negatively correlated with firmnessabove 900 nm in the low-F range.
6) Water light absorption and relocation. The sharp increase inwater absorption above 900 nm leads to lower R. However, thisdoes not mean that this effect has any correlation with firm-ness. Indeed, we have verified that the DM (fruit, peel, pulp)did not correlate at all with firmness (Table 3). However, and aspointed out by Peirs et al. (2005), cell wall deterioration maylead to relocation of water molecules, changing relative refrac-
tive indices and consequently the scattering process and thereflectance. In the end, this means that, after all, a correlationbetween the water absorption band and firmness is plausible.However, the complexity of the problem does not allow for aprediction about the signal of the correlation.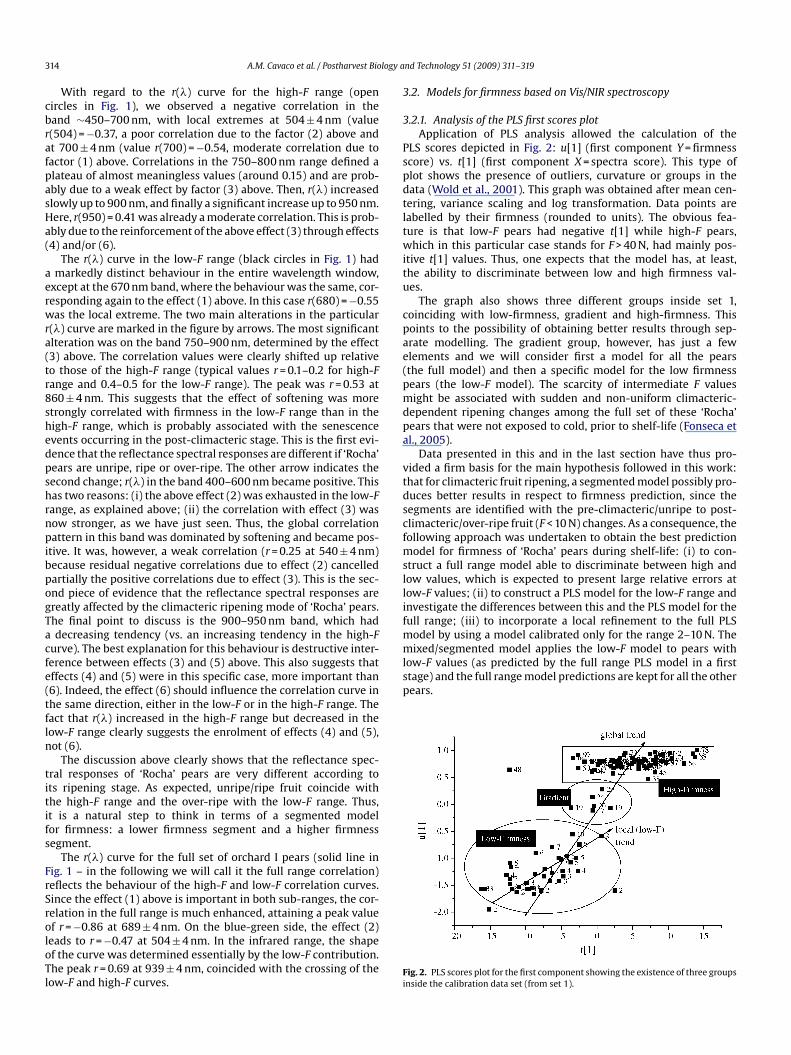
3 logy a
cbrafpasHa(
aerwra(tr8shedpshrnpibpogTacfe(tfln
titifs
FrSroloTl
3
3
Pspdtltwitu
cpae(pmdpa
vtdscfmsllifmmixed/segmented model applies the low-F model to pears withlow-F values (as predicted by the full range PLS model in a firststage) and the full range model predictions are kept for all the otherpears.
14 A.M. Cavaco et al. / Postharvest Bio
With regard to the r(�) curve for the high-F range (openircles in Fig. 1), we observed a negative correlation in theand ∼450–700 nm, with local extremes at 504 ± 4 nm (value(504) = −0.37, a poor correlation due to the factor (2) above andt 700 ± 4 nm (value r(700) = −0.54, moderate correlation due toactor (1) above. Correlations in the 750–800 nm range defined alateau of almost meaningless values (around 0.15) and are prob-bly due to a weak effect by factor (3) above. Then, r(�) increasedlowly up to 900 nm, and finally a significant increase up to 950 nm.ere, r(950) = 0.41 was already a moderate correlation. This is prob-bly due to the reinforcement of the above effect (3) through effects4) and/or (6).
The r(�) curve in the low-F range (black circles in Fig. 1) hadmarkedly distinct behaviour in the entire wavelength window,
xcept at the 670 nm band, where the behaviour was the same, cor-esponding again to the effect (1) above. In this case r(680) = −0.55as the local extreme. The two main alterations in the particular
(�) curve are marked in the figure by arrows. The most significantlteration was on the band 750–900 nm, determined by the effect3) above. The correlation values were clearly shifted up relativeo those of the high-F range (typical values r = 0.1–0.2 for high-Fange and 0.4–0.5 for the low-F range). The peak was r = 0.53 at60 ± 4 nm. This suggests that the effect of softening was moretrongly correlated with firmness in the low-F range than in theigh-F range, which is probably associated with the senescencevents occurring in the post-climacteric stage. This is the first evi-ence that the reflectance spectral responses are different if ‘Rocha’ears are unripe, ripe or over-ripe. The other arrow indicates theecond change; r(�) in the band 400–600 nm became positive. Thisas two reasons: (i) the above effect (2) was exhausted in the low-Fange, as explained above; (ii) the correlation with effect (3) wasow stronger, as we have just seen. Thus, the global correlationattern in this band was dominated by softening and became pos-
tive. It was, however, a weak correlation (r = 0.25 at 540 ± 4 nm)ecause residual negative correlations due to effect (2) cancelledartially the positive correlations due to effect (3). This is the sec-nd piece of evidence that the reflectance spectral responses arereatly affected by the climacteric ripening mode of ‘Rocha’ pears.he final point to discuss is the 900–950 nm band, which haddecreasing tendency (vs. an increasing tendency in the high-F
urve). The best explanation for this behaviour is destructive inter-erence between effects (3) and (5) above. This also suggests thatffects (4) and (5) were in this specific case, more important than6). Indeed, the effect (6) should influence the correlation curve inhe same direction, either in the low-F or in the high-F range. Theact that r(�) increased in the high-F range but decreased in theow-F range clearly suggests the enrolment of effects (4) and (5),ot (6).
The discussion above clearly shows that the reflectance spec-ral responses of ‘Rocha’ pears are very different according tots ripening stage. As expected, unripe/ripe fruit coincide withhe high-F range and the over-ripe with the low-F range. Thus,t is a natural step to think in terms of a segmented modelor firmness: a lower firmness segment and a higher firmnessegment.
The r(�) curve for the full set of orchard I pears (solid line inig. 1 – in the following we will call it the full range correlation)eflects the behaviour of the high-F and low-F correlation curves.ince the effect (1) above is important in both sub-ranges, the cor-elation in the full range is much enhanced, attaining a peak value
f r = −0.86 at 689 ± 4 nm. On the blue-green side, the effect (2)eads to r = −0.47 at 504 ± 4 nm. In the infrared range, the shapef the curve was determined essentially by the low-F contribution.he peak r = 0.69 at 939 ± 4 nm, coincided with the crossing of theow-F and high-F curves.Fi
nd Technology 51 (2009) 311–319
.2. Models for firmness based on Vis/NIR spectroscopy
.2.1. Analysis of the PLS first scores plotApplication of PLS analysis allowed the calculation of the
LS scores depicted in Fig. 2: u[1] (first component Y = firmnesscore) vs. t[1] (first component X = spectra score). This type oflot shows the presence of outliers, curvature or groups in theata (Wold et al., 2001). This graph was obtained after mean cen-ering, variance scaling and log transformation. Data points areabelled by their firmness (rounded to units). The obvious fea-ure is that low-F pears had negative t[1] while high-F pears,hich in this particular case stands for F > 40 N, had mainly pos-
tive t[1] values. Thus, one expects that the model has, at least,he ability to discriminate between low and high firmness val-es.
The graph also shows three different groups inside set 1,oinciding with low-firmness, gradient and high-firmness. Thisoints to the possibility of obtaining better results through sep-rate modelling. The gradient group, however, has just a fewlements and we will consider first a model for all the pearsthe full model) and then a specific model for the low firmnessears (the low-F model). The scarcity of intermediate F valuesight be associated with sudden and non-uniform climacteric-
ependent ripening changes among the full set of these ‘Rocha’ears that were not exposed to cold, prior to shelf-life (Fonseca etl., 2005).
Data presented in this and in the last section have thus pro-ided a firm basis for the main hypothesis followed in this work:hat for climacteric fruit ripening, a segmented model possibly pro-uces better results in respect to firmness prediction, since theegments are identified with the pre-climacteric/unripe to post-limacteric/over-ripe fruit (F < 10 N) changes. As a consequence, theollowing approach was undertaken to obtain the best prediction
odel for firmness of ‘Rocha’ pears during shelf-life: (i) to con-truct a full range model able to discriminate between high andow values, which is expected to present large relative errors atow-F values; (ii) to construct a PLS model for the low-F range andnvestigate the differences between this and the PLS model for theull range; (iii) to incorporate a local refinement to the full PLS
odel by using a model calibrated only for the range 2–10 N. The
ig. 2. PLS scores plot for the first component showing the existence of three groupsnside the calibration data set (from set 1).
A.M. Cavaco et al. / Postharvest Biology and Technology 51 (2009) 311–319 315
Table 2Summary of the models presented in this work concerning firmness of ‘Rocha’ pear in the shelf-life along ripening.
Model Range (N) No. of LV RMSEC/RMSEP (N) RMSEP% rc2/rp
2 Bias (N) SDR % (error < 30%) Pred. mean (N) Pred. std dev (N)
Full-rangeSet 1 (cal) 1.5
–77.58 10.9 0.88 0.0 2.90 66 36.7 25.1
Set 1 (valid) 10.7 139 0.85 −0.1 2.48 60 36.7 22.3Set 2 10.4 91 0.74 0 1.50 44 20.4 20.2Set 3 7.9 56 0.83 0 2.40 55 22.7 18.7
Low-FSet 1 (cal) 1.5
–9.63 0.9 0.71 0.0 1.88 89 3.8 1.3
Set 1 (valid) 1.1 21 0.53 0.1 1.49 83 3.7 1.2Set 2 1.5 21 0.16 0 1.00 83 7.7 1.3Set 3 1.7 27 0.02 0 0.88 86 7.7 1.1
SegmentedSet 1 (cal) 1.5
–77.53 + 8 8.9a 0.90 1.6 3.00a 86 35.1 26.3
Set 1 (valid) 10.1 29 0.86 2.7 2.63 83 33.9 25.2Set 2 8.3 55 0.79 −0.6 1.89 64 21.0 18.4Set 3 6.8 31 0.86 0.8 2.77 80 21.9 18.2
Colorimetry only a*Set 1 (cal) 1.5
–77.51 18.3 155 0.53 2.1 1.46 47 34.6 21.9
Set 1 (valid) 15.9 43 0.64 1.1 1.67 58 35.5 23.4Set 2 7.6 28 0.77 0.8 2.06 67 19.6 14.9Set 3 5.6 0.92 1.9 3.35 78 20.8 16.4
Colorimetry fullSet 1 (cal) 1.5
–77.56 15.3a 63 0.71 1.7 1.75a 66 35.1 24.4
Set 1 (valid) 17.8 36 0.59 3.9 1.49 67 32.7 26.7Set 3 8.2 0.83 2.30 73 23.6 19.3
R (689 nm)Set 1 (cal) 1.5
–77.51 11.1 0.83 1.7 2.41 72 34.9 25.2
Set 1 (valid) 19.2 107 0.55 0.4 1.38 63 33.9 27.0Set 3 7.0 36 0.88 −1.8 2.72 68 24.5 20.6
“ e predc table.
3
taaetI(npsitpdfEtfa(Rs
iStNat
emmore uniform in the low-F region and gave lower values of RMSEP%.Either way, the dispersion of the predictions in the low-F range wasvisible for all data sets. As a practical result, this model classifiesas medium-firm a significant number of pre- and senescent pears(Fig. 3).
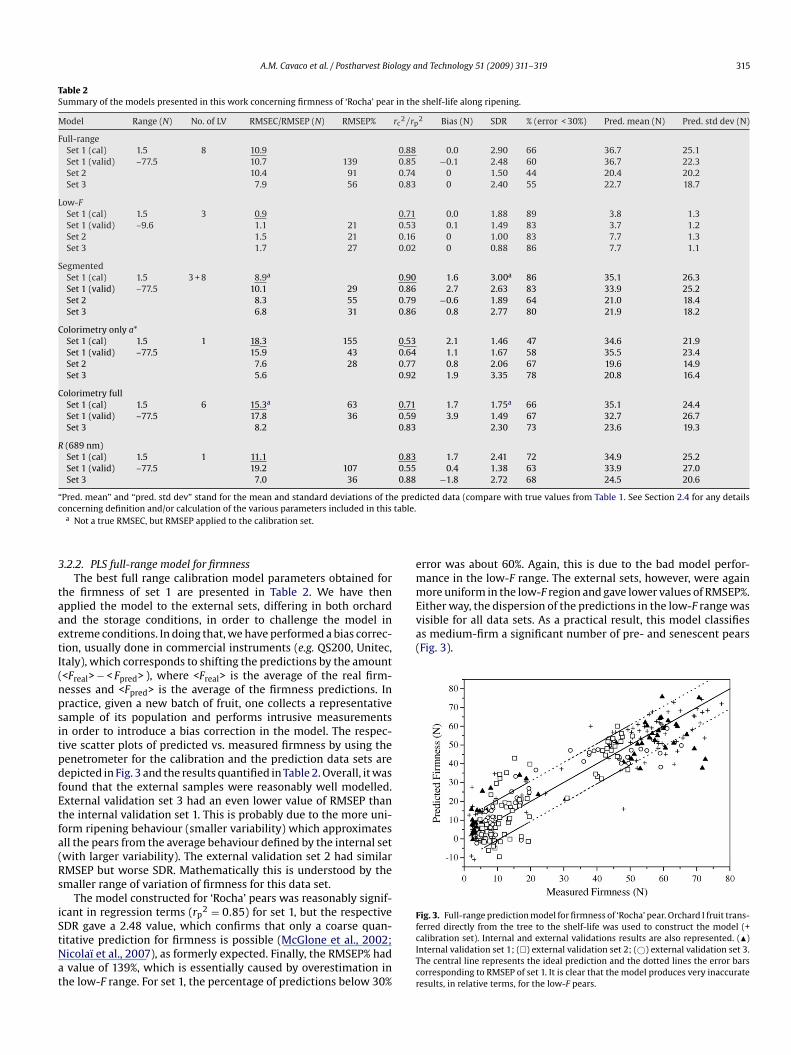
Fig. 3. Full-range prediction model for firmness of ‘Rocha’ pear. Orchard I fruit trans-
Pred. mean” and “pred. std dev” stand for the mean and standard deviations of thoncerning definition and/or calculation of the various parameters included in thisa Not a true RMSEC, but RMSEP applied to the calibration set.
.2.2. PLS full-range model for firmnessThe best full range calibration model parameters obtained for
he firmness of set 1 are presented in Table 2. We have thenpplied the model to the external sets, differing in both orchardnd the storage conditions, in order to challenge the model inxtreme conditions. In doing that, we have performed a bias correc-ion, usually done in commercial instruments (e.g. QS200, Unitec,taly), which corresponds to shifting the predictions by the amount<Freal> − < Fpred> ), where <Freal> is the average of the real firm-esses and <Fpred> is the average of the firmness predictions. Inractice, given a new batch of fruit, one collects a representativeample of its population and performs intrusive measurementsn order to introduce a bias correction in the model. The respec-ive scatter plots of predicted vs. measured firmness by using theenetrometer for the calibration and the prediction data sets areepicted in Fig. 3 and the results quantified in Table 2. Overall, it wasound that the external samples were reasonably well modelled.xternal validation set 3 had an even lower value of RMSEP thanhe internal validation set 1. This is probably due to the more uni-orm ripening behaviour (smaller variability) which approximatesll the pears from the average behaviour defined by the internal setwith larger variability). The external validation set 2 had similarMSEP but worse SDR. Mathematically this is understood by themaller range of variation of firmness for this data set.
The model constructed for ‘Rocha’ pears was reasonably signif-cant in regression terms (rp
2 = 0.85) for set 1, but the respective
DR gave a 2.48 value, which confirms that only a coarse quan-itative prediction for firmness is possible (McGlone et al., 2002;icolaï et al., 2007), as formerly expected. Finally, the RMSEP% hadvalue of 139%, which is essentially caused by overestimation inhe low-F range. For set 1, the percentage of predictions below 30%
fcITcr
icted data (compare with true values from Table 1. See Section 2.4 for any details
rror was about 60%. Again, this is due to the bad model perfor-ance in the low-F range. The external sets, however, were again
erred directly from the tree to the shelf-life was used to construct the model (+alibration set). Internal and external validations results are also represented. (�)nternal validation set 1; (�) external validation set 2; (©) external validation set 3.he central line represents the ideal prediction and the dotted lines the error barsorresponding to RMSEP of set 1. It is clear that the model produces very inaccurateesults, in relative terms, for the low-F pears.
3 logy and Technology 51 (2009) 311–319
iPbncflmsteui
pmppf0cMaooRtFloc
uc(2twr
PirbwpeRwnu
3
fiowtiSSpto
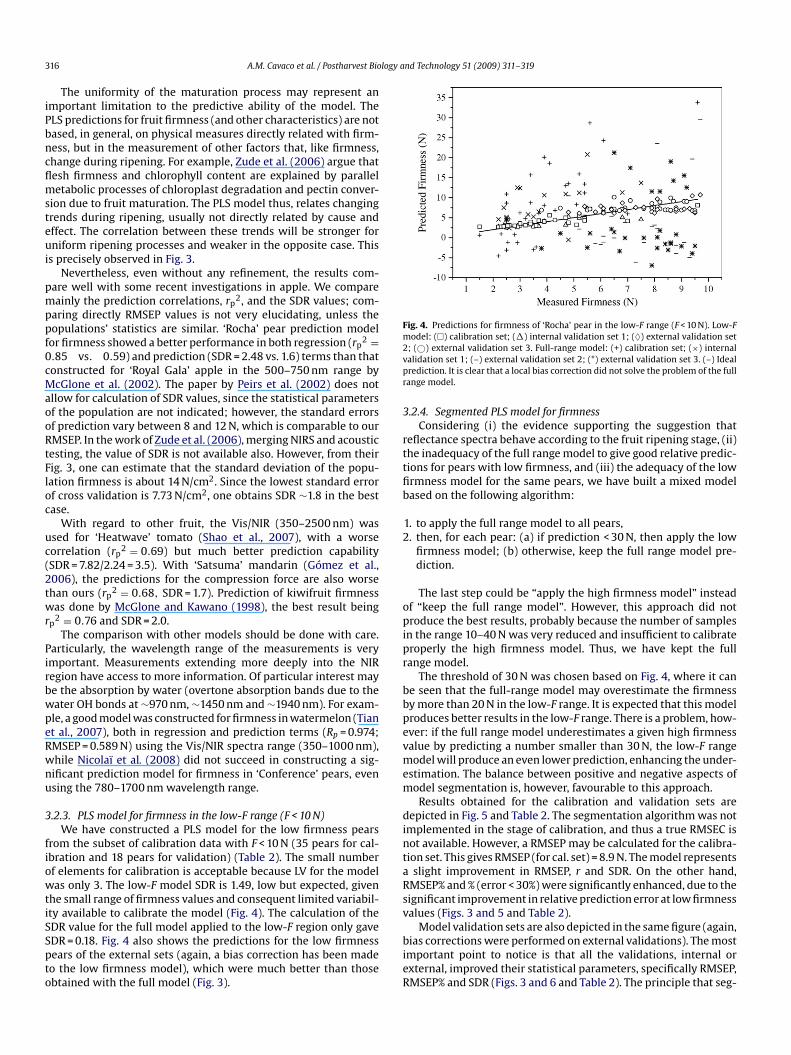
Fig. 4. Predictions for firmness of ‘Rocha’ pear in the low-F range (F < 10 N). Low-Fmodel: (�) calibration set; (�) internal validation set 1; (♦) external validation set2vpr
3
rttfib
2
opipr
bbpevmem
dintaRsv
16 A.M. Cavaco et al. / Postharvest Bio
The uniformity of the maturation process may represent anmportant limitation to the predictive ability of the model. TheLS predictions for fruit firmness (and other characteristics) are notased, in general, on physical measures directly related with firm-ess, but in the measurement of other factors that, like firmness,hange during ripening. For example, Zude et al. (2006) argue thatesh firmness and chlorophyll content are explained by paralleletabolic processes of chloroplast degradation and pectin conver-
ion due to fruit maturation. The PLS model thus, relates changingrends during ripening, usually not directly related by cause andffect. The correlation between these trends will be stronger forniform ripening processes and weaker in the opposite case. This
s precisely observed in Fig. 3.Nevertheless, even without any refinement, the results com-
are well with some recent investigations in apple. We compareainly the prediction correlations, rp
2, and the SDR values; com-aring directly RMSEP values is not very elucidating, unless theopulations’ statistics are similar. ‘Rocha’ pear prediction modelor firmness showed a better performance in both regression (rp
2 =.85 vs. 0.59) and prediction (SDR = 2.48 vs. 1.6) terms than thatonstructed for ‘Royal Gala’ apple in the 500–750 nm range bycGlone et al. (2002). The paper by Peirs et al. (2002) does not
llow for calculation of SDR values, since the statistical parametersf the population are not indicated; however, the standard errorsf prediction vary between 8 and 12 N, which is comparable to ourMSEP. In the work of Zude et al. (2006), merging NIRS and acousticesting, the value of SDR is not available also. However, from theirig. 3, one can estimate that the standard deviation of the popu-ation firmness is about 14 N/cm2. Since the lowest standard errorf cross validation is 7.73 N/cm2, one obtains SDR ∼1.8 in the bestase.
With regard to other fruit, the Vis/NIR (350–2500 nm) wassed for ‘Heatwave’ tomato (Shao et al., 2007), with a worseorrelation (rp
2 = 0.69) but much better prediction capabilitySDR = 7.82/2.24 = 3.5). With ‘Satsuma’ mandarin (Gómez et al.,006), the predictions for the compression force are also worsehan ours (rp
2 = 0.68, SDR = 1.7). Prediction of kiwifruit firmnessas done by McGlone and Kawano (1998), the best result being
p2 = 0.76 and SDR = 2.0.The comparison with other models should be done with care.
articularly, the wavelength range of the measurements is verymportant. Measurements extending more deeply into the NIRegion have access to more information. Of particular interest maye the absorption by water (overtone absorption bands due to theater OH bonds at ∼970 nm, ∼1450 nm and ∼1940 nm). For exam-le, a good model was constructed for firmness in watermelon (Tiant al., 2007), both in regression and prediction terms (Rp = 0.974;MSEP = 0.589 N) using the Vis/NIR spectra range (350–1000 nm),hile Nicolaï et al. (2008) did not succeed in constructing a sig-ificant prediction model for firmness in ‘Conference’ pears, evensing the 780–1700 nm wavelength range.
.2.3. PLS model for firmness in the low-F range (F < 10 N)We have constructed a PLS model for the low firmness pears
rom the subset of calibration data with F < 10 N (35 pears for cal-bration and 18 pears for validation) (Table 2). The small numberf elements for calibration is acceptable because LV for the modelas only 3. The low-F model SDR is 1.49, low but expected, given
he small range of firmness values and consequent limited variabil-ty available to calibrate the model (Fig. 4). The calculation of the
DR value for the full model applied to the low-F region only gaveDR = 0.18. Fig. 4 also shows the predictions for the low firmnessears of the external sets (again, a bias correction has been madeo the low firmness model), which were much better than thosebtained with the full model (Fig. 3).bieR
; (©) external validation set 3. Full-range model: (+) calibration set; (×) internalalidation set 1; (–) external validation set 2; (*) external validation set 3. (–) Idealrediction. It is clear that a local bias correction did not solve the problem of the fullange model.
.2.4. Segmented PLS model for firmnessConsidering (i) the evidence supporting the suggestion that
eflectance spectra behave according to the fruit ripening stage, (ii)he inadequacy of the full range model to give good relative predic-ions for pears with low firmness, and (iii) the adequacy of the lowrmness model for the same pears, we have built a mixed modelased on the following algorithm:
1. to apply the full range model to all pears,. then, for each pear: (a) if prediction < 30 N, then apply the low
firmness model; (b) otherwise, keep the full range model pre-diction.
The last step could be “apply the high firmness model” insteadf “keep the full range model”. However, this approach did notroduce the best results, probably because the number of samples
n the range 10–40 N was very reduced and insufficient to calibrateroperly the high firmness model. Thus, we have kept the fullange model.
The threshold of 30 N was chosen based on Fig. 4, where it cane seen that the full-range model may overestimate the firmnessy more than 20 N in the low-F range. It is expected that this modelroduces better results in the low-F range. There is a problem, how-ver: if the full range model underestimates a given high firmnessalue by predicting a number smaller than 30 N, the low-F rangeodel will produce an even lower prediction, enhancing the under-
stimation. The balance between positive and negative aspects ofodel segmentation is, however, favourable to this approach.Results obtained for the calibration and validation sets are
epicted in Fig. 5 and Table 2. The segmentation algorithm was notmplemented in the stage of calibration, and thus a true RMSEC isot available. However, a RMSEP may be calculated for the calibra-ion set. This gives RMSEP (for cal. set) = 8.9 N. The model represents
slight improvement in RMSEP, r and SDR. On the other hand,MSEP% and % (error < 30%) were significantly enhanced, due to theignificant improvement in relative prediction error at low firmnessalues (Figs. 3 and 5 and Table 2).
Model validation sets are also depicted in the same figure (again,ias corrections were performed on external validations). The most
mportant point to notice is that all the validations, internal orxternal, improved their statistical parameters, specifically RMSEP,MSEP% and SDR (Figs. 3 and 6 and Table 2). The principle that seg-
A.M. Cavaco et al. / Postharvest Biology a
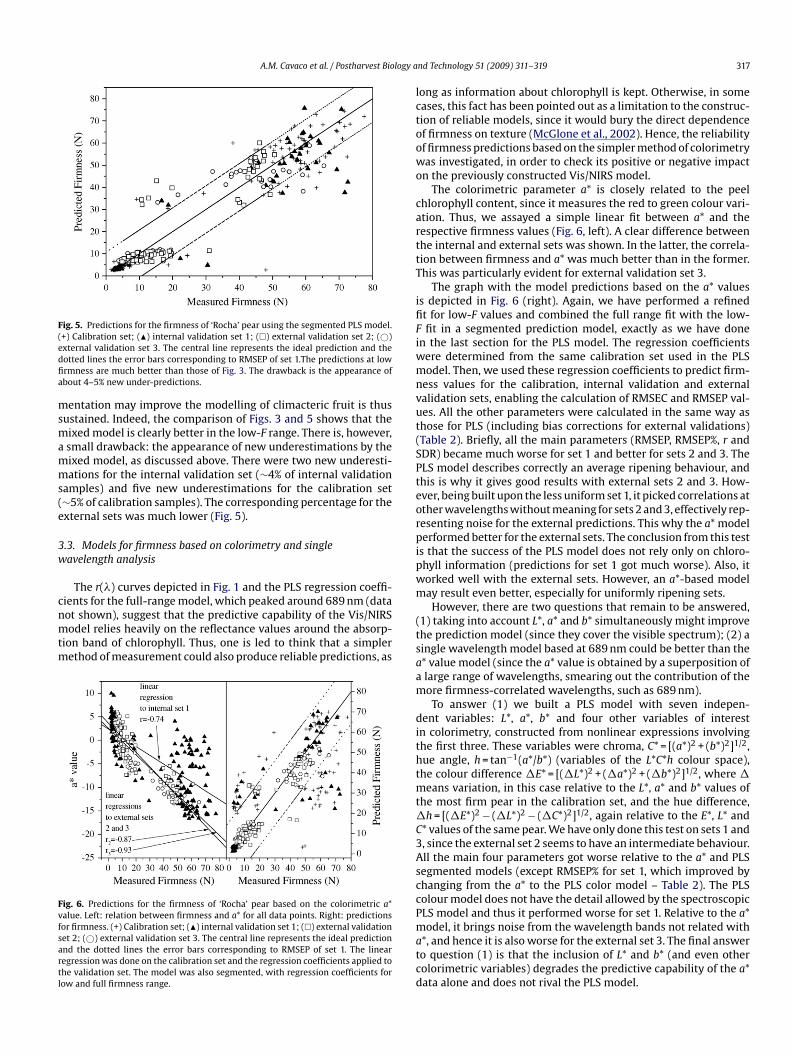
Fig. 5. Predictions for the firmness of ‘Rocha’ pear using the segmented PLS model.(edfia
msmamms(e
3w
cnmtm
Fvfsartl
lctoowo
carttT
ifiFiwmnvut(SPteorpipwm
+) Calibration set; (�) internal validation set 1; (�) external validation set 2; (©)xternal validation set 3. The central line represents the ideal prediction and theotted lines the error bars corresponding to RMSEP of set 1.The predictions at lowrmness are much better than those of Fig. 3. The drawback is the appearance ofbout 4–5% new under-predictions.
entation may improve the modelling of climacteric fruit is thusustained. Indeed, the comparison of Figs. 3 and 5 shows that theixed model is clearly better in the low-F range. There is, however,small drawback: the appearance of new underestimations by theixed model, as discussed above. There were two new underesti-ations for the internal validation set (∼4% of internal validation
amples) and five new underestimations for the calibration set∼5% of calibration samples). The corresponding percentage for thexternal sets was much lower (Fig. 5).
.3. Models for firmness based on colorimetry and singleavelength analysis
The r(�) curves depicted in Fig. 1 and the PLS regression coeffi-
ients for the full-range model, which peaked around 689 nm (dataot shown), suggest that the predictive capability of the Vis/NIRSodel relies heavily on the reflectance values around the absorp-ion band of chlorophyll. Thus, one is led to think that a simplerethod of measurement could also produce reliable predictions, as
ig. 6. Predictions for the firmness of ‘Rocha’ pear based on the colorimetric a*alue. Left: relation between firmness and a* for all data points. Right: predictionsor firmness. (+) Calibration set; (�) internal validation set 1; (�) external validationet 2; (©) external validation set 3. The central line represents the ideal predictionnd the dotted lines the error bars corresponding to RMSEP of set 1. The linearegression was done on the calibration set and the regression coefficients applied tohe validation set. The model was also segmented, with regression coefficients forow and full firmness range.
(tsaam
dithtmt�C3AsccPmatcd
nd Technology 51 (2009) 311–319 317
ong as information about chlorophyll is kept. Otherwise, in someases, this fact has been pointed out as a limitation to the construc-ion of reliable models, since it would bury the direct dependencef firmness on texture (McGlone et al., 2002). Hence, the reliabilityf firmness predictions based on the simpler method of colorimetryas investigated, in order to check its positive or negative impactn the previously constructed Vis/NIRS model.
The colorimetric parameter a* is closely related to the peelhlorophyll content, since it measures the red to green colour vari-tion. Thus, we assayed a simple linear fit between a* and theespective firmness values (Fig. 6, left). A clear difference betweenhe internal and external sets was shown. In the latter, the correla-ion between firmness and a* was much better than in the former.his was particularly evident for external validation set 3.
The graph with the model predictions based on the a* valuess depicted in Fig. 6 (right). Again, we have performed a refinedt for low-F values and combined the full range fit with the low-fit in a segmented prediction model, exactly as we have done
n the last section for the PLS model. The regression coefficientsere determined from the same calibration set used in the PLSodel. Then, we used these regression coefficients to predict firm-
ess values for the calibration, internal validation and externalalidation sets, enabling the calculation of RMSEC and RMSEP val-es. All the other parameters were calculated in the same way ashose for PLS (including bias corrections for external validations)Table 2). Briefly, all the main parameters (RMSEP, RMSEP%, r andDR) became much worse for set 1 and better for sets 2 and 3. TheLS model describes correctly an average ripening behaviour, andhis is why it gives good results with external sets 2 and 3. How-ver, being built upon the less uniform set 1, it picked correlations atther wavelengths without meaning for sets 2 and 3, effectively rep-esenting noise for the external predictions. This why the a* modelerformed better for the external sets. The conclusion from this test
s that the success of the PLS model does not rely only on chloro-hyll information (predictions for set 1 got much worse). Also, itorked well with the external sets. However, an a*-based modelay result even better, especially for uniformly ripening sets.However, there are two questions that remain to be answered,
1) taking into account L*, a* and b* simultaneously might improvehe prediction model (since they cover the visible spectrum); (2) aingle wavelength model based at 689 nm could be better than the* value model (since the a* value is obtained by a superposition oflarge range of wavelengths, smearing out the contribution of theore firmness-correlated wavelengths, such as 689 nm).To answer (1) we built a PLS model with seven indepen-
ent variables: L*, a*, b* and four other variables of interestn colorimetry, constructed from nonlinear expressions involvinghe first three. These variables were chroma, C* = [(a*)2 + (b*)2]1/2,ue angle, h = tan−1(a*/b*) (variables of the L*C*h colour space),he colour difference �E* = [(�L*)2 + (�a*)2 + (�b*)2]1/2, where �
eans variation, in this case relative to the L*, a* and b* values ofhe most firm pear in the calibration set, and the hue difference,
h = [(�E*)2 − (�L*)2 − (�C*)2]1/2, again relative to the E*, L* and* values of the same pear. We have only done this test on sets 1 and, since the external set 2 seems to have an intermediate behaviour.ll the main four parameters got worse relative to the a* and PLSegmented models (except RMSEP% for set 1, which improved byhanging from the a* to the PLS color model – Table 2). The PLSolour model does not have the detail allowed by the spectroscopicLS model and thus it performed worse for set 1. Relative to the a*
odel, it brings noise from the wavelength bands not related with*, and hence it is also worse for the external set 3. The final answero question (1) is that the inclusion of L* and b* (and even otherolorimetric variables) degrades the predictive capability of the a*ata alone and does not rival the PLS model.
318 A.M. Cavaco et al. / Postharvest Biology and Technology 51 (2009) 311–319
Table 3Main correlations between DM (%) (peel, pulp and fruit), firmness (F) and the colorimetric parameters described in the text (L*, a*, b*, C*,�E*, h) of orchard I ‘Rocha’ pear.
Type of correlation Attribute 1 (X) Attribute 2 (Y) r r2
Strong DM pulp DM fruit 0.97 0.93
Moderate F �E* −0.78 0.60F Hue −0.74 0.54F a* −0.74 0.54DM peel DM fruit 0.71 0.50
W
M tric p
spibftvasm
afiarm
bpwPnfid
tsesV
Fs
tt
A
aMF
R
A
C
C
C
D
F
F
eak FDM peel
eaningless All other combinations (except between colorime
Finally, to answer question (2) we performed the linear regres-ion of the reflectance values at 689 nm [R(689)] vs. firmness forredictions based on that regression (again just for calibration,
nternal validation set 1 and external validation set 3). The modelased on R(689) performed worse than the a* model for all mainour parameters except RMSEP% for set 1. The conclusion is thathe single wavelength model is less immune to the effect of naturalariability on model performance. In this case a wavelength aver-ge over a meaningful band, as it is the case with a*, gives a moretable model. Again, the a* model is better than a single wavelengthodel.Table 3 shows auxiliary data to characterize the data set 1, which
re the main correlations between dry matter (peel, pulp and fruit),rmness and the colorimetric parameters. It is shown that �Emax
nd hue also correlated well with firmness, while L* had a weak cor-elation with it. On the other hand, the dry matter did not correlateeaningfully with any of the colorimetric parameters.A last test was done in order to understand better the difference
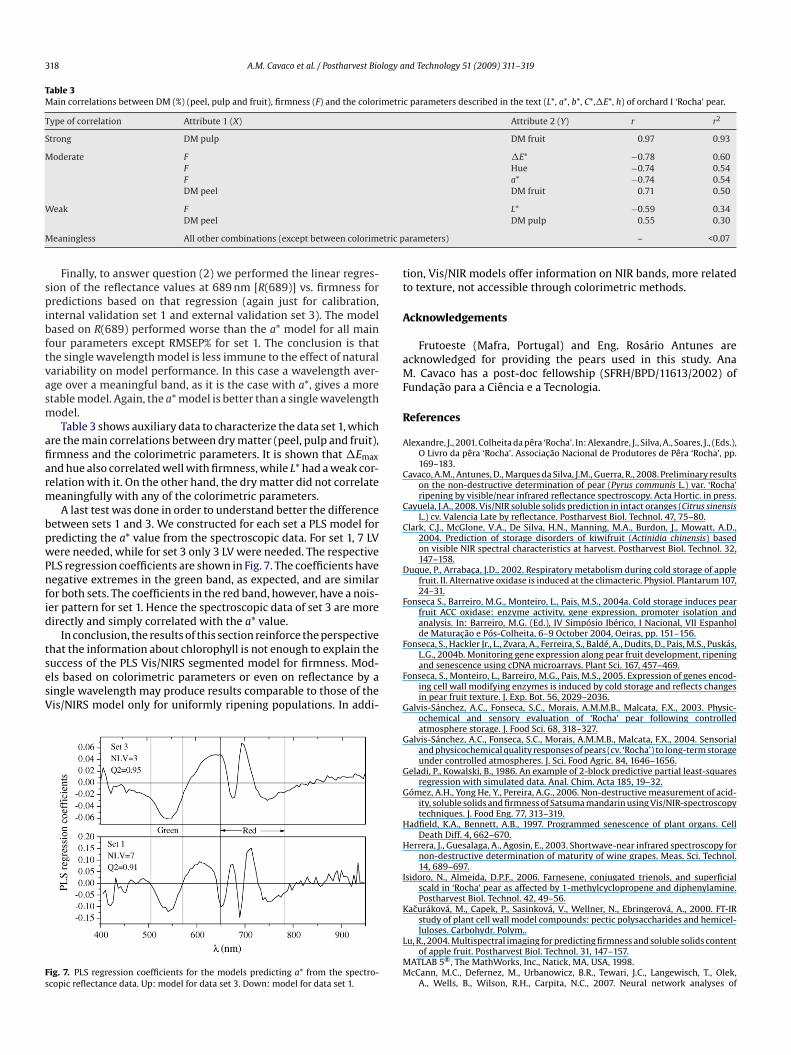
etween sets 1 and 3. We constructed for each set a PLS model forredicting the a* value from the spectroscopic data. For set 1, 7 LVere needed, while for set 3 only 3 LV were needed. The respective
LS regression coefficients are shown in Fig. 7. The coefficients haveegative extremes in the green band, as expected, and are similar
or both sets. The coefficients in the red band, however, have a nois-er pattern for set 1. Hence the spectroscopic data of set 3 are moreirectly and simply correlated with the a* value.
In conclusion, the results of this section reinforce the perspective
hat the information about chlorophyll is not enough to explain theuccess of the PLS Vis/NIRS segmented model for firmness. Mod-ls based on colorimetric parameters or even on reflectance by aingle wavelength may produce results comparable to those of theis/NIRS model only for uniformly ripening populations. In addi-ig. 7. PLS regression coefficients for the models predicting a* from the spectro-copic reflectance data. Up: model for data set 3. Down: model for data set 1.
F
G
G
G
G
H
H
I
K
L
MM
L* −0.59 0.34DM pulp 0.55 0.30
arameters) – <0.07
ion, Vis/NIR models offer information on NIR bands, more relatedo texture, not accessible through colorimetric methods.
cknowledgements
Frutoeste (Mafra, Portugal) and Eng. Rosário Antunes arecknowledged for providing the pears used in this study. Ana. Cavaco has a post-doc fellowship (SFRH/BPD/11613/2002) of
undacão para a Ciência e a Tecnologia.
eferences
lexandre, J., 2001. Colheita da pêra ‘Rocha’. In: Alexandre, J., Silva, A., Soares, J., (Eds.),O Livro da pêra ‘Rocha’. Associacão Nacional de Produtores de Pêra ‘Rocha’, pp.169–183.
avaco, A.M., Antunes, D., Marques da Silva, J.M., Guerra, R., 2008. Preliminary resultson the non-destructive determination of pear (Pyrus communis L.) var. ‘Rocha’ripening by visible/near infrared reflectance spectroscopy. Acta Hortic. in press.
ayuela, J.A., 2008. Vis/NIR soluble solids prediction in intact oranges (Citrus sinensisL.) cv. Valencia Late by reflectance. Postharvest Biol. Technol. 47, 75–80.
lark, C.J., McGlone, V.A., De Silva, H.N., Manning, M.A., Burdon, J., Mowatt, A.D.,2004. Prediction of storage disorders of kiwifruit (Actinidia chinensis) basedon visible NIR spectral characteristics at harvest. Postharvest Biol. Technol. 32,147–158.
uque, P., Arrabaca, J.D., 2002. Respiratory metabolism during cold storage of applefruit. II. Alternative oxidase is induced at the climacteric. Physiol. Plantarum 107,24–31.
onseca S., Barreiro, M.G., Monteiro, L., Pais, M.S., 2004a. Cold storage induces pearfruit ACC oxidase: enzyme activity, gene expression, promoter isolation andanalysis. In: Barreiro, M.G. (Ed.), IV Simpósio Ibérico, I Nacional, VII Espanholde Maturacão e Pós-Colheita, 6–9 October 2004, Oeiras, pp. 151–156.
onseca, S., Hackler Jr., L., Zvara, A., Ferreira, S., Baldé, A., Dudits, D., Pais, M.S., Puskás,L.G., 2004b. Monitoring gene expression along pear fruit development, ripeningand senescence using cDNA microarrays. Plant Sci. 167, 457–469.
onseca, S., Monteiro, L., Barreiro, M.G., Pais, M.S., 2005. Expression of genes encod-ing cell wall modifying enzymes is induced by cold storage and reflects changesin pear fruit texture. J. Exp. Bot. 56, 2029–2036.
alvis-Sánchez, A.C., Fonseca, S.C., Morais, A.M.M.B., Malcata, F.X., 2003. Physic-ochemical and sensory evaluation of ‘Rocha’ pear following controlledatmosphere storage. J. Food Sci. 68, 318–327.
alvis-Sánchez, A.C., Fonseca, S.C., Morais, A.M.M.B., Malcata, F.X., 2004. Sensorialand physicochemical quality responses of pears (cv. ‘Rocha’) to long-term storageunder controlled atmospheres. J. Sci. Food Agric. 84, 1646–1656.
eladi, P., Kowalski, B., 1986. An example of 2-block predictive partial least-squaresregression with simulated data. Anal. Chim. Acta 185, 19–32.
ómez, A.H., Yong He, Y., Pereira, A.G., 2006. Non-destructive measurement of acid-ity, soluble solids and firmness of Satsuma mandarin using Vis/NIR-spectroscopytechniques. J. Food Eng. 77, 313–319.
adfield, K.A., Bennett, A.B., 1997. Programmed senescence of plant organs. CellDeath Diff. 4, 662–670.
errera, J., Guesalaga, A., Agosin, E., 2003. Shortwave-near infrared spectroscopy fornon-destructive determination of maturity of wine grapes. Meas. Sci. Technol.14, 689–697.
sidoro, N., Almeida, D.P.F., 2006. Farnesene, conjugated trienols, and superficialscald in ‘Rocha’ pear as affected by 1-methylcyclopropene and diphenylamine.Postharvest Biol. Technol. 42, 49–56.
acuráková, M., Capek, P., Sasinková, V., Wellner, N., Ebringerová, A., 2000. FT-IRstudy of plant cell wall model compounds: pectic polysaccharides and hemicel-
luloses. Carbohydr. Polym..u, R., 2004. Multispectral imaging for predicting firmness and soluble solids contentof apple fruit. Postharvest Biol. Technol. 31, 147–157.
ATLAB 5®, The MathWorks, Inc., Natick, MA, USA, 1998.cCann, M.C., Defernez, M., Urbanowicz, B.R., Tewari, J.C., Langewisch, T., Olek,
A., Wells, B., Wilson, R.H., Carpita, N.C., 2007. Neural network analyses of

logy a
M
M
M
M
N
N
P
P
Q
S
S
S
T
V
W
W
W
Wrics. Chemom. Intell. Lab. Syst. 58, 109–130.
A.M. Cavaco et al. / Postharvest Bio
infrared spectra for classifying cell wall architectures. Plant Physiol. 143, 1314–1326.
cGlone, V.A., Abe, H., Kawano, S., 1997. Kiwifruit firmness by near infrared lightscattering. J. Near Infrared Spectrosc. 5, 83–89.
cGlone, V.A., Kawano, S., 1998. Firmness, dry matter and soluble solids assess-ment of postharvest kiwifruit by NIR-spectroscopy. Postharvest Biol. Technol.13, 131–141.
cGlone, V.A., Jordan, R.B., Martinsen, P.J., 2002. Vis/NIR estimation at harvest ofpre- and post-storage quality indices for ‘Royal Gala’ apple. Postharvest Biol.Technol. 25, 135–144.
erzlyak, M.N., Gitelson, A.A., Chivkunova, O.B., Rakitin, V.Y.U., 1999. Non-destructive optical detection of pigment changes during leaf senescence andfruit ripening. Physiol. Plant 106, 135–141.
icolaï, B.M., Beullens, K., Bobelyn, E., Peirs, A., Saeys, W., Theron, K.I., Lammertyn,J., 2007. Nondestructive measurement of fruit and vegetable quality by meansof NIR spectroscopy: a review. Postharvest Biol. Technol. 46, 99–118.
icolaï, B.M., Verlinden, B.E., Desmet, M., Saevels, S., Theron, K., Cubeddu, R., Pifferi,A., Torricelli, A., 2008. Time-resolved and continuous wave NIR reflectance spec-troscopy to predict firmness and soluble solids content of ‘Conference’ pears.Postharvest Biol. Technol. 47, 68–74.
eirs, A., Scheerlink, N., Touchant, K., Nicolaï, B.M., 2002. Comparison of Fouriertransform and dispersive near-infrared reflectance spectroscopy for apple qual-ity measurements. Biosyst. Eng. 81, 305–311.
eirs, A., Schenk, A., Nicolaï, B.M., 2005. Effect of natural variability among apples onthe accuracy of VIS-NIR calibration models for optimal harvest date predictions.Postharvest Biol. Technol. 35, 1–13.
ing, Z.S., Ji, B.P., Zude, M., 2008. Non-destructive analysis of apple quality param-eters by means of laser-induced light backscattering imaging. Postharvest Biol.Technol. 48, 215–222.
ánchez, A.C.G., Morais, A.M.M.B., 2001. Effects of controlled atmosphere (CA) stor-age on pectinmethylesterase (PME) activity and texture of ‘Rocha’ pears. J. Sci.Food Agric. 82, 143–145.
Z
Z
nd Technology 51 (2009) 311–319 319
hao, Y., Hea, Y., Gómez, A.H., Pereira, A.G., Qiua, Z., 2007. Visible/near infraredspectrometric technique for nondestructive assessment of tomato ‘Heat-wave’ (Lycopersicon esculentum) quality characteristics. J. Food Eng. 81, 672–678.
laughter, D.C., 1995. Non-destructive determination of internal quality in peachesand nectarines. Trans. ASAE 38, 617–623.
ian, H.Q., Ying, Y.B., Lu, H.S., Xu, H.R., Xie, L.J., Fu, X.P., Yu, H.Y., 2007. Study onpredicting firmness of watermelon by Vis/NIR diffuse transmittance technique.Spectrosc. Spectral Anal. 27, 1113–1117.
alle-Guadarrama, S., Saucedo-Veloz, C., Pena-Valdivia, C.B., Corrales-Garcia, J.J.E., Chavez-Franco, S.H., 2004. Aerobic-anaerobic metabolictransition in ‘Hass’ avocado fruits. Food Sci. Technol. Intern. 10, 391–398.
ang, C.Y., Mellenthin, W.M., 1975. Effect of short-term high CO2 [carbon diox-ide] treatment on storage of ‘d’Anjou’ pear. Plant Physiol. Biochem. 100, 492–495.
illiams, P.C., Norris, K.H., 1987. Qualitative applications of near-infrared reflectancespectroscopy. In: Williams, P.C., Norris, K.H. (Eds.), Near-Infrared Technology inthe Agricultural and Food Industries. American Association of Cereal Chemistry,St. Paul, MN, pp. 241–246.
ilson, R.H., Smith, A.C., Kacuráková, M., Saunders, P.K., Wellner, N., Waldron, K.W.,2000. The mechanical properties and molecular dynamics of plant cell wallpolysaccharides studied by Fourier-Transform Infrared Spectroscopy. Plant Phys-iol. 124, 397–405.
old, S., Sjöström, M., Eriksson, L., 2001. PLS-regression: a basic tool of chemomet-
ude-Sasse, M., Herold, B., Geyer, M., 2000. Comparative study on maturity predic-tion in ‘Elstar’ and ‘Jonagold’. Gartenbauwissenshaft 65, 260–265.
ude, M., Herold, B., Roger, J.M., Bellon-Maurel, V., Landahl, S., 2006. Non-destructivetests on the prediction of apple fruit flesh firmness and soluble solids contenton tree and in shelf life. J. Food Eng. 77, 254–260.