beam steering with segmented annular arrays
TRANSCRIPT
1944 ieee transactions on ultrasonics, ferroelectrics, and frequency control, vol. 53, no. 10, october 2006
Correspondence
Beam Steering with Segmented Annular Arrays
Luis G. Ullate, Gregorio Godoy, Oscar Martınez, andTeresa Sanchez
Abstract—Two-dimensional (2-D) arrays of squared ma-trix have maximum periodicity in their main directions;consequently, they require half wavelength (��2), interele-ment spacing to avoid grating lobes. This condition givesrise to well-known problems derived from the huge numberof array elements and from their small size. In contrast, 2-Darrays with curvilinear configuration produce lower gratinglobes and, therefore, allow the element size to be increasedbeyond ��2. Using larger elements, these arrays have theadvantage of reducing the number of elements and of in-creasing the signal-to-noise ratio (SNR).
In this paper, the beamforming properties of segmentedannular phased arrays are theoretically analyzed and com-pared with the equivalent squared matrix array. In the firstpart, point-like elements are considered in order to facilitatethe field analysis with respect to the array structure. Af-terward, the effect of the element size on the steered beamproperties also is presented.
In the examples, it is shown that the segmented annulararray has notably lower grating lobes than the equivalentsquared matrix array and that it is possible to design seg-mented annular arrays with interelement distance higherthan � whose beam characteristics are perfectly valid forvolumetric imaging applications.
I. Introduction
Two-dimensional (2-D) arrays are useful for ul-trasonic volumetric imaging because they produce
steered and focused beams throughout a volume of inter-est. Typical 2-D arrays are based on a squared matrix (SM)configuration in which the array elements are the cells ofthe matrix. Due to the aperture periodicity, phased arraysrequire λ/2 spacing between elements in order to avoid un-wanted grating lobes [1]. This condition gives rise to severeproblems derived from the huge number of array elements,which becomes excessive in relation to the number of chan-nels managed by current imaging systems, and from theirsmall size, which causes a reduction in the signal-to-noiseratio (SNR).
Several techniques have been proposed in the literatureto reduce the number of active array elements in SM ar-
Manuscript received September 20, 2005; accepted May 10, 2006.This paper received the support of the Education and ScienceMinistry of Spain under its DPI2002-01583, DPI2004-06470, andDPI2004-06756 projects.
L. G. Ullate, O. Martınez, and T. Sanchez are with the Institutode Automatica Industrial (CSIC), La Poveda - 28500 Arganda delRey, Madrid, Spain (e-mail: [email protected]).
G. Godoy is with the Departamento de Ingenierıa Electronica, deTelecomunicacion y Automatica, Universidad de Jaen, Linares, Jaen,Spain.
Digital Object Identifier 10.1109/TUFFC.2006.127
rays. One approach destroys the array periodicity by ran-domly removing a subset of elements from the full aper-ture [1]–[4]. Several methods for optimizing aperiodic lay-outs also have been proposed [5]–[7]. An alternative ap-proach uses different arrangements of sparse periodic lay-outs for transmit and receive modes in which the gratinglobes of the transmit array are suppressed by zeroes of thereceive array response and vice versa. In this group canbe included the cross-like configuration [8] and Vernier ar-rays [9], [10], which configure the transmission and recep-tion apertures based on the Vernier scale. The concept ofVernier arrays was further extended to new 2-D layouts byexploiting either an increased number of symmetry axes orradial symmetry [11].
A constant of all these methods is that they maintainthe λ/2 interelement spacing; thus, although they can pro-duce beams of good properties, important problems relat-ing to the SNR still remain, owing to the small size of theelements and the drastic reduction in the array active area.
As an alternative to these limitations, array aper-tures with curvilinear deployment have been proposed asthey outperform rectilinear designs [12]–[15]. Due to theirgreater aperture spatial diversity, curvilinear arrays pro-duce lower grating lobes and, therefore, layouts with in-terelement distance beyond λ/2 can be considered. In thissense, curvilinear arrays have the advantage of reducingthe number of elements and, in addition, of enlarging theelement size, thereby increasing the SNR associated withthe element impedance and the array active area.
Our interest in this paper is to analyze theoretically thecapability of segmented annular (SA) phased arrays for 3-D beamforming. A segmented annular array is a curvilin-ear array composed of a set of concentric rings of similarwidth that are divided into sectors. Although it is possi-ble to configure this aperture in several ways, we consideronly the case of elements with a similar area and uni-tary aspect ratio (Fig. 1), because, with these conditions,the beam properties are nearly optimized [14]. Computingmethods for SA arrays based on the well-known spatialimpulse response approach [16] are presented in [17], [18].A theoretical description of the beam radiated by a sin-gle segmented annulus can be found in [19], [20]. Severalsimulations showing advantages of SA arrays in relationto SM arrays also have been presented, but the analysis islimited to particular cases, such as continuous wave [21] orunsteering [22]. Different layouts of SA arrays have beenproposed for medical [23]–[25] and non-destructive testing[26], [27] applications.
In this work, the beamforming properties for equivalentSA and SM arrays are compared (two equivalent arrayshave similar shape, size, active area, number of elements,and aspect ratio). In a first step, the analysis is made onthe basis of the array factor (AF) function [28], which can
0885–3010/$20.00 c© 2006 IEEE
ullate et al.: beam steering with segmented annular arrays 1945
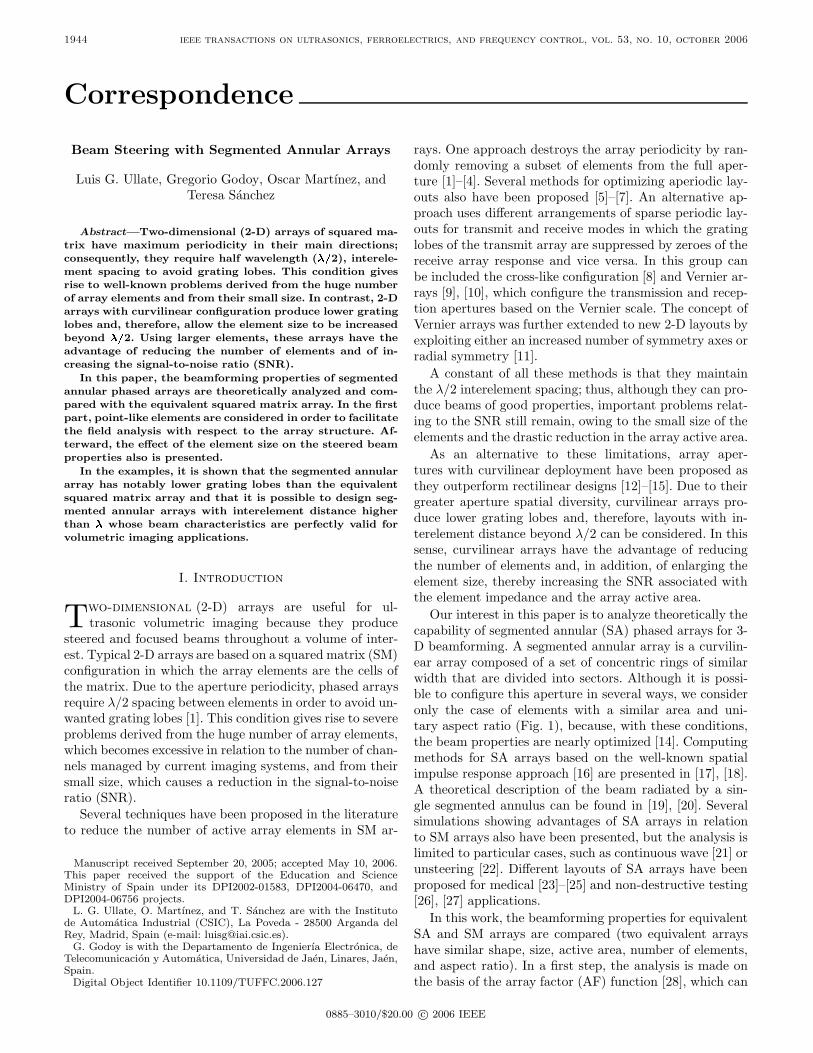
Fig. 1. Geometry of the equivalent arrays SA1 (left) and SM1 (right)with D = 30 mm, d = w = 0.6 mm, and N = 1950 elements ofunitary aspect ratio with e = 0.48 mm of size.
be obtained by replacing the actual elements with pointsources vibrating in continuous wave (CW); this functionfacilitates the analysis of the beam properties in relationto the array structure. In a second step, the analysis is ex-tended to wide-band excitation conditions. Steered-beamproperties also are studied considering the real size of ele-ments for both array configurations. Only the cases of fullaperture and no apodization are considered in this work.
Fig. 1 shows the geometry of the two equivalent arrayson which the comparative analysis is based: a squared ma-trix array (SM1) and a segmented annular array (SA1)both of circular area with diameter D = 30 mm, contain-ing N = 1950 elements of unitary aspect ratio. For botharrays, the interelement spacing is d = w = 0.6 mm andthe element size is e = 0.8 d. Simulations are made con-sidering that the arrays emit waves at 3 MHz into water,giving a wavelength of λ ≈ 0.5 mm, and the array dimen-sions become D = 60 λ and d = w ≈ 1.2 λ and e ≈ 0.96 λ.The analysis in wide band considers an ultrasonic pulsewith a Gaussian envelope of 3 MHz central frequency andB = 70% relative bandwidth at −6 dB cut-off.
II. Computational Method
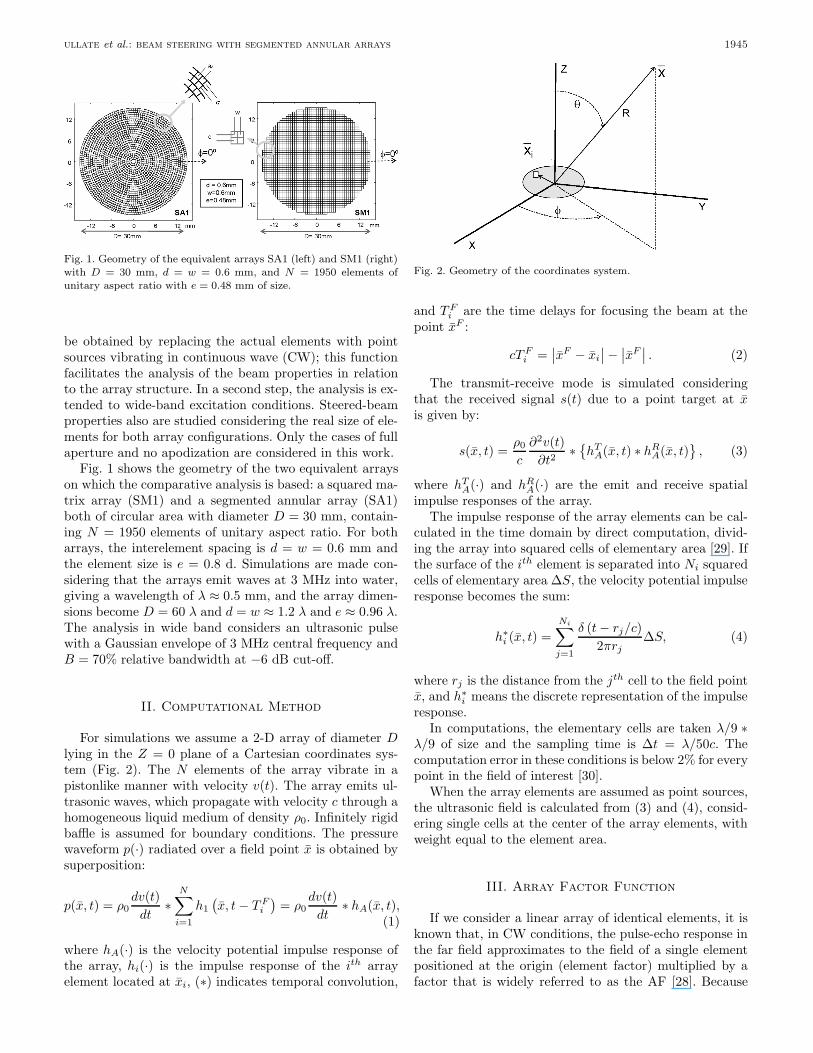
For simulations we assume a 2-D array of diameter Dlying in the Z = 0 plane of a Cartesian coordinates sys-tem (Fig. 2). The N elements of the array vibrate in apistonlike manner with velocity v(t). The array emits ul-trasonic waves, which propagate with velocity c through ahomogeneous liquid medium of density ρ0. Infinitely rigidbaffle is assumed for boundary conditions. The pressurewaveform p(·) radiated over a field point x is obtained bysuperposition:
p(x, t) = ρ0dv(t)dt
∗N∑
i=1
h1(x, t − T F
i
)= ρ0
dv(t)dt
∗ hA(x, t),(1)
where hA(·) is the velocity potential impulse response ofthe array, hi(·) is the impulse response of the ith arrayelement located at xi, (∗) indicates temporal convolution,
Fig. 2. Geometry of the coordinates system.
and T Fi are the time delays for focusing the beam at the
point xF :
cT Fi =
∣∣xF − xi
∣∣ −∣∣xF
∣∣ . (2)
The transmit-receive mode is simulated consideringthat the received signal s(t) due to a point target at xis given by:
s(x, t) =ρ0
c
∂2v(t)∂t2
∗{hT
A(x, t) ∗ hRA(x, t)
}, (3)
where hTA(·) and hR
A(·) are the emit and receive spatialimpulse responses of the array.
The impulse response of the array elements can be cal-culated in the time domain by direct computation, divid-ing the array into squared cells of elementary area [29]. Ifthe surface of the ith element is separated into Ni squaredcells of elementary area ∆S, the velocity potential impulseresponse becomes the sum:
h∗i (x, t) =
Ni∑j=1
δ (t − rj/c)2πrj
∆S, (4)
where rj is the distance from the jth cell to the field pointx, and h∗
i means the discrete representation of the impulseresponse.
In computations, the elementary cells are taken λ/9 ∗λ/9 of size and the sampling time is ∆t = λ/50c. Thecomputation error in these conditions is below 2% for everypoint in the field of interest [30].
When the array elements are assumed as point sources,the ultrasonic field is calculated from (3) and (4), consid-ering single cells at the center of the array elements, withweight equal to the element area.
III. Array Factor Function
If we consider a linear array of identical elements, it isknown that, in CW conditions, the pulse-echo response inthe far field approximates to the field of a single elementpositioned at the origin (element factor) multiplied by afactor that is widely referred to as the AF [28]. Because
1946 ieee transactions on ultrasonics, ferroelectrics, and frequency control, vol. 53, no. 10, october 2006
the AF does not depend on the directional characteristicsof the radiating elements themselves, it can be simulatedby replacing the actual elements with isotropic point-likesources. Each array has its own AF, which is a functionof the geometrical layout, the steering angle and the pulsewavelength.
The pulse-echo analysis of 2-D arrays can be simpli-fied by applying the projection-slice theorem [12], [31] andthe effective aperture concept [9], [10]. The projection-slicemethod considers that the CW response of a 2-D array ata given azimuth direction φ can be found by projectingthe 2-D element distribution on a line oriented at the φdirection (both 1-D and 2-D arrays are equivalent). How-ever, the effective aperture of a linear array is the one-wayaperture that has the same response as the pulse-echo re-sponse. In CW conditions, the effective aperture can beobtained from the spatial convolution of transmission andreception apertures. In this way, for every azimuth an-gle, the aperture of a 2-D array can be simplified to theaperture of a linear array, which is the convolution of theequivalent transmit and receive linear arrays at that direc-tion. The elements’ distribution on the effective apertureof the equivalent linear array is a determinant factor forthe ultrasonic field in the side lobe region.
In the SM array case, the elements overlap for the maindirections (φ = 0◦ and 90◦), resulting in a periodic equiv-alent linear array with NL = D/d weighted elements, allseparated by a distance of d. The grating lobes in this caseshow peaks of amplitude similar to that of the main beam,whose angular position θG is [1]:
θG ≈ − arcsin(λ/d − sin θF
), (5)
where θF is the beam steering angle. For φ = 45◦ and 135◦,the equivalent linear array also is periodic, but in this casethe interelement distance is reduced to 0.7 d.
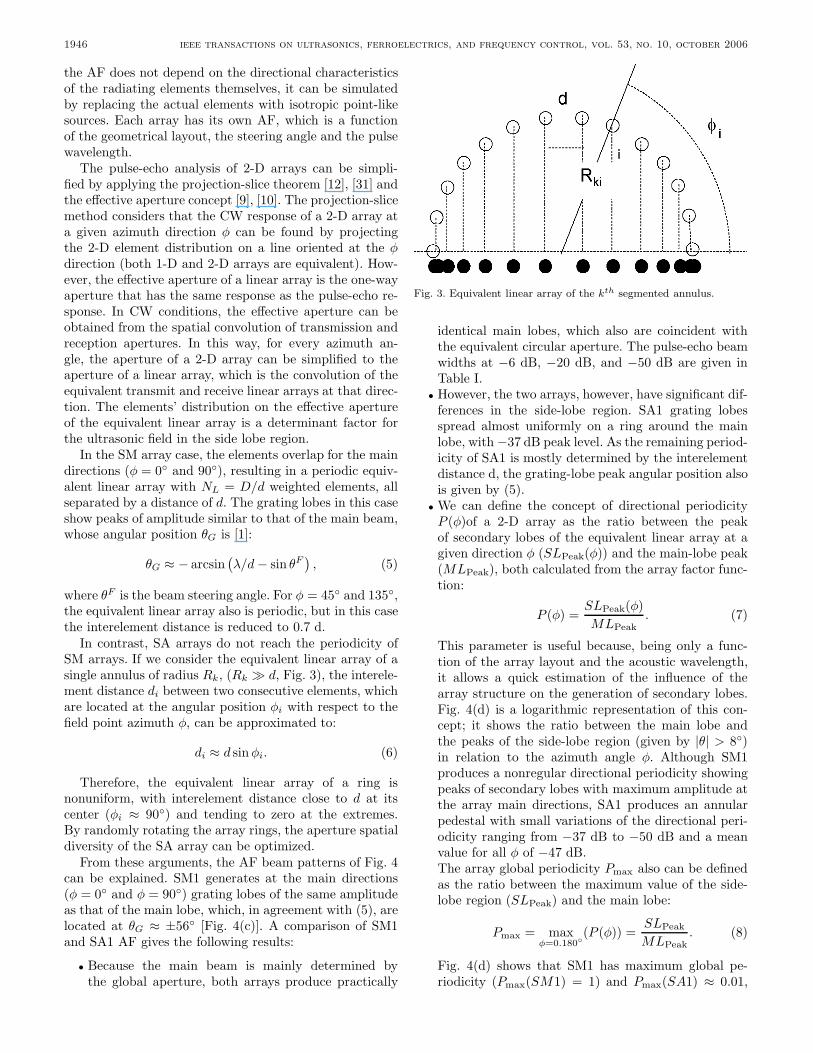
In contrast, SA arrays do not reach the periodicity ofSM arrays. If we consider the equivalent linear array of asingle annulus of radius Rk, (Rk � d, Fig. 3), the interele-ment distance di between two consecutive elements, whichare located at the angular position φi with respect to thefield point azimuth φ, can be approximated to:
di ≈ d sinφi. (6)
Therefore, the equivalent linear array of a ring isnonuniform, with interelement distance close to d at itscenter (φi ≈ 90◦) and tending to zero at the extremes.By randomly rotating the array rings, the aperture spatialdiversity of the SA array can be optimized.
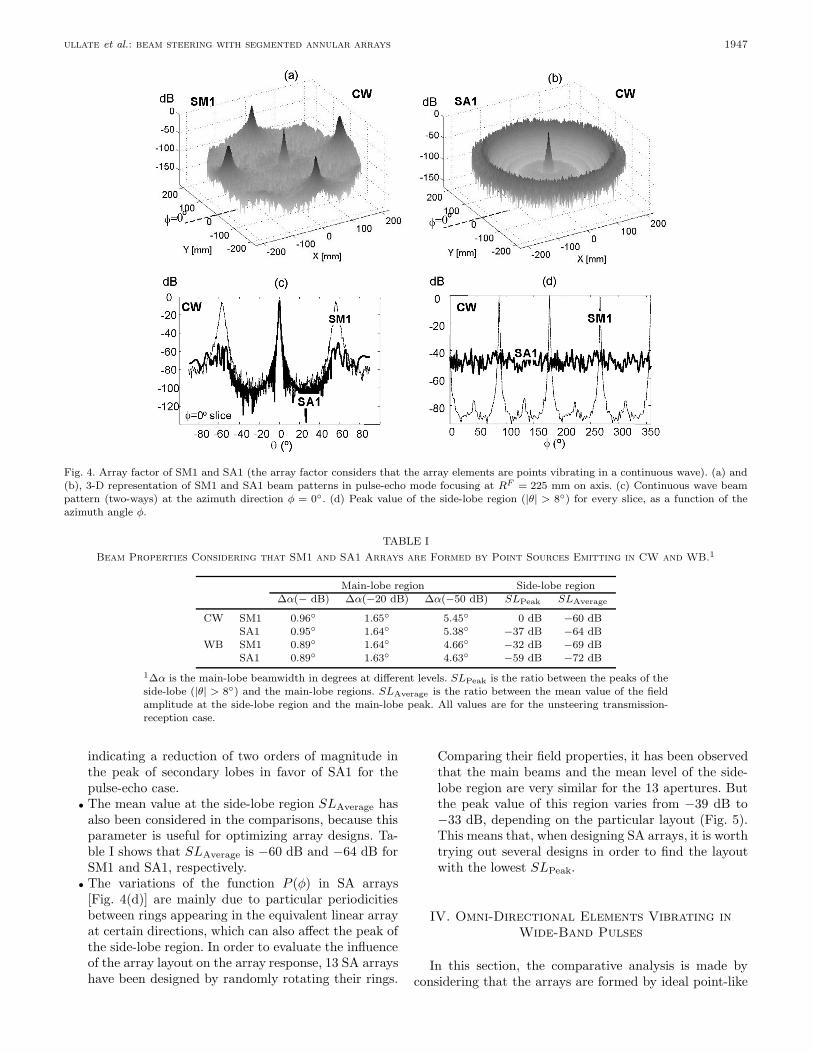
From these arguments, the AF beam patterns of Fig. 4can be explained. SM1 generates at the main directions(φ = 0◦ and φ = 90◦) grating lobes of the same amplitudeas that of the main lobe, which, in agreement with (5), arelocated at θG ≈ ±56◦ [Fig. 4(c)]. A comparison of SM1and SA1 AF gives the following results:
• Because the main beam is mainly determined bythe global aperture, both arrays produce practically
Fig. 3. Equivalent linear array of the kth segmented annulus.
identical main lobes, which also are coincident withthe equivalent circular aperture. The pulse-echo beamwidths at −6 dB, −20 dB, and −50 dB are given inTable I.
• However, the two arrays, however, have significant dif-ferences in the side-lobe region. SA1 grating lobesspread almost uniformly on a ring around the mainlobe, with −37 dB peak level. As the remaining period-icity of SA1 is mostly determined by the interelementdistance d, the grating-lobe peak angular position alsois given by (5).
• We can define the concept of directional periodicityP (φ)of a 2-D array as the ratio between the peakof secondary lobes of the equivalent linear array at agiven direction φ (SLPeak(φ)) and the main-lobe peak(MLPeak), both calculated from the array factor func-tion:
P (φ) =SLPeak(φ)MLPeak
. (7)
This parameter is useful because, being only a func-tion of the array layout and the acoustic wavelength,it allows a quick estimation of the influence of thearray structure on the generation of secondary lobes.Fig. 4(d) is a logarithmic representation of this con-cept; it shows the ratio between the main lobe andthe peaks of the side-lobe region (given by |θ| > 8◦)in relation to the azimuth angle φ. Although SM1produces a nonregular directional periodicity showingpeaks of secondary lobes with maximum amplitude atthe array main directions, SA1 produces an annularpedestal with small variations of the directional peri-odicity ranging from −37 dB to −50 dB and a meanvalue for all φ of −47 dB.The array global periodicity Pmax also can be definedas the ratio between the maximum value of the side-lobe region (SLPeak) and the main lobe:
Pmax = maxφ=0.180◦
(P (φ)) =SLPeak
MLPeak. (8)
Fig. 4(d) shows that SM1 has maximum global pe-riodicity (Pmax(SM1) = 1) and Pmax(SA1) ≈ 0.01,
ullate et al.: beam steering with segmented annular arrays 1947
Fig. 4. Array factor of SM1 and SA1 (the array factor considers that the array elements are points vibrating in a continuous wave). (a) and(b), 3-D representation of SM1 and SA1 beam patterns in pulse-echo mode focusing at RF = 225 mm on axis. (c) Continuous wave beampattern (two-ways) at the azimuth direction φ = 0◦. (d) Peak value of the side-lobe region (|θ| > 8◦) for every slice, as a function of theazimuth angle φ.
TABLE IBeam Properties Considering that SM1 and SA1 Arrays are Formed by Point Sources Emitting in CW and WB.
1
Main-lobe region Side-lobe region∆α(− dB) ∆α(−20 dB) ∆α(−50 dB) SLPeak SLAverage
CW SM1 0.96◦ 1.65◦ 5.45◦ 0 dB −60 dBSA1 0.95◦ 1.64◦ 5.38◦ −37 dB −64 dB
WB SM1 0.89◦ 1.64◦ 4.66◦ −32 dB −69 dBSA1 0.89◦ 1.63◦ 4.63◦ −59 dB −72 dB
1∆α is the main-lobe beamwidth in degrees at different levels. SLPeak is the ratio between the peaks of theside-lobe (|θ| > 8◦) and the main-lobe regions. SLAverage is the ratio between the mean value of the fieldamplitude at the side-lobe region and the main-lobe peak. All values are for the unsteering transmission-reception case.
indicating a reduction of two orders of magnitude inthe peak of secondary lobes in favor of SA1 for thepulse-echo case.
• The mean value at the side-lobe region SLAverage hasalso been considered in the comparisons, because thisparameter is useful for optimizing array designs. Ta-ble I shows that SLAverage is −60 dB and −64 dB forSM1 and SA1, respectively.
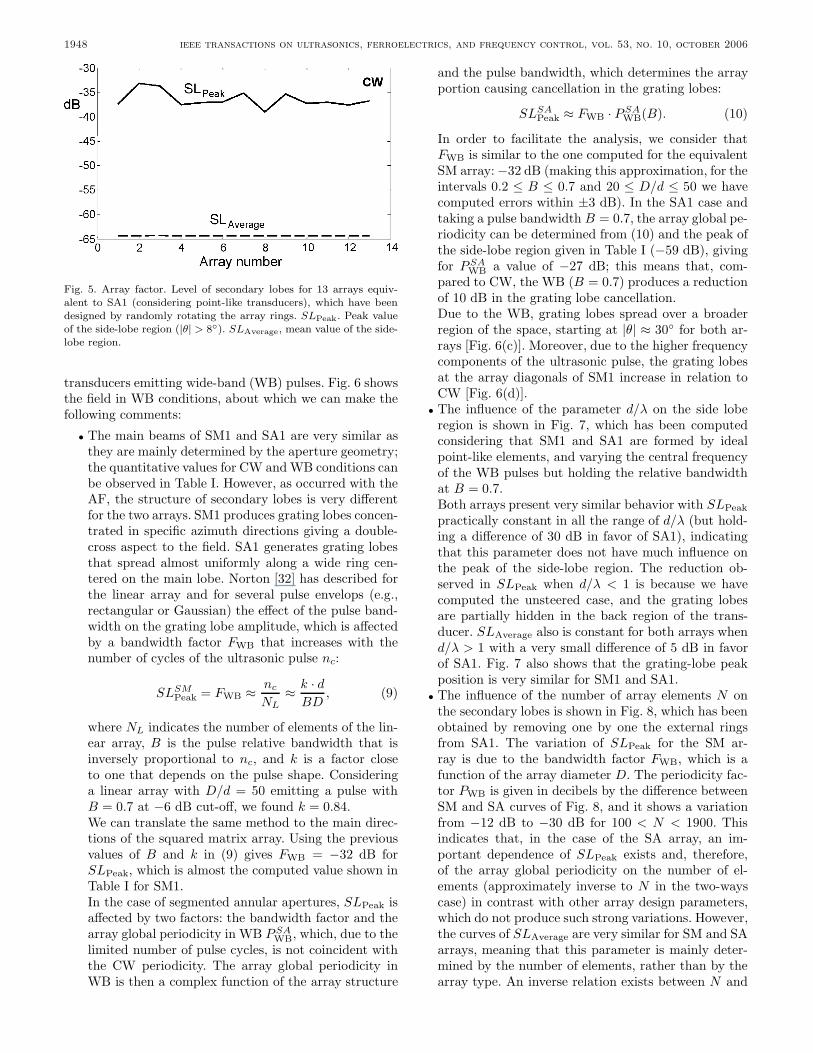
• The variations of the function P (φ) in SA arrays[Fig. 4(d)] are mainly due to particular periodicitiesbetween rings appearing in the equivalent linear arrayat certain directions, which can also affect the peak ofthe side-lobe region. In order to evaluate the influenceof the array layout on the array response, 13 SA arrayshave been designed by randomly rotating their rings.
Comparing their field properties, it has been observedthat the main beams and the mean level of the side-lobe region are very similar for the 13 apertures. Butthe peak value of this region varies from −39 dB to−33 dB, depending on the particular layout (Fig. 5).This means that, when designing SA arrays, it is worthtrying out several designs in order to find the layoutwith the lowest SLPeak.
IV. Omni-Directional Elements Vibrating in
Wide-Band Pulses
In this section, the comparative analysis is made byconsidering that the arrays are formed by ideal point-like
1948 ieee transactions on ultrasonics, ferroelectrics, and frequency control, vol. 53, no. 10, october 2006
Fig. 5. Array factor. Level of secondary lobes for 13 arrays equiv-alent to SA1 (considering point-like transducers), which have beendesigned by randomly rotating the array rings. SLPeak. Peak valueof the side-lobe region (|θ| > 8◦). SLAverage, mean value of the side-lobe region.
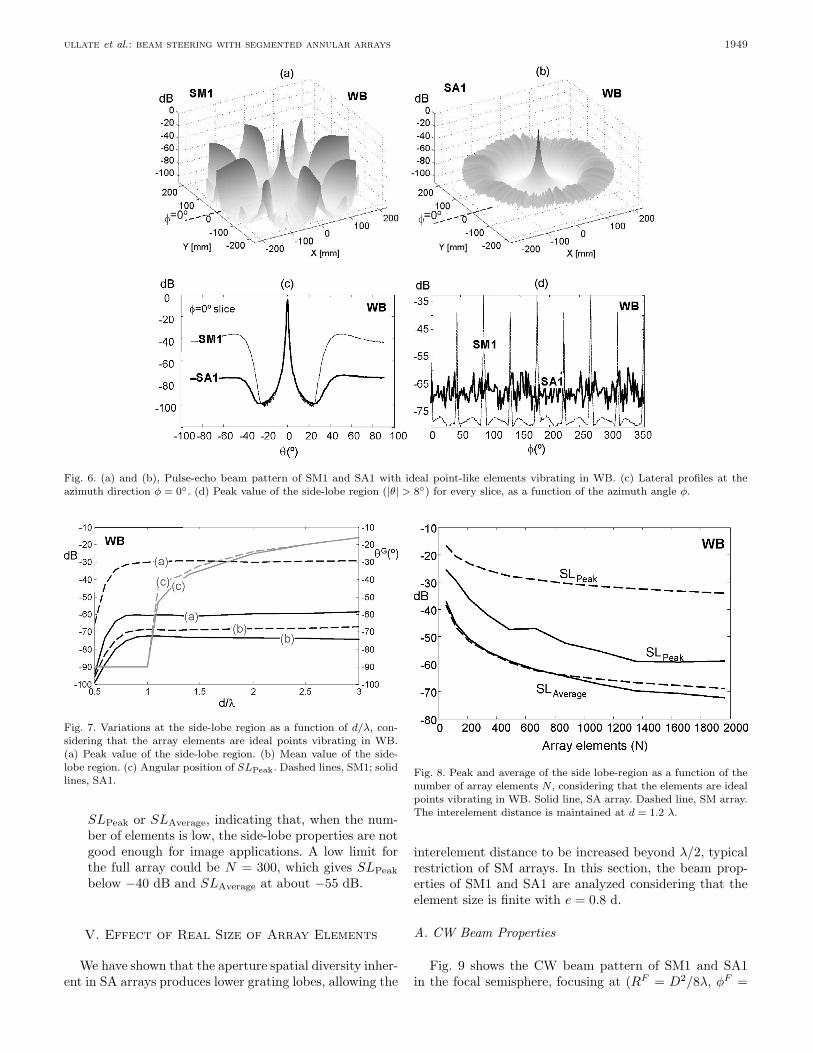
transducers emitting wide-band (WB) pulses. Fig. 6 showsthe field in WB conditions, about which we can make thefollowing comments:
• The main beams of SM1 and SA1 are very similar asthey are mainly determined by the aperture geometry;the quantitative values for CW and WB conditions canbe observed in Table I. However, as occurred with theAF, the structure of secondary lobes is very differentfor the two arrays. SM1 produces grating lobes concen-trated in specific azimuth directions giving a double-cross aspect to the field. SA1 generates grating lobesthat spread almost uniformly along a wide ring cen-tered on the main lobe. Norton [32] has described forthe linear array and for several pulse envelops (e.g.,rectangular or Gaussian) the effect of the pulse band-width on the grating lobe amplitude, which is affectedby a bandwidth factor FWB that increases with thenumber of cycles of the ultrasonic pulse nc:
SLSMPeak = FWB ≈ nc
NL≈ k · d
BD, (9)
where NL indicates the number of elements of the lin-ear array, B is the pulse relative bandwidth that isinversely proportional to nc, and k is a factor closeto one that depends on the pulse shape. Consideringa linear array with D/d = 50 emitting a pulse withB = 0.7 at −6 dB cut-off, we found k = 0.84.We can translate the same method to the main direc-tions of the squared matrix array. Using the previousvalues of B and k in (9) gives FWB = −32 dB forSLPeak, which is almost the computed value shown inTable I for SM1.In the case of segmented annular apertures, SLPeak isaffected by two factors: the bandwidth factor and thearray global periodicity in WB PSA
WB, which, due to thelimited number of pulse cycles, is not coincident withthe CW periodicity. The array global periodicity inWB is then a complex function of the array structure
and the pulse bandwidth, which determines the arrayportion causing cancellation in the grating lobes:
SLSAPeak ≈ FWB · PSA
WB(B). (10)
In order to facilitate the analysis, we consider thatFWB is similar to the one computed for the equivalentSM array: −32 dB (making this approximation, for theintervals 0.2 ≤ B ≤ 0.7 and 20 ≤ D/d ≤ 50 we havecomputed errors within ±3 dB). In the SA1 case andtaking a pulse bandwidth B = 0.7, the array global pe-riodicity can be determined from (10) and the peak ofthe side-lobe region given in Table I (−59 dB), givingfor PSA
WB a value of −27 dB; this means that, com-pared to CW, the WB (B = 0.7) produces a reductionof 10 dB in the grating lobe cancellation.Due to the WB, grating lobes spread over a broaderregion of the space, starting at |θ| ≈ 30◦ for both ar-rays [Fig. 6(c)]. Moreover, due to the higher frequencycomponents of the ultrasonic pulse, the grating lobesat the array diagonals of SM1 increase in relation toCW [Fig. 6(d)].
• The influence of the parameter d/λ on the side loberegion is shown in Fig. 7, which has been computedconsidering that SM1 and SA1 are formed by idealpoint-like elements, and varying the central frequencyof the WB pulses but holding the relative bandwidthat B = 0.7.Both arrays present very similar behavior with SLPeakpractically constant in all the range of d/λ (but hold-ing a difference of 30 dB in favor of SA1), indicatingthat this parameter does not have much influence onthe peak of the side-lobe region. The reduction ob-served in SLPeak when d/λ < 1 is because we havecomputed the unsteered case, and the grating lobesare partially hidden in the back region of the trans-ducer. SLAverage also is constant for both arrays whend/λ > 1 with a very small difference of 5 dB in favorof SA1. Fig. 7 also shows that the grating-lobe peakposition is very similar for SM1 and SA1.
• The influence of the number of array elements N onthe secondary lobes is shown in Fig. 8, which has beenobtained by removing one by one the external ringsfrom SA1. The variation of SLPeak for the SM ar-ray is due to the bandwidth factor FWB, which is afunction of the array diameter D. The periodicity fac-tor PWB is given in decibels by the difference betweenSM and SA curves of Fig. 8, and it shows a variationfrom −12 dB to −30 dB for 100 < N < 1900. Thisindicates that, in the case of the SA array, an im-portant dependence of SLPeak exists and, therefore,of the array global periodicity on the number of el-ements (approximately inverse to N in the two-wayscase) in contrast with other array design parameters,which do not produce such strong variations. However,the curves of SLAverage are very similar for SM and SAarrays, meaning that this parameter is mainly deter-mined by the number of elements, rather than by thearray type. An inverse relation exists between N and
ullate et al.: beam steering with segmented annular arrays 1949
Fig. 6. (a) and (b), Pulse-echo beam pattern of SM1 and SA1 with ideal point-like elements vibrating in WB. (c) Lateral profiles at theazimuth direction φ = 0◦. (d) Peak value of the side-lobe region (|θ| > 8◦) for every slice, as a function of the azimuth angle φ.
Fig. 7. Variations at the side-lobe region as a function of d/λ, con-sidering that the array elements are ideal points vibrating in WB.(a) Peak value of the side-lobe region. (b) Mean value of the side-lobe region. (c) Angular position of SLPeak. Dashed lines, SM1; solidlines, SA1.
SLPeak or SLAverage, indicating that, when the num-ber of elements is low, the side-lobe properties are notgood enough for image applications. A low limit forthe full array could be N = 300, which gives SLPeakbelow −40 dB and SLAverage at about −55 dB.
V. Effect of Real Size of Array Elements
We have shown that the aperture spatial diversity inher-ent in SA arrays produces lower grating lobes, allowing the
Fig. 8. Peak and average of the side lobe-region as a function of thenumber of array elements N , considering that the elements are idealpoints vibrating in WB. Solid line, SA array. Dashed line, SM array.The interelement distance is maintained at d = 1.2 λ.
interelement distance to be increased beyond λ/2, typicalrestriction of SM arrays. In this section, the beam prop-erties of SM1 and SA1 are analyzed considering that theelement size is finite with e = 0.8 d.
A. CW Beam Properties
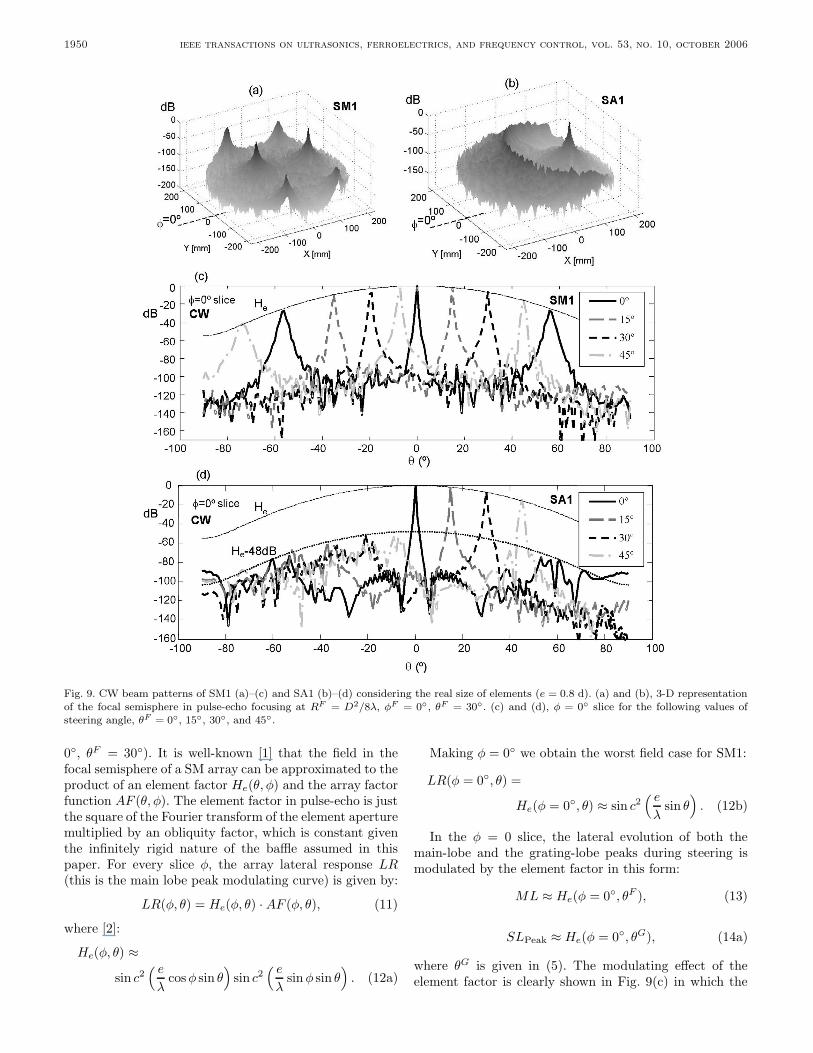
Fig. 9 shows the CW beam pattern of SM1 and SA1in the focal semisphere, focusing at (RF = D2/8λ, φF =
1950 ieee transactions on ultrasonics, ferroelectrics, and frequency control, vol. 53, no. 10, october 2006
Fig. 9. CW beam patterns of SM1 (a)–(c) and SA1 (b)–(d) considering the real size of elements (e = 0.8 d). (a) and (b), 3-D representationof the focal semisphere in pulse-echo focusing at RF = D2/8λ, φF = 0◦, θF = 30◦. (c) and (d), φ = 0◦ slice for the following values ofsteering angle, θF = 0◦, 15◦, 30◦, and 45◦.
0◦, θF = 30◦). It is well-known [1] that the field in thefocal semisphere of a SM array can be approximated to theproduct of an element factor He(θ, φ) and the array factorfunction AF (θ, φ). The element factor in pulse-echo is justthe square of the Fourier transform of the element aperturemultiplied by an obliquity factor, which is constant giventhe infinitely rigid nature of the baffle assumed in thispaper. For every slice φ, the array lateral response LR(this is the main lobe peak modulating curve) is given by:
LR(φ, θ) = He(φ, θ) · AF (φ, θ), (11)
where [2]:
He(φ, θ) ≈
sin c2( e
λcosφ sin θ
)sin c2
( e
λsinφ sin θ
). (12a)
Making φ = 0◦ we obtain the worst field case for SM1:
LR(φ = 0◦, θ) =
He(φ = 0◦, θ) ≈ sin c2( e
λsin θ
). (12b)
In the φ = 0 slice, the lateral evolution of both themain-lobe and the grating-lobe peaks during steering ismodulated by the element factor in this form:
ML ≈ He(φ = 0◦, θF ), (13)
SLPeak ≈ He(φ = 0◦, θG), (14a)
where θG is given in (5). The modulating effect of theelement factor is clearly shown in Fig. 9(c) in which the
ullate et al.: beam steering with segmented annular arrays 1951
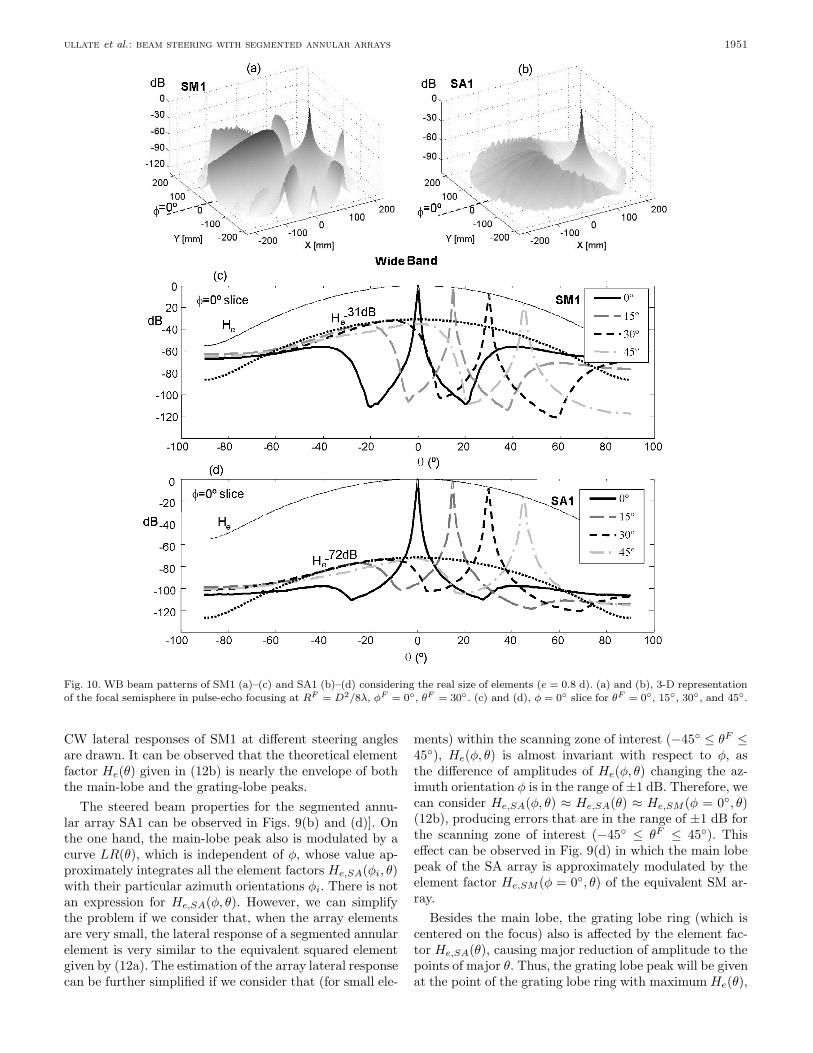
Fig. 10. WB beam patterns of SM1 (a)–(c) and SA1 (b)–(d) considering the real size of elements (e = 0.8 d). (a) and (b), 3-D representationof the focal semisphere in pulse-echo focusing at RF = D2/8λ, φF = 0◦, θF = 30◦. (c) and (d), φ = 0◦ slice for θF = 0◦, 15◦, 30◦, and 45◦.
CW lateral responses of SM1 at different steering anglesare drawn. It can be observed that the theoretical elementfactor He(θ) given in (12b) is nearly the envelope of boththe main-lobe and the grating-lobe peaks.
The steered beam properties for the segmented annu-lar array SA1 can be observed in Figs. 9(b) and (d)]. Onthe one hand, the main-lobe peak also is modulated by acurve LR(θ), which is independent of φ, whose value ap-proximately integrates all the element factors He,SA(φi, θ)with their particular azimuth orientations φi. There is notan expression for He,SA(φ, θ). However, we can simplifythe problem if we consider that, when the array elementsare very small, the lateral response of a segmented annularelement is very similar to the equivalent squared elementgiven by (12a). The estimation of the array lateral responsecan be further simplified if we consider that (for small ele-
ments) within the scanning zone of interest (−45◦ ≤ θF ≤45◦), He(φ, θ) is almost invariant with respect to φ, asthe difference of amplitudes of He(φ, θ) changing the az-imuth orientation φ is in the range of ±1 dB. Therefore, wecan consider He,SA(φ, θ) ≈ He,SA(θ) ≈ He,SM (φ = 0◦, θ)(12b), producing errors that are in the range of ±1 dB forthe scanning zone of interest (−45◦ ≤ θF ≤ 45◦). Thiseffect can be observed in Fig. 9(d) in which the main lobepeak of the SA array is approximately modulated by theelement factor He,SM (φ = 0◦, θ) of the equivalent SM ar-ray.
Besides the main lobe, the grating lobe ring (which iscentered on the focus) also is affected by the element fac-tor He,SA(θ), causing major reduction of amplitude to thepoints of major θ. Thus, the grating lobe peak will be givenat the point of the grating lobe ring with maximum He(θ),
1952 ieee transactions on ultrasonics, ferroelectrics, and frequency control, vol. 53, no. 10, october 2006
which is located in the φ = φF slice at θ ≈ θF − θG. Thisis the section presented in Fig. 9(d) in which it can be ob-served that the grating lobes are modulated by the elementfactor He(θ) of (12b), but in this case with a drop of 48 dBwith respect to the main lobe [this quantity agrees withthe array periodicity at the θ = 0 slice shown in Fig. 4(c)].
Therefore, for segmented annular arrays, the grating-lobe peak during steering can be written in a more gener-alized form than (14a):
SLPeak(φF
)≈ P
(φF
)· He
(θF − θG
).
(14b)
As P (φ) has small variations in relation to the azimuthangle, this function can be replaced by a global periodicityfactor taking either the average of P (φ) or its maximumPmax (8) for the worst φ case.
B. Beam Properties in Wide Band
Fig. 10 shows the WB beam patterns of SM1 and SA1 inthe focal semisphere, focusing at (RF = D2/8λ, φF = 0◦,θF = 30◦). In this case, the lateral evolution of the main-lobe peak during steering is modulated by the element fac-tor He(θ), and the grating-lobe peak evolution is affectedby three factors: the element factor He, the WB factor,and the array periodicity in the WB PWB:
SLPeak(φF
)≈ FWB · He
(θF − θG
)· PWB
(φF
).(14c)
For SM1, the grating-lobe peak is produced in the maindirections where PWB = 1. The vertical distance betweenboth He envelope curves of Fig. 10(c) is −31.5 dB, whichis in agreement with the value of FWB given in Table I. ForSA1, the vertical distance between the envelope curves ofFig. 10(d) is −72 dB, which is in accordance with SLPeakat the φ = 0◦ slice shown in Fig. 6(c).
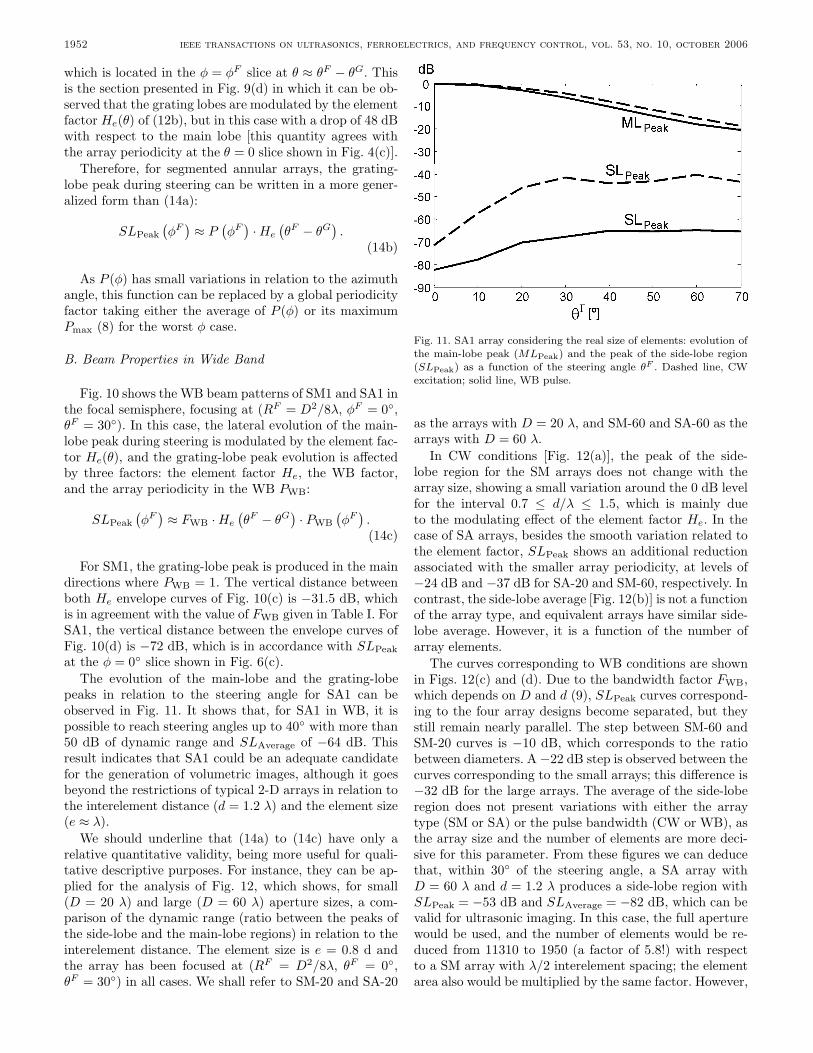
The evolution of the main-lobe and the grating-lobepeaks in relation to the steering angle for SA1 can beobserved in Fig. 11. It shows that, for SA1 in WB, it ispossible to reach steering angles up to 40◦ with more than50 dB of dynamic range and SLAverage of −64 dB. Thisresult indicates that SA1 could be an adequate candidatefor the generation of volumetric images, although it goesbeyond the restrictions of typical 2-D arrays in relation tothe interelement distance (d = 1.2 λ) and the element size(e ≈ λ).
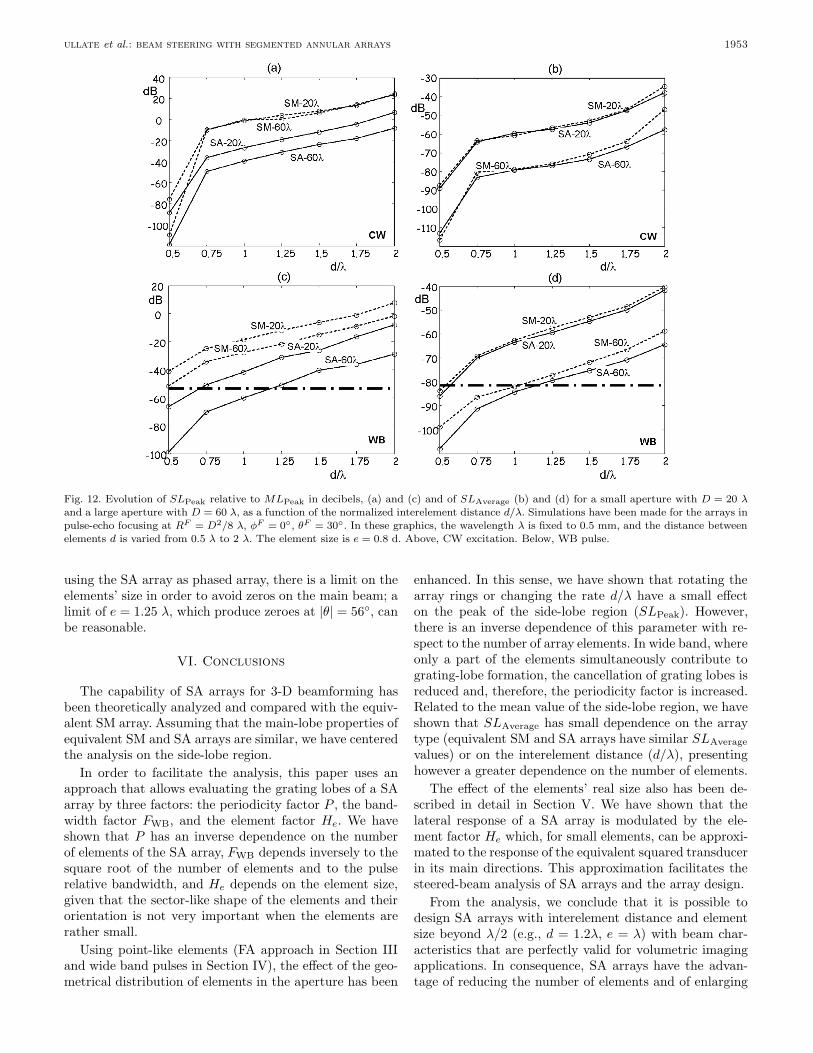
We should underline that (14a) to (14c) have only arelative quantitative validity, being more useful for quali-tative descriptive purposes. For instance, they can be ap-plied for the analysis of Fig. 12, which shows, for small(D = 20 λ) and large (D = 60 λ) aperture sizes, a com-parison of the dynamic range (ratio between the peaks ofthe side-lobe and the main-lobe regions) in relation to theinterelement distance. The element size is e = 0.8 d andthe array has been focused at (RF = D2/8λ, θF = 0◦,θF = 30◦) in all cases. We shall refer to SM-20 and SA-20
Fig. 11. SA1 array considering the real size of elements: evolution ofthe main-lobe peak (MLPeak) and the peak of the side-lobe region(SLPeak) as a function of the steering angle θF . Dashed line, CWexcitation; solid line, WB pulse.
as the arrays with D = 20 λ, and SM-60 and SA-60 as thearrays with D = 60 λ.
In CW conditions [Fig. 12(a)], the peak of the side-lobe region for the SM arrays does not change with thearray size, showing a small variation around the 0 dB levelfor the interval 0.7 ≤ d/λ ≤ 1.5, which is mainly dueto the modulating effect of the element factor He. In thecase of SA arrays, besides the smooth variation related tothe element factor, SLPeak shows an additional reductionassociated with the smaller array periodicity, at levels of−24 dB and −37 dB for SA-20 and SM-60, respectively. Incontrast, the side-lobe average [Fig. 12(b)] is not a functionof the array type, and equivalent arrays have similar side-lobe average. However, it is a function of the number ofarray elements.
The curves corresponding to WB conditions are shownin Figs. 12(c) and (d). Due to the bandwidth factor FWB,which depends on D and d (9), SLPeak curves correspond-ing to the four array designs become separated, but theystill remain nearly parallel. The step between SM-60 andSM-20 curves is −10 dB, which corresponds to the ratiobetween diameters. A −22 dB step is observed between thecurves corresponding to the small arrays; this difference is−32 dB for the large arrays. The average of the side-loberegion does not present variations with either the arraytype (SM or SA) or the pulse bandwidth (CW or WB), asthe array size and the number of elements are more deci-sive for this parameter. From these figures we can deducethat, within 30◦ of the steering angle, a SA array withD = 60 λ and d = 1.2 λ produces a side-lobe region withSLPeak = −53 dB and SLAverage = −82 dB, which can bevalid for ultrasonic imaging. In this case, the full aperturewould be used, and the number of elements would be re-duced from 11310 to 1950 (a factor of 5.8!) with respectto a SM array with λ/2 interelement spacing; the elementarea also would be multiplied by the same factor. However,
ullate et al.: beam steering with segmented annular arrays 1953
Fig. 12. Evolution of SLPeak relative to MLPeak in decibels, (a) and (c) and of SLAverage (b) and (d) for a small aperture with D = 20 λand a large aperture with D = 60 λ, as a function of the normalized interelement distance d/λ. Simulations have been made for the arrays inpulse-echo focusing at RF = D2/8 λ, φF = 0◦, θF = 30◦. In these graphics, the wavelength λ is fixed to 0.5 mm, and the distance betweenelements d is varied from 0.5 λ to 2 λ. The element size is e = 0.8 d. Above, CW excitation. Below, WB pulse.
using the SA array as phased array, there is a limit on theelements’ size in order to avoid zeros on the main beam; alimit of e = 1.25 λ, which produce zeroes at |θ| = 56◦, canbe reasonable.
VI. Conclusions
The capability of SA arrays for 3-D beamforming hasbeen theoretically analyzed and compared with the equiv-alent SM array. Assuming that the main-lobe properties ofequivalent SM and SA arrays are similar, we have centeredthe analysis on the side-lobe region.
In order to facilitate the analysis, this paper uses anapproach that allows evaluating the grating lobes of a SAarray by three factors: the periodicity factor P , the band-width factor FWB, and the element factor He. We haveshown that P has an inverse dependence on the numberof elements of the SA array, FWB depends inversely to thesquare root of the number of elements and to the pulserelative bandwidth, and He depends on the element size,given that the sector-like shape of the elements and theirorientation is not very important when the elements arerather small.
Using point-like elements (FA approach in Section IIIand wide band pulses in Section IV), the effect of the geo-metrical distribution of elements in the aperture has been
enhanced. In this sense, we have shown that rotating thearray rings or changing the rate d/λ have a small effecton the peak of the side-lobe region (SLPeak). However,there is an inverse dependence of this parameter with re-spect to the number of array elements. In wide band, whereonly a part of the elements simultaneously contribute tograting-lobe formation, the cancellation of grating lobes isreduced and, therefore, the periodicity factor is increased.Related to the mean value of the side-lobe region, we haveshown that SLAverage has small dependence on the arraytype (equivalent SM and SA arrays have similar SLAveragevalues) or on the interelement distance (d/λ), presentinghowever a greater dependence on the number of elements.
The effect of the elements’ real size also has been de-scribed in detail in Section V. We have shown that thelateral response of a SA array is modulated by the ele-ment factor He which, for small elements, can be approxi-mated to the response of the equivalent squared transducerin its main directions. This approximation facilitates thesteered-beam analysis of SA arrays and the array design.
From the analysis, we conclude that it is possible todesign SA arrays with interelement distance and elementsize beyond λ/2 (e.g., d = 1.2λ, e = λ) with beam char-acteristics that are perfectly valid for volumetric imagingapplications. In consequence, SA arrays have the advan-tage of reducing the number of elements and of enlarging
1954 ieee transactions on ultrasonics, ferroelectrics, and frequency control, vol. 53, no. 10, october 2006
the element size, implying an increase in the SNR associ-ated with the element impedance and with the array ac-tive area. However, there is a limit on the elements’ size(e < 1.25 λ), as we need avoiding the zeros of the elementfactor He for large steering angles.
In contrast, the irregular geometry of SA arrays im-plies a drawback for their fabrication from piezocompos-ite techniques [27], especially with small elements (e.g.,e ≤ 0.5 mm). However, capacitive micromachined ultra-sonic transducer (CMUT) techniques can be a good solu-tion to this problem, as using a cell resolution of 40 µm,array elements with 0.2 mm of size can be well designed.
References
[1] D. H. Turnbull and F. S. Foster, “Beam steering with pulsedtwo-dimensional transducer array,” IEEE Trans. Ultrason., Fer-roelect., Freq. Contr., vol. 38, no. 2, pp. 320–333, 1991.
[2] D. H. Turnbull and F. S. Foster, “Simulation of B-scan imagesfrom two-dimensional transducer arrays: Part II—Comparisonbetween linear and two-dimensional phased arrays,” Ultrason.Imag., vol. 14, no. 4, pp. 334–353, 1992.
[3] R. E. Davidsen, J. A. Jensen, and S. W. Smith, “Two-dimensional random arrays for real time volumetric imag-ing,” Ultrason. Imag., vol. 16, pp. 143–163, 1994.
[4] E. D. Light, R. E. Davidsen, J. O. Fiering, and T. A. Hruschka,“Progress in two-dimensional arrays for real-time volumetricimaging,” Ultrason. Imag., vol. 20, pp. 1–15, 1998.
[5] P. K. Weber, R. M. Schmitt, B. D. Tylkowski, and J. Steck,“Optimization of random sparse 2-D transducer arrays for 3-Delectronic beam steering and focusing,” in Proc. IEEE Ultrason.Symp., 1994, pp. 1503–1506.
[6] S. Holm and B. Elgetun, “Properties of the beampattern ofweight-and layout-optimized sparse arrays,” IEEE Trans. Ul-trason., Ferroelect., Freq. Contr., vol. 44, no. 5, pp. 983–991,1997.
[7] A. Trucco, “Thinning and weighting of large planar arrays bysimulated annealing,” IEEE Trans. Ultrason., Ferroelect., Freq.Contr., vol. 46, no. 2, pp. 347–355, 1999.
[8] S. W. Smith, H. G. Pavy, and O. T. Von Ramm, “High speed ul-trasound volumetric imaging system—Part I: Transducer designand beam steering,” IEEE Trans. Ultrason., Ferroelect., Freq.Contr., vol. 38, no. 2, pp. 101–108, 1991.
[9] G. Lockwood and F. S. Foster, “Optimizing the radiation pat-tern of sparse periodic two-dimensional arrays,” IEEE Trans.Ultrason., Ferroelect., Freq. Contr., vol. 45, no. 2, pp. 338–348,1996.
[10] S. Brunke and G. Lockwood, “Broad-bandwidth radiation pat-terns of sparse two-dimensional Vernier arrays,” IEEE Trans.Ultrason., Ferroelect., Freq. Contr., vol. 44, no. 5, pp. 1101–1109, 1997.
[11] A. Austeng and S. Holm, “Sparse 2-D arrays for 3-D phasedarray imaging—Design methods,” IEEE Trans. Ultrason., Fer-roelect., Freq. Contr., vol. 49, no. 8, pp. 1073–1086, 2002.
[12] J. L. Schwartz and B. D. Steinberg, “Ultrasparse, ultrawidebandarrays,” IEEE Trans. Ultrason., Ferroelect., Freq. Contr., vol.45, pp. 376–393, 1998.
[13] T. S. Sumanaweera, J. Schwartz, and D. Napolitano, “A spi-ral 2D phased array for 3D imaging,” in Proc. IEEE Ultrason.Symp., vol. 2, 1999, pp. 1271–1274.
[14] O. Martınez, “Arrays de anillos segmentados para generacion deimagen 3D,” Ph.D. dissertation, University Politecnica, Madrid,Spain, Sep. 2000. (in Spanish)
[15] M. Akhnak, O. Martınez, L. G. Ullate, and F. Montero de Es-pinosa, “64 elements two-dimensional piezoelectric array for 3-Dimaging,” Ultrasonics, vol. 40, pp. 139–143, 2002.
[16] P. R. Stepanishen, “Transient radiation from pistons in an infi-nite planar baffle,” J. Acoust. Soc. Amer., vol. 49, no. 5-2, pp.1629–1639, 1971.
[17] A. Reilly and G. Hayward, “A model to predict the transientradiation from segmented annular apertures radiating into solidmedia,” IEEE Trans. Ultrason., Ferroelect., Freq. Contr., vol.43, no. 2, pp. 263–269, 1996.
[18] O. Martınez, L. G. Ullate, and F. Montero, “Computation ofthe ultrasonic field radiated by segmented-annular arrays,” J.Comput. Acoust., vol. 9, no. 3, pp. 757–772, 2001.
[19] S. J. Norton, “Annular array imaging with full aperture reso-lution,” J. Acoust. Soc. Amer., vol. 92, no. 6, pp. 3202–3206,1992.
[20] L. G. Ullate, O. Martınez, M. Parrilla, and M. A. G. Izquierdo,“3D beamforming with ultrasonic divided-ring arrays,” Ultra-sonics, vol. 40, pp. 123–127, 2002.
[21] O. Martınez, L. Gomez-Ullate, and A. Ibanez, “Comparison ofCW beam patterns from segmented annular arrays and squaredarrays,” Sens. Actuators, vol. 85, no. 1-3, pp. 33–37, 2000.
[22] Y. Mendelsohn and E. Wiener-Avnear, “Simulations of circu-lar 2D phase-array ultrasonic imaging transducers,” Ultrasonics,vol. 39, pp. 657–666, 2002.
[23] J. J. Giesey, P. L. Carlson, D. W. Fitting, and C. R. Meyer,“Speckle reduction in pulse-echo ultrasonic imaging using a two-dimensional receiving array,” IEEE Trans. Ultrason., Ferro-elect., Freq. Contr., vol. 39, no. 2, pp. 167–173, 1992.
[24] T. Fjield and K. Hynynen, “The combined concentric ringand sector-vortex phased array for MRI guided ultrasoundsurgery,” IEEE Trans. Ultrason., Ferroelect., Freq. Contr., vol.44, no. 5, pp. 1157–1167, 1997.
[25] Y. Wang and M. O’Donnell, “Compounding of a forward-viewingring-annular ultrasound array system,” Ultrason. Imag., vol. 23,pp. 147–160, 2001.
[26] H. P. Schwarz, “Development of a divided ring array for three-dimensional beam steering in ultrasonic non-destructive test-ing,” in Proc. IEEE Ultrason. Symp., 1987, pp. 859–861.
[27] O. Martınez, M. Akhnak, L. G. Ullate, and F. Montero, “A small2D ultrasonic array for NDT applications,” NDT&E Int., vol.36, pp. 57–63, 2003.
[28] C. A. Balanis, Antenna Theory, analysis and design. New York:Wiley, 1982, pp. 206–213.
[29] B. Piwakowski and S. Khalid, “A new approach to calculatethe field radiated from arbitrarily structured transducer ar-rays,” IEEE Trans. Ultrason., Ferroelect., Freq. Contr., vol. 46,no. 2, pp. 422–440, 1999.
[30] G. Godoy, “Metodologıa de diseno de arrays bidimensionalesde geometrıa anular para generacion de imagen ultrasonica3D,” Ph.D. dissertation, Universidad Nacional de Educacion aDistancia (UNED), Madrid, Spain, 2004. (in Spanish)
[31] B. D. Steinberg, Principles of Aperture and Array System: In-cluding Random and Adaptive Arrays. New York: Wiley, 1976.
[32] S. J. Norton, “Theory of acoustic imaging,” Ph.D. dissertation,Stanford University, Technical Report 4956-2, 1976, pp. 72–7 3.