photometric study of chromospheric and coronal spikes observed during the total solar eclipse of 30...
TRANSCRIPT

P H O T O M E T R I C S T U D Y OF C H R O M O S P H E R I C A N D C O R O N A L
S P I K E S O B S E R V E D D U R I N G T H E T O T A L S O L A R E C L I P S E
OF 30 J U N E , 1 9 7 3
S. KOUTCHMY*
Sacramento Peak Observatory, AFCRL, Sunspot, New Mexico 88349
and
G. STELLMACHER
Institut d'Astrophysique, S.A.S., Paris 75014
(Received 20 February, 1976)
Abstract. A photometric and colorimetric analysis of a color picture of the very inner solar corona, near the South pole region, is performed. Dimensions and average electron densities of both chromospheric and very fine resolved coronal spikes are deduced. For the coronal spike a half width of 1'!67 is measured, the estimate of electron density yields ne = 101~ -3. Some conclusions are attempted on the light of a simultaneously observed spectrum of the same region which appeared to be a "disappearing coronal hole." The observations seem to support the concept of a "striated" corona.
1. Introduction
Observations of the solar corona directly over the poles are of special interest
since these regions correspond to the corona associated with regions of reduced
activity of the Sun. Characteristic features of the polar regions are the spicules (chromospheric
"spikes" or prominence "spikes") seen in the light of Ho~ (and other chromos-
pheric lines) on coronagraph pictures and the polar plumes or polar rays observed
in white light during total eclipses. Chromospheric spikes are of short duration (
some minutes), have characteristic diameters of ~4", and may extend up to about
40" (-=30 000 km above the limb). For a review see Roberts (1944), Bugoslavs- kaya (1949), and Dunn (1960). The typical autocorrelation widths of polar plumes
are 50" (Bugoslavskaya, 1949); it seems acknowledged they are related with the
chromospheric network. Evidence based on statistical analysis, was given by
Harvey (1965), Newkirk and Harvey (1968); a discussion of the association of
plumes with chromospheric features on the basis of XUV observations is pre-
sented by Bohlin et al. (1975). In addition to these structures, the presence of very thin "streams" or "coronal
spikes" with width of order of 1" have been observed during total eclipses. Visual
observations are reported for example by Nishi and Nakayomi (1963) who claim that the emitting matter is coronal, as suggested by its white color. A photo-
* On leave from Institut d'Astrophysique, Paris as NRC Post-Doctoral Research Assistant.
Solar Physics 49 (1976) 253-265. All Rights Reserved Copyright �9 1976 by D. Reidel Publishing Company, Dordrecht-Holland

254 s . K O U T C H M Y A N D G. S T E L L M A C H E R
graphic observation by Ivanchuk, et al. (1969), yields essentially the same result, and a photometry performed by Dzubenko et al. (1969) gave contrast values of ~3% and widths of ~1"-2". However, no clear proof for the coronal state of these streams has been given. Dzubenko et al. (1969) detected these streams by their apparent fine diameters; furthermore, these authors point to an apparent systematic correlation in position with the spicular emission, observed by them above the limb (apparent minimal distance above the solar limb being ~4" for their observations). An intriguing question arising now is the identification of these structures in light of recently reported ATM observations of "super- spicules" or "macro-spicules", Bohlin et al. (1975), Withbroe and Jaffe (1975). No answer will be sought in this paper.
Total eclipses in general are best suited for obtaining high resolution pictures of the white light corona (K-corona), since they easily allow the use of rather large telescopes with long focal lengths. The 1973 eclipse offered an opportunity to observe again these structures. A high spatial resolution experiment has been devoted to the study of chromospheric and coronal fine structures. The use of color emulsions together with radial neutral filters allows a more quantitative approach to this work.
During the same eclipse we also performed a special spectroscopic experiment in order to obtain information about the thermal and non-thermal :velocities above the polar regions, expecting in this manner to get observations of the so-called "coronal holes". We will try to relate spectroscopic and photometric results in this paper, although no clear conclusion can be drawn, in view of the rather unexpected results we obtained.
2. Observations
The following sections are each divided into Part A representing work concerning the chromospheric and coronal spike fine structure, and part B for the spectros- copic spectra.
A. The corona was observed during totality on June 30, 1973 at Moussoro (Republic of Tchad). A 20 cm lens telescope (Zeiss doublet AS); f/15 fed by a coelostat (D = 35 cm) was used together with the technique of compensating for the radial variation in coronal brightness. High quality images were obtained on Ektachrome film (frame size 18 x24 cm), Koutchmy (1973), (see his Figure 1). The use of color emulsions allows one to perform in a simple manner a colorimetric study, with the advantage described by Leroy (1966). The technique applied to separate the wavelength regions was to use accurately filtered dupli- cates on black and white emulsions. These duplicates have been used for the microphotometric analysis. The extensions of the wavelength regions were checked with the aid of a prism spectrum of the photosphere taken on the same color emulsion. Figure 3a shows the normalized spectral response Sa for the different wavelength regions.
P H O T O M E T R I C S T U D Y OF C H R O M O S P H E R I C A N D C O R O N A L SPIKES 255
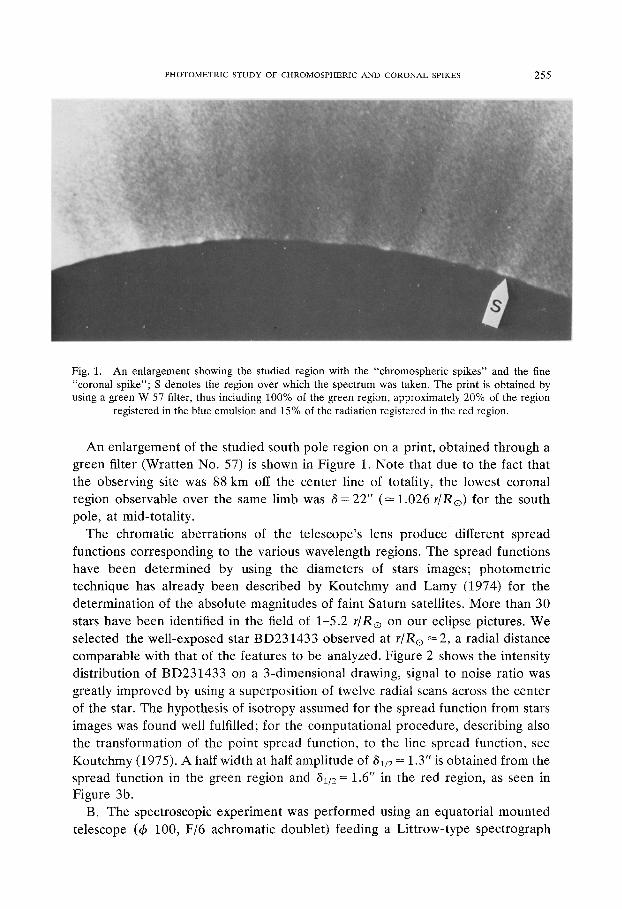
Fig. 1. An enlargement showing the studied region with the "chromospheric spikes" and the fine "coronal spike"; S denotes the region over which the spectrum was taken. The print is obtained by using a green W 57 filter, thus including 100% of the green region, approximately 20% of the region
registered in the blue emulsion and 15% of the radiation registered in the red region.
An enlargement of the studied south pole region on a print, obtained through a green filter (Wratten No. 57) is shown in Figure 1. Note that due to the fact that the observing site was 88 km off the center line of totality, the lowest coronal region observable over the same limb was 6 = 22" (-~ 1.026 r/Ro) for the south pole, at mid-totality.
The chromatic aberrations of the telescope's lens p roduce different spread functions corresponding to the various wavelength regions. The spread functions have been determined by using the diameters of stars images; photometric technique has already been described by Koutchmy and Lamy (1974) for the determination of the absolute magnitudes of faint Saturn satellites. More than 30 stars have been identified in the field of 1-5.2 r/R o on our eclipse pictures. We selected the well-exposed star BD231433 observed at r/RQ --~ 2, a radial distance comparable with that of the features to be analyzed. Figure 2 shows the intensity distribution of BD231433 on a 3-dimensional drawing, signal to noise ratio was greatly improved by using a superposition of twelve radial scans across the center of the star. The hypothesis of isotropy assumed for the spread function from stars images was found well fulfilled; for the computational procedure, describing also the transformation of the point spread function, to the line spread function, see Koutchmy (1975). A half width at half amplitude of 61/2 = 1.3" is obtained from the spread function in the green region and 61/2 = 1.6" in the red region, as seen in Figure 3b.
B. The spectroscopic experiment was performed using an equatorial mounted telescope (05 100, F/6 achromatic doublet) feeding a Littrow-type spectrograph

2 5 6 S. KOUTCHMY AND G. STELLMACHER
.,4
22"Xx1 '
17.6"
13.2" X v x ' , ~ . ; ' - - ~ } z , , / / 1 Z 6 "
8.8"\ ~ l ~ 3 2 ' ~ ~ " 1 / ./13.2"
4 4"
3.8"
22"
0 BD 231433 ( A G K 2 )
Fig. 2. A three-dimensional drawing showing the intensity distribution of the star BD231433, m~ = 6.78, and the coronal background. Ordinates are photographic densities on a relative scale. The
studied area is 22" x 22" and the effective microphotometer slit was 0.1" x 0.6".
(F= 600 mm, grating 1800 l/mm) with a linear dispersion of 19,&/mm, with the
observed spectral range 4650 A < h < 5750 A. A slit with a variable profile,
allowing a compensat ion for the radial gradient of brightness, was placed along the N-S axis of the corona, covering all of the lunar disk and the corona up to a
distance of 2 R e from the limb (additional information concerning this exper iment
can be found in Koutchmy et al. (1974), where some results concerning the study of the 160 s exposure- t ime spectrum are also given). Here we will use a 30 s exposed spectrum for the discussion.
3. Results
A. For the detailed study of the chromospheric and coronal fine structures we
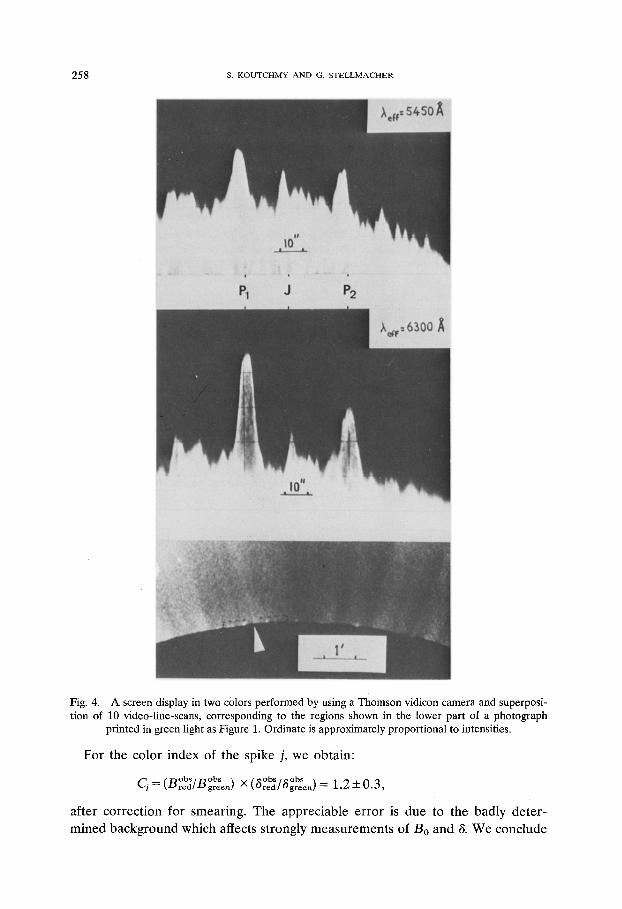
choose the most typical area indicated in Figure 4 (bottom), where a fine spike between two rather coarse emissions can be seen. See also Figure 1. A screen
display giving the superposition of 10 scans over this region (performed in a direction parallel to the neighbouring limb), for respectively the red and green duplicates, obtained with a Thompson-bui l t vidicon camera, is shown in Figure 4;

PHOTOMETRIC STUDY OF CHROMOSPHERIC AND CORONAL SPIKES 257
1.0 S;,,
0.5
K H 8 i i i 10"
6v~ i /
i / /
/ /
Ill
0.4
Y [3 b D 3 l I I I
)k" i . ' ' , " ' , ;' " " ' ' ' ' " \, ,1' " " " - .
i . ., I \ \ ", i \ l /
. \ i ~ I
\ . ',, ,/ ~1 I
; ,< \ I . I " ' / ~ . - - - , . X , _ . _ - - - . ~ ; ~ ' l
0.5 0.6 ~ [I a]
5*
0.0 O*
Fig. 3a. The normalized spectral response Sa for the combination of the films, filters, instrument and terrestrial atmospheric transmission. Half width at half amplitude of the smearing "81/2" determined by the effects of chromatic aberration is shown. The positions of prominent chromospheric lines are
indicated.
1.0
0.5 0.4
0.3
0.2
0.1
~\ 0 .63u
/\ J " ' ~ X ~ S N ~ 5 4 5
, \ I I i
2 3 4 5
n 6 V2
Fig. 3b. The normalized smearing functions obtained from the study of the star BD231433 for two wavelengths in a log/log scale.
the extension with height in the corona corresponds to ~ 5 " . Due to the fine scanning beam the resolution in the direction parallel to the limb is not affected.
A comparison of the green and red scans shows that the emission in the coarse structures is far stronger in the red, thus suggesting a prominence or chromosphere- type emission. The fine spike does not show any noticeable color variation, indicating a coronal- type white light emission.
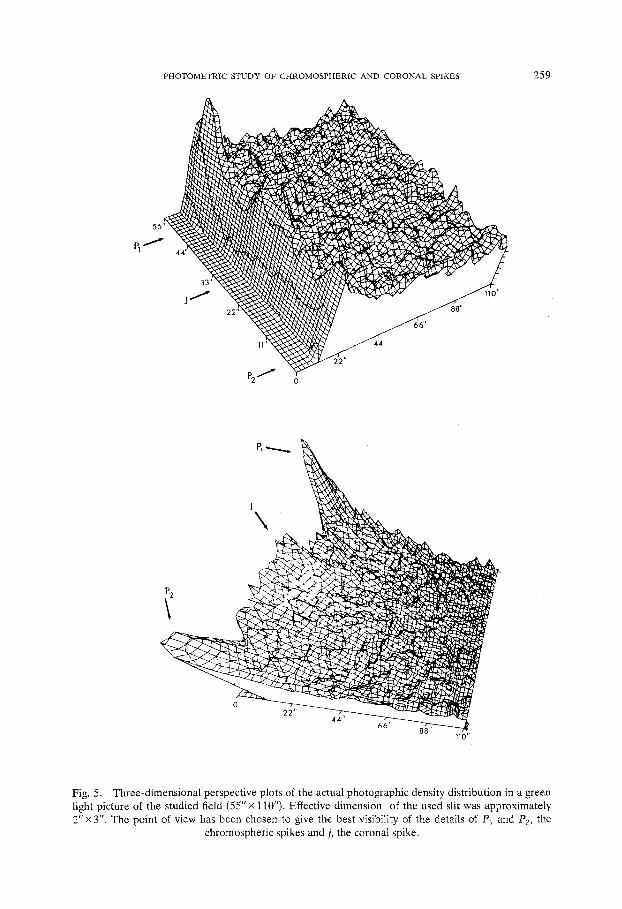
Microphotometer tracings were per formed in order to obtain widths and
intensities for these structures. Three-dimensional scans are shown in Figure 5. The prominence-l ike emissions are designed by P1 and P2; the fine coronal spike by j. The calibration in terms of absolute intensities was obtained f rom the study
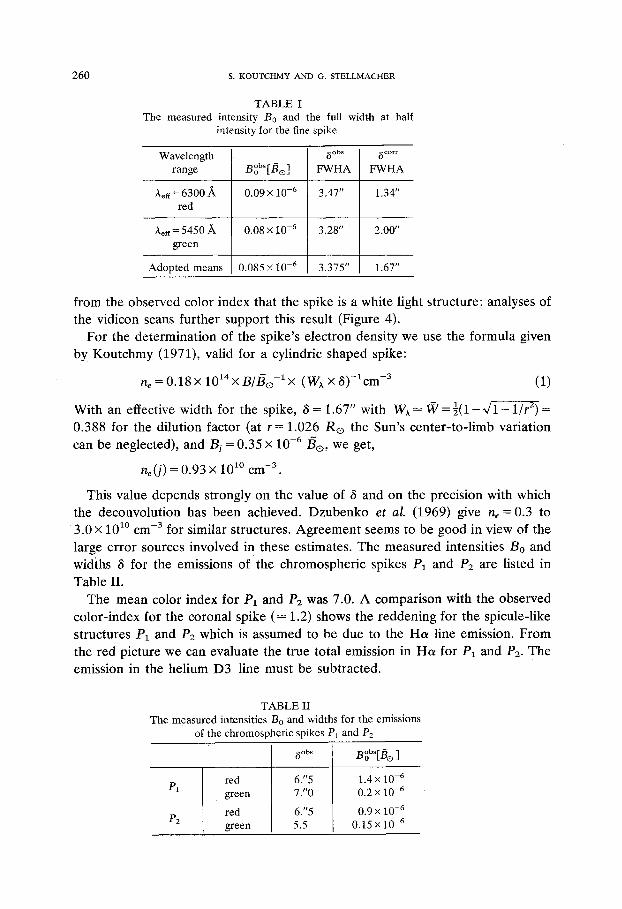
of 6 selected stars as absolute standards; details concerning the absolute calibra- tions of the picture will be described in a separate paper. The measured values for the intensity Bo and the full width at half intensity 3 of the fine spike, are listed in Table I. Corrected values are obtained after deconvolution assuming gaussians, a condition fulfilled by the deduced smear-functions, Figure 3b. The corrected
mean intensity becomes
/~ . . . . = ~obs(~obs /gcor r )2 = 0.35 x 10 -6/3o-
258 s. KOUTCHMY AND G. STELLMACHER
Fig. 4. A screen display in two colors performed by using a Thomson vidicon camera and superposi- tion of 10 video-line-scans, corresponding to the regions shown in the lower part of a photograph
printed in green light as Figure 1. Ordinate is approximately proportional to intensities.
F o r the co lor index of the sp ike j, we ob ta in :
C ~ / l [~~176 h / R o b s / R o b s k.Vred/LWgreen ) X kOred/Ugreer t ] = 1 . 2 + 0.3,
af ter co r rec t ion for smear ing . The a p p r e c i a b l e e r ro r is due to the b a d l y de t e r -
m i n e d b a c k g r o u n d which affects s t rongly m e a s u r e m e n t s of Bo and 8. W e conc lude
P H O T O M E T R I C S T U D Y O F C H R O M O S P H E R I C A N D C O R O N A L SPIKES 259
5 5 "
P ' ~ ,a"
2 2 ' - ~ , , ~ 88"
P2 " I " o
vv 110"
Fig. 5. Three-dimensional perspective plots of the actual photographic density distribution in a green light picture of the studied field (55"• 110"). Effective dimension of the used slit was approximately 2"• 3". The point of view has been chosen to give the best visibility of the details of P1 and P2, the
chromospheric spikes and j, the coronal spike.
260 S. K O U T C H M Y A N D G. S T E L L M A C H E R
TABLE I The measured intensity B0 and the full width at half
intensity for the fine spike
Wavelength range
he~ = 6300 ~_ 0.09 • 10 .6 red
heft= 5450 A 0.08;<10 .6 green
Adopted means 0.085 • 10 -6
~obs
F W H A
3.47"
3.28"
3.375"
~corr
F W H A
1.34"
2.00"
1.67"
from the observed color index that the spike is a white light structure; analyses of the vidicon scans further support this result (Figure 4).
For the determination of the spike's electron density we use the formula given by Koutchmy (1971), valid for a cylindric shaped spike:
ne = 0 . 1 8 X 10¹⁴X B/Bo -1 x (Wx x ~ ) - l c m - 3 (1)
With an effective width for the spike, 6 = 1.67" with Wx-~ rff, = �89 - ~ = 0.388 for the dilution factor (at r = 1.026 R o the Sun's center-to-limb variation can be neglected), and Bj = 0.35 x 10 . 6 / 3 o , we get,
he(j) = 0.93 X 101~ c m -3
This value depends strongly on the value of 8 and on the precision with which the deconvolution has been achieved. Dzubenko et al. (1969) give ne = 0.3 to 3.0 • 1 0 l~ c m -3 for similar structures. Agreement seems to be good in view of the large error sources involved in these estimates. The measured intensities Bo and widths 8 for the emissions of t h e chromospheric spikes Pa and P2 are listed in Table II.
The mean color index for PI and P2 was 7.0. A comparison with the observed color-index for the coronal spike ( = 1.2) shows the reddening for the spicule-like structures P~ and P2 which is assumed to be due to the H a line emission. From the red picture we can evaluate the true total emission in H a for Pa and P2. The emission in the helium D3 line must be subtracted.
TABLE II The measured intensities B0 and widths for the emissions
of the chromospheric spikes P1 and Pa
8 ~ B~b~[/~ o ]
red 6."5 1.4 x 10 -6 P1 green 7."0 0.2 x 10 .6
red 6."5 0.9 x 10 .6 /'2 green 5.5 0.15 x 10 6
P H O T O M E T R I C S T U D Y O F C H R O M O S P H E R I C A N D C O R O N A L S P I K E S 261
In his spicule model, Beckers (1972) gives for the intensity ratio H a / D 3 = 8
for h = 6000 kin, and ~ 25 for h = 25 000 kin. For faint prominences: H a / D 3 = 8 (Stellmacher, 1972). We simply take H a / D 3 = 10, since the contribution of D3 leads only to a small correction.
With a bandwidth of --~700 A for the red, the at tenuation factor ( 1 - s p e c t r a l response Sx) at H a was determined to be equal to 0.7; for D3 we have 0.6 (Figure 3a). We then get for the H a emission:
B~(P1) = 1 .4x 10-6x 700• 1 .34= 1.33 m / k /3o tea
B~ (P2) = 0.9 x 10 .6 x 700 x 1.34 = 0.86 m ,~/~o red
where 1.34 is the correction factor which accounts for the D3 emission and the respective attenuation in H a and D3. The contribution of t h e continuous
emission can be neglected for the red region; it is est imated to =~s for this
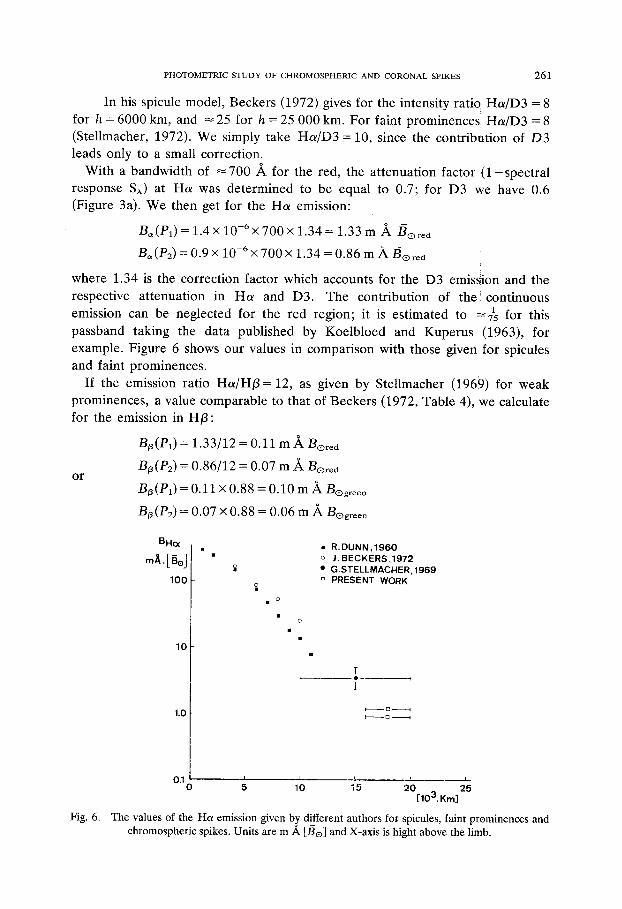
passband taking the data published by Koelbloed and Kuperus (1963), for example. Figure 6 shows our values in comparison with those given for spicules and faint prominences.
If the emission ratio Ha/H~ = 12, as given by Stellmacher (1969) for weak prominences, a value comparable to that of Beckers (1972, Table 4), we calculate for the emission in H/3:
B~(P1) = 1.33/12 = 0.11 m A Bored
B~(P2) = 0.86/12 = 0.07 m A Bore~ or
B~(P1) = 0.11 x 0.88 = 0.10 m * Bogreen
B~(P2) = 0.07 x 0.88 = 0.06 m A Bog~**,
Fig. 6.
BHcx
100
m
10
1.0
0.1 o
o o
o
[ ]
�9 R.DUNN, 1960 o J. BECKERS,1972 �9 G.STELLMACHER, 1969 o PRESENT WORK
T O - - I 1
b ~ D ----.---4
5 10 15 20 3 5 [10 . Krn]
The values of the Ha emission given by different authors for spicules, faint prominences and chromospheric spikes. Units are m A [/3o] and X-axis is hight above the limb.
262 S. K O U T C H M Y A N D G. S T E L L M A C H E R
when re la ted to the green con t inuum, with a convers ion factor 2.4/2.72 = 0.88,
account ing for the solar spectral dis t r ibut ion.
The actual emiss ion of H/3 will be a t t enua ted by a factor ~ 15 in the green
region. Tak ing into account o ther p r o m i n e n c e lines falling into this wavelength
region (D3, Mgb, H~/), we get for the total l ine emiss ion
Bline(P1) = 0.034 m A B o green
Bline(P2) = 0.020 m A B o g . . . .
or in uni ts of m e a n solar br ightness in our 650 A,effect ive passband,
Bline(P1) = 0 .034/650 = 0.05 x 10 -6 B o g . . . .
Bline(P2) = 0.020/650 = 0.03 x 10 -6 B o gr . . . .
Subtrac t ing these values from the measu red total emission (Table II), we get for
the con t inuous emissions in the green region:
Bcont(P1) = 0.20 x 10 - 6 - 0.05 x 10 6 = 0.15 X 10 -6 B o green
Boont(P2) = 0.15 X 10 .6 - 0.03 X 10 6 = 0.12 X 10 -6 B o g . . . . .
Aga in using equa t ion (1) and the value
Bcont(P) = 0 . 1 3 5 x 10 6 B o g . . . .
and 8 = 6.2 arc-seconds, we ob ta in for the e lec t ron densi ty of the chromospher ic
spikes P1 and P2
fie(P) = 0.1X 10 l~ cm -3 .
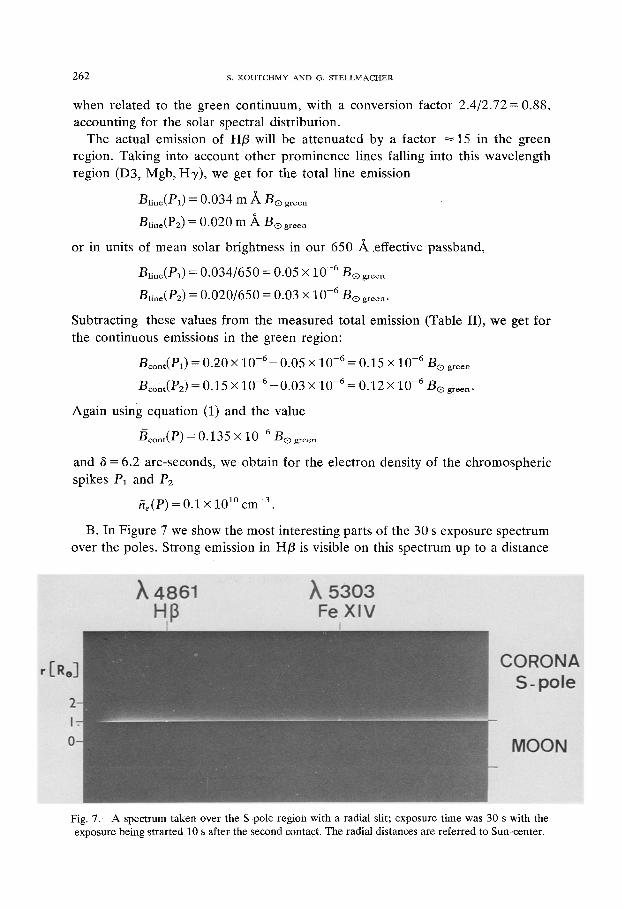
B. In Figure 7 we show the most in teres t ing parts of the 30 s exposure spec t rum
over the poles. St rong emiss ion in H/3 is visible on this spec t rum up to a distance
Fig. 7. A spectrum taken over the S-pole region with a radial slit; exposure time was 30 s with the exposure being strarted 10 s after the second contact. The radial distances are referred to Sun-center.
P H O T O M E T R I C S T U D Y O F C H R O M O S P H E R I C A N D C O R O N A L SPIKES 263
of about 5" to 10" above the lunar limb or 25"-30" above the solar limb (the exposure was made immediately after the second contact). Unfortunately, H/3 is slightly overexposed, and is not suited for a proper photometry. The emission in the green line X5303 seems to appear at a slightly higher position than the typical chromospheric emission. The green line is visible up to a distance of 1.5 R o from the Sun's center. We mention that Fisher (1974) observed the green line, with the photoelectric photometer of the Sacramento Peak Observatory on June 30, 1973 at a distance of 1.15 to 1.2 R o and determined a brightness of i x 1 0 -6 B O over
the south pole, in accordance with our observations. The most remarkable feature of the spectrum is the broad assymetric profile of
the Fe xiv )t5303 line; its corrected width was determined to about 4 (Koutchmy et al., 1974). A detailed analysis of the profile shows that we have to assume a composite line. For an assumed two-component line the separation is estimated to 3 .5• A, which would correspond to Doppler-Fizeau displace-
ments of ~ 2 0 0 km s -I (allowing for a reasonable inclination of 30 ~ for the emitting streams at an assumed height of 0.5 R o above the limb).
Billings et al. (1956) have described coronagraph observations performed above equatorial active regions showing a 3.5 A wide composite red line ()~6374) (see their figure 1). These authors interpreted this profile in terms of Doppler-Fizeau- displacements and point to prominence related motions. Obviously, the situation is different over the quiet sun and also in polar regions where magnetic field lines are rather open. Our spectroscopic observations strongly suggest a model of the south pole region as a source of a high speed solar wind (see discussion).
Furthermore, a photometric scan across H/3 shows no abnormal widening of the line whose width is determined by the actual instrumental profile including photographic noise. We emphasize here that the examination of the lunar background shows without any doubt that this chromospheric emission has its origin in the lowest corona due to structures falling in or very close to the slit, in constrast with the parasitic origin of the low excitation line emission observed during the same eclipse over the E-limb, by Stellmacher and Koutchmy (1974).
4. Discussion
We are' able to make a clear distinction between the fine coronal spike and the chromospheric spike (prominence spike) with the aid of a colorimetric analysis. This was not possible in the earlier observations (see Introduction).
The inferred H a emission of the chromospheric spikes fits the values given for spicules by Dunn (1960) and Beckers (1972), and for weak prominences by Stellmacher (1969).
A quite conspicuous very fine spike, with halfwidth 61/z = 1'.'67, consisting of
coronal matter has been measured, yielding an estimate of density ne = 10 l~ cm -3.

2 6 4 S. K O U T C H M Y A N D G. S T E L L M A C H E R
Spectrosocopic evidence in )t5303 of coronal high speed velocities (+200 kms -1) has been given. No obvious excessive broadening or shifting of the observed chromospheric H/3 line was found in the underlying regions.
After the discovery of "superthin streams" (coronal spikes) by the Kiev observers, Ivanchuk (1969, 1972a, 1972b) proposed a model of the solar wind involving a corona striated in density and magnetic field. His corona is filled with fine streams of arc-seconds widths and - 10 3 km s -~ upward expansion velocities. Our observations support in part this rather non-orthodox view of the coronal expansion phenomena. We want to remark that many authors in the past emphasized the existence of fine structures as filamentary currents of the magnetic plasma in the solar corona (see, for example, Alfv6n, 1963). Even the interplanet- ary solar wind shows density modulation with a characteristic dimension compara- ble with our "coronal spike", when extrapolated back to the Sun, as Jokipii (1973) showed. An examination of the problems of coronal fine structures will be beyond the scope of this paper. We restrict our conclusion to the suggested relation between "spicular ejection phenomena" and a new kind of coronal structure (coronal spike) which overlies a polar-type region of the Sun, where we find spectroscopic evidence of high speed expansion velocities.
A study of synoptic maps by Wagner (1976) of the distribution of Fe xv (A284) extreme ultraviolet emissions for rotation 1602 (before and around the eclipse date) shows the presence of a high latitude "coronal hole" extending from longitude 200 ~ up to longitude 280 ~ (central meridian passage 7-14 June 1973). It was possible to follow back in time this well-developed coronal hole until rotation 1598 (February 1973); but an interesting point must be mentioned, namely, the sudden non-recurrence for this "coronal hole" during rotation 1603, immediately after the eclipse date. Thus the south-polar region, where high speed coronal matter was observed, might be connected with a "disappearing coronal hole". Finally we want to point out that even on the 160 s exposure time spectrum no trace of h5303 emission can be detected above the north-polar region, where the maps of Wagner (1976), show a well-developed "coronal hole" (central meridian passage 29 June 1973).
Acknowledgements We are grateful for the cooperation and facilities provided us by the Republic of Tchad, French Government Representatives and A6rospatiale, France, without which the Eclipse Observations could not have been carried out. Efforts of Prof. J. R6sch, responsible for Eclipse Expeditions are hereby acknowledged.
We are indebted to Dr W. Wagner for meaningful suggestions in course of preparation of this paper.
References Alfv~n, H.: 1963, 'The Solar Corona', IAU Syrnp. 16, 35. Beckers, J. M.: 1972, Ann. Rev. Astron. Astrophys. 10, 73. Billings, D. E., Hirsch, S. and Varsavsky, C.: 1956, Astrophys. J. 123, 532.
P H O T O M E T R I C S T U D Y OF C H R O M O S P H E R I C A N D C O R O N A L SPIKES 265
Bohlin, J. D., Purcell, J. D., Sheeley, N. R., Tousey, R.: 1975, Bull. Amer. Astro. Soc. 7, 356. Bohlin, J. D., Vogel, S. N., Purcell, J. D., Sheeley, N. R., Tousey, R. and Van Housier, M. E.: 1975,
Astrophys. J. Letters, 197, L 133. Bugoslavskaya, E. Y.: 1949, 'Structure of the Solar Corona', Sternberg Inst. Vol. XIX, Moscou. Dunn, R. B.: 1960. Thesis, Harvard University, Cambridge, MA. Dzubenko, N. I., Ivanchuk, V. I. and Rubo, C. A.: 1969, Astr. Circ. No. 504, 3. Fisher, R. R.: 1974, Solar Phys. 36, 343. Harvey, J. W.: 1965, Astrophys. J. 141, 832. Ivanchuk, V. I.: 1969, Astron. Circ. 537, 5. Ivanchuk, V. I.: 1972, Astron. Circ. 716, 1. Ivanchuk, V. I.: 1972. Astron. Circ. 716, 4. Ivanchuk, V. I., Vsekhsvjatsky, S. K., Dzubenko, N. I. and Rubo, G. A.: 1969, Astr. Circ. no. 504, 1. Jokipii, J. R.: 1973, Ann. Rev. Astron. Astrophys. 11, 1. Koelbloed, D. and Kuperus, M.: 1963, Konig. Nederl. Akad. Wet. Proceedings Serie B, Vol. LXVI, 1. Koutchmy, S.: 1971, Astron. Astrophys. 13, 79. Koutchmy, S.: 1973, Sky and Telescope 46, 215. Koutchmy, S.: 1975, Icarus, 25, 131. Koutchmy, S. and Lamy, Ph.: 1974, Icarus, 25, 459. Koutchmy, S., Bateau, Ch. and Stellmacher, G.: 1974, C.R.A.S. 278, 873. Leroy, J. L.: 1966, Astronomie, 80, 271. Newkirk, Jr. G. and Harvey, J.: 1968, Solar Phys. 3, 321. Nishi, K. and Nakagomi, Y.: 1963, Publ. Astron. Soc. Japan 15, 56. Roberts, W. O.: 1944, Astrophys. Z 101, 134. Stellmacher, G.: 1969, Astron. Astrophys. 1, 62. Stellmacher, G.: 1972, Solar Phys. 25, 104. Stellmacher, G. and Koutchmy, S.: 1974, Astron. Astrophys. 35, 43. Wagner, W. J.: 1976, private comm. Withbroe, G. L. and Jaffe, D.: 1975, Paper presented at the 5th Meeting of the AAS Sol. Phys. Div.,
Boulder, Col.