the eclipse ballooning project at vanderbilt university
TRANSCRIPT

THE ECLIPSE BALLOONING PROJECT AT VANDERBILT UNIVERSITY
AND THE CONSTRUCTION OF CUSTOM EQUIPMENT
By
Adam Jarrell
Thesis
Submitted to the Faculty of the
Graduate School of Vanderbilt University
in partial fulfillment of the requirements
for the degree of
MASTER OF SCIENCE
in
Mechanical Engineering
December 16, 2017
Nashville, Tennessee
Approved:
Professor Alvin M. Strauss
Professor George E. Cook

ACKNOWLEDGMENTS
I would like to thank all of my lab mates Devany Sweitzer, Jacob Matthews, Jay
Reynolds, Kelsay Neely and, Todd Evans for being the launch and recovery crew for
many long launch days. Also, I would like to thank Dr. Tim Holman, Bruce Martin,
Robin Midget, Daniel Vibert, and the other members of the Vanderbilt Amateur
Radio Club for providing vital experience and time into developing the amateur radio
repeater. Additionally, they provided the APRS unit and the Microhunt beacon.
I would like to thank the Vanderbilt Grounds Crew for going above and beyond the
expectations to recover balloons, where ever they landed. Additionally, Tom Delker,
and the DeKalb County Amateur Radio Club for making eclipse day recovery much
easier than previous launches.
I would like to acknowledge the efforts of the Montana, Minnesota, Colorado,
and Louisiana Space Grant Consortium who provided guidance and developed the
common payload utilized in this project.
Financial support was provided through the NASA Space Grant Consortium and
Vanderbilt University.
ii

TABLE OF CONTENTS
Page
ACKNOWLEDGMENTS . . . . . . . . . . . . . . . . . . . . . . . . . . . . . ii
LIST OF TABLES . . . . . . . . . . . . . . . . . . . . . . . . . . . . . . . . . v
LIST OF FIGURES . . . . . . . . . . . . . . . . . . . . . . . . . . . . . . . . vi
TERMS AND DEFINITIONS . . . . . . . . . . . . . . . . . . . . . . . . . . . xi
1 INTRODUCTION . . . . . . . . . . . . . . . . . . . . . . . . . . . . . . . 1
1.1 The Eclipse Project . . . . . . . . . . . . . . . . . . . . . . . . . . . . 2
2 GENERAL GUIDELINES FOR HAB . . . . . . . . . . . . . . . . . . . . 5
2.1 APRS Tracking . . . . . . . . . . . . . . . . . . . . . . . . . . . . . . 7
3 HARDWARE OVERVIEW . . . . . . . . . . . . . . . . . . . . . . . . . . 11
3.1 Balloon and Parachute . . . . . . . . . . . . . . . . . . . . . . . . . . 11
3.2 Ground Station . . . . . . . . . . . . . . . . . . . . . . . . . . . . . . 13
3.3 Packages . . . . . . . . . . . . . . . . . . . . . . . . . . . . . . . . . . 14
3.3.1 Iridium tracking package . . . . . . . . . . . . . . . . . . . . . . 16
3.3.2 OCCAMs Cut Down Unit . . . . . . . . . . . . . . . . . . . . . 17
3.3.3 Video System . . . . . . . . . . . . . . . . . . . . . . . . . . . . 18
3.3.4 Still Image System . . . . . . . . . . . . . . . . . . . . . . . . . 19
3.3.5 Two Meter Beacon . . . . . . . . . . . . . . . . . . . . . . . . . 19
3.3.6 APRS Unit . . . . . . . . . . . . . . . . . . . . . . . . . . . . . 20
3.3.7 Evironmental Package . . . . . . . . . . . . . . . . . . . . . . . 21
3.3.8 Amateur Radio Repeater . . . . . . . . . . . . . . . . . . . . . . 23
4 SOFTWARE OVERVIEW . . . . . . . . . . . . . . . . . . . . . . . . . . . 31
4.1 Ground Station . . . . . . . . . . . . . . . . . . . . . . . . . . . . . . 31
4.1.1 Video Streaming Computer . . . . . . . . . . . . . . . . . . . . 32
iii

4.2 Packages . . . . . . . . . . . . . . . . . . . . . . . . . . . . . . . . . . 33
4.2.1 APRS unit . . . . . . . . . . . . . . . . . . . . . . . . . . . . . . 33
4.2.2 Environmental Package . . . . . . . . . . . . . . . . . . . . . . . 34
5 LAUNCH LOGISTICS . . . . . . . . . . . . . . . . . . . . . . . . . . . . . 39
6 FIRST TEST FLIGHT . . . . . . . . . . . . . . . . . . . . . . . . . . . . . 41
7 SECOND TEST FLIGHT . . . . . . . . . . . . . . . . . . . . . . . . . . . 45
8 ECLIPSE FLIGHT . . . . . . . . . . . . . . . . . . . . . . . . . . . . . . . 47
9 LESSONS LEARNED AND FUTURE IMPROVEMENTS . . . . . . . . . 50
10 CONCLUSIONS . . . . . . . . . . . . . . . . . . . . . . . . . . . . . . . . 54
BIBLIOGRAPHY . . . . . . . . . . . . . . . . . . . . . . . . . . . . . . . . . 55
Appendix . . . . . . . . . . . . . . . . . . . . . . . . . . . . . . . . . . . . . . 56
A STANDARD OPERATING PROCEDURES FOR LAUNCH . . . . . . . . 56
A.1 Ground Station and Iridium Tracker . . . . . . . . . . . . . . . . . . . 57
A.2 Still Image Package . . . . . . . . . . . . . . . . . . . . . . . . . . . . 58
A.3 Video Payload . . . . . . . . . . . . . . . . . . . . . . . . . . . . . . . 59
A.4 Environmental Package . . . . . . . . . . . . . . . . . . . . . . . . . . 60
B ENVIRONMENTAL DATA . . . . . . . . . . . . . . . . . . . . . . . . . . 62
B.1 Heading . . . . . . . . . . . . . . . . . . . . . . . . . . . . . . . . . . 62
B.2 Temperature . . . . . . . . . . . . . . . . . . . . . . . . . . . . . . . . 66
B.3 Humidity . . . . . . . . . . . . . . . . . . . . . . . . . . . . . . . . . . 68
B.4 Pressure . . . . . . . . . . . . . . . . . . . . . . . . . . . . . . . . . . 69
B.5 CO2 . . . . . . . . . . . . . . . . . . . . . . . . . . . . . . . . . . . . . 69
iv

LIST OF TABLES
Table Page
2.1 Budgetary guidelines for a basic HAB launch. . . . . . . . . . . . . . . 5
2.2 Comparison of the some of the trackers available to use with High Al-
titude Balloonists . . . . . . . . . . . . . . . . . . . . . . . . . . . . . 6
3.1 Materials used in the construction of the Environmental Package. . . . 23
3.2 Materials used in the construction of the Amateur Radio Repeater. . . 24
v

LIST OF FIGURES
Figure Page
1.1 Path of totality of the August 2017 Solar Eclipse with lines indicating
the magnitude of the eclipses and the time of maximum eclipse. Image
produced by NASA’s Scientific Visualization Studio and Ernie Wright
[7]. . . . . . . . . . . . . . . . . . . . . . . . . . . . . . . . . . . . . . 3
1.2 Path of the August 2017 solar eclipse overlaid with the location of
Eclipse Ballooning Project Teams’ launch locations. [8] . . . . . . . . 4
2.1 Map of the VHF frequency reserved for APRS transmissions. [15] . . 8
2.2 Path that an APRS packet would take using the WIDE2-2 path. . . 9
3.1 How all the balloons used in the test launches were rigged. On an
actual launch a second cable tie would be used, and the whole assembly
wrapped in duct tape. The parachute and packages were suspended
from the loop in the nylon cord. . . . . . . . . . . . . . . . . . . . . . 12
3.2 The Diagram shows the connection and type of connection made be-
tween all components in the standard payload [8]. . . . . . . . . . . . 13
3.3 The Diagram shows the connection and type of connection made be-
tween all components in the standard payload. . . . . . . . . . . . . 14
3.4 The more rigid enclosure made to house the electrical components.
The rigging lines run up the vinyl tubing around the package. The
electronics are safely nested inside the enclosure. . . . . . . . . . . . 16
3.5 General lay out of components inside of one of the cardboard tubes.
The batteries were generally insulated by foam on all sides. . . . . . 17
3.6 The Iridium tracking package deconstructed with major component
labeled. . . . . . . . . . . . . . . . . . . . . . . . . . . . . . . . . . . 18
vi

3.7 The live video package deconstructed with major components labeled. 25
3.8 The still image package deconstructed with major components labeled. 26
3.9 The Tracksoar unit bought to replace the APRS package lost in the
first test flight [18]. . . . . . . . . . . . . . . . . . . . . . . . . . . . . 27
3.10 Block diagram of the components of the environmental package. The
sensors are arranged by what bus on the Raspberry Pi to which they
are connected. . . . . . . . . . . . . . . . . . . . . . . . . . . . . . . 27
3.11 The environmental package deconstructed with major components la-
beled. . . . . . . . . . . . . . . . . . . . . . . . . . . . . . . . . . . . 28
3.12 Schematic of the printed circuit board that was manufactured in house
to connect the power distribution, sensors, and Raspberry Pi. . . . . 28
3.13 Block diagram of the components of the amateur radio repeater package. 29
3.14 Diagram of the repeater relay used to enable easy access to the balloon
repeater. . . . . . . . . . . . . . . . . . . . . . . . . . . . . . . . . . 29
3.15 The calculated radio horizon of the amateur radio repeater for various
balloon altitude. . . . . . . . . . . . . . . . . . . . . . . . . . . . . . 30
6.1 The flight path of the balloon during the second test flight on June
20th, 2017. The balloon landed in Riddleton, TN. . . . . . . . . . . . 41
6.2 The two flight paths of the balloon and the lost APRS package. . . . 42
7.1 The flight path of the balloon during the second test flight on August
8th, 2017. The balloon landed in Watertown, TN. . . . . . . . . . . . 45
7.2 Video Still from the max altitude that the balloon reached. The Image
was taken right after the balloon ruptured. . . . . . . . . . . . . . . . 46
8.1 Image taken by the balloon at 7500-8000 meters as totality came into
Nashville. . . . . . . . . . . . . . . . . . . . . . . . . . . . . . . . . . 48
vii

8.2 The flight path of the balloon during the second test flight on August
21st, 2017. The balloon landed in Statesville, TN. . . . . . . . . . . . 49
8.3 Image taken by the balloon at 22,000 meters, near the maximum alti-
tude of the eclipse flight. . . . . . . . . . . . . . . . . . . . . . . . . . 49
9.1 Comparison of the flight paths of the two test flights and the eclipse
flight. . . . . . . . . . . . . . . . . . . . . . . . . . . . . . . . . . . . 52
A.1 Order that the packages were hocked up to the balloon. The Diagram
was posted at all launches, so volunteers knew how to hook up their
designated package. . . . . . . . . . . . . . . . . . . . . . . . . . . . 56
B.1 The (a) longitude and (b) latitude plotted against altitude for the
08/08 flight. The different currents of air can be clearly seen by when
the balloon changes direction. A large majority of the balloons move-
ment is in longitudinal directions. . . . . . . . . . . . . . . . . . . . . 63
B.2 The (a) longitude and (b) latitude plotted against altitude for the
08/21 flight. The different currents of air can be clearly seen by when
the balloon changes direction. A large majority of the balloons move-
ment is in longitudinal directions. . . . . . . . . . . . . . . . . . . . . 63
B.3 The derived wind (a) speed and (b) bearing plotted against altitude
for the 08/08 flight. The different currents of air can be clearly seen
by when the balloon rises above a defined altitude. . . . . . . . . . . 64
B.4 The derived wind (a) speed and (b) bearing plotted against altitude
for the 08/21 flight. The different currents of air can be clearly seen
by when the balloon rises above a defined altitude. . . . . . . . . . . 65
B.5 The (a) ascent and (b) descent rate of the balloon derived from the
altitude data of the balloon. . . . . . . . . . . . . . . . . . . . . . . . 65
viii
B.6 Temperature reported by all the sensors on board the environmental
logger during the the 08/08 test flight during (a) ascent and (b) descent. 66
B.7 Temperature reported by all the sensors on board the environmental
logger during the the 08/21 test flight during (a) ascent and (b) descent. 66
B.8 Comparison of the temperature measured from the Type K thermo-
couple for both the 08/08 and 08/21 flights for (a) ascent and (b)
descent. It can be easily seen that the thermocouple on the 08/08
flight was lose in the socket and fell out around 15000 meters. . . . . 67
B.9 Temperature measured by the Type K thermocouple during the 08/08
flight for ascent and descent. . . . . . . . . . . . . . . . . . . . . . . 68
B.10 Temperature measured by the Type K thermocouple during the 08/21
flight for ascent and descent. . . . . . . . . . . . . . . . . . . . . . . 69
B.11 Comparison of the humidity measured from the SHT31 IC for both the
08/08 and 08/21 flights for (a) ascent and (b) descent. The accuracy
of the data above 1000 meeter and during decent is doubtful due to
the sensor being below temperature limits. . . . . . . . . . . . . . . . 70
B.12 Humidity measured during the 08/08 flight for ascent and descent. . 71
B.13 Humidity measured during the 08/21 flight for ascent and descent. . 72
B.14 Comparison of the pressure measured from the BMP180 IC for both
the 08/08 and 08/21 flights for (a) ascent and (b) descent. The range
of the measured pressure is within the bounds of expected. . . . . . . 72
B.15 Pressure measured during the 08/08 flight for ascent and descent. . . 73
B.16 Pressure measured during the 08/21 flight for ascent and descent. . . 74
ix

B.17 Comparison of the CO2 measured from the K-30 IC for both the 08/08
and 08/21 flights for (a) ascent and (b) descent. The k-30 seems to
have malfunctioned for a majority of the of the 08/08 flight. The
reasons are unknown However, descent data is questionable due to
the rapid rate of descent. . . . . . . . . . . . . . . . . . . . . . . . . 74
B.18 CO2 measured during the 08/08 flight for (a) ascent and (d) descent. 75
B.19 CO2 measured during the 08/08 flight for (a) ascent and (d) descent. 75
x

TERMS AND DEFINITIONS
APRS - Automatic Packet Reporting System is a HAM Based digital communi-
cations system
Arduino - Arduino is an open source single-board microcontroller and accompanying
programming language based off C.
ARIES - ARIES is the Montana State University based server dedicated to retrieving
and distributing telemetry through the Iridium Satellite Array
EEPROM - Electrically Erasable Programmable Read-Only Memory is a method of
data storage that allows byte level read, write, and erase of bits. It is commonly used
on microprocessors to store configurations.
FFmpeg - FFmpeg is a open source project that produces multimedia programs.
GPIO - General Purpose Input and Output are general purpose pins, who’s function
are controlled by the user.
GUI - The Graphicall User Interface is the portion of the program that interfaces
with the user.
HAM radio - The use of dedicated radio frequency bands for non-commercial private
recreation.
I2C - Inter-Integrated Circuit is a three wire synchronous serial interface.
IMU - Inertial Measurement Unit is a electronic device designed to measure 3D ori-
entation. The device includes an accelerometer, gyroscope, and magnetometer.
Iridium Satellite Array - The Iridium Satellite Array is an constellation of 66 active
satellites to provide phone and data coverage over Earth’s surface.
OBS - Open Broadcaster Software is a open source video recording and streaming
software.
OCCAMS - The cutdown unit from the standard payload. Named after Occam’s
Razer.
xi

Python - Python is a general purpose scripting language that is easy to use and pop-
ular in scientific communities.
Raspberry Pi - Raspberry Pi is a single-board computer based around a ARM pro-
cessor and Debian Linux Operating System.
Raspberry Pi Zero W - The Zero W is the latest model of the Raspberry Pi. It is a
small form factor computer with wireless capabilities.
Shell Script - program that is designed to be run by a command-line interpreter.
SPI - Serial Peripheral Interface bus is a four wire synchronous serial interface.
UART - Universal Asynchronous Receiver-Transmitter is an asynchronous serial in-
terface.
UHF - Ultra High Frequency is the range of the radio spectrum from 300 Mhz to 3
Ghz
UTM Coordinates - Universial Transverse Mercator coordinate system
VHF - Very High Frequency is the range of the radio spectrum from 30 Mhz to 300
Mhz.
VLC - VLC is an open source media player.
xii

CHAPTER 1
INTRODUCTION
High Altitude Ballooning is an effective and relatively simple conduit for STEM
education. Balloons provide a space-like environment and regularly reach the strato-
sphere with sustained flights. Latex balloons have flight times measured in the hours,
and mylar ”zero pressure” balloons can maintain an altitude for months. The bud-
get for a launch can range from hundreds to millions of dollars. At the minimum,
high altitude balloons use around 400 dollars of consumable materials per flight, and
their payloads can be as simple as a few sensors with a single board computer and
a tracking device. At the maximum, they can be used for millions of dollar research
projects.
High Altitude ballooning has a low barrier to entry into the field and is commonly
done with students as young as elementary age. Cheap and simple experiments
can be developed, using single board computers, for grade school to enhance the
educational experience [1]. Students can get first hand experience in the use of the
scientific method. They can formulate real world questions, hypothesize about the
results, develop experiments, conduct the experiments, and formulate conclusions.
High altitude ballooning can provide a teaching platform that will make an impact
in the students education.
In comparison, rocketry and CubeSat programs are rarely seen outside of the
large university environment. Rockets have safety concerns with explosive fuels, and
require large amounts of expertise. Additionally, they go to a lower altitude for less
time than balloons. CubeSats represent a large investment, on the order of tens
of thousands of dollars, and require specialized equipment to survive the radiation
environment in a low earth orbit. Generally, they are inaccessible to anyone without
1

specialized engineering experience.
Even though High altitude ballooning is accessible for inexperienced teams, bal-
looning can also provide real world solutions and be a platform for large scale research
projects. The National Weather Service launches hundreds balloons daily from their
weather stations to gain information on wind patterns in the upper atmosphere [2].
Large balloons were used to carry the BOOMERanG used to map the cosmic back-
ground radiation around the south pole [3]. Google Lune is experimenting with
balloons to provide affordable Internet to undeveloped regions by using steerable bal-
loons to create an in air network of Antennas to distribute Internet to those bellow
[4]. NASA has long used ballooning to create analog extraterrestrial environments in
which to conduct experiments. [5] [6].
1.1 The Eclipse Project
August 21st, 2017 a total solar eclipse was predicted to transverse coast to coast
across the county. Totality was to enter the United States from the Oregon coast
line and depart off the South Carolina coast. Twelve states would experience totality,
Figure 1.1. The last total solar eclipse in the continental United States was in 1979,
and only crossed the northwestern section of the country.
It was believed eclipse would be an excellent opportunity to capture the imagina-
tion of everyone, regardless of education level. The Eclipse Ballooning Project was
a NASA Space Grant Consortium initiative created harness the interest behind the
eclipse as a conduit between educators and the general public for STEM knowledge.
It was also used as an opportunity for students to get hands on experience with being
part of a national collaborative project. The main feature of the project was coast to
coast coverage of the eclipse filmed from high altitude balloons.
The August 2017 eclipse provided an excellent opportunity to attempt a national
collaborative project as the eclipse covered the entire Continental United States. The
2
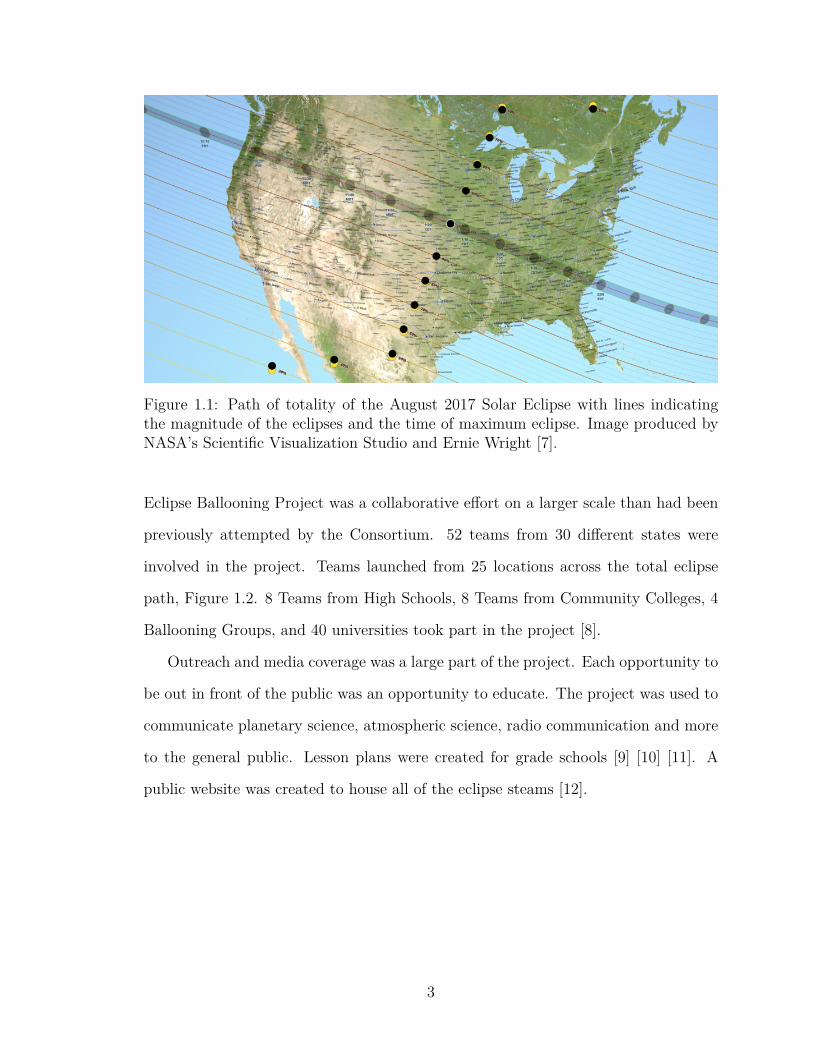
Figure 1.1: Path of totality of the August 2017 Solar Eclipse with lines indicatingthe magnitude of the eclipses and the time of maximum eclipse. Image produced byNASA’s Scientific Visualization Studio and Ernie Wright [7].
Eclipse Ballooning Project was a collaborative effort on a larger scale than had been
previously attempted by the Consortium. 52 teams from 30 different states were
involved in the project. Teams launched from 25 locations across the total eclipse
path, Figure 1.2. 8 Teams from High Schools, 8 Teams from Community Colleges, 4
Ballooning Groups, and 40 universities took part in the project [8].
Outreach and media coverage was a large part of the project. Each opportunity to
be out in front of the public was an opportunity to educate. The project was used to
communicate planetary science, atmospheric science, radio communication and more
to the general public. Lesson plans were created for grade schools [9] [10] [11]. A
public website was created to house all of the eclipse steams [12].
3

Figure 1.2: Path of the August 2017 solar eclipse overlaid with the location of EclipseBallooning Project Teams’ launch locations. [8]
4

CHAPTER 2
GENERAL GUIDELINES FOR HAB
High Altitude Ballooning is a low budget platform of accessing a space like envi-
ronment. When planning a launch there are a few general guidelines to follow.
At the low end, a latex balloon launch will only cost 230-580 dollars in expendable
materials. A single balloon can typically carry multiple packages in its payload. A
packages is a self contained set of hardware designed to fulfill a task. Generally, each
package is placed in its own container as suspended in a stack under the balloon. A
general budgetary guideline is written out in Table 2.1. The exact cost of the a HAB
launch will depend on the packages that are used as well as the research goals of the
launch. The budget listed only accounts for a single packages but one balloon can
carry multiple payloads.
Material CostConsumables
Balloon 100-250Helium 100-300Rigging 30Tape and other Launch Supplies 50
Non-consumableParachute 50-100Balloon Filling Equipment 30Regulator for helium 40Tools 100Packages and Instrumentation 200Tracker 200-300Total 900-1400
Table 2.1: Budgetary guidelines for a basic HAB launch.
The FAA regulates unmanned freed balloons in Part 101 Subpart D of the FAA
regulations. The regulations will not be listed here due to upcoming changes in the
5

regulations. Refer to the regulations to insure that regulations are followed [13]. All
flight restrictions, notification requests, and balloon requirements should be followed
for each launch.
Any balloon that is expected to be recovered needs to have some device capable
of providing locational telemetry back to the ballooning team. The device is usually
called a tracker. A reliable tracker is especially important when data from the balloon
needs to be related to altitude. Some of the tracking devices readily available to the
balloonist are compared in Table 2.2.
Tracker Advantages disadvantages CostSpot tracker Reliable and regularly tested.
Popular option for hobbyistballooning. Wide internationalcoverage
Requires asubscription fee.Not modifiable. Lowoperating Altitude.Difficult to obtainraw data.
170 +15 a
month
Iridium Reliable. International coverage.Commercial Solution. Raw datacan be requested from the IridiumDatabase. Models are availablewithout altitude limits. Can beused for two way communication.
Requiressubscription fee.Requires data fee.Expensive.
600 +10 a
month+
datafees
APRS No subscription fees. Easy accessto raw data. Easily modifiable.Models are available with outaltitude limits.
Coverage isn’tuniversal anddepends onhobbyists. Requiresa license to operate.
100 to300
Table 2.2: Comparison of the some of the trackers available to use with High AltitudeBalloonists
Trackers that haven’t been proven or reported by a reliable source to be effective
in high altitude scenarios shouldn’t be depended on. Some GPS modules have been
programmed to be ineffective at high altitudes or speeds obtainable at higher altitude.
If you are validating one brand of GPS module, pair it with another that is reliable.
6

Redundant reliable trackers should be used and placed on opposite ends of the
packages stack to be assured of recovery. If possible, use trackers that use two differ-
ent communication methods. For example, Iridium systems use a satellite array for
communication, and APRS depends on a network of ground stations. If the balloon
fragments in two, both fragments will have a tracking system for recover. If the bal-
loon doesn’t transmit all collected data through telemetry systems, recovery of the
packages is essential for success of the launch.
When rigging up the package stack, insure that the packages have enough room
between them to prevent interference. This can be in the form of radio interference,
or disruption of the environment the package is designed to measure. packages can in-
terfere with each other electrically, disrupting transmission and function Interference
can be minimized by increasing the amount of line between each package, minimum
of 6 feet between packages, and thoughtful selection of order.
2.1 APRS Tracking
APRS is a remote telemetry reporting systems developed by HAM operators,
and it requires a HAM license to use. APRS, Automatic Packet Reporting System,
network is commonly used to track high altitude balloons. The network can be used
to relay locational, altitude, and some sensor data to the ground. Since it is relatively
open software and hardware, it warrants some explanation here.
The networks consists of three components. Automated beacons that broadcast
digital telemetry packets. Specialized repeaters, called digipeaters, rebroadcast the
digital packets. Internet connected radios, Igates, upload the digital packets to central
servers. Digipeaters are high powered devices and are placed in areas that provide
the best reception. However, they tend to be remote and lack an Internet connection.
Igates can be run by HAM clubs or individuals. These centralized servers can be
accessed and telemetry of the beacon can be received on the ground via specialized
7

websites [14].
A frequency of the VHF band has been set aside for use with APRS. The specific
frequency varies per country; in the United States, 144.390 MHz has been set aside
for APRS, Figure 2.1.
Figure 2.1: Map of the VHF frequency reserved for APRS transmissions. [15]
The idea is that the beacons broadcasts the packets in direct range of an Igate,
or the packet ”hops” digipeaters; the digipeaters rebroadcast the packet with greater
power to be heard by an Igate. The number of hops the packet is to take is prepro-
grammed into the packet. The packets are broadcast by the beacon and digipeater
without feedback of receipt So, the packet will continue to make the full number of
hops regardless of when and where it was received by an Igate.
APRS is a public and largely unregulated service. Therefore, there is the ability to
abuse the service. The digital packets contain no error correction. The entire packet
must be received without errors if it is to be received at all. So, every transmission
has to have completely clear airways. Any noise or interference prevents reception of
the signal. So, APRS depends on each packet being transmitted in its own time slot.
Modern improvements to the system attempt to prevent the abuse of the system.
For example, digipeaters don’t retransmit packets from the same call sign within a
8

specified time, and digipeaters toss out packets that are coded for too many hops.
Most digipeaters restrict the number of hops to two to restrict the amount of traffic
on the network. The digipeaters either ignore any packet designating more than two
jumps or modify the packet. However, the responsibility for not clogging up the
network is still upon the user. So, the networks allows for several transmission modes
depended on the use case to avoid clogging up the network.
The header of APRS packages contain the call sign of the recipients and sender.
The recipient can be a specific station or general class of devices. The recipients are
placed in order to designated the path the packet is to take. All relatively new APRS
devices follow the WIDEn-N pathing paradigm. Most home stations respond to the
Wide1-1 call sign. Digipeaters in the VHF band respond to the WIDE2-N call sign
and decrement N by one as long as N is greater that zero, Figure 2.2.
Figure 2.2: Path that an APRS packet would take using the WIDE2-2 path.
It is recommended that for high altitude operation to use the WIDE2-1. The iden-
tifier prevents home stations from digipeating the signal. At the altitude the APRS
unit flies, hundreds of home stations could be accessed by the unit causing hundreds
of identical packets to overflow the network. Digipeaters that received the APRS
transmissions would only rebroadcast them once minimizing traffic. Transmitting
9

in a different mode would clog up the APRS network with access traffic making it
unusable for hundreds of miles. Even without the digipeating function of the APRS
network, the altitude of the balloon makes the likelihood of reaching an Igate with
the first transmission almost a certainty [16]
10

CHAPTER 3
HARDWARE OVERVIEW
A majority of the hardware utilized in the Eclipse Project was provided through
the Space Grant Consortium. Two of the additional packages were in-house solutions,
and the additional tracking devices were commercial solutions configured for our
needs. The provided hardware was designed to fulfill the minimum requirements of
the project. The requirements were that the system had to be able to live stream
video of the eclipse from above 60,000 feet with a maximum range of 30 miles, and to
take still images through the flight. The FAA requested that all balloons in the air
under this project had to be traceable by air traffic controllers, and each team had to
provide a the option of termination of the flight in-case of conflicts of airspace.
A standard payload and ground system was developed to fulfill all of the require-
ments, and was distributed to all of the teams during a workshop. The ground station,
live video payload, still image payload, and Iridium tracker, and the OCCAMs cut
down unit were received An environmental logger and amateur radio repeater were
constructed in house to add to eclipse flight. An APRS tracker from Tracksoar was in-
cluded to have a redundant tracker, and a 2 meter fox hunting beacon was purchased
in case of emergency.
3.1 Balloon and Parachute
The balloon utilized for all launches was a Kaymont 2000g high altitude balloon.
The latex balloon expands continually with the decreasing pressure, the bursting
diameter is 10.5 meters. The balloons can take 7-9 pounds to 110,000 feet with ideal
conditions.
The neck of the balloon was stiffened with a small length of 1.5 inch diameter
11

PVC tubing. This gave the balloon a rigid area to attach the rigging using cable ties,
Figure 3.1. At least two cable ties were used to firmly fasten a loop of paracord to
the balloon. Multiple loops of a duct tape were wrapped around the cable ties to
prevent sharp ends from damaging the balloon.
Figure 3.1: How all the balloons used in the test launches were rigged. On an actuallaunch a second cable tie would be used, and the whole assembly wrapped in ducttape. The parachute and packages were suspended from the loop in the nylon cord.
The parachute was a 72 inch Spherachute modified with a weather balloon attach-
ment. The parachute is designed to give a 8-13 lbs payload a 15-20 ft/sec descent rate
at sea level. The rate will insure that the packages or anything hit by the balloon are
not damaged during decent.
The parachute was connected to the paracord loop from the balloon via a second
length of paracord. The second length should be around 6-10 feet long. It prevents the
12

remnants of the balloon from partially or fully closing the parachute. The packages
were suspended from under the parachute by a key ring connecting the suspension
lines of the parachute.
3.2 Ground Station
The ground station encompassed all the video streaming and telemetry equipment,
Figure 3.2.
Figure 3.2: The Diagram shows the connection and type of connection made betweenall components in the standard payload [8].
One dish antenna was used for the 5.8 GHz system. One patch antenna and one
Yagi antenna was used for the 900 MHz system. The fixture for the antennas was
constructed out of 80/20 extruded aluminum sections.
Since the antennas used are directional, have an asymmetric gain pattern, the
ground station features a pointing system. The pointing system used a IMU to
provide bearing and elevation data. An Arduino with an GPS shield was used to
determine the ground stations location. The magnetometer was used for the bearing,
and the accelerometer was used for the elevation. Tilt and pan servos were used to
point the antenna array. A Pololu Micro Maestro Servo Controller was used to control
the servos.
13

Connections made between the balloon payloads and components of the ground
station is shown in Figure 3.3.
Figure 3.3: The Diagram shows the connection and type of connection made betweenall components in the standard payload.
3.3 Packages
All instrumentation is suspended underneath the balloon in packages. Each of the
packages are designed for a purpose. For example, packages can provide locational
telemetry allowing recovery teams to track the balloon or log the environment that
the balloon transverses. Each of the packages must be built to be light but resistant
14

to water and protect the components inside against impact.
The original packaging provided with the standard packaging was replaced with
a sturdier design due to concerns about insulation and water, Figures 3.4, 3.5. The
design was inspired by the work of the Pittsburgh eclipse ballooning team and the
Minnesota Space Grant. The containers were based around materials readily available
from local vendors. The body of the packages were constructed from concrete form
tubes. Four guide lines were routed on the outside of the concrete tube through vinyl
freezer tubing at 90 degree angles with respect to one another. The tubing prevented
the rigging from fraying or catching on the corners of the container, and causing a
possible lost of a package. Tight fitting disks of extruded polystyrene rigid foam
insulation seal off either end of the pip and are used to nest electrical components
in layers inside. The components were secured together by mechanical means via zip
ties. On each package, contact information was affixed to the outer surface of the
package. Therefore, anyone who finds the balloon after the landing will be able to
contact the team and return the packages.
The cardboard tubes are typically used for a form when pouring concrete columns.
So, they are made out of a thicker material and have a waxy coating that resist water.
They stand up well to moisture and are rigid enough to reliably connect the packages
to each other. Additionally, they are easy to shape and form. The polystyrene foam
served as an insulating material to prevent the packages from getting to cold to
function in flight. It also served as a potential source for flotation in the case of a
water landing.
Each package had approximately 10 ft of nylon twine run through each of the four
vinyl tubes with key rings knotted to each end of the twine. The twine and key rings
are intended to fail at 50 pounds per current FAA regulations. Each guide line was
knotted on either side of the package such that the line could not slide through the
tubing. The key rings are used to connect the packages together.
15

Figure 3.4: The more rigid enclosure made to house the electrical components. Therigging lines run up the vinyl tubing around the package. The electronics are safelynested inside the enclosure.
3.3.1 Iridium tracking package
The Iridium tracking package was the primary tracker of the balloon. The Iridium
9602-LP modem used was purchased from NAL Research Corporation. The modem is
capable of two way communication with the Iridium Satellite array. The modem was
connected to two patch antennas. One for the patch antennas receives transmissions
from the GPS array, and the other communicates with the Iridium array. The system
was powered by a 6600 mAh Lithium Ion Battery pack. A control board housed an
Xbee Bluetooth module that connected to the OCCAMs cut-down unit. All of the
components were attached to a 3d printed bracket and nested in a foam insulation
ring, Figure 3.6.
Commands could be sent to Iridium modem. These would turn on individual pins
on the 15-pin D-Sub connector. These signals are decoded by the control board and
sent corresponding commands over the Xbee. Through this system, the flight could
16

Figure 3.5: General lay out of components inside of one of the cardboard tubes. Thebatteries were generally insulated by foam on all sides.
be terminated at any time through the Iridium array.
The insulation disk housing the device was sandwiched between two other insula-
tion panels and fitted into the cardboard tube.
The package was instrumental in pointing the ground station antennas. The
ground station used telemetry data from the Iridium modem to position the antennas.
3.3.2 OCCAMs Cut Down Unit
The OCCAMs cut down unit could be used to terminate the flight by separating
the packages from the balloon. The balloon would continue the flight while the
packages would fall to the ground. The unit could be used to prevent the packages
from landing in an inconvenient situation.
The cut down system was formed around a 3d printed frame. the line connected
the balloon to the parachute ran through the 3d printed frame. An motorized offset
17
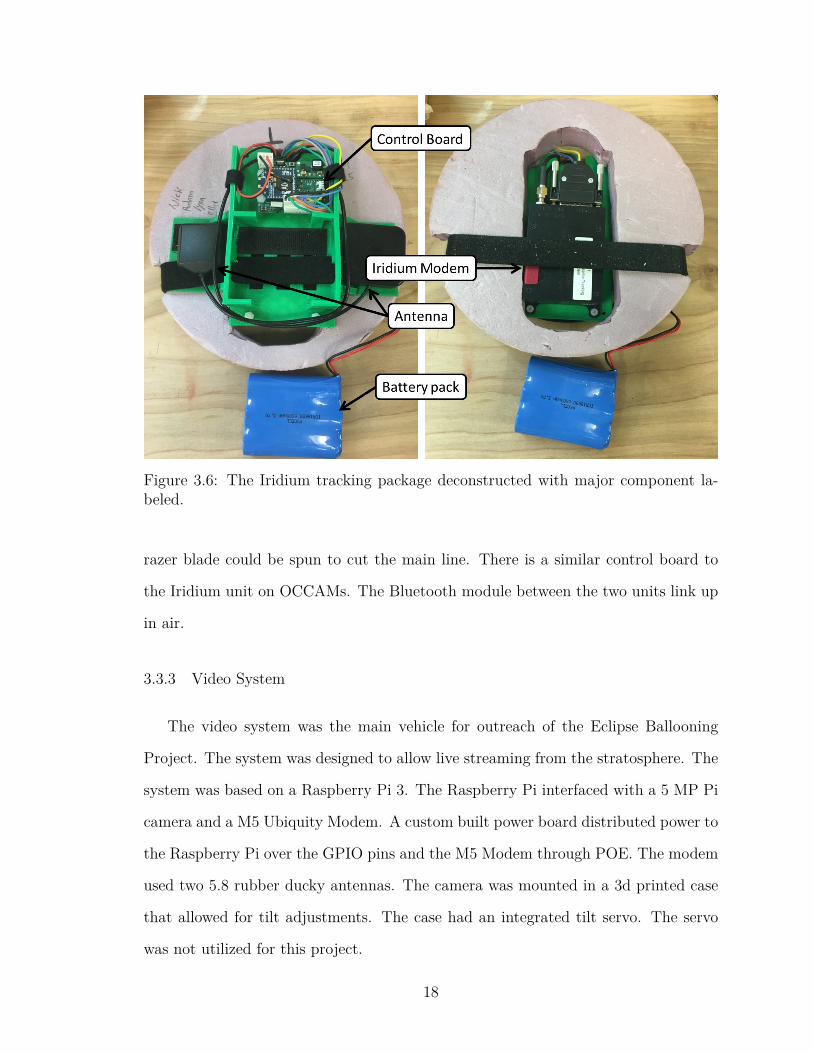
Figure 3.6: The Iridium tracking package deconstructed with major component la-beled.
razer blade could be spun to cut the main line. There is a similar control board to
the Iridium unit on OCCAMs. The Bluetooth module between the two units link up
in air.
3.3.3 Video System
The video system was the main vehicle for outreach of the Eclipse Ballooning
Project. The system was designed to allow live streaming from the stratosphere. The
system was based on a Raspberry Pi 3. The Raspberry Pi interfaced with a 5 MP Pi
camera and a M5 Ubiquity Modem. A custom built power board distributed power to
the Raspberry Pi over the GPIO pins and the M5 Modem through POE. The modem
used two 5.8 rubber ducky antennas. The camera was mounted in a 3d printed case
that allowed for tilt adjustments. The case had an integrated tilt servo. The servo
was not utilized for this project.
18

The unit was powered by two 6600 mAh Lithium Ion batteries. The batteries
could provide about 2-3 hours of video streaming.
The raspberry pi and camera was mounted onto a foam core board, Figure 3.7.
The modem and batteries were nested in foam insulation panels and stacked bel-
low the Raspberry Pi, Figure 3.5. The stack was then put into the standard tube
enclosure. The antennas passed through the side wall of the enclosure.
3.3.4 Still Image System
The still image system was also a raspberry pi based system. The Raspberry Pi
interfaced with a 5 MP pi camera.
The package utilized a 900 Mhz long range telemetry radio from RFDesign. The
radio has a power rating on 1 watt and claims an operating range of greater than 40
km depending on operating conditions.
The package was powered by two 6600 mAh lithium Ion batteries. The system
could operate for about 3 hours of flight time off the batteries.
The electronic components were mounted similar to the video system. The Rasp-
berry Pi, Radio, and Camera was mounted onto a foam core board with the rubber
ducky antennas mounted in a perpendicular polarization arrangement with an thin
gauge steel ground plane. The batteries were enclosed in foam insulation. The stack
of components were pressed into a cardboard tube and sealed off on both ends by
more of the foam insulation.
3.3.5 Two Meter Beacon
A two meter fox hunting” beacon from microhunt was included on the payload
[17]. The beacon transmitted on 146.565 MHz, and it repeated the call sign ”AA4VU”
in Morse code for 30 seconds followed by a 30 second down time.
The beacon would be the last backup for tracking down the balloon via direction
19

finding efforts. If all tracking systems on the balloon failed. Then, a team can go out
to the estimated landing location with a directional antenna and possibly hunt down
the balloon.
3.3.6 APRS Unit
Two APRS units were used through the balloon flights. The first was a homemade
solution. It was lost during the first test flight, when the package broke free during
balloon burst.
The second was a unit from Tracksoar, a super light APRS unit developed at
the Santa Barbra Hackerspace [18]. The Tracksoar was based off of an Arduino. It
is programmable through the Arduino IDE, and the unit is completely open source.
Powered from 2 AA batteries, the unit transmitted on the 2 meter band, 144.390
MHz, through a dipole antenna.
The Tracksoar unit also incorporated a BMP280 humidity and pressure sensor.
The BMP280 includes a low noise temperature sensor that is primarily used for tem-
perature correction of the pressure and humidity. Additionally, the BMP 280 isn’t
rated for temperatures below −40 C, so the accuracy its operation in the upper tro-
posphere is questionable.
The Tracksoar unit was nestled between two foam insulation sheets, and fitted
into a small diameter cardboard tube. The dipole antenna was threaded out of the
tubing and affixed to a fiberglass reinforced plastic road.
The unit had very good performance with two Lithium Ion AA batteries. It
survived the altitude and transmitting for two days straight, which was plenty of
time to find the package after landing.
20

3.3.7 Evironmental Package
The environmental package was based on a Raspberry Pi Zero W. Environmental
Sensors are populated on the I2C, SPI, and UART buses of the Pi. MCP9808
temperature sensor, SHT31 humidity sensor, BMP180 pressure sensor, and DS3231
real time clock populated the I2C bus. A Max31856 universal thermocouple amplifier
populated SPI bus. The K-30 10,000 PPM CO2 sensor interfaced with the UART
bus , Figure 3.10.
All of the sensors used in the package was provided as breakout boards. So, the
focus of the project could be spent on interfacing with the sensors instead of design
and manufacture of an appropriate PCB with individual components. The breakout
board were purchased through Adafruit and CO2Meter.com
The Raspberry Pi Zero W was selected so that the Pi can be configured as a wire-
less access point. The accesses point can be used to verify operation prior to launch,
and the files can be retrieved via SSH file transfer after the launch. Additionally, The
Pi had an extremely low power draw, around 300 mA at full operation.
The package initially intended to only utilize A SHT31-D humidity sensor, MCP9808
temperature sensor, and the BMP180 pressure sensor, and the K-30 CO2 meter. How-
ever, It was determined after the first test flight that the boards were either to close
to the power generation or the −40 C operating range on most of the sensors led to
some inaccuracies in the measurement. So, an MAX31856 Thermocouple to Digital
Converter IC was added to the package. The IC contained a low noise amplifier,
cold junction compensation, temperature look up table, and a SPI communication
interface. The Cold junction compensation had the same −40 C operating range,
but it was not a debilitating factor, since the IC could be kept in the interior of the
enclosure. The Type K thermocouple used had a much larger operating range and
could be threaded out of the bottom of the package.
The DS3231 Real Time clock was added to insure that the Environmental Data
21

Logged by the sensor could be directly related to the location at which it was taken
using an accurate time stamp. The DS3231 was the most accurate over the time
span of the flight, in addition to having temperature compensation that could lead
to inaccuracies in the real time clock. Before the real time clock was used in flight,
the Raspberry Pi was connected to the Internet so that the clock could sync with
Universal Time.
The power for the system was provided by 6 AA Lithium Ion Batteries. The
voltage was stepped down via DC/DC converters based on the MP1584EN package
for both the K-30 and Raspberry Pi. It was necessary to separate the power supply
for the Raspberry Pi and the K-30 CO2 sensor, because the K-30 sensor requires 7V
and spikes of 300 mA when taking a measurement. The power demand was outside
what could be provided through the Raspberry Pi. All other sensor packages were
powered of the Raspberry Pi’s 5V rail. The 5V supply to the Pi was further regulated
by a t7805cv voltage regulator and some appropriate electrolytic capacitors.
All of the original components except the Raspberry Pi were connected via an in-
house manufactured PCB. Figure 3.12. The rest were housed on an acrylic plate that
was affixed to the back of the PCB, Figure 3.11. The two boards could be slid into a
cardboard tube with the sensors exposed out of the face. A Foam shroud prevented
cold air from leaking around the sensors into the enclosure. Either end of the tube
was plugged using foam disks.
The materials used in the construction of the environmental logger is summarized
in Table 3.1. The package came in at just over 200 dollars. Enclosure materials was
not included in this bill of materials but can be easily manufactured for around 10
dollars.
22

Material CostRaspberry Pi Zero 1016 GB Micro SD Card 10Adafruit BMP180 20Adafruit SHT31-D 14Adafruit MCP9808 5Adafruit MAX31856 18Adafruit DS3231 15Type K Thermocouple 10K-30 CO2 sensor 85Lithium Ion AA Battery 15PCB, components, and connectors 30Total 232
Table 3.1: Materials used in the construction of the Environmental Package.
3.3.8 Amateur Radio Repeater
The amateur radio repeater was also based around a Raspberry Pi. The Pi runs
Open Repeater, a package for single board computers to enable low cost cross-band
repeater functionality. The receive and transmit are handled via two Baofeng hand-
helds. The handhelds were electrically isolated from the Raspberry Pi using an Easy
Digi interface. A usb sound card was used to interface the handhelds to the Raspberry
Pi, Figure 3.13.
The repeater design was low cost, light weight, robust, and was easy to assemble.
The materials for the repeater came in at under 300 dollars. However, the package
can be further minimized using custom built PCBs. Such a design could be used to
reestablish communication of disaster areas.
VHF and UHF signals don’t travel much further than line of sight, or their radio
horizon. It was estimated that the extreme altitude of the balloon would give the
repeater an extremely large radio horizon, Figure 3.15. Communicating through the
balloon would be similar to communicating via a satellite. A low powered handheld
23
with a directional antenna should be to communicate through the balloon from the
extents of the balloons radio horizon under ideal conditions. The balloon repeater
could have been used to link communication over most of the southeastern region of
the United States.
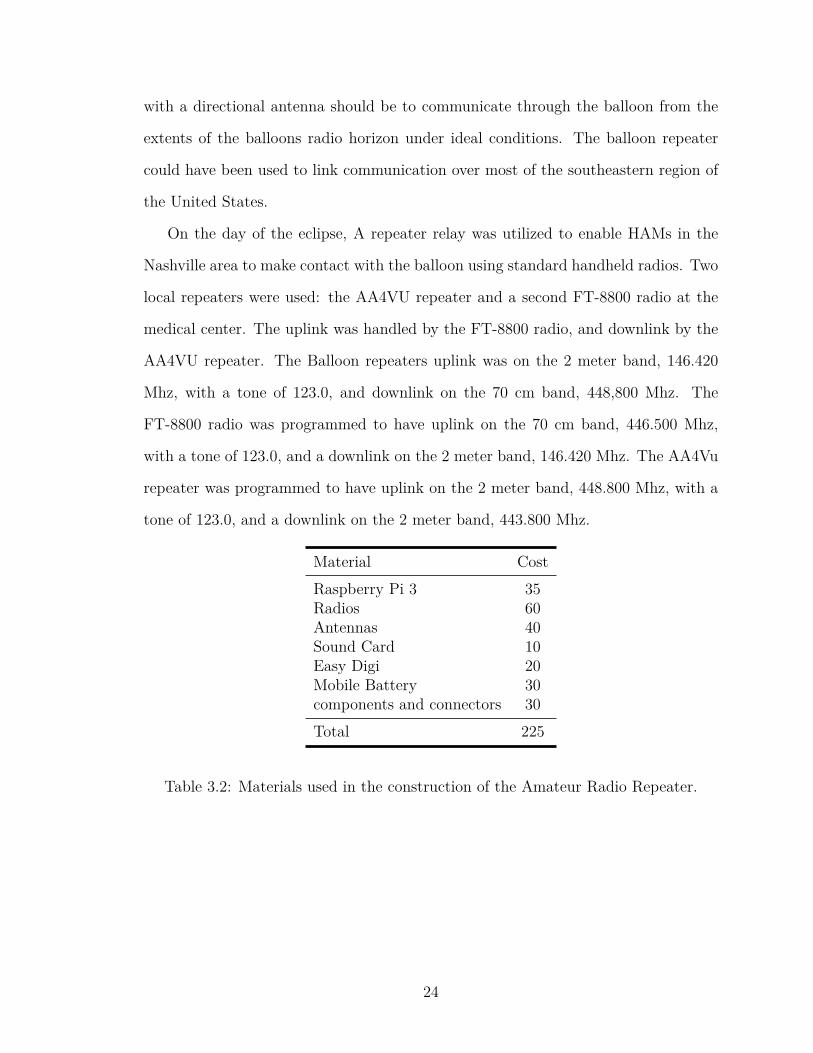
On the day of the eclipse, A repeater relay was utilized to enable HAMs in the
Nashville area to make contact with the balloon using standard handheld radios. Two
local repeaters were used: the AA4VU repeater and a second FT-8800 radio at the
medical center. The uplink was handled by the FT-8800 radio, and downlink by the
AA4VU repeater. The Balloon repeaters uplink was on the 2 meter band, 146.420
Mhz, with a tone of 123.0, and downlink on the 70 cm band, 448,800 Mhz. The
FT-8800 radio was programmed to have uplink on the 70 cm band, 446.500 Mhz,
with a tone of 123.0, and a downlink on the 2 meter band, 146.420 Mhz. The AA4Vu
repeater was programmed to have uplink on the 2 meter band, 448.800 Mhz, with a
tone of 123.0, and a downlink on the 2 meter band, 443.800 Mhz.
Material CostRaspberry Pi 3 35Radios 60Antennas 40Sound Card 10Easy Digi 20Mobile Battery 30components and connectors 30Total 225
Table 3.2: Materials used in the construction of the Amateur Radio Repeater.
24

Figure 3.7: The live video package deconstructed with major components labeled.
25

Figure 3.8: The still image package deconstructed with major components labeled.
26

Figure 3.9: The Tracksoar unit bought to replace the APRS package lost in the firsttest flight [18].
Figure 3.10: Block diagram of the components of the environmental package. Thesensors are arranged by what bus on the Raspberry Pi to which they are connected.
27

Figure 3.11: The environmental package deconstructed with major components la-beled.
Figure 3.12: Schematic of the printed circuit board that was manufactured in houseto connect the power distribution, sensors, and Raspberry Pi.
28

Figure 3.13: Block diagram of the components of the amateur radio repeater package.
Figure 3.14: Diagram of the repeater relay used to enable easy access to the balloonrepeater.
29

Figure 3.15: The calculated radio horizon of the amateur radio repeater for variousballoon altitude.
30

CHAPTER 4
SOFTWARE OVERVIEW
Large amounts of the software was developed for use in this project. The ma-
jority was written in Python. additionally, some was was written in shell script and
Arduino/C. Python is a easy to use but powerful scripting language that is widely
used in the scientific community and provides an extensive standard library. Most
of the software that was included with the standard payload was left unchanged.
The streaming software used was open source, and the software used was left to the
preferences of the individual teams.
4.1 Ground Station
Custom software written in Python run the ground station. The software inter-
faced with the 900 Mhz radio, and the pointing system. It was also responsible for
pulling telemetry data from the Aries database to locate the balloon.
First, the ground station had to know its location. The coordinates and bearing
could be determined using the Arduino or a manual input method.
The Arduino was programmed to collect data from the GPS and IMU breakout
boards, and relay them to the control computer using the UART interface. The IMU
required calibration before use. This is done by moving the IMU through multiple
orientations. The calibration variables are written to EEPROM so that they can be
used after a reboot.
An EEPROM clear software was included. If the Arduino was malfunctioning,
the EEPROM values can be cleared and the IMU recalibrate
The telemetry data from the Iridium Modem was downloaded from a database,
Aries, set up by the Montana Space Grant Consortium. However, The system could
31

be easily configured to receive telemetry data from other sources.
The system used the law of haversines to determine the heading from the ground
station to the balloon. Then, the servo motors were commanded to move to the
appropriate heading.
The system does account for the the servo limits. So, the antenna array doesn’t
attempt to rotate around the opposite direction but doesn’t utilize the IMU for feed-
back control of the servos. The feedback came from potentiometers on the servos.
4.1.1 Video Streaming Computer
Two options for streaming were recommended. One utilized OBS screen capture
software to stream. The other option used FFmpeg, a free software used to record,
transcode, and stream. FFmpeg would run faster due to the lack of a GUI. However,
It was decided to use the OBS stream capture option. The GUI would provide a quick
visual check of the stream quality. Also the GUI would provide a way for spectators
to watch the stream during the event.
The OBS streaming system used VLC media player to open a network stream.
The VLC is directed to the IP address of the Raspberry Pi, 192.168.1.3, and the
socket, 8554. Then OBS is configured capture the VLC window and steam it to the
stream.live page. The VLC screen was used as a viewing platform for spectators.
Video streaming is an CPU and network intensive program. So, it was determined
that separate computers would be used for tracking and streaming for a more robust
operation. When attempting to stream to a public website, it is strongly recom-
mended that the streaming computer has access to hard line Internet. Additionally,
the computer is recommended to have at least an Intel i7 or equivalent processor.
The computer used during eclipse day had a i7-7700 with 16 GB of RAM.
When streaming with low signal strength, the stream will be at a low frame rate
and can occasionally drop out. To restore the stream, the antenna should be pointed
32

to obtain a higher signal strength. Then, the network stream can be reopened.
4.2 Packages
Most of the packages relied on Raspberry Pi single board computers for control
and data logging. All of the custom scripting for the packages was written in Python.
4.2.1 APRS unit
The TrackSoar unit ran open source code written in Arduino/C. The original code
didn’t support multiple pathing modes. So, the source code was modified to provide
switching between two different modes based upon altitude. If the unit dropped below
2500 feet, the unit would transmit in ”low” mode. Digipeating would be enabled so
the unit could be easily found. If the unit rose above 3000 feet or was reporting
an altitude of zero, the unit would transmit in ”high” mode. Digipeating would be
disabled to prevent causing interference. The zero condition prevented the unit from
balloon from being stuck in ”low” mode in the case of the gps unit failing to achieve
a lock. The 500 foot difference in switching altitudes prevented noise from the gps
unit from continually switching the mode in the 2000-3000 foot range in altitude.
A simple if statement was used to change a boolean based upon altitude, Listing
1. The boolean switched the constructor for the broadcast message, Listing 2.
If the TrackSoar unit was configured to not to digipeat it’s broadcasts, it broadcast
with a WIDE2-1 identifier. If it was configured to digipeat, it broadcast with a
WIDE2-2 identifier.
1 i f ( gps_a l t i tude == 0 | | gps_a l t i tude > DIGI_ALTITUDE_SWITCH_HIGH)
2 gps_lowAltitudeMode = f a l s e ;
3 e l s e i f ( gps_a l t i tude < DIGI_ALTITUDE_SWITCH_LOW)
4 gps_lowAltitudeMode = true ; //end_VUARC
Listing 4.1: If statemet to provide altitude switching
33

1 //VUARC: Two a l t e r n a t e headers are used f o r the two a l t i t u d e modes
2 // Alte rnate s_address s t ruc t , ” addressesLow ” , enab l e s WIDE2−1 hop
3 const s t r u c t s_address addressesLow [ ] = {
4 {D_CALLSIGN, D_CALLSIGN_ID} , // Des t inat i on c a l l s i g n
5 {S_CALLSIGN, S_CALLSIGN_ID} , // Source c a l l s i g n (−11 = bal loon , −9 =
car )
6 #i f d e f DIGI_PATH1
7 {DIGI_PATH1, DIGI_PATH1_TTL} , // Dig i1 ( f i r s t d i g i in the chain )
8 #e n d i f
9 #i f d e f DIGI_PATH2
10 {DIGI_PATH2, DIGI_PATH2_TTL} , // Dig i2 ( second d i g i in the chain )
11 #e n d i f
12 } ;
Listing 4.2: construction of the broadcast message depends on the selected mode.
4.2.2 Environmental Package
The Pi runs through a simple Python Script to access each one of the sensors and
log each one of the values into a CSV file, Listing 3. The file can then be downloaded
through file transfer protocols.
Adafruit provides python libraries that manage communications with their sen-
sors. The libraries simplify the communication, abstracting sending commands and
receiving data ofter the interface.
The K-30 sensor doesn’t come with the same packages. It makes use of the
Raspberry Pi serial package to manage writing bits directly to the serial bus. The
request for a reading is sent to the sensor and the response is read and parsed into a
readable value using byte manipulation.
1 #imports from a l l o f the three examples ( not sure i f i need to put in
the appropr ia te d i r e c t o r i e s or not
2 from Adafruit_SHT31 import ∗
34

3 import Adafruit_BMP .BMP085 as BMP085
4 import Adafruit_MCP9808 . MCP9808 as MCP9808
5 import Adafruit_GPIO
6 from Adafruit_MAX31856 import MAX31856 as MAX31856
7 #imports f o r the k−30 senso r
8 import s e r i a l
9
10 #gene ra l imports
11 import time
12 import datet ime
13
14 #c r e a t i n g a l l th ree i n s t a n c e s o f a s enso r
15 SHTSensor = SHT31( address = 0x44 )
16 BMPSensor = BMP085 .BMP085( )
17 MCPSensor = MCP9808 . MCP9808( )
18 # Raspberry Pi hardware SPI c o n f i g u r a t i o n f o r the MAX31856
19 SPI_PORT = 0
20 SPI_DEVICE = 0
21 MAXSensor = MAX31856( hardware_spi=Adafruit_GPIO . SPI . SpiDev (SPI_PORT,
SPI_DEVICE) )
22
23 #c r e a t i n g the s e r i a l bus f o r the k−30 senso r
24 s e r = s e r i a l . S e r i a l ( ”/dev/ttyAMA0” , baudrate = 9600 , t imeout = . 5 )
25 s e r . f l u sh Input ( )
26 time . s l e e p (1 )
27
28 #conver t s temp C to temp F
29 de f c_to_f ( c ) :
30 re turn c ∗ 9 .0 / 5 .0 + 32 .0
31
32 #p u l l s in the s t a tu s o f the SHT31 senso r
33 de f pr in t_status ( ) :
34 s t a tu s = senso r . read_status ( )
35

35 i s_data_crc_error = SHTSensor . i s_data_crc_error ( )
36 is_command_error = SHTSensor . is_command_error ( )
37 i s_re se t_detec ted = SHTSensor . i s_rese t_detec ted ( )
38 i s_track ing_temperature_alert = SHTSensor .
i s_track ing_temperature_alert ( )
39 i s_tracking_humidity_alert = SHTSensor . i s_tracking_humidity_alert ( )
40 i s_heater_act ive = SHTSensor . i s_heater_act ive ( )
41 i s_alert_pending = SHTSensor . i s_alert_pending ( )
42 pr in t ’ Status = {:04X} ’ . format ( s t a tu s )
43 pr in t ’ Data CRC Error = {} ’ . format ( is_data_crc_error )
44 pr in t ’ Command Error = {} ’ . format ( is_command_error )
45 pr in t ’ Reset Detected = {} ’ . format ( i s_rese t_detec ted )
46 pr in t ’ Tracking Temp = {} ’ . format ( i s_track ing_temperature_alert )
47 pr in t ’ Tracking RH = {} ’ . format ( i s_tracking_humidity_alert )
48 pr in t ’ Heater Active = {} ’ . format ( i s_heater_act ive )
49 pr in t ’ Ale r t Pending = {} ’ . format ( i s_alert_pending )
50
51 # You can a l s o o p t i o n a l l y change the BMP085 mode to one o f
BMP085_ULTRALOWPOWER,
52 # BMP085_STANDARD, BMP085_HIGHRES, or BMP085_ULTRAHIGHRES. See the
BMP085
53 # datasheet f o r more d e t a i l s on the meanings o f each mode ( accuracy and
power
54 # consumption are p r imar i l y the d i f f e r e n c e s ) . The d e f a u l t mode i s
STANDARD.
55 #BMPSensor = BMP085 .BMP085(mode=BMP085 .BMP085_ULTRAHIGHRES)
56
57 # read ing in the data from a l l th ree s e n s o r s
58
59 #i n i t i a l i z e s the MCP9808 Sensor
60 MCPSensor . begin ( )
61 date_stamp = datet ime . datet ime . now ( ) . s t r f t i m e ( ”%m_%d_%y_%H_%M_%S” )
62 f = open ( ’ data_ ’ + date_stamp + ’ . txt ’ , ’w ’ )
36

63 f . wr i t e ( ’ time , temp SHT ( C e l s i u s ) , temp MCP ( C e l s i u s ) , temp BMP ( C e l s i u s
) , Theremocouple temp ( C e l s i u s ) , Cold Junct ion Temp ( C e l s i u s ) ,
humidity (%) , p r e s su r e (Pa) , a l t i t u d e (m) , s e a l e v e l p r e s su r e (Pa) ,
CO2 (ppm) \n ’ )
64
65
66 # Loop p r i n t i n g measurements every second .
67 pr in t ( ’ Press Ctrl−C to qu i t . ’ )
68 whi le True :
69 #data from the SHT31 senso r
70 SHTtempC = SHTSensor . read_temperature ( )
71 SHThumidity = SHTSensor . read_humidity ( )
72 #data from the MCP9809 senso r
73 MCPtempC = MCPSensor . readTempC ( )
74 #data from the BMP180 senso r
75 BMPtempC = BMPSensor . read_temperature ( )
76 BMPpressure = BMPSensor . read_pressure ( )
77 BMPaltitude = BMPSensor . r ead_al t i tude ( )
78 BMPsealevel = BMPSensor . r ead_sea l eve l_pres sure ( )
79 #data from the k−30 senso r
80 s e r . f l u sh Input ( )
81 s e r . wr i t e ( ”\xFE\x44\x00\x08\x02\x9F\x25” )
82 time . s l e e p ( . 5 )
83 re sp = s e r . read (7 )
84 high = ord ( resp [ 3 ] )
85 low = ord ( resp [ 4 ] )
86 co2 = ( high ∗256) + low
87 #Data from the MAX31856
88 MAXTemp = MAXSensor . read_temp_c ( )
89 MAXInternal = MAXSensor . read_internal_temp_c ( )
90 #cr e a t e a time stamp f o r l ogg ing purposes
91 #needs to be adapted f o r some s o r t o f r e a l time c l o ck or
92 #comp c y c l e counter
37

93 time_stamp = datet ime . datet ime . now ( ) . s t r f t i m e ( ”%H:%M:%S” )
94 #pr in t ( ’ Temperature = { 0 : 0 . 2 f } ∗C , { 1 : 0 . 2 f } ∗C, { 2 : 0 . 2 f } ∗C ’ . format (
SHTtempC, MCPtempC, BMPtempC) )
95 pr in t ( time_stamp )
96 pr in t ( ’ Temperature SHT = { 0 : 0 . 2 f } ∗C ’ . format (SHTtempC) )
97 pr in t ( ’ Temperature MCP = { 0 : 0 . 2 f } ∗C ’ . format (MCPtempC) )
98 pr in t ( ’ Temperature BMP = { 0 : 0 . 2 f } ∗C ’ . format (BMPtempC) )
99 pr in t ( ’ Thermocouple Temperature MAX = { 0 : 0 . 3F}∗C ’ . format (MAXTemp) )
100 pr in t ( ’ I n t e r n a l Temperature MAX = { 0 : 0 . 3F}∗C ’ . format ( MAXInternal ) )
101 pr in t ( ’ Humidity = { 0 : 0 . 2 f } %’ . format ( SHThumidity ) )
102 pr in t ( ’ Pres sure = { 0 : 0 . 2 f } Pa ’ . format ( BMPpressure ) )
103 pr in t ( ’ A l t i tude = { 0 : 0 . 2 f } m’ . format ( BMPaltitude ) )
104 pr in t ( ’ S e a l e v e l Pres sure = { 0 : 0 . 2 f } Pa ’ . format ( BMPsealevel ) )
105 pr in t ( ”CO2 = ” + s t r ( co2 ) )
106 pr in t ( ’ ’ )
107 f . wr i t e ( time_stamp + ” , ” + s t r (SHTtempC) + ” , ” + s t r (MCPtempC) + ” ,
” + s t r (BMPtempC) + ” , ” + s t r (MAXTemp) + ” , ” + s t r ( MAXInternal ) + ”
, ” + s t r ( SHThumidity ) + ” , ” + s t r ( BMPpressure ) + ” , ” + s t r (
BMPaltitude ) + ” , ” + s t r ( BMPsealevel ) + ” , ” + s t r ( co2 ) + ”\n” )
108 time . s l e e p ( 0 . 5 )
Listing 4.3: Environmental pack main python script
38

CHAPTER 5
LAUNCH LOGISTICS
Considerable logistical challenges had to be considered when picking a locations
for the practice and eclipse flights. It was determined that all launches would be con-
ducted in the same location so that the team could be familiarized with the location.
For this project, three locations have to be selected. The first is a location for the
ground station, the second is a location for the balloon launch, and the third is the
landing location of the balloon.
The ground station had to have access to hardline Internet, and reliable power.
It was not advised to use any form of wireless Internet due to anticipated demand on
the day of the eclipse.
The launch location for the balloon needed to be relatively open and flat. Other-
wise, the balloon might pop itself on tree branches or buildings.
The landing location also had to be considered. Launching to far east would
result in the balloon landing in the rugged terrain on the eastern portion of the state.
Additionally, the location had to be accessible to volunteers to launch the balloon
with enough space and parking.
The video streaming system had a max range of 30 miles. So during the eclipse,
the video streaming package had to be no more than 30 miles distant from the ground
station. The 30 mile limit was a line of sight distance not juse a projection along the
ground.
To accommodate all of these requirements, it was decided that both the launch
and the ground station would be placed on the 25th Avenue Parking garage. The top
floor of the garage is open to the sky and high enough that the balloon shouldn’t have
collided into any other buildings. Also, power was readily available, and Vanderbilt’s
39

wireless network was accessible from the garage. Later, hard line access was routed
up to the top floor of the garage. The large open space on the top floor was able
to host a large number of guests and reporters for all of the launches, and provided
an above ground level view of the eclipse that was hard to rival. With the two test
flights, It was shown that the video streaming doesn’t exceed its maximum range for
at least an hour and a half after launch. A stream was maintained while the balloon
was 65,000 feet over Old Hickory Lake. It was thought that people would be more
likely to volunteer if helping provided an excellent viewing location with room for
their families.
40

CHAPTER 6
FIRST TEST FLIGHT
The June 20th first test flight was the Vanderbilt Eclipse Ballooning Teams first
test flight. The flight revealed multiple issues and inefficiencies in the package prepa-
ration and launch process. The goal was to have the balloon in the air by 12:40
PM.
The Microhunt 2 meter beacon, Iridium tracker, live video system, still image
system, environmental package, and APRS tracker were flown. The balloon reached a
maximum altitude of 27,107 meters above sea level. The balloon traveled an estimated
71.8 km 74 degrees east from the launch point on 25th Avenue parking garage to
land in Riddleton, TN, Figure 6.1. The balloon and most packages were lodged
approximately 15 meters in a oak tree in a horse pasture.
Figure 6.1: The flight path of the balloon during the second test flight on June 20th,2017. The balloon landed in Riddleton, TN.
The APRS disconnected at altitude and was lost in the woods north of Lebanon,
41

Figure 6.2. An attempt to find the package by listening for broadcasts and following
the maximum signal strength was made. However, no broadcasts from the APRS
packet were heard. The APRS package was replaced with a Tracksoar APRS unit for
future flights.
Figure 6.2: The two flight paths of the balloon and the lost APRS package.
The remaining packages that landed together in the tree were beyond recovery
without specialized equipment. The tree in question was road accessible. Therefore,
Vanderbilt Plant Operations lent the use of a bucket truck to recover the packages.
The video system failed completely for unknown reasons. The failure mode was
not able to be replicated on the ground. So, all the batteries were charged fully and
connections rechecked before future flights. It is hypothesized that the batteries ran
out on the ground.
The still image system took only green pictures. The issue was intermittent,
vanishing on the ground and turning green at altitude. It was theorized that the cold
environment was responsible So a series of environmental tests were made post launch
to determine the cause. While being cycled from room temperature to -60 degrees
42

Celsius, the images taken by the package were not green.
Contacting the national organizing group about the issues reveled that the issue
was a common intermittent issue. It was presumed that the cause was the python
script accessing the camera before it had completed its ”wake up time”. So, a delay
was added between creating the camera object and taking a picture.
The environmental package worked for some of the flight. The data reveled that
the system functioned around 3000 to 5000 meters above sea level, and again between
7000-9000 meters above see level. It was theorized that the enclosure didn’t pro-
vide adequate support and insulation to the batteries to insure consistent operation.
Therefore, after the eclipse a new enclosure was designed that completely isolated
the batteries from the environment. Then, testing was preformed in a environmental
chamber cycling down to -60 degrees C to insure that the new enclosure functioned
properly. The testing reveled that the temperature sensors were to close to the power
sources to give accurate temperature measurements. A thermocouple amplifier and
Type K thermocouple was added to the system. The thermocouple could be laid out
away from all sources of heat inside the package, and a wider temperature range than
semiconductor transducers. Therefore, it had the potential to be much more accurate
than any other sensor on the package.
The Iridium tracker worked flawlessly, continually sending telemetry updates for
a full day after the launch. However, the antenna pointing program proved to be
unreliable updating location.
The preparation for the first test launch took hours longer than expected due to a
lack of experience and too many tasks to complete. For future launches, It was deter-
mined that each package would be prepared to a much more ”launch ready” state. So,
the packages only needed to have batteries added and functionality checked prior to
launch. In addition, each package would have an companioning ”Standard Operating
Procedure” that would instruct workers through properly turning on, testing, and
43

hooking up of each package and the ground station. Therefore, even new volunteers
had a clear set of instructions at all times. The complete set of Standard Operating
procedures can be found in Appendix A.
44

CHAPTER 7
SECOND TEST FLIGHT
The second eclipse flight took place on August 8th, 2017. The balloon rose to a
maximum altitude of 28,806 meters before falling back to earth, Figure 7.2. It traveled
57.74 kilometers 94 degrees east from the launch point on 25th Avenue parking garage,
Figure 7.1. The balloon and all packages landed an estimated 24 meters high in a
stand of young hickory trees.
Figure 7.1: The flight path of the balloon during the second test flight on August8th, 2017. The balloon landed in Watertown, TN.
The microhunt 2 meter beacon, Iridium tracker, live video system, still image sys-
tem, environmental package, amateur radio repeater, and APRS tracker were flown.
All of the packages functioned much better than the previous test flight. Video
streaming was maintained for an estimated 25-30 miles during the launch. Streaming
was maintained up to 65,000 feet over Old Hickory Lake. The camera was angled to
high for much of the flight, filming the atmosphere more than the horizon.
45

Figure 7.2: Video Still from the max altitude that the balloon reached. The Imagewas taken right after the balloon ruptured.
The amateur radio repeater functioned for the whole launch. The repeater ac-
cidentally had the same down link and tone as a repeater in Cincinnati, OH. At a
sufficient altitude, the balloon communications were being relayed through the re-
peater in Cincinnati. The owner of the repeater contacted the team after hearing
large amounts of unusual traffic relayed through his repeater.
Unfortunately, the stand the balloon landed in had no easy road access. So, a
bucket truck was out of the question. First, an attempt was made to pull down the
balloon packages by tossing a line around or through the rigging. A majority of the
attempts left the lead line tangled in the branches as well. Through this method, the
bottom three packages were recovered. The rest of the packages had to be recovered
by hiring a professional arborist scale the trees with safety harness and cut down
the entangling branches. Unfortunately the parachute and microhunt beacon crossed
property lines and would have cost more to recover than replace. So, both were
replaced before the eclipse.
46

CHAPTER 8
ECLIPSE FLIGHT
The total solar eclipse occurred on August 21st, 2017 around 1:30 PM. The goal
was to launch the balloon by 12:40 to allow the balloon to experience the eclipse
around 65,000 feet.
Unfortunately, the first inflated balloon broke free of its mooring during a high
gust of wind. A second balloon was rapidly rigged and launch. The balloon was
40,000 feet lowed than hoped for the eclipse.
Video Streaming was maintained for the eclipse except for the 2 minutes of to-
tality on the parking garage. The break was to allow volunteers to enjoy the eclipse
because the ground station was manually pointed. Some footage of the eclipse ap-
proaching Nashville from an estimated 7500-8000 meters was recovered, Figure 8.1.
Unfortunately, an unidentified bug in the code from the last software update pre-
vented the video system from saving video at the same time that it was streaming.
So full resolution video from the eclipse was not available Locally recorded video from
the streaming computer caught a portion of the event from the balloons perspective.
The balloon reached a maximum altitude of 22,276 meters and flew 61.13 kilome-
ters 101 degrees east from the 25th Avenue parking garage launch location, Figure
8.2. It landed an estimated 6 meters in a tree in Statesville, TN.
The angled downward camera managed to perfectly capture the ground, horizon,
and atmosphere from high altitude, Figure 8.3.
The microhunt 2 meter beacon, Iridium tracker, live video system, still image sys-
tem, environmental package, amateur radio repeater, and APRS tracker were flown.
The amateur radio repeater functioned flawlessly through the whole test flight.
HAMs could check in to the repeater from as far away as Cincinnati, OH.
47

Figure 8.1: Image taken by the balloon at 7500-8000 meters as totality came intoNashville.
All packages were recovered with the help of the Dekalb County Amateur Radio
Club, and the recovery effort was coordinated by Tom Delker.
48

Figure 8.2: The flight path of the balloon during the second test flight on August21st, 2017. The balloon landed in Statesville, TN.
Figure 8.3: Image taken by the balloon at 22,000 meters, near the maximum altitudeof the eclipse flight.
49

CHAPTER 9
LESSONS LEARNED AND FUTURE IMPROVEMENTS
During the balloon flights leading up to and during the eclipse, several weaknesses
of the payloads became apparent. Some of the issues could be corrected by optimizing
the teams procedure. However, time and budget to make the proposed changes was
not available. So, some modifications and additions to the hardware is recommended
for future uses. So, a list of lessons learned and improvements are listed to incorporate
into future launches.
The still image system continuously failed. First, the 900Mhz radio continuously
failed to connect. In contrast the Ubiquity 5.8Ghz Rocket Modems on the live video
system connected every time. Ubiquity also created a 900Mhz Rocket Modem. It is
recommended that the RFD radios be replaced for a Ubiquity 900 Mhz modem to
see if it would be more reliable.
The Raspberry Pi Zero W used in the Environmental Package functioned flaw-
lessly and used significantly less power than the Raspberry Pi 3. More Raspberry Pi
Zero Ws could be utilized to add more cameras in different directions (Eg. Upward
facing, Downward facing, and outward facing). The wireless capabilities of the Zero
could be used to create an in air network to expand the telemetry capabilities of the
balloon.
When manually pointing the ground station, a signal strength indicator was used
on the Ubiquity Rocket M5 modem to adjust the antenna. The antenna would be
moved in small circles until the signal strength was maximized. It was proposed that
if the signal strength could be reported to the base station computer, the computer
could use the signal strength in a closed loop controller to maintain the best signal
quality.
50
The servos and frame used to tilt the antennas on the ground station had a
large amount of flex and backlash. Additionally, the servos had to continuously be
powered to prevent the antenna away from moving or balancing the system. It might
be beneficial to experiment with a lead screw and gearing to prevent back driving
of the system, or balancing the antenna array. The structure would flex under the
torque of the antenna.
After the first test flight, it was determined that having one or two people with
knowledge of anyone system was a severe bottleneck in the preflight preparation.
Standard Operating Procedures, SOPs, for each of the system were written.The SOPs
led the reader through step by step instructions for each major component from
installing batteries, turning them on, and hooking them to the rest of the package
stack, Appendix A. So, new volunteers could be up to speed in a brief amount of
time. These documents greatly sped up preflight preparations.
A SOP for the still image system was not complete written, because the radios
included with the package never connected during a launch. So, feedback about the
functionality of the package wasn’t possible.
The Upper Tropospheric winds was the major driving factor for the balloons move-
ment in middle Tennessee. All three flights generally drifted eastward, Figure 9.1.
The eastward drift ended when the balloon rose into the Stratosphere and resumed
when the balloon descended back into the Troposphere.
All of the balloon flights ended up in trees. Middle and eastern Tennessee are
largely forested and often rugged terrain. When launching in the area, prepare for a
tree landing. When the balloon lands in a tree, the rigging lines tangle around the
branches, and the balloon can be suspended across many trees. To reliably recover
all the packages, specialized tools and equipment are a must have, and sometimes
professional help is needed.
The tool best suited for getting them down is the pneumatic ball launcher. The
51

Figure 9.1: Comparison of the flight paths of the two test flights and the eclipse flight.
system can be pressurized on location by a portable air compressor. Then, a weighted
ball can by fired over or through the rigging lines of the balloon trailing a light line.
The light line can be used to pull up a more robust cord, and the cord used to pull
some of the packages out of the tree. Due to rigging strength restrictions, It is likely
the packages will fragment, and will require many successful attempts to pull all the
packages out of the tree.
Large telescoping poles can be very useful if the package is relatively low in the
tree. If the package is to high, the pole will be unwieldy and be much more difficult
to use.
If all else fails, local arborist and tree trimmers can be helpful to recovering all of
the packages. They can get into areas without road access, and trim only the required
branches. However, it is an expensive option and requires local contacts.
It is possible that the balloon will land in remote regions. When going to re-
trieve the balloon, make sure that communication is arranged beforehand. A specific
frequency or HAM repeater can keep recovery teams in contact could prevent con-
52

fusion and waisted time. In addition, downloaded or printed maps of the area with
suspected GPS coordinates of the balloon marked are must haves. GPS on smart
phones will still function without cell signal, but maps will be unable to be down-
loaded. A working knowledge of UTM coordinates would be helpful in finding the
balloon.
A single balloon launch can represent a significant investment in time and money.
Try to keep the number of risks to a minimum use as many known and temperature
robust components as possible Additionally, Keep code complexity down so that the
number of bugs that develop during flight is to a minimum
Ground testing and dry runs are very important to verify the functionality of
equipment without expending consumable materials. Even though ballooning is low
cost. It can be a significant investment in time. Unconsidered complications and
unplanned steps can disrupt a launch. Additionally, a majority of the hardware used
for balloon launch usually isn’t designed for high altitude operation. A little testing
and preparation can prevent a launch from being unsuccessful.
Being able to verify that all packages are functioning correctly prior to launch is
preferable, and can save the flight from being a failure. The check can be easily ac-
complished by having wireless access to the package. The package can be programed
to automatically connect to a wireless service or broadcast a service that can be con-
nected to from a laptop. Then, the list of process or the status of log files can be
checked. Visual feedback can also be used to verify operation. Visual feedback can
come in the form of status LEDs or screens.
If wireless telemetry is going to be attempted in flight, insure that the destination
is recieving packets before releasing the balloon. For example, It was discovered that
the live video package had a loose connection before launch on eclipse day. The stream
was checked and found to be blank. The package was disassembled and reassembled
to fix the issue.
53

CHAPTER 10
CONCLUSIONS
The Eclipse Ballooning project was truly a multi discipline project. Components
of electrical, computer, and mechanical engineering were present along with physics
and environmental science.
Most of the python code for the systems were multi-threaded Pythons memory
management module isn’t thread safe. So some of the issues of the system might have
been due to different threads not relinquishing resources when it was requested. This
is a possible explanation to some of the issues that the system was exhibiting during
the project. However it is far from a certainty
54

BIBLIOGRAPHY
[1] Lowe, R. High Altitude Ballooning code for the Raspberry Pi and Sense HAT.https://github.com/pngwen/habpi
[2] National Weather Service Radiosonde Observations.https://www.weather.gov/gjt/education_corner_balloon
[3] Masi, S., De Bernardis, P., De Troia, G., and et. al. (2002). The BOOMERanGexperiment and the curvature of the Universe. Progress in Particle and NuclearPhysics. 48. 243-261.
[4] Project Lune. https://x.company/loon/
[5] Gregory, D.D. , Stepp, W.E., NASA’s long duration balloon program: the lastten years and the next ten years, In Advances in Space Research, Volume 33, Issue10, 2004, Pages 1608-1612.
[6] Smith, D. and Marianne, B.S. (2017). Ballooning for Biologists: Mission Essen-tials for Flying Life Science Experiments to Near Space on NASA Large ScientificBalloons. Gravitational and Space Research. 5. 52-73.
[7] NASA’s Scientific Visualization Studio. https://svs.gsfc.nasa.gov/
[8] Eclipse Ballooning Project. http://eclipse.montana.edu/
[9] Deal, D. NGSS Lession Planning Template(Eclipses).
[10] Lawrence, L. and Hartmann, R. Total Solar Eclipse Unit.
[11] Amento, R. and Waack, L. Eclipse Unit.
[12] 2017 Solar Eclipse Streams. https://eclipse.stream.live/
[13] Part 101 - Moored Balloons, Kites, Amateur Rockets, Unmanned FreeBalloons, and Certain Model Aircraft. https://www.ecfr.gov/cgi-bin/text-idx?rgn=div5&node=14:2.0.1.3.15
[14] APRS.fi https://aprs.fi/
[15] Bruninga B. Automatic Packet Reporting System. http://www.aprs.org
[16] Smith S. H. (2016, June 16). APRS Digipeating and Path Selection 101.http://www.wa8lmf.net/DigiPaths/
[17] MicroHunt Foxhunting Transmitter. http://www.west.net/ marvin/mi-crohnt.htm
[18] Tracksoar. https://www.tracksoar.com/
55
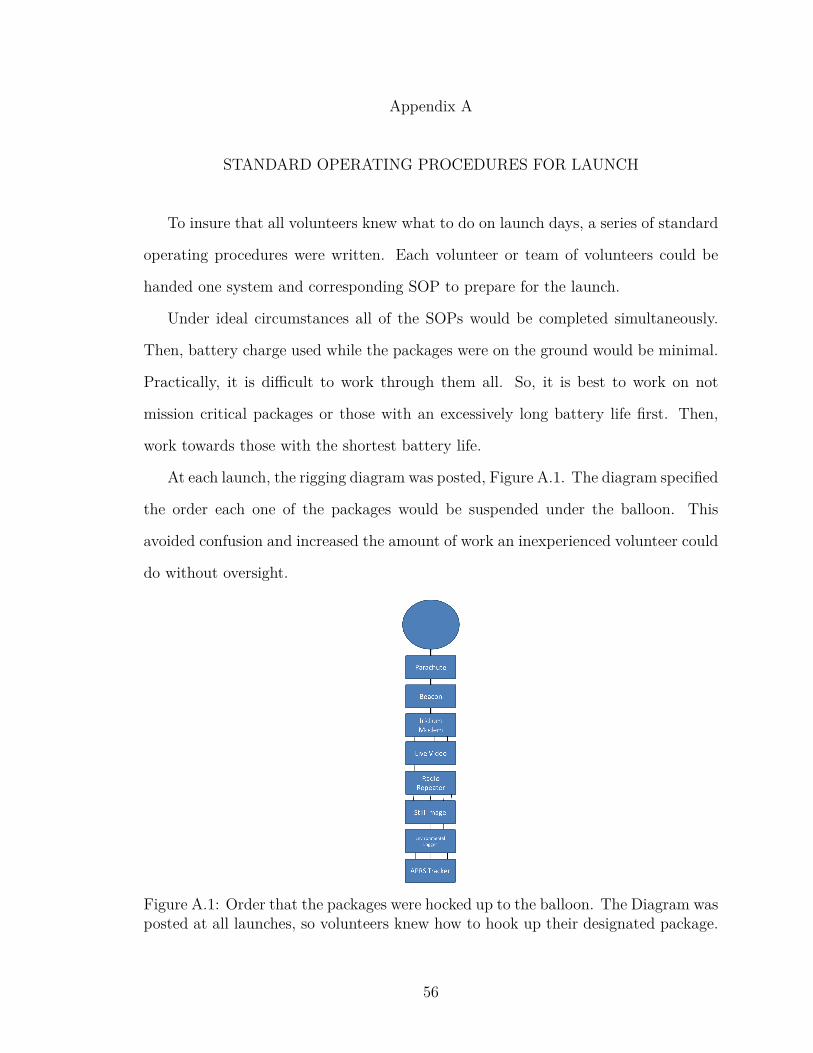
Appendix A
STANDARD OPERATING PROCEDURES FOR LAUNCH
To insure that all volunteers knew what to do on launch days, a series of standard
operating procedures were written. Each volunteer or team of volunteers could be
handed one system and corresponding SOP to prepare for the launch.
Under ideal circumstances all of the SOPs would be completed simultaneously.
Then, battery charge used while the packages were on the ground would be minimal.
Practically, it is difficult to work through them all. So, it is best to work on not
mission critical packages or those with an excessively long battery life first. Then,
work towards those with the shortest battery life.
At each launch, the rigging diagram was posted, Figure A.1. The diagram specified
the order each one of the packages would be suspended under the balloon. This
avoided confusion and increased the amount of work an inexperienced volunteer could
do without oversight.
Figure A.1: Order that the packages were hocked up to the balloon. The Diagram wasposted at all launches, so volunteers knew how to hook up their designated package.
56

A.1 Ground Station and Iridium Tracker
1. make sure that the location for the ground station has access to power. The
ground station might have to be on a separate circuit from the ground station
computers to prevent overloading the circuit.
2. Make sure that the ground station is connected according to the diagram, Figure
3.2.
3. Start up the Antenna Tracker program on the tracking computer.
4. Make sure all the ports for the devices are filled (COM ports).
5. Check that the IMEI field is filled in correctly, same IMEI number as the Iridium
modem (300234064909600).
6. Under tracking devices make sure that the Iridium box is checked.
7. Click ”Update Settings”. When the new window pops up, calibrate the IMU unit
by alternating the orientation of the IMU until the window reports 3 degrees of
freedom calibrated for all sensors. there is an alternate method to this step.
Alternative Calibration Method
1. Turn on the Servos and make sure they are both in their zero position(Antenna
pointing forward and level).
2. Pick up the antenna assembly, tripod and all. Rotate the assembly to the cardi-
nal direction the balloon is most likely to travel (most likely east for Tennessee).
3. change the option in the top middle box from ”Get local (Arduino)” to the
option corresponding to your cardinal direction.
4. Add in the GPS coordinates of the ground stations location. (these can bee
pulled from google maps).
57

5. Hit update settings.
Iridium Tracker
1. Install the battery on the Iridium tracker.
2. Insure that the tracker is powered on. Set it out in the open and make sure
that the Iridium and GPS lights on solid.
3. Go to eclipse.rci.montana.edu and insure that the tracker is listed and ac-
tive, the current location shown on the map and under the IMEI number
300234064909600.
4. Look to see if the antenna swings around to point at the package.
5. Seal up the package with zip ties and use the key rings to connect it to the
other packages according to the rigging diagram.
A.2 Still Image Package
1. Check the antenna connections to the RFD modem on the ground station and
package. Insure that the cables are routed cleanly and free of strain.
2. Plug battery into the ”M5” and ”Pi” plugs on the custom power board and
route the cables neatly.
3. Use the barrel key to turn on the package
4. Place the package in direct line to ground station antennas. Look for the lights
on the RFD 900 modem to go solid green.
5. Wait for at least two minutes. Then, use the ground station GUI to request the
most recent picture from the package.
58

6. Use Zip Ties to make sure any lose components are held solidly, and fasten on
the top of the package.
7. Use the key rings in the rigging to attach the package according to the rigging
diagram.
A.3 Video Payload
1. Make sure that the Ethernet cable from the M5 rocket modem is inserted into
the computer dedicated to streaming.
2. If using the Linux desktop, make sure the computer is connected to ”Ground
Station”. This makes sure that the IP address is static for communication with
the modem.
3. Plug batteries into the ”M5” and ”Pi” slots on the custom power board and
nest them into their layer in the package.
4. Turn the barrel key in the switch to turn on the Video Payload. and place it
in direct line of sight of the ground station.
5. Look at the signal indicator on the ground station M5 modem to make sure
there is a strong connection between the two (the indicator bar should go all
the way to the green, and the connection LED should be flashing).
6. Start up a SSH client (Bitvise on windows, Remmina or terminal on Linux)
and connect to the Raspberry Pi. (IP: 192.168.1.1 Username: pi Password:
raspberry).
7. In the terminal use the command ”ps aux | grep python” to print the list of
running processes.
8. Check to make sure there is a python process running.
59

Starting the Stream
1. Start up VLC Media Player.
2. Open up a network stream under the ”Media” Tab and enter the address
”rtsp://192.168.1.3:8554/”.
3. Make sure that live video is displayed on the network stream.
4. Start OBS. Under settings, software should be configured to stream to the URL,
”rtmp://media.stream.live/live”, and the Stream Key field should be full.
5. Under the sources, ”windows capture (Xcomposite)” should be highlighted.
6. Click the start streaming button and start recording on the lower right region
of the screen.
7. Verify that the stream is live at the streaming location.
1. Make sure that there is no lose connections or components are free to move
inside the package.
2. Use Zip ties to secure the top of the package.
3. Use the key rings to fasten the packages together according to the rigging dia-
gram.
A.4 Environmental Package
1. Put new batteries into the Battery Pack, and connect the pack to the power
board.
2. Insure that the lights are blinking on both the CO2 sensor and the Raspberry
Pi.
60

3. Pack the batteries and board into the canister and make sure the sensors are
aligned with the holes in the canister and the foam shroud is in place.
4. Use a Wi-Fi enabled computer to connect up to the network: ”EvoPack” Pass-
word: ”password”.
5. Use the computer to SSH into the Pi using software of choice (see directions
for the Video Payload). The IP: 192.168.1.1, username: ”pi”, and password:
”raspberry”.
6. Use the command ”ps aux | grep python” to check that python scripts are
running.
7. Use zip ties to fasten down the top.
8. Connect the package to the stack according to the rigging diagram.
61

Appendix B
ENVIRONMENTAL DATA
The environmental logging package took thousands of data points, one point from
each sensor approximately every second during the flight, for two flights. The first
test flight, it malfunctioned presumably due to low temperatures dropping the voltage
of the batteries. However, for the August 8th and August 21st flight it functioned
through the whole flight.
Each set of data was timestamped using the DS3231 real time clock. The time
stamp was used to relate it to the location the data was taken. This was done by
using a python script to create linear interpolation functions for a combination of the
Iridium and APRS GPS reported time, altitude, latitude, and longitude. Then the
time stamp on the data set was used to estimate the position with the interpolated
functions.
B.1 Heading
Each layer of the atmosphere can have a different wind speed and direction, and
the balloon moves with the wind during flight. So wind speeds and directions can be
inferred from the balloons flight path. As the balloon transverses multiple layers of
air, distinct changes in the movement of the balloon can be seen.
The main regions the balloon transverses are surface winds, the troposphere,
tropopause, and stratosphere. By looking at the altitude vs. longitude, the altitude
when the balloon leaves different streams of air is apparent. The balloons moved form
west to east with the movement being an order of magnitude larger than north to
south, Figure B.1 B.2.
There is three distinct changes in the direction of the balloons travel during the
62

August 8th Launch, Figure B.1. The balloon left surface winds and reentered them
around 4000 meters. The tropospheric winds blew the balloon eastward between
about 4000 and 18,000 meters. the stratospheric winds took effect over 18,000 meters.
The eclipse flight was to a lower altitude so the features of the stratosphere are not
as well defined, Figure B.2. The surface winds for the the August 21st flight are less
distinct and appear to be mostly stagnant on landing with a little bit of movement
in the latitudinal direction.
(a) (b)
Figure B.1: The (a) longitude and (b) latitude plotted against altitude for the 08/08flight. The different currents of air can be clearly seen by when the balloon changesdirection. A large majority of the balloons movement is in longitudinal directions.
(a) (b)
Figure B.2: The (a) longitude and (b) latitude plotted against altitude for the 08/21flight. The different currents of air can be clearly seen by when the balloon changesdirection. A large majority of the balloons movement is in longitudinal directions.
63

The coordinates can be used to derive the bearing and speed of the balloon using
the law of haversine. The derived curves were noisy due to the low sampling speed of
the GPSs along with GPS bounce. However, the bearing and speed from the August
8th flight shows high stratospheric winds at 10-16 km altitude, and distinct wind
bearings between different layers of the atmosphere, Figure B.3.
(a) (b)
Figure B.3: The derived wind (a) speed and (b) bearing plotted against altitude forthe 08/08 flight. The different currents of air can be clearly seen by when the balloonrises above a defined altitude.
The atmospheric features during the eclipse flight is much harder to decipher,
Figure B.4. The stratospheric winds are much slower but at approximately the same
altitude.
The ascent and descent rates was calculated from the interpolated altitude, Figure
B.5. Generally, the ascent rate during the 8th was higher then the eclipse flight. The
slow ascent rate was likely due to a slightly under inflated balloon launched during
the eclipse, due to launch complications. The ascent rate was noisy. Some of the noise
was likely due to the offset between the APRS and Iridium GPS unit. It is possible
that the higher of the two modules reported seconds before the lower. When the data
was combine, it could result in a very large apparent descent rate. The reverse of
this effect can be seen during the descent as well. During the descent, the balloon
gradually slowed down as the parachute got into thicker air. The curves follow each
64

(a) (b)
Figure B.4: The derived wind (a) speed and (b) bearing plotted against altitude forthe 08/21 flight. The different currents of air can be clearly seen by when the balloonrises above a defined altitude.
other closely during decent even though the balloon on the 8th got to a much higher
altitude. This implies that the balloons reach terminal velocity quickly.
(a) (b)
Figure B.5: The (a) ascent and (b) descent rate of the balloon derived from thealtitude data of the balloon.
The balloon generally follows the exact same bearing pattern on the ascent that
it does on the descent. It drops much faster than it rises. so, the path is mirrored
but shrunk.
65

B.2 Temperature
The temperature was measured by multiple sensors in different locations on the
environmental package, Figure B.6 B.7. The Temperature of the environment was
most accurately measured by the type k thermocouple, B.8. The transition between
the troposphere and stratosphere can be clearly seen by the transition in temperature
tends at around 16,000 meters. The other sensors were either on the interior of the
enclosure, or close to the power distribution components.
(a) (b)
Figure B.6: Temperature reported by all the sensors on board the environmentallogger during the the 08/08 test flight during (a) ascent and (b) descent.
(a) (b)
Figure B.7: Temperature reported by all the sensors on board the environmentallogger during the the 08/21 test flight during (a) ascent and (b) descent.
66

(a) (b)
Figure B.8: Comparison of the temperature measured from the Type K thermocouplefor both the 08/08 and 08/21 flights for (a) ascent and (b) descent. It can be easilyseen that the thermocouple on the 08/08 flight was lose in the socket and fell outaround 15000 meters.
The balloon had a large number of IC temperature sensors on board. All of the
temperature data collected is shown in Figure B.6. The effects of the bad connection
at the thermocouple can be seen. However, The cold junction inside the contain stayed
well within an acceptable temperature range for the whole flight. The temperature
sensors on the BMP180, SHT31, and MCP9808 stayed significantly warmer than the
environment, the proximity to the power distribution and Raspberry Pi might have
heated them above the temperature of the environment.
It was substantially colder at the tropopause during the eclipse flight than during
the August 08th flight. This could be due to some of the atmospheric cooling from
the eclipse. However, it is unknown without further verification.
The thermocouple data from the 8th had a large amount of noise due to a lose
connection. The lowest temperature experienced during the flight was around −66 C,
and the tropopause was between 15,000 and 18,000 meters, Figure B.9. Eventually
the thermocouple fell out of the terminal at around 15,000 meters during the descent,
Figure B.6.
67

Figure B.9: Temperature measured by the Type K thermocouple during the 08/08flight for ascent and descent.
B.3 Humidity
The humidity sensor between the two launches shows remarkably similar trends,
Figure B.11. However, the humidity goes to zero within the coldest region the balloon
transversed. It is doubtful that this is accurate. It is more likely an effect of the cold
temperatures. During descent both flights reported a significant gain in humidity.
This is probably an artifact of the cooling rate. As the balloon falls quickly, the
sensor reaches warmer air, and condensation could form. The most accurate data
from the humidity sensor is most likely before 10,000 meters on the ascent of the
balloon.
68

Figure B.10: Temperature measured by the Type K thermocouple during the 08/21flight for ascent and descent.
B.4 Pressure
The pressure fits what would be expected. With increasing altitude, the pressure
decreased, Figure B.14. It is almost linear within the range of the troposphere. Pres-
sure based altimeters can be accurate within this region. However, in the tropopause
the pressure decreases more exponentially. The pressure was almost exactly the same
between the two test flights.
B.5 CO2
The CO2 measured similar levels of atmospheric CO2 on both flights, Figure B.17.
However different amounts of CO2 were measured during ascent and descent, Figure
69

(a) (b)
Figure B.11: Comparison of the humidity measured from the SHT31 IC for both the08/08 and 08/21 flights for (a) ascent and (b) descent. The accuracy of the data above1000 meeter and during decent is doubtful due to the sensor being below temperaturelimits.
B.18 B.19. The sensor saturated multiple times during the the August 8th flight,
Figure B.18. The reason for the saturation is unknown.
The K-30 sensor depends on a diffusion chamber to make measurements. So,
the sensor exhibits some amount of pressure dependence that should be corrected
out. Additionally, The sensor has a measurement inertia while the diffusion process
takes place. At rapidly changing pressures and environments, the sensor shouldn’t be
determined to be accurate. So, the descent should be ignored. Most air quality sensors
are sensitive to more than one type of gas. Therefore, The changing atmospheric
composition might also add error to the measurements.
70

Figure B.12: Humidity measured during the 08/08 flight for ascent and descent.
71

Figure B.13: Humidity measured during the 08/21 flight for ascent and descent.
(a) (b)
Figure B.14: Comparison of the pressure measured from the BMP180 IC for both the08/08 and 08/21 flights for (a) ascent and (b) descent. The range of the measuredpressure is within the bounds of expected.
72

Figure B.15: Pressure measured during the 08/08 flight for ascent and descent.
73

Figure B.16: Pressure measured during the 08/21 flight for ascent and descent.
(a) (b)
Figure B.17: Comparison of the CO2 measured from the K-30 IC for both the 08/08and 08/21 flights for (a) ascent and (b) descent. The k-30 seems to have malfunctionedfor a majority of the of the 08/08 flight. The reasons are unknown However, descentdata is questionable due to the rapid rate of descent.
74

(a) (b)
Figure B.18: CO2 measured during the 08/08 flight for (a) ascent and (d) descent.
(a) (b)
Figure B.19: CO2 measured during the 08/08 flight for (a) ascent and (d) descent.
75