epsilon aurigae eclipse 2009 - ingress
TRANSCRIPT
Hopkins et al. – epsilon Aurigae Ingress
13
Epsilon Aurigae Eclipse 2009 - Ingress
Jeffrey L. Hopkins
Hopkins Phoenix Observatory
7812 West Clayton Dr., Phoenix, Arizona 85033-2439 USA
Robert E. Stencel, University of Denver, Denver, Colorado, USA
Robin Leadbeater, Three Hills Observatory, Cumbria, England
Paul J. Beckmann, Jim Beckmann Observatory, Mendota Heights, Minnesota, USA
Christian Buil, Castanet-Tolosan, France
Donald Collins, Warren Wilson College, Ashville, North Carolina, USA
Tiziano Colombo, S. Giovanni Gatano al Observatory, Pisa, Italy
Thierry Garrel, Observatoire de Foncaude, Juvignac, France
Stanley Gorodenski, Blue Hills Observatory, Dewey, Arizona USA
Snaevarr Gudmundsson, Lindarberg Observatory, Hafnarfjordur, Iceland
Thomas Karlsson, Varberg Observatory, Varberg, Sweden
Dr. Mukund Kurtadikar, Jalna Education Society Observatory, Maharashtra, India
Hans-Goran Lindberg, Kaerrbo Observatory, Skultuna, Sweden
Des Loughney, Edinburgh, Scotland, United Kingdom
Benji Mauclaire, Observatoire du Val de I'Arc, Bouches du Rhone, France
Brian E. McCandless, Grand View Observatory, Elkton, Maryland USA
Frank J. Melillo, Holtsville, New York ,USA
Richard Miles, Golden Hill Observatory, Dorset, England
Robert T. (Tom) Pearson, Virginia Beach, Virginia, USA
Gerard Samolyk, Greenfield, Wisconsin, USA
Lothar Schanne, Völklingen, Deutschland, Germany
Iakovos Marios Strikis, Elizabeth Observatory of Athens, Haldrf (Athens), Greece
François Teyssier, Yogurt Pot Observatory, Rouen, France
Olivier Thizy, Shelyak Instruments, Revel, France
Hopkins et al. – epsilon Aurigae Ingress
14
ABSTRACT
The mysterious star system epsilon Aurigae undergoes an eclipse every 27.1 years that lasts nearly two years. The most recent eclipse started during the late summer of 2009. An international campaign for observing this eclipse was created in 2006, with a web site for information and, to-date, 17 periodic newsletters for details, as well as a Yahoo forum List for immediate announcements and comments. Photometric data in the UBVRIJH bands have been submitted. Ingress occurred with first contact in the V band estimated at the second week of 2009 August and second contact estimated at 2010 mid-January. Spectroscopic data were also obtained during ingress. Spectroscopic data have been provided in the potassium I region, hydrogen alpha and beta regions and sodium D line region of the star system's spectrum. In this paper we describe details of observations and prelimi-nary analysis during ingress and second contact. We introduce the observers and discuss plans for observing throughout totality and the end of the eclipse in 2011.
1. Introduction
During the 1982-1984 eclipse of epsilon Auri-
gae, an international Campaign was started. The
Hopkins Phoenix Observatory was the focal point for
that campaign. Thirteen Newsletters were published
and distributed around the world. At the conclusion
of the campaign, a NASA-sponsored workshop was
held in Tucson, Arizona, in conjunction with the June
1985 American Astronomical Society meeting, re-
sulting in published proceedings (Stencel, 1985).
Now 27 years later, epsilon Aurigae is back in
eclipse between 2009 August and 2011 May. A new
international campaign was started in 2006. The
campaign consists of professional and advanced ama-
teur observers from around the world who have con-
tributed high-quality and valuable spectroscopic and
photometric data on the epsilon Aurigae star system.
This paper discusses the ingress and second contact
portion of the current eclipse as well as providing
information on the observers who have contributed
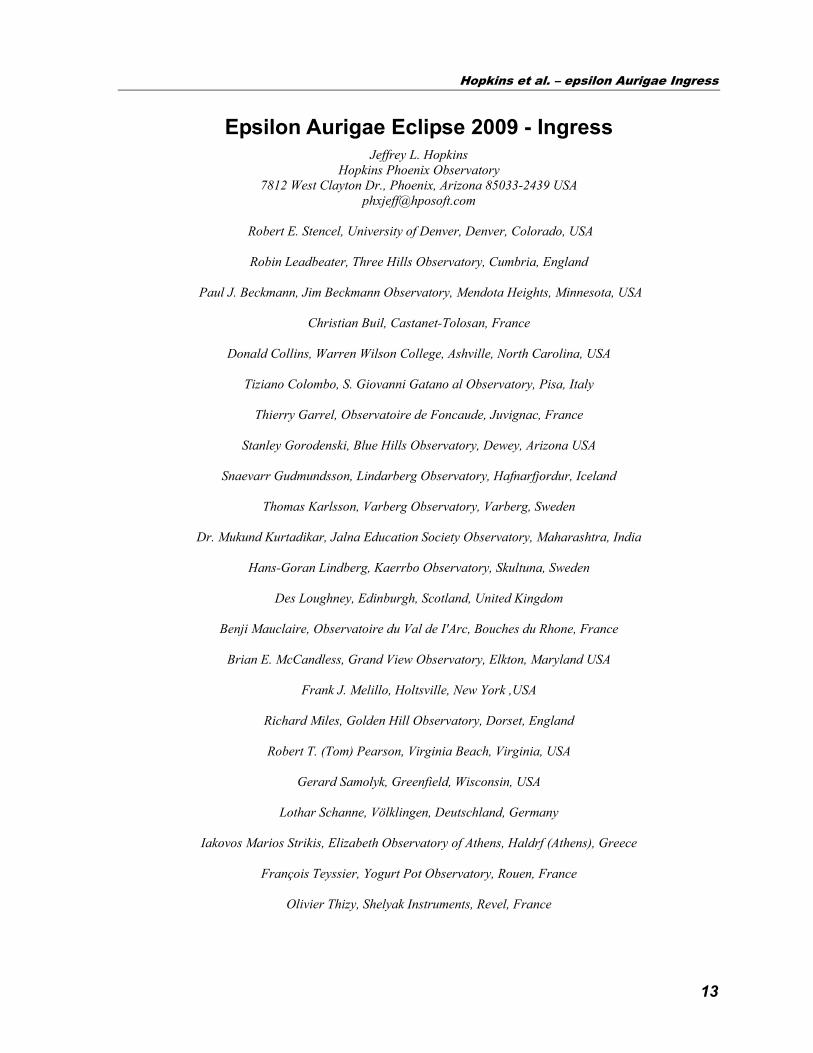
data for this period. For reference we include Figure
1 which shows a system schematic using the “High
Mass” model which was the prevailing model for
most of the 20th century.
Figure 1. Epsilon Aurigae system schematic.
2. Campaign Communication
During the previous eclipses and campaigns,
communication was limited to in-person meetings,
telephone calls and postal mail. With observers lo-
cated around the world, meetings were extremely
difficult and expensive. Telephone calls were also
expensive and not efficient for getting news to many
people. The use of postal communication was much
more efficient, but very slow. A month or more went
by between newsletters. With the advent of the Inter-
net, we now have near instantaneous communication
around the world. In addition, newsletters are created
more easily and published on the Internet in high
quality PDF format that includes data lists, diagrams,
and photographic images. These newsletters can be
downloaded by anyone. A very popular and powerful
feature of the Internet is the use of on-line forums.
People can post a message and receive comments
near instantaneously as well as sharing images and
data.
In 2006 May, the Hopkins Phoenix Observatory
created a web site devoted to epsilon Aurigae and the
current campaign. We have published 17 newsletters
for this campaign. They are available free as PDF-
format files. There is also a vast amount of reference
material on the site. In the fall of 2009, a Yahoo fo-
rum was created to allow near instantaneous commu-
nication with all those interested in the campaign and
epsilon Aurigae. The web site URL is
http://www.hposoft.com/Campaign09.html
One can sign up for the forum at
http://tech.groups.yahoo.com/EpsilonAurigae/
3. Campaign Equipment
During the 1982-1984 eclipse, personal com-
puters were just becoming available. The Internet,
affordable CCD and DSLR cameras did not yet exist,
and spectroscopy by a small observatory was unheard
of. This eclipse is benefiting from many technologi-
cal advances. Many smaller observatories are con-
tributing spectroscopic data. In addition to the single
channel photometers, e.g., PMT-based photon count-
Hopkins et al. – epsilon Aurigae Ingress
15
ers, and PIN diode-based SSP-3 and SSP-4, CCD
photometers are also making valuable contributions.
What is even more astounding are the contributions
from observers using Digital Single Lens Reflex
(DSLR) cameras, without a telescope and just
mounted on a tripod. Excellent V band data are being
provided by those using the DSLR cameras. For
spectrometry, the Lhires III spectrograph has proven
affordable and an excellent tool for the small obser-
vatory.
4. Photometric Data
Full resolution images of the following plots can
be seen on-line at the following links:
http://www.hposoft.com/Plots09/VFall09.jpg
http://www.hposoft.com/Plots09/UBFall09.jpg
http://www.hposoft.com/Plots09/RIFall09.jpg
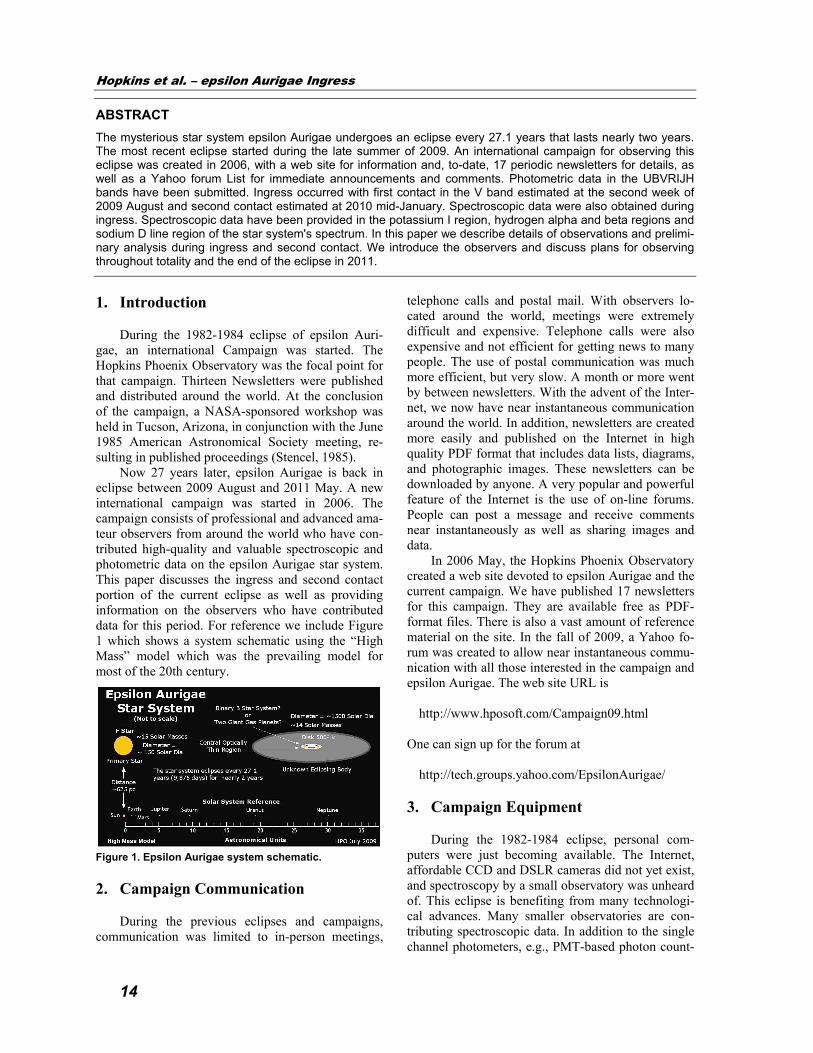
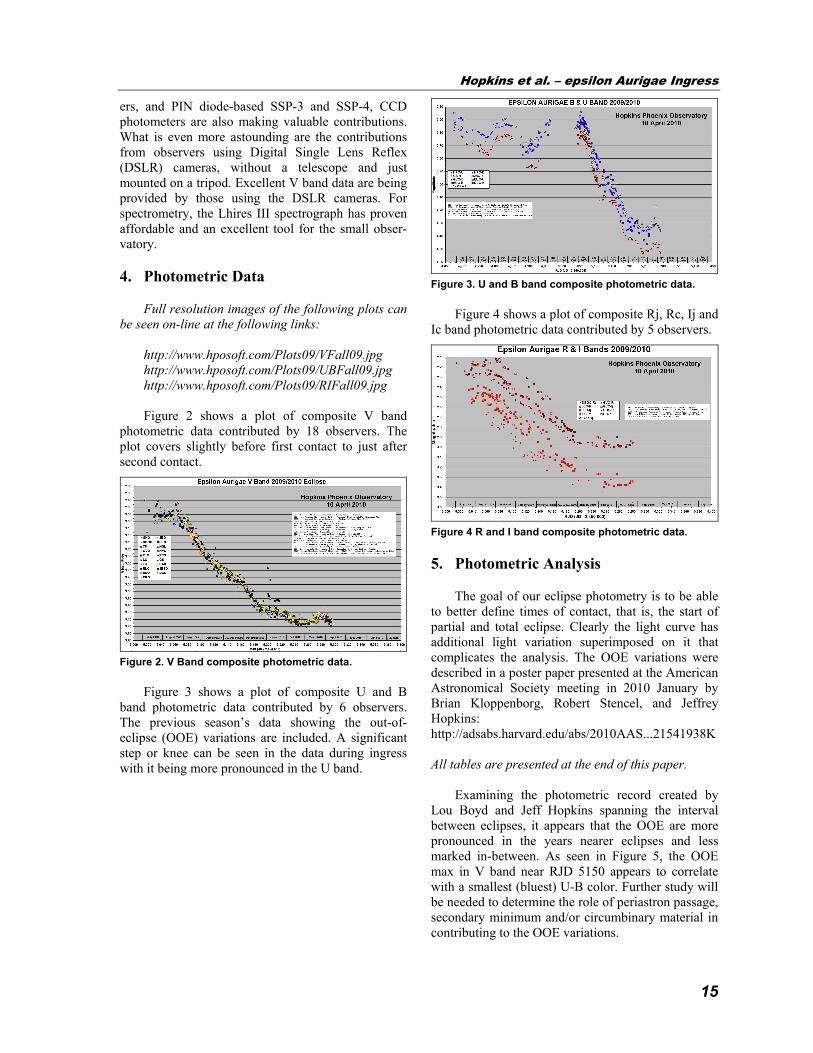
Figure 2 shows a plot of composite V band
photometric data contributed by 18 observers. The
plot covers slightly before first contact to just after
second contact.
Figure 2. V Band composite photometric data.
Figure 3 shows a plot of composite U and B
band photometric data contributed by 6 observers.
The previous season’s data showing the out-of-
eclipse (OOE) variations are included. A significant
step or knee can be seen in the data during ingress
with it being more pronounced in the U band.
Figure 3. U and B band composite photometric data.
Figure 4 shows a plot of composite Rj, Rc, Ij and
Ic band photometric data contributed by 5 observers.
Figure 4 R and I band composite photometric data.
5. Photometric Analysis
The goal of our eclipse photometry is to be able
to better define times of contact, that is, the start of
partial and total eclipse. Clearly the light curve has
additional light variation superimposed on it that
complicates the analysis. The OOE variations were
described in a poster paper presented at the American
Astronomical Society meeting in 2010 January by
Brian Kloppenborg, Robert Stencel, and Jeffrey
Hopkins:
http://adsabs.harvard.edu/abs/2010AAS...21541938K
All tables are presented at the end of this paper.
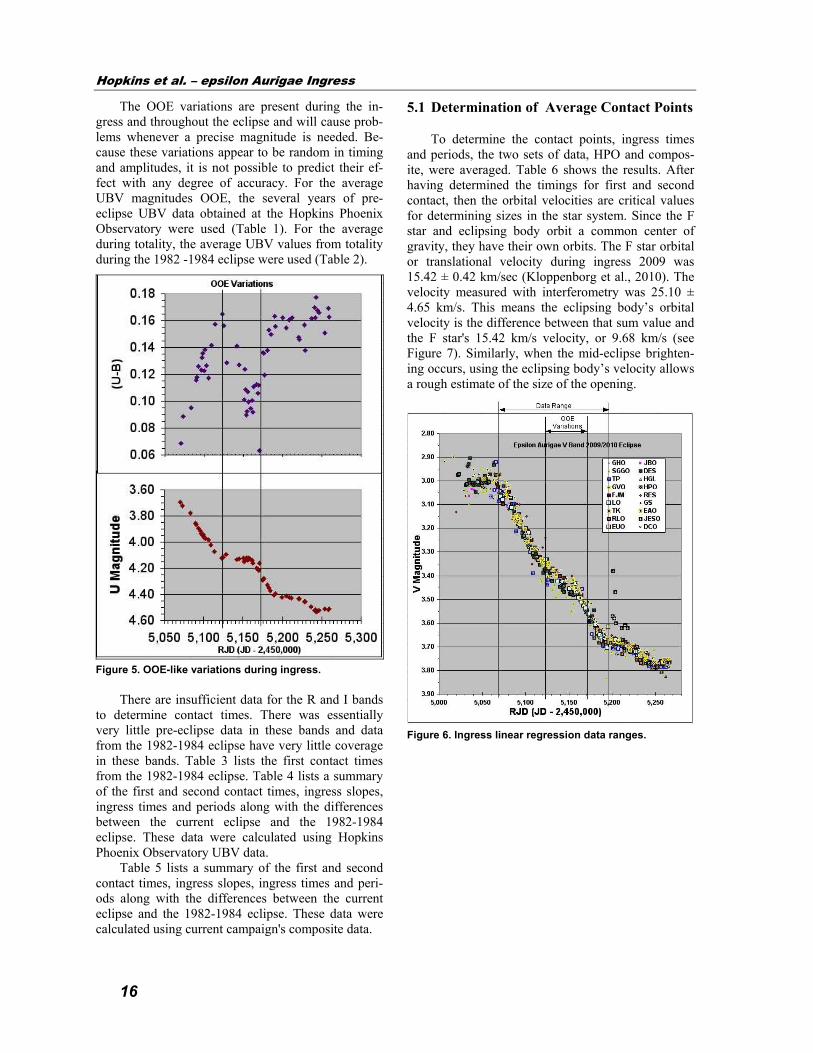
Examining the photometric record created by
Lou Boyd and Jeff Hopkins spanning the interval
between eclipses, it appears that the OOE are more
pronounced in the years nearer eclipses and less
marked in-between. As seen in Figure 5, the OOE
max in V band near RJD 5150 appears to correlate
with a smallest (bluest) U-B color. Further study will
be needed to determine the role of periastron passage,
secondary minimum and/or circumbinary material in
contributing to the OOE variations.
Hopkins et al. – epsilon Aurigae Ingress
16
The OOE variations are present during the in-
gress and throughout the eclipse and will cause prob-
lems whenever a precise magnitude is needed. Be-
cause these variations appear to be random in timing
and amplitudes, it is not possible to predict their ef-
fect with any degree of accuracy. For the average
UBV magnitudes OOE, the several years of pre-
eclipse UBV data obtained at the Hopkins Phoenix
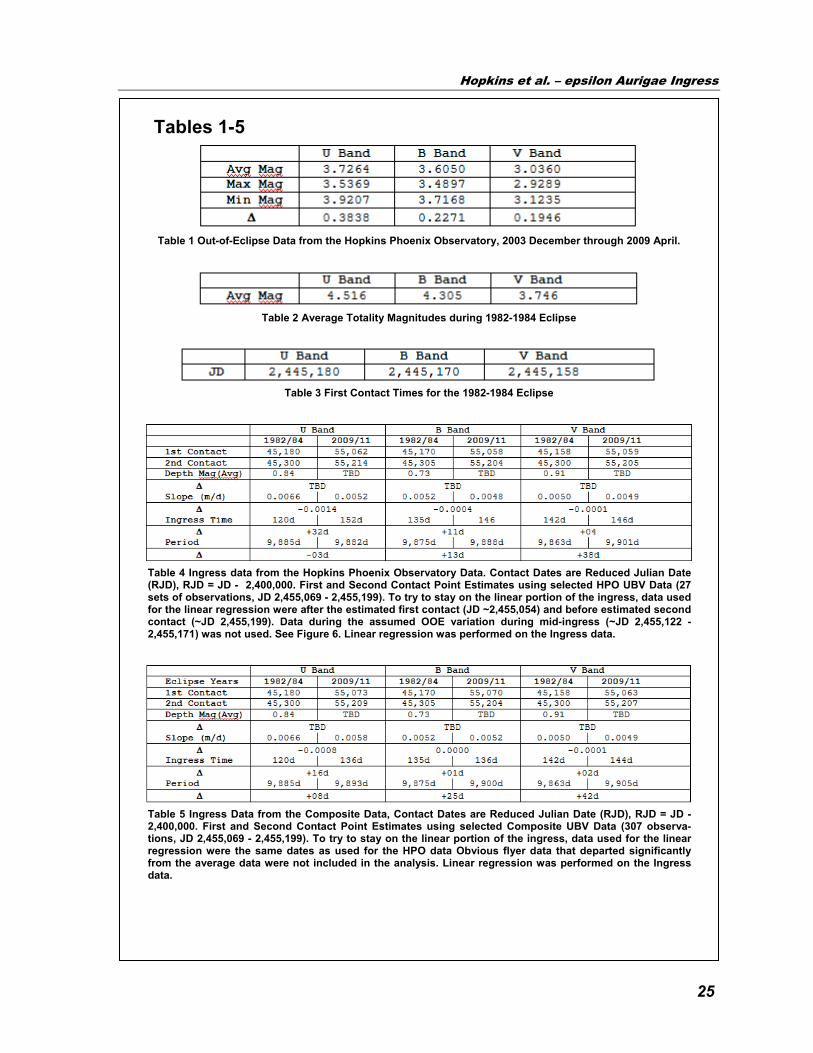
Observatory were used (Table 1). For the average
during totality, the average UBV values from totality
during the 1982 -1984 eclipse were used (Table 2).
Figure 5. OOE-like variations during ingress.
There are insufficient data for the R and I bands
to determine contact times. There was essentially
very little pre-eclipse data in these bands and data
from the 1982-1984 eclipse have very little coverage
in these bands. Table 3 lists the first contact times
from the 1982-1984 eclipse. Table 4 lists a summary
of the first and second contact times, ingress slopes,
ingress times and periods along with the differences
between the current eclipse and the 1982-1984
eclipse. These data were calculated using Hopkins
Phoenix Observatory UBV data.
Table 5 lists a summary of the first and second
contact times, ingress slopes, ingress times and peri-
ods along with the differences between the current
eclipse and the 1982-1984 eclipse. These data were
calculated using current campaign's composite data.
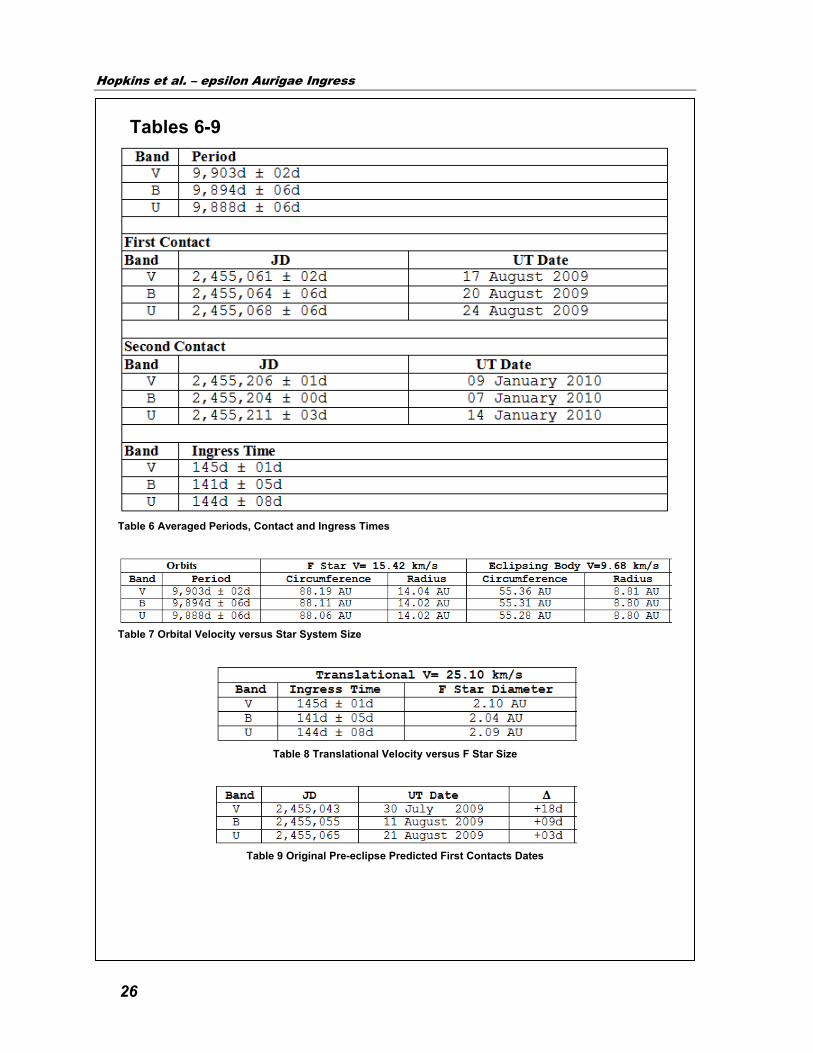
5.1 Determination of Average Contact Points
To determine the contact points, ingress times
and periods, the two sets of data, HPO and compos-
ite, were averaged. Table 6 shows the results. After
having determined the timings for first and second
contact, then the orbital velocities are critical values
for determining sizes in the star system. Since the F
star and eclipsing body orbit a common center of
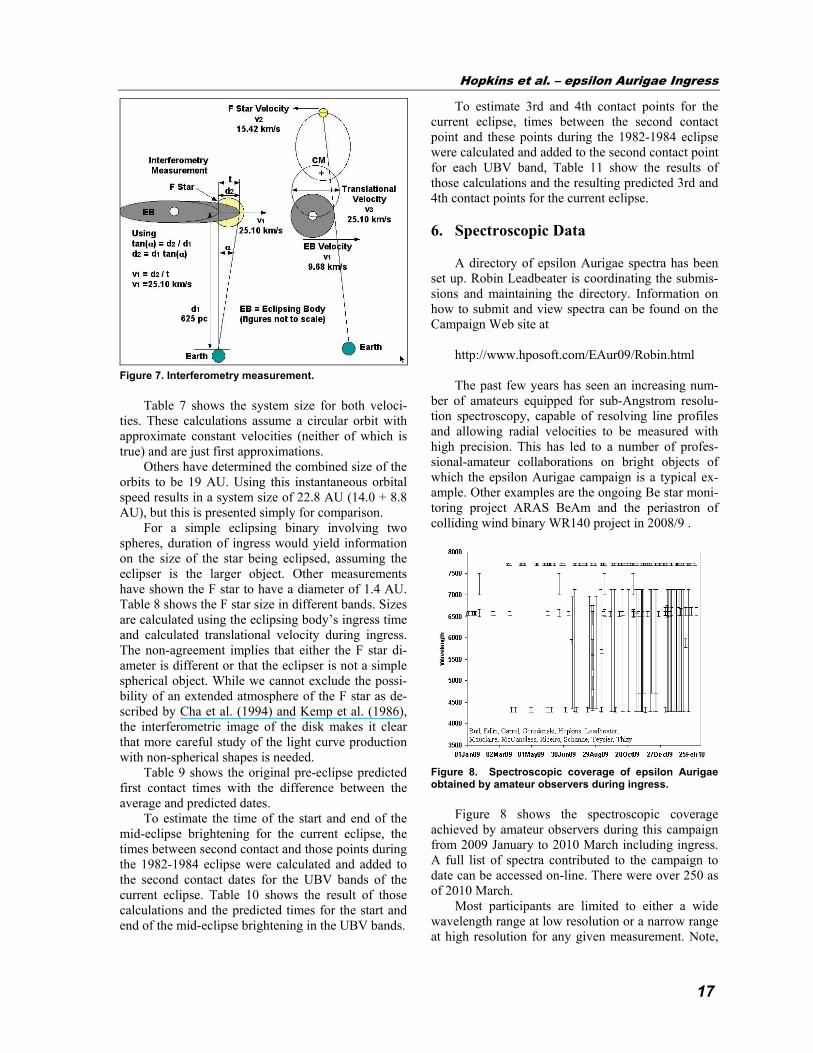
gravity, they have their own orbits. The F star orbital
or translational velocity during ingress 2009 was
15.42 ± 0.42 km/sec (Kloppenborg et al., 2010). The
velocity measured with interferometry was 25.10 ±
4.65 km/s. This means the eclipsing body’s orbital
velocity is the difference between that sum value and
the F star's 15.42 km/s velocity, or 9.68 km/s (see
Figure 7). Similarly, when the mid-eclipse brighten-
ing occurs, using the eclipsing body’s velocity allows
a rough estimate of the size of the opening.
Figure 6. Ingress linear regression data ranges.
Hopkins et al. – epsilon Aurigae Ingress
17
Figure 7. Interferometry measurement.
Table 7 shows the system size for both veloci-
ties. These calculations assume a circular orbit with
approximate constant velocities (neither of which is
true) and are just first approximations.
Others have determined the combined size of the
orbits to be 19 AU. Using this instantaneous orbital
speed results in a system size of 22.8 AU (14.0 + 8.8
AU), but this is presented simply for comparison.
For a simple eclipsing binary involving two
spheres, duration of ingress would yield information
on the size of the star being eclipsed, assuming the
eclipser is the larger object. Other measurements
have shown the F star to have a diameter of 1.4 AU.
Table 8 shows the F star size in different bands. Sizes
are calculated using the eclipsing body’s ingress time
and calculated translational velocity during ingress.
The non-agreement implies that either the F star di-
ameter is different or that the eclipser is not a simple
spherical object. While we cannot exclude the possi-
bility of an extended atmosphere of the F star as de-
scribed by Cha et al. (1994) and Kemp et al. (1986),
the interferometric image of the disk makes it clear
that more careful study of the light curve production
with non-spherical shapes is needed.
Table 9 shows the original pre-eclipse predicted
first contact times with the difference between the
average and predicted dates.
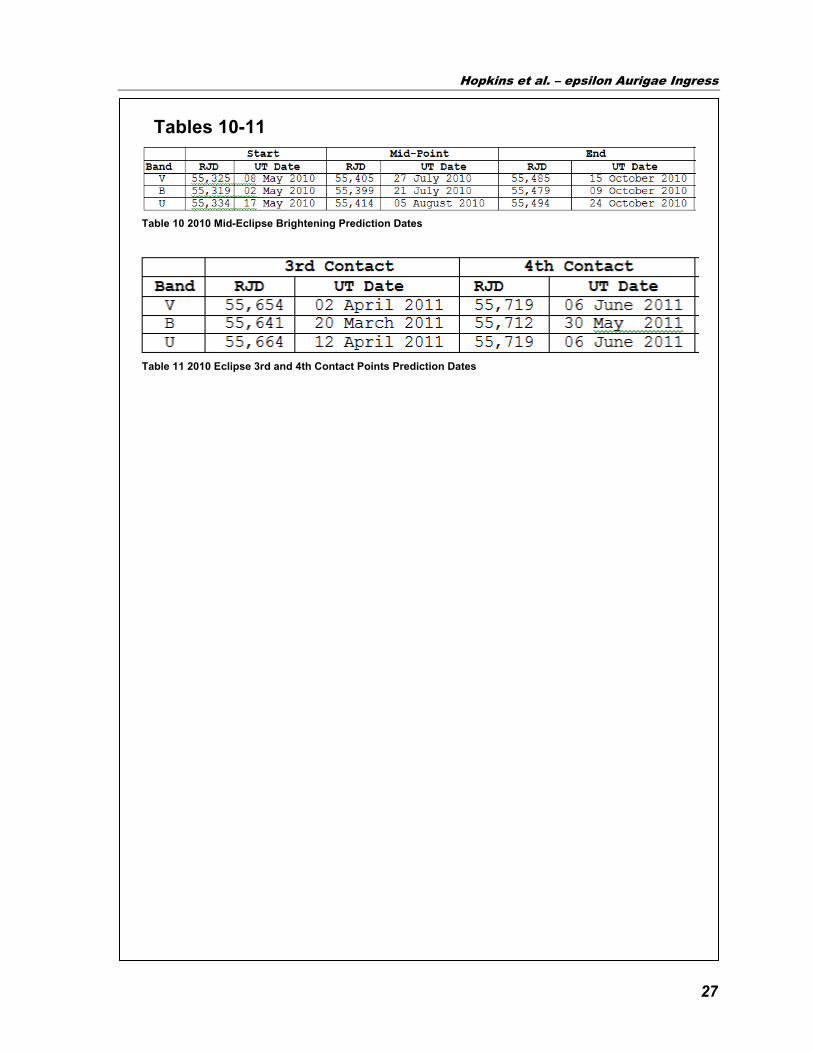
To estimate the time of the start and end of the
mid-eclipse brightening for the current eclipse, the
times between second contact and those points during
the 1982-1984 eclipse were calculated and added to
the second contact dates for the UBV bands of the
current eclipse. Table 10 shows the result of those
calculations and the predicted times for the start and
end of the mid-eclipse brightening in the UBV bands.
To estimate 3rd and 4th contact points for the
current eclipse, times between the second contact
point and these points during the 1982-1984 eclipse
were calculated and added to the second contact point
for each UBV band, Table 11 show the results of
those calculations and the resulting predicted 3rd and
4th contact points for the current eclipse.
6. Spectroscopic Data
A directory of epsilon Aurigae spectra has been
set up. Robin Leadbeater is coordinating the submis-
sions and maintaining the directory. Information on
how to submit and view spectra can be found on the
Campaign Web site at
http://www.hposoft.com/EAur09/Robin.html
The past few years has seen an increasing num-
ber of amateurs equipped for sub-Angstrom resolu-
tion spectroscopy, capable of resolving line profiles
and allowing radial velocities to be measured with
high precision. This has led to a number of profes-
sional-amateur collaborations on bright objects of
which the epsilon Aurigae campaign is a typical ex-
ample. Other examples are the ongoing Be star moni-
toring project ARAS BeAm and the periastron of
colliding wind binary WR140 project in 2008/9 .
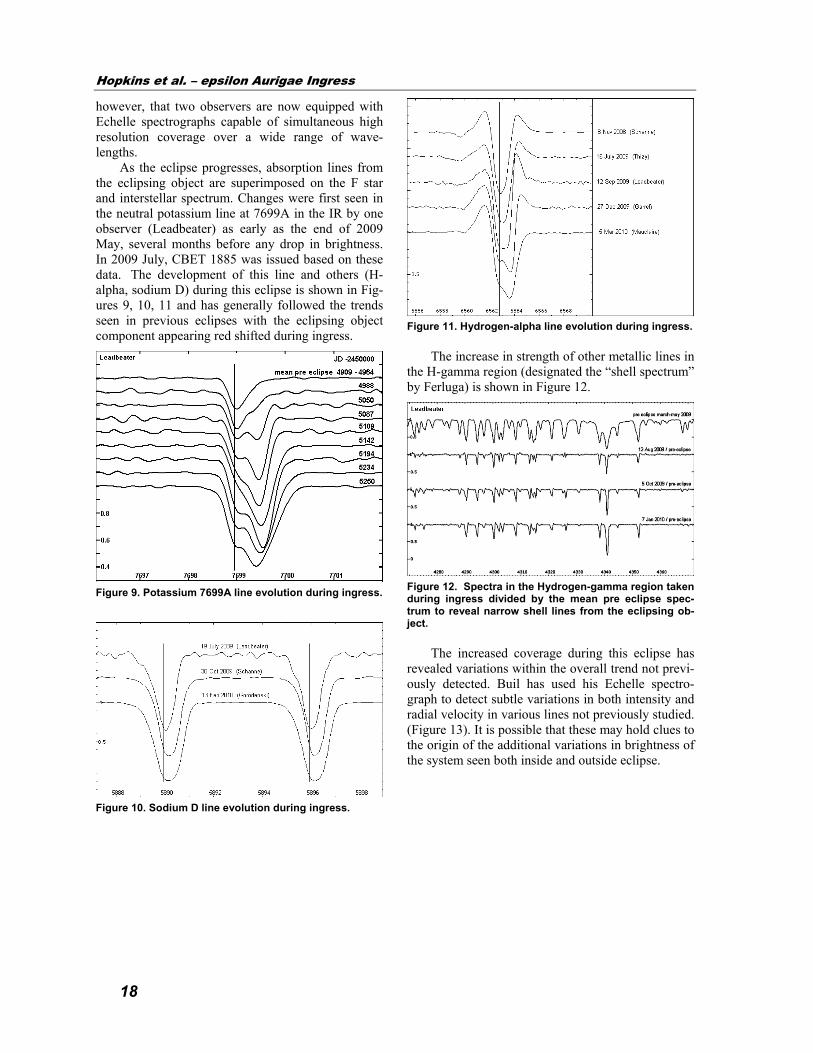
Figure 8. Spectroscopic coverage of epsilon Aurigae obtained by amateur observers during ingress.
Figure 8 shows the spectroscopic coverage
achieved by amateur observers during this campaign
from 2009 January to 2010 March including ingress.
A full list of spectra contributed to the campaign to
date can be accessed on-line. There were over 250 as
of 2010 March.
Most participants are limited to either a wide
wavelength range at low resolution or a narrow range
at high resolution for any given measurement. Note,
Hopkins et al. – epsilon Aurigae Ingress
18
however, that two observers are now equipped with
Echelle spectrographs capable of simultaneous high
resolution coverage over a wide range of wave-
lengths.
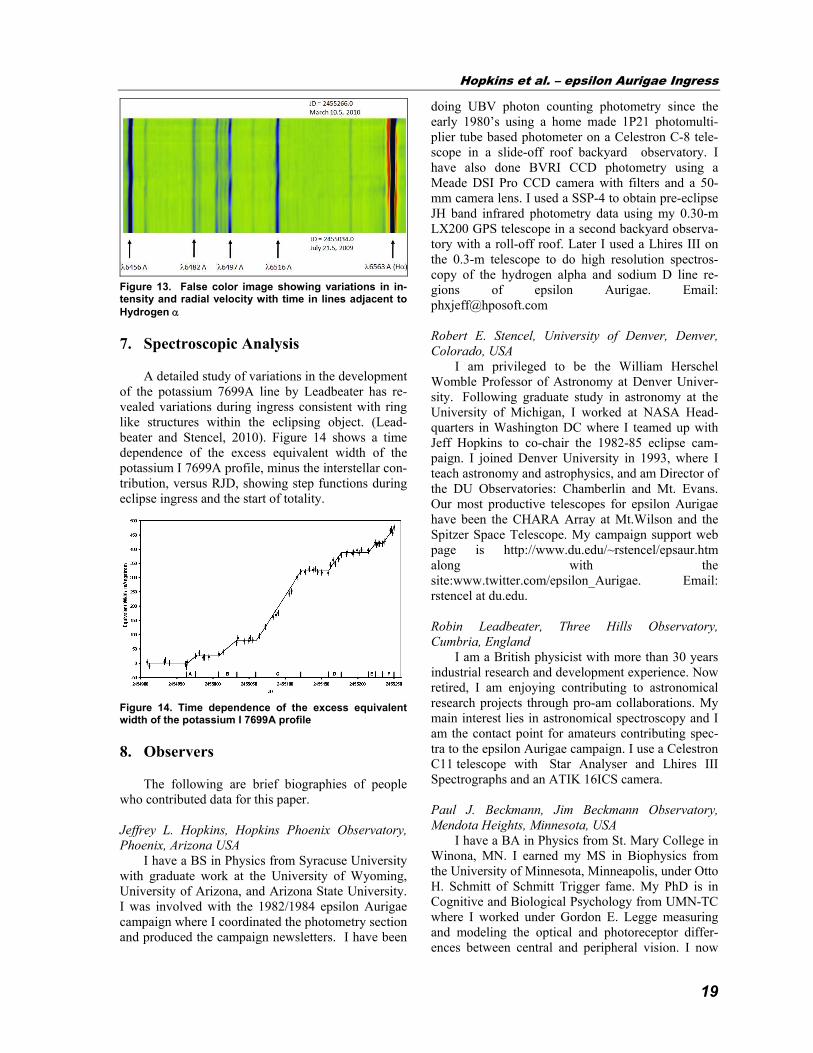
As the eclipse progresses, absorption lines from
the eclipsing object are superimposed on the F star
and interstellar spectrum. Changes were first seen in
the neutral potassium line at 7699A in the IR by one
observer (Leadbeater) as early as the end of 2009
May, several months before any drop in brightness.
In 2009 July, CBET 1885 was issued based on these
data. The development of this line and others (H-
alpha, sodium D) during this eclipse is shown in Fig-
ures 9, 10, 11 and has generally followed the trends
seen in previous eclipses with the eclipsing object
component appearing red shifted during ingress.
Figure 9. Potassium 7699A line evolution during ingress.
Figure 10. Sodium D line evolution during ingress.
Figure 11. Hydrogen-alpha line evolution during ingress.
The increase in strength of other metallic lines in
the H-gamma region (designated the “shell spectrum”
by Ferluga) is shown in Figure 12.
Figure 12. Spectra in the Hydrogen-gamma region taken during ingress divided by the mean pre eclipse spec-trum to reveal narrow shell lines from the eclipsing ob-ject.
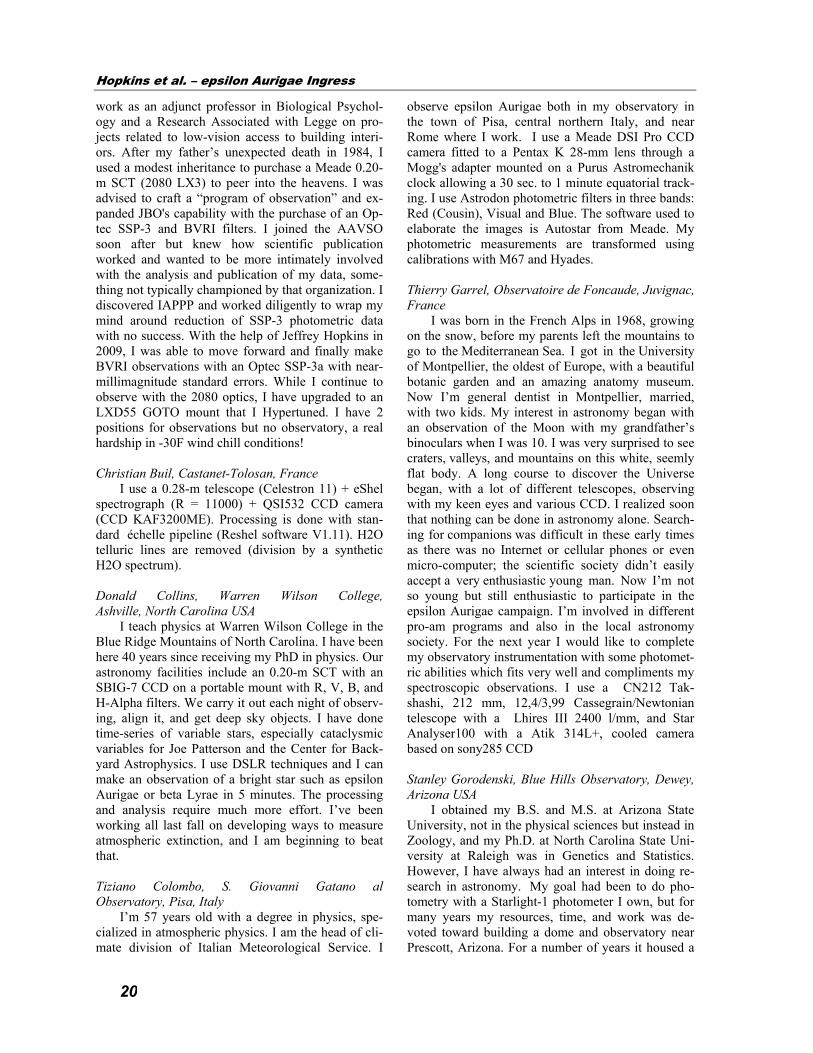
The increased coverage during this eclipse has
revealed variations within the overall trend not previ-
ously detected. Buil has used his Echelle spectro-
graph to detect subtle variations in both intensity and
radial velocity in various lines not previously studied.
(Figure 13). It is possible that these may hold clues to
the origin of the additional variations in brightness of
the system seen both inside and outside eclipse.
Hopkins et al. – epsilon Aurigae Ingress
19
Figure 13. False color image showing variations in in-tensity and radial velocity with time in lines adjacent to
Hydrogen D
7. Spectroscopic Analysis
A detailed study of variations in the development
of the potassium 7699A line by Leadbeater has re-
vealed variations during ingress consistent with ring
like structures within the eclipsing object. (Lead-
beater and Stencel, 2010). Figure 14 shows a time
dependence of the excess equivalent width of the
potassium I 7699A profile, minus the interstellar con-
tribution, versus RJD, showing step functions during
eclipse ingress and the start of totality.
Figure 14. Time dependence of the excess equivalent width of the potassium I 7699A profile
8. Observers
The following are brief biographies of people
who contributed data for this paper.
Jeffrey L. Hopkins, Hopkins Phoenix Observatory,
Phoenix, Arizona USA
I have a BS in Physics from Syracuse University
with graduate work at the University of Wyoming,
University of Arizona, and Arizona State University.
I was involved with the 1982/1984 epsilon Aurigae
campaign where I coordinated the photometry section
and produced the campaign newsletters. I have been
doing UBV photon counting photometry since the
early 1980’s using a home made 1P21 photomulti-
plier tube based photometer on a Celestron C-8 tele-
scope in a slide-off roof backyard observatory. I
have also done BVRI CCD photometry using a
Meade DSI Pro CCD camera with filters and a 50-
mm camera lens. I used a SSP-4 to obtain pre-eclipse
JH band infrared photometry data using my 0.30-m
LX200 GPS telescope in a second backyard observa-
tory with a roll-off roof. Later I used a Lhires III on
the 0.3-m telescope to do high resolution spectros-
copy of the hydrogen alpha and sodium D line re-
gions of epsilon Aurigae. Email:
Robert E. Stencel, University of Denver, Denver,
Colorado, USA
I am privileged to be the William Herschel
Womble Professor of Astronomy at Denver Univer-
sity. Following graduate study in astronomy at the
University of Michigan, I worked at NASA Head-
quarters in Washington DC where I teamed up with
Jeff Hopkins to co-chair the 1982-85 eclipse cam-
paign. I joined Denver University in 1993, where I
teach astronomy and astrophysics, and am Director of
the DU Observatories: Chamberlin and Mt. Evans.
Our most productive telescopes for epsilon Aurigae
have been the CHARA Array at Mt.Wilson and the
Spitzer Space Telescope. My campaign support web
page is http://www.du.edu/~rstencel/epsaur.htm
along with the
site:www.twitter.com/epsilon_Aurigae. Email:
rstencel at du.edu.
Robin Leadbeater, Three Hills Observatory,
Cumbria, England
I am a British physicist with more than 30 years
industrial research and development experience. Now
retired, I am enjoying contributing to astronomical
research projects through pro-am collaborations. My
main interest lies in astronomical spectroscopy and I
am the contact point for amateurs contributing spec-
tra to the epsilon Aurigae campaign. I use a Celestron
C11 telescope with Star Analyser and Lhires III
Spectrographs and an ATIK 16ICS camera.
Paul J. Beckmann, Jim Beckmann Observatory,
Mendota Heights, Minnesota, USA
I have a BA in Physics from St. Mary College in
Winona, MN. I earned my MS in Biophysics from
the University of Minnesota, Minneapolis, under Otto
H. Schmitt of Schmitt Trigger fame. My PhD is in
Cognitive and Biological Psychology from UMN-TC
where I worked under Gordon E. Legge measuring
and modeling the optical and photoreceptor differ-
ences between central and peripheral vision. I now
Hopkins et al. – epsilon Aurigae Ingress
20
work as an adjunct professor in Biological Psychol-
ogy and a Research Associated with Legge on pro-
jects related to low-vision access to building interi-
ors. After my father’s unexpected death in 1984, I
used a modest inheritance to purchase a Meade 0.20-
m SCT (2080 LX3) to peer into the heavens. I was
advised to craft a “program of observation” and ex-
panded JBO's capability with the purchase of an Op-
tec SSP-3 and BVRI filters. I joined the AAVSO
soon after but knew how scientific publication
worked and wanted to be more intimately involved
with the analysis and publication of my data, some-
thing not typically championed by that organization. I
discovered IAPPP and worked diligently to wrap my
mind around reduction of SSP-3 photometric data
with no success. With the help of Jeffrey Hopkins in
2009, I was able to move forward and finally make
BVRI observations with an Optec SSP-3a with near-
millimagnitude standard errors. While I continue to
observe with the 2080 optics, I have upgraded to an
LXD55 GOTO mount that I Hypertuned. I have 2
positions for observations but no observatory, a real
hardship in -30F wind chill conditions!
Christian Buil, Castanet-Tolosan, France
I use a 0.28-m telescope (Celestron 11) + eShel
spectrograph (R = 11000) + QSI532 CCD camera
(CCD KAF3200ME). Processing is done with stan-
dard échelle pipeline (Reshel software V1.11). H2O
telluric lines are removed (division by a synthetic
H2O spectrum).
Donald Collins, Warren Wilson College,
Ashville, North Carolina USA
I teach physics at Warren Wilson College in the
Blue Ridge Mountains of North Carolina. I have been
here 40 years since receiving my PhD in physics. Our
astronomy facilities include an 0.20-m SCT with an
SBIG-7 CCD on a portable mount with R, V, B, and
H-Alpha filters. We carry it out each night of observ-
ing, align it, and get deep sky objects. I have done
time-series of variable stars, especially cataclysmic
variables for Joe Patterson and the Center for Back-
yard Astrophysics. I use DSLR techniques and I can
make an observation of a bright star such as epsilon
Aurigae or beta Lyrae in 5 minutes. The processing
and analysis require much more effort. I’ve been
working all last fall on developing ways to measure
atmospheric extinction, and I am beginning to beat
that.
Tiziano Colombo, S. Giovanni Gatano al
Observatory, Pisa, Italy
I’m 57 years old with a degree in physics, spe-
cialized in atmospheric physics. I am the head of cli-
mate division of Italian Meteorological Service. I
observe epsilon Aurigae both in my observatory in
the town of Pisa, central northern Italy, and near
Rome where I work. I use a Meade DSI Pro CCD
camera fitted to a Pentax K 28-mm lens through a
Mogg's adapter mounted on a Purus Astromechanik
clock allowing a 30 sec. to 1 minute equatorial track-
ing. I use Astrodon photometric filters in three bands:
Red (Cousin), Visual and Blue. The software used to
elaborate the images is Autostar from Meade. My
photometric measurements are transformed using
calibrations with M67 and Hyades.
Thierry Garrel, Observatoire de Foncaude, Juvignac,
France
I was born in the French Alps in 1968, growing
on the snow, before my parents left the mountains to
go to the Mediterranean Sea. I got in the University
of Montpellier, the oldest of Europe, with a beautiful
botanic garden and an amazing anatomy museum.
Now I’m general dentist in Montpellier, married,
with two kids. My interest in astronomy began with
an observation of the Moon with my grandfather’s
binoculars when I was 10. I was very surprised to see
craters, valleys, and mountains on this white, seemly
flat body. A long course to discover the Universe
began, with a lot of different telescopes, observing
with my keen eyes and various CCD. I realized soon
that nothing can be done in astronomy alone. Search-
ing for companions was difficult in these early times
as there was no Internet or cellular phones or even
micro-computer; the scientific society didn’t easily
accept a very enthusiastic young man. Now I’m not
so young but still enthusiastic to participate in the
epsilon Aurigae campaign. I’m involved in different
pro-am programs and also in the local astronomy
society. For the next year I would like to complete
my observatory instrumentation with some photomet-
ric abilities which fits very well and compliments my
spectroscopic observations. I use a CN212 Tak-
shashi, 212 mm, 12,4/3,99 Cassegrain/Newtonian
telescope with a Lhires III 2400 l/mm, and Star
Analyser100 with a Atik 314L+, cooled camera
based on sony285 CCD
Stanley Gorodenski, Blue Hills Observatory, Dewey,
Arizona USA
I obtained my B.S. and M.S. at Arizona State
University, not in the physical sciences but instead in
Zoology, and my Ph.D. at North Carolina State Uni-
versity at Raleigh was in Genetics and Statistics.
However, I have always had an interest in doing re-
search in astronomy. My goal had been to do pho-
tometry with a Starlight-1 photometer I own, but for
many years my resources, time, and work was de-
voted toward building a dome and observatory near
Prescott, Arizona. For a number of years it housed a
Hopkins et al. – epsilon Aurigae Ingress
21
0.31-m Dall-Kirkham telescope built by a machinist
friend until it was replaced in 2007 by a Meade 0.40-
m LX200R. I have always been interested in doing
spectroscopy and by the time I finished the observa-
tory and equipped it with a telescope that can do sci-
entific work, CCD technology made it possible and
the LHIRES III had came out.
Email: [email protected]
Snaevarr Gudmundsson, Lindarberg Observatory,
Hafnarfjordur, Iceland
I was born 1963 and am director of Stjornuverid
(Planetarium), which uses mobile Digital Starlab for
presentations of the night sky and the cosmos. I’m
also finishing a BSc in Geography and Geology from
the University of Iceland. I have written two books
and many articles about mountaineering, climbing,
and astronomy. I qualified as mountain guide in 1985
and have also worked occasionally as a nature pho-
tographer. I have been an amateur astronomer since
1988, with special interest in our home galaxy, rang-
ing from binaries and variables to star clusters and
nebulas. My observing site is located at outskirts of
Hafnarfjordur in Iceland. The observatory is elevated
at 60 m (above sea-level) on a hill with reasonable
light pollution towards north and west (from Reykja-
vik), but very little light pollution towards east and
south. Weather is usually unpredictable in the long
term, but when it clears up the sky is usually without
mist or much pollution. Auroras are frequent sights
from Iceland, but has been unusually quiet during this
winter. These conditions have been helpful for this
project. I built my observatory in 2000. It has two
telescopes: Meade LX 200 0.30-m Schmidt-
Cassegrain telescope f/10 and Williams Optic FLT-
110 refractor which is mostly used for astrophotogra-
phy. Since 2005, I have used SBIG’s STL-
11000M CCD camera and Astrodon’s narrowband
filters for astrophotography. I also had invested in an
Optec SSP-3, used for single channel V photometry
(since 2003) of variable stars and eclipsing binaries.
Thomas Karlsson, Varberg Observatory, Varberg,
Sweden
I’ve been an active variable observer for two
years but have been interested in astronomy since I
was a kid. Now I’m 45 years old and work with IT as
a network technician. For epsilon Aurigae, I do V
measurements. I use a Canon 450D DSLR camera
with an EF 35-80 mm objective on a camera tripod. I
usually shoot 4 or 5 series of 10 photos with 5 second
exposure time at ISO800, slightly defocused. I proc-
ess the raw pictures with dark and flat frames, align
and stack each series of 10 pictures before measuring
them. For the photometric measurement, I have 20
non-variable stars around epsilon I use for calibrating
each stacked picture. For each session I also compute
each star’s air mass. I then use regression analysis to
get the two coefficients in the formula. Finally, I
compute the average and standard deviation from the
4-5 series to get a final V value for epsilon. For im-
age processing I use Iris, for photometry TeleAuto,
and for analys, Excel.
Dr. Mukund Kurtadikar, Jalna Education Society
Observatory, Maharashtra, India
The JESO was established in 2001 January with
the installation of a 0.30-m Meade LX200 Telescope
with SSP-3A Optec photometer as the backend in-
strument. The instrument was funded by Department
of Science and Technology , Govt. of India.
JESO Staff
M.L. Kurtadikar: Associate Professor in the Post-
graduate Department of Physics, J.E.S.College Jalna
431 203 , Maharashtra State, India. He is Principal
Investigator of the Epsilon Aurigae campaign and is
in-Charge of the JESO, Jalna. He has developed the
observatory with the funding from government of
India and started work on photoelectric photometry
of several variable stars.
A.N. Ardad: Teaching Faculty Member in the De-
partment of Physics, Shiv Chatrapati College, Auran-
gabad 431 003, Maharashtra State, India. He is a
member of JESO for Eps Aur campaign.
P.M. Kokne: Teaching Faculty Member in the De-
partment of Physics, B.R. Barwale College, Jalna 431
203, Maharashtra State, India. He is a member of
JESO for Eps Aur campaign.
S.K. Pandit: Teaching Faculty Member in the De-
partment of Physics, B.R. Barwale College, Jalna 431
203, Maharashtra State, India. He is a member of
JESO for Eps Aur campaign.
A.D. Dashrath: Teaching Faculty Member in the De-
partment of Physics, High-Tech Polytechnic and En-
gineering College, Waluj, Aurangabad, Maharashtra
State, India. He is a member of JESO for Eps Aur
campaign.
R.S. Yannawar: Teaching Faculty Member in the
Department of Physics, Milind Science College, Au-
rangabad 431 005, Maharashtra State, India. He is a
member of JESO for Eps Aur Campaign.
Hans-Goran Lindberg, Kaerrbo Observatory,
Skultuna, Sweden
I live in Sweden 60 deg north, 16d 24 m east and
have an observatory with 254-mm Schmidt-
Newtonian f/4, 254-mm Newtonian f/5.1, and 180-
mm f/10 Intes-Micro Maksutov-Cassegrain tele-
scopes. Starlight EXpres CCD camera HX-516 mono
Hopkins et al. – epsilon Aurigae Ingress
22
as I use on epsilon Aurigae with a 50-mm fl camera
lens from Meyer optik. I am section leader for The
Swedish Amateur Astronomer Association (Svensk
Amator Astronomisk Forening, SAAF) section for
variable stars. I started with astronomy as a young
boy 7 years old in 1948 and have observed variable
stars since 1993. For the past 5 years during the
summer time, I images Venus in UV-light. I have
helped develop a database with Swedish observations
of variable stars starting in 1720:
http://var.astronet.se/
Des Loughney, Edinburgh, Scotland
I observe from suburban Edinburgh, Scotland.
I use a 450D Canon DSLR with an 85-mm lens
mounted on a tripod. The settings are exposure 5 sec-
onds, f/4.5 and ISO 200. Each estimate is arrived at
after analyzing 5 sets of ten images using AIP4WIN
(v 2.1.10). For each image a green channel image is
isolated and used to compare epsilon with eta Auri-
gae. A transformation coefficient has been worked
out for the 450D DSLR. This is used to determine V
magnitude from the green channel estimate. In good
conditions, V estimates have a standard deviation of
less than 0.01 mag. I have a BSc MA and am an ama-
teur astronomer with scientific training. I am the
Eclipsing Binary Secretary of the British Astronomi-
cal Association Variable Star Section and also a
member of the Astronomical Society of Edinburgh.
Benji Mauclaire, Observatoire du Val de I'Arc,
Bouches du Rhone, France
I have been observing the sky for more than
20 years. I am a professor of physics near Aix-en-
Provence, South of France. I started with visual ob-
servation of deep sky objects with a 0.43-m Dobson
telescope, especially planetary nebulae challenges.
Stellar evolution is one of my favourite astrophysics
subjects. From my own remote observatory, my main
purpose is the spectral analysis of targets from Be
stars to planetary nebulae. I use a 0.30-m SCT with a
LHIRES III spectrograph under a country sky which
provides a good environment for long time survey
projects such as epsilon Aurigae. I created a software
program for a high-rate production of spectra’s re-
duction and analysis with powerful pipelines called
SpcAudace
http://bmauclaire.free.fr/spcaudace/
that gives time for astrophysics reading and analysis,
and public conferencing. Today, my main research
program is Be stars study in collaboration with pro-
fessional astronomers that leads to burst detection
and publications in international revues.
Brian E. McCandless, Grand View Observatory,
Elkton, Maryland USA
I have been an astronomer since the 1960’s. I
earned my degree in astronomy from the University
of Maryland at College Park in 1980. I am an associ-
ate scientist with the Institute of Energy Conversion
at the University of Delaware, where I research thin
film photovoltaic devices. My wife Julie and I oper-
ate their Grand View Observatory from sites in
Tidewater, Maryland and the Blue Ridge Mountains
in Virginia. The observational focus is single channel
photometry and spectroscopy of long-period vari-
ables and novae. Photometric observations are carried
out in Johnson BVRI, wing narrow band-pass, and
infrared JH systems using Optec solid state photome-
ters. Spectrographic measurements are made using an
SBIG SGS spectrograph with ST7-XME CCD cam-
era. The primary telescope is a Celestron 0.36-m SCT
on a CGE mount.
Frank J. Melillo, Holtsville, New York USA
I have a Celestron 0.20-m and a Meade 0.25-m
telescope. I became interest in photoelectric pho-
tometry in 1983 when I purchased the SSP-3 OPTEC
photometer, which I still have today. I caught the last
partial eclipse of epsilon Aurigae in the spring of
1984. Afterward, I concentrated more on minor plan-
ets photometry to monitor their brightness as they
rotate. I did photometry on Uranus and Neptune to
take measurements in the near-infrared where meth-
ane absorbs the most. I use the 0.20-m telescope to
monitor epsilon Aurigae photoelectrically with a
SSP-3 OPTEC photometer.
Email: [email protected]
Richard Miles, Golden Hill Observatory, Dorset,
England
I am a 58 year old retired research scientist
working in physics and chemistry. I have been an
amateur astronomer since I was a kid. My special
interests are in photometry, occultations, asteroids
and comets. I began by building my own photometers
using PMTs in 1981. I have been a member of the
British Astronomical Association since 1966 and am
Past President 2005-2007. I am keen on participating
in pro-am collaboration and have been a member of
IAPPP since 1982 I have recently begun making in-
creased use of robotic telescopes to gather observa-
tions with a view to publishing new insights into the
nature of some comet nuclei. I use a 0.06-m Takaha-
shi F860C refractor telescope with a Starlight Xpress
SXV-H9 CCD camera with V and Ic band filters.
Hopkins et al. – epsilon Aurigae Ingress
23
Robert T. (Tom) Pearson, Virginia Beach, Virginia
USA
Although I’ve enjoyed amateur astronomy for
many years, I’m a relative newcomer to variable star
observing. I became intrigued when I heard that
DSLR cameras could be used to do accurate pho-
tometry. When I first read about the “mystery star”
last summer, I thought the coming eclipse would be a
perfect opportunity to do real research by combing
two hobbies, photography and astronomy. I am cur-
rently imaging epsilon Aurigae from my backyard in
Virginia Beach, VA, using a Canon 20D DSLR with
a 70-mm lens. During each observing session I take
30 star images, 10 dark frames, 10 flats and 10 flat
darks. Exposures are 5 seconds at f/4 and ISO 800.
Gerard Samolyk, Greenfield, Wisconsin USA
I have been a variable star observer for more
than 35 years (both visual and CCD). I worked with
the AAVSO Eclipsing Binary committee and RR Lyr
committee for 30 years, publishing an annual ephem-
eris and times of minimum. Currently I’m co-chair of
the AAVSO Eclipsing Binary Section and the Short
Period Pulsator Section. I have been the Observatory
Directory for the Milwaukee Astronomical Society
since 1980. I use an ST9XE CCD camera with 50-
mm lens for BVR photometry.
Lothar Schanne, Hohlstrasse 19, D-66333,
Völklingen, Germany
My astronomical equipment consists of a: C14 +
autoguided Lhires III spectrograph + self-build
echelle spectrograph + sigma 1603ME (CCD) in a
Sirius 2.3 m dome. My interest is spectroscopy of hot
stars. I have 5 years experience with spectroscopy. I
have web sites at www.astrospectroscopy.eu and
www.spectrosphere.de
Iakovos Marios Strikis, Elizabeth Observatory of
Athens, Haldrf (Athens), Greece
I was born on 1985 May 15. My profession is a
photo-journalist. I am the current President of the
Hellenic Amateur Astronomy Association. Until
1998 I had many different hobbies (coin collections,
mineral collections, microscopy imaging, etc.). All of
them had a terminal point because of the expenses to
find some rare parts of my collections. When I found
about astronomy I was stunned, soon I realized that
with not huge budget I could do some serious job in
contributing in the knowledge of astronomy. That is
the time when I got my first telescope. From 1999
until 2004 I did more than 980 sunspot drawings and
more than 300 planetary observations by drawing
Jupiter, Saturn, Venus and Mars. In 2004 I started to
get involved with the digital imaging with the new
cheap web-camera from Philips. This had opened a
brand new world to my eyes. I always wanted to get
involved in CCD photometry and imaging. This came
to life at 2008 when I got my CCD camera (one of
the cheapest models) from a friend who got a new
one and wanted some money. I started to observe and
recorded many stars such as RR-Lyrae and i Boo
because they had quick light curves. Then I started to
observe globular clusters with Rodney Howe and
others. When a friend told me about the epsilon
Aurigae project, I started to observe almost every
clear night but, as it has always been, the Sun is my
first priority doing almost every day observations of
the Sun in H-alpha line and also doing spectroscopy
during total solar eclipses. I use a ATIC CCD camera
with 55-mm lens at f/6.3. You can find my astronomy
work and observations at: www.hellas-astro.gr,
www.elizabethobservatory.webs.com and
www.dailysolar.weebly.com
François Teyssier, Yogurt Pot Observatory, Rouen,
France
I use a Lhires III spectrograph with a low resolu-
tion, 150 line/mm, grating and Starlight SXV-H9
CCD camera.
Olivier Thizy, Shelyak Instruments, Revel, France
I started astronomy more than 30 years ago
with a 0.12-m telescope. I have always been an active
observer, watching stars being one of the most excit-
ing experiences! I am now observing from my home
in the Alps or with one of the two 0.60-m public tele-
scopes in France. I participated to the development of
Lhires III high resolution spectrograph within AUDE
association and worked on some professional spec-
trographs (MuSiCoS, NARVAL). In 2006, I co-
founded Shelyak Instruments, a company specialized
in spectroscopy for astronomy proposing the first
commercial optical fiber echelle spectrograph. I am
also actively involved in promoting scientific projects
for amateur astronomers such as participation in
pro/am collaboration on Be stars.
9. Conclusion
The system's mid-eclipse is predicted to be 2010
August 4, with third contact predicted for 2011
March, and fourth contact for 2011 May 13. During
the late spring and summer observing season (North-
ern Hemisphere) the star system can be seen from
higher latitudes early evening and just before sunrise.
While the system is observable, the air mass through
which the observations must be made is very high.
Some of the most interesting and important data
could be obtained during these times so it is worth-
while to put the extra effort into the observing. High
Hopkins et al. – epsilon Aurigae Ingress
24
air mass photometry requires careful correction of
extinction. Ideally, nightly extinction coefficients
should be determined.
The campaign is archiving photometric and spec-
troscopic data. The photometric data will be archived
as text files and available for download from the
campaign web site. The web site will also continue to
host the spectroscopic data. A paper including the
campaign’s photometric data is planned for the
IBVS.
10. Acknowledgments
We would like to thank Brian Kloppenborg for
helpful comments during the development of this
paper as well as the efforts of all the worldwide ob-
servers not included here who also are contributing
data to this eclipse campaign.
11. References
Cha, G., Tan, H., Xu, J., Li, Y. (1994) “High-
dispersion H alpha spectroscopy of epsilon Aurigae.”
Astron. Astrophys. 284, 874.
Ferluga, S., Mangiacapra, D. (1991) “Epsilon Auri-
gae. II The shell spectrum.” Astron. Astrophys. 243,
230.
Hopkins, J.L, Stencel, R. (2008), Epsilon Aurigae A
Mysterious Star System, ISBN 978-0-615-24022-0.
Kemp, J.C., Henson, G.D., Kraus, D., Beardsley, I.,
Carroll, L., Ake, T., Simon, T., Collins, G. (1986).
“Epsilon Aurigae - Polarization, light curves, and
geometry of the 1982-1984 eclipse.” ApJ. 300, L11.
Kloppenborg, B., Stencel, R., Monnier, J.D., Schae-
fer, G., Zhao, M., Baron, F., McAlister, H.A., ten
Brummelaar, T.A., Che, X., Farrington, C.D., Pe-
dretti, E., Sallave-Goldfinger, P.J., Sturmann, J.,
Sturmann, L., Thureau, N., Turner, N., Carroll, S.
(2010). “Infrared images of the transiting disk in the
epsilon Aurigae system.” Nature 464, 870.
Leadbeater, R., Stencel, R. (2010). “Structure in the
disc of epsilon Aurigae: Spectroscopic observations
of neutral potassium during eclipse ingress.”
http://arxiv.org/abs/1003.3617
URLs
The ARAS BeAm Be star monitoring program:
http://arasbeam.free.fr
The periastron of colliding wind binary WR140
2008/9:
http://www.stsci.de/wr140/index_e.htm
The International Epsilon Aurigae Campaign list of
amateur spectra:
http://www.threehillsobservatory.co.uk/epsaur_spectr
a.htm
CBET 1885 27 July 2009 epsilon Aurigae:
http://www.cfa.harvard.edu/iau/cbet/001800/CBET00
1885.txt
Hopkins et al. – epsilon Aurigae Ingress
25
Tables 1-5
Table 1 Out-of-Eclipse Data from the Hopkins Phoenix Observatory, 2003 December through 2009 April.
Table 2 Average Totality Magnitudes during 1982-1984 Eclipse
Table 3 First Contact Times for the 1982-1984 Eclipse
Table 4 Ingress data from the Hopkins Phoenix Observatory Data. Contact Dates are Reduced Julian Date (RJD), RJD = JD - 2,400,000. First and Second Contact Point Estimates using selected HPO UBV Data (27 sets of observations, JD 2,455,069 - 2,455,199). To try to stay on the linear portion of the ingress, data used for the linear regression were after the estimated first contact (JD ~2,455,054) and before estimated second contact (~JD 2,455,199). Data during the assumed OOE variation during mid-ingress (~JD 2,455,122 - 2,455,171) was not used. See Figure 6. Linear regression was performed on the Ingress data.
Table 5 Ingress Data from the Composite Data, Contact Dates are Reduced Julian Date (RJD), RJD = JD - 2,400,000. First and Second Contact Point Estimates using selected Composite UBV Data (307 observa-tions, JD 2,455,069 - 2,455,199). To try to stay on the linear portion of the ingress, data used for the linear regression were the same dates as used for the HPO data Obvious flyer data that departed significantly from the average data were not included in the analysis. Linear regression was performed on the Ingress data.
Hopkins et al. – epsilon Aurigae Ingress
26
Tables 6-9
Table 6 Averaged Periods, Contact and Ingress Times
Table 7 Orbital Velocity versus Star System Size
Table 8 Translational Velocity versus F Star Size
Table 9 Original Pre-eclipse Predicted First Contacts Dates
Hopkins et al. – epsilon Aurigae Ingress
27
Tables 10-11
Table 10 2010 Mid-Eclipse Brightening Prediction Dates
Table 11 2010 Eclipse 3rd and 4th Contact Points Prediction Dates