superhumps in cataclysmic binaries. xxv. q_crit, epsilon(q), and mass-radius
TRANSCRIPT
SUPERHUMPS IN CATACLYSMIC BINARIES.
XXV. QCRIT, ε(Q), AND MASS–RADIUS
JOSEPH PATTERSON,1 JONATHAN KEMP,2,1,3 DAVID A. HARVEY,4 ROBERT E. FRIED,5
ROBERT REA,6 BERTO MONARD,7 LEWIS M. COOK,8 DAVID R. SKILLMAN,9
TONNY VANMUNSTER,10 GREG BOLT,11 EVE ARMSTRONG,12,1 JENNIE MCCORMICK,13
THOMAS KRAJCI,14 LASSE JENSEN,15 JERRY GUNN,16 NEIL BUTTERWORTH,17
JERRY FOOTE,18 MARC BOS,19 GIANLUCA MASI,20 & PAUL WARHURST21
in press • Publications of the Astronomical Society of the Pacific • to appear 2005 November
2005 June 28 Revision
PATTERSON, J. ET AL. QCRIT, ε(Q), & MASS–RADIUS
2
1 Department of Astronomy, Columbia University, 550 West 120th Street, New York, NY10027; [email protected] Joint Astronomy Centre, University Park, 660 North A’ohōkū Place, Hilo, HI 96720;[email protected] Visiting Astronomer, Cerro Tololo Interamerican Observatory, National Optical AstronomyObservatories, which is operated by the Association of Universities for Research in Astronomy,Inc. (AURA) under cooperative agreement with the National Science Foundation4 Center for Backyard Astrophysics (West), 1552 West Chapala Drive, Tucson, AZ 85704;[email protected] Center for Backyard Astrophysics (Flagstaff), Braeside Observatory; (deceased)6 Center for Backyard Astrophysics (Nelson), 8 Regent Lane, Richmond, Nelson, NewZealand; [email protected] Center for Backyard Astrophysics (Pretoria), Post Office Box 11426, Tiegerpoort 0056,South Africa; [email protected] Center for Backyard Astrophysics (Concord & Pahala), 1730 Helix Court, Concord, CA94518; [email protected] Center for Backyard Astrophysics (East), 9517 Washington Avenue, Laurel, MD 20723;[email protected] Center for Backyard Astrophysics (Belgium), Walhostraat 1A, B-3401 Landen, Belgium;[email protected] Center for Backyard Astrophysics (Perth), 295 Camberwarra Drive, Craigie, WesternAustralia 6025, Australia; [email protected] Department of Physics, University of California at San Diego, Mail Code 0354, 9500 GilmanDrive, San Diego, CA 92093; [email protected] Center for Backyard Astrophysics (Pakuranga), Farm Cove Observatory, 2/24 Rapallo Place,Farm Cove, Pakuranga, Auckland, New Zealand; [email protected] Center for Backyard Astrophysics (New Mexico & Uzbekistan), 9605 Goldenrod Circle,Albuquerque, NM 87116; [email protected] Center for Backyard Astrophysics (Denmark), Søndervej 38, DK-8350 Hundslund,Denmark; [email protected] Center for Backyard Astrophysics (Illinois), 1269 North Skyview Drive, East Peoria, IL61611; [email protected] Center for Backyard Astrophysics (Townsville), 24 Payne Street, Mount Louisa, Queensland4814, Australia; [email protected] Center for Backyard Astrophysics (Utah), 4175 East Red Cliffs Drive, Kanab, UT 84741;[email protected] Center for Backyard Astrophysics (Otahuhu), Mount Molehill Observatory, 54 McDowellCress, Glenfield, North Shore City, Auckland, New Zealand; [email protected] Center for Backyard Astrophysics (Italy), Via Madonna de Loco, 47, 03023 Ceccano FR,Italy; [email protected] Department of Physics, University of Auckland, Private Bag 92019, Auckland, NewZealand; [email protected]
PATTERSON, J. ET AL. QCRIT, ε(Q), & MASS–RADIUS
3
ABSTRACT
We report on successes and failures in searching for positive superhumps in cataclysmicvariables, and show the superhumping fraction as a function of orbital period. Basically, allshort-period systems do, all long-period systems don’t, and a 50% success rate is found atPorb=3.1±0.2 hr. We can use this to measure the critical mass ratio for the creation ofsuperhumps. With a mass–radius relation appropriate for cataclysmic variables, and an assumedmean white-dwarf mass of 0.75 M , we find a mass ratio qcrit=0.35±0.02.
We also report superhump studies of several stars of independently known mass ratio:OU Virginis, XZ Eridani, UU Aquarii, and KV UMa (= XTE J1118+480). The latter two are ofspecial interest, because they represent the most extreme mass ratios for which accuratesuperhump measurements have been made. We use these to improve the ε(q) calibration, bywhich we can infer the elusive q from the easy-to-measure ε (the fractional period excess ofPsuperhump over Porb). This relation allows mass and radius estimates for the secondary star in anyCV showing superhumps. The consequent mass–radius law shows an apparent discontinuity inradius near 0.2 M , as predicted by the disrupted magnetic braking model for the 2.1–2.7 hourperiod gap. This is effectively the “empirical main sequence” for CV secondaries.
Subject headings: accretion, accretion disks — binaries: close — novae, cataclysmicvariables — stars: individual (OU Virginis) — stars: individual (XZ Eridani) —stars: individual (UU Aquarii) — stars: individual (KV Ursae Majoris) — stars:individual (BB Doradus) — stars: individual (U Geminorum) — stars: individual(IP Pegasi) — stars: individual (DW Ursae Majoris)
PATTERSON, J. ET AL. QCRIT, ε(Q), & MASS–RADIUS
4
1. INTRODUCTION
Superhumps are large-amplitude periodic waves in the light curves of dwarf novae insuperoutburst, and several other types of cataclysmic and low-mass X-ray binaries. Their mostcurious hallmark is their period — which is typically a few percent longer than the orbitalperiod, but changes slightly during the course of an outburst. There is now a complex zoologyof related periodic phenomena (Patterson et al. 2002a, Appendix A), although most starsparticipating in this phenomenon are dwarf novae and show “common” superhumps whichevolve in a consistent and repeatable way — substantially as described in the earliest papers onthe subject (Vogt 1974; Warner 1975, 1985).
A series of theory papers in 1988–1992 established the reason for superhumps: aneccentric instability grows at the 3:1 resonance in the accretion disk, and perturbation by thesecondary forces the eccentric disk to precess (Whitehurst 1988, Hirose & Osaki 1990, Lubow1991). Recent studies have confirmed this, added new details, and established the basic origin ofthe superhump light: the extra heating associated with periodic deformations of disk shape(Lubow 1992; Murray 1996, 2000; Kunze et al. 1997; Simpson & Wood 1998; Wood,Montgomery, & Simpson 2000). These studies have found that the mass ratio q=M2/M1 plays akey role, with superhumps produced only below a critical ratio, roughly qcrit~0.3. This limit hasbecome an article of faith; but different models give different estimates, and it has never beenestablished by observations of disks in actual stars (rather than in computers).
The perturbation making superhumps should scale with q, and it has therefore beentempting to use the observed precession rates as estimators of q, M2, or M1. This is a worthygoal, since the latter quantities are of great interest and are famously difficult to measure. Theearliest such efforts, starting with Mineshige et al. (1992), achieved only limited success,because they relied on expressions for qcrit and ε(q) derived solely from theory. Even to this day,there is still no published work which provides an evidentiary basis for knowing the value ofqcrit. A recent study (Patterson 2001, hereafter P01) proposed to replace the theoretical ε(q)dependence [roughly ε=0.34q] with an empirical expression [ε=0.22q] which correctlyreproduces the (ε, q) values for the best-studied stars. But this expression was only well-calibrated for middling values of q (~0.10–0.17). In this paper, we report new observations atlow and high q to remedy this shortcoming, and study the dependence of superhumps on Porb, toestablish a measured qcrit. We also show how ε(q) can be used to establish an accurate mass–radius relation for the secondaries in short-period cataclysmic variables.
2. OBSERVATIONS
This paper is another in our series on the superhumps of cataclysmic binaries (just in caseyou didn’t know). As in previous papers, we study long time series of differential photometry inorder to identify periodic signals. Periods displaced by a few percent from Porb are identified assuperhump phenomena. Most of the light curves were obtained at observing stations of theCenter for Backyard Astrophysics (CBA), a worldwide network of small telescopes(http://cba.phys.columbia.edu/). A wide distribution in longitude is especially important,because period-finding can be frequently confused by 24-hour aliasing.
PATTERSON, J. ET AL. QCRIT, ε(Q), & MASS–RADIUS
5
In this paper we report details of photometric campaigns on five stars, and discuss threeothers — all stars with independently known mass ratios. This is in order to establish anempirical ε(q) calibration. Then we will report our overall survey results and try to answer thequestion “which stars superhump?” We will find that superhumping is strongly correlated withorbital period — sufficiently strongly that the mass ratio may be the sole determining factor.These are essentially summary reports on the individual observing campaigns; some will bereported later in greater detail.
3. OU VIRGINIS
The history of this eclipsing dwarf nova is well reviewed by Vanmunster, Velthuis, &McCormick (2000). Superoutbursts occurred in May 1999, June 2000, May 2002 (probably),and May 2003. Thus the recurrence interval could be ~360 days. However, the superoutburstsof many dwarf novae recur with similar periods, so this probably reflects the inevitableperiodicity of visual monitoring activity for stars near the ecliptic. The star is still notextensively monitored, and superoutbursts last only 10–14 days, so some superoutbursts (andmost short outbursts) will likely be missed.
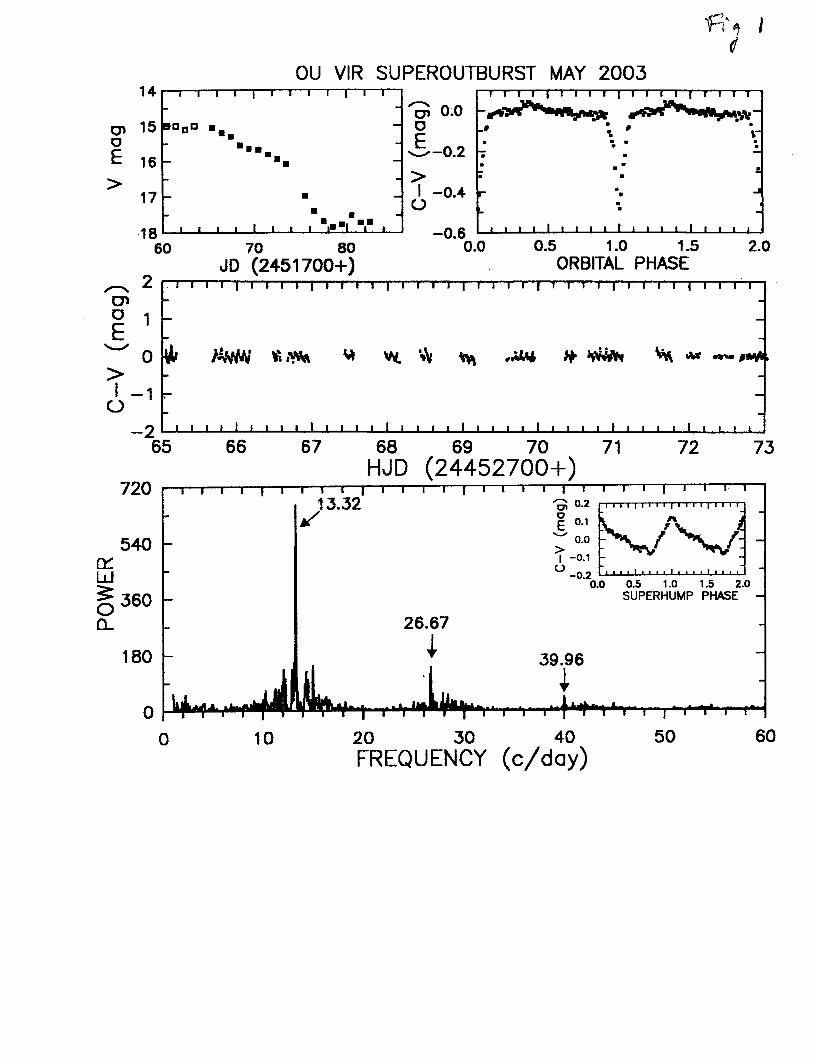
A superoutburst was discovered and announced by R. Stubbings and M. Simonsen on 4May 2003 (JD 2452763). CBA photometry began 2 nights later, with the star near V=15.1, andcontinued for 50 nights. The upper left frame of Figure 1 shows the eruption light curve, and asummary observing log is given in Table 1. The eruption light curve looks altogether normal forSU UMa-type dwarf novae: an unobserved rise, a steady decline at ~0.12 mag/day, followed bya sharp drop to a level slightly above minimum light. That level was near V=17.6, about 0.5–1.0magnitude above true quiescence; this too is a common feature of these dwarf novae.
All the light curves were punctuated by strong superhumps, and deep eclipses recurringwith Porb=0.07271 d. The eclipse depths varied from 0.4 mag to 1.0 mag on the “precession”cycle (the beat of orbital and superhump periods), as is also commonly found in eclipsing dwarfnovae. The mean orbital waveform near maximum light (summed over the first five days, toencompass exactly two beat cycles) is shown in the upper right frame of Figure 1.
We obtained very extensive coverage for the first 8 days of outburst. To prepare the lightcurves for time-series analysis, we subtracted the mean and trend from each night’s light curve,spliced them together, and removed eclipses. The resultant light curve, seen in the middle frameof Figure 1, is dense enough to overcome aliasing difficulties, and long enough to give goodfrequency resolution. The bottom frame of Figure 1 contains the resultant power spectrum,showing an obvious strong signal at the superhump frequency ωsh=13.32(2) c/d and twoharmonics.22 Synchronous summation at that frequency gave the mean waveform, shown in theinset. This is basically the familiar waveform of a common superhump.
We then subtracted these signals from the time series and recalculated the powerspectrum, in order to look for weaker periodic signals which might be hiding in the window 22 In this paper we use c/d as a shorthand for cycles day–1.
PATTERSON, J. ET AL. QCRIT, ε(Q), & MASS–RADIUS
6
pattern of the superhump. We found no certain detections, although there were peaks at 40.84and 53.68 c/d (not shown), which correspond respectively to 3ωo–Ω and 4ωo–3Ω under the usualωsh=ωo–Ω prescription (where Ω is the putative — and generally unseen — frequency of diskprecession).
The superhump seemed to endure throughout the 50-day campaign, although we couldnot unambiguously track it past the first 16 days. Just for the record, its ephemeris near eruptionpeak was found to be
Maximum light = HJD 2,451,765.1201(10) + 0.07508(9) E. (1)
The observed fractional period excess of the superhump is ε=(Psh–Porb)/Porb=0.0326(15).Resolution of the eclipse shape at quiescence has yielded a fairly accurate value for the massratio (Feline et al. 2004a). This will be useful in Section 12.
4. XZ ERIDANI
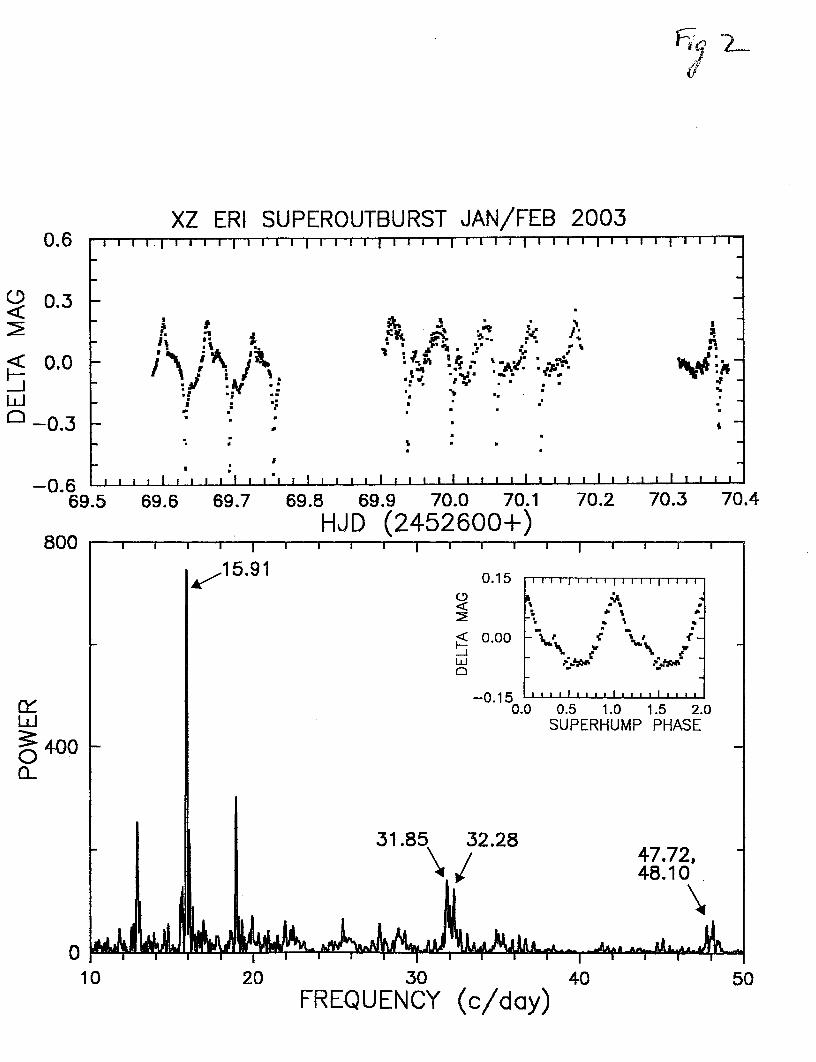
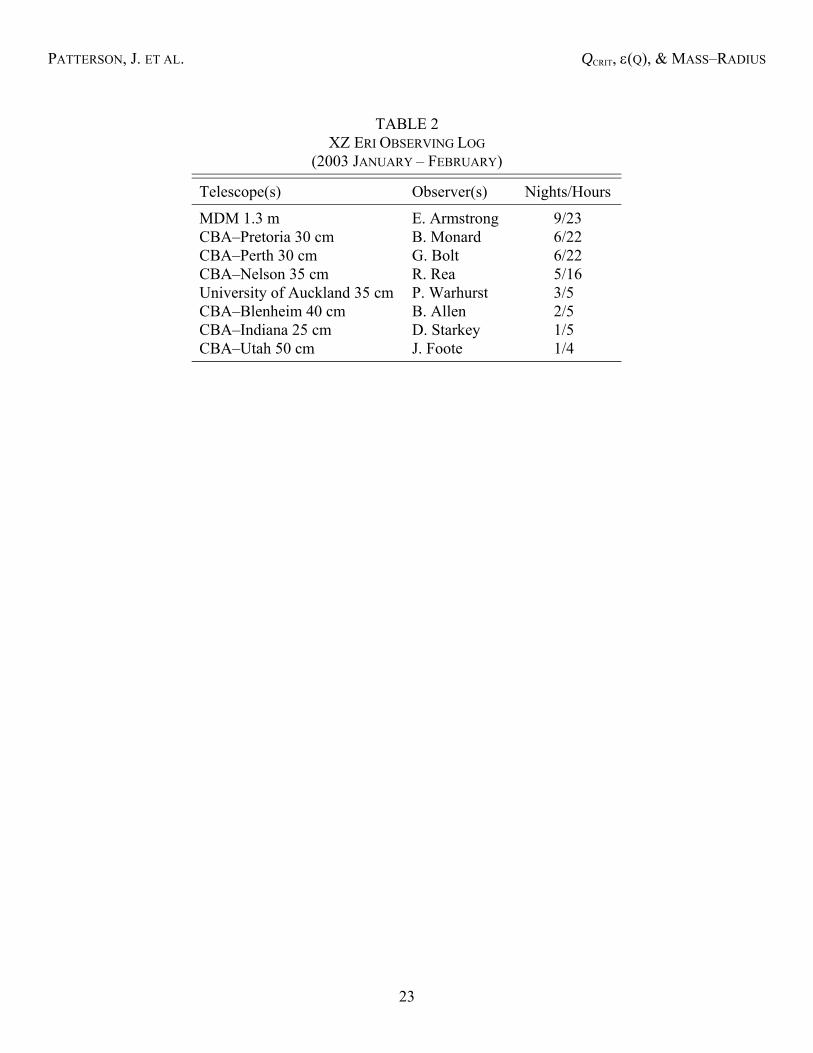
Woudt & Warner (2001) reported deep eclipses in the quiescent light curves of this dwarfnova, recurring with a period of 0.06116 d. This made the star an attractive target forphotometry during outburst. So when Rod Stubbings found the star at V=15 on 27 January 2003,we immediately launched a campaign, which continued for 10 days. The first observations,those of Greg Bolt on 28 January, showed obvious strong superhumps. Much of our data hasalready been included in the study of Uemura et al. (2004); here we give a briefer descriptionlimited to the superhumps. The summary observing log is given in Table 2.
A sample light curve is given at the top of Figure 2, which shows large superhumps andsharp eclipses. We obtained good global coverage (Africa, North America, New Zealand,Australia), and hence were essentially immune to aliasing problems. The power spectrum of thespliced 10-day light curve, with eclipses removed, is given in the lower frame of Figure 2, withsignificant signals flagged with their frequencies. The main signal occurs at ωsh=15.915(11) c/d,along with the first two harmonics. In addition there are significant signals slightly blue-shiftedfrom the harmonics. In the customary ωsh=ωo–Ω notation, these signals occur at 2ωo–Ω and3ωo–2Ω. These “sideband” signals are commonly produced in CV superhumps. Inset is themean superhump waveform, which tracked the ephemeris
Maximum light = HJD 2452668.0336 + 0.06283(8)E. (2)
The superhump period excess is ε=0.0273(13). Feline et al. (2004b) analyzed white-dwarf and hot-spot contact times in the quiescent eclipses, and derived an accurateq=0.1098(17). These numbers will be useful in Section 12.
5. UU AQUARII
This novalike variable eclipses with a period of 0.16358 d, and has been well studied byBaptista et al. (1994), who deduced q=0.30(7) from the eclipses. This makes it of high interest
PATTERSON, J. ET AL. QCRIT, ε(Q), & MASS–RADIUS
7
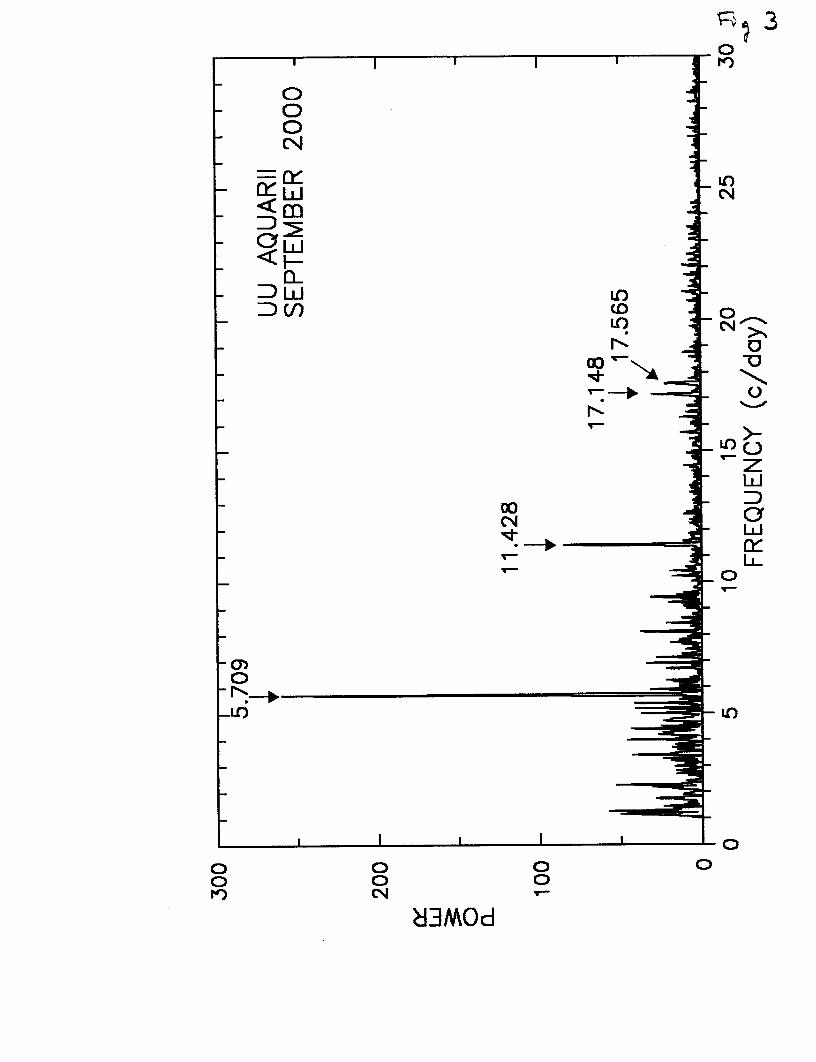
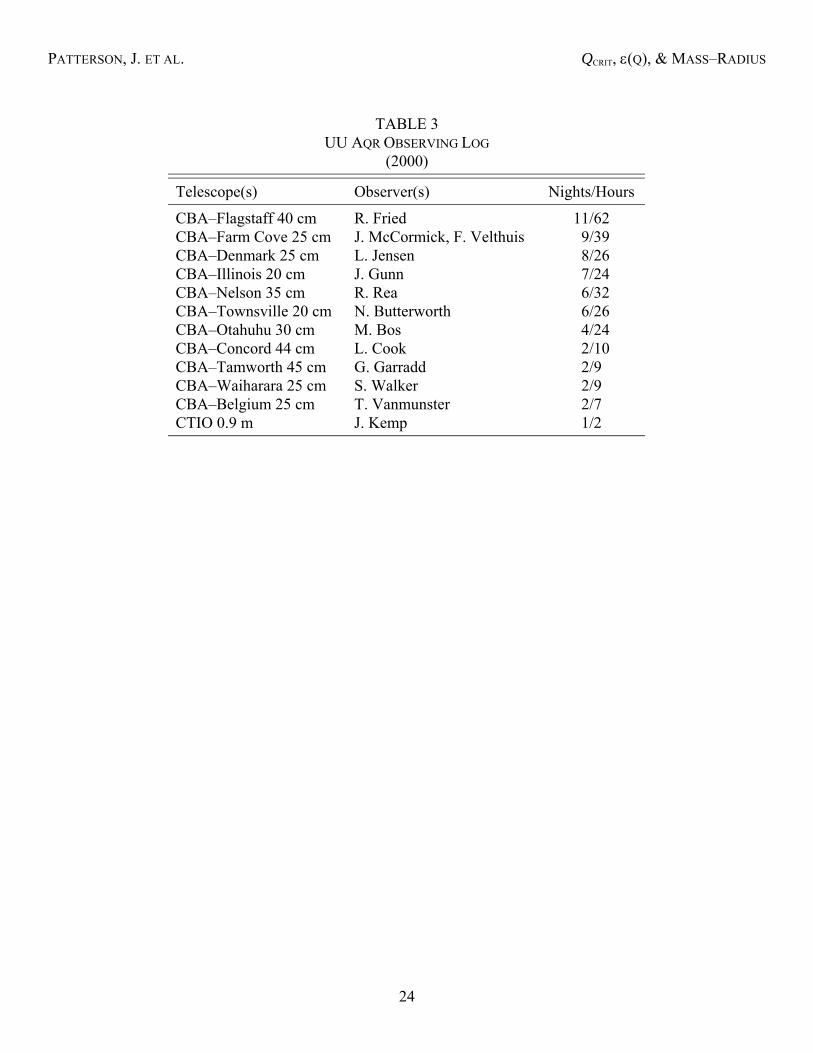
for superhumps. A 1998 CBA observing campaign gave some evidence for periods slightlylonger than Porb; but the signals were weak, somewhat unstable, and troubled by aliasing. So weimproved our density and distribution of coverage, and tried again in 2000. This campaigncovered 57 “nights” and 270 hr of data, spread over 21 days. The summary log is given in Table3. Observing stations spanned the full range of terrestrial longitude (North America, NewZealand, Australia, Europe), so there was no confusion due to aliasing. And the star cooperatedby staying in a single luminosity state (V~13.9) throughout the campaign.
Figure 3 shows a power spectrum of the full light curve, after removing eclipses. Apowerful superhump is present at 5.711(6) c/d, along with two harmonics. In addition there is asatellite signal at 17.565(10) c/d. Adopting ωo=6.113 c/d and the usual convention that ωsh=ωo–Ω, we see that the satellite signal occurs at 3ωo–2Ω. This fine-structure is a common property ofapsidal superhumps (Skillman et al. 1999). Just for the record, the superhump tracked theephemeris
Maximum light = HJD 2451790.1013 + 0.17510(18) E. (3)
6. KV URSAE MAJORIS (= XTE J1118+480)
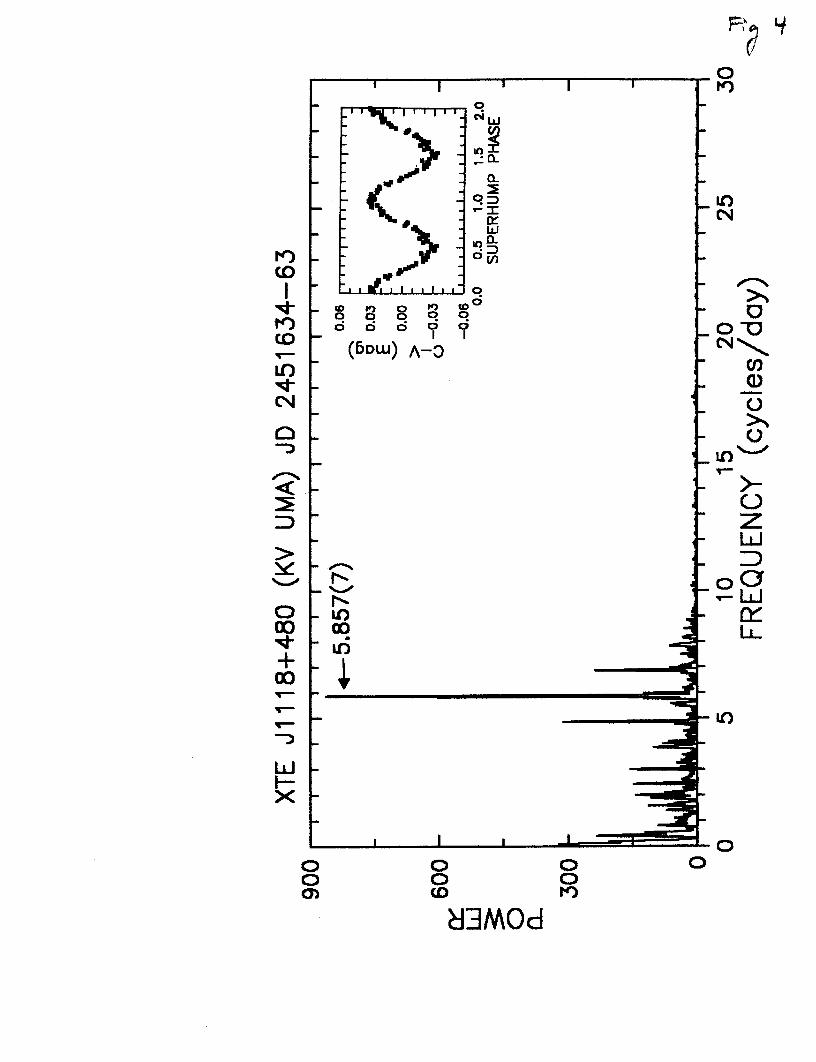
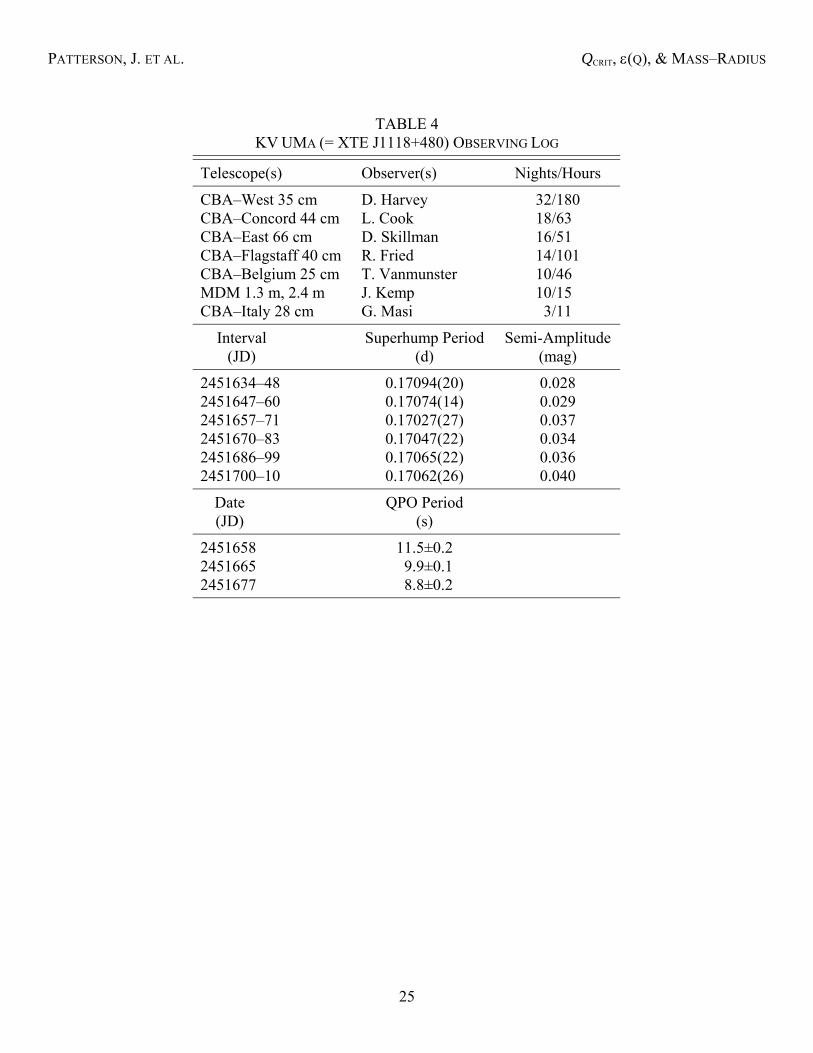
This star, now an extensively studied low-mass X-ray-binary, was discovered as a brighttransient by the Rossi X-ray Timing Explorer on 29 March 2000 (Remillard et al. 2000). CBAphotometry began two days later, and the first night’s observation (by Lew Cook) showed a 4-hour signal in the light curve, which proved to be stable after a few days’ coverage (Cook et al.2000, Patterson et al. 2000a). We continued the campaign for 88 days, accumulating a total of460 hrs over 92 nights. The summary observing log is given in Table 4.
Figure 4 shows the power spectrum of the first 30 days, revealing a stable signal at5.857(5) c/d. The mean waveform, shown in the inset figure, is essentially a pure sinusoid.Maximum light tracked the ephemeris
Maximum light = HJD 2451634.848 + 0.17073(15) E. (4)
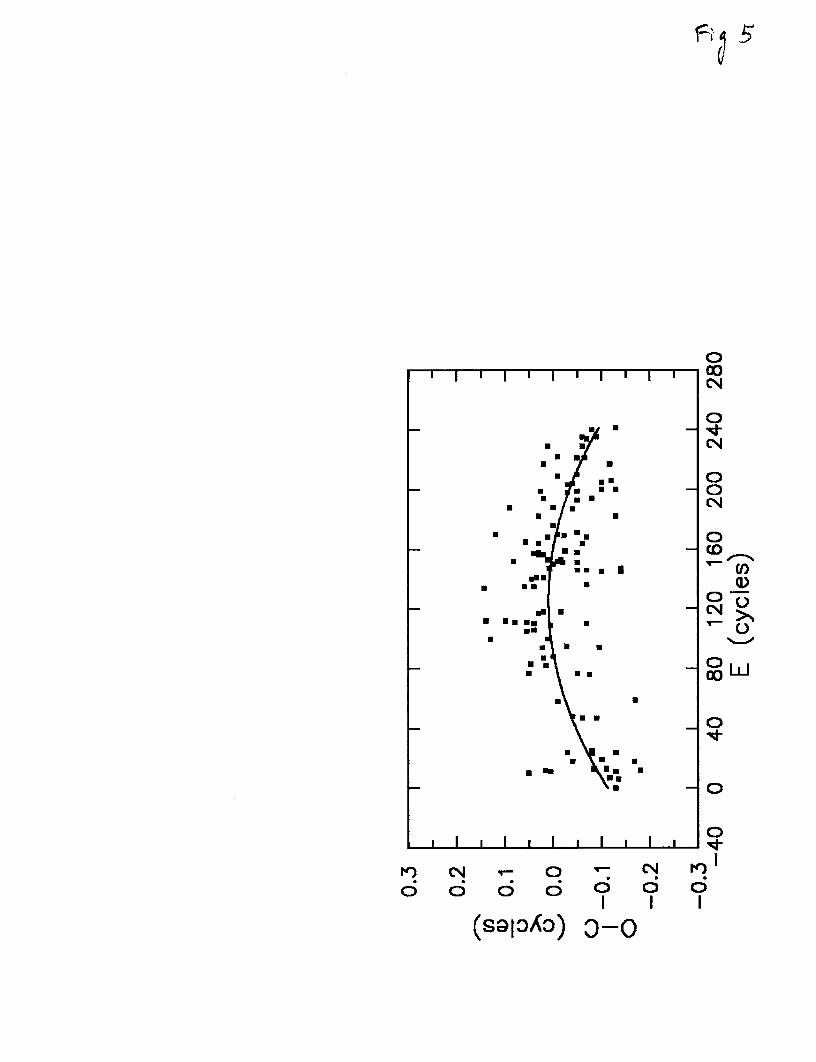
We tracked this signal throughout the campaign. The amplitude and waveform remainedsubstantially unchanged, but timings of maximum and minimum light gradually drifted from aconstant-period ephemeris. Figure 5 shows an O–C diagram of the timings during the first 45days of our campaign, relative to a test period of 0.17065 d. The curvature indicates a slowperiod decrease ( P& =–1×10⁻⁶). Table 4 catalogues the period changes in various intervals.
More details about the superhump are given by Uemura et al. (2002) and Zurita et al.(2002). The orbital period is known to be 0.169937(1) d from the observed ellipsoidalmodulation of the secondary in quiescence (Zurita et al. 2002), and we adopt Psh=0.17073(12) das a mean value appropriate to the eruption peak (within 0.4 mag of maximum light, the sameconvention we use in judging Psh in dwarf novae). Thus we obtain ε=0.0047(9). The mass ratiois more elusive, since the system does not eclipse; but Orosz et al. (2001) argued for q=0.037(7)from measuring the rotational velocity of the secondary.
PATTERSON, J. ET AL. QCRIT, ε(Q), & MASS–RADIUS
8
This supplies another point for the ε(q) calibration in Section 11. The inclusion of ablack-hole X-ray transient in this collection of CVs may be problematic. But superhumps haveconsistently been seen in the optical light curves of X-ray transients, and their properties bear areasonable resemblance to those of CVs (O’Donoghue & Charles 1996, Zurita et al. 2002, Figure1 of P01). So for the present, we accept this calibration point.
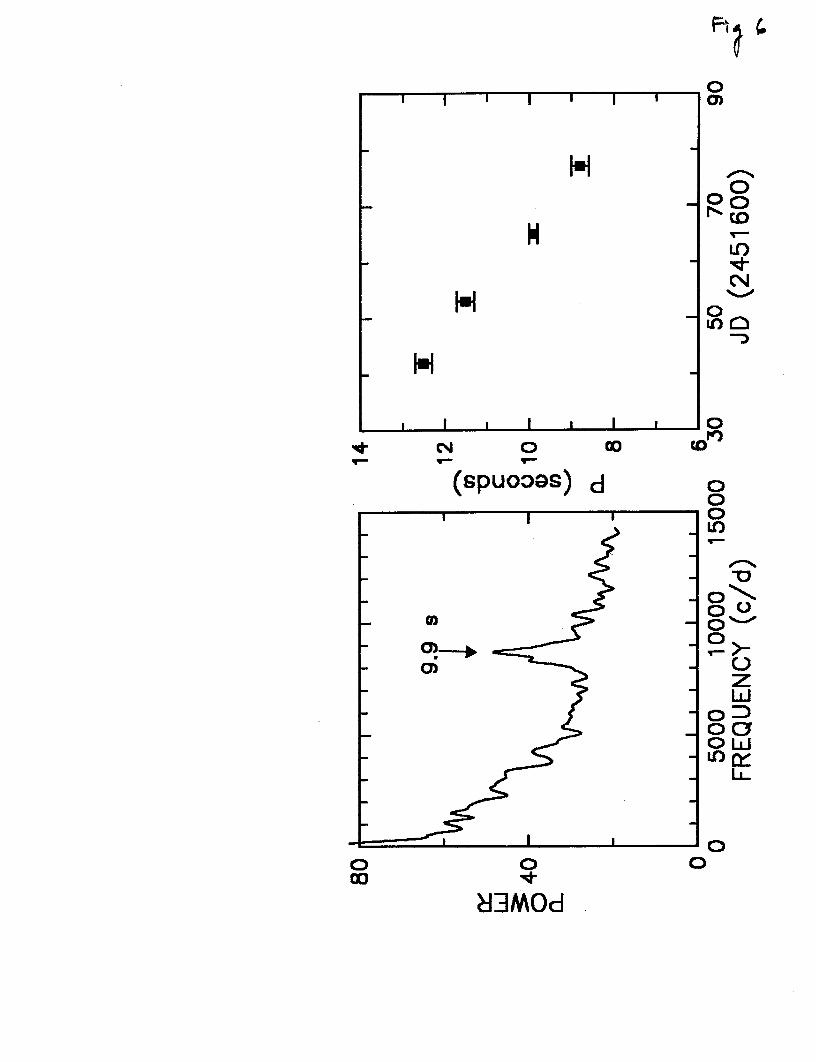
From the earliest observation, we were puzzled that the light curves were so noisy,despite no obvious flickering. Essentially all light curves showed a 0.1 mag noise band. After afew days of bafflement, we tried fast photometry at 2 s time resolution; this still showed a largenoise band, but power spectra of short segments revealed significant peaks at periods near 10 s.The peaks moved around rapidly, and we only achieved a stable result by averaging powerspectra of many short observations. The left frame of Figure 6 shows the mean power spectrumfrom 36 10-minute observations on JD 2451665. Other detections of this quasi-periodic signalare listed in Table 4, and shown in the right frame of Figure 6.
7. BB DORADUS (= EC 05287–5857)
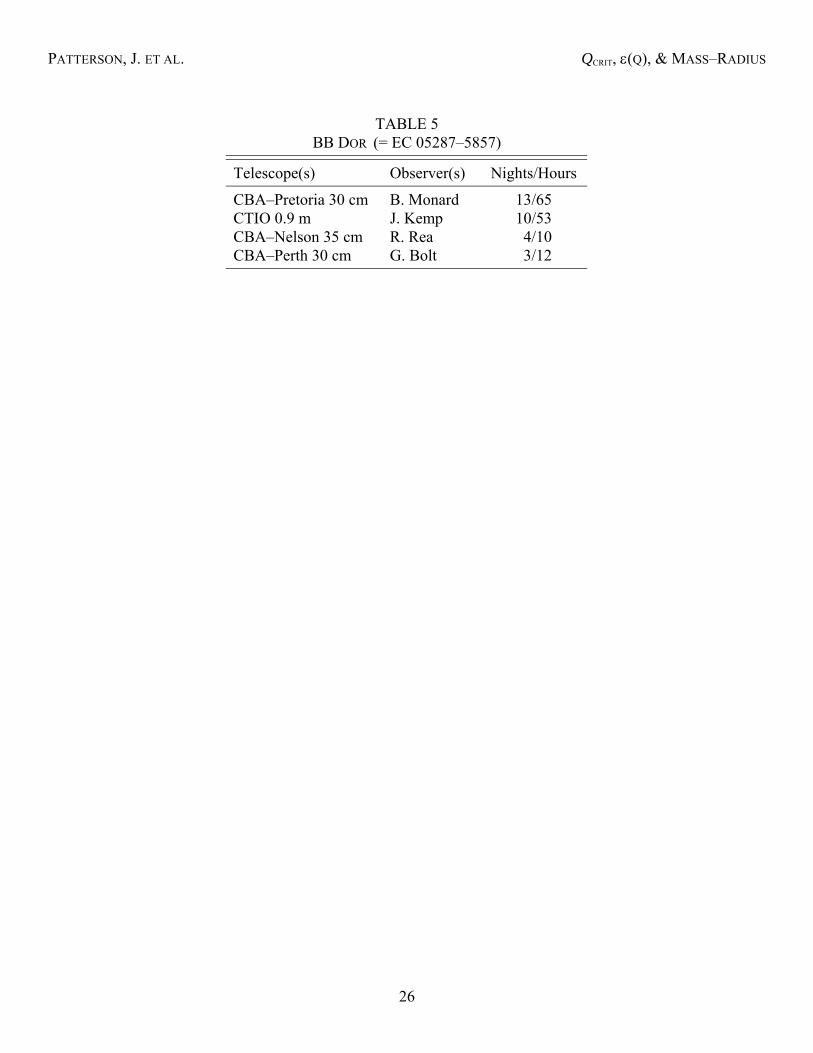
This novalike variable was discovered in the Edinburgh–Cape survey for blue stars (Chenet al. 2001). Chen et al. suggested a tentative period of 0.107(7) d in a radial-velocity search,and this motivated us to carry out a photometry campaign in October–November 2002. Weaccumulated 140 hr of coverage over 28 nights during the 45-day campaign. The star remainednear V=14.0 throughout, the “high state” of this probable VY Scl star. A summary observing logis given in Table 5.
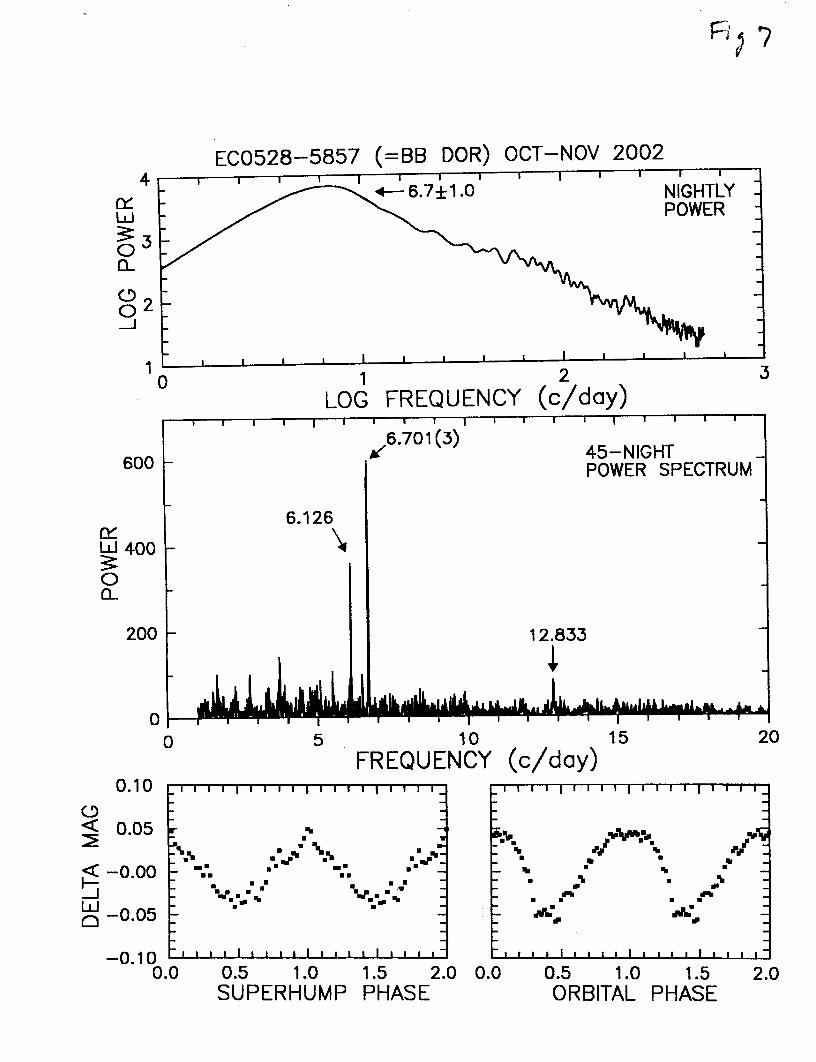
The light curves were typical of most novalikes, dominated by strong flickering; samplesare given in Figure 8 of Chen et al. The top frame of Figure 7 shows the average (“incoherent”)nightly power spectrum, formed by averaging the nights of long (>6 hr) coverage. A signal near6.7±1.0 c/d is present, and flickering with P∝ν–1.3. The middle frame shows the “cleaned”power spectrum (alias peaks removed by subtraction) of the 45-day light curve, with thefrequencies of significant signals marked. There was no detection near the candidate orbitalfrequency. The longitude distribution was essentially perfect (Chile, New Zealand, Australia,South Africa), so there were no aliasing problems. This enabled us to clean the power spectrumwithout ambiguity.
The dominant signal occurs at 6.701(3) c/d, with weaker signals at 6.126 and 12.833 c/d.This trio of frequencies suggests a familiar pattern in the numerology of superhumps: if thestrongest signal is ωo, then the other signals could be superhumps at ωo–Ω and 2ωo–Ω. Themean orbital and (ωo–Ω) superhump waveforms are seen in the lowest frame of Figure 7. Sincethis pattern is very common and the radial-velocity evidence is quite weak, we are willing to beton this identification. The orbital ephemeris is then
Maximum light = HJD 2452583.438(6) + 0.14923(7) E. (5)
But we might be wrong. It is also possible that the dominant signal is a ‘negative’superhump, with the wave blue-shifted to a higher frequency ωo+N, and the weaker signal at6.126 c/d representing ωo. If so, then the third signal occurs at 2ωo+N — occasionally, though
PATTERSON, J. ET AL. QCRIT, ε(Q), & MASS–RADIUS
9
not commonly, seen among negative superhumpers. The main reason we disfavor thisinterpretation is that the required value of ε (–0.094) is somewhat out of bounds for the family ofnegative superhumpers (see Figure 1 of Patterson 1999), The equivalent value for a positivesuperhump interpretation [ε=0.094(1)] accords fairly well with what is expected at such a longPorb (see Sec. 10–12 below).
Naturally, a radial-velocity study to resolve this ambiguity is warmly recommended!
8. U GEMINORUM AND IP PEGASI
These two dwarf novae are of special interest because they are eclipsing double-linedbinaries, thereby satisfying in principle the requirement for accurate measurement of masses.Smak (2001, 2002) deduced q=0.36(2) and 0.45(4) for these stars respectively. Extensive CBAphotometry has failed to reveal superhumps in either star — even in very long eruptions, as longas the superoutbursts of SU UMa stars.23 The U Gem upper limit on q may be particularlyconstraining, because several superhumping stars have a q provably or likely near 0.3. Belowwe will use this, in conjunction with other data, to estimate an upper limit of qcrit=0.35 for thecreation of superhumps.
9. DW URSAE MAJORIS
DW Ursae Majoris is an eclipsing novalike variable which shows high and low states,and many phenomena charactistic of the “SW Sex” class of CVs. A fortuitous HST observationduring a low state revealed the steep-walled eclipse of a pure white dwarf, enabling thededuction of a q(i) relation (Araujo-Betancor et al. 2003). This yielded q>0.24. We havereported CBA time-series photometry, which shows long-lived episodes of negative and positivesuperhumps, yielding ε=0.0644(20) (Patterson et al. 2002b). Since we know of no star showingsuperhumps at q>0.35, and U Gem apparently fails to superhump at q=0.36±0.02, we areinclined to regard 0.36 as an upper limit. Thus we regard q=0.24–0.36 as being very likely inDW UMa — sufficiently likely to use as a constraint.
Also, under the assumption that ε is strictly a function of q, DW UMa is probably notnear the upper limit of q — since we need to leave room for stars with larger ε. Let us adoptq=0.24–0.32. For this q, Araujo-Betancor et al. (2003) deduced a white-dwarf mass of 0.73(3)M to fit the observed durations of ingress and egress. This determines M2 and R2 from Kepler’sLaws: from (0.18 M , 0.29 R ) to (0.24 M , 0.32 R ). These are not exactly “hard”measurements, since they require an assumption from superhump theory. But it’s a fairly weakassumption (that ε depends solely or mainly on q); and in an enterprise where constraints arehard to find, we consider them worthy of use.
23 A recent study of AAVSO visual data on the long U Gem outburst of 1985 appears tocontradict this (Smak & Waagen 2004). Our data so far, including some in the same outburst,does not confirm this; and the published evidence does not seem strong. But the point definitelywarrants closer study.
PATTERSON, J. ET AL. QCRIT, ε(Q), & MASS–RADIUS
10
10. WHICH STARS SUPERHUMP?
We have been measuring CV light curves for superhumps since 1977, and systematicallysince 1993. To date we have obtained results for ~200 stars. At first we concentrated on short-period dwarf novae, since the first superhump discoveries were in such stars. Soon we expandedthe search to include all CVs bright enough (usually V~15–16) to get onto our radar screens. Ina typical case, we use the globally distributed telescopes of the CBA for a campaign lasting 1–2weeks, with ~40–150 hr of observation. Power-spectrum analysis of the light curve then tests forthe presence of periodic signals. The detection threshold is always sensitive to the erraticvariability (“flickering”) for which CVs are famous. Dwarf novae in outburst typically havevery quiet light curves, in which case 1–3 hour periodic signals can be detected down to a semi-amplitude of ~0.015 mag. Novalike variables typically have strong flickering, which degradesthe detection limit to ~0.03 mag.
Other groups (especially the Kyoto group: Kato et al. 2004) have also been publishingsuperhump detections, of course. But so far there has been no accounting of the actual successrate, or of the observing strategy. Thus the perceptions of superhumps in the greater CV andaccretion-physics communities have been in the form of “conventional wisdom”, graduallyformed by sheer weight of publication rather than addressed in any specific study. We aim toremedy that situation here.
As stated above, we tend to target all CVs above our brightness threshold. But very earlyin this enterprise, it was clear that superhumps — or at least the common superhumps which arethe subject of this paper — are absent in quiescent dwarf novae. It was also apparent thatsuperhumps avoid CVs of long orbital period, and avoid highly magnetic CVs (AM Her stars).Of course, these are three elements of today’s conventional wisdom. Since we wished to test thelatter, we invested considerable time in stars which would violate those rules. But since we alsowished to discover superhumps, we used those rules somewhat in target selection, especiallywhen the rules seemed to be very firm indeed. So our study does not quite have the merit of an“unbiased survey”. As a result of this dual strategy, we found many common superhumps, butalso accumulated enough information about the range of the phenomenon to write this section ofour paper.24
Most of the brighter CVs have a known orbital period. Since superhumps obviouslyfavor short Porb, we tried to observe all CVs with Porb<4 hr. For old novae and novalikes, wesucceeded (within our brightness limits). Some dwarf novae eluded our net by virtue of rareoutbursts or southerly declination; but we still managed to observe ~120 dwarf novae withPorb<4 hr. We also observed a few dozen stars of longer Porb, and a few dozen of unknown Porb.
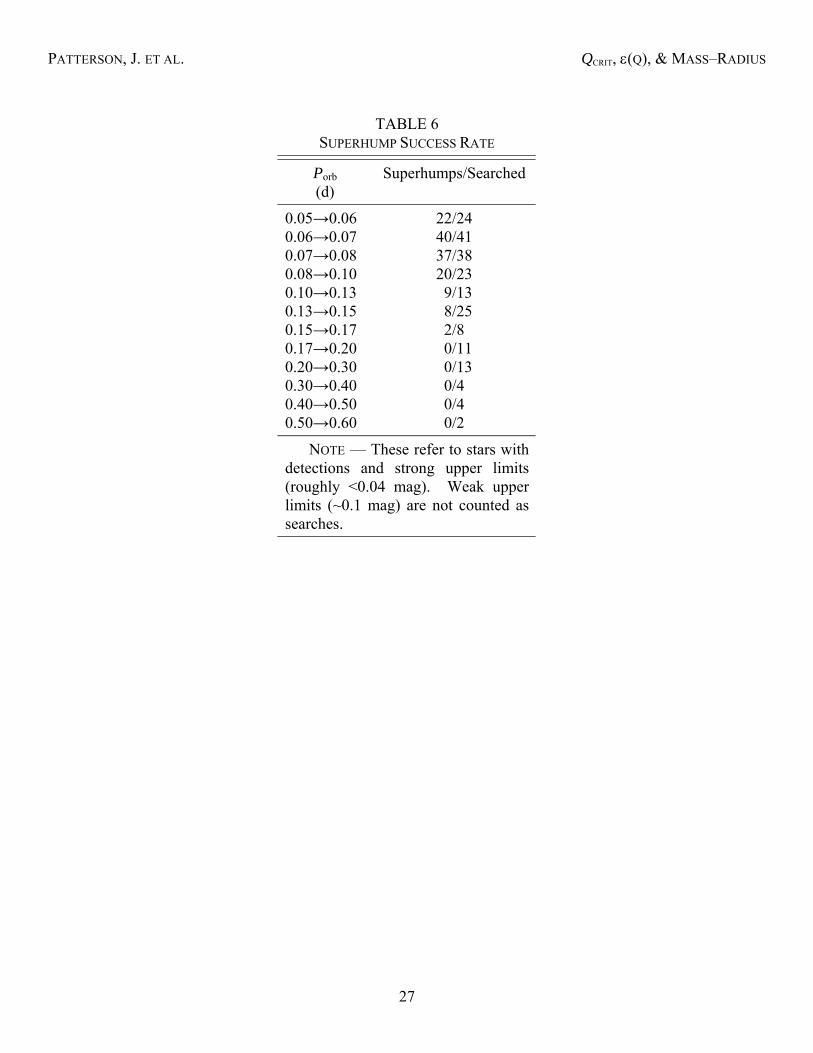
We have published superhump detections in ~60 stars, with the details of ~50 moredetections still awaiting a precise measure of Porb. Table 6 summarizes the overall results, withmost of the positive detections previously tabulated (Patterson 1998, Patterson et al. 2003; 24 And to find a range of phenomena related to superhumps but much more poorly known. Aone-page summary of these can be found in Appendix A of Patterson et al. (2002a).
PATTERSON, J. ET AL. QCRIT, ε(Q), & MASS–RADIUS
11
hereafter P98, P03). Nearly all short-Porb stars in their “high states” show superhumps, and alllong-Porb stars don’t. For dwarf novae, the brightness is the obvious high-state identifier. Mostold novae and novalikes are considered to be in a high state, because their absolute magnitudesare similar to those of erupting dwarf novae (Mv~4–6); a few are much fainter, and none of thelatter show superhumps. Thus a better statement is probably: all nonmagnetic CVs superhump ifthey have a Porb sufficiently short and an M& sufficiently high. How short, and how high?
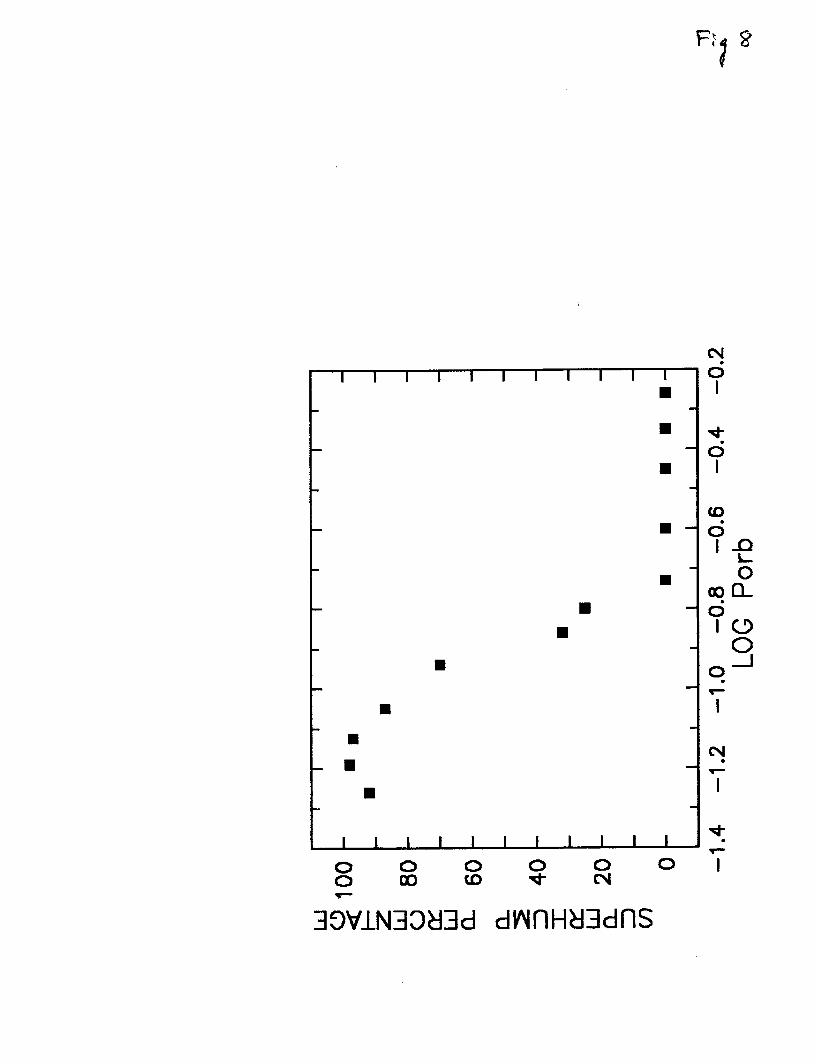
Based on Table 6, Figure 8 shows the dependence of superhump percentage on Porb. Thatpercentage declines to 50% at Porb=3.1±0.2 hr, and no (positive) superhumps are definitely seenwith Porb>4 hr. A few other notes are pertinent to this result.
1. Table 6 — and for that matter all remaining discussion — applies to all (nonmagnetic) CVs,not just those with CBA data. The difference is minor, though; we obtained adequately longtime series for 126 of the 138 stars with positive detections, and all 68 nondetections. Wedid exclude from consideration ~6 stars for which superhump claims have been made, whenwe judged the quality of evidence to be insufficient (usually because adequate power-spectrum evidence is not presented).
2. We mainly excluded AM Her stars from consideration, but observed all the sufficientlybright DQ Her stars (intermediate polars). None of the latter produced clear superhumps,although the reason for this is unclear (“high state” is poorly defined for such stars).
3. A possible exception to these trends is TV Col, a magnetic CV where Retter et al. (2003)reported positive superhumps despite the long Porb (5.5 hrs). Our two campaigns on TV Coldid not confirm this; but superhumps are known to be transient in many novalikes, so thestar remains an interesting candidate. Unfortunately, it is unlikely that magnetic CVs canever be used for our purposes [qcrit, ε(q), mass–radius], since they do not contain full disks.
4. Although superhumps are clearly dependent on a high– M& state, the causal relation isunclear. It seems likely that the true underlying cause of both is viscosity, which permitsaccretion and enlarges the disk, thereby giving access to the resonance. Since M& is(roughly) measurable and viscosity is not, we characterize the dependence in terms of M& .That might be correct. But if — as is likely — the real requirement is the transition to thethermal instability, then the relevant condition is more complex. Osaki (1996) characterizedthe thermal instability condition as roughly critM& =10–9 M /yr Po [hr]1.8, and that seems aboutright.
5. These are the circumstances relevant to superhump manufacture. But superhumpscommonly outlive the high– M& states which spawn them, sometimes for as long as a fewhundred or a few thousand orbits. No one quite understands this.
6. Are there superhumps just below our detection threshold? Well, we never found commonsuperhumps of dwarf novae near the threshold; all were much stronger, or were undetected.Thus we suspect that our net was 100% accurate for dwarf novae — or to put it another way,“there are no small common superhumps”. For novalikes, too, most detections were far
PATTERSON, J. ET AL. QCRIT, ε(Q), & MASS–RADIUS
12
above threshold; but a few were not, and a few others were classified as nondetectionsbecause they barely failed to have sufficient amplitude and/or repeatability. We areconfident that all detections are certain, but a few classified nondetections may simply resultfrom low sensitivity.
11. THE TRANSITION REGION NEAR 3 HOURS
In a perfect world, superhumps would depend strictly on q, all white dwarfs would havethe same mass, and all secondaries would obey a single mass–radius relation (e.g., “the mainsequence”). If all of that were true, there would be a perfectly sharp transition separating thesuperhump-eligibles from the ineligibles. There would also be a perfect correlation between Porb
and ε.
Just how perfect is our world? Well, in this very limited sense, it seems to be prettygood. The rms scatter in ε(Porb) is quite low, just 21% (see Figure 20 and Sec. 6 of P03). Thisimplies a scatter of <21% in M1 and <11% in mass–radius. We can also apply superhump theoryto the Porb dependence seen in Figure 8 to obtain a constraint on qcrit. Applying Porb=3.1±0.2 hrsto Eqs. (7), (8), and (9) of P03, we obtain
qcrit = (0.36±0.03) <m1>–1 α–2.05 (6)
from Figure 8, where <m1>=<M1>/M and α=R2/RZAMS. Since the observed upper limit to q isvery nearly the same (0.32–0.38, see below), we basically have
α = <m1>–½. (7)
This is nearly the same constraint as obtained in P03 from a separate argument (the value of ε ata given q, see Sec. 6.2 and 6.3 of P03). For an assumed <m1>=0.75, it implies α=1.15 —secondaries 15% larger than RZAMS.
What about the width of the transition zone near 3.1 hr? We don’t have many stars in thisregion, but the narrowness of the transition implies that no great variance can exist in M1 or α.We carried out numerical experiments on trial populations of CVs with widely varying values ofM1, and found that the sharpness of the transition could not be reproduced with an rms scatter inM1 greater than 30%. This is consistent with, but not quite as constraining as, the result from thescatter in ε(Porb) (discussed in P03).
12. ε(Q)
What value of ε is produced by a given q?
We previously tackled this question with the data available in 2000 (P01). That studycontains a fuller discussion of these matters. In brief, we derived an empirical ε(q) calibrationfrom observations of eclipsing binaries of known q. A few new calibrating stars are now known,a few estimates are improved, and we now have an estimate for how the superhump phenomenon
PATTERSON, J. ET AL. QCRIT, ε(Q), & MASS–RADIUS
13
is distributed with Porb. These make it desirable to revisit the issue.
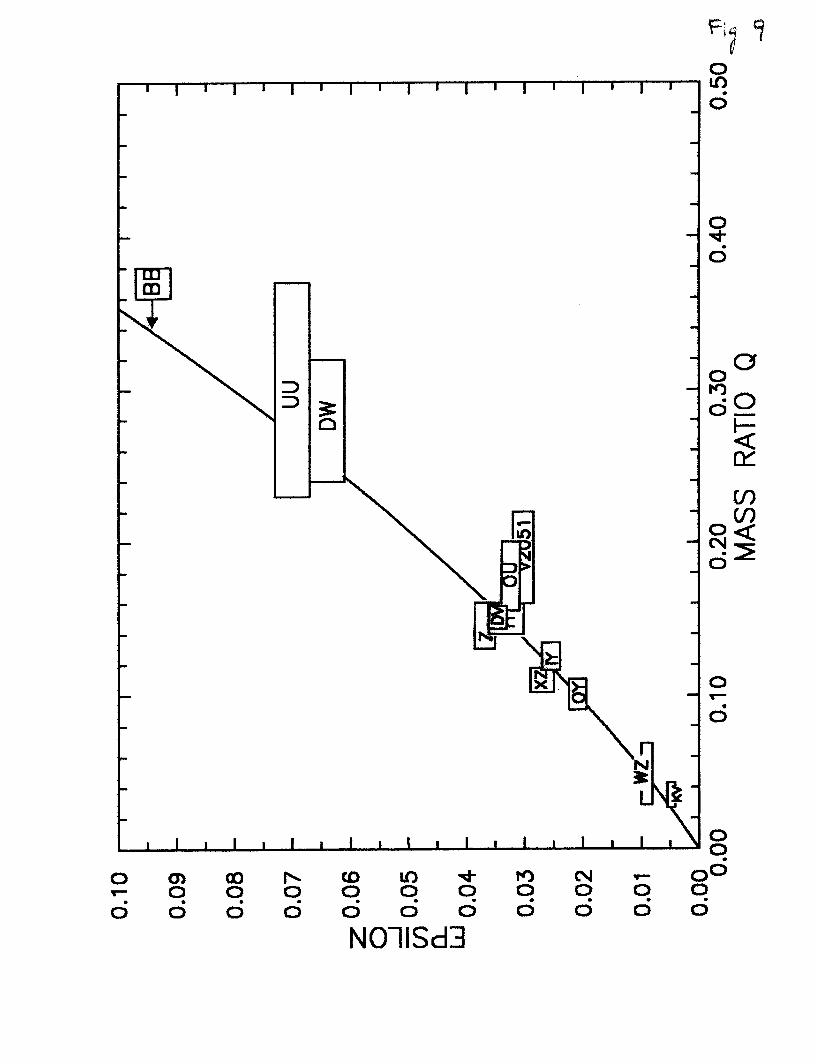
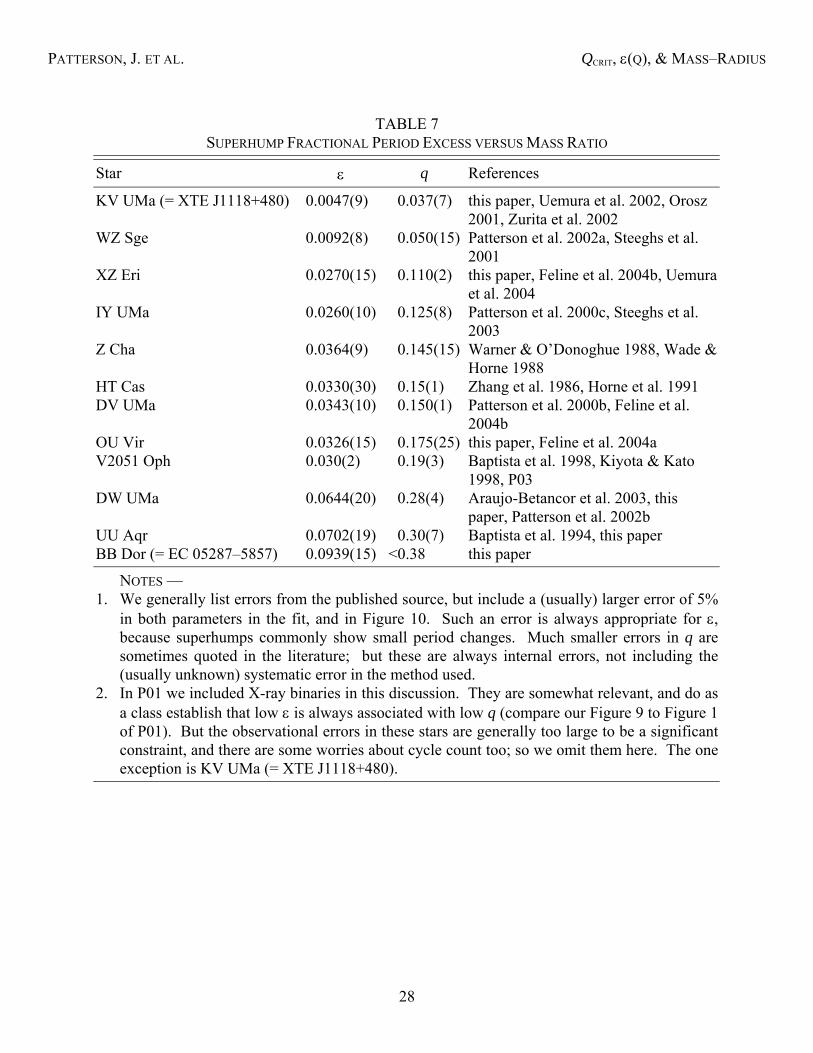
The relevant data are shown in Table 7 and Figure 9. The P01 linear ε(q) scaling remainsa roughly acceptable fit to the data. But ε ranges as high as 0.094 (at least), which impliesq=0.43 on the P01 scaling. This is probably too high. Theoretical models have suggested qcrit inthe range 0.20–0.35, and we assume the upper limit for U Gem (0.38) to be reliable. Refittingthe data after assigning q<0.38 to the largest known ε (BB Dor), we find a scaling slightlydifferent at large q:
ε = 0.18 q + 0.29 q2. (8)
This is likely an improvement on the P01 relation. On the assumption that ε is strictly a functionof q, this allows use of the easily measured ε as a surrogate for the elusive q.
13. MASS–RADIUS RELATION FOR THE SECONDARIES
So superhumps, when observed with sufficient precision and accompanied by an accuratePorb, seem to yield an accurate q. The observed low dispersion in ε(Porb) (Figure 20 and Sec. 6 ofP03) and to a lesser extent the sharpness of the transition in Figure 8 of this paper alsodemonstrate that the dispersion in M1 does not exceed ~20%. This implies an estimate of M2, notmerely q, for each superhumping star. And since lobe-filling secondaries obey a P ρ relation,it also implies a radius for each star.
Let’s see how this goes. The secondaries fill their Roche lobes, requiring
Porb [hr] = 8.75 (m2 / r23)–½, (9)
where m2 and r2 are in solar units (Faulkner, Flannery, & Warner 1972). This implies
r2 = 0.2355 Porb⅔ m1
⅓ q⅓. (10)
Figure 9 suggests that q is probably deducible from ε within ~10% in its best calibrated region(q~0.10–0.20). This error might rise as high as 20% for the smallest and largest values of q. Theresultant error in r2 is small, just 3–7%. The error resulting from the dispersion in m1 is alsosmall (<7%, since m1 varies by <20%). Unfortunately, though, superhump theory does notspecify the actual value of m1; it is coupled with α via Eq. (7).
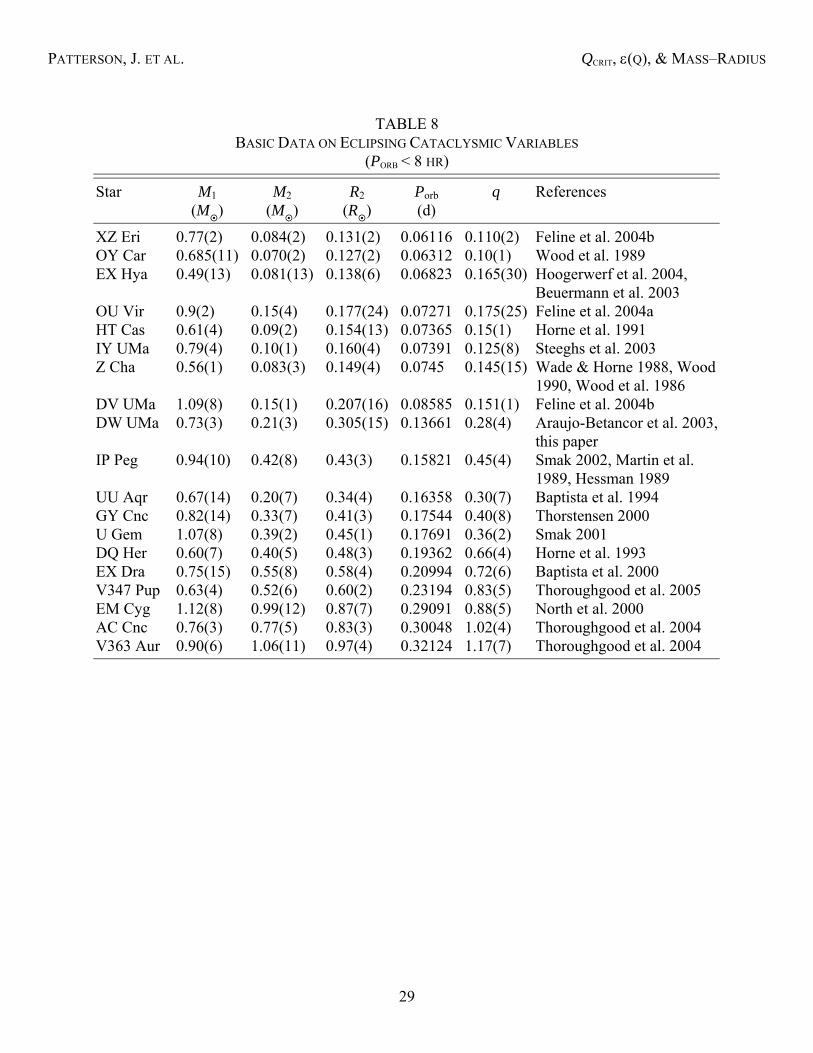
Help in this matter comes from several sources. Conventional measures of <m1> in CVshave yielded fairly consistent results: 0.7±0.1 (Shafter 1983), 0.74±0.04 (Webbink 1990), and0.77±0.21 (Smith & Dhillon 1998). We consider <m1>=0.75 to be a good choice. Secondly, theeight accurately known mass–radius pairs in short-period eclipsing CVs show an α substantiallyexceeding 1 [~1.2, comparing Table 8 and Figure 10 with the theoretical ZAMS of Baraffe et al.(1998)]. And thirdly, CV evolution models (e.g., Kolb & Baraffe 1999) adopting α=1 alwaysreach too short a minimum Porb (~66 compared to the observed 78 minutes); since r2∝Porb
⅔, thiscan be roughly fixed by adopting α=1.15. Thus the evidence favors <m1>=0.75, α=1.15,
PATTERSON, J. ET AL. QCRIT, ε(Q), & MASS–RADIUS
14
implying
r2 = 0.214 Porb⅔ q⅓ (11)
and
m2 = 0.75 q. (12)
For those few stars with a better m1 constraint available (eclipsers, and fast classical novae — forwhich we assign m1=1), we used that constraint rather than the default m1=0.75.
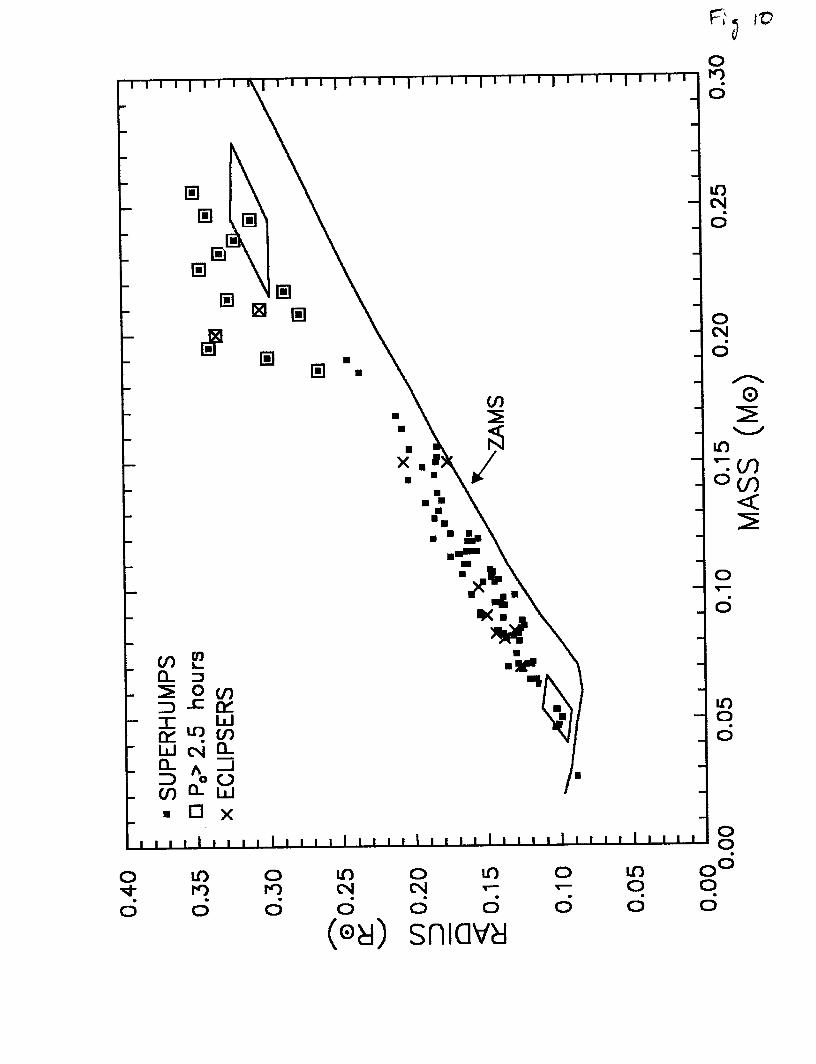
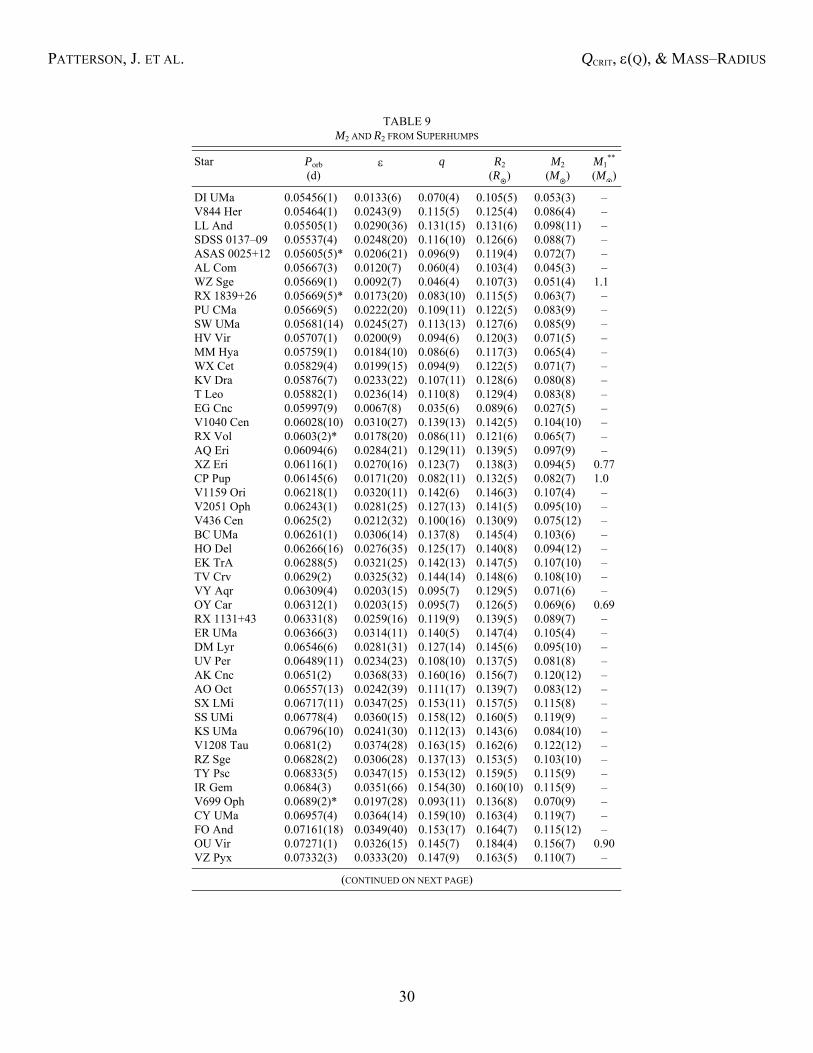
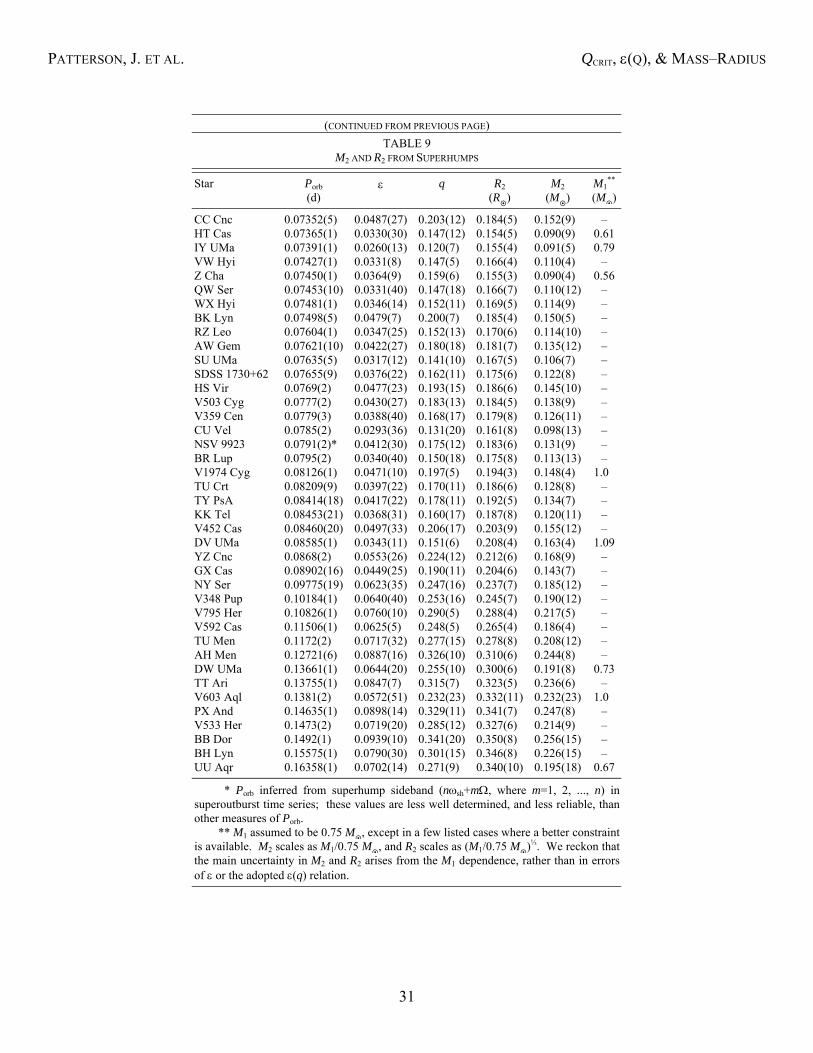
We then calculated the (m2, r2) pairs from the ε(q) relation, and show them as the filledsquares in Figure 10, along with values directly and independently obtained in eclipsing binaries(indicated by crosses). The data are shown in Table 9.25 The solid curve is the theoreticalZAMS mass–radius relation (the 10 Gyr models of Baraffe et al. 1998), extended to lower masswith the cold brown dwarf models of Burrows et al. (1993). This is very similar to thecorrelation shown in Figure 2 of P01, but differs slightly for high m2 (>0.18) because of thechanged ε(q) calibration.
The main lesson is the same one drawn by P01: CV secondaries are larger than ZAMSstars (i.e., α>1). Although the typical error in radius is ~10–12%, similar to the disagreementwith the ZAMS, it is nevertheless certain that the CV secondaries lie above the ZAMS, becausethe error diamonds move the points roughly parallel to the ZAMS — and also because theindependently derived crosses are well above the ZAMS.
An apparent discontinuity appears around 0.20 M . Secondaries less massive show greatconsistency, just slightly above the ZAMS (α~1.10). Secondaries more massive appear to begenerally larger, with α~1.30. Stars with Porb>2.5 hr are identified with enclosing boxes. Thusthese two categories define the two sides of the “period gap” — the Porb=2.1–2.7 hour regionwhere very few stars are found.26
In the simplest understanding of the period gap, secondaries detach from their Rochelobes when they become completely convective (Robinson et al. 1981, Rappaport et al. 1983).For single ZAMS stars this occurs near 0.35 M — wildly inconsistent with our estimate of0.196±0.014 M from Figure 10! However, stars losing mass are much bigger; for appropriatevalues of M& (>10–9 M /yr), the corresponding mass has been calculated as 0.255±0.015 M(McDermott & Taam 1989, especially their Figure 1 and Table 1) and 0.23±0.01 M (Howell et 25 Most values of q are given in Table A1 of Patterson, Thorstensen, and Kemp 2005; otherscan be deduced from the ε tabulations of P03 and P98. These papers give more completereferences.26 For CV fans in extremis, the unboxed points of largest m2 and Porb are NY Ser and V348 Pup— stars with Porb=2.35 and 2.44 hr respectively. There is some sensitivity here — certainly inour discussion, and probably in the actual binaries as well — to exactly where the edges of theperiod gap are placed.
PATTERSON, J. ET AL. QCRIT, ε(Q), & MASS–RADIUS
15
al. 2001, especially their Figure 2). Our measured value is slightly discrepant. But while thesharpness of the discontinuity in Figure 10 is significant (and constitutes some evidence for lowdispersion in m1), its location at 0.20 M depends on the assumption that <m1>=0.75. Sincem2∝m1, a change to <m1>=0.9 would move the discontinuity to 0.24 M . So within the errors ofthe observational data, and perhaps also the theory, there is no certifiable disagreement betweenthese estimates.
The most popular theory for the origin of the period gap — disrupted magnetic braking(Ritter 1985; Taam & Spruit 1989; Hameury, King, & Lasota 1991; Spruit & Ritter 1983) —predicts such a discontinuity. The radii of stars immediately above and below the period gap (Raand Rb) should be in the ratio
Ra / Rb = (Pa / Pb)⅔, (13)
where Pa and Pb are the periods above and below the gap [from Eq. (9) above]. For a 2.1–2.7hour gap, we thus expect an 18% difference — in agreement with the effect estimated fromFigure 10 (1.30/1.10 implying a 18% difference). Figure 10 thus offers substantial evidence insupport of the disrupted magnetic braking model, or models like it which predict bloatedsecondaries above the period gap.
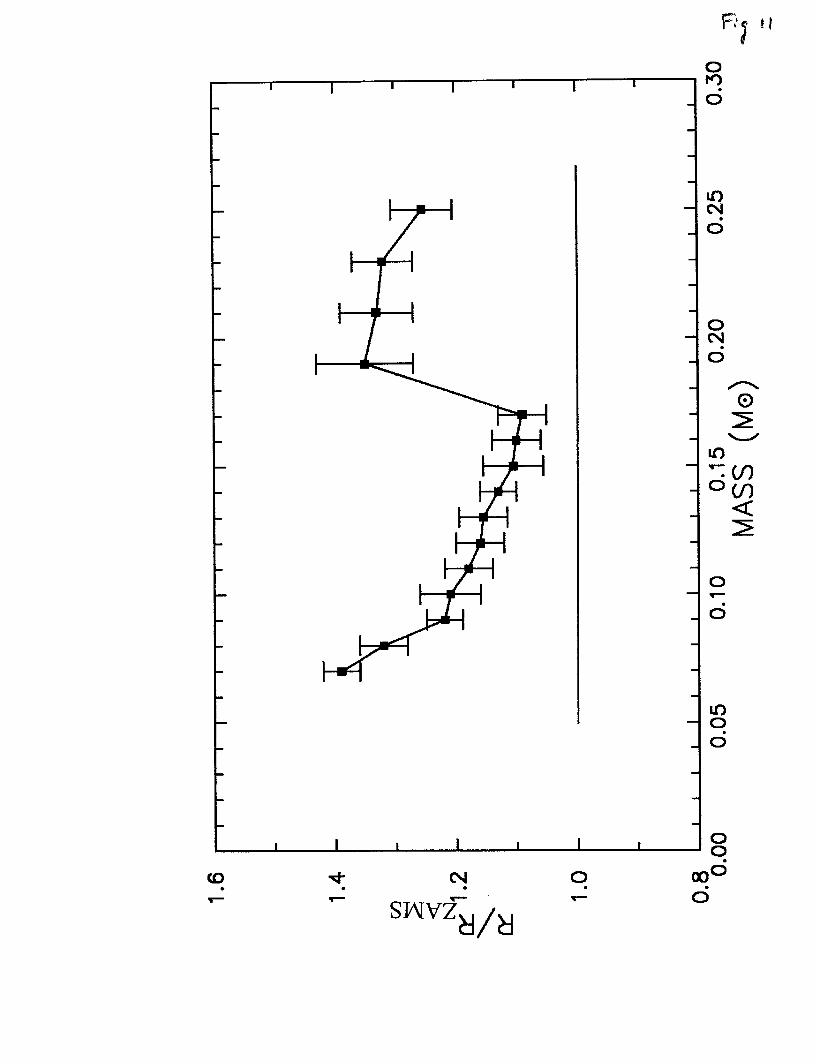
Figure 11 presents another version of this data, with R2/RZAMS averaged over 0.01 and0.02 M bins. This does not add anything new, but perhaps better illustrates the trends discussedhere: the discontinuity at 0.20 M , and the progressive bloating of the secondary as it evolves tovery low mass.
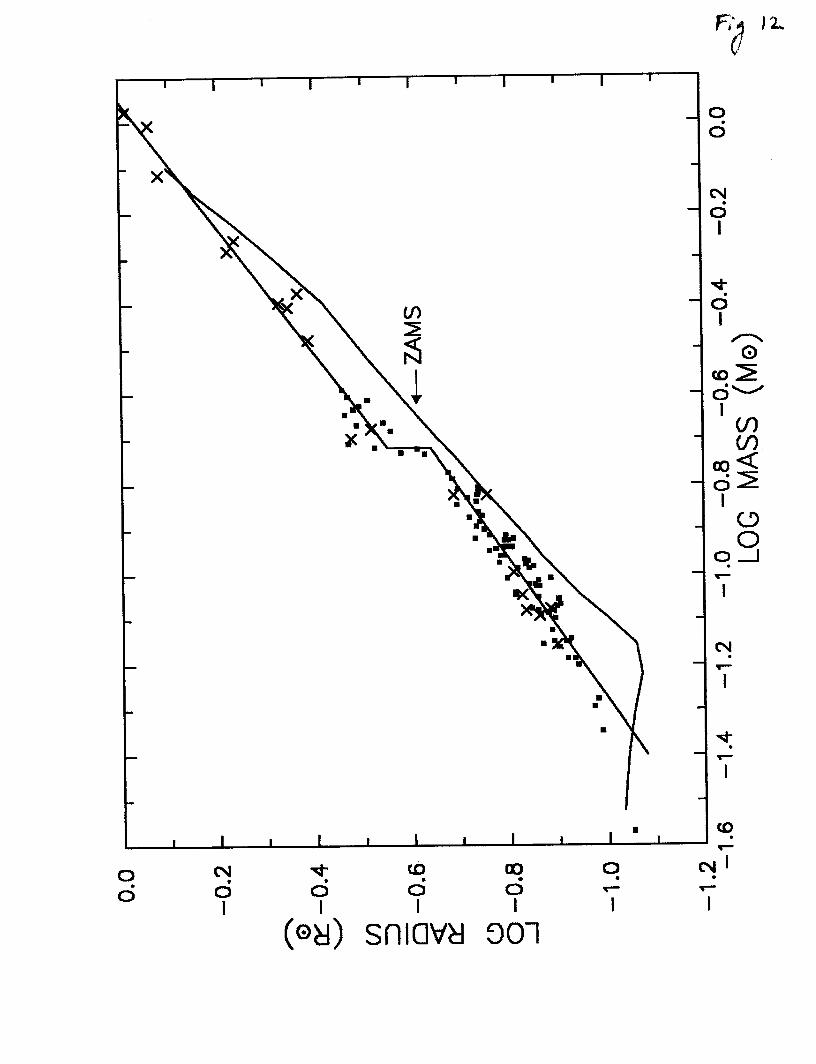
Figure 12 shows the mass–radius data on a log–log scale, including all additionaleclipsing CVs with Porb<8 hr (also contained in Table 8).27 Just for the record, the resultantempirical mass–radius relation for CV secondaries is
r2 = 0.62 m20.61 [m2 = 0.06–0.18, Po=1.3–2.3]
r2 = 0.00 m20.00 [m2 = 0.00–0.00, Po=0.0–0.0] (14)
r2 = 0.92 m20.71 [m2 = 0.21–1.00, Po=2.5–8.0]
This relation is shown as the piecewise linear fit in Figure 12. The equivalent mass–periodrelation is
m2 = 0.032 Po2.38 [Po < 2.3]
m2 = 0.000 Po0.00 [Po < 0.0] (15)
m2 = 0.026 Po1.78 [Po > 2.5]
The data are too sparse to yield trustworthy results for the secondaries of lowest mass m2<0.06). 27 Restriction to eclipsers improves reliability over some previous collections, e.g., Table 3 ofSmith & Dhillon (1998). Noneclipsing CVs seldom offer an inclination constraint good enoughto use in these calibrations — except in superhump studies, where inclination is irrelevant.
PATTERSON, J. ET AL. QCRIT, ε(Q), & MASS–RADIUS
16
These relations could be considered the “empirical main sequence” of CVs. The lowdispersion in Figures 10 and 12, like that of the more famous main sequence, requires a fairlyuniform chemical composition in these secondaries. In particular, stellar radius is sensitive tomean molecular weight, so these secondaries probably have not burned appreciable hydrogen intheir prior lives — either before or after their imprisonment in a cataclysmic binary. To a goodapproximation, they should be considered unevolved stars of solar composition.28
There are a few obvious exceptions to this. A few secondaries (AE Aqr and GK Per arefamous examples) have radii much too large for their mass, apparently as a result of true nuclearevolution. All of these seem to be in binaries with Porb>8 hr (hence outside our net). And threeothers have radii much too small for their mass; these are all known or suspected to be helium-rich (EI Psc: Thorstensen et al. 2002a; QZ Ser: Thorstensen et al. 2002b; V485 Cen:Augusteijn et al. 1996). But the great majority of CV secondaries seem to be pretty normal low-mass stars — just slightly agitated by the special circumstances of their imprisonment (enforcedrapid rotation, struggles with thermal equilibrium, the occasional nova outburst, etc.).
14. SUMMARY
1. We report photometric campaigns on the eclipsing dwarf novae XZ Eridani and OU Virginis.These showed common superhumps with ε=0.0270(15) and 0.0326(15), respectively, for thetwo stars.
2. We do the same for the novalike variable UU Aquarii. The 2000 observing campaignshowed strong superhumps — a stable wave with ε=0.0702(24), lasting essentiallythroughout the 50-day campaign.
3. We discovered and tracked the superhump wave of the black-hole X-ray transient KV UrsaeMajoris (= XTE J1118+480) through its 2000 outburst. The properties of the superhumpwere a little different — smaller, more long-lived, more stable in period, more sinusoidal inwaveform — from those of the common superhumps of dwarf novae. Nevertheless, theresemblances are sufficient to warrant adopting the hypothesis of a common origin. Wefound ε=0.0047(7).
4. We discuss the important constraints set by the nondetection of superhumps in U Geminorum(especially) and IP Pegasi. Assuming that there is a critical ratio qcrit for superhumpmanufacture, we infer that qcrit does not exceed 0.38.
5. We report a season’s photometry on the novalike variable BB Doradus (= EC 05287–5857),yielding three noncommensurate frequencies. No help is available to guide us in interpreting
28 They are somewhat larger than ZAMS stars, but this is probably due to the extra heating CVsecondaries suffer as they struggle with thermal equilibrium (Paczynski & Sienkiewicz 1983).There is still room for abundance anomalies (C/N, etc.), but their interpretations should notinvoke too much H burning.
PATTERSON, J. ET AL. QCRIT, ε(Q), & MASS–RADIUS
17
the frequencies; but the strongest signal, at 6.701(3) c/d, can be plausibly associated with theorbital frequency ωo. We interpret the other two signals as the ωo–Ω and 2ωo–Ωsuperhumps. This superhump is of special interest since it has a very large period excessε=0.0939(15), thus providing a calibrating point (a limit) at large ε.
6. DW Ursae Majoris supplies an additional calibration at large ε, now that eclipse analysis hassupplied a q constraint.
7. We report survey results for ~200 stars, and tackle the question: which stars superhump?The answer is pretty simple, and not a property of dwarf-nova eruptions. Basically all short-period CVs which reach high- M& states for more than a few days grow superhumps. As Porbincreases from 2.3 hr to 3.5 hr, the superhumping fraction seems to drop smoothly from~100% to ~15% — with the 50% threshold crossed at Porb=3.1±0.2 hr. This smoothdependence on Porb is consistent with the hypothesis that the controlling parameter is q, withthe width of the transition probably reflecting a variance in white-dwarf mass. We show howqcrit, <M1>, and the secondary’s mass–radius relation are linked.
8. Since superhump properties appear to be tightly correlated with q (independently measurablein ~12–15 cases) and Porb (measurable in all cases), we adopt the working hypothesis that q isthe controlling parameter, and derive an estimate for qcrit. Superhumps are absent in all CVswith a certifiable q>0.36, and present in all CVs with a certifiable q<0.25. DW UMa and UUAqr are of particular interest since they have a fairly high q (near 0.3) and yet show well-defined superhumps with ε not quite at the top of the range. We use this to estimateqcrit=0.35±0.02. This is also consistent with an estimate based on the 50% threshold at 3.1hr.
9. We use all available data to establish an empirical ε(q) law, Eq. (8). This should be useful inestimating system parameters of any star showing superhumps. It also provides a mass–radius law for the secondary stars in short-period CVs, subject to the adopted value of <M1>.Plausible choices are <M1>=0.75 M , R2=1.15 RZAMS. The resultant mass–radius law showsan apparent discontinuity near 0.20 M , which agrees with the expectation from a disruptedmagnetic braking model.
10. The mass–radius law, shown in Figures 10–12 and Eq. (14), demonstrates that CVsecondaries follow a theoretical ZAMS pretty well, with just two clear departures: near 0.08and 0.20 M . The first is well-understood as the result of the star’s inability to contract fastenough to keep up with its timescale of mass loss (first described by Paczynski 1981). Thesecond is less understood, but probably arises from the same effect, where the timescale is setby the strength of magnetic braking. It should be noted, however, that these departures aremainly gradual. Essentially all CVs have secondaries slightly above the single-star ZAMS,and this bloating seems to steadily increase as they approach the transitions at 0.20 and 0.08M . It’s possible that this arises because the secondaries are always losing matter ontimescales pretty close to their thermal timescales [see Figure 23 of Patterson (1984) and theaccompanying discussion].
PATTERSON, J. ET AL. QCRIT, ε(Q), & MASS–RADIUS
18
11. The very low dispersion in the R2(M2) law is a striking result here — as if the evolving starsjust slid gracefully down a well-defined string in Figures 10–12. These figures are somewhatmisleading, though, because the uncertainty in M1 moves the points roughly parallel to theapparent evolution tracks. So while low dispersion is true and is important, this is only truefor the collection of stars; M2 and R2 are not so well determined for each individual star.
12. There is also a minor (at least) paradox in the understanding of a well-defined R2(M2) law forshort-period CVs. These stars range in apparent < M& > from 10–11 M /yr (WZ Sge stars) to10–9 (ER UMa stars) to 10–8 (CP Pup, BK Lyn). It is not easy to understand how thesecondaries can muster a common mass–radius law in the face of such variety. Long-termmass-transfer cycles, possibly associated with classical nova eruptions, could perhaps explainthis… but at present it looms as a mystery.
13. There are still some loose ends needing clarification. The question of U Gem superhumps isimportant and will affect our results. If the Smak & Waagen result is correct, thenε=0.130(14) at q=0.36(2). Adding this point to Figure 9 and refitting, we find a somewhatsteeper ε(q) with a larger quadratic term. That implies a smaller q above the period gap,which would increase the discontinuity in radius we find near 0.2 M . TV Col needsclarification too, although cannot be easily compared with these other stars, since it lacks a qconstraint and is magnetic. And a radial-velocity study of BB Dor would be very welcome,since we found an annoying ambiguity of interpretation there. Finally, ε(q) still needs help atthe low-q end; this will be critical in measuring q and M2 for the very oldest CVs, after theyhave passed minimum period.
This paper reports results from 262 nights and ~1000 hours — and that’s just for the fivestars with newly reported positive results. The negative results, and summary reports on starsnot yet published, span another thousand nights. Keeping this collaboration humming alongtakes a lot of community mojo. Even outside the big author list, we benefited from the data ofGordon Garradd, Stan Walker, Bill Allen, Panos Niarchos, Bernard Heathcote, David Messier,Sarah Tuttle, Donn Starkey, and Fred Velthuis. The NSF provided some mojo too, in financialsupport through grants AST 00–98254 and 04–06813.
PATTERSON, J. ET AL. QCRIT, ε(Q), & MASS–RADIUS
19
REFERENCES
Araujo-Betancor, S. et al. 2003, ApJ, 583, 437.Augusteijn, T. et al. 1996, A&A, 311, 889.Baptista, R., Steiner, J.E., & Cieslinski, D. 1994, ApJ, 433, 332.Baptista, R., Cilveira, C., Catalan, S., Horne, K., & Zilli, D. 1998, MNRAS, 300, 233.Baptista, R., Catalan, M.S., & Costa, L. 2000, MNRAS, 324, 599.Baraffe, I, Chabrier, G., Allard, F., & Hauschildt, P. 1998, A&A, 337, 403.Beuermann, K. et al. 2003, A&A, 412, 821.Burrows, A. et al. 1993, ApJ, 406, 158.Chen, A., O’Donoghue, D., Stobie, R.S., Kilkenny, D., & Warner, B. 2001, MNRAS, 325, 89.Cook, L., Patterson, J., Buczynski, D., & Fried, R.E. 2000, IAUC 7397.Faulkner, J., Flannery, B.P., & Warner, B. 1972, ApJ, 175, L79.Feline, W. et al. 2004a, MNRAS, 347, 1173.Feline, W. et al. 2004b, MNRAS, 355, 1.Hameury, J.M., King, A.R., & Lasota, J.P. 1991, A&A, 248, 525.Hessman, F.V. 1989, AJ, 98, 675.Hirose, M. & Osaki, Y. 1990, PASJ, 42, 135.Hoogerwerf, R., Brickhouse, N.S., & Mauche, C.W. 2004, ApJ, 610, 411.Horne, K., Wood, J.H., & Stiening, R. 1991, ApJ, 378, 271.Horne, K., Welsh, W.F., & Wade, R.A. 1993, ApJ, 410, 357.Howell, S.B., Nelson, L.A., & Rappaport, S. 2001, ApJ, 550. 897.Kato, T. et al. 2004, PASJ, 56, 1.Kiyota, S. & Kato, T. 1998, IBVS 4644.Kolb, U. & Baraffe, I. 1999, MNRAS, 309, 1034.Kunze, S., Speith, R., & Riffert, H. 1997, MNRAS, 289, 889.Long, K.S. & Gilliland, R.L. 1999, ApJ, 511, 916.Lubow, S.H. 1991, ApJ, 381, 268.Lubow, S.H. 1992, ApJ, 401, 317.Martin, J.S., Friend, M.T., Smith, R.C., & Jones, D.H.P. 1989, MNRAS, 240, 519.McDermott, P.N. & Taam, R.E. 1989, ApJ, 342, 1019.Mineshige, S., Hirose, M., & Osaki, Y. 1992, PASJ, 44, L15.Murray, J.R. 1996, MNRAS, 279, 402.Murray, J.R. 2000, MNRAS, 314, L1.North, R.C., Marsh, T.R., Moran, C.K.J., Kolb, U., Smith, R.C., & Stehle, R. 2000, MNRAS,
313, 383.O’Donoghue, D. & Charles, P.A. 1996, MNRAS, 282, 191.Orosz, J.A. 2001, Atel 67.Osaki, Y. 1996, PASP, 108, 39.Pacynski, B. 1981, AcA, 31, 1.Paczynski, B. & Sienkiewicz, R. 1983, ApJ, 268, 825.Patterson, J. 1984, ApJS, 54, 443.Patterson, J. 1998, PASP, 110, 1132.Patterson, J. 1999, in Disk Instabilities in Close Binary Systems, ed. S. Mineshige and J.C.
Wheeler (Universal Academy Press: Kyoto), 61.Patterson, J. 2001, PASP, 113, 736 (P01).
PATTERSON, J. ET AL. QCRIT, ε(Q), & MASS–RADIUS
20
Patterson, J., Thorstensen, J.R., & Kemp, J. 2005, PASP, in press.Patterson, J. et al. 2000a, IAUC 7412.Patterson, J. et al. 2000b, PASP, 112, 1584.Patterson, J. et al. 2000c, PASP, 112, 1567.Patterson, J. et al. 2002a, PASP, 114, 721.Patterson, J. et al. 2002b, PASP, 114, 1364.Patterson, J. et al. 2003, PASP, 115, 1308 (P03).Remillard, R. et al. 2000, IAUC 7389.Retter, A. et al. 2003, MNRAS, 340, 679.Ritter, H. 1985, A&A, 145, 227.Robinson, E.L. et al. 1981, ApJ, 251, 611.Schoembs, R. 1986, A&A, 158, 233.Shafter, A.W. 1983, Ph.D. thesis, Univ. Calif. At Los Angeles.Simpson, J.C. & Wood, M.A. 1998, ApJ, 506, 360.Skillman, D.R. et al. 1999, PASP, 111, 1281.Smak, J.I. 2001, AcA, 51, 279.Smak, J.I. 2002, AcA, 52, 189.Smak, J. & Waagen, E.O. 2004, AcA, 54, 443.Smith, D.A. & Dhillon, V.S. 1998, MNRAS, 301, 767.Steeghs, D., Marsh, T., Knigge, C., Maxted, P.F.L., Kuulkers, E., & Skidmore, W. 2001, ApJ,
562, L145.Steeghs, D., Perryman, M.A.C., Reynolds, A., de Bruijne, J.H.J., Marsh, T., Dhillon, V.S., &
Peacock, A. 2003, MNRAS, 339, 810.Taam, R.E. & Spruit, H.C. 1989, ApJ, 345, 972.Thoroughgood, T.D., Dhillon, V.S., Watson, C.A., Buckley, D.A.H., Steeghs, D., & Stevenson,
M.J. 2004, MNRAS, 353, 1135.Thoroughgood, T.D. et al. 2005, MNRAS, 357, 881.Thorstensen, J.R. 2000, PASP, 112, 1269.Thorstensen, J.R. et al. 2002b, ApJ, 567, L49.Thorstensen, J.R. et al. 2002b, PASP, 114, 1117.Uemura, M. et al. 2002, PASJ, 54, 285.Uemura, M. et al. 2004, PASJ, 56, 141.Vanmunster, T., Velthuis, F., & McCormick, J. 2000, IBVS, 4955.Vogt, N. 1974, A&A, 36, 369.Wade, R.A. & Horne, K. 1988, ApJ, 324, 411.Warner, B. 1975, MNRAS, 170, 219.Warner, B. 1985, in Interacting Binaries, ASI Proceedings (Dordrecht: Reidel), 367.Warner, B. & O’Donoghue, D. 1988, MNRAS, 233, 705.Webbink, R.L. 1990, in Accretion-Powered Compact Stars, ed. C.W. Mauche (Cambridge:
Cambridge Univ. Press), 177.Whitehurst, R. 1988, MNRAS, 232, 35.Wood, J.H. 1990, MNRAS, 243, 219.Wood, J.H. et al. 1986, MNRAS, 219, 629.Wood, J.H., Horne, K., Berriman, G., & Wade, R.A. 1989, ApJ, 341, 974.Wood, J.H., Horne, K., & Vennes, S. 1992, ApJ, 385, 294.Wood, M.A., Montgomery, M.M., & Simpson, J.C. 2000, ApJ, 535, L39.
PATTERSON, J. ET AL. QCRIT, ε(Q), & MASS–RADIUS
21
Woudt, P.A. & Warner, B. 2001, MNRAS, 328, 159.Zhang, E.-H., Robinson, E.L., & Nather, R.E. 1986, ApJ, 305, 740.Zurita, C. et al. 2002, MNRAS, 333, 791.

PATTERSON, J. ET AL. QCRIT, ε(Q), & MASS–RADIUS
22
TABLE 1OU VIR OBSERVING LOG
(2003 MAY – JUNE)
Telescope(s) Observer(s) Nights/Hours
MDM 2.4 m, 1.3 m J. Kemp 12/46CBA–Uzbekistan 28 cm T. Krajci 08/43CBA–Nelson 35 cm R. Rea 07/34CBA–Utah 50 cm J. Foote 04/25CBA–Flagstaff 40 cm R. Fried 03/18CBA–Pretoria 30 cm B. Monard 03/14CBA–Belgium 35 cm T. Vanmunster 03/11University of Athens P. Niarchos 02/14CBA–Connecticut 25 cm D. Messier 1/7CBA–East 66 cm D. Skillman 1/5CBA–Mia Mia B. Heathcote 1/4
PATTERSON, J. ET AL. QCRIT, ε(Q), & MASS–RADIUS
23
TABLE 2XZ ERI OBSERVING LOG
(2003 JANUARY – FEBRUARY)
Telescope(s) Observer(s) Nights/Hours
MDM 1.3 m E. Armstrong 9/23CBA–Pretoria 30 cm B. Monard 6/22CBA–Perth 30 cm G. Bolt 6/22CBA–Nelson 35 cm R. Rea 5/16University of Auckland 35 cm P. Warhurst 3/50CBA–Blenheim 40 cm B. Allen 2/50CBA–Indiana 25 cm D. Starkey 1/50CBA–Utah 50 cm J. Foote 1/40
PATTERSON, J. ET AL. QCRIT, ε(Q), & MASS–RADIUS
24
TABLE 3UU AQR OBSERVING LOG
(2000)
Telescope(s) Observer(s) Nights/Hours
CBA–Flagstaff 40 cm R. Fried 11/62CBA–Farm Cove 25 cm J. McCormick, F. Velthuis 09/39CBA–Denmark 25 cm L. Jensen 08/26CBA–Illinois 20 cm J. Gunn 07/24CBA–Nelson 35 cm R. Rea 06/32CBA–Townsville 20 cm N. Butterworth 06/26CBA–Otahuhu 30 cm M. Bos 04/24CBA–Concord 44 cm L. Cook 02/10CBA–Tamworth 45 cm G. Garradd 2/9CBA–Waiharara 25 cm S. Walker 2/9CBA–Belgium 25 cm T. Vanmunster 2/7CTIO 0.9 m J. Kemp 1/2
PATTERSON, J. ET AL. QCRIT, ε(Q), & MASS–RADIUS
25
TABLE 4KV UMA (= XTE J1118+480) OBSERVING LOG
Telescope(s) Observer(s) Nights/Hours
CBA–West 35 cm D. Harvey 32/180CBA–Concord 44 cm L. Cook 18/630CBA–East 66 cm D. Skillman 16/510CBA–Flagstaff 40 cm R. Fried 14/101CBA–Belgium 25 cm T. Vanmunster 10/460MDM 1.3 m, 2.4 m J. Kemp 10/150CBA–Italy 28 cm G. Masi 3/11
Interval00000000 Superhump Period Semi-Amplitude(JD)00000000 (d) (mag)
2451634–48 0.17094(20) 0.0282451647–60 0.17074(14) 0.0292451657–71 0.17027(27) 0.0372451670–83 0.17047(22) 0.0342451686–99 0.17065(22) 0.0362451700–10 0.17062(26) 0.040
Date00000000000 QPO Period(JD)00000000000 (s)
2451658 11.5±0.22451665 09.9±0.12451677 08.8±0.2
PATTERSON, J. ET AL. QCRIT, ε(Q), & MASS–RADIUS
26
TABLE 5BB DOR (= EC 05287–5857)
Telescope(s) Observer(s) Nights/Hours
CBA–Pretoria 30 cm B. Monard 13/65CTIO 0.9 m J. Kemp 10/53CBA–Nelson 35 cm R. Rea 04/10CBA–Perth 30 cm G. Bolt 03/12
PATTERSON, J. ET AL. QCRIT, ε(Q), & MASS–RADIUS
27
TABLE 6SUPERHUMP SUCCESS RATE
Porb Superhumps/Searched(d)
0.05→0.06 22/240.06→0.07 40/410.07→0.08 37/380.08→0.10 20/230.10→0.13 09/130.13→0.15 08/250.15→0.17 2/80.17→0.20 00/110.20→0.30 00/130.30→0.40 0/40.40→0.50 0/40.50→0.60 0/2
NOTE — These refer to stars withdetections and strong upper limits(roughly <0.04 mag). Weak upperlimits (~0.1 mag) are not counted assearches.
PATTERSON, J. ET AL. QCRIT, ε(Q), & MASS–RADIUS
28
TABLE 7SUPERHUMP FRACTIONAL PERIOD EXCESS VERSUS MASS RATIO
Star ε q References
KV UMa (= XTE J1118+480) 0.0047(9)0 <0.037(7)0 this paper, Uemura et al. 2002, Orosz2001, Zurita et al. 2002
WZ Sge 0.0092(8)0 <0.050(15) Patterson et al. 2002a, Steeghs et al.2001
XZ Eri 0.0270(15) <0.110(2)0 this paper, Feline et al. 2004b, Uemuraet al. 2004
IY UMa 0.0260(10) <0.125(8)0 Patterson et al. 2000c, Steeghs et al.2003
Z Cha 0.0364(9)0 <0.145(15) Warner & O’Donoghue 1988, Wade &Horne 1988
HT Cas 0.0330(30) <0.15(1)00 Zhang et al. 1986, Horne et al. 1991DV UMa 0.0343(10) <0.150(1)0 Patterson et al. 2000b, Feline et al.
2004bOU Vir 0.0326(15) <0.175(25) this paper, Feline et al. 2004aV2051 Oph 0.030(2)00 <0.19(3)00 Baptista et al. 1998, Kiyota & Kato
1998, P03DW UMa 0.0644(20) <0.28(4)00 Araujo-Betancor et al. 2003, this
paper, Patterson et al. 2002bUU Aqr 0.0702(19) <0.30(7)00 Baptista et al. 1994, this paperBB Dor (= EC 05287–5857) 0.0939(15) <0.38()000 this paper
NOTES —1. We generally list errors from the published source, but include a (usually) larger error of 5%
in both parameters in the fit, and in Figure 10. Such an error is always appropriate for ε,because superhumps commonly show small period changes. Much smaller errors in q aresometimes quoted in the literature; but these are always internal errors, not including the(usually unknown) systematic error in the method used.
2. In P01 we included X-ray binaries in this discussion. They are somewhat relevant, and do asa class establish that low ε is always associated with low q (compare our Figure 9 to Figure 1of P01). But the observational errors in these stars are generally too large to be a significantconstraint, and there are some worries about cycle count too; so we omit them here. The oneexception is KV UMa (= XTE J1118+480).
PATTERSON, J. ET AL. QCRIT, ε(Q), & MASS–RADIUS
29
TABLE 8BASIC DATA ON ECLIPSING CATACLYSMIC VARIABLES
(PORB < 8 HR)
Star M1 M2 R2 Porb q References(M ) (M ) (R ) (d)
XZ Eri 0.77(2)00 0.084(2)0 0.131(2)0 0.06116 0.110(2)0 Feline et al. 2004bOY Car 0.685(11) 0.070(2)0 0.127(2)0 0.06312 0.10(1)00 Wood et al. 1989EX Hya 0.49(13)0 0.081(13) 0.138(6)0 0.06823 0.165(30) Hoogerwerf et al. 2004,
Beuermann et al. 2003OU Vir 0.9(2)000 0.15(4)00 0.177(24) 0.07271 0.175(25) Feline et al. 2004aHT Cas 0.61(4)00 0.09(2)00 0.154(13) 0.07365 0.15(1)00 Horne et al. 1991IY UMa 0.79(4)00 0.10(1)00 0.160(4)0 0.07391 0.125(8)0 Steeghs et al. 2003Z Cha 0.56(1)00 0.083(3)0 0.149(4)0 0.07450 0.145(15) Wade & Horne 1988, Wood
1990, Wood et al. 1986DV UMa 1.09(8)00 0.15(1)00 0.207(16) 0.08585 0.151(1)0 Feline et al. 2004bDW UMa 0.73(3)00 0.21(3)00 0.305(15) 0.13661 0.28(4)00 Araujo-Betancor et al. 2003,
this paperIP Peg 0.94(10)0 0.42(8)00 0.43(3)00 0.15821 0.45(4)00 Smak 2002, Martin et al.
1989, Hessman 1989UU Aqr 0.67(14)0 0.20(7)00 0.34(4)00 0.16358 0.30(7)00 Baptista et al. 1994GY Cnc 0.82(14)0 0.33(7)00 0.41(3)00 0.17544 0.40(8)00 Thorstensen 2000U Gem 1.07(8)00 0.39(2)00 0.45(1)00 0.17691 0.36(2)00 Smak 2001DQ Her 0.60(7)00 0.40(5)00 0.48(3)00 0.19362 0.66(4)00 Horne et al. 1993EX Dra 0.75(15)0 0.55(8)00 0.58(4)00 0.20994 0.72(6)00 Baptista et al. 2000V347 Pup 0.63(4)00 0.52(6)00 0.60(2)00 0.23194 0.83(5)00 Thoroughgood et al. 2005EM Cyg 1.12(8)00 0.99(12)0 0.87(7)00 0.29091 0.88(5)00 North et al. 2000AC Cnc 0.76(3)00 0.77(5)00 0.83(3)00 0.30048 1.02(4)00 Thoroughgood et al. 2004V363 Aur 0.90(6)00 1.06(11)0 0.97(4)00 0.32124 1.17(7)00 Thoroughgood et al. 2004
PATTERSON, J. ET AL. QCRIT, ε(Q), & MASS–RADIUS
30
TABLE 9M2 AND R2 FROM SUPERHUMPS
Star Porb(d)
ε q R2(R )
M2(M )
M1**
(M )
DI UMa 0.05456(1)0 0.0133(6)0 0.070(4)0 0.105(5)0 0.053(3)0 –V844 Her 0.05464(1)0 0.0243(9)0 0.115(5)0 0.125(4)0 0.086(4)0 –LL And 0.05505(1)0 0.0290(36) 0.131(15) 0.131(6)0 0.098(11) –SDSS 0137–09 0.05537(4)0 0.0248(20) 0.116(10) 0.126(6)0 0.088(7)0 –ASAS 0025+12 0.05605(5)* 0.0206(21) 0.096(9)0 0.119(4)0 0.072(7)0 –AL Com 0.05667(3)0 0.0120(7)0 0.060(4)0 0.103(4)0 0.045(3)0 –WZ Sge 0.05669(1)0 0.0092(7)0 0.046(4)0 0.107(3)0 0.051(4)0 1.10RX 1839+26 0.05669(5)* 0.0173(20) 0.083(10) 0.115(5)0 0.063(7)0 –PU CMa 0.05669(5)0 0.0222(20) 0.109(11) 0.122(5)0 0.083(9)0 –SW UMa 0.05681(14) 0.0245(27) 0.113(13) 0.127(6)0 0.085(9)0 –HV Vir 0.05707(1)0 0.0200(9)0 0.094(6)0 0.120(3)0 0.071(5)0 –MM Hya 0.05759(1)0 0.0184(10) 0.086(6)0 0.117(3)0 0.065(4)0 –WX Cet 0.05829(4)0 0.0199(15) 0.094(9)0 0.122(5)0 0.071(7)0 –KV Dra 0.05876(7)0 0.0233(22) 0.107(11) 0.128(6)0 0.080(8)0 –T Leo 0.05882(1)0 0.0236(14) 0.110(8)0 0.129(4)0 0.083(8)0 –EG Cnc 0.05997(9)0 0.0067(8)0 0.035(6)0 0.089(6)0 0.027(5)0 –V1040 Cen 0.06028(10) 0.0310(27) 0.139(13) 0.142(5)0 0.104(10) –RX Vol 0.0603(2)*0 0.0178(20) 0.086(11) 0.121(6)0 0.065(7)0 –AQ Eri 0.06094(6)0 0.0284(21) 0.129(11) 0.139(5)0 0.097(9)0 –XZ Eri 0.06116(1)0 0.0270(16) 0.123(7)0 0.138(3)0 0.094(5)0 0.77CP Pup 0.06145(6)0 0.0171(20) 0.082(11) 0.132(5)0 0.082(7)0 1.00V1159 Ori 0.06218(1)0 0.0320(11) 0.142(6)0 0.146(3)0 0.107(4)0 –V2051 Oph 0.06243(1)0 0.0281(25) 0.127(13) 0.141(5)0 0.095(10) –V436 Cen 0.0625(2)00 0.0212(32) 0.100(16) 0.130(9)0 0.075(12) –BC UMa 0.06261(1)0 0.0306(14) 0.137(8)0 0.145(4)0 0.103(6)0 –HO Del 0.06266(16) 0.0276(35) 0.125(17) 0.140(8)0 0.094(12) –EK TrA 0.06288(5)0 0.0321(25) 0.142(13) 0.147(5)0 0.107(10) –TV Crv 0.0629(2)00 0.0325(32) 0.144(14) 0.148(6)0 0.108(10) –VY Aqr 0.06309(4)0 0.0203(15) 0.095(7)0 0.129(5)0 0.071(6)0 –OY Car 0.06312(1)0 0.0203(15) 0.095(7)0 0.126(5)0 0.069(6)0 0.69RX 1131+43 0.06331(8)0 0.0259(16) 0.119(9)0 0.139(5)0 0.089(7)0 –ER UMa 0.06366(3)0 0.0314(11) 0.140(5)0 0.147(4)0 0.105(4)0 –DM Lyr 0.06546(6)0 0.0281(31) 0.127(14) 0.145(6)0 0.095(10) –UV Per 0.06489(11) 0.0234(23) 0.108(10) 0.137(5)0 0.081(8)0 –AK Cnc 0.0651(2)00 0.0368(33) 0.160(16) 0.156(7)0 0.120(12) –AO Oct 0.06557(13) 0.0242(39) 0.111(17) 0.139(7)0 0.083(12) –SX LMi 0.06717(11) 0.0347(25) 0.153(11) 0.157(5)0 0.115(8)0 –SS UMi 0.06778(4)0 0.0360(15) 0.158(12) 0.160(5)0 0.119(9)0 –KS UMa 0.06796(10) 0.0241(30) 0.112(13) 0.143(6)0 0.084(10) –V1208 Tau 0.0681(2)00 0.0374(28) 0.163(15) 0.162(6)0 0.122(12) –RZ Sge 0.06828(2)0 0.0306(28) 0.137(13) 0.153(5)0 0.103(10) –TY Psc 0.06833(5)0 0.0347(15) 0.153(12) 0.159(5)0 0.115(9)0 –IR Gem 0.0684(3)00 0.0351(66) 0.154(30) 0.160(10) 0.115(9)0 –V699 Oph 0.0689(2)*0 0.0197(28) 0.093(11) 0.136(8)0 0.070(9)0 –CY UMa 0.06957(4)0 0.0364(14) 0.159(10) 0.163(4)0 0.119(7)0 –FO And 0.07161(18) 0.0349(40) 0.153(17) 0.164(7)0 0.115(12) –OU Vir 0.07271(1)0 0.0326(15) 0.145(7)0 0.184(4)0 0.156(7)0 0.90VZ Pyx 0.07332(3)0 0.0333(20) 0.147(9)0 0.163(5)0 0.110(7)0 –
(CONTINUED ON NEXT PAGE)
PATTERSON, J. ET AL. QCRIT, ε(Q), & MASS–RADIUS
31
(CONTINUED FROM PREVIOUS PAGE)TABLE 9
M2 AND R2 FROM SUPERHUMPS
Star Porb(d)
ε q R2(R )
M2(M )
M1**
(M )
CC Cnc 0.07352(5)0 0.0487(27) 0.203(12) 0.184(5)0 0.152(9)0 –HT Cas 0.07365(1)0 0.0330(30) 0.147(12) 0.154(5)0 0.090(9)0 0.61IY UMa 0.07391(1)0 0.0260(13) 0.120(7)0 0.155(4)0 0.091(5)0 0.79VW Hyi 0.07427(1)0 0.0331(8)0 0.147(5)0 0.166(4)0 0.110(4)0 –Z Cha 0.07450(1)0 0.0364(9)0 0.159(6)0 0.155(3)0 0.090(4)0 0.56QW Ser 0.07453(10) 0.0331(40) 0.147(18) 0.166(7)0 0.110(12) –WX Hyi 0.07481(1)0 0.0346(14) 0.152(11) 0.169(5)0 0.114(9)0 –BK Lyn 0.07498(5)0 0.0479(7)0 0.200(7)0 0.185(4)0 0.150(5)0 –RZ Leo 0.07604(1)0 0.0347(25) 0.152(13) 0.170(6)0 0.114(10) –AW Gem 0.07621(10) 0.0422(27) 0.180(18) 0.181(7)0 0.135(12) –SU UMa 0.07635(5)0 0.0317(12) 0.141(10) 0.167(5)0 0.106(7)0 –SDSS 1730+62 0.07655(9)0 0.0376(22) 0.162(11) 0.175(6)0 0.122(8)0 –HS Vir 0.0769(2)00 0.0477(23) 0.193(15) 0.186(6)0 0.145(10) –V503 Cyg 0.0777(2)00 0.0430(27) 0.183(13) 0.184(5)0 0.138(9)0 –V359 Cen 0.0779(3)00 0.0388(40) 0.168(17) 0.179(8)0 0.126(11) –CU Vel 0.0785(2)00 0.0293(36) 0.131(20) 0.161(8)0 0.098(13) –NSV 9923 0.0791(2)*0 0.0412(30) 0.175(12) 0.183(6)0 0.131(9)0 –BR Lup 0.0795(2)00 0.0340(40) 0.150(18) 0.175(8)0 0.113(13) –V1974 Cyg 0.08126(1)0 0.0471(10) 0.197(5)0 0.194(3)0 0.148(4)0 1.00TU Crt 0.08209(9)0 0.0397(22) 0.170(11) 0.186(6)0 0.128(8)0 –TY PsA 0.08414(18) 0.0417(22) 0.178(11) 0.192(5)0 0.134(7)0 –KK Tel 0.08453(21) 0.0368(31) 0.160(17) 0.187(8)0 0.120(11) –V452 Cas 0.08460(20) 0.0497(33) 0.206(17) 0.203(9)0 0.155(12) –DV UMa 0.08585(1)0 0.0343(11) 0.151(6)0 0.208(4)0 0.163(4)0 1.09YZ Cnc 0.0868(2)00 0.0553(26) 0.224(12) 0.212(6)0 0.168(9)0 –GX Cas 0.08902(16) 0.0449(25) 0.190(11) 0.204(6)0 0.143(7)0 –NY Ser 0.09775(19) 0.0623(35) 0.247(16) 0.237(7)0 0.185(12) –V348 Pup 0.10184(1)0 0.0640(40) 0.253(16) 0.245(7)0 0.190(12) –V795 Her 0.10826(1)0 0.0760(10) 0.290(5)0 0.288(4)0 0.217(5)0 –V592 Cas 0.11506(1)0 0.0625(5)0 0.248(5)0 0.265(4)0 0.186(4)0 –TU Men 0.1172(2)00 0.0717(32) 0.277(15) 0.278(8)0 0.208(12) –AH Men 0.12721(6)0 0.0887(16) 0.326(10) 0.310(6)0 0.244(8)0 –DW UMa 0.13661(1)0 0.0644(20) 0.255(10) 0.300(6)0 0.191(8)0 0.73TT Ari 0.13755(1)0 0.0847(7)0 0.315(7)0 0.323(5)0 0.236(6)0 –V603 Aql 0.1381(2)00 0.0572(51) 0.232(23) 0.332(11) 0.232(23) 1.00PX And 0.14635(1)0 0.0898(14) 0.329(11) 0.341(7)0 0.247(8)0 –V533 Her 0.1473(2)00 0.0719(20) 0.285(12) 0.327(6)0 0.214(9)0 –BB Dor 0.1492(1)00 0.0939(10) 0.341(20) 0.350(8)0 0.256(15) –BH Lyn 0.15575(1)0 0.0790(30) 0.301(15) 0.346(8)0 0.226(15) –UU Aqr 0.16358(1)0 0.0702(14) 0.271(9)0 0.340(10) 0.195(18) 0.67
** Porb inferred from superhump sideband (nωsh+mΩ, where m=1, 2, ..., n) insuperoutburst time series; these values are less well determined, and less reliable, thanother measures of Porb.
** M1 assumed to be 0.75 M , except in a few listed cases where a better constraintis available. M2 scales as M1/0.75 M , and R2 scales as (M1/0.75 M )⅓. We reckon thatthe main uncertainty in M2 and R2 arises from the M1 dependence, rather than in errorsof ε or the adopted ε(q) relation.
PATTERSON, J. ET AL. QCRIT, ε(Q), & MASS–RADIUS
32
FIGURE CAPTIONS
FIGURE 1. — Upper left frame, eruption light curve of OU Vir. The open squares are upperlimits. Upper right, the mean orbital waveform in superoutburst. Middle frame, 8-day lightcurve in superoutburst, after removing the mean, trend, and eclipses for each night. Lowerframe, power spectrum of the 8-day light curve, with significant signals marked with theirfrequencies in c/d (±0.02). The mean superhump waveform is inset.
FIGURE 2. — Upper frame: sample light curve of XZ Eri in superoutburst. Lower frame:power spectrum of the 10-night spliced light curve, with significant frequencies marked in c/d.The observation window produced weak sidebands ±3.0 c/d displaced from the main peaks,which accounts for the odd appearance. Inset is the mean superhump light curve.
FIGURE 3. — Power spectrum of the UU Aqr time series in 2000, after removal of eclipses.Significant signals are marked with their frequency in c/d (±0.008). In order of increasingfrequency, these signals are interpreted as ωo–Ω, 2(ωo–Ω), 3(ωo–Ω), and 3ωo–2Ω.
FIGURE 4. — The power spectrum of the first 30 days of coverage of KV UMa (= XTEJ1118+480). A simple signal at 5.857(7) c/d is seen, with a sinusoidal waveform (inset).
FIGURE 5. — O–C diagram of the timings of maximum light of KV UMa, relative to a testperiod of 0.17065 d. The fitted parabola indicates a slowly decreasing period, with P& =–1×10⁻⁶.
FIGURE 6. — Left frame, average power spectrum of 36 10-minute observations at 2 s timeresolution on JD2451665. A quasi-period oscillation centered on P=9.9 s is evident. Rightframe, other detections of the QPO.
FIGURE 7. — Top frame, average nightly power spectrum of BB Dor (= EC 05287–5857).Middle frame, power spectrum of the 45-night light curve, with significant signals marked withtheir frequencies in c/d (±0.003). Bottom frame, mean orbital (6.701 c/d) and superhump (6,126c/d) waveforms.
FIGURE 8. — Percentage of (apsidal) superhumps as a function of Porb, drawn from Table 6.Porb appears to be a good predictor, with 50% occurring at Porb=3.1±0.2 hrs. The width of thetransition allows us to limit the dispersion in M1, and in the mass–radius law.
FIGURE 9. — Variation of ε with q in the stars of Table 7. The limit for BB Dor (q<0.38) is setby the requirement that it should have a lower q than U Gem, since the latter (probably) does notsuperhump. The fitted quadratic curve is Eq. (8).
FIGURE 10. — Mass–radius dependence for secondary stars in CVs. Filled squares are (M2, R2)pairs deduced from superhumps. Diamonds show typical errors in the short-Porb and long-Porbregimes. Crosses are values independently deduced in eclipsing binaries (from Table 8).Enclosing boxes denote “long-period” stars (>2.5 hours). The curve shows the M–R dependenceon the ZAMS (Baraffe et al. 1998), extended to lower mass with the brown dwarf models ofBurrows et al. (1993). All CV secondaries are slightly too big to be ZAMS stars, but there is an
PATTERSON, J. ET AL. QCRIT, ε(Q), & MASS–RADIUS
33
apparent discontinuity near 0.20 M .
FIGURE 11. — Secondary-star radii compared to ZAMS radii, as a function of mass. This isobtained by binning the data of Figure 10 (0.01 and 0.02 M bins). The general form of thiscurve is a secure result, unless the ε(q) relation is greatly in error. But the location of the breakat 0.19 M depends on < M1>, which could be off by ~15%.
FIGURE 12. — Mass–radius plot in log–log space, extended to 1 M and including additionaleclipsing stars from Table 8. Straight lines are the empirical fits given by Eq. (14).