optimization of a non-radioactive high-throughput assay for decarboxylase enzymes
TRANSCRIPT
© MARY ANN LIEBERT, INC. • VOL. 8 NO. 2 • APRIL 2010 ASSAY and Drug Development Technologies 175DOI: 10.1089/adt.2009.0249
David C. Smithson , 1,2 Anang A. Shelat , 2 Jeffrey Baldwin , 3
Margaret A. Phillips , 3 and R. Kiplin Guy 2
1 Graduate Program in Chemistry and Chemical Biology, University
of California, San Francisco, California.
2 Department of Chemical Biology and Therapeutics, St. Jude
Children’s Research Hospital, Memphis, Tennessee.
3 Department of Pharmacology, The University of Texas
Southwestern Medical Center at Dallas, Dallas, Texas.
ABSTRACT Herein, we describe the optimization of a linked enzyme assay suit-able for high-throughput screening of decarboxylases, a target fam-ily whose activity has historically been difficult to quantify. Our approach uses a commercially available bicarbonate detection reagent to measure decarboxylase activity. The assay is performed in a fully enclosed automated screening system under inert nitrogen atmo-sphere to minimize perturbation by exogenous CO 2 . Receiver operat-ing characteristic (ROC) analysis following a pilot screen of a small library of ∼3,600 unique molecules for inhibitors of Trypanosoma brucei ornithine decarboxylase quantitatively demonstrates that the assay has excellent discriminatory power (area under the curve = 0.90 with 95% confidence interval between 0.82 and 0.97).
INTRODUCTION
Decarboxylase enzymes represent a significant target fam-ily for the development of therapeutic agents. Ornithine decarboxylase (ODC) and S -adenosylmethionine decar-boxylase control the polyamine biosynthetic pathway,
a therapeutic target in both oncology and parasitology. 1,2 Other
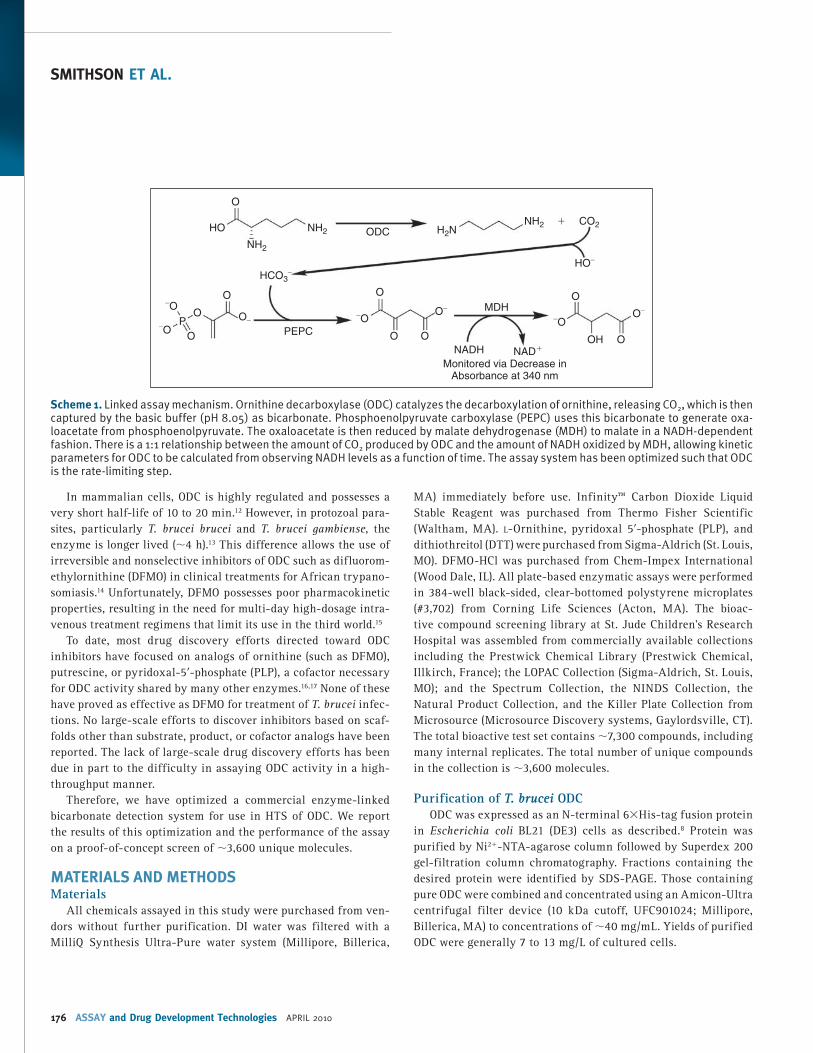
medically relevant decarboxylases include histidine decarboxyl-ase, a target in the inflammation pathway, DOPA decarboxylase, a Parkinson’s disease target, and diaminopimelate decarboxylase, a potential antibiotic target. 3–5 In spite of the importance of the enzyme class, few decarboxylases have been subjected to large-scale drug discovery efforts, in part due to difficulty in quantifying their activities in a manner compatible with modern high-through-put approaches. Classical methods for assaying decarboxylase func-tion often involve capture of 14 CO 2 from radiolabeled substrates or derivatization of the enzyme products followed by HPLC analysis. 6,7 Neither of these techniques is suitable for high-throughput screen-ing (HTS) efforts, as they involve either formation of radioactive gas or lengthy, resource intensive detection procedures. Use of a commercial low-throughput method linking the production of CO 2 to the consumption of NADH using phosphoenolpyruvate carbox-ylase (PEPC) and malate dehydrogenase (MDH) to track decarbox-ylase activities has been reported 8 ( Scheme 1 ). Reaction progress was measured by the decrease in NADH absorbance at 340 nm. We believed this assay was a good candidate for adaptation to HTS.
The target chosen for optimization of this assay system was ODC from Trypanosoma brucei , the causative agent of human African trypanosomiasis. This disease is fatal if left untreated and is a major health problem in much of central Africa. 9 The only clinically validated molecular target for treatment of T. brucei infections is ODC, which catalyzes the first step in poly-amine metabolism, the decarboxylation of ornithine to produce putrescine. Putrescine and the other polyamines, spermidine and spermine, are necessary for cellular reproduction, making their regulatory enzymes attractive drug targets in both parasitology and oncology. The biological roles of polyamines are numerous, and they have been implicated in the regulation of a wide range of important genes, including P53 and c-myc . 10,11
Optimization of a Non-Radioactive High-Throughput Assay for Decarboxylase Enzymes
ABBREVIATIONS: DFMO, difl uoromethyl ornithine; DTT, dithiothreitol; HTS, high throughput screening; MDH, malate dehydrogenase; ODC, ornithine decarboxylase;
PEPC, phosphoenol pyruvate carboxylase; PLP, pyridoxal-5′-phosphate; ROC, receiver operator characteristic.
adt.2009.0249.indd 175 4/19/2010 11:37:43 AM
SMITHSON ET AL.
176 ASSAY and Drug Development Technologies APRIL 2010
In mammalian cells, ODC is highly regulated and possesses a very short half-life of 10 to 20 min. 12 However, in protozoal para-sites, particularly T. brucei brucei and T. brucei gambiense , the enzyme is longer lived (∼4 h). 13 This difference allows the use of irreversible and nonselective inhibitors of ODC such as difluorom-ethylornithine (DFMO) in clinical treatments for African trypano-somiasis. 14 Unfortunately, DFMO possesses poor pharmacokinetic properties, resulting in the need for multi-day high-dosage intra-venous treatment regimens that limit its use in the third world. 15
To date, most drug discovery efforts directed toward ODC inhibitors have focused on analogs of ornithine (such as DFMO), putrescine, or pyridoxal-5′-phosphate (PLP), a cofactor necessary for ODC activity shared by many other enzymes. 16,17 None of these have proved as effective as DFMO for treatment of T. brucei infec-tions. No large-scale efforts to discover inhibitors based on scaf-folds other than substrate, product, or cofactor analogs have been reported. The lack of large-scale drug discovery efforts has been due in part to the difficulty in assaying ODC activity in a high-throughput manner.
Therefore, we have optimized a commercial enzyme-linked bicarbonate detection system for use in HTS of ODC. We report the results of this optimization and the performance of the assay on a proof-of-concept screen of ∼3,600 unique molecules.
MATERIALS AND METHODS Materials
All chemicals assayed in this study were purchased from ven-dors without further purification. DI water was filtered with a MilliQ Synthesis Ultra-Pure water system (Millipore, Billerica,
MA) immediately before use. Infinity™ Carbon Dioxide Liquid Stable Reagent was purchased from Thermo Fisher Scientific (Waltham, MA). L -Ornithine, pyridoxal 5′-phosphate (PLP), and dithiothreitol (DTT) were purchased from Sigma-Aldrich (St. Louis, MO). DFMO-HCl was purchased from Chem-Impex International (Wood Dale, IL). All plate-based enzymatic assays were performed in 384-well black-sided, clear-bottomed polystyrene microplates (#3,702) from Corning Life Sciences (Acton, MA). The bioac-tive compound screening library at St. Jude Children’s Research Hospital was assembled from commercially available collections including the Prestwick Chemical Library (Prestwick Chemical, Illkirch, France); the LOPAC Collection (Sigma-Aldrich, St. Louis, MO); and the Spectrum Collection, the NINDS Collection, the Natural Product Collection, and the Killer Plate Collection from Microsource (Microsource Discovery systems, Gaylordsville, CT). The total bioactive test set contains ∼7,300 compounds, including many internal replicates. The total number of unique compounds in the collection is ∼3,600 molecules.
Purification of T. brucei ODC ODC was expressed as an N-terminal 6×His-tag fusion protein
in Escherichia coli BL21 (DE3) cells as described. 8 Protein was purified by Ni 2+ -NTA-agarose column followed by Superdex 200 gel-filtration column chromatography. Fractions containing the desired protein were identified by SDS-PAGE. Those containing pure ODC were combined and concentrated using an Amicon-Ultra centrifugal filter device (10 kDa cutoff, UFC901024; Millipore, Billerica, MA) to concentrations of ∼40 mg/mL. Yields of purified ODC were generally 7 to 13 mg/L of cultured cells.
HO
NH2
HCO3–
–O–O –O
O––O
O
O
O O O
OOHO O
P
HO–
NH2NH2 + CO2
H2N
O
ODC
PEPC
Monitored via Decrease inAbsorbance at 340 nm
MDH
NADH NAD+
O–O–
Scheme 1. Linked assay mechanism. Ornithine decarboxylase (ODC) catalyzes the decarboxylation of ornithine, releasing CO 2 , which is then captured by the basic buffer (pH 8.05) as bicarbonate. Phosphoenolpyruvate carboxylase (PEPC) uses this bicarbonate to generate oxa-loacetate from phosphoenolpyruvate. The oxaloacetate is then reduced by malate dehydrogenase (MDH) to malate in a NADH-dependent fashion. There is a 1:1 relationship between the amount of CO 2 produced by ODC and the amount of NADH oxidized by MDH, allowing kinetic parameters for ODC to be calculated from observing NADH levels as a function of time. The assay system has been optimized such that ODC is the rate-limiting step.
adt.2009.0249.indd 176 4/19/2010 11:37:44 AM
DECARBOXYLASE ENZYME HTS
© MARY ANN LIEBERT, INC. • VOL. 8 NO. 2 • APRIL 2010 ASSAY and Drug Development Technologies 177
Assay Automation and Nitrogen Atmosphere Generation All screening data were generated on a High Resolution
Engineering (Woburn, MA) integrated screening system using Liconic plate incubators (Woburn, MA) and a Staubli T60 robotic arm (Staubli, SC). This system is enclosed in a gas-tight Plexiglas enclosure allowing a nitrogen atmosphere to be generated by continual purging with ∼30 psi nitrogen through twin 8-mm inner diameter tubes. Nitrogen was obtained by boil-off from liq-uid nitrogen using an in-house dry nitrogen system supplied by NexAir (Memphis, TN). Nitrogen consumption during screening was estimated to be ∼200 L/min (12,000 L/h or 1,200 L per plate for a kinetic read). Percent oxygen within the enclosure was mon-itored using an Air Aware oxygen detector (model 6810-0056; Industrial Scientific, Oakdale, PA) and maintained at <2.5% throughout all high-throughput assays. Percent carbon diox-ide was below detectable levels (0.5%) as measured by Liconic STR240 series incubators (Liconic Instruments, Woburn, MA). Assay solutions were dispensed using Matrix Wellmates (Matrix Technologies, NH) equipped with 1 μL rated tubes. Plates were centrifuged after all liquid additions using a Vspin plate cen-trifuge (Velocity11, Menlo Park, CA). Compound transfers were performed using a 384-well pin tool equipped with 10 nL slot-ted hydrophobic surface-coated pins (V&P Scientific, San Diego, CA). This allowed delivery of ∼25 nL of DMSO stock solution with CVs of <10%. All absorbance data were measured using an EnVision Multilabel Plate Reader equipped with a 340 nm narrow bandwidth filter (Perkin Elmer, 2100-5740). During automation, the screening system was operated offline and individual instru-ments were accessed using manual operation of the robot arm.
ODC-PEPC-MDH-Linked Assay This assay was performed under nitrogen atmosphere. Assay
buffers were prepared under normal atmosphere while flushing with a stream of nitrogen and transferred to enclosed nitrogen atmosphere upon completion. Assay buffer (66 mM Tris, 25 mM NaCl, 8 mM MgSO 4 , 0.01% Triton-X, pH 8.05) was prepared daily. The assay reaction was prepared using 2 master mixes A and B, which were prepared immediately before use. Mix A contained ornithine (0–10 mM), PLP (0–937 μM), and 5.7 mM DTT in assay buffer. Mix A was prepared immediately before testing from fro-zen stocks prepared in water (0.5 M Orn, pH 7.5, 20 mM PLP, and 1 M DTT). Mix B contained Infinity Carbon Dioxide Liquid Stable Reagent (Infinity CO 2 , Thermo Fisher Scientific) and ODC (0–300 nM). Mix B was prepared immediately prior to testing from fresh Infinity Carbon Dioxide Liquid Stable Reagent and frozen ODC stocks. For testing, 15 μL Mix B was added to appropriate wells in a 384-well clear-bottomed plate followed by compounds transferred by pin. The 10 μL Mix A was then added to start the reaction.
Final optimized assay concentrations were 2.3 mM DTT, 600 μM ornithine, 60 μM PLP, 60% Infinity Carbon Dioxide Liquid Stable Reagent, 150 nM ODC, 10 μM test compound, and 0.01% Triton-X, in a 25-μL final volume unless otherwise specified. Reaction pro-gress was monitored by following absorbance at 340 nm using an Envision plate reader (Perkin Elmer) equipped with a narrow bandwidth 340 nm filter (Perkin Elmer, 2100-5740). Absorbance was monitored for 20 min, with time points taken every minute. Data from 15 to 20 min after addition of Mix A were fit to a linear model using statistical methods described below. The resulting slope of this fit was taken as the rate of the reaction and used as the endpoint for the assay.
Compounds for screening were placed in 384-well polypropyl-ene plates (Corning Life Sciences, Acton, MA) at 10 mM concen-tration in DMSO with columns 1, 2, 13, and 14 empty. Positive controls (DFMO, 1 M, 10 μL) were placed in a separate 384-well polypropylene plate in wells A2, B2, C2, D2, E14, F14, G14, H14, I2, J2, K2, L2, M14, N14, O14, and P14. Negative controls (DMSO, 10 μL) were placed in the same plate as positive controls in wells A14, B14, C14, D14, E2, F2, G2, H2, I14, J14, K14, L14, M2, N2, O2, and P2. All microplate compound transfers were accomplished using a 384-well pin tool equipped with 10 nL hydrophobic surface-coated pins (V&P Scientific, San Diego, CA). This allowed deliv-ery of ∼25 nL of DMSO stock solution with CVs of <10%.
Cuvette assays were performed as described above with the following minor modifications; the final assay volume in cuvettes was 500 μL at 40% Infinity Carbon Dioxide Liquid Stable Reagent, 50 μM PLP, 50 μM DTT, 1% DMSO, and varied ornithine concen-trations from 10 mM to 100 μM. As with microplate assays, assay buffer (66 mM Tris, 25 mM NaCl, 8 mM MgSO 4 , 0.01% Triton-X, pH 8.05) was prepared fresh daily.
PEPC-MDH-Linked Assay—Microplate For assay of the linking enzymes, assay buffer (66 mM Tris, 25
mM NaCl, 8 mM MgSO 4 , 0.01% Triton-X, pH 8.05) was prepared daily using water. The assay reaction was prepared in 2 master mixes. Mix A contained 1.25 mM sodium bicarbonate (Sigma-Aldrich), 100 μM PLP, and 5.7 mM DTT in assay buffer. Mix B was 100% Infinity Carbon Dioxide Liquid Stable Reagent. For testing 15 μL, Mix B was added to appropriate wells of a 384-well clear-bottomed microplate followed by pin-transfer compound DMSO stocks. Compounds were allowed to equilibrate in the presence of enzymes for 20 min before substrate was added. The reaction was started by addition of 10 μL Mix A and reaction progress was mon-itored by absorbance at 340 nm. Positive controls were wells with no sodium bicarbonate added, negative controls were DMSO.
Final assay concentrations were 2.3 mM DTT, 60 μM PLP, 0.75 mM sodium bicarbonate, 60% Infinity Carbon Dioxide Liquid
adt.2009.0249.indd 177 4/19/2010 11:37:44 AM

SMITHSON ET AL.
178 ASSAY and Drug Development Technologies APRIL 2010
Stable Reagent, and 0.01% Triton-X. Reaction progress was mon-itored by decrease in absorbance at 340 nm using an Envision plate reader (Perkin Elmer) equipped with a narrow bandwidth 340 nm filter (Perkin Elmer, 2100-5740) for 10 min with time points taken every 1 min. Data from 1 to 5 min were fit to a linear model using statistical methods as described below and normal-ized to the positive and negative controls.
Primary Screening Data Analysis and Reaction Rate Calculation
Primary screening data analysis was performed using cus-tom protocols written in Pipeline Pilot (v. 6.1.1, Accelrys) and the R program (http://www.r-project.org/, v. 2.7.0). 18 For rate deter-mination, kinetic data were fit using 3 methods: a linear model using least squares (“linear,” calculated using the lm function in robustbase R package, v. 0.2-7), a linear model using only the difference between the first and last time points (“delta”), and a robust linear model using an iteratively re-weighted least squares algorithm (“robust,” calculated using the lmrob function in robust base R package, v. 0.2-7). 19 For hit identification, the final 5 min of data (6 data points in total including the 15 min time point) were fit using the “linear” method. The fitted rates were the values used in the calculations of all plate statistics. Only plates passing the minimum Z ′ and Z -factor thresholds of 0.4 and 0.4, respec-tively, were accepted. Initial screening hits were determined on a plate-by-plate basis by identifying compounds with activities that were simultaneously outliers from the negative control and variable compound populations. The outlier cutoffs were calcu-lated as the upper fourth plus 1.5 times the fourth spread (the upper fourth and fourth spread are similar to the third quartile and interquartile range, respectively), a robust statistic that cor-responds to a P value of ∼0.005 for normal distributions. 20 For Z ′ calculations, 16 positive and 16 negative controls were used unless otherwise stated. Reaction rate was transformed from AU/min to mM NADH/min using an extinction coefficient of 6.349 AU/mM/cm for NADH and an approximate path length of 0.4 cm for assays performed at 25 μL final volume in a 384-well plate.
Reaction rates for dose–response data were calculated as described above. Rates were then normalized to DMSO and DFMO controls and sigmoidal curves with variable slopes were fit using Graphpad Prism 4.03. No constraints were used when fitting this data.
Receiver Operating Characteristic Analysis Receiver operating characteristic (ROC) analysis was per-
formed using custom R scripts (http://www.r-project.org/, v. 2.9.0) and the R rocr package (v. 1.0.2). The ROC test set was composed of 63 compounds that uniformly sample from the distribution of
observed primary screen activities (−7% to 103%). A compound was considered a true positive if it inhibited ODC in a dose-depen-dent fashion, had no effect in the PEPC-MDH assay system, and showed a 2-fold increase in reaction rate when screened with 300 nM ODC. The ROC curve was formed by plotting the true positive rate vs. the false positive rate as a function of decreasing primary screen activity. Confidence intervals for the ROC area under the curve (AUC) were calculated from 200 bootstrap simulations.
RESULTS Optimization of ODC-PEPC-MDH-Linked Assay
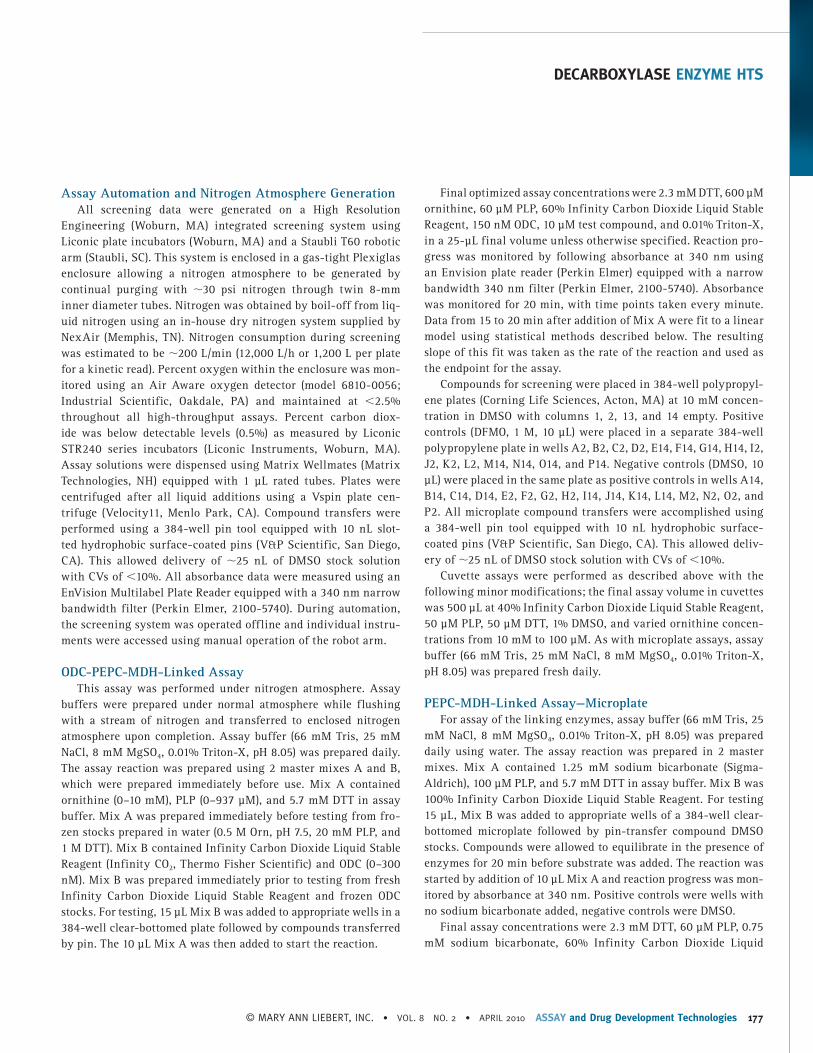
The assay system was chosen in part because the linking sys-tem was available from Thermo Fisher Scientific, simplifying quality control and large-scale reagent sourcing. This system was designed for clinical detection of bicarbonate in bodily fluids, and is extremely sensitive to low levels of dissolved CO 2 , which is in equilibrium with bicarbonate in aqueous solutions. Unfortunately, this sensitivity is a disadvantage in HTS applications. The back-ground signal produced by atmospheric CO 2 reduces the assay linear time and causes reagents placed on the screening deck to rapidly degrade. However, if reagents are stored, dispensed, incubated, and read under a nitrogen atmosphere, this liability is largely mitigated. When the assay is performed under nitrogen, the signal-to-noise ratio increases from 2.5 to 8.1 and there is a significant increase in reagent stability (see Fig. 1A ). For this rea-son, all optimization and screening experiments were performed under an inert nitrogen atmosphere as described.
The assay rate was linear with respect to ODC concentration from 20 to ∼600 nM. A final concentration of 150 nM ODC was chosen for the primary screen, based upon signal-to-noise ratio and Z ′ score (>4 and >0.5, respectively, Fig. 1B ). The final PLP concentration chosen was 60 μM, ∼300-fold over the literature reported K m , 21 to minimize the probability of finding compounds that interfered directly with PLP, or competed for the PLP-binding site. The assay buffer was not optimized, and was formulated to match the commercial linking buffer in order to maintain perfor-mance of the linking system. Several methods to remove dissolved CO 2 from the buffer were tested including vacuum degassing and nitrogen sparging. None offered significant reductions in back-ground signal over using fresh MilliQ Synthesis grade water (data not shown). To ensure that the assay system was performing com-parably to other literature methods, the K m for ornithine was mea-sured. The values obtained (420 ± 22 μM, Fig. 1C ) were consistent with literature values (370–500 μM). 22 , 23 The relatively low orni-thine concentration chosen for screening (625 μM, 1.5 × K m ) was selected to maximize the probability of finding ornithine compet-itive inhibitors. The k cat determined under screening conditions (0.71 s −1 at ∼22°C) is ∼10-fold lower than the reported literature
adt.2009.0249.indd 178 4/19/2010 11:37:45 AM
DECARBOXYLASE ENZYME HTS
© MARY ANN LIEBERT, INC. • VOL. 8 NO. 2 • APRIL 2010 ASSAY and Drug Development Technologies 179
values. 21 This was determined to be a temperature effect, and it was possible to replicate literature values by performing the assay at 37°C. Due to limitations with our integrated plate reader, all HTS was performed at room temperature (∼22°C).
Finally, the amount of linking enzyme mix (Infinity CO 2 ) was optimized ( Fig. 1D ). While the signal remained linear over the 20-min assay window for both 60% and 45% Infinity CO 2 , 60% was chosen in order to maximize the linear time available during screening and reduce dependence on precise timing during the
process. The percentage was not increased past 60% due to the fact that absorbance values were already approaching 1.2 at this concentration. The assay system’s tolerance for DMSO was also tested, and was shown to be up to 10% at optimized screening conditions (data not shown).
Optimization of Secondary PEPC-MDH Assay In light of the fact that this assay is dependent upon the activity
of the 2 linking enzymes as well as that of ODC, a secondary assay
00 10 20 30 40 50Time (min)
60 70 80 90
0 0.0
0.00
0.25
0.50
0.75
1.00
1.25A
U340
2.5 5.0 7.5 10.0
Time (min)
Optimization of Infinity CO2 Percentage
12.5 15.0 17.5 20.0
0.0000
0.0025
0.0050
Rate
(m
M/m
in)
0.0075
5,000 10,000
Determination of Orn Km
Km = 420 ± 22 μM
kcat = 0.78 ± 0.02 s–1
15,000 20,000 25,000Orn (μM)
0.00 0.0
0.1
0.2
0.3
0.4
0.5
0.6 Z′ Valu
e
0.7
0.8
0.9
0.01
0.02
0.03
0.04
250 500 750 1,000 1,250 1,5000.00
0.25
0.50
0.75
1.00
[ODC (nM)]
Optimization of ODC Levels
Reaction R
ate
(m
M N
AD
H/m
in)
Rate = 0.020 AU/min
Rate = 0.0162 AU/min
Rate = 0.008 AU/min
Rate = 0.002 AU/min
Effect of Nitrogen AtmosphereA
C D
B
AU
Fig. 1. Optimization of assay conditions. ( A ) Increase in background signal under normal atmosphere. The signal seen here in green is solely from atmospheric CO 2 (orange = nitrogen atmosphere, no ornithine; green = standard atmosphere, no ornithine; blue = nitrogen atmosphere, 625 μM ornithine; red = standard atmosphere, 625 μM ornithine). Quadruplicate data were collected in a 384-well microplate as described in the presence of the indicated concentrations of ornithine. All other reagent concentrations were identical to the optimized conditions described in Materials and Methods. The nitrogen atmosphere was maintained as described with O 2 levels under 2.5%. ( B ) Optimization of enzyme levels. ▼ = Z ′ values, ■ = reaction rates. Dashed line indicates standard Z ′ cutoff value of 0.5. Data were collected in a 384-well microplate using optimized assay conditions with varied fi nal ornithine decarboxylase (ODC) concentrations. Z ′ Values were calculated using 8 positive (1 mM difl uoromethylornithine (DFMO)) and 8 negative (DMSO) controls. The signal window at 150 nM ODC is ∼5-fold. ( C ) Determination of ODC K m at 150 nM ODC and 60 μM PLP. Data were collected in a 384-well plate as described and fi t to the Michaelis–Menten equation. ( D ) Optimization of Infi nity CO 2 percentage (■ = 60% Infi nity CO 2 , ▲ = 45% Infi nity CO 2 , ▼ = 30% Infi nity CO 2 , ♦ = 15% Infi nity CO 2 , • = 7.5% Infi nity CO 2 ). Data were collected in 384-well plates as described at optimized assay conditions with varied Infi nity CO 2 . Data points were taken every 15 s in quadruplicate. The plot of AU 340 vs. time at 60% Infi nity CO 2 represents a typical data set under optimized assay conditions with a ∆AU 340 of ∼0.4 AU.
adt.2009.0249.indd 179 4/19/2010 11:37:45 AM
SMITHSON ET AL.
180 ASSAY and Drug Development Technologies APRIL 2010
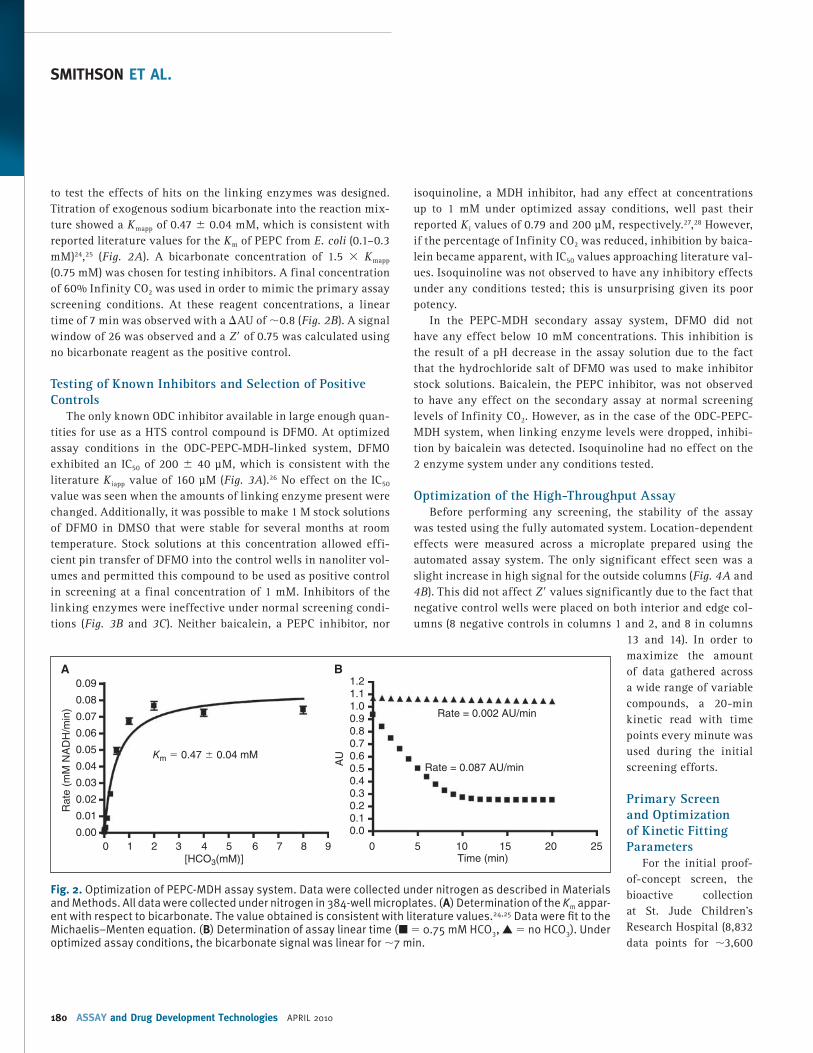
to test the effects of hits on the linking enzymes was designed. Titration of exogenous sodium bicarbonate into the reaction mix-ture showed a K mapp of 0.47 ± 0.04 mM, which is consistent with reported literature values for the K m of PEPC from E. coli (0.1–0.3 mM) 24 , 25 ( Fig. 2A ). A bicarbonate concentration of 1.5 × K mapp (0.75 mM) was chosen for testing inhibitors. A final concentration of 60% Infinity CO 2 was used in order to mimic the primary assay screening conditions. At these reagent concentrations, a linear time of 7 min was observed with a ∆AU of ∼0.8 ( Fig. 2B ). A signal window of 26 was observed and a Z ′ of 0.75 was calculated using no bicarbonate reagent as the positive control.
Testing of Known Inhibitors and Selection of Positive Controls
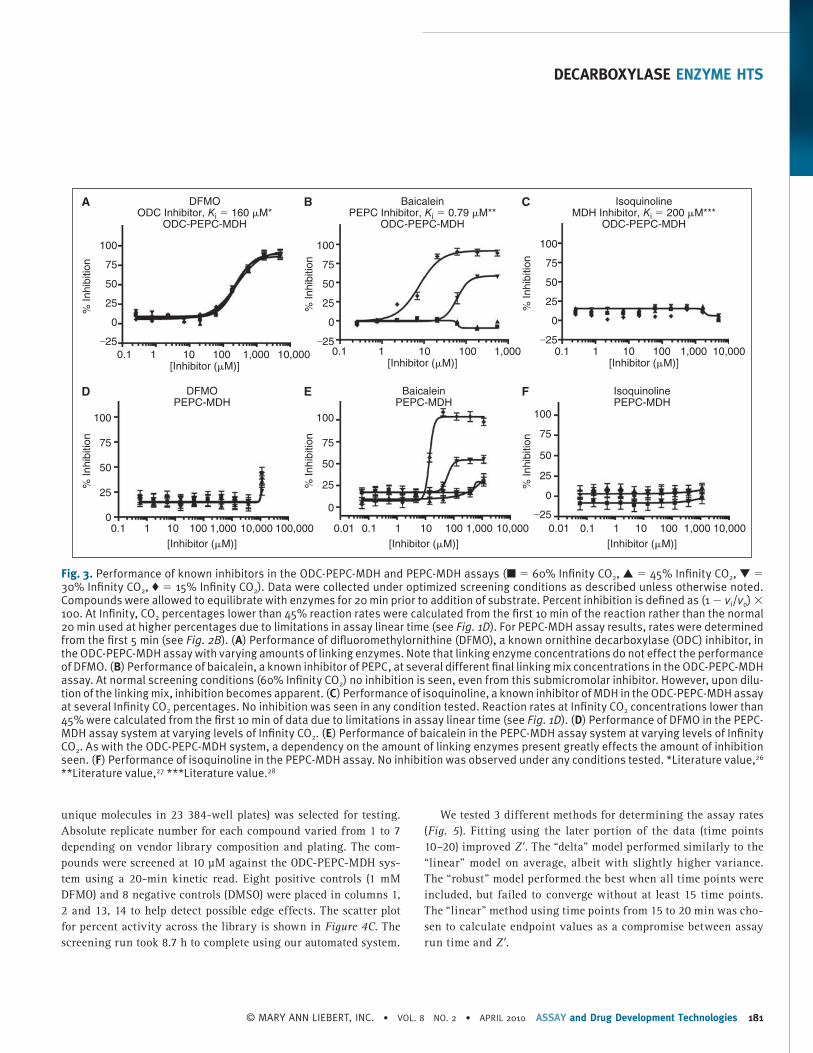
The only known ODC inhibitor available in large enough quan-tities for use as a HTS control compound is DFMO. At optimized assay conditions in the ODC-PEPC-MDH-linked system, DFMO exhibited an IC 50 of 200 ± 40 μM, which is consistent with the literature K iapp value of 160 μM ( Fig. 3A ). 26 No effect on the IC 50 value was seen when the amounts of linking enzyme present were changed. Additionally, it was possible to make 1 M stock solutions of DFMO in DMSO that were stable for several months at room temperature. Stock solutions at this concentration allowed effi-cient pin transfer of DFMO into the control wells in nanoliter vol-umes and permitted this compound to be used as positive control in screening at a final concentration of 1 mM. Inhibitors of the linking enzymes were ineffective under normal screening condi-tions ( Fig. 3B and 3C ). Neither baicalein, a PEPC inhibitor, nor
isoquinoline, a MDH inhibitor, had any effect at concentrations up to 1 mM under optimized assay conditions, well past their reported K i values of 0.79 and 200 μM, respectively. 27 , 28 However, if the percentage of Infinity CO 2 was reduced, inhibition by baica-lein became apparent, with IC 50 values approaching literature val-ues. Isoquinoline was not observed to have any inhibitory effects under any conditions tested; this is unsurprising given its poor potency.
In the PEPC-MDH secondary assay system, DFMO did not have any effect below 10 mM concentrations. This inhibition is the result of a pH decrease in the assay solution due to the fact that the hydrochloride salt of DFMO was used to make inhibitor stock solutions. Baicalein, the PEPC inhibitor, was not observed to have any effect on the secondary assay at normal screening levels of Infinity CO 2 . However, as in the case of the ODC-PEPC-MDH system, when linking enzyme levels were dropped, inhibi-tion by baicalein was detected. Isoquinoline had no effect on the 2 enzyme system under any conditions tested.
Optimization of the High-Throughput Assay Before performing any screening, the stability of the assay
was tested using the fully automated system. Location-dependent effects were measured across a microplate prepared using the automated assay system. The only significant effect seen was a slight increase in high signal for the outside columns ( Fig. 4A and 4B ). This did not affect Z ′ values significantly due to the fact that negative control wells were placed on both interior and edge col-umns (8 negative controls in columns 1 and 2, and 8 in columns
13 and 14). In order to maximize the amount of data gathered across a wide range of variable compounds, a 20-min kinetic read with time points every minute was used during the initial screening efforts.
Primary Screen and Optimization of Kinetic Fitting Parameters
For the initial proof-of-concept screen, the bioactive collection at St. Jude Children’s Research Hospital (8,832 data points for ∼3,600
0
0.00
0.01
0.02
0.03
0.04
0.05
0.06
0.07
0.08
0.09
A B
1 2 3 4
Rate
(m
M N
AD
H/m
in)
5[HCO3(mM)]
6 7 8 9 0
0.00.10.20.30.40.50.60.70.80.91.01.11.2
5 10 15Time (min)
Rate = 0.087 AU/min
Rate = 0.002 AU/min
AU
20 25
Km = 0.47 ± 0.04 mM
Fig. 2. Optimization of PEPC-MDH assay system. Data were collected under nitrogen as described in Materials and Methods. All data were collected under nitrogen in 384-well microplates. ( A ) Determination of the K m appar-ent with respect to bicarbonate. The value obtained is consistent with literature values. 24,25 Data were fi t to the Michaelis–Menten equation. ( B ) Determination of assay linear time (■ = 0.75 mM HCO 3 , ▲ = no HCO 3 ). Under optimized assay conditions, the bicarbonate signal was linear for ∼7 min.
adt.2009.0249.indd 180 4/19/2010 11:37:46 AM
DECARBOXYLASE ENZYME HTS
© MARY ANN LIEBERT, INC. • VOL. 8 NO. 2 • APRIL 2010 ASSAY and Drug Development Technologies 181
unique molecules in 23 384-well plates) was selected for testing. Absolute replicate number for each compound varied from 1 to 7 depending on vendor library composition and plating. The com-pounds were screened at 10 μM against the ODC-PEPC-MDH sys-tem using a 20-min kinetic read. Eight positive controls (1 mM DFMO) and 8 negative controls (DMSO) were placed in columns 1, 2 and 13, 14 to help detect possible edge effects. The scatter plot for percent activity across the library is shown in Figure 4C . The screening run took 8.7 h to complete using our automated system.
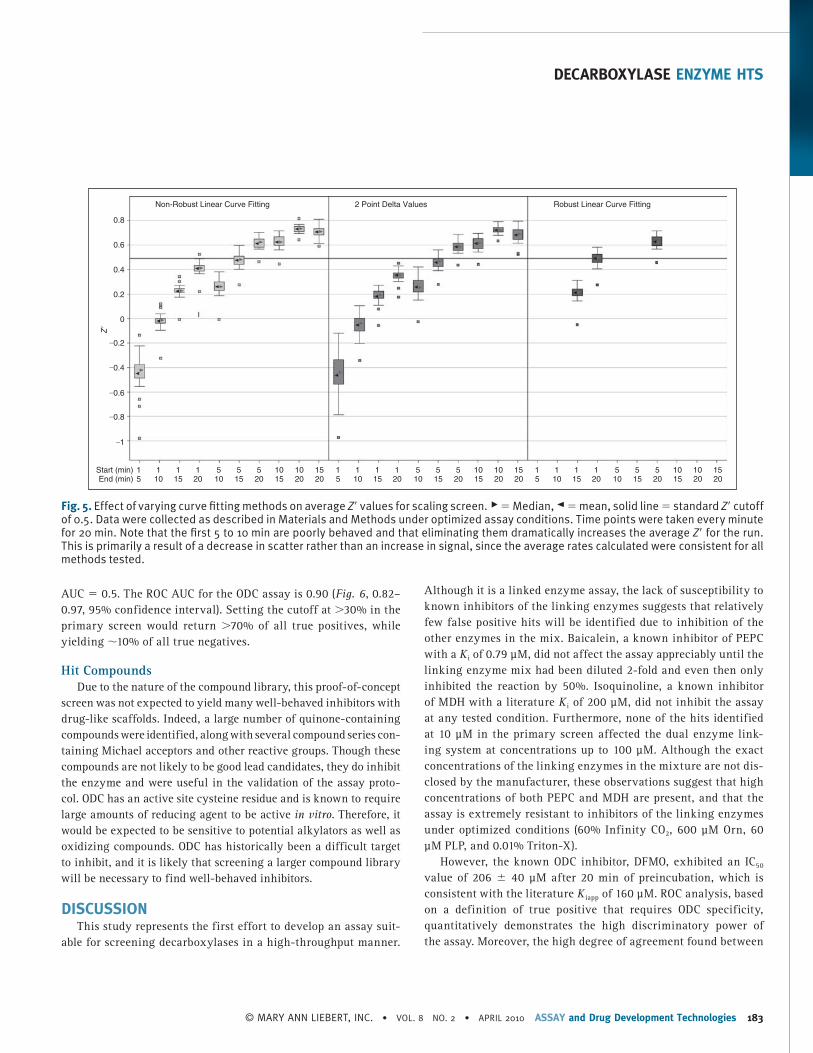
We tested 3 different methods for determining the assay rates ( Fig. 5 ). Fitting using the later portion of the data (time points 10–20) improved Z ′. The “delta” model performed similarly to the “linear” model on average, albeit with slightly higher variance. The “robust” model performed the best when all time points were included, but failed to converge without at least 15 time points. The “linear” method using time points from 15 to 20 min was cho-sen to calculate endpoint values as a compromise between assay run time and Z ′.
0.1
–25
0
25
50
75
100
A B C
% Inhib
itio
n
0
25
50
75
100
D
% Inhib
itio
n
0
25
50
75
100
E
% Inhib
itio
n
0
25
50
75
100
F
% Inhib
itio
n
–25
–25
0
25
50
75
100
% Inhib
itio
n
–25
0
25
50
75
100
% Inhib
itio
n
1 10 100[Inhibitor (μM)]
DFMOODC Inhibitor, Ki = 160 μM*
ODC-PEPC-MDH
DFMOPEPC-MDH
BaicaleinPEPC-MDH
IsoquinolinePEPC-MDH
BaicaleinPEPC Inhibitor, Ki = 0.79 μM**
ODC-PEPC-MDH
IsoquinolineMDH Inhibitor, Ki = 200 μM***
ODC-PEPC-MDH
1,000 10,000
0.1 1 10 100
[Inhibitor (μM)]
1,000 10,000 0.10.01 1 10 100
[Inhibitor (μM)]
1,000 10,000 0.10.01 1 10 100
[Inhibitor (μM)]
1,000 10,000100,000
0.1 1 10 100[Inhibitor (μM)]
1,000 0.1 1 10 100[Inhibitor (μM)]
1,000 10,000
Fig. 3. Performance of known inhibitors in the ODC-PEPC-MDH and PEPC-MDH assays (■ = 60% Infi nity CO 2 , ▲ = 45% Infi nity CO 2 , ▼ = 30% Infi nity CO 2 , ♦ = 15% Infi nity CO 2 ). Data were collected under optimized screening conditions as described unless otherwise noted. Compounds were allowed to equilibrate with enzymes for 20 min prior to addition of substrate. Percent inhibition is defi ned as (1 − v i / v o ) × 100. At Infi nity, CO 2 percentages lower than 45% reaction rates were calculated from the fi rst 10 min of the reaction rather than the normal 20 min used at higher percentages due to limitations in assay linear time (see Fig. 1D ). For PEPC-MDH assay results, rates were determined from the fi rst 5 min (see Fig. 2B ). ( A ) Performance of difl uoromethylornithine (DFMO), a known ornithine decarboxylase (ODC) inhibitor, in the ODC-PEPC-MDH assay with varying amounts of linking enzymes. Note that linking enzyme concentrations do not effect the performance of DFMO. ( B ) Performance of baicalein, a known inhibitor of PEPC, at several different fi nal linking mix concentrations in the ODC-PEPC-MDH assay. At normal screening conditions (60% Infi nity CO 2 ) no inhibition is seen, even from this submicromolar inhibitor. However, upon dilu-tion of the linking mix, inhibition becomes apparent. ( C ) Performance of isoquinoline, a known inhibitor of MDH in the ODC-PEPC-MDH assay at several Infi nity CO 2 percentages. No inhibition was seen in any condition tested. Reaction rates at Infi nity CO 2 concentrations lower than 45% were calculated from the fi rst 10 min of data due to limitations in assay linear time (see Fig. 1D ). ( D ) Performance of DFMO in the PEPC-MDH assay system at varying levels of Infi nity CO 2 . ( E ) Performance of baicalein in the PEPC-MDH assay system at varying levels of Infi nity CO 2 . As with the ODC-PEPC-MDH system, a dependency on the amount of linking enzymes present greatly effects the amount of inhibition seen. ( F ) Performance of isoquinoline in the PEPC-MDH assay. No inhibition was observed under any conditions tested. *Literature value, 26 **Literature value, 27 ***Literature value. 28
adt.2009.0249.indd 181 4/19/2010 11:37:46 AM

SMITHSON ET AL.
182 ASSAY and Drug Development Technologies APRIL 2010
The overall data quality for the 3-enzyme assay was satisfac-tory, with an average Z ′ value of 0.68 across all plates. The robust outlier cutoff yielded 84 primary hits, of which 52 were unique. Internal duplication of compounds afforded an assessment of
assay reproducibility. Active repli-cates were detected 86% of the time with an average activity CV of 16%, and 97% of the time with an average activity CV of only 3% when restrict-ing replicates to those from the same vendor.
Secondary Testing To further characterize the hits,
aliquots of each unique sample were cherry-picked and subjected to full dose–response studies consisting of 10 points in a 1:3 dilution series (top = 100 μM). Thirty three of the initial 52 unique hits displayed a full dose response while 15 displayed partial dose responses in the ODC-PEPC-MDH system—a 92% confirmation rate. None of the samples signifi-cantly affected the PEPC-MDH sys-tem at concentrations up to 100 μM at 60% Infinity CO 2 under optimized assay conditions. To further confirm that inhibition of ODC was the rate-limiting step in the reaction cascade, the samples were re-screened at 300 nM ODC, and the rates at the IC 50 were compared to those determined at 150 nM ODC. All samples displayed the predicted 2-fold increase at the higher enzyme concentration, confirming that inhibition of ODC was the rate-limiting step. These compounds were designated as true positives for the ROC analysis.
ROC Analysis ROC analysis provides an assess-
ment of the discriminatory power of an assay that is nonparametric (ie, does not assume Gaussian distribu-tion) and that is independent of both the number of true positives and the
threshold for classifying hits. The ROC AUC is the probability that the assay will rank a randomly chosen true positive ahead of a randomly chosen true negative. A random assay—one that cannot discriminate true positives from true negatives—has an
00.0000
0.0009
0.0019
Reaction R
ate
(m
M N
AD
H/m
in)
0.0029
0.0039
0.0049
A
C
0.0000
0.0009
0.0019
Reaction R
ate
(m
M N
AD
H/m
in)
0.0029
0.0039
0.0049
B
64 128 192
Well Number by Row
0
0
50
100
% A
ctivity
150
2,000 4,000
Compounds in Order Screened
Scatterplot of High Throughput Data
6,000 8,000
256 320 384 0 64 128 192
Well Number by Column
256 320 384
Fig. 4. ODC-PEPC-MDH-linked plate geographic effects and high-throughput data scatter plot. Assays were performed in 384-well plates as described and rates were calculated from the fi nal 6 data points from a 20-min observation. ■ = High signal (DMSO), ▲ = mid signal (200 μM difl uoromethylornithine (DFMO)), ▼ = low signal (1 mM DFMO). ( A ) Column effects resulting in a slight increase in signal on the outer columns. ( B ) Data from 3A arranged by row, showing that signal across rows is constant. The signal window for the assay is also apparent in these fi gures and is ∼4.5. ( C ) Data from the small-scale high-throughput assay of the bioactive compound col-lection at St. Jude Children’s Research Hospital. Green circles = positive control (1 mM DFMO), red circles = negative control (DMSO), blue circles = hit compound, black circles = inactive compound. Magenta line = 99th percentile cutoff, orange line = 95th percentile cutoff. Percent activity was calculated by normalizing kinetic reaction rates (20-min data collection with the fi nal 6 data points fi t as described in Materials and Methods) to positive and negative controls. The 8,832 total data points were collected from ∼3,600 unique compounds. Absolute replicate number for each compound varied from 1 to 7, depending on vendor library composition and plating. The assay took 8.7 h to complete using our automation system.
adt.2009.0249.indd 182 4/19/2010 11:37:47 AM
DECARBOXYLASE ENZYME HTS
© MARY ANN LIEBERT, INC. • VOL. 8 NO. 2 • APRIL 2010 ASSAY and Drug Development Technologies 183
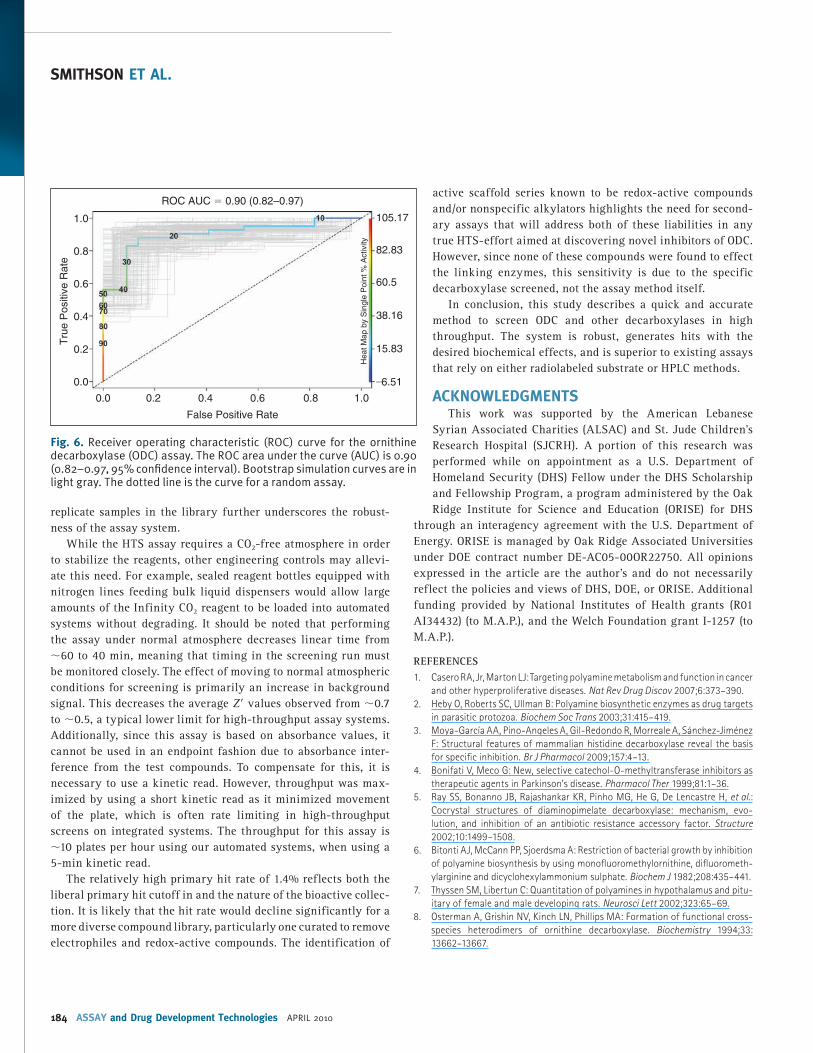
AUC = 0.5. The ROC AUC for the ODC assay is 0.90 ( Fig. 6 , 0.82–0.97, 95% confidence interval). Setting the cutoff at >30% in the primary screen would return >70% of all true positives, while yielding ∼10% of all true negatives.
Hit Compounds Due to the nature of the compound library, this proof-of-concept
screen was not expected to yield many well-behaved inhibitors with drug-like scaffolds. Indeed, a large number of quinone-containing compounds were identified, along with several compound series con-taining Michael acceptors and other reactive groups. Though these compounds are not likely to be good lead candidates, they do inhibit the enzyme and were useful in the validation of the assay proto-col. ODC has an active site cysteine residue and is known to require large amounts of reducing agent to be active in vitro . Therefore, it would be expected to be sensitive to potential alkylators as well as oxidizing compounds. ODC has historically been a difficult target to inhibit, and it is likely that screening a larger compound library will be necessary to find well-behaved inhibitors.
DISCUSSION This study represents the first effort to develop an assay suit-
able for screening decarboxylases in a high-throughput manner.
Although it is a linked enzyme assay, the lack of susceptibility to known inhibitors of the linking enzymes suggests that relatively few false positive hits will be identified due to inhibition of the other enzymes in the mix. Baicalein, a known inhibitor of PEPC with a K i of 0.79 μM, did not affect the assay appreciably until the linking enzyme mix had been diluted 2-fold and even then only inhibited the reaction by 50%. Isoquinoline, a known inhibitor of MDH with a literature K i of 200 μM, did not inhibit the assay at any tested condition. Furthermore, none of the hits identified at 10 μM in the primary screen affected the dual enzyme link-ing system at concentrations up to 100 μM. Although the exact concentrations of the linking enzymes in the mixture are not dis-closed by the manufacturer, these observations suggest that high concentrations of both PEPC and MDH are present, and that the assay is extremely resistant to inhibitors of the linking enzymes under optimized conditions (60% Infinity CO 2 , 600 μM Orn, 60 μM PLP, and 0.01% Triton-X).
However, the known ODC inhibitor, DFMO, exhibited an IC 50 value of 206 ± 40 μM after 20 min of preincubation, which is consistent with the literature K iapp of 160 μM. ROC analysis, based on a definition of true positive that requires ODC specificity, quantitatively demonstrates the high discriminatory power of the assay. Moreover, the high degree of agreement found between
1
–1
–0.8
–0.6
–0.4
–0.2
0
0.2
0.4
Z′
0.6
0.8
Start (min)End (min)
1 1 1 5 5 5
Non-Robust Linear Curve Fitting 2 Point Delta Values Robust Linear Curve Fitting
10 10 155 10 15 20 10 15 20 15 20 20 5 10 15 20 10 15 20 15 20 20 5 10 15 20 10 15 20 15 20 20
1 1 1 1 5 5 5 10 10 15 1 1 1 1 5 5 5 10 10 15
Fig. 5. Effect of varying curve fi tting methods on average Z ′ values for scaling screen. ▶ = Median, ◄ = mean, solid line = standard Z ′ cutoff of 0.5. Data were collected as described in Materials and Methods under optimized assay conditions. Time points were taken every minute for 20 min. Note that the fi rst 5 to 10 min are poorly behaved and that eliminating them dramatically increases the average Z ′ for the run. This is primarily a result of a decrease in scatter rather than an increase in signal, since the average rates calculated were consistent for all methods tested.
adt.2009.0249.indd 183 4/19/2010 11:37:49 AM
SMITHSON ET AL.
184 ASSAY and Drug Development Technologies APRIL 2010
replicate samples in the library further underscores the robust-ness of the assay system.
While the HTS assay requires a CO 2 -free atmosphere in order to stabilize the reagents, other engineering controls may allevi-ate this need. For example, sealed reagent bottles equipped with nitrogen lines feeding bulk liquid dispensers would allow large amounts of the Infinity CO 2 reagent to be loaded into automated systems without degrading. It should be noted that performing the assay under normal atmosphere decreases linear time from ∼60 to 40 min, meaning that timing in the screening run must be monitored closely. The effect of moving to normal atmospheric conditions for screening is primarily an increase in background signal. This decreases the average Z ′ values observed from ∼0.7 to ∼0.5, a typical lower limit for high-throughput assay systems. Additionally, since this assay is based on absorbance values, it cannot be used in an endpoint fashion due to absorbance inter-ference from the test compounds. To compensate for this, it is necessary to use a kinetic read. However, throughput was max-imized by using a short kinetic read as it minimized movement of the plate, which is often rate limiting in high-throughput screens on integrated systems. The throughput for this assay is ∼10 plates per hour using our automated systems, when using a 5-min kinetic read.
The relatively high primary hit rate of 1.4% reflects both the liberal primary hit cutoff in and the nature of the bioactive collec-tion. It is likely that the hit rate would decline significantly for a more diverse compound library, particularly one curated to remove electrophiles and redox-active compounds. The identification of
active scaffold series known to be redox-active compounds and/or nonspecific alkylators highlights the need for second-ary assays that will address both of these liabilities in any true HTS-effort aimed at discovering novel inhibitors of ODC. However, since none of these compounds were found to effect the linking enzymes, this sensitivity is due to the specific decarboxylase screened, not the assay method itself.
In conclusion, this study describes a quick and accurate method to screen ODC and other decarboxylases in high throughput. The system is robust, generates hits with the desired biochemical effects, and is superior to existing assays that rely on either radiolabeled substrate or HPLC methods.
ACKNOWLEDGMENTS This work was supported by the American Lebanese
Syrian Associated Charities (ALSAC) and St. Jude Children’s Research Hospital (SJCRH). A portion of this research was performed while on appointment as a U.S. Department of Homeland Security (DHS) Fellow under the DHS Scholarship and Fellowship Program, a program administered by the Oak Ridge Institute for Science and Education (ORISE) for DHS
through an interagency agreement with the U.S. Department of Energy. ORISE is managed by Oak Ridge Associated Universities under DOE contract number DE-AC05-00OR22750. All opinions expressed in the article are the author’s and do not necessarily reflect the policies and views of DHS, DOE, or ORISE. Additional funding provided by National Institutes of Health grants (R01 AI34432) (to M.A.P.), and the Welch Foundation grant I-1257 (to M.A.P.).
REFERENCES 1. Casero RA , Jr , Marton LJ : Targeting polyamine metabolism and function in cancer
and other hyperproliferative diseases . Nat Rev Drug Discov 2007 ; 6 : 373 – 390 .
2. Heby O , Roberts SC , Ullman B : Polyamine biosynthetic enzymes as drug targets
in parasitic protozoa . Biochem Soc Trans 2003 ; 31 : 415 – 419 .
3. Moya-García AA , Pino-Angeles A , Gil-Redondo R , Morreale A , Sánchez-Jiménez
F : Structural features of mammalian histidine decarboxylase reveal the basis
for specifi c inhibition . Br J Pharmacol 2009 ; 157 : 4 – 13 .
4. Bonifati V , Meco G : New, selective catechol-O-methyltransferase inhibitors as
therapeutic agents in Parkinson’s disease . Pharmacol Ther 1999 ; 81 : 1 – 36 .
5. Ray SS , Bonanno JB , Rajashankar KR , Pinho MG , He G , De Lencastre H , et al .:
Cocrystal structures of diaminopimelate decarboxylase: mechanism, evo-
lution, and inhibition of an antibiotic resistance accessory factor . Structure
2002 ; 10 : 1499 – 1508 .
6. Bitonti AJ , McCann PP , Sjoerdsma A : Restriction of bacterial growth by inhibition
of polyamine biosynthesis by using monofl uoromethylornithine, difl uorometh-
ylarginine and dicyclohexylammonium sulphate . Biochem J 1982 ; 208 : 435 – 441 .
7. Thyssen SM , Libertun C : Quantitation of polyamines in hypothalamus and pitu-
itary of female and male developing rats . Neurosci Lett 2002 ; 323 : 65 – 69 .
8. Osterman A , Grishin NV , Kinch LN , Phillips MA : Formation of functional cross-
species heterodimers of ornithine decarboxylase . Biochemistry 1994 ; 33 :
13662 – 13667 .
0.0
0.0 –6.51
15.83
38.16
60.5
82.83
105.17
0.2
0.4
Tru
e P
ositiv
e R
ate
0.6
0.8
1.0
0.2 0.4
False Positive Rate
Heat
Map b
y S
ingle
Poin
t %
Activity
ROC AUC = 0.90 (0.82–0.97)
0.6 0.8 1.0
Fig. 6. Receiver operating characteristic (ROC) curve for the ornithine decarboxylase (ODC) assay. The ROC area under the curve (AUC) is 0.90 (0.82–0.97, 95% confi dence interval). Bootstrap simulation curves are in light gray. The dotted line is the curve for a random assay.
adt.2009.0249.indd 184 4/19/2010 11:37:50 AM
DECARBOXYLASE ENZYME HTS
© MARY ANN LIEBERT, INC. • VOL. 8 NO. 2 • APRIL 2010 ASSAY and Drug Development Technologies 185
9. WHO . African Trypanosomiasis (sleeping sickness) . http://www.who.int/media-
centre/factsheets/fs259/en/ (accessed November 26, 2007).
10. Ray RM , Zimmerman BJ , McCormack SA , Patel TB , Johnson LR : Polyamine
depletion arrests cell cycle and induces inhibitors p21(Waf1/Cip1), p27(Kip1),
and p53 in IEC-6 cells . Am J Physiol 1999 ; 276 : C684 – C691 .
11. Celano P , Baylin SB , Giardiello FM , Nelkin BD , Casero RA , Jr : Effect of polyamine
depletion on c-myc expression in human colon carcinoma cells . J Biol Chem
1988 ; 263 : 5491 – 5494 .
12. Iwami K , Wang JY , Jain R , McCormack S , Johnson LR : Intestinal orni-
thine decarboxylase: half-life and regulation by putrescine . Am J Physiol
1990 ; 258 : G308 – G315 .
13. Phillips MA , Coffi no P , Wang CC : Cloning and sequencing of the ornithine decar-
boxylase gene from Trypanosoma brucei. Implications for enzyme turnover and
selective difl uoromethylornithine inhibition . J Biol Chem 1987 ; 262 : 8721 – 8727 .
14. Van Nieuwenhove S , Schechter PJ , Declercq J , Boné G , Burke J , Sjoerdsma
A : Treatment of gambiense sleeping sickness in the Sudan with oral DFMO
(DL-alpha-difl uoromethylornithine), an inhibitor of ornithine decarboxylase;
fi rst fi eld trial . Trans R Soc Trop Med Hyg 1985 ; 79 : 692 – 698 .
15. Abeloff MD , Slavik M , Luk GD , Griffi n CA , Hermann J , Blanc O , et al .: Phase I trial
and pharmacokinetic studies of alpha-difl uoromethylornithine--an inhibitor of
polyamine biosynthesis . J Clin Oncol 1984 ; 2 : 124 – 130 .
16. Bey P , Danzin C , Jung M : Inhibition of basic amino acid decarboxylases involved
in polyamine biosynthesis . In: Inhibition of Polyamine Metabolism—Biological
Signifi cance and Basis for New Therapies ( McCann PP , Pegg AE , Sjoerdsma A ,
eds.), pp. 1 – 31 . Academic Press , San Diego , 1987 .
17. Amadasi A , Bertoldi M , Contestabile R , Bettati S , Cellini B , di Salvo ML , et al .:
Pyridoxal 5’-phosphate enzymes as targets for therapeutic agents . Curr Med
Chem 2007 ; 14 : 1291 – 1324 .
18. Team RDC : R: A Language and Environment for Statistical Computing . R
Foundation for Statistical Computing , Vienna , 2007 .
19. Peter Rousseeuw CC , Todorov V , Ruckstuhl A , Salibian-Barrera M , Maechler M :
Robustbase:Basic Robust Statistics R package 0.2-7; 2006.
20. Hoaglin DC , Mosteller F , Tukey JW : Understanding Robust and Exploratory Data
Analysis . John Wiley and Sons, Inc. , New York , 1983 .
21. Osterman AL , Brooks HB , Rizo J , Phillips MA : Role of Arg-277 in the binding
of pyridoxal 5′-phosphate to Trypanosoma brucei ornithine decarboxylase .
Biochemistry 1997 ; 36 : 4558 – 4567 .
22. Myers DP , Jackson LK , Ipe VG , Murphy GE , Phillips MA : Long-range interactions
in the dimer interface of ornithine decarboxylase are important for enzyme
function . Biochemistry 2001 ; 40 : 13230 – 13236 .
23. Jackson LK , Baldwin J , Akella R , Goldsmith EJ , Phillips MA : Multiple active site
conformations revealed by distant site mutation in ornithine decarboxylase .
Biochemistry 2004 ; 43 : 12990 – 12999 .
24. Terada K , Izui K : Site-directed mutagenesis of the conserved histidine residue
of phosphoenolpyruvate carboxylase. His138 is essential for the second partial
reaction . Eur J Biochem 1991 ; 202 : 797 – 803 .
25. Yano M , Terada K , Umiji K , Izui K : Catalytic role of an arginine residue in the
highly conserved and unique sequence of phosphoenolpyruvate carboxylase . J
Biochem 1995 ; 117 : 1196 – 1200 .
26. Bitonti AJ , Bacchi CJ , McCann PP , Sjoerdsma A : Catalytic irreversible inhibition
of Trypanosoma brucei brucei ornithine decarboxylase by substrate and prod-
uct analogs and their effects on murine trypanosomiasis . Biochem Pharmacol
1985 ; 34 : 1773 – 1777 .
27. Pairoba CF , Colombo SL , Andreo CS : Flavonoids as inhibitors of NADP-malic
enzyme and PEP carboxylase from C4 plants . Biosci Biotechnol Biochem
1996 ; 60 : 779 – 783 .
28. Kapp E , Whiteley C : Protein ligand interactions:isoquinoline alkaloids as inhibi-
tors for lactate and malate dehydrogenase . J Enzym Inhib 1991 ; 4 : 233 – 243 .
Address correspondence to: Dr. R. Kiplin Guy
Department of Chemical Biology and Therapeutics St. Jude Children’s Research Hospital
262 Danny Thomas Place Memphis, TN 38105
E-mail: [email protected]
adt.2009.0249.indd 185 4/19/2010 11:37:51 AM