cell 2012 glycine decarboxylase activity drives nsclc tic and tumorigenesis
TRANSCRIPT
Glycine Decarboxylase Activity DrivesNon-Small Cell Lung CancerTumor-Initiating Cells and TumorigenesisWen Cai Zhang,1,3 Ng Shyh-Chang,1 He Yang,5 Amit Rai,6 Shivshankar Umashankar,6,7 Siming Ma,1 Boon Seng Soh,1
Li Li Sun,1 Bee Choo Tai,11 Min En Nga,9 Kishore Kumar Bhakoo,12 Senthil Raja Jayapal,13 Massimo Nichane,1Qiang Yu,2
Dokeu A. Ahmed,4 Christie Tan,4 Wong Poo Sing,10 John Tam,10 Agasthian Thirugananam,14 Monireh Soroush Noghabi,1
Yin Huei Pang,9 Haw Siang Ang,5 Paul Robson,1 Philipp Kaldis,13 Ross Andrew Soo,5,8 Sanjay Swarup,6,7
Elaine Hsuen Lim,3,8,15,* and Bing Lim1,16,*1Stem Cell and Developmental Biology2Cancer Biology and Pharmacology
Genome Institute of Singapore, 60 Biopolis Street, Singapore 1386723Department of Respiratory Medicine4Department of Thoracic Surgery
Tan Tock Seng Hospital, 11 Jalan Tan Tock Seng, Singapore 3084335Cancer Science Institute of Singapore, National University of Singapore, 28 Medical Drive, Singapore 1174566Metabolites Biology Lab, Department of Biological Sciences, National University of Singapore, 14 Science Drive 4, Singapore 1175437NUS Environmental Research Institute (NERI), T-Lab Building (TL), National University of Singapore, 5A Engineering Drive 1,
Singapore 1174118Department of Haematology-Oncology9Department of Pathology10Department of Thoracic Surgery
National University Hospital, 5 Lower Kent Ridge Road, Singapore 11907411Department of Community, Occupational and Family Medicine, Yong Loo Lin School of Medicine, National University of Singapore,
Singapore 11759712Translational Molecular Imaging Group (TMIG), Laboratory of Molecular Imaging (LMI), Singapore BioImaging Consortium (SBIC),
11 Biopolis Way, Singapore 13866713Cell Division and Cancer Laboratory (PRK), Institute of Molecular and Cell Biology, 61 Biopolis Drive, Singapore 13867314Department of Thoracic Surgery15Department of Medical Oncology
National Cancer Centre, 11 Hospital Drive, Singapore 16961016Beth-Israel Deaconess Medical Center, Harvard Medical School, 330 Brookline Avenue, Boston, MA 02215, USA
*Correspondence: [email protected] (E.H.L.), [email protected] (B.L.)
DOI 10.1016/j.cell.2011.11.050
SUMMARY
Identification of the factors critical to the tumor-initi-
ating cell (TIC) statemay open new avenues in cancer
therapy. Here we show that the metabolic enzyme
glycine decarboxylase (GLDC) is critical for TICs in
non-small cell lung cancer (NSCLC). TICs from pri-
mary NSCLC tumors express high levels of the onco-
genic stem cell factor LIN28B and GLDC, which are
both required for TIC growth and tumorigenesis.
Overexpression of GLDC and other glycine/serine
enzymes, but not catalytically inactive GLDC, pro-
motes cellular transformation and tumorigenesis.
We found that GLDC induces dramatic changes in
glycolysis and glycine/serine metabolism, leading
to changes in pyrimidine metabolism to regulate
cancer cell proliferation. In the clinic, aberrant activa-
tion of GLDC correlates with poorer survival in lung
cancer patients, and aberrant GLDC expression is
observed in multiple cancer types. This link between
glycine metabolism and tumorigenesis may provide
novel targets for advancing anticancer therapy.
INTRODUCTION
Despite numerous advances in our knowledge of cancer (Vogel-
stein and Kinzler, 2004; Hanahan and Weinberg, 2011), our
ability to develop clinically effective therapies based on this
understanding has met with limited success. Current therapies
can control tumor growth initially, but most patients ultimately
relapse. One prominent example is lung cancer, the leading
cause of cancer-related mortality with over 1 million deaths
each year (Jemal et al., 2011). Non-small cell lung cancer
(NSCLC) accounts for approximately 85% of all lung cancers.
Although NSCLC patients with epidermal growth factor receptor
(EGFR) mutations respond to EGFR inhibitors initially, most
patients experience a relapse within 1 year (Sequist et al.,
2007). These findings underscore the urgent need for both com-
bination therapies and also new approaches to treat cancerous
Cell 148, 1–14, January 20, 2012 ª2012 Elsevier Inc. 1
Please cite this article in press as: Zhang et al., Glycine Decarboxylase Activity Drives Non-Small Cell Lung Cancer Tumor-Initiating Cells and
Tumorigenesis, Cell (2012), doi:10.1016/j.cell.2011.11.050
tumors. One such approach may be to target tumor-initiating
cells (TICs).
Data from leukemias, germ cell tumors, and a number of solid
tumors support the notion that cancers are maintained by
a subpopulation of self-renewing and evolving TICs. This is
also popularly known as the cancer stem cell (CSC) model
(Reya et al., 2001; Rosen and Jordan, 2009). Although the validity
of the CSC model is an issue of controversy in melanoma (Quin-
tana et al., 2008, 2010; Boiko et al., 2010; Civenni et al., 2011),
many other solid tumors appear to follow the CSC model (Ishi-
zawa et al., 2010). Recently it was proposed that at earlier stages
of tumorigenesis, rare TIC clones differentiate into nonmalignant
progeny to form the bulk of the tumor, whereas at advanced
stages, TIC clones constitute the bulk of the tumor (Boiko
et al., 2010). Studies with mouse models of lung cancer have
also begun to reconcile the connection between the evolving
genotype of TIC clones and the surface phenotype of TICs (Cur-
tis et al., 2010). Thus accumulated findings suggest that target-
ing TICs may be a promising approach for eradicating tumors
early. However, progress in the targeting of TICs to improve
cancer therapy has been hindered by a lack of understanding
of the molecular pathways that are critical to TICs.
Recent studies have led to an emerging appreciation of the
importance of metabolic reprogramming in cancer (Hsu and
Sabatini, 2008; Vander Heiden et al., 2009; Hanahan and Wein-
berg, 2011). Most recently, the embryonic isoform of pyruvate
kinase PKM2, in collaboration with phosphoglycerate mutase,
was found to regulate the shift from oxidative phosphoryla-
tion to glycolysis in cancer cells (Christofk et al., 2008; Vander
Heiden et al., 2010). These findings have led to a resurgence of
interest in the Warburg effect—the phenomenon whereby
cancer cells, like embryonic cells, preferentially use glycolysis
even under aerobic conditions (Warburg, 1956). Besides glycol-
ysis, an arm of metabolism that results in sarcosine pro-
duction has also been implicated in prostate cancer (Sreekumar
et al., 2009). These data suggest that metabolic reprogram-
ming is crucial for tumorigenesis, and much remains to be
uncovered.
Here we show that glycine metabolism and the metabolic
enzyme glycine decarboxylase (GLDC) drive TICs and tumori-
genesis in NSCLC. Using CD166 as a surface marker and
NOD/SCID Il2rg!/! mice as xenotransplantation recipients,
we isolated lung TICs from a broad range of primary NSCLC
tumors (stages I–III). Primary lung TICs express high levels of
LIN28B, GLDC, and many other glycine/serine metabolism
enzymes. Both LIN28B and GLDC were required for lung TIC
proliferation and tumor growth. Overexpression of GLDC alone,
and other glycine/serine enzymes, promotes cellular transfor-
mation both in vitro and in vivo. Metabolomic analysis shows
that GLDC overexpression induces dramatic changes in glycol-
ysis and glycine metabolism, leading to changes in pyrimidine
metabolism for cancer cell proliferation. In human patients,
aberrant upregulation of GLDC is significantly associated with
higher mortality from lung cancer, and aberrant GLDC ex-
pression is observed in multiple cancer types. Our findings
establish a link between glycine metabolism and tumorigenesis
and may provide novel targets for advancing anticancer
therapy.
RESULTS
TICs in Lung Cancer
To assess the cellular heterogeneity within NSCLC, we obtained
freshly resected lung tumors from 36 human patients with a
broad range of stage I–III primary NSCLC (Table S1 available
online). Patient lung cancer cells were directly transplanted
subcutaneously into NOD/SCID Il2rg!/! mice with Matrigel
(Quintana et al., 2008). Using this maximally sensitive assay,
we estimated by limiting dilution analysis that lung TICs exist
with a low frequency of 1 in 4 3 105 cells in unsorted NSCLC
tumor cells (n = 36 patients; Figure 1A), consistent with published
findings (Ishizawa et al., 2010).
To profile the surface phenotype of this subpopulation of lung
TICs, we fractionated the NSCLC tumors by fluorescence-
activated cell sorting (FACS; Figure S1A). After excluding
hematopoietic and endothelial cells (Lin!), we tested a panel of
cell-surface markers, including CD166, CD44, CD133, and
EpCAM (Figure 1B). We found that CD166 was the most robust
marker for enriching the lung TIC subpopulation, compared to
CD133, CD44, or EpCAM, allowing us to reliably enrich lung
TICs by nearly 100-fold (Figures 1A and 1B). In 12 out of 12
NSCLC patient tumors (lung adenocarcinoma), the CD166+
Lin! fraction contained cells that consistently initiated lung tumor
formation in vivo. In contrast, CD166!Lin! tumor cells generally
failed to initiate lung tumor formation even after 8 months of
observation, although they also expressed carcinoembryonic
antigen (CEA), a tumor-specific marker not expressed in normal
adult lung cells (Figures 1A, 1B, and S1B). Similar results were
observed in lung squamous cell carcinoma and large cell carci-
noma (Figure S1C). Although CD166 expression varied across
the NSCLC tumors we examined, CD166 was consistently
higher in lung tumors than in normal adjacent lung tissues
(n = 25 patients; Figures S1D and S1E).
CD166+ lung TICs demonstrate a capacity for self-renewal
and differentiation in vivo. Serial transplantations showed that
only the CD166+ fraction was able to self-renew and initiate pri-
mary and secondary xenograft tumors (Figures 1A and S1F).
Upon transplantation, CD166+ lung TICs differentiated to form
xenograft tumors that phenocopy the complex cytoarchitec-
ture of their parental patient tumors, sharing similar histolog-
ical morphology by hematoxylin-eosin (H&E) staining and
similar tissue distributions of CD166, cytokeratin, E-cadherin,
vimentin, smooth muscle actin, and synaptophysin (Figures
1C, S1G, and S1H). Furthermore, we found that transplants
with more TICs grow more rapidly, suggesting that lung TIC
frequency is correlated with tumor growth rate (Figures 1D
and S1I).
The self-renewal capacity of CD166+ lung TICs is further
corroborated by in vitro assays. We tested the CD166+ fraction
for the ability to form tumor spheres, a widely used in vitro tech-
nique for assessing self-renewal capacity (Dontu et al., 2003).
Although both primary CD166+ and CD166! cells remained
viable in vitro, only primary CD166+ but not CD166! cells were
able to form compact self-renewing spheres (n = 9 patients;
Figures 1E, 1F, and S1J). Using immunofluorescence and flow
cytometry, we found that the lung tumor spheres retained high
levels of CD166 expression but undetectable CD133 expression
2 Cell 148, 1–14, January 20, 2012 ª2012 Elsevier Inc.
Please cite this article in press as: Zhang et al., Glycine Decarboxylase Activity Drives Non-Small Cell Lung Cancer Tumor-Initiating Cells and
Tumorigenesis, Cell (2012), doi:10.1016/j.cell.2011.11.050
in contrast (Figures S1K and S1L). When primary lung tumor
spheres were dissociated into single cells and transplanted
into NOD/SCID Il2rg!/! mice in vivo, we found that as few as
1–5 single cells consistently initiated tumorigenesis (Figures 1G
and S1M).
The increased tumor-initiating frequency of lung tumor sphere
cells suggests that they are even more highly enriched for lung
TICs than the patient tumor CD166+ fraction, and that lung
TICs expanded during in vitro culture to form tumor spheres.
To test whether CD166 drives tumorigenicity in lung TICs, we
A
CellsNo. cells per
injection
No. tumors
/ No.
injections
LTICs
frequency
(95% CI)
Enrichment
factor (x)P value
150,000 2/4
C
H&
E
Patient tumor Xenograft tumor
Unsorted
1/403,971
(1/255,949 -
1/637,598)
1
200,000 1/10
300,000 4/5
500,000 3/5
1,000,000 9/9
2,000,000 2/2
CD166+Lin-
1/5,175
(1/2,837 -
1/9,441)
78 1.37E-23
1,000 2/8
5,000 2/3
10,000 7/9
23,000 2/2
25,000 4/4
CD
16
6Population
No. tumors/
No. injections
CD166+ 12/12
B
25,000 4/4
50,000 1/1
CD166-Lin-
1/3,297,091
(1/460,464 -
1/23,608,384)
0.1 4.82E-03210,000 0/1
260,000 1/3
500,000 0/3
400
(mm
3)
CD166+Lin- (1st xenograft; 5,000)
CD166+Lin- (patient; 5,000)
Lin- (patient; 150,000)
i ( i )
Dp
an
-CK
CD166- 0/10
CD44+ 6/8
CD44- 6/8
CD133+ 6/11
CD133- 7/13
EpCAM+ 10/13
EpCAM- 8/14 0
100
200
300
14 15 16 17 18 19 20 21
Tu
mo
r v
olu
me
(
Weeks
CD166-Lin- (patient; 100,000)
AdC
F G
0
30
60
90
120
No
. o
f sp
her
es /
10
,00
0 c
ells
AdC SCC LCC
E
D1
66
- Lin
-
SCCAdC LCC
CD
16
6+L
in-
No.
Cells
No. tumors/ No. injections
1st passage 10th passage
2500 12/12 N.D.
500 18/18 18/18
50 24/24 24/24
10 12/12 12/12
5 16/18 17/18
1 5/18 5/18
GTumor sphere assay
CD
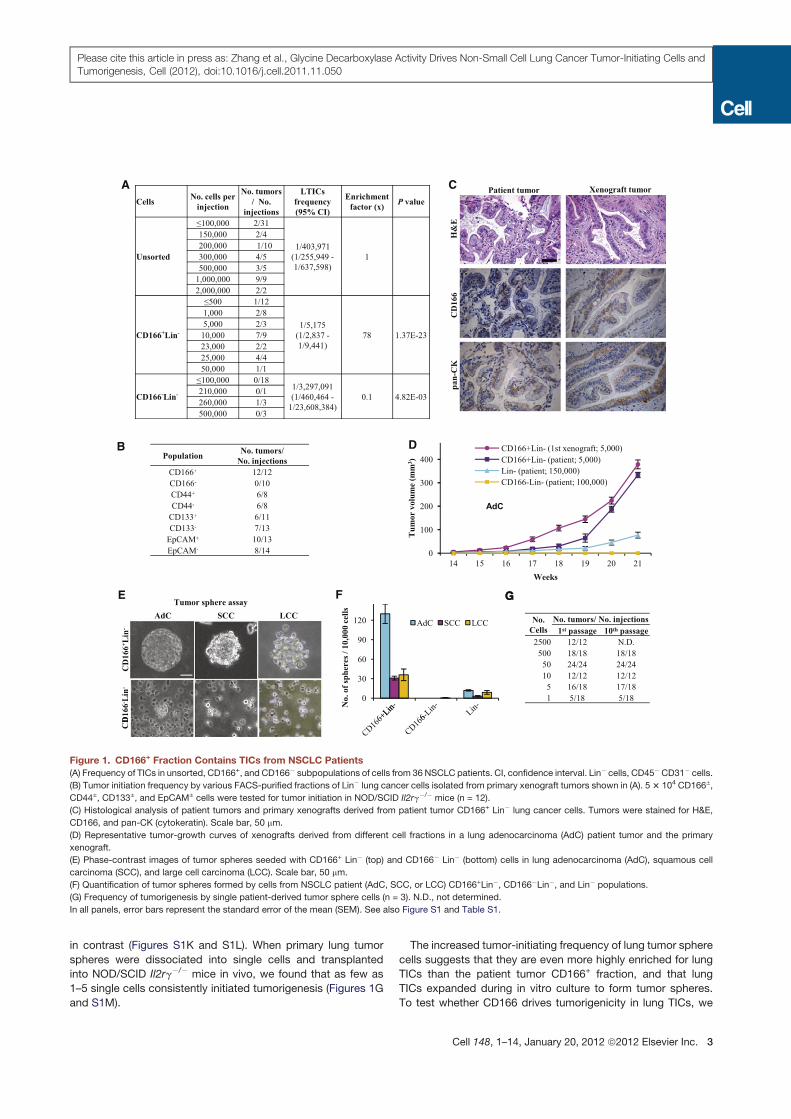
Figure 1. CD166+ Fraction Contains TICs from NSCLC Patients
(A) Frequency of TICs in unsorted, CD166+, and CD166! subpopulations of cells from 36 NSCLC patients. CI, confidence interval. Lin! cells, CD45!CD31! cells.
(B) Tumor initiation frequency by various FACS-purified fractions of Lin! lung cancer cells isolated from primary xenograft tumors shown in (A). 53 104 CD166±,
CD44±, CD133±, and EpCAM± cells were tested for tumor initiation in NOD/SCID Il2rg!/! mice (n = 12).
(C) Histological analysis of patient tumors and primary xenografts derived from patient tumor CD166+ Lin! lung cancer cells. Tumors were stained for H&E,
CD166, and pan-CK (cytokeratin). Scale bar, 50 mm.
(D) Representative tumor-growth curves of xenografts derived from different cell fractions in a lung adenocarcinoma (AdC) patient tumor and the primary
xenograft.
(E) Phase-contrast images of tumor spheres seeded with CD166+ Lin! (top) and CD166! Lin! (bottom) cells in lung adenocarcinoma (AdC), squamous cell
carcinoma (SCC), and large cell carcinoma (LCC). Scale bar, 50 mm.
(F) Quantification of tumor spheres formed by cells from NSCLC patient (AdC, SCC, or LCC) CD166+Lin!, CD166!Lin!, and Lin! populations.
(G) Frequency of tumorigenesis by single patient-derived tumor sphere cells (n = 3). N.D., not determined.
In all panels, error bars represent the standard error of the mean (SEM). See also Figure S1 and Table S1.
Cell 148, 1–14, January 20, 2012 ª2012 Elsevier Inc. 3
Please cite this article in press as: Zhang et al., Glycine Decarboxylase Activity Drives Non-Small Cell Lung Cancer Tumor-Initiating Cells and
Tumorigenesis, Cell (2012), doi:10.1016/j.cell.2011.11.050
knocked down CD166 in two lines of NSCLC patient-derived
tumor spheres by retroviral shRNA (Figure S1N). We found that
the tumorigenicity of lung TICs in the tumor spheres was not
significantly affected by CD166 shRNA, demonstrating that
CD166 is an inert cell-surface marker that enriches for lung
TICs (Figures S1O–S1Q).
Lung TICs Express High levels of Glycine/Serine
Metabolism Enzymes
To gain a deeper understanding of the molecular basis for the
TIC state and its tumorigenic capacity, we sought to obtain
a molecular signature for lung TICs. To do this, we performed
genome-wide transcriptome analysis on CD166! Lin! tumor
cells, CD166+ Lin! tumor cells, and lung tumor spheres, in
increasing order of lung TIC frequency (Figure 2A). As a negative
control, we also profiled CD166+ versus CD166! cells from
normal adjacent lung tissues (n = 3 patients; Table S1). This
led us to a profile of genes that are upregulated and down-
regulated in lung TICs, compared to non-TICs (Figure 2B).
Lung TIC-associated genes include the oncogenic stem cell
factor LIN28B, embryonic lung transcription factors like PEA3
and the trachealess homolog NPAS1 (Viswanathan et al., 2009;
4
o
4
BA
Enrichment
S/X-
X+/X-
P+/P-
N+/N-
Lo
g2
rati
o
0
-4N+/X- P+/X- S/X-X+/X-
Lo
g2
rati
0
-4N+/X- P+/X- S/X-X+/X_
c e
X+ S
Candidate
genes
S: sphere; X, xenograft tumor; P, primary tumor;
N, normal tissue; +, CD166+; -, CD166-.
0
1
2
3
4
on
lev
el (
log
2ra
tio
)
S/X+ X+/X-
P+/P- N+/N-H
SP
A1
A
IGL
L1
RE
NB
P
PP
P1
R1
5A
RA
SD
1
MM
P9
RR
AD
CX
CL
2
GA
DD
45G
TN
FA
IP3
C D
0% 2% 4% 6% 8% 10%
Cell cycle
DNA replication
G i i i
Percentage of genes in pathway
-5
-4
-3
-2
-1
0
Rel
ati
ve
mR
NA
ex
pre
ssio
GL
DC
NP
AS
1
LIN
28
B
RG
9M
TD
2
CC
NB
1
TM
EM
11
8
SM
C6
PE
A3
RE
EP
1
FO
XK
2
Glycine, serine and threonine
metabolism
Pyrimidine metabolism
MAPK signaling pathway
p53 signaling pathwayExperimental
Predicted
E
PSPHGlycine CO2 + NH3 + CH2Phosphoserine Serine
GLDC
L-2-Amino-acetoacetate
GCAT
SHMT13P-Hydroxy pyruvate
PSAT1
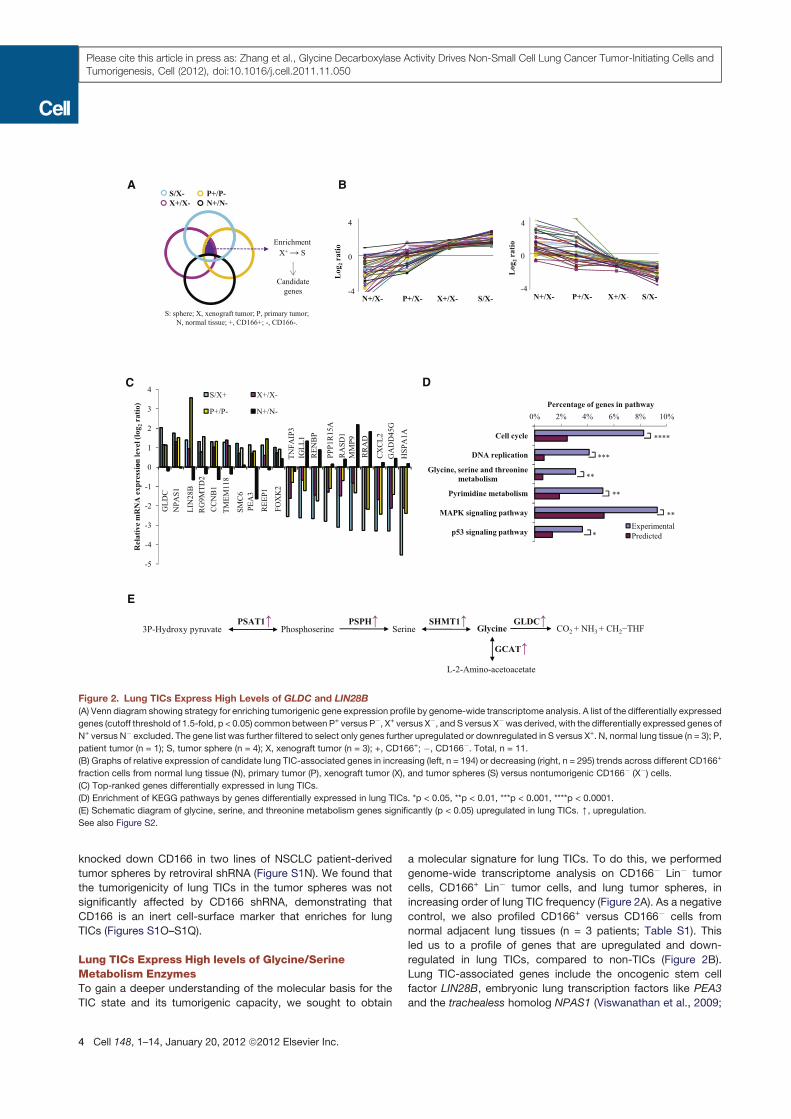
Figure 2. Lung TICs Express High Levels of GLDC and LIN28B
(A) Venn diagram showing strategy for enriching tumorigenic gene expression profile by genome-wide transcriptome analysis. A list of the differentially expressed
genes (cutoff threshold of 1.5-fold, p < 0.05) commonbetween P+ versus P!, X+ versus X!, and S versus X!was derived, with the differentially expressed genes of
N+ versus N! excluded. The gene list was further filtered to select only genes further upregulated or downregulated in S versus X+. N, normal lung tissue (n = 3); P,
patient tumor (n = 1); S, tumor sphere (n = 4); X, xenograft tumor (n = 3); +, CD166+; !, CD166!. Total, n = 11.
(B) Graphs of relative expression of candidate lung TIC-associated genes in increasing (left, n = 194) or decreasing (right, n = 295) trends across different CD166+
fraction cells from normal lung tissue (N), primary tumor (P), xenograft tumor (X), and tumor spheres (S) versus nontumorigenic CD166! (X!) cells.
(C) Top-ranked genes differentially expressed in lung TICs.
(D) Enrichment of KEGG pathways by genes differentially expressed in lung TICs. *p < 0.05, **p < 0.01, ***p < 0.001, ****p < 0.0001.
(E) Schematic diagram of glycine, serine, and threonine metabolism genes significantly (p < 0.05) upregulated in lung TICs. [, upregulation.
See also Figure S2.
4 Cell 148, 1–14, January 20, 2012 ª2012 Elsevier Inc.
Please cite this article in press as: Zhang et al., Glycine Decarboxylase Activity Drives Non-Small Cell Lung Cancer Tumor-Initiating Cells and
Tumorigenesis, Cell (2012), doi:10.1016/j.cell.2011.11.050
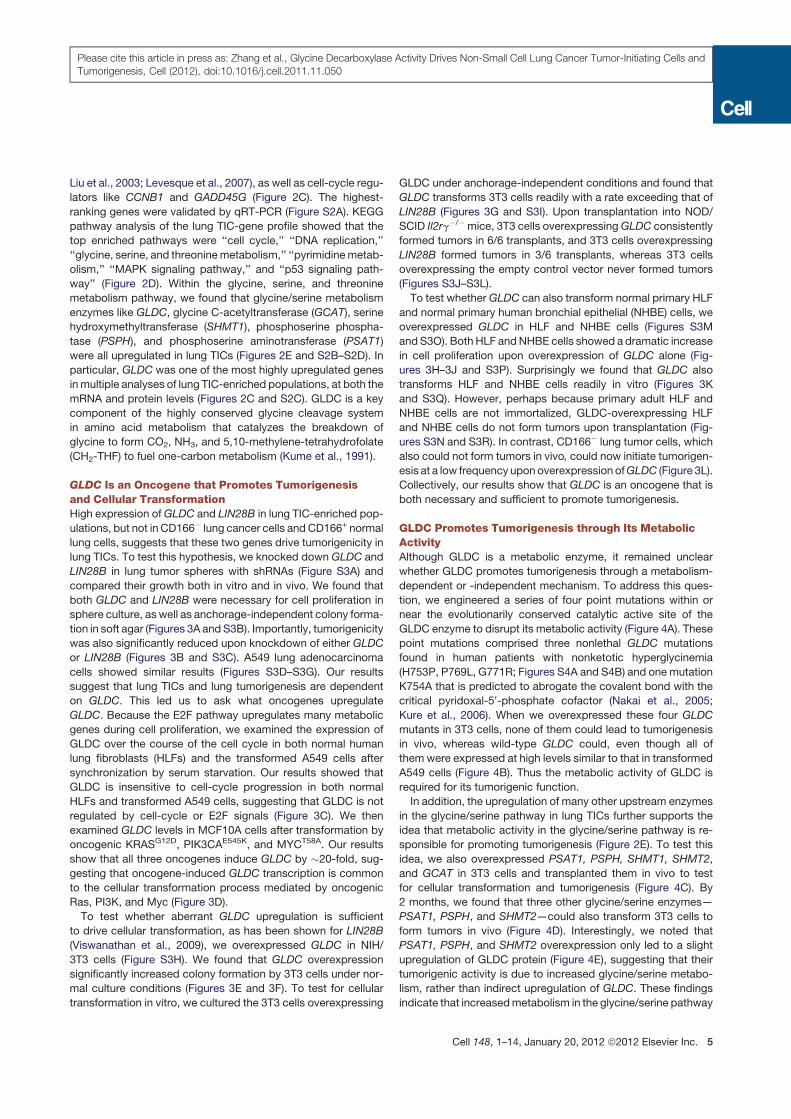
Liu et al., 2003; Levesque et al., 2007), as well as cell-cycle regu-
lators like CCNB1 and GADD45G (Figure 2C). The highest-
ranking genes were validated by qRT-PCR (Figure S2A). KEGG
pathway analysis of the lung TIC-gene profile showed that the
top enriched pathways were ‘‘cell cycle,’’ ‘‘DNA replication,’’
‘‘glycine, serine, and threoninemetabolism,’’ ‘‘pyrimidinemetab-
olism,’’ ‘‘MAPK signaling pathway,’’ and ‘‘p53 signaling path-
way’’ (Figure 2D). Within the glycine, serine, and threonine
metabolism pathway, we found that glycine/serine metabolism
enzymes like GLDC, glycine C-acetyltransferase (GCAT), serine
hydroxymethyltransferase (SHMT1), phosphoserine phospha-
tase (PSPH), and phosphoserine aminotransferase (PSAT1)
were all upregulated in lung TICs (Figures 2E and S2B–S2D). In
particular, GLDC was one of the most highly upregulated genes
inmultiple analyses of lung TIC-enriched populations, at both the
mRNA and protein levels (Figures 2C and S2C). GLDC is a key
component of the highly conserved glycine cleavage system
in amino acid metabolism that catalyzes the breakdown of
glycine to form CO2, NH3, and 5,10-methylene-tetrahydrofolate
(CH2-THF) to fuel one-carbon metabolism (Kume et al., 1991).
GLDC Is an Oncogene that Promotes Tumorigenesis
and Cellular Transformation
High expression of GLDC and LIN28B in lung TIC-enriched pop-
ulations, but not in CD166! lung cancer cells and CD166+ normal
lung cells, suggests that these two genes drive tumorigenicity in
lung TICs. To test this hypothesis, we knocked down GLDC and
LIN28B in lung tumor spheres with shRNAs (Figure S3A) and
compared their growth both in vitro and in vivo. We found that
both GLDC and LIN28B were necessary for cell proliferation in
sphere culture, as well as anchorage-independent colony forma-
tion in soft agar (Figures 3A andS3B). Importantly, tumorigenicity
was also significantly reduced upon knockdown of either GLDC
or LIN28B (Figures 3B and S3C). A549 lung adenocarcinoma
cells showed similar results (Figures S3D–S3G). Our results
suggest that lung TICs and lung tumorigenesis are dependent
on GLDC. This led us to ask what oncogenes upregulate
GLDC. Because the E2F pathway upregulates many metabolic
genes during cell proliferation, we examined the expression of
GLDC over the course of the cell cycle in both normal human
lung fibroblasts (HLFs) and the transformed A549 cells after
synchronization by serum starvation. Our results showed that
GLDC is insensitive to cell-cycle progression in both normal
HLFs and transformed A549 cells, suggesting that GLDC is not
regulated by cell-cycle or E2F signals (Figure 3C). We then
examined GLDC levels in MCF10A cells after transformation by
oncogenic KRASG12D, PIK3CAE545K, and MYCT58A. Our results
show that all three oncogenes induce GLDC by "20-fold, sug-
gesting that oncogene-induced GLDC transcription is common
to the cellular transformation process mediated by oncogenic
Ras, PI3K, and Myc (Figure 3D).
To test whether aberrant GLDC upregulation is sufficient
to drive cellular transformation, as has been shown for LIN28B
(Viswanathan et al., 2009), we overexpressed GLDC in NIH/
3T3 cells (Figure S3H). We found that GLDC overexpression
significantly increased colony formation by 3T3 cells under nor-
mal culture conditions (Figures 3E and 3F). To test for cellular
transformation in vitro, we cultured the 3T3 cells overexpressing
GLDC under anchorage-independent conditions and found that
GLDC transforms 3T3 cells readily with a rate exceeding that of
LIN28B (Figures 3G and S3I). Upon transplantation into NOD/
SCID Il2rg!/! mice, 3T3 cells overexpressingGLDC consistently
formed tumors in 6/6 transplants, and 3T3 cells overexpressing
LIN28B formed tumors in 3/6 transplants, whereas 3T3 cells
overexpressing the empty control vector never formed tumors
(Figures S3J–S3L).
To test whether GLDC can also transform normal primary HLF
and normal primary human bronchial epithelial (NHBE) cells, we
overexpressed GLDC in HLF and NHBE cells (Figures S3M
and S3O). Both HLF andNHBE cells showed a dramatic increase
in cell proliferation upon overexpression of GLDC alone (Fig-
ures 3H–3J and S3P). Surprisingly we found that GLDC also
transforms HLF and NHBE cells readily in vitro (Figures 3K
and S3Q). However, perhaps because primary adult HLF and
NHBE cells are not immortalized, GLDC-overexpressing HLF
and NHBE cells do not form tumors upon transplantation (Fig-
ures S3N and S3R). In contrast, CD166! lung tumor cells, which
also could not form tumors in vivo, could now initiate tumorigen-
esis at a low frequency upon overexpression ofGLDC (Figure 3L).
Collectively, our results show that GLDC is an oncogene that is
both necessary and sufficient to promote tumorigenesis.
GLDC Promotes Tumorigenesis through Its Metabolic
Activity
Although GLDC is a metabolic enzyme, it remained unclear
whether GLDC promotes tumorigenesis through a metabolism-
dependent or -independent mechanism. To address this ques-
tion, we engineered a series of four point mutations within or
near the evolutionarily conserved catalytic active site of the
GLDC enzyme to disrupt its metabolic activity (Figure 4A). These
point mutations comprised three nonlethal GLDC mutations
found in human patients with nonketotic hyperglycinemia
(H753P, P769L, G771R; Figures S4A and S4B) and onemutation
K754A that is predicted to abrogate the covalent bond with the
critical pyridoxal-50-phosphate cofactor (Nakai et al., 2005;
Kure et al., 2006). When we overexpressed these four GLDC
mutants in 3T3 cells, none of them could lead to tumorigenesis
in vivo, whereas wild-type GLDC could, even though all of
them were expressed at high levels similar to that in transformed
A549 cells (Figure 4B). Thus the metabolic activity of GLDC is
required for its tumorigenic function.
In addition, the upregulation of many other upstream enzymes
in the glycine/serine pathway in lung TICs further supports the
idea that metabolic activity in the glycine/serine pathway is re-
sponsible for promoting tumorigenesis (Figure 2E). To test this
idea, we also overexpressed PSAT1, PSPH, SHMT1, SHMT2,
and GCAT in 3T3 cells and transplanted them in vivo to test
for cellular transformation and tumorigenesis (Figure 4C). By
2 months, we found that three other glycine/serine enzymes—
PSAT1, PSPH, and SHMT2—could also transform 3T3 cells to
form tumors in vivo (Figure 4D). Interestingly, we noted that
PSAT1, PSPH, and SHMT2 overexpression only led to a slight
upregulation of GLDC protein (Figure 4E), suggesting that their
tumorigenic activity is due to increased glycine/serine metabo-
lism, rather than indirect upregulation of GLDC. These findings
indicate that increasedmetabolism in the glycine/serine pathway
Cell 148, 1–14, January 20, 2012 ª2012 Elsevier Inc. 5
Please cite this article in press as: Zhang et al., Glycine Decarboxylase Activity Drives Non-Small Cell Lung Cancer Tumor-Initiating Cells and
Tumorigenesis, Cell (2012), doi:10.1016/j.cell.2011.11.050
Tumor spheres
120,000 TS-Ctrl-sh
A B C
h h h 6 h
HLF
Time after release in serum
h 4 h
8 h
yc h 4 h
8 h
A549
Time after release in serum
h0.8
1
r s(g
)
Ctrl-sh
GD-sh
28B h
0
20,000
40,000
60,000
80,000
100,000
0 2 4
Nu
mb
er o
f ce
lls
TS-28B-sh
TS-GD-sh
1
2 4
16
FOS
CDK1
GLDC
0
24
48
cy
HSP90
CDK1
HSP90
GLDC
8 24
48
4
0
0.2
0.4
0.6
0.8
Ma
ss o
f x
eno
gra
ft t
um
ou
r 28B-sh
*
**
F
100
125
nie
s /
3T33T3-GD3T3-28B
E3
T3
3T3
D
MCF10A
20
30
exp
ress
ion
Days
G
60
70
80
5,0
00
3T3
3T3-GD
3T3-28B
0
25
50
75
No
. o
f a
dh
eren
t co
lon
50
0 3
T3
** **3T
3-G
D3
T3
-28
B
0
10
Rel
ati
ve
GL
DC
e
0
10
20
30
40
50
60
No
. o
f a
ga
r co
lon
ies
/ 5
3T
3
** **
60,000
80,000
100,000
er o
f ce
lls
HLF-GD
HLF-28B
HLF
H
25
30
35
nie
s /
5,0
00
HLF
HLF-GD
HLF-28B
** **
KJ
100
120
140
colo
nie
s /
LF
HLF
HLF-GD
HLF-28B
** **
HLF
HL
FH
L
I
0
20,000
40,000
0 3 6
Nu
mb
e
Days 0
5
10
15
20
No
. o
f a
ga
r co
lon
HL
F
0
20
40
60
80
No. of
ad
her
ent
1,0
00
HL
Xenograft
LF
-GD
HL
F-2
8B
GroupNo. cells /
injection
No. tumors/
No. injections
CD166-
200,000 0/12
100,000 0/12
CD166- GD200,000 4/12
100,000 1/12
L
g
,
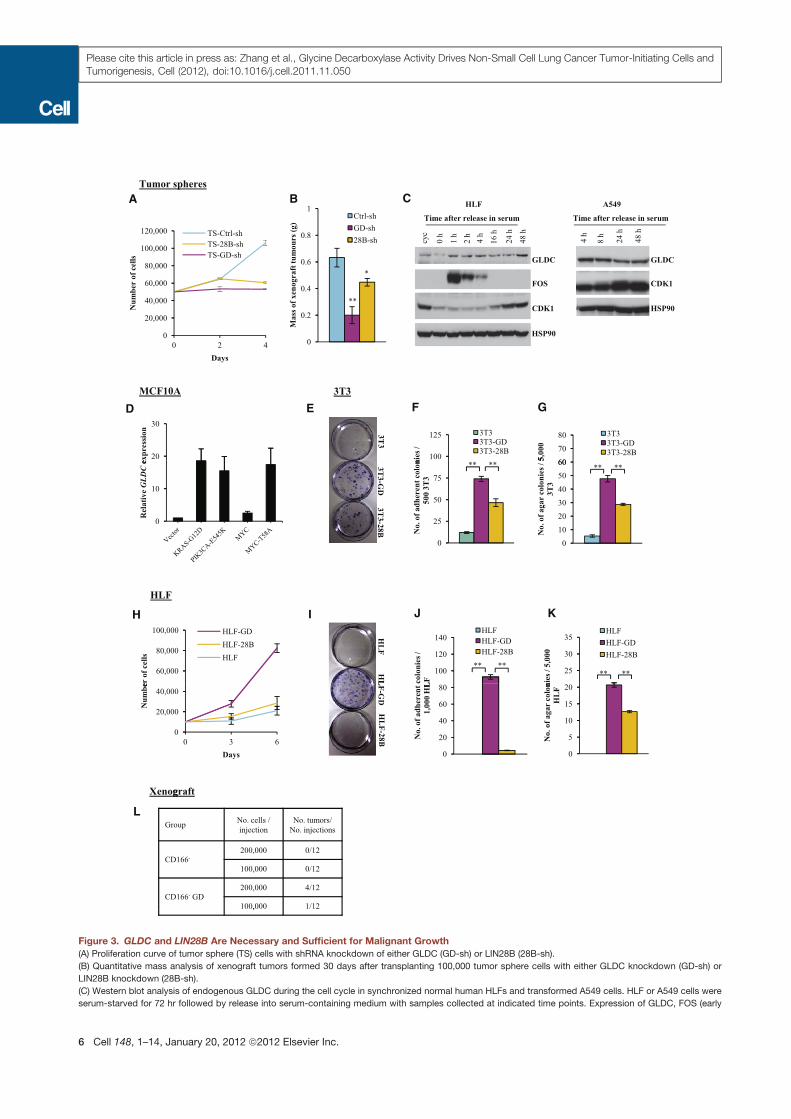
Figure 3. GLDC and LIN28B Are Necessary and Sufficient for Malignant Growth
(A) Proliferation curve of tumor sphere (TS) cells with shRNA knockdown of either GLDC (GD-sh) or LIN28B (28B-sh).
(B) Quantitative mass analysis of xenograft tumors formed 30 days after transplanting 100,000 tumor sphere cells with either GLDC knockdown (GD-sh) or
LIN28B knockdown (28B-sh).
(C) Western blot analysis of endogenous GLDC during the cell cycle in synchronized normal human HLFs and transformed A549 cells. HLF or A549 cells were
serum-starved for 72 hr followed by release into serum-containing medium with samples collected at indicated time points. Expression of GLDC, FOS (early
6 Cell 148, 1–14, January 20, 2012 ª2012 Elsevier Inc.
Please cite this article in press as: Zhang et al., Glycine Decarboxylase Activity Drives Non-Small Cell Lung Cancer Tumor-Initiating Cells and
Tumorigenesis, Cell (2012), doi:10.1016/j.cell.2011.11.050
due to GLDC or other glycine/serine enzymes can exert a potent
tumorigenic effect.
GLDC Regulates Glycine Metabolism, with Effects on
Glycolysis and Pyrimidines
Given that GLDC promotes tumorigenesis through a metabo-
lism-dependent mechanism, we performed metabolomic anal-
ysis to gain deeper mechanistic insights into the GLDC-driven
metabolism changes that lead to tumorigenesis. We used liquid
chromatography-mass spectrometry (LC-MS) to perform me-
tabolomics profiling of HLF cells and 3T3 cells overexpressing
GLDC, as well as A549 lung adenocarcinoma cells with retroviral
knockdown of GLDC, relative to empty vector controls. We
found that glycine-related metabolites, glycolysis intermediates,
serum response), and CDK1 (E2F target) were tested. Normal growing, unsynchronized cells (Cyc) were used as a control. HSP90 was used as a loading control.
CDK1, cyclin-dependent kinase 1; HSP90, heat shock protein 90.
(D) Expression of endogenous GLDC in MCF10A cells transformed by oncogenic KRASG12D, PIK3CAE545K, MYC, or MYCT58A, by qRT-PCR.
(E) Colony formation assay in adherent conditions by seeding 500 3T3 cells overexpressing either GLDC (3T3-GD) or LIN28B (3T3-28B).
(F) Quantitative analysis of colony formation efficiency under adherent conditions as shown in (E).
(G) Quantitative analysis of soft agar colony formation by 5,000 3T3 cells overexpressing either GLDC (3T3-GD) or LIN28B (3T3-28B). Colonies were stained with
INT on day 28.
(H) Proliferation curve of HLF cells overexpressing GLDC (HLF-GD), LIN28B (HLF-28B), or the empty vector (HLF).
(I) Colony formation assay in adherent conditions seeding 1,000 HLF cells overexpressing GLDC (HLF-GD), LIN28B (HLF-28B), or the empty vector (HLF).
(J) Quantitative analysis of colony formation efficiency under adherent conditions as shown in (I).
(K) Quantitative analysis of soft agar colony formation by 5,000 HLF cells overexpressing either GLDC (HLF-GD), LIN28B (HLF-28B), or the empty vector (HLF).
(L) Tumor formation by CD166! lung tumor cells 3 months after overexpression of GLDC. CD166! tumor cells from xenografts were sorted by FACS and infected
with retrovirus expressing either the empty vector (CD166!) or GLDC (CD166! GD), followed by transplantation into mice 24 hr after infection (n = 12 for each
group).
In all panels, error bars represent SEM. *p < 0.05, **p < 0.01. See also Figure S3.
BA
WT
H7
53
P
K7
54
A
P7
69
L
G7
71
R
Vec
tor
A5
49
GLDC
8/
8
0/
8
0/
8
0/
8
0/
8
0/
8
8/
8
GLDC
No. tumors/
No. injections
D E
GroupNo. tumors/
No. injections
3T3-GLDC 6/6
3T3-PSAT1 3/6
3T3-PSPH 2/6
3T3-SHMT2 1/6
3T3-SHMT1 0/6
3T3-GCAT 0/6
3T3 0/6
1
10
100
1,000
10,000
100,000
Rel
ati
ve
RN
A e
xp
ress
ion
lev
el
C
-Actin
GLDC
GLDC-GFP
R
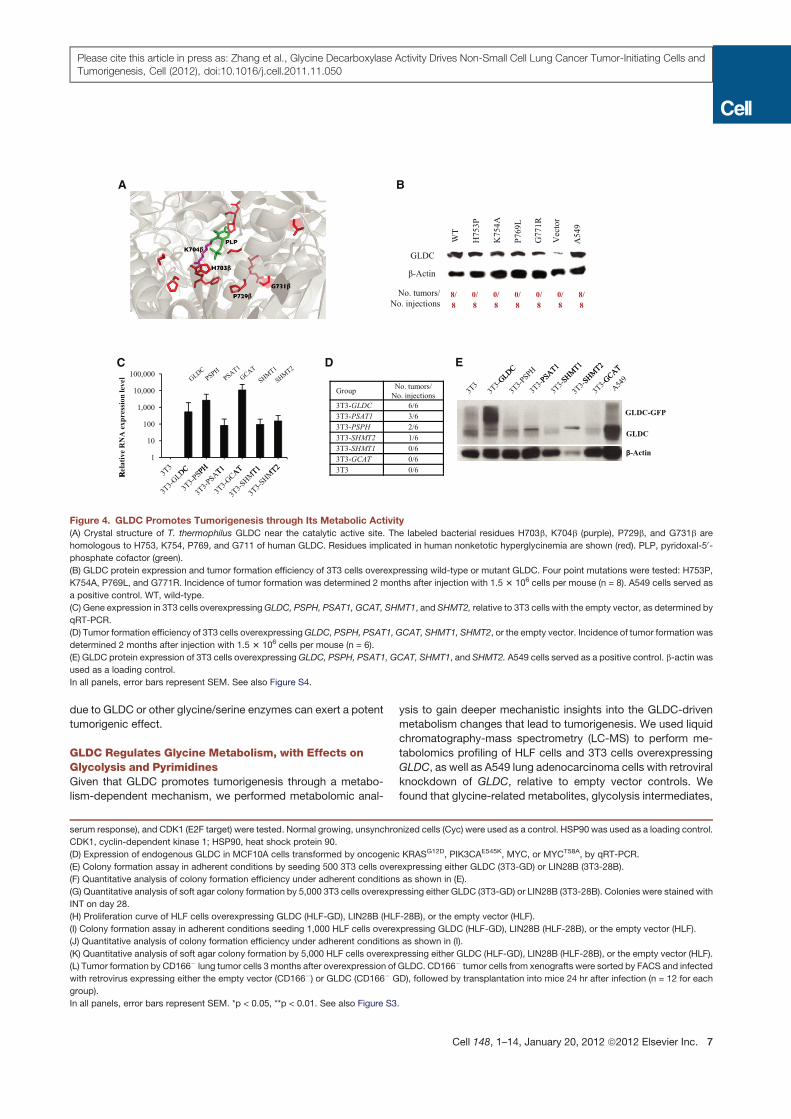
Figure 4. GLDC Promotes Tumorigenesis through Its Metabolic Activity
(A) Crystal structure of T. thermophilus GLDC near the catalytic active site. The labeled bacterial residues H703b, K704b (purple), P729b, and G731b are
homologous to H753, K754, P769, and G711 of human GLDC. Residues implicated in human nonketotic hyperglycinemia are shown (red). PLP, pyridoxal-50-
phosphate cofactor (green).
(B) GLDC protein expression and tumor formation efficiency of 3T3 cells overexpressing wild-type or mutant GLDC. Four point mutations were tested: H753P,
K754A, P769L, and G771R. Incidence of tumor formation was determined 2 months after injection with 1.5 3 106 cells per mouse (n = 8). A549 cells served as
a positive control. WT, wild-type.
(C) Gene expression in 3T3 cells overexpressingGLDC, PSPH, PSAT1, GCAT, SHMT1, and SHMT2, relative to 3T3 cells with the empty vector, as determined by
qRT-PCR.
(D) Tumor formation efficiency of 3T3 cells overexpressingGLDC, PSPH, PSAT1, GCAT, SHMT1, SHMT2, or the empty vector. Incidence of tumor formation was
determined 2 months after injection with 1.5 3 106 cells per mouse (n = 6).
(E) GLDC protein expression of 3T3 cells overexpressingGLDC, PSPH, PSAT1, GCAT, SHMT1, and SHMT2. A549 cells served as a positive control. b-actin was
used as a loading control.
In all panels, error bars represent SEM. See also Figure S4.
Cell 148, 1–14, January 20, 2012 ª2012 Elsevier Inc. 7
Please cite this article in press as: Zhang et al., Glycine Decarboxylase Activity Drives Non-Small Cell Lung Cancer Tumor-Initiating Cells and
Tumorigenesis, Cell (2012), doi:10.1016/j.cell.2011.11.050
and many pyrimidines were significantly perturbed by both
GLDC overexpression and knockdown (p < 0.05; Figures
5A–5D). For glycine-relatedmetabolites, we found that sarcosine
(N-methylglycine) levels increased significantly upon GLDC
overexpression and dropped significantly upon GLDC knock-
down, indicating that GLDC promotes sarcosine synthesis or
accumulation (Figure 5A). Consistent with this observation,
betaine aldehyde in the betaine-sarcosine-glycine pathway for
glycine synthesis also showed the same pattern of changes (Fig-
ure 5A). Glycine levels decrease with GLDC overexpression and
increase with GLDC knockdown, in agreement with the fact that
GLDC breaks down glycine irreversibly. In contrast, serine levels
increase with GLDC overexpression and decrease with GLDC
knockdown, suggesting that GLDC promotes serine synthesis
or uptake (Figure 5A).
Surprisingly, GLDC perturbation also led to dramatic changes
in glycolysis and other amino acids (Figures 5B, 5C, and S5A).
Our data suggest that GLDC promotes glycolysis, leading
to the increased synthesis or accumulation of glucose-1-
phosphate, phosphoenolpyruvate, pyruvate, and lactate (Fig-
ures 5B and 5C). In fact many of the upstream glycine/serine
metabolism enzymes that we found upregulated in lung TICs,
such as PSAT1, PSPH, and SHMT1/2, channel glycolytic inter-
mediates into de novo serine and glycine biosynthesis (Fig-
ure 2E), suggesting that GLDC is working in a concerted fashion
with these enzymes to promote the glycolysis-serine-glycine
flux. This is supported by our finding that GLDC does not signif-
icantly promote glycine uptake (Figures S5B and S5C) but
promotes glycolysis instead (Figures 5B and 5C).
Finally, our metabolomics analysis also revealed that GLDC
promotes the synthesis or accumulation of pyrimidines, in-
cluding thymidine, deoxyuridine, thymine, uracil, and cytosine
(Figure 5D). The GLDC-catalyzed reaction converts glycine into
CH2-THF (Kume et al., 1991). CH2-THF contains the methylene
group that fuels de novo thymidine synthesis from deoxyuridine
in concert with pyrimidine biosynthesis and hence nucleotide
synthesis during cell proliferation (Tibbetts and Appling, 2010).
Recent studies suggest that early oncogenesis involves aberrant
activation of cell proliferation, which then leads to a crisis of
nucleotide deficiency and replication stress (Bester et al., 2011).
Our observations on pyrimidine synthesis suggest that upregula-
tion of GLDC could promote cellular transformation by over-
coming this deficiency to progress onward in early oncogenesis.
To test whether any of the metabolite changes induced by
GLDC can mimic GLDC’s effects on cancer cells, we analyzed
whether an increased exogenous supply of specific metabolites
could rescue GLDC retroviral knockdown in A549 cells. We
found that 10 mM of sarcosine could significantly rescue the
proliferation defect upon GLDC knockdown, with little effect on
control A549 cells (Figure 5F), indicating that increased sarco-
sine-glycine metabolite flux can rescue the effects of reduced
GLDC enzyme. To further test whether the production of
CH2-THF is necessary for GLDC’s effects on proliferation, we
tested whether the antifolate drug methotrexate could specifi-
cally abrogate GLDC-induced proliferation by reducing the tetra-
hydrofolate (THF) cofactor needed to produce CH2-THF for
pyrimidine synthesis. Our results show that low doses of metho-
trexate specifically abrogated GLDC-induced proliferation in 3T3
and HLF cells, with little effect on control 3T3 and HLF cells
(Figure 5E). Furthermore, methotrexate in combination with
GLDC shRNA killed transformed A549 cells much more effec-
tively than either alone (Figure 5E), suggesting that a combination
of antifolates with a GLDC inhibitor could completely shut off
glycine catabolism to treat cancer cells more effectively. Using
these metabolic data, we constructed a model of how aberrant
GLDC expression might reprogram glycolysis and glycine
metabolism fluxes in cancer cells to promote cancer cell prolifer-
ation and tumorigenesis (Figure 5G).
Prognostic Significance of Aberrant GLDC Expression
in NSCLC Patients
To assess whether our experimental findings on GLDC are rele-
vant to human lung cancer patients in the clinic, we used tissue
microarray immunohistochemistry to examine the prognostic
significance of GLDC expression, tumor size, tumor grade, and
cancer stage in clinical tumor samples from cohorts of NSCLC
patients (n = 143) (Figures 6A and S6; Table S2). Subdistribution
hazard ratio (SHR) analysis showed that patients with high or
grade 3+ GLDC expression have a 3-fold higher risk of lung
cancer mortality compared to patients with low or grade 0
GLDC expression, even when adjusted for cancer stage (SHR =
3.01, 95% confidence interval [CI]: 1.48–6.10, p = 0.002) (Fig-
ure 6B). Cumulative mortality analysis also showed that high
GLDC expression (grade 3+) is significantly associated with
higher cumulative incidence of mortality across 143 NSCLC
lung cancer patients, even when adjusted for cancer stage
(p = 0.005) (Figure 6C). CD166 expression was not significantly
associated with higher mortality in lung cancer patients—which
was not unexpected given that only 1 in 5 3 103 CD166+ cells
are tumorigenic (Figures S6A–S6C). Indeed, coimmunostaining
of lung tumors revealed that GLDC+ cells mostly form a subset
of CD166+ cells, and that not all CD166+ cells are GLDC+ (Figures
6D and S6D). LIN28B immunohistochemistry was also not signif-
icantly correlated with lung cancer patient mortality (Figures
S6A–S6C), although western blots revealed that lung TICs
express a second LIN28B isoform that is indiscernible from
immunohistochemistry staining, thus renderingour LIN28Bstain-
ing results inconclusive (Figure S6E). Our immunohistochemistry
results on clinical tumor samples are consistent with the idea that
lung TICs constitute the bulk of the tumors in late stages of
malignancy and demonstrate that aberrant activation of GLDC
is significantly associated with human mortality in NSCLC
patients—further supporting its role as a metabolic oncogene in
human NSCLC.
Aberrant GLDC Expression in Other Cancers
To check whether aberrant GLDC expression is specific to
NSCLC, we examined a variety of other cancers. Surprisingly
GLDC is also aberrantly upregulated in subsets of primary
tumors from other cancers, especially ovarian and germ cell
tumors (Figure 7A; Table S3). Further analysis of 606 human
cancer cell lines showed that 158 (26.1%) cancer cell lines over-
express GLDC, including lines from ovarian, germ cell, cervical,
lung, lymphoma, prostate, bladder, and colon cancer (Figure 7B;
Table S4). To test whether GLDC is also required for growth by
one of these GLDC-overexpressing cell lines, we knocked
8 Cell 148, 1–14, January 20, 2012 ª2012 Elsevier Inc.
Please cite this article in press as: Zhang et al., Glycine Decarboxylase Activity Drives Non-Small Cell Lung Cancer Tumor-Initiating Cells and
Tumorigenesis, Cell (2012), doi:10.1016/j.cell.2011.11.050
A B
Glycine-related metabolites
1 S i
Glycolysis
1 Glucose 1 phosphate2 00
4.00
le)
Cells
2.00
4.00 Cells
1 Sarcosine
2 Betaine aldehyde
3 Serine
4 Glycine
1 Glucose 1-phosphate
2 Phosphoenolpyruvate
3 Pyruvate
0.25
0.50
1.00
2.00
1 2 3
Fo
ld c
ha
ng
e (L
og
2sc
al
3T3-GD/Ctrl
HLF-GD/Ctrl
A549-GD-sh/Ctrl
0 02
0.03
0.06
0.13
0.25
0.50
1.00
1 2 3 4
Fo
ld c
ha
ng
e (L
og
2sc
ale
)
3T3-GD/Ctrl
HLF-GD/Ctrl
A549-GD-sh/Ctrl
1 00
2.00
4.00
e (L
og
2sc
ale
)
1.5
2.0
2.5
ate
OD
3T3-GD
3T3 Pyrimidines
1 Thymidine
2 Deoxyuridine
3 Thymine
4 Cytosine
DC
1.5
2.0
2.5A549
A549-GD-sh
0.02
F
120
0.25
0.50
1.00
1 2 3 4 5
Fo
ld c
ha
ng
e
3T3-GD/Ctrl
HLF-GD/Ctrl
A549-GD-sh/Ctrl0.0
0.5
1.0
0 1 2 4 8 24 Hr
La
cta y
5 Uracil
0.0
0.5
1.0
0 1 2 4 8 24 Hr
60
E
0
20
40
60
80
100
120
Ag
ar
colo
ny
nu
mb
er
0 uM Sarcosine
10 uM Sarcosine
0
20
40
60
0 0.1 0.2 0.5 1 2 5 10 20 0 0.1 0.2 0.5 1 2 5 10 20
No
. o
f a
dh
eren
t co
lon
ies
/ 2
00
cel
ls
Methotrexate ( M)
3T3
Control GLDC
G
Serine
Sarcosine
Glycolysis
Betaine Pyrimidine
t b li
Phosphoserine
Glycine CH2-THF
Tetrahydrofolate (THF)
Methotrexate0
5
10
15
20
0 0.1 0.2 0.5 1 2 5 10 0 0.1 0.2 0.5 1 2 5 10
No
. o
f a
dh
eren
t co
lon
ies
/ 2
00
cel
ls
Methotrexate ( M)
HLF
Control GLDC
GLDCAldehyde metabolism
CO2
NH3
NADH
Glycine C 2
0
50
100
0 10 20 50 0 10 20 50 0 10 20 50
No
. o
f so
ft a
ga
r co
lon
ies
/ 1
00
0 c
ells
Methotrexate ( M)
A549
Control GLDC shRNA1 GLDC shRNA2
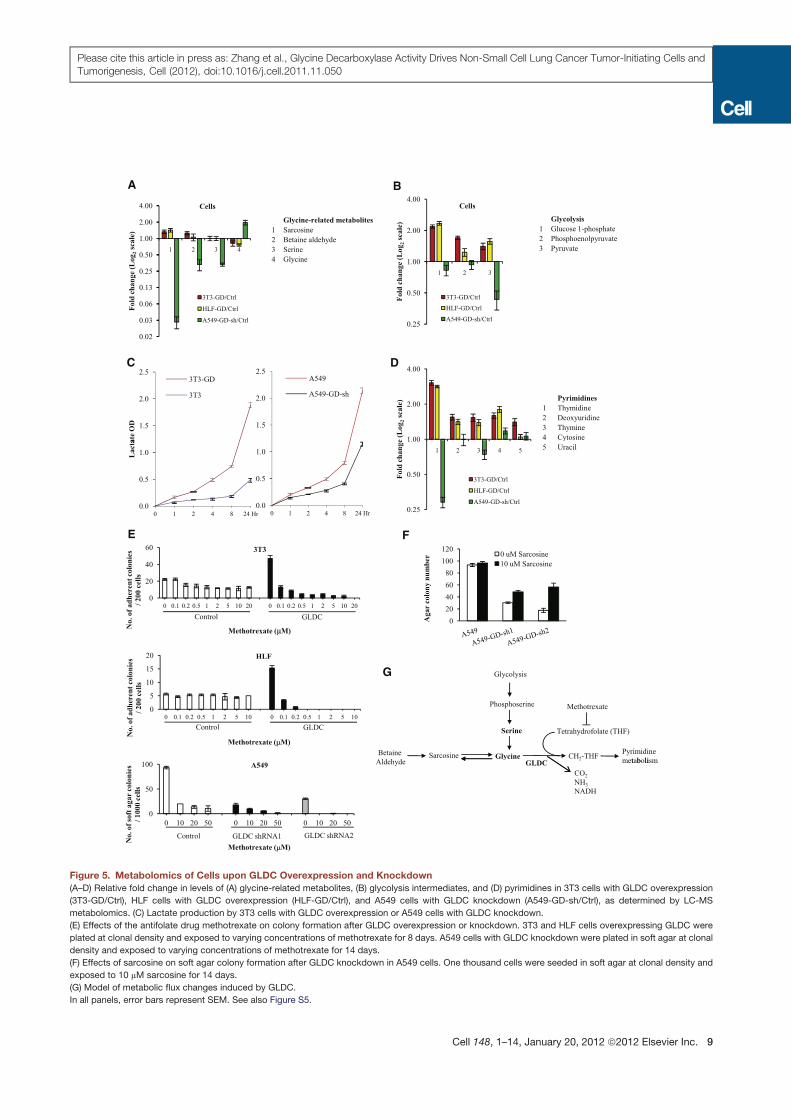
Figure 5. Metabolomics of Cells upon GLDC Overexpression and Knockdown
(A–D) Relative fold change in levels of (A) glycine-related metabolites, (B) glycolysis intermediates, and (D) pyrimidines in 3T3 cells with GLDC overexpression
(3T3-GD/Ctrl), HLF cells with GLDC overexpression (HLF-GD/Ctrl), and A549 cells with GLDC knockdown (A549-GD-sh/Ctrl), as determined by LC-MS
metabolomics. (C) Lactate production by 3T3 cells with GLDC overexpression or A549 cells with GLDC knockdown.
(E) Effects of the antifolate drug methotrexate on colony formation after GLDC overexpression or knockdown. 3T3 and HLF cells overexpressing GLDC were
plated at clonal density and exposed to varying concentrations of methotrexate for 8 days. A549 cells with GLDC knockdown were plated in soft agar at clonal
density and exposed to varying concentrations of methotrexate for 14 days.
(F) Effects of sarcosine on soft agar colony formation after GLDC knockdown in A549 cells. One thousand cells were seeded in soft agar at clonal density and
exposed to 10 mM sarcosine for 14 days.
(G) Model of metabolic flux changes induced by GLDC.
In all panels, error bars represent SEM. See also Figure S5.
Cell 148, 1–14, January 20, 2012 ª2012 Elsevier Inc. 9
Please cite this article in press as: Zhang et al., Glycine Decarboxylase Activity Drives Non-Small Cell Lung Cancer Tumor-Initiating Cells and
Tumorigenesis, Cell (2012), doi:10.1016/j.cell.2011.11.050

A GLDC
C
1+ 3+2+0
Ad
C
B
GLDC Intensity SHR (95% CI) P-value
0.005
1 1.28 (0.61 – 2.71) 0.514
0.8
0.6
0 4
1.0CGLDC
3+
1+2+
0
ati
ve
inci
den
ce
2 1.19 (0.50 – 2.84) 0.700
3 3.01 (1.48 – 6.10) 0.002
D
0.2
0.4
Time to lung cancer death (years)
P = 0.005
n=143
Cu
mu
la
0 2 4 6 8 10 12 14
0
CD166
CD166 GLDC DAPIDAPI CD166 GLDC DAPIDAPI
GLDC GLDCCD166
Figure 6. GLDC Is a Prognostic Indicator for Mortality in NSCLC Patients
(A) GLDC immunohistochemistry staining in a NSCLC tumor microarray (n = 143). Representative images shown for human primary lung adenocarcinomas (AdC)
immunostained with GLDC. Staining intensity grade is indicated in the upper right corner. The boxed regions in the upper images are shown at higher magni-
fication in the lower images. Scale bar, 100 mm.
(B) Subdistribution hazard ratios for each GLDC staining intensity grade, adjusted for American Joint Committee on Cancer (AJCC) staging. CI, confidence
interval.
(C) Cumulative incidence of lung cancer mortality adjusted for AJCC staging, for patients with each GLDC staining intensity grade.
(D) Coimmunofluorescence staining of CD166 (red) and GLDC (green) on primary lung cancer patient tumors, counterstained with DAPI (blue). Representative
cases with coexpression of high levels of CD166 and high levels of GLDC (left panel) and low levels of CD166 and low levels of GLDC (right panel) are shown.
Higher magnification inset is shown in bottom left corner. Scale bar, 50 mm.
See also Figure S6 and Table S2.
10 Cell 148, 1–14, January 20, 2012 ª2012 Elsevier Inc.
Please cite this article in press as: Zhang et al., Glycine Decarboxylase Activity Drives Non-Small Cell Lung Cancer Tumor-Initiating Cells and
Tumorigenesis, Cell (2012), doi:10.1016/j.cell.2011.11.050
down GLDC in CACO2 cells. Indeed we found thatGLDC knock-
down reduced their proliferation and tumorigenic potential upon
transplantation, suggesting that GLDC may act as an oncogene
in other cancer cells as well (Figures 7C–7E). To examine the
possibility that GLDC is a housekeeping gene for cell prolifera-
tion, we also knocked down GLDC in normal HLFs (Figure S7A).
We found that HLF proliferation was unaffected by retroviral
knockdown of GLDC (Figures S7B and S7C). Furthermore we
observed that GLDC is highly expressed only in a few normal
tissues, including postmitotic liver cells, kidney cells, placenta
cells, and olfactory bulb neurons (Figure S7D). Altogether our
observations in both experimental and clinical settings suggest
that human GLDC is not a housekeeping gene required for cell
proliferation but rather an oncogenic metabolic enzyme aber-
rantly upregulated in NSCLC and possibly several other human
cancers.
DISCUSSION
TIC State in Lung Cancer
Our work sheds new light on the nature of the TIC state and the
role of metabolic reprogramming in tumorigenesis. In this study,
we isolated a subpopulation of TICs from NSCLC patients using
themarker CD166 and showed that both the oncogenic stem cell
2
3
4
GL
DC
in
ssu
es
A GLDC expression across primary tissue cancers
-4
-3
-2
-1
0
1
Ov
ary
Ger
m c
ell
Cer
vix
Bra
in
Lu
ng
Ly
mp
ho
ma
Pro
sta
te
Hea
d &
Nec
k
Eso
ph
ag
us
Bla
dd
er
Co
lon
Lo
g2
fold
ch
an
ge
of
G
tum
or
/ n
orm
al
tis
10000B
1
10
100
1000
No
rma
lize
d G
LD
Cin
ten
sity
250
0 0
0.5
1.0
Rel
ativ
e GLDC
expre
ssio
n
Ctrl-shGD-sh
C
CACO2
600,000
800,000
f ce
lls
Ctrl-sh
GD-sh
28B-sh
D E
Ctrl-sh GD-sh 28B-sh
0.0
0
200,000
400,000
0 2 4 6
Nu
mb
er o
Days0.0
0.5
1.0
Rel
ativ
e LIN28B
expre
ssio
n
Ctrl-sh28B-sh
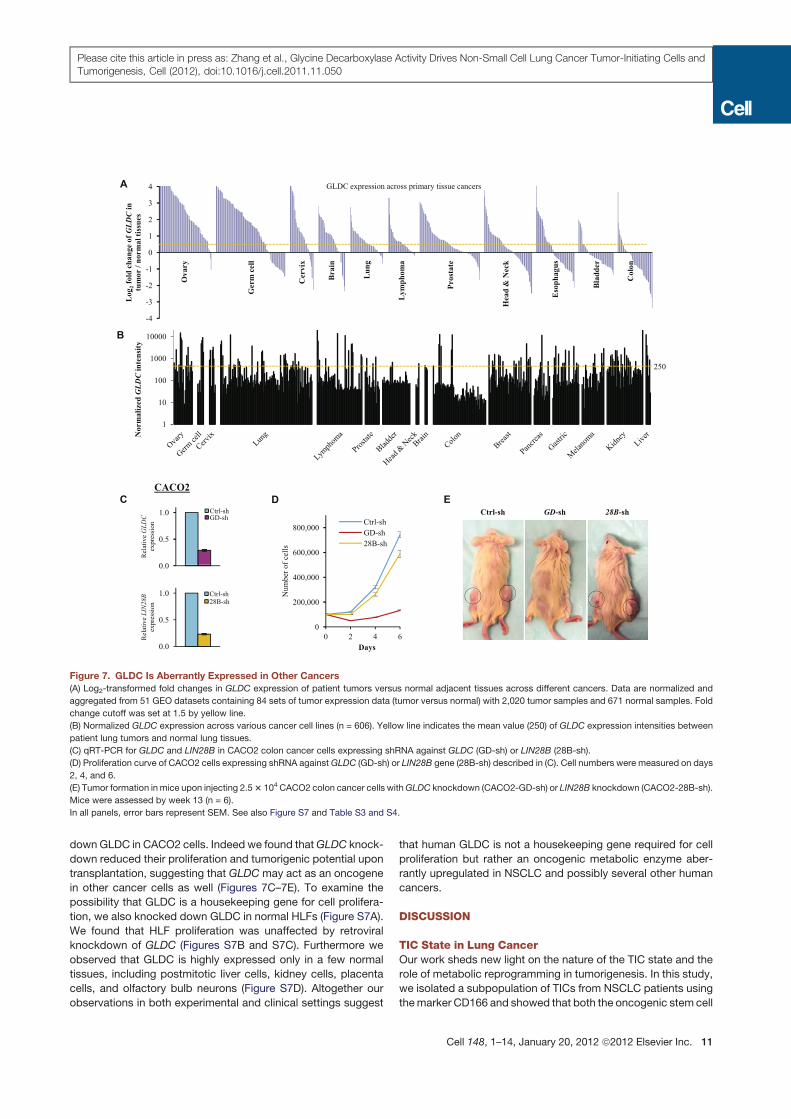
Figure 7. GLDC Is Aberrantly Expressed in Other Cancers
(A) Log2-transformed fold changes in GLDC expression of patient tumors versus normal adjacent tissues across different cancers. Data are normalized and
aggregated from 51 GEO datasets containing 84 sets of tumor expression data (tumor versus normal) with 2,020 tumor samples and 671 normal samples. Fold
change cutoff was set at 1.5 by yellow line.
(B) Normalized GLDC expression across various cancer cell lines (n = 606). Yellow line indicates the mean value (250) of GLDC expression intensities between
patient lung tumors and normal lung tissues.
(C) qRT-PCR for GLDC and LIN28B in CACO2 colon cancer cells expressing shRNA against GLDC (GD-sh) or LIN28B (28B-sh).
(D) Proliferation curve of CACO2 cells expressing shRNA againstGLDC (GD-sh) or LIN28B gene (28B-sh) described in (C). Cell numbers were measured on days
2, 4, and 6.
(E) Tumor formation in mice upon injecting 2.53 104CACO2 colon cancer cells withGLDC knockdown (CACO2-GD-sh) or LIN28B knockdown (CACO2-28B-sh).
Mice were assessed by week 13 (n = 6).
In all panels, error bars represent SEM. See also Figure S7 and Table S3 and S4.
Cell 148, 1–14, January 20, 2012 ª2012 Elsevier Inc. 11
Please cite this article in press as: Zhang et al., Glycine Decarboxylase Activity Drives Non-Small Cell Lung Cancer Tumor-Initiating Cells and
Tumorigenesis, Cell (2012), doi:10.1016/j.cell.2011.11.050
factor LIN28B and the glycine metabolism enzyme GLDC drive
the tumorigenicity of lung cancer TICs.
Our data showed that CD166 enriched for TICs in primary
NSCLC, and that CD166 served as an inert surface marker. In
contrast, our results on CD133 are different from the results re-
ported by Eramo et al. (2008) even though both studies used
the same CD133 antibody. This is most likely due to differences
in the xenotransplantation assays, which tend to underestimate
the true frequency of TICs. We employed a more sensitive
mouse xenotransplantation assay using NOD/SCID Il2rg!/!
mice instead of SCID mice, and we directly transplanted primary
tumor cells with Matrigel instead of expanding the tumor cells
in vitro. Previous studies have demonstrated that using a more
sensitive mouse xenotransplantation assay dramatically im-
proves our understanding of TICs (Quintana et al., 2008). Our
present study supports this notion, leading us to CD166 as a
new marker for the lung TIC-containing fraction. In normal phys-
iology, CD166 is expressed predominantly during embryonic
development, including the embryonic upper airway, primitive
cardiac cells, and mesenchymal stem cells (Avril-Delplanque
et al., 2005; Murakami et al., 2007; Hennrick et al., 2007; Sabatini
et al., 2005). Expression of CD166 in the embryonic lung is
consistent with our observation that CD166+ lung TICs express
high levels of embryonic lung transcription factors like PEA3
and the trachealess homolog NPAS1, as well as the oncogenic
stem cell factor LIN28B (Liu et al., 2003; Levesque et al., 2007;
Viswanathan et al., 2009). Interestingly, mouse Lin28 is also
expressed in the embryonic lung during normal development
(Yang and Moss, 2003). These observations suggest that the
TIC state in lung cancer is similar to the embryonic lung progen-
itor state in many aspects.
GLDC Is a Metabolic Oncogene
Our results demonstrate thatmultiple components in the glycine/
serine pathway are also oncogenes. In addition to embryonic
lung factors, lung TICs also express high levels of GLDC,
GCAT, SHMT1/2, PSPH, and PSAT1, suggesting that TICs rely
on glycine/serine metabolism for tumorigenesis. Overexpression
of catalytically active GLDC, as well as PSAT1, PSPH, and
SHMT2, could induce cellular transformation in 3T3 cells to
form tumors, whereas retroviral knockdown of GLDC signifi-
cantly reduces the tumorigenicity of lung cancer cells. We further
observed that GLDC+ cells mostly form a subset of CD166+ cells
in lung tumors.
PSAT1, PSPH, and SHMT1/2 lie upstream of GLDC in
the glycine/serine pathway, diverting glycolytic flux from
3-phosphoglycerate through serine to glycine. GLDC is an
oxidoreductase that catalyzes the irreversible rate-limiting step
of glycine catabolism, by breaking down each glycine molecule
in the glycine cleavage system to produce NADH, CO2, NH3, and
CH2-THF (Kume et al., 1991). CH2-THF fuels the one-carbon/
folate metabolism pool, which in turn supplies methylene groups
for biosynthesis (Tibbetts and Appling, 2010). Consistent with
these facts, we found that GLDC regulates many metabolites
in glycolysis and the glycine/serine pathway, leading to specific
changes in pyrimidine synthesis. Pyrimidine derivatives like
thymidine, in turn, are required for nucleotide synthesis in cell
proliferation. Recent studies suggest that early oncogenesis
involves aberrant activation of cell proliferation, which then leads
to a crisis of nucleotide deficiency and replication stress (Bester
et al., 2011)—a crisis that GLDC upregulation could overcome
for continued progression in tumorigenesis. Interestingly, we
found that GLDC also increases the levels of N-methylglycine
or sarcosine, an oncometabolite implicated in prostate cancer
(Sreekumar et al., 2009). Furthermore, we observed that GLDC
promotes glycolysis. Combined with our findings on LIN28,
which has been shown to promote glucose uptake and glycol-
ysis (Zhu et al., 2010, 2011), GLDC might be cooperating with
LIN28 as well as PSAT1, PSPH, and SHMT1/2 to divert the
glycolytic flux to glycine and produce CH2-THF. These observa-
tions support the notion that the Warburg effect promotes
biosynthesis for tumorigenesis (Hsu and Sabatini, 2008; Vander
Heiden et al., 2009).
GLDC and Glycine Metabolism Are Relevant to Human
Cancer Patients
From the prognostic perspective, aberrant GLDC expression is
significantly correlated with the survival rates of NSCLC patients.
This is consistent with the model that TIC clones expand to
constitute the bulk of the tumor in advanced stages of malig-
nancy (Boiko et al., 2010). Aberrantly increased GLDC is also
widespread in many other human cancers, including lymphoma,
ovarian, germ cell, cervical, prostate, bladder, and colon cancer,
whereas most normal adult human tissues express very low
levels of GLDC. Our experimental data further suggest that in
cancers that rely on GLDC and glycine metabolism, the highly
toxic antifolate drug methotrexate might be initially effective
because it targets TICs, although our data suggest an even
more effective chemotherapy could be potentially achieved by
combining an antifolate drug with a GLDC inhibitor or by search-
ing for a glycine cleavage complex-specific antifolate drug—
much like the search for kinase-specific inhibitors in targeted
cancer therapy.
Our study links a glycine metabolism enzyme to lung cancer
and tumorigenesis. Recently several metabolic enzymes have
been linked to cancer in patients, supporting the status of meta-
bolic reprogramming as a new hallmark of cancer (Hanahan and
Weinberg, 2011). In particular, the pyruvate kinase M2 isoform
PKM2, isocitrate dehydrogenase IDH1/2, and phosphoglycerate
dehydrogenase PHGDH have been implicated in multiple
cancers (Christofk et al., 2008; Parsons et al., 2008; Dang et al.,
2009; Locasale et al., 2011; Possemato et al., 2011). Regardless
of the controversy over the frequency of TICs at different stages
of malignancy, our approach shows that characterizing the
unique molecular basis that defines cancer cells with tumori-
genic capacity may nevertheless provide novel drug targets for
advancing cancer therapy.
EXPERIMENTAL PROCEDURES
Tumor Cell Preparation
NSCLC tumors were collected from patients according to protocols approved
by the Ethics Committee of the National University of Singapore. Samples
were washed, dissociated, and incubated in DNase and collagenase/dispase.
After incubation, cell clusters and red blood cells were removed. Then single
cells were resuspended and ready for transplantation. See the Extended
Experimental Procedures for more details.
12 Cell 148, 1–14, January 20, 2012 ª2012 Elsevier Inc.
Please cite this article in press as: Zhang et al., Glycine Decarboxylase Activity Drives Non-Small Cell Lung Cancer Tumor-Initiating Cells and
Tumorigenesis, Cell (2012), doi:10.1016/j.cell.2011.11.050
Flow Cytometry
A list of antibodies used can be found in Table S5. Cells were FACS-sorted
using a FACSAria (BD). Flow cytometry was performed using a LSR II flow
cytometer, and data were analyzed with CELLQuest Pro software (BD).
Animals and Transplantation of Tumor Cells
NOD.Cg-Prkdcscid Il2rgtm1Wjl/SzJ mice (Jackson Laboratories) at 4–6 weeks
old were subcutaneously transplanted with single-cell suspensions in
serum-free medium and Matrigel (BD) (1:1).
Tumor Sphere Culture
Cells were grown in DMEM/F12 containing ITS (BD Biosciences) and supple-
mented with 50 ng/ml EGF and 20 ng/ml basic fibroblast growth factor (bFGF)
(Invitrogen), using nontreated cell culture plates (Nunc). Fresh medium was
replenished every 3 days.
cDNA Microarray Analysis
Total RNA was extracted by Trizol (Invitrogen) and purified by RNeasy Mini
Kit (QIAGEN). Lung primary tumors (one patient), tumor xenografts (three
patients), tumor spheres (four patients), and normal human adult lung
tissues (three patients) were used. RNA was processed and hybridized to
HumanRef-8 v3.0 Beadarrays (Illumina), and themicroarray data were normal-
ized and analyzed as described previously (Chua et al., 2006). A fold-change
cut-off threshold of 1.5 was applied to generate the lung TIC gene signature
after four comparisons: primary tumor CD166+ versus CD166! (P+/P!), xeno-
graft tumor CD166+ versus CD166! (X+/X!), spheres versus xenograft tumor
CD166+ (S/X+), and normal lung CD166+ versus CD166! (N+/N!). After inter-
secting the differentially expressed genes (DEGs) of P+/P!, X+/X!, and S/X+
and excluding DEGs intersecting with N+/N!, DAVID Bioinformatics
Resources 6.7 was applied for KEGG pathway analysis of the final list of
DEGs (Huang et al., 2009).
Metabolomics
Metabolites were extracted by centrifugation of culture media at 14,000 rpm
for 30 min at 4$C. Metabolomic profiling was performed through UPLC/MS
using a Zorbax Eclipse Plus-C18 column on the Agilent 1200 RRLC and an
Agilent 6530 Accurate Mass QTOF. Mass spectrometry was performed on
an Agilent 6530 Accurate Mass Q-TOF mass spectrometer operating in posi-
tive ion mode with 2 GHz extended dynamic range mode. See Extended
Experimental Procedures for more details.
Statistical Analysis
Differences were compared using two-tailed Student’s t test. p values < 0.05
were considered statistically significant. All analyses were performed with
SPSS 18.0 (SPSS). Lung TIC frequencies were estimated using ELDA software
(Hu and Smyth, 2009). Fisher’s exact test was used to assess the association
between GLDC, CD166, or LIN28B and clinicopathological parameters. The
effect of GLDC, CD166, or LIN28B expressions on lung cancer mortality was
modeled using competing risks regression and quantified based on the SHR
(Fine and Gray, 1999).
ACCESSION NUMBERS
The GEO accession number for human datasets is GSE33198.
SUPPLEMENTAL INFORMATION
Supplemental Information includes Extended Experimental Procedures, seven
figures, and six tables and can be found with this article online at doi:10.1016/
j.cell.2011.11.050.
ACKNOWLEDGMENTS
This work is supported by grants from Biomedical Research Council (BMRC)
and Agency for Science, Technology and Research (A*STAR) (B.L.) and grants
from the Singapore Cancer Syndicate and Singapore LungCancer Consortium
(E.H.L.). We gratefully acknowledge assistance fromY.P.R. Yip, S.L. Long, and
J. Xu for collection of lung tissues. We are grateful to the Biopolis Shared Facil-
ities Histopathology Laboratory staff for their support with immunohistochem-
istry and image analysis. We thank Z.M. Li for assistance with making trans-
formed breast cell lines. We greatly acknowledge V. Gaddemane, C.S. Gan,
and T. Hennessy from Agilent Technologies, Singapore for their support in
acquiring and analyzing the mass spectrometry data for the differential anal-
ysis of the metabolites. We thank W.L. Tam and F. McKeon for comments
on the manuscript.
Received: February 22, 2011
Revised: August 11, 2011
Accepted: November 17, 2011
Published online: January 5, 2012
REFERENCES
Avril-Delplanque, A., Casal, I., Castillon, N., Hinnrasky, J., Puchelle, E., and
Peault, B. (2005). Aquaporin-3 expression in human fetal airway epithelial
progenitor cells. Stem Cells 23, 992–1001.
Bester, A.C., Roniger, M., Oren, Y.S., Im, M.M., Sarni, D., Chaoat, M., Bensi-
mon, A., Zamir, G., Shewach, D.S., and Kerem, B. (2011). Nucleotide defi-
ciency promotes genomic instability in early stages of cancer development.
Cell 145, 435–446.
Boiko, A.D., Razorenova, O.V., van de Rijn, M., Swetter, S.M., Johnson, D.L.,
Ly, D.P., Butler, P.D., Yang, G.P., Joshua, B., Kaplan, M.J., et al. (2010).
Human melanoma-initiating cells express neural crest nerve growth factor
receptor CD271. Nature 466, 133–137.
Christofk, H.R., Vander Heiden, M.G., Harris, M.H., Ramanathan, A., Gerszten,
R.E., Wei, R., Fleming, M.D., Schreiber, S.L., and Cantley, L.C. (2008). The M2
splice isoform of pyruvate kinase is important for cancer metabolism and
tumour growth. Nature 452, 230–233.
Chua, S.W., Vijayakumar, P., Nissom, P.M., Yam, C.Y., Wong, V.V.T., and
Yang, H. (2006). A novel normalization method for effective removal of system-
atic variation in microarray data. Nucleic Acids Res. 34, e38.
Civenni, G., Walter, A., Kobert, N., Mihic-Probst, D., Zipser, M., Belloni, B.,
Seifert, B., Moch, H., Dummer, R., van den Broek, M., and Sommer, L.
(2011). Human CD271-positive melanoma stem cells associated with metas-
tasis establish tumor heterogeneity and long-term growth. Cancer Res. 71,
3098–3109.
Curtis, S.J., Sinkevicius, K.W., Li, D.A., Lau, A.N., Roach, R.R., Zamponi, R.,
Woolfenden, A.E., Kirsch, D.G., Wong, K.K., and Kim, C.F. (2010). Primary
tumor genotype is an important determinant in identification of lung cancer
propagating cells. Cell Stem Cell 7, 127–133.
Dang, L., White, D.W., Gross, S., Bennett, B.D., Bittinger, M.A., Driggers, E.M.,
Fantin, V.R., Jang, H.G., Jin, S., Keenan,M.C., et al. (2009). Cancer-associated
IDH1 mutations produce 2-hydroxyglutarate. Nature 462, 739–744.
Dontu, G., Abdallah, W.M., Foley, J.M., Jackson, K.W., Clarke, M.F., Kawa-
mura, M.J., and Wicha, M.S. (2003). In vitro propagation and transcriptional
profiling of human mammary stem/progenitor cells. Genes Dev. 17, 1253–
1270.
Eramo, A., Lotti, F., Sette, G., Pilozzi, E., Biffoni, M., Di Virgilio, A., Conticello,
C., Ruco, L., Peschle, C., and DeMaria, R. (2008). Identification and expansion
of the tumorigenic lung cancer stem cell population. Cell Death Differ. 15,
504–514.
Fine, J.P., and Gray, R.J. (1999). A proportional hazards model for the subdis-
tribution of a competing risk. J. Am. Stat. Assoc. 94, 496–509.
Hanahan, D., and Weinberg, R.A. (2011). Hallmarks of cancer: the next gener-
ation. Cell 144, 646–674.
Hennrick, K.T., Keeton, A.G., Nanua, S., Kijek, T.G., Goldsmith, A.M., Sajjan,
U.S., Bentley, J.K., Lama, V.N., Moore, B.B., Schumacher, R.E., et al.
(2007). Lung cells from neonates show a mesenchymal stem cell phenotype.
Am. J. Respir. Crit. Care Med. 175, 1158–1164.
Cell 148, 1–14, January 20, 2012 ª2012 Elsevier Inc. 13
Please cite this article in press as: Zhang et al., Glycine Decarboxylase Activity Drives Non-Small Cell Lung Cancer Tumor-Initiating Cells and
Tumorigenesis, Cell (2012), doi:10.1016/j.cell.2011.11.050
Hsu, P.P., and Sabatini, D.M. (2008). Cancer cell metabolism: Warburg and
beyond. Cell 134, 703–707.
Hu, Y.F., and Smyth, G.K. (2009). ELDA: extreme limiting dilution analysis for
comparing depleted and enriched populations in stem cell and other assays.
J. Immunol. Methods 347, 70–78.
Huang, W., Sherman, B.T., and Lempicki, R.A. (2009). Systematic and integra-
tive analysis of large gene lists using DAVID bioinformatics resources. Nat.
Protoc. 4, 44–57.
Ishizawa, K., Rasheed, Z.A., Karisch, R., Wang, Q.J., Kowalski, J., Susky, E.,
Pereira, K., Karamboulas, C., Moghal, N., Rajeshkumar, N.V., et al. (2010).
Tumor-initiating cells are rare in many human tumors. Cell Stem Cell 7,
279–282.
Jemal, A., Bray, F., Center, M.M., Ferlay, J., Ward, E., and Forman, D. (2011).
Global cancer statistics. CA Cancer J. Clin. 61, 69–90.
Kume, A., Koyata, H., Sakakibara, T., Ishiguro, Y., Kure, S., and Hiraga, K.
(1991). The glycine cleavage system. Molecular cloning of the chicken and
human glycine decarboxylase cDNAs and some characteristics involved in
the deduced protein structures. J. Biol. Chem. 266, 3323–3329.
Kure, S., Kato, K., Dinopoulos, A., Gail, C., DeGrauw, T.J., Christodoulou, J.,
Bzduch, V., Kalmanchey, R., Fekete, G., Trojovsky, A., et al. (2006). Compre-
hensive mutation analysis of GLDC, AMT, and GCSH in nonketotic hyperglyci-
nemia. Hum. Mutat. 27, 343–352.
Levesque, B.M., Zhou, S.T., Shan, L., Johnston, P., Kong, Y.P., Degan, S., and
Sunday, M.E. (2007). NPAS1 regulates branching morphogenesis in embry-
onic lung. Am. J. Respir. Cell Mol. Biol. 36, 427–434.
Liu, Y.R., Jiang, H.Y., Crawford, H.C., and Hogan, B.L.M. (2003). Role for ETS
domain transcription factors Pea3/Erm in mouse lung development. Dev. Biol.
261, 10–24.
Locasale, J.W., Grassian, A.R., Melman, T., Lyssiotis, C.A., Mattaini, K.R.,
Bass, A.J., Heffron, G., Metallo, C.M., Muranen, T., Sharfi, H., et al. (2011).
Phosphoglycerate dehydrogenase diverts glycolytic flux and contributes to
oncogenesis. Nat. Genet. 43, 869–874.
Murakami, Y., Hirata, H., Miyamoto, Y., Nagahashi, A., Sawa, Y., Jakt, M., Asa-
hara, T., and Kawamata, S. (2007). Isolation of cardiac cells from E8.5 yolk sac
by ALCAM (CD166) expression. Mech. Dev. 124, 830–839.
Nakai, T., Nakagawa, N., Maoka, N., Masui, R., Kuramitsu, S., and Kamiya, N.
(2005). Structure of P-protein of the glycine cleavage system: implications for
nonketotic hyperglycinemia. EMBO J. 24, 1523–1536.
Parsons, D.W., Jones, S., Zhang, X.S., Lin, J.C.H., Leary, R.J., Angenendt, P.,
Mankoo, P., Carter, H., Siu, I.M., Gallia, G.L., et al. (2008). An integrated
genomic analysis of human glioblastoma multiforme. Science 321, 1807–
1812.
Possemato, R., Marks, K.M., Shaul, Y.D., Pacold, M.E., Kim, D., Birsoy, K.,
Sethumadhavan, S., Woo, H.K., Jang, H.G., Jha, A.K., et al. (2011). Functional
genomics reveal that the serine synthesis pathway is essential in breast
cancer. Nature 476, 346–350.
Quintana, E., Shackleton, M., Sabel, M.S., Fullen, D.R., Johnson, T.M., and
Morrison, S.J. (2008). Efficient tumour formation by single human melanoma
cells. Nature 456, 593–598.
Quintana, E., Shackleton, M., Foster, H.R., Fullen, D.R., Sabel, M.S., Johnson,
T.M., and Morrison, S.J. (2010). Phenotypic heterogeneity among tumorigenic
melanoma cells from patients that is reversible and not hierarchically orga-
nized. Cancer Cell 18, 510–523.
Reya, T., Morrison, S.J., Clarke, M.F., and Weissman, I.L. (2001). Stem cells,
cancer, and cancer stem cells. Nature 414, 105–111.
Rosen, J.M., and Jordan, C.T. (2009). The increasing complexity of the cancer
stem cell paradigm. Science 324, 1670–1673.
Sabatini, F., Petecchia, L., Tavian, M., Jodon de Villeroche, V., Rossi, G.A., and
Brouty-Boye, D. (2005). Human bronchial fibroblasts exhibit a mesenchymal
stem cell phenotype and multilineage differentiating potentialities. Lab. Invest.
85, 962–971.
Sequist, L.V., Joshi, V.A., Janne, P.A., Muzikansky, A., Fidias, P., Meyerson,
M., Haber, D.A., Kucherlapati, R., Johnson, B.E., and Lynch, T.J. (2007).
Response to treatment and survival of patients with non-small cell lung cancer
undergoing somatic EGFR mutation testing. Oncologist 12, 90–98.
Sreekumar, A., Poisson, L.M., Rajendiran, T.M., Khan, A.P., Cao, Q., Yu, J.D.,
Laxman, B., Mehra, R., Lonigro, R.J., Li, Y., et al. (2009). Metabolomic profiles
delineate potential role for sarcosine in prostate cancer progression. Nature
457, 910–914.
Tibbetts, A.S., and Appling, D.R. (2010). Compartmentalization of mammalian
folate-mediated one-carbon metabolism. Annu. Rev. Nutr. 30, 57–81.
Vander Heiden, M.G., Cantley, L.C., and Thompson, C.B. (2009). Under-
standing the Warburg effect: the metabolic requirements of cell proliferation.
Science 324, 1029–1033.
Vander Heiden, M.G., Locasale, J.W., Swanson, K.D., Sharfi, H., Heffron, G.J.,
Amador-Noguez, D., Christofk, H.R., Wagner, G., Rabinowitz, J.D., Asara,
J.M., and Cantley, L.C. (2010). Evidence for an alternative glycolytic pathway
in rapidly proliferating cells. Science 329, 1492–1499.
Viswanathan, S.R., Powers, J.T., Einhorn, W., Hoshida, Y., Ng, T.L., Toffanin,
S., O’Sullivan, M., Lu, J., Phillips, L.A., Lockhart, V.L., et al. (2009). Lin28
promotes transformation and is associated with advanced human malignan-
cies. Nat. Genet. 41, 843–848.
Vogelstein, B., and Kinzler, K.W. (2004). Cancer genes and the pathways they
control. Nat. Med. 10, 789–799.
Warburg, O. (1956). On the origin of cancer cells. Science 123, 309–314.
Yang, D.H., and Moss, E.G. (2003). Temporally regulated expression of Lin-28
in diverse tissues of the developing mouse. Gene Expr. Patterns 3, 719–726.
Zhu, H., Shah, S., Shyh-Chang, N., Shinoda, G., Einhorn, W.S., Viswanathan,
S.R., Takeuchi, A., Grasemann, C., Rinn, J.L., Lopez, M.F., et al. (2010). Lin28a
transgenic mice manifest size and puberty phenotypes identified in human
genetic association studies. Nat. Genet. 42, 626–630.
Zhu, H., Shyh-Chang, N., Segre, A.V., Shinoda, G., Shah, S.P., Einhorn, W.S.,
Takeuchi, A., Engreitz, J.M., Hagan, J.P., Kharas, M.G., et al; DIAGRAM
Consortium; MAGIC Investigators. (2011). The Lin28/let-7 axis regulates
glucose metabolism. Cell 147, 81–94.
14 Cell 148, 1–14, January 20, 2012 ª2012 Elsevier Inc.
Please cite this article in press as: Zhang et al., Glycine Decarboxylase Activity Drives Non-Small Cell Lung Cancer Tumor-Initiating Cells and
Tumorigenesis, Cell (2012), doi:10.1016/j.cell.2011.11.050