sampling and analysis of naturally occurring radioactive
TRANSCRIPT

Sampling and Analysis of
Naturally Occurring Radioactive Material
in Oil and Gas Produced Water
Prepared by
Peter Gintautas, Ph.D.
Robert Chesson
Arthur Koepsell
November 2019
COGCC Special Project 10243

Sampling and Analysis of Naturally Occurring Radioactive Material in Oil and Gas Produced Water
COGCC Special Project 10243 i
EXECUTIVE SUMMARY
In 2017, environmental staff members of the Colorado Oil and Gas Conservation Commission (COGCC) conducted a survey of naturally occurring radioactive materials (NORM) in aqueous fluids produced from 45 oil and gas facilities throughout the state. These aqueous fluids are typically referred to as produced water. Produced water is the largest volume waste stream produced by oil & gas exploration and production (E&P) operations in Colorado. Approximately 308 million barrels of produced water were reported to COGCC during the year of this study (2017). Special Project 10243 was undertaken to better understand the activities of NORM in this waste. Both general water quality and NORM radiochemistry analytical parameters were determined as part of this study. All sampling and analyses were conducted as described in a project specific sampling and analysis plan. Sampling was performed by COGCC environmental protection staff and all analyses were conducted by independent laboratories. The analytical data gathered as part of this project has been uploaded in the COGCC environmental (COENV) database and the data and lab reports can be accessed through the COGCC web site. Fifty‐one samples of E&P fluids and 5 production gas samples were collected from fifteen separate producing formations in basins statewide. Characterization of NORM constituents in produced waters from basins with different geologic settings and different producing formations is necessary to understand what levels of NORM activities are present in the water co‐extracted with hydrocarbons from producing basins across the state. Analysis for NORM constituents included screening level analyses (gross alpha and gross beta), analysis of concentrations of uranium (U) and thorium (Th), and determination of the activities of numerous U and Th progeny using alpha, beta and gamma radiochemistry analytical procedures. A subset of samples sites (5) were selected for water/gas sample couplets to evaluate radon isotopic (222Rn) activities fractionation between water and gas phases. A small set of water samples were also analyzed for tritium (3H) activities and for calculated 14C ages of dissolved inorganic carbon (DIC). Radiological activity levels from this study are at the low to middle end of ranges found in the literature from other states (New York, Pennsylvania and Texas) and in the literature from a worldwide compilation of NORM in produced water. When compared to data from three other states, produced water samples from this study shows activities of NORM radionuclides to be lower in Colorado produced water samples than in other states for which large published data sets are available, and in most cases, by more than one order of magnitude, as shown in Tables 23, 24, and 25 in Section 4.2. An international compilation of ranges of activities of NORM radionuclides in comparison to results from this study is shown in Table 31. As with the datasets discussed in Section 4.2, the maximum measured activities in Colorado samples are lower than the maximum of the ranges of activities compiled from the international data set (Jonkers et al., 1997, IAEA, 2003). No relationship between water quality or radiological activities and the type of drilling technique or well stimulation/completion practices (hydraulic fracturing versus no hydraulic fracturing) was observed. The majority of the samples collected (10 of 16) with the highest activities of NORM analytes are from vertical wells that were not completed with hydraulic fracturing techniques. Only three of the highest activities of the NORM analytes were present in wells that had been completed by hydraulic fracturing, and none of the wells contributing to those sites were horizontal wells (Facilities 755501, 755657 and 755646).

Sampling and Analysis of Naturally Occurring Radioactive Material in Oil and Gas Produced Water
COGCC Special Project 10243 ii
General water quality parameters including major cations and anions, trace metals, pH, electrical conductivity, and suspended and dissolved solids, were determined for all of the study samples to better understand sources of solutes in produced water and relationship with NORM activities. Significant variations in the geochemistry of produced waters were observed within waters produced from the same formations in the same basin and even in formations in stratigraphic proximity to one another. High concentrations of TDS has been observed in previous studies in other states to be related to elevated radiological activities and that relationship is observed in samples collected for this study. This demonstrates that the composition of the rocks in contact with the produced water is the dominant factor in both the overall water quality (TDS for example) and the radiological content of the produced waters. Facility 755645 (Lyons Fm.), had the highest gross beta activity and highest activities of 40K, 228Ra, 226Ra, 222Rn, 210Pb and 210Po and the highest TDS concentration of all of the samples collected. Two other sampling sites, Facility 755541 (gross alpha, Osage Limestone) and Facility 755523 (214Pb and 214Bi, Topeka Limestone) also had highest reported activities and have the second‐ and fifth‐highest TDS concentrations reported in samples collected for this study. Sodium and, to a lesser extent, potassium are the dominant cations in the samples collected and chloride the dominant anion with lesser occurrences of bicarbonate alkalinity and sulfate. In general, the overall concentrations of total dissolved solids concentrations limit the use of produced waters for beneficial reuse without treatment. Road spreading of produced water for dust control is not possible in most situations as 71% of the samples exceed the 3,500 mg/l threshold under COGCC rule. The high sodium content relative to calcium and magnesium in these waters contributes to a high sodium adsorption ratio (SAR) with most of the samples having SAR ratios exceeding 9 which would severely limit produced water reuse in irrigation because of possible reduction of infiltration due to reactions induced in soils by the sodic waters. These limitations on use reduce the likelihood of the public coming in contact with most produced waters in the state. Mass ratios (Cl/Br) and molar ratios (Na/Cl) are used to better understand sources of solutes present in the produced water samples and in conjunction with water isotope ratios can be used to better
understand sources and history of produced waters. Stable isotopes of water (18O & deuterium (2H)) in study samples do not in general reflect modern or recent meteoric water sources of produced water (except for the coal‐bed methane samples and samples from a few other producing formations). Tritium and 14C activities were determined for eight of the samples and the results indicate non‐modern water in all but the frac source water sample (Facility 755461). Percent modern carbon results (14C) yielded ages from 60 years before present (BP) (the frac source water sample) to 43,600 years BP. The analytical data collected under Special Project 10243 provide staff, operators, other agencies, and the public with summary and detailed NORM‐related analytical data for produced water from across Colorado’s oil and gas producing basins. In general, NORM activities in Colorado are significantly lower (in some cases lower by more than one order of magnitude) when compared to published NORM data from other states. A very strong correlation between high TDS and elevated gross beta activities is observed in the study samples and is attributable to predominantly to 40K and to a lesser extent 228Ra and 210Pb. 40K is

Sampling and Analysis of Naturally Occurring Radioactive Material in Oil and Gas Produced Water
COGCC Special Project 10243 iii
present in produced waters from dissolution of K bearing minerals in shales, sandstones and evaporite minerals in O&G reservoir rocks and may also be added as KCL in products used in drilling, in well control fluids or in completion fluids. No risk assessment or exposure modeling related to NORM was done as part of this study, as both are outside the scope of the project and not within the expertise of COGCC staff. However, a guiding concept (as developed by the Health Physics Society) with respect to all exposure to or potential exposures to ionizing radiation, is to keep exposure to ionizing radiation as low as reasonably achievable (ALARA) in a workplace environment (or other places where people may come in contact with radiation). Oil and gas facilities are the workplace in which this concept is most appropriate with respect to NORM in E&P wastes.

Sampling and Analysis of Naturally Occurring Radioactive Material in Oil and Gas Produced Water
COGCC Special Project 10243 iv
Contents
Executive Summary .................................................................................................................................................. i
List of Figures ......................................................................................................................................................... vi
List of Tables .......................................................................................................................................................... vii
Acknowledgements .............................................................................................................................................. viii
1. Introduction, Purpose, and Approach .............................................................................................................. 1
2. Study Implementation ...................................................................................................................................... 8
2.1 Sampling Methods ..................................................................................................................................... 8
2.2 Sampling Activities ..................................................................................................................................... 8
2.3 Analytes and Analytical Methods ............................................................................................................... 8
3. Analytical Data ................................................................................................................................................ 12
3.1 Radiochemistry Results ............................................................................................................................ 12
3.1.1 Gross Alpha and Gross Beta .............................................................................................................. 12
3.1.2 Isotopic Analyses of U and 238U Progeny ........................................................................................... 19
3.1.3 Isotopic Analyses of Th and 232Th Progeny ........................................................................................ 25
3.1.4 Analysis by Gamma Spectrometry ..................................................................................................... 29
3.2 General Water Quality Parameters .......................................................................................................... 37
3.2.1 Metals Including U and Th ................................................................................................................. 37
3.2.2 Anions ................................................................................................................................................ 40
3.2.3 pH, Specific Conductance, TDS and TSS ............................................................................................. 41
3.2.4 Major Ion Chemistry and General Water Chemistry Discussion ....................................................... 44
3.3 Stable Isotopes of H2O and of Carbon in Dissolved Inorganic Carbon ..................................................... 53
3.4 Tritium (3H) in H2O .................................................................................................................................... 58
3.5 14C in Dissolved Inorganic Carbon ............................................................................................................ 58
4. Discussion ....................................................................................................................................................... 60
4.1 Other Colorado Data ................................................................................................................................ 60
4.1.1 Project Rulison ................................................................................................................................... 60
4.1.2 Surface Water, Domestic Groundwater, and Raton Basin and NORM 2017 Produced Water Data 62
4.2 Data from Other States ............................................................................................................................ 68
4.3 Data from this Study ................................................................................................................................ 71
4.3.1 Gross Alpha and Gross Beta .............................................................................................................. 71
4.3.2 238U and Progeny ............................................................................................................................... 74
4.3.3 Radon Fractionation Between Gas and Aqueous Phases .................................................................. 76
4.3.4 232Th and Progeny .............................................................................................................................. 77
4.3.5 40K ...................................................................................................................................................... 77
4.3.6 General Inorganic Chemistry ............................................................................................................. 77

Sampling and Analysis of Naturally Occurring Radioactive Material in Oil and Gas Produced Water
COGCC Special Project 10243 v
4.3.7 Stable Isotopes of Water and DIC ...................................................................................................... 82
4.3.8 Tritium in H2O and 14C of DIC ............................................................................................................. 89
5. Summary ......................................................................................................................................................... 96
6. Conclusions ..................................................................................................................................................... 99
7. Recommendations ........................................................................................................................................ 114
References ........................................................................................................................................................... 115
Appendices .......................................................................................................................................................... 129
Appendix 1. List of Samples Collected ............................................................................................................ 129
Appendix 2. Gross Alpha and Gross Beta Analyses ......................................................................................... 131
Appendix 3. Isotopic Analyses of U ................................................................................................................. 133
Appendix 4. Isotopic Analyses of 238U Progeny ............................................................................................... 134
Appendix 5. 222Rn Analyses of Gas Samples .................................................................................................... 137
Appendix 6. Isotopic Analyses of 232Th Progeny.............................................................................................. 138
Appendix 7. Gamma Spectroscopy Results for 40K, 60Co, 137Cs and 241Am ...................................................... 141
Appendix 9, Gamma Spectroscopy Results for Th Related Isotopes .............................................................. 146
Appendix 10. Dissolved Metals ....................................................................................................................... 149
Appendix 11. Total ICP Metals (SW6010) ....................................................................................................... 151
Appendix 12. Total ICP/MS Metals (SW6020) ................................................................................................. 155
Appendix 13. Anions ....................................................................................................................................... 163
Appendix 14. pH, Specific Conductance, TDS and TSS .................................................................................... 166
Appendix 15. Stable Isotopes of H2O and Carbon Isotopes of Dissolved Inorganic Carbon ........................... 168
Appendix 16. Tritium (3H) in Water (U of Miami) ........................................................................................... 170
Appendix 17. 14C in Dissolved Inorganic Carbon (DIC) University of Arizona ................................................. 170

Sampling and Analysis of Naturally Occurring Radioactive Material in Oil and Gas Produced Water
COGCC Special Project 10243 vi
LIST OF FIGURES
Figure 1. Decay Chain of 238U .................................................................................................................................. 5 Figure 2. Decay Chain of 232Th ................................................................................................................................. 7 Figure 3. Sampling Locations Identified by COENV Facility Number .................................................................... 10 Figure 4. Histogram of Gross Alpha activities ....................................................................................................... 14 Figure 5. Histogram of Gross Beta Activities ......................................................................................................... 14 Figure 6. Ranges of Gross Alpha Activities ............................................................................................................ 16 Figure 7. Ranges of Gross Beta Activities .............................................................................................................. 17 Figure 8. Gross Alpha and Gross Beta Activities Plotted versus TDS Concentration ............................................ 18 Figure 9. Ranges of 226Ra Activities ....................................................................................................................... 21 Figure 10. Ranges of 228Ra Activities ..................................................................................................................... 28 Figure 11. 40K and Gross Beta Activities in Comparison to K Concentration ........................................................ 31 Figure 12. Comparison of 226Ra Activities by Two Analytical Methods ................................................................. 33 Figure 13. Comparison of 222Rn Activities versus Gamma Spectroscopy 214Pb and 214Bi Activities....................... 34 Figure 14. Comparison of 228Ra Activities by Two Analytical Methods ................................................................. 36 Figure 15. Total Dissolved Solids (TDS) versus Specific Conductance ................................................................... 42 Figure 16. NORM 2017 Samples Production Formation(s) and Ranges of TDS .................................................... 43 Figure 17. Piper Diagram Showing Major Ion Composition of 2017 NORM Produced Water Samples ............... 45 Figure 18. Sodium Adsorption Ratio (SAR) of Samples Collected as Part of this Study ........................................ 47 Figure 19. Chloride/Bromide Mass Ratio of Samples Collected as Part of this Study .......................................... 49 Figure 20. Na/Cl molar ratios of NORM 2017 Samples ......................................................................................... 51 Figure 21. Na/Cl ratio Plotted versus Cl/Br Ratio of 2017 NORM Samples .......................................................... 52 Figure 22. Water Stable Isotopes of NORM 2017 Samples ................................................................................... 54 Figure 23. Carbon Isotope Ratios of Dissolved Inorganic Carbon in NORM 2017 samples .................................. 57 Figure 24. Comparison of Domestic Groundwater and Produced Water Uranium Concentrations .................... 63 Figure 25. Comparison of Gross Alpha and Gross Beta in Colorado H2O Samples ............................................... 65 Figure 26. Comparison of Domestic Groundwater and Produced Water 226Ra and 222Rn Activities .................... 66 Figure 27. Comparison of Domestic Groundwater and Produced Water 228Ra Activities .................................... 67 Figure 28. Gross Alpha Activities Versus Sum of 226Ra, 224Ra and 210Po Activities from Samples Collected as Part of this Study .......................................................................................................................................................... 72 Figure 29. Gross Beta and Major Beta Emitters from Samples Collected as Part of this Study ............................ 73 Figure 30. . Ratio of 210Pb Activity to 210Po Activity in Samples with >MDC Activities of 210Pb (this study) .......... 75 Figure 31. Major Ion Differences Shown on a Stiff Diagram – Williams Fork Fm. Samples (this study) ............... 78 Figure 32. Major Ion Composition of Niobrara Fm. Produced Waters (this study) Shown on Piper Diagram. .... 80 Figure 33. Piper Diagram Showing Major Ion Composition of Water Samples with 3H and 14C DIC Analyses (this study). .................................................................................................................................................................... 81 Figure 34. Stable Isotopes of Water Plot of Northeastern Colorado 2017 NORM Study Samples ....................... 83 Figure 35. Stable Isotopes of Water Plot of NORM 2017 Northwest CO samples (this study) ............................. 84 Figure 36. Stable Isotopes of Water Plot of NORM 2017 Samples with Na/Cl Molar Ratio >1.29 ....................... 85 Figure 37. Stable Isotopes of Water NORM 2017 Samples with Cl/Br Mass Ratio >400 and Na/Cl Molar Ratio Similar to Seawater ............................................................................................................................................... 87 Figure 38. Stable Isotopes of Water Plot of NORM 2017 Samples with 3H of Water and 14C in DIC Analyses ..... 88 Figure 39. Reported Water Production from the Four Wells which Produced to Facility 755501 in the 28 Months Prior to and Including the Sampling Event .............................................................................................. 94 Figure 40. Activities of Ra isotopes in Comparison to Chloride Concentration (this study) ............................... 106 Figure 41. Production Formation(s) for Each Sampling Facility and Ranges of 226Ra/228Ra Ratio for NORM 2017 Samples ............................................................................................................................................................... 108 Figure 42. Reported Percentages of Produced Water Disposal by Mechanism in Colorado for 2017 ............... 110

Sampling and Analysis of Naturally Occurring Radioactive Material in Oil and Gas Produced Water
COGCC Special Project 10243 vii
LIST OF TABLES
Table 1. Analytes, Matrices, Methods and Number of Samples Collected ........................................................... 11 Table 2. Summary Statistics for Gross Alpha & Gross Beta ................................................................................... 13 Table 3. Total U Summary ..................................................................................................................................... 19 Table 4. Summary Statistics for 226Ra .................................................................................................................... 20 Table 5. Summary Statistics for 222Rn in H2O ........................................................................................................ 23 Table 6. Summary Statistics for 222Rn in Gas ......................................................................................................... 23 Table 7. Summary Statistics for 210Pb .................................................................................................................... 24 Table 8. Summary Statistics for 210Po .................................................................................................................... 25 Table 9. Summary Statistics for Th ........................................................................................................................ 26 Table 10. Summary Statistics for 228Ra .................................................................................................................. 26 Table 11. Summary Statistics for 224Ra .................................................................................................................. 29 Table 12. Summary Statistics for Gamma Analytes (40K and Man‐Made Nuclides) .............................................. 30 Table 13. Summary Statistics for Uranium‐Related Gamma Analytes .................................................................. 32 Table 14. Summary Statistics for 232Th‐Related Gamma Analytes ........................................................................ 35 Table 15. Summary Statistics for Dissolved Metals (SW6010) .............................................................................. 38 Table 16. Summary Statistics for Total Metals (SW6010) ..................................................................................... 38 Table 17. Summary Statistics for Total Metals (SW6020) ..................................................................................... 39 Table 18. Summary Statistics for Major Anions .................................................................................................... 40 Table 19. Summary Statistics for General Water Quality Parameters .................................................................. 41 Table 20. Comparison of Rulison and This Study Produced Water Screening and Isotopic Data ......................... 61 Table 21. Rulison Source Water and Frac Flowback and COGCC 2017 Comparison ............................................ 62 Table 22. Comparison of Domestic Well Groundwater and Produced Water Thorium Concentrations .............. 64 Table 23. Comparison of CO (this study), PA and PA &NY Ranges of Gross Alpha and Gross Beta Activities in Produced Water Samples ...................................................................................................................................... 68 Table 24. Comparison of CO, PA, NY and TX Ranges of 226Ra, 228Ra and 40K Activities in Produced Water Samples ............................................................................................................................................................................... 70 Table 25. Comparison of CO and PA Ranges of 222Rn Activities in Natural Gas Samples ...................................... 71 Table 26. Comparison of 222Rn activities in Gas and Water Samples (this study) ................................................. 76 Table 27. 3H and 14C in DIC, Water Source of Frac, Time after Frac and % of Frac Returned to Surface as Produced Water (this study) ................................................................................................................................. 91 Table 28. Facilities with Highest Reported Activities by Analyte ........................................................................ 100 Table 29. Activities and Concentrations of Selected Analytes in GWA Niobrara and Codell Produced Water (this study) ................................................................................................................................................................... 103 Table 30. Uranium and Thorium Concentrations in Niobrara and Codell Rocks ................................................ 104 Table 31. Ranges of NORM Radionuclides from IAEA International Compilation and from this Study .............. 104 Table 32. Average Concentrations and Activities of K, Th, and U in Three Types of Sedimentary Rocks ........... 107 Table 33. Produced Water Samples with Lowest and Highest 226Ra/228Ra Activity Ratios (this study) .............. 109

Sampling and Analysis of Naturally Occurring Radioactive Material in Oil and Gas Produced Water
COGCC Special Project 10243 viii
ACKNOWLEDGEMENTS
The COGCC would like to recognize the generous cooperation of the following operators in
supporting this project: Augustus Energy Resources; BP America Production Company; Brown Oil &
Gas; Caerus Piceance, LLC.; Grayhorse Operating; HRM Resources; Kerr McGee Oil & Gas Onshore
L.P.; Kinder Morgan C02; K.P. Kauffman Company; Laramie Energy; Murfin Drilling Company; Noble
Energy, Inc.; PDC Energy, Inc.; Pioneer Natural Resources; Sandridge Exploration & Production;
Stelbar Oil Corporation; TEP Rocky Mountain, LLC.; URSA Operating Company, LLC.; Unit Petroleum
Company; Vanguard Operating, LLC; WPX Energy Production; Ward and Son; Wellington Operating;
and Wiepking‐Fullerton Energy. Many operations staff and environmental staff with operators
assisted at sample collection locations and with logistics, and their time and interest is greatly
appreciated.
Development of the radiochemistry analytical plan benefited greatly from discussions with Bob
Shannon. And special thanks to Emily Wagner for assistance in general editing of and in formatting of
this report.
Sample collection was performed by COGCC environmental staff members who work in all areas of
the state. Particular thanks for their efforts in contacting and coordinating with operators as well as
for their sampling efforts go to Rick Allison, Steven Arauza, Jim Hughes, Jason Kosola, Carlos Lujan,
Kris Neidel, Stan Spencer, and Rob Young. Thanks to Chris Eisinger and Ken Robertson for assistance in querying the COGCC production database. The technical reviews by COGCC staff members Rick,
Allison, John Axelson and Greg Deranleau are greatly appreciated. In particular we appreciate the
interest shown in the project by Jim Grice of the Radioactive Materials Unit at CDPHE.

Sampling and Analysis of Naturally Occurring Radioactive Material in Oil and Gas Produced Water
COGCC Special Project 10243 1
1. INTRODUCTION, PURPOSE, AND APPROACH
The National Research Council (1999) Committee on Evaluation of EPA Guidelines for Exposure to
Naturally Occurring Radioactive Materials states that “All natural media – earth, air, water and biota,
including humans – are radioactive to some degree, and the concentrations of radionuclides in these
media are highly variable, both between and within media.” For this study it is important to
understand the ranges of activities present in groundwater co‐produced with oil and natural gas
(generally referred to as produced water). The Colorado Oil and Gas Conservation Commission
(COGCC) (special project 10243) acquired data to better understand the activities of naturally
occurring radioactive materials (NORM) in Colorado aqueous exploration and production (E&P)
wastes (produced water).
Produced water was chosen for this study as it is the E&P waste produced in greatest volume in
Colorado, and produced water is a waste stream for which the COGCC has primary regulatory
authority. The COGCC production database shows that oil and gas operators reported producing
308,414,523 barrels of water in 2017 (Eisinger and Robertson, personal communication, 2018).
Disposal mechanisms of produced water that may be more likely to result in NORM accumulations in
soils include disposal in pits (lined and unlined) or discharge to surface waters under permit from the
Colorado Department of Public Health and Environment (CDPHE). In 2017 approximately 12% of the
produced water from Colorado oil and gas operations was disposed of in pits, mainly in Washington
and Las Animas counties, or by surface discharge, mainly in Las Animas county. Approximately 85%
(or greater) of the produced water is re‐injected in Underground Injection Control (UIC) wells with
less chance of impacts to soils or shallow groundwater.
A process to obtain representative, precise, and accurate data regarding NORM and other inorganic
analytes in produced water was developed for this study and is described in the study‐specific
sampling and analysis plan (SAP) (COGCC, 2017a). COGCC staff collected 51 aqueous samples and 5
gas samples from 15 producing formations from across the state for this study. COGCC also collected
one shallow groundwater sample (source water for drilling or completions collected prior to use
downhole). Operator cooperation and assistance in accessing production facilities and production
equipment was essential. After sample collection and analyses, COGCC staff conducted geological and
geochemical evaluations to understand what geologic formations and what types of produced water
geochemistry may be associated with relatively greater or lesser activities of NORM. Inorganic
analytes such as metals and anions were also analyzed to aid understanding of geochemical
associations with NORM constituents. Produced water samples were collected from vertical,
directional, and horizontal wells to investigate if drilling techniques are a significant influence on
produced water geochemistry. To examine if completion techniques are a significant influence on
produced water geochemistry, produced water samples were collected from wells, some of which
were completed using hydraulic fracture stimulation techniques, and some that were not.
No risk assessment or exposure modeling related to NORM was done as part of this study, as both are
outside the scope of the project and not within the expertise of COGCC staff. As developed by the
Health Physics Society with respect to all exposure to or potential exposures to ionizing radiation, a
general guidance is to keep exposure to ionizing radiation as low as reasonably achievable (ALARA) in
a workplace environment.

Sampling and Analysis of Naturally Occurring Radioactive Material in Oil and Gas Produced Water
COGCC Special Project 10243 2
The data gathered in this study will provide staff, operators, other agencies, and the public with
summary and detailed NORM‐related analytical data from across Colorado’s oil and gas producing
basins. The ranges of NORM constituent activities are compared to published NORM data from other
states and other nations in an effort to help understand the relative scale of potential impacts. The
study was conducted in order to “investigate, prevent, monitor or mitigate conditions that threaten to
cause or that actually cause a significant adverse environmental impact on any air, water, soil, or
biological resource” and to “gather background or baseline data on any air, water, soil, or biological
resource that the commission determines may be so impacted by the conduct of oil and gas
operations” as described in the Oil and Gas Conservation Act (Colorado Revised Statutes Title 34,
Article 60). Analysis of inorganic components of the produced water (other than NORM) was also
performed so that staff, operators, other agencies, and the public have summary and detailed
inorganic analytical data to better inform about possible impacts from produced water spills/releases.
This special project is responsive to concerns and questions raised in the October 2011 review of
COGCC rules, policies, and practices by the State Review of Oil & Natural Gas Environmental
Regulations (STRONGER). The STRONGER review noted that the COGCC did not have appreciable data
concerning concentrations or activities of radioactive constituents in E&P waste streams in Colorado.
The limited NORM data in COGCC records is because the COGCC has no statutory authority over use
or disposal of radioactive materials. As assigned by the Colorado State Legislature, regulatory
authority over radioactive materials in Colorado lies with the CDPHE in all processes and wastes, even
though COGCC does regulate many other aspects of storage and disposal of E&P wastes along with
requiring remediation of spills or releases of E&P wastes to ensure compliance with thresholds
established by rule.
In 2014 COGCC staff addressed part of the STRONGER review concerns with Special Project 2136
which evaluated drill cuttings, soils into which cuttings had been mixed, and background soils by
analysis of NORM constituents in these matrices (COGCC, 2014b). This project also used a project‐
specific SAP (COGCC, 2014a). The evaluation of NORM constituents in drilling cuttings was a priority
because cuttings from drilling with water based muds have often been land‐disposed under COGCC
purview. Analyses of drill cuttings also presented opportunities to evaluate the activities of uranium
(U) and thorium (Th) and their radioactive progeny in the rocks that are in contact with water, gas,
and oil produced by a well. The rocks in which a well is completed are assumed to be a main source of
NORM in E&P products and wastes that are brought to surface. Activities of NORM constituents in
drill cuttings were found to be similar to or lower than activities of NORM analytes in background
soils in the Wattenberg field.
Prior to this study, two other data sets contained the majority of the NORM constituent analyses
from E&P wastes available to COGCC. Data on radioactivity in gas wells drilled near Project Rulison
(Garfield County) and in wastes from those oil and gas wells is submitted to COGCC by operators in
the area under policies first adopted in 2007 (URS, 2010a). One operator voluntarily provided a data
set containing analyses of selected NORM constituents in produced water from just over 100 coal bed
methane (CBM) wells in the Raton Basin. Before this current study, the Raton Basin dataset gathered
in 1998 was a very high proportion of the Colorado produced water NORM analyses available to the
COGCC.

Sampling and Analysis of Naturally Occurring Radioactive Material in Oil and Gas Produced Water
COGCC Special Project 10243 3
A wide variety of uses for produced water range from options included in current rules such as reuse
in drilling and production activities or dust control. Potential uses not currently listed in COGCC rules
such as fire suppression, agricultural uses, sources of water for aquifer replenishment, or even as
sources of drinking water have been proposed in Colorado or are active in other areas. As many
suggestions about uses of produced water have been voiced to staff or are done in other oil and gas
producing areas, it is useful to better understand the chemistry of water produced from oil and gas
wells.
Treatment of produced water may be needed prior to any of these uses, and such treatment may
produce residuals or wastes that would be regulated under authority of CDPHE and not under COGCC
rules. Characterization of the general inorganic and NORM components of produced water done as
part of this study provides useful information regarding what might end up in treatment residuals.
Produced water is a primary source of NORM that can be also found in sediments and scale in oil and
gas storage or processing facilities. The NORM found in sediments and scale may be considered
technologically enhanced NORM (TENORM) after treatment or processing. Radon (Rn), a gas that is
produced in the decay chain of both Th and U, may be found in the aqueous (waste) as well as in oil
and gas (product) phases brought up from well bores, as illustrated in Figures 1 and 2. When Rn
migrates out of the mix of liquids and gases that are produced from oil and gas wells, as gases by
design do in liquid/gas separators used in‐line at or near wells, then the progeny of Rn (also NORM)
might be more likely found in gas pipelines or further downstream in gas processing facilities. Rn may
also be found dissolved in produced water or in natural gases produced from oil and gas wells. To
better understand the fractionation of the 222Rn isotope between the produced water phase and the
natural gas phase, a subset of samples of natural gas and produced water from the same wells were
analyzed for activities of 222Rn. Radon carried in the gas stream could result in presence of its progeny
in production facilities processing gas but not receiving produced water.
Characterization of NORM constituents in aqueous E&P wastes from basins around the state with
different geologic settings, different producing lithologies, and different drilling and completions
techniques was conducted to better understand what levels of NORM activities are present in water
produced in basins other than the Raton and from geologic formations other than coals. Significant
variations in the geochemistry of produced waters can be present even within waters produced from
the same formations in the same basin. For example, some CBM produced waters from the Raton
Basin have concentrations of total dissolved solids (TDS) as low as 500 milligrams per liter (mg/l)
while a few produced waters in the same formation in the same basin have TDS >25,000 mg/l.
Aqueous wastes from production of gas in tight sandstones of the Williams Fork Formation (Fm.) in
the Piceance Basin of western Colorado will have different geochemical signature than produced
water from wells completed in carbonate mineral bearing chalk and marl zones in the Niobrara Fm. of
the Wattenberg field in northeastern Colorado. The produced water chemistry from each is expected
to reflect those differences in chemistries of the rocks with which the waters are in contact as well as
the source(s) of water in the formations. Analysis of stable isotopes of water together with major ion
compositions of produced water can be used to better understand the sources of water in producing
formations. A broad suite of inorganic water quality parameters other than NORM were also
determined on all water samples collected as part of this study for two reasons. Determination of
general water quality measurements such as pH, TDS, major anions such as chloride, and major

Sampling and Analysis of Naturally Occurring Radioactive Material in Oil and Gas Produced Water
COGCC Special Project 10243 4
cations such as sodium can be used to better understand sources of solutes in produced water and
relationship with NORM activities. Also, the analysis of trace elements including arsenic (As) and
selenium (Se) can provide relevant information about potential impacts to soils or water from spills
and releases of E&P waste.
A project‐specific SAP (COGCC, 2017a) was developed to provide COGCC staff procedures for the
collection of representative aqueous E&P wastes (and one E&P product – natural gas) as well as for
the accurate and precise determination of NORM activity levels in those aqueous wastes and gaseous
products.
Naturally occurring Th and U isotopes, and one radioactive isotope of potassium (K), are present in
many rocks and, together with the progeny produced by the decay of U and Th, are the primary
sources of NORM in E&P wastes (IAEA, 2003). Potassium is estimated to be the eighth most abundant
element (1.84%) in the earth’s crust (Greenwood and Earnshaw, 1997), and its long‐lived, naturally
occurring radioactive isotope (40K) is present as a fraction (0.0117%) of K present in the earth (Meija
et al., 2016; CIAAW, 2017) or approximately 2 milligrams per kilogram (mg/kg) of 40K present on
average in rocks making up the earth’s crust. Although Th and U are estimated to be the 39th (8.1
mg/kg) and 47th (2.3 mg/kg), respectively, most abundant elements in the earth’s crust by
Greenwood and Earnshaw (1997), it is helpful to keep in mind that even small concentrations of
radionuclides may represent a significant amount of radioactivity.
232Th (99.98%) and 238U (99.2742%) are the most abundant isotopes of Th and U in the earth (Meija et
al., 2016; CIAAW, 2017) and are ubiquitous in the earth’s crust with activities dependent on rock type
(IAEA, 2003). 40K and the 23 radionuclides in the Th and U decay chains are the primary NORM
components in E&P wastes. These are listed in Figure 1 (238U) and Figure 2 (232Th) as modified from an
International Atomic Energy Agency (IAEA, 2003) guidance document concerning management of
NORM in E&P wastes. Th and, to a lesser extent U, are thought to be relatively immobile under the
geochemical conditions present in many oil‐producing rocks (Langmuir, 1978; Langmuir and Herman,
1980; Hem, 1992; IAEA, 2003). Two elements found among the decay products of the U and Th decay
chains, radium (Ra) and Rn, tend to be more soluble in water and gas phases, respectively. Thus, Ra
and Rn are likely to be brought to the surface by production activities at oil and gas wells. Radium
isotopes (224Ra, 226Ra and 228Ra) may be found in significant concentrations in waters while isotopes
of Rn gas (222Rn, 220Rn, and other Rn isotopes) are typically found in natural gas as discussed by Hem
(1992) and IAEA (2003). These mobility concepts, illustrated in Figures 1 and 2, are explained in more
detail in the IAEA publication cited (IAEA, 2003). Potassium is relatively soluble in water (Hem, 1992)
and is another potential source of NORM in produced water. The decay of 40K is directly to stable
isotopes of calcium (Ca) by beta decay (89%) and to argon (Ar) through electron capture (11%) and
subsequent gamma emission (National Research Council, 1999), so there are no radioactive progeny
of 40K of concern in this study.
In Colorado, E&P activities for oil and natural gas are conducted in many parts of the state. These
activities include drilling through various subsurface layers of rock that contain U, Th, their decay
products, and K, with the purpose of producing oil and natural gas from those geologic formations.
Rock cuttings brought to the surface by drilling, and waters and gas co‐produced when natural gas
and crude oil are brought to surface, are expected to contain NORM. In addition to Special Project

Sampling and Analysis of Naturally Occurring Radioactive Material in Oil and Gas Produced Water
COGCC Special Project 10243 5
2136, in which rock cuttings from drilling activities in the Greater Wattenberg field of Colorado were
analyzed for NORM activities (COGCC, 2014b), a nationwide 1989 survey (Otto, 1989) was performed
on behalf of the American Petroleum Institute (API) with screening type analyses reported from
multiple sites in five counties in Colorado. Studies from other states were reviewed, and a brief
summary is provided in Section 4.2 with comparisons to data from this study.
Figure 1. Decay Chain of 238U Decay modes are alpha = α and beta = β. Abbreviations for time units as follows: a=year, d=day, min=minute, µs=10‐6 seconds. Modified from IAEA, 2003.
NORM in produced waters from E&P wastes in Pennsylvania (PESI, 2016) were sampled and analyzed,
and the data were used for comparison to data from Colorado E&P wastes collected in the current
study and also from Special Project 2136 (COGCC, 2014b). New sampling and analysis of Pennsylvania
produced water to be used for road spreading was reported recently (Tasker et al., 2018). The United
States Geological Survey (USGS) maintains a database containing produced water analyses from
around the country, and recently they have incorporated gross alpha, gross beta, radon, and radium
activity concentrations in their database (NASE&M, 2016, p.42). Inspection of the USGS data indicates
that the Colorado data contained in the USGS files are from the Raton Basin and currently reside in
the COGCC database. Samples of produced water from New York state oil and gas wells were
analyzed for the presence of several radionuclides by gamma spectroscopy (NYDEC, 1999). Existing
data were compiled and new sampling and analysis of produced water from Texas geothermal and oil

Sampling and Analysis of Naturally Occurring Radioactive Material in Oil and Gas Produced Water
COGCC Special Project 10243 6
and gas wells were summarized in a 1995 (Fisher, 1995) report of the Texas Bureau of Economic
Geology. Existing data were compiled and new sampling and analysis of produced water from
Pennsylvania and New York oil and gas wells was summarized in a 2011 USGS report (Rowan et al.,
2011). The 2011 USGS compilation included the NYDEC (1999) data already summarized. The other
sources of data included in the 2011 compilation include data hand‐compiled from a manual search
of Pennsylvania documents from 2009 and 2010 at Pennsylvania Department of Environmental
Protection (PADEP) offices by USGS staff (Rowan et al., 2011) as well as data from a New York study
(NYDEC, 2009) and a Pennsylvania study (PADEP, 1992).The data available from Pennsylvania, New
York, and Texas are compared to data from this study in Section 4.2 of this report.
For purposes of this study, any water emerging from the well is considered produced water, even if
was previously injected for hydraulic fracturing or is from aqueous liquids added to a wellbore such as
potassium chloride (KCl) brines used to control pressure in wells or for other purposes. Although the
primary focus of the study is the analysis of aqueous E&P wastes from oil and gas‐producing
formations in sedimentary basins across the state, a subset of the sample sites included source water
for drilling and completion activities prior to use downhole, and included sampling and analysis of
water produced soon after hydraulic fracture stimulation, referred to as frac flowback or flowback
fluids.
The numbers of samples collected for this study include:
produced water (50, including 6 duplicates)
fresh source water prior to use downhole(1)
frac flowback (1)
natural gas (5)
Two of the produced water sampling facilities in the Piceance Basin were centralized facilities from
which produced water was predominately reused in drilling or completion activities. Produced water
from any oil and gas well may be recycled and re‐used for enhanced recovery, drilling, or other
approved uses following COGCC Rule 907.c.(3).

Sampling and Analysis of Naturally Occurring Radioactive Material in Oil and Gas Produced Water
COGCC Special Project 10243 7
Figure 2. Decay Chain of 232Th
Decay modes are alpha = α and beta = β. Abbreviations for time units as follows: a=year, d=day, h=hour, min=minute and µs=10‐6 seconds. Modified from IAEA, 2003.

Sampling and Analysis of Naturally Occurring Radioactive Material in Oil and Gas Produced Water
COGCC Special Project 10243 8
2. STUDY IMPLEMENTATION
All samples for this study were collected from existing oil and gas production wells or aqueous fluid
handling facilities with an emphasis on basins and formations from which relatively large volumes of
E&P waste are produced, as documented in COGCC production database since 1999. Figure 3 shows
the locations of samples collected for this study. Source water and flowback samples were collected
opportunistically in an area where wells were being drilled and completed at the time of sampling.
2.1 Sampling Methods
Grab samples were collected from wells or their production facilities from locations outlined below
and based on criteria discussed previously:
Produced water collected directly from well or from phase separators
Produced water collected from storage vessels (such as produced water tanks)
One sample collected from hydraulic fracturing “flow back” operations
One fresh water drilling and hydraulic fracturing water sampled from a process piping sampling port
Two produced water samples collected from process piping at centralized E&P waste management facilities
2.2 Sampling Activities
Sampling activities were performed in accordance with the SAP developed for this project (COGCC,
2017a). The project‐specific SAP provides documentation of the analytes of interest as well as
documentation of the laboratory methods used in the analysis of the specified target list, guidance
for record‐keeping in the field and laboratory, and general quality assurance (QA) practices and
procedures used in the field and laboratory. The names of the facilities sampled as well as
information about geographic locations (public land survey system known as PLSS) are listed in
Appendix 1.
2.3 Analytes and Analytical Methods
Laboratory analyses of aqueous samples include the following parameters, as specified in Table 1:
gross alpha and gross beta
gamma spectroscopy to identify radionuclides present
alpha spectroscopy for uranium (238U, 235U, and 234U) and thorium (232Th, 230Th and 228Th) following chemical separation, if total concentration of Th or U >3 micrograms per liter (µg/l)
liquid scintillation for 222Rn in water samples
224Ra and 226Ra by alpha spectroscopy following chemical separation
228Ra by gas flow proportional counting (GFPC) beta analysis of its short‐lived progeny (228Ac) following chemical separation
alpha spectroscopy following chemical separation of 210Po
liquid scintillation spectrometry following chemical separation of 210Pb
metals analysis (total) of U and Th by inductively couple plasma/mass spectrometry
metals analysis of dissolved phase major cations
analysis of major anions by ion chromatography
analysis of alkalinity by titration
Sampling and Analysis of Naturally Occurring Radioactive Material in Oil and Gas Produced Water
COGCC Special Project 10243 9
analysis of general water quality parameters such as pH, specific conductance, dissolved and suspended solids
stable isotopes of water by isotope ratio mass spectrometry
determination of isotopic carbon ratio of dissolved inorganic carbon (DIC) by isotope ratio mass spectrometry
accelerator mass spectrometry for determination of 14C in DIC (selected samples)
electrolytic enrichment and GFPC of 3H in H2O (selected samples)

Sampling and Analysis of Naturally Occurring Radioactive Material in Oil and Gas Produced Water
COGCC Special Project 10243 10
Figure 3. Sampling Locations Identified by COENV Facility Number A list of facility names and corresponding facility number can be found in Appendix 1.

Sampling and Analysis of Naturally Occurring Radioactive Material in Oil and Gas Produced Water
COGCC Special Project 10243 11
Table 1. Analytes, Matrices, Methods and Number of Samples Collected
Analyte(s) Sample Matrices Analytical Methods
Number of Samples Collected
gross alpha PW/FSW/FFB E900.0 as modified in ALS SOP 702r20, ALS SOP 786r7 (coprecipitation preparation) and 724r12
52*
gross beta PW/FSW/FFB E900.0 as modified in ALS SOP 702r20 and 724r12
234U, 235U, 238U PW/FSW/FFB DOE‐U‐02 as modified in ALS SOP 776r14, 778r14 and 714r13 (if total U>3µg/l)
3 analyzed of 52 collected
228Th, 230Th, 232Th PW/FSW/FFB ASTM D3972 as modified in ALS SOP 776r14, 777r12 and 714r13 (if total Th >3µg/l)
0 analyzed of 52 collected1
210Pb PW/FSW/FFB ALS SOP 704 52*
210Po PW/FSW/FFB ASTM D3972 as modified in ALS SOP 711r10 and 714r13
52*
222Rn PW/FSW/FFB SM 7500‐Rn B as modified in ALS SOP 799r5 and 704r11
52*
222Rn natural gas E903.1 as modified in ALS SOP 783r12 5**
224Ra and 226Ra PW/FSW/FFB E903.0 as modified in ALS SOP 701 52*
228Ra PW/FSW/FFB E904.0 as modified in ALS SOP 749r3 and 724r12
52*
gamma emitters 40K, 137Cs, 208Tl, 212Pb, 212Bi, 214Pb, 214Bi, 226Ra/235U, 228Ac/228Ra, 234mPa 234Th
PW/FSW/FFB E901.1 as modified in ALS SOP 739r12 and 713r14
52*
3H PW/FSW/FFB SOP ‐electrolytic enrichment and GPC of H2 gas 8**
14C of DIC PW/FSW/FFB SOP –accelerator mass spectrometry (AMS) 8**
total metals B, Be, Ca, Cr, Fe, K, Li, Mg, Na, Ni, P, S, Si, V
PW/FSW/FFB SW3010A/SW6010B 52*
total metals Al, Ag, As, Ba, Cd, Co, Cu, Mo, Mn, Na, Pb, Se, Sr, Th, Tl, U, Zn
PW/FSW/FFB SW3010A/SW6020A 52*
dissolved metals Ba, Ca, Fe, K, Mg, Na, Si, Sr
PW/FSW/FFB SW3005A/SW6010B 52*
pH PW/FSW/FFB SW9040 52*
specific conductance PW/FSW/FFB SM2510 B 52*
alkalinity (total, bicarbonate and carbonate) as CaCO3)
PW/FSW/FFB SM2320B 52*
total suspended solids PW/FSW/FFB SM2540 D 52*
total dissolved solids PW/FSW/FFB SM2540 C 52*
Anions Br, Cl, F, SO4
PW/FSW/FFB SW9056 52*
δ18O & δD of H2O PW/FSW/FFB laboratory SOP 51***
δ13C of DIC PW/FSW/FFB laboratory SOP 51***
Note: PW ‐ produced water, FSW ‐ frac source water and FFB ‐ frac flowback fluid, * ‐ 46 primary and 6 field duplicate samples ** ‐ No duplicate samples collected, *** ‐ 46 primary and 5 field duplicate samples. 1Th was not detected ≥3µg/l in any samples so isotopic Th analyses were not triggered

Sampling and Analysis of Naturally Occurring Radioactive Material in Oil and Gas Produced Water
COGCC Special Project 10243 12
3. ANALYTICAL DATA
The analytical data presented and discussed in Section 3 is solely from the samples collected as part of this study. In Sections 4 and 5, data from other sources is compared and contrasted to the analytical data gathered as part of this study. The results discussed in this section and all analytical data gathered as part of this study can be accessed in tabular form through the COGCC environmental database using the Sample Site search tool under the Data tab on the COGCC website by querying the database facility number for each sampling site listed in Appendix 1. Lab reports can also be accessed as images using the sample site query tool to get to the scout card for each sample site sampled as during this study (http://cogcc.state.co.us/data.html#/cogis ). Using the sample site query under the data tab search by facility number provided in Appendix 1 and then by clicking on the docs tab of the scout card for that facility. Hyperlinks to the scout card for each sample site are also present in Appendix 1 in the column containing the facility numbers which lead to sample data that can be downloaded from the scout card as well as laboratory reports that can be downloaded (under the Docs tab). An example of the hyperlink to the scout card from one facility sampled as part of this study is 299153 . Data from 2017 sampling event is part of this study. Other sampling of produced water from this CBM well was performed as parts of other investigations.
3.1 Radiochemistry Results
All water samples were analyzed for radionuclides as shown in Table 1. Gross alpha and gross beta
analyses are not isotope‐specific but provide alpha and beta activity screening data. Uranium isotopic
data for three samples was triggered, and specific isotope data from all water samples for 238U
progeny are discussed below in descending order along the decay scheme from 226Ra, then 222Rn,
followed by 210Pb and 210Bi. At five sites, gas samples were collected for 222Rn analysis so that
comparison to 222Rn activities in water and gas samples from the same sites could be done. Two
progeny of 232Th were analyzed by specific isotope methods as discussed below in descending order
in the decay chain with discussion of 228Ra analyses followed by discussion of 224Ra analyses. Gamma
spectroscopy analyses of all water samples were also completed. Discussion of gamma results are
presented in three parts with 40K and man‐made isotopes presented first, followed by gamma
analysis of U progeny, and finally discussion of gamma analysis of thorium progeny.
3.1.1 Gross Alpha and Gross Beta
Analysis of gross alpha and gross beta activities of each water sample was performed using GFPC
techniques. Samples for gross alpha analysis were prepared using a co‐precipitation step in order to
improve the sensitivity of samples with high concentrations of dissolved solids. All samples were
prepared and counted within four days of collection in an effort to minimize changes in samples due
to in‐growth of isotopes or loss of short‐lived gas phase derived alpha or beta emitters. The
preparation of samples for both analyses involves evaporation to dryness. Any volatile components
such as 222Rn and 220Rn would be lost in the preparation. Thus, both gross alpha and gross beta
activities are from non‐volatile radionuclides only and are reported in units of picoCuries/liter (pCi/l).

Sampling and Analysis of Naturally Occurring Radioactive Material in Oil and Gas Produced Water
COGCC Special Project 10243 13
Table 2. Summary Statistics for Gross Alpha & Gross Beta
gross α gross β
Statistic all samples samples >MDC all samples samples >MDC
Minimum pCi/l 0.1 1.73 0.3 1.98
Median pCi/l 34.1 40.3 62.5 81.5
Mean pCi/l 118.5 130.9 268.8 316.8
Maximum pCi/l 730 730 5,710 5,710
Std. Deviation pCi/l 183.3 188.8 845.0 911.9
n= 52 47 52 44
# U flag included in calculation 5 0 8 0
range of & median MDC of U flag results pCi/l (number of U flag results) 2.6‐3.7, 3.4 (n=5) 1.9‐10.6, 3.7 (n=8)
Table 2 summarizes the ranges of gross alpha and gross beta activities reported by the laboratory for
water samples collected as part of this study. The maximum gross alpha activity detected was
730pCi/l (facility 755523). The minimum activity was <0.1 pCi/l (facility 755658) among samples with
reported activities greater than minimum detectable concentration (MDC). The median gross alpha
activity was 40.3 pCi/l among samples with reported activities >MDC. The gross alpha activity
detected is related to naturally occurring alpha‐emitting radionuclides such as 226Ra, 224Ra, and 210Po
and other alpha emitters (Figures 1 and 2) found in the water samples. Appendix 2 lists the results of
the gross alpha and gross beta analytical procedures for each sample. The appendix also includes two
sigma (Ϭ) total propagated uncertainties (TPU), MDCs, and qualifiers (data flags), if any, that the lab
applied to these results.
The x‐axis of Figure 4 is gross alpha activity in pCi/l. The y‐axis is number of samples with activities in
the given ranges (20pCi/l ranges). The histogram of gross alpha activities (Figure 4) is skewed to the
lower concentrations (to the left of the histogram). The majority of the samples (71%) had reported
gross alpha activities of <100 pCi/l. The clustering of results towards lower gross alpha activities with
a few scattered higher activities indicate that the data in not normally distributed but is likely
representative of the broader population of gross alpha activities in Colorado produced waters.

Sampling and Analysis of Naturally Occurring Radioactive Material in Oil and Gas Produced Water
COGCC Special Project 10243 14
Figure 4. Histogram of Gross Alpha activities y‐axis = number of sample results in each range of 20pCi/l. x‐axis = reported gross alpha activity in units of pCi/l.
Figure 5. Histogram of Gross Beta Activities y‐axis = number of sample results in each range of 40pCi/l. x‐axis = reported gross beta activity in units of pCi/l.

Sampling and Analysis of Naturally Occurring Radioactive Material in Oil and Gas Produced Water
COGCC Special Project 10243 15
The maximum gross beta activity detected was 5,710pCi/l (facility 755645). The minimum activity was
<0.3pCi/l (U flag, facility 215628) among all samples. The median gross beta activity was 81.5 pCi/l
among samples with reported activities >MDC. The x‐axis of Figure 5 is gross beta activity in pCi/l. The
y‐axis is number of samples with activities in the given ranges (40pCi/l ranges). The histogram of gross
beta activities detected (Figure 5) is skewed to the lower concentrations (to the left of Figure 5). The
majority of the samples (67%) had reported gross beta activities of <100pCi/l. The clustering of
results towards lower gross beta activities with a few scattered higher activities indicate that the data
in not normally distributed but is likely representative of the broader population of gross alpha
activities in Colorado produced waters.
The reported gross beta activities are partly related to naturally occurring 228Ra and 40K in the
formation fluids or naturally occurring 40K in waters used for drilling or completion. 40K is one of the
most abundant naturally occurring radionuclides and occurs in clay minerals and other K‐bearing
minerals in shales and in K mineral‐bearing sandstones that make up the bulk of non‐carbonate oil
and gas reservoirs. Potassium may also be present in rocks containing evaporitic minerals such as
sylvite, halite and anhydrite. Other beta emitters that may be present include 210Pb and other beta
emitting radionuclides as shown in Figures 1 and 2. The four samples with gross beta activity
>1000pCi/l all contain elevated levels of potassium which likely comes from dissolution of minerals in
proximity to or in the producing formations itself.
Gross alpha analyses are not isotope‐specific but provide alpha activity screening data. Figure 6
illustrates the ranges of gross alpha activity for each sample collected and provides a broad overview
of gross alpha activities in produced water from across the state. The geologic basins of the state are
labeled on the map, and producing formation(s) from which each sample was collected is included in
abbreviated form along with the facility number of the sampling location. The smallest marker on the
Figure 6 map indicates measured gross alpha activities <15pCi/l, which is the current Colorado
groundwater standard (excluding activities of U and Rn) and is the same as the drinking water
standard for gross alpha activity. The laboratory‐reported gross alpha activities of 16 of the samples
were <15pCi/l.

Sampling and Analysis of Naturally Occurring Radioactive Material in Oil and Gas Produced Water
COGCC Special Project 10243 16
Figure 6. Ranges of Gross Alpha Activities Each facility sampled is captioned with facility number and an abbreviated identification of the formation(s) from which oil and/or gas and water samples were produced. A legend explaining the abbreviated formations names can be found at the end of Appendix 1.

Sampling and Analysis of Naturally Occurring Radioactive Material in Oil and Gas Produced Water
COGCC Special Project 10243 17
Figure 7. Ranges of Gross Beta Activities Each facility sampled is captioned with facility number and an abbreviated identification of the formation(s) from which oil and/or gas and water samples were produced. A legend explaining the abbreviated formations names can be found at the end of Appendix 1.

Sampling and Analysis of Naturally Occurring Radioactive Material in Oil and Gas Produced Water
COGCC Special Project 10243 18
Gross beta analyses are not isotope‐specific but provide beta activity screening data. Figure 7
illustrates the ranges of gross beta activity for each sample collected and provides a broad overview
of gross beta activities in produced water from across the state. The geologic basins of the state are
labeled on the map, and producing formation(s) from which each sample was collected is included in
abbreviated form along with the facility number of the sampling location. The smallest marker on the
Figure 7 map indicates measured gross beta activities <5 pCi/l, which is the current Colorado
groundwater standard for the sum of 226Ra and 228Ra and is the same as the drinking water standard
for combined 226Ra and 228Ra activities. 226Ra is an alpha emitter while 228Ra is a beta emitter and
together with 40K, the two radionuclides are likely the primary beta emitters in many of these
samples. The laboratory‐reported gross beta activities of eight samples were <5 pCi/l. Isotope‐specific
analyses of 226Ra and 228Ra will be presented and discussed in a later section of this report.
Figure 8. Gross Alpha and Gross Beta Activities Plotted versus TDS Concentration x‐axis at bottom is the concentration of TDS of each sample in mg/l and the axis is in a logarithmic scale between 10‐500,000mg/l. Left y‐axis = gross alpha activity of each sample (blue diamonds) and is a logarithmic scale between 0.1‐1,000pCi/l. Right y‐axis = gross beta activity of each sample (green asterisk) and is a logarithmic scale between 1‐10,000pCi/l.
As shown on Figure 8, both gross beta and alpha activities show a general trend of increasing activity
with increasing total dissolved solids concentrations. The scale of the x‐axis for TDS is a logarithmic
scale. Also note that that gross alpha is plotted against the left side y‐axis and that gross beta is
plotted against the right side y‐axis. The left and right side y‐axes have different scales due to
1
10
100
1000
10000
0.1
1
10
100
1000
10 100 1000 10000 100000
Gross Beta (pCi/l)
Gross Alpha (pCi/l)
Total Dissolved Solids (mg/l)
Gross AlphaGross Beta

Sampling and Analysis of Naturally Occurring Radioactive Material in Oil and Gas Produced Water
COGCC Special Project 10243 19
differences in the ranges of measured gross alpha and gross beta activities, and both y‐axes have
logarithmic scales.
3.1.2 Isotopic Analyses of U and 238U Progeny
Uranium isotopic analyses of three water samples were triggered by the presence of total U >3 µg/l.
All water samples were analyzed for four specific isotope analyses (226Ra, 222Rn[aq], 210Pb, and 210Po).
Gas samples were collected at five sites for analysis of 222Rn(g). Specific isotopic analyses of U and 238U progeny for the gas and water samples are discussed in the next sections.
3.1.2.1 234U, 235U, and 238U
The reported U concentration (total by SW6020) of three samples was >3 µg/l, which triggered
isotopic analysis for 234U, 235U, and 238U. Table 3 provides a brief summary of the total U analyses
(SW6020).
Uranium was isolated from the three samples by chemical separation techniques. An isotopic tracer
(232U) was added in a known activity level to each of the samples prior to the chemical separation
process. The use of the tracer allows the lab to determine the efficiency of the separation procedure.
Appendix 3 lists the results of the U isotopic analyses procedures for each sample with total U >3
µg/l. The appendix also includes two Ϭ TPUs, MDCs, and qualifiers (data flags), if any, that the lab
applied to these results.
Table 3. Total U Summary
Statistic Total Uranium
>MDL
Minimum µg/l 0.03
Median µg/l 0.9
Mean µg/l 4.35
Maximum µg/l 23
Std. Deviation µg/l 8.33
n= 7
n of U flag not included in statistics = 45
range of & median MDL of the 45 U flag results µg/l 0.023‐0.75, 0.075
The maximum activity observed of 234U in the three samples for which U isotopic analysis was
triggered is 10 pCi/l (facility 755461) and the minimum activity for 234U was 0.46 pCi/l (facility 439136).
The maximum activity reported for 235U was 0.4 pCi/l (facility 755461). The measured activity of 235U
was below the MDC in the two other samples for which U isotope analysis was conducted. The
maximum activity observed for 238U was 8 pCi/l (facility 755461), and the minimum activity of 238U was
0.038 pCi/l (facility 439136). The sample with the highest total U concentration and highest activities of
the U isotopes analyzed by alpha spectroscopy is a sample from a near surface aquifer used as drilling
and completion source water and is not E&P produced water.

Sampling and Analysis of Naturally Occurring Radioactive Material in Oil and Gas Produced Water
COGCC Special Project 10243 20
The concentration of total U in the other 49 samples were less than the concentration in the three
samples for which isotopic U analysis was triggered by a factor of 3 or greater. It can be assumed that
the activities of U isotopes in the other 49 samples collected as part of the study are less than the
ranges of activities discussed above. For example, the highest MDL of a U flagged result was 0.75 µg/l,
which would equate to a 238U activity of 0.25 pCi/l.
3.1.2.2 226Ra
All water samples were analyzed for 226Ra by alpha spectroscopy. Radium was isolated from the
sample by chemical separation techniques. An isotopic tracer (217At) was added in known activity
level to each of the samples prior to the chemical separation process. The use of the isotopic tracer
allows the lab to determine the efficiency of the separation procedure. Table 4 provides a summary
of 226Ra activities reported by the lab from water samples collected as part of this study. Appendix 4
lists the results of the 226Ra isotopic analysis procedures for each water sample. The appendix also
includes two Ϭ TPUs, MDCs, and qualifiers (data flags), if any, that the lab applied to these results.
Table 4. Summary Statistics for 226Ra
Statistic
226Ra
all samples
samples >MDC
Minimum pCi/l ‐0.0580675 0.14902
Median pCi/l 15.1013 20.80225
Mean pCi/l 52.4 61.8
Maximum pCi/l 376.858 376.858
Std. Deviation pCi/l 83.7 87.9
n= 52 44
n <MDC = 8 0
range of & median MDC of the eight U flag results pCi/l 0.0719‐16.66, 0.351
The maximum activity for 226Ra was reported as 376.8 pCi/l in the Lyons Fm. produced water sample
collected from facility 755645. The minimum 226Ra activity was measured at 0.149 pCi/l in sample
755658 among samples with reported activities >MDC. The median activity observed for all samples
was 20.8 pCi/l among samples with reported activities >MDC. The activity of 226Ra was reported as
<MDC in eight samples.

Sampling and Analysis of Naturally Occurring Radioactive Material in Oil and Gas Produced Water
COGCC Special Project 10243 21
Figure 9. Ranges of 226Ra Activities Each facility sampled is captioned with facility number and an abbreviated identification of the formation(s) from which oil and/or gas and water samples were produced. A legend explaining the abbreviated formations names can be found at the end of Appendix 1. Size of circle at a site is larger with increasing 226Ra activity of sample collected at the facility.

Sampling and Analysis of Naturally Occurring Radioactive Material in Oil and Gas Produced Water
COGCC Special Project 10243 22
Figure 9 illustrates the ranges of 226Ra activity for each sample collected and provides a broad overview of 226Ra activities in produced water from across the state. The 226Ra activities shown here are from the
specific isotope analysis by alpha spectroscopy following chemical separation described in this section. The
geologic basins and producing formation(s) from which each sample was collected is included in
abbreviated form along with the facility number of the sampling location. The smallest marker on the
Figure 9 map indicates measured 226Ra activities <5 pCi/l, which is the current Colorado groundwater
standard for the sum of 226Ra and 228Ra and is the same as the drinking water standard for combined 226Ra
and 228Ra activities. The laboratory reported 226Ra activities of 16 samples (31%) were <5 pCi/l.
All five of the produced water samples from CBM wells had reported 226Ra activities <5 pCi/l. Two of the
CBM‐produced water samples were collected from Raton Basin wells, and the other three were collected
from San Juan Basin wells (includes one well sampled in duplicate). Six produced water samples were
collected from Cretaceous J Sand Fm. wells in eastern Colorado. All of the produced water samples from
eastern Colorado J Sand Fm. wells had reported 226Ra activities <5 pCi/l. 226Ra is a radionuclide that is
progeny of 238U, as shown in Figure 1. In each of the CBM and J Sand Fm. produced water samples, total U
concentrations were reported as not detected with detection limits of 0.075 µg/l. Uranium concentrations
were anticipated to be low in produced water samples due to assumed reducing geochemical conditions
(Hem, 1992; IAEA, 2003). The rocks in contact with the produced water could contain U even if geochemical
conditions limit the solubility in water. As shown in Figure 1, U atoms present in rocks are assumed to be
the source of 226Ra in produced water. In one analysis found in the literature (Levinthal, 2016), total U in
Niobrara Fm. rock samples was 27.9 µg/g or approximately 19 pCi/g of 238U. In the five CBM and six J Sand
Fm. produced water samples with 226Ra activities <5 pCi/l, the rocks in contact with the produced water
may be assumed to have relatively low content of total U and by assumption also have low concentrations
of the most naturally abundant isotope (238U) because of the low activities of the Ra progeny of 238U. A
second factor limiting 226Ra activities in these 11 samples may be the major ion composition of the
produced waters.
The water sample with the highest total U concentration was the shallow groundwater source water
sample collected at facility 755461, which had the second lowest activity of 226Ra of samples with activities
greater than sample‐specific MDC. The same sample had the second highest 222Rn activity of all water
samples collected in this study. 222Rn is the progeny of 226Ra, and both are progeny of 238U. The high 222Rn
activity simultaneous with very low 226Ra activity indicates the presence of Ra in the aquifer solids, even if
very low in the water sample collected perhaps due to the geochemistry of the water sample itself, which
has dominant anions of sulfate and bicarbonate alkalinity unlike many of the produced waters, which are
more frequently dominated by chloride anions.
3.1.2.3 222Rn (in H2O)
All water samples were analyzed for 222Rn by liquid scintillation counting. An aliquot of each water sample
was mixed with scintillation cocktail and then counted. Table 5 provides a summary of 222Rn activities
reported by the lab from water samples collected as part of this study. Appendix 4 lists the results of the 222Rn analyses for each water sample. The appendix also includes two Ϭ TPUs, MDCs, and qualifiers (data
flags), if any, that the lab applied to these results.

Sampling and Analysis of Naturally Occurring Radioactive Material in Oil and Gas Produced Water
COGCC Special Project 10243 23
Table 5. Summary Statistics for 222Rn in H2O
Statistic
222Rn in H2O
all samples
samples >MDC
Minimum pCi/l ‐22 32
Median pCi/l 24 74.5
Mean pCi/l 58.3 136.6
Maximum pCi/l 681 681
Std. Deviation pCi/l 117.1 161.1
n= 52 20
n <MDC = 32 0
range of & median MDC of the 32 U flag results pCi/l 26‐44, 34
The maximum activity for 222Rn was reported as 681 pCi/l in facility 755645. 222Rn is the direct progeny of 226Ra, and the reported activity of 226Ra in the same sample was also the highest among all samples
collected as part of this study. The minimum activity was reported as 32 pCi/l in facility 215628 for samples
with activities >MDC. The median activity observed for samples with activities >MDC was 74.5 pCi/l. The
reported activities of 32 water samples were <MDC.
3.1.2.4 222Rn (in Gas Samples)
Five natural gas samples were collected as part of this study. Each of the gas samples was analyzed for 222Rn
by direct counting in an alpha scintillation cell. Table 6 provides a summary of 222Rn activities reported by
the lab from gas samples. Appendix 5 lists the results of the 222Rn analyses for each natural gas sample. The
appendix also includes two Ϭ TPUs, MDCs, and qualifiers (data flags), if any, that the lab applied to these
results.
Table 6. Summary Statistics for 222Rn in Gas
Statistic 222Rn in Gas
Minimum (pCi/l) 17.5
Median (pCi/l) 46
Mean (pCi/l) 61.2
Maximum (pCi/l) 150
Std. Deviation (pCi/l) 53.9
n= 5
The maximum activity for 222Rn in gas was reported as 150 pCi/l in facility 755501. The minimum activity was
reported as 17.5 pCi/l in facility 755474. The median activity reported for all gas samples was 46 pCi/l.

Sampling and Analysis of Naturally Occurring Radioactive Material in Oil and Gas Produced Water
COGCC Special Project 10243 24
3.1.2.5 210Pb
All water samples were analyzed for 210Pb by liquid scintillation counting. 210Pb was isolated from the
sample by chemical separation techniques. Lead (Pb) was added in a known concentration level to each of
the samples prior to the chemical separation process. The use of the chemical tracer allows the lab to
determine the efficiency of the separation procedure. Table 7 provides a summary of 210Pb activities
reported by the lab from water samples collected as part of this study. Appendix 4 lists the results of the 210Pb isotopic analysis procedures for each water sample. The appendix also includes two Ϭ TPUs, MDCs,
and qualifiers (data flags), if any, that the lab applied to these results.
Table 7. Summary Statistics for 210Pb
Statistic
210Pb
all samples
samples >MDC
Minimum pCi/l ‐3.7 0.71
Median pCi/l 0.265
Mean pCi/l 5.90
Maximum pCi/l 253 253
Std. Deviation pCi/l 35.3
n= 52 4
n <MDC = 48 0
range of & median MDC of the 48 U flag results pCi/l 0.56‐8.1, 0.81
The maximum activity reported for 210Pb was reported as 253 pCi/l in Lyons Fm. produced water sampled at
facility 755645. The minimum activity was reported as 0.71 pCi/l in facility 755657. The activities reported by
the lab for 48 samples were <MDC. No mean or median calculation are included for the four samples in
which the 210Pb activity exceeded the MDC due to the small population of activities reported as >MDC.
3.1.2.6 210Po
All water samples were analyzed for 210Po by alpha spectroscopy. Polonium was isolated from the sample
by chemical separation techniques. An isotopic tracer (209Po) was added in a known activity level to each of
the samples prior to the chemical separation process. The use of the isotopic tracer allows the lab to
determine the efficiency of the separation procedure. Table 8 provides a summary of 210Po activities
reported by the lab from water samples collected as part of this study. Appendix 4 lists the results of the 210Po isotopic analysis procedures for each water sample. The appendix also includes two Ϭ TPUs, MDCs,
and qualifiers (data flags), if any, that the lab applied to these results.

Sampling and Analysis of Naturally Occurring Radioactive Material in Oil and Gas Produced Water
COGCC Special Project 10243 25
Table 8. Summary Statistics for 210Po
Statistic
210Po
All Samples
samples >MDC
Minimum pCi/l ‐0.2 0.2
Median pCi/l 0.29 0.88
Mean pCi/l 1.79 8.30
Maximum pCi/l 72 72
Std. Deviation pCi/l 9.96 22.4
n= 52 10
n <MDC = 42 0
range of & median MDC of the 42 U flag results pCi/l 0.3‐56, 0.76
The maximum activity for 210Po was reported as 72 pCi/l in Lyons Fm. produced water collected at facility
755645. The minimum activity was reported as 0.2 pCi/l in facility 755590 in samples with activities >MDC.
The median activity observed for samples with activities >MDC was 0.8 pCi/l. The reported activities of 42
water samples were <MDC.
3.1.3 Isotopic Analyses of Th and 232Th Progeny
No thorium isotopic analyses of three water samples were triggered by the presence of total Th >3 µg/l.
Two specific isotope analyses of 232Th progeny were performed on all water samples (228Ra and 224Ra), and
the results are presented in sections 3.1.3.2 and 3.1.3.3.
3.1.3.1 228Th, 230Th, and 232Th
The reported concentration of Th (total by SW6020) in all samples was <3 µg/l. No analyses of the isotopic
composition of Th were triggered because of the relatively low reported concentrations of Th in water
samples collected as part of this study. The presence of Th (total) was reported as greater than the lab’s
sample‐specific method detection limit in only three water samples. The maximum reported sample‐
specific detection limit was 0.96 µg/l total Th as illustrated in Table 17.
Table 9 provides a brief summary of the total U analyses (SW6020). The maximum reported total Th
concentration of 0.31 µg/l would result in a 232Th activity of 0.034 pCi/l. The 232Th activity of all samples
would be <0.11 pCi/l from the highest not detected concentration of 0.96 µg/l.

Sampling and Analysis of Naturally Occurring Radioactive Material in Oil and Gas Produced Water
COGCC Special Project 10243 26
Table 9. Summary Statistics for Th
Statistic Total Thorium
>MDL
Minimum µg/l 0.04
Median µg/l
Mean µg/l
Maximum µg/l 0.31
Std. Deviation µg/l
n= 3
n of U flag not included in statistics = 49
range of & median MDL of the 49 U flag results µg/l 0.025‐0.96, 0.091
3.1.3.2 228Ra
All water samples were analyzed for 228Ra by GFPC of the 228Ac progeny of 228Ra. Radium was isolated from
the sample by chemical separation techniques. Barium was added in a known concentration level to each
of the samples prior to the chemical separation process. The use of the chemical tracer allows the lab to
determine the efficiency of the separation procedure. Table 10 provides a summary of 228Ra activities
reported by the lab. Appendix 6 lists the results of the 228Ra isotopic analysis procedures for each water
sample. The appendix also includes two Ϭ TPUs, MDCs, and qualifiers (data flags), if any, that the lab
applied to these results.
Table 10. Summary Statistics for 228Ra
Statistic
228Ra
all results >MDC
Minimum pCi/l ‐0.18 0.94
Median pCi/l 6.1 9.65
Mean pCi/l 14.20 18.29
Maximum pCi/l 221 221
Std. Deviation 31.84 35.37
n= 52 40
n <MDC included in statistics above= 12 0
range of & median MDC of the 12 U flag results pCi/l 0.63‐1.79, 0.705
The maximum activity for 228Ra was reported as 221 pCi/l in facility 755645. The minimum activity was
reported as 0.94 pCi/l in facility 755593 in samples with activities >MDC. The median activity observed for
samples with activities >MDC was 9.65 pCi/l. The reported activities of 12 water samples were <MDC.

Sampling and Analysis of Naturally Occurring Radioactive Material in Oil and Gas Produced Water
COGCC Special Project 10243 27
Figure 10 illustrates the ranges of 228Ra activity for each sample collected and provides a broad overview of 228Ra activities in produced water from across the state. The 228Ra activities shown here are from the
specific isotope analysis by GFPC following chemical separation previously described in this section. The
geologic basins and producing formation(s) from which each sample was collected is included in
abbreviated form along with the facility number of the sampling location. The smallest marker on the
Figure 10 map indicates measured 228Ra activities <5 pCi/l, which is the current Colorado groundwater
standard for the sum of 226Ra and 228Ra, and is the same as the drinking water standard for combined 226Ra
and 228Ra activities. The laboratory reported 228Ra activities of 23 samples (44%) were <5 pCi/l.
All five of the produced water samples from CBM wells had reported 228Ra activities <5 pCi/l. Two of the
CBM produced water samples were collected from Raton Basin wells, and the other three CBM produced
water samples were collected from San Juan Basin wells (includes one well sampled in duplicate). Six
produced water samples were collected from Cretaceous J sand wells in eastern Colorado. Five of the six
produced water samples from eastern Colorado J sand wells had reported 228Ra activities <5 pCi/l. 228Ra is a
radionuclide that is progeny of 232Th as shown previously in Figure 2. In each of the CBM and J sand
produced water samples, total Th concentrations were reported as not detected with detection limits of
0.091 µg/l. Thorium concentrations were anticipated to be low in produced water samples due to the very
low solubility of thorium in most aqueous systems (Langmuir and Herman, 1980).
The rocks in contact with the produced water may have significant concentrations of Th even if solubility
limits the concentration of Th in produced water. One analysis found in the literature (Levinthal, 2016) of
total Th in Niobrara Fm. rock samples was 5.2 µg/g or approximately 0.6 pCi/g of 232Th. As shown in Figure
2, Th atoms present in rocks are presumed to be the source of 228Ra in produced water, in that 232Th in
minerals undergoes alpha decay to 228Ra, which is considered to be more soluble in water than the Th
parent nuclide. In the cases of the five CBM and five J sand produced water samples with 228Ra activities <5
pCi/l, the rocks in contact with the produced water may be assumed to have relatively low content of total
Th and by assumption also have low concentrations of the most naturally abundant isotope (232Th) because
of the low activities of the Ra progeny of 232Th. A second factor limiting 228Ra activities in these ten samples
may be the major ion composition of the produced waters, which are of relatively low dissolved solids
concentration. The TDS concentration of nine of the ten samples is <5,000 mg/l. In all ten of the samples
with 228Ra activities <5 pCi/l, the TDS concentration is <10,000 mg/l and less than the median TDS
concentration of samples (11,000 mg/l).

Sampling and Analysis of Naturally Occurring Radioactive Material in Oil and Gas Produced Water
COGCC Special Project 10243 28
Figure 10. Ranges of 228Ra Activities Each facility sampled is captioned with facility number and an abbreviated identification of the formation(s) from which oil and/or gas and water samples were produced. A legend explaining the abbreviated formations names can be found at the end of Appendix 1. Size of circle at a site is larger with increasing 228Ra activity of sample collected at the facility.

Sampling and Analysis of Naturally Occurring Radioactive Material in Oil and Gas Produced Water
COGCC Special Project 10243 29
3.1.3.3 224Ra
All water samples collected as part of this study were analyzed for 224Ra by alpha spectroscopy.
Radium was isolated from the sample by chemical separation techniques. An isotopic tracer (217At)
was added in a known activity level to each of the samples prior to the chemical separation process.
The use of the isotopic tracer allows the lab to determine the efficiency of the separation procedure.
Table 11 provides a summary of 224Ra activities reported by the lab. Appendix 6 lists the results of the 224Ra isotopic analyses procedures for each sample. The appendix also includes two Ϭ TPUs, MDCs,
and qualifiers (data flags), if any, that the lab applied to these results.
Table 11. Summary Statistics for 224Ra
The maximum activity of 224Ra was reported as 78.0933 pCi/l in sample 755657. The minimum activity
in samples with activities >MDC was reported as 0.51125 pCi/l in sample 755461. The median activity
observed for samples with activities >MDC was 9.65 pCi/l. The reported activities of 32 water samples
were <MDC.
3.1.4 Analysis by Gamma Spectrometry
Gamma spectroscopic analyses of water samples were performed to identify and quantify gamma‐
emitting radionuclides using specific libraries that include members of 232Th and 238U decay chains, as
well as 235U, 137Cs, and 40K. The thorium decay chain radionuclides include 208Tl, 212Pb, 212Bi, and 228Ra/Ac. Uranium decay chain radionuclides include 214Bi, 214Pb, 234mPa, 234Th, and 226Ra. Although it
contributes only modestly to the overall activity of NORM mixtures, 235U, the head of the third
natural decay chain, the actinium chain, emits an intense gamma ray. Note that 137Cs is not expected
in samples but rather it is included as a reference nuclide against which relative detection capability is
assessed. The presence of 235U in samples can interfere with the analysis of 226Ra by gamma
spectroscopy due to the near coincidence in their gamma ray energies.
Several gamma spectrometry analytes in aqueous matrices that are routinely requested of and
performed by laboratories may produce unreliable results. The analyses of the potentially unreliable
results are being requested here as screening for 214Pb and 214Bi and to allow assessment of data
quality relative to definitive isotope‐specific tests for Ra and U isotopes. They include:
Statistic
224Ra
all results >MDC
Minimum pCi/l ‐4.89899 0.51125
Median pCi/l 3.95378 16.1393
Mean pCi/l 10.45 19.90
Maximum pCi/l 78.0933 78.0933
Std. Deviation 16.08 18.51
n= 52 20
n <MDC included in statistics above= 32 0
range of & median MDC of the 32 U flag results pCi/l 0.759‐102.7, 13.76

Sampling and Analysis of Naturally Occurring Radioactive Material in Oil and Gas Produced Water
COGCC Special Project 10243 30
226Ra, 228Ra, and 235U – Due to relatively low sensitivity by gamma spectrometry, results for these radionuclides may show very high uncertainty until they are present in high concentration. Isotopic determinations of 226Ra, 228Ra and 235U (when performed) are considered to be the definitive results and the gamma spectrometry measurements as supporting data.
226Ra – Determinations for 226Ra by gamma spectroscopy are not specific for this radionuclide and may exhibit high errors in precision and accuracy due to spectral interferences. Results are used in this study only as qualitative indicators of the possible presence of 226Ra in samples, and a more definitive isotope‐specific testing for 226Ra was performed on all samples.
214Pb and 214Bi – These two isotopes are frequently used as indicators of 222Rn in samples. These results are unreliable since water samples for gamma analysis are generally not managed to protect against loss of radon during sampling, transport, storage, preparation, and analysis.
3.1.4.1 40K and Man‐Made Nuclides
Each of the water samples collected in this study was analyzed for 40K, 60Co, 137Cs and, 241Am by
gamma spectroscopy with direct counting. Table 12 provides a summary of reported activities for 40
and man‐made radionuclides. Appendix 7 lists the results of the gamma analysis for these analytes
for each water sample. The appendix also includes two Ϭ TPUs, MDCs, and qualifiers (data flags), if
any, that the lab applied to these results.
Table 12. Summary Statistics for Gamma Analytes (40K and Man‐Made Nuclides)
Statistic
40K 60Co 137Cs 241Am
all samples
samples>MDC
Minimum pCi/l ‐74 338
Median pCi/l 14
Mean pCi/l 138.7
Maximum pCi/l 2,840 2,840
Std. Deviation pCi/l 448.1
n= 52 5
n <MDC or NQ = 47 52 52 52
range of & median MDC of the U flag results pCi/l 71‐230, 62 5.2‐13.7, 8.8 4.9‐10, 7.55 6.4‐360, 56
Only 5 of the 52 samples collected for 40K analysis had activities above the MDC. The maximum
activity reported was in facility 755645 at 2,840 pCi/l, and the minimum reported 40K activity in samples
with activities >MDC was 338 pCi/l in facility 755659. No activities greater than the sample‐specific
MDC were reported for man‐made radionuclides in samples collected as part of this project. Thus, no
statistics except for those related to sample‐specific MDC are included in Table 12 for 60Co, 137Cs, and 241Am.
As discussed earlier, the major source of 40K in the produced water samples is from K‐bearing
minerals of rocks the water has been in contact with (such as clays, feldspars, and evaporite minerals)
and with other possible contributions when KCl brines have been used in drilling, completions and
workover operations. Figure 11 shows the strong correlation of 40K activities with K total metals

Sampling and Analysis of Naturally Occurring Radioactive Material in Oil and Gas Produced Water
COGCC Special Project 10243 31
analytical concentrations for the five samples with 40K activities >MDC by gamma analysis. Two of the
five samples are from CO2 wells in Montezuma County completed in Mississippian Leadville
Limestone. Two of the five were from oil and gas wells in southeastern Colorado (Lincoln County)
with one completed in the Mississippian Osage Limestone and one completed in the Pennsylvanian
Cherokee Fm. The last of the five was from an oil well in Weld County completed in the Permian
Lyons Fm. COGCC records indicated that none of the five wells with the highest 40K activities in
produced water were completed using hydraulic fracturing techniques. The five facilities with
detectable 40K activities in produced water samples from this study also were reported by the lab to
have the highest five concentrations of total K determined by SW6010 analysis.
Produced water from facility 755645 had the highest reported gross beta activity as well as the highest
activity of 40K. Other beta emitters for which analyses were performed include progeny of 238U (234Th, 234mPa, 214Pb, 214Bi, 214Po, 210Pb, and 210Bi) and progeny of 232Th (228Ra, 228Ac, 212Pb, 212Bi, and 208Tl) as
shown in Table 1. Other beta emitters reported above the sample‐specific MDCs in produced water
samples from facility 755645 included 214Pb, 214Bi, 210Pb, 228Ra, 228Ac, and 212Pb.
Figure 11. 40K and Gross Beta Activities in Comparison to K Concentration
x‐axis at bottom is the concentration of potassium of each sample in mg/l. Left y‐axis = activity 40K in each sample (blue asterisk). Right y‐axis = gross beta activity of each sample (orange diamond). Each axis is plotted in arithmetic scales.
R² = 0.9838
R² = 0.9911
0
1000
2000
3000
4000
5000
6000
0
1000
2000
3000
4000
5000
6000
0 1000 2000 3000 4000 5000 6000
gross beta pCi/l
40K pCi/l
K (total SW6010) mg/l
40K
Gross Beta

Sampling and Analysis of Naturally Occurring Radioactive Material in Oil and Gas Produced Water
COGCC Special Project 10243 32
3.1.4.2 238U Progeny and 235U
Each of the water samples collected in this study was analyzed for 235U as well as for 234Th, 234mPa, 226Ra, 214Pb, and 214Bi by gamma spectroscopy with direct counting. 234Th, 234mPa, 226Ra, 214Pb, and 214Bi are progeny of the most abundant U isotope (238U). A summary of uranium‐related gamma
analytes is in Table 13. Appendix 8 lists the results of the gamma analysis for these analytes for each
water sample. The appendix also includes two Ϭ TPUs, MDCs, and qualifiers (data flags), if any, that
the lab applied to these results.
The gamma spectroscopy determined activities of 235U, 234Th, and 234mPa in water samples collected as
part of this study were reported as less than the sample‐specific MDC for all water samples. The
sample‐specific MDCs can be found in Appendix 8. No summary statistics for these three analytes
except for those related to sample‐specific MDCs are included in Table 13. Three water samples were
analyzed for activities of 235U by chemical separation followed by alpha spectroscopy, and this
analysis was discussed previously with data presented in Appendix 11. The highest reported alpha
spectroscopy activity of 235U was 0.4 pCi/l which is far less than any of the sample‐specific MDCs for 235U by gamma spectroscopy.
Table 13. Summary Statistics for Uranium‐Related Gamma Analytes
235U 234Th 234mPa 226Ra 214Pb 214Bi
all samples all samples all samples
Statistic samples >MDC samples >MDC samples >MDC
Minimum pCi/l ‐400 156 ‐10 26 ‐9 25
Median pCi/l 30 280 8 49 11 54
Mean pCi/l 57.2 267.7 21.1 63.5 20.9 66.1
Maximum pCi/l 400 390 121 121 119 119
Std. Deviation pCi/l 125.4 81.9 32.3 36.3 30.8 35.7
n= 52 52 52 52 7 52 14 52 12
n<MDC or flagged NQ 52 52 52 45 38 40
range of & median MDC of the U flag results pCi/l
18‐76, 39
44‐300, 156
830‐2000, 1350 116‐2000, 190 7.3‐32, 20 13.7‐40, 25
The maximum activity for 226Ra by gamma spectroscopy was reported as 390 pCi/l in facility 755645.
The minimum 226Ra activity in the seven samples in which activities were >MDC was reported as 156
pCi/l in facility 755661. The median activity reported for all samples with activities >MDC was 280
pCi/l. All of the 226Ra results by gamma spectroscopy were flagged a qualifier of SI indicating possible
spectral interference. The SI flag indicates the gamma spectroscopy results for 226Ra may have a high
bias when analyzed at the 186.21 kiloelectron volts (keV) utilized in these analyses. The positive
interference could be present from the 185.72 keV photopeak of 235U if that isotope is present in the
samples at significant activities. The median MDC reported by the lab for the gamma analysis of 226Ra
in samples from this project was 232 pCi/l. The mean MDC reported by the lab for the chemical

Sampling and Analysis of Naturally Occurring Radioactive Material in Oil and Gas Produced Water
COGCC Special Project 10243 33
separation followed by alpha spectroscopy analysis of 226Ra was 2.9 pCi/l. The gamma spectroscopy 226Ra activities were greater than the sample‐specific MDC in 7 of the 52 samples. The alpha
spectroscopy 226Ra activities were greater than the sample‐specific MDC in 44 of the 52 samples.
Due to the relatively low sensitivity by gamma spectrometry, results for 226Ra may show very high
uncertainty until they are present in high concentration. Isotopic determinations of 226Ra by alpha
spectroscopy following chemical separation are considered to be the definitive results with 40 out of
52 alpha spectroscopy 226Ra activities reported as greater than the sample‐specific MDC (Appendix 8).
The less sensitive gamma spectrometry measurements with 7 of 52 gamma spectroscopy 226Ra
activities greater than sample‐specific MDCs are considered as supporting data in this study.
Figure 12. Comparison of 226Ra Activities by Two Analytical Methods
The isotope‐specific analyses utilizing chemical separation and alpha spectroscopy analysis of 226Ra
activities were discussed in a previous section of this report. Figure 12 includes measured activities
for 226Ra utilizing the two analytical approaches described previously for all seven samples in which 226Ra was reported as greater than sample‐specific MDCs by the less sensitive gamma spectroscopy
method. Error bars representing the laboratory‐reported 2σ TPU associated with each result are
plotted. Pairs of reported activities from each of the seven samples are similar when including the
associated analytical uncertainty. Facility 755523 was sampled in duplicate in the field.
The maximum activity reported for 214Pb as determined by gamma spectroscopy is 121 pCi/l in facility
755541. The minimum reported activity in samples with activities >MDC is 26 pCi/l in facility 755500.
377
276
220
219
142
125
115
390
288
320
280
170
156
270
0
100
200
300
400
500
600
755645 755659 755523 755523 755648 755661 755522
226Ra activity pCi/l
Facility Number
226Ra activity following chemical separation and alpha spectroscopy analysis, 226Ra activity by gamma spectroscopy analysis,vertical error bars represent analytical 2σ TPU

Sampling and Analysis of Naturally Occurring Radioactive Material in Oil and Gas Produced Water
COGCC Special Project 10243 34
The median activity of samples with reported activities >MDC is 49 pCi/l. 214Pb activities were
reported as greater than the sample‐specific MDC in 14 of the 52 samples.
The maximum activity for 214Bi reported is 119 pCi/l in facility 755541. The minimum reported activity
from samples with reported activities >MDC is 25 pCi/l in facility 755657. The median activity observed
for all samples with reported activities >MDC is 56 pCi/l.
Figure 13. Comparison of 222Rn Activities versus Gamma Spectroscopy 214Pb and 214Bi Activities
As discussed above the presence of 214Pb and 214Bi are frequently used as indicators of the presence
of 222Rn in samples. Direct measurements of 222Rn were performed in all water samples collected as
part of this study. The liquid scintillation results for 222Rn are considered to be more definitive
indicators of the activity of 222Rn than are the gamma analysis for the radon progeny since water
samples for gamma analysis are generally not managed to protect against loss of radon during
sampling, transport, storage, preparation, and analysis. The gamma‐based activities for 214Pb and 214Bi are decay‐corrected based on the assumption that these progeny of 226Ra are in secular
equilibrium with the parent radium nuclide. Loss of the gaseous intermediate radionuclide 222Rn
during gas phase separation from produced water near the wellhead or during sampling and sample
handling invalidates the assumption of secular equilibrium, which likely causes the decay corrected
gamma spectroscopy‐based 214Pb and 214Bi activities to be erroneous.
Figure 13 includes data from all nine samples for which activities of 222Rn (by liquid scintillation) and 214Pb and 214Bi (both by gamma spectroscopy) were simultaneously greater than sample‐specific
0
20
40
60
80
100
120
140
0 100 200 300 400 500 600 700 800
214Pban
d 214Bi p
Ci/l
222Rn pCi/l
214Pb
214Bi

Sampling and Analysis of Naturally Occurring Radioactive Material in Oil and Gas Produced Water
COGCC Special Project 10243 35
MDCs. The sample with the highest 222Rn activity, which plots to the right of the chart, arguably
should also have the highest activities of 214Pb and 214Bi under ideal sampling, storage, and analytical
conditions. If samples are homogenous and no loss of radon gas occurs from the sample analyzed by
gamma spectroscopy, then one would expect the 214Pb and 214Bi activities to be several times greater
than were reported by the lab for this sample.
3.1.4.3 Th Progeny
Each of the water samples collected in this study was analyzed for 228Ra, 228Ac, 212Pb, and 212Bi by
gamma spectroscopy with direct counting. Each of these radionuclides is the progeny of the most
abundant Th isotope (232Th). A summary of reported activities of thorium‐related gamma analytes is
in Table 14. Appendix 9 lists the results of the gamma analysis for these analytes for each water
sample. The appendix also includes two Ϭ TPUs, MDCs, and qualifiers (data flags), if any, that the lab
applied to these results. Summary statistics for these thorium‐derived gamma analytes are in Table
14.
Table 14. Summary Statistics for 232Th‐Related Gamma Analytes
Statistic
228Ra 228Ac 212Pb 212Bi
all samples
samples>MDC
all samples
Samples >MDC
all samples
samples >MDC
all samples
Minimum ‐11 35 ‐11 35 ‐5 18
Median 19 39.5 19 39.5 4
Mean 22.1 71 22.1 71 5.2
Maximum 229 229 229 229 29 29
Std. Deviation 32.4 77.5 32.4 77.5 6.6
n= 52 6 52 6 52 3 0
n<MDC or NQ flag included in statistics 46 0 46 0 49 0 52
range of & median MDC of the U flag results pCi/l 22‐58, 35.5 9.2‐20, 14.3
67‐153, 106
The gamma spectroscopy 228Ra activities are derived from emissions of the short‐lived 228Ac progeny
of 228Ra (Figure 2) based on an assumption that these two nuclides are in secular equilibrium. The
reported activities for these two radionuclides are identical for each sample as seen in Appendix 9.
The maximum gamma spectroscopy activity for 228Ra was reported as 229 pCi/l in facility 755645. The
minimum reported activity from samples with reported activities >MDC is 35 pCi/l in facility 755462.
The median activity observed for all samples with reported activities >MDC is 39.5 pCi/l. No separate
discussion of 228Ac gamma results is presented since the data is identical to the 228Ra data discussed.

Sampling and Analysis of Naturally Occurring Radioactive Material in Oil and Gas Produced Water
COGCC Special Project 10243 36
Figure 14. Comparison of 228Ra Activities by Two Analytical Methods
Due to relatively low sensitivity by gamma spectrometry, results for 228Ra may show very high
uncertainty until they are present in high concentration. Isotopic determinations of 228Ra by GFPC
following chemical separation are considered to be the definitive results and the gamma
spectrometry measurements as supporting data. The isotope‐specific analyses utilizing chemical
separation and GFPC analysis of 228Ra activities were discussed in a previous section of this report
with data in Appendix 9. Figure 14 includes measured activities for 228Ra utilizing the two analytical
approaches described previously for the six samples in which 228Ra was reported as greater than
sample‐specific MDCs by gamma spectroscopy. Error bars representing the laboratory reported 2σ
TPU associated with each result are plotted.
Pairs of reported activities from four of the six samples (755462, 755522, 755657, and 755645) are similar
when associated analytical uncertainties are included. The sample results of the two analytical
methods including lab estimated analytical uncertainty for two of the samples (439136 and 755468) are
not similar. Samples from facility 439136 and 755648 have the lowest isotope‐specific 228Ra activity of
the six, and relatively low sensitivity and high uncertainty of the second analytical technique (gamma
spectroscopy) discussed previously may be a cause of the discrepancy between 228Ra activities seen in
these two samples. The gamma 228Ra activity for sample 755648 was flagged as TI (tentative
identification) due to a poor spectral match to reference spectra which may indicate the gamma 228Ra
activity for this sample may be biased high.
27.9
38
2 40.3
17.2
22135 47
36 39 40
229
0
50
100
150
200
250
300
755462 755522 439136 755657 755648 755645
228Ra acivity pCi/l
Facility
228Ra activity following chemical separation and GFPC analysis, 228Ra activity by gamma spectrocopy analysis,

Sampling and Analysis of Naturally Occurring Radioactive Material in Oil and Gas Produced Water
COGCC Special Project 10243 37
The maximum gamma spectroscopy activity for 212Pb was reported as 29 pCi/l in facility 755646. The
minimum reported activity from samples with reported activities >MDC is 18 pCi/l in facility 755647.
Activities of 212Pb >MDC were reported in three samples and no median, mean of standard deviation
are presented due to the small number of results greater than sample‐specific MDC.
The activities of 212Bi were reported as less than the sample‐specific MDC for all water samples. The
sample‐specific MDCs can be found in Appendix 9. No summary statistics for 212Bi except for those
related to sample‐specific MDC are included in Table 14.
The lab calculates activities for 212Pb and 212Bi based on an assumption that these two radionuclides
are in secular equilibrium with the long‐lived parent isotope of 232Th. Because of potential losses of
gaseous intermediate nuclide (220Rn) during separation of water and hydrocarbons in production
equipment as well as possible losses of radon in sampling, storage, and analysis of water samples, the
assumption that the samples are in secular equilibrium is not supported by the analytical date
available in this study.
3.2 General Water Quality Parameters
All water samples collected were analyzed for metals and general water quality parameters.
Gathering overall water chemistry information is important to understanding the sources of water
and the solutes, such as the NORM constituents contained in the water samples.
3.2.1 Metals Including U and Th
All water samples were analyzed for major and trace elements composition. Major elements were
analyzed as dissolved (filtered <0.45 µm) and total fractions. Trace elements such as As, Cd, Pb, Se,
Th, and U were analyzed as total fractions to better understand potential impacts from produced
water.
3.2.1.1 Dissolved Metals (SW6010)
Dissolved metals were analyzed in all water samples collected for the study, and the results of these
analyses are summarized in Table 15. The samples were filtered at the lab using a 0.45 µm filter
before acidification and sample preparation. The laboratory analyzed the sample by inductively
coupled plasma emission spectroscopy (ICP) using procedures outlined in SW846 method 6010. Four
cation metals are generally present at greatest concentrations in most groundwater samples (Hem,
1992) and those four (Ca, Mg, K, and Na) are the dissolved cations present at highest concentrations
in samples collected as part of this study. The maximum concentrations observed were 74,000 mg/l
for Na, 18,000 mg/l for Ca, 4,700 mg/l for K, and 1,800 mg/l for Mg. The median Na, Ca, K, and Mg
concentrations (mg/l) are 4,000; 135; 39.5; and 15, respectively. The remaining dissolved metals Ba,
Fe, Si, Sr were observed at varying concentrations as summarized in Table 15. Appendix 10 has
dissolved fraction SW6010 results for all water samples collected as part of this study. The appendix
also includes detection limits and qualifiers (data flags), if any, that the lab applied to results.

Sampling and Analysis of Naturally Occurring Radioactive Material in Oil and Gas Produced Water
COGCC Special Project 10243 38
Table 15. Summary Statistics for Dissolved Metals (SW6010)
Statistic
Ba Ca Fe K Mg Na Si Sr
Minimum mg/l 0.008 1 0.045 2.3 0.32 0.11 0.2 0.14
Median mg/l 4.3 135 8 39.5 15 4,000 18 14.5
Mean mg/l 15 613 21.3 250 99.7 6,507 23.0 36.0
Maximum mg/l 73 18,000 130 4,700 1,800 74,000 78 650
Std. Deviation mg/l 21.4 2,557 32.3 744 295 11,388 15.3 94.0
n= 44 50 49 50 47 51 52 50
# U flag and not included in calculations 8 2 3 2 5 1 0 2
3.2.1.2 Total Metals (SW6010)
Total metals were analyzed in all water samples collected for the study, and the results of these
SW6010 analyses are summarized in Table 16. The samples were acidified in the field and then
prepared at the lab using SW846 method 3010. The laboratory analyzed the sample by ICP using
procedures outlined in SW846 method 6010. As with the dissolved metals, the four major cations
were reported at the highest concentrations among the analytes shown in Table 16. The maximum
concentration observed were Na (72,000 mg/l), Ca (16,000 mg/l), K (4,800 mg/l), and Mg (2,300
mg/l). The median Na, Ca, K, and Mg concentrations (mg/l) are 3,650; 140; 50; and 15, respectively.
The ranges of total metal concentrations of the major cations are similar to the concentration ranges
of the same cations in the dissolved phase, which indicates the major cations are present largely in
the dissolved phase in these samples.
Among the other total metals analyzed by ICP, B, Fe, Li, Si were detected at varying concentrations as
summarized in Table 16. The lab reported that Be, Cr, Ni, V were not detected above the laboratory’s
method detection limits in the majority of the samples. Appendix 11 has total metals by SW6010
results for all water samples collected as part of this study. The appendix also includes detection
limits and qualifiers (data flags), if any, that the lab applied to results.
Table 16. Summary Statistics for Total Metals (SW6010)
Statistic Be mg/l
B mg/l
Ca mg/l
Cr mg/l
Fe mg/l
Li mg/l
Mg mg/l
Ni mg/l
K mg/l
Si mg/l
Na mg/l
V mg/l
Minimum mg/l 0.076 0.019 1 0.0042 0.029 0.03 0.35 0.0031 2.1 0.26 0.32 0.042
Median mg/l 13.5 140 0.017 6.85 3.5 15 0.140 50 20.5 3650
Mean mg/l 16.3 562 0.080 23.7 6.6 109 0.218 253 23.4 6329
Maximum mg/l 0.09 83 16,000 0.38 140 48 2,300 0.950 4,800 75 72,000 0.042
Std. Deviation mg/l 17.0 2,256 0.125 36.2 10.6 358 0.285 748 14.3 11,067
n= 2 52 51 9 50 51 48 10 51 52 52 1
# U flag and not included in calculations 50 0 1 43 2 1 4 42 1 0 0 51

Sampling and Analysis of Naturally Occurring Radioactive Material in Oil and Gas Produced Water
COGCC Special Project 10243 39
3.2.1.3 Total Metals (SW6020)
Total metals were analyzed in all water samples collected for the study, and the results of these
SW6020 total metals analyses are summarized in Table 17. The samples were acidified in the field and
then prepared at the lab using SW846 method 3010. The laboratory analyzed each sample by
inductively coupled plasma mass spectrometry (ICP/MS) using procedures outlined in SW846 method
6020. Of the four major cations, only Na was analyzed by this method, and of the 17 analytes
reported by the lab using ICP/MS instrumentation, Na was again present at the highest
concentrations. The maximum concentration reported for Na was 86,000 mg/l with a median
concentration of 4,150 mg/l. Four of the SW6020 analytes were detected in more than 50% of the
samples collected (Al, Ba, Mn, and Sr). Median concentrations for Al, Ba, Mn, and Sr (mg/l) in samples
with those elements detected are 0.14, 1.55, 0.145 and 16, respectively. Maximum concentrations for
Al, Ba, Mn, and Sr (mg/l) in samples collected for this study are 120, 73, 3.3, and 690. As, Cd, Co, Cu,
Pb, Mo, Se, Ag, Tl, Th, U, and Zn were detected in fewer than half of the samples collected as part of
this study. Appendix 12 lists the total metals results by SW6020 for each water sample. The appendix
also includes detection limits and qualifiers (data flags), if any, that the lab applied to these results.
Table 17. Summary Statistics for Total Metals (SW6020)
Statistic Al As Ba Cd Co Cu Pb Mn
Minimum mg/l 0.023 0.00017 0.0085 0.0001 0.00008 0.0047 0.00036 0.0069
Median mg/l 0.14 0.0016 1.55 0.00093 0.038 0.0043 0.145
Mean mg/l 4.22 0.66 13.65 0.00566 0.435 0.0347 0.473
Maximum mg/l 120 8.4 73 0.0042 0.025 2.2 0.33 3.3
Std. Deviation mg/l 21.9 2.2 20.5 0.00949 0.709 0.0828 0.742
n= 30 25 52 4 8 13 16 52
# U flag not included in statistics 22 27 0 48 44 39 36 0
Statistic
Mo Se Ag Na Sr Tl Th U Zn
Minimum mg/l 0.0011 0.00078 0.00039 0.34 0.002 0.00002 0.00004 0.00003 0.012
Median mg/l 0.0036 4,150 16 0.00022 0.0009 0.145
Mean mg/l 0.00838 7,278 37.5 0.016 0.00435 0.616
Maximum mg/l 0.072 0.0054 0.012 86,000 690 0.11 0.00031 0.023 3.5
Std. Deviation mg/l 0.0147 13,247 98.5 0.0324 0.00833 0.98
n= 24 4 2 52 51 19 3 7 24
# U flag not included in statistics 28 48 50 0 1 32 49 45 28

Sampling and Analysis of Naturally Occurring Radioactive Material in Oil and Gas Produced Water
COGCC Special Project 10243 40
3.2.2 Anions
Major anions were analyzed in all of the aqueous samples for the study, and the results are
summarized on Table 18. Water samples were analyzed for Br, Cl, F, and SO4 by ion chromatography
using procedures from SW 846 method 9056. Alkalinity was determined by titrimetric methods
following procedures outlined in SM 2320. The anions reported at highest concentrations in samples
analyzed by SW9056 are Cl and SO4, with median concentrations (mg/l) of 12,725 and 549,
respectively, though SO4 was not detected by the lab in 25% of the samples collected as part of this
study. Alkalinity in the samples is assumed to be from carbonate species (HCO3‐ and CO3
2‐) and
reported as mg/l of CaCO3. Oil and gas produced waters may also contain short chain organic acid
anions as documented in produced waters from the Alberta Basin (Connolly et al., 1990a). When
present, short chain organic acid anions also contribute to the total alkalinity of water samples
(Lozovik, 2005). The presence of short chain organic acid anions in the produced water samples
would result in a partial overestimate of the concentrations of carbonate species in the samples when
interpreted from the alkalinity titration process followed by the lab. The median alkalinity (as
bicarbonate) concentration in sample from this study is 585 mg/l as CaCO3. The maximum alkalinity
(as bicarbonate) concentration in these samples is 5,400 mg/l as CaCO3. Fluoride was detected in
fewer than half of the samples in this study and Br was detected in the majority of the samples and at
much lower concentrations than Cl in the same samples.
Table 18. Summary Statistics for Major Anions
Statistic
Bromide chloride fluoride sulfate bicarbonate alkalinity
carbonate alkalinity
total alkalinity
as CaCO3 as CaCO3 as CaCO3
Minimum mg/l 0.34 0.064 0.85 0.17 30 not detected in all samples
30
Median mg/l 42 6,700 2.3 25 585 585
Mean mg/l 61.4 12,725 2.4 549 998 998
Maximum mg/l 300 170,000 6 3,800 5,400 5,400
Std. Deviation mg/l 71.3 27,335 1.3 1,057 1,091 1,091
n= 43 52 23 39 52 0 52
# U flag and not included in statistics above 9 0 29 13 0 52 0
Chloride, alkalinity, and SO4 are the three major anions in most groundwater (Hem, 1992). Chloride
and alkalinity are the dominant anions with lesser SO4 in the majority of the samples collected for this
study. Appendix 13 lists the results of the anions analytical procedures for each water sample. The
appendix also includes detection limits and qualifiers (data flags), if any, that the lab applied to these
results.

Sampling and Analysis of Naturally Occurring Radioactive Material in Oil and Gas Produced Water
COGCC Special Project 10243 41
3.2.3 pH, Specific Conductance, TDS and TSS
Table 19. Summary Statistics for General Water Quality Parameters
Statistics pH SU
specific conductivity µmhos/cm
total dissolved solids mg/l
total suspendedsolids mg/l
Minimum 5.7 105 92 22
Median 7.50 17,850 11,000 75.5
Mean 28,547 21,400 151
Maximum 8.63 237,000 240,000 720
Std. Deviation 42,370 40,546 176
n= 52 52 52 32
# U flag results (not included in statistics above) 0 0 0 20
The pH of water samples was determined using specific ion electrode methods as described in SW
846 method 9040. The conductance of the water samples was determined using conductivity cell as
described in SM 2510. Gravimetric determination of dissolved (TDS) and suspended solids (TSS) in the
water samples was done using procedures described in SM 2540. The pH of most of the samples was
basic with the median pH equal to 7.5 as shown in Table 19 with a range from 5.7 to 8.63 (SU).
Total suspended solids are gravimetrically determined filterable solids present in water samples. Both
TDS and TSS are operationally derived parameters based on filtering and drying using method‐
defined pore size filters and method‐defined drying temperatures and times. Appendix 14 lists the
results of the general water quality analytical procedures for each water sample. The appendix also
includes detection limits and qualifiers (data flags), if any, that the lab applied to these results.

Sampling and Analysis of Naturally Occurring Radioactive Material in Oil and Gas Produced Water
COGCC Special Project 10243 42
Figure 15. Total Dissolved Solids (TDS) versus Specific Conductance y‐axis = measured conductivity of samples (electrometric data) in µmhos/cm, x‐axis = concentration of TDS of each sample (gravimetric determination) in mg/l.
Electrical conductivity of water is a function of the concentration and types of cations and anions
present in a water sample and can be related to the measured TDS. Figure 15 shows a linear
relationship between TDS and specific conductance in 50 of the 52 samples. In the two samples with
>150,000 mg/l TDS, the relationship between the two measured parameters is different because of
interactions between the ions which are thought to occur when the dissolved solids are present at
very high concentrations.
R² = 0.9932
0
50000
100000
150000
200000
250000
300000
0 50000 100000 150000 200000 250000
Specific Conductan
ce (µmhos/cm
)
Total Dissolved Solids (mg/l)

Sampling and Analysis of Naturally Occurring Radioactive Material in Oil and Gas Produced Water
COGCC Special Project 10243 43
Figure 16. NORM 2017 Samples Production Formation(s) and Ranges of TDS Each facility sampled is captioned with facility number and an abbreviated identification of the formation(s) from which oil and/or gas and water samples were produced. A legend explaining the abbreviated formations names can be found at the end of Appendix 1. Size of circle at a site is larger with increasing concentration of TDS in sample collected at the facility.

Sampling and Analysis of Naturally Occurring Radioactive Material in Oil and Gas Produced Water
COGCC Special Project 10243 44
The reported TDS concentration of 31 of the 52 water samples collected as part of this study are
>10,000 mg/l, and thus would not be considered underground sources of drinking water (USDW) as
defined by U.S. EPA. All of the samples with one exception were also collected from hydrocarbon
producing wells, and thus only the source water sample (facility 755461) would be considered a
USDW under the current definition.
Figure 16 shows the range of TDS measurements for each sample collected and provides a broad
overview of concentrations of dissolved solids across the state. The geologic basins and producing
formation(s) from which each sample was collected is included in abbreviated form with the facility
number of the sampling location. TDS concentrations are a general indicator of water quality. As can
be seen in Figure 16, most of the samples collected from wells producing from the eastern slope
Niobrara formation are broadly of similar TDS concentration with most between 10,000 to 30,000
mg/l TDS.
3.2.4 Major Ion Chemistry and General Water Chemistry Discussion
The major ion and general chemistry of the water samples can be used to evaluate potential for re‐
use of these water in agricultural or industrial uses outside of oil and gas exploration and production
recycling. The non‐radiochemistry data gathered as part of this study provides useful data for
potential users of produced water outside the oil and gas industry as to if treatment is needed or
what types of treatment systems might be needed to make the water suitable for an intended use.
Potential beneficial uses of produced water in Colorado may involve other agencies such as the
Division of Water Resources, water courts, and CDPHE. Solid wastes are likely to be produced if E&P
wastes waters are treated for other uses. In Colorado, such solid wastes would need to be
characterized and disposed of in accordance with applicable solid waste regulations.
Several types of general evaluation of the major ion and general water chemistry data are present in
this section including general evaluation by use of Piper diagrams, evaluation of potential problems if
produced water reuse in irrigation of crops is to be considered, and use of Cl/Br mass ratios and Na/Cl
molar ratios as indicators of possible water‐rock interactions and sources of solutes in the produced
water samples. Stable isotope ratios of the hydrogen and oxygen present in the water samples also
provide useful indicators of sources of water including potential mixing of two sources of water.
Piper diagrams are a means of categorizing similarities and differences in sources of water using
major ion compositions of the waters (Piper, 1944). Piper diagrams can also be used to evaluate the
possibility of mixing two water sources (Hem, 1992). Figure 17 below is a Piper diagram of the sample
set discussed above and shown on the map (Figure 16) above. Piper diagrams are in three parts. The
two triangles at the bottom of the Piper plot illustrate cation composition (left triangle) and anion
composition (right triangle). The scales of both the triangles are in percent of milliequivalents of the
sum of cations and sum of anions in each sample.
Sodium and, to a lesser extent, K are the dominant cations in the majority of the samples collected
for this study. Chloride is the dominant anion observed in the majority of the sample results with
lesser occurrences of bicarbonate alkalinity and SO4.

Sampling and Analysis of Naturally Occurring Radioactive Material in Oil and Gas Produced Water
COGCC Special Project 10243 45
Figure 17. Piper Diagram Showing Major Ion Composition of 2017 NORM Produced Water Samples
All but four samples which are from three facilities (755461, 755541 and 755658) analyzed have Na
(and K) as 80% or more of the major cations as seen in the cation triangle at lower left of Figure 17.
The triangle of cation composition at the lower left of Figure 17 indicates that the four samples with
<80% of the cations as Na have 40 to 70% of the cations as Ca and 5 to 40% of the cations as Mg.
Facility 755461 is a source water sample from shallow aquifers in eastern Colorado and would be expected to
contain more calcium than water from deeper sources. Facility 755541 is a produced water sample from a
well producing from the Osage Limestone. Higher proportion of Ca relative to Na is likely because of the
interaction with calcium bearing minerals in the producing formation. The overall composition of water
sampled at facility 755658 is likely not indicative of contact with the producing formation as discussed
later in this section.

Sampling and Analysis of Naturally Occurring Radioactive Material in Oil and Gas Produced Water
COGCC Special Project 10243 46
In only two of the samples collected as part of the study are Cl and carbonate <85% of the major
anions, as seen in the anion triangle at the lower right of Figure 17. Those two samples (755461 and
755658) with <85% of the anions being chloride and bicarbonate have sulfate as 40 to 50% of the
major anions. Facility 755461 is a source water sample from shallow aquifers in eastern Colorado and would
be expected to contain more calcium than water from deeper sources. The overall composition of water
sampled at facility 755658 is likely not indicative of contact with the producing formation as discussed
later in this section.
Sodium is the primary cation in many of the produced water samples collected as part of this study,
as discussed in previous sections of this report. High concentrations of Na in produced water samples
can pose problems if beneficial use of produced water in agriculture is desired, an enquiry the agency
fields regularly. Sodic soils can hinder reclamation of sites where spills or releases of produced water
with elevated sodium adsorption ratio (SAR) have occurred. Soil thresholds for sodicity are present in
COGCC rules for this reason. Calculation of a ratio of Na to Ca plus Mg is a useful tool in
understanding the potential to use water whose primary cation is Na in irrigation of crops.
The SAR is calculated from water analyses, as shown in this equation from the Agriculture Handbook
No. 60 (USDA, 1954):
𝐒𝐀𝐑𝐍𝐚
√𝐂𝐚 𝐌𝐠
𝟐
where, Na, Ca, and Mg concentrations are expressed in milliequivalents per liter (meq/l). The
calculated value of SAR provides a means of estimating potential sodicity impacts to soils from spills
or releases of produced water. The SAR of each water sample is shown in Figure 18.
General tolerances of crops with respect to the salinity and sodicity of irrigation waters as well as
tolerances to individual ions in irrigation water can be found in the compilation of Ayers and Westcot
(1985) for crops grown around the globe. Salinity tolerances are generally expressed with respect to
the loading of TDS, or more commonly in terms of the specific conductance (EC) of the potential
source of irrigation water while SAR as described above is the measure of sodicity used to evaluate
potential sources of irrigation water. Elevated SAR in irrigation water can be a causal factor in
reduced crop yield due to reduced ability of water to infiltrate some soils (Ayers and Westcot, 1985;
Bauder et al., 2014). Sodicity‐induced reduction of water infiltration is most pronounced in soils
containing expandable clays, which are common in agricultural soils in Colorado (Bauder et al., 2014).
Information about irrigation water quality with respect to crops, soils, and climatic conditions in
Colorado can be found in Bauder et al. (2014). Figure 18 includes a dashed red, horizontal line drawn
at SAR of 9. Irrigation waters with SAR of 9 or greater are considered to be of severely limited use
(Table 1, Ayers and Westcot, 1985) due to possible deleterious impacts on infiltration and also
because of potential specific ion toxicity of Na to sensitive crops.
Corn is a crop frequently raised in parts of Colorado and generally requires irrigation in addition to
rain and snowfall‐supplied water. Corn crop yields of 50% at 3,900 micromhos per centimeter
(µmhos/cm) and 0% at 6,700 µmhos/cm in comparison to 1,100 µmhos/cm irrigation water (100%

Sampling and Analysis of Naturally Occurring Radioactive Material in Oil and Gas Produced Water
COGCC Special Project 10243 47
corn yield) are shown in Ayers and Westcot (Table 4, 1985). Over 70% of the water samples had
>6,700 µmhos/cm specific conductance, and those high TDS waters would in general not be suitable
for use in irrigation of corn crops without treatment. For many crops, the higher the specific
conductance of the irrigation water, the more plants struggle to bring water into the organism
(Bauder et al., 2014). Soil types such as sandy or clay rich, irrigation practices such as flood or
overhead, climatic conditions, and other water quality factors will also be factors in crop yields.
Crops may also exhibit specific ion toxicity to elevated concentrations of Cl, Na, and boron (B). Corn is
considered moderately tolerant of B with the maximum tolerated B concentration in the range of 2 to
4 mg/l (Table 16, Ayers and Westcot, 1985). A majority of samples collected in this study (67%)
contained B >4 mg/l. Wheat is more sensitive to B in irrigation waters than is corn with the maximum
tolerance for wheat at 0.75 to 1 mg/l (Table 16, Ayers and Westcot, 1985), and 86% of the samples
collected in this study contained B >1 mg/l. The concentrations of B present in many of the produced
waters indicates that they might not be suitable for use in irrigation of corn or wheat crops without
treatment.
Figure 18. Sodium Adsorption Ratio (SAR) of Samples Collected as Part of this Study SAR calculated from dissolved concentrations of Na, Ca and Mg for each water sample collected during this study. Each bar indicates ratio of one sample and each is labeled with COGCC facility number.
Chloride and bromide (Br) ions are ubiquitous solutes in all natural waters. Chloride is generally a
major component, and Br is generally a minor one. Both Cl and Br are generally viewed as
755461
755462
755474
755475
755476
755500
755500 755501
755541
755523
755523
149017
755522
755550
439136
215628
215628
215820 755659
755658
755657
755557
755558 755559
755559
299153
285562
755648
755647
755645
755646
755662
755590
755652
755653
755661 755591
755667 755666
755667
755592 755593
755658
757036
757035
757105
757034
757071
757072
757033 757038
757037
90.0
100.0
200.0
300.0
400.0
500.0
Sodium Adsorption Ration (SA
R)
Facility
estimated ratio in columns filledwith green using laboratory specified MDL for U flagged Ca and/or Mg

Sampling and Analysis of Naturally Occurring Radioactive Material in Oil and Gas Produced Water
COGCC Special Project 10243 48
conservative tracers in groundwater systems (Whittemore, 1995; Davis et al., 1998; Davis et al., 2004;
Freeman, 2007). Cl/Br mass ratios can be used to help determine the origin and evolution of water
including water produced from oil and gas reservoirs and surface waters (Davis et al., 1998). Seawater
has a relatively uniform Cl/Br mass ratio around 290±4 (Katz et al., 2011). Groundwater Cl/Br mass
ratios close to that of seawater may in some instances reflect water trapped when marine sediments
were originally deposited. Shallow potable groundwater derived from meteoric water in Colorado as
shown in Table 4 of Davis et al., (2004) is expected to have Cl/Br mass ratios of about 50 if no
anthropogenic inputs are present.
Groundwater Cl/Br ratios greater than the seawater ratio generally indicate increased contributions
of solutes from water‐rock interactions, and ratios >1,000 may be from dissolution of the evaporite
mineral halite (Davis et al., 1998; Freeman, 2007). Groundwater Cl/Br mass ratios less than the
seawater ratio would indicate fluid sources from a fresher source (such as more recent fresh water
recharge) or less water‐rock interaction (residence time). Atmospheric precipitation generally has
Cl/Br mass ratios between 50 and 150 and typically after even short residence times, shallow
groundwaters have ratios between 100 and 200; ratios between 1,000 and 10,000 reflect solutes
derived from halite dissolution (Davis, et al., 1998).
Results of the Cl/Br mass ratios determined from analytical data of this study are presented on Figure
19. Note the y‐axis (Cl/Br ratio) is plotted on a logarithmic scale. The bulk of the fluid samples
collected have Cl/Br mass ratios between 100 and 200 (29 samples) with 10 samples having Cl/Br
ratios exceeding 290; one has a ratio at 11,333 (facility 755645). The Cl/Br mass ratio of nine samples
was <100. Five of the samples with Cl/Br mass ratios <100 were from wells which had been
hydraulically fractured in the 12 months prior to sampling (facility # in gold) and in which 90% or
more of the frac fluid was reported as fresh water on form 5A submissions to COGCC for these wells.
The sources of fresh water are not identified on COGCC Form 5A Completed Interval Report so it is
not known if the source water was from groundwater or surface water. The Cl/Br mass ratios of the
five samples from wells hydraulically fracture stimulated in the 12 months prior to sampling likely
indicate much of the water being produced at these sites may be from the fresh water used in the
fracs. Rosenblum et al., (2017) observed a Cl/Br mass ratio of 69.1 in produced water about eight
months after the completion of one well producing from the Niobrara Fm. in northeastern Colorado.
In general, the bulk of the samples from this study reflect fluids that have Cl/Br mass ratios that
would be expected to be present in waters that have evolved geochemically during contact with
rocks over geological time frames.
Analysis of stable isotopes of water, which can aid in interpretation of water sources, was also
performed on all samples and are presented in general in Section 3.3 and discussed in more detail in
Section 4.3.7. Three of the samples with fracs in the 12 months prior to sampling were among the
subset of samples on which analysis of tritium activities and 14C of DIC ages were performed. The
tritium analyses are summarized in Section 3.4 and the 14C of DIC analyses are summarized in Section
3.5. Tritium and 14C of DIC analyses are discussed in Section 4.3.8.

Sampling and Analysis of Naturally Occurring Radioactive Material in Oil and Gas Produced Water
COGCC Special Project 10243 49
Figure 19. Chloride/Bromide Mass Ratio of Samples Collected as Part of this Study Ratio of Cl concentrations (mg/l) to Br concentrations (mg/l) present in each water sample collected during this study. The red dotted horizontal line represent the Cl/Br mass ratio in modern seawater. Each bar indicates ratio of one sample and each is labeled with COGCC facility number.
Two sample sites are anomalous as having the highest and lowest mass Cl/Br ratios, facilities 755645
and 755658. Facility 755645 is produced water from the Permian Lyons Fm., and has a Cl/BR ratio of over
10,000. The presence of evaporite minerals within the Lyons Fm. is apparent in review of geophysical
logs from producing wells in the same area as facility 755645 and has been reported as a formation
cement (anhydrite) in the Lyons Sandstone (Lee and Bethke, 1994). Halite and gypsum beds are
present throughout the Permian age rocks (late Desmoinesian/Wolfcampian time) in the northern
Denver Basin (Garfield, et al., 1988). The presence of evaporate minerals likely contributes to the high
Cl/Br present in the Facility 755645 sample.
Facility 755658 was sampled once in May 2017 and again in October 2017. Both samples were collected
from the water/gas separator that receives production from well 05‐067‐08097. Gas production from
this well (and associated separator) has been reported at approximately 4,000 to 5,000 thousand
cubic feet (MCF)/month during 2017 from the Cretaceous Mesaverde Group. No water production
has been reported subsequent to April 2017 (before sampling events) until after the sampling events.
The water may not be formation‐related as the concentration of TDS was reported as 92 mg/l from
the May sample and 160 mg/l in the October sample. The Cl/Br mass ratios of two samples from
755461
755462
755474
755475
755476
755500
755500
755501
755541
755523
755523
149017
755522
755550
439136
215628
215628
215820
755659
755658
755657
755557
755558
755559
755559
299153
285562
755648
755647
755645
755646
755662
755590
755652
755653
755661
755591
755667
755666
755667
755592
755593
755658
757036
757035
757105
757034
757071
757072
757033
757038
757037
1
10
100
1000
10000
100000Cl/Br mass ratio
Facility #
estimated ratio green filled columns using MDL for U flagged Br resultsred line represents modern seawater mass ratio of Cl/Brfacility number in gold are samplesfrom wells recently hydraulically fractured

Sampling and Analysis of Naturally Occurring Radioactive Material in Oil and Gas Produced Water
COGCC Special Project 10243 50
facility 755658 are <10. These low Cl/Br ratios may be indicative that the water is not produced
groundwater but may be condensation or rainwater.
Na and Cl are dominant cation and anion in the majority of samples collected as part of this study.
The ratio of the concentrations of these two ions has been used in studies of seawater intrusion into
fresh water aquifers (Anders et al., 2013). The Na/Cl ratio can also be used to help understand
sources of solutes in the samples. The mole ratio of Na/Cl in seawater is 0.859 using composition data
compiled by Pilson (2013).
The Na/Cl molar ratios of the majority of samples (65%) are within ±50% of the seawater ratio shown
as a red horizontal line on Figure 20. Note the y‐axis (Na/Cl ratio) is plotted on a logarithmic scale.
The samples more than 50% different than the seawater ratio all have Na/Cl ratios >1.5 times the
seawater ratio (18 samples or 35% of all samples). The TDS concentrations of the 18 samples with
Na/Cl ratio >1.29 are all lower than the median TDS concentration (11,000 mg/l) of samples collected
as part of this study. The 18 samples with Na/Cl ratio >1.29 contain relatively lower concentrations of
chloride. The samples with Na/Cl molar ratio >1.29 are 18 of the 20 samples with the lowest chloride
concentrations. The 18 samples with Na/Cl molar ratio >1.29 also all have Na concentrations ≤ the
median Na concentration (4,000 mg/l) of samples collected as part of this study. Chloride is generally
considered to be a conservative tracer in groundwater systems. The relatively low concentrations of
chloride in these 18 samples indicate the source(s) of the water were also relatively low in chloride
and that the rocks these 18 samples have been in contact with do not contain seawater or solids such
as halite in appreciable amounts. Weathering of silicate minerals as groundwater migrates through
alluvium and near surface rock layers is a possible source of waters with relatively low chloride in
relation to Na concentrations.
The Na/Cl molar ratios of the majority of samples (65%) are within ±50% (0.43 to 1.29) of the
seawater ratio (0.859) shown as a red horizontal line on Figure 20. Note the y‐axis (Na/Cl ratio) is
plotted on a logarithmic scale. The samples more than 50% different than the seawater ratio all have
Na/Cl ratios >1.5 times the seawater ratio (18 samples or 35% of all samples with ratio > 1.29). The
TDS concentrations of the 18 samples with Na/Cl ratio >1.29 are all lower than the median TDS
concentration (11,000 mg/l) of samples collected as part of this study and contain relatively lower
concentrations of chloride. This group of samples comprise 18 of the 20 lowest chloride
concentration samples. The 18 samples with Na/Cl molar ratio >1.29 also all have Na concentrations ≤
the median Na concentration (4,000 mg/l) of samples collected as part of this study. Chloride is
generally considered to be a conservative tracer in groundwater systems. The relatively low
concentrations of chloride in these 18 samples indicate the source(s) of the water were also relatively
low in chloride and that the rocks these 18 samples have been in contact with do not contain
seawater or solids such as halite in appreciable amounts. Weathering of silicate minerals as
groundwater migrates through alluvium and near surface rock layers is a possible source of waters
with relatively low chloride in relation to Na concentrations.

Sampling and Analysis of Naturally Occurring Radioactive Material in Oil and Gas Produced Water
COGCC Special Project 10243 51
Figure 20. Na/Cl molar ratios of NORM 2017 Samples Ratio of Na concentrations (moles/l) to Cl concentrations (moles/l) present in each water sample collected during this study. The red horizontal line represents the Na/Cl molar ratio in modern seawater. Each bar indicates ratio of one sample and each is labeled with COGCC facility number.
Figure 21 is a comparison of the Na/Cl molar ratio (x‐axis) and the Cl/Br mass ratios (y‐axis) just
presented and discussed. Note that both axes are plotted using a logarithmic scale. The seawater
Na/Cl molar ratio of 0.859 is shown as a labeled dark blue dashed vertical line and the seawater Cl/Br
mass ratio of 290 is shown as the green dashed horizontal line on Figure 21. In addition a vertical line
representing a Na/Cl molar ratio of 1.29, which is 50% greater than the seawater ratio, is drawn on
the plot as a gray dashed vertical line.
The Na/Cl molar ratio of 18 of the samples collected as part of this study are >1.29 (Groups A 1, A 2
and A 3 on Figure 21) The Cl/Br mass ratio of 16 of the 18 with >1.29 Na/Cl ratios are also <290
(seawater ratio). The two samples shown as purple circle symbols (Group A 2) with >1.29 Na/Cl ratios
and Cl/Br ratios >290 are the source water sample (755461) and produced water from a San Juan
Basin CBM well (215820). The greater than seawater Cl/Br ratio in samples 755461 and 215820 may be
the result of anthropogenic inputs of Cl such as from road salt (755461) or from input of dissolved
solids from other anthropogenic inputs (215820). The two samples shown as red triangles in Figure 21
(Group A 3) with >1.29 Na/Cl ratios and Cl/Br ratios <290 represent analyses of water from facility
755658. Bromide was not detected in samples from 755658 so the Cl/Br ratio was calculated using the
detection limit for bromide. The use of the detection limit would likely result in an underestimation of
755461
755462
755474
755475
755476
755500
755500
755501
755541 755523
755523
149017
755522
755550
439136
215628
215628
215820
755659755658 755657
755557
755558
755559
755559
299153
285562
755648
755647
755645 755646
755662
755590
755652
755653
755661
755591
755667
755666
755667
755592
755593
755658
757036
757035
757105
757034 757071
757072
757033
757038
757037
0.10
1.00
10.00
100.00
Na/Cl m
olar ratio
CBM‐produced water
seawater Na/Clratio 0.859

Sampling and Analysis of Naturally Occurring Radioactive Material in Oil and Gas Produced Water
COGCC Special Project 10243 52
the Cl/Br mass ratio for the two samples collected from 755658. As discussed previously the source of
these water samples is thought to be rain or perhaps water vapor carried in the gas stream from the
well served by the separator from which the samples were collected. Blue circle symbols (Group A 1)
mark the other 14 samples (of 18) with >1.29 Na/Cl ratios and Cl/Br ratios <290. The relatively high
Na/Cl ratio of the 14 samples in Group A 1 is indicative that the waters have not been mixed with
seawater. Seawater could possibly have been present in producing formations deposited in marine
settings or which were subsequently overlain by sea water. Thirteen of the 14 samples in Group A 1
come from formations which in part were deposited in fluvial or deltaic terrestrial environments and
the lack of sea water characteristics may be expected. Many of the samples with Na/Cl ratios >1.29
may be the product of weathering of silicate minerals by meteoric water as it migrates through the
earth. Many silicate minerals frequently contain sodium but contain little or no chloride. One means
of further examining that concept is to utilize the stable isotopes of water data collected as part of
this study. Section 4.3.7 presents an analysis of the stable isotopes of water from the subset of
samples with >1.29 Na/Cl ratios and Cl/Br ratios <290.
Figure 21. Na/Cl ratio Plotted versus Cl/Br Ratio of 2017 NORM Samples Vertical reference line at Na/Cl molar ratio (0.859) is plotted to highlight the Na/Cl molar ratio of modern seawater. Horizontal reference line at Cl/Br mass ratio (290) is plotted to highlight Cl/Br mass ratio of modern seawater. Both x‐ and y‐axes are plotted as logarithmic scales.
290 290
0.859
0.859
1.29
1.29
1
10
100
1000
10000
100000
0.40 4.00 40.00
Cl/Br mass ratio
Na/Cl molar ratio
Group A 1 Group A 2 Group A 3
Group B 1 Group B 2 Group B 3
Group B 4

Sampling and Analysis of Naturally Occurring Radioactive Material in Oil and Gas Produced Water
COGCC Special Project 10243 53
Six samples are indicated with green asterisks (Group B 3) and have Cl/Br mass ratios between
approximately 400 and 800 with Na/Cl ratios near that of seawater. These samples may represent
groundwaters derived from connate or later incursions of sea water and which have also been in
contact with halite as a source of the elevated chloride in comparison to bromide present in these
samples. One sample labeled as Group B 4 has a Cl/Br ratio >10,000 (755645) and is shown in Figure 21
with a red X. The elevated Cl/Br ratio in this produced water sample is thought to be from
contributions from halite present in formations in contact with the Lyons Fm., which is of terrestrial
origin. One sample 755541 (Group B 2) has the lowest Na/Cl molar ratio likely due to interactions
with calcium bearing minerals in the producing formation. Dissolution of calcium from the formation
has resulted in elevated calcium ratio of total cations in this sample compared to most other samples
collected as part of this study as illustrated in Figure 17 and discussed previously in this section.
Seven of the eight samples with Cl/Br >400 have Na/Cl ratios similar in a general sense to modern
seawater, even though the Cl/Br ratios are more than 35% greater than that of modern seawater.
The eight samples (from seven facilities with one duplicate) with Cl/Br >400 are produced water from
oil and gas wells developed in Paleozoic era formations (Appendix 1). All other samples in this study
are from wells developed in Mesozoic era formations (Appendix 1) with the exception of the source
water sample and one sample partially from Raton Fm. coals, which were deposited in part in the
Cenozoic era. The Paleozoic producing formations are of marine origin with the exception of the
Lyons Fm., which is of terrestrial origin (Maughan and Wilson, 1960; Thompson, 1949; Weimer and
Lund, 1972). All the reported concentrations of TDS in these eight samples are among the 15 highest
concentrations in samples collected as part of this study and include the first, second, third and fifth
highest TDS concentrations. One means of further examining the sources of water in these eight
samples from seven facilities is to utilize the stable isotopes of water data collected as part of this
study. None of the wells producing to the seven facilities with Cl/Br ratios >400 were completed by
hydraulic fracturing techniques. Section 4.3.2 presents an analysis of the stable isotopes of water
from the subset of eight samples with Cl/Br ratios >400.
The samples plotted with gold diamonds (Group B 1) in Figure 21 are those with Na/Cl and Cl/Br
ratios similar to that of modern seawater. One can hypothesize that connate (remnant) formation
water from marine sediments is present in the produced water at these sites even if mixed with more
recent fresh water, which in some cases has been introduced to the system by hydraulic fracturing.
3.3 Stable Isotopes of H2O and of Carbon in Dissolved Inorganic Carbon
Isotopic composition of the oxygen and hydrogen that make up water (H2O) can be used as a tool in
understanding differences in sources of groundwater. Appendix 15 lists the results of the stable
isotope of water and DIC analytical procedures for each water sample. Water isotopic data available
from this study are plotted below with water oxygen isotope ratios plotted as the x‐axis and water
hydrogen isotope ratios plotted as the y‐axis (Figure 22). The hydrogen isotope (2H) ratio plotted is
also referred to as deuterium and the label on the plot of D refers to the ratio of deuterium (2H) to
the more abundant 1H isotope. The carbon isotopic composition of DIC in waters (Figure 23) can also
be used in interpretation of interactions between groundwater and the rocks they are in contact with
and used in interpretation of biological processes in the groundwater.

Sampling and Analysis of Naturally Occurring Radioactive Material in Oil and Gas Produced Water
COGCC Special Project 10243 54
One line drawn diagonally across the water isotope plot (Figure 22) is known as the global meteoric
water line (GMWL) and represents a regression line to unevaporated precipitation data from across
the world (Craig, 1961; Rozanski et al., 1993). A nearly parallel line to the GMWL represents the local
meteoric water line from precipitation samples collected in the Pawnee Grasslands in northeastern
Colorado (Harvey, 2005). The isotopic composition of precipitation (meteoric water) is a function of
source of the atmospheric moisture which gives rise to the precipitation with isotopically depleted
waters associated with cold regions and enriched waters in warm regions as noted by Craig (1961).
Variability of D and 18O in precipitation reflects the source and seasonal transport patterns of the atmospheric moisture, the amount of precipitation that has previously fallen, and orographic effects
on isotopic composition (Bowen and Revenaugh, 1993).
Figure 22 illustrates that there is a large degree of variability of water isotope ratio between the
sources of produced water sampled in this study. However there is some overlap between the
dataset gathered as part of this study and with the meteoric water lines and data from local aquifers.
This is illustrated by including data from a recent study of upper Pierre aquifer water wells (Allison,
2017).
Figure 22. Water Stable Isotopes of NORM 2017 Samples Global Meteoric Water Line from Craig, 1961, Rozanski et al., 1993, Pawnee Meteoric Water Line from Harvey, 2005. The isotopic ratio of deuterium (2H) in water from samples collected as part of this study relative to Vienna standard mean ocean water reference is plotted against the y‐axis. The isotopic ratio of 18O (oxygen) in water from samples collected as part of this study relative to Vienna standard mean ocean water reference is plotted against the x‐axis.
‐150
‐140
‐130
‐120
‐110
‐100
‐90
‐80
‐70
‐60
‐50
‐40
‐30
‐20
‐10
0
10
20
30
‐20 ‐18 ‐16 ‐14 ‐12 ‐10 ‐8 ‐6 ‐4 ‐2 0 2 4
δD (‰
VSM
OW)
δ18O (‰ VSMOW)
Upper Pierre Aquifer
Shallow GW and CBM
Moffat
Northeast (not Weld)
Southwest (not CBM)
Southeast (not CBM)
Garfield, Mesa & Jackson
Weld
755658
Global Meteoric WaterLinePawnee Meteoric WaterLine

Sampling and Analysis of Naturally Occurring Radioactive Material in Oil and Gas Produced Water
COGCC Special Project 10243 55
The focus of this study is on aqueous fluids co‐produced with oil and gas production. Those produced
waters, from reservoir rocks, are generally considered to have been isolated from surface
precipitation and groundwater recharge for some time due to the depth of the oil and gas producing
formations. Significant differences in the stable O and H isotopes of older isolated water and present‐
day meteoric water would be expected. The bulk of stable O and H isotope results shows that most
produced fluids analyzed have stable isotopic signatures of 18O that plot well below the global and
local meteoric water lines. A few results will be highlighted and discussed here. More interpretation
and discussion of the water isotope data will be presented in Section 4 of this report.
Many factors other than the near surface recharge of meteoric water to the subsurface may affect
the isotopic composition of aqueous fluids in petroleum reservoirs. Mixing with older water sources
in reservoir rocks, which may include ancient seawater or water that has undergone evaporation, are
possible mechanisms that may cause produced water to plot off the meteoric water line.
The CBM produced fluids sampled as part of this study have water stable isotope values similar to
meteoric waters, which suggests a geologically recent recharge from meteoric waters. The frac source
water sample (755461 )has water stable isotope ratios similar to Upper Pierre aquifer groundwater
and falls near the meteoric water lines. The water isotope ratios for water samples from facility 755658
plots well below the global and local MWL. Water samples collected from the separator at this well
also have very low concentrations of TDS. The water isotope data may indicate these samples are not
rainwater but more likely water vapor condensed from the gas produced in that well.
The carbon isotopic ratios of the DIC species (bicarbonate and carbonate ions and CO2(g)) present in
groundwater systems is influenced by numerous processes. The simplest case is near surface
interaction of meteoric water infiltrating through soils reacting with gaseous soil carbon dioxide
(Geyh, 2000). Carbon dioxide is produced in soil through biological processes such as organic matter
decomposition and root respiration (Amundson et al., 1998). Dissolution or precipitation reactions
with carbonate minerals may also be factors in the 13C ratio of DIC in the groundwater when
carbonate minerals are present in soils or in rocks. As groundwater infiltrates and oxygen in the
groundwater is depleted, biological processes such as sulfate reduction (Londry and Des Marais,
2003), methanogenesis and methanotrophy (Whiticar, 1999) may occur and may alter the isotopic
composition of carbon in DIC. Carbon stable isotopic data for nine samples from the Dawson aquifer
has a median 13C ratio in DIC of ‐13.4 per mil (VPDB) from data found in Musgrove, et al., 2014. The
median 13C ratio in DIC of 21 samples from the deeper and older upper Pierre aquifer is ‐2.7 per mil
(VPDB) using data from Allison (2017). The more positive (heavier) composition of the upper Pierre
aquifer DIC in comparison to the shallower Dawson aquifer likely reflects longer residence time as
well as biogenic processes including sulfate reduction and methanogenesis.
The five most positive isotopic ratios of 13C in DIC are from CBM wells (Figure 23). The isotopic
composition of carbon in DIC from produced water at Colorado CBM wells typically is a positive
(heavier) ratio, reflecting longer residence times of water than in shallow domestic water sources and
processes such as sulfate reduction and methanogenesis. The water stable isotopes for the CBM
samples all fall on or near the meteoric water lines, as shown in Figure 22.

Sampling and Analysis of Naturally Occurring Radioactive Material in Oil and Gas Produced Water
COGCC Special Project 10243 56
The two most negative isotopic ratios of 13C in DIC are from duplicate samples collected at facility
755523 (Figure 23). The well is completed in and produces from upper Pennsylvanian Topeka
Limestone. Topeka Limestone produced water and the isotopic ratio of the DIC likely reflect
interactions with the carbonate minerals in the limestone rocks more than biological processes. The
water stable isotopes fall below the meteoric water lines (Figure 22).

Sampling and Analysis of Naturally Occurring Radioactive Material in Oil and Gas Produced Water
COGCC Special Project 10243 57
Figure 23. Carbon Isotope Ratios of Dissolved Inorganic Carbon in NORM 2017 samples The isotopic ratio of 13C (carbon) present as inorganic carbon species dissolved in water from samples collected as part of this study relative to Vienna Pee Dee belemnite reference standard is plotted against the y‐axis for each water sample collected as part of this study.
‐20
‐15
‐10
‐5
0
5
10
15
20
25
30
755461
755462
755475
755474
755476
755500
755500
755501
755541
755523
755523
755522
149017
439136
755550
215820
215628
215628
755657
755658
755659
755557
755558
755559
755559
299153
285562
755647
755648
755645
755646
755652
755653
755590
755591
755661
755662
755666
755667
755667
755592
755593
755658
757036
757035
757105
757034
757071
757072
757033
757038
757037
δ13C DIC ‰
VPDB
755523 is produced water from upper Pennsylvanian age Topeka Limestone
source water
flowback
215820, 215628 (& duplicate), 299153 and 285562 are produced water from CBM wells

Sampling and Analysis of Naturally Occurring Radioactive Material in Oil and Gas Produced Water
COGCC Special Project 10243 58
The isotopic ratios of 13C in DIC in 755658 and duplicate, 755657 and 755541 are approximately 0 per mil (Figure 23). Sample 755658 was collected at two sampling events from a separator and may represent condensation present in the separator and not produced water as previously discussed. The DIC present in samples from 755658 may be from the atmosphere or may reflect carbon isotopic ratio of carbon dioxide present in the produced gas (Mesa Verde Fm. production) which the water has been in contact. The sample from 755657 has similar carbon isotopic composition of DIC as 755658 and the water and gas produced from this well is in part from completions in the Mesa Verde Fm. which may point to carbon dioxide in the natural gas produced as a possible source of DIC in water samples from these two sites. Sample 755541 is produced water from a well completed in the Osage Limestone and the isotopic composition of DIC may be representative of carbonate mineral solids in the formation. Gas sales have not been reported from the three wells served by the production facility where sample 755541 was collected so carbon dioxide present in gas phases in the production are a less likely source of the DIC than carbonate mineral dissolution.
3.4 Tritium (3H) in H2O
Tritium (3H) is a radioactive isotope of hydrogen that is naturally produced at small amounts in the
upper atmosphere through the interaction of cosmic rays with nitrogen, oxygen, or deuterium (2H).
Tritium also is produced industrially in nuclear reactors or in other fission processes related to nuclear
weapons tests. Electrolytic enrichment of the tritium in water samples can be used to enable
detection of low levels of tritium in water samples.
Tritium in the atmosphere falls to the earth as part of water molecules in precipitation. Tritium
undergoes beta (β) decay with a half‐life of 12.3 years. Prior to atmospheric nuclear weapons testing
during the 1950s and 1960s, 3H concentrations in meteoric waters were low (≈5 tritium units [TU])
and went up a thousand fold or more in the early 1960s (Mook, 2000). Concentrations in meteoric
water peaked in 1963 and have since been decreasing rapidly as it has rained out of the atmosphere
(Mook, 2000; Musgrove, et al. 2014). Groundwater with a 3H concentration >20 to 30 TU (1 TU equals
3.24 pCi/l) likely contains bomb‐pulse water, and groundwater with activities of 3H<5TU likely have
mean residence time older than the bomb pulse of the early 1960s (Musgrove, et al. 2014; Mook,
2000).
Eight of the study samples were analyzed for 3H activity levels by gas proportional counting of
hydrogen gas produced from the water samples. The sample results are presented in Appendix 16.
With the exception of facility 755461 (shallow groundwater source), all of the remaining samples
show lower TU activities, which would be expected of fluids that have not been in recent contact with
meteoric waters or the atmosphere or are mixtures of some modern water and waters older than the
bomb pulse. Further discussion and interpretation of tritium results from this study will be presented
in Section 4.
3.5 14C in Dissolved Inorganic Carbon
14C is a radioactive isotope of carbon, and like tritium, is also created cosmogenically at small
amounts in the atmosphere through the interaction of cosmic rays with nitrogen. 14C was also

Sampling and Analysis of Naturally Occurring Radioactive Material in Oil and Gas Produced Water
COGCC Special Project 10243 59
produced as a result of above ground nuclear explosions between 1945 and 1963, which increased
the quantity of 14C in the atmosphere. 14C falls to the earth incorporated in precipitation as carbon
dioxide. 14C undergoes β decay with a half‐life of 5,715 years (Bechtel 2010). 14C (in waters) is
measured in the DIC and expressed as a percent modern carbon (PMC). The age of the DIC present in
the water samples can also be calculated and expressed as BP or years before present (Musgrove, et
al. 2014). The sample results are presented in Appendix 17.
The analytically indicated 14C DIC age of the inorganic carbon in the shallow groundwater source
water sample (facility 755461) is 60 years BP (102.63 PMC). This indicates the inorganic carbon in the
source water may have in part been from the bomb pulse years. The tritium activity of the water
from this source water is likely indicative of younger water than from the bomb pulse years. The
source of the inorganic carbon dissolved in the source water is likely from decay of organic sources of
carbon in soils the shallow groundwater passed through. The organic matter source of the DIC is
assumed to be older than the infiltrating groundwater itself.
The 14C DIC ages of calculated for all of the produced water samples are older than the source water
sample age by more than two orders of magnitude. The calculated ages of the DIC in the produced
waters samples range from 17,115 to 43,600 years BP. Further discussion and interpretation of 14C
DIC ages from this study is presented in section 4.3.8.

Sampling and Analysis of Naturally Occurring Radioactive Material in Oil and Gas Produced Water
COGCC Special Project 10243 60
4. DISCUSSION
Data from this study and other surface water and groundwater radiochemistry data in the COGCC
database and records will be summarized and compared in this section. Radionuclide activities of
produced water from three other states (NY, PA and TX) were found in the literature, and those data
will also be summarized and compared to data from this study. The last portion of this section will
present more detailed interpretations of data collected as part of this study.
4.1 Other Colorado Data
The COGCC environmental database contains surface water and groundwater radionuclide or U and
Th data from several hundred sampling events. Project Rulison related data with its primary focus on
fission related radionuclides and not on NORM has not been brought into the database at this time.
Some of the Rulison data includes analytical data comparable to data collected as part of this study
and that data has been reviewed as part of this project and is discussed and summarized in the next
sections. Temporal changes in total U, 234U, 226Ra, 210Pb, and 210Po were analyzed and reported
(Rosenblum et al., 2017) in produced water from one oil and gas well and collected over a nine
month period following well completion. Rosenblum et al. (2017) did not disclose the well from which
the produced water came but did state the well was in northeastern Colorado and was completed in
the Cretaceous Niobrara Fm. As the specific well sampled is not disclosed by the authors, the
Rosenblum data cannot be incorporated in the COGCC database but will be summarized and
compared to data from data from Niobrara wells gathered as part of this study in Section 5 of this
report.
4.1.1 Project Rulison
Project Rulison was part of a program, generally called Project Plowshare, conducted by the Atomic
Energy Commission (AEC) to pursue peaceful uses of nuclear explosives. One proposed use was the
idea of detonating nuclear blasts in the subsurface to stimulate natural gas production from low‐
permeability sandstone reservoirs in sedimentary basins throughout the Rocky Mountain states. The
creation of an effectively large wellbore together with the creation of related connecting fractures in
the adjacent formation using a nuclear explosive device was proposed as possibly more efficient than
using chemical explosives or hydraulic fracturing techniques (Rubin et al., 1972).
Project Rulison was conducted in 1969. Gas production rates were found to be high initially; however,
pressure recovery measurements during shut‐in periods indicated limited effectiveness of the blast
stimulation to exploit the low‐permeability reservoir. Extensive environmental radiological monitoring
at and around the project site before and after the tests by the AEC and later by DOE, USGS, and EPA
has shown that no radioactive fission products attributable to the tests have been found in these near
surface environmental samples collected to present, with the exception of radioactive natural gases
vented from the site in the first year following the test. A summary of the Project Rulison related
sampling and analysis scheme is found in the most recent version of the Rulison Sampling and Analysis
Plan (COGCC 2017b).
Renewed interest in natural gas production from the Williams Fork Fm. near Project Rulison in the
mid 2000s prompted the COGCC to establish specific radiological sampling of drilling and production

Sampling and Analysis of Naturally Occurring Radioactive Material in Oil and Gas Produced Water
COGCC Special Project 10243 61
fluids and gasses from oil and gas wells drilled within a 3‐mile radius centered on the Project Rulison
blast well (also known as Lot 11 [40‐acre lot]) (COGCC Cause Number 139‐43). Subsurface drilling
below 6,000 feet is restricted under Lot 11 by the federal government and Garfield County deed
restriction (COGCC, 2017b).
Exploration and production sample media including produced water and both frac source water and
flow back fluid have been collected from 2008 through 2018, with the bulk of the sampling in 2008
through 2010. Table 20 presents a summary of results extracted from the 4th Quarter 2009 summary
that was provided to COGCC by operators in the Rulison area (URS, 2010b) which is available in the
Project Rulison section under the Piceance Basin area of the Library link on the COGCC webpage
(http://cogcc.state.co.us/library.html#/areareports).
The database for the Project Rulison E&P radiological sampling is not yet incorporated into the
COGCC environmental database, as the current COGCC environmental database did not exist at the
time when the initial Rulison sampling and analysis plan went into effect. The Rulison data presented
below in Table 20 and 21 (URS 2010b) are from subsets of the entire project and were compiled
manually as part of this project. The main focus of the Rulison sampling is on fission products such as 14C and 3H that may have migrated from the blast cavity and not on NORM related radionuclides.
Table 20. Comparison of Rulison and This Study Produced Water Screening and Isotopic Data
Analyte
Rulison Area Produced Water This Study Produced Water
Minimum Activity (>MDC) (pCi/l)
Maximum Activity (pCi/l)
Minimum Activity (>MDC) (pCi/l)
Maximum Activity (pCi/l)
gross α 19.1 37.5 0.1 730
gross β 14.6 43.2 1.98 5,710
214Bi 5.76 8.38 25 119
40K 39.1 60.6 189 2,840
210Pb 3.73 5.27 0.71 253
214Pb 6.2 7.32 26 78.09
228Ra 8.25 13.4 0.94 221
Analytical results show higher maximum activities for produced water samples from this study (Table
20) than for those measured for the Rulison Project. Minimum activities were lower for all analytes
for this study than for the Rulison results (with the exception of 40K). The Rulison samples are all from
a single producing formation (Cretaceous Williams Fork), whereas the data from this study are a
compilation of results from 15 different formations across the state.

Sampling and Analysis of Naturally Occurring Radioactive Material in Oil and Gas Produced Water
COGCC Special Project 10243 62
Table 21. Rulison Source Water and Frac Flowback and COGCC 2017 Comparison
Analyte Rulison Area Source Water and Flowback
This Study Source Water and Flowback
Minimum Activity >MDC'
Maximum Activity Minimum Activity >MDC
Maximum Activity
gross α (pCi/l) 142.8 (U) (s) 266 (f) 26.8 (s) 53.2 (f)
gross β (pCi/l) 2,300 (f) 5,420 (f) 5.56 (s) 68 (f)
tritium (TU) 10 (s) 12.1 (s) 1.3 (f) 6.71 (s)
214Bi (pCi/l) 11.2 (f) 39.4 (s) U U<29
40K (pCi/l) 2,860 (f)1 4,390 (s) 1 U U<200
210Pb (pCi/l) 908 (U) (s) 387 (s) U U<1.19
214Pb (pCi/l) 15.2 (s) 30.7 (s) U U<24
228Ra (pCi/l) 32.3 (f) 36.5 (f) U 1.47 (f)
f ‐frac flowback, s – frac source water (1 2% KCL added for Rulison samples) U ‐ not detected
Activities of the analytes included in Table 21 indicate higher maximum and minimum activities for
both the Rulison frac source and flowback water samples than for activities determined for this study
(Table 21). It is worth noting that the Rulison frac source water was conditioned with the addition of
2% KCl as an additive, whereas no KCl was added chemical modifier in the frac source water sampled
from the DJ Basin. Records available on FracFocus website indicate that KCl was not added as a
primary component to any of the eight wells from which a comingled flowback sample was collected
as part of this study. The addition of KCl to the Rulison source waters is presumably responsible for
much if not all of the higher activities for gross beta and 40K in Rulison source waters and in Rulison
flowback waters than in the one 2017 source water and one 2017 flowback sample.
4.1.2 Surface Water, Domestic Groundwater, and Raton Basin and NORM 2017 Produced Water Data
Some NORM‐related analyses of surface water and groundwater, including produced water, are
found in the COGCC environmental database. The NORM‐related analyses of produced water that
predate this study are primarily from CBM produced water in the Raton Basin. Many of the
groundwater and surface water samples with NORM‐related analytes have been collected as part of
voluntary baseline sampling conducted for oil and gas operators. The data discussed below
incorporates data from this study and data from other sources that were found in a query of the
COGCC environmental database. Enough results for metals analysis of Th and U concentrations in
water, activities of two 238U progeny (226Ra and 222Rn) in water, and activities of one 232Th progeny
(228Ra) in water samples were found in the database and will be summarized and discussed below.
The data for domestic groundwater and surface water samples are being used in aggregate and for
comparison. Much of the data in the COGCC database has not received thorough review and
validation and has been received from many sources and many labs. In this report the large data set
will be used for comparison of broad trends and not be used in detailed evaluation of individual
groundwater sources.

Sampling and Analysis of Naturally Occurring Radioactive Material in Oil and Gas Produced Water
COGCC Special Project 10243 63
Metals analyses of water samples for U and Th are found in the COGCC database as summarized
below. A total of 775 results for U reported as concentration (not activity) in water samples were
found in the 23February2018 query. Figure 24 illustrates the minimum, median, mean, and maximum
concentrations for the surface and domestic groundwater samples (detected in 336 out of 658
results), with the same set of statistics shown from the produced water samples (detected in 24
samples out of 117 results). Note that the y‐axis (U concentration) is plotted on a logarithmic scale.
The minimum, median, mean, and maximum concentrations of U are lower in Colorado produced
water samples than the minimum, median, mean, and maximum U concentrations in Colorado
surface water and domestic groundwater sources for which data are available. Overall the
concentration of U in deeper sources such as produced water are lower than the U concentrations in
shallower water sources, including surface water and domestic well groundwater (Figure 24).
Figure 24. Comparison of Domestic Groundwater and Produced Water Uranium Concentrations
Relatively low concentrations of U in groundwater from deeper water sources, such as produced
water in which oxygen has been depleted and in which strongly reducing conditions prevail, was
expected and assumed based on available scientific literature referenced in the Introduction to this
report such as Langmuir (1978), Hem (1992), and IAEA (2003).
Many of the domestic groundwater samples for which data are available were collected in areas of
Weld County. A number of the shallow sandstones known to contain U and that have been
considered as potential sites for in‐situ extraction of U are present in northern Weld County (Reade,
0.01
0.1
1
10
100
1000
Minimum Median Mean Maximum
µg/l
Domestic Well Groundwater and Surface Water (n>detectionlimit = 336, total # results = 658)
Produced Water (n>detection limit = 24, total # results = 117)

Sampling and Analysis of Naturally Occurring Radioactive Material in Oil and Gas Produced Water
COGCC Special Project 10243 64
1978). It is likely that many of the shallow groundwaters are not as depleted in oxygen as produced
water samples. The presence of oxygen or in general of oxidizing conditions favors the dissolution of
U present in the shallow aquifer rocks and sediments (Hem, 1992; IAEA, 2003).
Thorium is generally considered to be relatively insoluble in water but can be present as complexes
with sulfate, phosphate, fluoride, and organic anions (Langmuir and Herman, 1980). A total of 323
results for Th reported as concentration (not activity) in water samples were found in the
23February2018 query, and Table 22 presents the minimum, median, mean, and maximum
concentrations for the surface and domestic groundwater samples (detected in 84 out of 239 results),
with the same set of statistics shown from the produced water samples (detected in 12 samples out of
84 results).
The median, mean, and maximum concentrations of Th are lower in Colorado produced water
samples than the median, mean, and maximum Th concentrations in Colorado surface water and
domestic groundwater sources for which data are available. Dissolved Th concentrations in surface
waters are thought in general to be between 0.01 to 1µg/l (Langmuir and Herman, 1980). The Th
concentrations in shallow groundwater and surface water samples from Colorado mostly fall in the
range reported by Langmuir and Herman (1980).
Table 22. Comparison of Domestic Well Groundwater and Produced Water Thorium Concentrations
Thorium
Domestic Well Groundwater and Surface Water Samples (n>detection limit = 84, total # Th results
= 239)
Produced Water Samples (n>detection limit = 12, total # Th results = 84)
Minimum µg/l 0.030 Minimum µg/l 0.040
Median µg/l 0.715 Median µg/l 0.085
Mean µg/l 0.949 Mean µg/l 0.145
Maximum µg/l 4.5 Maximum µg/l 0.57
range of & median MDL of 239 results µg/l 0.03‐10, 0.55
range of & median MDL of 84 results µg/l 0.2‐2, 0.2
Gross alpha and gross beta analyses of Colorado water samples are found in the COGCC database as
summarized below. A total of 573 results for gross alpha activities and 450 results for gross beta
activities in water samples were found in the 23February2018 query, and Figure 25 illustrates the
minimum, median, mean, and maximum concentrations for the surface and domestic groundwater
samples. Note that the y‐axis (pCi/l) is in a logarithmic scale. Gross alpha activities present above
sample‐specific MDC in 202 out of 415 results and gross beta activities were present above sample‐
specific MDC in 184 out of 293 results found from surface water and domestic well groundwater
sample data. The same set of statistics shown from the produced water samples indicate gross alpha
activities present above sample‐specific MDC in 81 out of 158 results and gross beta activities present
above sample‐specific MDC in 93 out of 157 results available from produced water samples. Gross
alpha and gross beta activities are a general screening analysis for the presence of many
radionuclides but do not provide information regarding the activity of individual radionuclides.

Sampling and Analysis of Naturally Occurring Radioactive Material in Oil and Gas Produced Water
COGCC Special Project 10243 65
The medians, means, and maximums of gross alpha and gross beta activities of produced water
samples are higher than the same statistics for surface and domestic groundwater samples for which
data is present in the COGCC database. The median, mean, and maximum concentrations of U and Th
are both greater in the COGCC database set of surface water and domestic groundwater sample
results than in the COGCC database’s produced water sample results, but as discussed above the
opposite is found for gross alpha and gross beta activities. Analyses of samples for gross alpha and
gross beta activities do not indicate specific isotopes responsible for the measured radioactivity. In
addition, the preparation step for the analysis does not retain gaseous radon isotopes. From the U
and Th metals analytical data, one can infer that the greater range of gross alpha activity present in
produced waters (Figure 25) is not primarily from alpha decay of Th and U isotopes, but from alpha
decay of progeny of U and Th such as 226Ra and 224Ra. As discussed in this report, it has been inferred
that the primary beta emitters responsible for the gross beta activity are 40K (Figure 11) and, as will
be discussed later in this section, 228Ra (Figure 27). The surface water and domestic groundwater
samples may have greater concentrations of U and Th on average than Colorado produced water
samples for which data is available, but presumably the concentrations (inferred from gross beta as
well as from specific Ra isotope activities data to be discussed below) of K and alpha and beta
emitting Ra isotopes are on average greater in produced water samples.
Figure 25. Comparison of Gross Alpha and Gross Beta in Colorado H2O Samples
The COGCC environmental database contains 344 results of 226Ra and 213 analyses of its 222Rn
progeny (22 Feb 2018 query). Both of these radionuclides are progeny of 238U. Radium is thought to
0.1
1
10
100
1000
10000
Minimum Median Mean Maximum
pCi/l
Gross Alpha, Domestic Well Groundwater & SurfaceWater Samples (n>MDC = 202, Total Gross Alpharesults = 415) Gross Alpha, Produced Water Samples (n>MDC = 81,Total Gross Alpha results = 158)
Gross Beta, Domestic Well Groundwater & SurfaceWater Samples (n>MDC = 184, Total Gross Beta results= 293) Gross Beta, Produced Water Samples (n>MDC = 93,Total Gross Alpha results = 157)

Sampling and Analysis of Naturally Occurring Radioactive Material in Oil and Gas Produced Water
COGCC Special Project 10243 66
be more soluble in produced water than either U or Th (parent nuclides) as shown in Figures 1 and 2
(Hem, 1992; IAEA, 2003). Figure 26 is a comparison of the ranges of 226Ra and 222Rn activity data in
the COGCC database from surface water and domestic groundwater sources to data from produced
water sources. Note that the y‐axis (pCi/l) is plotted in a logarithmic scale.
The 226Ra activity of 15 water samples was reported as >MDC out of 136 samples from surface and
domestic well sources. The 222Rn activity of 39 water samples was reported as >MDC out of 44
samples from surface and domestic sources. The 226Ra activity of 138 produced water samples was
reported as >MDC out of 208 samples from produced water sources. The 222Rn activity of 104 water
samples was reported as >MDC out of 169 samples from produced water sources.
Figure 26. Comparison of Domestic Groundwater and Produced Water 226Ra and 222Rn Activities
The median, mean, and maximum activities of 226Ra and of its progeny 222Rn of produced water
samples are lower than the same statistics for surface and domestic groundwater samples for which
data is present in the COGCC database. A hydrocarbon gas phase is present in produced water and
some or much of the radon present in the water in the subsurface may be portioned into natural gas
during the production process and this may be responsible for relatively lower radon activities in
produced water samples in comparison to shallow groundwater samples for which data is available in
the COGCC database. Domestic groundwater samples may be interacting with rocks and sediments
that contain greater concentrations of U and its progeny such as 226Ra and 222Rn which may in part be
responsible for the results shown in Figure 26. As discussed elsewhere in this report with repsect to
0.01
0.1
1
10
100
1000
10000
Minimum Median Mean Maximum
pCi/l
226Ra Domestic Well Groundwater and Surface Water (n>detection limit =15, total # results = 136
226Ra Produced Water (n>detection limit = 138, total # results = 208)
222Rn Domestic Well Groundwater and Surface Water (n>detection limit =39, total # results = 44)
222Rn Produced Water (n>detection limit = 104, total # results = 169)

Sampling and Analysis of Naturally Occurring Radioactive Material in Oil and Gas Produced Water
COGCC Special Project 10243 67
produced water samples, the chemistry of domestic groundwater is in many cases dependent on the
rocks or sediments it has flowed through or in which is now present instead of the manner or style of
drilling or completion processes done to develop the well.
Figure 27. Comparison of Domestic Groundwater and Produced Water 228Ra Activities
The COGCC environmental database contains 350 results of 228Ra analyses (22 Feb 2018 query). Many
of the results from domestic groundwater sources are from less sensitive gamma spectroscopy
analysis with elevated MDC in the range of 20 to 50 pCi/l. Most produced water analyses in the
COGCC database of 228Ra are from GFPC analysis following chemical separation with much lower MDC
(typical range of 1 to 2 pCi/l or less). Figure 27 is a comparison of the 228Ra data in the COGCC
database. Note that the y‐axis (pCi/l) is plotted on a logarithmic scale. Only one domestic
groundwater sample was reported as >MDC out of 136 samples from domestic sources, so no
median, mean, or maximum are plotted. The median and mean of the produced water 228Ra activities
are 2 and 11.6 pCi/l respectively. Both the median and mean activities of the produced water 228Ra
analyses are less than the typical MDCs for the domestic groundwater analyses. 228Ra is the progeny
of 232Th. The presence of 228Ra in samples even when total Th concentrations are very low is
indicative of the assumed greater solubility of Ra than Th in produced waters (Hem, 1992; IAEA,
2003).
224Ra and 220Rn are radionuclides in the 232Th decay chain illustrated in Figure 2. 224Ra was analyzed in
all water samples collected as part of this study. The COGCC database does not contain other
0.01
0.1
1
10
100
1000
Minimum Median Mean Maximum
pCi/l
228Ra Domestic Well Groundwater and Surface Water(n>detection limit = 1, total # results = 136
228Ra Produced Water (n>detection limit = 106, total # results =214)

Sampling and Analysis of Naturally Occurring Radioactive Material in Oil and Gas Produced Water
COGCC Special Project 10243 68
analyses for this Ra isotope or for the 220Rn isotope. The 220Rn isotope has a half‐life of <1 minute
(IAEA, 2003) and would need to be analyzed in the field immediately upon collection.
4.2 Data from Other States
Samples of produced water from Pennsylvania oil and gas wells were analyzed for gross alpha and
gross beta activity as part of a study conducted by contractors to the Pennsylvania Department of
Environmental Protection in 2014 with a revised report released in 2016 (PESI, 2016) and those
samples are listed under the columns labeled PA in Table 23. A 2011 USGS study (Rowan et al., 2011)
gathered new and existing data analyses of produced water from oil and gas wells in Pennsylvania
and New York and summaries of that data are under the columns labeled PA & NY in Table 23. Data
included in the Table 23 statistical summary of PA and NY produced water analyses include data
hand‐compiled from a manual search of Pennsylvania documents from 2009 and 2010 at PADEP
offices by USGS staff (Rowan et al., 2011) as well as data from a New York study (NYDEC, 2009). A
comparison of the ranges of Pennsylvania and New York gross alpha and gross beta activities in
comparison to the ranges of alpha and beta activities of Colorado samples from this study is
presented below in Table 23.
The range of gross alpha activities reported in Table 23 are lower by one to two orders of magnitude
in the Colorado produced water samples than in the Pennsylvania and New York sample data from
the sources listed above. The ranges of produced water gross beta activities in Colorado and
Pennsylvania are more similar than the ranges of gross alpha activities, but the median gross beta of
the Colorado samples collected in this study is lower by more than one order of magnitude than the
PA or PA & NY median gross beta activities.
Table 23. Comparison of CO (this study), PA and PA &NY Ranges of Gross Alpha and Gross Beta Activities in Produced Water Samples
Statistic
gross α gross β
CO PA PA & NY CO PA PA & NY
Minimum pCi/l 1.73 233 14 1.98 113 7
Median pCi/l 40.3 9,760 6,845 81.5 2,300 1,170
Mean pCi/l 130.9 11,500 12,064 316.8 2,660 2,287
Maximum pCi/l 730 41,700 123,000 5,710 7,600 12,000
Std. Deviation pCi/l 188.8 12,800 22,228 911.9 2,460 3,181
n= 47 13 33 44 13 32
PA data from PESI, 2016. PA & NY data from Rowan et al., 2011, NYDEC, 2009 and PADEP, 1992.
Table 24 summarizes reported activities of 226Ra, 228Ra, and 40K in produced water from this study and
from studies conducted in Pennsylvania, New York, and Texas. The columns labeled PA have
summary statistics from the PADEP (PESI, 2016) study and the columns labeled PA (2018) come from
the more recent study by Tasker et al. (2018). Analyses from this data set include 226Ra and 228Ra
activities by gamma spectroscopy. The data in the columns labeled NY come from the NYDEC (1999)
study. Analyses from the 1999 New York dataset include 238U progeny activities, 232Th progeny
activities, and 40K activities, all determined from gamma spectroscopy.

Sampling and Analysis of Naturally Occurring Radioactive Material in Oil and Gas Produced Water
COGCC Special Project 10243 69
Existing data were compiled and new sampling and analysis of produced water from Pennsylvania
and New York oil and gas wells were summarized in a 2011 USGS report (Rowan et al., 2011). The
2011 compilation included the NYDEC (1999) data already summarized. The Table 24 columns labeled
PA & NY have summary statistics for analyses from Pennsylvania and New York but do not include
the NYDEC (1999) data. The other sources of data included in the 2011 compilation include data
hand‐compiled from a manual search of Pennsylvania documents from 2009 and 2010 at PADEP
offices by USGS staff (Rowan et al., 2011) as well as data from a New York study (NYDEC, 2009) and a
Pennsylvania study (PADEP, 1992). Existing data were compiled and new sampling and analysis of
produced water from Texas geothermal and oil and gas wells was summarized in a 1995 report
(Fisher, 1995) by the Texas Bureau of Economic Geology. Analyses from the Texas dataset include 226Ra and 228Ra activities by gamma spectroscopy, and summary statistics from this Texas study are
shown in the columns labeled TX.
Ranges of 226Ra (238U decay chain) are available from this study and the five studies listed above. The
median, mean, and maximum of 226Ra activities from this study are lower than the same statistical
parameters from the four studies in PA, NY, and TX. For example the 226Ra median, mean, and
maximum activities are from the 2016 PA study and are one to two orders of magnitude greater than 226Ra activities in samples collected in Colorado as part of this study. One can surmise that the rocks
in contact with the PA, NY, and TX produced waters contain higher activities of 226Ra, and presumably
also the 238U isotope from which it has decayed, than the 226Ra and 238U activities of rocks in contact
with the produced waters collected as part of the study in Colorado. An alternative hypothesis is that
the geochemistry of the produced water limits solubility of Ra in the formation waters. The alternate
hypothesis and the supposition regarding higher presence of Ra are not mutually exclusive in that the
U content of the producing formation’s rocks and minerals and the geochemistry of the waters in
contact with the producing formation’s rocks and minerals both matter.
Ranges of 228Ra (232Th decay chain) are available from this study and the five studies listed above. The
median, mean, and maximum of 228Ra activities from this study are lower than the same statistical
parameters from the five studies in PA, NY, and TX. For example the 228Ra median, mean, and
maximum activities from each of the other five studies are roughly one to two orders of magnitude
greater than the median, mean, and maximum 228Ra activities in samples collected in Colorado as
part of this study. As with 226Ra, one can surmise that the rocks in contact with the PA, NY and TX
produced waters contain higher activities of 228Ra, and presumably also the 232Th isotope from which
it has decayed, than the 228Ra and 232Th activities of rocks in contact with the produced waters
collected as part of this study in Colorado. An alternative hypothesis is that the geochemistry of the
produced water limits solubility of Ra in the formation waters. The alternate hypothesis and the
supposition regarding higher presence of Ra are not mutually exclusive as discussed above.
Activities of 40K were reported in two of the studies (PA and NY) as shown in Table 24. 40K activities
were greater than the sample‐specific MDC in 5 of 52 samples collected as part of this study, and
summary statistics except for minimum and maximum were not calculated. The ranges of
concentration of K in produced water as well as the activities of its radioactive 40K isotope are more
similar between CO, PA and NY samples than the activities of U and Th‐derived radium isotopes
discussed previously.

Sampling and Analysis of Naturally Occurring Radioactive Material in Oil and Gas Produced Water
COGCC Special Project 10243 70
Table 24. Comparison of CO, PA, NY and TX Ranges of 226Ra, 228Ra and 40K Activities in Produced Water Samples
Statistic
226Ra
alpha spectroscopy at 4781keV
following chemical separation
gamma emission
186keV direct
gamma emission
(inferred from 214Pb or 214Bi)
gamma emission
(inferred from higher of 214Pb
or 214Bi various methods
various methods
CO PA PA (2018) NY PA & NY TX
Minimum pCi/l 0.149 40.5 51 64 0.16 0.1
Median pCi/l 20.45 4,490 506 445 1,040 138
Mean pCi/l 62.6 5,880 439 614 2,427 356
Maximum pCi/l 377 26,600 1,220 3,800 16,920 5,150
Std. Deviation pCi/l 88.8 7,450 315 617 3,607 625
n= 43 13 14 50 93 153
Statistic
228Ra
beta emission of 228Ra progeny
(228Ac) using GFPC following chemical
separation
gamma emission 911keV inferred
gamma emission 911keV
inferred from 228Ac
gamma emission
inferred from highest of
228Ac, 212Pb or 208Tl
various methods
various methods
CO PA PA (2018) NY PA & NY TX
Minimum pCi/l 0.94 26 8 19 0.03 8.2
Median pCi/l 9.65 636 464 565 515 226
Mean pCi/l 18.29 773 719 1,352 607 541
Maximum pCi/l 221 1,900 1,760 24,000 2,589 5,490
Std. Deviation pCi/l 35.4 604 652 3,682 604 1,143
n= 40 13 14 44 88 22
Statistic
40K
gamma emission 1460.75keV direct
gamma emission
1460keV direct
gamma emission direct
CO PA NY Minimum pCi/l 338 15.5 120
Median pCi/l 220 2,000
Mean pCi/l 335 2,259
Maximum pCi/l 2,840 852 6,800
Std. Deviation pCi/l 260 1,502
n= 5 13 50 PA data from PESI, 2016.PA (2018) data from Tasker et al., 2018. NY data from NYDEC, 1999. PA & NY data from Rowan et al., 2011, NYDEC, 2009 and PADEP, 1992. TX data from Fisher, 1995.

Sampling and Analysis of Naturally Occurring Radioactive Material in Oil and Gas Produced Water
COGCC Special Project 10243 71
A limited number of gas samples were collected as part of this study for analysis of 222Rn activity.
Data from the PA study (PESI, 2016) is compared to the limited set of 222Rn activities of Colorado gas
samples in Table 25. The ranges of the two sets of 222Rn activities of gas samples are similar despite
the much higher activities of the radon parent nuclide (226Ra) reported in Pennsylvania produced
water samples. Alpha decay of 226Ra (238U decay chain) is the immediate precursor of 222Rn. As
discussed previously the activities of 226Ra were one to two orders of magnitude greater in the PA
produced water samples. Higher activities of 226Ra should result in higher activities of 222Rn in the PA
samples if collected in the same manner and assuming minimal losses of radon gas during and after
sample collection. We view the PA 222Rn activities as anomalous but do not know enough about the
systems from which the PA gases were collected or the processes of collection, storage, and analysis
of the PA gas samples to hypothesize an explanation of the anomaly.
Table 25. Comparison of CO and PA Ranges of 222Rn Activities in Natural Gas Samples
Statistic
222Rn in natural gas samples
CO PA (2016)
Minimum pCi/l 17.5 3
Median pCi/l 46 41.8
Mean pCi/l 61.2 47.9
Maximum pCi/l 150 148
Std. Deviation pCi/l 53.9 34.5
n= 5 22
PA data from PESI, 2016.
4.3 Data from this Study
Analytical data obtained as part of this study have been described and summarized in Section 3 and
presented in tabular form in the appendices to this report. Discussion of specific and general results
from this study will be found in the next sections under this heading.
4.3.1 Gross Alpha and Gross Beta
Gross alpha and gross beta analyses of all water samples collected as part of this study were
performed. Analyses of individual alpha and beta emitting isotopes were also performed on all water
samples collected as part of this study. Gross alpha and gross beta analyses are not isotope‐specific
analyses but do provide alpha activity and beta activity screening data from non‐volatile
radionuclides present in the samples as discussed in Section 3.1.1. of this study.
Figure 1 and Figure 2 show that 14 isotopes in the decay chains of 238U and 232Th decay by alpha
emission, and 12 of the 14 are non‐volatile. Specific isotope analyses of three of the non‐volatile
alpha emitters were performed on all water samples (226Ra, 224Ra and, 210Po). The sum of the
reported activities of 226Ra, 224Ra, and 210Po (if >MDC) are plotted versus the reported gross alpha
activity of the same sample (if >MDC) in Figure 28. Activities of three U isotopes are included in the
sum for the three samples in which uranium isotopic analyses were triggered (Appendix 4). Reported
activities of 238U, 235U, and 234U were minimal in comparison to gross alpha activity in samples from

Sampling and Analysis of Naturally Occurring Radioactive Material in Oil and Gas Produced Water
COGCC Special Project 10243 72
two produced water samples (439136 – 0.3%, 755653 – 4%). Reported activities of the three uranium
isotopes were approximately 69% of the gross alpha activity of the source water sample (755461).
Uranium concentrations observed by Rosenblum et al. (2017) in frac source water were also much
higher than in produced water samples from the Niobrara Fm. well in which the source water had
been utilized in a hydraulic fracture completion.
The equation to the linear best fit line shown in Figure 28 indicates that approximately 48% of the
gross alpha activity of the samples is accounted for by the sum of the activities of the three isotope‐
specific analyses of alpha emitters. Alpha emitting radon isotopes (222Rn and 220Rn) present would be
lost during the preparation process for the gross alpha analysis. Nine of the non‐volatile alpha
emitters listed in Figures 1 and 2 were not subject to specific chemical separation and analysis and
would be expected to be present in these samples at varying levels. Low levels of naturally occurring
alpha emitters other than in the 238U and 232Th decay chains may also be present including other
uranium and thorium isotopes.
Figure 28. Gross Alpha Activities Versus Sum of 226Ra, 224Ra and 210Po Activities from Samples Collected as Part of this Study
Figure 1 and Figure 2 show that 12 isotopes in the decay chains of 238U and 232Th decay by beta
emission, and each of the 12 are non‐volatile. Specific isotope analyses of two of the non‐volatile
beta emitters were performed on all water samples (228Ra and 210Pb). 40K also decays by beta
emission but is not part of uranium or thorium decay chains. Analysis of 40K was done by gamma
y = 0.4769x + 6.8564R² = 0.7902
0
100
200
300
400
500
600
700
800
0 100 200 300 400 500 600 700 800
226Ra +
224Ra +
210Po (pCi/l)
gross α (pCi/l)

Sampling and Analysis of Naturally Occurring Radioactive Material in Oil and Gas Produced Water
COGCC Special Project 10243 73
spectrometry with limited sensitivity and as was discussed in section 3.5.4.1 the activity of 40K was
above the MDC in only five of the samples collected as part of this study, which are also the samples
with the five highest concentrations of K.
The sum of the reported activities of 228Ra and 210Pb (if >MDC) from specific isotope separations and
analysis are plotted versus the reported gross beta activity of the same sample (if >MDC) in Figure 29.
The concentration of K in each sample collected as part of this study is also plotted (if >MDL) versus
the gross beta activity of the same sample (if >MDC) in Figure 29. The concentration of K is used as an
analog for the concentration of 40K in naturally occurring K, since 0.0117% of the atoms in naturally
occurring K (CIAAW, 2017) are the radioactive isotope (40K).
Figure 29. Gross Beta and Major Beta Emitters from Samples Collected as Part of this Study
The sum of activities of 228Ra and 210Pb account for about 10% of the gross beta activity in samples
collected as part of this study. The activity of 40K accounted for between 40 to 100% of the gross beta
activity for the five samples with highest metals analysis K concentrations (Figure 11).
The gross alpha and gross beta activities in samples collected as part of this study both increase as
the concentration of dissolved solids increase, as illustrated in Figure 8, and the gross beta activity is
strongly correlated to 40K activities, which proportionally increase as a function of K concentration in
samples collected as part of this study.
y = 0.8699x + 16.137R² = 0.9833
y = 0.0732x + 0.2375R² = 0.8688
0
100
200
300
400
500
600
0
1000
2000
3000
4000
5000
6000
0 1000 2000 3000 4000 5000 6000
228Ra + 210Pb pCi/l
K m
g/l
gross beta pCi/l
K
228Ra + 210Pb

Sampling and Analysis of Naturally Occurring Radioactive Material in Oil and Gas Produced Water
COGCC Special Project 10243 74
4.3.2 238U and Progeny
The highest reported activities of four 238U progeny analyzed by isotope‐specific chemical separation
followed by alpha or beta analysis were from one sample facility (755645). The concentration of U
reported from total metals analysis (Appendix 12) was 0.9 µg/l, which was the fourth highest
concentration of U in the seven samples in which U was reported as >MDL. Uranium was reported
above the sample‐specific MDL in six of the produced water samples and in the one source water
sample, and U was reported as <MDL in the other 45 samples collected as part of this study (Table 3).
A recent study (Rosenblum et al., 2017) observed the highest concentrations of U in the Colorado
groundwater source used in hydraulic fracture completion of one Niobrara Fm. well in comparison to
produced water samples collected from one oil and gas well over more than seven months following
completion. As discussed in the Introduction to this report, the geochemical conditions present in
producing formations are likely to control and minimize uranium concentrations in solution
(Langmuir, 1978; IAEA, 2003; Hem, 1992). Uranium concentration data from this study support that
hypothesis in that the highest concentration of U was reported in the shallow source groundwater
sample with much lower concentrations (if detected at all) in produced water samples.
Rosenblum et al. (2017) noted their analyses indicated that parent 210Pb and progeny 210Po were not
in secular equilibrium in water samples collected in the first seven months following hydraulic
fracture completion of a Niobrara Fm. well in Colorado. Figure 30 shows the ratio of 210Pb to 210Po
activities of the only four produced water samples with 210Pb activities >MDC. As discussed in
Rosenblum et al. (2017), the activities of the longer lived parent (210Pb – 23.3 years) and the shorter
lived progeny (210Po – 138.4 days) should be equal if the isotopes present in the water are in secular
equilibrium (Nelson et al., 2015). Figure 30 has a dashed line plotted at equal activities (ratio of 1) of
the two radionuclides. The water‐rock system before drilling and completion would be expected to
be at secular equilibrium due to the length of time (typically tens of million years or more) the
Colorado oil and gas producing formations have been in place in the subsurface and not disturbed.

Sampling and Analysis of Naturally Occurring Radioactive Material in Oil and Gas Produced Water
COGCC Special Project 10243 75
Figure 30. . Ratio of 210Pb Activity to 210Po Activity in Samples with >MDC Activities of 210Pb (this study) Activity ratio of 210Pb to 210Po in samples with reported 210Pb activities >MDC. Dotted line plotted at ratio of 1 as indicator of secular equilibrium. Columns in blue at or near secular equilibrium. Columns in green not in secular equilibrium.
Two of the samples in Figure 30 with both parent and progeny activity ratios near 1 are likely at or
near secular equilibrium and are plotted in blue. The two samples in Figure 30 with much higher
activity ratios of the parent and progeny nuclide (plotted in green), approximately 31 for the sample
from 755541 and 3 for the sample from 755645, indicate a lack of secular equilibrium even if the rock‐
water system in the producing formation may be at secular equilibrium. Rosenblum et al. (2017)
suggested that differences in solubility in water of Pb and Po may be responsible for the apparent
lack of secular equilibrium observed in water analyses. The wells producing the two samples not in
secular equilibrium were not completed by hydraulic fracturing techniques, so the water‐rock system
has not been perturbed as much as in the well sampled by Rosenblum et al. (2017). The two samples
from this study which appear to be in secular equilibrium between parent Pb and progeny Po (755550
and 755657) were completed using hydraulic fracturing techniques, but the completions were
performed 32 years prior to sampling 755550 and 19 and 6 years prior to sampling 755657. Operators of
the wells at the two sampling sites (facilities 755541 and 755645) which are not at secular equilibrium
indicated that scale inhibitor chemical products were used downhole at wells producing water to
755541 and 755645. The operators of the wells at facilities 755550 and 755657, both of which are at or
near secular equilibrium with respect to the parent Pb and progeny Po isotopes, indicated they were
31.5
1.4 1.3
3.5
0
5
10
15
20
25
30
35
755541 755550 755657 755645
Ratio of 210Pb activity/ 210Po activity
Facility
activity ratio = 1

Sampling and Analysis of Naturally Occurring Radioactive Material in Oil and Gas Produced Water
COGCC Special Project 10243 76
not using scale inhibitor products downhole at the time of sampling. The presence of some scale
inhibitor chemical products in a well and the water it produces may enhance the solubility of the Pb
relative to Po, and this may be a cause of the lack of secular equilibrium observed in those two
samples with respect to activities of 210Pb and 210Po. Rosenblum et al. (2017) did not discuss if any
chemical products such as scale inhibitors were used at the well they sampled.
4.3.3 Radon Fractionation Between Gas and Aqueous Phases
Radon is a gas that is produced in the decay chain of both 238U (222Rn) and 232Th (220Rn)and may be
found in the water as well as the oil and gas produced in oil and gas wells, as illustrated in Figures 1
and 2. When radon migrates out of the mix of liquids and gases produced from oil and gas wells, as
gases by design do in liquid/gas separators used in‐line at or near wells, then the progeny of radon
isotopes (also NORM) may more likely be found in gas pipelines or further downstream in gas
processing facilities. Preferential fractionation of radon from natural gas into ethane and propane
streams at gas processing plants has been well documented (Gesell, 1973; Gesell, 1975). To better
understand the fractionation of the 222Rn isotope between the produced water phase and the natural
gas phase, a subset of samples of natural gas and produced water from the same wells was analyzed
for activities of 222Rn. Radon carried in the gas stream could result in presence of its progeny in
production facilities processing gas but not receiving produced water, as discussed by Hem (1992)
and IAEA (2003). 232Th derived 220Rn, 235U derived 219Rn, and 238U derived 218Rn may also be present in
these samples. The relatively short half‐lives (<60s) of these three radon isotopes hinder or preclude
accurate and representative laboratory analysis, and thus activities of 222Rn were used to test
fractionation between gas and water at five sites.
The reported 222Rn activities of the limited sampling of production gases at five sites are shown in
Table 26 with reported aqueous 222Rn activities of produced water samples at the same sites. The
limited data set indicates a slight fractionation preference to the gas phase in sample 755462. No
preference can be determined for the other four samples. There may also be fractionation of radon
into the hydrocarbon liquids at these wells or at gas processing plants. For example, laboratory
studies indicate a strong fractionation of Rn into hexane from nitrogen gas phase as summarized in a
review by Clever (1979). No liquid hydrocarbon samples were analyzed for presence of NORM in this
study.
Table 26. Comparison of 222Rn activities in Gas and Water Samples (this study)
Facility ID COENV DB
Natural Gas Samples Water Samples
222Rn +/‐ TPU pCi/l
MDCpCi/l
DataFlags
222Rn +/‐ TPU pCi/l
MDCpCi/l
Data Flags
755462 70+/‐18 1 22+/‐21 35 U
755475 22.5+/‐6.8 2.6 M3 37+/‐26 41 U
755474 17.5+/‐5.5 2 M3 36+/‐25 39 U
755500 46+/‐12 1 M3 36+/‐22 34 LT
755500 NA 54+/‐23 33
755501 15‐+/‐38 2 M3 26+/‐21 34 U

Sampling and Analysis of Naturally Occurring Radioactive Material in Oil and Gas Produced Water
COGCC Special Project 10243 77
4.3.4 232Th and Progeny
Thorium was reported as >MDL in 3 of the 52 samples collected as part of this study. The 232Th
activity of all samples would be <0.11 pCi/l from the highest not detected concentration of 0.96 µg/l.
The progeny of 232Th were shown in Table 2 of this report.
The highest reported activities of two 232Th progeny analyzed by isotope‐specific chemical separation
followed by beta or alpha analysis were from two sample facilities (755645 – 228Ra and 755657 – 224Ra). A
third progeny of 232Th (212Pb) was analyzed directly in water samples by gamma spectrometry. The
highest 212Pb activity reported as >MDC was in samples from facility 755646. Thorium was not detected
in any of the three samples with the highest reported activities of Th progeny. The relative lack of
solubility of Th under geochemical conditions present in oil and gas producing formations was
discussed in Sections 1 and 3.1.3.2, in references including Hem, 1992; IAEA, 2003; and Langmuir and
Herman, 1980, and as seen in the data from this study.
The relatively greater solubility of Ra in comparison to Th in water present in oil and gas producing
formations was discussed in Sections 1 and 3.1.3.2, in references such as Hem, 1992; IAEA, 2003; and
Langmuir and Riese, 1985, and as seen in data from this study. For example 228Ra was reported as
>MDC in 40 of the samples (beta decay) collected as part of this study, and 224Ra was reported as
>MDC in 20 of the samples (alpha decay) collected as part of this study, even though total Th was
detected in only 3 of the samples.
4.3.5 40K
40K is a naturally occurring radioactive isotope of K, as discussed in Section 1 of this report. Potassium
is relatively abundant in the earth’s crust (1.84% of the crust) (Greenwood and Earnshaw, 1997), and
the natural abundance of the long‐lived radioactive 40K isotope is 0.0117% of the total K
concentration (Meija et al., 2016; CIAAW, 2017). 40K decays primarily by beta decay with lesser
percentage of decay by electron capture, which then produces gamma emission. The amount of 40K
activity present in produced water is directly proportional to the total concentration of K present in
produced water at approximately 0.8 pCi/mg of total K present (National Research Council, 1999).
Figure 11 showed a correlation between activity of the radioactive K isotope and total concentration
of K in produced water samples with 40K activities >MDC by gamma analysis.
4.3.6 General Inorganic Chemistry
A brief overview of the major ion chemistry of the samples collected as part of this study is found in
section 3.2.4 and illustrated in the Piper diagram (Figure 17). Geographic and geologic subsets of the
major ion composition data will be presented and discussed in this section using tools such as the
Piper plot and the Stiff diagram to illustrate compositional differences or possible mixing of fresh
water and formation water (Hem, 1992). Stiff diagrams (Stiff, 1951) provide a means of categorizing
similarities and differences in major ion composition and sources of waters (Hem, 1992). The width of
each component of the Stiff plots is a measure of the concentration of and the charges of (in meq/l),
the major cations (plotted to the left) and the major anions (plotted to the right) in each water.

Sampling and Analysis of Naturally Occurring Radioactive Material in Oil and Gas Produced Water
COGCC Special Project 10243 78
Figure 31. Major Ion Differences Shown on a Stiff Diagram – Williams Fork Fm. Samples (this study) Samples shown in blue in Figure 31 are from wells producing from Williams Fork Fm. Samples show in green in Figure 31 are from centralized E&P waste management facilities which receive water from many wells. Produced water at the two centralized E&P facilities primarily comes from Williams Fork Fm. production. Each polygon is labeled with facility number where the water sample was collected.
Six samples were collected as part of this study from wells reported to be completed in the Williams
Fork Fm. Cole and Cumella (2003), Lorenz (1983), and Hemborg (2000) all classify the producing
sandstones in the Williams Fork Fm. as terrestrial fluvial or fluvial‐deltaic in origin. Completion
records for the wells producing to each of the six of the Williams Fork Fm. sampling facilities indicate
all wells were completed using hydraulic fracture stimulation. Two other samples were collected from
centralized water handling facilities which primarily receive water from oil and gas wells completed in
the Williams Fork Fm. The Stiff diagram (Figure 31) illustrates similarities and differences in the major
ion composition of these eight samples. The sample compositions shown in green are from the two
centralized water handling facilities and are predominantly of Na‐Cl character. Three of the Williams
Fork Fm. samples are also predominantly of Na‐Cl major ion character (755667 and field duplicate as
well as 757071). Three of the Williams Fork Fm. samples have bicarbonate as a significant anion
component other than chloride (757034, 757035, and 757036).

Sampling and Analysis of Naturally Occurring Radioactive Material in Oil and Gas Produced Water
COGCC Special Project 10243 79
The well associated with 755667 is reported to produce from the Cameo coals section of the Williams
Fork Fm., and the well was hydraulically fractured in 2012. Records of production volumes available
on the COGCC website indicate that water equivalent to 42% of the volume used in the stimulation
have been produced to surface. Water volume produced during flowback was not separately
reported but would be expected to increase the percentage returned to surface. The dominant cation
and anion in the samples from this facility are Na and Cl, and not Na and bicarbonate, as might be
expected in water produced from a formation containing coals.
Completion records for the well associated with 755667 do not indicate if the source of the water used
in the frac was fresh water or recycled water. The Frac Focus report for this well indicates that the
frac solution included 2% KCl. At the time of sampling and analysis, the produced water was reported
to contain 28 mg/l K (Appendix 10) or <0.3% of the approximate 10,000 mg/l that would be expected
in a 2% KCL solution used in the well completion. The produced water samples from 2017 are likely
formation water, or the K has been removed by sorption to or reaction with minerals in the Williams
Fork Fm.
As shown in Figure 31, the produced water from facility 757036 has Na and bicarbonate as the
dominant ions, which is a major ion composition typical of water produced from coals. Production
records for the well served by this facility indicate that the volume of water pumped from this well is
approximately 3.6 times greater than the volume of water used in the hydraulic fracture stimulation
of the well, indicating the water and associated chemistry are likely that of all or of some rock units in
the completed interval. The completed interval in the Williams Fork Fm. is over 2,000 feet in length at
this site and may include sections with coals.
The major ion compositions of 10 samples collected at facilities associated with production of oil and
gas from the Niobrara Fm. are shown in Figure 32. Five of the samples (including one duplicate) are
from wells producing from the Niobrara in the GWA and are shown as orange dots (755475, 755500 in
duplicate, 755652 and 755653). Two of the samples are from wells producing what is reported to be
biogenic gas (Rice, 1984) from carbonate horizons in the Niobrara Fm. in eastern Colorado and are
shown as red triangles in Figure 32. Three samples shown as blue circles are produced water samples
from western Colorado wells producing from the Niobrara Fm. The 10 samples of Niobrara Fm.
produced water are all of dominantly Na‐Cl major ion composition.
While the major ion composition of the 10 Niobrara samples is similar, the range of dissolved solids
(TDS in Appendix 14) varies considerably. For example the TDS of water at facility 757037 (Garfield
County) was reported by the lab as 960 mg/l, and the circle around the composition circle for this
sample is so small as to be indistinguishable from the symbol. The TDS of the other two western slope
Niobrara produced water samples (Jackson County) was more the 35 times greater (755648 – 35,000
mg/l and 755647 – 37,000 mg/l) than that reported for the Garfield County Niobrara Fm. produced
water sample.

Sampling and Analysis of Naturally Occurring Radioactive Material in Oil and Gas Produced Water
COGCC Special Project 10243 80
Figure 32. Major Ion Composition of Niobrara Fm. Produced Waters (this study) Shown on Piper Diagram. Samples collected statewide as part of this study. Two samples were collected from eastern Colorado Niobrara wells producing what has been described as biogenic methane and are shown as red triangles. Five samples from wells producing from Niobrara Fm. in the GWA are shown as orange dots. Three samples from wells producing from Niobrara Fm. in western Colorado are shown as blue dots.
A Piper diagram illustrating major ion composition of the subset of eight water samples in which
analyses of 3H activities and 14C (of DIC) ages were performed is shown in Figure 32. The analyses for
tritium in water and 14C of DIC were discussed in sections 3.3 and 3.4 with data in Appendices 8 and
9. Interpretation of the tritium activity data together with the calculated 14C in DIC ages are discussed
in more detail in section 4.3.3.

Sampling and Analysis of Naturally Occurring Radioactive Material in Oil and Gas Produced Water
COGCC Special Project 10243 81
Facility 755461 was a sample of source water to be later used in drilling and completions by one
operator in northeastern Colorado. As shown in Figure 33, the major ions in the source water are Ca
and sulfate with lesser Na, Mg, bicarbonate alkalinity, and Cl, and the source water sample has the
lowest TDS concentration among these eight samples. The circle around the green star symbol for
this sample is so small as to be indistinguishable from the symbol itself. Major ion chemistry of each
sample is shown with a different symbol and color.
Figure 33. Piper Diagram Showing Major Ion Composition of Water Samples with 3H and 14C DIC Analyses (this study). Open circles are scaled to the concentrations of TDS for each sample shown. Colors of the TDS circles match the symbol colors for each sample. A different symbol and color are used to illustrate the anion, cation and overall major ion composition of each sample.
The dominant cation and anion in the other seven samples are Na and Cl, respectively. The seven
other samples include one flowback sample (755476) and six produced water samples. The flowback

Sampling and Analysis of Naturally Occurring Radioactive Material in Oil and Gas Produced Water
COGCC Special Project 10243 82
sample was collected from a facility that was receiving flowback from several wells recently
completed in the Niobrara and Codell Fms. Analytical data for a produced water sample (facility
755523) from eastern Colorado which produces from the Pennsylvanian Topeka Limestone, have minor
amounts of Ca and sulfate present. The presence of more than trace amounts of Ca and sulfate in this
sample may indicate the presence of evaporite minerals such as gypsum or anhydrite in the
formation or in nearby formations in contact with the groundwater produced at this oil well. The oil
well producing to 755523 was not completed by hydraulic fracturing techniques so the water chemistry
can be assumed to be that of the formation. The reported TDS concentration of sample 755523 was the
highest among this subset of eight samples. The five other samples shown on Figure 33 come from
wells that produce from the Sussex Fm., the Niobrara Fm. and the Codell Fm.
4.3.7 Stable Isotopes of Water and DIC
Isotopic composition of the oxygen and hydrogen that make up water (H2O) can be used as a tool in
understanding differences in sources of groundwater. Water isotopic data available from this study
were shown previously in Section 3.3 with water oxygen isotope ratios plotted as the x‐axis and water
hydrogen isotope ratios plotted as the y‐axis (Figure 22). The hydrogen isotope (2H) ratio plotted is
also referred to as deuterium, and the label on the plot of D refers to the ratio of deuterium (2H) to
the more abundant 1H isotope. A general description of stable isotopes of water plots was presented
previously in Section 3.3. Plots of several subsets of samples are presented below to facilitate
discussion and interpretation of the data.
Stable isotopes of water from samples collected in northeastern Colorado as part of this study are
plotted in Figure 34. The data is plotted as groupings by production formation(s) from which the
samples were collected and also by geographic area for water produced from the Niobrara Fm. Two
samples from eastern Colorado Niobrara gas wells plot just above the GWML, and five of the six J
Sand samples plot just below the GMWL as does the source water sample. Ratios of the stable
isotopes of water for the remainder of the samples from several formations listed in the legend for
Figure 34 plot below or well below the GMWL including one flowback sample. The stable isotopes of
water for one GWA Niobrara sample plot intermediate between the GMWL and the bulk of the GWA
samples (755500) and may represent a mix of some formation water with mainly fresh water used in
the frac at this well. At the time of sampling the reported produced water volume was less than 11%
(Table 27) of the fluid volume used in the hydraulic fracture completion (755500). Our one source
water sample may not be representative of all fresh waters used in hydraulic fracture stimulations in
the GWA.
Water isotopic data from aquifers present in the Denver Basin obtained from the literature (>70
samples) and are summarized in Figure 34 as a cigar‐shaped outline of data points with individual
points not shown. The cigar shape is labeled Denver Basin aquifers. Samples from surface to depth
are from water table, Dawson, Denver, Arapahoe, Laramie‐Fox Hills and upper Pierre aquifers with
data from Musgrove et al., 2014 and Allison, 2017.
The flowback sample (755476) was collected within 30 days of the frac completion, and the completion
reports indicate that 95% of the water used in the frac was fresh water. The shallow aquifers (source
water 755461 green triangle) sample water isotope ratio shown in Figure 34 can be considered as an

Sampling and Analysis of Naturally Occurring Radioactive Material in Oil and Gas Produced Water
COGCC Special Project 10243 83
analog for the fresh water used in the completions in the wells producing to facility 755476 (blue
asterisk). The water isotope ratios of comingled Niobrara‐Codell produced water samples (orange
squares) in Figure 34 can be considered as the other end of a mixing line between the fresh water
used in the completion and the formation water. The stable isotope ratios of the produced water
from recently completed Niobrara and Codell wells sampled at 755476 indicate mixing between the
fresh water component of the frac fluid and the native formation waters. The stable isotopes of
water from the flowback sample 755476 indicate a relatively rapid mixing with or exchange of
formation water, as at the time of sampling no more than 1.4% of the frac volume had been returned
to surface (Table 27). The blue dotted line on Figure 34 is to illustrate possible mixing of fresh and
formation waters following the completions of the wells at 755476. Tritium activities of the source
water 755461, the flowback water sample 755476 and of GWA Niobrara sample 755500 were measured
as part of this study and will be discussed in terms of percentage of fresh water present in the
flowback in Section 4.3.8.
Figure 34. Stable Isotopes of Water Plot of Northeastern Colorado 2017 NORM Study Samples Global Meteoric Water Line from Craig, 1961, Rozanski et al., 1993, Pawnee Meteoric Water Line from Harvey, 2005. The isotopic ratio of deuterium (2H) in water from samples collected as part of this study relative to Vienna standard mean ocean water reference is plotted against the y‐axis. The isotopic ratio of 18O (oxygen) in water from samples collected as part of this study relative to Vienna standard mean ocean water reference is plotted against the x‐axis. The composition of the reference standard mean ocean water is plotted as VSMOW. The cigar shaped outlined in blue dots and labeled Denver Basin aquifers encompasses water isotopic
755461
755500
755476
NB‐CD
NB‐CD
VSMOW
‐130
‐120
‐110
‐100
‐90
‐80
‐70
‐60
‐50
‐40
‐30
‐20
‐10
0
10
‐18 ‐16 ‐14 ‐12 ‐10 ‐8 ‐6 ‐4 ‐2 0 2
δD (‰
VSM
OW)
δ18O (‰ VSMOW)
shallow aquifersSussexE CO NiobraraGWA Niobraraflowback NB‐CDNB‐CDCodellNB/CD/JJ SandD sandLyonsGlobal Meteoric Water Line ( δD = 8 * δ18O + 10 ) (Craig, 1961)Pawnee Meteoric Water Line ( δD = 7.86 * δ18O + 7.66 ) (Harvey, 2005)

Sampling and Analysis of Naturally Occurring Radioactive Material in Oil and Gas Produced Water
COGCC Special Project 10243 84
data from shallow water table aquifers down to the upper Pierre aquifer and also includes data from Dawson, Denver, Arapahoe, Laramie‐Fox Hills aquifers. Data for Denver Basin aquifers is from Musgrove et al., 2014 and Allison, 2017.
The stable isotopes of water data from samples collected in northwestern Colorado as part of this study are plotted in Figure 35. The data is plotted as groupings by production formation(s) from which the samples were collected. Two samples from water collections systems in the Parachute and Hunter Mesa areas (yellow asterisk), two samples from the Mancos Fm. (blue asterisk), and three samples from the western Colorado portion of the Niobrara Fm. (blue crosses) plot well to the right of the GMWL. Sample 757072 plots furthest to the right of the GWML. The well completed in the Mancos Fm. that produces to facility 757072 was completed using hydraulic fracturing in 2011 using 100% recycled produced water and had produced approximately 220% of the frac volume as produced water at the time of sampling. The second sample collected from a Mancos Fm. well sampled as part of this study was completed in 2014 by hydraulic fracture techniques using 31.9% recycled produced water and 67.8% fresh water and had produced approximately 104% of the frac volume as flowback and produced water at the time of sampling. The results of the stable isotopes of water from the two Mancos Fm. samples likely are representative of formation waters as is the major ion chemistry.
Figure 35. Stable Isotopes of Water Plot of NORM 2017 Northwest CO samples (this study)
755667755667
757036
757035757034
757071
755647
755648
757037755666
757072757033
757038
VSMOW
‐140
‐130
‐120
‐110
‐100
‐90
‐80
‐70
‐60
‐50
‐40
‐30
‐20
‐10
0
‐20.0 ‐18.0 ‐16.0 ‐14.0 ‐12.0 ‐10.0 ‐8.0 ‐6.0 ‐4.0 ‐2.0 0.0 2.0 4.0
δD (‰
VSM
OW)
δ18O (‰ VSMOW)
Williams Fork
Niobrara
Mancos
Morrison/Sundance
water collection systems
Global Meteoric Water Line ( δD = 8 * δ18O + 10 ) (Craig, 1961)

Sampling and Analysis of Naturally Occurring Radioactive Material in Oil and Gas Produced Water
COGCC Special Project 10243 85
Global Meteoric Water Line from Craig, 1961, Rozanski et al., 1993. The isotopic ratio of deuterium (2H) in water from samples collected as part of this study relative to Vienna standard mean ocean water reference is plotted against the y‐axis. The isotopic ratio of 18O (oxygen) in water from samples collected as part of this study relative to Vienna standard mean ocean water reference is plotted against the x‐axis. The composition of the reference standard mean ocean water is plotted as VSMOW.
The stable isotope ratios of six water samples from five Williams Fork Fm. wells (one duplicate) are
plotted in Figure 35. The stable isotope ratios from Williams Fork Fm. samples plot near the GWML.
The major ion chemistry of the same six samples was previously plotted in Figure 31 on Stiff diagrams
with three of the six having Na and Cl as the dominant major cation and anion, respectively, and the
other three having Na‐bicarbonate along with chloride as dominant major ions. The stable isotope
ratios do not vary greatly even though the solutes in the water do vary significantly. Production
records for the well served by facility 757036 indicate that the volume of water pumped from this well
is approximately 3.6 times greater than the volume of water used in the hydraulic fracture
stimulation of the well. The stable isotopes of water for this sample plot close to the meteoric water
line, and together with the greater produced water volume relative to frac volume, indicate the water
and associated major ion chemistry (Na‐bicarbonate) are likely representative of some rock units in
the completed interval of this Garfield County well completed in the Williams Fork Fm.
Figure 36. Stable Isotopes of Water Plot of NORM 2017 Samples with Na/Cl Molar Ratio >1.29 Global Meteoric Water Line from Craig, 1961, Rozanski et al., 1993. The isotopic ratio of deuterium (2H) in water from samples collected as part of this study relative to Vienna standard mean ocean water reference is
755461215820 215628
215628
299153285562
755658
757036
757035
755657
149017
755557
755590
755591
755592
755593
VSMOW
‐140
‐130
‐120
‐110
‐100
‐90
‐80
‐70
‐60
‐50
‐40
‐30
‐20
‐10
0
‐20 ‐18 ‐16 ‐14 ‐12 ‐10 ‐8 ‐6 ‐4 ‐2 0 2
δD (‰
VSM
OW)
δ18O (‰ VSMOW)
shallow aquifers
CBM
755658
Williams Fork
Mesa Verde/Mancos/Dakota
J sand
Morrison/Sundance
Global Meteoric Water Line ( δD = 8 * δ18O + 10 ) (Craig, 1961)VSMOW

Sampling and Analysis of Naturally Occurring Radioactive Material in Oil and Gas Produced Water
COGCC Special Project 10243 86
plotted against the y‐axis. The isotopic ratio of 18O (oxygen) in water from samples collected as part of this study relative to Vienna standard mean ocean water reference is plotted against the x‐axis. The composition of the reference standard mean ocean water is plotted as VSMOW.
Facility 755667 (Mesa County) was sampled in duplicate after approximately 42% of the frac volume
had been returned to the surface as produced water, but the records do not indicate the source of
the frac water at this well. The stable isotopes of water for the sample and duplicate plot very close
to the GWML (Figure 35), but the major ion chemistry is dominantly Na‐Cl unlike the Garfield County
Williams Fork Fm. sample from 757036, discussed above and illustrated in the Stiff diagram (Figure 31).
The major ion chemistry differences in 755667 may be due to the presence of relict water from the
hydraulic fracture stimulation fluids to which KCl and HCl had been added. The major ion and stable
isotope of water data from the 757036 indicate that relict seawater was not present in the Williams
Fork Fm. accessed by the well that produces to 757036. The Cl/Br mass ratio data (Figure 19) and the
Na/Cl molar ratio data (Figure 20) for sample 757036 support this conclusion. The variability in major
ion composition of Williams Fork Fm. produced waters cannot be explained with the data we have at
present. The producing sandstones of the Williams Fork have been classified as terrestrial origin by
Cumella (2003), Lorenz (1983), and Hemborg (2000) and in which originally there was connate fresh
water but there may have been recharge events in in parts of the Piceance Basin which contained
water derived from marine sources or rocks deposited in marine systems with connate sea water.
The stable isotopes of water for the subset of samples collected as part of this study with Na/Cl molar
ratios >1.29 are plotted in Figure 36. The present day seawater Na/Cl molar ratio is 0.859 using
composition data compiled by Pilson (2013) as discussed in section 3.1.4 and the entire set of Na/Cl
ratios from this study is shown in Figure 20. The data is plotted as groupings by production
formation(s) or type of production formation (CBM) from which the samples were collected. A
general interpretation of the source of solutes in water samples with Na/Cl ratios significantly greater
than that of seawater is that those waters have no major contributions from relict seawater. The
stable isotopes of water from 13 of the 18 samples with Na/Cl ratios >1.29 plot on or very close to the
GWML, indicating that the sources of water in the 13 are likely of meteoric origin with little
contribution of water from relict seawater. The 13 include 5 samples from CBM production, 5
samples from J Sand Fm. production, 1 sample from Morrison Fm. production, 1 from Williams Fork
Fm. production, and the source water sample. Replicate samples from sample 755658 plot well below
the line, and likely sources of this water which may not be produced water were discussed in Section
3.1.4. The three remaining samples plotted in Figure 36 are from the Williams Fork Fm., J Sand Fm.,
and a well completed in the Dakota, Mancos, and Mesa Verde Fms., and may have some component
of relict seawater based on the water isotope data.
Stable isotopes of water for eight samples (one duplicate) with Cl/Br ratios >400 and with Na/Cl ratios
similar to that of seawater collected at seven facilities as part of this study are plotted in Figure 37.
The major ion chemistry of these samples was discussed in section 3.1.4. Each of the samples with
Cl/Br ratios >400 are produced water from Paleozoic era formations and have relatively high
concentrations of TDS, as discussed in Section 3.1.4. None of these wells were completed using
hydraulic fracture techniques, so there is no need to consider mixing of frac water with formation
waters in the discussion of the origin of the water or the solutes present in the water from these
wells.

Sampling and Analysis of Naturally Occurring Radioactive Material in Oil and Gas Produced Water
COGCC Special Project 10243 87
Figure 37. Stable Isotopes of Water NORM 2017 Samples with Cl/Br Mass Ratio >400 and Na/Cl Molar Ratio Similar to Seawater Global Meteoric Water Line from Craig, 1961, Rozanski et al., 1993. The isotopic ratio of deuterium (2H) in water from samples collected as part of this study relative to Vienna standard mean ocean water reference is plotted against the y‐axis. The isotopic ratio of 18O (oxygen) in water from samples collected as part of this study relative to Vienna standard mean ocean water reference is plotted against the x‐axis. The composition of the reference standard mean ocean water is plotted as VSMOW.
While the solutes in each of these groundwater samples appear to be related to evaporite minerals or
relict seawater or both, the stable isotopes of water in three of the samples plot near the GMWL. The
stable isotopes of water from two samples produced from Mississippian Leadville Limestone carbon
dioxide wells and from one eastern Colorado Mississippian limestone oil well are similar to modern
meteoric waters. Water samples with stable isotopes similar to meteoric water but with solutes
similar to seawater (Na/Cl) ratio and evaporite dissolution (Cl/Br) could result from relatively
geologically recent recharge of meteoric water followed by interactions with and dissolution of
minerals in the recharge path towards the wells. The cap rocks of the McElmo Dome field are salt‐
bearing units in the overlying Paradox Fm. (Gilfillan et al., 2008), which is the likely source of the
solutes in the water samples collected from the Leadville Limestone. Cappa and Rice (1995)
suggested the source of the carbon dioxide in McElmo Dome was contact metamorphic degradation
755661 755662
755522
755541
755659
755523
755523
755645
VSMOW
‐140
‐130
‐120
‐110
‐100
‐90
‐80
‐70
‐60
‐50
‐40
‐30
‐20
‐10
0
‐20.0 ‐18.0 ‐16.0 ‐14.0 ‐12.0 ‐10.0 ‐8.0 ‐6.0 ‐4.0 ‐2.0 0.0 2.0
δD (‰
VSM
OW)
δ18O (‰ VSMOW)
Leadville Limestone
Mississippian
Osage
Cherokee
Topeka
Lyons
Global Meteoric Water Line ( δD = 8 * δ18O + 10 ) (Craig, 1961)

Sampling and Analysis of Naturally Occurring Radioactive Material in Oil and Gas Produced Water
COGCC Special Project 10243 88
of carbonate minerals in the Leadville Limestone. Carbon dioxide derived from deeper magmatic
(mantle) sources based on rare gas geochemistry was later suggested as the carbon dioxide source by
Gilfillan et al. (2008), who also concluded that the produced water in the field had been in contact
with atmospheric gases indicating a likely meteoric origin of the produced water. The stable isotopes
of water data gathered as part of this study supports this conclusion.
Analysis of tritium activities and of 14C of DIC ages was performed on a subset of eight samples from
this study, as discussed in Sections 3.4 and 3.5, as part of an effort to understand if these tests might
be useful in understanding the sources of produced water from formations in the state as shown in
Figure 22. Specifically, analyses of water stable isotopes have been effectively used to differentiate
water sources in recently completed wells in the Permian Basin (Laughland et al., 2014) and in Saudi
Arabia (Birkle, 2016a; 2016b) and was seen in this study and discussed previously in this section
(Figure 34). The stable isotopes of water (D and H) of this subset are plotted on Figure 38.
Figure 38. Stable Isotopes of Water Plot of NORM 2017 Samples with 3H of Water and 14C in DIC Analyses Global Meteoric Water Line from Craig, 1961, Rozanski et al., 1993. The isotopic ratio of deuterium (2H) in water from samples collected as part of this study relative to Vienna standard mean ocean water reference is plotted against the y‐axis. The isotopic ratio of 18O (oxygen) in water from samples collected as part of this study relative to Vienna standard mean ocean water reference is plotted against the x‐axis. The composition of the reference standard mean ocean water is plotted as VSMOW.
755461, source water
755476, Niobrara, Fort Hays, Codell, Carlile
755501, Niobrara, Codell
755475, Niobrara 755474, Codell
755500, Niobrara
755523, Topeka,
755462, Sussex
VSMOW
‐110
‐100
‐90
‐80
‐70
‐60
‐50
‐40
‐30
‐20
‐10
0
10
20
30
‐16 ‐14 ‐12 ‐10 ‐8 ‐6 ‐4 ‐2 0 2
δD (‰
VSM
OW)
δ18O (‰ VSMOW)
755461, source water
755476, 94.6% fresh water, 8 wells, 1 frac each, 1.5% frac volumereturned in <30days, Niobrara, Fort Hays, Codell, Carlile755501, 100% fresh water, 4 wells, 7 fracs, >45.4% frac volume returnedin 8 to 25 years, Niobrara, Codell755475, 99.0 fresh water, 1 well, 1 frac, 4.5% frac volume returned in 10months, Niobrara755474, 99.4% fresh water, 1 well, 1 frac, 17.9% frac volume returnedin 9 months, Codell755500, 100% fresh water, 1 well, 1 frac, 10.6% frac volume returned in16 months, Niobrara755523, no frac, >3,255000 bbl water produced in 24 years, Topeka
755462, 100% fresh water, 4 wells, 1 frac each, >1580% frac volumereturned in 20 years, SussexGlobal Meteoric Water Line ( δD = 8 * δ18O + 10 ) (Craig, 1961)

Sampling and Analysis of Naturally Occurring Radioactive Material in Oil and Gas Produced Water
COGCC Special Project 10243 89
The example source water sample (755461) plots as distinctly different stable isotopes of water ratios
than any of the produced water sample plotted in Figure 38. The water stable isotope ratios of the
example source water are similar to those of near surface and shallow aquifer groundwater in the
Denver basin (Musgrove et al., 2014; Allison, 2017) as shown in Figure 34. The flowback sample
(755476) was sampled from a site that comingled produced water from eight wells. All of the wells
flowing to 755476 were hydraulically fractured fewer than 30 days prior to sampling. In total <1.4% of
the volume of fluids used in the fracs had been returned to surface at the time of sampling (Figure 38
and Table 27). About 95% of the frac fluids used at this site were fresh water with about 5% recycled
produced water and with minor amounts of hydrochloric acid. No discrete sample of the water used
in the fracs at facility 755476 is available to compare with the flowback. The example source water
sample will be used as a basis for comparisons because it is believed to be typical of fresh waters
used at present in the Wattenberg field and by the operator of 755476 wells. For example, the ratios of
the stable isotopes of water for the flowback sample (Figure 38) are much different than those of the
example source water (facility 755461), indicating a rapid mixing with free formation water or with
water held in formation pores or sorbed to clay minerals is likely to have occurred. The stable carbon
isotope ratios of the DIC in the example source water sample also show a rapid change from negative
to positive delta 13C DIC of flowback samples from facility 755476, as shown in Figure 23 in Section 3.3,
in comparison to the example source water. A further discussion of tritium activities and 14C of DIC
ages of the samples included in the subset of Figure 38 is presented in Section 4.3.8.
The water stable isotope ratios of samples 755462 and 755523 are assumed to be representative of the
formations that are produced by the well at each facility. The well at 755523 (Topeka Limestone) was
not hydraulically fractured so no large amounts of water from another source were introduced into
that well (Figure 38 and Table 27). Sample 755462 was completed by hydraulic fracturing techniques,
but since completion, the wells producing to this facility have produced water volumes equivalent to
more than 15 times the volumes of fresh water fluid introduced to the Sussex Fm. in and around the
four wells producing to this facility.
The other four facilities sampled and plotted on Figure 38 all produce from Niobrara or Codell
completions. Sample 755500 has stable isotopes of water ratios that plot closer to the GMWL than any
of the samples in Figure 38 other than the source water sample. Both oxygen and hydrogen isotope
ratios of water in the produced water sample from 755500 are more positive (heavier) than shallow
groundwater samples from the Denver Basin (Musgrove et al., 2014; Allison, 2017), which indicates in
this and all other samples in Figure 38 that there has been significant interaction with formation
water in each of the wells in which fresh water was used in hydraulic fracture well completions.
4.3.8 Tritium in H2O and 14C of DIC
Tritium in H2O and 14C of DIC are geologically relatively short lived radioactive (non‐NORM) analytes.
The levels of activities of these analytes in conjunction with stable isotopes of water and major ion
chemistry are used to help evaluate the hypothesis stated in the SAP for this project (COGCC, 2017a)
that much of the water produced to the surface from wells drilled and completed in the Niobrara and
Codell Fms. is not native formation water but comes from the source water used in hydraulic fracture
well completions. The presence of, as well as the activity levels of, tritium in produced water can be
used as a transient tracer of water sources that have been at the earth’s surface in the last 50 to 60

Sampling and Analysis of Naturally Occurring Radioactive Material in Oil and Gas Produced Water
COGCC Special Project 10243 90
years. This study treats tritium like a conservative tracer (in the short term) even though it is
radioactive and continually undergoing decay, as chloride and bromide are treated as conservative
tracers in earlier discussions of sources of solutes present in produced water (Section 3.1.4).
The activities of tritium and 14C in DIC were determined in an eight sample subset of the 52 samples
collected along with the NORM and major ion chemical analyses. The eight sample subset consisted
of one source water sample (755461), one flowback sample (755476), produced water from one eastern
Colorado well that records indicated had not been hydraulically fractured (755523), and produced
water from one Sussex Fm. well (755462) and four Niobrara, Codell or comingled Niobrara‐Codell Fm.
wells completed over the last 25 years (755501, 755475, 755474, and 755500). As it is not possible to have
tritium measurements of each source water used in completing any of the seven wells with data in
Table 27, the fraction of tritium relative to the example source water is considered to be an
approximate fraction of fresh water in the produced water samples. The fraction of tritium activity in
each of the seven produced water sample compared to the tritium activity of the example source
water is shown in Table 27.
The 3H and 14C in DIC results are summarized in Table 27 in order of descending activity of tritium.
Tritium was not detected in produced water from the eastern Colorado well that had been treated
with 12 barrels (bbl) of acid in the perforated zone but not been completed by hydraulic fracture
stimulation. The well producing to 755523 has produced more than 3,250,000 bbl of produced water
since completion. Tritium was not detected in the comingled water produced from four Sussex Fm.
wells that were stimulated 20 years prior to sampling(755462), indicating the 100% fresh water frac
volume has been completely returned to the surface or some fraction could still be trapped in the
formation. The cumulative produced water volume at the time of sampling from the four Sussex wells
is >16 times the total volume of fluids used in the well stimulations, and the low activity of tritium in
this sample is not unexpected, as the water appears to be water from the formation. The two
produced water samples in which tritium was not detected also had the sixth and seventh oldest 14C
of DIC apparent ages, which supports the conclusion that little or no fresh water from fracs or the
surface is being produced from these sites, based primarily on the low tritium activities reported by
the lab. The stable isotopes of oxygen and hydrogen of H2O in the two produced water samples in
which 3H was not detected also fall well below the local and global meteoric water lines (Figure 38),
which also supports the conclusion that both are primarily formation water.

Sampling and Analysis of Naturally Occurring Radioactive Material in Oil and Gas Produced Water
COGCC Special Project 10243 91
Table 27. 3H and 14C in DIC, Water Source of Frac, Time after Frac and % of Frac Returned to Surface as Produced Water (this study)
Facility # COENV DB
3H H2O TU (tritium units)
fraction of 3H in PW compared to example source H2O
14C DIC (pmc ‐ % modern carbon)
14C DIC Age (years BP)
% of fresh water, % acid and volume of
water in frac
time since frac(s) at sampling
Primary rock type()s in production
zones
Sum of produced water
at time of sampling as % of frac fluid used
755461
6.71
102.63 60 source water ‐ near surface aquifer
‐
755476 4.13 0.62 1.31 34,840 94.6% fresh water, 0.4% acid, 8 wells, 1 frac
each, 117,0347 bbl total
<30 days carbonate, shale and sandstone
1.4
755501 2.81 0.42 11.88 17,115 100% fresh water, 4 wells, 7 fracs, 25,563 bbl
total
25, 10 and 8 years
carbonate, shale and sandstone
45.4
755475 2.74 0.41 0.44 43,600 99.0 fresh water, 0.3%acid, 1 well, 1 frac,
147,455 bbl
10 months carbonate and shale
4.5
755474 1.91 0.29 1.13 36,030 99.4 fresh water, ).2% acid, 1 well, 1 frac,
95,479 bbl
9 months sandstone and carbonate
17.9
755500 1.66 0.25 6.85 21,540 100% fresh water, 0% acid, 1 well, 1 frac,
78,659 bbl
16 months carbonate and shale
10.6
755523 U (‐0.01) 0.64 40,500 no frac carbonate ‐
755462 U (‐1) 0.69 39,900 100% fresh water, 4 wells, 4 fracs, 88, 126
bbl total
20 years sandstone 1580

Sampling and Analysis of Naturally Occurring Radioactive Material in Oil and Gas Produced Water
COGCC Special Project 10243 92
Tritium activities were above detection limits in six of the eight samples collected, as discussed in
section 3.3. The source water sample (755461) had the highest 3H activity and the youngest 14C of DIC
age. The source water sample was collected to illustrate an example for near surface, modern
groundwater that one operator uses in completion operations, but water from this site was not
necessarily used in completions at any of the sites sampled in this project. The frac flowback sample
(755476) had the second highest 3H activity of about 62% of the example source water, which is to be
expected from the reported use of 95% fresh water in the fracs completed fewer than 30 days prior
to sampling. The frac flowback sample (755476) has the fourth youngest 14C of DIC apparent age
despite the reported use of nearly 95% fresh water in the fracs completed fewer than 30 days prior to
the sampling event. The inorganic carbon dissolved in the produced water samples can be from
sources other than the predominantly fresh water used in the frac for several reasons which are
discussed below.
Carbon dioxide is present in gas samples from most producing zones in the state and can readily and
rapidly dissolve in the produced water. That carbon dioxide intrinsically present in the hydrocarbon
gases can be assumed to be geologically “old.” Data available from the COGCC environmental
database for production gas samples from Weld County have a median carbon dioxide concentration
of 2 mole percent (mol%) (1,028 samples on 28September2018) with a median δ13C CO2 of 2.79 per
mil VPDB (318 samples on 28September2018). The gaseous carbon dioxide can be assumed to be
geologically “old” and also to interact with, dissolve into, and exchange with fresh water introduced
into the producing formations. Carbonate minerals and organic material in producing formations are
also likely sources of geologically “old” carbon in flowback or produced water. Water present in the
pore space of the producing formation is also expected to have geologically “old” DIC, which may
exchange or dissolve into the frac fluid before returning to the surface. Carbonate minerals are
approximately 70% or more of the productive chalk zones with in the Niobrara Fm. (Pollastro, 1992;
Sonnenberg, 2016) in portions of the Denver basin. Interactions between aqueous fluids, carbon
dioxide gas, and carbonate minerals are likely to alter the 13C isotopic ratio of DIC of produced waters
as well as increase the apparent 14C age of the DIC in produced waters when fresh waters are used to
make hydraulic fracture fluids. Hefton (2015) measured carbon isotope ratios of 718 Niobrara
carbonate mineral samples and described a δ13C range between 0 and 2.5 per mil VPDB of carbon in
the carbonate minerals in the Niobrara. Nakamura (2015) analyzed Niobrara Fm. core samples and
also compiled carbon and oxygen isotope data of Niobrara carbonate rocks from the literature, which
showed a slightly greater range of δ13C between ‐2 to 3.5 per mil VPDB of carbon in the carbonate
minerals in the Niobrara. The reported range of Niobrara Fm. δ18O in carbonate minerals (Nakamura,
2015) was between 0 to ‐20 per mil VPDB (not VSMOW as for water samples in this report).
The stable carbon isotope ratios of the DIC flowback samples also indicate a rapid change from
negative to positive delta 13C of DIC in comparison to the example source water. As shown in Figure
23 and Section 3.3, this indicates the DIC in the flowback is in part from sources other than the
reference (example) source fresh water. Completion reports for the eight wells contributing flowback
to sample 755476 indicate that 0.4% of the fluids used were acids, with a greater relative percentage
used in Niobrara Fm. horizontals than in Codell Sandstone Fm. horizontals at the location. Acid‐
induced dissolution of carbonate minerals in the chalk horizons of the Niobrara Fm. would release to
solution geologically “old” inorganic carbon. Interactions of the frac fluid with water, gas, and rocks in

Sampling and Analysis of Naturally Occurring Radioactive Material in Oil and Gas Produced Water
COGCC Special Project 10243 93
the formation would alter the apparent 14C of DIC age towards older than recent. The apparent 14C of
DIC age for sample of flowback is much older than what would be calculated simply based on the
relative activity of tritium in the flowback sample (≈62%) in comparison to the tritium activity of the
source water sample. As discussed in Section 3.2.4 and illustrated in Figure 19, relatively low Cl/Br
mass ratio of the flowback water and other recently completed wells also supports the explanation of
the presence of significant amounts of fresh water in the frac fluid. In agreement with these
observations, the recent study of Rosenblum et al. (2017) observed a Cl/Br mass ratio of 69.1 in
produced water about eight months after the hydraulic fracture completion of one well producing
from the Niobrara Fm. in northeastern Colorado in which fresh water was used as base of the frac
fluid.
Sample 755501 had the third highest tritium activity and the second youngest 14C of DIC apparent age.
The set of four wells whose produced water is comingled in the production facility where the sample
was collected vary in time of completion between 25 and 8 years prior to sampling, with two of the
four wells having been fracture stimulated more than once.
The cumulative produced water volume as a fraction of the sum of fluids used in the multiple frac
jobs at the time of sampling was 45%. The four wells were shut in for several months in early 2016
while nearby horizontal wells were completed. The reported produced water volumes were much
greater following the return to production of three of the four wells that the facility serves, as shown
in Figure 39. Produced water volumes from 05‐123‐25209 remained relatively constant between
2015 reports and late 2016 to early 2017 reports. The sudden increase in monthly produced water
volumes at the other three wells that produce water to facility 755501 is hypothesized to be the result
of hydraulic fracture stimulations of nearby horizontal Niobrara Fm. wells. The horizontal wells
closest to the three older wells in Figure 39 that show increased water production in late 2016 and
early 2017 were reported on Frac Focus as using 100% fresh water in the completions which were
done in January 2016.
Fresh water used in the completions on nearby horizontal Niobrara Fm. wells may have introduced
water with higher tritium activities than one would expect in wells isolated from near surface
recharge and which were completed more than 8 years prior to sampling with recovery as produced
water of 45% or more of introduced fluid volume. The 14C of DIC age calculated for this sample is the
youngest of the six produced water samples 14C analysis.

Sampling and Analysis of Naturally Occurring Radioactive Material in Oil and Gas Produced Water
COGCC Special Project 10243 94
Figure 39. Reported Water Production from the Four Wells which Produced to Facility 755501 in the 28 Months Prior to and Including the Sampling Event
The produced water sample from the separator at 755475 is of water produced from the Niobrara Fm.
and has the oldest reported apparent 14C of DIC age among the produced water samples. The activity
of 3H in this sample is the third highest of the six produced water samples or approximately 40% of
the activity of tritium measured in the source water sample. The frac fluid used at the well served by
the separator was indicated as >99% fresh water on the completion report. The 3H levels of the
produced water from 755475 (Niobrara Fm.) and the nearby Codell Fm. sample (755474) are
approximately 41% and 29%, respectively, of the example source water activity of 3H. The wells
producing to 755475 and 755474 had been completed using hydraulic fracture techniques using 99%
fresh water fewer than 10 months prior to sampling, but both have relatively old 14C of DIC ages, and
the stable isotopes of water are not similar to the example source water. The waters from both 755475
and 755474 have positive stable carbon isotope ratios of the DIC like the flowback sample and unlike
the source water sample. A relatively rapid change from negative to positive delta 13C of DIC as shown
in Figure 23 in Section 3.3 indicates the DIC in the samples at 755475 and 755474 are in part from
sources other than example source fresh water.
Tritium activities of produced water, together with stable isotope ratios of water, are useful tools in
aiding the understanding of mixing of frac waters and formation waters in the subsurface as well as in
understanding what water is being returned to the surface at least for a period of several years after
use of fresh water in hydraulic fracturing processes. The 14C of DIC ages of samples from wells
0
50
100
150
200
250
300
350
400Monthly Produced W
water (bbl)
Production Month Starting Date
123‐29229123‐10860123‐29555123‐25209

Sampling and Analysis of Naturally Occurring Radioactive Material in Oil and Gas Produced Water
COGCC Special Project 10243 95
completed with fresh water fracs are not indicative of the ages of the water due to rapid exchange of
carbon dioxide between gases in the producing formation and the injected water and also due to
exchange of carbon dioxide between the injected water and carbonate minerals in producing
formation. Hydraulic fracture stimulation of four wells listed in Table 27 utilized acids as a small
fraction of the liquids injected (755476, 755475, 755474, and 755500). Carbonate minerals are
approximately 70% or more of the productive chalk zones with in the Niobrara Fm. (Pollastro, 1992;
Sonnenberg, 2016) in portions of the Denver basin, and the four wells listed above are all completed
in the Niobrara Fm. Dissolution of carbonate minerals present in producing zones of the Niobrara Fm.
is expected to be induced by the presence of acids in the fracture fluid. The dissolution of geologically
old carbonates would also increase the apparent age of DIC in any produced water samples from
those wells in which acid was a portion of the frac fluid.

Sampling and Analysis of Naturally Occurring Radioactive Material in Oil and Gas Produced Water
COGCC Special Project 10243 96
5. SUMMARY
The COGCC conducted Special Project 10243 to gain a better understanding of the activities of NORM
in aqueous E&P wastes statewide. Produced fluids (mainly water with occasionally minor quantities
of organic liquids present) were chosen as the subject of this study as those fluids are the E&P waste
produced in greatest volumes. Produced water is a primary source of NORM found as sediments and
scale present in storage tanks, in pipes and in gas and produced water processing facilities. For this
study, any water emerging from the well is considered to be produced water, even if was previously
introduced into the producing formation for hydraulic fracturing, or if it is derived in part from
produced water used in secondary recovery operations or if the water is derived from aqueous
liquids added to a wellbore such as dense KCl brines used to control downhole pressure in wells or
when KCl brines are used for other purposes downhole in oil and gas wells such as clay control.
Regulatory authority over radioactive materials in Colorado lies with the CDPHE, in general and also
specific to TENORM. The Radiation Program of the Hazardous Material Division of CDPHE provides
regulatory oversight and guidance for handling and disposal of TENORM materials.
There are currently no regulatory rules specifically related to handling or disposal of NORM materials
in COGCC rules as the state legislature has not specifically delegated such authority to the
Commission. However, in some cases, the level of NORM activity in E&P wastes may be equal to
activities of materials governed under TENORM regulatory programs in Colorado or other states. In
some instances the handling and disposal of produced water and associated E&P wastes may create
situations with potential for increased radiation exposures particularly to workers who may come in
close contact with produced water or sediments from produced water or with scale formed from
produced water and found in storage tanks or in pipe used for transport of oil and gas produced
fluids.
Sampling for this project was conducted by COGCC staff with analysis conducted by commercial or
research laboratories. The sampling and the analyses were conducted following the SAP developed
for this study (COGCC, 2017a). Fifty‐one samples of E&P fluids and five natural gas samples (for 222Rn
analysis only) were collected for this study. Fluids were collected and analyzed from 45 sites that
produce from 15 separate geologic formations in basins statewide (Denver‐Julesburg, Piceance,
Raton, North Park, San Juan and Sand Wash Basins). One sample of drilling and hydraulic fracturing
source water from shallow aquifer water wells in the Denver‐Julesburg Basin was also collected. A
summary of sampling sites and associated formations from which the water is produced is provided
in Appendix 1. The map included as Figure 3 shows that samples of produced water were collected
from geologic basins with oil and gas production throughout the state. All analyses performed on
samples collected as part of this study were conducted by independent commercial or research
laboratories.
All aqueous samples collected as part of this study were analyzed for the NORM analytes by analytical
methods as described in Table 1. Analysis of gross alpha and gross beta activities were performed on
all aqueous samples to provide generalized information regarding the activities of non‐volatile NORM
in the water samples. Chemical separation and isotope‐specific analysis of 238U, 235U and 234U were
performed on the one source water and the two produced water samples with total U concentrations

Sampling and Analysis of Naturally Occurring Radioactive Material in Oil and Gas Produced Water
COGCC Special Project 10243 97
>3µg/l. Chemical separation and isotope‐specific analyses of 238U progeny including 226Ra, 222Rn, 210Pb
and 210Po were performed on all aqueous samples. Isotope‐specific analyses of 222Rn were performed
for the five natural gas samples collected. Chemical separation and isotope‐specific analyses of 232Th
progeny including 228Ra and 224Ra were performed on all aqueous samples. Summaries of the
laboratory data acquired regarding NORM activities in produced water samples collected as part of
this study were presented in more detail in section 3.1 of this report and discussed in section 4.3.
The ranges of NORM analytes present in the samples collected as part of this study were presented in
Tables 3 to 14 in section 3 of this report. These summary tables can be used broadly to better
understand the ranges of NORM activities present in groundwater present in oil and gas producing
formations throughout Colorado. All of the analytical data obtained from samples collected as part of
this study are accessible to the public, other agencies, operators or any interested party through the
COGCC web site and summarized in the appendices to this report.
A set of NORM data available from the Raton Basin CBM produced water was compiled and
compared to data from this study. NORM analytical data from the area surrounding Project Rulison
were compiled and compared to data gathered as part of this study. The ranges of NORM activities in
produced water from three other states were compiled from the available literature and compared
and contrasted to data gathered as part of this study. The summaries of NORM activities from the
Raton Basin, the dataset of samples from near project Rulison and datasets from Texas, Pennsylvania
and New York are presented in tables in section 4.2. Discussion of differences and similarities
between ranges of NORM activities in produced water from Colorado, Texas, Pennsylvania and New
York are also presented in the text and in the tables in section 4.2.
All liquid samples collected for this study were analyzed for gross alpha and gross beta activity. Of the
52 samples analyzed, 47 samples were above sample‐specific MDC for gross alpha and 42 samples
were above sample‐specific MDC for gross beta (Table 2). The maximum gross alpha activity (730
pCi/l) was sample facility 755523, and the minimum activity (0.1 pCi/l) from sample facility 755658. The
median gross alpha activity was 40.3 pCi/l. The gross alpha activities are skewed to lower
concentrations (Figure 4) with the majority (71%) of the samples from this study reporting gross
alpha activities <100 pCi/l. The maximum gross beta activity detected in the samples was 5,710 pCi/l
from sample facility 755645, and the minimum gross beta activity was <0.3 pCi/l from sample facility
215628. The median gross beta activity was 81.5 pCi/l. As with the gross alpha, the gross beta
activities are skewed to lower concentrations (Figure 5) with the majority of the samples (67%)
reporting gross beta activities <100 pCi/l.
All aqueous samples were analyzed for general water quality parameters including major cations and
anions, metals (dissolved and total), pH, electrical conductivity, and both total and dissolved solids.
Table 1 includes more details of what analytical methods were used in this to determine inorganic
water quality parameters for this study. Summaries of the laboratory data acquired for general water
quality parameters in produced water samples collected as part of this study were presented in more
detail in section 3.2 of this report and discussed in section 4.3.
The ranges of general inorganic analytes present in the samples collected as part of this study were
presented in Tables 3 to 14 in section 3.2 of this report. These summary tables can be used broadly to

Sampling and Analysis of Naturally Occurring Radioactive Material in Oil and Gas Produced Water
COGCC Special Project 10243 98
better understand the ranges of such general water quality parameters as pH or TDS, the ranges of
concentration of major anions and cations such as Na and Cl and the ranges of concentration of trace
elements such as Pb and As present in water brought to surface from oil and gas producing
formations throughout Colorado.
Section 3.2.4 includes discussion of general inorganic chemistry of the produced waters sampled as
part of this study with a particular emphasis on overall water quality and suggested possible uses of
produced water in agriculture. Discussion of the ratios of Cl/Br and Na/Cl in produced waters sampled
as part of this study was presented in section 3.2.4 as these ratios are useful in understanding
possible sources of the produced water and also in understanding if the waters are mainly fresh
water or are partly derived from water from sediments deposited in saline waters including seawater
and/or evaporite brines.
Section 3.3 includes summary plots of the stable isotope ratios of hydrogen (δ2H and also called δD)
and oxygen (δ18O) and discussion of general use in each water sample collected as part of this study.
Analysis of the carbon stable isotope composition of DIC in each water sample collected was
performed. Summary discussion and plot of δ13C of DIC is in section 3.3.
A small set of water samples were analyzed for 3H activities and the 14C ages of DIC in the same water
samples were also determined. The data for the 3H analyses is discussed in section 3.4 of the report
and the 14C analyses are discussed in section 3.5. Analysis of both 3H activities and 14C ages may be
useful in understanding ages of produced water and also in aiding interpretation of sources of
produced water at the facilities sampled.

Sampling and Analysis of Naturally Occurring Radioactive Material in Oil and Gas Produced Water
COGCC Special Project 10243 99
6. CONCLUSIONS
The analytical data from this study provides staff and others with NORM radionuclide activities and
general inorganic water quality parameters for produced water from across the state. Analytical data
for all samples and all analyses have been uploaded to the COGCC environmental database, which
enables any and all interested parties to view and obtain the analytical data.
The laboratory measured activity levels from NORM radionuclides in produced water samples from
this study are generally at the low to middle end of activity ranges found in this country from New
York, Pennsylvania and Texas studies and in the literature from a worldwide compilation. Even in
instances with very low NORM radionuclide activity in any setting, it is important to understand that
even low levels of ionizing radiation might be harmful. In keeping with the ALARA principle, it is
always advisable to limit exposure to ionizing radiation by minimizing possible exposures.
The gross alpha and the gross beta activities of the samples are not specific for individual isotopes.
Both gross alpha and gross beta activities provide informative and useful screening level results for
naturally occurring radionuclides. Gross alpha results typically are from 226Ra, 224Ra, 210Po, and other
alpha emitters. Gross beta results provide informative and useful screening level data to the presence
of naturally occurring beta‐emitting radionuclides 228Ra and 40K, and other beta‐emitters such as 210Pb. Review of the gross alpha and beta activities statewide do show some specific geologic controls
by formation or groundwater type (Figures 6 and 7). In general there is a trend of increasing gross
alpha and gross beta activity with increasing TDS concentration. A state map view of general TDS
concentration ranges is shown in Figure 16. For example, produced waters from CBM production in
the Raton Basin have relatively low concentrations of dissolved solids and low activities of NORM
radionuclides from both gross alpha and beta analyses and also from isotope‐specific analyses.
Conversely, produced waters from geologic formations with evaporite minerals in the oil and gas
producing formation or in adjacent formations with which the produced water has been in contact
have high concentrations of dissolved solids and relatively high activities of alpha and beta emitters.
Produced water from the Lyons Fm. in north central Weld County is one example of the coincident
high levels of dissolved solids (highest in the study) and high levels (for this study) of specific
radionuclides and gross alpha and gross beta activities. Produced waters from Topeka Limestone and
Osage Limestone also have elevated concentrations of dissolved solids (fifth and second highest
respectively) and generally elevated activities of individual radionuclides and elevated gross alpha
and gross beta activities. One sample each from Lyons Fm., Topeka Limestone, and Osage Limestone
production wells were collected, as this was a general survey with more samples collected from
geologic formations with relatively greater oil, gas, and produced water volumes. Even if the single
samples from each of these three formations are not representative of produced water from every
well drilled into and producing from these three formations, they provide useful data when taken in
the context of all samples collected as part of this study.

Sampling and Analysis of Naturally Occurring Radioactive Material in Oil and Gas Produced Water
COGCC Special Project 10243 100
Table 28. Facilities with Highest Reported Activities by Analyte
Analyte Facility with
Maximum Activity Facility Name Producing
Formation(s) Comments TDS rank
Gross α 755523 UPRC 1‐35 produced water tank Penn. Topeka Limestone Vertical & no frac 5
Gross β 755645 McKay Federal AB02‐15 FWKO Permian Lyons Sandstone Vertical & no frac 1
238U 755461
Gobbler Water Handling Facility Shallow aquifer Frac source water 45
235U 755461
Gobbler Water Handling Facility Shallow aquifer Frac source water 45
234U 755461
Gobbler Water Handling Facility Shallow aquifer Frac source water 45
226Ra & 226Ra (γ)
755645 McKay Federal AB02‐15 FWKO Permian Lyons Sandstone Vertical & no frac 1
222Rn (in water)
755645 McKay Federal AB02‐15 FWKO Permian Lyons Sandstone Vertical & no frac 1
222Rn (in gas) 755501 West Harden 1 Battery Prod. Water Tank
Cretaceous Niobrara Fm. & Codell SS.
3 Vert. & 1 Dir. 1 vert. & fracs 1982 & 2007, other 3 2009 fracs
17
214Pb (γ) 755541
Ma‐State Battery PW Tank Miss. Osage Limestone 3 Vert. & no fracs 2
214Bi (γ) 755541
Ma‐State Battery PW Tank Miss. Osage Limestone 3 Vert. & no fracs 2
210Pb 755645 McKay Federal AB02‐15 FWKO Permian Lyons Sandstone Vertical & no frac 1
210Po 755645 McKay Federal AB02‐15 FWKO Permian Lyons Sandstone Vertical & no frac 1
228Ra & 228Ra (γ)
755645 McKay Federal AB02‐15 FWKO Permian Lyons Sandstone Vertical & no frac 1
224Ra 755657 Ignacio 33‐8 001C Separator Cretaceous Mancos Shale, Mesa Verde Group and Dakota SS
Vertical, fracs in 1998 & 2011 37
212Pb (γ) 755646 70 Ranch USX BB 27‐02, ‐08 & ‐17 PW tank
Cretaceous Niobrara Fm., Codell SS. & J SS
3 vert. , fracs in 2010 22
40K (γ) 755645 McKay Federal AB02‐15 FWKO Permian Lyons Sandstone Vertical & no frac 1

Sampling and Analysis of Naturally Occurring Radioactive Material in Oil and Gas Produced Water
COGCC Special Project 10243 101
Table 28 shows each NORM analyte from this study along with the facility number and name in which
the highest reported activity of all samples collected as part of this study was present. Producing
formations at the facilities along with the relative rank of total dissolved solids concentration of water
samples from that facility are listed in Table 28. Comments regarding the drilling style of oil and gas
well(s) at the facility and if the well(s) were completed using hydraulic fracture techniques are also
included in Table 28.
Only 7 facilities out of 46 had samples with maximum radiological activities for the 18 NORM analytes
listed in Table 28. Two‐thirds of the maximum reported activities were reported from only two of the
facilities. Facility 755645 (McKay Federal AB02‐15 Free Water Knock Out) and facility 755461 (shallow
groundwater source), respectively, account for 50% and 16.7% of the total maximum activities
reported for samples collected as part of this study. The remaining five sample sites listed in Table 28
had either one or two maximum activities. The elevated activities present in 755461 and 755645 are
discussed below.
Facility 755461 is not produced water but is a source water supply for drilling and completions
activities obtained from shallow groundwater wells. Facility 755461had the highest total U
concentration of samples collected as part of this study, which results in the highest isotopic U
activities. Due to the geochemical controls on uranium solubility (Langmuir, 1978; Hem, 1992; IAEA,
2003), it is expected to find elevated U concentration in shallow oxidized source groundwater in
comparison to deeper oxygen‐depleted produced water. Higher concentrations of U in source water
than in produced water from the well in which the shallow groundwater was used as a base of the
frac fluid have previously been reported in Colorado (Rosenblum et al., 2017). The data from facility
755461 collected as part of this study together with domestic groundwater U analyses present in the
COGCC database (Figure 24) also indicate geochemical controls enhance solubility of U in shallow
oxidized groundwater compared to organic‐rich produced water as discussed in Section 4.1.2
previously.
The geochemistry of most oil‐producing formations and the groundwater produced from those
formations is expected to limit the solubility of U and Th in those produced waters (Langmuir, 1978;
Langmuir and Herman, 1980; Hem, 1992; IAEA, 2003). The reported concentrations of U and Th in
produced water samples from this study are relatively low as expected. Thus the contributions from
alpha emitting isotopes of U (238U, 235U and 234U) and Th (232Th, 230Th and 228Th) to NORM gross alpha
of produced water samples from this study is low.
Twelve of the maximum activity samples (66.7%) were from three sampling sites related to vertical oil
and gas wells, with one of the three completed in the Lyons Fm. (755645), one completed in the
Osage Limestone (755541), and one completed in the Topeka Limestone (755523). The wells producing
to these three facilities are vertical wells that had not been stimulated using hydraulic fracturing
techniques and have the first, second, and fifth highest TDS concentrations reported in samples
collected as part of this study. One sample each was collected from Lyons, Osage, and Topeka
production wells, so the produced water chemistries measured in these three formations/wells to

Sampling and Analysis of Naturally Occurring Radioactive Material in Oil and Gas Produced Water
COGCC Special Project 10243 102
production can only be extrapolated with some confidence to the same or similar age or similar
lithology units elsewhere in the state.
Geology of the formations the samples were produced from and the geochemistry of the water
samples in general can be used to better understand the elevated levels of radioactivity in these
samples. The project’s radiochemistry data and geochemistry results demonstrate that the
composition of the rocks in contact with the produced water is the dominant factor in the overall
water quality (TDS for example) and radiological content of the produced fluids. As seen in Table 28,
there is no connection between overall water quality or elevated radioactive isotope activities to the
type of drilling technique (i.e., horizontal versus vertical well) or to well stimulation practices (frac
versus no frac). The majority of samples (10 of 16) with the highest activities of NORM analytes
reported from this study are from vertical oil and gas wells that were not completed by hydraulic
fracture techniques. The highest activities of uranium isotopes were observed in shallow
groundwater used as source water for drilling and completions and not in produced water. Only three
of the highest activities of the NORM analytes were present in wells that had been completed by
hydraulic fracturing, and none of the wells contributing to those sites were horizontal wells (Table
28).
Variability in water chemistry between formations based on varying lithologic composition and
variability within a formation is expected and was observed in this study. Eight samples were
collected from wells developed in the Niobrara and/or Codell formations in the Greater Wattenberg
Area of the Denver‐Julesburg basin of eastern Colorado and producing to seven facilities. A brief
summary of general water quality results and the activities of two Ra isotopes is presented in Table
29 to illustrate the variability of the selected analytical parameters within one geographic area and
between two producing formations. Wells producing to six of the seven sampling sites in Table 29 are
horizontal wells. Wells producing to one of the sampling sites (755501) are vertical or directionally
drilled wells. All of the wells producing to the seven facilities were completed using hydraulic fracture
completion techniques.
The concentrations of Na and Cl when added together compose the majority of the total dissolved
solids present in these samples (Table 29), which vary from 7,500 to 23,000 mg/l in the five Niobrara
Fm. samples and a slightly higher TDS concentration in the one Codell sandstone. The reported
concentrations of dissolved solids in the samples listed in Table 29 are less than that of modern day
seawater, which is approximately 35,000 mg/l (Pilson, 2013). That the TDS of all samples in Table 29
are lower than TDS of seawater likely indicates mixing of fresher water with formation waters and
possible reaction of formation water with rocks and elements in rocks more reactive than chloride or
bromide.

Sampling and Analysis of Naturally Occurring Radioactive Material in Oil and Gas Produced Water
COGCC Special Project 10243 103
Table 29. Activities and Concentrations of Selected Analytes in GWA Niobrara and Codell Produced Water (this study)
Facility
226Ra pC/l
228Ra pCi/l
226Ra/228Raactivity ratio
TDS mg/l
Na mg/l
Cl mg/l
Na/Cl molar ratio
Cl/Br mass ratio
GWA Niobrara
755475 46.7 5.8 8.1 15,000 4,900 8,600 0.84 78
755500 50.0 4.2 11.9 7,500 2,600 4,400 0.88 102
755500 (dup.) 51.1 4.9 10.4 7,600 2,700 4,400 0.88 105
755652 124.8 7.6 16.4 15,000 4,700 13,000 0.71 123
755653 19.96 U<1.19 >16.8 23,000 7,100 13,000 0.79 118
GWA Niobrara/Codell comingled
755501 14.9 4.6 3.2 16,000 5,500 9,300 0.91 131
755476 flowback 23.5 1.5 15.7 12,000 4,100 6,500 0.93 67
GWA Codell
755474 28.4 16.5 1.7 25,000 7,800 16,000 0.84 80
The Na/Cl ratios of each of the eight samples are within approximately 15% of the seawater Na/Cl
ratio discussed in Section 3.2.4, indicating that relict seawater is likely a main source of the solutes in
the produced waters at each of these facilities. The Cl/Br mass ratios of the produced water samples
highlighted in Table 29 are lower than the seawater ratio, which can be interpreted that the waters
also have significant fresh water mixed in, presumably from use of fresh water in hydraulic fracture
stimulation of each of the wells producing to these facilities. As shown in Figure 34 and discussed in
section 4.3.7, the stable isotopes of water from each produced water sample listed in Table 29 lies
below the meteoric water line by varied amounts. The stable isotopes of water results for the
samples listed in Table 29 are likely from mixing of fresh water with formation waters.
The calculated ratios of 226Ra/228Ra from the sample sites shown in Table 29 vary from 1.7 to >16.8. 226Ra is progeny of 238U, and 228Ra is progeny of 232Th. The 226Ra/228Ra is likely to reflect the relative
activities of the parent uranium and thorium isotopes in rocks that have been in contact with the
water from wells developed in that geologic formation or aquifer (Stackelburg et al., 2018). There are
limited numbers of U and Th analyses from the Niobrara Fm. and Codell sandstones in the literature
for comparison to the isotopic Ra analyses of produced water from the same formations conducted
as part of this study. Nakamura (2015) and Levinthal (2016) are recent studies with ICP/MS analyses
of the U and Th concentrations present in the Niobrara and Codell (Nakamura, 2015) and in the
Niobrara (Levinthal, 2016). The 238U/232Th activity ratios shown in Table 30 are calculated from
specific activities for the two isotopes (Peterson et al., 2007) and the concentrations of the elements
in rocks reported by Nakamura (2015) and Levinthal (2016). Dellenbach (2016) suggested that
interpretation of U/Th ratios in rocks from spectral gamma well logs from the Niobrara in the Sand
Wash Basin could be used to aid identification of carbonate mineral rich zones from higher U/Th
ratios of carbonate zones than observed in clay rich shale zones. The differences in relative U/Th
ratio between the carbonate dominated formation (Niobrara) with higher U/Th ratio and the

Sampling and Analysis of Naturally Occurring Radioactive Material in Oil and Gas Produced Water
COGCC Special Project 10243 104
sandstone formation (Codell) can be seen in Table 30 for eastern Colorado from the analytical data of
Nakamura, 2015 and Levinthal, 2016.
Table 30. Uranium and Thorium Concentrations in Niobrara and Codell Rocks
Source of Data
Niobrara Codell
U mg/kg
Th mg/kg
U/Th mass ratio
238U/232Thactivity ratio (calc.)
U mg/kg
Th mg/kg
U/Th mass ratio
238U/232Thactivity ratio (calc.)
Nakamura (2015) medians 9.5 3.25 2.9 9.1 2.9 8.1 0.4 1.1
Levinthal (2016) 26.2 5.4 4.9 15.0
This study did not find any analyses of Ra isotope activities in Niobrara or Codell rocks in the
literature. Assuming the 238U and 232Th isotopes and their respective 226Ra and 228Ra progeny in the
rocks of the two formations are in secular equilibrium, then the activity ratio 226Ra/228Ra in the rocks
should be the same as the activity ratio of the parent isotopes in the rocks. The secular equilibrium
assumed Ra isotope ratios of the Niobrara (9.1‐15) are in the ranges of the same ratio calculated from
measured activities of 226Ra and 228Ra in produced water samples from wells completed in Niobrara
Fm. as shown in Table 29 (8.1 to >16.8). The Table 30 secular equilibrium assumed ratio (one rock
analysis) of the Codell (1.1) and the same ratio calculated from measured activities of 226Ra and 228Ra
in produced water samples from wells completed in the Codell, as shown in Table 29, is 1.7. The
differences between formations in the measured and in the secular equilibrium assumed 226Ra/228Ra
activity ratios supports the general conclusion that differences in the chemistry of the rocks in
contact with produced water is a major influence on the composition of the produced water. The
measured 226Ra/228Ra activity ratios in the two Niobrara‐Codell comingled produced water samples
(Table 29, facilities 755501 and 755476) are intermediate and may be considered as indicators of the
relative contributions of each formation to the produced water sample.
Table 31. Ranges of NORM Radionuclides from IAEA International Compilation and from this Study
radionuclide
IAEA, 2003 from Jonkers et al., 1997 This study
Natural gas pCi/l
Produced water pCi/l
Natural Gas pCi/l
Produced Water pCi/l
238U 0.008‐2.7 0.38‐0.67
226Ra 0.002‐1,200 0.14‐376
222Rn 135‐5,400,000 17.5‐150 32‐681
210Pb 13.5‐5,140 0.71‐253
210Po 0.2‐72
232Th 0.008‐0.027 <0.11
228Ra 8.1‐4,860 0.94‐221
224Ra 13.5‐1,080 0.5‐78

Sampling and Analysis of Naturally Occurring Radioactive Material in Oil and Gas Produced Water
COGCC Special Project 10243 105
When compared to data from three other states, produced water samples from this study shows
activities of NORM radionuclides to be lower in Colorado produced water samples than in other
states for which large published data sets are available, and in most cases, by more than one order of
magnitude, as shown in Tables 23, 24, and 25 in Section 4.2. An international compilation of ranges of
activities of NORM radionuclides in comparison to results from this study is shown in Table 31. The
IAEA (2003) data set was originally compiled by Jonkers et al. (1997). As with the datasets discussed
in Section 4.2, the maximum measured activities in Colorado samples are lower than the maximum of
the ranges of activities compiled from the international data set (Jonkers et al., 1997, IAEA, 2003).
Facility 755545 (McKay Federal) produces oil, gas, and produced water from the Permian Lyons Fm.
As noted previously, this sample is the highest in both K (total and dissolved) and TDS of all of the
samples collected for this study in addition to highest activities for gross beta, 226Ra, 222Rn (in water), 210Pb, 228Ra, and 40K. As can be seen in Figure 8 there is a general increase in gross beta and gross
alpha activities with increasing TDS of samples collected as part of this study. Fisher (1995) noted no
broad correlation between TDS concentration and Ra activities of the same samples. Fisher (1995)
however did note a general correlation of higher 226Ra and 228Ra activities with increasing chloride
concentrations (when >20,000 mg/l Cl present) of produced water in some samples from Texas. As
chloride is the dominant anion in many produced water samples, increase in chloride concentration
would imply a more general correlation between greater activities of Ra isotopes and higher TDS
concentrations.
Figure 40 shows all activities >MDC of three Ra isotopes plotted against the Cl concentration of the
same produced water samples. Linear best fit lines are plotted for activities of each Ra isotope in
samples for which the reported concentration of chloride was 20,000 mg/l or greater. Only 5 of the
52 samples contained 20,000 mg/l Cl or greater, but there is a general increase in activities of 226Ra
and 228Ra with increasing Cl concentration when Cl>20,000mg/l is present in produced water as
observed and discussed by Fisher (1995) for produced water from Texas. The correlations between
increased TDS (or Cl) concentrations and increasing activities or Ra isotopes may be from increased
desorption of Ra from mineral surfaces as the relative concentrations of ions other than Cl (such as Ca
and Na) increase as part of increasing TDS levels (Sturchio et al., 2001). Figure 8 in section 3.1.1
showed a general trend of increasing gross alpha and gross beta activities with increasing
concentrations of TDS is samples collected as part of this study. Figure 11 in section 3.1.4 showed
good correlation between gross beta activities, 40K activities and the concentration of K (40K activity)
in samples collected as part of this study.

Sampling and Analysis of Naturally Occurring Radioactive Material in Oil and Gas Produced Water
COGCC Special Project 10243 106
Figure 40. Activities of Ra isotopes in Comparison to Chloride Concentration (this study) Linear regressions shown are based solely on activities from the five samples with Cl concentration >20,000mg/l. Ra activities from samples with Cl <20,000mg/l are also plotted but no meaningful correlation between Ra activities and Cl concentration for those samples is observed in this dataset.
The ratios of the reported activities of 226Ra/228Ra have been used as indicators of the relative
contributions of their parent radionuclides (238U and 232Th) to NORM radionuclides in the formation(s)
from which water is produced (Fisher, 1995; Sturchio et al., 2001; Stackelburg et al., 2018; this study).
Fisher (1995) reported a near 1:1 correspondence of the 226Ra and 228Ra activities in 20 samples with
analyses of both isotopes as interpreted from a slope of 1.03 for the regression line with a correlation
coefficient r2 of 0.96. Fisher (1995) suggested that the activity of 228Ra in Texas produced waters
could be predicted based on measured activity of 226Ra even though they are progeny of different
parent isotopes. Overall, the data from this study do not show a 1:1 relationship between produced
water 226Ra and 228Ra activities. Only 2 out of 38 samples for which the both isotopes were reported
as >MDC had ratios between 0.9 and 1.1.
Figure 41 illustrates that there is considerable variability in the ratios of activity of the 238U‐derived 226Ra and the activity of the 232Th‐derived 228Ra in the produced water samples collected as part of
this study, and there is not a 1:1 correlation between the activities of the 238U‐derived 226Ra and the
activity of the 232Th‐derived 228Ra in the produced water samples collected as part of this study, unlike
the Texas produced water dataset reported by Fisher (1995). There are 19 Ra activity ratios between
3 and 62 for samples in which the reported activity was >MDC. There are also 19 Ra activity ratios
R² = 0.8505
R² = 0.8949
R² = 0.8666
0
50
100
150
200
250
300
350
400
0 20000 40000 60000 80000 100000 120000 140000 160000 180000
Isotopic Ra activities pCi/l
Cl mg/l
226Ra
228Ra
224Ra

Sampling and Analysis of Naturally Occurring Radioactive Material in Oil and Gas Produced Water
COGCC Special Project 10243 107
between 0.5 and 2. The data from this study indicate there is no statistical correlation between
activities of the U‐derived 226Ra and the Th‐derived 228Ra. Since these two Ra isotopes are progeny of
different parent radionuclides, one would expect that the activities of the parent radionuclides
present in the rocks from which the produced water has been in contact would be the primary
determinant of the 226Ra/228Ra activity ratio with no reason to expect a direct correspondence
between the two unrelated progeny (Sturchio et al., 2001; Stackelburg et al., 2018). Variations in U
and Th concentrations in the producing formations are likely responsible for the varying ratios of
activities of Ra isotopes. Different lithologies or formations contain different amounts of U and Th
because of their varying mineralogy, differences in depositional history, and varying diagenetic
histories. A summary of worldwide average U and Th concentrations of three types of sedimentary
rocks in which oil and gas accumulations are frequently present are shown in Table 32 (National
Research Council, 1999 ; National Council on Radiation Protection and Measurements, 1987). In
Table 32 the activities of 40K, 232Th, and 238U are expressed in units of Becquerels per kilogram (Bq/kg)
which can be converted to picoCuries per unit as used in this report. The table shows the relative
ratio of the specific activities of Th and U in the carbonate rocks data. The specific activity per unit
weight of 238U is approximately 3 times greater than the specific activity of 232Th as reflected in the 3
times greater activity per 2 mg/kg U in carbonate rocks than for 2 mg/kg Th average in carbonate
rocks. The half‐life of 238U (Figure 1) is roughly 3 times shorter than the half‐life of 232Th (Figure 2),
which accounts for the lower activities per unit weight of 232Th than for 238U. Carbonate aquifers in
the midcontinent area of the United States were reported to have mean 226Ra/228Ra activity ratios of
3 with a range upwards to >16 (Sturchio et al., 2001) and good correlation to high U/Th ratios in the
rocks of the carbonate aquifers. Available U and Th analytical data for two oil and gas producing
formations in Colorado were presented in Table 30 and discussed in this section of the report. The
available local data are better suited for use in this study than the worldwide averages presented in
Table 32.
Table 32. Average Concentrations and Activities of K, Th, and U in Three Types of Sedimentary Rocks
Rock Type
K 232Th 238U
% total K Bq/kg mg/kg Bq/kg mg/kg Bq/kg
shale 2.7 800 12 50 3.7 40
sandstone <1 <2 <2 <8 <1 <10
carbonate rocks 0.3 70 2 8 2 25
Adapted from National Research Council, 1999 and National Council on Radiation Protection and Measurements, 1987

Sampling and Analysis of Naturally Occurring Radioactive Material in Oil and Gas Produced Water
COGCC Special Project 10243 108
Figure 41. Production Formation(s) for Each Sampling Facility and Ranges of 226Ra/228Ra Ratio for NORM 2017 Samples Each facility sampled is captioned with facility number and an abbreviated identification of the formation(s) from which oil and/or gas and water samples were produced. A legend explaining the abbreviated formations names can be found at the end of Appendix 1.

Sampling and Analysis of Naturally Occurring Radioactive Material in Oil and Gas Produced Water
COGCC Special Project 10243 109
At seven of the sites shown in Figure 41, the 226Ra/228Ra activity ratios are >10. Each of the seven
produced waters with >10 activity ratios came from formations dominated by carbonate minerals
(Cherokee, Topeka, and Niobrara Fms.) as shown in Table 33. Seven of the eastern Colorado
produced water samples had 226Ra/228Ra activity ratios of <1. Each of the seven produced water
samples in Table 33 with activity ratios <1 are produced from predominantly sandstone formations (D
sand, J sand, and Sussex units). One can assume that the relative ratios of uranium and thorium
activities in the producing formations are similar to the produced water activities of their progeny Ra
isotopes. In this study we compared Niobrara (carbonate) and Codell (sandstone) 226Ra/228Ra activity
ratios to U/Th concentration and activity ratios in the same formations, and could show based on
limited data from the literature and data from this study that the activity ratios of the parent isotopes
in the rocks were similar to the activity ratio of the progeny isotopes in produced water.
Table 33. Produced Water Samples with Lowest and Highest 226Ra/228Ra Activity Ratios (this study)
Facility ID Formation, Vertical or Horizontal,
Completion
226Ra/228Ra activity ratios <1
755557 J sand, vertical, frac
755590 J sand, vertical, no frac
755593 J sand, vertical, no frac
755558 D sand, vertical, no frac
755462 Sussex, vertical, frac
755592 J sand, vertical, no frac
755559 D sand, vertical, frac
226Ra/228Ra activity ratios >10
755550 Niobrara, vertical, frac
755500 Niobrara, horizontal, frac
755476 Niobrara (7 of 8 wells), horizontal, frac
755652 Niobrara, horizontal, frac
755523 Topeka, vertical, no frac
755659 Cherokee, vertical, no frac
439136 Niobrara, vertical, frac
The data in Table 30 and Table 33 and in the summary just presented and seen in Figure 41 indicate
that differences in NORM composition are based on differences in U/Th ratios resulting from
differences in lithology of the production formation and not based on drilling style or completions
practices. The samples with 226Ra/228Ra activity ratios <1 (Table 33) are all from vertical wells
producing from sandstone units, with three of the seven having been completed by hydraulic fracture
techniques and four of the seven not having undergone hydraulic fracture completions. The samples
with 226Ra/228Ra activity ratios >10 (Table 33) are all from wells producing from carbonate mineral
bearing formations, and four of those seven are produced water from vertical wells completed in
carbonates, and three from horizontal wells completed in carbonates. Each of the five Niobrara

Sampling and Analysis of Naturally Occurring Radioactive Material in Oil and Gas Produced Water
COGCC Special Project 10243 110
produced water samples in Table 33 are from wells that had been completed by hydraulic fracture
techniques. The samples from the Cherokee and Topeka Limestone (Table 33) are from vertical wells
that were not completed by hydraulic fracture techniques.
TDS concentrations of the majority (71%) of samples collected as part of this study were in excess of
3,500 mg/l, and thus road spreading as a means of waste disposal of produced water is restricted by
COGCC rules in most areas of the state. A limited amount of produced water with TDS <3,500mg/l is
discharged to surface water in Colorado under Colorado Discharge Permitting System (CDPS) permits.
Figure 42 shows that in 2017 the reported percentage of produced water discharged under CPDHE
permits to waters of the state was 5.9% (≈18,000,000 bbls) of the total volume (3.08 x 10⁸ bbls) of
water produced. Discharges to waters of the state (COGCC database disposal code S) were reported
as a disposal mechanism in only two counties (Las Animas and Moffat), and more than 99% of the
produced water reported as discharged in 2017 was in Las Animas County. For example, in Las
Animas County (2017 production reports) approximately 47% of the produced water was discharged
under CDPS permit as reported by operators. Disposal of produced water by discharge to waters of
the state are potential sources of release of NORM radionuclides into the near surface environment.
However, as only produced waters with TDS <3,500 mg/l can be discharged under CDPS permits, and
given the general correlation between lower NORM activities and lower TDS waters, there is less
likelihood of impacts from NORM radionuclides present in the produced water than if high TDS
waters could be discharged to surface under CPDS permits.
Figure 42. Reported Percentages of Produced Water Disposal by Mechanism in Colorado for 2017
I = injected, 50.1
C = centralized facility, 19.0
M = commercial , 18.7
P = pits, 6.3S = surface discharge,
5.9
0.0
10.0
20.0
30.0
40.0
50.0
60.0
% o
f 2017 produced water vo
lume
Reported Disposal Mechanism

Sampling and Analysis of Naturally Occurring Radioactive Material in Oil and Gas Produced Water
COGCC Special Project 10243 111
Produced water disposal in lined and unlined pits (COGCC database disposal code P) was reported as
6.3% of the 2017 total produced water volume. More than half of the produced water disposal
(10,739,324bbls≈59%) reported as going to pits in 2017 occurred in Washington County. Disposal of
produced water in pits (particularly unlined pits) is another potential route by which produced water
NORM radionuclides may be introduced into the near surface environment including soils and
shallow groundwater. Unlike waters discharged to surface under CDPS permit, the COGCC does not
have TDS threshold above which produced waters cannot be disposed of into permitted pits.
Establishing a TDS threshold might serve to lessen the potential for NORM accumulations in pits or
shallow groundwater near pits.
Approximately 88% of the water produced in Colorado during 2017 as part of oil and gas production
was reported to be injected, sent to a centralized waste management facility, or disposed of at
commercial facilities (COGCC database codes I, C, and M respectively). This study assumes that most
of the water at centralized facilities is re‐used in oil and gas operations or injected in UIC wells and
that most of the produced water reported as commercially disposed was also injected in UIC wells.
Careful storage, handling, and transport practices for produced water at the surface and before
injection can minimize the potential for release of NORM radionuclides into the near surface
environment.
Sodium and lesser concentrations of K are the dominant cations in the majority of the samples
collected for this study. Chloride is the dominant anion in the majority of the sample results with
lesser concentrations of bicarbonate alkalinity and SO4. Crops may also exhibit specific ion toxicity to
elevated concentrations of Cl and B (Ayers and Westcot, 1985) that are present in many of the
produced water samples collected as part of this study. High concentrations of Na in produced water
samples in comparison to Ca and Mg concentrations can pose problems if it is desired to use
produced water beneficially in agriculture (Ayers and Westcot, 1985). Sodic soils that result from
direct release/application of Na‐dominated waters can hinder reclamation of sites where spills or
releases of produced water with elevated SAR have occurred. Elevated SAR in irrigation water can be
a causal factor in reduced crop yield due to reductions of the water infiltration ability of some soils
(Bauder et al., 2014). In general, produced waters are unsuitable for irrigation due to sodicity and
salinity concerns (see section 3.2.4) without treatment. Regulatory issues from varied agencies such
as COGCC, CDPHE or Division of Water Resources (DWR limit reuse in irrigation). Cost of produced
water treatment together with the regulatory issues have limited use of produced water in
agriculture. Cost and regulatory issues have to date limited the possibility of release of NORM
radionuclides into the near surface environment from beneficial reuse of produced water for
irrigation.
Mass ratios of Cl/Br for the bulk of the samples had ratios between 100 and 200, which are
characteristic of many shallow groundwaters (Davis et al., 1998). Nine samples had Cl/Br ratios
exceeding 290; one with a ratio at 11,333 (Facility 755645). Cl/Br ratios in deeper groundwater such as
produced water that are 200 to 400 have been described as representative of connate water (Davis
et al., 1998). Connate water is water trapped in the sediments (typically marine) when originally
deposited (Whitten and Brooks, 1972). Five of the samples collected as part of this study have Cl/Br
mass ratios of 200 to 400. When ratios of Cl/Br are >1,000, it is typically thought that much of the
solutes in those groundwaters are derived from evaporite minerals (Davis et al., 1998) that have

Sampling and Analysis of Naturally Occurring Radioactive Material in Oil and Gas Produced Water
COGCC Special Project 10243 112
come into contact with the produced water. Overall, Cl/Br mass ratios observed in this study were
consistent with ratios expected for geologically isolated fluids and in some cases with mixing of fresh
water into the existing groundwater.
Ratios of stable isotopes of O and H can be used to help understand differences in water sources and
were evaluated in all the water samples collected as part this study. Water isotope data are typically
compared to present day global precipitation as represented by the GMWL, which is a regression line
to unevaporated precipitation data from across the world (Craig, 1961). A large degree of water
isotope composition variability and differences was observed in this study’s results when compared
to present‐day meteoric water, and similar to the interpretations of the Cl/Br mass ratio previously
discussed, the water stable isotope ratios observed are generally indicative of geologically isolated
waters in some cases mixed with near surface water. A small subset of samples collected from coal‐
bed methane wells have isotopic values at or near the GMWL, reflecting the more recent
groundwater recharge. Effective use of stable isotopes as an aid in determining sources of produced
water have recently been documented in the Permian Basin (Laughland et al., 2014) and in Saudi
Arabia (Birkle, 2016a; 2016b). In conjunction with water well water stable isotope data in the COGCC
database, the produced water stable isotope dataset gathered as part of this study can be used
effectively to aid in understanding if produced water spills/release are present in water wells.
Water samples from eight sites were analyzed for tritium (3H) and 14C activity levels. With the
exception of the source sample from Facility 755461, the remaining seven samples (all produced
water) show low tritium activities, which would be expected for fluids that have not been in recent
contact with meteoric water or the atmosphere, or are mixtures of some modern water and waters
older than bomb pulse water. Analyses of tritium in produced water can be useful in understanding
the mixing of fresh water based hydraulic fracture stimulations with the water present in producing
formations at the time of the hydraulic fracture process.
The shallow groundwater sample from Facility 755461 has a 14C of DIC age of 60 years BP (102.63
PMC). The remaining samples had 14C DIC ages older than the water from the 755461 site by more
than two orders of magnitude, with calculated ages ranging from 17,115 to 43,600 years BP. The
presence of geologically “old” carbon in producing formations may cause 14C ages of DIC in produced
water to not be meaningful in understanding age of the water being produced. In particular, carbon
dioxide in different concentrations in many natural gases together with DIC already present in
formation water are two likely sources of geologically “old” carbon that would interact rapidly with
any water introduced into the formations that produce oil and gas. The 14C ages of DIC in the seven
produced water samples with ages between 17,115 to 43,600 years BP are likely reflective of
interactions between the rocks, gases, and organic matter in the producing formations and any fresh
water introduced into the formation, and are not realistic ages of the water.
Regulatory authority over radioactive materials and TENORM in Colorado lies with the CDPHE. The
Radiation Program of the Hazardous Material Division provides regulatory oversight and guidance for
handling and proper disposal of TENORM materials in Colorado. There are currently no regulatory
rules over NORM materials; however, in some cases, the level of NORM may be equal to materials
governed under TENORM regulatory programs, or the handling of NORM materials can create issues
which may increase potential for health exposures whether those NORM containing materials are

Sampling and Analysis of Naturally Occurring Radioactive Material in Oil and Gas Produced Water
COGCC Special Project 10243 113
from E&P waste or from other sources. The National Research Council (1999) Committee on
Evaluation of EPA Guidelines for Exposure to Naturally Occurring Radioactive Materials states that
“All natural media – earth, air, water and biota, including humans – are radioactive to some degree,
and the concentrations of radionuclides in these media are highly variable, both between and within
media,” and for this study it is important to understand the ranges of activities present in water co‐
produced with oil and natural gas. The COGCC (special project 10243) study acquired representative
samples from across the state in order to gain a better understanding of the activities of NORM in
Colorado aqueous E&P wastes than existed before the study was conducted.
The data gathered in this study will be used to provide staff, operators, other agencies, and the public
with summary and detailed NORM‐related analytical data for produced water from across Colorado’s
oil and gas producing basins. The ranges of NORM constituent activities is also compared to published
NORM data from other states and from other nations in an effort to help understand relative scale of
potential impacts. The study was conducted using funds allocated in the Oil and Gas Conservation Act
in order to investigate conditions that threaten to cause or that actually cause a significant adverse
environmental impact and to gather background or baseline data related to oil and gas operations
(Colorado Revised Statutes Title 34, Article 60). The Act also requires that the Commission shall
promulgate rules and regulations to protect the health, safety, and welfare of any person at an oil or
gas well, and the data gathered in this study can help inform worker safety concerns at oil and gas
operational facilities.

Sampling and Analysis of Naturally Occurring Radioactive Material in Oil and Gas Produced Water
COGCC Special Project 10243 114
7. RECOMMENDATIONS
The E&P waste produced in largest volume in Colorado is produced water. The majority of produced water in Colorado is disposed of by injection in permitted UIC wells. Colorado produced water is also disposed of by surface discharge to waters of the state under permit from CDPHE and in pits permitted by COGCC. The latter two disposal mechanisms may result in impacts to soils, groundwater and surface water from NORM present in E&P wastes. COGCC should further assess the data in this report and determine if current practices of disposal are protective of water and soil quality. One recommendation related to COGCC permitted pits is to gather more data on the chemistry of produced water being disposed in unlined pits. This study collected representative samples from many areas of the state and attempted to gather samples from all areas of the state with significant oil and gas operations in proportion to produced water production. That goal was not completely met as no produced water samples were collected from Rio Blanco County from which approximately 33% of the total produced water volume in Colorado (2017) was reported. Most of the produced water from Rio Blanco County is disposed of or reused in injection wells which may limit possible surface impacts from use of pits or surface discharge as disposal mechanisms. There are spills and releases of produced water in this county as in others so a survey type sampling of NORM and general water quality parameters in produced water from Rio Blanco County is recommended. A limited study of the fractionation of Rn gas between produced water and natural gas phases was conducted as part of this study in an attempt to better define which progeny of U and Th may be present at which parts of the production, processing or distribution facilities. No analogous attempt to determine if Rn gas partitions into liquid hydrocarbon phases was performed as part of this study but may need to be considered. Any significant partitioning of Rn gas into liquid hydrocarbon phases would imply that significant activities for radiogenic progeny of Rn such as 212Pb, 210Pb, 212Po and 210Pb might be found at liquid hydrocarbon transport, processing and storage. Water from each producing formation in the state were not sampled and analyzed as part of the study as the goal was to develop a general overview of NORM activities across the state. If large scale oil and gas operations are developed in formations and basins not sampled as part of this study then additional sampling and analysis may be needed.

Sampling and Analysis of Naturally Occurring Radioactive Material in Oil and Gas Produced Water
COGCC Special Project 10243 115
REFERENCES
Allison, R., 2017. Water Quality and the Presence and Origin of Methane in the Upper Pierre Aquifer
in Northeastern Weld County, Morgan County and Logan County, Colorado, COGCC Special Project
2141, 36 p. Accessed on 4 November, 2019 at: Upper Pierre Aquifer study
Amundson, R., Stern, L., Baisden, T. and Wang, Y., 1998. The isotopic composition of soil and soil
respired CO2, Geoderma, V. 82, p. 83‐114.
Anders, R., Mendez, G.O., Futa, K. and Danskin, W.R., 2013. A Geochemical Approach to Determine
Sources and Movement of Saline Groundwater in a Coastal Aquifer, Groundwater, v. 52, p. 756‐768.
APHA, 2012. American Public Health Association, American Water Works Association, and Water
Environment Federation. August 2012. Standard Methods for the Examination of Water and
Wastewater, 22nd Edition.
ANSI HPS N13.53‐2009, August 31, 2009. American National Standards Institute. "Control and Release
of Technologically Enhanced Naturally Occurring Radioactive Material (TENORM)."
Ayers, R.S. and Westcot, D.W., 1985. Water Quality for Agriculture, FAO Irrigation and Drainage Paper
29 Rev. 1.
Bauder, T.A., Waskom, R.M., Sutherland, P.L. and Davis, J.G., 2014. Irrigation Water Quality Criteria,
Colorado State University Extension Fact Sheet 0.506.
Bechtel Marine Propulsion Corporation, 2009. Nuclides and Isotopes. Chart of the Nuclides,
Seventeenth Edition, 95 p.
Birkle, P., 2016a. Geochemical fingerprinting of hydraulic fracturing fluids from Qusaiba Hot Shale and
formation water from Paleozoic petroleum systems, Saudi Arabia, Geofluids, v. 16, p. 565‐584.
Birkle, P., 2016b. Recovery rates of fracturing fluids and provenance of produced water from
fracturing of Silurian Qusaiba hot shale, northern Saudi Arabia, with implications on fracture network,
AAPG Bulletin, v. 100, p. 917‐941.
Bowen, G. and Revenaugh, J., 1993. Interpolating the isotopic composition of modern meteoric
precipitation. Water Resources Research, Vol. 39, 1299.
Cappa J. and Rice D., 1995. Carbon dioxide in Mississippian rocks of the Paradox Basin and adjacent
areas, Colorado, Utah, New Mexico and Arizona, U.S. Geological Survey Bulletin No. 2000‐H.
CIAAW, 2017. Int. Union of Pure and Applied Chemistry Commission of Isotopic Abundances and
Atomic Weights Current Isotopic Abundances.
Clever, H.L. (ed.) , 1979. Krytpon, Xenon and Radon – Gas Solubilities, in Solubility Data Series Volume
2, IUPAC Solubility Data Series, Pergamon, p. 227‐322.

Sampling and Analysis of Naturally Occurring Radioactive Material in Oil and Gas Produced Water
COGCC Special Project 10243 116
COGCC, 2014a. Sampling and Analysis Plan for Naturally Occurring Radioactive Material in Oil and Gas
Well Drill Cuttings, COGCC Special Project 2136. Accessed on 4 November, 2019 at: NORM SAP for
Cuttings 2014
COGCC, 2014b. Analysis of Radioactive Materials in Drill Cuttings, Greater Wattenberg Field, Weld
County, COGCC Special Project 2136. Accessed on 4 November, 2019 at: NORM in Oil and Gas Drill
Cuttings 2014
COGCC, 2017a. Sampling and Analysis Plan for Naturally Occurring Radioactive Material in Oil and Gas
Produced Water, COGCC Special Project 10243. Document # 2496349 accessed on 4 November, 2019
as: document 2496349 in project 10243.
COGCC, 2017b. Rulison Sampling and Analysis Plan, July 2017 Rev. 4. Accessed on 4 November, 2019
at: Rulison Area SAP 2017
Cole, R. and Cumella, S., 2003. Stratigraphic Architecture and Reservoir Characteristics of the Mesa
Verde Group, Southern Piceance Basin, Colorado, Ch. 18 in Field Trip Guidebook October 4 and 6,
2003. Rocky Mountain Association of Geologists and the American Institute of Professional
Geologists.
Connolly, C.A., Walter, L.M., Baadsgard, H. and Longstaffe, F.J., 1990a. Origin and evolution of
formation waters, Alberta Basin, Western Canada Sedimentary Basin. I. Chemistry, Applied
Geochemistry, v. 5, p. 375‐395.
Craig, H., 1961. Isotopic Variation in Meteoric Waters, Science, v. 133, p. 1702‐1703.
Davis, S.N., Whittemore, D.O., and Fabryka‐Martin, J., 1998. Uses of Chloride/Bromide Ratios in
Studies of Potable Water: Groundwater, v. 36, p.338‐350. Accessed on 4 November, 2019 at:
https://onlinelibrary.wiley.com/doi/abs/10.1111/j.1745‐6584.1998.tb01099.x
Davis, S.N., Fabryka‐Martin, J. and Wolfsberg, L.E., 2004. Variations in Bromide in Potable water in the
United States, Groundwater, v. 42, p. 902=909.
Dellenbach, B.A., 2016. An outcrop to subsurface stratigraphic analysis of the Niobrara Fm, Sand
Wash Basin, Colorado, Colorado School of Mines M.S. thesis, 119p.
Eisinger, C. and Robertson, K, personal communication, 2018‐ COGCC database query as of 31August
2018).
ElGhonimy, R.S., 2015. Petrophysics, Geochemistry, Mineralogy and Storage Capacity of the Niobrara
Formation in the Aristocrat PC H11‐07 Core, Wattenberg Field, Denver Basin, Colorado, M.S. thesis,
Colorado School of Mines, 142p.
Fisher, S., 1995. Naturally Occurring Radioactive Materials (NORM) in Produced Water and Scale from
Texas Oil, Gas and Geothermal Wells: Geographic, Geologic and Geochemical Controls. Bureau of
Economic Geology Geological Circular 95‐3.

Sampling and Analysis of Naturally Occurring Radioactive Material in Oil and Gas Produced Water
COGCC Special Project 10243 117
Freeman, J.T., 2007. The use of bromide and chloride mass ratios to differentiate salt‐dissolution and
formation brines in shallow groundwaters of the Western Canadian Sedimentary Basin. Hydrogeology
Journal, v. 15, p. 1377‐1385.
Garfield, T.R, Scott, A.J., and Walker, A.L., 1998. Overview: Late Paleozoic Geologic History of the
Northern Denver Basin, in, Occurrence and Petrophysical Properties of Carbonate Reservoirs in the
Rocky Mountain Region, S.M. Goolsby and M.W. Longman (eds), Rocky Mountain Association of
Geologists., p. 1‐18.
Gesell, T.F., 1973. Some radiological health aspects of radon‐222 in liquefied petroleum gas, In
Symposium on noble gases: Las Vegas 1973, eds. Stanley, R.E. and Moghissi, A.A.,
Gesell, T.F., 1975. Occupational Radiation Exposure Due to 222Rn in Natural Gas and Natural Gas
Products, Health Physics, v. 29, p. 681‐687.
Geyh, M., editor, 2000. Environmental Isotopes in the Hydrological Cycle – Volume 4, Groundwater,
Saturated and Unsaturated Zone, IAEA.
Gilfillan, S.M.V., Ballentine, C.J., Holland, G.D., Blagburn, D., Sherwood Lollar, B., Stevens, S., Schoell,
M. and Cassidy, M., 2008. The noble gas geochemistry of natural CO2 gas reservoirs from the
Colorado Plateau and Rocky Mountain provinces, USA, Geochimica et Cosmochimica Acta, v. 72, p.
1174‐1198.
Greenwood, N.N. and Earnshaw, A., 1997. Appendix 4 in Chemistry of the Elements 2nd ed. Elsevier,
Amsterdam, 1294 p.
Harvey, F.E., 2005. Stable Hydrogen and Oxygen Isotope Composition of Precipitation in Northeastern
Colorado. Journal of the American Water Resources Association, v. 41, p. 447‐459.
Hefton, L., 2015. Diagenesis of the B Chalk, B Marl and Fort Hays Member of the Niobrara Formation,
Denver Basin, Colorado, M.S. thesis, Colorado School of Mines, 224p.
Hem, J.D., 1992. Study and Interpretation of the Chemical Characteristics of Natural Water, USGS
Water‐Supply Paper 2254, Third Edition, 263p.
Hemborg, H.T., 2000. Gas Production Characteristics of the Rulison, Grand Valley, Mamm Creek and
Parachute Fields, Garfield County, Colorado, Resource Series 39, Colorado Geological Survey.
IAEA, 2003. Radiation Protection and the Management of Radioactive Waste in the Oil and Gas
Industry, Vienna, 130p.
Jonkers, G., Hartog, E.D., Knaepen, A.A.I. and Lancee, P.F.J., 1997. Characterization of NORM in the oil
and gas production (E&P) industry, In Radiological Problems with Natural Radioactivity in the Non‐
Nuclear Industry, Proceedings International Symposium Amsterdam.
Katz, B.G., Eberts, S.M. and Kauffman, L.J., 2011. Using Cl/Br ratios and other indicators to assess
potential impacts on groundwater quality from septic systems: A review and examples from principal
aquifers in the United States, Journal of Hydrology, v.397, p. 151‐166.

Sampling and Analysis of Naturally Occurring Radioactive Material in Oil and Gas Produced Water
COGCC Special Project 10243 118
Langmuir, D., 1978. Uranium solution‐mineral equilibria at low temperatures with applications to
sedimentary ore deposits, Geochimica et Cosmochimica Acta, v. 42, p. 547‐569.
Langmuir, D. and Herman, J., 1980. The mobility of thorium in natural waters at low temperatures,
Geochimica et Cosmochimica Acta, v. 44, p. 1753‐1766.
Langmuir, D. and Melchior, D., 1985. The geochemistry of Ca, Sr, Ba and Ra sulfates in some deep
brines from the Palo Duro Basin, Texas, Geochimica et Cosmochimica Acta, v.49, p. 2423‐2432.
Langmuir, D. and Riese, A.C., 1985. The thermodynamic properties of radium, Geochimica et
Cosmochimica Acta, v. 49, p. 1593‐1601.
Laughland, M.M., Nelson, D.E., Wilson, P. and Eastridge, E., 2014. Uncharted waters: What we can
learn from waters produced from horizontal wells in the Permian Basin, Unconventional Resources
Technology Conference Denver CO. Accessed on 4 November, 2019 at:
https://library.seg.org/doi/abs/10.15530/urtec‐2014‐1926712.
Lee, M.K. and Bethke, C.M., 1993. Groundwater flow, late cementation, and petroleum accumulation
in the Permian Lyon Sandstone, Denver basin, AAPG Bulletin, v. 78, p. 217‐237.
Levinthal, J.D., 2016. Mineralogical and Chemical Composition of Shale at Multiple Scales. M.S. thesis,
University of Utah, 60p.
Londry, K.L. and Des Marais, D.J., 2003. Stable Carbon Isotope Fractionation by Sulfate‐Reducing
Bacteria. Applied and Environmental Microbiology, v. 69, p. 2942‐2949.
Lozovic, P.A., 2005. Contribution of Organic Acid Anions to the Alkalinity of Natural Humic Water,
Journal of Analytical Chemistry, v. 60, p. 1000‐1004.
Maughan, E.K. and Wilson, R.F, 1960. Pennsylvanian and Permian Strata in Southern Wyoming and
Northern Colorado, in, Guide to the Geology of Colorado, Geological Society of America, Rocky
Mountain Association of Geologists, and Colorado Scientific Society, R.J. Weimer and J.D. Haun, eds.,
p. 34– 42.
Meija, J., Coplen, T.B., Berglund, M., Brand, W.A., De Bievre, P., Groning, M., Holden, N.E., Irrgeher, J.,
Loss, R.D., Walczyk, T. and Prohaska, T., 2016. Atomic Weights of the Elements 2013 (IUPAC Technical
Report), Pure and Applied Chemistry, 88, 365‐291.
Mook, W.G., editor, 2000. Environmental Isotopes in the Hydrological Cycle – Volume 1, Introduction,
Theory, Methods and Review, IAEA.
Musgrove, M., Beck, J.A., Paschke, S.S., Bauch, N.J., and Mashcurn, S.L., 2014. Quality of Groundwater in the Denver Basin aquifer system, Colorado 2003‐5: U.S. Geological Survey Scientific Investigations Report 2014‐5051, 107p. Accessed on 4 November, 2019 at: http://dx.doi.org/10.3133/sir20145051. Nakamura, KKK. 2015. Chemostratigraphy of the late Cretaceous Western Interior (Greenhorn, Carlile
and Niobrara Formations), Denver Basin, CO, USA, Ph.D. Thesis, Colorado School of Mines, 93p.

Sampling and Analysis of Naturally Occurring Radioactive Material in Oil and Gas Produced Water
COGCC Special Project 10243 119
NASE&M, 2016. National Academies of Sciences, Engineering and Medicine, Flowback and Produced
Waters: Opportunities and Challenges for Innovation: Proceedings of a Workshop, Washington, DC.,
The National Academies Press. Accessed on 4 November, 2019 at:
https://doi.org/10.17226/24620.
National Council on Radiation Protection and Measurements, 1987. Report No. 094 – Exposure of the
population in the United States and Canada from Natural Background Radiation.
National Research Council, 1999. Evaluation of Guidelines for Exposures to Technologically Enhanced
Naturally Occurring Radioactive Materials, The National Academies Press. Accessed on 4 November,
2019 at: http://nap.edu/6360.
Nelson, A.W., Knight, A.W., May, D., Eitrtheim, E.S. and Schultz, M.K., Naturally occurring radioactive
materials (NORM) associated with unconventional drilling for shale gas. Ch. 4 in Hydraulic Fracturing
Environmental Issues, ACS Symposium Series, p. 89‐128.
NYDEC, 1999. An Investigation of Naturally Occurring Radioactive Materials (NORM) in Oil and Gas
Wells in New York State, New York State Department of Environmental Conservation Division of Solid
and Hazardous Materials.
NYDEC, 2009. Draft Supplemental Generic Environmental Impact Statement (SGEIS) on the oil, gas, and solution mining regulatory program (September 2009) Appendix 13, Department of Environmental Conservation, Division of Mineral Resources, Bureau of Oil and Gas Regulation. Osselin, F., Nightingale, M., Hearn, G., Kloppmann, W., Gaucher, E., Clarkson, C.R. and Mayer, B., 2018. Quantifying the extent of flowback of hydraulic fracturing fluids using chemical and isotopic tracer approaches, Applied Geochemistry, v. 93, p. 20‐29. Otto, G.H., 1989. A National Survey on Naturally Occurring Radioactive Materials (NORM) in
Petroleum Producing and Gas Processing Facilities, American Petroleum Institute, Dallas, 265p.
PADEP, 1992. Pennsylvania Department of Environmental Protection NORM Summary Survey
September 1, 1992. Available (July 11, 2018) at:
files.dep.state.pa.us/OilGas/BOGM/BOGMPortalFiles/RadiationProtection/NORM.pdf
PESI, 2013a. Sampling and Analysis Plan, Part I – Field Sampling Plan, Pennsylvania Department of
Environmental Protection, April 3, 2013. Perma‐Fix Environmental Services, Inc. Available (March 7,
2017) at:
http://files.dep.state.pa.us/OilGas/BOGM/BOGMPortalFiles/RadiationProtection/Sampling_and_Anal
ysis_Plan‐Part‐I‐Field_Sampling_Plan.pdf
PESI, 2013b. Sampling and Analysis Plan, Part II – Quality Assurance Project Plan, Pennsylvania
Department of Environmental Protection, April 3, 2013. Perma‐Fix Environmental Services, Inc.
Available (March 7, 2017) at:
http://files.dep.state.pa.us/OilGas/BOGM/BOGMPortalFiles/RadiationProtection/Sampling_and_Anal
ysis_Plan‐Part‐II‐Quality_Assurance_Project_Plan.pdf

Sampling and Analysis of Naturally Occurring Radioactive Material in Oil and Gas Produced Water
COGCC Special Project 10243 120
PESI, 2016. Technologically Enhanced Naturally Occurring Radioactive Materials (TENORM) Study
Report Revision 1 May 2016, Pennsylvania Department of Environmental Protection. Perma‐Fix
Environmental Solutions, Inc. Available (4November, 2019) at
http://files.dep.state.pa.us/OilGas/BOGM/BOGMPortalFiles/RadiationProtection/PA‐DEP‐TENORM‐
Study_Report_(Section_Text)_May_2016_track_change.pdf
Peterson, J., MacDonell, M., Haroun, L. and Monette, F., 2007. Radiological and Chemical Fact Sheets
to Support Health Risk Analyses for Contaminated Areas, Argonne National Laboratory Environmental
Science Division. Accessed on 4 November, 2019 at:
https://www.remm.nlm.gov/ANL_ContaminantFactSheets_All_070418.pdf
Pilson, M.E.Q, 2013. An Introduction to the Chemistry of the Sea. Cambridge University Press, p. 67.
Piper, A.M., 1944. A graphic procedure in the geochemical interpretation of water‐analyses,
Transactions, American Geophysical Union, v. 25, p. 914‐928.
Pollastro, R.M., 1992. Natural fractures, composition, cyclicity, and diagenesis of the Upper
Cretaceous Niobrara Formation, Berthoud Field, Colorado, in Geological studies relevant to horizontal
drilling – Examples from western North America, eds. Schmoker, J.W., Coalson, E.B. and Brown, C.A.,
Rocky Mountain Association of Geologists Guidebook, p. 243‐255.
Reade, H. L., 1978. Uranium deposits: Northern Denver Julesburg Basin, Colorado in Energy Resources
of the Denver Basin, Denver. Rocky Mountain Association of Geologists: pp. 161–171.
Rice, D.D., 1984. Relation of Hydrocarbon Occurrence to Thermal Maturity of Organic Matter in the
Upper Cretaceous Niobrara Formation, Eastern Denver Basin: Evidence of Biogenic versus
Thermogenic Origin of Hydrocarbons, in Hydrocarbon Source Rocks of the Greater Rocky Mountain
Region, Rocky Mountain Association of Geologists, p. 365‐367.
Rosenblum, J., Nelson, A.W., Ruyle, B., Schultz, M.K., Ryan, J.N. and Linden, K., 2017. Temporal
characterization of flowback and produced water quality from a hydraulically fractured oil and gas
well, Science of the Total Environment,
Rowan, E.L., Engle, M.A., Kirby, C.S. and Kraemer, T.F., 2011. Radium Content of Oil‐ and Gas‐Field
Produced Waters in the Northern Appalachian Basin (USA): Summary and Discussion of Data, USGS
Scientific Investigations Report 2011‐5135.
Rozanski, K., Araguas‐Araguas, L. and Gonfiantini, R., 1993. Isotopic Patterns in Modern Global
Precipitation. In Climate Change in Continental Isotopic Records, American Geophysical Union
Geophysical Monograph Series 78, 1‐36.
Rubin, B., Schwartz, L. and Montan, D., 1972. An Analysis of Gas Stimulation Using Nuclear Explosives,
Lawrence Livermore Laboratory Report UCRL‐51226.
Sonnenberg, S., 2016. Insights into Niobrara Stratigraphic Architecture and Diagenesis, Wattenberg
Field, Denver Basin, Colorado, AAPG Search and Discovery Article 20373.

Sampling and Analysis of Naturally Occurring Radioactive Material in Oil and Gas Produced Water
COGCC Special Project 10243 121
Stackelburg, P.E., Szabo, Z. and Jurgens, B.C., 2018. Radium mobility and the age of groundwater in
public‐drinking‐water supplies from the Cambro‐Ordovician aquifer system, north‐central USA,
Applied Geochemistry, v. 89, p. 34‐48.
Stiff, H.A., 1951. The Interpretation of Chemical Water Analysis by Means of Patterns, J. of Petroleum
Technology, v. 3, p. 15‐17.
Sturchio, N.C., Banner, J.L., Binz, C.M., Heraty, L.B. and Musgrove, M., 2001. Radium geochemistry of
groundwaters in Paleozoic carbonate aquifers, midcontinent, USA, Applied Geochemistry, v. 16, p
109‐122.
Tasker, T.L., Burgos, W.D., Piotrowski, P., Castillo‐Meza, L., Blewett, T.A., Ganow, K.B., Stallworth, A.,
Delompre, P.L.M., Goss, G.G., Fowler, L.B., Vanden Heuvel, J.P., Dorman, F. and Warner, N.R., 2018.
Environmental Human Health Impacts of Spreading Oil and Gas Wastewater on Roads. Environmental
Science and Technology v. 52, p. 7081‐7091.
Thompson, W.O., 1949. Lyons Sandstone of Colorado Front Range: American Association of
Petroleum Geologists Bulletin, V. 38, p. 52‐72.
URS Corporation, 2008. First Quarter 2008 Report, Operational and Environmental Monitoring Within
a Three‐Mile Radius of Project Rulison, Prepared for Noble Energy Production, Inc. Accessed on
27April, 2018 at
http://cogcc.state.co.us/library.html#/AreaReports/PiceanceBasin/Rulison/Rulison1qtr2008.zip
URS Corporation, 2010a. Final Rulison Sampling and Analysis Plan for Operational and Environmental
Monitoring within a Three‐Mile Radius of Project Rulison. Accessed on 27April, 2018 at
http://cogcc.state.co.us/library.html#/AreaReports/PiceanceBasin/Rulison/ sampling and analysis
plans for wells near the Rulison site
URS Corporation, 2010b. Fourth Quarter 2009 Report, Operational and Environmental Monitoring
Within a Three‐Mile Radius of Project Rulison, April 2010. Accessed on 27 April, 2018 at
http://cogcc.stat.co.us/library.html#/AreaReports/PiceanceBasin/Rulison/Rulison4qtr2009.zip
USDA, 1954. Saline and Alkaline Soils, Agriculture Handbook 60.
USDOT Title 49 Code of Federal Regulations 173, Subpart I. 1996. US Department of Transportation.
"Class 7 (Radioactive) Materials."
USEPA, January 2008. Test Methods for Evaluating Solid Waste, Physical/Chemical Methods (SW‐846,
Third Edition).
USEPA, June 1972. Handbook for Analytical Quality Control Water and Wastewater Laboratories (EPA
600/4‐79‐019).
USEPA, January 2010. Contract Laboratory Program National Functional Guidelines for Inorganic
SUPERFUND Data Review (OSWER 9240.1‐51, EPA 540‐R‐10‐011).

Sampling and Analysis of Naturally Occurring Radioactive Material in Oil and Gas Produced Water
COGCC Special Project 10243 122
USNRC, Title 10 Code of Federal Regulations 20. 1995. U.S. Nuclear Regulatory Commission.
"Standards for Protection Against Radiation."
Weimer, R.J. and Lund Jr., C.B., 1972. Lyons Formation (Permian), Jefferson County, Colorado: A
Fluvial Deposit, Mountain Geologist (Rocky Mountain Association of Geologists), V.9, pp. 289‐297.
Whiticar, M.J., 1999. Carbon and hydrogen isotope systematics of bacterial formation and oxidation
of methane, Chemical Geology, v.161, p. 291‐314.
Whittemore, D.O., 1995. Geochemical Differentiation of Oil and Gas Brine from Other Saltwater
Sources Contaminating Water Resources: Case Studies from Kansas and Oklahoma, AAPG Division of
Environmental Geosciences Journal, v.2, p 15‐31.
Whitten, D.G.A and Brooks, J.R.V., 1972. A Dictionary of Geology, Penguin Books.

Sampling and Analysis of Naturally Occurring Radioactive Material in Oil and Gas Produced Water
COGCC Special Project 10243 123
LIST OF ABBREVIATIONS, ACRONYMS AND TECHNICAL JARGON
α – alpha decay mechanism
a – year, annum
228Ac – actinium‐228 isotope
AEC – Atomic Energy Commission
Ag ‐ silver
Al – aluminum
ALARA – as low as reasonably achievable
ALS – ALS Laboratories
AMS – accelerator mass spectrometry
ANSI – American National Standards Institute
API – American Petroleum Institute
As – arsenic
ASTM – American Society for Testing and Materials
Ar – argon
β ‐ beta decay mechanism
B ‐ boron
Ba – barium
bbl – barrel of water or oil equal to 42 gallons
Be – beryllium
212Bi – bismuth‐212 isotope
214Bi – bismuth‐214 isotope
BP – before present as in years BP
Br – bromide anion or elemental bromine
Bq/kg – Becquerels per kilogram
14C – carbon‐14 isotope
oC – degree Celsius
Ca – calcium
CBM – coal bed methane
Cd – cadmium
Cl – chloride anion or elemental chlorine

Sampling and Analysis of Naturally Occurring Radioactive Material in Oil and Gas Produced Water
COGCC Special Project 10243 124
LIST OF ABBREVIATIONS, ACRONYMS AND TECHNICAL JARGON
Co – cobalt
CO ‐ Colorado
137Cs – cesium‐137 isotope
Cu – copper
CDPHE ‐ Colorado Department of Public Health and Environment
CDPS – Colorado Discharge Permitting System
CFR – Code of Federal Regulations
CLP – Contract Laboratory Program
COC – chain‐of‐custody
COGCC – Colorado Oil and Gas Conservation Commission
Cr – chromium
d – day
δ – delta
D – deuterium isotope of hydrogen, 2H isotope
DER – duplicate error ratio
DIC – dissolved inorganic carbon
DOE – Department of Energy
DOT – Department of Transportation
DQL – data quality levels
DQO – data quality objectives
DUP – duplicate
DWR – Colorado Division of Water Rersources
E### ‐ analytical method from EPA 900 series of methods of analysis of radioactivity
E&P – exploration and production
Fe – iron
F – elemental fluorine or in some instances shorthand for fluoride anion
Fm. ‐ Formation
γ ‐ gamma radiation (electromagnetic energy emitted by radionuclides)
GMWL – global meteoric water line
GFPC – gas‐flow proportional counting system

Sampling and Analysis of Naturally Occurring Radioactive Material in Oil and Gas Produced Water
COGCC Special Project 10243 125
LIST OF ABBREVIATIONS, ACRONYMS AND TECHNICAL JARGON
GPS – global positioning system
GWA – Greater Wattenberg Area
H ‐ hydrogen
3H – tritium isotope of hydrogen
HCl – hydrochloric acid
HDPE – high‐density polyethylene
HNO3 – nitric acid
IAEA – International Atomic Energy Agency
ICP – inductively coupled plasma emission spectroscopy
ICP/MS – inductively coupled plasma mass spectrometry
K – potassium
KCl – potassium choride
40K – potassium‐40 isotope
keV – kiloelectron volt
Li – lithium
LCS – laboratory control sample
LQAP – laboratory quality assurance plan
MB – method blank
MCF – thousand cubic feet
MDC – minimum detectable concentration
mg/kg – milligrams per kilogram
mg/l – milligrams per liter
Mg – magnesium
min ‐ minute
Mn – manganese
Mo – molybdenum
mol% ‐ mole percent
MS/MSD – matrix spike/matrix spike duplicate
NA – not applicable
N ‐ nitrogen

Sampling and Analysis of Naturally Occurring Radioactive Material in Oil and Gas Produced Water
COGCC Special Project 10243 126
LIST OF ABBREVIATIONS, ACRONYMS AND TECHNICAL JARGON
Na – sodium
NIST – National Institute of Standards and Technology
NORM ‐ naturally occurring radioactive material
Ni – nickel
NRC – Nuclear Regulatory Commission
NY – New York
O‐ oxygen
18O – oxygen‐18 isotope
pCi/l – picoCuries/liter, 10‐12 Curies per liter or approximately 2.2 disintegrations/minute
P‐ phosphorus
PA ‐ Pennsylvania
234mPa – metastable protactnium‐234 isotope
Pb – lead
210Pb – lead‐210 isotope
212Pb – lead‐212 isotope
214Pb – lead‐214 isotope
PESI – Perma‐Fix Environmental Services, Inc.
pH – measure of acidity
PMC – percent modern carbon
210Po ‐ polonium‐210 isotope
PTFE – polytetrafluoroethylene
PLSS – public land survey system
QA – quality assurance
QAP – quality assurance plan
QC – quality control
Ra – radium
224Ra – radium‐224 isotope
226Ra – radium‐226 isotope
228Ra – radium‐228 isotope
Rn – radon

Sampling and Analysis of Naturally Occurring Radioactive Material in Oil and Gas Produced Water
COGCC Special Project 10243 127
LIST OF ABBREVIATIONS, ACRONYMS AND TECHNICAL JARGON
222Rn – radon‐222 isotope
RPD – relative percent difference
S‐ sulfur
SAP – sampling and analysis plan
Se – selenium
Si – silicon
SM####‐ analytical method from Standard Methods for the Examination of Water and
Wastewater
SO4 – sulfate anion
SOP – standard operating procedure
Sr – strontium
STRONGER ‐ State Review of Oil & Natural Gas Environmental Regulations
SU – standard unit (for pH)
SW#### ‐ analytical method from SW‐846
TDS – total dissolved solids
TSS – total suspended solids
TENORM – technologically enhanced naturally occurring radioactive material
Th – the element thorium
228Th – thorium‐288 isotope
230Th – thorium‐230 isotope
232Th – thorium‐232 isotope
Tl – thallium
208Tl – thalium‐208 isotope
TPU – total propagated uncertainty
TX – Texas
UIC – underground injection control program
USDW – U.S. EPA acronym for underground source of drinking water (40CFR section 144.3)
U.S. EPA – United States Environmental Protection Agency
USGS – United States Geological Survey
U – the element uranium

Sampling and Analysis of Naturally Occurring Radioactive Material in Oil and Gas Produced Water
COGCC Special Project 10243 128
LIST OF ABBREVIATIONS, ACRONYMS AND TECHNICAL JARGON
234U – uranium‐234 isotope
238U – uranium‐238 isotope
235U – uranium‐235 isotope
V – vanadium
VOA – volatile organic analysis
VPDB – Vienna Peedee belemnite reference for carbon isotopic composition
VSMOW – Vienna standard mean ocean water reference for hydrogen and oxygen isotope
composition
Zn‐ zinc
% ‐ percentage
‰ – per mil
< ‐ less than
>‐ greater than
µg/l ‐ micrograms per liter
µmhos/cm – micromhos per centimeter
µs – microsecond, 10‐6 seconds

Sampling and Analysis of Naturally Occurring Radioactive Material in Oil and Gas Produced Water
COGCC Special Project 10243 129
APPENDICES
Appendix 1. List of Samples Collected
COENV Facility # Facility Name Section Township T Dir. Range R Dir. QuarterQuarter Meridian
Producing Formation
149017 Wellington Production Water Treatment Facility 7 9 N 68 W SWSW 6 Kjs
215628 WILBOURN FEDERAL GAS UNIT 1 and duplicate 19 35 N 7 W NENW N Kf
215820 GEARHART C 1 8 34 N 7 W SENW N Kf
285562 SANCHINATOR 11‐36 TR 36 32 S 68 W NWNW 6 Kr
299153 Panther 33‐5 5 33 S 66 W NWSE 6 Kv/r
439136 Gardner Trust 44‐18 2N46W 18 2 N 46 W SESE 6 Kn
755461 Gobbler Water Handling Facility 23 2 N 66 w SENE 6 GW
755462 Baurer 41‐36, Eiberger 32‐36 & 42‐36 PW tank 36 1 N 67 W NENE 6 Ks
755474 Sarchet 38C‐20Hz separator 20 2 N 65 W SWNE 6 Kc
755475 Sarchet 16N‐20Hz separator 20 2 N 65 W SWNE 6 Kn
755476 Carter 33Hz temp. separator (frac flowback) 33 2 N 66 W NENW 6 Kn/c
755500 Peschel 20H‐232 separator and duplicate 20 4 N 65 W SWSW 6 Kn
755501 West Hardin 1 Battery produced water tank 29 5 N 63 W NWSE 6 Kn/c
755522 UPRR 1‐1 free water knock out separator 1 16 S 45 W SWSE 6 Mstl/Mw
755523 UPRC 1‐35 produced water tank and duplicate 35 13 S 44 W SENE 6 IPtls
755541 Ma‐State battery PW tank 24 10 S 56 W NWSW 6 Mo
755550 Mathies 1‐13 separator 13 2 S 50 W SWSW 6 Kn
755557 Michaels 1 PW discharge to pit 14 11 N 53 W NWSW 6 Kjs
755558 H Smith location 312252 after sep. & filters 24 11 N 54 W NESE 6 Kds
755559 Doud separator on location 312325 and duplicate 8 11 N 54 W NESE 6 Kds
755590 Blomenkamp 1 outfall to PW pit 17 3 S 56 W NENE 6 Kjs
755591 Marick State 1 skim tank outfall to PW pit 3 3 S 52 W SWSE 6 Kjs
755592 Peterson 1 outfall to pit 15 3 S 54 W NESW 6 Kjs
755593 Horn, Ruth B #1 outfall to pit 34 1 N 54 W SESW 6 Kjs
755645 McKay Federal AB02‐15 FWKO 2 7 N 64 W SWSE 6 Pl
755646 70 Ranch USX BB 27‐02, ‐08 & ‐17 PW tank 27 5 N 63 W NWNE 6 Kn/c/js
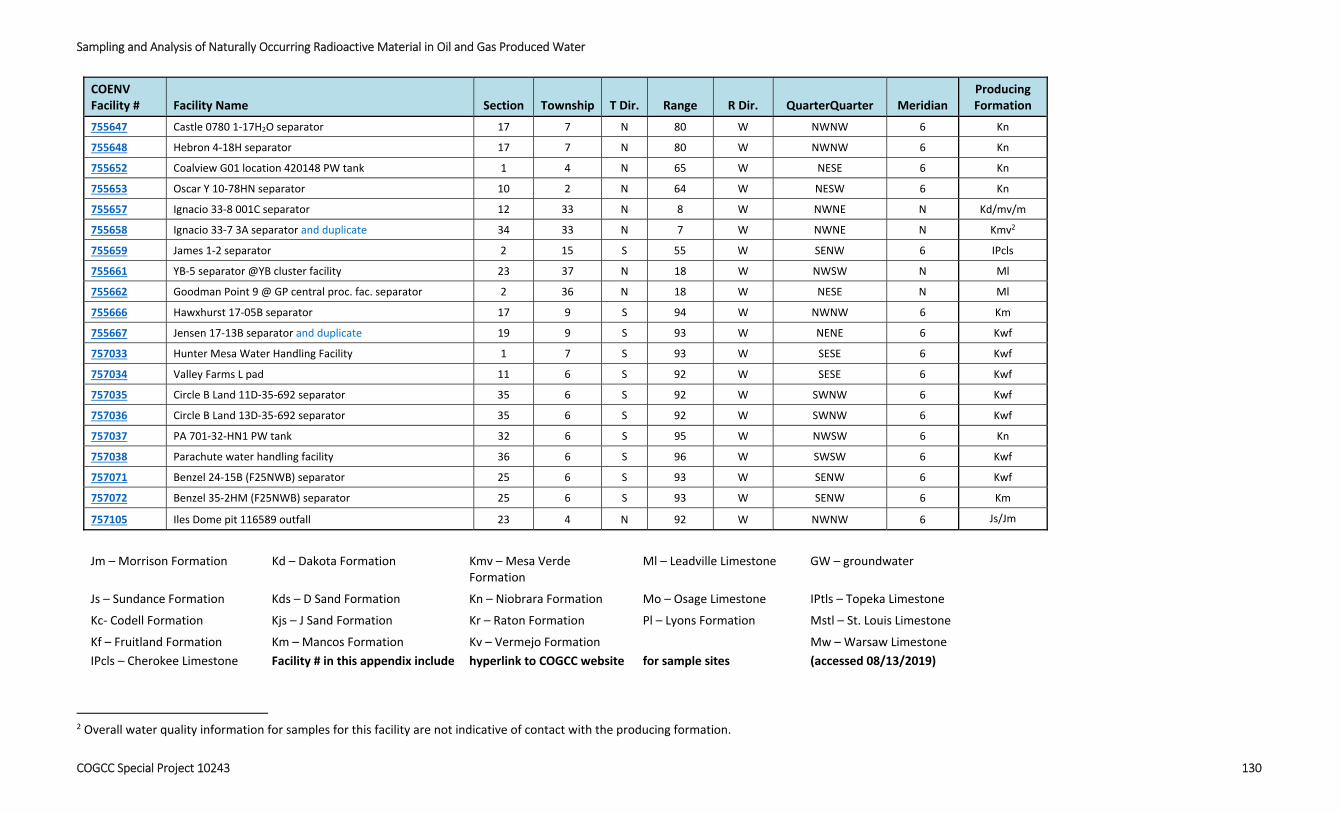
Sampling and Analysis of Naturally Occurring Radioactive Material in Oil and Gas Produced Water
COGCC Special Project 10243 130
COENV Facility # Facility Name Section Township T Dir. Range R Dir. QuarterQuarter Meridian
Producing Formation
755647 Castle 0780 1‐17H2O separator 17 7 N 80 W NWNW 6 Kn
755648 Hebron 4‐18H separator 17 7 N 80 W NWNW 6 Kn
755652 Coalview G01 location 420148 PW tank 1 4 N 65 W NESE 6 Kn
755653 Oscar Y 10‐78HN separator 10 2 N 64 W NESW 6 Kn
755657 Ignacio 33‐8 001C separator 12 33 N 8 W NWNE N Kd/mv/m
755658 Ignacio 33‐7 3A separator and duplicate 34 33 N 7 W NWNE N Kmv2
755659 James 1‐2 separator 2 15 S 55 W SENW 6 IPcls
755661 YB‐5 separator @YB cluster facility 23 37 N 18 W NWSW N Ml
755662 Goodman Point 9 @ GP central proc. fac. separator 2 36 N 18 W NESE N Ml
755666 Hawxhurst 17‐05B separator 17 9 S 94 W NWNW 6 Km
755667 Jensen 17‐13B separator and duplicate 19 9 S 93 W NENE 6 Kwf
757033 Hunter Mesa Water Handling Facility 1 7 S 93 W SESE 6 Kwf
757034 Valley Farms L pad 11 6 S 92 W SESE 6 Kwf
757035 Circle B Land 11D‐35‐692 separator 35 6 S 92 W SWNW 6 Kwf
757036 Circle B Land 13D‐35‐692 separator 35 6 S 92 W SWNW 6 Kwf
757037 PA 701‐32‐HN1 PW tank 32 6 S 95 W NWSW 6 Kn
757038 Parachute water handling facility 36 6 S 96 W SWSW 6 Kwf
757071 Benzel 24‐15B (F25NWB) separator 25 6 S 93 W SENW 6 Kwf
757072 Benzel 35‐2HM (F25NWB) separator 25 6 S 93 W SENW 6 Km
757105 Iles Dome pit 116589 outfall 23 4 N 92 W NWNW 6 Js/Jm
Jm – Morrison Formation Kd – Dakota Formation Kmv – Mesa Verde
Formation Ml – Leadville Limestone GW – groundwater
Js – Sundance Formation Kds – D Sand Formation Kn – Niobrara Formation Mo – Osage Limestone IPtls – Topeka Limestone
Kc‐ Codell Formation Kjs – J Sand Formation Kr – Raton Formation Pl – Lyons Formation Mstl – St. Louis Limestone
Kf – Fruitland Formation
IPcls – Cherokee Limestone
Km – Mancos Formation
Facility # in this appendix include
Kv – Vermejo Formation
hyperlink to COGCC website
for sample sites
Mw – Warsaw Limestone
(accessed 08/13/2019)
2 Overall water quality information for samples for this facility are not indicative of contact with the producing formation.

Sampling and Analysis of Naturally Occurring Radioactive Material in Oil and Gas Produced Water
COGCC Special Project 10243 131
Appendix 2. Gross Alpha and Gross Beta Analyses
Facility COENV DB
Gross α pCi/l +/‐ TPU
MDC pCi/l
Lab Qualifiers
Gross β pCi/l +/‐ TPU
MDC pCi/l
Lab Qualifiers
755461 26.8+/‐2.9 2 5.56+/‐0.82 2.34
755462 123+/‐10 1 89+/‐13 34 M3
755474 83+/‐14 2 90+/‐24 29 M3
755475 65+/‐11 3 66+/‐20 27 M3
755476 53.2+/‐9.6 2.5 68+/‐20 26 M3
755500 64+/‐11 2 37.4+/‐9.3 10.9 M3
755500 63+/‐11 2 29.4+/‐9.1 12.4 M3
755501 24.4+/‐4.7 2 48+/‐16 21 M3
755541 182+/‐30 5 M3 1370+/‐280 250 M3
755523 690+/‐110 0 M3 301+/‐61 56 M3
755523 730+/‐120 0 M3 293+/‐60 55 M3
149017 10.2+/‐2.9 3 9.3+/‐3.2 4.5 M3
755522 416+/‐67 3 M3 231+/‐42 29 M3
755550 107+/‐18 3 M3 71+/‐19 24 M3
439136 271+/‐44 3 M3 96+/‐23 25 M3
215628 3.1+/‐2.2 3.4 U,M 0.3+/‐1.1 1.9 U
215628 3+/‐2.2 3.3 U,M 1.98+/‐0.9 1.34 LT
215820 6.2+/‐2.4 3.3 M3 4.2+/‐2.3 3.5
755659 479+/‐78 6 M3 410+/‐110 130 M3
755658 2.6+/‐2.2 3.5 U,M 1.3+/‐1.3 2.7 U
755657 216+/‐35 3 M3 205+/‐34 10 M3
755557 23+/‐4.7 3.2 M3 20.8+/‐6.9 9.4 M3
755558 78+/‐13 3 M3 59+/‐13 14 M3
755559 30.9+/‐5.9 3 31.3+/‐9 11.5 M3
755559 25.9+/‐5.2 3.3 M3 22.8+/‐7.4 10.1 M3
299153 1.73+/‐0.75 1.02 LT 0.8+/‐1.5 2.5 U
285562 2.2+/‐0.94 1.39 LT 3.1+/‐1.5 2.2 LT

Sampling and Analysis of Naturally Occurring Radioactive Material in Oil and Gas Produced Water
COGCC Special Project 10243 132
Facility COENV DB
Gross α pCi/l +/‐ TPU
MDC pCi/l
Lab Qualifiers
Gross β pCi/l +/‐ TPU
MDC pCi/l
Lab Qualifiers
755648 277+/‐46 8 M3 163+/‐49 64 M3
755647 352+/‐58 8 M3 193+/‐53 68 M3
755645 640+/‐100 10 M3 5710+/‐960 350 M3
755646 40.3+/‐6.7 0.9 74+/‐22 29 M3
755662 92+/‐16 4 M3 1560+/‐250 30 M3
755590 7.6+/‐1.4 0.7 4+/‐14 23 U,M
755652 194+/‐32 4 M3 106+/‐25 27 M3
755653 45.9+/‐8.5 3.9 M3 118+/‐27 29 M3
755661 374+/‐61 5 M3 1610+/‐260 40 M3
755591 5+/‐1.1 0.7 7+/‐14 24 U,M
755666 123+/‐21 4 M3 104+/‐27 32 M3
755667 33.4+/‐6.5 3.5 M3 47+/‐18 26 M3
755667 34.8+/‐6.6 3.2 M3 37+/‐18 27 M3
755592 3.9+/‐1.3 1.7 6.6+/‐2.9 4.2 M3
755593 5.9+/‐1.6 1.7 3.8+/‐2.8 4.4 U,M
755658 0.1+/‐1 2.6 U 1.7+/‐1.5 3 U
757036 5.1+/‐2.6 3.8 M3 51+/‐13 15 M3
757035 0.7+/‐3.3 5.6 U,M 47+/‐19 27 M3
757105 3.7+/‐2 2.9 17+/‐14 23 U,M
757034 19.3+/‐4.2 3.3 M3 102+/‐24 26 M3
757071 32.8+/‐6.3 3.3 M3 96+/‐24 27 M3
757072 31.3+/‐5.9 3 127+/‐29 30 M3
757033 37.1+/‐6.9 3 M3 92+/‐23 28 M3
757038 15.7+/‐3.7 3.5 M3 126+/‐28 30 M3
757037 7.7+/‐2.4 2.8 7.6+/‐2.2 2.8
U flag indicates result is less than the sample specific MDC, LT indicates result is less than Requested MDC and greater than the sample specific MDC, M indicates the requested MDC
was not met, M3 indicates the requested MDC was not met but the reported activity is greater than the samples specific MDC.

Sampling and Analysis of Naturally Occurring Radioactive Material in Oil and Gas Produced Water
COGCC Special Project 10243 133
Appendix 3. Isotopic Analyses of U
Facility # Total U 238U 235U 234U
COENV DB µg/l pCi/l +/‐TPU MDC pCi/l
Data Flags pCi/l +/‐TPU
MDC pCi/l
Data Flags pCi/l +/‐TPU
MDC pCi/l
Data Flags
755461 23 8+/‐1.5 0.1 0.4+/‐0.18 0.11 10+/‐1.8 0.1
439136 3.1 0.38+/‐0.15 0.07 0.009+/‐0.052 0.077 U 0.46+/‐0.17 0.07
755653 3.1 0.67+/‐0.34 0.21 M3 0.07+/‐0.16 0.25 U,M 1.16+/‐0.48 0.31 M3
U flag indicates result is less than the sample specific MDC, M indicates the requested MDC was not met, M3 indicates the requested MDC was not met but the reported activity is
greater than the samples specific MDC.

Sampling and Analysis of Naturally Occurring Radioactive Material in Oil and Gas Produced Water
COGCC Special Project 10243 134
Appendix 4. Isotopic Analyses of 238U Progeny
Facility # COENV DB
Total Uranium µg/l
Data Flags
226Ra 222Rn in H2O 210Pb 210Po
pCi/l +/‐ TPU MDC pCi/l
DataFlags pCi/l +/‐ TPU
MDC pCi/l
DataFlags pCi/l +/‐ TPU
MDCpCi/l
DataFlags pCi/l +/‐ TPU
MDC pCi/l
Data Flags
755461 23 0.1618584+/‐4.280819E‐02 0.087 449+/‐58 26 0.34+/‐0.39 0.63 U 0+/‐0.19 0.45 U
755462 0.03 J 21.15603+/‐5.472691 12.272 M3 22+/‐21 35 U 0.5+/‐1.8 3 U,M 0.2+/‐0.22 0.36 U
755474 0.75 U 28.38854+/‐3.037032 1.898 M3 36+/‐25 39 U 1.2+/‐3.6 6 U,M 0.16+/‐0.38 0.73 U,M
755475 0.025 U 46.7602+/‐3.779083 0.757 M3 37+/‐26 41 U 1.1+/‐1.5 2.4 U,M 0.14+/‐0.35 0.52 U,M
755476 0.75 U 23.50775+/‐2.006147 0.868 M3 23+/‐24 39 U 0.45+/‐0.73 1.19 U,M 0.13+/‐0.18 0.3 U
755500 0.075 U 51.13597+/‐4.49688 1.721 M3 36+/‐22 34 LT ‐0.08+/‐0.37 0.62 U 0.08+/‐0.42 0.79 U,M
755500 0.075 U 49.9565+/‐4.433913 2.824 M3 54+/‐23 33 ‐0.01+/‐0.39 0.67 U ‐0.08+/‐0.62 1.26 U,M
755501 0.12 14.8575+/‐1.434077 0.584 26+/‐21 34 U ‐0.25+/‐0.38 0.65 U 0.7+/‐0.52 0.57 M3
755541 0.075 U 251.411+/‐17.70893 1.319 M3 75+/‐23 31 35+/‐10 8 M3 1.11+/‐0.56 0.18
755523 0.075 U 219.8841+/‐14.83976 0.046 159+/‐36 43 0.27+/‐0.37 0.59 U 0.14+/‐0.4 0.75 U,M
755523 0.075 U 218.8159+/‐14.41345 0.057 196+/‐39 44 ‐0.13+/‐0.38 0.64 U 0+/‐0.51 1.03 U,M
149017 0.075 U 3.882098+/‐1.029634 2.263 M3 ‐11+/‐25 42 U 0.39+/‐0.39 0.62 U 0.34+/‐0.42 0.64 U,M
755522 0.075 U 114.6859+/‐7.703536 0.035 92+/‐31 44 0.11+/‐0.38 0.64 U 0.49+/‐0.55 0.84 U,M
755550 0.075 U 53.46792+/‐4.331821 1.224 M3 108+/‐30 39 1.38+/‐0.56 0.7 0.98+/‐0.63 0.6 M3
439136 3.1 124.553+/‐10.16901 2.995 M3 99+/‐28 38 ‐0.04+/‐0.51 0.87 U 0.5+/‐1 1.9 U,M
215628 0.075 U 5.439881E‐02+/‐0.02825953 0.078 U ‐2+/‐22 37 U ‐0.14+/‐0.35 0.59 U 0.26+/‐0.41 0.69 U,M
215628 0.075 U 4.485815E‐02+/‐0.02397427 0.072 U ‐22+/‐21 36 U 0.17+/‐0.34 0.57 U 0.33+/‐0.35 0.48 U
215820 0.075 U 0.318901+/‐0.1465001 0.432 U ‐15+/‐21 37 U 0.02+/‐0.35 0.59 U ‐0.15+/‐0.48 1.08 U,M
755659 0.075 U 275.6035+/‐18.047 0.210 246+/‐40 36 1.7+/‐3.2 5.3 U,M 0.44+/‐0.36 0.2 LT
755658 0.075 U 2.575443E‐02+/‐0.05161835 0.087 U 70+/‐23 32 0.63+/‐0.46 0.7 U 0.65+/‐0.56 0.68 U,M
755657 0.075 U 43.24572+/‐6.7019 0.195 Y2 112+/‐26 32 0.71+/‐0.41 0.59 LT 0.54+/‐0.39 0.18
755557 0.075 U 3.671774+/‐0.6062813 0.134 20+/‐17 28 U 0.33+/‐0.38 0.62 U 0.97+/‐0.6 0.64 M3
755558 0.075 U 9.098517+/‐1.418087 0.138 10+/‐17 28 U 0.22+/‐0.37 0.62 U 0.79+/‐0.56 0.66 M3
755559 0.075 U 5.951859+/‐0.9108306 0.127 21+/‐18 29 U ‐0.13+/‐0.38 0.65 U 0.47+/‐0.5 0.73 U,M

Sampling and Analysis of Naturally Occurring Radioactive Material in Oil and Gas Produced Water
COGCC Special Project 10243 135
Facility # COENV DB
Total Uranium µg/l
Data Flags
226Ra 222Rn in H2O 210Pb 210Po
pCi/l +/‐ TPU MDC pCi/l
DataFlags pCi/l +/‐ TPU
MDC pCi/l
DataFlags pCi/l +/‐ TPU
MDCpCi/l
DataFlags pCi/l +/‐ TPU
MDC pCi/l
Data Flags
755559 0.075 U 5.751862+/‐0.8900439 0.095 13+/‐18 29 U 0.09+/‐0.38 0.63 U 0.35+/‐0.55 0.93 U,M
299153 0.075 U 0.4823406+/‐0.1751 0.122 ‐5+/‐23 39 U 0.05+/‐0.33 0.56 U 0.2+/‐0.33 0.49 U
285562 0.075 U 0.1490201+/‐0.1016 0.123 8+/‐24 40 U ‐0.15+/‐0.34 0.59 U 0.13+/‐0.32 0.6 U,M
755648 0.075 U 142.0197+/‐28.62898 8.436 M3 55+/‐25 37 3.8+/‐4.3 6.9 U,M 0.49+/‐0.7 1.15 U,M
755647 0.075 U 149.4837+/‐29.95405 8.625 M3 39+/‐23 36 LT 2.3+/‐4.2 7 U,M 0.72+/‐0.69 0.89 U,M
755645 0.9 J 376.858+/‐51.14682 0.203 681+/‐87 40 253+/‐61 6 M3 72+/‐12 1 M3
755646 0.075 U 20.4485+/‐3.049145 0.297 64+/‐27 40 0.62+/‐0.49 0.75 U 0.33+/‐0.52 0.88 U,M
755662 0.075 U 11.20623+/‐1.745818 0.107 Y2 ‐6+/‐21 35 U 0.49+/‐0.89 1.46 U,M 0.12+/‐0.29 0.54 Y1,U,M
755590 0.075 U 1.04884+/‐0.2401808 0.124 74+/‐20 27 ‐0.04+/‐0.38 0.65 U 0.2+/‐0.33 0.18 LT
755652 0.075 U 124.7878+/‐20.86287 4.233 M3 ‐3+/‐15 26 U 0.2+/‐0.9 1.51 U,M 0+/‐0.35 0.66 U,M
755653 3.1 19.96004+/‐3.844406 1.065 M3 10+/‐16 26 U 0.93+/‐0.92 1.46 U,M 0+/‐30 56 Y2,U,M
755661 0.22 125.2102+/‐17.47679 0.120 7+/‐20 34 U 0.58+/‐0.88 1.44 U,M 0.14+/‐0.33 0.5 U
755591 0.075 U 0.8877606+/‐0.3102073 0.281 4+/‐16 27 U 0.02+/‐0.38 0.64 U 0.36+/‐0.38 0.53 U,M
755666 0.075 U 44.76707+/‐13.02172 7.852 M3 25+/‐20 33 U 0.01+/‐0.88 1.49 U,M 0.07+/‐0.35 0.53 U,M
755667 0.075 U 12.12199+/‐6.715656 5.826 M3 39+/‐21 32 LT 0.11+/‐0.81 1.37 U,M 0.26+/‐0.42 0.63 U,M
755667 0.075 U 12.42826+/‐7.762828 8.367 M3 30+/‐21 33 U 0.26+/‐0.77 1.29 U,M 0.08+/‐0.4 0.77 U,M
755592 0.075 U 1.298991+/‐0.2858126 0.079 ‐1+/‐17 29 U ‐0.12+/‐0.37 0.64 U 0.16+/‐0.38 0.57 U,M
755593 0.075 U 0.5906044+/‐0.1939299 0.164 ‐2+/‐17 29 U ‐0.12+/‐0.4 0.68 U 0.2+/‐0.33 0.5 U
755658 0.023 U ‐5.806753E‐02+/‐0.1163932 0.269 U 51+/‐18 26 0.05+/‐0.39 0.66 U 0+/‐0.84 1.58 U,M
757036 0.23 U 6.872674+/‐7.061105 10.631 U,M 10+/‐26 43 U 0.9+/‐4.1 6.9 U,M 0.32+/‐0.79 1.49 U,M
757035 0.23 U 11.82568+/‐6.280188 6.893 M3 21+/‐26 42 U ‐2.2+/‐4.7 8.1 U,M 0.33+/‐0.81 1.21 U,M
757105 0.023 U 0.7556123+/‐0.6070987 0.795 U,M ‐2+/‐26 44 U 0.61+/‐0.92 1.49 U,M 0.49+/‐0.8 1.19 U,M
757034 0.23 U 0.9986518+/‐8.707063 16.655 U,M ‐20+/‐21 36 U 1.6+/‐1.5 2.4 U,M 0+/‐0.85 1.88 U,M
757071 0.23 U 27.44029+/‐12.84951 12.218 M3 11+/‐20 33 U 0.7+/‐1.4 2.3 U,M 0.5+/‐1.1 2 U,M
757072 0.23 U 32.34278+/‐8.218379 2.969 M3 32+/‐20 32 LT 2.4+/‐1.7 2.6 U,M 0.7+/‐1.1 1.8 U,M

Sampling and Analysis of Naturally Occurring Radioactive Material in Oil and Gas Produced Water
COGCC Special Project 10243 136
Facility # COENV DB
Total Uranium µg/l
Data Flags
226Ra 222Rn in H2O 210Pb 210Po
pCi/l +/‐ TPU MDC pCi/l
DataFlags pCi/l +/‐ TPU
MDC pCi/l
DataFlags pCi/l +/‐ TPU
MDCpCi/l
DataFlags pCi/l +/‐ TPU
MDC pCi/l
Data Flags
757033 0.23 U 18.8308+/‐10.2282 10.008 M3 15+/‐20 33 U 0.5+/‐1.4 2.3 U,M 5.3+/‐2.2 2 M3
757038 0.23 U 15.3451+/‐11.61727 14.804 M3 10+/‐20 34 U ‐3.7+/‐4.8 8.1 U,M ‐0.2+/‐1.1 2.3 U,M
757037 0.023 U 1.708694+/‐0.3557627 0.134 30+/‐21 33 U 0.1+/‐4 6.7 U,M 0.5+/‐1.4 2.6 U,M
Total Uranium flags U flag indicates analyte not detected at concentration greater the MDL (method detection limit) specified by the laboratory J flag indicates analyte detected at concentration greater the MDL (method detection limit) but less the RL (report limit) specified by the laboratory and considered as estimated
Radiochemistry flags for this appendix
U flag indicates result is less than the sample specific MDC, LT indicates result is less than Requested MDC and greater than the sample specific MDC, M indicates the requested MDC
was not met, M3 indicates the requested MDC was not met but the reported activity is greater than the samples specific MDC. Y1 flag indicates chemical yield is in control at 100‐
110% and quantitative yield is assumed. Y2 flag indicates chemical yield is outside default limits.

Sampling and Analysis of Naturally Occurring Radioactive Material in Oil and Gas Produced Water
COGCC Special Project 10243 137
Appendix 5. 222Rn Analyses of Gas Samples
Facility ID COENV DB
222Rn +/‐ TPU pCi/l
MDC pCi/l Data
755461 70+/‐18 1
755475 22.5+/‐6.8 2.6 M3
755474 17.5+/‐5.5 2 M3
755500 46+/‐12 1 M3
755501 15‐+/‐38 2 M3
M3 flag indicates the requested MDC was not met but the reported activity is greater than the
sample specific MDC.

Sampling and Analysis of Naturally Occurring Radioactive Material in Oil and Gas Produced Water
COGCC Special Project 10243 138
Appendix 6. Isotopic Analyses of 232Th Progeny
Facility # COENV DB
Thorium (total) 228Ra +/‐TPU 224Ra +/‐TPU
µg/l MDL DataFlags pCi/l MDC
DataFlags pCi/l MDC
Data Flags
755461 0.04 0.025 J 0.4+/‐0.33 0.67 U 0.5112497+/‐0.152081 0.5552228
755462 0.04 0.025 J 27.9+/‐6.5 0.7 ‐3.04146+/‐17.12824 79.61439 U,M
755474 0.91 0.91 U 16.5+/‐4 1.2 M3 20.05298+/‐4.670219 16.04583 M3
755475 0.025 0.025 U 5.8+/‐1.6 1.4 M3 3.549666+/‐2.053318 8.588546 U
755476 0.91 0.91 U 1.47+/‐0.66 1.08 M3 0.6287665+/‐1.367482 5.900128 U,M
755500 0.091 0.091 U 4.9+/‐1.3 1.1 M3 ‐1.157423+/‐5.079942 19.86004 U,M
755500 0.091 0.091 U 4.2+/‐1.2 1.2 M3 ‐4.022472+/‐4.028916 16.14057 U,M
755501 0.091 0.091 U 4.6+/‐1.3 1.1 M3 1.827033+/‐1.512547 6.100078 U,M
755541 0.091 0.091 U 68+/‐20 19 M3 26.94463+/‐4.587819 13.72625 M3
755523 0.091 0.091 U 12.9+/‐3.2 1.2 Y1,M3 31.51903+/‐2.228289 1.660681 M3
755523 0.091 0.091 U 13.5+/‐3.3 1.3 M3 33.17127+/‐2.267054 1.386986 M3
149017 0.091 0.091 U 3.3+/‐1.2 1.8 M3 ‐2.463487+/‐4.689348 21.01032 U,M
755522 0.091 0.091 U 38+/‐8.9 1.5 M3 42.60556+/‐2.933442 1.077992 M3
755550 0.091 0.091 U 5+/‐1.6 1.9 M3 4.357892+/‐2.825114 11.38827 U,M
439136 0.31 0.091 2+/‐1 1.8 M3 5.142788+/‐6.655595 28.1487 U,M
215628 0.091 0.091 U ‐0.18+/‐0.28 0.68 U ‐0.1372491+/‐0.2582475 1.129662 U,M
215628 0.091 0.091 U 0.32+/‐0.33 0.69 U 1.381773E‐02+/‐0.2140328 0.9266994 U
215820 0.091 0.091 U 0.13+/‐0.29 0.65 U 0.1638293+/‐1.039711 4.63034 U,M
755659 0.091 0.091 U 14.1+/‐4.5 5.3 M3 24.78524+/‐1.901995 2.146535 M3
755658 0.091 0.091 U 1+/‐0.87 1.79 U,M ‐0.3116394+/‐0.4066214 0.9022288 U
755657 0.091 0.091 U 40.3+/‐9.5 1.7 M3 78.09334+/‐12.06835 1.684091 Y2,M3
755557 0.091 0.091 U 6.6+/‐2 2.1 M3 5.686288+/‐0.9588314 0.6446335
755558 0.091 0.091 U 12.8+/‐3.3 1.8 M3 15.62343+/‐2.400047 1.137106 M3
755559 0.091 0.091 U 7.4+/‐2.2 2 M3 6.19665+/‐1.016727 0.5903229

Sampling and Analysis of Naturally Occurring Radioactive Material in Oil and Gas Produced Water
COGCC Special Project 10243 139
Facility # COENV DB
Thorium (total) 228Ra +/‐TPU 224Ra +/‐TPU
µg/l MDL DataFlags pCi/l MDC
DataFlags pCi/l MDC
Data Flags
755559 0.091 0.091 U 6.4+/‐1.9 1.9 M3 5.668857+/‐0.9669993 0.6734044
299153 0.091 0.091 U 0.35+/‐0.34 0.72 U 0.1538308+/‐0.45591 1.001346 U,M
285562 0.091 0.091 U 0.53+/‐0.35 0.67 U ‐0.1128863+/‐0.39108 0.9273175 U
755648 0.091 0.091 U 17.2+/‐4.2 1.4 M3 15.62313+/‐31.33009 70.42085 M
755647 0.091 0.091 U 21.9+/‐5.3 1.4 M3 10.59295+/‐32.01507 72.71352 M
755645 0.91 0.91 U 221+/‐51 2 M3 34.77879+/‐5.315527 2.040596 M3
755646 0.091 0.091 U 14.7+/‐3.6 1.2 M3 6.358658+/‐1.739662 2.429833 M3
755662 0.091 0.091 U 5.7+/‐1.5 1.2 M3 16.65525+/‐2.628186 0.7287717 Y2
755590 0.091 0.091 U 1.69+/‐0.74 1.2 M3 0.8474239+/‐0.3691023 0.6322129
755652 0.091 0.091 U 7.6+/‐2 1.3 M3 11.63643+/‐12.09997 25.52998 U,M
755653 0.091 0.091 U 0.63+/‐0.57 1.19 U,M 2.481953+/‐3.189251 6.635294 U,M
755661 0.091 0.091 U 16.6+/‐4 1.2 M3 21.23936+/‐3.566055 1.929901 M3
755591 0.091 0.091 U 1.33+/‐0.73 1.33 U,M 1.008226+/‐0.7392638 1.448751 U,M
755666 0.091 0.091 U 22.3+/‐5.3 1.2 M3 28.79808+/‐33.81166 74.44302 U,M
755667 0.091 0.091 U 6.4+/‐1.7 1.2 M3 ‐4.339589+/‐36.09553 84.26396 U,M
755667 0.091 0.091 U 7.9+/‐2 1.2 M3 49.83281+/‐37.60357 76.93273 U,M
755592 0.091 0.091 U 1.65+/‐0.59 0.8 1.06917+/‐0.4482507 0.7618658
755593 0.091 0.091 U 0.94+/‐0.43 0.74 LT 0.6518728+/‐0.3990588 0.758777 U
755658 0.096 0.096 U 0.16+/‐0.28 0.63 U 0.5930673+/‐0.8108366 1.706472 U,M
757036 0.96 0.96 U 3.11+/‐0.97 1.07 M3 ‐4.89899+/‐29.13784 67.44949 U,M
757035 0.96 0.96 U 3.4+/‐1 1.1 M3 11.6042+/‐23.77834 50.7135 U,M
757105 0.096 0.096 U 0.62+/‐0.51 1.04 U,M 1.316164+/‐3.14534 6.926093 U,M
757034 0.96 0.96 U 11.4+/‐3 1.9 M3 1.825642+/‐34.10899 76.34924 U,M
757071 0.96 0.96 U 14.1+/‐3.6 1.9 M3 15.63189+/‐37.97866 82.50881 U,M
757072 0.96 0.96 U 15.3+/‐3.8 1.8 M3 17.29358+/‐12.73865 24.6576 U,M
757033 0.96 0.96 U 13.8+/‐3.4 1.7 M3 ‐4.580721+/‐27.12456 62.89407 U,M

Sampling and Analysis of Naturally Occurring Radioactive Material in Oil and Gas Produced Water
COGCC Special Project 10243 140
Facility # COENV DB
Thorium (total) 228Ra +/‐TPU 224Ra +/‐TPU
µg/l MDL DataFlags pCi/l MDC
DataFlags pCi/l MDC
Data Flags
757038 0.96 0.96 U 29.3+/‐7.1 2.2 M3 11.52535+/‐47.67434 102.7375 U,M
757037 0.096 0.096 U 1.23+/‐0.77 1.48 U,M 0.3118909+/‐0.4419052 0.9622439 U
Total thorium flags U flag indicates analyte not detected at concentration greater the MDL (method detection limit) specified by the laboratory J flag indicates analyte detected at concentration greater the MDL (method detection limit) but less the RL (report limit) specified by the laboratory and considered as estimated
Radiochemistry flags for this appendix
U flag indicates result is less than the sample specific MDC, LT indicates result is less than Requested MDC and greater than the sample specific MDC, M indicates the requested
MDC was not met, M3 indicates the requested MDC was not met but the reported activity is greater than the samples specific MDC. Y1 flag indicates chemical yield is in control at
100‐110% and quantitative yield is assumed. Y2 flag indicates chemical yield is outside default limits.

Sampling and Analysis of Naturally Occurring Radioactive Material in Oil and Gas Produced Water
COGCC Special Project 10243 141
Appendix 7. Gamma Spectroscopy Results for 40K, 60Co, 137Cs and 241Am
Facility # COENV DB
40K 60Co 137Cs 241Am
pCi/l +/‐ TPU MDC pCi/l
Lab Qualifiers
pCi/l +/‐ TPU
MDC pCi/l
Lab Qualifiers pCi/l +/‐ TPU
MDC pCi/l
Lab Qualifiers
pCi/l +/‐ TPU
MDC pCi/l
Lab Qualifiers
755461 ‐20+/‐120 200 U ‐3+/‐5.4 9.8 U 1.2+/‐4.8 8.1 U ‐31+/‐39 67 U
755462 ‐20+/‐84 142 U 0+/‐3.7 6.3 U 2.8+/‐3.5 5.7 U ‐60+/‐160 270 U
755474 ‐60+/‐110 180 U ‐0.9+/‐6.4 11.2 U 3.7+/‐4.6 7.5 U ‐15+/‐30 52 U
755475 ‐38+/‐90 156 U 2.9+/‐4.9 8.2 U ‐5.1+/‐4.4 8 U ‐40+/‐210 360 U
755476 34+/‐91 152 U ‐1.9+/‐5.2 9.3 U 2+/‐4.5 7.6 U ‐11+/‐27 46 U
755500 ‐66+/‐80 138 U ‐3+/‐4.2 7.6 U 0.3+/‐3.4 5.8 U 20+/‐20 33 U
755500 10+/‐100 170 U 0+/‐4.8 8.2 U ‐1.5+/‐3.6 6.2 U ‐16+/‐25 42 U
755501 21+/‐73 123 U 2.3+/‐3.1 5.2 U ‐0.2+/‐2.8 4.9 U 0.7+/‐3.8 6.4 U
755541 870+/‐190 210 ‐0.6+/‐6.3 11.3 U ‐0.6+/‐5.6 9.8 U 14+/‐58 97 U
755523 100+/‐110 190 U ‐3.1+/‐6.8 12.4 U 1.6+/‐5.2 8.8 U ‐28+/‐49 84 U
755523 50+/‐140 230 U 2.4+/‐4.6 7.7 U ‐1.9+/‐3.9 6.7 U 16+/‐23 38 U
149017 ‐20+/‐90 155 U ‐0.6+/‐5.2 9.2 U ‐4.5+/‐4.5 8.2 U ‐20+/‐120 200 U
755522 80+/‐110 180 U ‐3.7+/‐5.4 10 U 0.7+/‐4.8 8.3 U ‐10+/‐180 310 U
755550 40+/‐110 180 U ‐3+/‐6.6 12.1 U ‐3.7+/‐5.4 9.8 U 4+/‐30 52 U
439136 189+/‐59 71 NQ 0.7+/‐4.5 7.8 U ‐1.2+/‐4.2 7.2 U 2.3+/‐4.7 7.8 U
215628 110+/‐100 170 U 0.4+/‐5.8 10.4 U 0.2+/‐5.5 9.6 U 3.2+/‐6.4 10.6 U
215628 20+/‐100 170 U 1.1+/‐5.1 9 U ‐1.3+/‐4.8 8.6 U ‐2.7+/‐5.8 10.1 U
215820 ‐20+/‐100 180 U ‐1+/‐6.1 10.9 U 4.4+/‐5.1 8.3 U 90+/‐190 320 U
755659 338+/‐95 128 ‐1.2+/‐3.7 6.5 U ‐0.4+/‐3.2 5.6 U 4.5+/‐4.8 7.9 U
755658 ‐16+/‐90 154 U ‐1.5+/‐4.7 8.4 U 3.1+/‐3.9 6.3 U ‐13+/‐32 54 U
755657 1+/‐82 138 U ‐1.5+/‐4 7.1 U ‐2+/‐3.6 6.3 U ‐21+/‐91 154 U
755557 ‐20+/‐120 200 U ‐0.8+/‐6.1 10.7 U 0.4+/‐5.2 8.9 U 18+/‐29 47 U
755558 22+/‐91 152 U 1.3+/‐3.8 6.5 U 0.8+/‐3.5 5.9 U ‐60+/‐130 230 U
755559 ‐20+/‐100 170 U 0.2+/‐4.9 8.5 U 0.1+/‐3.9 6.6 U 0+/‐26 44 U
755559 2+/‐77 132 U ‐3.6+/‐4.2 7.8 U ‐0.7+/‐3.9 6.8 U 1.9+/‐4.2 7 U
299153 150+/‐120 190 U 2.7+/‐4.6 7.6 U 1.2+/‐4.1 6.9 U ‐10+/‐40 68 U

Sampling and Analysis of Naturally Occurring Radioactive Material in Oil and Gas Produced Water
COGCC Special Project 10243 142
Facility # COENV DB
40K 60Co 137Cs 241Am
pCi/l +/‐ TPU MDC pCi/l
Lab Qualifiers
pCi/l +/‐ TPU
MDC pCi/l
Lab Qualifiers pCi/l +/‐ TPU
MDC pCi/l
Lab Qualifiers
pCi/l +/‐ TPU
MDC pCi/l
Lab Qualifiers
285562 47+/‐82 135 U 1.9+/‐4.1 7 U ‐2.6+/‐3.4 6 U 32+/‐91 152 U
755648 10+/‐110 180 U 4.1+/‐4.9 8.1 U 0.8+/‐3.9 6.5 U 16+/‐27 44 U
755647 249+/‐83 107 NQ ‐4.9+/‐6.7 12.1 U 2.9+/‐5.3 8.9 U ‐21+/‐31 53 U
755645 2840+/‐370 150 ‐4.1+/‐5.8 10.3 U ‐0.9+/‐4.6 7.8 U 2+/‐28 47 U
755646 ‐8+/‐70 119 U 0.3+/‐3.5 6.1 U ‐0.4+/‐3.1 5.4 U 1.8+/‐4.1 6.9 U
755662 1010+/‐170 160 ‐5.1+/‐5.1 9.3 U ‐0.4+/‐4 6.9 U 4+/‐34 56 U
755590 ‐58+/‐97 165 U ‐0.2+/‐3.8 6.6 U 0.4+/‐3.5 6 U ‐20+/‐130 220 U
755652 9+/‐92 156 U ‐1.9+/‐5 9 U ‐2.6+/‐4 7.1 U ‐3+/‐34 58 U
755653 186+/‐86 126 NQ ‐4.1+/‐6.4 11.5 U 1.3+/‐5.2 8.7 U 4+/‐42 69 U
755661 1020+/‐170 150 ‐0.4+/‐4.6 8.2 U 1.1+/‐4 6.7 U 3.9+/‐4.7 7.7 U
755591 40+/‐110 180 U ‐4.6+/‐5.4 9.7 U 0.9+/‐3.7 6.3 U ‐42+/‐27 47 U
755666 ‐1+/‐99 169 U 1.1+/‐5.3 9.1 U ‐3.8+/‐4.5 8.1 U ‐27+/‐37 65 U
755667 ‐36+/‐85 147 U 1.1+/‐4.9 8.4 U ‐2.3+/‐4.2 7.4 U ‐27+/‐24 43 U
755667 ‐74+/‐89 155 U ‐3.5+/‐4.6 8.4 U ‐1.1+/‐3.7 6.6 U ‐90+/‐140 250 U
755592 ‐60+/‐120 200 U ‐0.5+/‐4.8 8.6 U ‐1.9+/‐4.4 7.9 U 7+/‐44 75 U
755593 ‐3+/‐82 139 U 1.5+/‐4.6 7.9 U 2.1+/‐3.9 6.5 U 4+/‐97 164 U
755658 16+/‐96 164 U 2.4+/‐5.3 9.1 U 1.1+/‐5.4 9.2 U ‐70+/‐150 250 U
757036 62+/‐87 143 U 0.5+/‐3.7 6.4 U ‐3+/‐3.8 6.7 U 30+/‐100 170 U
757035 0+/‐110 190 U ‐2.4+/‐4.2 7.8 U ‐1.6+/‐4.3 7.6 U ‐17+/‐40 69 U
757105 50+/‐110 180 U ‐0.3+/‐4.9 8.6 U ‐2.4+/‐4.4 7.7 U 33+/‐30 48 U
757034 9+/‐85 146 U ‐0.5+/‐4.9 9 U ‐3.1+/‐4.7 8.6 U 1.3+/‐5.8 9.8 U
757071 12+/‐78 134 U ‐0.6+/‐5 9.1 U ‐2.2+/‐4.6 8.4 U 0.3+/‐5.8 9.9 U
757072 40+/‐100 170 U ‐4+/‐7.5 13.7 U 1.1+/‐5.6 9.6 U ‐16+/‐32 56 U
757033 70+/‐130 220 U ‐0.3+/‐6.2 11.1 U ‐2.1+/‐5.6 10 U 13+/‐52 88 U
757038 110+/‐140 220 U ‐5.4+/‐7.3 13.3 U ‐4.1+/‐5.5 9.8 U 1+/‐33 56 U
757037 ‐60+/‐100 180 U 1.3+/‐6.4 11.2 U 6+/‐5.5 8.9 U ‐7+/‐39 67 U
U flag indicates result is less than the sample specific MDC, NQ flag indicates analyst determined criteria for identification and quantification was not met and analyte is not present at
any level above the sample specific MDC

Sampling and Analysis of Naturally Occurring Radioactive Material in Oil and Gas Produced Water
COGCC Special Project 10243 143
Appendix 8. Gamma Spectroscopy Results for U Related Isotopes
Facility # COENV DB
235U 234Th 234mPa 226Ra 214Pb 214Bi
pCi/l +/‐ TPU
MDC pCi/l
DataFlags
pCi/l +/‐ TPU
MDCpCi/l
DataFlags
pCi/l +/‐ TPU
MDC pCi/l
DataFlags
pCi/l +/‐ TPU
MDCpCi/l
DataFlags
pCi/l +/‐ TPU
MDCpCi/l
Data Flags
pCi/l +/‐ TPU
MDC pCi/l
Data Flags
755461 17+/‐20 33 U 20+/‐100 170 U ‐10+/‐810 1410 U 60+/‐140 240 U,SI 6+/‐15 24 U 14+/‐16 29 U
755462 24+/‐16 31 U 20+/‐150 250 U 500+/‐580 950 U 10+/‐110 190 U,SI ‐3+/‐12 20 U 13+/‐12 25 U
755474 0+/‐27 45 U 11+/‐91 153 U 550+/‐910 1510 U 120+/‐130 210 U,SI 5+/‐14 24 U 6+/‐17 28 U
755475 22+/‐24 40 U 140+/‐98 155 U 50+/‐710 1240 U 90+/‐130 210 U,SI 2+/‐13 22 U 11+/‐14 22 U
755476 7+/‐20 33 U 8+/‐89 149 U ‐290+/‐780 1390 U ‐10+/‐100 170 U,SI 6+/‐13 22 U 13+/‐15 25 U
755500 10+/‐15 25 U 25+/‐80 133 U 140+/‐590 1000 U 14+/‐87 145 U,SI 17+/‐14 22 U 16+/‐13 21 U
755500 ‐10+/‐16 28 U ‐46+/‐82 137 U ‐130+/‐660 1140 U 80+/‐100 160 U,SI 26+/‐13 21 TI 27+/‐13 25
755501 15+/‐10 18 U ‐11+/‐48 79 U 580+/‐520 830 U 14+/‐83 137 U,SI 3+/‐9 15 U 3+/‐14 23 U
755541 6+/‐24 46 U 10+/‐110 180 U 500+/‐1000 1700 U ‐400+/‐1600 2600 U,SI 121+/‐20 22 119+/‐23 26
755523 ‐5+/‐26 44 U ‐20+/‐110 190 U 510+/‐970 1620 U 320+/‐170 260 SI 92+/‐18 25 89+/‐24 35
755523 25+/‐18 29 U 28+/‐91 151 U ‐500+/‐1100 1900 U 280+/‐140 220 SI 110+/‐18 25 105+/‐20 26
149017 5+/‐34 57 U 30+/‐140 230 U 150+/‐700 1200 U 60+/‐140 240 U,SI ‐1+/‐13 23 U ‐2+/‐13 22 U
755522 ‐18+/‐38 64 U 170+/‐120 180 U ‐310+/‐850 1520 U 270+/‐160 250 SI 57+/‐15 25 56+/‐17 25
755550 ‐4+/‐36 61 U ‐25+/‐88 156 U 590+/‐920 1540 U ‐20+/‐120 200 U,SI 31+/‐12 21 28+/‐18 29 U
439136 9+/‐16 26 U 161+/‐36 44 NQ 610+/‐730 1190 U 70+/‐97 158 U,SI 46+/‐12 20 41+/‐15 25
215628 ‐2+/‐27 46 U ‐34+/‐62 106 U 1500+/‐1100 1800 U 16+/‐93 158 U,SI 6.5+/‐9.4 15.5 U ‐5+/‐17 30 U
215628 9+/‐20 33 U 30+/‐47 96 U ‐530+/‐800 1500 U ‐10+/‐100 170 U,SI 5+/‐14 23 U 6+/‐14 24 U
215820 8+/‐29 49 U 60+/‐180 300 U ‐150+/‐870 1560 U 30+/‐150 240 U,SI 13+/‐10 16 U 4+/‐16 27 U
755659 ‐2+/‐18 30 U ‐11+/‐41 82 U 150+/‐600 1020 U 288+/‐97 142 SI 119+/‐17 17 115+/‐19 20
755658 18+/‐18 40 U ‐44+/‐95 161 U 670+/‐660 1060 U ‐30+/‐100 170 U,SI 11+/‐11 18 U 18+/‐12 24 U
755657 16+/‐22 37 U 70+/‐140 220 U 350+/‐580 970 U 30+/‐130 220 U,SI 27.4+/‐9.9 18.5 25+/‐12 21
755557 1+/‐31 51 U ‐20+/‐100 170 U 250+/‐850 1450 U 80+/‐130 210 U,SI 3+/‐15 25 U 18+/‐20 33 U
755558 ‐5+/‐38 64 U 60+/‐170 280 U 370+/‐610 1010 U 40+/‐110 190 U,SI 5+/‐12 20 U 5+/‐15 26 U
755559 8+/‐25 41 U ‐10+/‐80 134 U ‐100+/‐1100 1900 U 15+/‐98 163 U,SI 8+/‐11 18 U 25+/‐12 18
755559 22+/‐20 37 U ‐16+/‐52 87 U 580+/‐700 1150 U 29+/‐85 140 U,SI 4.7+/‐6.9 11.4 U 6+/‐14 23 U

Sampling and Analysis of Naturally Occurring Radioactive Material in Oil and Gas Produced Water
COGCC Special Project 10243 144
Facility # COENV DB
235U 234Th 234mPa 226Ra 214Pb 214Bi
pCi/l +/‐ TPU
MDC pCi/l
DataFlags
pCi/l +/‐ TPU
MDCpCi/l
DataFlags
pCi/l +/‐ TPU
MDC pCi/l
DataFlags
pCi/l +/‐ TPU
MDCpCi/l
DataFlags
pCi/l +/‐ TPU
MDCpCi/l
Data Flags
pCi/l +/‐ TPU
MDC pCi/l
Data Flags
299153 ‐9+/‐18 31 U 40+/‐55 91 U 200+/‐1200 2000 U 61+/‐71 116 U,SI 10.1+/‐8 12.8 U 7+/‐8.9 14.6 U
285562 12+/‐34 56 U ‐20+/‐140 240 U 600+/‐1100 1900 U ‐40+/‐120 200 U,SI 12.7+/‐7.7 12 NQ 7+/‐8.4 13.7 U
755648 5+/‐18 30 U 0+/‐97 162 U 200+/‐760 1280 U 170+/‐110 170 SI 30+/‐11 21 20+/‐12 22 U
755647 28+/‐23 37 U 222+/‐67 93 NQ 1050+/‐940 1500 U 400+/‐150 220 NQ,SI 37+/‐13 24 24+/‐19 31 U
755645 ‐14+/‐31 53 U 130+/‐110 180 U ‐170+/‐830 1440 U 390+/‐120 180 SI 99+/‐17 21 91+/‐19 24
755646 11+/‐12 20 U 18+/‐49 81 U 480+/‐540 870 U 55+/‐84 138 U,SI ‐1+/‐11 18 U ‐1+/‐14 24 U
755662 ‐10+/‐46 76 U ‐5+/‐97 162 U 280+/‐720 1220 U ‐30+/‐100 170 U,SI 3.5+/‐4.4 7.3 U 7+/‐13 22 U
755590 ‐11+/‐27 46 U 30+/‐150 250 U 280+/‐620 1050 U 40+/‐130 220 U,SI 6+/‐14 23 U 5+/‐16 27 U
755652 12+/‐26 51 U 8+/‐91 152 U 290+/‐690 1160 U 60+/‐110 190 U,SI 42+/‐13 25 48+/‐14 21
755653 9+/‐30 50 U ‐80+/‐110 180 U 780+/‐870 1420 U 20+/‐120 210 U,SI 6+/‐12 21 U 15+/‐11 17 U
755661 9+/‐17 27 U ‐10+/‐55 91 U 320+/‐790 1320 U 156+/‐96 152 SI 52+/‐12 16 52+/‐14 20
755591 12+/‐17 28 U 26+/‐87 144 U 240+/‐740 1260 U 20+/‐110 180 U,SI 10.3+/‐7.4 11.8 U 3+/‐13 22 U
755666 0+/‐24 41 U ‐29+/‐89 151 U 20+/‐800 1380 U 60+/‐100 170 U,SI 15+/‐15 25 U 12+/‐15 25 U
755667 11+/‐23 38 U 24+/‐91 152 U 220+/‐740 1260 U 19+/‐88 147 U,SI 8+/‐14 24 U 15+/‐15 25 U
755667 2+/‐36 61 U 10+/‐160 270 U 250+/‐680 1140 U ‐40+/‐120 200 U,SI 7.2+/‐8 13.1 U 6+/‐14 23 U
755592 ‐9+/‐19 33 U 37+/‐60 100 U 490+/‐780 1300 U 89+/‐72 116 U,SI ‐9+/‐12 20 U 2+/‐14 23 U
755593 23+/‐20 39 U 30+/‐150 250 U 450+/‐690 1140 U ‐20+/‐120 200 U,SI 3+/‐10 17 U 2+/‐15 26 U
755658 ‐5+/‐40 68 U 50+/‐150 260 U 350+/‐900 1540 U 0+/‐140 240 U,SI 15+/‐10 16 U 0+/‐18 31 U
757036 10+/‐21 35 U 90+/‐150 240 U 30+/‐590 1020 U 20+/‐120 190 U,SI ‐10+/‐13 23 U ‐9+/‐15 26 U
757035 7+/‐18 31 U 65+/‐55 88 U 400+/‐660 1100 U 40+/‐110 180 U,SI 14.9+/‐8.3 12.7 NQ ‐2+/‐15 25 U
757105 1+/‐21 40 U 10+/‐110 180 U 240+/‐710 1200 U ‐10+/‐120 200 U,SI 10.5+/‐7.8 12.3 U ‐1+/‐15 25 U
757034 9+/‐17 28 U ‐26+/‐60 102 U 350+/‐820 1400 U 28+/‐98 165 U,SI ‐3+/‐13 22 U 1+/‐16 28 U
757071 7+/‐22 37 U ‐13+/‐56 95 U 570+/‐840 1390 U ‐19+/‐89 152 U,SI ‐4+/‐12 20 U 11+/‐13 24 U
757072 7+/‐23 39 U 20+/‐100 170 U ‐800+/‐1000 1800 U 50+/‐130 210 U,SI ‐1+/‐14 23 U 0+/‐16 28 U
757033 21+/‐23 38 U 51+/‐74 122 U 290+/‐870 1500 U 121+/‐91 144 U,SI 13+/‐12 19 U 1+/‐19 32 U
757038 31+/‐25 40 U 20+/‐120 200 U 470+/‐920 1550 U ‐40+/‐140 240 U,SI 4+/‐19 32 U 12+/‐24 40 U

Sampling and Analysis of Naturally Occurring Radioactive Material in Oil and Gas Produced Water
COGCC Special Project 10243 145
Facility # COENV DB
235U 234Th 234mPa 226Ra 214Pb 214Bi
pCi/l +/‐ TPU
MDC pCi/l
DataFlags
pCi/l +/‐ TPU
MDCpCi/l
DataFlags
pCi/l +/‐ TPU
MDC pCi/l
DataFlags
pCi/l +/‐ TPU
MDCpCi/l
DataFlags
pCi/l +/‐ TPU
MDCpCi/l
Data Flags
pCi/l +/‐ TPU
MDC pCi/l
Data Flags
757037 8+/‐24 40 U ‐30+/‐110 190 U 690+/‐940 1550 U ‐70+/‐120 210 U,SI 3+/‐19 31 U 4+/‐18 30 U
U flag indicates result is less than the sample specific MDC, NQ flag indicates analyst determined criteria for identification and quantification was not met and analyte is not present at any level above the sample specific MDC, SI flag indicates nuclide identification and/or quantification is tentative, TI flag indicates nuclide identification is tentative

Sampling and Analysis of Naturally Occurring Radioactive Material in Oil and Gas Produced Water
COGCC Special Project 10243 146
Appendix 9, Gamma Spectroscopy Results for Th Related Isotopes
Facility # COENV DB
228Ra 228Ac 212Pb 212Bi
pCi/l +/‐ TPU MDC pC/l
DataFlags pCi/l +/‐ TPU
MDCpC/l
DataFlags pCi/l +/‐ TPU
MDCpC/l
DataFlags pCi/l +/‐ TPU
MDCpC/l
DataFlags
755461 39+/‐20 29 NQ 39+/‐20 29 NQ 6.9+/‐9.5 15.6 U ‐35+/‐61 107 U
755462 35+/‐21 33 TI 35+/‐21 33 TI 9.2+/‐8.6 14 U 23+/‐45 75 U
755474 20+/‐30 49 U 20+/‐30 49 U 6.9+/‐9.2 15 U 25+/‐67 114 U
755475 9+/‐17 28 U 9+/‐17 28 U 9+/‐7.8 12.6 U ‐6+/‐57 100 U
755476 2+/‐25 42 U 2+/‐25 42 U ‐2.9+/‐9.7 16.5 U 29+/‐66 110 U
755500 3+/‐25 42 U 3+/‐25 42 U 6.6+/‐7.9 12.9 U 101+/‐50 74 NQ
755500 24+/‐15 24 NQ 24+/‐15 24 NQ 6.9+/‐8.6 14.1 U 41+/‐51 84 U
755501 4+/‐17 28 U 4+/‐17 28 U ‐3.3+/‐6.7 11.2 U ‐2+/‐44 75 U
755541 43+/‐21 55 U 43+/‐21 55 U 5+/‐12 20 U ‐35+/‐84 149 U
755523 25+/‐22 35 U 25+/‐22 35 U 4+/‐10 17 U 20+/‐80 136 U
755523 21+/‐17 32 U 21+/‐17 32 U 4+/‐8.3 13.8 U 33+/‐49 82 U
149017 33+/‐19 28 NQ 33+/‐19 28 NQ 4+/‐11 19 U 45+/‐71 118 U
755522 47+/‐20 46 47+/‐20 46 19+/‐12 19 U 7+/‐69 120 U
755550 20+/‐21 45 U 20+/‐21 45 U 4.5+/‐8 13.4 U 66+/‐71 115 U
439136 36+/‐17 24 36+/‐17 24 8.7+/‐7.9 12.5 U 33+/‐54 89 U
215628 14+/‐29 49 U 14+/‐29 49 U ‐2+/‐11 18 U ‐12+/‐67 122 U
215628 ‐7+/‐24 42 U ‐7+/‐24 42 U 2.2+/‐8.6 14.5 U 30+/‐84 141 U
215820 15+/‐29 49 U 15+/‐29 49 U 4+/‐12 19 U 11+/‐71 122 U
755659 7+/‐21 35 U 7+/‐21 35 U 6.7+/‐8.3 13.6 U ‐11+/‐70 119 U
755658 13+/‐14 27 U 13+/‐14 27 U 1.3+/‐9.3 15.5 U ‐55+/‐87 153 U
755657 39+/‐17 39 39+/‐17 39 25+/‐10 15 54+/‐43 67 U
755557 25+/‐22 35 U 25+/‐22 35 U 1.1+/‐9.7 16.3 U ‐31+/‐66 117 U
755558 19+/‐17 37 U 19+/‐17 37 U 8.2+/‐8.7 14.2 U 60+/‐50 79 U
755559 12+/‐21 35 U 12+/‐21 35 U 4.3+/‐9.1 15.1 U 36+/‐56 92 U
755559 17+/‐13 24 U 17+/‐13 24 U 1.5+/‐8.2 13.7 U 9+/‐54 91 U

Sampling and Analysis of Naturally Occurring Radioactive Material in Oil and Gas Produced Water
COGCC Special Project 10243 147
Facility # COENV DB
228Ra 228Ac 212Pb 212Bi
pCi/l +/‐ TPU MDC pC/l
DataFlags pCi/l +/‐ TPU
MDCpC/l
DataFlags pCi/l +/‐ TPU
MDCpC/l
DataFlags pCi/l +/‐ TPU
MDCpC/l
DataFlags
299153 13+/‐17 28 U 13+/‐17 28 U 10.9+/‐5.9 9.2 NQ 8+/‐62 105 U
285562 ‐11+/‐24 41 U U ‐11+/‐24 41 U 2+/‐10 17 U 38+/‐51 85 U
755648 40+/‐19 39 TI 40+/‐19 39 TI ‐0.9+/‐8.5 14.3 U 39+/‐57 93 U
755647 42+/‐16 32 NQ 42+/‐16 32 NQ 18+/‐11 17 67+/‐70 113 U
755645 229+/‐35 42 229+/‐35 42 29+/‐11 16 45+/‐69 113 U
755646 21+/‐15 23 U 21+/‐15 23 U 1.5+/‐6.4 10.7 U 25+/‐47 78 U
755662 8+/‐32 54 U 8+/‐32 54 U 4.7+/‐7.6 12.6 U 59+/‐58 93 U
755590 14+/‐13 25 U 14+/‐13 25 U 0+/‐9.6 16 U 23+/‐50 84 U
755652 2+/‐27 46 U 2+/‐27 46 U ‐1.4+/‐7.7 12.9 U 7+/‐60 102 U
755653 ‐6+/‐34 58 U ‐6+/‐34 58 U 2.4+/‐8.7 14.4 U 76+/‐69 110 U
755661 26+/‐30 49 U 26+/‐30 49 U 11.3+/‐8 12.7 U ‐17+/‐55 96 U
755591 15+/‐16 34 U 15+/‐16 34 U ‐0.1+/‐8.7 14.6 U 34+/‐57 95 U
755666 23+/‐18 36 U 23+/‐18 36 U 6+/‐8.7 14.3 U 1+/‐62 108 U
755667 21+/‐22 43 U 21+/‐22 43 U 1.2+/‐8.5 14.2 U 62+/‐62 100 U
755667 14+/‐15 29 U 14+/‐15 29 U ‐5+/‐11 18 U 10+/‐55 94 U
755592 ‐7+/‐34 58 U ‐7+/‐34 58 U 4+/‐6.3 10.4 U 12+/‐79 135 U
755593 19+/‐16 25 U 19+/‐16 25 U 3+/‐10 17 U 36+/‐57 94 U
755658 5+/‐33 57 U 5+/‐33 57 U ‐0.7+/‐9.4 16 U 68+/‐70 112 U
757036 24+/‐15 22 NQ 24+/‐15 22 NQ 2.2+/‐9.5 15.9 U 28+/‐48 80 U
757035 19+/‐17 27 U 19+/‐17 27 U 9.5+/‐6 9.4 NQ 1+/‐58 100 U
757105 16+/‐16 26 U 16+/‐16 26 U ‐3+/‐10 17 U 64+/‐60 97 U
757034 25+/‐16 33 U 25+/‐16 33 U 0.8+/‐8.1 13.7 U 58+/‐71 116 U
757071 21+/‐26 43 U 21+/‐26 43 U 9+/‐8.1 13.1 U ‐27+/‐81 143 U
757072 12+/‐30 51 U 12+/‐30 51 U 12.8+/‐8.2 12.8 NQ ‐33+/‐79 141 U
757033 ‐1+/‐32 55 U ‐1+/‐32 55 U 4+/‐11 18 U 47+/‐79 132 U
757038 41+/‐22 56 U 41+/‐22 56 U 6.5+/‐8.3 13.6 U 43+/‐76 127 U

Sampling and Analysis of Naturally Occurring Radioactive Material in Oil and Gas Produced Water
COGCC Special Project 10243 148
Facility # COENV DB
228Ra 228Ac 212Pb 212Bi
pCi/l +/‐ TPU MDC pC/l
DataFlags pCi/l +/‐ TPU
MDCpC/l
DataFlags pCi/l +/‐ TPU
MDCpC/l
DataFlags pCi/l +/‐ TPU
MDCpC/l
DataFlags
757037 10+/‐27 46 U 10+/‐27 46 U 2+/‐12 20 U 60+/‐77 126 U
U flag indicates result is less than the sample specific MDC, NQ flag indicates analyst determined criteria for identification and quantification was not met and analyte is not present at any level above the sample specific MDC, SI flag indicates nuclide identification and/or quantification is tentative, TI flag indicates nuclide identification is tentative

Sampling and Analysis of Naturally Occurring Radioactive Material in Oil and Gas Produced Water
COGCC Special Project 10243 149
Appendix 10. Dissolved Metals
Facility # COENV DB
Ba Ca Fe K Mg Na Si Sr
result mg/l
MDL mg/l flag
result mg/l
MDL mg/l flag
resultmg/l
MDL mg/l flag
resultmg/l
MDL mg/l flag
resultmg/l
MDL mg/l flag
resultmg/l
MDL mg/l flag
result mg/l
MDL mg/l flag
result mg/l
MDL mg/l flag
755461 0.051 0.00099 J 170 0.023 0.046 0.016 J 6.6 0.17 33 1 130 0.026 9.8 0.05 1.3 0.01
755462 55 0.0099 150 0.23 21 0.16 93 1.7 27 10 8800 2.6 17 0.5 34 0.1
755474 10 0.3 570 3 8 0.3 95 3 54 10 8000 30 51 0.5 71 0.1
755475 4.5 300 170 3000 4.7 300 55 3000 20 10 4700 30 49 0.5 23 0.1
755476 4.1 0.3 130 3 28 0.3 43 3 16 10 3900 30 46 0.5 14 0.1
755500 9.1 0.3 140 3 17 0.3 18 3 15 10 2500 30 15 0.5 20 0.1
755500 9.1 0.3 140 3 17 0.3 18 3 15 10 2500 30 15 0.5 20 0.1
755501 4.1 0.3 180 3 25 0.3 78 3 25 10 5500 30 35 0.5 23 0.1
755541 6.2 0.3 18000 300 41 0.3 1700 3 1800 10 34000 300 15 0.5 650 10
755523 0.3 0.3 U 740 3 0.3 0.3 U 250 3 250 10 9900 30 14 0.5 21 0.1
755523 0.3 0.3 U 740 3 0.3 0.3 U 250 3 250 10 10000 30 14 0.5 21 0.1
149017 8.8 0.03 6 0.3 0.096 0.03 J 10 0.3 1.5 1 830 3 15 0.05 0.93 0.01
755522 0.3 0.3 U 830 3 1 0.3 170 3 140 10 4800 30 17 0.5 24 0.1
755550 6.2 0.3 8.4 3 J 12 0.3 100 3 10 10 4500 30 8.7 0.5 4.5 0.1
439136 14 0.3 68 3 25 0.3 48 3 25 10 5300 30 10 0.5 9.5 0.1
215628 0.34 0.03 3.6 0.3 2.9 0.03 2.7 0.3 0.65 1 J 240 3 8.8 0.05 0.42 0.01
215628 0.34 0.03 3.6 0.3 2.7 0.03 2.3 0.3 0.65 1 J 240 3 8.9 0.05 0.43 0.01
215820 1.6 0.03 6.9 0.3 0.82 0.03 4.9 0.3 1.3 1 680 3 11 0.05 1.3 0.01
755659 0.32 0.3 J 3200 3 2.9 0.3 730 3 620 10 26000 150 14 0.5 140 5
755658 0.03 0.03 U 0.3 0.3 U 53 0.03 0.3 0.3 U 0.3 1 U 0.3 0.3 U 0.21 0.05 0.003 0.01 U
755657 0.3 0.3 U 32 3 12 0.3 110 3 3.2 10 J 2200 30 36 0.5 3.5 0.1
755557 0.3 0.3 U 9.6 3 J 0.3 0.3 U 17 3 3 10 U 2600 30 24 0.5 0.88 0.1
755558 0.89 0.3 J 24 3 0.33 0.3 J 28 3 4.9 10 J 4000 30 24 0.5 2.2 0.1
755559 0.34 0.3 J 11 3 1.3 0.3 22 3 3 10 U 3500 30 26 0.5 1.2 0.1
755559 0.33 0.3 J 12 3 1.4 0.3 21 3 3 10 U 3500 30 26 0.5 1.2 0.1
299153 0.62 0.03 2.7 0.3 0.37 0.03 4.9 0.3 0.83 1 J 600 3 9.4 0.05 0.75 0.01

Sampling and Analysis of Naturally Occurring Radioactive Material in Oil and Gas Produced Water
COGCC Special Project 10243 150
Facility # COENV DB
Ba Ca Fe K Mg Na Si Sr
result mg/l
MDL mg/l flag
result mg/l
MDL mg/l flag
resultmg/l
MDL mg/l flag
resultmg/l
MDL mg/l flag
resultmg/l
MDL mg/l flag
resultmg/l
MDL mg/l flag
result mg/l
MDL mg/l flag
result mg/l
MDL mg/l flag
285562 0.74 0.03 2.6 0.3 0.32 0.03 4.7 0.3 0.89 1 J 500 3 7 0.05 0.44 0.01
755648 58 0.3 590 3 86 0.3 110 3 72 10 13000 150 35 0.5 90 0.1
755647 58 0.3 680 3 130 0.3 110 3 83 10 12000 150 37 0.5 120 5
755645 0.84 0.3 J 490 3 15 0.3 4700 150 820 10 74000 150 26 0.5 18 0.1
755646 1.3 0.3 120 3 14 0.3 120 3 26 10 5300 150 41 0.5 13 0.1
755662 0.3 0.3 U 860 3 1.5 0.3 1500 3 93 10 7300 150 24 0.5 23 0.1
755590 0.4 0.03 2.9 0.3 0.083 0.03 J 8.5 0.3 0.51 1 J 1100 3 17 0.05 0.33 0.01
755652 16 0.3 240 3 45 0.3 40 3 29 10 4600 150 21 0.5 39 0.1
755653 1.2 0.3 300 3 120 0.3 84 3 37 10 6700 150 34 0.5 43 0.1
755661 0.3 0.3 U 650 3 2.5 0.3 1500 3 77 10 7100 150 17 0.5 15 0.1
755591 1 0.03 2.6 0.3 0.87 0.03 8 0.3 0.54 1 J 790 3 16 0.05 0.21 0.01
755666 42 0.3 320 3 8.7 0.3 60 3 27 10 8200 15 57 0.5 74 0.1
755667 41 0.3 150 3 96 0.3 28 3 10 10 3500 3 29 0.5 17 0.1
755667 39 0.3 140 3 99 0.3 28 3 10 10 3400 3 28 0.5 17 0.1
755592 0.33 0.03 5.1 0.3 0.085 0.03 J 7.3 0.3 1.2 1 950 1.5 19 0.05 0.37 0.01
755593 0.47 0.03 1 0.3 0.31 0.03 5.4 0.3 0.32 1 J 670 1.5 22 0.05 0.14 0.01
755658 0.008 0.0048 J 0.12 0.12 U 36 0.017 0.15 0.15 U 0.097 1 U 0.11 0.11 J 0.2 0.05 0.0026 0.01 U
757036 35 0.048 11 1.2 40 0.17 36 1.5 2.8 10 J 3200 1.1 25 0.5 4.1 0.1
757035 26 0.0048 21 0.12 4.8 0.017 33 0.15 2.2 1 4000 1.1 29 0.05 7.7 0.01
757105 3.9 0.0048 9.6 0.12 0.045 0.017 J 13 0.15 2.5 1 710 0.54 15 0.05 0.96 0.01
757034 12 0.0048 31 0.12 4 0.017 13 0.15 2.2 1 1100 0.54 8.7 0.05 5.2 0.01
757071 62 0.048 81 1.2 3.7 0.17 39 1.5 21 10 4900 1.1 37 0.5 44 0.1
757072 17 0.0048 210 0.12 19 0.017 59 0.15 14 1 8300 5.4 78 0.5 76 0.1
757033 55 0.048 230 1.2 24 0.17 55 1.5 13 10 4800 1.1 38 0.5 46 0.1
757038 73 0.048 160 0.12 4.3 0.017 72 0.15 29 1 6500 5.4 16 0.05 49 0.1
757037 0.54 0.0048 19 0.12 9.3 0.017 3.3 0.15 0.53 1 J 330 0.11 0.49 0.05 5.2 0.01
U flag indicates analyte not detected at concentration greater the MDL (method detection limit) specified by the laboratory J flag indicates analyte detected at concentration greater the MDL (method detection limit) but less the RL (report limit) specified by the laboratory and considered as estimated

Sampling and Analysis of Naturally Occurring Radioactive Material in Oil and Gas Produced Water
COGCC Special Project 10243 151
Appendix 11. Total ICP Metals (SW6010)
Facility # COENV DB
Be B Ca Cr Fe Li
result mg/l
MDL mg/l flag
result mg/l
MDL mg/l flag
resultmg/l
MDL mg/l flag
result mg/l
MDL mg/l flag
resultmg/l
MDL mg/l flag
resultmg/l
MDL mg/l flag
755461 0.00049 0.00049 U 0.24 0.007 160 0.021 0.00069 0.00069 U 0.059 0.1 J 0.03 0.0024
755462 0.0049 0.0049 U 7.3 0.07 150 0.21 0.0069 0.0069 U 22 1 2.4 0.024
755474 0.015 0.015 U 34 0.3 560 3 0.03 0.03 U 8.3 1 14 0.03
755475 0.015 0.015 U 25 0.3 180 3 0.03 0.03 U 5.2 1 7.4 0.03
755476 0.015 0.015 U 20 0.3 140 3 0.03 0.03 U 32 1 5.1 0.03
755500 0.015 0.015 U 9.4 0.3 140 3 0.03 0.03 U 17 1 3 0.03
755500 0.015 0.015 U 9.5 0.3 140 3 0.03 0.03 U 17 1 3 0.03
755501 0.015 0.015 U 23 0.3 180 3 0.03 0.03 U 25 1 6.2 0.03
755541 0.015 0.015 U 18 0.3 16000 300 0.03 0.03 U 51 1 35 0.03
755523 0.015 0.015 U 14 0.3 740 3 0.03 0.03 U 0.3 1 U 4.7 0.03
755523 0.015 0.015 U 14 0.3 740 3 0.03 0.03 U 0.3 1 U 4.7 0.03
149017 0.0015 0.0015 U 2.4 0.03 7.1 0.3 0.003 0.003 U 0.096 0.1 J 0.39 0.003
755522 0.015 0.015 U 5 0.3 850 3 0.03 0.03 U 3.1 1 11 0.03
755550 0.015 0.015 U 13 0.3 8.7 3 J 0.03 0.03 U 13 1 0.81 0.03
439136 0.015 0.015 U 14 0.3 120 3 0.38 0.03 79 1 1.1 0.03
215628 0.0015 0.0015 U 0.092 0.03 J 3.6 0.3 0.0083 0.003 J 3.2 0.1 0.085 0.003
215628 0.0015 0.0015 U 0.092 0.03 J 3.5 0.3 0.0042 0.003 J 2.8 0.1 0.082 0.003
215820 0.0015 0.0015 U 0.62 0.03 7 0.3 0.0064 0.003 J 1.5 0.1 0.73 0.003
755659 0.015 0.015 U 17 0.3 3100 3 0.03 0.03 U 4.6 1 3.7 0.03
755658 0.015 0.015 U 22 0.3 21 3 0.03 0.03 U 76 1 1.3 0.03
755657 0.015 0.015 U 7.6 0.3 30 3 0.03 0.03 U 13 1 8.8 0.03
755557 0.015 0.015 U 30 0.3 9.3 3 J 0.03 0.03 U 0.69 1 J 0.86 0.03
755558 0.0015 0.0015 U 29 1.5 7.8 0.3 0.003 0.003 U 0.24 0.1 0.92 0.003
755559 0.015 0.015 U 23 0.3 11 3 0.03 0.03 U 1.4 1 1.1 0.03
755559 0.015 0.015 U 23 0.3 11 3 0.03 0.03 U 1.7 1 1.1 0.03

Sampling and Analysis of Naturally Occurring Radioactive Material in Oil and Gas Produced Water
COGCC Special Project 10243 152
Facility # COENV DB
Be B Ca Cr Fe Li
result mg/l
MDL mg/l flag
result mg/l
MDL mg/l flag
resultmg/l
MDL mg/l flag
result mg/l
MDL mg/l flag
resultmg/l
MDL mg/l flag
resultmg/l
MDL mg/l flag
299153 0.0015 0.0015 U 0.4 0.03 2.7 0.3 0.003 0.003 U 0.48 0.1 0.27 0.003
285562 0.0015 0.0015 U 0.036 0.03 J 2.6 0.3 0.003 0.003 U 0.42 0.1 0.045 0.003
755648 0.015 0.015 U 49 0.3 570 3 0.16 0.03 87 1 5.2 0.03
755647 0.015 0.015 U 47 0.3 700 3 0.11 0.03 130 1 6.3 0.03
755645 0.015 0.015 U 55 0.3 520 3 0.03 0.03 U 12 1 18 0.03
755646 0.015 0.015 U 32 0.3 120 3 0.03 0.03 U 13 1 3.5 0.03
755662 0.076 0.015 37 0.3 630 3 0.03 0.03 U 2.1 1 45 1.5
755590 0.0015 0.0015 U 3 0.03 2.7 0.3 0.003 0.003 U 0.11 0.1 0.29 0.003
755652 0.015 0.015 U 15 0.3 260 3 0.03 0.03 U 47 1 5.8 0.03
755653 0.015 0.015 U 25 0.3 320 3 0.03 0.03 U 140 1 8.1 0.03
755661 0.09 0.015 38 0.3 830 3 0.03 0.03 U 1.6 1 48 1.5
755591 0.0015 0.0015 U 1.5 0.03 2.4 0.3 0.003 0.003 U 0.93 0.1 0.19 0.003
755667 0.015 0.015 U 3.1 0.3 140 3 0.03 0.03 U 96 1 2.3 0.03
755666 0.015 0.015 U 30 0.3 300 3 0.03 0.03 U 10 1 15 0.03
755667 0.015 0.015 U 3 0.3 140 3 0.03 0.03 U 88 1 2.3 0.03
755592 0.0015 0.0015 U 2.4 0.03 4.7 0.3 0.003 0.003 U 0.21 0.1 0.31 0.003
755593 0.0015 0.0015 U 1.9 0.03 1 0.3 0.003 0.003 U 0.44 0.1 0.18 0.003
755658 0.00056 0.00056 U 0.019 0.011 J 0.12 0.12 U 0.017 0.0019 97 0.1 0.0057 0.0057 U
757036 0.0056 0.0056 U 3.5 0.11 11 1.2 0.019 0.019 U 6.5 1 4.9 0.057
757035 0.0056 0.0056 U 6.2 0.11 23 1.2 0.019 0.019 U 4.1 1 4.3 0.057
757105 0.00056 0.00056 U 1.1 0.011 8.8 0.12 0.0019 0.0019 U 0.029 0.1 J 0.39 0.0057
757034 0.0056 0.0056 U 2.5 0.11 95 1.2 0.034 0.019 J 7.2 1 4.2 0.057
757071 0.0056 0.0056 U 7.7 0.11 74 1.2 0.019 0.019 U 3.1 1 4.2 0.057
757072 0.0056 0.0056 U 83 0.11 220 1.2 0.019 0.019 U 25 1 28 0.057
757033 0.0056 0.0056 U 15 0.11 200 1.2 0.019 0.019 U 21 1 7 0.057
757038 0.0056 0.0056 U 7.3 0.11 150 1.2 0.019 0.019 U 4.2 1 4.9 0.057
757037 0.00056 0.00056 U 17 0.11 17 0.12 0.0043 0.0019 J 7.4 0.1 1.2 0.0057

Sampling and Analysis of Naturally Occurring Radioactive Material in Oil and Gas Produced Water
COGCC Special Project 10243 153
Facility # COENV DB
Mg Ni K Si Na V
result mg/l
MDL mg/l flag
result mg/l
MDL mg/l flag
resultmg/l
MDL mg/l flag
result mg/l
MDL mg/l flag
resultmg/l
MDL mg/l flag
resultmg/l
MDL mg/l flag
755461 32 1 0.0019 0.02 U 6.4 1 9.3 0.05 120 1 0.0011 0.01 U
755462 26 10 0.019 0.2 U 88 10 16 0.5 8100 500 0.011 0.1 U
755474 53 10 0.06 0.2 U 93 10 51 0.5 7800 100 0.03 0.1 U
755475 21 10 0.06 0.2 U 58 10 49 0.5 4900 100 0.03 0.1 U
755476 16 10 0.06 0.2 U 44 10 48 0.5 4100 100 0.03 0.1 U
755500 15 10 0.06 0.2 U 18 10 14 0.5 2500 100 0.03 0.1 U
755500 15 10 0.06 0.2 U 19 10 15 0.5 2600 100 0.03 0.1 U
755501 24 10 0.06 0.2 U 79 10 34 0.5 5500 100 0.03 0.1 U
755541 2300 10 0.06 0.2 U 1700 10 18 0.5 36000 1000 0.03 0.1 U
755523 250 10 0.1 0.2 J 260 10 14 0.5 10000 100 0.03 0.1 U
755523 250 10 0.06 0.2 U 250 10 14 0.5 10000 100 0.03 0.1 U
149017 1.5 1 0.006 0.02 U 10 1 14 0.05 800 10 0.003 0.01 U
755522 140 10 0.06 0.2 U 170 10 18 0.5 4900 100 0.03 0.1 U
755550 11 10 0.06 0.2 U 100 10 9.4 0.5 4300 100 0.03 0.1 U
439136 26 10 0.95 0.2 50 10 13 0.5 5200 100 0.042 0.1 J
215628 0.66 1 J 0.4 0.02 2.9 1 8.8 0.05 220 10 0.003 0.01 U
215628 0.64 1 J 0.18 0.02 2.1 1 8.6 0.05 220 10 0.003 0.01 U
215820 1.3 1 0.049 0.02 4.9 1 11 0.05 680 10 0.003 0.01 U
755659 610 10 0.06 0.2 U 720 10 14 0.5 24000 500 0.03 0.1 U
755658 4.6 10 J 0.06 0.2 U 25 10 22 0.5 3500 100 0.03 0.1 U
755657 3.1 10 J 0.06 0.2 U 100 10 36 0.5 2100 100 0.03 0.1 U
755557 3 10 U 0.06 0.2 U 18 10 25 0.5 2600 100 0.03 0.1 U
755558 1.7 1 0.006 0.02 U 25 1 22 0.05 2600 50 0.003 0.01 U
755559 3 10 U 0.06 0.2 U 22 10 26 0.5 3100 100 0.03 0.1 U
755559 3 10 U 0.06 0.2 U 21 10 26 0.5 3200 100 0.03 0.1 U
299153 0.79 1 J 0.006 0.02 U 4.9 1 9 0.05 600 10 0.003 0.01 U
285562 0.88 1 J 0.006 0.02 U 4.7 1 6.6 0.05 490 10 0.003 0.01 U
755648 69 10 0.06 0.2 U 100 10 35 0.5 12000 500 0.03 0.1 U

Sampling and Analysis of Naturally Occurring Radioactive Material in Oil and Gas Produced Water
COGCC Special Project 10243 154
Facility # COENV DB
Mg Ni K Si Na V
result mg/l
MDL mg/l flag
result mg/l
MDL mg/l flag
resultmg/l
MDL mg/l flag
result mg/l
MDL mg/l flag
resultmg/l
MDL mg/l flag
resultmg/l
MDL mg/l flag
755647 82 10 0.06 0.2 U 120 10 38 0.5 12000 500 0.03 0.1 U
755645 870 10 0.22 0.2 4800 500 26 0.5 72000 500 0.03 0.1 U
755646 21 10 0.06 0.2 U 89 10 40 0.5 5000 500 0.03 0.1 U
755662 75 10 0.06 0.2 U 1500 10 17 0.5 6900 500 0.03 0.1 U
755590 0.48 1 J 0.006 0.02 U 8.2 1 17 0.05 1000 10 0.003 0.01 U
755652 30 10 0.06 0.2 U 43 10 23 0.5 4700 500 0.03 0.1 U
755653 39 10 0.22 0.2 91 10 37 0.5 7100 500 0.03 0.1 U
755661 90 10 0.06 0.2 U 1500 10 24 0.5 7300 500 0.03 0.1 U
755591 0.52 1 J 0.006 0.02 U 7.8 1 16 0.05 740 10 0.003 0.01 U
755667 10 10 0.06 0.2 U 39 10 26 0.5 3500 500 0.03 0.1 U
755666 27 10 0.06 0.2 U 98 10 51 0.5 7900 500 0.03 0.1 U
755667 10 10 0.06 0.2 U 39 10 27 0.5 3600 500 0.03 0.1 U
755592 0.92 1 J 0.006 0.02 U 12 1 17 0.05 970 50 0.003 0.01 U
755593 0.35 1 J 0.006 0.02 U 8.6 1 19 0.05 670 50 0.003 0.01 U
755658 0.079 1 U 0.027 0.02 0.2 1 U 0.26 0.05 0.32 1 J 0.0018 0.01 U
757036 1.6 10 J 0.027 0.2 U 51 10 24 0.5 3000 100 0.018 0.1 U
757035 2.4 10 J 0.027 0.2 U 50 10 28 0.5 3700 100 0.018 0.1 U
757105 2.4 1 0.0027 0.02 U 22 1 14 0.05 660 10 0.0018 0.01 U
757034 6.9 10 J 0.029 0.2 J 58 10 27 0.5 3500 100 0.018 0.1 U
757071 18 10 0.027 0.2 U 65 10 34 0.5 4800 100 0.018 0.1 U
757072 15 10 0.027 0.2 U 110 10 75 0.5 7100 100 0.018 0.1 U
757033 12 10 0.027 0.2 U 85 10 35 0.5 4600 100 0.018 0.1 U
757038 31 10 0.027 0.2 U 120 10 14 0.5 5900 100 0.018 0.1 U
757037 0.56 1 J 0.0031 0.02 J 4 1 0.46 0.05 360 10 0.0018 0.01 U
U flag indicates analyte not detected at concentration greater the MDL (method detection limit) specified by the laboratory J flag indicates analyte detected at concentration greater the MDL (method detection limit) but less the RL (report limit) specified by the laboratory and considered as estimated

Sampling and Analysis of Naturally Occurring Radioactive Material in Oil and Gas Produced Water
COGCC Special Project 10243 155
Appendix 12. Total ICP/MS Metals (SW6020)
Facility # COENV DB
Al As Ba Cd Co Cu
mg/l MDL mg/l
data flag mg/l
MDL mg/l
dataflag mg/l
MDL mg/l
dataflag mg/l
MDL mg/l
dataflag mg/l
MDL mg/l
dataflag mg/l
MDL mg/l
data flag
755461 0.052 0.011 J 0.00041 0.00016 J 0.051 0.00024 7.90E‐05 7.90E‐05 U 0.00022 7.90E‐05 J 0.0061 0.0009 J
755462 0.23 0.011
0.00094 0.00016 J 57 0.024 0.00024 7.90E‐05 J 0.00055 7.90E‐05 J 0.0055 0.0009 J
755474 0.5 0.5 U 0.0091 0.0091 U 11 0.036 0.0095 0.0095 U 0.022 0.022 U 0.12 0.12 U
755475 0.052 0.011 J 0.001 0.00016 J 4.5 0.00024 7.90E‐05 7.90E‐05 U 8.00E‐05 7.90E‐05 J 0.0009 0.0009 U
755476 0.5 0.5 U 0.0091 0.0091 U 1.5 0.036 0.0095 0.0095 U 0.022 0.022 U 0.12 0.12 U
755500 0.21 0.05
0.00091 0.00091 U 9.5 0.0036 0.00095 0.00095 U 0.0022 0.0022 U 0.012 0.012 U
755500 0.15 0.05
0.00091 0.00091 U 9.6 0.0036 0.00095 0.00095 U 0.0022 0.0022 U 0.012 0.012 U
755501 0.14 0.05
0.0016 0.00091 J 4.7 0.0036 0.00095 0.00095 U 0.0022 0.0022 U 0.012 0.012 U
755541 0.37 0.05
0.014 0.00091 8.9 0.0036 0.0042 0.00095 0.0022 0.0022 U 0.057 0.012
755523 0.14 0.05
0.001 0.00091 J 0.016 0.0036 0.00095 0.00095 U 0.0022 0.0022 U 1.6 0.012
755523 0.055 0.05 J 0.00091 0.00091 U 0.015 0.0036 0.00095 0.00095 U 0.0022 0.0022 U 0.35 0.012
149017 0.067 0.05 J 0.00091 0.00091 U 9.4 0.0036 0.00095 0.00095 U 0.0022 0.0022 U 0.012 0.012 U
755522 0.05 0.05 U 0.00091 0.00091 U 0.11 0.0036 0.00095 0.00095 U 0.0022 0.0022 U 0.012 0.012 U
755550 0.05 0.05 U 0.00091 0.00091 U 6.5 0.0036 0.00095 0.00095 U 0.0022 0.0022 U 0.012 0.012 U
439136 0.65 0.05
0.018 0.00091 14 0.036 0.0014 0.00095 J 0.016 0.0022 0.52 0.012
215628 0.069 0.05 J 0.00091 0.00091 U 0.33 0.0036 0.00095 0.00095 U 0.0022 0.0022 U 0.015 0.012 J
215628 0.05 0.05 U 0.00091 0.00091 U 0.31 0.0036 0.00095 0.00095 U 0.0022 0.0022 U 0.012 0.012 U
215820 0.05 0.05 U 0.00091 0.00091 U 1.6 0.0036 0.00095 0.00095 U 0.0022 0.0022 U 0.038 0.012
755659 0.054 0.05 J 0.00091 0.00091 U 0.39 0.0036 0.00095 0.00095 U 0.0022 0.0022 U 0.012 0.012 U
755658 0.05 0.05 U 0.00091 0.00091 U 0.0085 0.0036 0.00095 0.00095 U 0.0022 0.0022 U 0.012 0.012 U
755657 0.05 0.05 U 0.00091 0.00091 U 0.045 0.0036 0.00095 0.00095 U 0.0022 0.0022 U 0.012 0.012 U
755557 0.05 0.05 U 0.00091 0.00091 U 0.092 0.0036 0.00095 0.00095 U 0.0022 0.0022 U 0.012 0.012 U
755558 0.05 0.05 U 0.00091 0.00091 U 0.89 0.0036 0.00095 0.00095 U 0.0022 0.0022 U 0.012 0.012 U
755559 0.067 0.05 J 0.00091 0.00091 U 0.34 0.0036 0.00095 0.00095 U 0.0022 0.0022 U 0.012 0.012 U

Sampling and Analysis of Naturally Occurring Radioactive Material in Oil and Gas Produced Water
COGCC Special Project 10243 156
Facility # COENV DB
Al As Ba Cd Co Cu
mg/l MDL mg/l
data flag mg/l
MDL mg/l
dataflag mg/l
MDL mg/l
dataflag mg/l
MDL mg/l
dataflag mg/l
MDL mg/l
dataflag mg/l
MDL mg/l
data flag
755559 0.05 0.05 U 0.00091 0.00091 U 0.32 0.0036 0.00095 0.00095 U 0.0022 0.0022 U 0.012 0.012 U
299153 0.05 0.05 U 0.00091 0.00091 U 0.65 0.0036 0.00095 0.00095 U 0.0022 0.0022 U 0.012 0.012 U
285562 0.05 0.05 U 0.00091 0.00091 U 0.74 0.0036 0.00095 0.00095 U 0.0022 0.0022 U 0.012 0.012 U
755648 0.076 0.05 J 0.0011 0.00091 J 63 0.036 0.00095 0.00095 U 0.0022 0.0022 U 0.017 0.012 J
755647 0.05 0.05 U 0.00091 0.00091 U 59 0.036 0.00095 0.00095 U 0.0022 0.0022 U 0.012 0.012 U
755645 0.5 0.5 U 0.34 0.0091 1.3 0.036 0.0095 0.0095 U 0.022 0.022 U 0.83 0.12
755646 0.059 0.05 J 0.00091 0.00091 J 1.4 0.036 0.00095 0.00095 U 0.0022 0.0022 U 0.012 0.012 U
755662 0.22 0.05
8.4 0.00091 0.096 0.0036 0.00095 0.00095 U 0.0022 0.0022 U 0.012 0.012 U
755590 0.05 0.05 U 0.00091 0.00091 U 0.42 0.0036 0.00095 0.00095 U 0.0022 0.0022 U 0.012 0.012 U
755652 0.05 0.05 U 0.0015 0.00091 J 18 0.036 0.00095 0.00095 U 0.0022 0.0022 U 0.012 0.012 U
755653 0.07 0.05 J 0.11 0.00091 4.5 0.036 0.00095 0.00095 U 0.025 0.0022 2.2 0.012
755661 0.19 0.05
7.7 0.00091 0.15 0.0036 0.00095 0.00095 U 0.0022 0.0022 U 0.012 0.012 U
755591 0.05 0.05 U 0.00091 0.00091 U 1.1 0.0036 0.00095 0.00095 U 0.0022 0.0022 U 0.012 0.012 U
755666 0.05 0.05 U 0.0099 0.00091 42 0.036 0.00095 0.00095 U 0.0022 0.0022 U 0.012 0.012 U
755667 0.16 0.05
0.0029 0.00091 38 0.036 0.00095 0.00095 U 0.0022 0.0022 U 0.012 0.012 U
755667 0.05 0.05 U 0.0018 0.00091 J 37 0.036 0.00095 0.00095 U 0.0022 0.0022 U 0.012 0.012 U
755592 0.05 0.05 U 0.0011 0.00091 J 0.32 0.0036 0.00095 0.00095 U 0.0022 0.0022 U 0.012 0.012 U
755593 0.05 0.05 U 0.0012 0.00091 J 0.44 0.0036 0.00095 0.00095 U 0.0022 0.0022 U 0.012 0.012 U
755658 0.23 0.0075
0.00059 0.00017 J 0.0094 0.00012 0.0001 5.10E‐05 J 0.0013 0.00015 J 0.014 0.0016 J
757036 0.3 0.075 J 0.0017 0.0017 U 30 0.0012 0.00051 0.00051 U 0.0015 0.0015 U 0.016 0.016 U
757035 0.63 0.075 J 0.0017 0.0017 U 28 0.0012 0.00051 0.00051 U 0.0015 0.0015 U 0.016 0.016 U
757105 0.023 0.0075 J 0.00017 0.00017 J 3.9 0.00012 5.10E‐05 5.10E‐05 U 0.00015 0.00015 U 0.0016 0.0016 U
757034 0.094 0.075 J 0.0018 0.0017 J 37 0.0012 0.00051 0.00051 U 0.0015 0.0015 U 0.016 0.016 U
757071 0.09 0.075 J 0.0017 0.0017 U 60 0.0012 0.00051 0.00051 U 0.0015 0.0015 U 0.016 0.016 U
757072 1.9 0.075
0.0017 0.0017 U 19 0.0012 0.00051 0.00051 U 0.0015 0.0015 U 0.016 0.016 U
757033 120 0.075
0.0022 0.0017 J 49 0.0012 0.00051 0.00051 U 0.0015 0.0015 U 0.016 0.016 U

Sampling and Analysis of Naturally Occurring Radioactive Material in Oil and Gas Produced Water
COGCC Special Project 10243 157
Facility # COENV DB
Al As Ba Cd Co Cu
mg/l MDL mg/l
data flag mg/l
MDL mg/l
dataflag mg/l
MDL mg/l
dataflag mg/l
MDL mg/l
dataflag mg/l
MDL mg/l
dataflag mg/l
MDL mg/l
data flag
757038 0.36 0.075 J 0.0026 0.0017 J 73 0.0012 0.00051 0.00051 U 0.0019 0.0015 J 0.016 0.016 U
757037 0.036 0.0075 J 0.00042 0.00017 J 0.51 0.00012 5.10E‐05 5.10E‐05 U 0.00024 0.00015 J 0.0047 0.0016 J
U flag indicates analyte not detected at concentration greater the MDL (method detection limit) specified by the laboratory J flag indicates analyte detected at concentration greater the MDL (method detection limit) but less the RL (report limit) specified by the laboratory and considered as estimated

Sampling and Analysis of Naturally Occurring Radioactive Material in Oil and Gas Produced Water
COGCC Special Project 10243 158
Facility # COENV DB
Pb Mn Mo Se Ag Na
mg/l MDL mg/l
data flag mg/l
MDL mg/l
dataflag mg/l
MDL mg/l
data flag mg/l
MDL mg/l
dataflag mg/l
MDL mg/l
dataflag mg/l
MDL mg/l
data flag
755461 0.00074 0.00017 J 0.023 0.0003 0.0023 0.00038 0.0054 0.00066 J 3.30E‐05 3.30E‐05 U 130 0.16
755462 0.00069 0.00017 J 0.34 0.0003 0.0046 0.00038 0.00078 0.00066 J 3.30E‐05 3.30E‐05 U 9500 0.16
755474 0.014 0.014 U 0.33 0.023 0.0098 0.0098 U 0.049 0.049 U 0.0022 0.0022 U 9200 4.6
755475 0.00017 0.00017 U 0.12 0.0003 0.0029 0.00038 0.00082 0.00066 J 3.30E‐05 3.30E‐05 U 5200 0.16
755476 0.014 0.014 U 0.54 0.023 0.022 0.0098 0.049 0.049 U 0.0022 0.0022 U 4600 4.6
755500 0.0014 0.0014 U 0.29 0.0023 0.00098 0.00098 U 0.0049 0.0049 U 0.00022 0.00022 U 2700 0.46
755500 0.0014 0.0014 U 0.29 0.0023 0.00098 0.00098 U 0.0049 0.0049 U 0.00022 0.00022 U 2600 0.46
755501 0.0078 0.0014
0.47 0.0023 0.02 0.00098 0.0049 0.0049 U 0.00022 0.00022 U 6300 0.46
755541 0.092 0.0014
2.9 0.0023 0.00098 0.00098 U 0.0049 0.0049 U 0.00022 0.00022 U 40000 46
755523 0.062 0.0014
0.017 0.0023 0.00098 0.00098 U 0.0049 0.0049 U 0.00039 0.00022 J 13000 46
755523 0.016 0.0014
0.012 0.0023 0.00098 0.00098 U 0.0049 0.0049 U 0.00022 0.00022 U 17000 46
149017 0.0014 0.0014 U 0.032 0.0023 0.00098 0.00098 U 0.0049 0.0049 U 0.00022 0.00022 U 910 0.46
755522 0.0014 0.0014 J 0.1 0.0023 0.00098 0.00098 U 0.0049 0.0049 U 0.00022 0.00022 U 9000 46
755550 0.0014 0.0014 U 0.33 0.0023 0.00098 0.00098 U 0.0049 0.0049 U 0.00022 0.00022 U 4900 0.46
439136 0.018 0.0014
1.1 0.0023 0.072 0.00098 0.0049 0.0049 U 0.00022 0.00022 U 5100 4.6
215628 0.0014 0.0014 U 0.063 0.0023 0.002 0.00098 J 0.0049 0.0049 U 0.00022 0.00022 U 250 0.46
215628 0.0014 0.0014 U 0.043 0.0023 0.0014 0.00098 J 0.0049 0.0049 U 0.00022 0.00022 U 230 0.46
215820 0.0014 0.0014 U 0.026 0.0023 0.0012 0.00098 J 0.0049 0.0049 U 0.00022 0.00022 U 760 0.46
755659 0.0014 0.0014 U 0.11 0.0023 0.00098 0.00098 U 0.0049 0.0049 U 0.00022 0.00022 U 31000 46
755658 0.0014 0.0014 U 0.9 0.0023 0.00098 0.00098 U 0.0049 0.0049 U 0.00022 0.00022 U 1.3 0.46
755657 0.0014 0.0014 U 0.17 0.0023 0.003 0.00098 0.0049 0.0049 U 0.00022 0.00022 U 2300 0.46
755557 0.0014 0.0014 U 0.016 0.0023 0.00098 0.00098 U 0.0049 0.0049 U 0.00022 0.00022 U 3000 0.46
755558 0.0014 0.0014 U 0.034 0.0023 0.00098 0.00098 U 0.0049 0.0049 U 0.00022 0.00022 U 4400 0.46
755559 0.0014 0.0014 U 0.056 0.0023 0.00098 0.00098 U 0.0049 0.0049 U 0.00022 0.00022 U 3700 0.46
755559 0.0014 0.0014 U 0.061 0.0023 0.00098 0.00098 U 0.0049 0.0049 U 0.00022 0.00022 U 3900 0.46
299153 0.0014 0.0014 U 0.0072 0.0023 0.00098 0.00098 U 0.0049 0.0049 U 0.00022 0.00022 U 670 0.46

Sampling and Analysis of Naturally Occurring Radioactive Material in Oil and Gas Produced Water
COGCC Special Project 10243 159
Facility # COENV DB
Pb Mn Mo Se Ag Na
mg/l MDL mg/l
data flag mg/l
MDL mg/l
dataflag mg/l
MDL mg/l
data flag mg/l
MDL mg/l
dataflag mg/l
MDL mg/l
dataflag mg/l
MDL mg/l
data flag
285562 0.0014 0.0014 U 0.0081 0.0023 0.0011 0.00098 J 0.0049 0.0049 U 0.00022 0.00022 U 560 0.46
755648 0.0031 0.0014
1.2 0.023 0.013 0.00098 0.0049 0.0049 U 0.00022 0.00022 U 13000 4.6
755647 0.0014 0.0014 U 1.6 0.023 0.0062 0.00098 0.0049 0.0049 U 0.00022 0.00022 U 12000 4.6
755645 0.33 0.014
3.3 0.023 0.0098 0.0098 U 0.049 0.049 U 0.012 0.0022 86000 4.6
755646 0.0032 0.0014
0.25 0.023 0.00098 0.00098 U 0.0049 0.0049 U 0.00022 0.00022 U 5000 4.6
755662 0.0054 0.0014
0.06 0.0023 0.0048 0.00098 0.0049 0.0049 U 0.00022 0.00022 U 7900 4.6
755590 0.0014 0.0014 U 0.021 0.0023 0.00098 0.00098 U 0.0049 0.0049 U 0.00022 0.00022 U 1200 0.46
755652 0.0014 0.0014 U 0.64 0.023 0.0024 0.00098 0.0049 0.0049 U 0.00022 0.00022 U 5100 4.6
755653 0.0014 0.0014 U 2.6 0.023 0.012 0.00098 0.0049 0.0049 U 0.00022 0.00022 U 7500 4.6
755661 0.0097 0.0014
0.027 0.0023 0.0042 0.00098 0.0049 0.0049 U 0.00022 0.00022 U 7800 4.6
755591 0.0014 0.0014 U 0.046 0.0023 0.00098 0.00098 U 0.0049 0.0049 U 0.00022 0.00022 U 860 0.46
755666 0.0014 0.0014 U 0.2 0.0023 0.0013 0.00098 J 0.0049 0.0049 U 0.00022 0.00022 U 8700 4.6
755667 0.003 0.0014
1.3 0.0023 0.0011 0.00098 J 0.0049 0.0049 U 0.00022 0.00022 U 3700 4.6
755667 0.0014 0.0014 U 1.2 0.0023 0.00098 0.00098 U 0.0049 0.0049 U 0.00022 0.00022 U 3700 4.6
755592 0.0014 0.0014 U 0.03 0.0023 0.00098 0.00098 U 0.0049 0.0049 U 0.00022 0.00022 U 1000 0.46
755593 0.0014 0.0014 U 0.0069 0.0023 0.00098 0.00098 U 0.0049 0.0049 U 0.00022 0.00022 U 730 0.46
755658 0.0015 0.00018 J 0.97 0.00042 0.0022 0.00016 0.00017 0.00017 U 8.10E‐05 8.10E‐05 U 0.34 0.17 J
757036 0.0018 0.0018 U 0.069 0.0042 0.0016 0.0016 U 0.0017 0.0017 U 0.00081 0.00081 U 2900 1.7
757035 0.0018 0.0018 U 0.088 0.0042 0.0017 0.0016 J 0.0017 0.0017 U 0.00081 0.00081 U 3600 1.7
757105 0.00018 0.00018 U 0.025 0.00042 0.00016 0.00016 U 0.00017 0.00017 U 8.10E‐05 8.10E‐05 U 660 0.17
757034 0.0018 0.0018 U 0.23 0.0042 0.0016 0.0016 U 0.0017 0.0017 U 0.00081 0.00081 U 3300 1.7
757071 0.0018 0.0018 U 0.075 0.0042 0.0016 0.0016 U 0.0017 0.0017 U 0.00081 0.00081 U 4900 1.7
757072 0.0018 0.0018 U 0.35 0.0042 0.0016 0.0016 U 0.0017 0.0017 U 0.00081 0.00081 U 7300 1.7
757033 0.0018 0.0018 U 0.49 0.0042 0.0054 0.0016 J 0.0017 0.0017 U 0.00081 0.00081 U 4400 1.7
757038 0.0018 0.0018 U 0.21 0.0042 0.0087 0.0016 J 0.0017 0.0017 J 0.00081 0.00081 U 6000 1.7
757037 0.00036 0.00018 J 1.2 0.00042 0.0055 0.00016 0.00017 0.00017 U 8.10E‐05 8.10E‐05 U 290 0.17

Sampling and Analysis of Naturally Occurring Radioactive Material in Oil and Gas Produced Water
COGCC Special Project 10243 160
Facility # COENV DB
Sr Tl Th U Zn
mg/l MDL mg/l
data flag mg/l
MDL mg/l
dataflag mg/l
MDL mg/l
data flag mg/l
MDL mg/l
dataflag mg/l
MDL mg/l
dataflag
755461 1.4 0.0003
1.40E‐05 1.40E‐05 U 4.00E‐05 2.50E‐05 J 0.023 2.50E‐05 0.012 0.0081 J
755462 41 0.03
2.00E‐05 1.40E‐05 J 4.00E‐05 2.50E‐05 J 3.00E‐05 2.50E‐05 J 0.033 0.0081 J
755474 81 0.03
0.0007 0.00062 J 0.00091 0.00091 U 0.00075 0.00075 U 2.4 0.48
755475 23 0.003
0.00022 1.40E‐05 2.50E‐05 2.50E‐05 U 2.50E‐05 2.50E‐05 U 0.0081 0.0081 U
755476 15 0.03
0.00062 0.00062 U 0.00091 0.00091 U 0.00075 0.00075 U 0.48 0.48 U
755500 21 0.03
0.00022 6.20E‐05 9.10E‐05 9.10E‐05 U 7.50E‐05 7.50E‐05 U 0.048 0.048 U
755500 20 0.03
0.00021 6.20E‐05 9.10E‐05 9.10E‐05 U 7.50E‐05 7.50E‐05 U 0.048 0.048 U
755501 24 0.03
6.20E‐05 6.20E‐05 U 9.10E‐05 9.10E‐05 U 0.00012 7.50E‐05 0.048 0.048 U
755541 690 0.3
0.11 6.20E‐05 9.10E‐05 9.10E‐05 U 7.50E‐05 7.50E‐05 U 1.6 0.048
755523 25 0.3
6.20E‐05 6.20E‐05 U 9.10E‐05 9.10E‐05 U 7.50E‐05 7.50E‐05 U 2.9 0.048
755523 33 0.3
6.20E‐05 6.20E‐05 U 9.10E‐05 9.10E‐05 U 7.50E‐05 7.50E‐05 U 0.89 0.048
149017 0.96 0.003
0.00019 6.20E‐05 9.10E‐05 9.10E‐05 U 7.50E‐05 7.50E‐05 U 0.048 0.048 U
755522 41 0.3
0.00011 6.20E‐05 9.10E‐05 9.10E‐05 U 7.50E‐05 7.50E‐05 U 0.31 0.048
755550 4.7 0.003
6.20E‐05 6.20E‐05 U 9.10E‐05 9.10E‐05 U 7.50E‐05 7.50E‐05 U 0.048 0.048 U
439136 9.8 0.003
0.00034 6.20E‐05 0.00031 9.10E‐05
0.0031 7.50E‐05 0.29 0.048
215628 0.4 0.003
6.20E‐05 6.20E‐05 U 9.10E‐05 9.10E‐05 U 7.50E‐05 7.50E‐05 U 0.054 0.048 J
215628 0.37 0.003
6.20E‐05 6.20E‐05 U 9.10E‐05 9.10E‐05 U 7.50E‐05 7.50E‐05 U 0.048 0.048 U
215820 1.3 0.003
6.20E‐05 6.20E‐05 U 9.10E‐05 9.10E‐05 U 7.50E‐05 7.50E‐05 U 0.05 0.048 J
755659 150 0.3
7.00E‐05 6.20E‐05 J 9.10E‐05 9.10E‐05 U 7.50E‐05 7.50E‐05 U 0.048 0.048 U
755658 0.003 0.003 U 6.20E‐05 6.20E‐05 U 9.10E‐05 9.10E‐05 U 7.50E‐05 7.50E‐05 U 0.048 0.048 U
755657 3.4 0.003
0.00014 6.20E‐05 9.10E‐05 9.10E‐05 U 7.50E‐05 7.50E‐05 U 0.048 0.048 U
755557 0.88 0.003
6.20E‐05 6.20E‐05 U 9.10E‐05 9.10E‐05 U 7.50E‐05 7.50E‐05 U 0.048 0.048 U
755558 2.2 0.003
6.20E‐05 6.20E‐05 U 9.10E‐05 9.10E‐05 U 7.50E‐05 7.50E‐05 U 0.048 0.048 U
755559 1.2 0.003
6.20E‐05 6.20E‐05 U 9.10E‐05 9.10E‐05 U 7.50E‐05 7.50E‐05 U 0.048 0.048 U
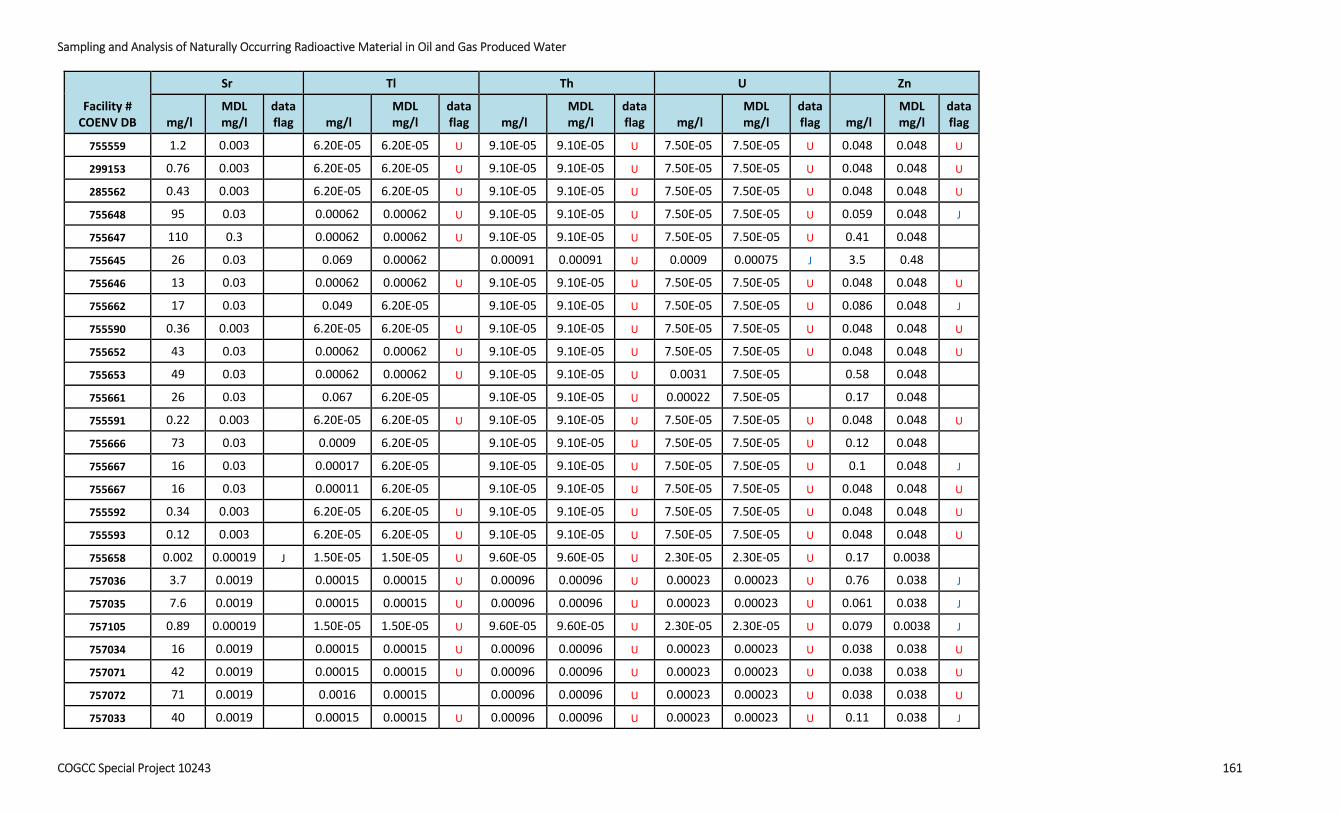
Sampling and Analysis of Naturally Occurring Radioactive Material in Oil and Gas Produced Water
COGCC Special Project 10243 161
Facility # COENV DB
Sr Tl Th U Zn
mg/l MDL mg/l
data flag mg/l
MDL mg/l
dataflag mg/l
MDL mg/l
data flag mg/l
MDL mg/l
dataflag mg/l
MDL mg/l
dataflag
755559 1.2 0.003
6.20E‐05 6.20E‐05 U 9.10E‐05 9.10E‐05 U 7.50E‐05 7.50E‐05 U 0.048 0.048 U
299153 0.76 0.003
6.20E‐05 6.20E‐05 U 9.10E‐05 9.10E‐05 U 7.50E‐05 7.50E‐05 U 0.048 0.048 U
285562 0.43 0.003
6.20E‐05 6.20E‐05 U 9.10E‐05 9.10E‐05 U 7.50E‐05 7.50E‐05 U 0.048 0.048 U
755648 95 0.03
0.00062 0.00062 U 9.10E‐05 9.10E‐05 U 7.50E‐05 7.50E‐05 U 0.059 0.048 J
755647 110 0.3
0.00062 0.00062 U 9.10E‐05 9.10E‐05 U 7.50E‐05 7.50E‐05 U 0.41 0.048
755645 26 0.03
0.069 0.00062 0.00091 0.00091 U 0.0009 0.00075 J 3.5 0.48
755646 13 0.03
0.00062 0.00062 U 9.10E‐05 9.10E‐05 U 7.50E‐05 7.50E‐05 U 0.048 0.048 U
755662 17 0.03
0.049 6.20E‐05 9.10E‐05 9.10E‐05 U 7.50E‐05 7.50E‐05 U 0.086 0.048 J
755590 0.36 0.003
6.20E‐05 6.20E‐05 U 9.10E‐05 9.10E‐05 U 7.50E‐05 7.50E‐05 U 0.048 0.048 U
755652 43 0.03
0.00062 0.00062 U 9.10E‐05 9.10E‐05 U 7.50E‐05 7.50E‐05 U 0.048 0.048 U
755653 49 0.03
0.00062 0.00062 U 9.10E‐05 9.10E‐05 U 0.0031 7.50E‐05 0.58 0.048
755661 26 0.03
0.067 6.20E‐05 9.10E‐05 9.10E‐05 U 0.00022 7.50E‐05 0.17 0.048
755591 0.22 0.003
6.20E‐05 6.20E‐05 U 9.10E‐05 9.10E‐05 U 7.50E‐05 7.50E‐05 U 0.048 0.048 U
755666 73 0.03
0.0009 6.20E‐05 9.10E‐05 9.10E‐05 U 7.50E‐05 7.50E‐05 U 0.12 0.048
755667 16 0.03
0.00017 6.20E‐05 9.10E‐05 9.10E‐05 U 7.50E‐05 7.50E‐05 U 0.1 0.048 J
755667 16 0.03
0.00011 6.20E‐05 9.10E‐05 9.10E‐05 U 7.50E‐05 7.50E‐05 U 0.048 0.048 U
755592 0.34 0.003
6.20E‐05 6.20E‐05 U 9.10E‐05 9.10E‐05 U 7.50E‐05 7.50E‐05 U 0.048 0.048 U
755593 0.12 0.003
6.20E‐05 6.20E‐05 U 9.10E‐05 9.10E‐05 U 7.50E‐05 7.50E‐05 U 0.048 0.048 U
755658 0.002 0.00019 J 1.50E‐05 1.50E‐05 U 9.60E‐05 9.60E‐05 U 2.30E‐05 2.30E‐05 U 0.17 0.0038
757036 3.7 0.0019
0.00015 0.00015 U 0.00096 0.00096 U 0.00023 0.00023 U 0.76 0.038 J
757035 7.6 0.0019
0.00015 0.00015 U 0.00096 0.00096 U 0.00023 0.00023 U 0.061 0.038 J
757105 0.89 0.00019
1.50E‐05 1.50E‐05 U 9.60E‐05 9.60E‐05 U 2.30E‐05 2.30E‐05 U 0.079 0.0038 J
757034 16 0.0019
0.00015 0.00015 U 0.00096 0.00096 U 0.00023 0.00023 U 0.038 0.038 U
757071 42 0.0019
0.00015 0.00015 U 0.00096 0.00096 U 0.00023 0.00023 U 0.038 0.038 U
757072 71 0.0019
0.0016 0.00015 0.00096 0.00096 U 0.00023 0.00023 U 0.038 0.038 U
757033 40 0.0019
0.00015 0.00015 U 0.00096 0.00096 U 0.00023 0.00023 U 0.11 0.038 J

Sampling and Analysis of Naturally Occurring Radioactive Material in Oil and Gas Produced Water
COGCC Special Project 10243 162
Facility # COENV DB
Sr Tl Th U Zn
mg/l MDL mg/l
data flag mg/l
MDL mg/l
dataflag mg/l
MDL mg/l
data flag mg/l
MDL mg/l
dataflag mg/l
MDL mg/l
dataflag
757038 48 0.0019
0.00015 0.00015 U 0.00096 0.00096 U 0.00023 0.00023 U 0.038 0.038 U
757037 4.9 0.00019
0.0046 1.50E‐05 9.60E‐05 9.60E‐05 U 2.30E‐05 2.30E‐05 U 0.036 0.0038 J
U flag indicates analyte not detected at concentration greater the MDL (method detection limit) specified by the laboratory J flag indicates analyte detected at concentration greater the MDL (method detection limit) but less the RL (report limit) specified by the laboratory and considered as estimated

Sampling and Analysis of Naturally Occurring Radioactive Material in Oil and Gas Produced Water
COGCC Special Project 10243 163
Appendix 13. Anions
Facility COENV DB
bromide chloride fluoride sulfate bicarbonate alkalinity carbonate alk. total alkalinity
result mg/l
MDL mg/l flag
result mg/l
MDLmg/l flag
result mg/l
MDLmg/l flag
result mg/l
MDLmg/l flag
result mg/l
(as CaCO3) RL mg/l flag
result mg/l
(as CaCO3) RL mg/l flag
result mg/l
(as CaCO3) RL mg/l flag
755461 0.34 0.06 130 0.6 0.85 0.03 360 1.5 230 20 20 20 U 230 20
755462 110 2.4 16000 60 1.2 1.2 U 6 6 U 420 20 20 20 U 420 20
755474 200 2.4 16000 60 1.2 1.2 U 45 6 340 20 20 20 U 340 20
755475 110 1.5 8600 30 1.3 0.75 J 64 3.8 520 20 20 20 U 520 20
755476 97 1.2 6500 30 1.8 0.6 J 130 3 840 20 20 20 U 840 20
755500 43 12 4400 30 6 6 U 30 30 U 180 20 20 20 U 180 20
755500 42 12 4400 30 6 6 U 98 30 J 180 20 20 20 U 180 20
755501 71 15 9300 30 7.5 7.5 U 120 38 J 620 20 20 20 U 620 20
755541 230 12 100000 600 6 6 U 400 30 150 20 20 20 U 150 20
755523 23 3 17000 60 3.3 1.5 J 3800 7.5 550 100 100 100 U 550 100
755523 23 3 18000 60 2.3 1.5 J 3800 7.5 540 100 100 100 U 540 100
149017 3 0.3 360 1.5 3.8 0.15 13 0.75 1300 100 100 100 U 1300 100
755522 16 1.5 9400 60 2.5 0.75 1700 3.8 180 50 50 50 U 180 50
755550 59 1.5 8200 30 1.8 0.75 J 3.8 3.8 U 1100 100 100 100 U 1100 100
439136 60 1.5 9700 60 1.7 0.75 J 7.1 3.8 J 920 100 100 100 U 920 100
215628 0.06 0.06 U 7.5 0.06 1.3 0.03 0.15 0.15 U 530 20 20 20 U 530 20
215628 0.06 0.06 U 6.9 0.06 1.3 0.03 0.29 0.15 J 540 50 50 50 U 540 50
215820 0.12 0.12 U 55 1.2 2.3 0.06 0.6 0.3 J 300 20 20 20 U 300 20
755659 74 7.5 56000 300 3.8 3.8 U 1100 19 570 100 100 100 U 570 100
755658 0.06 0.06 U 0.33 0.06 0.03 0.03 U 1 0.15 81 20 20 20 U 81 20
755657 11 0.6 1500 6 2.6 0.3 2300 15 680 50 50 50 U 680 50
755557 12 0.6 2900 30 0.86 0.3 J 420 1.5 1900 100 100 100 U 1900 100
755558 45 1.2 5800 30 0.3 0.3 U 16 3 J 1400 100 100 100 U 1400 100
755559 39 1.2 5200 30 0.99 0.6 J 23 3 1100 100 100 100 U 1100 100

Sampling and Analysis of Naturally Occurring Radioactive Material in Oil and Gas Produced Water
COGCC Special Project 10243 164
Facility COENV DB
bromide chloride fluoride sulfate bicarbonate alkalinity carbonate alk. total alkalinity
result mg/l
MDL mg/l flag
result mg/l
MDLmg/l flag
result mg/l
MDLmg/l flag
result mg/l
MDLmg/l flag
result mg/l
(as CaCO3) RL mg/l flag
result mg/l
(as CaCO3) RL mg/l flag
result mg/l
(as CaCO3) RL mg/l flag
755461 0.34 0.06 130 0.6 0.85 0.03 360 1.5 230 20 20 20 U 230 20
755559 39 1.2 5200 30 1 0.6 J 25 3 1200 100 100 100 U 1200 100
299153 1.4 0.12 200 1.5 3.4 0.06 0.74 0.3 J 1100 100 100 100 U 1100 100
285562 1 0.12 170 1.2 3.3 0.06 0.63 0.3 J 910 20 20 20 U 930 20
755648 260 3 27000 150 1.5 1.5 U 7.5 7.5 U 390 20 20 20 U 390 20
755647 300 3 24000 120 1.5 1.5 U 7.5 7.5 U 380 20 20 20 U 380 20
755645 15 15 U 170000 600 7.5 7.5 U 3000 38 140 20 20 20 U 140 20
755646 50 1.5 7900 120 0.75 0.75 U 110 3.8 770 20 20 20 U 770 20
755662 16 3 13000 150 1.5 1.5 U 2100 7.5 3500 100 100 100 U 3500 100
755590 6 0.3 760 3 3.1 0.15 32 0.75 1500 100 100 100 U 1500 100
755652 78 1.5 9600 30 0.75 0.75 U 9.5 3.8 J 250 20 20 20 U 250 20
755653 110 2.4 13000 60 1.2 1.2 U 230 6 150 20 20 20 U 150 20
755661 18 3 15000 150 1.5 1.5 U 1400 7.5 2700 100 100 100 U 2700 100
755591 5.9 0.3 750 3 3.6 0.15 2.8 0.75 J 810 100 100 100 U 810 100
755667 44 3 7400 30 1.5 1.5 U 19 7.5 J 430 50 50 50 U 430 50
755666 120 3 16000 150 1.5 1.5 U 23 7.5 J 600 100 100 100 U 600 100
755667 48 3 7600 30 1.5 1.5 U 18 7.5 J 430 50 50 50 U 430 50
755592 2 0.06 330 3 3.9 0.03 8.3 0.15 1700 500 500 500 U 1700 500
755593 2.3 0.06 350 3 6 0.03 1.5 0.15 1200 500 500 500 U 1200 500
755658 0.06 0.06 U 0.064 0.06 J 0.03 0.03 U 0.17 0.15 J 30 20 20 20 U 30 20
757036 16 6 J 720 6 3 3 U 15 15 U 5400 100 100 100 U 5400 100
757035 12 12 U 2600 12 6 6 U 30 30 U 4300 50 50 50 U 4300 50
757105 3.5 0.6 130 0.6 1.4 0.03 8.1 0.15 1300 20 20 20 U 1300
757034 12 12 U 2800 12 6 6 U 30 30 U 3400 100 100 100 U 3400 100
757071 30 30 U 7400 30 15 15 U 75 75 U 1600 100 100 100 U 1600 100
757072 110 30 13000 60 30 30 U 150 150 U 400 100 100 100 U 400 100

Sampling and Analysis of Naturally Occurring Radioactive Material in Oil and Gas Produced Water
COGCC Special Project 10243 165
Facility COENV DB
bromide chloride fluoride sulfate bicarbonate alkalinity carbonate alk. total alkalinity
result mg/l
MDL mg/l flag
result mg/l
MDLmg/l flag
result mg/l
MDLmg/l flag
result mg/l
MDLmg/l flag
result mg/l
(as CaCO3) RL mg/l flag
result mg/l
(as CaCO3) RL mg/l flag
result mg/l
(as CaCO3) RL mg/l flag
755461 0.34 0.06 130 0.6 0.85 0.03 360 1.5 230 20 20 20 U 230 20
757033 39 30 J 6900 30 15 15 U 75 75 U 1500 100 100 100 U 1500 100
757038 100 30 9900 30 15 15 U 75 75 U 500 100 100 100 U 500 100
757037 3.1 3 J 510 3 1.5 1.5 U 11 7.5 J 120 20 20 20 U 120 20
U flag indicates analyte not detected at concentration greater the MDL (method detection limit) specified by the laboratory J flag indicates analyte detected at concentration greater the MDL (method detection limit) but less the RL (report limit) specified by the laboratory and considered as estimated

Sampling and Analysis of Naturally Occurring Radioactive Material in Oil and Gas Produced Water
COGCC Special Project 10243 166
Appendix 14. pH, Specific Conductance, TDS and TSS
Facility COENV DB
pH Result SU qualifier
specific conductivity result
µmhos/cm qualifier
total dissolved solids result mg/l qualifier
total suspended solids result mg/l
RL mg/l qualifier
755461 7.44 1458 1000 20 20 U
755462 7.09 38700 23000 33 4
755474 6.67 39800 25000 43 20
755475 7.21 24300 15000 27 20
755476 7.10 19720 12000 95 20
755500 6.96 13270 7600 24 20
755500 7.09 13330 7500 130 20
755501 7.23 26100 16000 78 20
755541 5.92 178000 170000 75 20
755523 7.55 50200 35000 100 20
755523 7.58 50300 35000 180 20
149017 8.45 3410 2200 20 20 U
755522 7.10 27300 18000 20 20 U
755550 7.75 20790 13000 32 20
439136 7.75 25100 16000 620 20
215628 7.84 1026 660 20 20 U
215628 7.83 997 640 20 20 U
215820 8.36 2910 1800 20 20 U
755659 7.39 127100 91000 55 20
755658 6.24 105 160 54 20
755657 8.01 9960 6800 20 20 U
755557 7.95 11880 7800 20 20 U
755558 8.19 18440 11000 20 20 U
755559 8.21 16560 9700 20 20 U
755559 7.83 16340 10000 20 20 U
299153 8.53 2880 1900 20 20 U
285562 8.63 2440 1400 20 20 U

Sampling and Analysis of Naturally Occurring Radioactive Material in Oil and Gas Produced Water
COGCC Special Project 10243 167
Facility COENV DB
pH Result SU qualifier
specific conductivity result
µmhos/cm qualifier
total dissolved solids result mg/l qualifier
total suspended solids result mg/l
RL mg/l qualifier
755648 5.70 55500 35000 250 20
755647 6.00 57600 37000 720 80
755645 6.12 237000 240000 70 20
755646 6.82 22500 14000 180 20
755662 7.02 36100 27000 20 20 U
755590 7.97 4770 2900 20 20 U
755652 6.54 24200 15000 160 20
755653 6.22 34200 23000 110 20
755661 6.65 38300 27000 20 20 U
755591 7.99 3700 2100 20 20 U
755667 6.10 16930 11000 61 20
755666 6.37 36000 25000 22 20
755667 7.42 17260 11000 58 20
755592 8.10 3990 2300 20 20 U
755593 7.73 2920 1700 20 20 U
755658 5.76 188.6 92 76 20
757036 8.29 11520 8900 230 40
757035 7.95 15490 11000 350 49
757105 8.34 2680 1700 20 20 U
757034 8.56 14090 10000 410 40
757071 7.98 22100 15000 29 20
757072 7.05 33700 21000 26 20
757033 7.78 21260 14000 440 71
757038 8.43 27900 17000 47 20
757037 6.67 2105 960 31 20
U flag indicates analyte not detected at concentration greater the RL (report limit) specified by the laboratory

Sampling and Analysis of Naturally Occurring Radioactive Material in Oil and Gas Produced Water
COGCC Special Project 10243 168
Appendix 15. Stable Isotopes of H2O and Carbon Isotopes of Dissolved Inorganic Carbon
Facility # COENV DB
δ18O H2O per mil VSMOW
δD H2O per mil VSMOW
δ13C DIC per mil VPDB
755461 ‐12.3 ‐99.2 ‐8
755462 ‐3.3 ‐40 4.9
755474 ‐3 ‐52.2 11.1
755475 ‐5.4 ‐59.8 10.5
755476 ‐6.2 ‐69.4 7.7
755500 ‐7.7 ‐63 8.4
755501 ‐5.3 ‐61.1 8.1
755541 ‐1 ‐20.7 0.4
755523 ‐7.7 ‐74.5 ‐15
755523 ‐7.1 ‐72.8 ‐15
149017 ‐12.7 ‐93.8 6.4
755522 ‐11.5 ‐89 ‐4
755550 ‐10.5 ‐61.5 6.1
439136 ‐8.1 ‐52.4 4.3
215628 ‐14.3 ‐105 22.6
215628 ‐14.2 ‐104.2 22.9
215820 ‐14.4 ‐105.6 24.6
755659 1.4 ‐33.8 2.1
755658 ‐5 ‐67.7 ‐0.6
755657 ‐5.2 ‐75.9 0
755557 ‐4.5 ‐52.9 ‐7.1
755558 ‐3.1 ‐45.1 ‐6.7
755559 ‐2.5 ‐43.1 ‐2.8
755559 ‐2.5 ‐44 ‐2.7
299153 ‐9.9 ‐72.1 21.5
285562 ‐10.1 ‐73.3 19.8
755648 ‐5.6 ‐84 1.5
755647 ‐5.5 ‐85 4.5
755645 ‐4.1 ‐65 3.6
755646 ‐0.8 ‐43 9.2
755662 ‐10.1 ‐74 3.7
755590 ‐12.3 ‐95 ‐8.7
755653 ‐3.5 ‐50 8.5
755652 ‐4.3 ‐51 10.5
755661 ‐12.0 ‐72 2.9
755591 ‐12.4 ‐90 ‐6.0
755667 ‐6.5 ‐50 1.2
755666 ‐0.2 ‐40 5.3

Sampling and Analysis of Naturally Occurring Radioactive Material in Oil and Gas Produced Water
COGCC Special Project 10243 169
Facility # COENV DB
δ18O H2O per mil VSMOW
δD H2O per mil VSMOW
δ13C DIC per mil VPDB
755667 ‐6.7 ‐52 1.5
755592 ‐12.6 ‐95 6.2
755593 ‐12.7 ‐95 1.1
755658 ‐4.9 ‐67 ‐0.6
757036 ‐6.9 ‐59 2.6
757035 ‐2.6 ‐34 3.7
757105 ‐18.3 ‐140 4.5
757034 ‐4.5 ‐36 4.8
757071 ‐3.3 ‐33 4.4
757072 4.0 ‐33 7.2
757033 ‐2.4 ‐36 5.9
757038 ‐1.4 ‐33 ‐8.6
757037 1.3 ‐41 2.6

Sampling and Analysis of Naturally Occurring Radioactive Material in Oil and Gas Produced Water
COGCC Special Project 10243 170
Appendix 16. Tritium (3H) in Water (U of Miami)
Facility # COENV DB
3H H2O TU (tritium units)
one Ϭ uncertainty (TU)
Data Flags
755461 6.71 0.22
755462 ‐1 2 U
755474 1.91 0.09
755475 2.74 0.09
755476 4.13 0.14
755500 1.66 0.09
755501 2.81 0.09
755523 ‐0.01 0.09 U
U flag indicates analyte not detected by the laboratory
Appendix 17. 14C in Dissolved Inorganic Carbon (DIC) University of Arizona
Facility # COENV DB
δ13C DIC per mil VPDB 14C DIC
14C DIC Units 14C DIC Age Units
755461 ‐9.9 102.63 pMC 60 years BP
755462 2.8 0.69 pMC 39900 years BP
755474 12.9 1.13 pMC 36030 years BP
755475 12 0.44 pMC 43600 years BP
755476 6.9 1.31 pMC 34840 years BP
755500 7.3 6.85 pMC 21540 years BP
755501 ‐2.7 11.88 pMC 17115 years BP
755523 ‐17.2 0.64 pMC 40500 years BP