metabolomics as a diagnostic tool for hepatology: validation in a naturally occurring canine model
TRANSCRIPT
Metabolomics as a diagnostic tool for hepatology: validation in a
naturally occurring canine model
Phillip David Whitfielda, Peter-John Mantyla Nobleb, Hilary Majorc, Robert Jeffrey Beynona, Rachel Burrowb,Alistair Iain Freemanb, and Alexander James Germanb,*
aDepartment of Veterinary Preclinical Sciences, Faculty of Veterinary Science, University of Liverpool, Crown Street, Liverpool, L69 7ZJ, UKbDepartment of Veterinary Clinical Sciences, Faculty of Veterinary Science, University of Liverpool, Crown Street, Liverpool, L69 7ZJ, UK
cWaters Corporation, Atlas Park, Simonsway, Manchester, M22 5PP, UK
Received 4 March 2005; accepted 16 May 2005
Human hepatopathies are a diagnostic challenge, with many distinct diseases having similar clinical signs and laboratory
findings. Naturally occurring canine hepatic disease provides an excellent model for human diseases and similar diagnostic
dilemmas exist; differentiating canine congenital portosystemic vascular anomalies (PVA) from acquired hepatopathies is difficult
and traditionally requires invasive diagnostic procedures. The emerging post-genomic science of metabolomics is concerned with
detecting global changes of populations of endogenous low molecular weight metabolites in biological samples and offers the
possibility of identifying surrogate profiles of disease. Metabolomics couples sensitive metabolite analysis with sophisticated pattern
recognition techniques. In this study, a metabolomic strategy has been employed to assess metabolite changes in the plasma of dogs
with congenital PVA and acquired hepatic disease. Plasma samples were collected from 25 dogs, comprising 9 dogs with congenital
PVA, 6 with acquired hepatopathy and 10 with non-hepatic disorders. Low molecular weight metabolites were analyzed by liquid
chromatography-mass spectrometry (LC-MS). Following identification of metabolites, multivariate data analysis was used to
compare profiles amongst groups. The analysis demonstrated significant disturbances in the plasma bile acid and phospholipid
profiles of dogs with portovascular anomalies. In contrast to traditional laboratory parameters, the metabolomic strategy was able
to produce a clear segregation between all three study groups. In conclusion, this study demonstrates the potential of metabolomics
as a diagnostic tool for naturally occurring hepatic disease. With further validation, this approach will improve diagnostic
capabilities, provide an insight into pathogenetic mechanisms, and ultimately inform therapeutic decision making in clinical
hepatology.
KEY WORDS: metabonomics; portovascular anomalies; liver; hepatopathy; dogs; mass spectrometry.
1. Introduction
The liver is the most metabolically diverse organ ofthe body, and is involved in a number of critical meta-bolic processes. This organ is sensitive to many patho-logical insults, and the result of dysfunction leads to anarray of clinical signs and symptoms. Clinicians canutilize such metabolic derangements in diagnosis. Con-ventional diagnostic approaches have typically focussedon a small number of biomarkers, which are charac-teristic of a particular disease state. Although, for somediseases with a straightforward cause and effect rela-tionship, this approach can reliably group a populationinto affected and unaffected individuals, such links aredifficult to establish for complex multifactorial diseases(German et al., 2003). In many cases, no single bio-marker is sufficiently specific to provide a definitivediagnosis. Clinicians must, therefore, combine tests todiagnose the disease accurately, and use pattern recog-nition to differentiate conditions which lead to similar
clinical signs. However, the ability to make a correctdiagnosis is often limited by the number of variablesthat the clinician can assimilate in parallel.
Thousands of low molecular weight metabolites existin the body fluids and tissues. Metabolite profiles can bealtered by a variety of physiological and pathologicalprocesses, and therefore global changes in such profilesmay signal the presence of a particular disease state(Nicholson et al., 2002; Griffin and Shockcor, 2004).Metabolomics is an emerging post-genomic science thatuses analytical techniques such as nuclear magneticresonance (NMR) spectroscopy and mass spectrometryto measure low molecular weight metabolites in bio-logical samples (Griffin, 2003; Dunn et al., 2005; Wilsonet al., 2005). Advanced statistical analysis is thenemployed to maximize the recovery of information andinterpret the large data sets that are generated. Whilststill in its infancy, metabolomics is already beginning tomake a significant impact in biological and medicalresearch. Metabolomic strategies have been employed tocharacterize metabolic perturbations resulting fromaltered gene function in biological systems (Raamsdonk
*To whom correspondence should be addressed.
E-mail: [email protected]
Metabolomics Vol. 1, No. 3, July 2005(� 2005) 215DOI: 10.1007/s11306-005-0001-3
1573-3882/05/0700–0215/0 � 2005 Springer ScienceþBusiness Media, Inc.
et al., 2000; Roessner et al., 2001; Allen et al., 2003) andas a means of assessing the toxicological effects ofchemical compounds (Waters et al., 2002; Lindon et al.,2003; Nicholson et al., 2003). To date there have beenfew studies, which focus on naturally occurring diseasestates. However, metabolomic approaches are increas-ingly being employed by investigators as a means ofcharacterizing metabolic alterations in body fluids andtissues of humans and animals in order to improveclinical diagnosis and explore the pathogenesis of dis-eases (Brindle et al., 2002; Lamers et al., 2003; Yanget al., 2004).
Congenital portovascular anomalies (PVA; alsoknown as portosystemic shunts, PSS) have been recog-nized in many species, and are the most common con-genital liver disease in dogs (Center, 1996). In all cases,an abnormal vascular communication exists between theportal and systemic venous circulations, which allowsblood from splanchnic organs to bypass the liver andavoids normal hepatic metabolism. The reduced abilityof the liver to detoxify and excrete waste results indramatic changes in the levels of a wide range ofmetabolites. PVA are associated with hyperammona-emia and disturbances in the concentrations of aromaticand branched chain amino acids in the plasma ofaffected dogs have been reported (Schafer et al., 1985).The disease state is characterized by the development ofneurological (dementia, staggering, circling, centralblindness, tremors, seizures and coma) and systemic(stunting, poor body condition, polydipsia, polyuria,vomiting and diarrhoea) signs. Whilst congenital PVAare rare abnormalities of liver vasculature in humans,surgically induced transjugular intrahepatic portosys-temic shunts (TIPS) are a valuable tool in the manage-ment of patients with cirrhosis and treatment ofcomplications of portal hypertension (Watanabe, 2000;Rosado and Kamath, 2003). Interestingly, a commoncomplication of TIPS is hepatic encephalopathy.Therefore, congenital PVA in dogs can provide anexcellent animal model with which to study hepaticdysfunction.
Diagnosis of congenital PVA in dogs can be prob-lematic because a number of acquired hepatic diseasescan also arise in young dogs, and the presenting clinicalsigns can be identical. Congenital PVA are typicallydiagnosed by a combination of laboratory analyses, anddiagnostic imaging. Although diagnosis can be achievedin most instances there are numerous pitfalls. Pre-liminary investigations include routine haematologicaland clinical chemistry analysis, and measurement offasting and post-prandial bile acid concentrations.However, none of these tests are pathognomonic forcongenital PVA and often can not differentiate fromacquired PVA. Alternatively, the abnormal shuntingvessel can be detected by abdominal ultrasonography,but the technique is technically challenging and manyshunts are missed (Center, 1996). At present, the most
informative diagnostic approach is intravenous porto-venography. However, this technique also requiresconsiderable expertise and given the requirement forgeneral anaesthesia and celiotomy, it is invasive and notwithout risk. Therefore, additional non-invasive diag-nostic modalities are urgently required. Our overallhypothesis is that metabolomics will provide a powerful,non-invasive, diagnostic tool for both human and vet-erinary hepatology. To test this hypothesis we haveemployed metabolomic strategies to assess the pertur-bations of the metabolite profiles in the plasma of dogswith congenital PVA and compared them with dogswith acquired liver disease.
2. Materials and methods
2.1. Study animals
The study involved 25 dogs referred to the Depart-ment of Veterinary Clinical Sciences, University ofLiverpool. Of these dogs, 15 were referred for theinvestigation of suspected hepatic disease (table 1).After diagnostic investigations, these dogs were assignedto two groups; Group 1 (n=9) represented dogs with afinal diagnosis of congenital portovascular anomaly(PVA); Group 2 (n=6) represented dogs with a finaldiagnosis of an acquired hepatopathy. The remainingdogs (n=10) were assigned to Group 3, and were acontrol population, referred for unrelated i.e. non-hepatic disorders over the same period of study as theclinical cases (table 1). The study was performed inadherence to the University of Liverpool Animal EthicsGuidelines and the owners of all animals participating inthe study gave written consent.
2.2. Clinical investigations and diagnosis
The exact diagnostic investigations performeddepended upon the presenting signs of the individualcase. All dogs had routine haematological analysis,whilst the majority of dogs (5/9, 4/6 and 7/10 for Groups1, 2 and 3, respectively) had routine urinalysis (dipstick,specific gravity by refractometer, sediment analysis).Fasting (9/9, 6/6 and 8/10; for Groups 1, 2 and 3,respectively) and post-prandial (9/9, 4/6 and 4/10; forgroups 1, 2 and 3, respectively) bile acid concentrations,and abdominal ultrasonography (9/9, 4/6 and 7/10; forGroups 1, 2 and 3, respectively) were also performed inmost cases. All routine laboratory investigations wereperformed by the diagnostic laboratories in the Depart-ment of Veterinary Pathology, University of Liverpool.
Definitive diagnosis of congenital PVA was made atceliotomy either by direct visualization of theanomalous blood vessel (n=4) or by direct visualizationand portovenography (n=5). Seven dogs had extra-hepatic PVA, of which 5 were portocaval, one wasporto-azygous and one was a communication between a
P.D. Whitfield et al./Metabolomics in hepatic disease216
gastric vein and the vena cava. The remaining two dogshad intrahepatic PVA, one of which was right divi-sional, and the other was left divisional. Definitivediagnosis of acquired hepatopathy was made by histo-pathological assessment of hepatic biopsy specimens inmost cases, collected either at celiotomy (n=1), lapa-roscopy (n=3), or postmortem examination (n=1). Inthe remaining case, a presumptive diagnosis of gluco-corticoid hepatopathy was made after documentingdramatic increases in liver enzymes (alkaline phoso-phatase and alanine aminotransferase), whilst the dogwas undergoing high-dose glucocorticoid therapy(prednisolone at a dosage of 2 mg/kg). Elevated fastingserum bile acid concentrations were documented andfine needle aspiration cytology revealed findings con-sistent with vacuolar hepatopathy. Hepatic parametershad been normal prior to glucocorticoid use. The spe-cific clinical investigations performed in the control dogsvaried depending on reason for referral. However, therewas no evidence of hepatic disease, and an alternativediagnosis was documented in every case.
Blood was collected from the dogs by jugular vene-puncture for routine haematological and biochemicalanalyses.Any surplus heparinized plasma (approximately1 mL) was used for the study, aliquoted into 20 lL units,and immediately stored at )20 �C for metabolite analy-ses. All the investigative procedures performed were for
the direct benefit of the patient. After diagnosis, all ani-mals were treated according to standard hospital proto-cols and received the most appropriate therapy.
2.3. Statistical analysis of clinical data
Statistical analysis was performed using Minitab forWindows release 14.1 (Minitab Inc., State College, PA,USA). Prior to statistical analysis, all continuous datawere assessed for normal distribution. Given that noneof the data for any outcome were normally distributed,data were logarithmically transformed and again asses-sed for normal distribution. The data for age and fastingbile acid concentrations were normalized by this trans-formation. When a square root transformation was usedinstead, data for post-prandial bile acid concentrationswere normalized. Therefore, parametric tests wereemployed (after appropriate transformation).
The order of statistical analysis was as follows:baseline data (e.g. age, gender, neuter status) amongstgroups first were compared with either a one-wayanalysis of variance (ANOVA) (age) or Chi squaredtests (gender and neuter status). The data were then usedin quantitative analyses among groups, using one-wayANOVA. Post hoc analysis was performed with Tukey’spairwise comparisons. The level of significance for allstatistical tests was set at p<0.05.
Table 1
Clinical information for all cases
Case Breed Gender Age Diagnosis
Group 1: Congenital PVA
1 Miniature Schnauzer F 36 EH PVAa (portocaval)
2 Bichon Frise NMb 11 EH PVA (portocaval)
3 Miniature Schnauzer M 30 EH PVA (portocaval)
4 West Highland White Terrier NFc 24 EH PVA (portoazygous)
5 Mixbreed M 4 IH PVAd (right divisional)
6 Miniature Dachshund F 7 EH PVA (portocaval))
7 Boarder Terrier M 84 EH PVA (portocaval))
8 Bichon Frise F 6 EH PVA (gastrocaval)
9 Labrador M 12 IH PVA (left divisional)
Group 2: Acquired Hepatopathy
10 Mixbreed NF 60 Cirrhosis
11 Staffordshire Bull Terrier M 22 Cholangiohepatitis
12 Boxer NM 68 Steroid hepatopathy
13 Cocker Spaniel NF 70 Vacuolar hepatopathy
14 Yorkshire Terrier M 156 Hepatocellular carcinoma
15 Mixbreed NF 13 Portal vein hypoplasia
Group 3: Controls
16 Miniature Schnauzer F 14 Nasal foreign body
17 German Shepherd Dog M 60 Osteosarcoma
18 Mixbreed M 5 Campylobacter
19 Yorkshire Terrier NM 36 Idiopathic epilepsy
20 Weimaraner F 24 Myaesthenia gravis
21 Mixbreed M 168 Laryngeal paralysis
22 Cavalier King Charles Spaniel M 7 Leukoencephalopathy
23 Weimaraner M 10 Prostatitis
24 Rottweiler NM 51 Supraventricular dysrhythmia
25 Boxer M 3 Eosinophilic enteritis
All ages reported in months. a Extra-hepatic portovascular anomaly, b Neutered male, c Neutered female, d Intrahepatic portovascular anomaly.
P.D. Whitfield et al./Metabolomics in hepatic disease 217
2.4. Extraction of low molecular weight metabolites
The plasma samples were thawed at room tempera-ture and mixed thoroughly prior to analysis. The lowmolecular weight metabolites in plasma were extractedin organic solvents. A 50 lL aliquot of plasma was thenextracted with 200 lL of acetonitrile. The mixture wasleft to stand at room temperature for 10 min and wasthen centrifuged at to remove the precipitated plasmaproteins.
2.5. Liquid chromatography-mass spectrometry(LC-MS)
The low molecular weight metabolites were thenanalyzed by liquid chromatography-mass spectrometry(LC-MS) as previously described (Plumb et al., 2003;Lenz et al., 2004a, b). All mass spectrometric analyseswere performed using a Micromass Q-TOF micro massspectrometer (Waters Corporation, Manchester, UK)equipped with a Z-Spray electrospray source and cou-pled to a Waters Alliance 2795XC HPLC system.
Samples (10 lL) were injected on to a Waters Sym-metry C18 reverse phase LC column (2.1· 100 mm,3.5 lm) held at 40 �C. The column was eluted using awater/acetonitrile gradient at a flow rate of 600 lL/min.Themobile phases both contained 0.1% (volume/volume,v/v) formic acid. The gradient conditions were 0–20%acetonitrile over 4 min, followed by 20–95% acetonitrileover 4–8 min. The gradient was held for 1 min and thenreturned to 0% acetonitrile at 9.1 min. The flow rate wassplit to 120 lL/min into the mass spectrometer.
The mass spectrometer was operated in both thepositive and negative ion mode. The positive and neg-ative ion data was acquired separately in two runs. Thecapillary voltage was set to 3200 V in the positive modeand 2600 V in negative ion mode. The cone voltage wasset to 30 V. The source temperature was set at 120 �Cwith a cone gas flow of 50 L/h, the desolvation heater at250 �C and a desolvation gas flow of 500 L/h. Data werecollected in centroid mode using a LockSpray interfacewith a scan time of 0.4 s and an inter-scan delay of 0.1 s.Leucine enkephalin was used as the lockmass standardat a concentration of 0.5 ng/lL in acetonitrile:water +0.1% (v/v) formic acid in positive ion mode([M+H]+=556.2771) and 1 ng/lL in acetonitrile:water+ 0.1% (v/v) formic acid in negative ion mode ([M-H])=554.2615). The LockSpray frequency was set as5 s and the lockmass was averaged over 10 scans. Massspectra were acquired over the mass to charge ratiorange (m/z) 50–850. Metabolites were identified usingliquid chromatography-tandem mass spectrometry (LC-MS/MS). Product ions were detected over a scanningrange of m/z 50–850. The collision voltage was setbetween 30 and 70 V and argon was used as the collisiongas at a pressure of 15 p.s.i. Identification of themetabolites was confirmed by comparison withauthentic standards.
2.6. Data processing and statistical analysis of metabolitedata
The raw LC-MS data was initially processed using theMarkerLynx (version 1.0) applications manager software(Lenz et al., 2004a, b). The software incorporates a peakdeconvolution package which allows detection andretention time alignment of the peaks eluting in each datefile across the whole dataset. MarkerLynx extracts com-ponents utilizing exact mass chromatograms and listsdetected peaks as theirmass and retention time alongwiththeir associated intensities.
Chromatographic peaks in the raw data files aredetected by extracting nominal mass chromatogramsand tracking the apex of the peaks in the chromato-grams. The spectra from each of the detected peaks aresaved as retention time and exact mass pairs along withassociated intensities which can be saved as either nor-malized or absolute intensities. Once all the data hasbeen extracted it is aligned within user defined mass andretention time windows. If necessary retention timecorrection can be applied using an internal standard.Once collected the data were then interpreted by prin-ciple component analysis (PCA) within MarkerLynxapplications manager.
Partial least squares-discriminant analysis (PLS-DA)was performed by exporting the processed data toSIMCA-P+ (version 10.0) multivariate data analysissoftware package (Umetrics, Sweden). PLS-DA modelswere originally constructed using all the samples and theinformation supplied regarding their class membership.To validate the PLS-DA model an observation fromeach class was excluded in turn and a new model gen-erated. The coefficients from each model were thentaken and sorted in ascending order. The models werethen compared to check that the order of the potentialbiomarkers were the same or similar between the dif-ferent models. The models were also validated by pre-dicting the excluded observations and checking theirclassifications against the models. If the probability ofbelonging to a class is >0.65 then this is consideredpositive. If the probability of belonging to a class is>0.35 to 0.65 then it is considered to be borderline andbelow that it is considered not to belong to that class.
3. Results and discussion
3.1. Clinical data
The clinical data from all cases is summarized intable 1. Preliminary statistical analyses did not revealany significant differences in age, gender or neuter statusbetween groups (p>0.14 for all). Further, a number ofbreeds were represented in all groups, and a particularbreed bias was not obvious in any one group. However,given the small numbers of dogs in each group, the trueeffect of breed could not be determined. In the future,larger studies will be required to make certain that
P.D. Whitfield et al./Metabolomics in hepatic disease218
chance differences between such groups are not simplythe effect of a chance association with a particular breed.
Prior to metabolomic analysis, we first assessed theability of routine diagnostic investigations to differenti-ate the three clinical groups. Haematological androutine clinical chemistry results are reported in table 2.Although typical abnormalities were documented inGroup 1 (including microcytic anaemia and low albu-min concentrations), similar findings were evident ingroup 2 dogs. Therefore, none of the parameters mea-sured could reliably distinguish cases with congenitalPVA from dogs with acquired hepatic disease. Signifi-cant differences amongst groups were noted for bothfasting and post-prandial bile acid concentrations(p<0.0001 for both). However, the group ranges for bileacid concentrations overlapped (table 1). Therefore,measurement of bile acid concentrations could not beused to differentiate accurately between dogs with PVA,dogs with acquired hepatic disease and controls. Simi-larly, multivariate data analysis of the conventionalbiochemical and haematological parameters was able toseparate control and affected populations of dogs, butwas unable to fully discriminate animals with congenitalPVA from those with acquired hepatopathies (data notshown).
3.2. Negative ion mode LC-MS analysis
Plasma low molecular weight metabolites were char-acterized by LC-MS in both the positive and negative ionmodes. The mass spectral data were then processed bymultivariate analysis. Initial analyses employed anunsupervised statistical method, PCA. PCA is a patternrecognition method that reduces the dimensionality ofdata to a number of summary variables, principle com-ponents (PC). The PC are designed so that they encap-sulate most of the variation present within the collecteddata. Data plotted using PC reveals inter-sample rela-tionships via their spatial proximity. Trajectories can beidentified in PC values between sample groups whichreflect the perturbation of multiple metabolic pathways.
PCA can generate two main outputs, a scores plotand a loadings plot. A PCA scores plot displays anynatural clustering or separation within a data set. Thevariability within each PC factor is attributed to theoriginal measured individual and combined variableswithin the data set. This plot allows physiological orpathological similarities or differences to be explored. APCA loadings plot identifies the relative contribution ofindividual ions to each PC and thus the most influentialcontributors to the natural sample class clustering.
Table 2
Traditional laboratory analyses in all cases
Parameter Clinical group p Value
1. Congenital PVA 2. Acquired hepatic 3. Controls
Haematology
Haemoglobin 12–18 g/dL 15.2 (12.6–16.6) 12.0 (6.3–16.0)a 15.7 (12.9–19.3)b 0.026
PCV 35–55% 43 (35–47) 34 (16–47) 43 (35–53) 0.066
RBC 5.40–8.00· 1012/L 7.00 (6.31–8.10)a 5.56 (2.65–6.69)b 6.63 (4.77–7.85) 0.012
MCV 65–75 fL 61.2 (56–66.6) 62.4 (62–70) 64.0 (61.7–73.1) 0.074
MCHC 34–37 g/dL 34.7 (31.0–36.1)a 36.0 (34.0–38.2) 36.3 (35.0–38.6)b 0.021
WBC 6.0–18.0· 109/L 14.0 (7.8–21.8) 16.6 (4.6–35.2) 15.3 (9.2–40.9 0.715
Platelets 200–500· 109/L 216 (26–443) 176 (60–335) 280 (198–371) 0.217
Serum biochemistry
Total protein 57.0–78.0 g/L 53 (38–61)a 55 (51–76) 65 (63–76)b 0.022
Albumin 23.0–31.0g/L 27 (18–31)a 27 (25–30) 29 (28–36)b 0.045
Globulins 27.0–40.0.0 g/L 28 (17–33)a 28 (26–46) 35 (27–43)b 0.047
Urea 3.5–6.0mmol/L 2.3 (1.1–3.9)a 2.7 (2.0–18.3) 5.9 (4.3–11.9)b 0.001
Creatinine 60–100 lmol/L 48 (36–92) 50 (32–163) 83 (49–118) 0.103
Sodium 140–153 mmol/L 148 (144–151) 152 (144–153) 149 (146–152) 0.651
Potassium 3.80–5.30 mmol/L 4.60 (3.74–6.16) 4.34 (3.99–5.10) 4.52 (4.20–5.14) 0.679
Calcium 2.20–2.70 mmol/L 2.39 (1.66–2.72)a 2.13 (1.73–2.81)a 2.74 (2.46–3.04)b 0.008
Phosphate 0.80–2.00 mmol/L 1.48 (0.94–2.30) 1.46 (0.83–1.63) 1.67 (1.32–2.89) 0.353
Cholesterol 3.2–6.5 mmol/L 3.8 (3.2–5.7) 4.6 (3.6–6.7) 6.1 (3.7–7.5) 0.113
ALT 7–50 IU/L 272 (13–833) 249 (111–1400) 60 (27–280) 0.063
ALP 0–100 IU/L 366 (118–2650) 454 (53–943) 198 (98–1160) 0.324
Bile acids
Fasting 0–15 lmol/L 97 (16–321)a 12 (1–203)b 2 (1–4)b <0.0001
Post-prandial 0–25 lmol/L 199 (66–462)a 75 (36–268)a 4 (1–9)b <0.0001
Results reported as median (range) for all parameters. PCV=packed cell volume; RBC=red blood cells; MCV=mean corpuscular volume;
MCHC=mean corpuscular haemoglobin concentration; WMC=white blood cells; ALT=alanine aminotransferase; ALP=alkaline phospha-
tase; groups with different superscripts are significantly different from each other at the level shown in the final column (p-value).
P.D. Whitfield et al./Metabolomics in hepatic disease 219
Following PCA the data sets were processed usingmore powerful supervised statistical method, PLS-DA.PLS-DA like PCA is a projection method and is aclassification method based on the regression extensionof PCA. The regression against a dummy variabledefining class identity yields latent variables explainingmaximum separation between known classes of samples.The interpretation of the scores gives information aboutclass separation while interpretation of loadings givesinformation about variables responsible for separatingthe predefined classes.
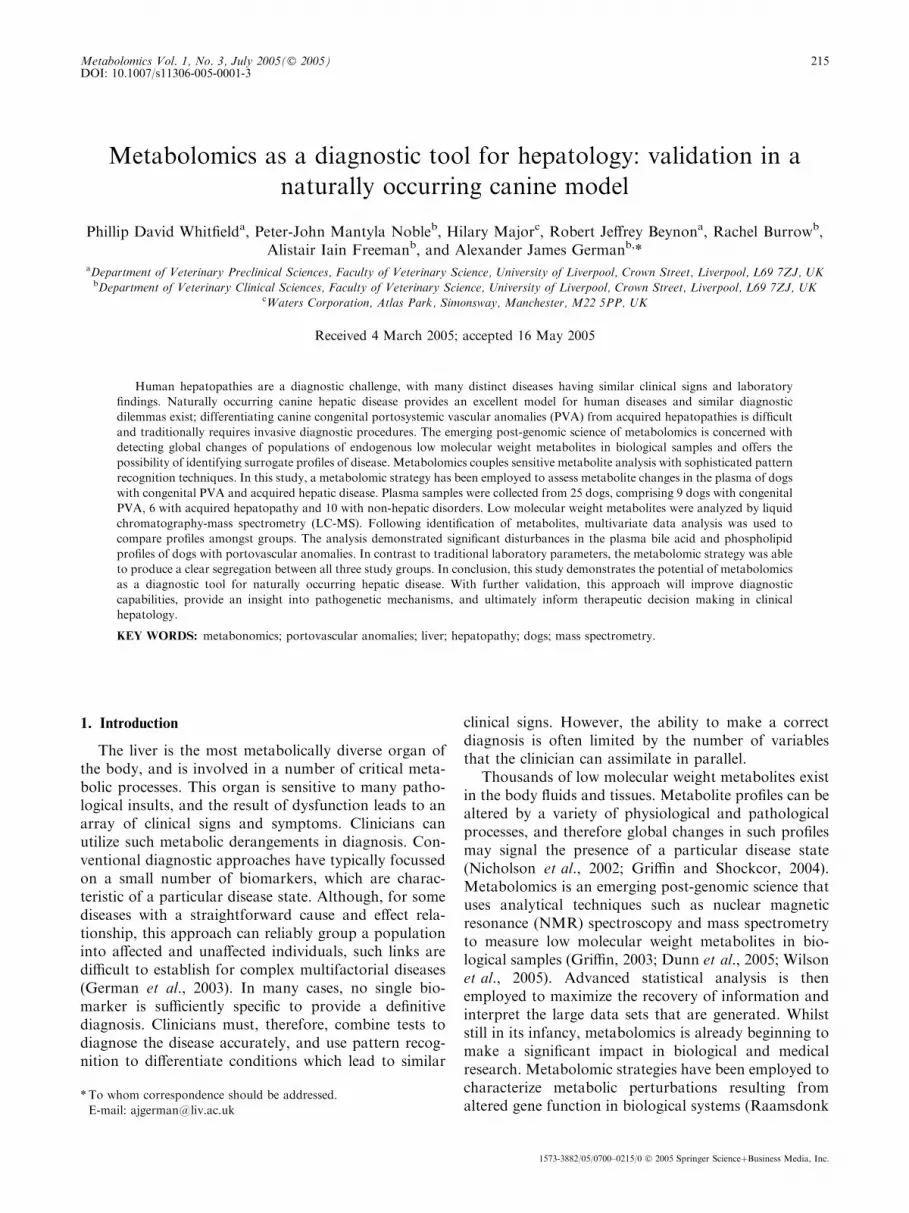
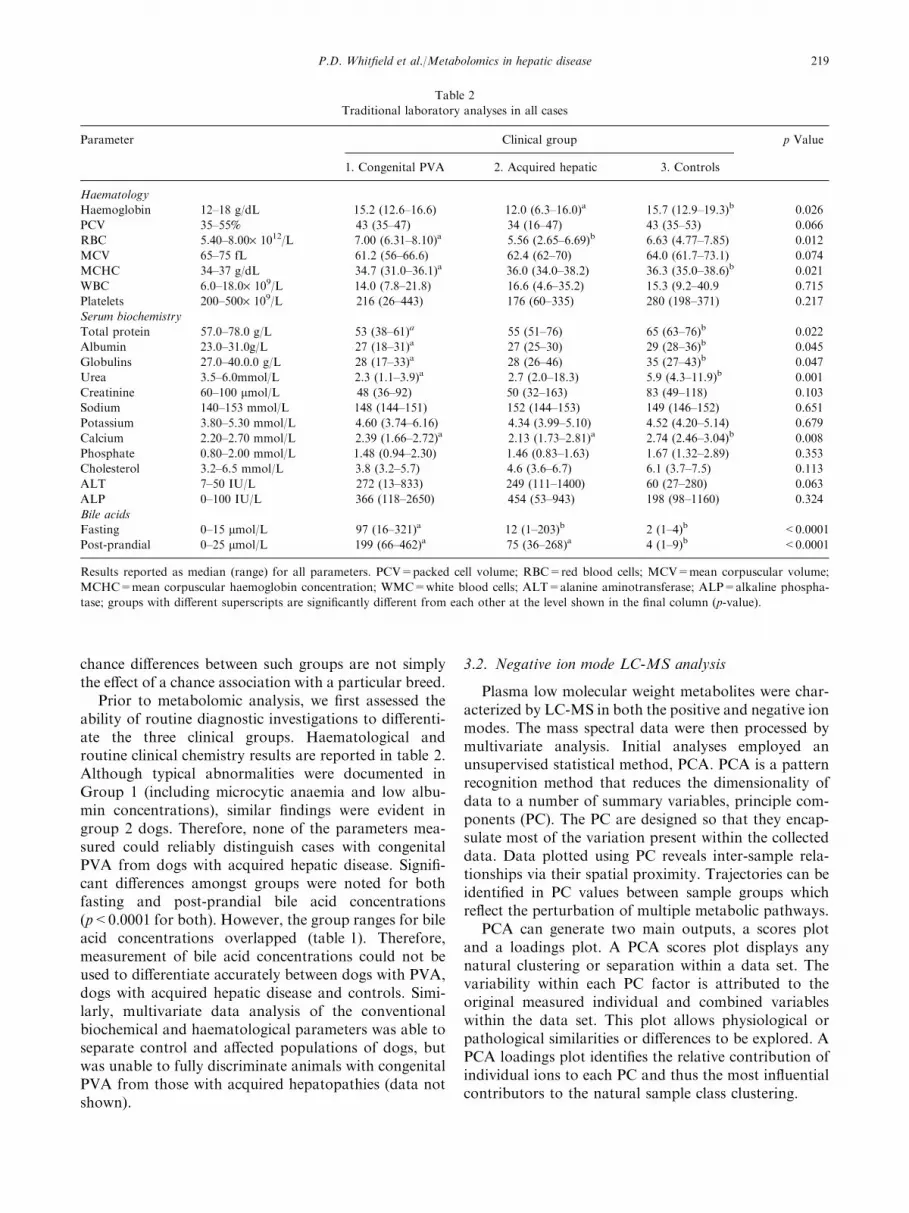
The principle components analysis (PCA) scores plot(PC1 versus PC2) of the negative ion data is shown infigure 1. Each point represents a single dog plasmasample. Control samples cluster in one area of the plotwhile samples exhibiting biochemical differences causedby disease states appear in regions away from the con-trols. The PCA was unable to discriminate fully betweenthe different cohorts of plasma samples; there was con-siderable overlap of plasma samples from Group 2 (dogswith acquired hepatopathies) and Group 3 ("controls"),whilst the Group 1 dogs (congenital PVA) tended tocluster away from the other groups of dogs (figure 1).The results indicated that the major separation wasachieved with PC1 and PC 2. No real improvementcould be obtained in the separation by looking at PC3.
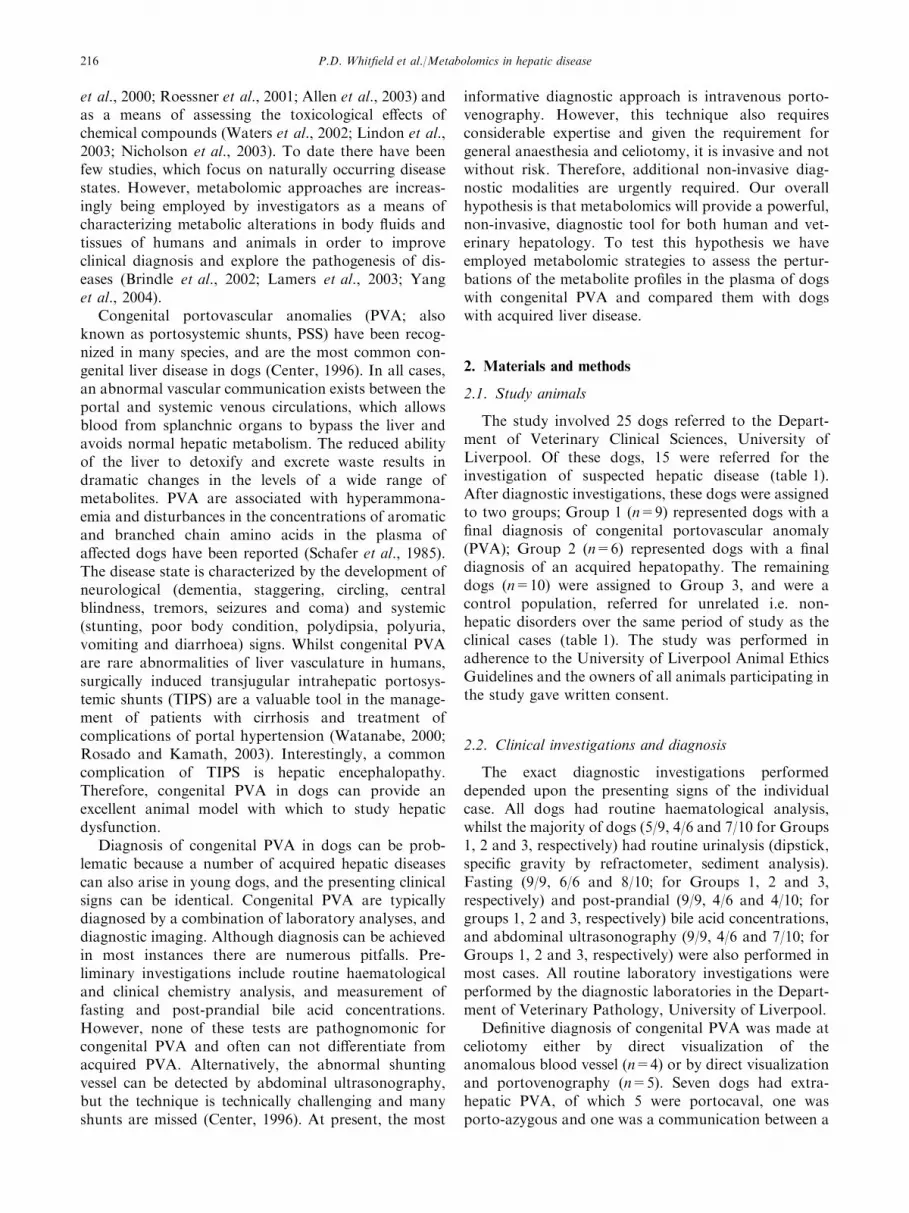
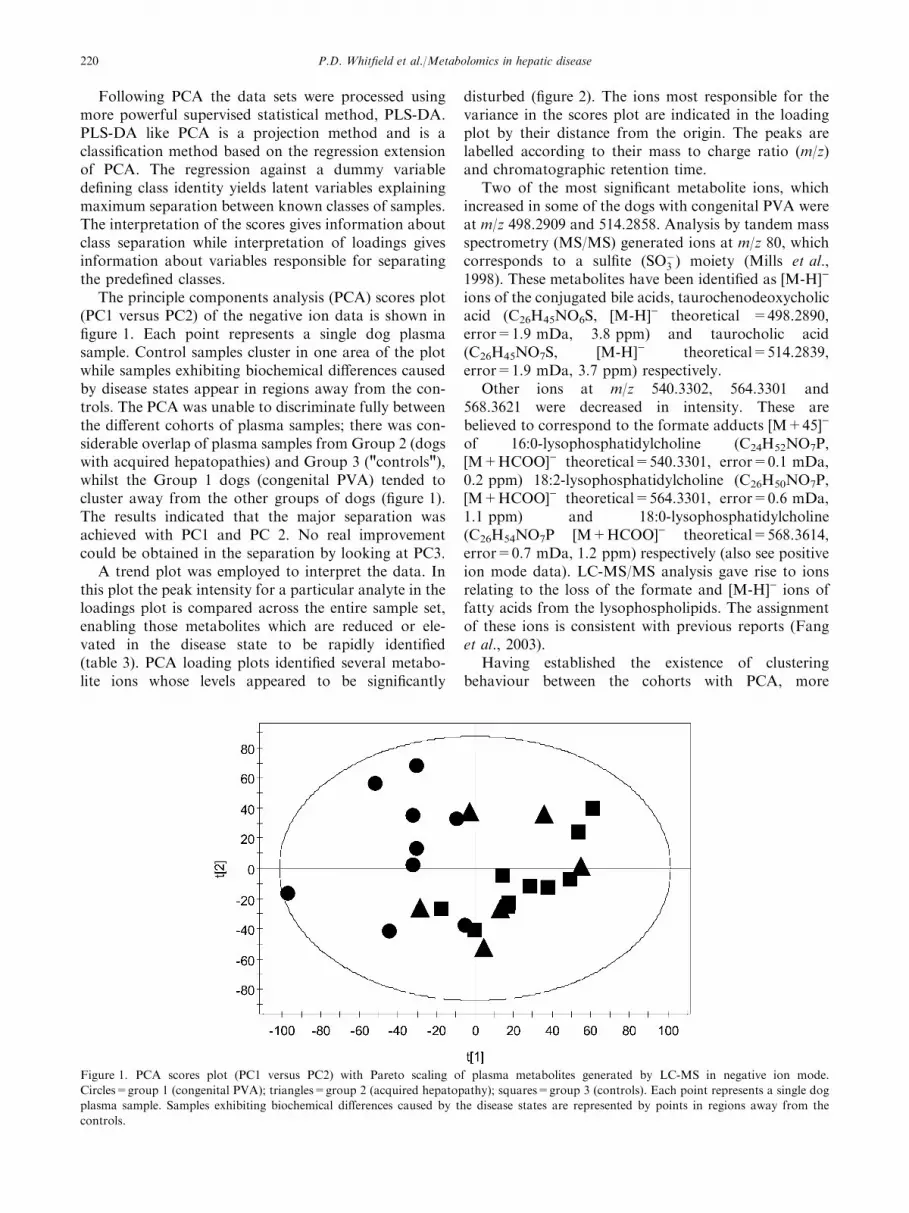
A trend plot was employed to interpret the data. Inthis plot the peak intensity for a particular analyte in theloadings plot is compared across the entire sample set,enabling those metabolites which are reduced or ele-vated in the disease state to be rapidly identified(table 3). PCA loading plots identified several metabo-lite ions whose levels appeared to be significantly
disturbed (figure 2). The ions most responsible for thevariance in the scores plot are indicated in the loadingplot by their distance from the origin. The peaks arelabelled according to their mass to charge ratio (m/z)and chromatographic retention time.
Two of the most significant metabolite ions, whichincreased in some of the dogs with congenital PVA wereat m/z 498.2909 and 514.2858. Analysis by tandem massspectrometry (MS/MS) generated ions at m/z 80, whichcorresponds to a sulfite (SO�3 ) moiety (Mills et al.,1998). These metabolites have been identified as [M-H])
ions of the conjugated bile acids, taurochenodeoxycholicacid (C26H45NO6S, [M-H]) theoretical =498.2890,error=1.9 mDa, 3.8 ppm) and taurocholic acid(C26H45NO7S, [M-H]) theoretical=514.2839,error=1.9 mDa, 3.7 ppm) respectively.
Other ions at m/z 540.3302, 564.3301 and568.3621 were decreased in intensity. These arebelieved to correspond to the formate adducts [M+45])
of 16:0-lysophosphatidylcholine (C24H52NO7P,[M+HCOO]) theoretical=540.3301, error=0.1 mDa,0.2 ppm) 18:2-lysophosphatidylcholine (C26H50NO7P,[M+HCOO]) theoretical=564.3301, error=0.6 mDa,1.1 ppm) and 18:0-lysophosphatidylcholine(C26H54NO7P [M+HCOO]) theoretical=568.3614,error=0.7 mDa, 1.2 ppm) respectively (also see positiveion mode data). LC-MS/MS analysis gave rise to ionsrelating to the loss of the formate and [M-H]) ions offatty acids from the lysophospholipids. The assignmentof these ions is consistent with previous reports (Fanget al., 2003).
Having established the existence of clusteringbehaviour between the cohorts with PCA, more
Figure 1. PCA scores plot (PC1 versus PC2) with Pareto scaling of plasma metabolites generated by LC-MS in negative ion mode.
Circles=group 1 (congenital PVA); triangles=group 2 (acquired hepatopathy); squares=group 3 (controls). Each point represents a single dog
plasma sample. Samples exhibiting biochemical differences caused by the disease states are represented by points in regions away from the
controls.
P.D. Whitfield et al./Metabolomics in hepatic disease220
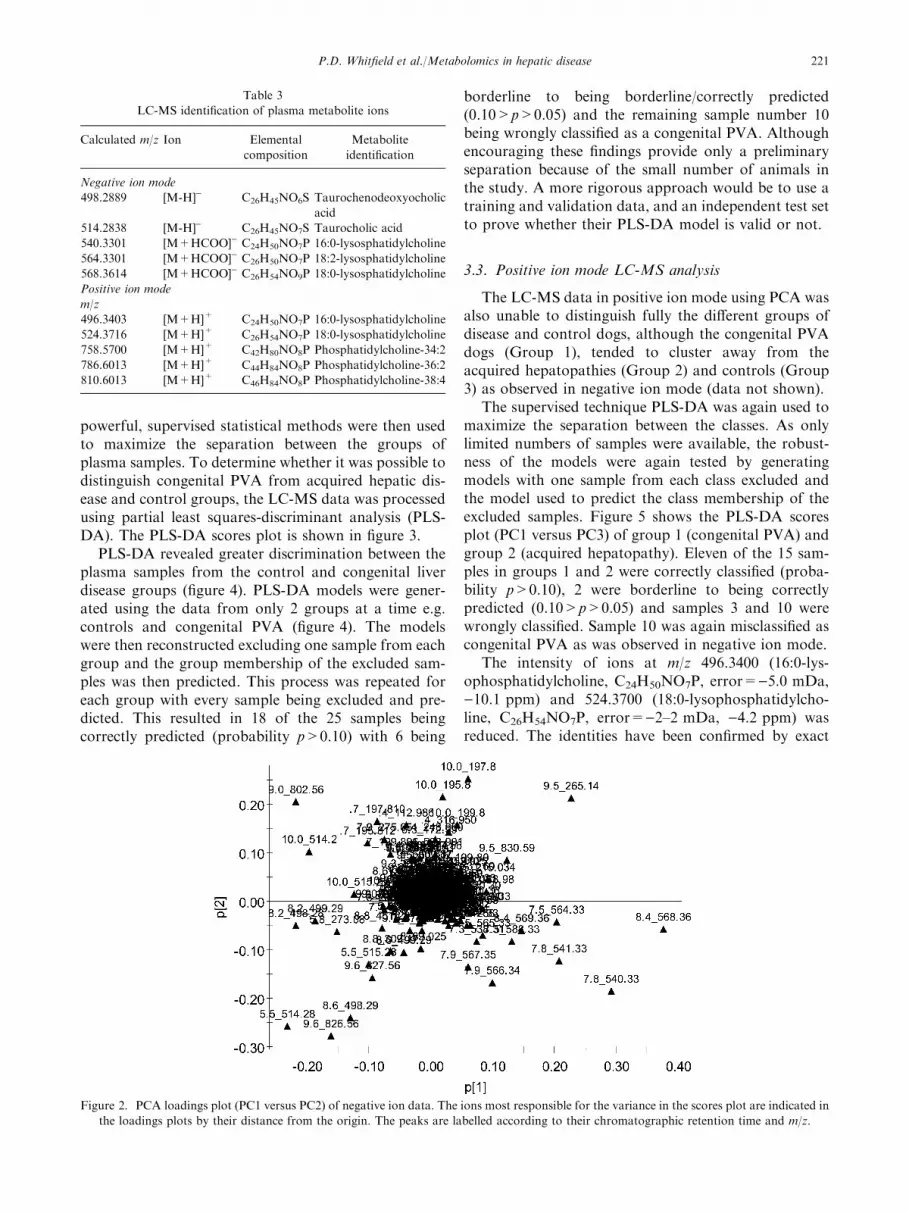
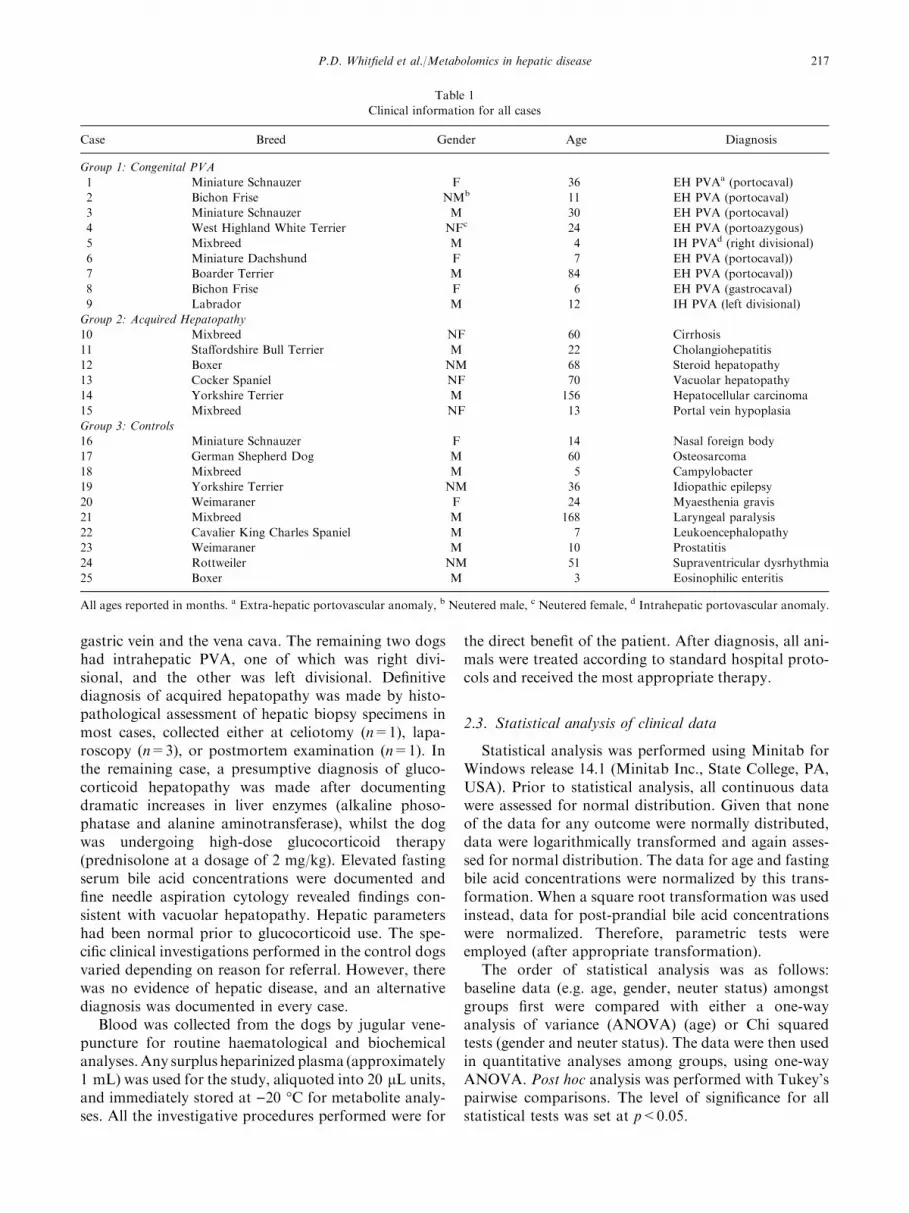
powerful, supervised statistical methods were then usedto maximize the separation between the groups ofplasma samples. To determine whether it was possible todistinguish congenital PVA from acquired hepatic dis-ease and control groups, the LC-MS data was processedusing partial least squares-discriminant analysis (PLS-DA). The PLS-DA scores plot is shown in figure 3.
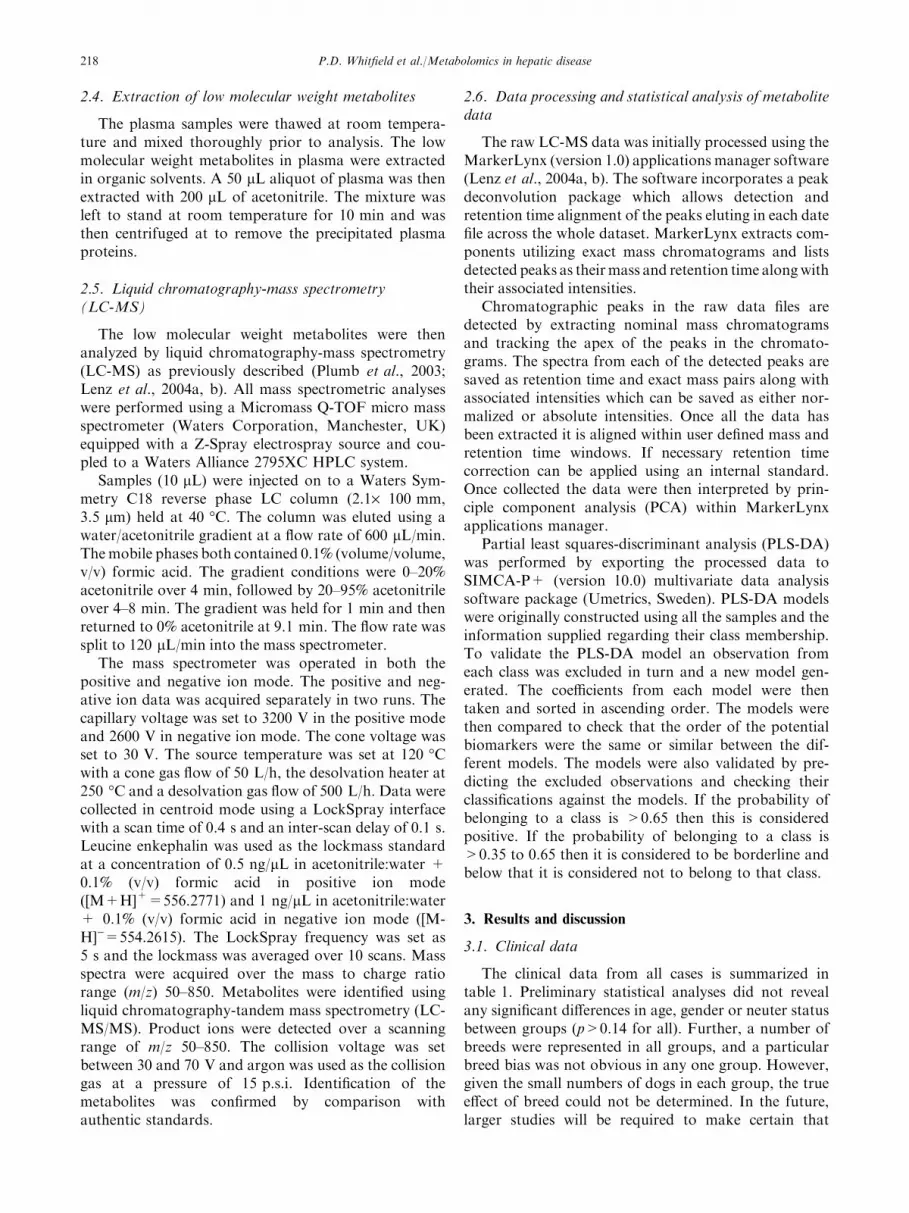
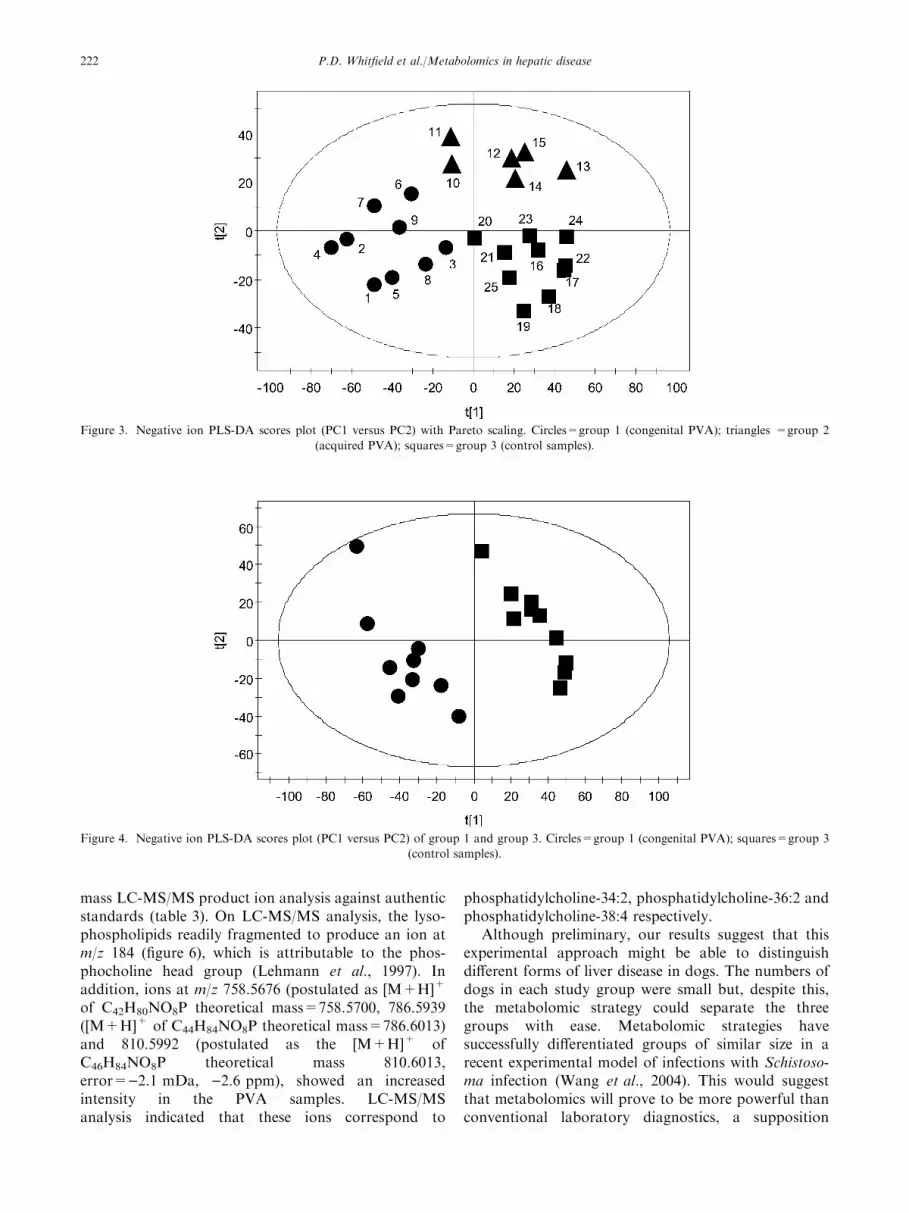
PLS-DA revealed greater discrimination between theplasma samples from the control and congenital liverdisease groups (figure 4). PLS-DA models were gener-ated using the data from only 2 groups at a time e.g.controls and congenital PVA (figure 4). The modelswere then reconstructed excluding one sample from eachgroup and the group membership of the excluded sam-ples was then predicted. This process was repeated foreach group with every sample being excluded and pre-dicted. This resulted in 18 of the 25 samples beingcorrectly predicted (probability p>0.10) with 6 being
borderline to being borderline/correctly predicted(0.10>p>0.05) and the remaining sample number 10being wrongly classified as a congenital PVA. Althoughencouraging these findings provide only a preliminaryseparation because of the small number of animals inthe study. A more rigorous approach would be to use atraining and validation data, and an independent test setto prove whether their PLS-DA model is valid or not.
3.3. Positive ion mode LC-MS analysis
The LC-MS data in positive ion mode using PCA wasalso unable to distinguish fully the different groups ofdisease and control dogs, although the congenital PVAdogs (Group 1), tended to cluster away from theacquired hepatopathies (Group 2) and controls (Group3) as observed in negative ion mode (data not shown).
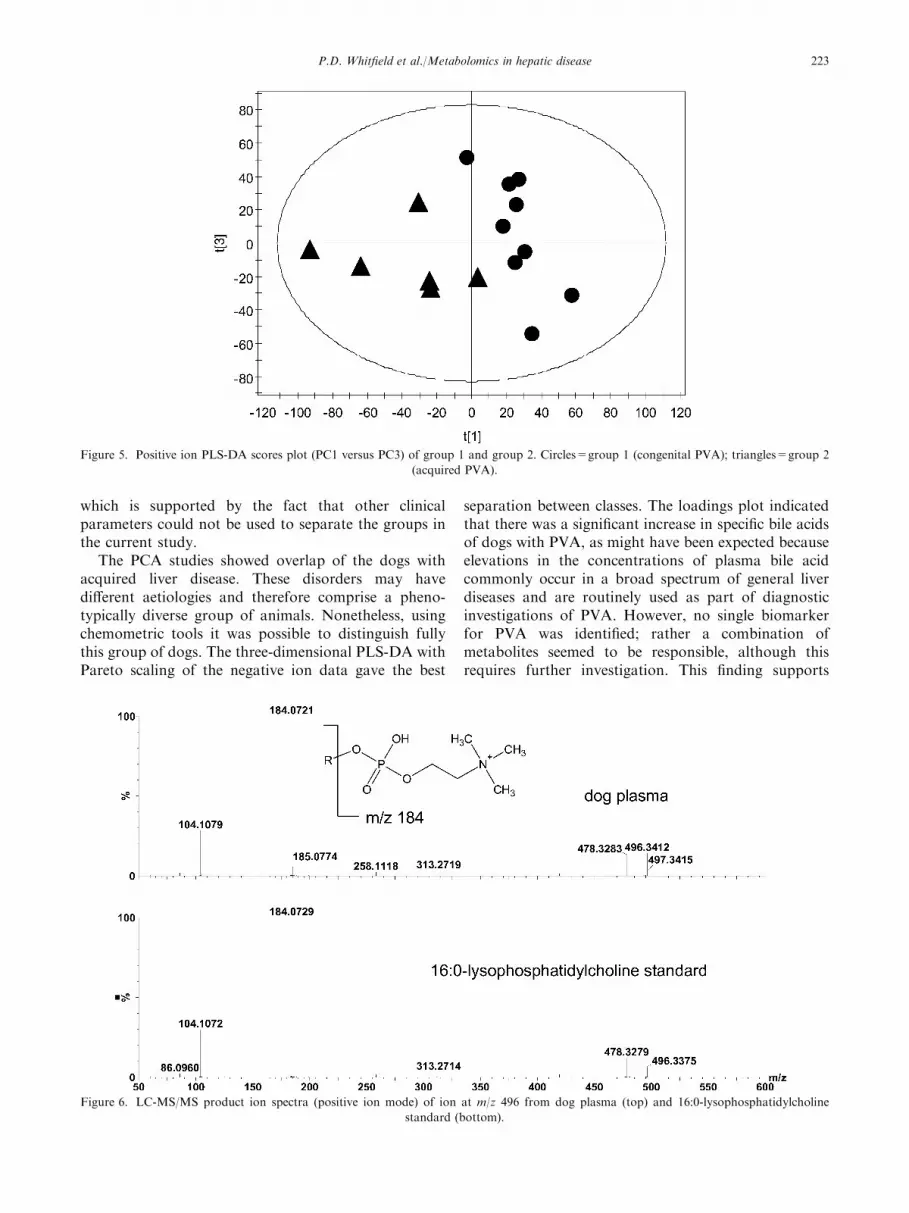
The supervised technique PLS-DA was again used tomaximize the separation between the classes. As onlylimited numbers of samples were available, the robust-ness of the models were again tested by generatingmodels with one sample from each class excluded andthe model used to predict the class membership of theexcluded samples. Figure 5 shows the PLS-DA scoresplot (PC1 versus PC3) of group 1 (congenital PVA) andgroup 2 (acquired hepatopathy). Eleven of the 15 sam-ples in groups 1 and 2 were correctly classified (proba-bility p>0.10), 2 were borderline to being correctlypredicted (0.10>p>0.05) and samples 3 and 10 werewrongly classified. Sample 10 was again misclassified ascongenital PVA as was observed in negative ion mode.
The intensity of ions at m/z 496.3400 (16:0-lys-ophosphatidylcholine, C24H50NO7P, error=)5.0 mDa,)10.1 ppm) and 524.3700 (18:0-lysophosphatidylcho-line, C26H54NO7P, error=)2–2 mDa, )4.2 ppm) wasreduced. The identities have been confirmed by exact
Table 3
LC-MS identification of plasma metabolite ions
Calculated m/z Ion Elemental
composition
Metabolite
identification
Negative ion mode
498.2889 [M-H]) C26H45NO6S Taurochenodeoxyocholic
acid
514.2838 [M-H]) C26H45NO7S Taurocholic acid
540.3301 [M+HCOO]) C24H50NO7P 16:0-lysosphatidylcholine
564.3301 [M+HCOO]) C26H50NO7P 18:2-lysosphatidylcholine
568.3614 [M+HCOO]) C26H54NO9P 18:0-lysosphatidylcholine
Positive ion mode
m/z
496.3403 [M+H]+ C24H50NO7P 16:0-lysosphatidylcholine
524.3716 [M+H]+ C26H54NO7P 18:0-lysosphatidylcholine
758.5700 [M+H]+ C42H80NO8P Phosphatidylcholine-34:2
786.6013 [M+H]+ C44H84NO8P Phosphatidylcholine-36:2
810.6013 [M+H]+ C46H84NO8P Phosphatidylcholine-38:4
Figure 2. PCA loadings plot (PC1 versus PC2) of negative ion data. The ions most responsible for the variance in the scores plot are indicated in
the loadings plots by their distance from the origin. The peaks are labelled according to their chromatographic retention time and m/z.
P.D. Whitfield et al./Metabolomics in hepatic disease 221
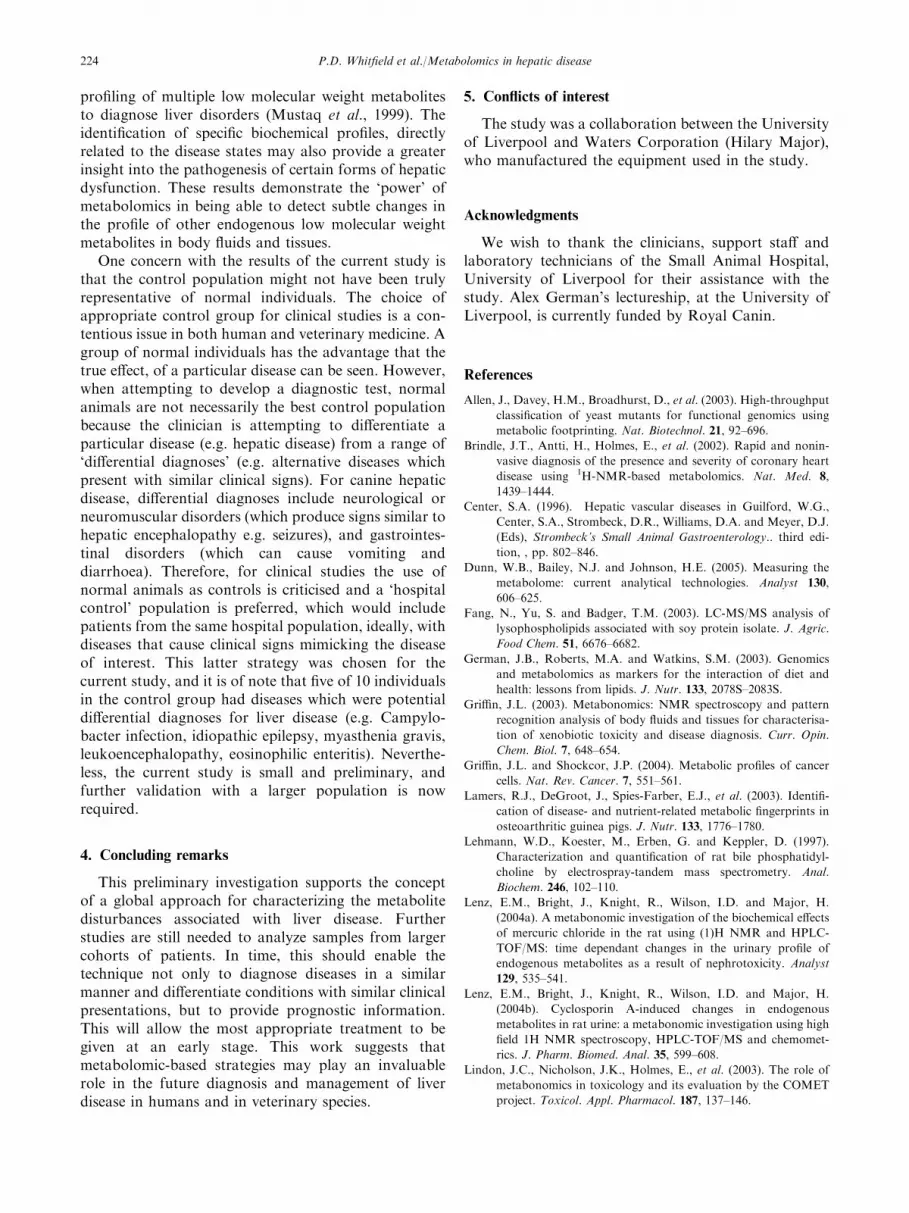
mass LC-MS/MS product ion analysis against authenticstandards (table 3). On LC-MS/MS analysis, the lyso-phospholipids readily fragmented to produce an ion atm/z 184 (figure 6), which is attributable to the phos-phocholine head group (Lehmann et al., 1997). Inaddition, ions at m/z 758.5676 (postulated as [M+H]+
of C42H80NO8P theoretical mass=758.5700, 786.5939([M+H]+ of C44H84NO8P theoretical mass=786.6013)and 810.5992 (postulated as the [M+H]+ ofC46H84NO8P theoretical mass 810.6013,error=)2.1 mDa, )2.6 ppm), showed an increasedintensity in the PVA samples. LC-MS/MSanalysis indicated that these ions correspond to
phosphatidylcholine-34:2, phosphatidylcholine-36:2 andphosphatidylcholine-38:4 respectively.
Although preliminary, our results suggest that thisexperimental approach might be able to distinguishdifferent forms of liver disease in dogs. The numbers ofdogs in each study group were small but, despite this,the metabolomic strategy could separate the threegroups with ease. Metabolomic strategies havesuccessfully differentiated groups of similar size in arecent experimental model of infections with Schistoso-ma infection (Wang et al., 2004). This would suggestthat metabolomics will prove to be more powerful thanconventional laboratory diagnostics, a supposition
Figure 3. Negative ion PLS-DA scores plot (PC1 versus PC2) with Pareto scaling. Circles=group 1 (congenital PVA); triangles =group 2
(acquired PVA); squares=group 3 (control samples).
Figure 4. Negative ion PLS-DA scores plot (PC1 versus PC2) of group 1 and group 3. Circles=group 1 (congenital PVA); squares=group 3
(control samples).
P.D. Whitfield et al./Metabolomics in hepatic disease222
which is supported by the fact that other clinicalparameters could not be used to separate the groups inthe current study.
The PCA studies showed overlap of the dogs withacquired liver disease. These disorders may havedifferent aetiologies and therefore comprise a pheno-typically diverse group of animals. Nonetheless, usingchemometric tools it was possible to distinguish fullythis group of dogs. The three-dimensional PLS-DA withPareto scaling of the negative ion data gave the best
separation between classes. The loadings plot indicatedthat there was a significant increase in specific bile acidsof dogs with PVA, as might have been expected becauseelevations in the concentrations of plasma bile acidcommonly occur in a broad spectrum of general liverdiseases and are routinely used as part of diagnosticinvestigations of PVA. However, no single biomarkerfor PVA was identified; rather a combination ofmetabolites seemed to be responsible, although thisrequires further investigation. This finding supports
Figure 5. Positive ion PLS-DA scores plot (PC1 versus PC3) of group 1 and group 2. Circles=group 1 (congenital PVA); triangles=group 2
(acquired PVA).
Figure 6. LC-MS/MS product ion spectra (positive ion mode) of ion at m/z 496 from dog plasma (top) and 16:0-lysophosphatidylcholine
standard (bottom).
P.D. Whitfield et al./Metabolomics in hepatic disease 223
profiling of multiple low molecular weight metabolitesto diagnose liver disorders (Mustaq et al., 1999). Theidentification of specific biochemical profiles, directlyrelated to the disease states may also provide a greaterinsight into the pathogenesis of certain forms of hepaticdysfunction. These results demonstrate the ‘power’ ofmetabolomics in being able to detect subtle changes inthe profile of other endogenous low molecular weightmetabolites in body fluids and tissues.
One concern with the results of the current study isthat the control population might not have been trulyrepresentative of normal individuals. The choice ofappropriate control group for clinical studies is a con-tentious issue in both human and veterinary medicine. Agroup of normal individuals has the advantage that thetrue effect, of a particular disease can be seen. However,when attempting to develop a diagnostic test, normalanimals are not necessarily the best control populationbecause the clinician is attempting to differentiate aparticular disease (e.g. hepatic disease) from a range of‘differential diagnoses’ (e.g. alternative diseases whichpresent with similar clinical signs). For canine hepaticdisease, differential diagnoses include neurological orneuromuscular disorders (which produce signs similar tohepatic encephalopathy e.g. seizures), and gastrointes-tinal disorders (which can cause vomiting anddiarrhoea). Therefore, for clinical studies the use ofnormal animals as controls is criticised and a ‘hospitalcontrol’ population is preferred, which would includepatients from the same hospital population, ideally, withdiseases that cause clinical signs mimicking the diseaseof interest. This latter strategy was chosen for thecurrent study, and it is of note that five of 10 individualsin the control group had diseases which were potentialdifferential diagnoses for liver disease (e.g. Campylo-bacter infection, idiopathic epilepsy, myasthenia gravis,leukoencephalopathy, eosinophilic enteritis). Neverthe-less, the current study is small and preliminary, andfurther validation with a larger population is nowrequired.
4. Concluding remarks
This preliminary investigation supports the conceptof a global approach for characterizing the metabolitedisturbances associated with liver disease. Furtherstudies are still needed to analyze samples from largercohorts of patients. In time, this should enable thetechnique not only to diagnose diseases in a similarmanner and differentiate conditions with similar clinicalpresentations, but to provide prognostic information.This will allow the most appropriate treatment to begiven at an early stage. This work suggests thatmetabolomic-based strategies may play an invaluablerole in the future diagnosis and management of liverdisease in humans and in veterinary species.
5. Conflicts of interest
The study was a collaboration between the Universityof Liverpool and Waters Corporation (Hilary Major),who manufactured the equipment used in the study.
Acknowledgments
We wish to thank the clinicians, support staff andlaboratory technicians of the Small Animal Hospital,University of Liverpool for their assistance with thestudy. Alex German’s lectureship, at the University ofLiverpool, is currently funded by Royal Canin.
References
Allen, J., Davey, H.M., Broadhurst, D., et al. (2003). High-throughput
classification of yeast mutants for functional genomics using
metabolic footprinting. Nat. Biotechnol. 21, 92–696.
Brindle, J.T., Antti, H., Holmes, E., et al. (2002). Rapid and nonin-
vasive diagnosis of the presence and severity of coronary heart
disease using 1H-NMR-based metabolomics. Nat. Med. 8,
1439–1444.
Center, S.A. (1996). Hepatic vascular diseases in Guilford, W.G.,
Center, S.A., Strombeck, D.R., Williams, D.A. and Meyer, D.J.
(Eds), Strombeck’s Small Animal Gastroenterology.. third edi-
tion, , pp. 802–846.
Dunn, W.B., Bailey, N.J. and Johnson, H.E. (2005). Measuring the
metabolome: current analytical technologies. Analyst 130,
606–625.
Fang, N., Yu, S. and Badger, T.M. (2003). LC-MS/MS analysis of
lysophospholipids associated with soy protein isolate. J. Agric.
Food Chem. 51, 6676–6682.
German, J.B., Roberts, M.A. and Watkins, S.M. (2003). Genomics
and metabolomics as markers for the interaction of diet and
health: lessons from lipids. J. Nutr. 133, 2078S–2083S.
Griffin, J.L. (2003). Metabonomics: NMR spectroscopy and pattern
recognition analysis of body fluids and tissues for characterisa-
tion of xenobiotic toxicity and disease diagnosis. Curr. Opin.
Chem. Biol. 7, 648–654.
Griffin, J.L. and Shockcor, J.P. (2004). Metabolic profiles of cancer
cells. Nat. Rev. Cancer. 7, 551–561.
Lamers, R.J., DeGroot, J., Spies-Farber, E.J., et al. (2003). Identifi-
cation of disease- and nutrient-related metabolic fingerprints in
osteoarthritic guinea pigs. J. Nutr. 133, 1776–1780.
Lehmann, W.D., Koester, M., Erben, G. and Keppler, D. (1997).
Characterization and quantification of rat bile phosphatidyl-
choline by electrospray-tandem mass spectrometry. Anal.
Biochem. 246, 102–110.
Lenz, E.M., Bright, J., Knight, R., Wilson, I.D. and Major, H.
(2004a). A metabonomic investigation of the biochemical effects
of mercuric chloride in the rat using (1)H NMR and HPLC-
TOF/MS: time dependant changes in the urinary profile of
endogenous metabolites as a result of nephrotoxicity. Analyst
129, 535–541.
Lenz, E.M., Bright, J., Knight, R., Wilson, I.D. and Major, H.
(2004b). Cyclosporin A-induced changes in endogenous
metabolites in rat urine: a metabonomic investigation using high
field 1H NMR spectroscopy, HPLC-TOF/MS and chemomet-
rics. J. Pharm. Biomed. Anal. 35, 599–608.
Lindon, J.C., Nicholson, J.K., Holmes, E., et al. (2003). The role of
metabonomics in toxicology and its evaluation by the COMET
project. Toxicol. Appl. Pharmacol. 187, 137–146.
P.D. Whitfield et al./Metabolomics in hepatic disease224
Mills, K.A., Mustaq, I., Johnson, A.W., Whitfield, P.D. and Clayton,
P.T. (1998). A method for the quantitation of conjugated bile
acids in dried blood spots using electrospray ionization-tandem
mass spectrometry. Pediatr. Res. 43, 361–368.
Mustaq, I., Logan, S., Morris, M., et al. (1999). Screening of newborn
infants for cholestatic hepatobilary disease with tandem mass
spectrometry. Brit. Med. J. 319, 471–477.
Nicholson, J.K., Connelly, J., Lindon, J.C. and Holmes, E. (2002).
Metabonomics: a platform for studying drug toxicity and gene
function. Nat. Rev. Drug Discov. 1, 153–161.
Nicholson, J.K. and Wilson, I.D. (2003). Understanding ’global’ sys-
tems biology: metabonomics and the continuum of metabolism.
Nat. Rev. Drug Discov. 2, 668–676.
Plumb, R.S., Stumpf, C.L., Granger, J.H., Castro-Perez, J., Haselden,
J.N. and Dear, G.J. (2003). Use of liquid chromatography/time-
of-flight mass spectrometry and multivariate statistical analysis
shows promise for the detection of drug metabolites in biological
fluids. Rapid Commun. Mass Spectrom. 17, 2632–2638.
Raamsdonk, L.M., Teusink, B., Broadhurst, D., et al. (2000). A func-
tional genomics strategy that uses metabolome data to reveal the
phenotype of silent mutations. Nat. Biotechnol. 19, 45–50.
Roessner, U., Luedemann, A., Brust, D., et al. (2001). Metabolite
profiling allows comprehensive phenotyping of genetically or
environmentally modified plant systems. Plant Cell. 13, 11–29.
Rosado, B. and Kamath, P.S. (2003). Transjugular intrahepatic por-
tosystemic shunts: an update. Liver Transpl. 9, 207–217.
Schafer, K., Ukida, M., Steffen, C., Bode, C., Zelder, O. and Bode,
J.C. (1985). Effect of ammonia on plasma and cerebrospinal
amino acids in dogs with and without portacaval anastomoses.
Res. Exp. Med. 185, 35–44.
Wang, Y., Holmes, E., Nicholson, J.K., et al. (2004). Metabonomic
investigations in mice infected with Schistosoma mansoni: an
approach for biomarker identification. Proc. Natl. Acad. Sci.
USA 101, 12676–12681.
Watanabe, A. (2000). Portal-systemic encephalopathy in non-cirrhotic
patients: classification of clinical types, diagnosis and treatment.
J. Gastroenterol. Hepatol. 15, 969–979.
Waters, N.J., Holmes, E., Waterfield, C.J., Farrant, R.D. and Nich-
olson, J.K. (2002). NMR and pattern recognition studies on
liver extracts and in livers from rats treated with alpha-naph-
thylisothiocyanate. Biochem. Pharmacol. 64, 67–77.
Wilson, I.D., Plumb, R., Granger, J., Major, H., Williams, R. and
Lenz, E.M. (2005). HPLC-MS-based methods for the study of
metabonomics. J. Chromatogr. B. 817, 67–76.
Yang, J., Xu, G., Zheng, , et al. (2004). Diagnosis of liver cancer using
HPLC-based metabonomics avoiding false-positive result from
hepatitisis and hepatocirrhosis diseases. J. Chromatogr. B 813,
59–65.
P.D. Whitfield et al./Metabolomics in hepatic disease 225