metabolomics applied to exhaled breath condensate in childhood asthma
TRANSCRIPT

METABOLOMICS APPLIED TO EXHALED BREATH CONDENSATE IN
CHILDHOOD ASTHMA.
Silvia Carraro1, 4, Serge Rezzi2,3, 4, Fabiano Reniero2, Károly Héberger2,
Giuseppe Giordano1, Stefania Zanconato1, Claude Guillou2, Eugenio Baraldi1
1 Department of Pediatrics, University of Padova, Via Giustiniani, 3, 35128 Padova,
Italy 2 European Commission, Joint Research Centre, Institute for Health and Consumer
Protection, Physical and Chemical Exposure Unit, BEVABS T.P. 740, 21020 Ispra
(VA), Italy 3 Actual address: BioAnalytical Science, Metabonomics & Biomarkers, Nestlé
Research Center PO Box 44, CH-1000 Lausanne 26 4 These authors contributed equally to the work
Corresponding author: Dr. Eugenio Baraldi Department of Pediatrics Allergy and Respiratory Medicine Unit Via Giustiniani 3 35128 Padova Italy Phone: 049 8213560 Fax: 049 8213502 E-mail: [email protected] Impact of this research on clinical medicine Here we apply, for the first time, metabolomics in the analysis of exhaled breath condensate in asthmatic children. Metabolomics allows both the detection of known metabolites and the prediction of unknown metabolites. Characterizing the sample overall biochemical profile, this technique may represent a significant advance in defining the biochemical phenotype in asthmatic patients. Running title: Metabolomics in childhood asthma
Subject category number: 66 Word count for the body manuscript: 2419
This article has an online data supplement, which is accessible from this issue’s table
of content online at www.atsjournal.org.
AJRCCM Articles in Press. Published on February 15, 2007 as doi:10.1164/rccm.200606-769OC
Copyright (C) 2007 by the American Thoracic Society.

1
ABSTRACT Rationale and Objectives: Metabolomic analysis provides biochemical profiles of
low molecular weight endogenous metabolites in biological fluids. The aim of this
study was to assess the feasibility of Nuclear Magnetic Resonance (NMR) based
metabolomic analysis applied to exhaled breath condensate. Information coming
from NMR spectra was analyzed with a view to establish the NMR variables that best
discriminate between asthmatic and healthy children.
Methods: 25 children with asthma (17 with persistent asthma treated with inhaled
corticosteroids, 8 with intermittent asthma inhaled corticosteroid naïve, age 7-15
years) and 11 healthy age-matched controls were enrolled. Every child performed
exhaled nitric oxide measurement, spirometry and condensate collection.
Condensate samples were analysed by means of NMR spectroscopy (Bruker,
BioSpin, 600 MHz 3 mm cryogenic probe at 300 k). Linear and partial least squares
discriminant analysis were applied to data obtained from the NMR spectra.
Results: The combination of exhaled nitric oxide and FEV1 discriminates asthmatic
and healthy children with a success rate of ~81%, while selected signals from NMR
spectra offer a slightly better discrimination (~86%). The selected NMR variables
derive from the region of 3.2 to 3.4 ppm, indicative of oxidized compounds and from
the region of 1.7 to 2.2 ppm, indicative of acetylated compounds.
Conclusion: Metabolomics can be applied to exhaled breath condensate leading to
the characterization of airway biochemical fingerprints. The presence of acetylated
compounds suggests new metabolic pathways that may have a role in asthma
pathophysiology.
Abstract Word count: 236
Key words: asthma, metabolomics, exhaled breath condensate, children, nuclear
magnetic resonance

2
INTRODUCTION
Asthma is a chronic inflammatory disease of the airways (1) that is nowadays
considered a major health problem since its prevalence has increased everywhere,
especially among children (2). The inflammatory state of asthmatic airways is weakly
correlated with clinical symptoms and lung function parameters, and even clinically
quiescent asthma can be associated with airway inflammation (3). Moreover, several
inflammatory patterns are involved in asthma and contribute to characterize different
clinical phenotypes (4). The knowledge of airway inflammatory state has therefore a
central role in asthma management. In the last years, the availability of non-invasive
techniques, as exhaled NO (FENO) measurement and exhaled breath condensate
(EBC) analysis, has opened new prospective for investigating and monitoring airway
inflammation. EBC is obtained by cooling exhaled air and it contains several
biocompounds that are believed to reflect airway lining fluid composition (5).
The analysis and interpretation of global metabolic data, expression of the
multiparametric metabolic response of living systems to pathophysiological stimuli, by
means of modern spectroscopic techniques and appropriate statistical approaches, is
defined as 'metabolic profiling’, 'metabonomics’ or 'metabolomics’. In the present
paper we use the term metabolomics (6-9). High resolution 1H nuclear magnetic
resonance (NMR) spectroscopy is one of the most powerful technique for metabolite
profile detection (10). This analytical technique enables the characterization of the
most represented proton-containing low-molecular mass compounds and their
representation in a spectrum, providing a metabolic fingerprint of the sample
analyzed. Multivariate statistical methods (usually termed as pattern recognition
methods) are then applied to extract information from these complex NMR spectra
(11).
3
So far, EBC has been studied to detect known target compounds (e.g.
leukotrienes, oxidative-stress markers, nitrogen oxide related products) in asthmatic
subjects (5). Metabolomics may offer a completely new approach to EBC analysis,
enabling not only the detection of known metabolites, but also the prediction of
unknown metabolites and novel biomarkers, which may provide insight into disease
mechanisms. NMR may provide objective reproducible patterns formed by the
chemical constituents of the EBC. These patterns, though not always indicative of a
specific identified chemical component, may nonetheless be useful in discriminating
between disease and health. Moreover, the chemical characteristics revealed in the
NMR profiles provide clues as to underlying metabolic derangements associated with
asthma, and such findings may help us to subphenotype the syndrome asthma into
its component disease processes.
Metabolomics is usually conducted on urine and blood but other biofluids and cell
cultures can be used.
The aim of our study was to assess the feasibility of applying NMR-based
metabolomic analysis to EBC. Information coming from NMR spectra was analyzed
with a view to establishing the NMR variables that best discriminate between
asthmatic and healthy children.
Some of the results of this study have been previously reported in the form of
an abstract (12).
METHODS
Study subjects
25 asthmatic allergic children with controlled disease and 11 age-matched healthy
controls were enrolled. Eight asthmatic children had intermittent asthma and had
received no inhaled corticosteroid (ICS) treatment for at least a month. Seventeen

4
children had persistent asthma and were treated with ICS on a regular base. The
diagnosis of asthma was made by a pediatric respiratory physician and was based
on clinical history (cough, shortness of breath, recurrent wheeze, chest tightness)
and increase in FEV1 after bronchodilator > 12%, according to international
guidelines (2). See the online supplement for additional information.
At recruitment children underwent physical examination and performed FENO
measurement and spirometry. EBC was collected, stored at –80° C and
subsequently analyzed by proton NMR.
The Ethics Committee of our hospital reviewed and approved the protocol and all
parents gave their informed consent.
Fractional exhaled nitric oxide (FENO) and pulmonary function measurement
FENO was measured with the NIOX system (Aerocrine, Stockholm, Sweden),
following the ERS/ATS guidelines for measuring FENO in children (13). Lung function
was measured by means of a 10-liter bell spirometer (Biomedin, Padova, Italy). See
the online supplement for additional information.
EBC collection
EBC was collected by means of a condenser consisting of five components:
a mouthpiece set up to work as a saliva trap too, a non-rebreathing polypropylene
valve, a 10 cm Tygon® tube, a 50 ml polypropylene vial and a Dewar flask
refrigerated with ice. Children breathed tidally through the mouth for 15 minutes,
while sitting comfortably and wearing a nose clip. They maintained a dry mouth
during collection by periodically swallowing excess saliva. EBC samples were
stored at –80°C in polypropylene tubes until assay.
To assess within-day repeatability, 6 asthmatic children were asked to
collect EBC twice within the same day.

5
NMR measurements
The EBC samples were dried with a speed vacuum system (UNIVAPO 150
ECH, UNIEQUIP, Munich, Germany) to small volume (10µl) and added to D2O for
NMR analysis (80 µl final volume). NMR measurements were taken on a 600MHz
Bruker BioSpin spectrometer, using a 3mm cryogenic probe, setting the temperature
at 300K. 1D-spectra were acquired with water suppression, using a modified 1-
dimensional Noesy sequence with 2 RF-Gradients (gradient ratio 50:10) in non-
spinning mode, acquiring 512 scans with a 32K time domain data size, a recycle time
of ~ 3.9 sec, and a mixing time of 100 msec. Samples were measured in 2.5 mm
NMR tubes using 80 microliters of sample, processed using an exponential
multiplication and a line-broadening factor of 1. Spectra were calibrated to TSP at 0
ppm (parts per million) (14). The resulting spectra were corrected for phase and
baseline using the TOPSPIN software package (Bruker), rel. 1.2.b.
Spectra were segmented into 101 chemical shift regions (“bucketing”
procedure) 0.04 ppm wide using the AMIX (Bruker) software package, rel. 3.5.6 and
considering the region 0.5 – 4.5 ppm, excluding lactate signals (quartet at 4.12 ppm
and doublet at 1.33 ppm).
The resulting integrated regions (“buckets”) were used for statistical analysis.
Each bucket was integrated and normalized using the total intensity of the spectrum.
NMR analysis was performed without knowing which group (healthy or
asthmatic) each child belonged to.
Statistical analysis
Data from the NMR spectra were processed using the AMIX Principal
Component Analysis (PCA) routine and then, after exportation, using the Statistica
6.0 software package for Discriminant Analysis (DA) and Partial least squares (PLS)
(15-17).

6
Within-day repeatability and technical repeatability of the measurements were
evaluated using the method of Bland and Altman (18) and the coefficient of variation,
respectively.
See the online supplement for additional information.
RESULTS
Mean FEV1 was significantly lower in asthmatic (median 87% pred.,
interquartile range (IQR) 78%-97%) than in healthy children (median 103% pred, IQR
95%-106%, p<0.01). FENO was significantly higher in asthmatic (median 30.5 ppb,
IQR 16.4-60.6 ppb) than in healthy children (median 9.6 ppb, IQR 6.8-12.9 ppb,
p<0.001).
LDA (linear discriminant analysis) demonstrated that, in combination, FENO
and FEV1 have a success rate of ~81% in discriminating between asthmatic and
healthy children, while selected NMR signals discriminate the two groups with a
success rate of ~86%.
Moreover, LDA using best subset selection discriminated asthmatic and
healthy children with a success rate in excess of 95%. An even better classification
can be achieved at the risk of overfit (by modeling the noise as well).
The results were verified against another (independent) statistical technique,
i.e. PLS, which is not sensitive to overfit, and clinical data were used as well as all
NMR variables. Considering three PLS components, we obtained a classification that
was around 95% successful, with only one clearly misclassified sample: an asthmatic
sample was classified as healthy (figure 1).
We also considered performing a subgroup analysis to compare steroid
treated and untreated children, but we were unable to do so because the number of
samples in each group was too small for reliable statistical analysis.

7
Based on the results of the above statistical analysis, the most important
signals for the classification of healthy and asthmatic patients come primarily from
the region of 1.7 to 2.2 ppm, and secondarily from the region of 3.2 to 3.4 ppm (figure
2). The first set of signals due to the chemical shift and the shape of the single
signals can be assumed to correspond to acetylated products. The second set can
be attributed to oxygen containing compounds.
A good within-day repeatability was demonstrated by means of the Bland
Altman test. Moreover a good technical repeatability was shown, with a coefficient of
variation of 1.07%. See the online supplement for additional information.
DISCUSSION
In our study, we showed that NMR-based metabolomic analysis can be
applied to an EBC matrix and, to the best of our knowledge, there are no previously
published data on the analysis of this biofluid using NMR-based spectroscopy. Within
the NMR spectrum we identified some profiles indicative of acetylated and oxidized
compounds that significantly distinguished asthmatic from healthy children (figure 2).
The development and application of techniques enabling the study of
underlying metabolic processes are important to improve our understanding of
asthma (2). Although the gold standard for investigating airway inflammation in vivo
is bronchoscopy with bronchoalveolar lavage and bronchial biopsy, this invasive
technique is not suitable for routine use, particularly in children (19-20). Growing
interest has therefore focused recently on non-invasive techniques, such as exhaled
NO and EBC analysis (19). The EBC technique is entirely non-invasive, safe and
easy to perform, even in children (20). Several studies have investigated EBC for the
presence of known compounds believed to mirror different pathways involved in

8
asthmatic airway inflammation and oxidative stress (19). However the application of
EBC is dependent on the development of sensitive and reproducible assays (21).
Metabolomics has been gaining more and more importance in quantitative
measurement of the multivariate metabolic responses of whole organisms to
pathophysiological stimuli (7-10), and it has recently been applied in studies
investigating the metabolic response to various diseases, such as ovarian cancer
(22), diabetes (23) and inherited metabolic disorders (24), but not asthma. NMR
spectroscopy has recently been applied successfully to urine demonstrating that
drug-induced responses in individuals are potentially predictable from their pre-dose
metabolic profiles (pharmaco-metabolomics) (25). NMR spectroscopy is very
powerful in providing overall biochemical profiles of low-molecular-weight
endogenous metabolites in biological fluids, without requiring any pre-selection of
measurable analytes (24,26-27). The biochemical compounds detected are
represented in a spectrum consisting of thousands of signals, the intensity of each of
which correlates with the metabolite’s concentration. Metabolomics thus provides an
overview of all the compound classes in a sample, drawing its metabolic fingerprint.
Multivariate statistical methods (11) are applied to NMR-generated profiles to extract
latent biochemical information from NMR spectra.
Alongside clinical symptoms, FEV1 - a parameter of airflow limitation (2) - and
FENO - a marker of eosinophilic airway inflammation (28) - are nowadays considered
as functional and biological markers for asthma diagnosis and monitoring. Our data
notably show that, in combination, FENO and FEV1 have a success rate of ~81% in
discriminating between asthmatic and healthy children, while selected NMR signals
discriminate between them with a success rate of ~86%. Moreover, LDA (Linear
Discriminant Analysis) using best subset selection (a combination of FEV1 and NMR
signals) produced a classification with a success rate in excess of 95%. These

9
observations suggest that NMR-based EBC analysis is effective in characterizing
asthmatic subjects and supports a role for this technique in further studies aimed at
investigating asthma pathobiology.
The NMR variables (signals) identified by LDA and PLS, derived primarily from
the region of 1.7 to 2.2 ppm (figure 2), and can be attributed to acetylated products.
To our knowledge there are no published data on acetylated compounds in the
exhaled air of asthmatic subjects. We could not characterize the exact molecules
represented by the peak identified in the NMR spectrum because the structural
identification of a single metabolite requires more complex procedures, such as
homo- and hetero- NMR bidimensional spectra or high-resolution mass spectrometry
and the application of such procedures was beyond the aims of the present study.
We can, therefore, only make some speculations on this new finding.
It has recently been demonstrated that, in response to several inflammatory
signals, the high motility group box protein 1 (HMGB1) is acetylated and then actively
secreted (29). In the extracellular space, HMGB1 behaves like a pro-inflammatory
mediator (29). We hypothesize that the large number of inflammatory stimuli in the
asthmatic airways might increase HMBG1 acetylation and release in the airway,
where this protein might act as a pro-inflammatory agent.
The peaks in the 3.2-3.4 ppm range of the NMR spectrum, which secondarily
characterized asthmatic children, are probably related to oxidized compounds.
Oxidative stress (resulting from an imbalance between oxidants and anti-oxidants in
the airways) has a significant role in asthma pathophysiology and lung damage (19).
Our finding is consistent with numerous studies showing higher concentrations of
oxidative stress markers in EBC collected from asthmatic subjects (30), and it
supports the need for further studies to investigate the therapeutic role of effective
antioxidant agents.

10
In fact, NMR metabolomics may reach a wider application in pulmonology. For
example further studies applying this method to the analysis of EBC might enable the
identification of early markers of lung cancer or, as recently reported, the prediction
of the response to drugs (25).
When a new technique is described, the availability of repeatability data is a
central issue (21). A recent study (31) addressed this problem concluding that NMR
spectroscopy of biofluids combined with pattern recognition methods is a robust and
precise approach for metabolomic studies. Our data confirm these observations,
showing a good within-day repeatability when two EBC samples are collected from
the same patient and a good technical repeatability when the NMR analysis is
repeated 8 times in a row on the same sample.
A limit of the present study is that we could only evaluate which parts of the
spectra may help us to discriminate between healthy and ill cases, while the limited
number of samples prevented us from making any predictions in an independent
group of subjects. We therefore recognize that our data are preliminary and further
studies are needed to determine prospectively, in a separate group of patients, the
utility of the built model in discriminating between asthmatic and healthy children.
In conclusion, the major novelty emerging from our study is that metabolomic
analysis can be applied to EBC giving the opportunity to obtain overall information on
the biochemical compounds in a biological fluid collected from the lower airway by
non-invasive means. In asthmatic patients, the application of metabolomics to the
EBC matrix has the potential for representing a significant advance in defining the
biochemical phenotype of the airways. The presence of acetylated compounds
suggested by NMR profiling paves the way to the study of new metabolic pathways
that may have a role in asthma pathophysiology.

11
Acknowledgements
We thank Dr. Manfred Spraul and Dr. Li-Hong Tseng of Bruker BioSpin GmbH for
NMR measurements.

12
References
1. Lemanske RF, Busse WW. Astma. J Allergy Clin Immunol 2003;111:S502-
S519.
2. Global Initiative for Asthma. Global Strategy for Asthma Management and
Prevention. NIH-NHLI 02-3659, Bethesda, MD:2002 (updated 2005).
3. Van Den Toorn LM, Overbeek SE, de Jongste JC, Leman K, Hoogsteden HC,
Prins JB. Airway inflammation is present during clinical remission of atopic
asthma. Am J Respir Crit Care Med 2001;164:2107-2113.
4. Payne DNR, Wilson NM, James A, Hablas H, Agrafioti C, Bush A. Evidence for
different subgroups of difficult asthma in children. Thorax 2005;56:345-350.
5. Horvath I, Barnes P, Hunt J. Exhaled breath condensate: methodological
recommendations and unresolved questions. Eur Respir J 2005;26:523-548.
6. Nicholson JK, Wilson ID. Understanding ‘global’ systems biology :
metabonomics and the continuum of metabolism. Natur Rev Drug Discov
2003;2:668-676
7. Nicholson J, Lindon J, Holmes E. 'Metabonomics': understanding the metabolic
responses of living systems to pathophysiological stimuli via multivariate
statistical analysis of biological NMR spectroscopic data. Xenobiotica
1999;29:1181-1189.
8. Pattern recognition and biomarker validation using quantitative 1H-NMR-based
metabolomics. Expert Rev Mol Diagn 2006;6:717-31
9. Bollard M, Stanley E, Lindon J, Nicholson J, Holmes E. NMR-based
metabonomic approaches for evaluating physiological influences on biofluid
composition. NMR Biomed 2005;18:143-62.
10. Lindon J, Holmes E, Nicholson J. So what's the deal with metabonomics? Anal
Chem 2003;75:385A-391A.

13
11. Lindon JC, Holmes E, Nicholson J Pattern recognition methods and applications
in biomedical magnetic resonance. Progress in Nuclear Magnetic Resonance
Spectroscopy 2001;39:1-40
12. Carraro S, Rezzi S, Reniero F, Heberger K, Giordano G, Zanconato S, Guillou
C, Baraldi E. Metabonomics applied to exhaled breath condensate in childhood
asthma. Eur Respir J 2006;28 (supplement 50):123s.
13. Baraldi E, de Jongste J. European Respiratory Society, American Thoracic
Society. Measurement of exhaled nitric oxide in children, 2001.
Eur Respir J 2002;20:223-37.
14. Harris R, Becker E, Cabral de Menezes S, Goodfellow R, Granger P. NMR
nomenclature. Nuclear spin properties and conventions for chemical shifts
(IUPAC Recommendations 2001). Pure Appl Chem, 2001;73:1795
15. Vandeginste B, Massart D, Buydens L, Jong S, Lewi P, Smeyers-Verbeke J.
Supervised pattern recognition. In: Handbook of Chemometrics and
Qualimetrics: Part B. Amsterdam, The Netherlands: Elsevier; 1998. p. 207-223
16. Geladi P, Kowalski B. Partial least-squares regression: a tutorial. Anal Chim
Acta 1986;185:1-17.
17. Ståhle L, Wold S. Partial least squares analysis with cross validation for the
two-class problem: a Monte Carlo study. J Chemometrics 1987;1:185-196.
18. Bland J, Altman D. Statistical methods for assessing agreement between two
methods of clinical measurement. Lancet 1986;1:307-10
19. Kharitonov S, Barnes P. Exhaled markers of pulmonary disease.
Am J Respir Crit Care Med 2001;163:1693-722
20. Baraldi E, Ghiro L, Piovan V, Carraro S, Zacchello F, Zanconato S. Safety and
success of exhaled breath condensate collection in asthma. Arch Dis Child
2003;88:358-360

14
21. Zacharasiewicz A, Wilson N, Lex C, Li A, Kemp M, Donovan J, Hooper J,
Kharitonov SA, Bush A. Repeatability of sodium and chloride in exhaled breath
condensates. Ped Pulm 2004;37:273-275
22. Odunsi K, Wollam R, Ambrosone C, Huston A, McCann S, Tammela J, Geisler
J, Miller G, Sellers T, Cliby W, Qian F, Keitz B, Intengan M, Lele S, Alderfer J.
Detection of epithelial ovarian cancer using H-NMR-based metabonomics. Int J
Cancer 2005;113:782-788.
23. Messana I, Forni F, Ferrari F, Rossi C, Giardina B, Zuppi C. Proton nuclear
magnetic resonance spectral profiles of urine in type II diabetic patients. Cinical
Chem 1998;44:1529-1534.
24. Moolenaar S, Engelke U, Wevers R. Proton nuclear magnetic resonance
spectroscopy of body fluids in the field of inborn errors of metabolism. Ann Clin
Biochem 2003;40:16-24.
25. Clayton T, Lindon J, Cloarec O, Antti H, Charuel C, Hanton G, Provost J, Le Net
J, Baker D, Walley R, Everett J, Nicholson J. Pharmaco-metabonomic
phenotyping and personalized drug treatment. Nature 2006; 440:1073-77
26. Coen M, O'Sullivan M, Bubb W, Kuchel P, Sorrell T. Proton nuclear magnetic
resonance-based metabonomics for rapid diagnosis of meningitis and
ventriculitis. Clin Infect Dis 2005;11:1582-1590.
27. Brindle J, Antti H, Holmes E, Tranter G, Nicholson J, Bethell H, Clarke S,
Schofield P, McKilligin E, Mosedale D, Grainger D. Rapid and noninvasive
diagnosis of the presence and severity of coronary heart disease using 1H-
NMR-based Metabonomics. Nat Med 2002; 8:1439-1445
28. Berry M, Shaw D, Green R, Brightling C, Wardlaw A, Pavord I. The use of
exhaled nitric oxide concentration to identify eosinophilic airway inflammation:
an observational study in adults with asthma. Clin Exp Allergy 2005;35:1175-9.
15
29. Erlandsson Harris, H, Andersson U. The nuclear protein HMGB1 as a
proinflammatory mediator. Eur J Immunol 2004;34:1503-1512.
30. Paredi P, Kharitonov S, Barnes P. Analysis of expired air for oxidation products.
Am J Respir Crit Care Med 2002 15;166:S31-7.
31. Dumas M, Maibaum E, Teague C, Ueshima H, Zhou B, Lindon J, Nicholson J,
Stamler J, Elliott P, Chan Q, Holmes E. Assessment of Analytical
Reproducibility of 1H NMR Spectroscopy Based Metabonomics for Large-Scale
Epidemiological Research: the INTERMAP Study. Anal Chem 2006,78:2199.

16
FIGURE LEGENDS
Figure 1. Partial Least Squares (PLS) X scores discrimination for healthy and
asthmatic children. All variables are used and three PLS components are retained in
the model. X scores are the components in the input matrix that best describe
relevant variations in the input variables and correlate best with the target value. As
we cannot determine the number of PLS components by cross-validation, said
number was varied: the classification was 69% correct using one PLS component,
83% using two and 94% using three; since the fourth PLS component does not
improve the classification, it very probably gives rise to an overfit.
Figure 2. Examples of Nuclear Magnetic Resonance (NMR) spectra obtained in
asthmatic (A and B) and healthy (C) children (zoom between 1-4 ppm). Significant
signals are found in the 1.7-2.2 ppm region of the spectrum in asthmatic children
compared to healthy subjects. These signals suggest a significant presence of
acetylated compounds (2) in exhaled breath condensate of asthmatic subjects.
Asthmatic children are also characterized by the presence of signals in the 3.2-3.4
ppm regions, indicative of the presence of oxidized compounds (1).

17
FIGURE 1

18
FIGURE 2
METABONOMICS APPLIED TO EXHALED BREATH CONDENSATE
IN CHILDHOOD ASTHMA
Silvia Carraro, Serge Rezzi, Fabiano Reniero, Károly Héberger,
Giuseppe Giordano, Stefania Zanconato, Claude Guillou, Eugenio Baraldi
Online Data Supplement

METODHS
Study subjects
The study included 25 (20 males) asthmatic children (mean age 10.6 years, range 7-15)
and 11 (6 males) healthy controls (mean age 8.6 years, range 6-13). All the enrolled
children were Caucasian. The asthmatic patients were recruited among patients attending
the Pulmonology/Allergy outpatients clinic at the Pediatrics Department in Padova. The
diagnosis of asthma was made by a pediatric respiratory physician and was based on
clinical history (cough, shortness of breath, recurrent wheeze, chest tightness) and
increase in FEV1 after bronchodilator > 12%, according to international guidelines (E1).
Eight asthmatic children had intermittent asthma and had received no inhaled
corticosteroid (ICS) treatment for at least a month. Seventeen children had persistent
asthma and were treated with ICS on a regular base (average daily dose 200 mcg
fluticasone or equivalent).
Asthmatic children were in good clinical control of their disease. In addition they had
suffered no acute upper or lower airway infection in the last 3 weeks. All asthmatic children
were atopic, sensitized to at least one airborne allergen, as demonstrated by skin prick
test.
Healthy children were relatives of nurses and doctors of our hospital and they had no
history of atopy or respiratory diseases.
The Ethics Committee of our hospital reviewed and approved the protocol and all parents
gave their informed consent.
Fractional exhaled nitric oxide (FENO) measurement
FENO was measured with the NIOX system (Aerocrine, Stockholm, Sweden) using a
single-breath on-line method according to ERS/ATS guidelines for measuring FENO in
children (E2). Children inhaled NO-free air to total lung capacity and exhaled through a

dynamic flow restrictor with a target flow of 50 ml/sec for at least 6-7 seconds. No nose
clip was used. The NIOX system was calibrated using a 200 ppb NO tank (Lindegas Hoek
Loos Speciality gases, Amsterdam, Netherlands) according to the manufacturer’s
instructions.
Pulmonary function test
Pulmonary function parameters were measured with a 10-liter bell spirometer (Biomedin,
Padova, Italy) and the best of three maneuvers was expressed as a percentage (%) of
predicted reference values.
Statistical analysis
Mann-Whitney Rank Sum Test was applied to compare FENO and FEV1 in healthy and
asthmatic children, being the data not normally distributed.
Data from the NMR spectra were processed using the AMIX Principal Component Analysis
(PCA) routine and then, after exportation, using the Statistica 6.0 software package for
Discriminant Analysis (DA) and Partial least squares (PLS).
Linear Discriminant Analysis (LDA) (E3) is a supervised pattern recognition
technique. It determines the linear function of the variables that maximizes the ratio of
between-class variance and minimizes the ratio of within-class variance. The variables (up
to 4 or 6) with the greatest discriminant capacity were selected with the best subset
selection variant of discriminant analysis. Partial Least Squares Discriminant Analysis
(PLS DA) (E4-E5) determines the components in the input matrix (X) that describe as
much as possible of the relevant variations in the input variables, and that, at the same
time, correlate best with the target value in Y, without including the variations that are
irrelevant or noisy. The PLS analysis was conducted on the centered (without intercept)
and standardized (autoscaled) data. PLS DA can be used in the case of ‘landscape

matrices’ without variable selection. It is not sensitive to overfit (if proper number of PLS
components are selected) or collinearity of variables.
Within-day repeatability and technical repeatability of the measurements were
evaluated using the method of Bland and Altman (E6) and the coefficient of variation,
respectively.
RESULTS
Within day repeatability
I) 6 asthmatic children performed EBC collection twice within the same day. When
analyzing the repeatability of NMR spectra, the main problem is the need of
evaluating the simultaneous measurement of many variables. To overcome this
problem we divided each spectrum in 5 zones (zone 1: 4.2-3.7 ppm; zone 2: 3.7-3.2
ppm; zone 3: 2.5-1.5 ppm; zone 4: 1.5-1.0 ppm; zone 5: 1.0-0.5 ppm) and we
calculated the area under the curve in each zone, obtaining 5 integrals. We could,
therefore, express each spectrum through 5 numbers (the integrals). We then
evaluated the repeatability by means of the Bland and Altman test applied both at
each zone and at all the zones together.
Looking at each spectrum zone we found that all the values fall within the 2SD range,
demonstrating a good repeatability (figure a1-a5).
References
E1. Global Initiative for Asthma. Global Strategy for Asthma Management and
Prevention. NIH-NHLI 02-3659, Bethesda, MD:(2002 updated 2005).
E2. Baraldi E, de Jongste J, European Respiratory Society, American Thoracic Society.
Measurement of exhaled nitric oxide in children, 2001.
Eur Respir J. 2002;20:223-37.
E3. Vandeginste B, Massart D, Buydens L, Jong S, Lewi P, Smeyers-Verbeke J. Chapter
33. Supervised pattern recognition, pp. 207-223. In Handbook of Chemometrics and
Qualimetrics: Part B; Elsevier: Amsterdam, The Netherlands, 1998.
E4. Geladi P, Kowalski B. Partial least-squares regression: a tutorial. Anal. Chim. Acta
1986;185:1-17.
E5. Ståhle L, Wold S. Partial least squares analysis with cross validation for the two-class
problem: a Monte Carlo study. J Chemometrics 1987;1:185-196.
E6. Bland J, Altman D. Statistical methods for assessing agreement between two
methods of clinical measurement. Lancet 1986;1:307-10

Figure E1. Bland Altman plot for zone 1 (4.2-3.7 ppm)
-0,4
-0,3
-0,2
-0,1
0
0,1
0,2
0,3
0,4
0 5 10 15
Mean (t1+t2) /2
Diff
eren
ce(t
1-t2
)
+1.96 SD
-1.96 SD
-0,4
-0,3
-0,2
-0,1
0
0,1
0,2
0,3
0,4
0 5 10 15
Mean (t1+t2) /2
Diff
eren
ce(t
1-t2
)
+1.96 SD
-1.96 SD
Figure E2. Bland Altman plot for zone 2 (3.7-3.2 ppm)ዊ�
-1
-0,8
-0,6
-0,4
-0,2
0
0,2
0,4
0,6
0,8
1
0 5 10 15 20 25 30 35 40 45 50
Mean (t1+t2) /2
Diff
eren
ce(t
1-t2
) +1.96 SD
-1.96 SD
-1
-0,8
-0,6
-0,4
-0,2
0
0,2
0,4
0,6
0,8
1
0 5 10 15 20 25 30 35 40 45 50
Mean (t1+t2) /2
Diff
eren
ce(t
1-t2
) +1.96 SD
-1.96 SD

Figure E3. Bland Altman plot for zone 3 (2.5-1.5 ppm)ዊ�
-0,8
-0,6
-0,4
-0,2
0
0,2
0,4
0,6
0,8
0 5 10 15 20
Mean (t1+t2) /2
Diff
eren
ce(t
1-t2
) +1.96 SD
-1.96 SD
-0,8
-0,6
-0,4
-0,2
0
0,2
0,4
0,6
0,8
0 5 10 15 20
Mean (t1+t2) /2
Diff
eren
ce(t
1-t2
) +1.96 SD
-1.96 SD
Figure E4. Bland Altman plot for zone 4 (1.5-1.0 ppm)
-0,9
-0,7
-0,5
-0,3
-0,1
0,1
0,3
0,5
0,7
0,9
0 5 10 15 20 25 30 35 40 45 50 55 60 65 70 75 80
Mean (t1+t2) /2
Diff
eren
ce(t
1-t2
) +1.96 SD
-1.96 SD
-0,9
-0,7
-0,5
-0,3
-0,1
0,1
0,3
0,5
0,7
0,9
0 5 10 15 20 25 30 35 40 45 50 55 60 65 70 75 80
Mean (t1+t2) /2
Diff
eren
ce(t
1-t2
) +1.96 SD
-1.96 SD
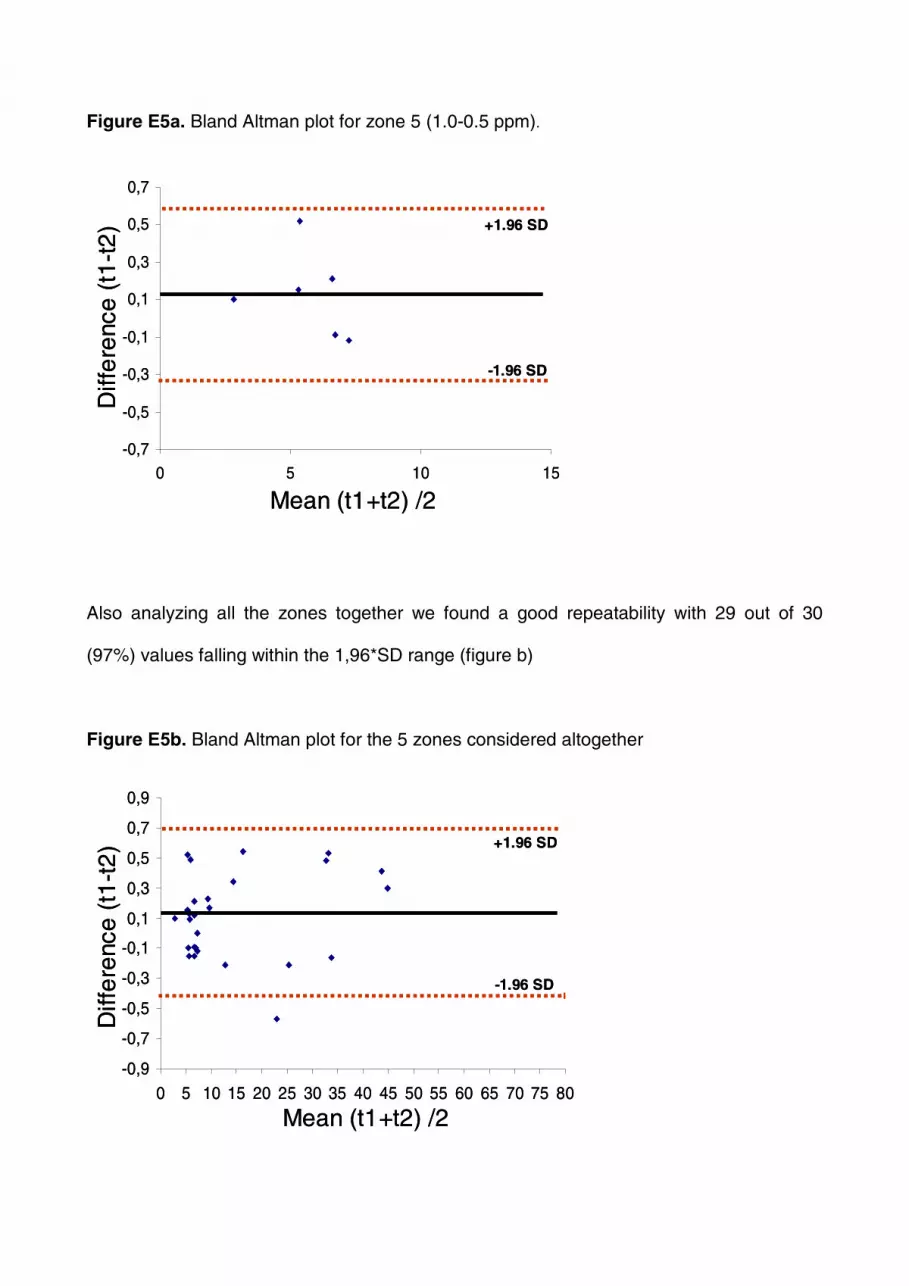
Figure E5a. Bland Altman plot for zone 5 (1.0-0.5 ppm)ዊ�
-0,7
-0,5
-0,3
-0,1
0,1
0,3
0,5
0,7
0 5 10 15
Mean (t1+t2) /2
Diff
ere
nce
(t1-
t2) +1.96 SD
-1.96 SD
-0,7
-0,5
-0,3
-0,1
0,1
0,3
0,5
0,7
0 5 10 15
Mean (t1+t2) /2
Diff
ere
nce
(t1-
t2) +1.96 SD
-1.96 SD
Also analyzing all the zones together we found a good repeatability with 29 out of 30
(97%) values falling within the 1,96*SD range (figure b)
Figure E5b. Bland Altman plot for the 5 zones considered altogether
-0,9
-0,7
-0,5
-0,3
-0,1
0,1
0,3
0,5
0,7
0,9
0 5 10 15 20 25 30 35 40 45 50 55 60 65 70 75 80
Mean (t1+t2) /2
Diff
eren
ce(t
1-t2
) +1.96 SD
-1.96 SD
-0,9
-0,7
-0,5
-0,3
-0,1
0,1
0,3
0,5
0,7
0,9
0 5 10 15 20 25 30 35 40 45 50 55 60 65 70 75 80
Mean (t1+t2) /2
Diff
eren
ce(t
1-t2
) +1.96 SD
-1.96 SD

Technical repeatability
II) To evaluate the repeatability of the technique, we have repeated the NMR analysis of
one sample 8 times in a row. We used the integral of the spectrum area between 3
and 4 ppm, finding a coefficient of variation of 1.07%.