development of radioactive beams at alto - arxiv
TRANSCRIPT
Development of radioactive beams at ALTO: Part 2. Influence of the UCx
target microstructure on the release properties of fission products
Julien Guillota*, Brigitte Roussièrea, Sandrine Tusseau-Nenezb, Denis Grebenkovb, Nicole Barré-Boschera,
Elie Borga, Julien Martina
a Institut de Physique Nucléaire d’Orsay CNRS/IN2P3 UMR 8608 - Université Paris Sud - Université Paris
Saclay, F-91406 ORSAY Cedex b Laboratoire de Physique de la Matière Condensée, CNRS, Ecole Polytechnique - Université Paris Saclay,
Route de Saclay, F-91128 Palaiseau
*Corresponding author: [email protected], tel: +33169155101
__________________________________________________________________________________________
Keywords: UCx target, Release efficiency, Radioactive beams, PCA, Fluka, γ-spectroscopy
__________________________________________________________________________________________
Abstract:
Producing intense radioactive beams, in particular those consisting of short-lived isotopes requires the control of
the release efficiency. The released fractions of 11 elements were measured on 14 samples that were characterized
by various physicochemical analyses in a correlated paper (Part 1). A multivariate statistical approach, using the
principal component analysis, was performed to highlight the impact of the microstructure on the release
properties. Samples that best release fission products consist of grains and aggregates with small size and display
a high porosity distributed on small diameter pores. They were obtained applying a mixing of ground uranium
dioxide and carbon nanotubes powders leading to homogeneous uranium carbide samples with a porous
nanostructure. A modelling under on-line ALTO conditions was carried out using the FLUKA code to compare
the yields released by an optimized and a conventional target.
__________________________________________________________________________________________
Introduction:
The research and development program at the ALTO facility (Accélérateur Linéaire et Tandem d'Orsay) of the
Institut de Physique Nucléaire d'Orsay (IPNO) aims to provide new beams of exotic and neuton-rich nuclei, as
intense as possible. At ALTO, neutron-rich nuclei are produced by photofission in thick uranium carbide targets.
An efficient way to improve the intensities of the radioactive beams, in particular those consisting of short-lived
isotopes, would be to develop dense and porous targets. These two properties are antagonistic but essential to
increase the fission fragment quantity produced and diffuse them out of the target respectively.
Much research work has been done to improve release efficiencies by studying the influence of several parameters.
Numerous studies have pointed out the impact of the uranium precursors [1]–[5] or lanthanum precursors taken as
uranium structural equivalent [6], [7] on the target porosity. It appears that, as the precursors generate more gas,
the porosity is favoured. Whatever the metal precursor used for the synthesis of uranium carbide (UCx) [4], [8]–
[11], [14]–[16], [22], lanthanum carbide (LaCx) [12], [13], [17], [18], [21] or titanium carbide (TiC) [19], [20]
targets, the carbon source (graphite [8]–[13], reticulated vitreous carbon foam [14]–[16], graphene [17], [18],
carbon black [19], [20] and carbon nanotubes [4], [19]–[22]) is also a key point because this parameter impacts
not only the amount of porosity but also the carbide grain size and the sintering step. Finally, the ratio of metal
precursor (uranium) to carbon must be a fine balance between obtaining high release efficiency and sufficient
production of fission products [23]–[27]. Moreover some recent studies suggest controlling the porosity by adding
polymer sacrificial particles which will leave a footprint after degassing due to the heating [28]–[30]. Studies on
calcium oxide (CaO) ISOL targets also showed the importance of the temperature on the target microstructure in
order to control the sintering and the grain size [31], [32]. It was recently suggested that the reaction rate velocity
during carburization could also be a point to be optimized [33]. In addition to experimental approaches [34]–[36],
the release dependence upon grain size and porosity has been studied for various isotopes in UCx targets by
simulations carried out with the RIBO code [37], [38]. Finally, recent results on UCx targets have shown that using
refractory targets with a nanometric structure enables the production of new and more exotic radioactive isotope
beams [22]. The correlated paper of this study (Part 1) gives more details on the contribution of the studies cited
here on the target synthesis [39].
In this context, we have undertaken to determine the impact of the physicochemical characteristics of a target on
its release properties. As a first step, seven samples ranging from a dense UC sample to a highly porous UCx one
elaborated with carbon nanotubes were studied. Open porosity appears to play the most significant role and the
use of carbon nanotubes proves very promising provided the microstructure remains stable when the sample is
heated at high temperature for a long time [4]. In a second step, after having investigated the parameters involved
in the target manufacturing (grinding and mixing of precursor powders, pressing, carburization and dwelled time
at high temperature), we produced fourteen samples from different uranium and carbon sources applying three
mixing protocols. An exhaustive physicochemical description of the samples was obtained, and strong correlations
were established between the methods of sample preparation and the structural properties, such as the quantity of
porosity, the pore-size distribution, the size of grains and aggregates [39]. In the present paper, the release
properties of these fourteen samples are investigated. The samples were irradiated with a deuteron beam delivered
by the tandem accelerator of the laboratory and the released fraction of 11 elements was measured by
gamma spectrometry. A statistical analysis of the results using the Principal Component Analysis (PCA) method
allowed us to establish strong correlations between the release properties of the samples and some of their structural
properties.
1. Experimental protocol
1.1. Description of the samples
Two uranium (uranium dioxide and uranium oxalate) and three carbon (graphite, carbon nanotube-CNT),
graphene) sources were used to produce 14 batches of samples according to 3 different mixing protocols labelled
conventional protocol (CP), developing protocol (DP) and graphene protocol (GP). 0.4 g and 1 g were taken from
the powder mixtures containing the CNT and graphite (or graphene) respectively. Each powder sample was pressed
6 seconds at 220 MPa to form a green pellet with about 13 mm diameter and 1.7 mm thickness. All the pellets
were carburized at 1800 °C for 2 hours and pellets No. 9, 10, 11 and 12 underwent an additional heat treatment at
1800 °C for 12 days. Despite the care taken during the preparation, after heating, the samples show significant
differences in diameter and thickness (Table 1).
Table 1: Mass (m), diameter (d) and thickness (t) of the pellets used for the release experiment. The uranium
quantity contained in each pellet is given in column 8 and the intensity of the deuteron beam used during the
irradiation in column 9. Samples are labelled by the uranium and carbon sources and the mixing protocol used (for
details, see ref. [39]). The PARRNe samples correspond to pellets used as conventional target at ALTO and build
of UO2 ground and graphite according to the conventional protocol.
No./Samples P1 P2
Uranium quantity per
pellet (⨯10-3 mol)
Beam
intensity
I (nA) m (g) d (mm) t (mm) m (g) d (mm) t (mm)
No.1 UO2 ground + CNT CP 0.32 13.52 2.24 0.33 13.50 1.58 1.0 50
No.2 UO2 ground + CNT DP 0.33 12.37 1.62 0.33 12.38 1.61 1.0 50
No.3 UO2 ground + graphene GP 0.75 11.62 1.80 0.77 11.56 2.00 2.4 20
No.4 OXA + graphite CP 0.32 9.61 1.29 0.32 9.62 1.33 1.0 50
No.5 OXA ground + CNT DP 0.21 11.28 1.58 0.21 11.31 1.57 0.7 50
No.6 OXA + CNT DP 0.22 12.39 1.63 0.22 12.40 1.63 0.7 50
No.7 PARRNe BP894 0.82 12.62 1.43 0.84 12.70 1.45 2.6 20
No.8 PARRNe BP897 CP 0.82 12.35 1.81 0.82 12.34 1.80 2.6 20
No.9 PARRNe BP897 CP 12d 0.80 12.31 1.81 0.81 12.29 1.79 2.6 20
No.10 UO2 ground + CNT CP 12d 0.33 12.69 2.05 0.33 12.68 1.90 1.0 50
No.11 UO2 ground + CNT DP 12d 0.33 12.54 1.66 0.33 12.55 1.62 1.0 50
No.12 UO2 ground + graphene GP 12d 0.77 11.52 1.79 0.78 11.46 1.81 2.5 20
No.13 UO2 ground + CNT-5moles DP 0.33 11.01 1.26 0.33 11.02 1.24 1.1 50
No.14 UO2 ground + CNT-7moles DP 0.33 13.02 1.95 0.33 13.08 1.98 1.0 50
The protocols used to synthesize the samples and the techniques and methods implemented to characterize them
are detailed in Guillot et al. [39] and reported in complementary data. Each sample was thus described by 14
variables: the proportion of the UC2, UC and C phases, the size of the UC and UC2 crystallites, the UCx grain size,
the UCx aggregate size, the percentages of open and close porosities and the distribution of the open porosity on
pores with 0.035, 0.2, 3, 10 and 30 µm average diameters (see Table 2 of ref. [39] and complementary data).
1.2. Release measurement
The released fractions were determined from the amount of fission products remaining in the samples after heating.
Fission products were obtained from the uranium (99.75 wt% of 238U and 0.25 wt% of 235U) fission induced by the
neutron flux generated by stopping a 26 MeV deuteron beam in a graphite converter. The measurements were
performed following the procedure developed by Hy et al. and Tusseau-Nenez et al. [2], [4]. Improvements have
been made to the pellet positioning in the specimen holder and to the heating device in order to increase the
reliability and the reproducibility of the measurements. They are described below.
Among all the pellets synthesized for each sample type, two, called P1 and P2 whose the dimensions are given in
Table 1, were selected to perform the release measurements. The first step consisted in irradiating the two pellets
placed in the specimen holder, one behind the other and both behind a graphite converter. They were immobilized
by graphite centering ring and shim in order to be perfectly in the beam axis. The deuteron-beam intensity
impinging on the converter was determined from the uranium quantity contained in the samples. As shown in
Table 1, pellets containing carbon nanotubes contain less uranium than pellets containing graphite or graphene.
They were irradiated with a higher-intensity beam in order to obtain, for all samples, very close radioactivity levels
and thus to carry out the γ-spectroscopy measurements with very similar temporal (irradiation, waiting and
counting times) and spatial (source-detector distance) conditions. All samples were irradiated for 20 minutes. For
radiation protection and safety reasons, a waiting time of the order of 30 minutes was required before removing
the pellets from the sample holder.
The second step consists in placing each pellet in front of a Ge(HP) detector in order to perform a first
γ-measurement aiming to compare the amount of fission products created in the two pellets.
In the third step, the pellet P1 was heated to 1768 °C for 30 minutes. The temperature of 1768 °C corresponds to
the temperature used in our previous R&D experiments at ALTO. Using this temperature, we can check the
reproducibility of the experiments and validate the protocol used for the study of the fission-product release. The
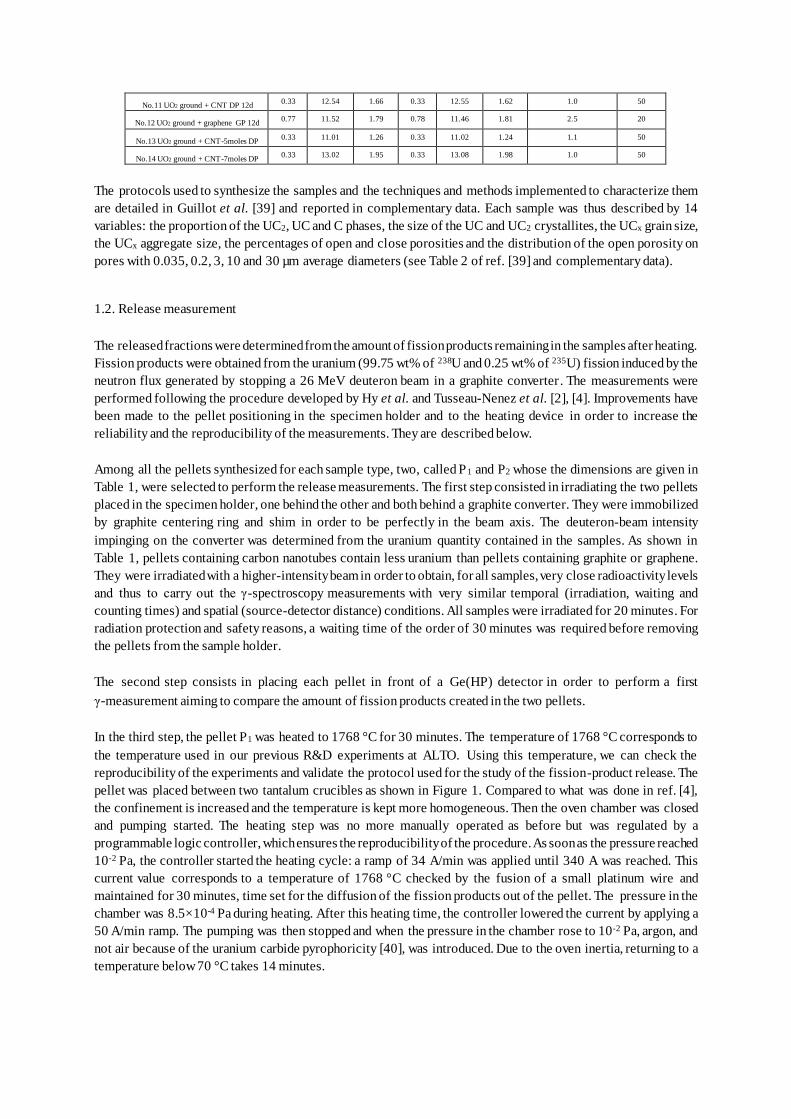
pellet was placed between two tantalum crucibles as shown in Figure 1. Compared to what was done in ref. [4],
the confinement is increased and the temperature is kept more homogeneous. Then the oven chamber was closed
and pumping started. The heating step was no more manually operated as before but was regulated by a
programmable logic controller, which ensures the reproducibility of the procedure. As soon as the pressure reached
10-2 Pa, the controller started the heating cycle: a ramp of 34 A/min was applied until 340 A was reached. This
current value corresponds to a temperature of 1768 °C checked by the fusion of a small platinum wire and
maintained for 30 minutes, time set for the diffusion of the fission products out of the pellet. The pressure in the
chamber was 8.5×10⁻⁴ Pa during heating. After this heating time, the controller lowered the current by applying a
50 A/min ramp. The pumping was then stopped and when the pressure in the chamber rose to 10-2 Pa, argon, and
not air because of the uranium carbide pyrophoricity [40], was introduced. Due to the oven inertia, returning to a
temperature below 70 °C takes 14 minutes.
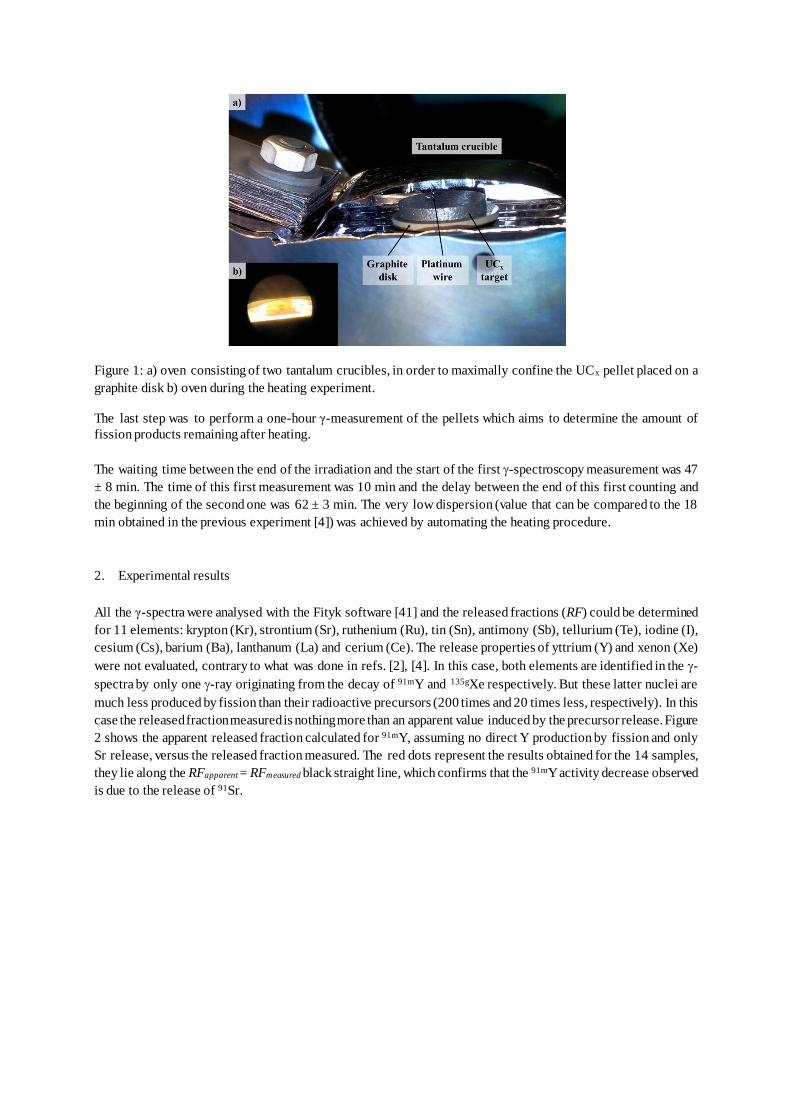
Figure 1: a) oven consisting of two tantalum crucibles, in order to maximally confine the UCx pellet placed on a
graphite disk b) oven during the heating experiment.
The last step was to perform a one-hour γ-measurement of the pellets which aims to determine the amount of
fission products remaining after heating.
The waiting time between the end of the irradiation and the start of the first -spectroscopy measurement was 47
± 8 min. The time of this first measurement was 10 min and the delay between the end of this first counting and
the beginning of the second one was 62 ± 3 min. The very low dispersion (value that can be compared to the 18
min obtained in the previous experiment [4]) was achieved by automating the heating procedure.
2. Experimental results
All the γ-spectra were analysed with the Fityk software [41] and the released fractions (RF) could be determined
for 11 elements: krypton (Kr), strontium (Sr), ruthenium (Ru), tin (Sn), antimony (Sb), tellurium (Te), iodine (I),
cesium (Cs), barium (Ba), lanthanum (La) and cerium (Ce). The release properties of yttrium (Y) and xenon (Xe)
were not evaluated, contrary to what was done in refs. [2], [4]. In this case, both elements are identified in the -
spectra by only one -ray originating from the decay of 91mY and 135gXe respectively. But these latter nuclei are
much less produced by fission than their radioactive precursors (200 times and 20 times less, respectively). In this
case the released fraction measured is nothing more than an apparent value induced by the precursor release. Figure
2 shows the apparent released fraction calculated for 91mY, assuming no direct Y production by fission and only
Sr release, versus the released fraction measured. The red dots represent the results obtained for the 14 samples,
they lie along the RFapparent = RFmeasured black straight line, which confirms that the 91mY activity decrease observed
is due to the release of 91Sr.
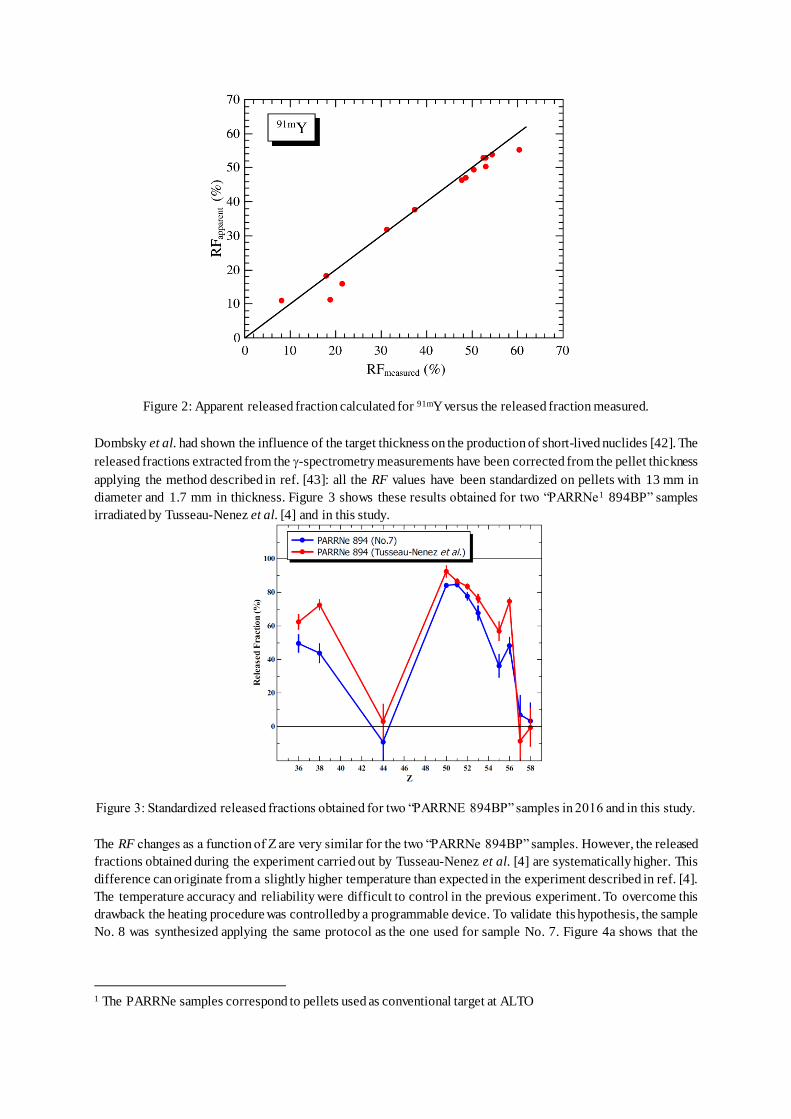
Figure 2: Apparent released fraction calculated for 91mY versus the released fraction measured.
Dombsky et al. had shown the influence of the target thickness on the production of short-lived nuclides [42]. The
released fractions extracted from the -spectrometry measurements have been corrected from the pellet thickness
applying the method described in ref. [43]: all the RF values have been standardized on pellets with 13 mm in
diameter and 1.7 mm in thickness. Figure 3 shows these results obtained for two “PARRNe1 894BP” samples
irradiated by Tusseau-Nenez et al. [4] and in this study.
Figure 3: Standardized released fractions obtained for two “PARRNE 894BP” samples in 2016 and in this study.
The RF changes as a function of Z are very similar for the two “PARRNe 894BP” samples. However, the released
fractions obtained during the experiment carried out by Tusseau-Nenez et al. [4] are systematically higher. This
difference can originate from a slightly higher temperature than expected in the experiment described in ref. [4].
The temperature accuracy and reliability were difficult to control in the previous experiment. To overcome this
drawback the heating procedure was controlled by a programmable device. To validate this hypothesis, the sample
No. 8 was synthesized applying the same protocol as the one used for sample No. 7. Figure 4a shows that the
1 The PARRNe samples correspond to pellets used as conventional target at ALTO
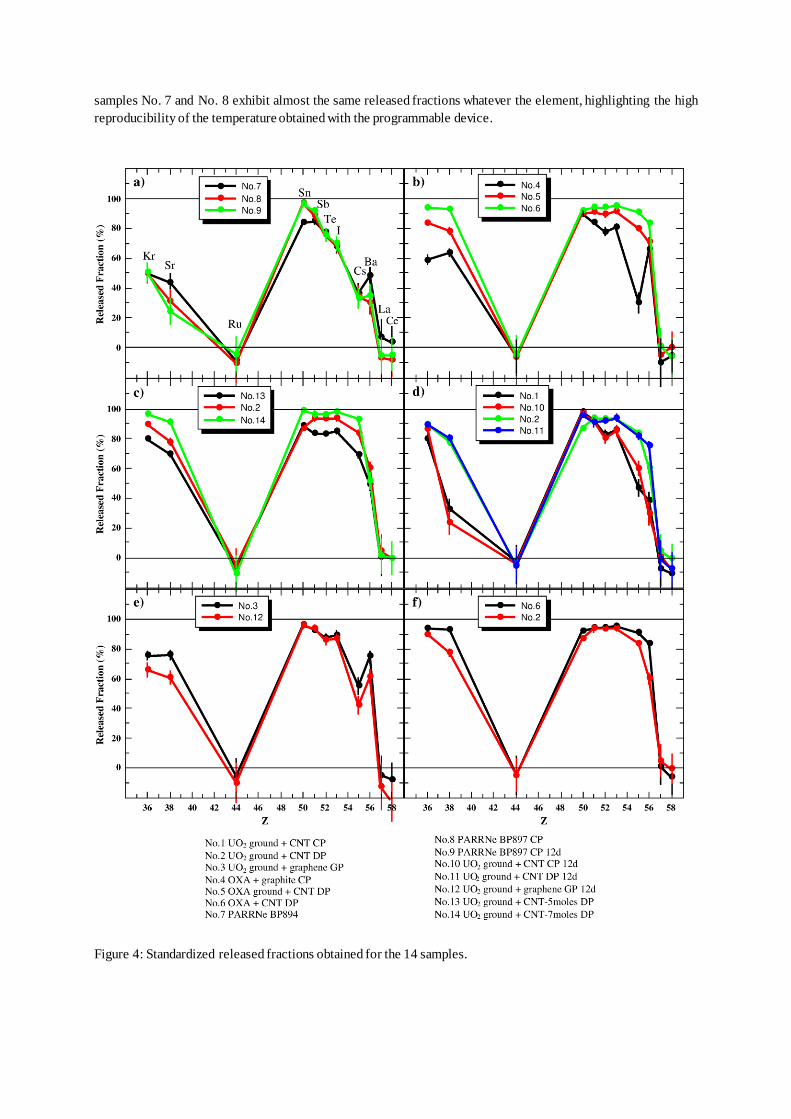
samples No. 7 and No. 8 exhibit almost the same released fractions whatever the element, highlighting the high
reproducibility of the temperature obtained with the programmable device.
Figure 4: Standardized released fractions obtained for the 14 samples.
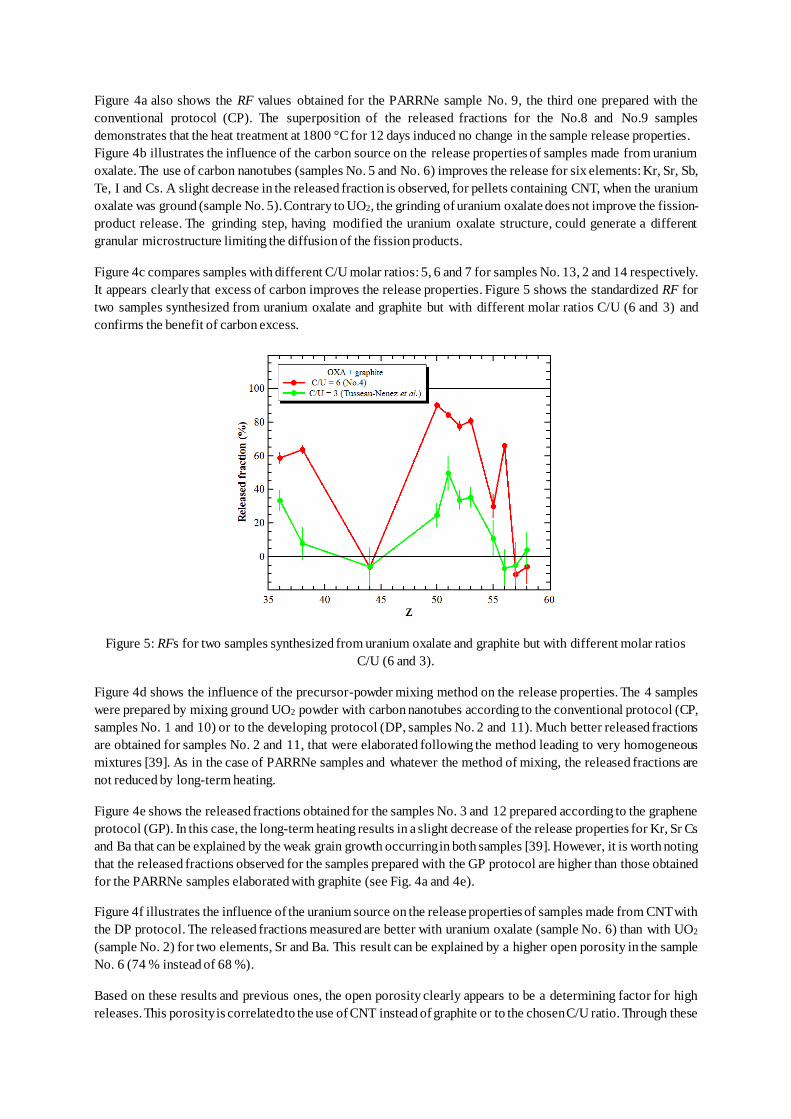
Figure 4a also shows the RF values obtained for the PARRNe sample No. 9, the third one prepared with the
conventional protocol (CP). The superposition of the released fractions for the No.8 and No.9 samples
demonstrates that the heat treatment at 1800 °C for 12 days induced no change in the sample release properties. Figure 4b illustrates the influence of the carbon source on the release properties of samples made from uranium
oxalate. The use of carbon nanotubes (samples No. 5 and No. 6) improves the release for six elements: Kr, Sr, Sb,
Te, I and Cs. A slight decrease in the released fraction is observed, for pellets containing CNT, when the uranium
oxalate was ground (sample No. 5). Contrary to UO2, the grinding of uranium oxalate does not improve the fission-
product release. The grinding step, having modified the uranium oxalate structure, could generate a different
granular microstructure limiting the diffusion of the fission products.
Figure 4c compares samples with different C/U molar ratios: 5, 6 and 7 for samples No. 13, 2 and 14 respectively.
It appears clearly that excess of carbon improves the release properties. Figure 5 shows the standardized RF for
two samples synthesized from uranium oxalate and graphite but with different molar ratios C/U (6 and 3) and
confirms the benefit of carbon excess.
Figure 5: RFs for two samples synthesized from uranium oxalate and graphite but with different molar ratios
C/U (6 and 3).
Figure 4d shows the influence of the precursor-powder mixing method on the release properties. The 4 samples
were prepared by mixing ground UO2 powder with carbon nanotubes according to the conventional protocol (CP,
samples No. 1 and 10) or to the developing protocol (DP, samples No. 2 and 11). Much better released fractions
are obtained for samples No. 2 and 11, that were elaborated following the method leading to very homogeneous
mixtures [39]. As in the case of PARRNe samples and whatever the method of mixing, the released fractions are
not reduced by long-term heating.
Figure 4e shows the released fractions obtained for the samples No. 3 and 12 prepared according to the graphene
protocol (GP). In this case, the long-term heating results in a slight decrease of the release properties for Kr, Sr Cs
and Ba that can be explained by the weak grain growth occurring in both samples [39]. However, it is worth noting
that the released fractions observed for the samples prepared with the GP protocol are higher than those obtained
for the PARRNe samples elaborated with graphite (see Fig. 4a and 4e).
Figure 4f illustrates the influence of the uranium source on the release properties of samples made from CNT with
the DP protocol. The released fractions measured are better with uranium oxalate (sample No. 6) than with UO2
(sample No. 2) for two elements, Sr and Ba. This result can be explained by a higher open porosity in the sample
No. 6 (74 % instead of 68 %).
Based on these results and previous ones, the open porosity clearly appears to be a determining factor for high
releases. This porosity is correlated to the use of CNT instead of graphite or to the chosen C/U ratio. Through these
experimental studies, the role of the pore size distribution and the UCx grain size in the release efficiency have to
be clarified.
3. Statistical analysis by Principal Component Analysis
As in the case of the physicochemical analysis of samples [39], a principal component analysis (PCA) was
performed in order to highlight the correlations between the variables related to the release and those associated
to the physicochemical properties. To carry out this PCA, each of the 14 samples was described by the 11
physicochemical variables statistically significant selected as active in ref. [39] as well as the RF values measured
for 6 elements. The RF values for Ru, Sn, Sb, La and Ce were not considered as active variables because they do
not exhibit any variability among samples. The temperature used, 1768 °C, is too low to release La, Ce and Ru.
As for Sn and Sb, they are very well released by all the samples, therefore these five elements cannot be used to
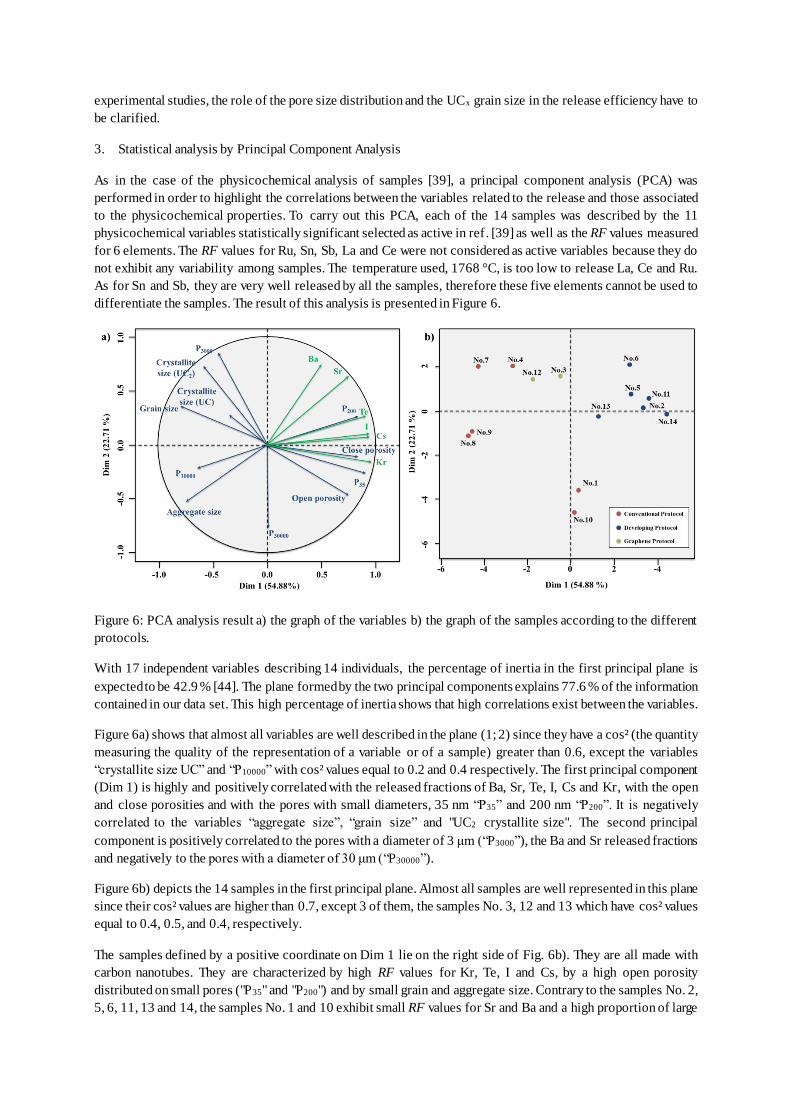
differentiate the samples. The result of this analysis is presented in Figure 6.
Figure 6: PCA analysis result a) the graph of the variables b) the graph of the samples according to the different
protocols.
With 17 independent variables describing 14 individuals, the percentage of inertia in the first principal plane is
expected to be 42.9 % [44]. The plane formed by the two principal components explains 77.6 % of the information
contained in our data set. This high percentage of inertia shows that high correlations exist between the variables.
Figure 6a) shows that almost all variables are well described in the plane (1; 2) since they have a cos² (the quantity
measuring the quality of the representation of a variable or of a sample) greater than 0.6, except the variables
“crystallite size UC” and “P10000” with cos² values equal to 0.2 and 0.4 respectively. The first principal component
(Dim 1) is highly and positively correlated with the released fractions of Ba, Sr, Te, I, Cs and Kr, with the open
and close porosities and with the pores with small diameters, 35 nm “P35” and 200 nm “P200”. It is negatively
correlated to the variables “aggregate size”, “grain size” and "UC2 crystallite size". The second principal
component is positively correlated to the pores with a diameter of 3 μm (“P3000”), the Ba and Sr released fractions
and negatively to the pores with a diameter of 30 μm (“P30000”).
Figure 6b) depicts the 14 samples in the first principal plane. Almost all samples are well represented in this plane
since their cos² values are higher than 0.7, except 3 of them, the samples No. 3, 12 and 13 which have cos² values
equal to 0.4, 0.5, and 0.4, respectively.
The samples defined by a positive coordinate on Dim 1 lie on the right side of Fig. 6b). They are all made with
carbon nanotubes. They are characterized by high RF values for Kr, Te, I and Cs, by a high open porosity
distributed on small pores ("P35" and "P200") and by small grain and aggregate size. Contrary to the samples No. 2,
5, 6, 11, 13 and 14, the samples No. 1 and 10 exhibit small RF values for Sr and Ba and a high proportion of large
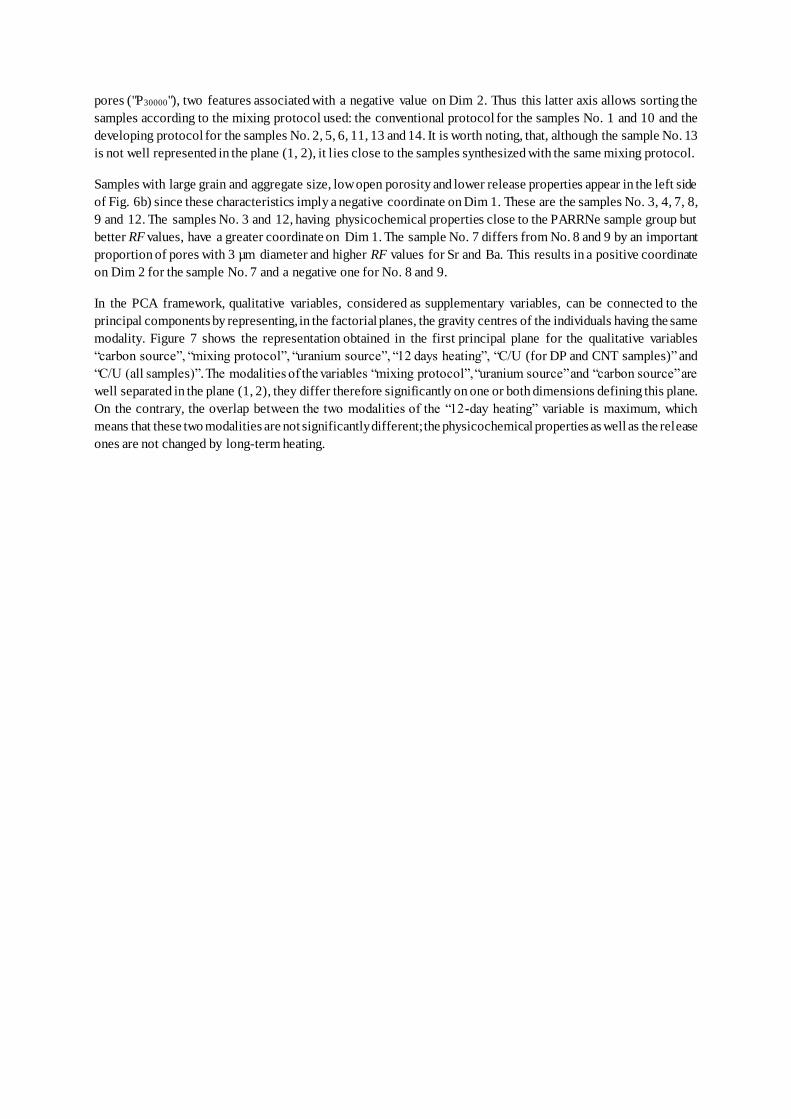
pores ("P30000"), two features associated with a negative value on Dim 2. Thus this latter axis allows sorting the
samples according to the mixing protocol used: the conventional protocol for the samples No. 1 and 10 and the
developing protocol for the samples No. 2, 5, 6, 11, 13 and 14. It is worth noting, that, although the sample No. 13
is not well represented in the plane (1, 2), it lies close to the samples synthesized with the same mixing protocol.
Samples with large grain and aggregate size, low open porosity and lower release properties appear in the left side
of Fig. 6b) since these characteristics imply a negative coordinate on Dim 1. These are the samples No. 3, 4, 7, 8,
9 and 12. The samples No. 3 and 12, having physicochemical properties close to the PARRNe sample group but
better RF values, have a greater coordinate on Dim 1. The sample No. 7 differs from No. 8 and 9 by an important
proportion of pores with 3 µm diameter and higher RF values for Sr and Ba. This results in a positive coordinate
on Dim 2 for the sample No. 7 and a negative one for No. 8 and 9.
In the PCA framework, qualitative variables, considered as supplementary variables, can be connected to the
principal components by representing, in the factorial planes, the gravity centres of the individuals having the same
modality. Figure 7 shows the representation obtained in the first principal plane for the qualitative variables
“carbon source”, “mixing protocol”, “uranium source”, “12 days heating”, “C/U (for DP and CNT samples)” and
“C/U (all samples)”. The modalities of the variables “mixing protocol”, “uranium source” and “carbon source” are
well separated in the plane (1, 2), they differ therefore significantly on one or both dimensions defining this plane.
On the contrary, the overlap between the two modalities of the “12-day heating” variable is maximum, which
means that these two modalities are not significantly different; the physicochemical properties as well as the release
ones are not changed by long-term heating.
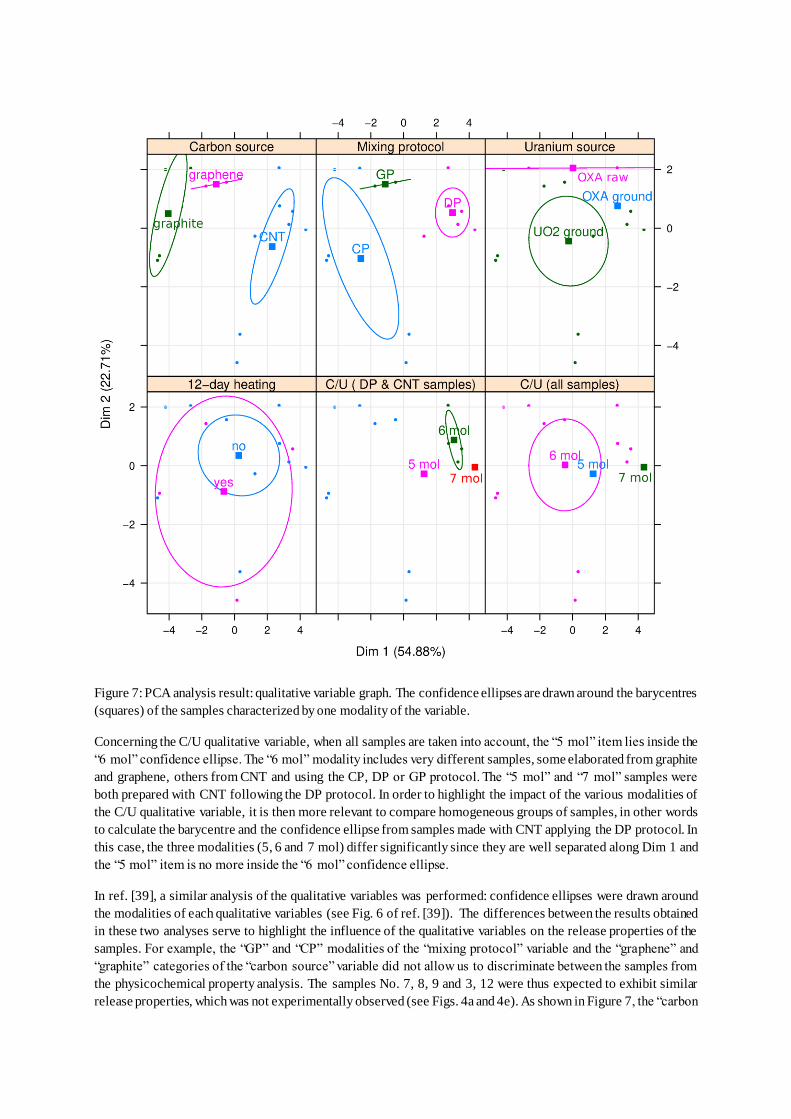
Figure 7: PCA analysis result: qualitative variable graph. The confidence ellipses are drawn around the barycentres
(squares) of the samples characterized by one modality of the variable.
Concerning the C/U qualitative variable, when all samples are taken into account, the “5 mol” item lies inside the
“6 mol” confidence ellipse. The “6 mol” modality includes very different samples, some elaborated from graphite
and graphene, others from CNT and using the CP, DP or GP protocol. The “5 mol” and “7 mol” samples were
both prepared with CNT following the DP protocol. In order to highlight the impact of the various modalities of
the C/U qualitative variable, it is then more relevant to compare homogeneous groups of samples, in other words
to calculate the barycentre and the confidence ellipse from samples made with CNT applying the DP protocol. In
this case, the three modalities (5, 6 and 7 mol) differ significantly since they are well separated along Dim 1 and
the “5 mol” item is no more inside the “6 mol” confidence ellipse.
In ref. [39], a similar analysis of the qualitative variables was performed: confidence ellipses were drawn around
the modalities of each qualitative variables (see Fig. 6 of ref. [39]). The differences between the results obtained
in these two analyses serve to highlight the influence of the qualitative variables on the release properties of the
samples. For example, the “GP” and “CP” modalities of the “mixing protocol” variable and the “graphene” and
“graphite” categories of the “carbon source” variable did not allow us to discriminate between the samples from
the physicochemical property analysis. The samples No. 7, 8, 9 and 3, 12 were thus expected to exhibit similar
release properties, which was not experimentally observed (see Figs. 4a and 4e). As shown in Figure 7, the “carbon
source” and “mixing protocol” variables impact the release properties since the centres of gravity of the “GP” and
“CP” modalities on the one hand and of “graphite” and “graphene” on the other hand have different coordinates
on the axis strongly correlated to the release properties (Dim 1). Similarly, the difference between the "OXA raw"
and "OXA ground" modalities of the "uranium source" variable is much more pronounced when not only the
physicochemical properties of the samples but also their release properties are taken into account.
In conclusion, the PCA allowed us to demonstrate that the sample release ability, whatever the considered element,
is highly correlated, through the first principal component, to some physicochemical properties of the samples.
The samples that best release fission products consist of grains and aggregates with small size and they display a
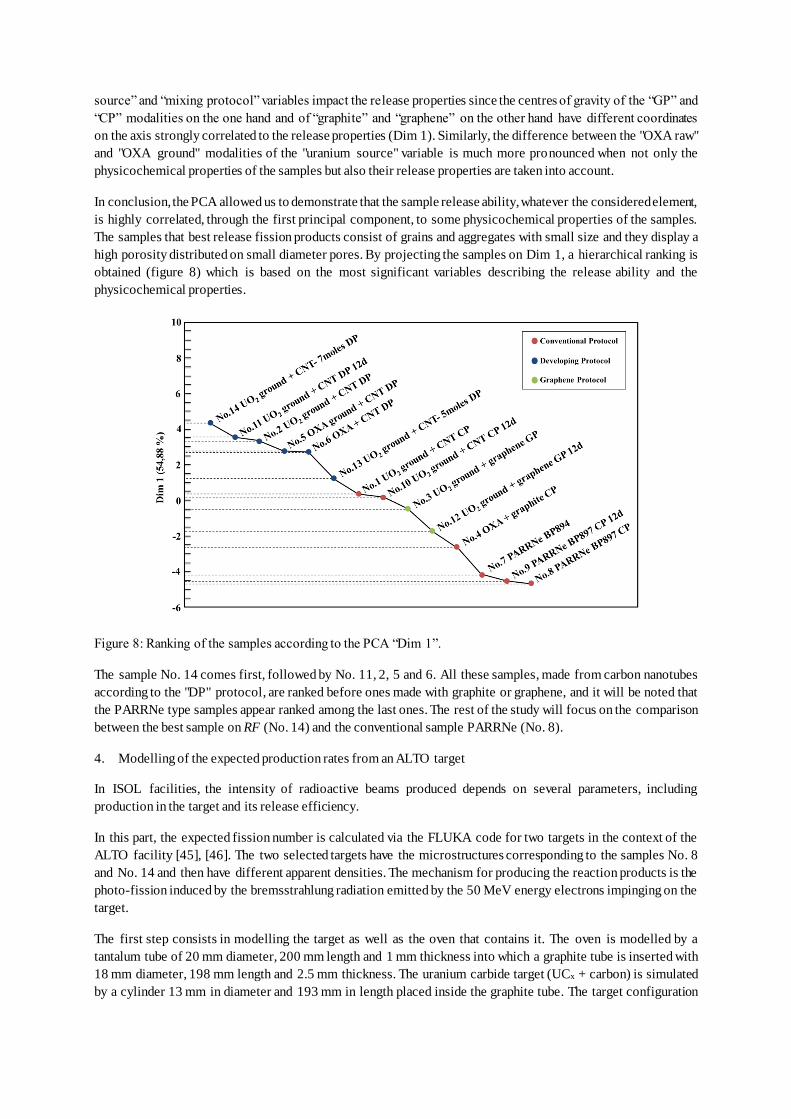
high porosity distributed on small diameter pores. By projecting the samples on Dim 1, a hierarchical ranking is
obtained (figure 8) which is based on the most significant variables describing the release ability and the
physicochemical properties.
Figure 8: Ranking of the samples according to the PCA “Dim 1”.
The sample No. 14 comes first, followed by No. 11, 2, 5 and 6. All these samples, made from carbon nanotubes
according to the "DP" protocol, are ranked before ones made with graphite or graphene, and it will be noted that
the PARRNe type samples appear ranked among the last ones. The rest of the study will focus on the comparison
between the best sample on RF (No. 14) and the conventional sample PARRNe (No. 8).
4. Modelling of the expected production rates from an ALTO target
In ISOL facilities, the intensity of radioactive beams produced depends on several parameters, including
production in the target and its release efficiency.
In this part, the expected fission number is calculated via the FLUKA code for two targets in the context of the
ALTO facility [45], [46]. The two selected targets have the microstructures corresponding to the samples No. 8
and No. 14 and then have different apparent densities. The mechanism for producing the reaction products is the
photo-fission induced by the bremsstrahlung radiation emitted by the 50 MeV energy electrons impinging on the
target.
The first step consists in modelling the target as well as the oven that contains it. The oven is modelled by a
tantalum tube of 20 mm diameter, 200 mm length and 1 mm thickness into which a graphite tube is inserted with
18 mm diameter, 198 mm length and 2.5 mm thickness. The uranium carbide target (UCx + carbon) is simulated
by a cylinder 13 mm in diameter and 193 mm in length placed inside the graphite tube. The target configuration
in pellets was not taken into account because it does not affect the production of the fission products but only their
release.
In the simulation, the electron beam moves along the z axis and its origin is set arbitrarily 10 mm upstream of the
uranium carbide target. Its diameter is 1 cm and its angular distribution is a Gaussian function with 0.3915 cm full
width at half maximum, in both x and y directions [47].
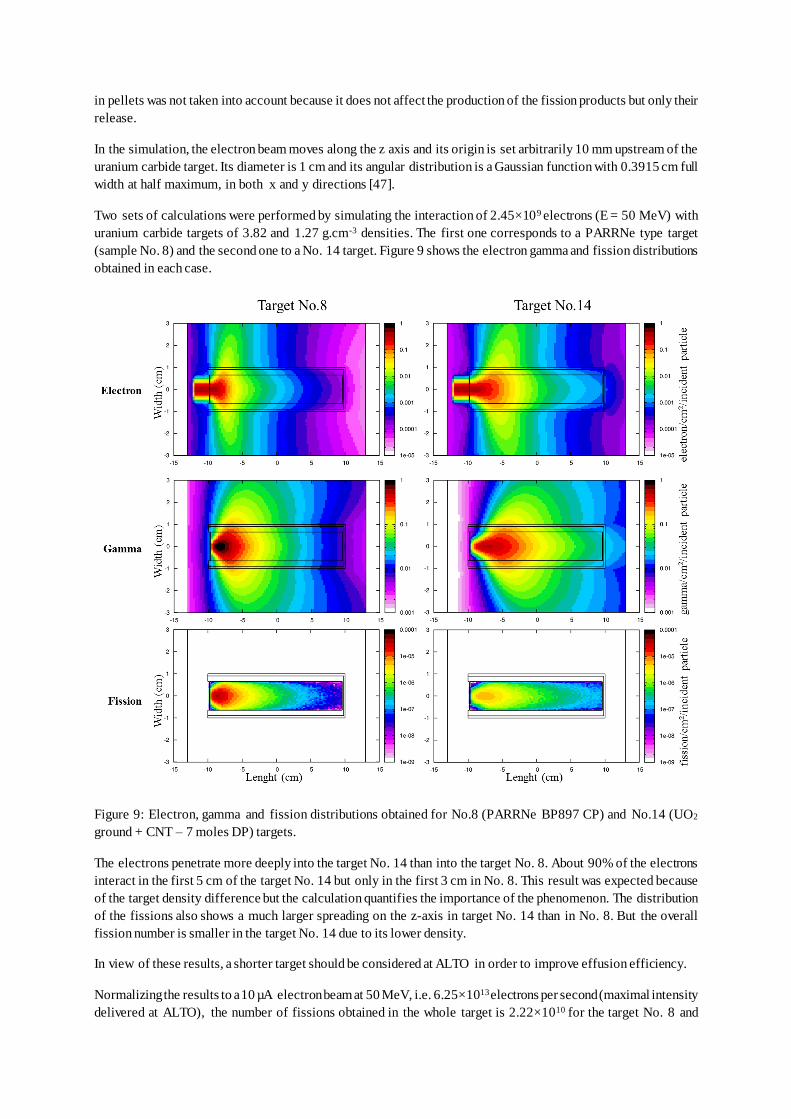
Two sets of calculations were performed by simulating the interaction of 2.45×10⁹ electrons (E = 50 MeV) with
uranium carbide targets of 3.82 and 1.27 g.cm-3 densities. The first one corresponds to a PARRNe type target
(sample No. 8) and the second one to a No. 14 target. Figure 9 shows the electron gamma and fission distributions
obtained in each case.
Figure 9: Electron, gamma and fission distributions obtained for No.8 (PARRNe BP897 CP) and No.14 (UO2
ground + CNT – 7 moles DP) targets.
The electrons penetrate more deeply into the target No. 14 than into the target No. 8. About 90% of the electrons
interact in the first 5 cm of the target No. 14 but only in the first 3 cm in No. 8. This result was expected because
of the target density difference but the calculation quantifies the importance of the phenomenon. The distribution
of the fissions also shows a much larger spreading on the z-axis in target No. 14 than in No. 8. But the overall
fission number is smaller in the target No. 14 due to its lower density.
In view of these results, a shorter target should be considered at ALTO in order to improve effusion efficiency.
Normalizing the results to a 10 µA electron beam at 50 MeV, i.e. 6.25×10¹³ electrons per second (maximal intensity
delivered at ALTO), the number of fissions obtained in the whole target is 2.22×10¹⁰ for the target No. 8 and
8.71×10⁹ for No 14. The ratio, 2.55, is lower than the value obtained from the densities of the two targets, which
is 3: the best penetration of the beam and the greatest spread of the fissions in the target No. 14 lead to a slight
compensation of the deficit expected from the difference in densities. However, in order to compare the
performance of both targets, it is important to combine two phenomena: production in the target and release of the
fission products.
The diffusion coefficients are extracted from the comparison of the released fractions measured during this work
and the values calculated using the formula describing the diffusion process in a cylinder. This formula was
obtained by extending the calculations made by Fujioka and Arai in the case of foils, fibers and particles [48].
Assuming isotropic and homogeneous diffusion, the motions along and perpendicular to the cylinder axis are
independent then the isotope fraction still remaining in the cylinder, labelled f(t), can be expressed by equation (1)
as:
𝑓(𝑡) = 𝑓(𝑡)𝑑𝑖𝑠𝑘 × 𝑓(𝑡)𝐿𝑒𝑛𝑔𝑡ℎ = 4 ∑𝑒𝑥𝑝(
−𝐽0,𝑘2 𝐷
𝑅2 𝑡ℎ)
𝐽0,𝑘2
∞𝑘=1 ×
8
𝜋2 ∑𝑒𝑥𝑝(
−𝜋2(2𝑚−1)2𝐷
𝐿2 𝑡ℎ)
(2𝑚−1)2∞𝑚=1 (1)
where f(t)disk and f(t)Length are the isotope fraction still remaining in a disk of radius R (cm) and in an interval of
length L (cm) (in other words the radius and thickness of the pellets). D (cm2.s-1) is the diffusion coefficient, th (s)
the heating time and J0,k the kth positive root of the zeroth order Bessel function of the first kind.
From equation (1), RF the fraction released by the cylinder during the heating time th is written as equation (2):
𝑅𝐹(𝑡ℎ) = 1 − 𝑓(𝑡) = 1 −32
𝜋2∑
𝑒𝑥𝑝(−𝐷𝑡ℎ(𝐽0,𝑘
2
𝑅2 +𝜋2(2𝑚−1)2
𝐿2 ))
𝐽0,𝑘2 (2𝑚−1)2
∞𝑘,𝑚=1 (2)
The release efficiency (εRF) of a given isotope of an element [49] can be expressed by equation (3):
𝜀𝑅𝐹(𝜆) = − ∫𝑑𝑓(𝑡)
𝑑𝑡× exp(−𝜆𝑡) 𝑑𝑡
∞
0=
32
𝜋2 ∑𝜋2(2𝑚−1)2
𝐿2 +𝐽0,𝑘
2
𝑅2
𝐽0,𝑘2 (2𝑚−1)2(𝜋2(2𝑚−1)2
𝐿2 +𝐽0,𝑘
2
𝑅2 +𝜆
𝐷)
∞𝑘,𝑚=1 (3)
with D, R, L, J0,k as defined above and λ (s-1) the radioactive decay constant of the isotope.
Finally, the production rates extracted from the target are related to the number of fissions generated in the target
and given by the FLUKA simulation (Nfission), the fission yield for the given isotope (Y) and the release efficiency
for this isotope εRF, according to equation (4):
𝜑 = 𝑁𝑓𝑖𝑠𝑠𝑖𝑜𝑛 × 𝑌 × 𝜀𝑅𝐹 (4)
Figure 10 illustrates the change in the released ratio between the targets No.14 and No.8 as a function of the isotope
half-life for the elements measured during the experiment at 1768 °C assuming pellets with 13 mm in diameter
and 1.7 mm in thickness.
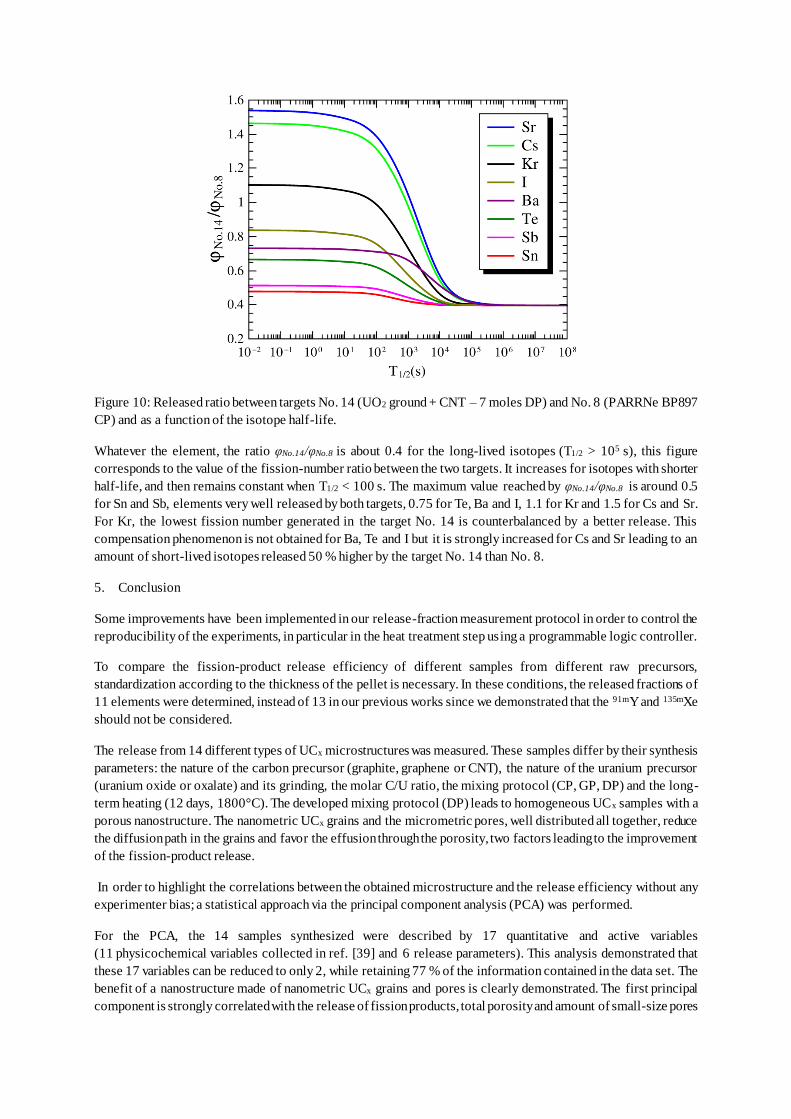
Figure 10: Released ratio between targets No. 14 (UO2 ground + CNT – 7 moles DP) and No. 8 (PARRNe BP897
CP) and as a function of the isotope half-life.
Whatever the element, the ratio φNo.14/φNo.8 is about 0.4 for the long-lived isotopes (T1/2 > 105 s), this figure
corresponds to the value of the fission-number ratio between the two targets. It increases for isotopes with shorter
half-life, and then remains constant when T1/2 < 100 s. The maximum value reached by φNo.14/φNo.8 is around 0.5
for Sn and Sb, elements very well released by both targets, 0.75 for Te, Ba and I, 1.1 for Kr and 1.5 for Cs and Sr.
For Kr, the lowest fission number generated in the target No. 14 is counterbalanced by a better release. This
compensation phenomenon is not obtained for Ba, Te and I but it is strongly increased for Cs and Sr leading to an
amount of short-lived isotopes released 50 % higher by the target No. 14 than No. 8.
5. Conclusion
Some improvements have been implemented in our release-fraction measurement protocol in order to control the
reproducibility of the experiments, in particular in the heat treatment step using a programmable logic controller.
To compare the fission-product release efficiency of different samples from different raw precursors,
standardization according to the thickness of the pellet is necessary. In these conditions, the released fractions of
11 elements were determined, instead of 13 in our previous works since we demonstrated that the 91mY and 135mXe
should not be considered.
The release from 14 different types of UCx microstructures was measured. These samples differ by their synthesis
parameters: the nature of the carbon precursor (graphite, graphene or CNT), the nature of the uranium precursor
(uranium oxide or oxalate) and its grinding, the molar C/U ratio, the mixing protocol (CP, GP, DP) and the long-
term heating (12 days, 1800°C). The developed mixing protocol (DP) leads to homogeneous UCx samples with a
porous nanostructure. The nanometric UCx grains and the micrometric pores, well distributed all together, reduce
the diffusion path in the grains and favor the effusion through the porosity, two factors leading to the improvement
of the fission-product release.
In order to highlight the correlations between the obtained microstructure and the release efficiency without any
experimenter bias; a statistical approach via the principal component analysis (PCA) was performed.
For the PCA, the 14 samples synthesized were described by 17 quantitative and active variables
(11 physicochemical variables collected in ref. [39] and 6 release parameters). This analysis demonstrated that
these 17 variables can be reduced to only 2, while retaining 77 % of the information contained in the data set. The
benefit of a nanostructure made of nanometric UCx grains and pores is clearly demonstrated. The first principal
component is strongly correlated with the release of fission products, total porosity and amount of small-size pores
as well as small-size grains. The second principal component is correlated to the Ba and Sr released fractions and
the quantity of pores of large size (3 and 30 μm).
The first principal component expressing 55 % of the total dataset inertia, a ranking was done by sorting the
samples according to their coordinate along this dimension. The best samples are made with carbon nanotubes
following the DP protocol where they were better than those made with graphite or graphene. It can be noted that
the PARRNe type samples appear ranked among the last ones. A study on OXA-based samples is still needed to
understand their particular behaviour.
A modelling of the on-line ALTO conditions was performed using the FLUKA code on the best target (No. 14)
and on a PARRNe one for comparison. The results showed that the less dense target (No. 14) allows deeper
penetration of the beam and therefore a larger distribution of fissions. Nevertheless, this new target has a
production rate three times lower than a conventional one. However, a better release for all elements was measured
experimentally, leading to a significant production gain for short-lived isotopes (T < 100 s) of Cs and Sr.
This study shows that there is no universal target material microstructure for the release of isotopes and that the
microstructure of the target must be adapted according to the elements to be released.
Acknowledgements
The authors would like to thank Ulli Köster, Pascal Jardin and Olivier Tougait for the ir comments and fruitful
discussions. We would like to thank the ALTO team for the help in the implementation of the experimental devices.
We would like to thank the NESTER, SPR and ALTO teams for advice and discussion on this project and
especially Abdelhakim Saïd, Thony Corbin, Christophe Planat, Robert Leplat, Christophe Vogel, Alain Semsoum,
Sébastien Wurth and David Verney for their help during the experiments.
References:
[1] L. Biasetto et al., ‘Developing uranium dicarbide–graphite porous materials for the SPES project’, J. Nucl. Mater., vol. 404, no. 1, pp. 68–76, Sep. 2010.
[2] B. Hy et al., ‘An off-line method to characterize the fission product release from uranium carbide-target prototypes
developed for SPIRAL2 project’, Nucl. Instrum. Methods Phys. Res. Sect. B Beam Interact. Mater. At. , vol. 288, pp. 34–41, Oct. 2012.
[3] S. Corradetti, M. Manzolaro, A. Andrighetto, P. Zanonato, and S. Tusseau-Nenez, ‘Thermal conductivity and emissivity measurements of uranium carbides’, Nucl. Instrum. Methods Phys. Res. Sect. B Beam Interact. Mater. At. , vol. 360, pp.
46–53, Oct. 2015. [4] S. Tusseau-Nenez et al., ‘Characterization of uranium carbide target materials to produce neutron-rich radioactive
beams’, Nucl. Instrum. Methods Phys. Res. Sect. B Beam Interact. Mater. At., vol. 370, pp. 19–31, Mar. 2016. [5] J. Guillot et al., ‘Study of uranium oxide milling in order to obtain nanostructured UCx target’, Nucl. Instrum. Methods
Phys. Res. Sect. B Beam Interact. Mater. At., vol. 374, pp. 116–120, May 2016.
[6] S. Carturan et al., ‘Synthesis and characterization of lanthanum dicarbide-carbon targets for radioactive ion beams generation via the carbothermal reaction’, Nucl. Instrum. Methods Phys. Res. Sect. Accel. Spectrometers Detect. Assoc. Equip., vol. 583, no. 2–3, pp. 256–263, Dec. 2007.
[7] L. Biasetto et al., ‘Lanthanum carbide-based porous materials from carburization of lanthanum oxide and lanthanum oxalate mixtures’, J. Nucl. Mater., vol. 378, no. 2, pp. 180–187, Aug. 2008.
[8] C. J. Orth, ‘Diffusion of Lanthanides and Actinides from Graphite at High Temperatures’, Nucl. Sci. Eng., vol. 9, no. 4, pp. 417–420, Apr. 1961.
[9] G. Rudstam, ‘The on-line mass separator OSIRIS and the study of short-lived fission products’, Nucl. Instrum. Methods, vol. 139, pp. 239–249, Dec. 1976.
[10] L. C. Carraz, I. R. Haldorsen, H. L. Ravn, M. Skarestad, and L. Westgaard, ‘Fast release of nuclear reaction products
from refractory matrices’, Nucl. Instrum. Methods, vol. 148, no. 2, pp. 217–230, Jan. 1978.
[11] L. C. Carraz, S. Sundell, H. L. Ravn, M. Skarestad, and L. Westgaard, ‘High-temperature carbide targets for fast on-line mass separation of alkali and noble gas elements’, Nucl. Instrum. Methods, vol. 158, pp. 69–80, Jan. 1979.
[12] V. Hanemaayer, P. Bricault, and M. Dombsky, ‘Composite ceramic targets for high power proton irradiation’, Nucl. Instrum. Methods Phys. Res. Sect. B Beam Interact. Mater. At., vol. 266, no. 19, pp. 4334–4337, Oct. 2008.
[13] M. Dombsky and V. Hanemaayer, ‘Method of forming composite ceramic targets’, US7682664B2, 23-Mar-2010. [14] D. W. Stracener, ‘Status of radioactive ion beams at the HRIBF’, Nucl. Instrum. Methods Phys. Res. Sect. B Beam
Interact. Mater. At., vol. 204, pp. 42–47, May 2003. [15] D. W. Stracener, G. D. Alton, R. L. Auble, J. R. Beene, P. E. Mueller, and J. C. Bilheux, ‘Targets used in the production
of radioactive ion beams at the HRIBF’, Nucl. Instrum. Methods Phys. Res. Sect. Accel. Spectrometers Detect. Assoc.
Equip., vol. 521, no. 1, pp. 126–135, Mar. 2004. [16] Y. Kawai, G. D. Alton, and J. C. Bilheux, ‘An inexpensive and fast method for infiltration coating of complex geometry
matrices for ISOL production target applications’, Nucl. Instrum. Methods Phys. Res. Sect. B-Beam Interact. Mater. At., vol. 241, no. 1–4, pp. 991–995, Dec. 2005.
[17] S. Corradetti et al., ‘Graphene derived lanthanum carbide targets for the SPES ISOL facility’, Ceram. Int. [18] L. Biasetto et al., ‘Morphological and functional effects of graphene on the synthesis of uranium carbide for isotopes
production targets’, Sci. Rep., vol. 8, no. 1, p. 8272, May 2018. [19] J. P. Ramos, A. M. R. Senos, T. Stora, C. M. Fernandes, and P. Bowen, ‘Development of a processing route for carbon
allotrope-based TiC porous nanocomposites’, J. Eur. Ceram. Soc. [20] J. P. Ramos, T. Stora, A. M. R. Senos, and P. Bowen, ‘Thermal stability of nanometric TiC-carbon composites: effects
of carbon allotropes and Zr milling impurities’, J. Eur. Ceram. Soc., vol. 38, no. 15, pp. 4882–4891, Dec. 2018. [21] L. Biasetto et al., ‘Fabrication of mesoporous and high specific surface area lanthanum carbide–carbon nanotube
composites’, J. Nucl. Mater., vol. 385, no. 3, pp. 582–590, Apr. 2009. [22] A. Gottberg, ‘Target materials for exotic ISOL beams’, Nucl. Instrum. Methods Phys. Res. Sect. B Beam Interact. Mater.
At., vol. 376, pp. 8–15, Jun. 2016. [23] H. L. Ravn et al., ‘Use of refractory oxides, carbides and borides as targets for on-line mass separation’, Nucl. Instrum.
Methods Phys. Res. Sect. B Beam Interact. Mater. At., vol. 26, no. 1–3, pp. 183–189, May 1987. [24] A. Kronenberg et al., ‘Yields of fission products from various uranium and thorium targets’, Nucl. Instrum. Methods
Phys. Res. Sect. B-Beam Interact. Mater. At., vol. 266, no. 19–20, pp. 4267–4270, Oct. 2008. [25] G. Lhersonneau et al., ‘Tests of high-density UC targets developed at Gatchina for neutron-rich radioactive-beam
facilities’, Nucl. Instrum. Methods Phys. Res. Sect. B-Beam Interact. Mater. At., vol. 266, no. 19–20, pp. 4326–4329, Oct. 2008.
[26] V. N. Panteleev et al., ‘Studies of uranium carbide targets of a high density’, Nucl. Instrum. Methods Phys. Res. Sect. B Beam Interact. Mater. At., vol. 266, no. 19–20, pp. 4247–4251, Oct. 2008.
[27] V. N. Panteleev et al., ‘Production of Cs and Fr isotopes from a high-density UC targets with different grain dimensions’, Eur. Phys. J. A, vol. 42, no. 3, pp. 495–501, Dec. 2009.
[28] L. Biasetto et al., ‘Gas permeability of lanthanum oxycarbide targets for the SPES project’, J. Nucl. Mater., vol. 440, no. 1–3, pp. 70–80, Sep. 2013.
[29] S. Corradetti, L. Biasetto, M. D. M. Innocentini, S. Carturan, P. Colombo, and A. Andrighetto, ‘Use of polymeric fibers to increase gas permeability of lanthanum carbide based targets for nuclear physics applications’, Ceram. Int., vol. 42, no. 15, pp. 17764–17772, Nov. 2016.
[30] S. Corradetti et al., ‘Effect of sacrificial fiber length on gas permeability of lanthanum carbide’, Ceram. Int., vol. 44,
no. 4, pp. 4483–4486, Mar. 2018.
[31] J. P. Ramos et al., ‘Intense 31–35Ar beams produced with a nanostructured CaO target at ISOLDE’, Nucl. Instrum. Methods Phys. Res. Sect. B Beam Interact. Mater. At., vol. 320, pp. 83–88, Feb. 2014.
[32] J. P. Ramos et al., ‘Target nanomaterials at CERN-ISOLDE: synthesis and release data’, Nucl. Instrum. Methods Phys. Res. Sect. B Beam Interact. Mater. At., vol. 376, pp. 81–85, Jun. 2016.
[33] M. Cervantes et al., ‘A NEW PRODUCTION PROCESS FOR UCx TARGETS FOR RADIOACTIVE ISOTOPE BEAMS AT TRIUMF’, presented at the 9th Int. Particle Accelerator Conf. (IPAC’18), Vancouver, BC, Canada, April
29-May 4, 2018, 2018, pp. 4990–4991. [34] H. Matzke, ‘Application of “channeling” techniques to fission gas release studies’, J. Nucl. Mater., vol. 30, no. 1–2, pp.
110–121, Apr. 1969. [35] J. P. Greene, A. Levand, J. Nolen, and T. Burtseva, ‘Uranium carbide fission target R&D for RIA - an update’, Nucl.
Phys. A, vol. 746, pp. 425C-428C, Dec. 2004.
[36] K. Forsberg and A. R. Massih, ‘Kinetics of fission product gas release during grain growth’, Model. Simul. Mater. Sci. Eng., vol. 15, no. 3, pp. 335–353, Apr. 2007.
[37] M. Golkovsky, V. Gubin, O. Alyakrinsky, and S. P. Bardakhanov, ‘About Carbides-made Nanoceramics Fission Target
for RIB Production’, presented at the EPAC, Genoa, Italy, 2008. [38] O. Alyakrinskiy, K. Gubin, P. Martyshkin, and L. Tecchio, ‘Influence of grain size and porosity on the release of
radioactive isotopes from target materials with high open porosity’, Nucl. Instrum. Methods Phys. Res. Sect. B Beam Interact. Mater. At., vol. 267, no. 15, pp. 2554–2558, Aug. 2009.
[39] J. Guillot, B. Roussière, S. Tusseau-Nenez, N. Barré-Boscher, F. Brisset, and S. Denis, ‘Development of radioactive beams at ALTO: Part 1. Physicochemical comparison of different types of UCx targets using a multivariate statistical approach’, Nucl. Instrum. Methods Phys. Res. Sect. B Beam Interact. Mater. At. , accepted.
[40] F. Le Guyadec, X. Génin, J. P. Bayle, O. Dugne, A. Duhart-Barone, and C. Ablitzer, ‘Pyrophoric behaviour of uranium
hydride and uranium powders’, J. Nucl. Mater., vol. 396, no. 2, pp. 294–302, Jan. 2010. [41] M. Wojdyr, ‘Fityk: a general-purpose peak fitting program’, J. Appl. Crystallogr., vol. 43, no. 5, pp. 1126–1128, Oct.
2010. [42] M. Dombsky, P. Bricault, P. Schmor, and M. Lane, ‘ISAC target operation with high proton currents’, Nucl. Instrum.
Methods Phys. Res. Sect. B Beam Interact. Mater. At., vol. 204, pp. 191–196, May 2003. [43] J. Guillot, B. Roussière, S. Tusseau-Nenez, N. Barré-Boscher, E. Borg, and J. Martin, ‘Influence of target thickness on
the release of radioactive atoms’, Nucl. Instrum. Methods Phys. Res. Sect. B Beam Interact. Mater. At. , vol. 394, pp. 153–155, Mar. 2017.
[44] F. Husson, S. Le, and J. Pagès, Exploratory Multivariate Analysis by Example Using R, Second Edition , 2nd ed. Boca
Raton: CRC Press, 2017. [45] T. T. Böhlen et al., ‘The FLUKA Code: Developments and Challenges for High Energy and Medical Applications’ ,
Nucl. Data Sheets, vol. 120, pp. 211–214, Jun. 2014.
[46] A. Ferrari et al., ‘FLUKA: a multi-particle transport code’, in Cern 2005-10 (2005), Infn/Tc 05/11, Slac-R-773. [47] M. Cheikh Mhamed et al., ‘RIB production by photofission in the framework of the ALTO project: First experimental
measurements and Monte-Carlo simulations’, Nucl. Instrum. Methods Phys. Res. Sect. B Beam Interact. Mater. At., vol. 266, no. 19, pp. 4092–4096, Oct. 2008.
[48] M. Fujioka and Y. Arai, ‘Diffusion of radioisotopes from solids in the form of foils, fibers and particles’, Nucl. Instrum. Methods Phys. Res., vol. 186, no. 1, pp. 409–412, Jul. 1981.
[49] R. Kirchner, ‘On the release and ionization efficiency of catcher-ion-source systems in isotope separation on-line’, Nucl. Instrum. Methods Phys. Res. Sect. B Beam Interact. Mater. At., vol. 70, no. 1, pp. 186–199, Aug. 1992.
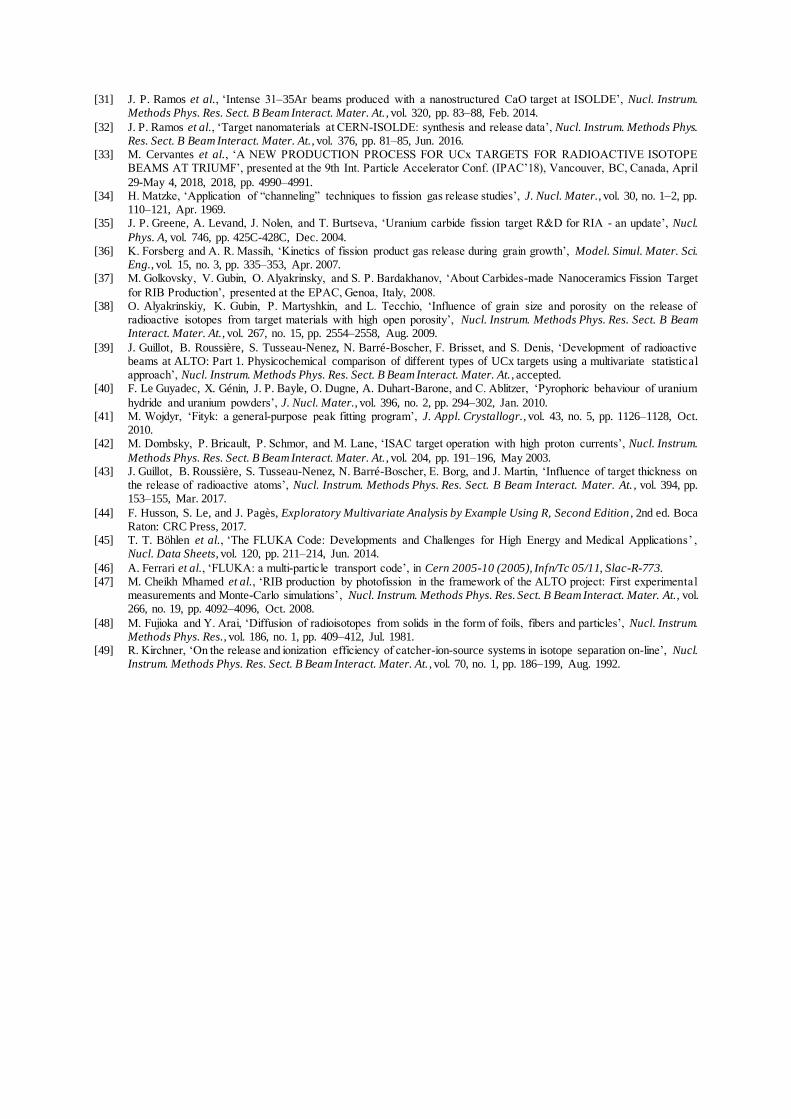
Complementary data [1]:
Table 1: Summary of the samples with the different qualitative variables used
Samples 12-day heating C/U Carbon source Uranium source Mixing protocol
No.1 UO2 ground + CNT CP no 6 CNT UO2 ground Conventional Protocol
No.2 UO2 ground + CNT DP no 6 CNT UO2 ground Developing Protocol
No.3 UO2 ground + graphene GP no 6 graphene UO2 ground Graphene Protocol
No.4 OXA + graphite CP no 6 graphite OXA Conventional Protocol
No.5 OXA ground + CNT DP no 6 CNT OXA ground Developing Protocol
No.6 OXA + CNT DP no 6 CNT OXA Developing Protocol
No.7 PARRNe BP894 no 6 graphite UO2 ground Conventional Protocol
No.8 PARRNe BP897 CP no 6 graphite UO2 ground Conventional Protocol
No.9 PARRNe BP897 CP 12d yes 6 graphite UO2 ground Conventional Protocol
No.10 UO2 ground + CNT CP 12d yes 6 CNT UO2 ground Conventional Protocol
No.11 UO2 ground + CNT DP 12d yes 6 CNT UO2 ground Developing Protocol
No.12 UO2 ground + graphene GP 12d yes 6 graphene UO2 ground Graphene Protocol
No.13 UO2 ground + CNT-5moles DP no 5 CNT UO2 ground Developing Protocol
No.14 UO2 ground + CNT-7moles DP no 7 CNT UO2 ground Developing Protocol
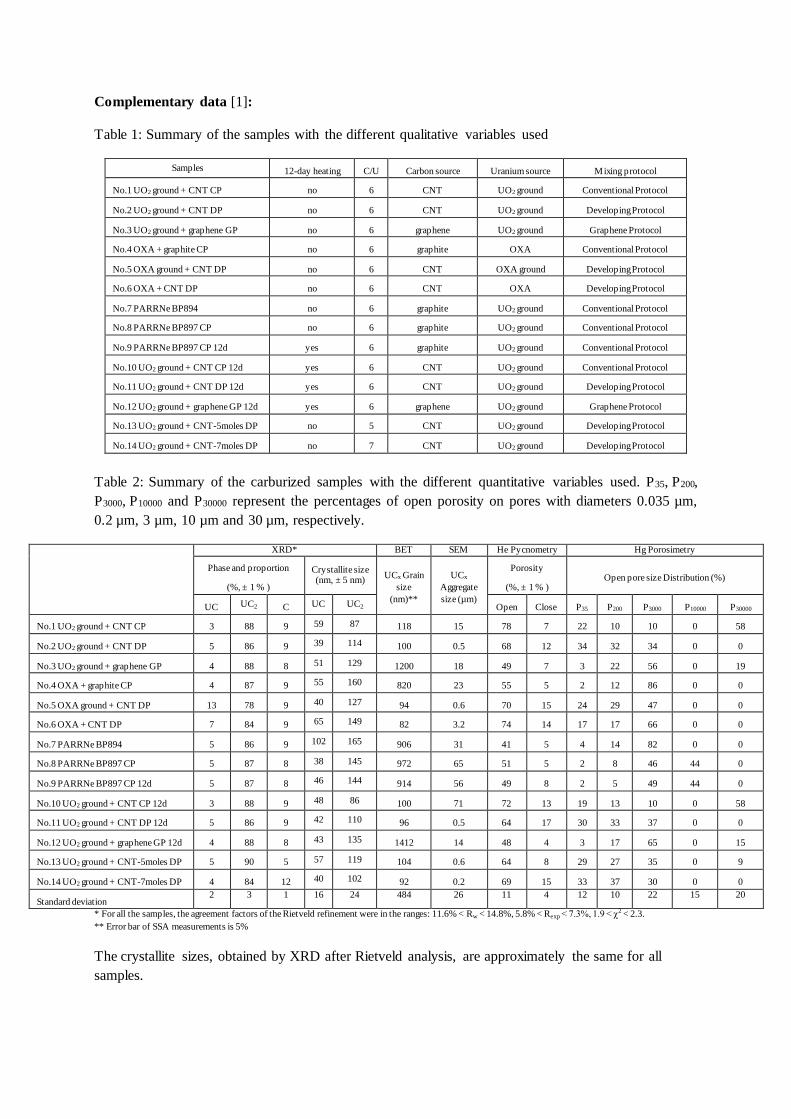
Table 2: Summary of the carburized samples with the different quantitative variables used. P35, P200,
P3000, P10000 and P30000 represent the percentages of open porosity on pores with diameters 0.035 µm,
0.2 µm, 3 µm, 10 µm and 30 µm, respectively.
XRD* BET SEM He Pycnometry Hg Porosimetry
Phase and proportion
(%, ± 1 % ) Crystallite size (nm, ± 5 nm)
UCx Grain
size
(nm)**
UCx
Aggregate
size (µm)
Porosity
(%, ± 1 % ) Open pore size Distribution (%)
UC UC2 C UC UC2 Open Close P35 P200 P3000 P10000 P30000
No.1 UO2 ground + CNT CP 3 88 9 59 87 118 15 78 7 22 10 10 0 58
No.2 UO2 ground + CNT DP 5 86 9 39 114 100 0.5 68 12 34 32 34 0 0
No.3 UO2 ground + graphene GP 4 88 8 51 129 1200 18 49 7 3 22 56 0 19
No.4 OXA + graphite CP 4 87 9 55 160 820 23 55 5 2 12 86 0 0
No.5 OXA ground + CNT DP 13 78 9 40 127 94 0.6 70 15 24 29 47 0 0
No.6 OXA + CNT DP 7 84 9 65 149 82 3.2 74 14 17 17 66 0 0
No.7 PARRNe BP894 5 86 9 102 165 906 31 41 5 4 14 82 0 0
No.8 PARRNe BP897 CP 5 87 8 38 145 972 65 51 5 2 8 46 44 0
No.9 PARRNe BP897 CP 12d 5 87 8 46 144 914 56 49 8 2 5 49 44 0
No.10 UO2 ground + CNT CP 12d 3 88 9 48 86 100 71 72 13 19 13 10 0 58
No.11 UO2 ground + CNT DP 12d 5 86 9 42 110 96 0.5 64 17 30 33 37 0 0
No.12 UO2 ground + graphene GP 12d 4 88 8 43 135 1412 14 48 4 3 17 65 0 15
No.13 UO2 ground + CNT-5moles DP 5 90 5 57 119 104 0.6 64 8 29 27 35 0 9
No.14 UO2 ground + CNT-7moles DP 4 84 12 40 102 92 0.2 69 15 33 37 30 0 0
Standard deviation 2 3 1 16 24 484 26 11 4 12 10 22 15 20
* For all the samples, the agreement factors of the Rietveld refinement were in the ranges: 11.6% < Rw < 14.8%, 5.8% < Rexp < 7.3%, 1.9 < χ2 < 2.3.
** Error bar of SSA measurements is 5%
The crystallite sizes, obtained by XRD after Rietveld analysis, are approximately the same for all
samples.

For the SSA analysis, the UCx grains cannot be considered as isolated (due to sintering leading to
aggregation even agglomeration of grains) contrary to what is assumed for a standard SSA analysis.
Moreover, a roughness of the grain surface increases its specific surface. These parameters could
overestimate the average size deduced [2]. The UCx grains were assumed spherical, the average size
was obtained taking into account the excess-carbon contribution as explained in Part 1.
Aggregate size estimation is more delicate and has been carried out using the intercept technique [3].
[1] J. Guillot, S. Tusseau-Nenez, B. Roussière, N. Barré-Boscher, F. Brisset, and S. Denis, ‘Development of radioactive beams at ALTO: Part 1. Physicochemical comparison of different types of UCx targets using a multivariate statistical approach’, Nucl. Instrum. Methods Phys. Res. Sect. B Beam Interact. Mater. At. , vol. 433, pp. 60–68, Oct. 2018.
[2] R. M. German, ‘A measure of the number of particles in agglomerates’, Int. J. Powder Metall., vol. 32, no. 4, pp. 365–373, 1996.
[3] H. Abrams, ‘Grain size measurement by the intercept method’, Metallography, vol. 4, no. 1, pp. 59–78, Feb. 1971.