national hazard exposure worker surveillance : wet work exposure and the provision of wet work...
TRANSCRIPT

This is the published version: Keegel,TessaG,Nixon,RosemaryLandLaMontagne,AnthonyD2011,Nationalhazardexposureworkersurveillance:wetworkexposureandtheprovisionofwetworkcontrolmeasuresinAustraliaworkplaces,SafeWorkAustralia,Canberra,ACT.
Available from Deakin Research Online: http://hdl.handle.net/10536/DRO/DU:30061221Reproducedwiththekindpermissionofthecopyrightowner.Copyright:2011,SafeWorkAustralia

NATIONAL HAZARD EXPOSURE WORKER SURVEILLANCE: WET WORK EXPOSURE AND THE PROVISION OF WET WORK CONTROL MEASURES IN AUSTRALIAN WORKPLACES
MARCH 2011
National Hazard Exposure Worker Surveillance – Exposure of hands and arms to wet work and the provision of wet work control measures in Australian workplaces
Acknowledgement This report was commissioned and developed by the Australian Safety and Compensation Council (ASCC), which is now known as Safe Work Australia. The survey was administered and data collected by Sweeney Research. The data analyses were undertaken and the report written by Dr Tessa Keegel, Monash Centre for Occupational and Environmental Health, Monash University, A/Professor Rosemary Nixon, Occupational Dermatology Research and Education Centre, the Skin and Cancer Foundation, Melbourne and A/Prof Anthony D LaMontagne, the McCaughey Centre, School of Population Health, University of Melbourne. This report has been peer reviewed by Dr Timothy Driscoll.
Disclaimer The information provided in this document can only assist you in the most general way. This document does not replace any statutory requirements under any relevant State and Territory legislation. Safe Work Australia is not liable for any loss resulting from any action taken or reliance made by you on the information or material contained on this document. Before relying on the material, users should carefully make their own assessment as to its accuracy, currency, completeness and relevance for their purposes, and should obtain any appropriate professional advice relevant to their particular circumstances. To the extent that the material on this document includes views or recommendations of third parties, such views or recommendations do not necessarily reflect the views of Safe Work Australia or indicate its commitment to a particular course of action.
Creative Commons With the exception of the Safe Work Australia logo, cover image and where otherwise noted, this report is licensed by Safe Work Australia under a Creative Commons 3.0 Australia Licence. To view a copy of this licence, visit http://creativecommons.org/licenses/by/3.0/au/deed.en In essence, you are free to copy, communicate and adapt the work, as long as you attribute the work to Safe Work Australia and abide by the other licensing terms. The report should be attributed as the National Hazard Exposure Worker Surveillance: Wet Work Exposure and the Provision of Wet Work Control Measures in Australian Workplaces. Enquiries regarding the licence and any use of the report are welcome at: Copyright Officer Communications, IT and Knowledge Management Safe Work Australia GPO Box 641 Canberra ACT 2601 Email: [email protected] ISBN 978 0 642 33166 3 [Online PDF] ISBN 978 0 642 33167 0 [Online RTF]
Wet work exposure and the provision of wet work control measures in Australian workplaces i
Foreword The Australian Safety and Compensation Council (ASCC) (now Safe Work Australia) requested the development and fielding of the National Hazard Exposure Worker Surveillance (NHEWS) survey to determine the current nature and extent of Australian workers’ exposure to selected occupational disease causing hazards. The survey also collected information from workers about the controls that were provided in workplaces to eliminate or reduce these hazards. The results of the NHEWS survey will be used to identify where workplace exposures exist that may contribute to the onset of one or more of the eight priority occupational diseases identified by the National Occupational Health and Safety Commission (NOHSC) in 2004. These diseases are; occupational cancer, respiratory diseases, noise-induced hearing loss, musculoskeletal disorders, mental disorders, cardiovascular disease, infectious and parasitic diseases and contact dermatitis.
The NHEWS survey was developed by the ASCC in collaboration with Australian OHS regulators and a panel of experts. These included Dr Tim Driscoll, Associate Professor Anthony LaMontagne, Associate Professor Wendy Macdonald, Dr Rosemary Nixon, Professor Malcolm Sim and Dr Warwick Williams. The NHEWS survey was the first national survey on exposure to workplace hazards in Australia.
In 2008, Sweeney Research was commissioned to conduct the NHEWS survey using computer assisted telephone interviews (CATI). The data, collected from 4500 workers, forms a national data set of occupational exposures across all Australian industries. The survey was conducted in two stages. The first stage (n=1900) focussed on the five national priority industries as determined by NOHSC in 2003 and 2005. These industries were selected to focus the work under the National Strategy 2002-2012 relating to reducing high incidence and high severity risks. The priority industries are Manufacturing, Transport and storage, Construction, Health and community services and Agriculture, forestry and fishing. The second stage (n = 2600) placed no restrictions on industry. An initial report on the results of the NHEWS survey can be found on the Safe Work Australia website. It contains a descriptive overview of the prevalence of exposure to the nine studied occupational hazards within industries and the provision of the various hazard control measures.
This report focuses on the exposure of Australian workers to wet work and the control measures that are provided in workplaces that eliminate, reduce or control worker exposure to wet work. The aims of this report are threefold. The first is to describe patterns of exposure to wet work in conjunction with patterns of wet work exposure control provision with respect to industry and other relevant demographic and employment variables. The second is to make recommendations, where possible, for the development of work health and safety and workers’ compensation policy. The final aim of this report is to provide researchers in this field with clear and constructive directions for future research.

Wet work exposure and the provision of wet work control measures in Australian workplaces ii

Wet work exposure and the provision of wet work control measures in Australian workplaces iii
Table of Contents Foreword ............................................................................................................................... i List of Figures .....................................................................................................................iv List of Tables .......................................................................................................................iv Summary .............................................................................................................................. 1
Main findings ..................................................................................................................... 2 Policy implications ............................................................................................................. 3 Further research ................................................................................................................ 3
Occupational wet-work: Background and research objectives ....................................... 5 Background ....................................................................................................................... 5 Wet work exposure ............................................................................................................ 6 Wet work exposure control measures ................................................................................ 7 Intervention studies addressing wet work exposures ......................................................... 8 Research objectives .......................................................................................................... 8
Overview of the survey methodology, data limitations and statistical analysis methodology ........................................................................................................................ 9 Results ................................................................................................................................10
Employment and demographic characteristics of Australian workers exposed to liquids in the workplace ...................................................................................................................10
1. Exposure to hand-washing in the workplace .........................................................10 2. Exposure to hands immersed in liquids in the workplace ......................................14
Wet work control measures provided in Australian workplaces .........................................19 Gloves ..........................................................................................................................21 Barrier creams and Moisturisers ...................................................................................23 Labelling and warning signs ..........................................................................................23 Time restriction .............................................................................................................23 Ongoing training and education about skin care ...........................................................24 No control measures .....................................................................................................24 ‘No controls’, and ‘other controls only’ compared to workplaces that have ‘time restriction’ as a control for wet work ..............................................................................26
Discussion ..........................................................................................................................28 Main findings ....................................................................................................................28
Wet work exposure .......................................................................................................28 Workplace provision of control measures .....................................................................28
Policy implications ............................................................................................................29 Recommendations for future research ..............................................................................30
Areas for further research .............................................................................................31 References ..........................................................................................................................33 Appendix 1. NHEWS survey methodology .......................................................................35
Survey design ...................................................................................................................35 Wet work exposure and control measure questions ..........................................................36 Chemical exposure and control measure questions ..........................................................36 Survey administration .......................................................................................................37 Duration of exposure: Hands immersed in liquids .............................................................37 Data Analyses ..................................................................................................................38
Appendix 2: Statistical tables ............................................................................................40

Wet work exposure and the provision of wet work control measures in Australian workplaces iv
List of Figures Figure 1. Exposure to wet work (hand washing) by industry ................................................ 11 Figure 2. Exposure to wet work (hands in liquids) by industry .............................................. 16 Figure 3. Annual incidence (± 95% confidence intervals) of hairdressers with a stated
occupational skin disease 1990-1999. From BMJ 2002; 324:1422-1423 (Dickel et al. 2002) - Used with permission ........................................................... 30
List of Tables Table 1. Exposure to wet work (hand washing) by demographic and workplace
variables ............................................................................................................... 11 Table 2. Summary of the results of a multivariate logistic regression model* examining
factors affecting the likelihood of reporting hand washing more than 20 times per day as opposed to washing hands 20 or fewer times per day ......................... 13
Table 3. Exposure to wet work (amount of time hands in liquid) by demographic and workplace variables .............................................................................................. 15
Table 4. Summary of the results of a multivariate logistic regression model*# examining factors affecting the likelihood of reporting the time spent with hands in liquids was more than two hours per day as opposed to reporting exposures two hours or less per day ..................................................................... 17
Table 5. The main types of liquids workers reported they had their hands in: number and percentage of workers within industries .......................................................... 18
Table 6. Results (odds ratios and 95% confidence intervals) of multivariate logistic regression models# examining the provision of the following control measures: gloves, barrier creams and moisturisers, labeling and warning ............ 20
Table 7. The main types of gloves workers reported they were provided with: number and percentage of workers within industries .......................................................... 22
Table 8. Results (odds ratios and 95% confidence intervals) of multivariate logistic regression models# examining the provision of the following control measures: time restriction, training, no control measures ...................................... 25
Table 9. Results (relative risk ratios and 95% confidence intervals) of a multinomial logistic regression model examining the demographic and employment factors that affected the likelihood of reporting the provision of other controls only or no controls, as opposed to workplaces that provided restricted time or restricted time and other controls for wet work exposure ....................................... 27
Table 10. Results of a multivariate logistic regression examining the demographic and employment factors affecting the likelihood workers reported they washed their hands more than 20 times per day as opposed to 20 or fewer times per day ........................................................................................................................ 40
Table 11. Results of a multivariate logistic regression examining the demographic and employment factors affecting the likelihood workers reported their hands were in liquids more than two hours per day as opposed to two hours or less per day ........................................................................................................................ 41
Table 12. The number and percentage of workers provided with the following wet work control measures: Gloves, Barrier creams and moisturisers, Labelling and warning, and Training, in their workplaces by demographic and employment variables ............................................................................................................... 42

Wet work exposure and the provision of wet work control measures in Australian workplaces v
Table 13. The number and percentage of workers provided with the following wet work control measures: Time restriction, Other controls only, and No control measures, in their workplaces by demographic and employment variables........... 43
Table 14. The number and percentage of workers provided with the following wet work control measures: Gloves, Barrier creams and moisturisers, Labelling and warning, and Training, in their workplaces by industry .......................................... 44
Table 15. The number and percentage of workers provided with the following wet work control measures: Time restriction, Other controls only, and No control measures, in their workplaces by industry ............................................................. 44
Table 16. Results (relative risk ratios and 95% confidence intervals) of a multinomial logistic regression model#^ examining the factors affecting the likelihood of the provision of time restriction as a control measure as opposed to other controls and no controls ........................................................................................ 45

Wet work exposure and the provision of wet work control measures in Australian workplaces vi

Wet work exposure and the provision of wet work control measures in Australian workplaces 1
Summary The purpose of the National Hazard Exposure Worker Surveillance (NHEWS) Survey was to inform the development of prevention and control initiatives that will ultimately lead to a reduction in occupational disease. This report presents findings on self-reported skin exposure to hand-washing and time spent with the hands in liquids. Exposure of the hands to liquids, either through frequent hand washing or through immersion of the hands in liquids, is known as ‘wet work’. Previous studies have found duration of exposure to wet work and high frequency of hand washing to be associated with occupational contact dermatitis of the hands (Larson et al. 1997; Uter et al. 1999).
In an Australian study, occupational skin disease (which included occupational contact dermatitis) was the second most common work-related problem presenting to general practitioners (Hendrie and Driscoll 2003). Contact dermatitis is the most common occupational skin disease in westernised industrial countries (it represents approximately 90-95% of all occupational skin diseases) (Lushniak 1995). Contact dermatitis is a skin problem usually affecting the hands, although other sites may become involved later (Rietschel et al. 2002). There are two main types of contact dermatitis, irritant and allergic contact dermatitis. Irritant contact dermatitis is caused by acute exposure to strongly acidic or alkaline substances, or by the cumulative effect of ongoing exposure to substances such as soap and water. Allergic contact dermatitis is caused by sensitisers contacting the skin and eliciting a Type IV (delayed) immune response (Nixon et al. 2005).
According to the best available international evidence, immersion of the hands in liquids for more than two hours per shift and/or washing hands more than twenty times per shift are considered risk factors for occupational contact dermatitis of the hands (Larson et al. 1997; Uter et al. 1999). In Germany this evidence has led to the introduction of the Technical standards for hazardous substances: Skin damage from work in wet environments (BAuA German Federal Institute for Occupational Safety and Health 1996). In Australia, the Australian Safety and Compensation Council (ASCC) developed a set of guidelines for exposure to wet work: Guidance on the prevention of dermatitis caused by wet work (ASCC 2005).
This report provides a profile of the occupational and demographic characteristics of workers who reported wet work exposure, as well as the types of controls with which workers were provided. Through these descriptions, groups of workers at risk of high exposure can be identified, as well as whether these potentially exposed groups of workers are adequately protected. This information will enable the development of targeted work health and safety policy and practice interventions, most importantly for highly exposed groups that do not report commensurate exposure controls. It is hoped that these initiatives will ultimately lead to a reduction in occupational contact dermatitis.
Information was collected by the NHEWS survey in 2008 for the five National Priority Industries; Manufacturing, Construction, Agriculture, Forestry and fishing, Transport and storage and Health and community services in addition to the remaining ten industrial sectors. However, the numbers of workers surveyed in these latter industries were much smaller. All 15 industries are reported on in this study. Workers in a number of these industries with smaller sample sizes (such as Accommodation, cafes and restaurants) are known to be at high risk of exposure to wet work. Because of the underlying study sample it is important to note that the NHEWS survey cannot be considered to be population-based, and because of this has limited generalisability to the Australian working population. However, the industry-specific data should be representative. It is also important to note that wet work may also affect other parts of the body such as the feet and legs; exposure of parts of the body apart from hands and arms was outside the scope of the NHEWS survey. Another important consideration with the NHEWS survey is that the described exposure data is self-reported and as such may be affected by the recall bias of the individual study

Wet work exposure and the provision of wet work control measures in Australian workplaces 2
participants. It was outside the scope of the NHEWS survey to perform objective exposure assessment.
The main findings as well as the policy implications of these findings and suggestions for further research are summarised below:
Main findings 1. There were two separate outcomes for wet work exposure: frequent washing of hands in
the workplace and duration of time spent at work with the hands immersed in liquids. For hand washing, overall 9.8% (95% Confidence Interval [95% CI]: 8.9-10.7%) of workers who participated in the NHEWS survey reported that they washed their hands more than 20 times per a typical day at work last week. For immersion of the hands in liquids, overall 7.3% (95% CI: 6.5-8.0%) of workers reported their hands immersed in liquids for more than one hour per day and 4.5% (95%CI: 3.9-5.1%) reported their hands immersed in liquids for more than two hours per day.
2. There were a number of factors that were associated with a higher risk of exposure to wet work.
• Female workers were more likely than male workers to report exposure to frequent hand washing, but there was no difference between males and females for immersion of the hands in liquids.
• The main industries where workers reported increased wet work exposure (both frequent hand washing and immersion of the hands in liquids) were Health and community services and Accommodation, cafes and restaurants.
• Workers in lower occupational skill level jobs were more likely to report increased exposure to hands immersed in liquids compared to higher-skilled workers.
• Workers reporting skin exposure to chemicals for an hour or more per day were much more likely to report exposure to wet work (both hand washing and immersion of the hands in liquids) compared to workers with no chemical exposure to the skin.
3. The most effective control (based on the hierarchy of controls) about which information was routinely collected in the NHEWS survey was restriction of the amount of time an individual was exposed to wet work. Only 32% of workers reported the provision of time restriction as a control in their workplace. In the Construction industry, 41% of workers reported time restriction. This contrasts with workers in Accommodation, cafes and restaurants and Health and community services, both industries with high exposures to wet work, where less than a third of workers reported time restriction. In Cultural, recreational and personal services, another highly exposed industry, only 21% of exposed workers reported time restriction as a control for wet work.
4. Ongoing training and education regarding exposure to wet work was another under-utilised resource, with only 43% of workers reporting the provision of ongoing training. There was little difference amongst those workers who reported high exposure, with 41% of highly exposed workers reporting ongoing training.
5. The most commonly provided control for exposure to wet work was gloves. In the NHEWS survey 75% of workers reported they were provided with gloves. Amongst workers in the Accommodation, cafes and restaurants industry, 94% of workers reported they were provided with gloves. For the Health and community services industry 88% reported they were provided with gloves. It must be noted however, that within these industrial sectors gloves are also routinely used as a method of food contamination prevention and infection control. Glove use is considered to be one of the least effective control measures, because gloves do not reduce the source of exposure and their effectiveness as control measures is dependent on supply of the appropriate gloves and

Wet work exposure and the provision of wet work control measures in Australian workplaces 3
correct usage by the worker. Therefore, it was positive to see that only 9% of workers reported glove provision as the sole control measure with which they were provided.
6. For workers in most industrial and workplace settings where there was a greater likelihood of exposure to wet work, there was also a greater likelihood of provision of control measures. This suggests that wet work hazards are generally recognised by employers and workers and are mitigated with at least some form of exposure control.
7. Of concern, however, there were some groups of workers who reported lower provision of controls. Workers in workplaces with fewer than 20 employees were twice as likely to report no provision of workplace controls. These workers were also less likely to be provided with a range of individual control measures: gloves, labelling and warning, barrier creams and moisturisers, and ongoing education about skin care.
Policy implications • Exposure to chemicals and exposure to liquids in the workplace were highly correlated in
the NHEWS sample, with workers reporting skin exposure to chemicals three times as likely to report higher rates of hand washing and four and a half times as likely to report exposure to immersion of the hands in liquids. These two exposures interact in the development of diseases such as allergic and irritant contact dermatitis. Contact with irritants, such as soap and water, are known to damage the barrier function of the skin and may lead to irritant contact dermatitis. Damage to the barrier function of the skin also facilitates the entry of allergens which may increase the risk of allergic contact dermatitis (Nixon et al. 2005). This co-occurrence of chemical exposure and wet work presents an opportunity for policy intervention to realise preventive synergies through integrated policy and practice interventions in industrial sectors and workplace settings where both exposures are high.
• Workers in particular industries were more likely to report exposure to wet work. These industries are Accommodation, cafes and restaurants and Health and Community services. Targeted policies and education packages are required to guide intervention on exposure to wet work within the specific workplace contexts of these high-risk industries.
• It appears that time restriction is under-utilised as a control for wet-work. Policy such as the German TRGS 531: Wet Work Technical Standard, (BAuA German Federal Institute for Occupational Safety and Health 1996) and the ASCC guidelines Guidance on the prevention of dermatitis caused by wet work (ASCC 2005) needs to be implemented for the Australian context.
• Workers in workplaces with fewer employees were more likely to report they were not provided with any controls in their workplaces. Policy suitable to the context of small businesses is urgently required.
Further research • Provision of gloves was the most commonly reported control measure, however within
the survey, questions regarding the type of glove provided were only asked of those who reported chemical exposure. It is difficult to judge if gloves, such as latex gloves, are being used appropriately. For example, it is inappropriate for individuals working in the food handling industry to use latex gloves, as the latex may contaminate food (Lee et al. 2001). Future studies should include questions for all workers on the types of gloves that are used in the workplace.
• Small and medium-sized businesses are unique environments that require specifically tailored interventions best developed in collaboration with the small and medium business sector. Future research might focus on the development of tailored

Wet work exposure and the provision of wet work control measures in Australian workplaces 4
interventions, which will be acceptable (and successful) within the small business context.
• Within the current NHEWS survey wet work exposure was restricted to the hands and arms. Further research might consider the effects of wet work exposure for other areas of the body, for example wet work exposure might affect the feet and legs for construction workers or for workers in the agriculture, fishing or mining industries.
• A number of the industries with high exposures for wet work were not National Priority Industries. In future surveys, a larger sample of workers from high risk industries such as Accommodation, cafes and restaurants and Cultural, recreational and personal services would provide a clearer indication of specific groups of workers, who may be at risk of exposure to wet work, thereby providing more complete information for effective policy intervention.
• Wet work is one of the main exposures for occupational contact dermatitis. Whilst this report provides details of industries and workplace settings where exposures to wet work are high, it does not provide information regarding settings with high rates of diagnosed occupational contact dermatitis, nor does it provide information regarding successful workers’ compensation claims for occupationally-induced dermatitis. Previous studies have found large discrepancies between the numbers of workers diagnosed with occupational contact dermatitis and successful workers’ compensation claims for occupationally-induced dermatitis (Rosen and Freeman 1992; Keegel et al. 2005; Keegel et al. 2007). Parallel studies to identify industries and workplace settings with elevated rates of diagnosed occupational contact dermatitis and compensated occupational dermatitis disease claims would confirm and extend the NHEWS Survey findings. Existing Australian data sources could be used for this purpose. Occupational dermatitis disease outcome data is collected by the NSW and Victorian Skin and Cancer Foundations (Rosen and Freeman 1992; Rosen and Freeman 1993; Williams et al. 2008), and national data regarding successful Australian workers’ compensation claims is collated by Safe Work Australia, (http://www.safeworkaustralia.gov.au/ ).
• International intervention studies carried out amongst workers at high risk of exposure to wet work, have found that the most effective interventions are those that make use of combined ‘top-down’ and ‘bottom-up’ strategies. The ‘top down’ components of these interventions address the implementation of management systems focusing on skin risk. This introduces official management obligation for continuous improvements in reducing work-related skin problems by identifying risk factors and implementing risk controls. The ‘bottom-up’ components of these interventions refers to the strategy of recruiting workers as ‘resource-persons’ who are then trained to identify risk factors and implement controls. These intervention studies are “based on the concept of empowerment … giving the participants a considerable understanding of the problem” (Mygind et al. 2006). Development and implementation of ‘top-down’ and ‘bottom-up’ intervention studies, suitable to the Australian context are an important research opportunity.

Wet work exposure and the provision of wet work control measures in Australian workplaces 5
Occupational wet work: background and research objectives
Background Contact dermatitis is the most common occupational skin disease in westernised industrial countries (approximately 90-95% of all occupational skin disease) (Lushniak 1995). Occupational skin disease, (which included occupational contact dermatitis) was the second most common work-related problem presenting to general practitioners in Australia (Hendrie and Driscoll 2003). Occupational contact dermatitis is a skin problem usually affecting the hands, although other sites may be affected or become involved later (Rietschel et al. 2002). There are two main types of contact dermatitis. Irritant contact dermatitis is caused by acute exposure to strongly acidic or alkaline substances, or by the cumulative effect of ongoing exposure to substances such as soap and water. Allergic contact dermatitis is caused by sensitisers contacting the skin and eliciting a Type IV (typically delayed, 4-24 hours following contact) immune response, and is detected by patch testing (Nixon et al. 2005). The “gold standard” for a diagnosis of occupational contact dermatitis includes assessment by an occupational dermatologist, using a specific set of diagnostic criteria (Mathias 1989), along with patch testing, and if required, radioallergosorbent (RAST) tests or prick testing.
There are many inconsistencies in the terminology utilised for occupational contact dermatitis. Some authors use the term "hand eczema" or "hand dermatitis" to encompass all skin conditions affecting the hands, whilst others prefer "hand eczema" for endogenous disease, and “hand dermatitis” for exogenous disease, some of which may be occupational in origin. The definition of occupational contact dermatitis may also vary, sometimes because of different legal requirements necessary for a successful workers' compensation claim.
Available statistics for occupational contact dermatitis are generally considered to underestimate disease prevalence and incidence (Rosen and Freeman 1992; Keegel et al. 2005; Keegel et al. 2007). There are many underlying reasons for this. Medical practitioners do not always ask about workplace exposures and thus do not recognise the contribution of the workplace to the disease (Holness 2004). Even if an occupational relationship is suspected, many workers affected by occupational contact dermatitis do not claim workers' compensation or even seek medical advice, and their access to both varies widely throughout the world. The relevant insurance body may not accept some claims even if the dermatitis does arise from work exposures. Meeting an expense threshold, or minimum period away from work, or the existence of permanent impairment may be required for a successful claim in some jurisdictions. Best international estimates of incidence and prevalence rates of occupational contact dermatitis, obtained from reporting schemes using medical practitioners as voluntary reporters range between 1.3 per 10 000 workers in the UK to 15 per 10 000 workers in the Netherlands (Keegel et al. 2009). An Australian reporting scheme using general practitioners and dermatologists as reporters found an incidence rate of 2.2 (95% CI, 1.3-3.2) per 10 000 workers and a one year period prevalence rate of 3.5 (95% CI, 2.4-4.8) per 10 000 workers (Keegel et al. 2005).
Contact dermatitis can have profound effects on workplace productivity and workplace costs (Burnett et al. 1998). Affected workers may require prolonged time off work and changes in workplace practices. Some workers may need to change their occupations (Rosen and Freeman 1993; Burnett et al. 1998). The worker may also accrue an ongoing financial burden as a result of treatment expenses (medical costs including topical corticosteroids) and preventative items (such as soap substitutes, and moisturisers), which the employer or compensation authority do not recompense. Occupational contact dermatitis impacts on domestic activities, can necessitate social restrictions and may have a detrimental psychological effect (Holness 2001).
Wet work exposure and the provision of wet work control measures in Australian workplaces 6
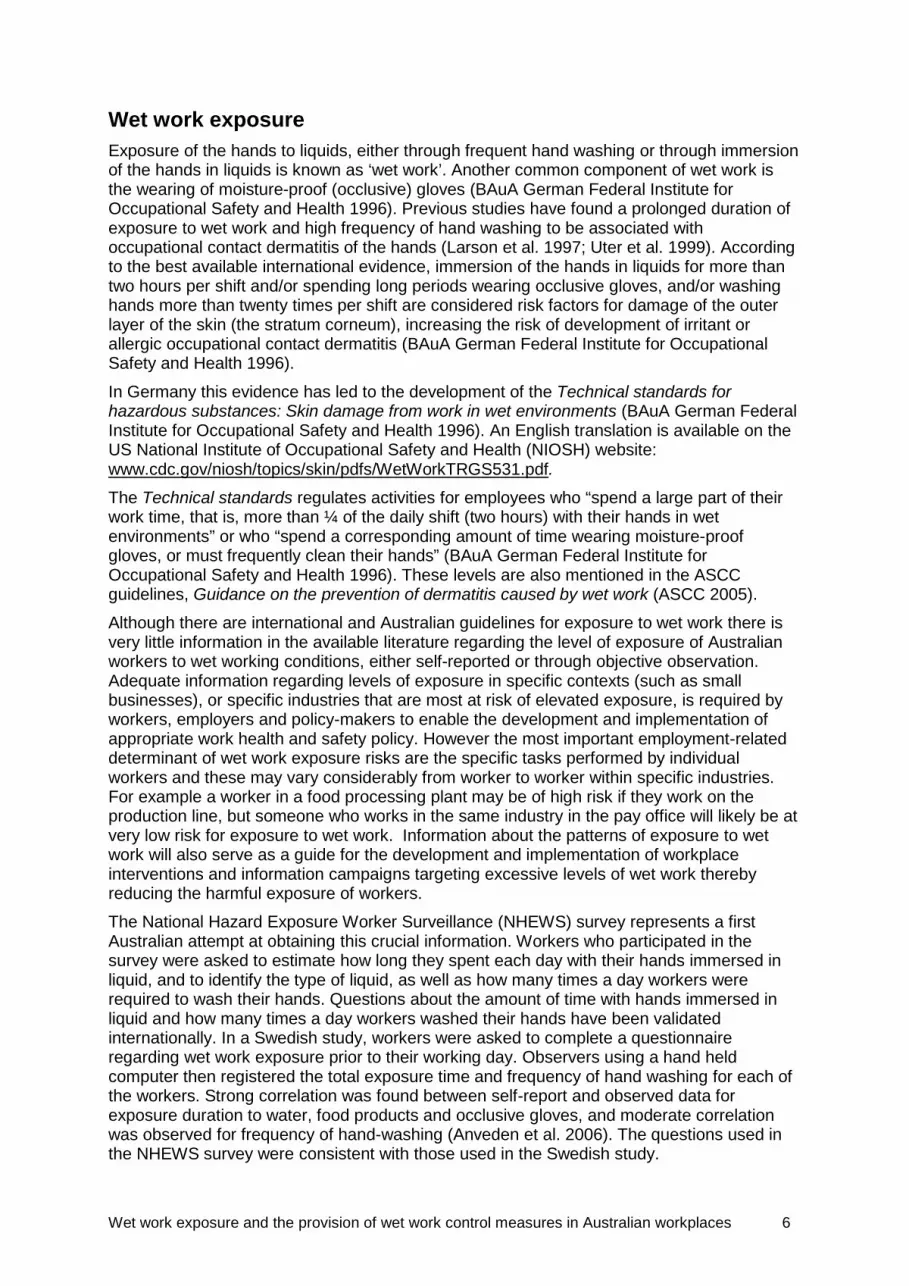
Wet work exposure Exposure of the hands to liquids, either through frequent hand washing or through immersion of the hands in liquids is known as ‘wet work’. Another common component of wet work is the wearing of moisture-proof (occlusive) gloves (BAuA German Federal Institute for Occupational Safety and Health 1996). Previous studies have found a prolonged duration of exposure to wet work and high frequency of hand washing to be associated with occupational contact dermatitis of the hands (Larson et al. 1997; Uter et al. 1999). According to the best available international evidence, immersion of the hands in liquids for more than two hours per shift and/or spending long periods wearing occlusive gloves, and/or washing hands more than twenty times per shift are considered risk factors for damage of the outer layer of the skin (the stratum corneum), increasing the risk of development of irritant or allergic occupational contact dermatitis (BAuA German Federal Institute for Occupational Safety and Health 1996).
In Germany this evidence has led to the development of the Technical standards for hazardous substances: Skin damage from work in wet environments (BAuA German Federal Institute for Occupational Safety and Health 1996). An English translation is available on the US National Institute of Occupational Safety and Health (NIOSH) website: www.cdc.gov/niosh/topics/skin/pdfs/WetWorkTRGS531.pdf.
The Technical standards regulates activities for employees who “spend a large part of their work time, that is, more than ¼ of the daily shift (two hours) with their hands in wet environments” or who “spend a corresponding amount of time wearing moisture-proof gloves, or must frequently clean their hands” (BAuA German Federal Institute for Occupational Safety and Health 1996). These levels are also mentioned in the ASCC guidelines, Guidance on the prevention of dermatitis caused by wet work (ASCC 2005).
Although there are international and Australian guidelines for exposure to wet work there is very little information in the available literature regarding the level of exposure of Australian workers to wet working conditions, either self-reported or through objective observation. Adequate information regarding levels of exposure in specific contexts (such as small businesses), or specific industries that are most at risk of elevated exposure, is required by workers, employers and policy-makers to enable the development and implementation of appropriate work health and safety policy. However the most important employment-related determinant of wet work exposure risks are the specific tasks performed by individual workers and these may vary considerably from worker to worker within specific industries. For example a worker in a food processing plant may be of high risk if they work on the production line, but someone who works in the same industry in the pay office will likely be at very low risk for exposure to wet work. Information about the patterns of exposure to wet work will also serve as a guide for the development and implementation of workplace interventions and information campaigns targeting excessive levels of wet work thereby reducing the harmful exposure of workers.
The National Hazard Exposure Worker Surveillance (NHEWS) survey represents a first Australian attempt at obtaining this crucial information. Workers who participated in the survey were asked to estimate how long they spent each day with their hands immersed in liquid, and to identify the type of liquid, as well as how many times a day workers were required to wash their hands. Questions about the amount of time with hands immersed in liquid and how many times a day workers washed their hands have been validated internationally. In a Swedish study, workers were asked to complete a questionnaire regarding wet work exposure prior to their working day. Observers using a hand held computer then registered the total exposure time and frequency of hand washing for each of the workers. Strong correlation was found between self-report and observed data for exposure duration to water, food products and occlusive gloves, and moderate correlation was observed for frequency of hand-washing (Anveden et al. 2006). The questions used in the NHEWS survey were consistent with those used in the Swedish study.

Wet work exposure and the provision of wet work control measures in Australian workplaces 7
Wet work exposure control measures There are many control measures that might potentially be utilised to reduce exposure to occupational wet work. It is recommended that employers follow the ‘hierarchy of controls’ when considering implementing steps to protect workers against wet work exposure. The hierarchy of controls provides a specific order for implementing controls to protect workers from occupational exposures. These are, in descending order: eliminate, substitute, isolate, engineer, work practices, administrative and personal protective equipment. The Skin Exposure recommendations on the US National Institute of Occupational Safety and Health website provide an explanation of the hierarchy of controls and examples of how the hierarchy might be applied to skin exposures: http://www.cdc.gov/niosh/topics/skin/recommendations.html. For an Australian perspective the ASCC’s Guidance on the prevention of dermatitis caused by wet work provides useful information: http://www.safeworkaustralia.gov.au/.
As specified in the ASCC publication on the prevention of dermatitis caused by wet work (ASCC 2005), the most effective prevention measures are those which aim to reduce at the source or preferably completely eliminate exposure to wet work caused by occupational processes. These include control measures, which for example eliminate the need for wet work processes entirely or provide engineering alternatives for wet work tasks, such as automated cleaning processes for machines. The next preferred set of control measures comprises those which change the way wet work tasks are carried out, i.e. changes to work practices. For example, implementation of ‘no-touch’ techniques for handling wet objects – such as the use of tongs, or baskets and crates to raise products out of liquids (ASCC 2005). Unfortunately, information about control measures that attempt to eliminate exposure, change the way wet work tasks are undertaken, or substitute for less irritating substances was not collected by the present NHEWS survey.
The introduction of administrative time restriction and task rotation control measures, are other wet work exposure controls. These controls arrange for wet work tasks to be distributed amongst a group of workers over time so that no one worker is excessively exposed. An example of this might be the distribution of a task such as hair washing amongst workers in a hairdressing salon, so that this duty is carried out by more than one worker.
Another control measure is the development and implementation of a workplace ‘skin protection plan’. A skin protection plan would include elements such as the workplace supply of mild hand cleansers, as well as the provision of after-work moisturisers and (if appropriate) suitable barrier creams (Kutting and Drexler 2003; Moyle et al. 2006; Weisshaar et al. 2007). The skin protection plan should be easily understandable and accessible to all employees. Warning signs should be visible to employees with potential exposure (ASCC 2005). The provision of ongoing education and training about the appropriate use of moisturisers and barrier creams is another important wet work control measure (Moyle et al. 2006). Available Australian education packages for workplace skin care include the Resources About Skin Health (RASH) education and training package (see http://www.rashprevention.com.au/). Relevant international education efforts include intensive residential education courses to facilitate the return-to-work of workers diagnosed with occupational skin disease (Weisshaar et al. 2007).
The least effective, but the most commonly utilised control measures are those which make use of personal protective equipment in the form of occlusive gloves. As discussed above, the wearing of occlusive gloves may be regarded in itself as a wet work exposure (BAuA German Federal Institute for Occupational Safety and Health 1996; ASCC 2005). If occlusive gloves are used for long periods it is recommended that thin cotton gloves are worn under the outer gloves to address the potential damage to the skin from excessive sweating (ASCC 2005).
Wet work exposure and the provision of wet work control measures in Australian workplaces 8
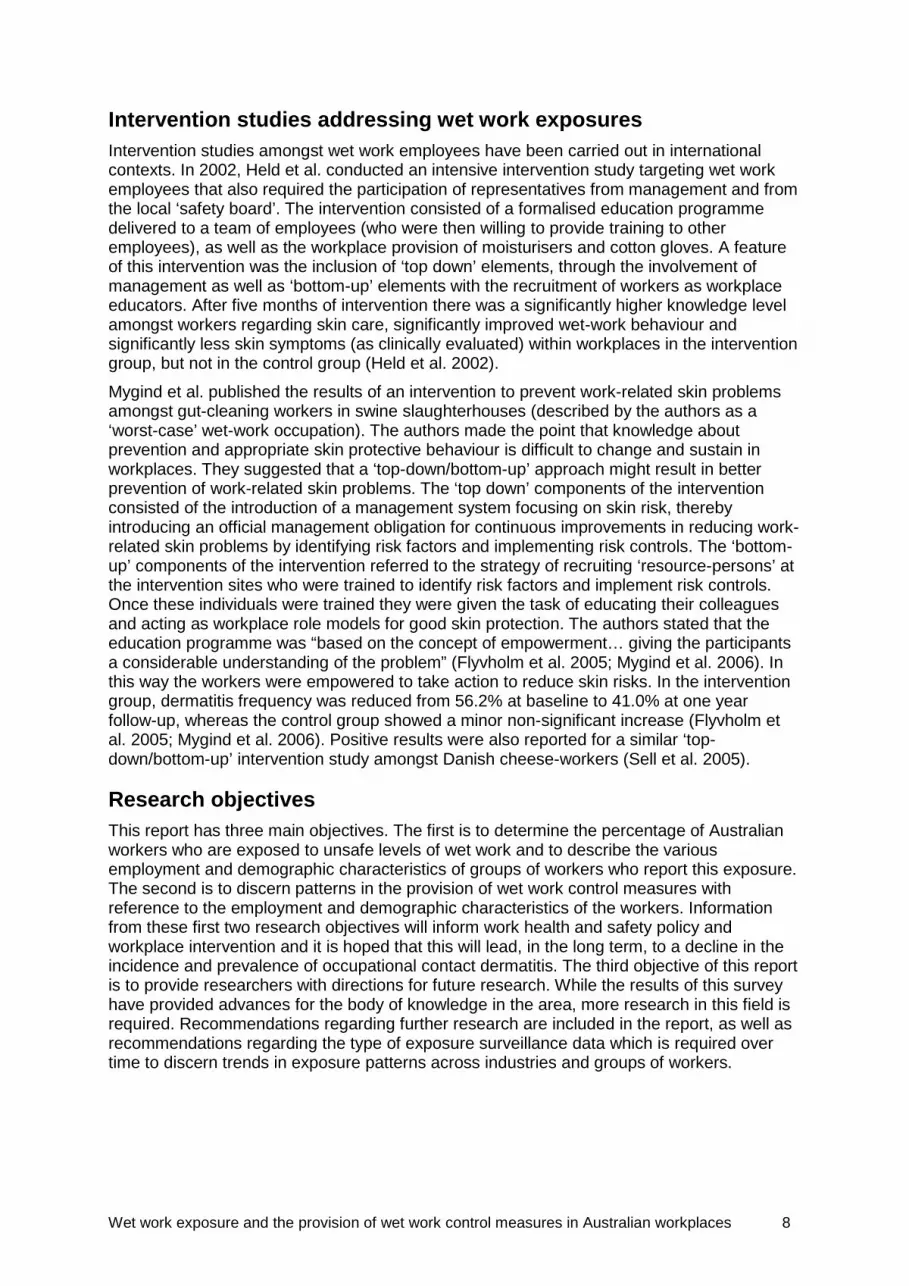
Intervention studies addressing wet work exposures Intervention studies amongst wet work employees have been carried out in international contexts. In 2002, Held et al. conducted an intensive intervention study targeting wet work employees that also required the participation of representatives from management and from the local ‘safety board’. The intervention consisted of a formalised education programme delivered to a team of employees (who were then willing to provide training to other employees), as well as the workplace provision of moisturisers and cotton gloves. A feature of this intervention was the inclusion of ‘top down’ elements, through the involvement of management as well as ‘bottom-up’ elements with the recruitment of workers as workplace educators. After five months of intervention there was a significantly higher knowledge level amongst workers regarding skin care, significantly improved wet-work behaviour and significantly less skin symptoms (as clinically evaluated) within workplaces in the intervention group, but not in the control group (Held et al. 2002).
Mygind et al. published the results of an intervention to prevent work-related skin problems amongst gut-cleaning workers in swine slaughterhouses (described by the authors as a ‘worst-case’ wet-work occupation). The authors made the point that knowledge about prevention and appropriate skin protective behaviour is difficult to change and sustain in workplaces. They suggested that a ‘top-down/bottom-up’ approach might result in better prevention of work-related skin problems. The ‘top down’ components of the intervention consisted of the introduction of a management system focusing on skin risk, thereby introducing an official management obligation for continuous improvements in reducing work-related skin problems by identifying risk factors and implementing risk controls. The ‘bottom-up’ components of the intervention referred to the strategy of recruiting ‘resource-persons’ at the intervention sites who were trained to identify risk factors and implement risk controls. Once these individuals were trained they were given the task of educating their colleagues and acting as workplace role models for good skin protection. The authors stated that the education programme was “based on the concept of empowerment… giving the participants a considerable understanding of the problem” (Flyvholm et al. 2005; Mygind et al. 2006). In this way the workers were empowered to take action to reduce skin risks. In the intervention group, dermatitis frequency was reduced from 56.2% at baseline to 41.0% at one year follow-up, whereas the control group showed a minor non-significant increase (Flyvholm et al. 2005; Mygind et al. 2006). Positive results were also reported for a similar ‘top-down/bottom-up’ intervention study amongst Danish cheese-workers (Sell et al. 2005).
Research objectives This report has three main objectives. The first is to determine the percentage of Australian workers who are exposed to unsafe levels of wet work and to describe the various employment and demographic characteristics of groups of workers who report this exposure. The second is to discern patterns in the provision of wet work control measures with reference to the employment and demographic characteristics of the workers. Information from these first two research objectives will inform work health and safety policy and workplace intervention and it is hoped that this will lead, in the long term, to a decline in the incidence and prevalence of occupational contact dermatitis. The third objective of this report is to provide researchers with directions for future research. While the results of this survey have provided advances for the body of knowledge in the area, more research in this field is required. Recommendations regarding further research are included in the report, as well as recommendations regarding the type of exposure surveillance data which is required over time to discern trends in exposure patterns across industries and groups of workers.

Wet work exposure and the provision of wet work control measures in Australian workplaces 9
Overview of the survey methodology, data limitations and statistical analysis methodology The NHEWS survey collected wet work exposure data from 4500 Australian workers using computer assisted telephone interviews (CATI). Survey participants were asked to estimate the duration (hours per day or hours per week) they were engaged in tasks with their hands immersed in liquids. Workers were asked to self-nominate liquids and these included a range of substances (details provided in Tables 5a and 5b). Workers were also asked to estimate the number of times per shift they were required to wash their hands. Workers who reported that they were exposed to wet work were asked about the various control measures provided in their workplaces to protect against exposure. The data collected by the NHEWS survey was self-reported and as such may be affected by the recall of the survey participants. It was outside the scope of the NHEWS survey to perform objective exposure assessment.
Information was collected by the NHEWS survey in 2008 for the five National Priority Industries; Manufacturing, Construction, Agriculture, Forestry and fishing, Transport and storage and Health and community services in addition to the remaining ten industrial sectors. However, the numbers of workers surveyed in these latter industries were much smaller. All 15 industries are reported on in this study. Workers in a number of these industries with smaller sample sizes (such as Accommodation, cafes and restaurants) are known to be at high risk of exposure to wet work. Because of the underlying study sample it is important to note that the NHEWS survey cannot be considered to be population-based, and because of this has limited generalisability to the Australian working population. However, the industry-specific data should be representative.
The exposure data collected in the NHEWS survey were stratified by variables including gender, categorical age group, occupational level, number of employees in the workplace and industrial sector. Percentages presented in this report were calculated for categories within each of these groups. Categorical variables were compared using chi-square tests. Significance was set at the 0.05 level. Multivariate and multinomial logistic regression analyses were used to identify determinants of exposure to wet work and (as separate models) workplace provision of wet work control measures.
Odds ratios and 95% confidence intervals are reported for the multivariate models and relative risk ratios are presented for the multinomial model. Multivariate logistic regression model fit was assessed using Hosmer-Lemeshow tests; all models presented had acceptable test statistics (>0.20). It was suspected that workers in industries who were exposed to chemicals in addition to wet work might have a different risk profile to workers in industries who were exposed to wet work without exposure to chemicals. Accordingly, all models were checked for interaction between chemical exposure and industry.
All analyses were completed using the STATA 10.1 statistical programme (Stata Corporation, College Station, TX). Full details of the survey design and data analysis methodology can be found in Appendix One of this report.

Wet work exposure and the provision of wet work control measures in Australian workplaces 10
Results This section provides an overview of the main results of the wet work component of the NHEWS survey. Detailed statistical information such as model output, test statistics and p-values are presented in Appendix Two.
Employment and demographic characteristics of Australian workers exposed to liquids in the workplace
1. Exposure to hand-washing in the workplace Information about occupational exposure to liquids was collected in two separate ways by the NHEWS survey. First, NHEWS survey participants were asked to report the number of times they washed their hands on a typical day at work over the past week, including when using the bathroom. Responses were recorded as the number of times hands were washed either with or without soap (ASCC 2005). Previous studies have found associations between high frequency hand-washing and occupational contact dermatitis of the hands (Larson et al. 1997; Uter et al. 1999). Washing hands more than twenty times per shift is considered as a risk factor for occupational contact dermatitis (BAuA German Federal Institute for Occupational Safety and Health 1996). This level is also used as an indicator of increase in risk in the ASCC publication Guidance on the prevention of dermatitis caused by wet work (ASCC 2005). Based upon these exposure assessment approaches, self-reported hand-washing from the NHEWS survey was categorised into the following groups:
• Unexposed/low exposure - workers who reported hand-washing less than or equal to twenty times per a typical day at work
• High exposure - workers who reported hand-washing more than twenty times per day, but less than 100 times per a typical day at work, and
• Very high exposure - workers who reported hand washing 100 times or more per a typical day at work.
Overall 9.8% (95% Confidence Interval [95% CI]: 8.9- 10.7%) of workers who participated in the NHEWS survey reported that they washed their hands more than 20 times per typical day at work in the week preceding the survey. There were 8.0% (95% CI: 7.1-8.8%) of workers in the ‘high’ exposure category (washing their hands more than twenty times, but less than 100), and 1.8%: (95% CI 1.4-2.2%) of workers in the ‘very high’ exposure category (washing their hands more than 100 times).
A greater percentage of women were exposed at higher levels than men. There were also significant differences relating to the number of workers in a workplace, with greater percentages of workers highly exposed in workplaces with larger numbers of employees, as well as differences by occupational skill level, with some higher percentages of exposed workers in the highest occupational skill level group (Table 1). These findings may be related to the large percentages of highly exposed workers in health and community services, presumably many of these working as health care professionals, such as nurses (in higher occupational skill level groups) located in hospitals, which are large workplaces (Figure 1). The proportion of workers exposed was not significantly related to the age of the worker or their employment arrangements (Table 1).
The industries with the highest percentages of workers reporting hand washing 100 times or more per typical day were Accommodation, cafes and restaurants (6.6%) and Health and community services (6.3%). When considering workers who reported hand-washing more than 20 times per day, but less than 100 times per day, the Health and community services industry recorded the highest percentage of exposed workers (23.8%), followed by Accommodation, cafes and restaurants (17.6%). The industry with the lowest self-reported

Wet work exposure and the provision of wet work control measures in Australian workplaces 11
exposure to hand-washing was Communication services. There were a number of industries where there were no workers who reported very high levels of hand washing (Figure 1). Table 1. Exposure to wet work (hand washing) by demographic and workplace variables Demographic and employment variables
Unexposed / low exposure
High exposure
Very high exposure p-value*
Gender (n=4500) Females – n (%) 1664 (83.8) 256 (12.9) 65 (3.3) <0.001 Males – n (%) 2394 (95.2) 103 (4.1) 18 (0.7) Age group (n=4464) 15-24 - n (%) 224 (89.6) 23 (9.2) 3 (1.2) 25-34 - n (%) 559 (89.15) 55 (8.8) 13 (2.1) 35-44 - n (%) 1038 (90.3) 88 (7.7) 23 (2.0) 45-54 - n (%) 1326 (90.7) 111 (7.6) 25 (1.7) 55+ - n (%) 883 (90.5) 77 (7.9) 16 (1.6) = 0.949 Occupational skill level (n=4337) Level one (highest) - n (%) 1352 (88.4) 134 (8.8) 43 (2.8) <0.001 Level two - n (%) 364 (88.1) 41 (9.9) 8 (1.9) Level three - n (%) 760 (94.65) 41 (5.1) 2 (0.25) Level four - n (%) 980 (88.4) 107 (9.65) 22 (2.0) Level five (lowest) - n (%) 449 (93.0) 28 (5.8) 6 (1.2) Employment arrangements (n=3627) Permanent - n (%) 2648 (89.5) 244 (8.25) 66 (2.2) = 0.327 Temp/casual - n (%) 472 (89.4) 48 (9.1) 8 (1.5) Fixed term - n (%) 128 (90.8) 13 (9.2) 0 (0) Number of employees at workplace (n=4472) Less than 5 - n (%) 913 (93.45) 54 (5.5) 10 (1.0) <0.001 5 to 19 - n (%) 886 (92.7) 59 (6.2) 11 (1.15) 20 to 199 - n (%) 1344 (88.9) 141 (9.3) 27 (1.8) 200 or more - n (%) 893 (86.95) 99 (9.6) 35 (3.4) *chi-square test
6.6
6.3
2.6
2.1
1.3
0.8
0.8
0.3
0.2
17.6
23.8
4.2
5.7
5.1
4.8
3.6
1.8
5.4
3.1
2.3
1.2
Accommodation, cafes & restaurants (91)
Health & community services (956)
Mining (38)
Cultural, recreational & personal services (95)
Agriculture, forestry & fishing (317)
Wholesale & retail trade (237)
Manufacturing (714)
Transport & storage (391)
Construction (655)
Electricity/gas/water supply (37)
Education (320)
Property & business services (262)
Government administration & defence (243)
Finance & insurance (94)
Communication services (50)
Exposure to wet work (hand-washing) by industry
Medium/HighVery high/Unsafe
Figure 1. Exposure to wet work (hand washing) by industry

Wet work exposure and the provision of wet work control measures in Australian workplaces 12
The results of the multivariate logistic regression model are presented in Table 2. For the categorical variable ‘Industry’, Transport and storage has been set as the reference category (the industry to which all other industries are compared in the models), for reasons explained in Appendix 1.
In the multivariate logistic regression model there were a number of factors that were found to be associated with survey participants reporting they were exposed to hand washing more than 20 times per typical day at work over the past week (Table 2). Table 2 presents a summary of results, with the full model and test statistics presented in Table 10 in Appendix Two.
One of the strongest associations was amongst workers who also reported exposure of their skin to chemicals (see Appendix One for question details regarding chemical exposure of the skin to chemicals in the NHEWS survey). These workers were more than three times as likely to report exposure to hand washing compared to workers who did not report chemical exposure. Two industries had statistically significantly increased odds of exposure compared to the reference industry of Transport and storage. Workers in Accommodation, cafes and restaurants and workers in Health and community services were both around six times as likely to report increased hand washing. The increased odds of exposure in workplaces with between 20 to 199 employees might be influenced by the number of workers in Health and community services working in hospitals, which are usually medium to large workplaces. Women were almost twice as likely to be exposed as men. Finally, there was no evidence of an interaction between industry and exposure to chemicals on the likelihood of reporting exposure to hand washing.

Wet work exposure and the provision of wet work control measures in Australian workplaces 13
Table 2. Summary of the results of a multivariate logistic regression model* examining factors affecting the likelihood of reporting hand washing more than 20 times per day as opposed to washing hands 20 or fewer times per day
Model factors
The odds of reporting hand washing more than 20 times per day (as opposed to 20 or fewer times per day) were…
… by a factor of Odds ratio (95% CI)
relative to the model factor reference category
Gender Males (ref) Females Increased 1.97 (1.49-2.61) Number of employees at workplace Less than 5 (ref) 5 to 19 20 to 199 Increased 1.49 (1.05-2.11) 200 or more Occupational skill level Level one (highest) (ref) Level two Level three Level four Level five (lowest) Decreased 0.58 (0.37-0.92) Exposure of the skin to chemicals No/low exposure (ref) High exposure Increased 3.68 (2.91-4.66) Industry Transport & storage (ref) Manufacturing Construction and Electricity, gas & water supply
Agriculture, forestry & fishing and Mining
Health & community services Increased 6.02 (3.38-10.70) Wholesale trade and Retail trade
Accommodation, cafes & restaurants Increased 5.70 (2.71-12.02)
Finance & insurance, Property & business services and Communication services
Government administration & defence
Education Cultural, recreational & personal services
* Results are only presented for categories with statistically significant differences. See Table 10, Appendix 2 for the full model and test statistics.

Wet work exposure and the provision of wet work control measures in Australian workplaces 14
2. Exposure to hands immersed in liquids in the workplace Workers participating in the NHEWS survey were also asked about the length of time they had their hands immersed in or covered by any liquid (including water) with or without gloves. Workers were asked “On a typical day at work last week, excluding time spent hand-washing, how long did you have your hands immersed in or covered by any liquid (including water) with or without gloves?” Workers provided answers to this question as time per day or time per week (ASCC 2005). The two measures of exposure were converted to a common scale: time per day. Details of the conversion process are provided in Appendix Two.
Previous studies have found associations between duration of exposure to liquids and occupational contact dermatitis of the hands (Larson et al. 1997; Uter et al. 1999). According to the best available international recommendations, immersion of the hands in liquids for more than two hours per day is considered a risk factor for occupational contact dermatitis (BAuA German Federal Institute for Occupational Safety and Health 1996).
This level is also provided in the ASCC publication Guidance on the prevention of dermatitis caused by wet work (ASCC 2005). Based on these recommendations, self-reported contact with liquids from the NHEWS survey was categorised into the following groups:
• Unexposed/low exposure - workers who reported contact with liquid one hour or less per day
• Medium exposure - workers who reported contact with liquid more than one hour, up to two hours per day, and
• High exposure - workers who reported contact with liquid more than two hours per day.
Overall, 7.3% (95% CI: 6.5-8.0%) of workers who participated in the NHEWS survey reported that they were exposed to liquids for more than an hour during the course of their work on a typical working day. There were 2.8% (95% CI: 2.3-3.2%) of workers in the medium exposure group and 4.5 % (95% CI: 3.9-5.1%) in the high exposure group. These exposure proportions are comparable with those from a Swedish population-based study which found that 16% of workers reported exposure to water for half an hour or more per day, and 7% of workers reported exposure to water for more than two hours per day (Anveden Berglind et al. 2009). Using information in the published results for the Swedish study, 95% confidence intervals can be generated for these point estimates – 16% (15.8-16.8%) for exposure of half an hour or more per day and 7% (6.7-7.4%) for more than two hours per day. These confidence intervals are similar to the confidence intervals from the NHEWS survey, indicating that the two studies have comparable proportions of workers with prolonged duration of exposure, particularly when comparing proportions of workers who reported exposure for more than two hours per day.
Similar to the descriptive results for hand washing, there were significantly higher percentages of women who worked with hands immersed in liquids in the workplace compared to men. This was also reported by the Swedish study (Anveden Berglind et al. 2009). There were also significant differences related to occupational skill level and employment arrangements, with the highest percentages of workers in the ‘high’ exposure category employed in the lowest occupational skill level grouping and employed in a ‘temporary or casual’ working arrangement. Similar to hand-washing, the amount of time working with hands in liquids was significantly related to chemical exposure, with higher levels of exposed workers in the groups also reporting exposure to chemicals (Table 3). There were no significant differences between workers based on number of employees in a workplace or on age. The results for age contrast with the Swedish study, which found higher percentages of young adults reporting exposure (Anveden Berglind et al. 2009).
Wet work exposure and the provision of wet work control measures in Australian workplaces 15
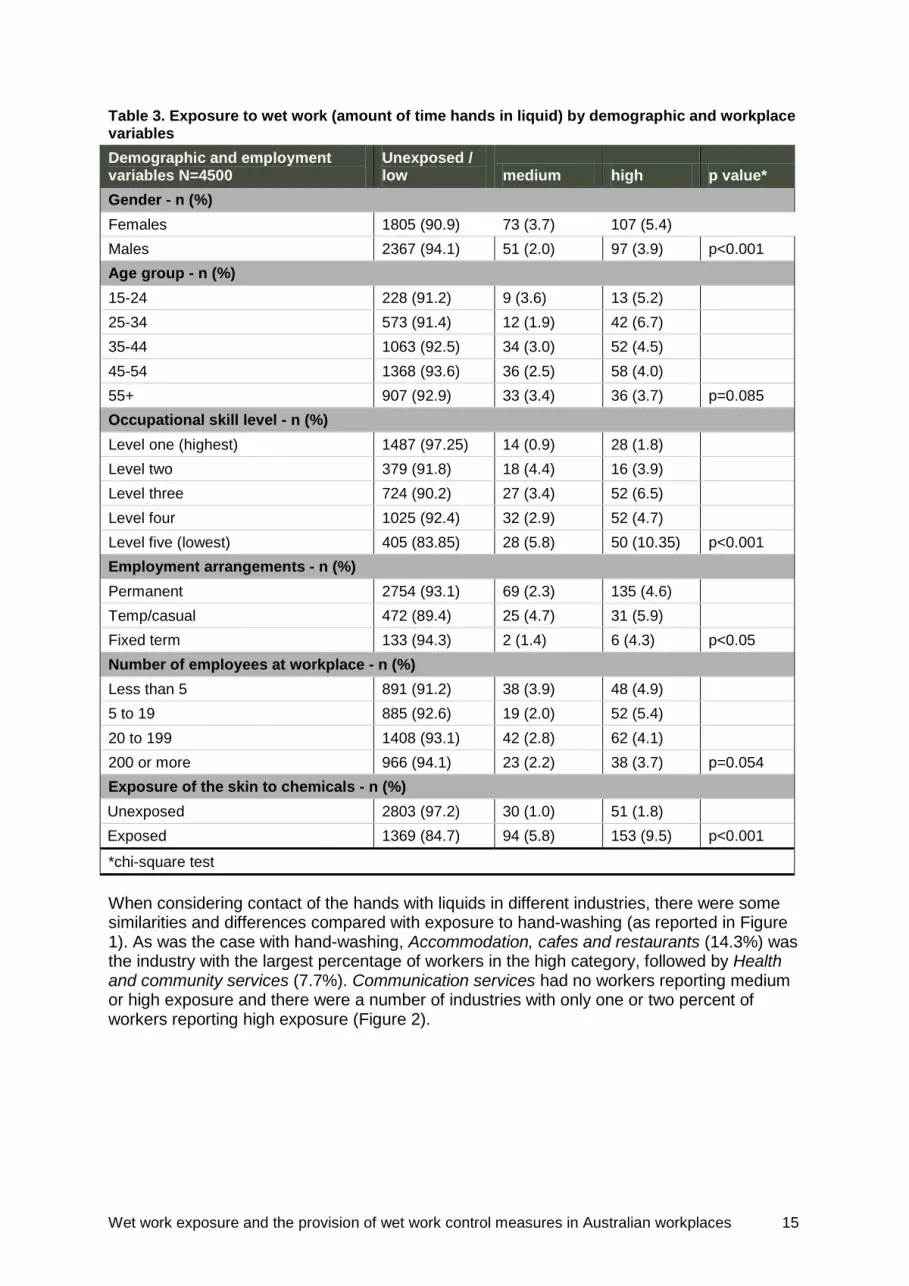
Table 3. Exposure to wet work (amount of time hands in liquid) by demographic and workplace variables Demographic and employment variables N=4500
Unexposed / low medium high p value*
Gender - n (%) Females 1805 (90.9) 73 (3.7) 107 (5.4) Males 2367 (94.1) 51 (2.0) 97 (3.9) p<0.001 Age group - n (%) 15-24 228 (91.2) 9 (3.6) 13 (5.2) 25-34 573 (91.4) 12 (1.9) 42 (6.7) 35-44 1063 (92.5) 34 (3.0) 52 (4.5) 45-54 1368 (93.6) 36 (2.5) 58 (4.0) 55+ 907 (92.9) 33 (3.4) 36 (3.7) p=0.085 Occupational skill level - n (%) Level one (highest) 1487 (97.25) 14 (0.9) 28 (1.8) Level two 379 (91.8) 18 (4.4) 16 (3.9) Level three 724 (90.2) 27 (3.4) 52 (6.5) Level four 1025 (92.4) 32 (2.9) 52 (4.7) Level five (lowest) 405 (83.85) 28 (5.8) 50 (10.35) p<0.001 Employment arrangements - n (%) Permanent 2754 (93.1) 69 (2.3) 135 (4.6) Temp/casual 472 (89.4) 25 (4.7) 31 (5.9) Fixed term 133 (94.3) 2 (1.4) 6 (4.3) p<0.05 Number of employees at workplace - n (%) Less than 5 891 (91.2) 38 (3.9) 48 (4.9) 5 to 19 885 (92.6) 19 (2.0) 52 (5.4) 20 to 199 1408 (93.1) 42 (2.8) 62 (4.1) 200 or more 966 (94.1) 23 (2.2) 38 (3.7) p=0.054 Exposure of the skin to chemicals - n (%) Unexposed 2803 (97.2) 30 (1.0) 51 (1.8) Exposed 1369 (84.7) 94 (5.8) 153 (9.5) p<0.001
*chi-square test When considering contact of the hands with liquids in different industries, there were some similarities and differences compared with exposure to hand-washing (as reported in Figure 1). As was the case with hand-washing, Accommodation, cafes and restaurants (14.3%) was the industry with the largest percentage of workers in the high category, followed by Health and community services (7.7%). Communication services had no workers reporting medium or high exposure and there were a number of industries with only one or two percent of workers reporting high exposure (Figure 2).

Wet work exposure and the provision of wet work control measures in Australian workplaces 16
Exposure to wet work (hands in liquids) by industry
14.3
7.7
6.3
5
4.9
4.1
3.1
2.7
2.6
2.3
2.1
1.2
1.2
1.1
9.9
4.5
7.4
3.5
2
2.3
1.3
5.3
2.7
2.5
0.9
0.8
0 2 4 6 8 10 12 14 16
Accommodation, cafes & restaurants (91)
Health & community services (956)
Cultural, recreational & personal services (95)
Agriculture, forestry & fishing (317)
Manufacturing (714)
Construction (655)
Transport & storage (391)
Electricity/gas/water supply (37)
Mining (38)
Property & business services (262)
Wholesale & retail trade (237)
Education (320)
Government administration & defence (243)
Finance & insurance (94)
Communication services (50)
% workers exposed to hands in liquids
MediumHigh
Figure 2. Exposure to wet work (hands in liquids) by industry
The results of the multivariate logistic regression model for the likelihood of reporting exposure to wet work (expressed as time spent in contact with liquids) are presented in Table 4. The model compares the group reporting less than or equal to two hours exposure (the reference group) to those reporting more than two hours exposure. Table 4 presents a summary of results, with the full models and test statistics presented as Table 11 in Appendix Two.
The model included all the variables that are shown in Table 4, and was also adjusted for gender. There were a number of factors that were found to be significantly associated with contact with liquids for more than two hours per day. There were strong associations by occupational skill level. Workers in Level Five, the lowest occupational skill level, were almost six and a half times as likely to be exposed more than two hours per day compared to workers in the highest occupational skill level. Workers in Level Three were four times as likely to be exposed. With respect to industry, Accommodation, cafes and restaurants and Health and community services had significantly increased odds of reporting exposure compared to the reference category of Transport and Storage.
Similar to the results for hand washing, workers who reported exposure of the skin to chemicals had increased odds of exposure compared to workers who did not report exposure to chemicals. These workers were four times more likely to be exposed to more than two hours of wet work per day. As discussed elsewhere in this report, the co-occurrence of chemical exposure and wet work presents an opportunity for policy intervention to realise preventive synergies through integrated policy and practice interventions in industrial sectors and workplace settings where both exposures are high. There was no evidence of interaction between industry and exposure to chemicals on the likelihood of reporting exposure to time spent with hands immersed in liquids.

Wet work exposure and the provision of wet work control measures in Australian workplaces 17
Table 4. Summary of the results of a multivariate logistic regression model*# examining factors affecting the likelihood of reporting the time spent with hands in liquids was more than two hours per day as opposed to reporting exposures two hours or less per day
Model factors
The odds of reporting time spent with the hands in liquids more than two
hours per day (as opposed to two hours or
less per day) were…
… by a factor of Odds ratio (95% CI) relative to the model
factor reference category
Occupational skill level Level one (highest) (ref) Level two Increased 2.03 (1.07-3.88) Level three Increased 4.07 (2.37-7.00) Level four Increased 2.40 (1.48-3.89) Level five (lowest) increased 6.41 (3.78-10.88) Exposure of the skin to chemicals No/low exposure (ref) High exposure Increased 4.09 (2.92-5.74) Industry Transport & storage (ref) Manufacturing Construction and Electricity, gas & water supply
Agriculture, forestry & fishing and Mining Health & community services Increased 2.92 (1.46-5.84) Wholesale trade and Retail trade Accommodation, cafes & restaurants Increased 2.97 (1.24-7.15) Finance & insurance, Property & business services and Communication services
Government administration & defence Education Cultural, recreational & personal services *Only statistically significant differences in odds are presented. # Model included all variables shown in the tables and was also adjusted for gender. See Table 11, Appendix Two for the full model and test statistics.
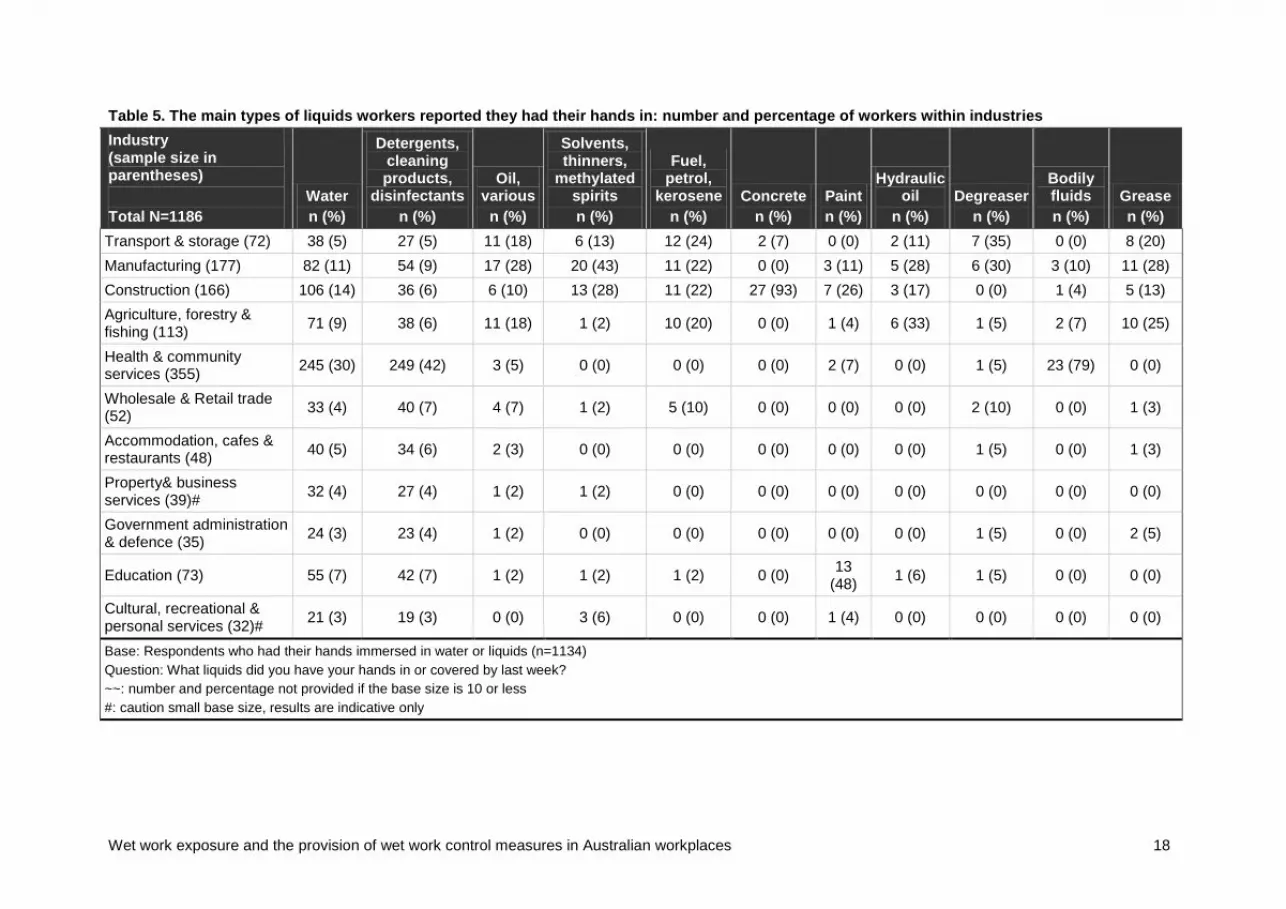
Workers were asked about the main types of liquids to which their hands were exposed in the previous week. These results provide some indication of the amount of overlap between wet work and exposure to chemicals, as many of the substances reported by exposed workers clearly might also be classified as ‘chemicals’. Respondents were permitted to supply more than one answer. Descriptive results for the types of liquids workers reported exposure to in each industry are presented in Table 5. When considering the information in this table it must be remembered that the five National Priority Industries had a much larger sample size than the rest of the industries. Therefore, this information is provided as an indication only. Results from industries where the number of respondents who were exposed was less than 10 are not shown.
Wet work exposure and the provision of wet work control measures in Australian workplaces 18
Table 5. The main types of liquids workers reported they had their hands in: number and percentage of workers within industries Industry (sample size in parentheses) Total N=1186
Water n (%)
Detergents, cleaning products,
disinfectants n (%)
Oil, various n (%)
Solvents, thinners,
methylated spirits n (%)
Fuel, petrol,
kerosene n (%)
Concrete n (%)
Paint n (%)
Hydraulic oil
n (%) Degreaser
n (%)
Bodily fluids n (%)
Grease n (%)
Transport & storage (72) 38 (5) 27 (5) 11 (18) 6 (13) 12 (24) 2 (7) 0 (0) 2 (11) 7 (35) 0 (0) 8 (20) Manufacturing (177) 82 (11) 54 (9) 17 (28) 20 (43) 11 (22) 0 (0) 3 (11) 5 (28) 6 (30) 3 (10) 11 (28) Construction (166) 106 (14) 36 (6) 6 (10) 13 (28) 11 (22) 27 (93) 7 (26) 3 (17) 0 (0) 1 (4) 5 (13) Agriculture, forestry & fishing (113) 71 (9) 38 (6) 11 (18) 1 (2) 10 (20) 0 (0) 1 (4) 6 (33) 1 (5) 2 (7) 10 (25)
Health & community services (355) 245 (30) 249 (42) 3 (5) 0 (0) 0 (0) 0 (0) 2 (7) 0 (0) 1 (5) 23 (79) 0 (0)
Wholesale & Retail trade (52) 33 (4) 40 (7) 4 (7) 1 (2) 5 (10) 0 (0) 0 (0) 0 (0) 2 (10) 0 (0) 1 (3)
Accommodation, cafes & restaurants (48) 40 (5) 34 (6) 2 (3) 0 (0) 0 (0) 0 (0) 0 (0) 0 (0) 1 (5) 0 (0) 1 (3)
Property& business services (39)# 32 (4) 27 (4) 1 (2) 1 (2) 0 (0) 0 (0) 0 (0) 0 (0) 0 (0) 0 (0) 0 (0)
Government administration & defence (35) 24 (3) 23 (4) 1 (2) 0 (0) 0 (0) 0 (0) 0 (0) 0 (0) 1 (5) 0 (0) 2 (5)
Education (73) 55 (7) 42 (7) 1 (2) 1 (2) 1 (2) 0 (0) 13 (48) 1 (6) 1 (5) 0 (0) 0 (0)
Cultural, recreational & personal services (32)# 21 (3) 19 (3) 0 (0) 3 (6) 0 (0) 0 (0) 1 (4) 0 (0) 0 (0) 0 (0) 0 (0)
Base: Respondents who had their hands immersed in water or liquids (n=1134) Question: What liquids did you have your hands in or covered by last week? ~~: number and percentage not provided if the base size is 10 or less #: caution small base size, results are indicative only

Wet work exposure and the provision of wet work control measures in Australian workplaces 19
The most commonly reported exposure was water, with 64% of those exposed to liquids reporting contact with water. Industries reporting the highest percentages of exposure to water were Health and Community Services (30%), followed by Construction (14%) and Manufacturing (11%). The industries with the highest percentage of exposure to detergents, cleaning products and disinfectants were Health and Community Services (42%), followed by Manufacturing (9%). Manufacturing was the industry with the highest percentages of exposed workers for a number of liquids, including oils (28%), solvents, thinners and methylated spirits (43%), hydraulic oil (28%), degreaser (30%) and grease (28%). Construction was the industry with the highest percentages of workers exposed to concrete (93%) and to paint (26%). Transport and storage was the industry with the highest percentage of workers exposed to fuel, petrol and kerosene (24%). Finally, the industry with the highest percentage of workers exposed to bodily fluids was Health and Community Services (79%).
Wet work control measures provided in Australian workplaces Workers participating in the NHEWS survey who reported any exposure to wet work were asked about the control measures that were provided in their workplaces. This question was restricted to those workers reporting any wet work exposure (n=1201, 27% of the total sample). When considering these results it must be remembered that the following data are from workplaces where wet work has not been eliminated. As a result there may be some under-estimation within the presented data of the full scope of wet work control measures utilised in Australian workplaces. For example, there may have been some workers participating in the survey who were employed in workplaces where engineering processes had isolated systems, thereby eliminating wet work as an exposure. Information about these most effective, source-focused controls was outside the scope of the NHEWS survey.
Survey participants who reported exposure to wet work were asked “Do you/does your employer do any of the following to prevent health problems caused by exposure to water or other liquids?”
Workers were then provided with the following list of choices for wet work control measures:
• Gloves
• Barrier cream
• Moisturiser
• Labelling or warning signs
• Limit the time you have your hands in water or other liquids, and
• Provide training.
The numbers and percentages of workers provided with the various control measures are presented in Table 12, Table 13, Table 14 and Table 15 in Appendix Two and are discussed by control type below.
Logistic regression models were run for each of the control measures to determine predictors for provision of the various workplace control measures. Model output is presented in Table 6 and Table 8.
Significant associations have been highlighted in the tables. Model diagnostics (Hosmer-Lemeshow goodness of fit tests) have been presented at the bottom of each separate model. All models showed acceptable fit. It was suspected that there might be differences for provision of control measures, by industry between workers who were and were not exposed to chemicals. An interaction term (for industry and chemical exposure) was fitted to the final models for each of the control measures. Significant interactions are reported.

Wet work exposure and the provision of wet work control measures in Australian workplaces 20
Table 6. Results (odds ratios and 95% confidence intervals) of multivariate logistic regression models# examining the provision of the following control measures: gloves, barrier creams and moisturisers, labeling and warning
Gloves Barrier creams &
moisturiser Labelling &
warning Age group 15-24 (ref) -- -- -- 25-34 1.49 (0.72-3.09) 1.61 (0.87-3.00) 0.80 (0.43-1.47) 35-44 1.65 (0.84-3.24) 2.23 (1.24-4.01)* 0.81 (0.46-1.44) 45-54 1.42 (0.74-2.75) 1.52 (0.85-2.70) 0.77 (0.44-1.35) 55+ 1.64 (0.80-3.36) 2.14 (1.15-3.98)* 0.87 (0.47-1.60) Employment arrangements Permanent -- -- -- Temp/casual 1.29 (0.77-2.15) 0.72 (0.48-1.08) 0.79 (0.53-1.16) Fixed term 1.09 (0.46- 2.60) 0.56 (0.26-1.20) 0.88 (0.43-1.80) Number of employees at workplace 200 or more (ref)
--
--
--
20 to 199 0.76 (0.45-1.27) 0.84 (0.57-1.25) 0.88 (0.60-1.30) 5 to 19 0.36 (0.21-0.62)* 0.44 (0.29-0.69)* 0.44 (0.29-0.67)* Less than 5 0.65 (0.32-1.32) 0.59 (0.34-1.01) 0.36 (0.21-0.61)* Industry** Transport & storage (ref) -- -- -- Manufacturing 2.29 (1.13-4.66)* 1.34 (0.72-2.51) 1.44 (0.77-2.70) Construction/Electricity, gas & water 1.40 (0.67-2.96) 0.85 (0.42-1.69) 1.18 (0.60-2.35) Agriculture, forestry & fishing/Mining 1.95 (0.81-4.70) 1.06 (0.49-2.30) 1.88 (0.85-4.13) Health & community services 5.27 (2.48-11.20)* 3.00 (1.56-5.77)* 2.13 (1.12-4.03)* Wholesale & retail trade 3.57 (1.21-10.56)* 1.05 (0.45-2.47) 1.94 (0.81-4.70) Accommodation, cafes & restaurants 11.90 (2.46-57.47)* 0.63 (0.26-1.52) 1.24 (0.53-2.92) Property & business services / communication services / Finance & Insurance
0.41 (0.15-1.08)
0.23 (0.81-0.68)*
0.39 (0.15-1.03)
Govt admin & defence 0.81 (0.31-2.16) 0.56 (0.22-1.42) 1.74 (0.67-4.53) Education 0.77 (0.33-1.82) 0.34 (0.15-0.79)* 0.71 (0.32-1.58) Cultural, recreational & personal services 1.35 (0.39-4.64) 0.45 (0.13-1.50) 1.52 (0.49-4.75) Exposure of the skin to wet work No/low exposure/ high exposure -- -- -- Very high/ unsafe exposure 1.21 (0.73-2.00) 0.82 (0.56-1.20) 0.94 (0.64-1.36) Exposure of the skin to chemicals No/low exposure -- -- -- Exposure 2.21 (1.53-3.20)* 1.16 (0.85-1.58) 1.32 (0.98-1.79) Observations Hosmer-Lemeshow goodness-of-fit
900 0.8275
900 0.4883
900 0.5359
*p<0.05 # Models were adjusted for gender and occupational skill level ** For the models the following industrial groupings have been combined: Construction and Electricity, gas and water supply Agriculture, forestry & fishing and Mining Property and business services, Communication services and Finance and Insurance

Wet work exposure and the provision of wet work control measures in Australian workplaces 21
Gloves Gloves were the most commonly provided control measure amongst workers participating in the NHEWS survey, with 75% of workers exposed to wet work reporting gloves were provided. Amongst workers reporting exposure to wet work in the Accommodation, cafes and restaurants industry, 94% of workers reported they were provided with gloves. For the Health and community services industry, 88% reported they were provided with gloves. However, it must also be noted that within these industrial sectors gloves are also routinely used as a method of food contamination prevention and infection control. The percentage of workers reporting provision of gloves decreased as workplace size decreased. Workplaces with less than five employees had the lowest percentage of any workplaces of workers reporting gloves were provided (65%).
Participants in the NHEWS survey were provided with many different types of gloves. Some of these are appropriate within specific industries but not others (e.g. latex gloves provide infection control but are generally considered inappropriate for food handlers since they may be handling food for customers with latex sensitivity (Lee et al. 2001)). Unfortunately, within the NHEWS survey the question about the type of glove provided was only asked for workers who separately reported exposure to chemicals. As previously stated, there was a strong correlation between wet work and exposure to chemicals in the NHEWS survey and accordingly the types of gloves provided to workers are presented in Table 7. The most commonly provided gloves were disposable latex gloves, with 41% of workers who answered the question regarding glove type reporting the use of disposable latex. Latex gloves are effective for infection control and, as expected, the industry with the highest percentage of workers reporting the provision of disposable latex gloves was Health and community services (Table 7). Other industries reporting high provision of disposable latex gloves were Accommodation, cafes and restaurants and Education. It is less clear whether use of disposable latex gloves was appropriate in these industries, particularly for Accommodation, Cafes and Restaurants where, as discussed above, the use of latex gloves may be unsafe if food becomes contaminated by latex. Other commonly provided gloves were rubber gloves (29%) and leather gloves (17%). There are recommendations that workers who regularly use occlusive gloves wear cotton gloves underneath their outer gloves to protect their hands against excessive sweating (ASCC 2005). The use of cotton gloves was reported by only 5% of the total sample and was mostly reported by workers in the Manufacturing industry (12% of Manufacturing workers) (Table 7).
The logistic regression model for provision of gloves as a control measure showed that there were a number of significant associations (Table 6). Workers reporting exposure of the skin to chemicals were twice as likely to report the provision of gloves as a control measure. There were also differences by industrial sector, with workers in the following industries more likely to report glove provision; Manufacturing (OR 2.29, 95% CI: 1.13-4.66), Health and community services (OR 5.27, 95% CI: 2.48-11.20), Wholesale and retail trade (OR 3.57, 95% CI: 1.21-10.56) and Accommodation, cafes and restaurants (OR 11.90, 95% CI: 2.46-57.47). The larger confidence intervals with some of these associations are because of the smaller sample sizes in the non-priority industries and these data should therefore be treated with caution. Workers in workplaces with between five and 19 workers were significantly less likely to report the provision of gloves as a control measure against wet work (OR 0.36, 95% CI: 0.21-0.62).
Finally, glove use is considered to be one of the least effective controls because use of gloves does not reduce the exposure to wet work at its source. As previously discussed, use of occlusive gloves for long periods is recognised as a possible risk factor for dermatitis (BAuA German Federal Institute for Occupational Safety and Health 1996; ASCC 2005). Another issue is that workers need to be supplied with appropriate gloves in the workplace and need to use these gloves correctly. Therefore, when the group was restricted to glove provision as the sole control measure, it was promising to see only 9% of exposed workers reported glove provision as their sole control measure.
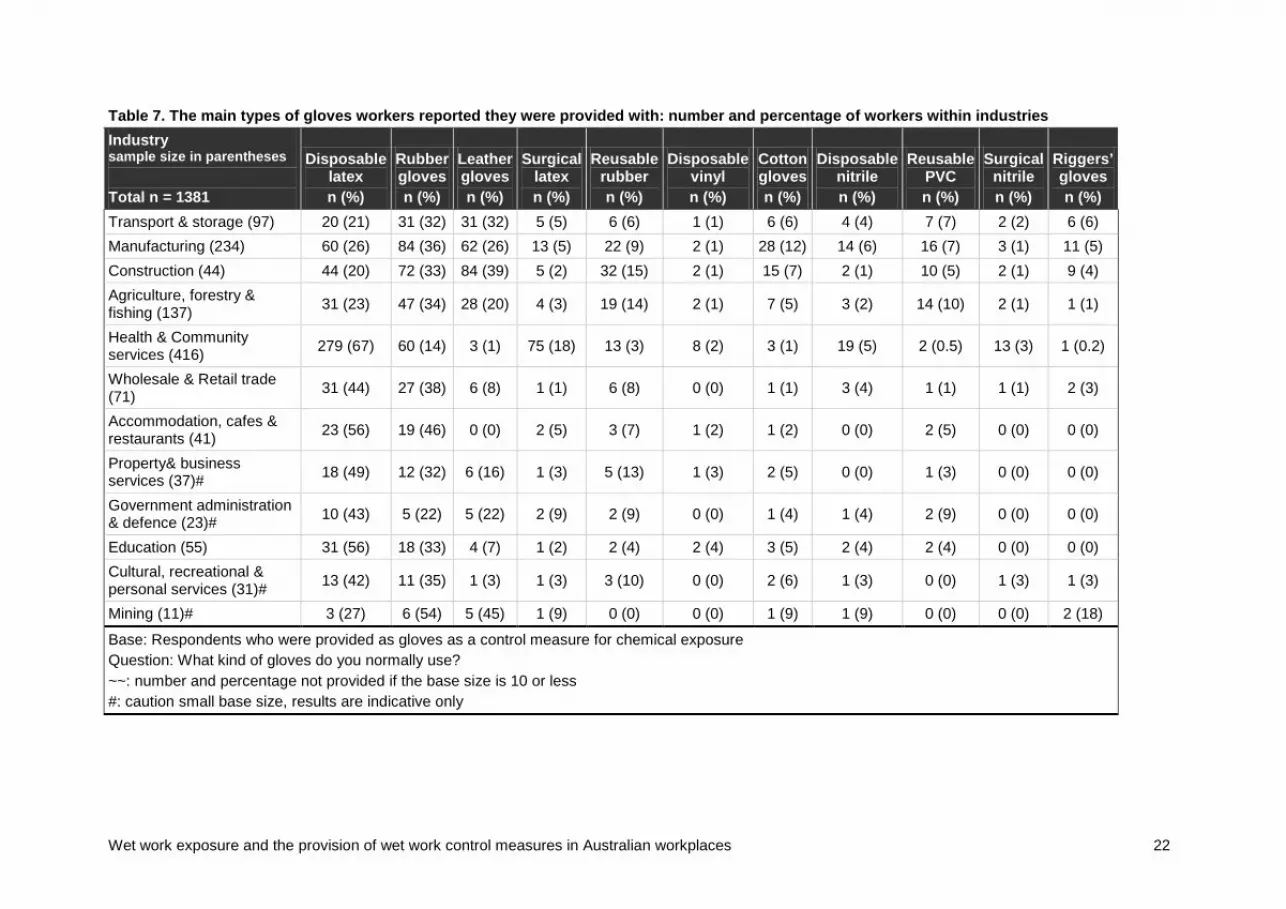
Wet work exposure and the provision of wet work control measures in Australian workplaces 22
Table 7. The main types of gloves workers reported they were provided with: number and percentage of workers within industries Industry sample size in parentheses Total n = 1381
Disposable latex n (%)
Rubber gloves n (%)
Leather gloves n (%)
Surgical latex n (%)
Reusable rubber n (%)
Disposable vinyl n (%)
Cotton gloves n (%)
Disposable nitrile n (%)
Reusable PVC n (%)
Surgical nitrile n (%)
Riggers’ gloves n (%)
Transport & storage (97) 20 (21) 31 (32) 31 (32) 5 (5) 6 (6) 1 (1) 6 (6) 4 (4) 7 (7) 2 (2) 6 (6) Manufacturing (234) 60 (26) 84 (36) 62 (26) 13 (5) 22 (9) 2 (1) 28 (12) 14 (6) 16 (7) 3 (1) 11 (5) Construction (44) 44 (20) 72 (33) 84 (39) 5 (2) 32 (15) 2 (1) 15 (7) 2 (1) 10 (5) 2 (1) 9 (4) Agriculture, forestry & fishing (137) 31 (23) 47 (34) 28 (20) 4 (3) 19 (14) 2 (1) 7 (5) 3 (2) 14 (10) 2 (1) 1 (1)
Health & Community services (416) 279 (67) 60 (14) 3 (1) 75 (18) 13 (3) 8 (2) 3 (1) 19 (5) 2 (0.5) 13 (3) 1 (0.2)
Wholesale & Retail trade (71) 31 (44) 27 (38) 6 (8) 1 (1) 6 (8) 0 (0) 1 (1) 3 (4) 1 (1) 1 (1) 2 (3)
Accommodation, cafes & restaurants (41) 23 (56) 19 (46) 0 (0) 2 (5) 3 (7) 1 (2) 1 (2) 0 (0) 2 (5) 0 (0) 0 (0)
Property& business services (37)# 18 (49) 12 (32) 6 (16) 1 (3) 5 (13) 1 (3) 2 (5) 0 (0) 1 (3) 0 (0) 0 (0)
Government administration & defence (23)# 10 (43) 5 (22) 5 (22) 2 (9) 2 (9) 0 (0) 1 (4) 1 (4) 2 (9) 0 (0) 0 (0)
Education (55) 31 (56) 18 (33) 4 (7) 1 (2) 2 (4) 2 (4) 3 (5) 2 (4) 2 (4) 0 (0) 0 (0) Cultural, recreational & personal services (31)# 13 (42) 11 (35) 1 (3) 1 (3) 3 (10) 0 (0) 2 (6) 1 (3) 0 (0) 1 (3) 1 (3)
Mining (11)# 3 (27) 6 (54) 5 (45) 1 (9) 0 (0) 0 (0) 1 (9) 1 (9) 0 (0) 0 (0) 2 (18)
Base: Respondents who were provided as gloves as a control measure for chemical exposure Question: What kind of gloves do you normally use? ~~: number and percentage not provided if the base size is 10 or less #: caution small base size, results are indicative only
Wet work exposure and the provision of wet work control measures in Australian workplaces 23
Barrier creams and Moisturisers The provision of barrier creams and moisturisers was reported by about half of the NHEWS survey participants. Industries reporting high percentages of moisturisers and barrier creams were Health and community services (73%) and Manufacturing (60%). However, when considering the logistic regression model reported in Table 6, the only industry with significantly increased odds of providing barrier creams and moisturisers was Health and Community Services (OR 3.00, 95% CI: 1.56-5.77). The other factor that was associated with increased odds of provision of barrier creams and moisturisers was age group, with individuals in the 35-44 and the 55+ age groups both reporting increased odds of provision. A number of groups reported decreased provision of barrier creams and moisturisers. Workers in workplaces with between five and 19 workers were associated with decreased odds of the provision of moisturisers and barrier creams (OR 0.44, 95% CI: 0.29-0.69). Neither exposure to chemicals nor high exposure to wet work were significantly associated with the provision of barrier creams and moisturisers.
Labelling and warning signs Occupational hazard communication informs workers and employers about the inherent dangers of substances that are used in the workplaces and how these hazards might be minimised. In the context of exposure to wet work this includes elements such as signs about the appropriate ways to protect skin, labelling of ingredients contained in liquids which workers are exposed to as part of their work, as well as warnings about the dangers associated with excessive exposure to wet work. As previously mentioned, exposure to wet work and exposure to chemicals were highly correlated in the NHEWS survey. Many of the liquids to which workers nominated being exposed (Table 5) might be classified as ‘chemicals’. As such, labelling and warning signs are important wet work control measures because they provide workers with information about exposure.
Labelling and warning signs were reported by 54% of the NHEWS survey participants. This percentage was higher amongst workers in industries such as Wholesale and retail trade (67%), Health and community services (65%) and Manufacturing (65%). Workers in workplaces with less than five employees recorded a lower percentage of workers reporting labelling and warning as a control in their workplaces (33%), compared to workers in workplaces with more employees. In the logistic regression model reported in Table 6, there were few significant associations with labelling and warning signs. The only industry to report increased odds compared to Transport and Storage was Health and Community Services (OR 2.13, 95% CI: 1.12-4.03). Workplaces with less than five employees (OR 0.36, 95% CI: 0.21-0.61) and workplaces with between five to 19 employees (OR 0.44, 95% CI: 0.29-0.67) were significantly less likely to report labelling and warning signs as control measures. The odds of having warning signs decreased as workplace size decreased. Neither workers exposed to chemicals nor workers with very high exposure to wet work were significantly more likely to report labelling and warning signs as a control measure.
Time restriction In terms of the hierarchy of controls, the highest level control about which information was routinely collected in the NHEWS survey was restriction of the amount of time an individual was exposed to wet work. Only 31% of workers reported time restriction as a control that was utilised in their workplaces. In the Construction industry, 40% of workers who reported exposure to wet work reported time restriction as a control. This contrasts with workers in Accommodation, cafes and restaurants and Health and community services, both industries with high exposures to wet work, where only 29% of workers reported time restriction as a control. In Cultural, recreational and personal services, another highly exposed industry, only 23% of exposed workers reported time restriction as a control for wet work.

Wet work exposure and the provision of wet work control measures in Australian workplaces 24
In the logistic regression model reported in Table 8 there were no variables with increased odds for the use of time restriction as a control for wet work exposure. However, one industry, Education, was significantly less likely than Transport and storage to have time restriction as a control (OR 0.26, 95% CI: 0.09-0.73). Workers who reported personal exposure levels of more than two hours per day were also less likely to report time restriction as a control measure. The model was checked for differences between workers in industries exposed to chemicals and workers not exposed to chemicals. An interaction term (for industry and chemical exposure) was fitted to the final model and was found to be significant, indicating that there was some interaction in the model. On further investigation this was found to be for the industry grouping Wholesale and retail trade and Accommodation, cafes and restaurants. Workers in these industrial groupings who also had exposure to chemicals were found to have five times greater odds of the provision of time restriction compared to workers in this industrial grouping without exposure to chemicals.
Ongoing training and education about skin care Ongoing training and education regarding exposure to wet work is another under-utilised resource, with only 43% of workers reporting the provision of ongoing training. In those workplaces with less than five employees only 26% of workers reported ongoing training regarding exposure to wet work.
The logistic regression model revealed that there was only one group of workers that had increased odds for the provision of ongoing training (Table 8). Workers in Health and community services were almost twice as likely to be provided with ongoing training, compared to workers in Transport and storage. There were, however, a number of groups with a decreased likelihood of reporting ongoing training. These included workers in workplaces with five to 19 employees (OR 0.46, 95% CI: 0.30-0.69) and workers in workplaces with less than five employees (OR 0.37, 95% CI: 0.22-0.65). Neither the group with exposure to chemicals nor the group with high exposure to wet work were significantly associated with the provision of ongoing training and education about skin care. The model was checked for differences between workers in industries exposed to chemicals and workers not exposed to chemicals. An interaction term (for industry and chemical exposure) was fitted to the final model and was found to be significant indicating that there was some interaction in the model. On further investigation this was found to be for the industrial groupings Agriculture, forestry and fishing / Mining, Health and community services and Accommodation cafes and restaurants. Workers in these industrial groupings who also had exposure to chemicals were found to have 3.6 times greater odds of provision of training and education as a control measure compared to workers in the same industrial grouping without exposure to chemicals.
No control measures Overall, 13% of the 1201 workers in the NHEWS survey who reported some exposure to wet work reported no control measures at all were provided in their workplaces. This percentage was higher in workplaces with less than five employees, where the percentage of workers provided with no controls for exposure to wet work was nearly 20%.
The logistic regression model revealed a few groups of workers that were significantly more likely to report no control measures (Table 8). These included workers in workplaces with five to 19 employees (OR 2.19, 95% CI: 1.12-4.28) and workers in workplaces with less than five employees (OR 2.26, 95% CI: 1.00-5.11). There were a number of groups with decreased odds of reporting no control measures. Health and community services (OR 0.20, 95% CI: 0.07-0.52) had increased odds of exposure to wet work but this was somewhat compensated for by having decreased odds of not having any control measures provided. Another group that was significantly less likely to report the provision of no control measures was the group also reporting exposure to chemicals (OR 0.43, 95% CI: 0.27-0.67).

Wet work exposure and the provision of wet work control measures in Australian workplaces 25
Table 8. Results (odds ratios and 95% confidence intervals) of multivariate logistic regression models# examining the provision of the following control measures: time restriction, training, no control measures
Time restriction Training No controls
provided Age group 15-24 (ref) -- -- -- 25-34 1.27 (0.66-2.44) 1.07 (0.58-1.95) 1.28 (0.48-3.42) 35-44 1.51 (0.82-2.78) 1.15 (0.65-2.02) 1.00 (0.40-2.51) 45-54 1.07 (0.58-1.97) 0.86 (0.49-1.50) 1.74 (0.72-4.18) 55+ 0.97 (0.50-1.87) 1.08 (0.59-1.96) 1.41 (0.55-3.62) Employment arrangements Permanent -- -- -- Temp/casual 0.82 (0.53-1.26) 0.70 (0.47-1.04) 1.41 (0.78-2.53) Fixed term 1.90 (0.90-4.00) 0.74 (0.36-1.55) 0.94 (0.32-2.75) Number of employees at workplace 200 or more (ref)
--
--
--
20 to 199 0.78 (0.56-1.35) 0.71 (0.49-1.03) 1.01 (0.53-1.92) 5 to 19 0.87 (0.56-1.35) 0.46 (0.30-0.69)* 2.19 (1.12-4.28)* Less than 5 0.70 (0.39-1.26) 0.37 (0.22-0.65)* 2.26 (1.00-5.11)* Industry** Transport & storage (ref) -- -- -- Manufacturing 1.24 (0.59-2.58) 0.67 (0.36-1.24) 0.52 (0.21-1.28) Construction / Electricity, gas & water supply 1.24 (0.59-2.58) 0.95 (0.48-1.88) 0.83 (0.33-2.09)
Agriculture, forestry & fishing / Mining 1.00 (0.43-2.31) 1.16 (0.54-2.52) 0.44 (0.14-1.35) Health & community services 0.98 (0.50-1.96) 1.99 (1.05-3.75)* 0.20 (0.07-0.52)* Wholesale & Retail trade 0.73 (0.29-1.84) 0.69 (0.30-1.62) 0.38 (0.09- 1.61) Accommodation, cafes & restaurants 0.93 (0.36-2.38) 0.48 (0.20-1.17) 0.19 (0.37-1.02) Property & business services / Communication services / Finance & insurance
0.60 (0.20-1.77) 0.34 (0.12-0.94)* 2.98 (1.00-8.85)*
Government administration & defence 0.99 (0.36-2.70) 0.81 (0.32-2.04) 1.50 (0.47-4.77) Education 0.26 (0.09-0.73)* 0.50 (0.22-1.15) 1.30 (0.46-3.69) Cultural, recreational & personal services 0.79 (0.21-2.91) 0.52 (0.16-1.74) 0.58 (0.10-3.19) Exposure of the skin to wet work No/low exposure/ high exposure -- -- -- Very high/ unsafe exposure 0.40 (0.25-0.63)* 0.78 (0.54-1.14) 0.86 (0.45-1.65) Exposure of the skin to chemicals No/low exposure -- -- -- Exposure 1.07 (0.77-1.48) 1.31 (0.98-1.78) 0.43 (0.27-0.67)* Observations Hosmer-Lemeshow goodness-of-fit
900 0.8989
900 0.2680
900 0.7628
*p<0.05 # Models adjusted for gender and occupational skill level **For the models the following industrial groupings have been combined: Construction and Electricity, gas and water supply Agriculture, forestry & fishing and Mining Property and business services, Communication services and Finance and Insurance

Wet work exposure and the provision of wet work control measures in Australian workplaces 26
‘No controls’, and ‘other controls only’ compared to workplaces that have ‘time restriction’ as a control for wet work The most source-focussed control included in the NHEWS survey was restriction of the amount of time an individual was exposed to wet work. In Table 9, the results of a multinomial logistic regression are presented where both the provision of ‘other controls only’ and the provision of ‘no controls’ were compared to workers who were provided with ‘time restriction’. The time restriction group also includes those workers who were additionally provided with other control measures. Workers who were provided with the most effective controls against exposure to wet work are in the time restriction group, based upon the hierarchy of controls. This is followed by the group with other controls only, which included those workers who reported gloves, moisturisers and barrier creams, labelling and warning and/or ongoing training. The worst group were the workers reporting no provision of control measures.
The relative risk of reporting other controls only, compared to the reference group of workers reporting time restriction, was increased amongst those in the Education industry (Relative Risk ratio [RR] 3.83, 95% CI: 1.36-10.77). The relative risk was also increased amongst those workers who reported very high/unsafe exposure of the skin to wet work (RR 2.31, 95% CI: 1.48-3.58).
When comparing the group reporting no provision of controls with those workers reporting time restriction there were a number of significant relative risk ratios. Workers in the highly exposed Health and community services industry were less likely to report no provision of controls (RR 0.24, 95% CI: 0.09-0.65). Once again we see the relationship between chemical exposure and wet work, with workers reporting exposure of the skin to chemicals also reporting a decreased likelihood of having no controls (RR 0.42, 95% CI: 0.26-0.68).
Of importance however, with respect to the development of policy intervention, was the finding that workers in workplaces with fewer employees were more likely to report no controls were provided, than workers from the largest (200 or more employees) workplaces. Workers in workplaces with between five and 19 employees were two and a half times as likely to report no controls (RR 2.47, 95% CI: 1.21-5.02) and workers in workplaces with less than five employees were three times more likely to report no controls (RR 2.98, 95% CI: 1.23-7.21). The multinomial model was checked for differences between workers in industries exposed to chemicals and workers not exposed to chemicals. An interaction term (for industry and chemical exposure) was fitted to the model and was found to be significant, indicating that there was some interaction in the model. On further investigation this was found to be for the industrial groupings Health and community services for provision of no controls and Accommodation cafes and restaurants for provision of controls other than time restriction. Table 9 presents a summary of the model results, with the full model and test statistics presented in Table 16 in Appendix Two.

Wet work exposure and the provision of wet work control measures in Australian workplaces 27
Table 9. Results (relative risk ratios and 95% confidence intervals) of a multinomial logistic regression model examining the demographic and employment factors that affected the likelihood of reporting the provision of other controls only or no controls, as opposed to workplaces that provided restricted time or restricted time and other controls for wet work exposure
Model factors: The reference group in this model is workplaces with time restriction or time restriction and other controls
The relative risk of
reporting ‘other
controls only’ were …
… by a factor of Relative risk ratio
(95% CI) relative to the model factor
reference category in workplaces where
workers reported time restriction or
time restriction and other controls
The relative risk of
reporting ‘no
controls’ were …
… by a factor of Relative risk ratio
(95% CI) to the model factor
reference category in workplaces where workers reported time
restriction or time restriction and other controls
Workplace size (number of employees
200 or more (ref) -- 20 to 199 5 to 19 Increased 2.47 (1.21-5.02)* Less than 5 Increased 2.98 (1.23-7.21)* Industry Transport & storage (ref) Manufacturing Construction / Electricity, gas & water supply
Agriculture, forestry & fishing / Mining
Health & community services Decreased 0.24 (0.09-0.65) Wholesale & Retail trade Accommodation, cafes & restaurants
Property & business services / Communication services / Finance & insurance
Government administration & defence
Education Increased 3.83 (1.36-10.77) Increased 3.87 (1.12-13.34) Cultural, recreational & personal services
Exposure of the skin to wet work
Very high/ unsafe exposure Increased 2.31 (1.48-3.58) Exposure of the skin to chemicals --
Exposure Decreased 0.42 (0.26-0.68) * Only statistically significant categories and differences in odds are presented. # Model also adjusted for age, gender and employment arrangements See Table 16, Appendix Two for the full model and test statistics.

Wet work exposure and the provision of wet work control measures in Australian workplaces 28
Discussion
Main findings Although the underlying study sample means that the results for the NHEWS survey cannot be considered as population-based, and therefore claims for generalisability must be treated with caution, this study presents a first attempt to obtain information about the extent and characteristics of exposure to wet work at the Australian national level.
Wet work exposure There were two separate outcomes for wet work exposure: frequent washing of hands in the workplace and duration of time spent at work with the hands immersed in liquids. For hand washing, overall 9.8% (95% Confidence Interval [95% CI]: 8.9-10.7%) of workers who participated in the NHEWS survey reported that they washed their hands more than 20 times per a typical day at work last week. For immersion of the hands in liquids, overall 7.3% (95% CI: 6.5-8.0%) of workers reported their hands immersed in liquids for more than one hour per day and 4.5% (95%CI: 3.9-5.1%) reported their hands immersed in liquids for more than two hours per day.
These exposure prevalences are comparable with those from a Swedish population-based study which found that 16% of workers reported exposure to water for half an hour or more per day, and 7% of workers reported exposure to water for more than two hours per day (Anveden Berglind et al. 2009). Using information in the published results for the Swedish study, 95% confidence intervals can be generated for these point estimates of 15.8-16.8% for exposure of half an hour or more per day and 6.7-7.4% for more than two hours per day. These confidence intervals are similar to the confidence intervals from the NHEWS survey, suggesting that the two studies have comparable rates for duration of exposure, particularly when comparing exposure for more than two hours per day
There were a number of factors which were associated with higher odds of exposure to wet work. Female workers were more likely to report exposure to frequent hand washing, but there was no difference between males and females for immersion of the hands in liquids. The main industries where workers reported increased wet work exposure (both frequent hand washing and immersion of the hands in liquids) were Health and community services and Accommodation, cafes and restaurants. Workers in lower occupational skill level jobs were more likely to report increased exposure to hands immersed in liquids. Workers reporting skin exposure to chemicals for an hour or more per day were much more likely to report exposure to wet work (both hand washing and immersion of the hands in liquids).
Workplace provision of control measures A range of controls for wet work were provided for workers and this report provides details of patterns for the provision of wet work control measures with reference to the employment and demographic characteristics of the workers. Wet work control measures included the provision of gloves, moisturisers and barrier creams, the use of labelling and warning, and the provision of ongoing training and education.
The most effective control about which information was routinely collected in the NHEWS survey was restriction of the amount of time an individual was exposed to wet work. The use of administrative time restriction means wet work tasks are distributed over time amongst a group of workers so that no single worker is excessively exposed. Only 32% of workers reported the provision of time restriction as a control in their workplace. In the Construction industry, 41% of workers reported time restriction. This contrasts with workers in Accommodation, cafes and restaurants and Health and community services, both industries with high exposures to wet work, where less than a third of workers reported time restriction.

Wet work exposure and the provision of wet work control measures in Australian workplaces 29
In Cultural, recreational and personal services, another highly exposed industry, only 21% of exposed workers reported time restriction as a control for wet work.
Another important control measure is the provision of ongoing education and on-the-job training. This was another under-provided control measure, with less than half of workers reporting the provision of ongoing training. This percentage was slightly lower amongst those workers who reported high exposure, with only 41% of highly exposed workers reporting ongoing training.
The least effective, but the most commonly utilised control measures are those which make use of personal protective equipment in the form of occlusive gloves. In the NHEWS survey, 75% of workers reported they were provided with gloves. Amongst workers in the Accommodation, cafes and restaurants industry, 94% of workers reported they were provided with gloves. For the Health and community services industry 88% reported they were provided with gloves. Glove use is considered to be one of the least effective control measures, because gloves do not reduce the source of exposure and their effectiveness as control measures is dependent on supply of the appropriate gloves and correct usage by the worker. Therefore it was positive to see that only 9% of workers reported glove provision as the sole control measure with which they were provided.
For workers in most industrial and workplace settings where there was a greater likelihood of exposure to wet work, there was also a greater likelihood of provision of control measures. This suggests that wet work hazards are generally recognised by employers and workers and are mitigated with at least some form of exposure control. Of concern, however, there were some groups of workers who reported lower provision of controls. Workers in workplaces with less than 20 employees were twice as likely to report no provision of workplace controls. These workers were also less likely to be provided with a range of individual control measures: gloves, labelling and warning, barrier creams and moisturisers, and ongoing education about skin care.
Policy implications According to the best available international evidence, immersion of the hands in liquids for more than two hours per day and/or spending a long periods wearing occlusive gloves, and/or washing hands more than 20 times per shift are considered as risk factors for damage of the outer layer of the skin (the stratum corneum), possibly leading to the development of irritant or allergic occupational contact dermatitis (BAuA German Federal Institute for Occupational Safety and Health 1996). In Germany, this evidence has led to the development of the Technical standards for hazardous substances: Skin damage from work in wet environments (BAuA German Federal Institute for Occupational Safety and Health 1996). An English translation is available on the US National Institute of Occupational Safety and Health (NIOSH) website: www.cdc.gov/niosh/topics/skin/pdfs/WetWorkTRGS531.pdf.
The German Technical Standards (531), together with the Technical Rules for Hazardous Substances 530 "Hairdressing trade" were fully enforced in 1996 and 1992 after a long period of consultation and implementation with employers, employees, the German hairdresser’s guild, cosmetic manufacturers and legislators. As a result of these collaborative efforts an impressive reduction was seen in the numbers of cases of occupational contact dermatitis amongst hairdressers in Northern Bavaria (see Figure 3). This success story was the result of a multi-disciplinary effort between dermatologists, employer and employee groups and policy makers (Dickel et al. 2002). Policy such as the German TRGS 531: Wet Work Technical Standard, (BAuA German Federal Institute for Occupational Safety and Health 1996) needs to be considered for the Australian context.

Wet work exposure and the provision of wet work control measures in Australian workplaces 30
Figure 3. Annual incidence (± 95% confidence intervals) of hairdressers with a stated occupational skin disease 1990-1999. From BMJ 2002; 324:1422-1423 (Dickel et al. 2002) - Used with permission1
In the NHEWS survey, workers in particular industries were more likely to report exposure to wet work. These industries are Accommodation, cafes and restaurants and Health and Community services. Targeted policies and education packages are required to guide intervention on exposure to wet work within the specific workplace contexts of these high-risk industries.
Exposure to chemicals and exposure to liquids in the workplace were highly correlated in the NHEWS sample, with workers reporting skin exposure to chemicals three times as likely to report higher rates of hand washing and four times as likely to report exposure to immersion of the hands in liquids. These two exposures are known to interact in the development of diseases such as allergic and irritant contact dermatitis. Contact with irritants, such as soap and water, are known to damage the barrier function of the skin and may lead to irritant contact dermatitis. Damage to the barrier function of the skin also facilitates the entry of allergens which may increase the risk of allergic contact dermatitis (Nixon et al. 2005). The correlation of chemical exposure and wet work presents an opportunity for policy intervention to realise prevention through integrated policy and practice interventions in industrial sectors and workplace settings where both exposures are high.
Finally, workers in workplaces with fewer employees were more likely to report they were not provided with any controls in their workplaces as well as less likely to report provision of a range of individual control measures. Policy suitable to the context of small businesses is urgently required.
Recommendations for future research Obtaining objectively measured nationally representative data on wet work exposures in Australian workplaces is made difficult by the great expense and physical difficulties of undertaking these measurements. Rather than collecting objective measurements, the NHEWS survey asked workers directly about their experience of exposure to liquids in the workplace as well as the control measures which were supplied to them to protect against the adverse effects of these exposures. The obvious benefit of this approach is that information can be collected within a relatively short time frame and at a fraction of the cost that might be associated with objective measurements. However this approach also entails certain limitations, some of which can be addressed by conducting validation studies of self reported data (Anveden et al. 2006).
1 Permission to use Figure 3 must be sought from BMJ Publishing Group.
Wet work exposure and the provision of wet work control measures in Australian workplaces 31
Self-reported data may provide an under or over estimation of the true exposure situation. This is relevant to estimates of the duration of wet work exposure and other areas such as the types of liquids that workers are exposed to in the workplace. Many liquids will have much lower thresholds for recommended exposure than the two hour limit suggested for exposure to water (ASCC 2005). Importantly, self-reported exposure data should be collected using one time scale (not per day OR per week as in the current NHEWS survey). This avoids issues with conversion of time scales as well as the assumptions regarding data that are necessarily part of such conversions.
Another area for further research is in the provision and worker uptake of various control measures. For example, it was outside the scope of the current NHEWS survey to collect information regarding the appropriateness of gloves used by survey participants. Incorrect or inappropriate glove use in itself can be a contributing exposure to occupational contact dermatitis (Larson et al. 1997; Lee et al. 2001). As specified in the report, a question about the type of gloves used was only asked of NHEWS survey participants who reported exposure of the skin to chemicals (not liquids).
When considering the NHEWS results it must be remembered that data are from workplaces where wet work has not been eliminated. As a result there may be some under-estimation of the full scope of wet work control measures utilised in Australian workplaces. For example, there may have been some workers employed in workplaces where engineering processes had isolated systems, thereby eliminating wet work as an exposure. Such information about ‘high level’ controls, in terms of the hierarchy of controls (ASCC 2005), was outside the scope of the NHEWS survey.
Areas for further research This research has identified a number of areas in which research on wet work exposure and control provision might provide useful knowledge if investigated further:
Small and medium-sized workplaces
Throughout this analysis of the NHEWS wet work data, workers in small and medium sized workplaces were found to be at potentially high risk of wet work exposure and adverse conditions related to wet work. For example, this group appears to be underprovided with respect to wet work control measures. Research on policy intervention, development of appropriate (and acceptable) source-focussed controls, and contextualised education and training needs to be carried out. This research should be conducted collaboratively or at least with key stakeholder groups in order to develop optimally feasible solutions.
High risk industries
Several industries have been identified as high-risk industries. One of these industries - Accommodation, cafes and restaurants - was not a National Priority Industry, and as such had a smaller sample size in the NHEWS compared to high risk industries such as Health and Community Services and Manufacturing. Future studies should collect representative data on all industries suspected to be at high risk of exposure to wet work, thereby providing more complete information for effective policy intervention.
Wet work exposure to other parts of the body (apart from hands and arms)
Within the current NHEWS survey wet work exposure was restricted to the hands and arms. Further research might consider the effects of wet work exposure for other areas of the body, for example wet work exposure might affect the feet and legs for construction workers or for workers in the agriculture, fishing or mining industries.
Comparison of wet work exposure data with occupational contact dermatitis claims data
Wet work is one of the main exposures for occupational contact dermatitis. Whilst this report provides details of industries and workplace settings where exposures to wet work are high, it does not provide information regarding settings with high rates of diagnosed occupational

Wet work exposure and the provision of wet work control measures in Australian workplaces 32
contact dermatitis, nor does it provide information regarding successful workers’ compensation claims for occupationally-induced dermatitis. Even if it did provide workers’ compensation information, previous studies have found large discrepancies between the numbers of workers diagnosed with occupational contact dermatitis and successful workers’ compensation claims for occupationally-induced dermatitis (Rosen and Freeman 1992; Keegel et al. 2005).
Important information for policy development might be obtained by comparing wet work exposure data with disease outcome data as collected by the NSW and Victorian Skin and Cancer Foundations (Rosen and Freeman 1992; Rosen and Freeman 1993; Williams et al. 2008), as well as data regarding successful Australian workers’ compensation claims (see the Safe Work Australia Website for more information regarding successful workers’ compensation claims data: http://www.safeworkaustralia.gov.au/ ). This analysis would provide important information on which groups of workers might be more successful in claiming workers’ compensation, as well as providing information on which groups of workers might fall outside the insurance compensation model.
‘Top-down’ and ‘bottom-up’ Intervention studies
International intervention studies carried out amongst workers at high risk of exposure to wet work have found that the most effective interventions are those that make use of combined ‘top-down’ and ‘bottom-up’ strategies. The ‘top down’ components of these interventions address the implementation of management systems focusing on skin risk. This introduces official management obligation for continuous improvements in reducing work-related skin problems by identifying risk factors and implementing risk controls. The ‘bottom-up’ components of these interventions refer to the strategy of recruiting workers as ‘resource-persons’ who are then trained to identify risk factors and implement controls. These intervention studies are “based on the concept of empowerment … giving the participants a considerable understanding of the problem” (Mygind et al. 2006). Development and implementation of a ‘top-down’ and ‘bottom-up’ intervention study, suitable to the Australian context is an important research opportunity.
Wet work exposure and the provision of wet work control measures in Australian workplaces 33
References Anveden Berglind, I., M. Alderling, et al. (2009). "Occupational skin exposure to water: a
population-based study." Br J Dermatol 160(3): 616-621. Anveden, I., C. Liden, et al. (2006). "Self-reported skin exposure--validation of questions by
observation." Contact Dermatitis 55(3): 186-191. ASCC (2005). Guidance on the prevention of dermatitis caused by wet work. Canberra,
Department of Employment and Workplace Relations. BAuA German Federal Institute for Occupational Safety and Health (1996). Technical
standard for hazardous substances: Skin damage from work in wet environments (TRGS 531: wet work). Translation jointly prepared by NIOSH and BAuA.
Burnett, C. A., B. D. Lushniak, et al. (1998). "Occupational dermatitis causing days away from work in US private industry, 1993." American Journal of Industrial Medicine 34(6): 568-573.
Dickel, H., O. Kuss, et al. (2002). "Impact of preventive strategies on trend of occupational skin disease in hairdressers: population based register study." BMJ 324(7351): 1422-1423.
Flyvholm, M. A., K. Mygind, et al. (2005). "A randomised controlled intervention study on prevention of work related skin problems among gut cleaners in swine slaughterhouses." Occup Environ Med 62(9): 642-649.
Held, E., K. Mygind, et al. (2002). "Prevention of work related skin problems: an intervention study in wet work employees." Occup Environ Med 59(8): 556-561.
Hendrie, L. and T. Driscoll (2003). "Work-related presentations to general practitoners in Australia." Journal of Occupational Health and Safety- Australia and New Zealand 19: 133-143.
Holness, D. L. (2001). "Results of a quality of life questionnaire in a patch test clinic population." Contact Dermatitis 44(2): 80-84.
Holness, D. L. (2004). "Health care services use by workers with work-related contact dermatitis." Dermatitis 15(1): 18-24.
Keegel, T., J. Cahill, et al. (2005). "Incidence and prevalence rates for occupational contact dermatitis in an Australian suburban area." Contact Dermatitis 52(5): 254-259.
Keegel, T., B. Erbas, et al. (2007). "Occupational contact dermatitis in Australia: diagnostic and management practices, and severity of worker impairment." Contact Dermatitis 56(6): 318-324.
Keegel, T., M. Moyle, et al. (2009). "The epidemiology of occupational contact dermatitis (1990-2007): a systematic review." Int J Dermatol 48(6): 571-578.
Kutting, B. and H. Drexler (2003). "Effectiveness of skin protection creams as a preventive measure in occupational dermatitis: a critical update according to criteria of evidence-based medicine." Int Arch Occup Environ Health 76(4): 253-259.
Larson, E., C. Friedman, et al. (1997). "Prevalence and correlates of skin damage on the hands of nurses." Heart Lung 26(5): 404-412.
Lee, A., R. Nixon, et al. (2001). "Reduction of use of latex gloves in food handlers: an intervention study." Contact Dermatitis 44: 75-79.
Lushniak, B. D. (1995). "The Epidemiology of Occupational Contact-Dermatitis." Dermatologic Clinics 13(3): 671-680.
Mathias, C. G. T. (1989). "Contact dermatitis and workers' compensation: Criteria for establishing occupational causation and aggravation." J Am Acad Dermatol 20: 842-848.
Moyle, M., T. Keegel, et al. (2006). "Skin care in occupational contact dermatitis of the hands." Australasian Journal of Dermatology 47: 97-101.
Mygind, K., V. Borg, et al. (2006). "A study of the implementation process of an intervention to prevent work-related skin problems in wet-work occupations." Int Arch Occup Environ Health 79(1): 66-74.
Nixon, R., K. Frowen, et al. (2005). "Occupational dermatoses." Australian Family Physician 34(5): 327 - 377.
Wet work exposure and the provision of wet work control measures in Australian workplaces 34
Rietschel, R. L., C. G. T. Mathias, et al. (2002). "Relationship of Occupation to Cotnact Dermatitis: Evaluation in Patients Tested from 1998 to 2000." American Journal of Contact Dermatitis 13(4): 170-176.
Rosen, R. H. and S. Freeman (1992). "Occupational contact dermatitis in New South Wales." Australas J Dermatol 33(1): 1-10.
Rosen, R. H. and S. Freeman (1993). "Prognosis of Occupational Contact-Dermatitis in New-South-Wales, Australia." Contact Dermatitis 29(2): 88-93.
Rosen, R. H. and S. Freeman (1993). "Prognosis of occupational contact dermatitis in New South Wales, Australia." Contact Dermatitis 29(2): 88-93.
Sell, L., M. A. Flyvholm, et al. (2005). "Implementation of an occupational skin disease prevention programme in Danish cheese dairies." Contact Dermatitis 53(3): 155-161.
Uter, W., A. Pfahlberg, et al. (1999). "Risk of hand dermatitis among hairdressers versus office workers." Scand J Work Environ Health 25(5): 450-456.
Weisshaar, E., M. Radulescu, et al. (2007). "Secondary individual prevention of occupational skin diseases in health care workers, cleaners and kitchen employees: aims, experiences and descriptive results." Int Arch Occup Environ Health 80(6): 477-484.
Williams, J. D., A. Y. Lee, et al. (2008). "Occupational contact urticaria: Australian data." Br J Dermatol 159(1): 125-131.

Wet work exposure and the provision of wet work control measures in Australian workplaces 35
Appendix 1. NHEWS survey methodology
Survey design The purpose of the NHEWS survey was to gather information to guide decision makers in developing prevention initiatives that ultimately lead to a reduction in occupational disease. Therefore, the survey was designed to collect demographic (e.g. sex, age, educational qualifications) and employment (occupation, industry, employment conditions, size of workplace) information in addition to information about worker exposure to a variety of different occupational hazards and about the hazard controls provided in the workplace.
The design and wording of the survey was undertaken by the ASCC in consultation with Australian work health and safety regulators and a panel of experts. It was based on existing Australian and international hazard exposure survey instruments. These included the:
- European Working Condition Survey,
- National Exposures at Work Survey (NIOSH, USA),
- Swedish Workplace and Environment Survey, and
- Victorian WorkCover Authority Worker Survey, amongst others.
A draft of the survey was reviewed by Dr Rebbecca Lilley (from the Preventative and Social Medicine, Injury Prevention and Research Unit, University of Otago, New Zealand), who is an expert on occupational hazard exposure. Comments and feedback from her review were incorporated into the survey instrument.
Skirmish testing (undertaken on ASCC staff) and cognitive testing on 11 workers, who were of a low literacy or non-English speaking background, and worked in several industries, was undertaken in face to face interviews. The survey was piloted by the Victorian WorkCover Authority on 160 workers using the Computer Assisted Telephone Interview (CATI) technique. This assisted in revising the survey length and correcting CATI programming issues. Feedback from the cognitive and pilot testing was incorporated into the final survey instrument.
The NHEWS research design and survey instrument were submitted to the University of Sydney Human Research Ethics Committee. The approval reference number is: 02-2008/10506. The research design and instrument met the National Statistical Clearing House guidelines. The research design and instrument were also in accordance with the Australian Market and Social Research Society (AMSRS) guidelines and the research company that undertook the CATI is a member of the AMRSRS and met all privacy and other guidelines.
More information, including the full survey instrument for all occupational hazards and their controls, can be found in the National Hazard Exposure Worker Surveillance (NHEWS): Survey Handbook and the National Hazard Exposure Worker Surveillance (NHEWS) Survey: 2008 Results, which are published on the Safe Work Australia website (http://www.safeworkaustralia.gov.au/).

Wet work exposure and the provision of wet work control measures in Australian workplaces 36
Wet work exposure and control measure questions
The specific questions relating to wet work exposure were as follows:
1. On a typical day at work last week, how many times did you wash your hands with water, including when using the bathroom?
2. On a typical day at work last week, excluding time spent hand-washing, how long did you have your hands immersed in or covered by any liquid (including water) with or without gloves?
3. What liquids did you have your hands covered by last week?
4. Does your employer (or, in the case of self-employed/contractors etc, do you) do any of the following to prevent health problems caused by exposure to water or other liquids?
a) Provide gloves
b) Provide barrier cream
c) Provide moisturiser
d) Provide labelling and warning signs
e) Limit the time you have your hands in water or other liquids, and
f) Provide training.
Chemical exposure and control measure questions The specific questions relating to skin contact with substances were as follows:
1. On a typical day at work last week, how long did you work with chemicals such as cement, cleaning products, disinfectants, solvents, resins, paints, pesticides or other chemical substances?
2. What were the main types of chemical products or substances you worked with last week?
The following question was asked of workers who reported exposure to chemicals, but was analysed in this report as it is also relevant to control measures for wet work:
3. Does your employer (or, in the case of self-employed/contractors etc, do you) do any of the following to prevent health problems caused by exposure to chemical products or substances?
a) Provide gloves
b) Provide protective clothing
c) Provide moisturiser
d) Provide labelling and warning signs
e) Provide washing facilities, and
f) Provide training
4. What kind of gloves do you normally use?
a) Cotton gloves
b) Disposable latex
c) Disposable vinyl
d) Disposable nitrile
e) Leather

Wet work exposure and the provision of wet work control measures in Australian workplaces 37
f) Surgical latex
g) Surgical nitrile
h) Reusable neoprene
i) Reusable rubber, and
j) Reuseable PVC
Survey administration The NHEWS survey was conducted by Sweeney Research Pty Ltd using computer assisted telephone interviews (CATI). The survey obtained an Australia-wide sample of 4500 workers across all 17 Australian industries. Households were randomly selected using the desk top marketing systems (DTMS) database, which collects its information from directories such as the White / Yellow pages. To be eligible for the research, respondents were required to have worked in the last week and to have earned money from the work. Where more than one individual was eligible for the research, the person whose birthday came next was selected. Overall, the survey achieved a 42.3% response rate.
The sampling scheme for the NHEWS can be considered as two stages with three waves of data collection. The first wave resulted in 1900 completed interviews which met quotas by sex within industry (five national priority industries: Manufacturing, Transport and storage, Construction, Health and community services and Agriculture, forestry and fishing) within state (1300 interviews), plus an additional sample coming from state contributions (600 interviews).
The second and third waves of the survey (n total = 2600) placed no restrictions on industry and differed only in that some additional questions were asked. The second wave involved re-contacting those households that had not been interviewed in the first wave due to being out of scope (e.g. had no persons working in the priority industries) or quotas already being met, and had given permission to be recontacted for further studies. This wave resulted in 485 completed interviews. The third wave (n=2115) resulted in the balance of the 4500 interviews, meeting sex within state quotas.
For reporting purposes the following industries were collapsed into two integrated industries: 1) Wholesale and Retail trade, and 2) Cultural and recreational services and Personal and other services.
Duration of exposure: Hands immersed in liquids The analysis of the duration for hands immersed in liquids was complicated by the way data was collected in the NHEWS survey. Workers reported immersion of their hands in liquids either by day (n=717) or by week (n=469). Conversion of these two scales of measurement to one common scale is complicated by probable differences in the patterns of wet work exposure between those workers who reported daily patterns of exposure and those who reported weekly patterns of exposure.
Hours of exposure per day were converted to hours of exposure per week because it was assumed that reports of daily durations of exposure were more accurate. Conversion of hours per day to hours per week was carried out using the following formula:
Eweek= Eday*(Hweek/8)
where Eweek is the number of hours hands were immersed in liquids per week, Eday is the number of hours hands were immersed in liquids per day and Hweek is the number of hours worked per week. Dividing Hweek by eight gives the number of standard eight hour working days worked per week. This calculation assumes that workers have the same exposure to wet work every day they work per week. Dividing by standard eight hour working days gives

Wet work exposure and the provision of wet work control measures in Australian workplaces 38
the data more sensitivity to workers who normally work less than or more than a standard day.
An alternative method of calculating hours per week (or day) would be to add up the number of days worked, as survey participants were asked to indicate which days of the reference week they worked. For comparison, duration of exposure for hands immersed in liquids were also converted to hours of exposure per day. This was achieved using the following formula:
Eday= Eweek/(Hweek/8)
The effect of this calculation is to create an average for duration of hands immersed in liquids per day. The limitation of this method is that it does not take into account patterns of exposure to hands immersed in liquids. In other words, because a worker may not have a typical day at work in terms of hands immersed in liquids, this exposure may occur on one day per week or be highly variable. Creating an average time of wet work exposure per day minimises the time exposed to hands immersed in liquids per day, which may result in underestimating the risk of exposure. Conversely, data expressed as hours per week may result in the opposite effect, an overestimation of the risk of exposure to hands immersed in liquids. The limitations of these calculations must be taken into consideration when interpreting the outcomes of analyses involving these data.
Data Analyses All data were inspected prior to formal analysis for missing cases or unusual values. Histograms were generated for all continuous data to assess whether or not data were normally distributed. The number of times workers reported washing their hands and the length of time workers reported having their hands immersed in liquids were not normally distributed. These data were analysed with non-parametric tests. Note that multivariate logistic regression models do not assume that data has a normal distribution.
The exposure data collected in the NHEWS survey were stratified by variables including gender, categorical age group, occupational level, number of employees in the workplace and industrial sector. Percentages were calculated by group. Categorical variables were compared using chi-squared tests. Significance was set at the 0.05 level.
The base size for some industries was extremely small. As a result the decision was made to combine a number of the industries. Exposure to wet work was considered in each industrial group and industries with similar exposures were combined in consultation with an occupational dermatologist specialist (Dr Rosemary Nixon). The models considering provision of wet work control measures have the following industries presented as combined categories:
• Construction with Electricity, gas and water
• Agriculture, forestry & fishing with Mining
• Property and business services, with Communication services and Finance and insurance
Eleven industries are presented in total, with Transport and storage as the reference category (the category to which all other categories are compared in the models). Transport and storage was chosen as the reference category because it was not a highly exposed nor unexposed industry, and because it was one of the National Priority Industries with a larger sample size in the NHEWS survey, there were sufficient numbers to provide a robust reference group.
Univariate analyses were carried out for all outcomes to determine the composition of the logistic regression models. A series of logistic regression models were run for each outcome. In most cases minimal models are presented, adjusted for gender. Model fit was assessed using Hosmer-Lemeshow tests; all models presented had acceptable test statistics (>0.20).

Wet work exposure and the provision of wet work control measures in Australian workplaces 39
The control measures provided in the workplace were analysed using two different methods:
1. Controls were analysed separately (except for barrier creams and moisturisers which were combined into a single category).
2. Only one control measure, time restriction for wet work, was concerned with the rearrangement of work tasks involving exposure to liquids, thereby reducing the potential exposure time for any one worker. As such, time restriction was the most effective control measure for which data was collected in the NHEWS survey. Workers who were provided with time restriction (only) or time restriction plus other controls, were compared in a multinomial model with workers who were provided with other types of controls, such as gloves or creams, as well as workers who reported no provision of workplace control measures.
Odds ratios and 95% confidence intervals are reported for the multivariate models and relative risk ratios are presented for the multinomial model. It was suspected that workers in industries who were exposed to chemicals in addition to wet work might have a different profile to workers in industries who were exposed to wet work without exposure to chemicals. Accordingly all models were checked for interaction between chemical exposure and industry.
All analyses were completed using the STATA 10 statistical programme (Stata Corporation, College Station, TX).

Wet work exposure and the provision of wet work control measures in Australian workplaces 40
Appendix 2: Statistical tables Table 10. Results of a multivariate logistic regression examining the demographic and employment factors affecting the likelihood workers reported they washed their hands more than 20 times per day as opposed to 20 or fewer times per day N=4500 Odds ratio (95% CI) Gender Males (ref) Females
-- 1.97 (1.49-2.61)*
Number of employees at workplace Less than 5 (ref) 5 to 19 20 to 199 200 or more
-- 0.77 (0.52-1.15) 1.49 (1.05-2.11)* 1.44 (1.00-2.08)
Occupational skill level Level one (highest) (ref) -- Level two 1.01 (0.68-1.49) Level three 0.91 (0.60-1.39) Level four 0.89 (0.67-1.19) Level five (lowest) 0.58 (0.37-0.92)* Chemical Exposure No/low exposure (ref) High exposure
-- 3.68 (2.91-4.66)*
Industry Transport & storage (ref) -- Manufacturing 1.33 (0.71-2.50) Construction / Electricity, gas & water supply 0.57 (0.27-1.20) Agriculture, forestry & fishing / Mining 1.51 (0.75-3.06) Health & Community services 6.02 (3.38-10.70)* Wholesale & Retail trade 1.40 (0.64-3.05) Accommodation, cafes & restaurants 5.70 (2.71-12.02)* Finance & insurance / Property & business / Communication services 0.41 (0.15-1.08) Government administration & defence 0.32 (0.09-1.14) Education 0.52 (0.22-1.23) Cultural, recreational & personal services 1.09 (0.37-3.17)
Observations Hosmer-Lemeshow goodness-of-fit
4309 x2 (8)=7.29 p=0.5055
*p<0.05 **For the models the following industrial groupings have been combined: Construction with Electricity, gas & water supply Agriculture, forestry & fishing with Mining Finance and Insurance, and Property and business services, with Communication services

Wet work exposure and the provision of wet work control measures in Australian workplaces 41
Table 11. Results of a multivariate logistic regression examining the demographic and employment factors affecting the likelihood workers reported their hands were in liquids more than two hours per day as opposed to two hours or less per day Odds ratio (95% CI) Gender Males (ref) Females
-- 1.24 (0.85-1.82)
Occupational skill level Level one (highest) -- Level two 2.03 (1.07-3.88)* Level three 4.07 (2.37-7.00)* Level four 2.40 (1.48-3.89)* Level five (lowest) 6.41 (3.78-10.88)* Industry Transport & storage (ref)
--
Manufacturing 1.40 (0.70-2.80) Construction / Electricity, gas & water supply 1.02 (0.50-2.08) Agriculture, forestry & fishing / Mining 1.38 (0.63-3.04) Health & community services 2.92 (1.46-5.84)* Wholesale and Retail trade 0.39 (0.13-1.18) Accommodation, cafes & restaurants 2.97 (1.24-7.15)* Finance & insurance / Property & business / Communication services 0.73 (0.26-2.02) Government administration & defence 0.71 (0.19-2.60) Education 0.72 (0.22-2.36) Cultural, recreational & personal services 1.78 (0.62-5.09) Exposure of the skin to chemicals No/low exposure (ref)
--
High exposure 4.09 (2.92-5.74)*
Observations Hosmer-Lemeshow goodness-of-fit
n=4337 x2(8) = 7.71 p=0.4625
*p<0.05 **For the models the following industrial groupings have been combined: Construction and Electricity, gas and water supply Agriculture, forestry & fishing and Mining Property and business services and Communication services

Wet work exposure and the provision of wet work control measures in Australian workplaces 42
Table 12. The number and percentage of workers provided with the following wet work control measures: Gloves, Barrier creams and moisturisers, Labelling and warning, and Training, in their workplaces by demographic and employment variables
Gloves n (%)
Barrier creams &
moisturisers n (%)
Labelling and warning
n (%) Training
n (%) Gender n=1201 Males 462 (73.1) 317 (50.2) 332 (52.5) 260 (41.1) Females 442 (77.7) 335 (58.9) 315 (55.4) 255 (44.8) Age group n= 1194 15-24 62 (72.1) 31 (36.0) 52 (60.5) 35 (40.7) 25-34 137 (78.3) 95 (54.3) 104 (59.4) 82 (46.9) 35-44 218 (73.9) 168 (56.9) 156 (52.9) 126 (42.7) 45-54 296 (76.9) 206 (53.5) 205 (53.3) 164 (42.6) 55+ 187 (73.9) 149 (58.9) 127 (50.2) 106 (41.9) Occupational skill level n=1165
Level one (highest) 226 (74.8) 170 (56.3) 151 (50.0) 127 (42.1) Level two 83 (79.1) 62 (59.0) 64 (60.9) 46 (43.8) Level three 196 (72.1) 145 (53.3) 144 (52.9) 103 (37.9) Level four 246 (77.1) 167 (52.3) 171 (53.6) 140 (43.9) Level five (lowest) 129 (77.2) 89 (53.3) 96 (57.5) 80 (47.9) Employment arrangements n=942
Permanent 571 (78) 428 (58.5) 455 (62.2) 359 (49.0) Temp/casual 140 (81.4) 77 (44.8) 92 (53.5) 68 (39.5) Fixed term 28 (73.7) 15 (39.5) 20 (52.6) 15 (39.5) Number of employees at workplace n= 1193
200 or more 196 (83.4) 158 (67.2) 162 (68.9) 137 (58.3) 20 to 199 297 (79.8) 215 (57.8) 238 (63.9) 178 (47.8) 5 to 19 213 (72.2) 139 (47.1) 147 (49.8) 122 (41.4) Less than 5 189 (65.4) 135 (46.7) 96 (33.2) 75 (25.9) Hands in liquids n=1201 Less than or equal to two hours 745 (74.7) 540 (54.2) 537 (53.9) 432 (43.3)
More than two hours 159 (77.9) 112 (54.9) 110 (53.9) 83 (40.7) Chemical exposure n=1201
Unexposed 276 (65.9) 209 (49.9) 207 (49.4) 157 (37.5) Exposed 628 (80.3) 443 (56.7) 440 (56.3) 358 (45.8)

Wet work exposure and the provision of wet work control measures in Australian workplaces 43
Table 13. The number and percentage of workers provided with the following wet work control measures: Time restriction, Other controls only, and No control measures, in their workplaces by demographic and employment variables
Time restriction n (%)
Other controls only n (%)
No control measures
n (%) Gender n=1201 Males 226 (35.8) 314 (49.8) 90 (14.2) Females 159 (27.9) 337 (59.3) 72 (12.6) Age group n= 1194 15-24 26 (30.2) 50 (58.2) 9 (10.5) 25-34 62 (35.4) 94 (53.7) 19 (10.9) 35-44 102 (34.6) 152 (51.7) 40 (13.6) 45-54 122 (31.7) 207 (53.9) 55 (14.3) 55+ 72 (28.5) 145 (57.3) 36 (14.2) Occupational skill level n=1165 Level one (highest) 102 (33.8) 156 (51.8) 43 (14.2) Level two 26 (24.8) 68 (65.4) 10 (9.5) Level three 95 (34.9) 138 (50.7) 39 (14.3) Level four 87 (27.3) 187 (58.6) 45 (14.1) Level five (lowest) 61 (36.5) 86 (51.8) 19 (11.4) Employment arrangements n=942
Permanent 207 (28.3) 436 (59.6) 88 (12.0) Temp/casual 45 (26.2) 102 (59.6) 24 (13.9) Fixed term 15 (39.5) 17 (44.7) 6 (15.8) Number of employees at workplace n= 1193
200 or more 78 (33.2) 135 (57.5) 22 (9.4) 20 to 199 99 (26.6) 234 (62.9) 39 (10.5) 5 to 19 96 (32.5) 154 (52.6) 43 (14.6) Less than 5 111 (38.4) 120 (41.7) 57 (19.7) Hands in liquids n=1201 Less than or equal to two hours 347 (34.8) 509 (59.5) 139 (13.9) More than two hours 38 (18.6) 142 (78.9) 23 (11.3) Chemical exposure n=1201 Unexposed 122 (29.1) 206 (49.3) 90 (21.5) Exposed 263 (33.6) 445 (57.1) 72 (9.2)

Wet work exposure and the provision of wet work control measures in Australian workplaces 44
Table 14. The number and percentage of workers provided with the following wet work control measures: Gloves, Barrier creams and moisturisers, Labelling and warning, and Training, in their workplaces by industry
Industry Gloves n (%)
Barrier creams &
moisturisers n (%)
Labelling & warning
n (%) Training
n (%) Transport & storage 50 (65.8) 38 (50.0) 37 (48.7) 34 (44.7) Manufacturing 147 (82.6) 107 (60.1) 115 (64.6) 77 (43.3) Construction 105 (62.5) 70 (41.7) 63 (37.5) 63 (37.5) Agriculture, forestry & fishing 78 (67.8) 51 (44.4) 41 (35.7) 32 (27.8) Health & community services 318 (88.1) 264 (73.1) 235 (65.1) 211 (58.4) Electricity, gas & water supply ~~ ~~ ~~ ~~ Wholesale & Retail trade 44 (84.6) 29 (55.8) 35 (67.3) 22 (42.3) Accommodation, cafes & restaurants 45 (93.7) 17 (35.4) 25 (52.1) 14 (29.2) Communication services ~~ ~~ ~~ ~~ Finance & insurance ~~ ~~ ~~ ~~ Property& business services# 24 (61.5) 15 (38.5) 18 (46.1) 11 (28.2) Government administration & defence# 19 (54.3) 12 (34.3) 22 (62.9) 14 (40.0) Education 39 (53.4) 22 (30.1) 27 (37.0) 18 (24.7) Cultural, recreational & personal services# 21 (65.6) 16 (50.0) 15 (46.9) 8 (25.0)
Mining ~~ ~~ ~~ ~~ ~~: number and percentage not provided if the base size is 10 or less #: caution small base size, results are indicative only
Table 15. The number and percentage of workers provided with the following wet work control measures: Time restriction, Other controls only, and No control measures, in their workplaces by industry
Industry Time restriction
n (%)
Other controls only n (%)
No control measures
n (%) Transport & storage 22 (28.9) 39 (51.3) 15 (19.7) Manufacturing 65 (36.5) 96 (53.9) 17 (9.5) Construction 69 (41.1) 70 (41.9) 28 (16.7) Agriculture, forestry & fishing 44 (38.3) 50 (43.5) 21 (18.3) Health & community services 109 (30.2) 230 (63.7) 22 (6.1) Electricity, gas & water supply ~~ ~~ ~~ Wholesale & Retail trade 19 (36.5) 29 (55.8) 4 (7.7) Accommodation, cafes & restaurants 14 (29.2) 31 (64.6) 3 (6.3) Communication services ~~ ~~ ~~ Finance & insurance ~~ ~~ ~~ Property & business services# 9 (23.1) 20 (51.3) 10 (25.6) Government administration & defence# 9 (25.7) 16 (45.7) 10 (28.6) Education 10 (13.7) 43 (58.9) 20 (27.4) Cultural, recreational & personal services# 7 (21.9) 18 (58.1) 6 (18.7) Mining ~~ ~~ ~~ ~~: number and percentage not provided if the base size is 10 or less #: caution small base size, results are indicative only

Wet work exposure and the provision of wet work control measures in Australian workplaces 45
Table 16. Results (relative risk ratios and 95% confidence intervals) of a multinomial logistic regression model#^ examining the factors affecting the likelihood of the provision of time restriction as a control measure as opposed to other controls and no controls Other controls only No controls Number of employees at workplace 200 or more (ref) -- -- 20 to 199 1.31 (0.89-1.93) 1.28 (0.65-2.54) 5 to 19 1.05 (0.68-1.62) 2.47 (1.21-5.02)* Less than 5 1.32 (0.73-2.38) 2.98 (1.23-7.21)* Employment arrangements Permanent (ref) -- -- Temp/casual 0.98 (0.64-1.49) 1.36 (0.73-2.53) Fixed term 0.46 (0.22-0.99)* 0.56 (0.17-1.80) Industry ** Transport & storage (ref) -- -- Manufacturing 0.87 (0.44-1.71) 0.43 (0.16-1.13) Construction / Electricity, gas & water supply 0.81 (0.38-1.72) 0.67 (0.25-1.82) Agriculture, forestry & fishing / Mining 1.15 (0.49-2.69) 0.42 (0.12-1.40) Health & community services 1.33 (0.67-2.62) 0.24 (0.09-0.65)* Wholesale & Retail trade 1.27 (0.51-3.19) 0.37 (0.08-1.71) Accommodation, cafes & restaurants 1.41 (0.56-3.70) 0.19 (0.03-1.13) Property & business services / Communication services / Finance & insurance 0.92 (0.30-2.87) 2.16 (0.61-7.66)
Government administration & defence 1.14 (0.41-3.19) 1.49 (0.41-5.32) Education 3.83 (1.36-10.77)* 3.87 (1.12-13.34)* Cultural, recreational & personal services 1.14 (0.33-4.00) 0.84 (0.16-4.50) Exposure of the skin to wet work No / low / high exposure -- -- Very high / unsafe exposure 2.31 (1.48-3.58)* 1.60 (0.79-3.23) Exposure of the skin to chemicals No / low exposure -- -- Exposure 1.07 (0.77-1.48) 0.42 (0.26-0.68)*
Observations N =927 # Reference category for the multinomial regression equation was ‘wet work time restriction’/ ‘wet work time restriction in combination with other controls’ ^ Model also adjusted for gender and age * p<0.05 ** For the models the following industrial groupings have been combined: Construction and electricity, gas and water Agriculture, forestry & fishing and Mining Property and business services, Communication services and Finance and Insurance