multidate sar/tm synergism for crop classification ... - asprs
TRANSCRIPT

PEER.REVIETYED ARI ICTE
Multidate SAR/TM Synet$ism fotGrop Classification in Western Ganada
B. Brisco and R. J. Brown
AbstractMultidate synthetic aperture radar (s,+n) and Thematic Map'per (rv) visible and near-infrared (vN:,R) data were evaluated
ior classifying crcps frequently grown in western Canado.The vlttR data were supefior to the sAR data for single dateclassifications due to the multispecttal information content.Multi'date classifications with s'c,n data improved classiftca-tion accuracy from 30 to 74 percent although multidate vNnproduced the highest single sensor rcsult of 90 percent cot-iect classification. This was slightly improved to 92 percentby including the sAR data with the vvn data. However,tiansformed divergence statistics show that the sAR and vNIRchannels are both found in the top eight channels, and, in-deed. the best two sAR channels and the best two yNIR chan-nels, based on their transformed divergence statistics,produced an overall classification accutacy of BS petcent.Furthermore, the May rtvt data combined with the sAR dotayielded an 87 percent conect classification bec.ause the grainand alfalfa classes were much bettet sepatated when vl uadata was combined with SAR data. These results demonsttatesignificant synergism between the two sensorc and suggesttie need for a featurc selection approach, or at least aknowledge baied system incorporating the synergism effect,once multidate, multisensor data become available on o te7-ular basis. The substitution of san data beneath cloud cov-ered terrain in rm data is used to demonstrate anotheraspect of santvNm synergism.
lntroductionRemote sensing techniques have become an important toolfor resource minagement, with successful mapping and mon-itoring projects demonstrated for a wide variety of applica-tions.-Ohe such application is crop identification andmonitoring (Ryerson et al., 1985', Boatwright and Whitehead'1986; Sharman, 1990). One of the limitations of using remotesensing data for this application is data availability fu9 to-cloud cover and the relatively long repeat cycle of the highspatial resolution optical sensors. This has led to the i-plg-mentation of a Crop Information System (cts) within Canadawhich utilizes a cohpositing procedure using low resolution,high temporal coverage data, provided by the Advanced Veryttigh Resolution Radiometer (arrsnn), into weekly images(Biown et d1., 1990). These weekly images are used to gener-ate normalized difference vegetation indices (NnvI) which arethe basis for the crop condition assessment. The increasedinformation content in the finer spatial resolution Thematic
Mapper (rrra) and sPor HRV imagery is offset by the uncer-tainty of data availability.
ihe impending launch of RaoaRsar and other existingspaceborneiynthetlc aperture radar (saR) sensors, such asthe European Remote Sensing Satellite (ens-l) and the fapa-nese Earih Resource Satellite [nns-r), is changing this situa-tion. Due to the all-weather, day or night capabilities of saR,imagery will be available on a regular and tim-ely basis- Thesv.tJ.eirm of sRR and visible and near-infrared (vNtR) datahas bJen previously demonstrated for some applications(Ahern et'a1.,1.978i Ulaby ef a1.,1'gB2: Brisco, 1985) and wil lbe expanded upon within this paper. SAR has the potentia.l toprovide unique information on a timely basis due to it's allweather daylnight capabilities' Because of these implications,the CanadaCenlre foi Remote Sensing (ccns) is undertakingresearch to develop the procedures to integrate SaR data intothe cIS. The researih program is using microwave data homground-based and airborne platforms to achieve this objec-tive (Brown, 1987).
During the summer of tgsa, an extensive multidate air-borne San data set was acquired of a site near Saskatoon,Saskatchewan. Early and mid-season cloud-free TM imagerywere also available. This data set provided an excellent op-portunity to investigate the synerglsm of sAR and vNtR dataio. ..op
"l"tsificatidn in weslern Canada. Specifically the ob-
lectivei of the study presented in this paper were
o To evaluate the crop classification accuracy achieved using c-
HH sAR and rM data alone and in combination for crops com-
monly grown in western Canada,r To demionstrate the impact on crop classific-ation accuracy of
replacing cloud covered TM data with SAR data, andr To evaluate the improvement in crop classification accuracy
using multidate nra and sAR data.
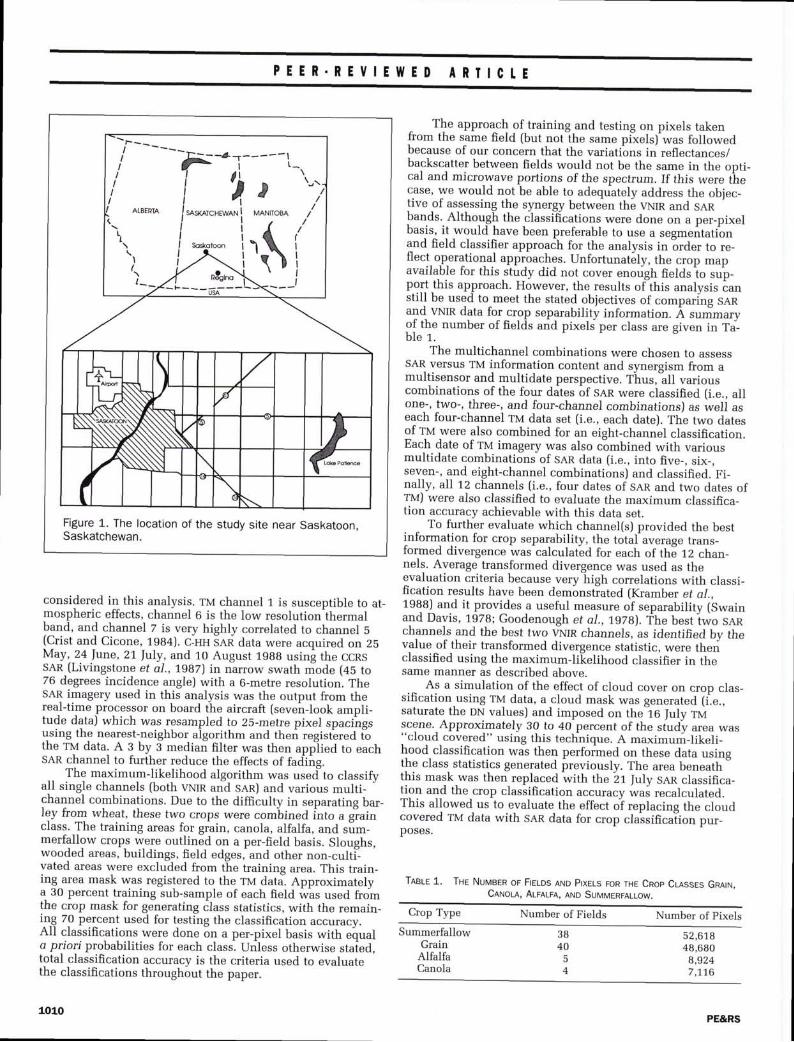
Study Area, Data Set, and APProachThe test site is located east of Saskatoon, Saskatchewan in apredominately agricultural area where there are fields of can-^ola.
barlev, *h"it, summerfallow, and alfalfa (Figure 1)' Thisarea is characterized as a glaciolacustrine plain with minorareas of hummocky topogiaphy. The surficial geological de'oosits are predominanilv eliciolacustrine clays and siltsi"ni"n havL developed into Dark Brown soils' Annual precip-itation is approximately 350 mm per-year. _
Geocoded cloud-free TM scenes from 28 May and 16 fuly19BB were obtained, but only TM channels 2 through 5 were
B. Brisco is with Intera Information Technologies, 2 Gurd-wara Road, Suite 200, Nepean, Ontario KzE 1A2, Canada.
R.J. Brown is with the Canada Centre for Remote Sensing,588 Booth Street, Ottawa, Ontario K1A 0Y7, Canada.
PE&RS
Photogrammetric Engineering & Remote Sensing,Vol. or, No. B, August 19s5, pp' 1009-1014'
oogs - 1 1,r2 / 95 /6 1 0S- 1 009$3. O0/0O 1995 American Society for Photogrammetry
and Remote Sensing
PEER.REVIEWED ARI ICTE
Figure 1. The location of the study site near Saskatoon,Saskatchewan.
. Tl" approach of training and testing on pixels takenIlom the s-ame field (but not the same pixels)'was followedbecause of our concern that the variatibns in reflectances/backscatter between fields would not be the same in the opti-cal and microwave portions of the spectrum. If this were thecase, we would not be able to adequately address the objec-tive of as-sessing the synergy betwe-en the vNn and sanbands.. Although the classiffcations were done on a per-pixelbasis, it would have been preferable to use a segmentatiionand field classifier approach for the analysis in
"order to re-
fl ect, operati or1a.l ap pr-oaches. Unfortunately, the crop mapavailable for this study did not cover enough fieldsio sup-portlhis approach. However, the results oflhis analysis ianstill be used to meet the stated objectives of comparing saRand vNIR data for crop separability information. A surimaryof the number of fields and pixelj per class are given in Ta"-b le 1.
The multichannel combinations were chosen to assessSAR versus Tu information content and synergism from amultisensor and multidate perspective. t-hus,
-all various
combinations of the four dates of san were classified (i.e., allone-, two-, three-, and four-channel combinations) as well aseach four-channel TM data set (i,e., each date). The two datesof TM were also combined for an eight-channel classification.Each date of ttr imagery was also combined with variousmultidate combinations of SaR data (i.e., into five-, six-.seven-, and eight-channel combinations) and classified. Fi-nally, all 12 channels (i.e., four dates of sAR and two dates ofTM) were also classified to evaluate the maximum classifica-tion accuracy achievable with this data set.
To further evaluate which channel(s) provided the bestinformation for crop sepArability, the totafaverage uans-formed divergence was-calculatLd for each of th6 rz chan-nels. Average transformed divergence was used as theevaluation criteria because very high correlations with classi_fication results have been demonstiated (Kramber ef o,1.,1988) and it provides a useful measure of separability (Swainand Davis, 1978; Goodenough et al.. 1S7B). The best iwo saRchannels and the best two vNrR channels, as identified by thevalue of their transformed divergence statistic, were thenclassified using the maximum-lilelihood classifier in thesame manner as described above.
As a simulation of the effect of cloud cover on crop clas_sification using TM data, a cloud mask was generated (i.e..saturate the Dn values) and imposed on the16 July rrras.cene._Approximately 30 to 40 percent of the study area was"cloud-covered" using this technique. A maximu--liteti-hood classification was therl performed on these data usingthe class statistics generated previously. The area beneath "this mask was then replaced with the
-Zf Jrrlv saR classifica-
tion and the crop classification accuracy wai recalculated.This allowed us to evaluate the effect oi replacing the cloudcovered TM data with sAR data for crop claisificuiion pu.-poses.
TneLe 1. THe NuMeeR or Freros lt.ro prxels roR rxe CRop Cusses Gnalru,CANoLA, ALFALFA, nruo SuMvERrnrlow.-
considered in this analysis. tlra channel 1 is susceptible to at-mospheric effects, channel 6 is the low resolution^thermalband, and channel 7 is very highly correlated to channel S(Crist and Cicone, 1gB4). c-HH Sari data were acquired on 25May,,24 June, 21 July, and 10 August 1988 using the CCRSsAR_(Livingstone ef it., n}zl in n-arrow swath riode (+s to76 degrees incidence angle) with a 6-metre resolution. TheSAR imagery used in this analysis was the output from thereal-time processor on board the aircraft (seven-look ampli-tude data) which was resampled to 25-metre pixel spacingsusing the nearest-neighbor algorithm and then regist^ered iothe rM data. A I by 5 mediai filter was then app"lied to eachSAR channel to further reduce the effects of fading.
The maximum-likelihood algorithm *as ,tsedto classifyall single channels (both vNn and san) and various multi-
-
channel combinations. Due to the difficulty in separating bar-ley from wheat, these two crops were com-bined into a giainclass. The training areas for grain, canola, alfalfa, and sim-merfallow crops were outlined on a per-field basis. Sloughs,wooded areas, buildings, field edgesf and other non-culti*-vated areas were excluded from the training area. This train_ing_area mask was registered to the TM data-. Approximatelya. 30 percent training sub-sample of each field was used fromthe crop mask ibr generating class statistics, with the remain_iLq Z_O percent used for testing the classification accuracy.All classifications were done on a per-pixel basis with e[uala prjo! probabilities for each class. Unless otherwise staied,total classification accuracy is the criteria used to evaluatethe classifications throughout the paper.
1010
Crop Type Number of Fields Number of Pixels
SummerfallowGrain
AlfalfaCanola
3840
tr
52,61848,6808,9247,1 ,16
PE&RS

PEER.NEVIEWED ARI ICTE
Results and DiscussionThe classes exhibited Guassian or near Guassian distribu-tions. Equal a priori probabilities were used because unequala priori probabilities were inappropriate for our objectives.Unequal a priori probabilities are useful when attempting tominimize risk or ensure that all of a particularly large classbe correctly identified. For example, if 80 percent of a regionwere wheat, then one could force a high classification accu-racy of wheat by using a proportionatley high a priofi proba-bility. However, this would give no insight into how wellone could distinguish between wheat and the minorityclases. In this study, the objective was to evaluate separabil-ity between the various classes.
The single channel classification accuracies for the TMand saR data can be found in Table 2. In general, the fulydata are superior to the other dates in correctly classifyingthe crop types in both the VNIR and microwave regions. Thistime period has been found to be superior for crop classifica-tion purposes in other multitemporal studies (Brisco ef o1.,1992; Foody ef 01., 1989; Brown et al., 1984, Brown ef o1.,1980) and has been attributed to the crops being at maxi-mum phenological development during this time.
There are some other interesting observations in Table 2.For example, the alfalfa crop is most accurately identified inthe May TM channels 2 and 3 and the June SAR data. Alfalfais the first crop to green up after the winter and thus be-comes seDarable from the other cultivated areas in the visiblechannelsbf the TN,t sensor. The repeated harvest of the alfalfacrop throughout the growing season influences the radarbackscatter because uncut and cut alfalfa have different sig-natures. The importance of the crop calendar on class sepa-rability for alfalfa and other hay crops using SAR data hasbeen previously reported (Brisco et al., 'Ls8,4). For example,the alfalfa is poorly classified in the August c-HH image, per-haps because of recent harvest operations.
Also note that, although canola is most accurately identi-fied in luly and then August, it becomes separable (zz percent correct classification) as early as /une in the SAR data.Canola is a broadleaf crop with high moisture content, andthus only a little plant growth is required before significantbackscatter occurs in the microwave region (Brown ef o1.,198a). The crop must be in flower before accurate identifica-tion in the vNIR region (Brown et al., 1.980). Summerfallowcan be identified with greater than 80 percent accuracy onTM channels 2 and 3 in Iulv and on the C-HH sRn channel by
August, However, a single sAR image alone mqy give deceiv-ing-results when identifying summerfallow fields' The radarbaikscatter value will be strongly dependant upon whetherthe field has been cultivated to reduce weed growth and onthe soil moisture content.
Finally, note the poor separability of grains throughoutthe growing season ifbnly one channel is being considered.The poor separability of the wheat and barley crops in boththe microwave and vNtR regions of the electromagnetic spec-trum has been previously reported as well (Brown ef 41.,1.984; Brisco ef d1., 19Bg). This is due to the very similarstructure and color of the grain crops' This problem may beovercome by using crop rotation information, historical aver-ages, crop calendar differences, and/or other anc_illary infor-mation. Ccns is pursuing these approaches to solving thesmall grain classification problem and will report on the pro-gress in the future.
An increase in the number of dates of saR used in theanalysis results in increased total classification accuracy 9n-til a'maximum of 74 percent is achieved with four dates (Ta-ble 3). Bush and Ulaby (1978) predicted reaching 90 percentaccuracy with four dates of microwave data in a simulationstudy but the revisits were ten days apar]' The SaR data usedin this study were acquired approximately a month -apart,which may be too long a time period to maximize changes- intarget properties (dielectric and geometric) as a function ofthe crop Calendars. Multitemporal observation certainly doesincrease classification accuracy, as many other studies haveobserved (Brisco et ol., 1.gg2t Le Toan et al., 1'9Bg; Foody efa1., tg8g; Brisco et aI., 1984i Hoogeboom, 1983). The suc-cessfuI launch of eRS-r and JrRs-r and the upcomingRADARSAT and nRs-z spaceborne SARS means that more andmore sAR data will be available in future years' As sAR cali-bration techniques have recently improved (Freeman, 1992),it is feasible to expect calibrated products to become moreroutinely available from these platforms. This will make itpossible to effectively use data from different sensors whichwill enhance using multidimensional approaches, includingmultitemporal, for crop classification.
Thisiame effect is seen in the Tlr.l data (Table 4). Forthis analysis, all four channels of the TM data (i.e., TM 2 to 5)were used in the classification algorithm for each date and
TnsLe 3. MuLTIDATE Cnop Clrsstncnrtoru Accunrcv Ustruc C-HH SAR Dnn(25 Mnv, 24 Jurue, 2L Juw, nr.ro 10 Aucusr 1988).
Yo Correctlv CIassified
Trere 2. Srllcrr-Cnntrurr CRop CrnssrRcnrroru REsurrs UsrNG 1988 TM AND Channel Summer- AccuracyC-HH SAR Dnrn. Combination fallow Grains Alfalfa Canola % + Std. Dev.
Yo Correctlv Classified Overall 2 ChannelMay/JuneMay/JulyMay/AugustJune/JulyJune/Augustjuly/August
3 ChannelMay/fune/fulyMay/June/AugMay/July/AugJune/fuIy/Aug
4 ChannelMay/|un/ful/Aug
ChannelSummer-
fallow Grains AlfalfaAccuracy
Canola % + Std.Dev.
50o /
687777
1o+J J
5 2a c
o o
7 2 7 5 5 0 + 3 44 0 s 2 6 3 + 2 22 2 8 1 3 8 + 3 55 8 9 1 6 7 + 1 76 1 8 2 6 5 + 1 64 7 8 9 6 6 + 1 8
6 3 S 2 6 9 + 7 76 6 8 4 6 7 + 1 66 0 9 0 7 0 + 7 46 8 8 S 7 2 + 7 3
25 May C-HH28 May 'till 2
T M 3T M 4T M 5
24 Jtne C-HH16 fuly TM-2
TM-3TM-4TM-5
27 July C-HH10 Aug C-HH
) a
o /
6g5 56356o o
88
7882
1 800
3 344
0
543B5455
b /
7268/ J
2 1 5 1 2 8 + 1 57 3 4 7 4 5 + 3 371, 55 49 + 334 3 5 4 4 6 + 1 04 6 2 2 4 4 + 7 76 5 7 2 4 8 + 3 31,7 77 50 + 365 5 7 S 5 7 + 3 8
0 8 4 5 4 + 3 85 6 a 4 6 4 + 2 71 9 9 1 6 1 + 3 24 8 1 5 6 + 3 7
J J
4662J U
PE&RS
7 4 + T 2

PEER.REVIEWED ARI ICTE
Inere 4. Srncre DnrE lruo TwoDnte TM Cnop Cr_lssrncnrrot AccuRncres(1988).
Tnere 6. Trr Torel AvERnce TRANSFoRMED DrveRcerucr Sterrsrrcs FoR CRopTvpe rRou Encr SAR nruo TM Csl.nel.
% Correctly Classified
ChannelsSurnmer-
fallow Grains Alfalfa Canola o/oAccuracy+ Std. Dev. Channel
TotalTransformedDivergence
TM 2-s (28 May)TM 2-s (ro fuly)TM 2-5 (both dates)
% Correctly Classified
Summer-fallow Grains Alfalfa Canola o/o
28 May 1988 TM-228 May 1988 TM-328 May 1988 TM-428 May 1988 TM-s16 fuly 1988 TM-216 fuly 1988 TM-316 Iulv 1988 TM-416 Iuli 19Bs TM-s25 May 1S88 C-HH SAR24 fune 1988 C-HH SAR21 fuly 19s8 C-HH SAR10 Aug 1988 C-HH SAR
6 3 5 8 8 2 5 3 6 4 + 1 38 9 7 3 6 3 9 0 7 9 + 1 39 1 9 1 8 8 9 0 9 0 + 1
8 7 8 5 8 5 9 1 8 7 + 39 0 8 0 7 6 9 2 8 5 + 89 1 9 4 8 9 9 4 g 2 + 2s 0 7 S 7 2 9 3 8 4 + 1 0
2 . 22 . 6z .u't .4
J - Z
4.55 . 25 .60 . 12 . O5 . J
5 . 5
TneLe 5. SAR/IM Mulrr SerusoR Cnop CussrrrcnloN AccuRActES (1gSg).THe C-HH SAR Dnrl Wene Aceurnro oN 29 MAy, 24 JuNt,21 Jurv. nr.ro 10
Aucust.
All four SAR
OverallAccuracy+ Std. Dev.
+ TM 2-5 (28 May)+ TM 2-5 (16 luly)+ TM 2-5 (both dates)May, June, July C-HH+ TM 2-s (16 iuly)
TABLE 7. TRANSFoRMED DrvencEtce Slarrsrrc FoR ALL CLAss pnrns ruo EncHor tae t2 CsnnrurLs Berrue Corusroeneo. (Frr_:SuvvERFALLow, Gnn=GRnn,
Arr:Alrnlrn, AND CAN:CANoLA).
Channel Fal/Grn Fal/Alf Fal/Can Grn/AIf Grn/Can Alf/Grn
then for both dates together. The TM sensor performs muchbetter on a single date then the SAR because-of the multis-pectral information content. Indeed, the two dates of tMyield an overall total classification accuracy of g0 percent.This is only slightly improved to g2 percent by adding allfour dates of saR to create a 12-channel data s-et (fable S).This accuracy is sufficient for most crop identification appli-cations.
To be of most use to present crop forecasting ap-proaches, the timeliness and/or accuracy of the informationmust improve on the early August date already achievablewith conventional approaches. In one example, we assumedonly one_date of TM data was available (from July), and itu/as combined with May, /une, and /uly sAn data to evaluateclassification accuracy achievable Uy mid-July. Although thefslltr indicate only an 84 percent classification accur;cy(Table 5), this is close to the operational goal of 90 percentcorrect classification and only improves to 85 percent byadding the August SAR channel. As another example, if-onlva May TM scene were available and it was combined with ailfour dates of saR, then an overall accuracy of 87 percent cor-rect classification was achieved. These results show that onlyone date of rrNIR data combined with multitemporal snn datiwill provide suitable classification accuracies.
The total average transformed divergence for each of the1.-2 channels is presented in Table 6. July rM channel 5 hasthe overall highest separability, followed very closely by theJuly and August SAR data. July rv channels 4, 3, and 2 arenext, followed by May ttvt channels 2, 3, and 4 and the funeSAR. Note jha! May TM channel 5 and, in particular, the MaySAR provide the least separability. These results further dem-onstrate the synergism of both the rv and SaR sensors andthe optimum date for data acquisit ion.
The synergism is related to both the different informa-tion on crop type as a function of wavelength and the changein information with time. Table Z provides the transformed-divergence statistic for each class pair and all 12 channelsbeing considered. The July/Augusl rv and sAR data providethe most separability at a given time because of maximum
LOU}
differences in crop phenology. This is followed by the addi-tion of May TM data, which incorporates the change due tothe crop growth stages in the separability informatlon. Notethat the May rv data provide the best summerfallow/alfalfaand grain/alfalfa separability. As discussed earlier. this canbe related to the physical interaction of the radiation withthe cr-ops. For example, TM is superior for separating sum-merfallow from grain classes due to the marlied speitral dif-ference (i.e., green versus brown/black). However, the SARdata are superior for separating canola, especially early inthe growing season, due to ththigh backstatter fro- thebroad-leafed crops as opposed to ihe lower backscatter fromgrains and summerfallow. AIs-o note that the grain class sepa-rability benefits from the combined sAR and irvr data largelybecause of reduced confusion with alfalfa and summerAltowon TM data and increased separability from canola on theSAR data.
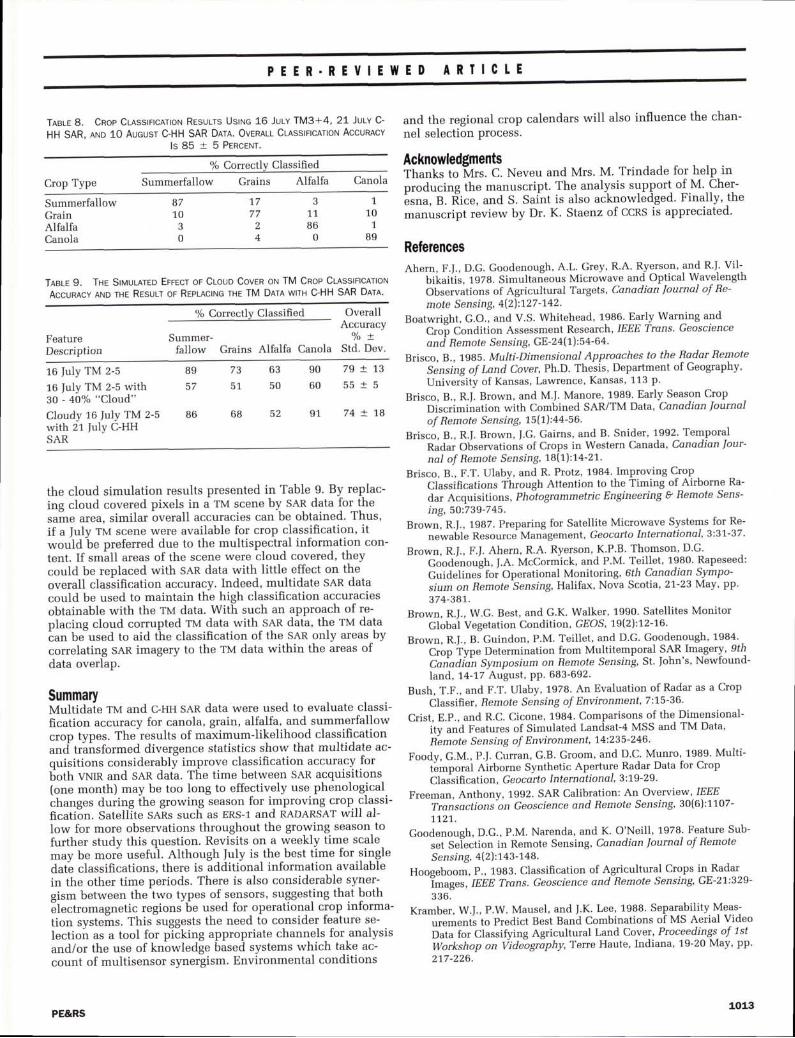
To demonstrate this, the best four channels, as identifiedby the transformed divergence statistics, were classified withthe results given in Table B, The overall accuracv of 85 per-cent obtained with two fuly ru channels, and the July andAugust sAR data are better then that obtained with thL four-channel SAR (74 percent) or the four-channel Julv Tv data(79 percent). It is also approximately the same
"i..r.u"y u,
that obtained by using all four SAR images with either date ofTM data.
A final example of the synergism of sAR and TM data is
May C-HHlun. C-HHJul. C-HHAug. C-HHTM4 MayTM-3 MayTM-4 MayTM-5 MayTM-2 fulyTM-3 lulyTM-a JulyTM-s fuly
o.o2o.o70.490.430.330.350.360.250.891.05o.201.04
0,03o.1.2o.o20.157.O27 . 7 20.100.610.967 . 1 70.05o.62
0.020 .581 .841 .95o.24o.29o.320.107 .221 .62L . 8 71 .81
o.o20.18o.340.09o.250.350.sg0.14o.o20 . 1 00.05o.29
0.01o.281 . 1 07 . 3 70.010.010.010.040.080.181.330.53
0.000 .81L . 7 51 . 5 10 .350.450 .58o .24o.o20.4't1 .661 . 3 0
PE&RS
PEER.REVIEWED ARI ICTE
TreLE 8. CRop CusstncertoN RESULTs Usrxc 16 JULY TM3+4, 21 Jut-v C-HH SAR, AND 10 Aucusr C-HH SAR Dnrn. OveRnu Cusstncnttotrt AccuRncv
l s 8 5 + 5 P e n c e r r '
% Correctly Classified
Crop Type Summerfallow Grains Alfalfa Canola
SummerfallowGrainAlfalfaCanola
Taere 9. THe Stvuurro EFFECT oF Ct-ouo Coven oru TM Cnop CLASslFlcAloN
AccuRAcy AND THE Resurt or Repnctnc rHE TM Dnrn wrrH C-HH SAR Dnrl'
o/o Correctlv Classified
5 1
68
the cloud simulation results presented in Table 9. By replac-ing cloud covered pixels in a TM scene by san data for theruitu *uu. similar overall accuracies can be obtained. Thus,if a luly TM scene were available for crop classification, itwould be preferred due to the multispectral information con-tent. If smill rreas of the scene were cloud covered, theycould be replaced with sAR data with little effect on theoverall clasiification accuracy, Indeed, multidate sAR datacould be used to maintain the high classification accuraciesobtainable with the TM data. With such an approach of re-placins, cloud corrupted rv data with SAR data, the TM dataian bJused to aid the classification of the sAR only areas bycorrelating sAR imagery to the TM data within the areas ofdata overlap.
SummaryMultidaie ttvt and c-HH sAR data were used to evaluate classi-fication accuracy for canola, grain, alfalfa, and summerfallowcrop types. The-results of maximum-likelihood classificationand trinsformed divergence statistics show that multidate ac-quisitions considerably improve classification accuracy forboth vNn and SaR data. The time between SAR acquisitions(one month) may be too long to effectively use phenological
"huttg"r during ihe growing season for improving crop.classi-
ficati6n. Satellite saRs such as ERS-1 and RaDaRsar will al-low for more observations throughout the growing season tofurther study this question. Revisits on a weekly tim^e scale-may be mor'e useful. Although July is-the-best time for singledatL classifications, there is additional information availablein the other time periods. There is also considerable syner--gism between the two types of se-nsors, suggesting that bothElectromagnetic regionsbe used for operational crop informa-tion systems. This suggests the need to consider feature se-Iection as a tool for p'iiking appropriate channels- for-analysisand/or the use of knbwledge based systems which take ac-count of multisensor synergism. Environmental conditions
and the regional crop calendars will also influence the chan-
nel selection process.
AcknowledgmentsThanks to l4rs. C. Neveu and Mrs' M. Trindade for help in
producing the manuscript' The analysis support of M' Cher-Lsna, B. flice, and S. Saint is also acknowledged' Finally, the
manuscript review by Dr. K. Staenz of ccRs is appreciated'
RefelencesAhern, F.J., D.G. Goodenough, A'L. Grey, R'A. Ryerson, and R'J' Vil-
biiaiiii, 1978. Simultarieous Microwave and Optical WavelengthObservations of Agricultural Targets, Canadian lourna) of Re-
mote S e n s ing, 4(2) il27 - 1' 42'
Boatwright, G.O., and V.S. Whitehead, 1986' Early Warning and
Cro! Condition Assessment Research, IEEE Trans' Geoscienceand Remote Sensing, GE-24(l:5a-64'
Brisco, 8., Ig85. Multi-Dimensional Approoches to the Rador Remote
Sensing of Land Cover, Ph.D. Theiis, Department of Geography'
University of Kansas, Lawrence, Kansas, 113 p'
Brisco, B., R.f. Brown, and M'f. Manore, 1989. Early Season Crop- Oir"ti-i"ation with Com6ined SAR/TM Dara' Canadian loutnalof Remote Sensing, 15(1):44-56.
Brisco, 8., R.J. Brown, J.G' Gairns, and B. Snider, 1992- TemporalRadar Observations of Crops in Western Canada, Canadian lour-nal of Remote Sensing, l8(l):Ia-21.
Brisco, B., F.T. Ulaby, and R. Protz, 1984' Improving C-r9g
Classifications Through Attention to the Timing of Airborn^e Ra-
dar Acquisitions, Photogrammetric Engineering & Remote Sens'
ing,5O:739-745.Brown, R.J., 1987. Preparing for Satellite Microwave Systems for Re-
.r"*.b1" Resourcd Manigement, Geocarto International, 3i31--37 '
Brown, R.I., F.I. Ahern, R.A. Ryerson. K,P.B. Thomson' D'G'
Coode"ough, J.A. McCormick, and P.M' Teillet, 1980' Rapeseed:
Guidelines* foi Operational Monitoring, 6th Canadian SWpo'
sjum on Remote Sensing, Halifax, Nova Scotia, 21-23 May' pp'
374-341..Brown, R.1., W.G. Best, and G.K' Walker, 1990. Satellites Monitor
Global Vegetation Condition ' GEOS' 79(2):1'2-t6'
Brown, R.J., B. Guindon, P.M. Teillet, and D'G' Goodenough, 1984'.
Crop fype Determination from Multitemporal SAR Imagery' 9ti
Caiadian Symposium on Remote Sensing, St' John's, Newfound-
land, ta-tz August, PP. 683-692.
Bush, T.F., and F.T. Ulaby, 1978. An Evaluation of Radar as a Crop
Classifi er, Remote Sensing of Environment, 7 :75-36'
Crist, E.P., and R.C. Cicone, 1984' Comparisons of the Dimensional-
ity and Features of Simulated Landsat-4 MSS and TM Data'
Rbmote Sensing of Envitonment, 14:235-246'
Foodv. G.M., P.l. Curran, G.B. Groom, and D'C' Munro, 1989' Multi-
t"emporal Airborne Synthetic Aperture Radar Data for Crop
Classification, Geocarto Internationol' 3:19-29'
Freeman, Anthony, 1992. SAR Calibration: An Overview, IEEETransacti ons' on Ge o science and Remote S ensing, 30(6) : 1 107-
71.27.Goodenough, D.G., P.M. Narenda, and K' O'Neill, 1978' Feature Sub-
set SeLction in Remote Sensing, Canadian lournal of Remote
S e n s i ng, 4(2) :7 43 - 7 48.
Hoogeboom, P., 1983. Classification of Agricultural Crops in-Radar--
Ttttug"t, IEEE Trans. Geoscience and Remote Sensing, GE-27:329-
336.Kramber, W.J., P.W. Mausel, and J.K. Lee, 1988' Separability Meas-
urements to Predict Best Band Combinations of MS Aerial Video
n"t" tot Classifying Agricultural Land Cover, Proceedings of 1st
Workshop on Videbgriphy. Terre Haute, Indiana, 19-20 May' pp'
2 r7-226.
11 0't
8S
11.86
0
7 7z
o /
1 0
0
FeatureDescription
Summer-fallow Grains Alfalfa Canola
OverallAccuracy
o/o +
Std. Dev.
16 fuly TM 2-5
16 fuly TM 2-5 with3O - 4oo/o "Cloud"
Cloudy 16 ]uly TM 2-5with 21 fuly c-HHSAR
90
60
63
5089
J /
7 9 + 1 3
5 5 - t 5
7 4 + 7 891
PEER.REVIEWED ARI IC I .E
Le Toan, T., H. Laur, E. Mougin, and A. Lopes, 1989. Multitemporaland Dual-Polarization Observations of Agricultural VegetationCovers by X-band SAR Images, IEEE Trans. Geoscienc-e and Re_mote Se nsi n g, 27 (6) i7 O9-7 78.
Livingstone, C.E., A.L. Gray, R.K. Hawkins, J.G. Halbertsma, R.A.Deane, and R.B. Olsen, 19S2. CCRS C-band Airborne Radar Sys_tem Description and Test Results, 1Lth Canadian Svmposiui onRemote Sensing, Waterloo, Ontario, 22-25 J\ne, pp. SO'S-Sf A.
Ryerson, R.A., R.N. Dobbins, and C. Thibault, 198b. Timely CropArea Estimates from Landsat, photogrammetric Engineerin[ ARemote Sensrng, S1.(1tlt7 gS-77 43.
Sharman, M., 1990. Calibration and Atmospheric Correction of theAVHRR,JoT the Purpose _of Agriculturai Monitoring in Europe,Proceedings of the ISPRS Mid-Term Symposium in C\obal andEnvironmental Monitoring, Commission VII, Victoria, 8.C., t7_27Sept., pp. 183-186.
Swain, P.H., and S.M. Davis, 1978. Remote Sensing: The euantita-tive Approach. McGraw Hill, New york, pp. {AA_1.2s.
Ulaby-, F.T., R.Y. Li, and K.S. Shanmugan, 1982. Crop ClassificationUsing Airborne Radar and Landsa[ Data, .IEEE Tians. Geoscienceand Remote Sensrng, GE-20:518-528.
(Received 4 June 1992; revised and accepted Z fuly 1993; revised 20August 1993J
Brian G. BriscoBrian G. Brisco was born in Chatham, Ontarioin L954. He received the B.Sc. Honours degreein Ecology from the University of Guelph in1.977 and an M.Sc. degree in Soil Science/LandResource Science, also from the Universitv of
Physical G,eo€raphy/Remote Sensing from the University ofKansas. While attending KU, he wor-ked in the Remote Sens_ing Laboratory as an associate proiect enqineer. In 1987 hereturned to Canada and worked as a posiDoctoral Fellow atthe Canada Centre for Remote Sensing (ccns) through a Na-tional Research Council fellowship. Since 19g9 he f,as beenemployed by Intera Information T^echnologies as a researchscientist under contract to CCRS. His reseaich interests focuson using radar data for. monitoring and managing renewableresources with an emphasis on agionomic ap;li;tions. Dr.Brisco is a member of the Canadiin Remote'Sensing Societyof the Canadian Aeronautics and Space Institute an*il is an "associate editor of the Canodian loirnol for Remote Sensmg.
Ronald f. Brov,'nRon Brown is head of the Applications Develop-ment Section, Canada Centre for Remote Sens-ing (ccns), coordinator within the Radar DataDevelopment Program for applications develop-ment within agriculture, and overall coordinaior
Guelph, in 1980. In 1985 he received the ph.D. degree in
lo.. l+o ap_plications development within CCRS ApplicationsDivision. He holds a PhD in physics from the University ofManitoba but most of the research was carried out at St. an_drews _University, Scotland and the Atomic Energy Establish-ment, Harwell, England. He is a former editor of-iheCanadian lournal of Remote Sensing and was a guest editorof a.special i-ssue of the .Canadian lournal of Refiote Sensingon the use of sAR in agricultural applicatioris, He is also a "principal investigator for SIR-C and inS-r for vegetation re_lated investigations.
t0 R T l t c0 t i l | i l c AR I t C t ts
The following list includes o'ry those articles schedulecl forpublication in PE&fiS tluough lgg5 except for those in theNoveurber GIS Special Issue.R. M. Babon and E M. Eliason, Digital Maps of Mars.Michoel F. Baunrgartner a:ncl Nbert Rango, A Microcomputer_
Based Alpine Snow Covsr Analysis System (ASCAS).lorge Antonio Silva Centeno and Vrctor Haertnl, Adaptive Low_
Pass Fr.rzzy Filter for Noise Removal.lohn L. Dwyer, Fred A. l(nrse, and Adan B. I*Jkoff, Effects of
Bmpirical versus Model-Based Reflectance Calibration onAutornated Analysis of hnaging Spectrometer Data: A CaseStucly from the Drum Mountains, Utah.
Sarrr Ekstrund, Landsat TM-Based Forest Darnage Assessment:(lorrection for Topograplti c Effects.
Petry; (.)ong, Ruiliang Prt, and fohn R. Millen Coniferous Forest LeafArea Index Estimation along the Oregon Transect Using()ornpact Airborne Spectrographic Imager Data.
Matthew Heric, Canvll Lucas, and Cirrstop her Devine, The OpenSkies Treaty: Qrralitative Utility Evaluations of AircraftReconnaissance and Commercial Satellite hnagery.
Ronald Kr.r,ok aud Tom Baltzer, The Geophysical processorSystem at the Alaska SAR Facility.
lussi Inuuni and Topani Sariakoski,lmage Compression by theJPEG Algorithrn.
Donald L. Light, Film Cameras or Digital Sensors? The{)hallenge Ahead for Aerial Imaging.
Michel Massart, Marie P4tillon, and El1onorc Wotff,The Impactofan Agricultural Developrnent project on a Tropical ForestEnvironment: The Case of Shaba (Zaire).
lcutet E. Nr'cio/, Monitoring Tropical Rain Forest Microclimate.
LOL4
K. Olaf Nientarrn, Remote Sensing of Forest Stand Age UsingAirborne Spectrorneter Data.
Elijah W. Ransey 1/I and John R. lensen, Reurote Sensing ofMangrove Wetlands: Relating Canopy Spectra to Site_Specific Data.
Stsphen A. Sade4 Spatial Characteristics of Forest Clearing andVegetation Regrowth as Detected by Landsat ThematicMapper hnagery.
Tian-Yuan S.hri, The Reversibility of Six Geometric ColorSpaces,
Mohamtned E. Shokr, Inurence l.Wilson, andDwayne L. Sutdn_Miller, Effect of Radar parameters on Sea Ice Tonal andTextural Signatures Using Multi-Frequency polarimetricSAR Data.
Patrick /. Starks, Fmnk R. Schiebe, a:rd. lohn F. Schalles,Characterization of the Accuracy and precision of SpectralMeasurements by a portable, Silicon Diode ArravSpectrorneter
Daniel R. Steinwand, lohn A. Hutchinson, and John p. Snyder,Map Projections for Global and Continental Data Sets andan Analysis of Pixel Distortion Caused by Reprojection.
Michael E. Wehde, Digital Image Comparison by SubtractingContextual Transformations: percentile Rank OrdeiDifferentiation.
Gary M. Wo}/, Operational Sea Ice Classification from SyntheticAperture Radar hnagery.
Peter T. Wolter, David l. Mladenoff, George E. Host, and TlorrrasR. Crcw, Improved Forest Classification in the NorthernLake States Using Multi-Temporal Landsat Imagery.
PE&RS