multi-scale high intensity turbulence generator applied to a high pressure turbulent burner
TRANSCRIPT

Multi-s ale high intensity turbulen e generator applied to a high pressureturbulent burnerRomain Fragner1, Ni olas Mazellier2∗, Fabien Halter1,2, Christian Chauveau1 and Iskender Gökalp11 CNRS ICARE, 1C, Avenue de la Re her he S ienti�que, 45072 Orléans Cedex 2 Fran e
2 Univ. Orléans, ENSI de Bourges, PRISME, EA 4229, 45072 Orléans, Fran eAbstra tWe report an experimental study dedi ated to the investigation of the turbulent �ow generatedby a multi-s ale grid and its intera tion with a premixed �ame. The multi-s ale grid is madefrom the ombination of three perforated plates shifted in spa e su h that their mesh size andblo kage ratio both in rease in the dire tion of the mean �ow. It is found that this multi-s alegrid indu es a nearly homogeneous and isotropi (at both large and small s ales) in the potential ore of an axisymmetri premixed burner. A omparison with a single-s ale grid shows thatthe length s ales hara terizing the multi-s ale grid generated turbulen e are smaller than thosemeasured downstream the single-s ale grid, while the turbulent kineti energy produ ed by themulti-s ale grid is mu h larger. The energy distribution through s ales is investigated by meansof the se ond-order stru ture fun tions highlighting an in rease of energy at ea h s ale, whi his even more pronoun ed at small s ales. As emphasized by the third-order stru ture fun tion,energy transfer through s ales is signi� antly enhan ed by the multi-s ale for ing and results, inturns, to an ex eptional fast de ay of the turbulent kineti energy. Our results are ompatiblewith the self-preservation theory where the Taylor mi ros ale is the hara teristi length-s ale.The potential of the multi-s ale for ing is then assessed in a premixed methane-air �ame. Thein�uen e of the turbulen e onto the stru ture of the �ame is evaluated via the turbulent �amespeed. The results obtained for the multi-s ale grid deviate from those obtained for single-s alegrid suggesting that the �ame stru ture may not undergo the in�uen e of large s ales alone, inagreement with re ent observations of �ame front wrinkling by Fragner et al (2014).1 Introdu tionIn the ontext of � lean� energy produ tion, the potential of power generation in a gas turbinefueled with syngas (CO/H2) obtained from biomass or oal gasi� ation, is an attra tive solution.Heat release in a hemi al energy onversion devi e depends on the quantity of fuel whi h an beburnt per unit of time. Turbulen e is a key parameter to in�uen e the heat release rate and �ame-turbulen e intera tions need to be well hara terized to model this e�e t. In this ontext, severalprevious studies investigated su h intera tions numeri ally (Bray, 1979; Poinsot et al, 1991) orexperimentally. However, these studies were limited to the �amelet regime (Borghi, 1985) wherethe turbulen e only a�e ts the global stru ture of the �ame but keeps the lo al, instantaneous,laminar behavior un hanged. Usually, �ame-turbulen e intera tions are lassi�ed in the so- alled ombustion diagram (Borghi, 1985) whi h is based on phenomenologi al arguments. One of themain assumptions underlying ombustion diagram modeling is that it relies on the homogeneityand isotropy of turbulent �ow.Flow inhomogeneity and anisotropy aused by the experimental apparatus, boundary ondi-tions as well as initial onditions may lead to misinterpretations of �ame-turbulen e intera tions.To over ome these drawba ks, one has to design a turbulen e generator allowing for exploring abroad range of �ame-turbulen e intera tion regimes while keeping inhomogeneity and anisotropylevels as low as possible. Experimentally speaking, �ow passing through a grid generates a nearlyhomogeneous and isotropi turbulen e. It is the reason why su h �ows have been extensivelyinvestigated in the framework of turbulen e modeling. The amount of turbulent energy produ ed∗Corresponding author. Email : ni olas.mazellier�univ-orleans.fr1

by regular grids is proportional to their drag oe� ient (Bat helor and Townsend, 1948) whi hdepends on their blo kage ratio σ (ratio of the blo ked area to the total area overed by the grid)(Laws and Livesey, 1978). Turbulen e generated by regular grid is hara terized by low turbu-len e intensity (⟨u2⟩1/2 /U of the order of few per ent with ⟨u2⟩1/2 the root-mean square of the�u tuating velo ity and U the mean velo ity) and a ordingly moderate Taylor-based Reynoldsnumbers Reλ (≡ ⟨
u2⟩1/2
λ/ν where λ is the Taylor mi ros ale and ν the kinemati vis osity).This limitation restri ts the interest of standard grid-generated turbulen e to explore only someregimes of the ombustion diagram.There have been many attempts to over ome this issue, i.e. generate turbulent �ows at highReynolds numbers keeping homogeneity and isotropy properties as good as possible (Corrsin,1963). To address this issue, the use of multi-s ale grid generated turbulen e has emerged. One an ite, for instan e, the a tive grid �rst designed by Makita (Makita, 1991) and then investi-gated by the group led by Warhaft (Mydlarski and Warhaft, 1996; Good and Warhaft, 2011).A tive grids are made of a frame of rotating rods equipped with small wings. The rotation of therods are driven by independent step motors allowing for random or in-phase motions indu ingthereby a time and spa e dependent blo kage ratio. High turbulen e intensities an be a hievedwith a tive grid (up to 10%) and onsequently very high Reynolds numbers (Reλ ∈ [150; 1000]).However, a tive grids generate noti eably higher inhomogeneity and anisotropy levels than stan-dard grids. Another lass of multi-s ale generated turbulen e is the fra tal grid developed by thegroup led by Vassili os (Hurst and Vassili os, 2007; Mazellier and Vassili os, 2010; Valente andVassili os, 2011). Fra tal grids are passive planar grids made from the reprodu tion of a givenpattern at di�erent s ales whi h an indu e high values of turbulen e intensity (within the range4% to 8%) with lower blo kage ratio ompared to standard regular grids. The isotropy level is lose to that of a tive grids and mean �ow inhomogeneities leading to turbulen e produ tionpersist further away than for the standard grid-generated turbulen e. Fra tal-grid generatedturbulen e is hara terized by an unusual fast de ay of the turbulent kineti energy whi h hasbeen interpreted by a breakdown of the standard Ri hardson-Kolmogorov as ade (Mazellierand Vassili os, 2010; Valente and Vassili os, 2011). Another passive multi-s ale grid was de-veloped and investigated by Mazellier et al (2010). Their turbulen e generator was made fromthe ombination of three perforated plates shifted in spa e su h that their mesh size and blo k-age ratio both in rease in the dire tion of the mean �ow. Comparing this three-dimensionalmulti-s ale grid with a single perforated plate, these authors observed that the inhomogeneousand anisotropy region appearing downstream the grids was strongly redu ed by the multi-s alefor ing. Downstream that region, the global isotropy level of the turbulent �ow reated by themulti-s ale grid was omparable to those reported for standard regular grids (see, e.g., Comte-Bellot and Corrsin, 1966). Furthermore, turbulen e intensity as high as 15% was observed in thenearly homogeneous and isotropi region. Su h a high value of turbulen e intensity indu ed asigni� ant in rease of the wrinkling of a lean V-shaped methane/air �ame.The aim of the present work is to design and hara terize the turbulen e generated by amulti-s ale turbulen e generator under high pressure onditions to approa h the gas turbineenvironment and to investigate the intera tions between this turbulen e and a premixed �ame.This paper is mainly devoted to the hara terization of the multi-s ale grid turbulen e at highpressures. The paper is organized as follows. The experimental set-up used in both non rea tiveand rea tive onditions is des ribed in Se . 2. Details about the turbulen e generators used inthis study are also provided. The properties of the turbulent �ow generated by the multi-s alegrid together with those of a referen e single-s ale grid are reported and dis ussed in Se . 3. The�ame-turbulen e intera tion in the framework of premixed ombustion is also investigated.2

2 Experimental set-up2.1 The burnerIn this paper, we investigate the turbulent �ow and the ombustion generated by an axisymmetri premixed burner with an inner diameter D equal to 25 mm and a total length of 230 mm. As hemati of the burner is depi ted in Fig. 1 together with the spatial oordinate notation. Thebulk �ow velo ity UD is kept onstant around 3.5 m/s for all the onditions.
Figure 1: S hemati of the burner experimental set-up.Experiments were arried out in a pressurized ombustion hamber of 300 mm inner diameterdesigned to withstand internal pressure Pint up to 1 MPa ompared to ambient. During experi-ments, the internal pressure is a urately regulated by means of a pressure regulator, while thetemperature is monitored via a thermo ouple. No signi� ant pressure os illations or any other on�nement e�e ts have been observed. The hamber is equipped with two 600 mm high super-posed verti al ylindri al se tions equipped with four 100 mm diameter quartz windows allowingfor opti al a ess. A one-dimensional traverse system driven by a stepping motor with 0.1 mma ura y allows for verti al motion (x-axis in the following) of the burner. More details aboutthe experimental set-up an be found elsewhere (La haux et al, 2005; Halter et al, 2007).3

2.2 The measurement te hniques2.2.1 Non rea tive on�gurationA single hot wire (DANTEC 55P11), operated in onstant-temperature mode, was used to mea-sure the longitudinal velo ity omponent u(x) along the burner axis. The probe was driven bya StreamLine Resear h CTA System. A systemati alibration of the probe was performed atthe beginning of ea h measurement series and the temperature was monitored for thermal om-pensation. The sensing part of the probe was 5 µm in diameter dw and 1.25 mm in length ℓwso that the aspe t ratio ℓw/dw was 250. The spatial resolution ℓw/η where η is the Kolmogorovs ale ranges between 6 and 25 depending on the internal pressure Pint. The spatially varyinglongitudinal velo ity omponent u(x) was re overed from the time-varying velo ity u(t) by meansof lo al Taylor's hypothesis (Malé ot et al, 2000). The signal oming from the anemometer waslow-pass �ltered to avoid aliasing then sampled and �nally re orded on a omputer.Besides hot-wire measurements, a two- hannel Laser Doppler Velo imetry (LDV) systemwas used to study the longitudinal and radial velo ity omponents u(x) and v(x), respe tively.Data were olle ted in ba kward s atter mode and were pro essed in oin iden e mode to ensuresimultaneous realizations on both hannels. Only the large s ale statisti s are investigated withthe LDV system be ause of its too low temporal and spatial resolutions. The velo ity statisti swere orre ted using a residen e time weighting pro edure as des ribed in Bu hhave et al (1979).The LDV probe was mounted on a traverse system allowing for displa ements along the radial oordinate. The LDV measurements were only performed downstream the multi-s ale grids.
Figure 2: S hemati of the multi-s ale grid. For omparisons with the single-s ale for ing, theintermediate grid is used.2.2.2 Rea tive on�gurationIn rea tive onditions, experiments were performed in the same pressure hamber as the nonrea tive on�guration. A oni al turbulent premixed �ame was stabilized with the help of apilot �ame. For the rea ting ases, methane/air mixtures with an equivalen e ratio of 0.8 were onsidered. Two pressure onditions were sele ted (0.1 and 0.5 MPa) and the two grid on�g-urations (single-s ale and multi-s ale grids as des ribed hereafter) were tested. The �ame was4

hara terized by means of hemilumines en e measurements with OH �ltering. For that purpose,an ICCD amera (Prin eton Instrument PI-MAX Gen II, 1024x1024 pixels2) was equipped witha band-pass �lter entered at 306 nm with a 20 nm bandwidth in order to observe the OH signalof the �ame. For ea h experiment, a mean image was re orded �xing an exposure time of 2se onds. This image was then post-pro essed using an Abel transform to take a ount of theaxial symmetry of the �ame. The transformed image was then normalized (see Figs. 14(b) and14(d)) and the hara teristi �ame height (see Fig. 1) was de�ned for a normalized intensityof 0.5. This �ame height orresponds to a mean progress variable of 0.5 (the progress variableis de�ned as c = (T − Tu)/(Tb − Tu), with Tu and Tb the unburnt and burnt gas temperature,respe tively). This pro edure allows for re overing the turbulent �ame speed ST a ording tothe following relationshipST =
πD2
4 UD
Sc, (1)where Sc =
πD2
√
D2/4 + h2 is the lateral area of the one de�ned by the burner diameter Dand the �ame height h.2.3 The gridsIn order to investigate the �ame-turbulen e intera tions in that experimental set-up, a turbulen egenerator was adapted from the work reported by Mazellier et al (2010) and �tted inside theburner (see Fig. 2).The multi-s ale grid is omposed of three su essive perforated plates set su h that smalls ales are �rst ex ited then intermediate s ales and �nally large s ales. The geometri al hara -teristi s of ea h perforated plate are listed in Table 1. One an noti e that the blo kage ratio ofthe perforated plates are signi� antly higher than that usually reported for regular grids (Corrsin,1963). The spa ing between two su essive grids has been �xed following the rules de�ned byMazellier et al (2010). The last grid (i.e., the third one) is lo ated at x0 = 60.5 mm upstreamthe burner exit.Table 1: Geometri al hara teristi s of the multi-s ale grid where dj , Mj , σj and Kj stand forthe hole diameter, the mesh size, the blo kage ratio and the pressure drop oe� ient of the j-thperforated plate.d1 (mm) 1.55 M1 (mm) 2 σ1 0.46 K1 2.43d2 (mm) 3.44 M2 (mm) 5 σ2 0.57 K2 4.41d3 (mm) 7.50 M3 (mm) 12.5 σ3 0.67 K3 8.18To obtain a deeper insight of the in�uen e of the multi-s ale for ing on the turbulen e devel-opment, we ompare the multi-s ale grid with a single-s ale grid. For that purpose, we des ribe,in the following, the methodology we have used to determine the geometri al hara teristi s ofthe single-s ale grid in order to mat h those of the multi-s ale grid.First, we de�ne the equivalent hydrauli diameter deq = 4
∑
j Sj/χj , where Sj and χj arethe total open area and the total wetted perimeter of the j-th perforated plate, whi h an beexpressed as followsdeq =
∑
j(1− σj)∑
j(1−σj )
dj
. (2)5

A ording to this relationship and the values reported in Table 1 we �nd deq ≈ 2.5 mm. Thepressure drop oe� ient Kj of the j-th perforated plate is de�ned as (Laws and Livesey, 1978;Groth and Johansson, 1988)Kj =
1− (1− σj)2
(1− σj)2. (3)Let us assume that the pressure drop oe� ient Keq of the multi-s ale grid an be de�nedas Keq =
∑
j Kj . It is then possible to al ulate an equivalent blo kage ratio σeq from Eq. (3).A ording to the values reported in Table 1, σeq = 0.75.It is obvious that the blo kage ratio of a perforated plate depends on both its mesh size andits hole diameter:σj = 1− π
2√3
(
djMj
)2
. (4)The equivalent mesh size Meq an therefore be al ulated from Eq. (4) whi h here yieldsMeq ≈ 4.8 mm. This value is very lose to that of the intermediate perforated plate (i.e., M2 inTable 1). For sake of simpli ity, the turbulent �ow reated by the intermediate perforated platehas been investigated for omparison and is referred to as the single-s ale grid, in the following.It is worth noting that the lo ation of the single-s ale grid mat hes that of the last plate of themulti-s ale grid, i.e. x0 = 60.5 mm upstream the burner exit.An important remark has to be made here. The blo kage ratio of the hosen single-s aledi�ers signi� antly from σeq = 0.75. It means that the amount of turbulent kineti energy reated by the single-s ale grid will be mu h lower than that of the multi-s ale grids. This biasmight be orre ted by measuring the drag oe� ient of both grids but this is beyond the s opeof this work.3 Results and dis ussionIn the following, the measurements are restri ted to a region slightly greater than the potential ore where we intend to investigate the intera tions between the �ame and the nearly homoge-neous and isotropi turbulen e. Results that will be shown in the next subse tions have beenobtained for internal pressure Pint within the range 0.1 to 0.5 MPa. One-point statisti s mea-sured by means of both single hot-wire anemometry and LDV are investigated �rst. Then, thetwo-point statisti s are studied via stru ture fun tions.3.1 One-point statisti s of the turbulent �ow reated by the multi-s ale grid3.1.1 Homogeneity and produ tion of turbulen eThe dimensionless mean longitudinal velo ity U/UD measured along the burner axis (i.e., r = 0)is plotted in Fig. 3(a) with respe t to the dimensionless streamwise position x/D. For the twohighest internal pressure, i.e. Pint = 0.3 MPa and Pint = 0.5 MPa, the mean velo ity remainsalmost onstant up to x/D = 3 whi h hara terizes the end of the potential ore. Beyond thatposition, U/UD drops signi� antly due to the radial spreading of the jet. One an noti e thatU is slightly larger than UD in the potential ore. This result is onsistent with the growth ofthe boundary layer thi kness developing up to the burner exit. For the lowest ambient pressure(Pint = 0.1 MPa) the existen e of the potential ore is mu h less evident, even though a slope hange is also observed around x/D = 3. Close to the burner exit (x/D ≤ 1), the �ow is hara terized by a signi� ant velo ity ex ess (U/UD ≥ 1.05) whi h annot be a ounted for theboundary layer growth alone. 6
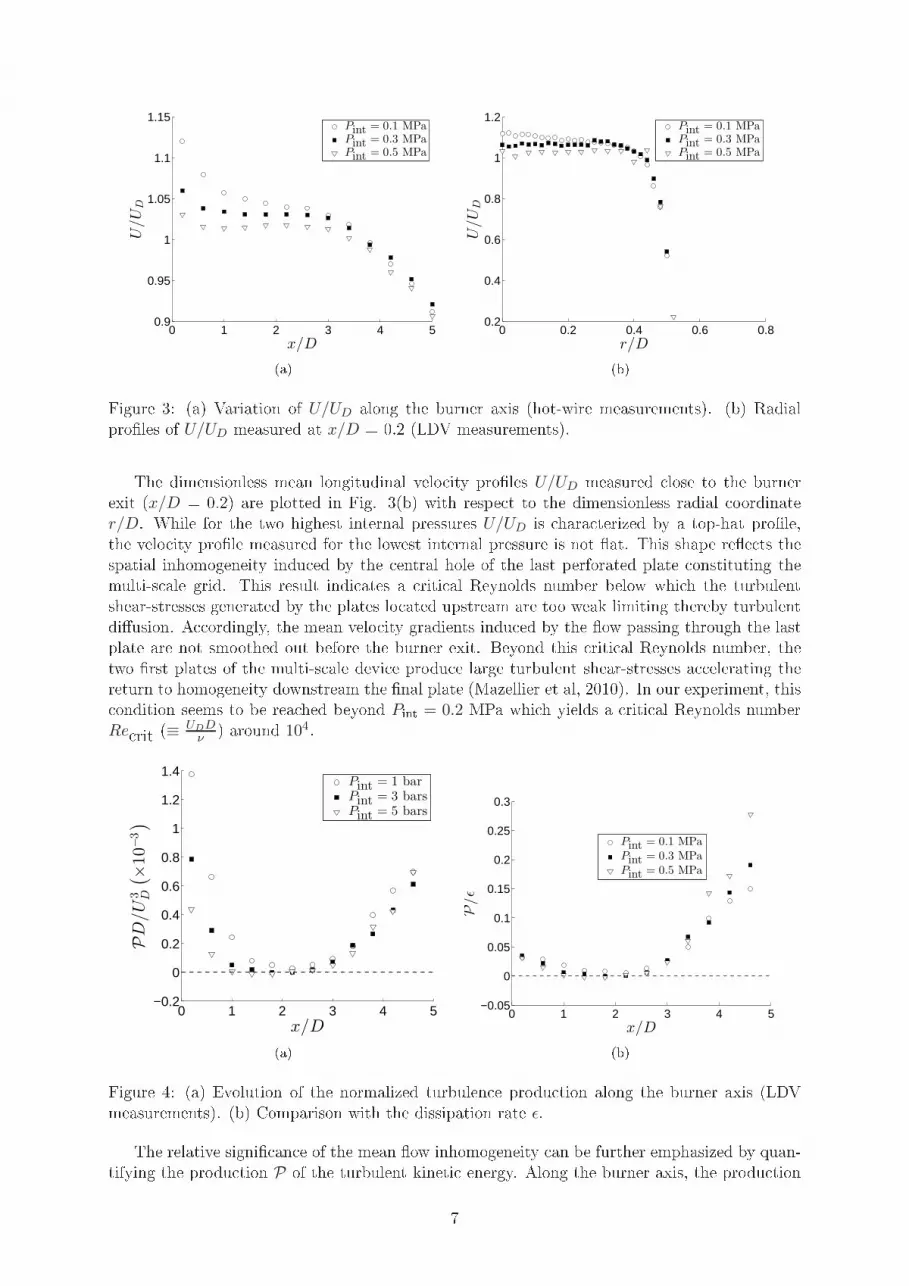
0 1 2 3 4 50.9
0.95
1
1.05
1.1
1.15
x/D
U/U
D
Pint = 0.1 MPaPint = 0.3 MPaPint = 0.5 MPa
(a) 0 0.2 0.4 0.6 0.80.2
0.4
0.6
0.8
1
1.2
r/D
U/U
D
Pint = 0.1 MPaPint = 0.3 MPaPint = 0.5 MPa
(b)Figure 3: (a) Variation of U/UD along the burner axis (hot-wire measurements). (b) Radialpro�les of U/UD measured at x/D = 0.2 (LDV measurements).The dimensionless mean longitudinal velo ity pro�les U/UD measured lose to the burnerexit (x/D = 0.2) are plotted in Fig. 3(b) with respe t to the dimensionless radial oordinater/D. While for the two highest internal pressures U/UD is hara terized by a top-hat pro�le,the velo ity pro�le measured for the lowest internal pressure is not �at. This shape re�e ts thespatial inhomogeneity indu ed by the entral hole of the last perforated plate onstituting themulti-s ale grid. This result indi ates a riti al Reynolds number below whi h the turbulentshear-stresses generated by the plates lo ated upstream are too weak limiting thereby turbulentdi�usion. A ordingly, the mean velo ity gradients indu ed by the �ow passing through the lastplate are not smoothed out before the burner exit. Beyond this riti al Reynolds number, thetwo �rst plates of the multi-s ale devi e produ e large turbulent shear-stresses a elerating thereturn to homogeneity downstream the �nal plate (Mazellier et al, 2010). In our experiment, this ondition seems to be rea hed beyond Pint = 0.2 MPa whi h yields a riti al Reynolds numberRe rit (≡ UDD
ν ) around 104.
0 1 2 3 4 5−0.2
0
0.2
0.4
0.6
0.8
1
1.2
1.4
x/D
PD/U
3 D
(
×10−3)
Pint = 1 barPint = 3 barsPint = 5 bars
(a) 0 1 2 3 4 5−0.05
0
0.05
0.1
0.15
0.2
0.25
0.3
x/D
P/ǫ
Pint = 0.1 MPaPint = 0.3 MPaPint = 0.5 MPa
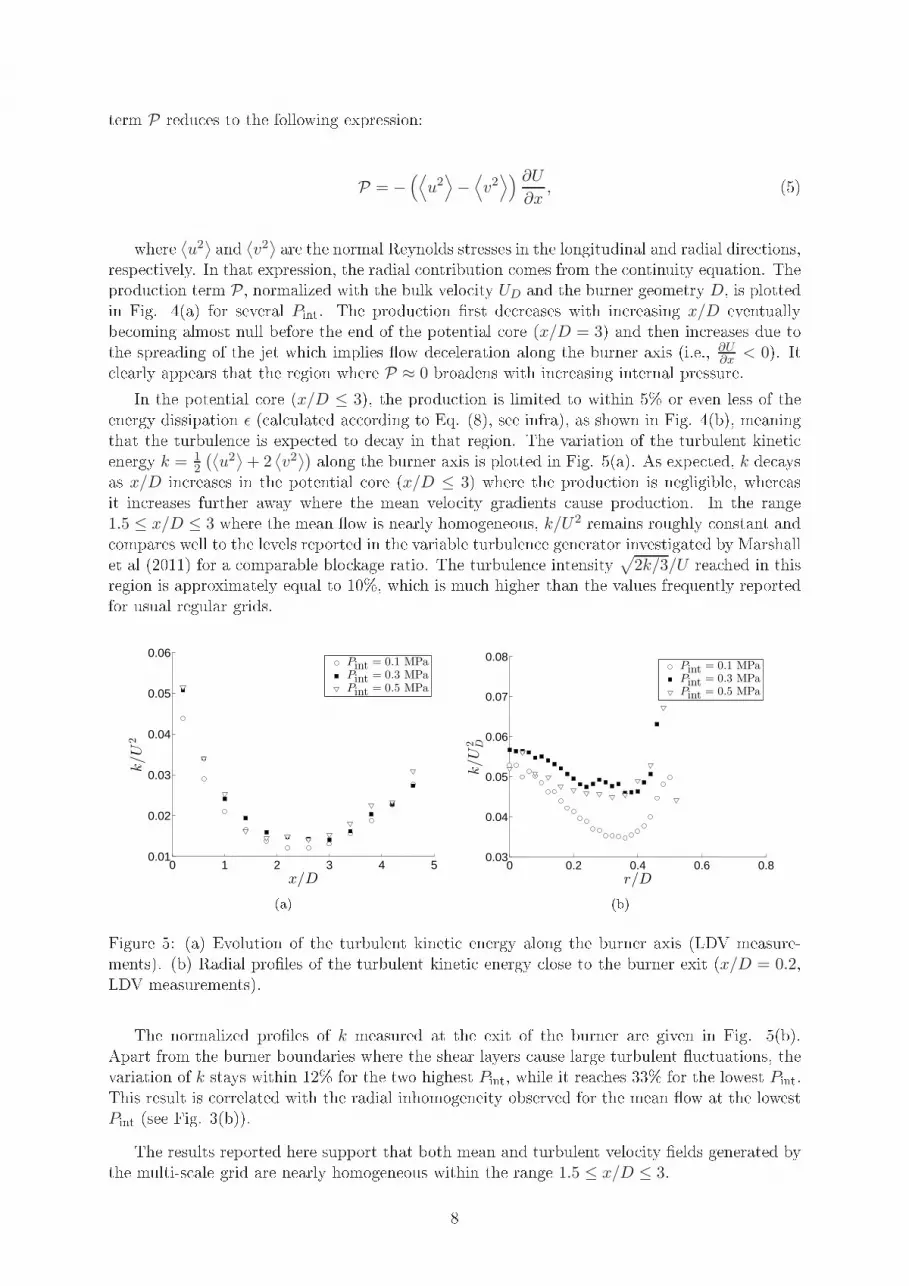
(b)Figure 4: (a) Evolution of the normalized turbulen e produ tion along the burner axis (LDVmeasurements). (b) Comparison with the dissipation rate ǫ.The relative signi� an e of the mean �ow inhomogeneity an be further emphasized by quan-tifying the produ tion P of the turbulent kineti energy. Along the burner axis, the produ tion7
term P redu es to the following expression:P = −
(⟨
u2⟩
−⟨
v2⟩) ∂U
∂x, (5)where ⟨u2⟩ and ⟨v2⟩ are the normal Reynolds stresses in the longitudinal and radial dire tions,respe tively. In that expression, the radial ontribution omes from the ontinuity equation. Theprodu tion term P, normalized with the bulk velo ity UD and the burner geometry D, is plottedin Fig. 4(a) for several Pint. The produ tion �rst de reases with in reasing x/D eventuallybe oming almost null before the end of the potential ore (x/D = 3) and then in reases due tothe spreading of the jet whi h implies �ow de eleration along the burner axis (i.e., ∂U
∂x < 0). It learly appears that the region where P ≈ 0 broadens with in reasing internal pressure.In the potential ore (x/D ≤ 3), the produ tion is limited to within 5% or even less of theenergy dissipation ǫ ( al ulated a ording to Eq. (8), see infra), as shown in Fig. 4(b), meaningthat the turbulen e is expe ted to de ay in that region. The variation of the turbulent kineti energy k = 12
(⟨
u2⟩
+ 2⟨
v2⟩) along the burner axis is plotted in Fig. 5(a). As expe ted, k de aysas x/D in reases in the potential ore (x/D ≤ 3) where the produ tion is negligible, whereasit in reases further away where the mean velo ity gradients ause produ tion. In the range
1.5 ≤ x/D ≤ 3 where the mean �ow is nearly homogeneous, k/U2 remains roughly onstant and ompares well to the levels reported in the variable turbulen e generator investigated by Marshallet al (2011) for a omparable blo kage ratio. The turbulen e intensity √2k/3/U rea hed in thisregion is approximately equal to 10%, whi h is mu h higher than the values frequently reportedfor usual regular grids.
0 1 2 3 4 50.01
0.02
0.03
0.04
0.05
0.06
x/D
k/U
2
Pint = 0.1 MPaPint = 0.3 MPaPint = 0.5 MPa
(a) 0 0.2 0.4 0.6 0.80.03
0.04
0.05
0.06
0.07
0.08
r/D
k/U
2 D
Pint = 0.1 MPaPint = 0.3 MPaPint = 0.5 MPa
(b)Figure 5: (a) Evolution of the turbulent kineti energy along the burner axis (LDV measure-ments). (b) Radial pro�les of the turbulent kineti energy lose to the burner exit (x/D = 0.2,LDV measurements).The normalized pro�les of k measured at the exit of the burner are given in Fig. 5(b).Apart from the burner boundaries where the shear layers ause large turbulent �u tuations, thevariation of k stays within 12% for the two highest Pint, while it rea hes 33% for the lowest Pint.This result is orrelated with the radial inhomogeneity observed for the mean �ow at the lowestPint (see Fig. 3(b)).The results reported here support that both mean and turbulent velo ity �elds generated bythe multi-s ale grid are nearly homogeneous within the range 1.5 ≤ x/D ≤ 3.8

3.1.2 Isotropy at large and small s alesIn the following, we aim at quantifying the anisotropy level of the turbulent �ow generated by themulti-s ale for ing at both large and small s ales. For that purpose, we introdu e the anisotropyratio I = 1 −√
〈u2〉〈v2〉 to assess the departure from isotropy at large s ales. The streamwiseevolution of I omputed from the LDV data olle ted along the burner axis is plotted in Fig.6(a). The anisotropy ratio I remains almost onstant in the potential ore and then in reasesin magnitude as x/D in reases. The departure from isotropy ranges between 12% to 20% in thehomogeneous region and de reases with in reasing Pint. These values are within the range ofanisotropy level reported in literature dealing with grid-generated turbulen e.
0 1 2 3 4 5−50
−40
−30
−20
−10
0
x/D
1−
√
〈u2〉/〈v
2〉[%
]
Pint = 0.1 MPaPint = 0.3 MPaPint = 0.5 MPa
(a) 0 0.2 0.4 0.6 0.8−80
−70
−60
−50
−40
−30
−20
−10
0
r/D
1−
√
〈u2〉/〈v
2〉[%
]
Pint = 0.1 MPaPint = 0.3 MPaPint = 0.5 MPa
(b)Figure 6: Variation of the anisotropy ratio I (a) along the burner axis and (b) lose to the burnerexit (x/D = 0.2) (LDV measurements).The radial pro�les of I measured lose to the exit of the burner (x/D = 0.2) are plotted inFig. 6(b) as a fun tion of the internal pressure Pint. Setting apart the jet boundary where theshear layer indu es large anisotropy, the entral part of the �ow is hara terized by a roughly onstant anisotropy level.We lose this subse tion by investigating the isotropy of small s ales. Turbulent small s alesare usually hara terized by the mean energy dissipation rate ǫ = 2ν 〈sijsij〉 (repeated indi esmean summation) where sij =12
(
∂ui
∂xj+
∂uj
∂xi
) is the �u tuating strain rate tensor. The straight-forward al ulation of ǫ requires therefore to resolve the full turbulent gradients otherwise it maylead to substantial underestimations of ǫ (Wyngaard, 1968; Lavoie et al, 2007). It is thus more onvenient to approximate ǫ by invoking some more or less restri tive assumptions (Kraw zynskiet al, 2010). One of the most ommon approximation of ǫ is the following:ǫiso = 15ν
⟨
(
∂u
∂x
)2⟩
, (6)whi h is based on lo al isotropy assumption and an be easily inferred from single hot-wire measurements. Given that the spatial resolution of the hot-wire we have used here is low ompared to the smallest s ales of the �ow, we ompare the results omputed from Eq. (6) toanother surrogate of mean energy dissipation. The se ond method relies on the measurement ofthe average distan e Λ between onse utive zero- rossings of u(x), i.e. points x where u(x) = 0.A ording to the work of Ri e (1944, 1945), Liepmann and Robinson (1952) and then afterSreenivasan et al (1983) and Mazellier and Vassili os (2008), it has been shown that the average9

distan e Λ is related to the Taylor mi ros ale λ de�ned as ǫ = 15ν〈u2〉λ2 . This relationship reads
Λ = Cπλ, (7)with C ≈ 1.1 for a broad range of Reynolds numbers and in various turbulent �ows (Mazellierand Vassili os, 2008). Substituting the Taylor mi ros ale λ by Eq. (7) yields an approximationof the mean energy dissipation rateǫΛ = 15ν(Cπ)2
⟨
u2⟩
Λ2. (8)The advantage of the zero rossings method stands in the fa t that the number of zero ross-ings does not hange beyond an inner ut-o� s ale η⋆ whi h is mu h larger than the Kolmogorovs ale η (see Mazellier and Vassili os, 2008). A ordingly, the spatial resolution of our hot-wireprobe ℓ/η⋆ ranges between 0.21 (Pint = 0.1 MPa) and 0.5 (Pint = 0.5 MPa) meaning that theprobe is small enough to apply with on�den e the zero- rossing method. A omparison betweenthe surrogate mean dissipation rates ǫiso and ǫΛ is displayed in Fig. 7(a). Even though the dif-feren e between ǫΛ and ǫiso stays within 20%, this plot emphasizes the low-pass �ltering e�e tdue to the poor spatial resolution when inferring the mean dissipation rate from ǫiso.
0 1 2 3 4 50
5
10
15
20
x/D
1−ǫ iso/ǫ ℓ
[%]
Pint = 0.1 MPaPint = 0.3 MPaPint = 0.5 MPa
(a) 40 60 80 100 120 1400.5
0.6
0.7
0.8
0.9
1
1.1
1.2
1.3
Reλ
Cǫ
Pint = 0.1 MPaPint = 0.3 MPaPint = 0.5 MPa
(b)Figure 7: (a) Comparison between the surrogate dissipation rates. (b) Variation of the dissipation onstant.The dissipation onstant de�ned as:Cǫ =
ǫLu
〈u2〉3/2, (9)where Lu is the longitudinal integral s ale omputed from the auto orrelation oe� ient
Ruu (∆x) = 〈u(x+∆x)u(x)〉〈u2〉 . As eviden ed in the reviews written by Sreenivasan (1984) and Pearsonet al (2002), Cǫ tends asymptoti ally to 0.5 in lo ally isotropi turbulen e. The evolution ofthe dissipation onstant Cǫ omputed from ǫΛ is plotted in Fig. 7(b) with respe t to the lo alTaylor-based Reynolds number Reλ (≡ ⟨
u2⟩1/2
λ/ν). Lo al isotropy relies on the s ale separation on ept whi h ensures independen e between large and small s ales. The ratio between largeand small s ales is an in reasing fun tion of Reλ (Tennekes and Lumley, 1972; Pope, 2000). Fig.7(b) eviden es that the in rease of internal pressure indu es the in rease of Reλ. It means thatthe �ow tends towards lo al isotropy with in reasing internal pressure.These results show that the nearly homogeneous region identi�ed previously is also nearlyisotropi at both large and small s ales with the degree of isotropy be oming better with in reases10

in Pint.3.2 Two-point statisti s and omparison with the single-s ale grid3.2.1 The energy distribution through s alesThe turbulent kineti energy as ade is hara terized by large and small s ales referred to as theintegral s ale Lu, the Taylor mi ros ale λ and the Kolmogorov s ale η (≡ (ν3/ǫ)1/4). The integrals ale Lu is representative of the energy- ontaining eddies, while λ and η are hara teristi of theinertial and the dissipative range, respe tively.Fig. 8(a) shows the variation of the longitudinal integral s ale Lu generated by the multi-s ale grid along the burner axis in dimensionless form. The pressure imposed in the ombustion hamber seems to have a minor e�e t on the evolution of Lu (see Fig. 8(a)). Nevertheless,one an remark a slight de rease of Lu with in reasing Pint. This trend agrees with the resultsreported by Kobayashi et al (1997).
0 1 2 3 4 5
0.2
0.25
0.3
0.35
x/D
Lu/D
Pint = 0.1 MPaPint = 0.3 MPaPint = 0.5 MPa
(a) 0 1 2 3 4 5
0.2
0.25
0.3
0.35
0.4
0.45
0.5
x/D
Lu/D
Single−ScaleMulti−Scale
(b)Figure 8: (a) Evolution of Lu vs distan e from the burner exit normalized by the burner diameterD (multi-s ale grid). (b) Comparison of Lu generated by single- and multi-s ale grids (Pint = 0.5MPa).The longitudinal integral s ales Lu indu ed by both single- and multi-s ale grids are omparedin Fig. 8(b) for Pint = 0.5 MPa. Despite that the multi-s ale grid generates slightly smallerintegral s ales ompared to the single-s ale grid, the growth of Lu with in reasing x/D is roughlysimilar for both turbulen e generators. This result supports the fa t that the mesh size of the hosen single-grid M2 is very lose to the equivalent mesh size Meq al ulated in Se . 2. Indeed,the typi al size of the integral length s ale is strongly related to the mesh size as eviden ed inseveral experimental studies (see e.g. Bat helor and Townsend, 1948; Comte-Bellot and Corrsin,1966; Mazellier et al, 2010).Unlike the integral s ale, the hange of internal pressure has a profound in�uen e on bothTaylor mi ros ale λ and Kolmogorov s ale η as eviden ed in Figs. 9(a) and 9(b). The in reaseof Pint indu es a redu tion of kinemati vis osity ν whi h in turns leads to a de rease of bothλ and η whi h are phenomenologi ally driven by vis ous e�e ts. These results agree with thosereported by Kobayashi et al (1997). Furthermore, it appears learly that the multi-s ale gridprodu es smaller s ales than the single-s ale grid (see Figs. 10(a) and 10(b)).A deeper analysis of the in�uen e of the multi-s ale for ing an be done by investigating theenergy distribution through s ales by means of longitudinal stru ture fun tions (Pope, 2000).These are the statisti al moments of the spatial in rements δu(ℓ) de�ned as follows:11

0 1 2 3 4 50.03
0.04
0.05
0.06
0.07
0.08
0.09
0.1
0.11
x/D
λ/D
Pint = 0.1 MPaPint = 0.3 MPaPint = 0.5 MPa
(a) 0 1 2 3 4 51
2
3
4
5
6
7 x 10⁻³
x/Dη/D
Pint = 0.1 MPaPint = 0.3 MPaPint = 0.5 MPa
(b)Figure 9: Evolution of (a) λ and (b) η vs distan e from the burner exit normalized by the burnerdiameter D (multi-s ale grid).
0 1 2 3 4 5
0.04
0.045
0.05
0.055
0.06
0.065
0.07
x/D
λ/D
Single−Scale
Multi−Scale
(a) 0 1 2 3 4 51.2
1.4
1.6
1.8
2
2.2
2.4
2.6x 10⁻³
x/D
η/D
Single−ScaleMulti−Scale
(b)Figure 10: Comparison of (a) λ and (b) η generated by both single- and multi-s ale grids (Pint =0.5 MPa).
12

δu(ℓ) = u(x+ ℓ)− u(x), (10)where ℓ is a longitudinal separation. Under isotropy assumption, the se ond-order stru turefun tion ⟨(δu(ℓ))2⟩ represents the kineti energy of the s ale ℓ (Pope, 2000). It is easy to showthat for large separation ℓ (i.e., ℓ → ∞) ⟨(δu(ℓ))2⟩ is twi e the varian e of the longitudinalnormal stress ⟨u2⟩ under homogeneity assumption. The in�uen e of the internal pressure on theenergy distribution through s ales is displayed in Fig. 11(a) for the multi-s ale grid. In this plotlarge s ale variables, that is to say Lu and ⟨u2⟩, have been used for normalization. As expe ted,at large s ales (ℓ ≥ Lu), the dimensionless se ond-order stru ture fun tions ollapse and tend to2 for ℓ → ∞. Moreover, the in rease of Pint indu es a broadening of the inertial range yieldingan in rease of Reλ whi h is somehow linked to the turbulent s ales via Reλ ∼ Lu/λ (Tennekesand Lumley, 1972; Pope, 2000). These results support the �ndings displayed in Figs. 8(a), 9(a)and 9(b).
10−2
100
102
10−3
10−2
10−1
100
101
ℓ/Lu
⟨
δu(ℓ)2⟩
/⟨
u2⟩
Pint = 0.1 MPaPint = 0.3 MPaPint = 0.5 MPa
(a) 10−4
10−2
100
102
10−5
10−4
10−3
10−2
10−1
ℓ/D
⟨
δu(ℓ)2⟩
/U
2 D
Single−Scale
Multi−Scale
(b)Figure 11: Evolution of the se ond-order stru ture fun tion normalized by (a) D and UD and(b) by Lu and ⟨u2⟩ (x/D = 1.8, Pint = 0.5 MPa).Fig. 11(b) ompares the se ond-order stru ture fun tions omputed at x/D = 1.8 for Pint =0.5 MPa for both single- and multi-s ale grids. It is important to noti e that at this spe i� lo ation the Taylor-based Reynolds number of both �ows is roughly the same (Reλ ≈ 120 atthese spe i� onditions). It appears learly that the energy inje ted by the multi-s ale grid issigni� antly higher than that inje ted by the single-s ale grid.We introdu e the ratio ∆E(ℓ) =
[〈(δu(ℓ))2〉/〈u2〉]multi[〈(δu(ℓ))2〉/〈u2〉]mono to quantify the gain of energy at a givens ale. In this expression, [⟨(δu(ℓ))2⟩ / ⟨u2⟩]multi and [⟨(δu(ℓ))2⟩ / ⟨u2⟩]mono are the dimension-less se ond-order stru ture fun tions al ulated for the multi-s ale and the single-s ale grids ats ale ℓ, respe tively. The normalization of the stru ture fun tions by ⟨u2⟩ allows for ompen-sating the bias due to the di�eren e in pressure loss indu ed by both turbulen e generators (seeSe . 2). Fig. 12(a) shows the ratio ∆E(ℓ) omputed with the data plotted in Fig. 11(b). Be-yond ℓ/D ≈ 1, ∆E(ℓ) rea hes a plateau whose value is around 1. Surprisingly, the ratio ∆E(ℓ)in reases monotoni ally with de reasing s ales and rea hes values up to 1.7 in the dissipativerange. It means that the multi-s ale for ing tends to amplify mu h more the energy at smalls ales. This might be interpreted as a profound hange in the nature of the so- alled turbu-lent kineti energy as ade due to the multi-s ale for ing. This is an interesting feature in theframework of �ame-turbulen e intera tions. Indeed, this may allow to explore di�erent regimes13

10−4
10−2
100
102
0.8
1
1.2
1.4
1.6
1.8
ℓ/D
∆E(ℓ)
(a) 10−2
100
102
104
−0.2
0
0.2
0.4
0.6
0.8
ℓ/λ
−
⟨
δu(ℓ)3⟩
/(ǫℓ)
Single−ScaleMulti−Scale
(b)Figure 12: (a) Evolution of ∆E(ℓ) at x/D = 1.8 for Pint = 0.5 MPa. (b) Dimensionless third-order stru ture fun tions omputed in the same onditions.of �ame-turbulen e intera tions by hanging the design of the turbulen e generator in order tofavor one spe i� range of s ales.3.2.2 The de ay and transfer of energyWe lose this se tion by investigating the s ale-by-s ale energy transfer and its onsequen e onthe turbulen e de ay.The investigation of the third-order stru ture fun tion ⟨(δu(ℓ))3⟩ might lead to a betterunderstanding of the as ade pro ess and its possible alteration. Indeed, the third-order stru turefun tion ⟨(δu(ℓ))3⟩ represents the transfer of energy at s ale ℓ. Its relationship to the se ond-order stru ture fun tion an be expressed as follows under assumption of lo al isotropy (Pope,2000):⟨
(δu(ℓ))3⟩
= 6ν∂⟨
(δu(ℓ))2⟩
∂ℓ− 4
5ǫℓ, (11)In the limit of high Reynolds number, the vis ous term in Eq. (11) be omes negligible in theinertial range (Lu ≫ ℓ ≫ η), leading to
⟨
(δu(ℓ))3⟩
= −4
5ǫℓ, (12)whi h is known as the Kolmogorov "4/5" law. The dimensionless third-order stru ture fun -tions ⟨(δu(ℓ))3⟩ /(ǫℓ) omputed at x/D = 1.8 for Pint = 0.5 MPa for both single- and multi-s alegrids are ompared in Fig. 12(b). This plot eviden es the existen e of a narrow inertial range(identi�ed by the bump near ℓ/λ = 1) whi h an be explained by the moderate Reynolds numberrea hed in that onditions (Reλ ≈ 120 for both grids). Furthermore, one an noti e that themaximum of ⟨(δu(ℓ))3⟩ /(ǫℓ) is smaller than the 4/5 value predi ted by Eq. (12). This dis- repan y is likely to be a ounted for moderate Reynolds e�e ts and large-s ale inhomogeneities(Danaila et al, 2004). Nevertheless, sin e both grids generate similar Reynolds numbers andmean velo ity gradients, the omparison plotted in Fig. 12(b) is relevant to study the in�uen eof the multi-s ale for ing onto the turbulent as ade. It appears learly that the energy transferthrough s ales indu ed by the multi-s ale grid is signi� antly stronger than that of the single-s ale grid. A ordingly, sin e produ tion terms ollapse in the potential ore (see Fig. 4(b)), the14

de ay of turbulent kineti energy should be faster.In order to on�rm this laim, we fo us on the turbulen e de ay in the nearly homogeneousand isotropi region. Assuming homogeneity and isotropy, the one-point turbulent kineti energybudget redu es to3
2U∂⟨
u2⟩
∂x= −ǫ. (13)This relationship illustrates how dissipation ounterbalan es onve tion in de aying turbu-len e. Assuming that energy de ays as a power law, i.e. ⟨u2⟩ = A(x− x⋆)
−n where A and n arethe de ay onstant and the de ay exponent respe tively and x⋆ a virtual origin, Eq. (13) yieldsǫ = U
3n
2A (x− x⋆)
−n−1 . (14)Re alling that by de�nition λ2 = 15ν⟨
u2⟩
/ǫ, we get (Bat helor and Townsend, 1948; Georgeet al, 2001)λ2 =
10ν
n
x− x⋆U
. (15)The main purpose of Eq. (15) is to provide a simple way to estimate the de ay exponent neven though the virtual origin is unknown. The evolution of (λ/D)2 is displayed in Fig. 13(a)versus νx/(UDD2). The data plotted in Fig. 13(a) have been olle ted for ea h internal pressure
Pint in the nearly homogeneous and isotropi region determined previously. For both multi-s aleand single-s ale grids, the data ollapses fairly well, meaning that the trend predi ted in Eq. (15)holds true in these �ows. This is eviden ed by the best �ts of Eq. (15) in the least square senserepresented by dashed lines in Fig. 13(a). For the single-s ale grid, the al ulation of the de ayexponent from experimental data yields n = 1.6 whi h is within the range reported in literature.The de ay exponent found for the multi-s ale for ing rea hes a mu h higher value n = 2.8. Su hdi�eren e, whi h annot be attributed to inhomogeneity e�e ts, proves that turbulen e de ay ismu h faster with the use of the multi-s ale grid (see Fig. 13(b)).
−1 0 1 2 3 4 5x 10
−4
0
0.005
0.01
0.015
λ2/D
2
νx/(
UDD2)
Single−Scale
Multi−Scale
(a) 0 1 2 3 4 50.005
0.01
0.015
0.02
0.025
0.03
0.035
x/D
⟨
u2⟩
/U
2
Single−ScaleMulti−Scale
(b)Figure 13: (a) E�e t of internal pressure on the Taylor mi ros ale. The dashed lines representthe best �ts of Eq. (15) in the least square sense. (b) Streamwise evolution of the dimensionlessnormal Reynolds stress ⟨u2⟩ along the jet axis (Pint = 0.5 MPa).Our results suggest a strong dependen y of the turbulen e development on its initial ondi-tions. The de ay rates al ulated for both the single-s ale and the multi-s ale grids are lose tothose predi ted by the self-preservation theory, i.e. n = 3/2 and n = 5/2 respe tively, introdu edby George (1992) assuming invarian e of either the Sa�man integral or the Loitsiansky integral,15

respe tively. Note that the de ay exponent n = 5/2 should not be onfused with the de ayexponent of the �nal period of de ay o urring at very low Reλ (≈ 1) (Pope, 2000) whi h is notrepresentative of our study (Reλ ranges from 50 to 150 in the nearly homogeneous and isotropi region). In fa t, these exponents represent the maximum (n = 5/2) and the minimum (n = 3/2)rate at whi h grid turbulen e is expe ted to de ay (George, 1992; Davidson, 2011). It is worthnoting that turbulen e generated by a regular grid (i.e., single-s ale for ing) behaves probablyas Sa�man turbulen e a ording to the experimental results reported in literature (Krogstadand Davidson, 2010; Davidson, 2011). In ontrast, turbulen e generated by means of multi-s alefor ing exhibits an unusual faster de ay rate. Indeed, de ay exponent as high as that we foundhas been re ently reported in fra tal-grid generated turbulen e (Valente and Vassili os, 2011;Hearst and Lavoie, 2014). To our best knowledge, apart from fra tal square grid turbulen e, itis the �rst time that su h de ay exponent is found experimentally.This is an important �nding whi h deserves some attention due to its possible onsequen esin the framework of ombustion modeling. Two main issues arise from our results:1. what kind of turbulen e is the most representative of ombustion systems (e.g., gas turbine)?2. what is the hara teristi length s ale of the turbulen e?The �rst issue is related to the omplex geometry hara terizing real-life ombustion systemsin ontrast of simpli�ed laboratory experiments. A ordingly, these ombustion systems aremore likely to produ e multi-s ale for ed turbulen e whi h seems to behave very di�erently fromsingle-s ale for ed turbulen e. However, for time and resour e onsuming reasons, the numeri alsimulations of su h systems are based on turbulen e modeling, e.g. k − ǫ, whi h are alibratedon usual de aying turbulen e. These models may therefore be irrelevant to predi t turbulen edevelopment and onsequently its intera tion with premixed �ame.The se ond issue is related to the turbulent length s ales sus eptible to intera t with the �amefront. Our results suggest that λ is a key parameter of the multi-s ale for ed turbulen e. Indeed,energy transfer enhan ement is mostly on entrated at s ales ranging around λ (see Fig. 12(b)).Furthermore, λ is the hara teristi length s ale arising from the self-preservation theory (George,1992). It is worth noting that the standard ombustion diagram is based on large s ale variables,i.e. turbulent kineti energy k and integral s ale Lu. However, the lassi al relationship usedto rely large and small s ales, i.e. ǫ ∼ k3/2/Lu, may not hold in multi-s ale for ed turbulen e(Valente and Vassili os, 2011). This suggest that ombustion diagrams might be in ompleteto hara terize �ame-turbulen e intera tions in regimes where small s ale turbulen e are morelikely to wrinkle and/or penetrate the �ame front. That point is dis ussed further in the nextsubse tion.3.3 Intera tion in premixed ombustionThis last subse tion is dedi ated to the investigation of the �ame-turbulen e intera tion. Thein�uen e of turbulen e onto the �ame stru ture will be emphasized by studying the turbulent�ame speed ST . As explained in Se . 2, the al ulation of ST is based on the mean progressvariable c = 0.5. The average light emission olle ted at Pint = 0.5 MPa for both single- andmulti-s ale grids are displayed in Figs. 14(a) and 14( ). The �ame geometry re overed by takingthe Abel transform of these average images are shown in Figs. 14(b) and 14(d).Even though the operating onditions (φ = 0.8, UD = 3.5 m/s) are identi al, the �ame geom-etry di�ers signi� antly between these experiments. Both the �ame height and the �ame brushare notably redu ed for the multi-s ale grid. This means that the multi-s ale grid indu es largerturbulent �ame speed ST ompared to the single-s ale grid for identi al operating onditions.The values of ST/SL, where SL is the laminar �ame speed (estimated from the PREMIX ode(Kee et al, 1993) and the CHEMKIN II database (Kee et al, 1989) using GriMe h 3.0 (Smith16

r/D
x/D
−1 −0.5 0 0.5 1
2.4
2.1
1.8
1.5
1.2
0.9
0.6
0.3
00
0.1
0.2
0.3
0.4
0.5
0.6
0.7
0.8
0.9
1
(a) r/D
x/D
−1 −0.5 0 0.5 1
2.4
2.1
1.8
1.5
1.2
0.9
0.6
0.3
00
0.1
0.2
0.3
0.4
0.5
0.6
0.7
0.8
0.9
1
(b)
r/D
x/D
−1 −0.5 0 0.5 1
2.4
2.1
1.8
1.5
1.2
0.9
0.6
0.3
0
0
0.1
0.2
0.3
0.4
0.5
0.6
0.7
0.8
0.9
1
( ) r/D
x/D
−1 −0.5 0 0.5 1
2.4
2.1
1.8
1.5
1.2
0.9
0.6
0.3
00
0.1
0.2
0.3
0.4
0.5
0.6
0.7
0.8
0.9
1
(d)Figure 14: Averaged light emission olle ted for (a) single- and ( ) multi-s ale grids at Pint = 0.5MPa and the related Abel transform (b) and (d), respe tively. The olormaps represent thenormalized light intensity.
17

et al, 1999)), are plotted in Fig. 15(a) with respe t to ⟨u2⟩1/2 /SL for both single-s ale andmulti-s ale grids. Furthermore, the results obtained in a previous study on the same burner butwith di�erent operating onditions (φ = 0.6 and UD = 2.1 m/s) have been added. The reader isreferred to La haux et al (2005) for more details. Clearly, the ratio ⟨u2⟩1/2 /SL is not the relevantparameter to s ale the dimensionless turbulent �ame speed ST /SL. Re ently, Chaudhuri et al(2011) proposed a s aling of ST /SL based on the spe tral losure of the G-equation. Theirapproa h provides an extension to the orrugated �amelet regime of the s aling �rst formulatedby Damköhler (1940) in the thin rea tion zone regime, i.e. ST/SL ∼√
〈u2〉1/2 L/(SLδL) where δLis the laminar �ame thi kness and L a hara teristi length s ale. This s aling was su essfullyapplied on both turbulent spheri al expanding �ame propagating in a fan-stirred vessel andBunsen �ame as well (Chaudhuri et al, 2012) suggesting the possible existen e of an universal orrelation for ST/SL.
1 2 3 4 52
4
6
8
10
12
14
⟨
u2⟩1/2
/SL
ST/SL
Single−scale (this study)
Multi−scale (this study)
Single−scale (Lachaux et al. (2005))(a) 5 10 15 20 252
4
6
8
10
12
14
√
〈u2〉1/2 D/(SLδL)
ST/SL
Single−scale (this study)Multi−scale (this study)Single−scale (Lachaux et al. (2005))(b)Figure 15: Variation of ST /SL vs (a) ⟨u2⟩1/2 /SL and (b) √〈u2〉1/2 D/(SLδL). The dashed linerepresents the best linear �t in the least square sense of the data obtained for the single-s alegrid.Fig. 15(b) shows the dimensionless turbulent �ame speed ST /SL as a fun tion of the s alingparameter proposed by Chaudhuri et al (2011) where the hara teristi length s ale L is theburner diameter D. Using that s aling, the dimensionless turbulent �ame speed ST /SL om-puted for both single-s ale grids ollapse on the same urve whi h is represented by the dashedline. For the multi-s ale grid, one an noti e a slight departure from this trend for the highestturbulent �ame speed whi h orresponds to the highest Pint. If this deviation is not due to exper-imental un ertainties, it might indi ate that parameters other than ⟨u2⟩1/2 are involved in the�ame-turbulen e intera tion. One may question the relevan e of the geometri al length s ale Dto hara terize the �ame-turbulen e intera tion. As shown in subse tion 3.2, the turbulen e de-velopment is strongly dependent on its initial onditions rather than the geometry of the burner.Furthermore, as stressed hereinbefore, the Taylor mi ros ale λ seems to be the hara teristi length s ale of the turbulen e de ay. In a re ent publi ation, Fragner et al (2014) investigatedthe s aling of the �ame wrinkling in the same fa ility as the one used in this study. In their work,the turbulen e was generated by the multi-s ale grid des ribed in subse tion 2.3. They reporteda remarkable s aling of the �ame front urvature statisti s with the Taylor mi ro-s ale λ whenthe laminar �ame thi kness δL is redu ed. Their results suggest that the ratio λ/δL ould be akey parameter of the intera tions between a premixed �ame and a highly turbulent �ow. Thispoint is ex luded from the usual ombustion diagram where the turbulen e is only hara terizedby its integral length-s ale. Another possible explanation relates on intermitten y o urring at18

small s ales (Pope, 2000) whi h may lead to s aling law orre tion (Chaudhuri et al, 2011). Theanswer to these issues is beyond the s ope of this paper as it would require mu h more a uratemeasurements and the extension of the range of operating onditions to rea h higher turbulen elevels. This work is left for future studies.4 Con lusionsThe turbulent �ow generated by a multi-s ale grid in a pressurized ombustion hamber hasbeen studied and ompared to that generated by a single-s ale grid. It has been shown that themulti-s ale grid indu es a nearly homogeneous and isotropi de aying turbulen e in the potential ore of the axisymmetri premixed burner. In that region, the turbulen e intensity is as highas 10%. The turbulent length s ales produ ed by the multi-s ale grid are smaller than thoseprodu ed by the single-s ale grid. Furthermore, the analysis of the two-point statisti s throughse ond- and third-order stru ture fun tions reveals that the multi-s ale for ing (i) inje ts higherenergy at ea h s ale of the �ow and (ii) ampli�es the s ale-by-s ale energy transfer. The useof the multi-s ale for ing results in an ex eptional fast de ay of the turbulent kineti energy omparable to that reported in fra tal-grid generated turbulen e (Valente and Vassili os, 2011;Hearst and Lavoie, 2014). Our results are onsistent with the predi tions of the self-preservationtheory introdu ed by George (1992). The main on lusions are twofold: (i) the turbulen eevolution is strongly sensitive to its initial onditions and (ii) the hara teristi length-s ale isthe Taylor mi ro-s ale λ.The intera tion with a methane-air premixed �ame was also investigated. The �ame stru turehas been hara terized by the turbulent �ame speed. It has been found that the dimensionless�ame speed measured for single-s ale grid s ales with √〈u2〉1/2 D/(SLδL), whereas the data olle ted for the multi-s ale grid slightly deviate from this s aling. This suggests that smalls ales, more espe ially the Taylor-mi ro-s ale λ, whi h are strongly enhan ed by the multi-s alefor ing might also modify the �ame stru ture as suggested by re ent observations of the s aling ofthe �ame front urvature (Fragner et al, 2014). Indeed, small turbulent s ales are both smallerand ontain more energy whi h an lead to thi kened premixed �ame fronts when applied toturbulent premixed �ame studies (Bédat and Cheng, 1995; Shepherd et al, 2002; Gülder, 2007).In the future, a Rayleigh s attering te hnique will be used to investigate the e�e ts of this kind ofturbulen e generator on the instantaneous �ame front thi knesses for CH4-Air and CO/H2-Air�ames.Our �ndings arise two main issues: (i) what turbulen e is representative of real ombustionsystems? (ii) What are the hara teristi length s ales? Both issues are ornerstones in �ame-turbulen e modeling and onsequently ask for more future studies.5 A knowledgmentsThis work is supported by the CNRS, the University of Orléans and the Fren h Government Pro-gramme �Investissements d'Avenir� through the LABEX CAPRYSSES. The authors are thankfulto Mr. J. M Nally for his valuable help in improving the writing of the paper.Referen esBat helor G, Townsend A (1948) De ay of isotropi turbulen e in the initial period. Pro R So Lond A 193:539�558Borghi R (1985) On the stru ture and morphology of turbulent premixed �ames. In: Re entadvan es in the Aerospa e S ien es, Springer, pp 117�13819

Bray K (1979) The intera tion between turbulen e and ombustion. In: Symposium (Interna-tional) on Combustion, Elsevier, vol 17, pp 223�233Bu hhave P, George WK, Lumley JL (1979) The measurement of turbulen e with the laser-doppler anemometer. Ann Rev Fluid Me h 11(1):443�503Bédat B, Cheng R (1995) Experimental study of premixed �ames in intense isotropi turbulen e.Comb Flame 100(3):485�494Chaudhuri S, Akkerman V, Law CK (2011) Spe tral formulation of turbulent �ame speed with onsideration of hydrodynami instability. Physi al Review E 84(2):026,322Chaudhuri S, Wu F, Zhu D, Law CK (2012) Flame speed and self-similar propagation of expand-ing turbulent premixed �ames. Phys Rev Lett 108(4):044,503Comte-Bellot G, Corrsin S (1966) The use of a ontra tion to improve isotropy of grid-generatedturbulen e. J Fluid Me h 25:657�682Corrsin S (1963) Turbulen e: experimental methods. In Handbu h der Physik pp 524�589Damköhler G (1940) In�uen e of turbulen e on the velo ity �ames in gas mixtures. Z Elektro hem46:601�626Danaila L, Antonia R, Burattini P (2004) Progress in studying small-s ale turbulen eusing'exa t'two-point equations. New J Phys 6(1):128Davidson P (2011) The minimum energy de ay rate in quasi-isotropi grid turbulen e. PhysFluids 23:085108Fragner R, Halter F, Mazellier N, Chauveau C, Gökalp I (2014) Investigation of pressure e�e tson the small s ale wrinkling of turbulent bunsen �ames, (in press)George W, Wang H, Wollblad C, Johansson T (2001) 'homogeneous turbulen e' and its relationto realizable �ows. In: Pro eedings of the 14th Australasian Fluid Me hani s Conferen e,ElsevierGeorge WK (1992) The de ay of homogeneous isotropi turbulen e. Phys Fluids A 4(7):1492�1509Good GH, Warhaft Z (2011) On the probability distribution fun tion of the velo ity �eld andits derivative in multi-s ale turbulen e. Phys Fluids 23:095106Groth J, Johansson A (1988) Turbulen e redu tion by s reens. J Fluid Me h 197:139�155Gülder ÖL (2007) Contribution of small s ale turbulen e to burning velo ity of �amelets in thethin rea tion zone regime. Pro eedings of the Combustion Institute 31(1):1369�1375Halter F, Chauveau C, Gökalp I (2007) Chara terization of the e�e ts of hydrogen addition inpremixed methane/air �ames. Int J of Hydrogen Energy 32(13):2585�2592Hearst R, Lavoie P (2014) De ay of turbulen e generated by a square-fra tal-element grid. JFluid Me h 741:567�584Hurst D, Vassili os J (2007) S alings and de ay of fra tal-generated turbulen e. Phys Fluids19:035103Kee R, Rupley F, Miller J (1989) Report no. sand89-8009b. Sandia National LaboratoriesKee R, Gr ar J, Smooke M, Miller J (1993) Report no. sand85-8240. Sandia National Laboratories20

Kobayashi H, Nakashima T, Tamura T, Maruta K, Niioka T (1997) Turbulen e measurementsand observations of turbulent premixed �ames at elevated pressures up to 3.0 mpa. Comb�ame 108(1):104�117Kraw zynski JF, Renou B, Danaila L (2010) The stru ture of the velo ity �eld in a on�ned �owdriven by an array of opposed jets. Phys Fluids 22(4):045104Krogstad P, Davidson P (2010) Is grid turbulen e sa�man turbulen e? J Fluid Me h 642:373�394La haux T, Halter F, Chauveau C, Gökalp I, Shepherd I (2005) Flame front analysis of high-pressure turbulent lean premixed methane-air �ames. Pro Combust Inst 30(1):819�826Lavoie P, Avallone G, Gregorio F, Romano G, Antonia R (2007) Spatial resolution of piv for themeasurement of turbulen e. Exp Fluids 43(1):39�51Laws E, Livesey J (1978) Flow through s reens. Ann Rev Fluid Me h 10:247�266Liepmann HW, Robinson MS (1952) Counting methods and equipment for mean-value measure-ments in turbulen e resear h. NACA TN p 3037Makita H (1991) Realization of a large-s ale turbulen e �eld in a small wind tunnel. Fluid DynRes 8:53�64Malé ot Y, Auriault C, Kahalerras H, Gagne Y, Chanal O, Chabaud B, Castaing B (2000) Astatisti al estimator of turbulen e intermitten y in physi al and numeri al experiments. EurPhys J B 16(3):549�561Marshall A, Venkateswaran P, Noble D, Seitzman J, Lieuwen T (2011) Development and har-a terization of a variable turbulen e generation system. Exp Fluids 51(3):611�620Mazellier N, Vassili os JC (2008) The turbulen e dissipation onstant is not universal be auseof its universal dependen e on large-s ale �ow topology. Phys Fluids 20(1):015101Mazellier N, Vassili os JC (2010) Turbulen e without ri hardson-kolmogorov as ade. Phys Flu-ids 22(1):075101Mazellier N, Danaila L, Renou B (2010) Multi-s ale energy inje tion: a new tool to generateintense homogeneous and isotropi turbulen e for premixed ombustion. J Turbulen e 11:N43Mydlarski L, Warhaft Z (1996) On the onset of high-reynolds-number grid-generated wind tunnelturbulen e. J Fluid Me h 320:331�368Pearson BR, Krogstad PA, van de Water W (2002) Measurements of the turbulent energy dissi-pation rate. Phys Fluids 14(3):1288�1290Poinsot T, Veynante D, Candel S (1991) Diagrams of premixed turbulent ombustion based ondire t simulation. In: Symposium (International) on Combustion, Elsevier, vol 23, pp 613�619Pope SB (2000) Turbulent �ows. Cambridge University Press, New-YorkRi e SO (1944) Mathemati al analysis of random noise. Bell Syst Te h J 23:282Ri e SO (1945) Mathemati al analysis of random noise. Bell Syst Te h J 24:46Shepherd I, Cheng R, Plessing T, Korts hik C, Peters N (2002) Premixed �ame front stru turein intense turbulen e. Pro eedings of the Combustion Institute 29(2):1833�1840Smith G, Golden D, Frenkla h M, Moriarty N, Eiteneer B, Goldenberg M, Bowman C, HansonR, Song S, Gardiner W, Lissianski V, Z Q (1999)21

Sreenivasan KR (1984) On the s aling of the turbulen e energy dissipation rate. Phys Fluids27(5):1048�1051Sreenivasan KR, Prabhu A, Narasimha R (1983) Zero- rossings in turbulent signals. J FluidMe h 137:251�272Tennekes H, Lumley JL (1972) A �rst ourse in turbulen e. The MIT pressValente P, Vassili os J (2011) The de ay of turbulen e generated by a lass of multis ale grids.J Fluid Me h 687:300�340Wyngaard JC (1968) Measurement of small-s ale turbulen e stru ture with hot wires. J Phys E:S ienti� Instruments 1(11):1105
22