kirby slides
TRANSCRIPT
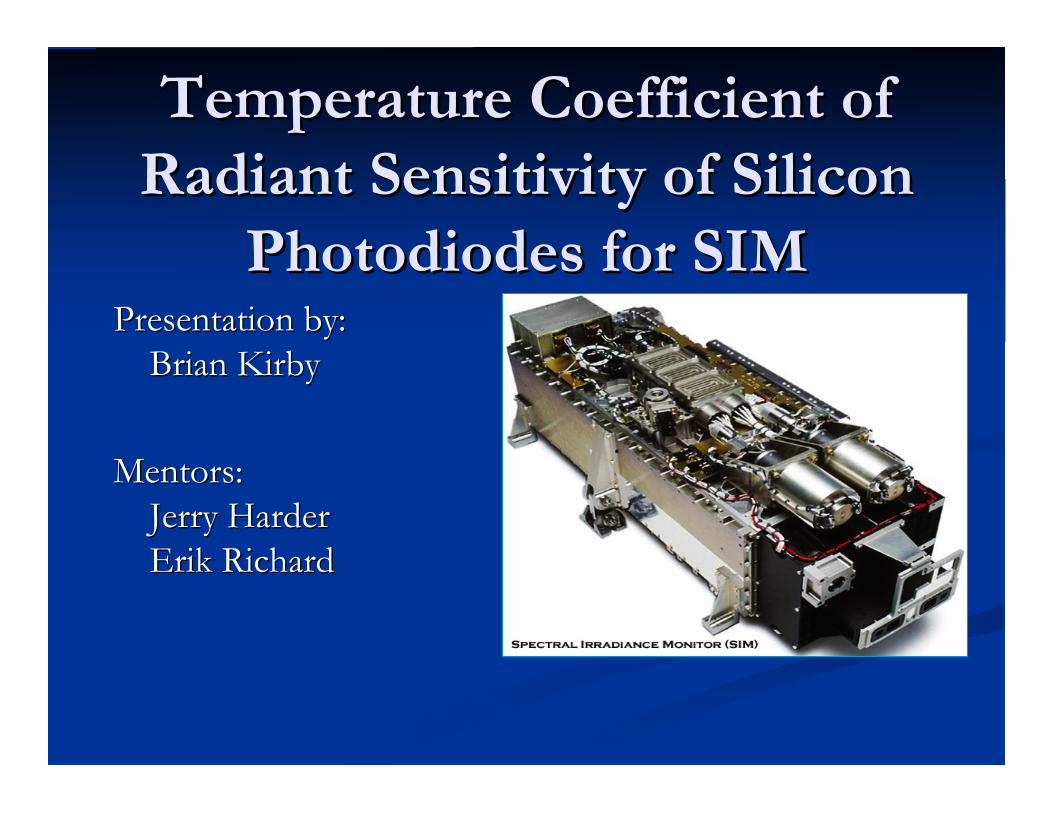
Temperature Coefficient ofTemperature Coefficient ofRadiant Sensitivity of SiliconRadiant Sensitivity of Silicon
Photodiodes for SIMPhotodiodes for SIMPresentation by:Presentation by:
Brian KirbyBrian Kirby
Mentors:Mentors:Jerry HarderJerry HarderErik RichardErik Richard
OutlineOutline
Background on the SIM instrumentBackground on the SIM instrument
Radiant sensitivity and why itRadiant sensitivity and why it’’s importants important ExperimentExperiment
The setupThe setup How data was takenHow data was taken ResultsResults The next stepsThe next steps
SummarySummary Celebrate the end of presentationsCelebrate the end of presentations
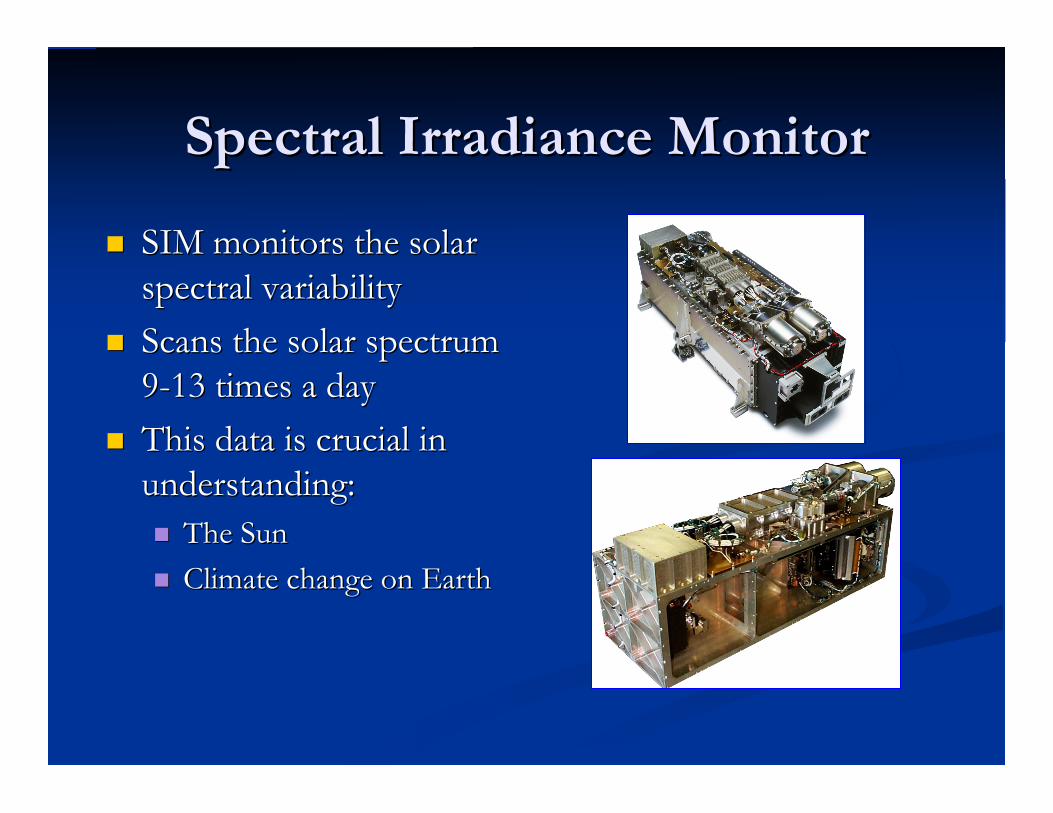
Spectral Irradiance MonitorSpectral Irradiance Monitor
SIM monitors the solarSIM monitors the solarspectral variabilityspectral variability
Scans the solar spectrumScans the solar spectrum9-13 times a day9-13 times a day
This data is crucial inThis data is crucial inunderstanding:understanding: The SunThe Sun Climate change on EarthClimate change on Earth
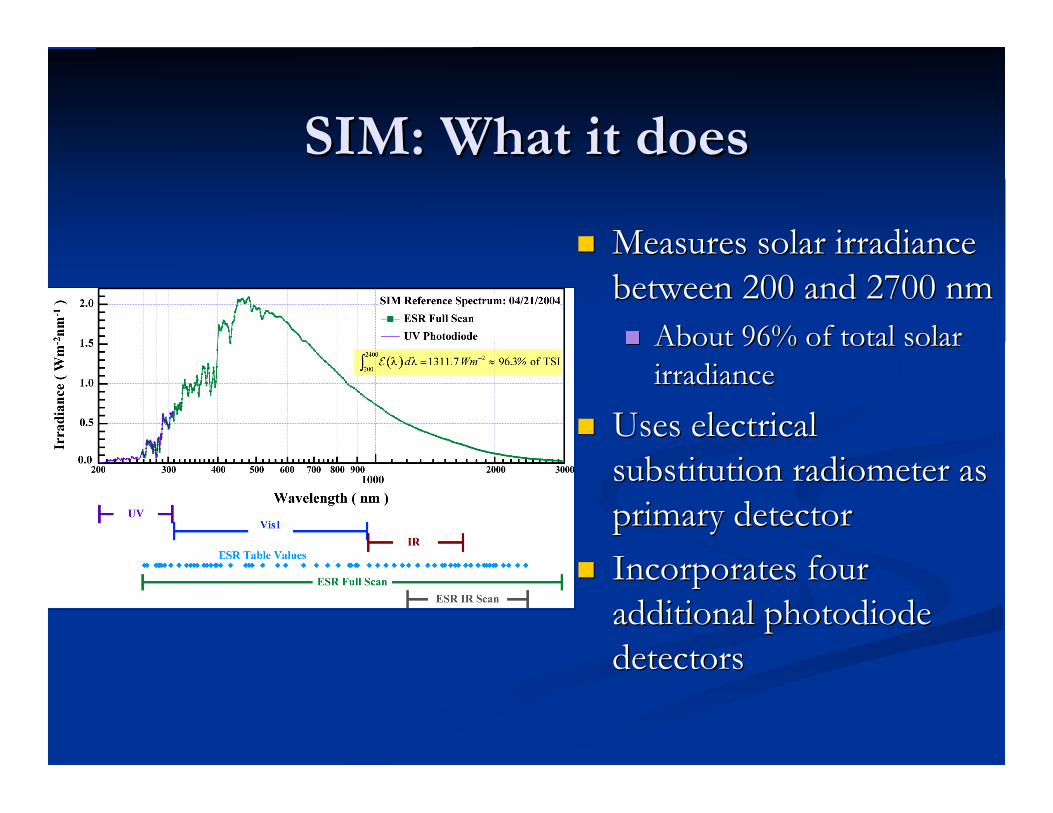
SIM: What it doesSIM: What it does
Measures solar irradianceMeasures solar irradiancebetween 200 and 2700 nmbetween 200 and 2700 nm About 96% of total solarAbout 96% of total solar
irradianceirradiance
Uses electricalUses electricalsubstitution radiometer assubstitution radiometer asprimary detectorprimary detector
Incorporates fourIncorporates fouradditional photodiodeadditional photodiodedetectorsdetectors
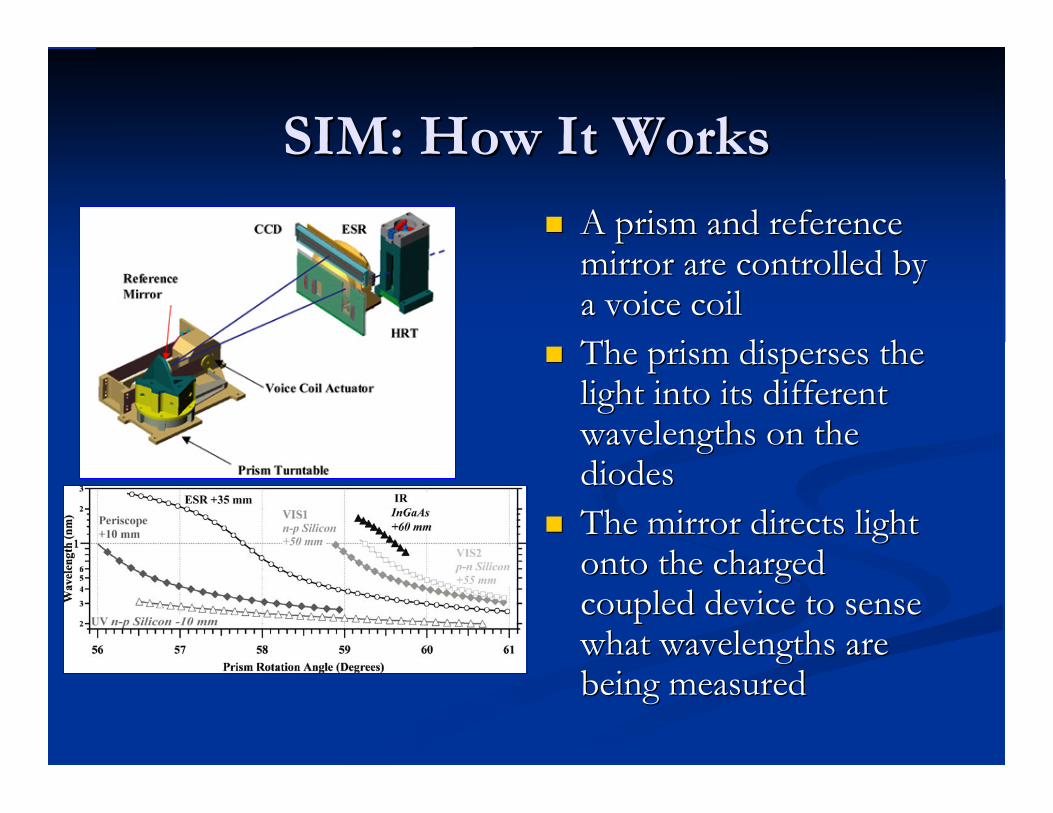
SIM: How It WorksSIM: How It Works A prism and referenceA prism and reference
mirror are controlled bymirror are controlled bya voice coila voice coil
The prism disperses theThe prism disperses thelight into its differentlight into its differentwavelengths on thewavelengths on thediodesdiodes
The mirror directs lightThe mirror directs lightonto the chargedonto the chargedcoupled device to sensecoupled device to sensewhat wavelengths arewhat wavelengths arebeing measuredbeing measured
Are You Paying Attention?Are You Paying Attention?
What does SIM stand for?What does SIM stand for?
Spectral Irradiance MonitorSpectral Irradiance Monitor
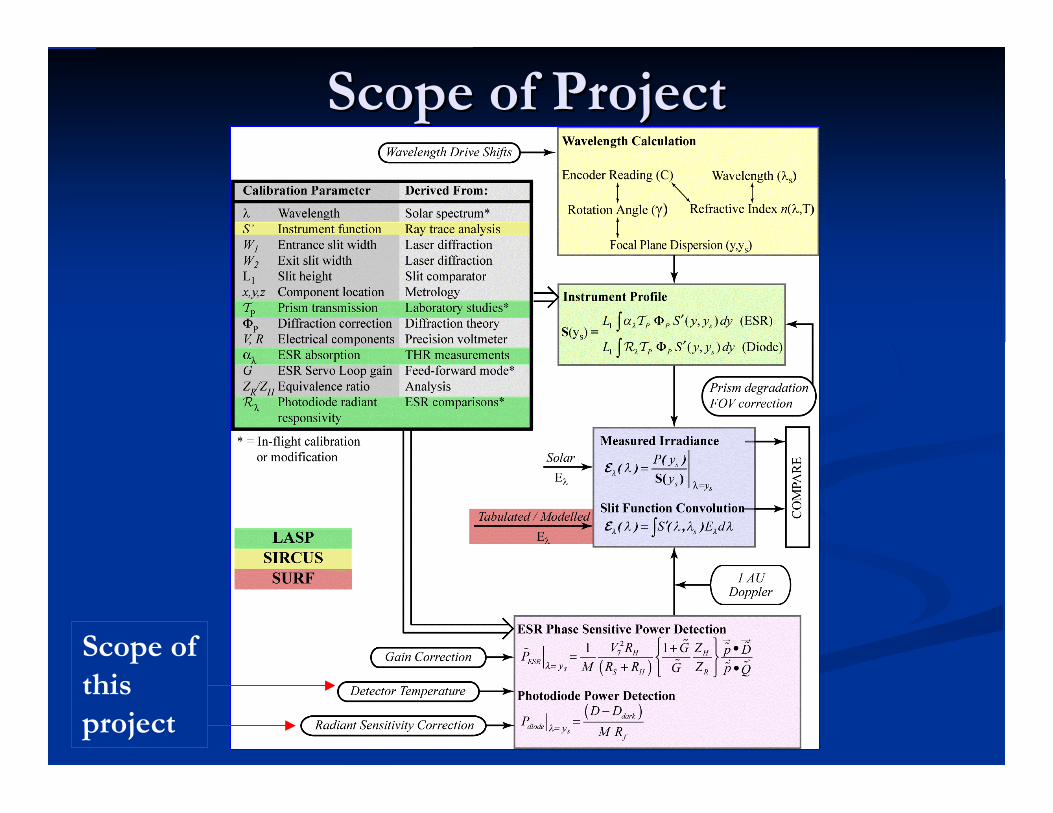
Scope of ProjectScope of Project
Scope ofthisproject
Radiant Sensitivity of PhotodiodesRadiant Sensitivity of Photodiodes
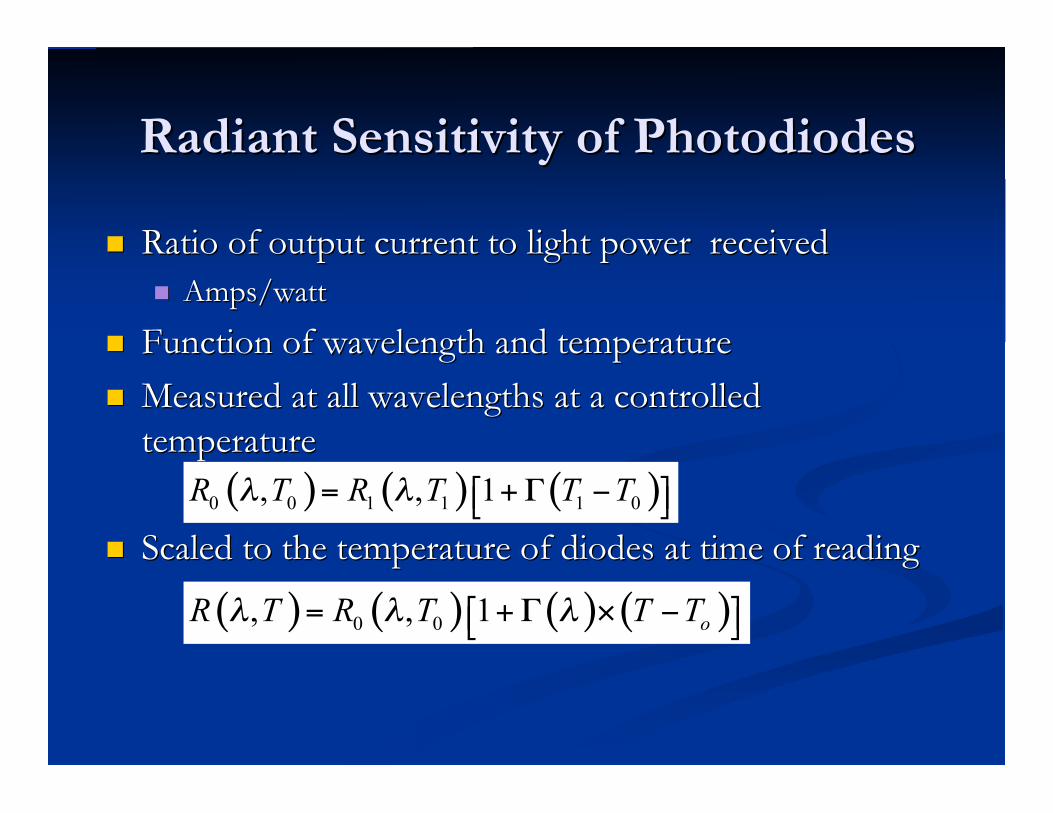
Ratio of output current to light power receivedRatio of output current to light power received Amps/wattAmps/watt
Function of wavelength and temperatureFunction of wavelength and temperature
Measured at all wavelengths at a controlledMeasured at all wavelengths at a controlledtemperaturetemperature
Scaled to the temperature of diodes at time of readingScaled to the temperature of diodes at time of reading
( ) ( ) ( )0 0 1 1 1 0, , 1R T R T T T! != +" #$ %& '
( ) ( ) ( ) ( )0 0, , 1
oR T R T T T! ! != +" # $% &' (
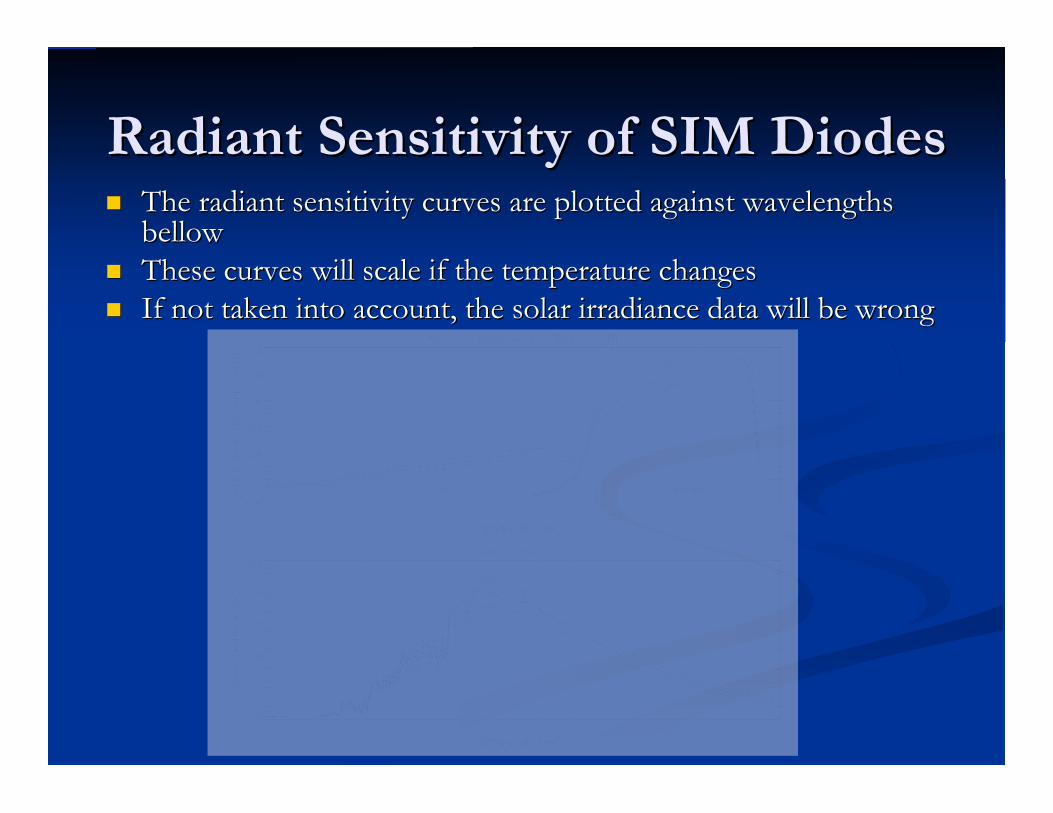
Radiant Sensitivity of SIM DiodesRadiant Sensitivity of SIM Diodes The radiant sensitivity curves are plotted against wavelengthsThe radiant sensitivity curves are plotted against wavelengths
bellowbellow These curves will scale if the temperature changesThese curves will scale if the temperature changes If not taken into account, the solar irradiance data will be wrongIf not taken into account, the solar irradiance data will be wrong
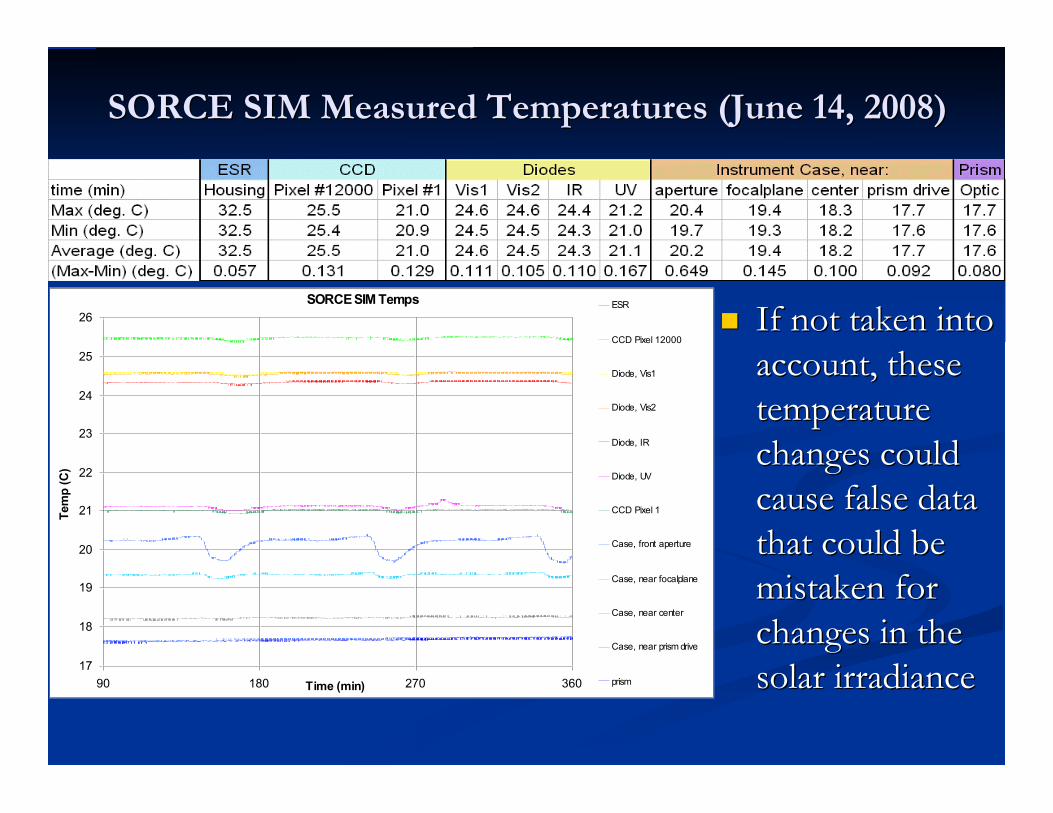
SORCE SIM Measured Temperatures (June 14, 2008)SORCE SIM Measured Temperatures (June 14, 2008)
SORCE SIM Temps
17
18
19
20
21
22
23
24
25
26
90 180 270 360Time (min)
Tem
p (
C)
ESR
CCD Pixel 12000
Diode, Vis1
Diode, Vis2
Diode, IR
Diode, UV
CCD Pixel 1
Case, front aperture
Case, near focalplane
Case, near center
Case, near prism drive
prism
If not taken intoIf not taken intoaccount, theseaccount, thesetemperaturetemperaturechanges couldchanges couldcause false datacause false datathat could bethat could bemistaken formistaken forchanges in thechanges in thesolar irradiancesolar irradiance
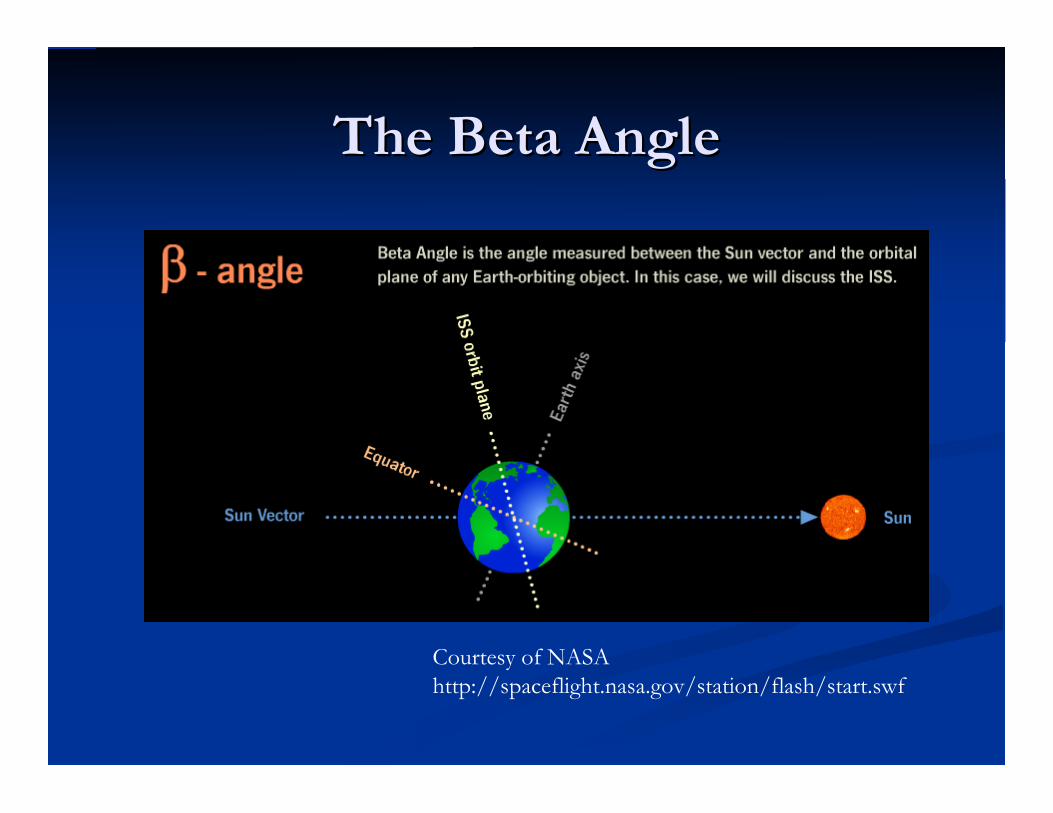
The Beta AngleThe Beta Angle
Courtesy of NASAhttp://spaceflight.nasa.gov/station/flash/start.swf
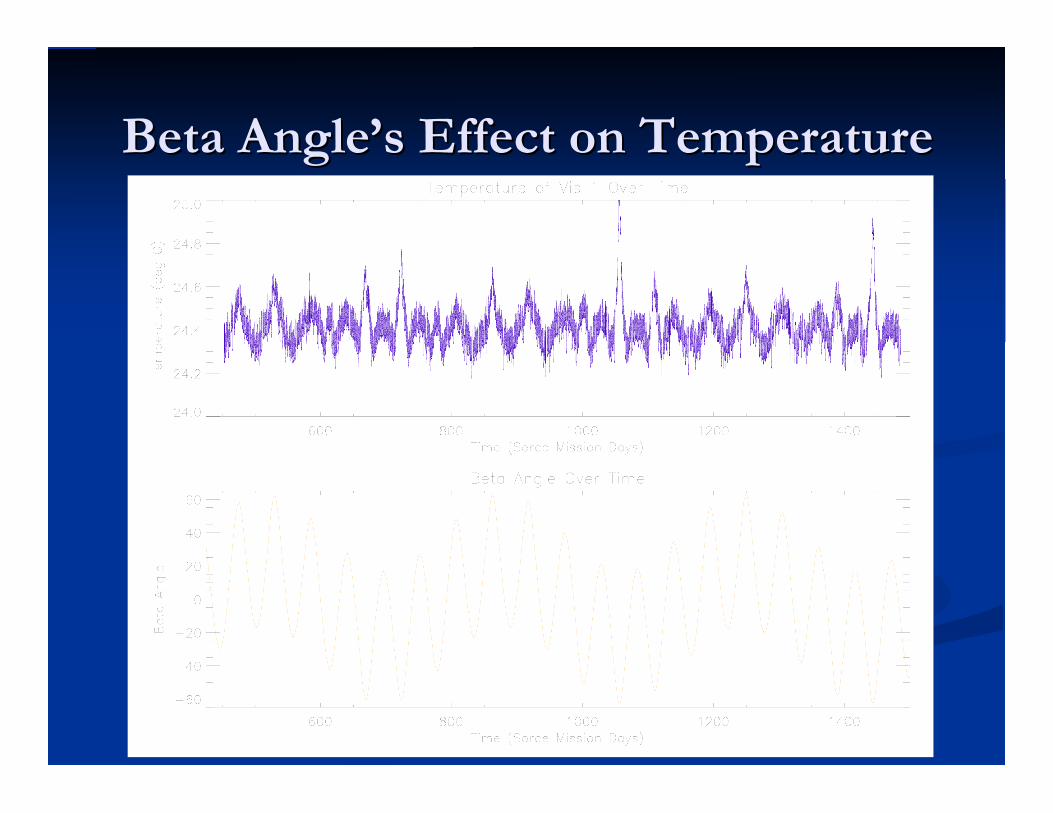
Beta AngleBeta Angle’’s Effect on Temperatures Effect on Temperature
Are You Really Paying Attention?Are You Really Paying Attention?
What is Radiant Sensitivity?What is Radiant Sensitivity? Amps of output current/watt of power receivedAmps of output current/watt of power received
by the detectorby the detector
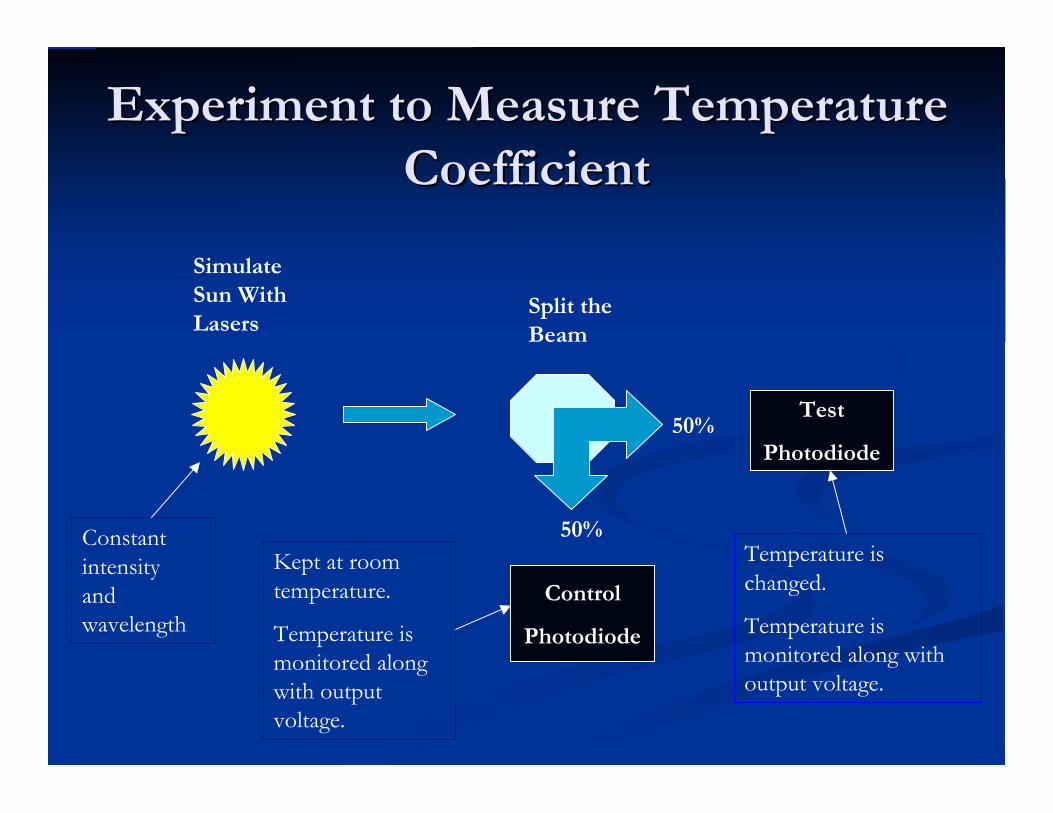
Experiment to Measure TemperatureExperiment to Measure TemperatureCoefficientCoefficient
SimulateSun WithLasers
Split theBeam
50%
50%
Control
Photodiode
Test
Photodiode
Constantintensityandwavelength
Kept at roomtemperature.
Temperature ismonitored alongwith outputvoltage.
Temperature ischanged.
Temperature ismonitored along withoutput voltage.
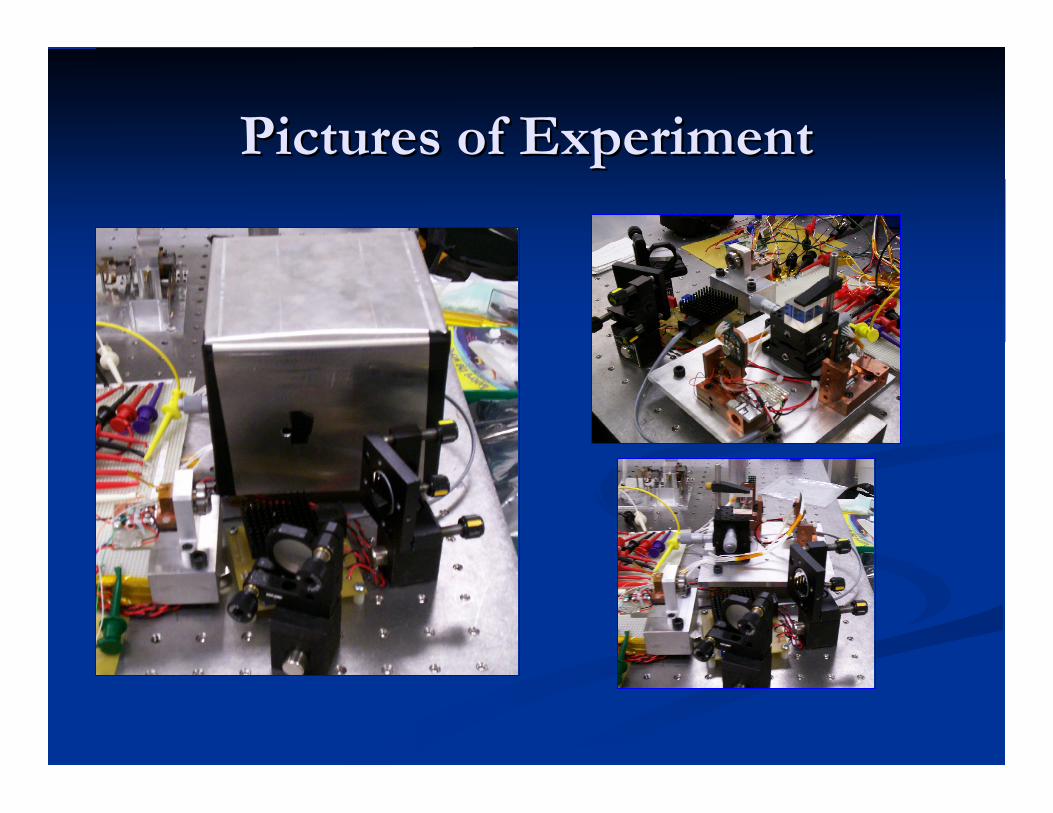
Pictures of ExperimentPictures of Experiment
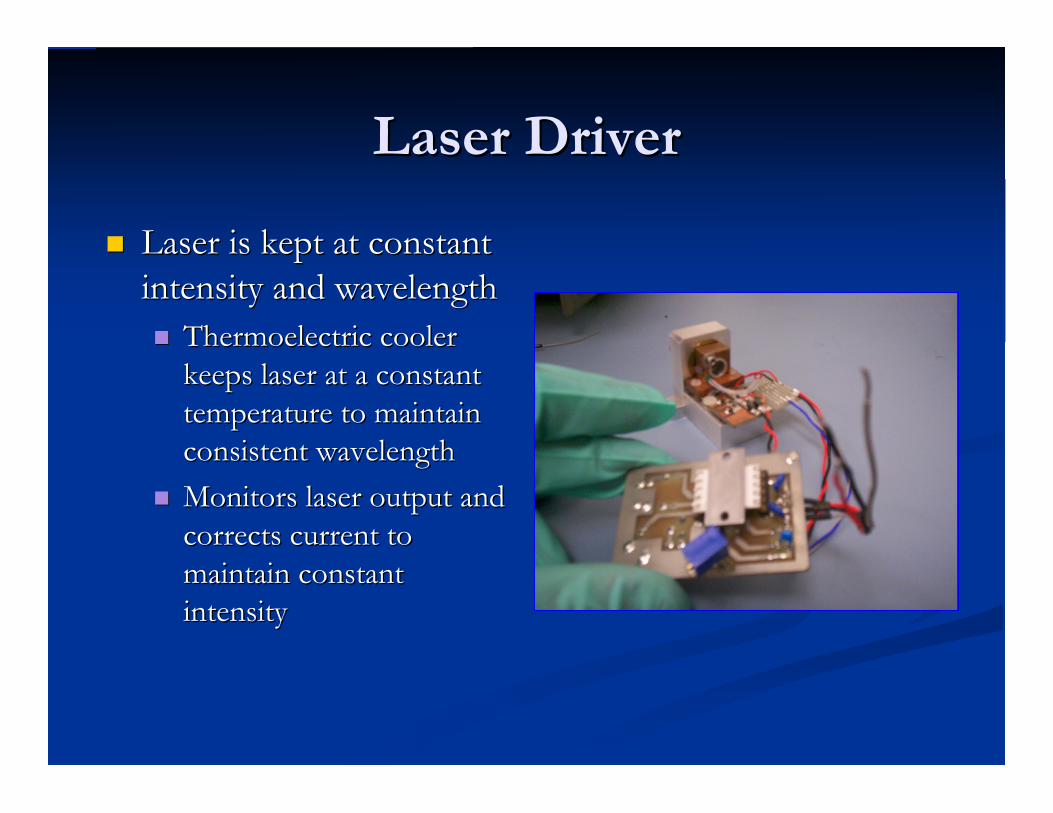
Laser DriverLaser Driver
Laser is kept at constantLaser is kept at constantintensity and wavelengthintensity and wavelength Thermoelectric coolerThermoelectric cooler
keeps laser at a constantkeeps laser at a constanttemperature to maintaintemperature to maintainconsistent wavelengthconsistent wavelength
Monitors laser output andMonitors laser output andcorrects current tocorrects current tomaintain constantmaintain constantintensityintensity
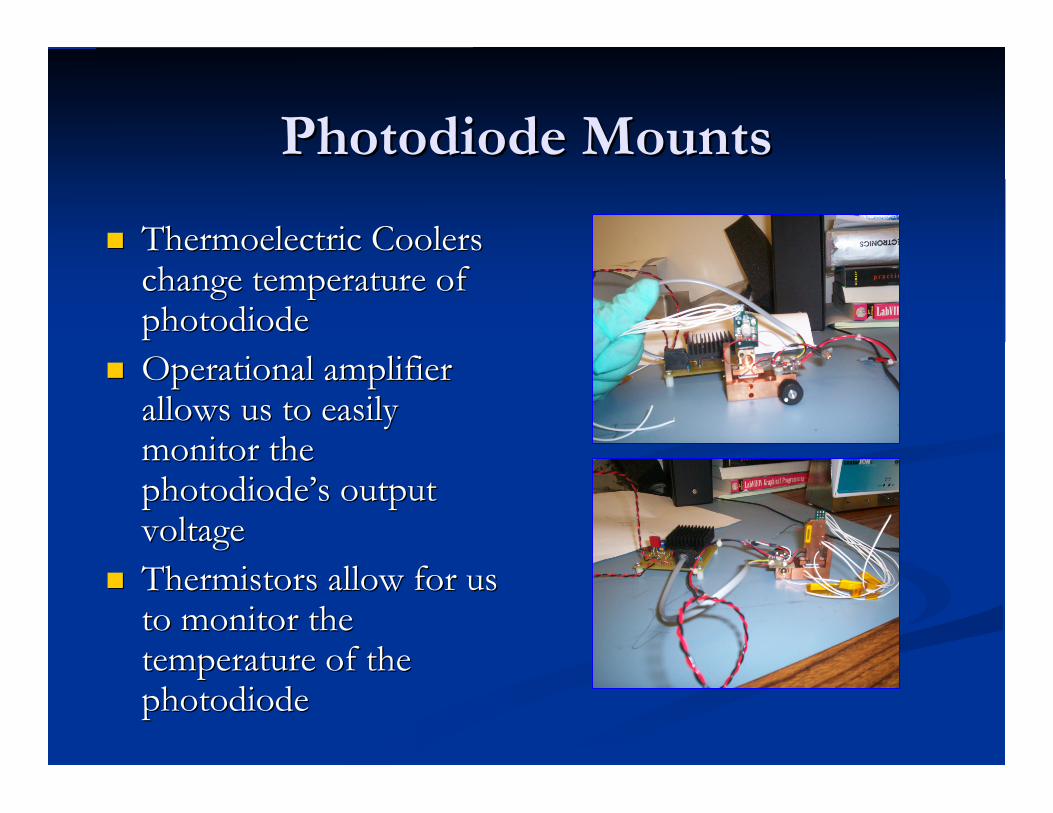
Photodiode MountsPhotodiode Mounts
Thermoelectric CoolersThermoelectric Coolerschange temperature ofchange temperature ofphotodiodephotodiode
Operational amplifierOperational amplifierallows us to easilyallows us to easilymonitor themonitor thephotodiodephotodiode’’s outputs outputvoltagevoltage
ThermistorsThermistors allow for us allow for usto monitor theto monitor thetemperature of thetemperature of thephotodiodephotodiode
Who Wants Candy?Who Wants Candy?
To assure weTo assure we’’re monitoring how the radiantre monitoring how the radiantsensitivity changes at a specific wavelengthsensitivity changes at a specific wavelength
What is the purpose of enclosing the experimentWhat is the purpose of enclosing the experimentin a box?in a box?
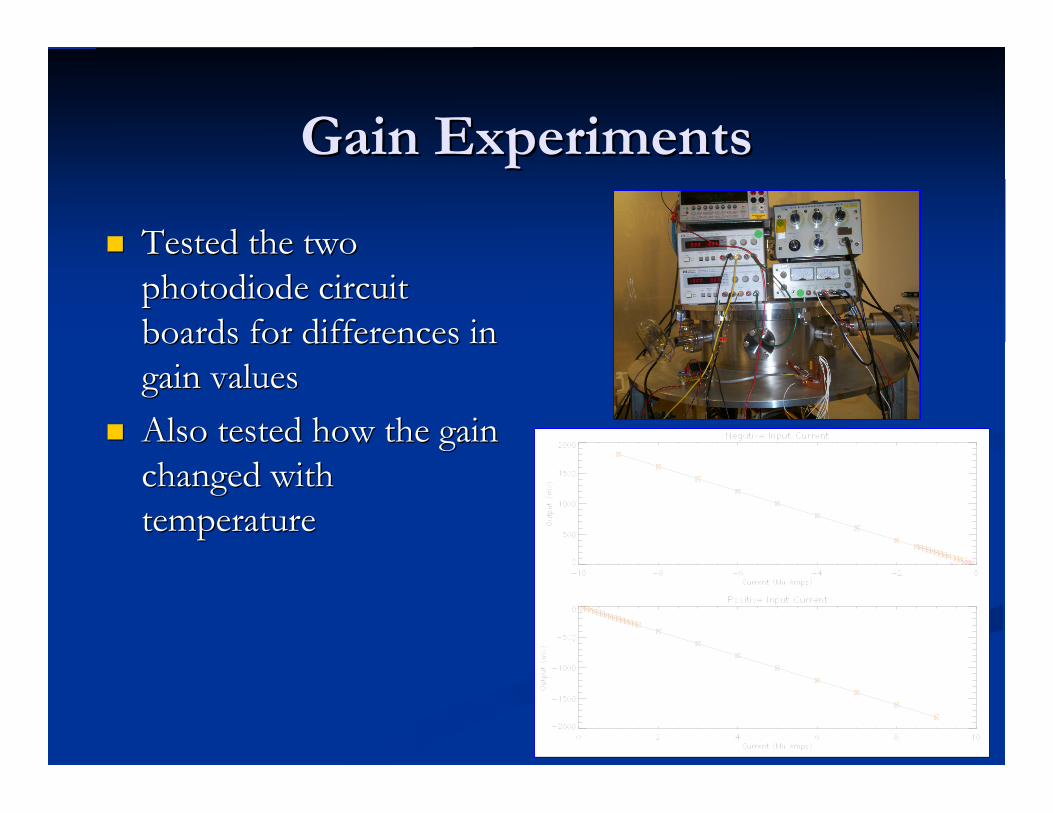
Gain ExperimentsGain Experiments
Tested the twoTested the twophotodiode circuitphotodiode circuitboards for differences inboards for differences ingain valuesgain values
Also tested how the gainAlso tested how the gainchanged withchanged withtemperaturetemperature
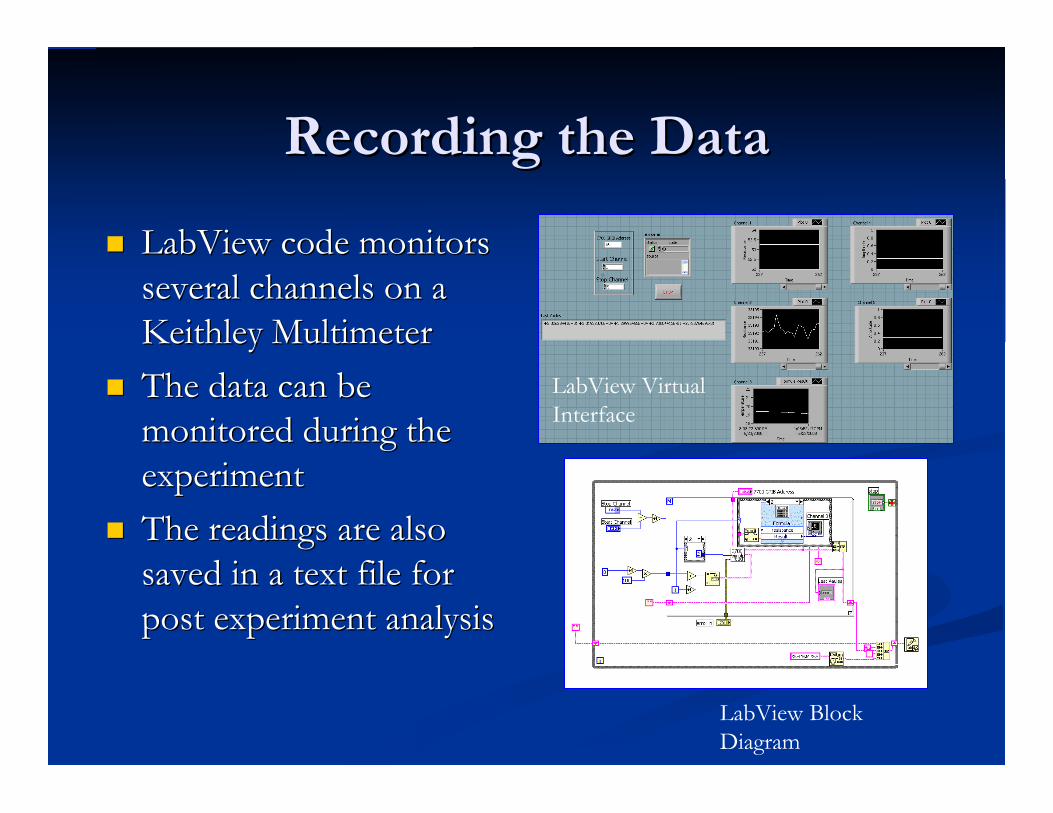
Recording the DataRecording the Data
LabViewLabView code monitors code monitorsseveral channels on aseveral channels on aKeithleyKeithley MultimeterMultimeter
The data can beThe data can bemonitored during themonitored during theexperimentexperiment
The readings are alsoThe readings are alsosaved in a text file forsaved in a text file forpost experiment analysispost experiment analysis
LabView VirtualInterface
LabView BlockDiagram
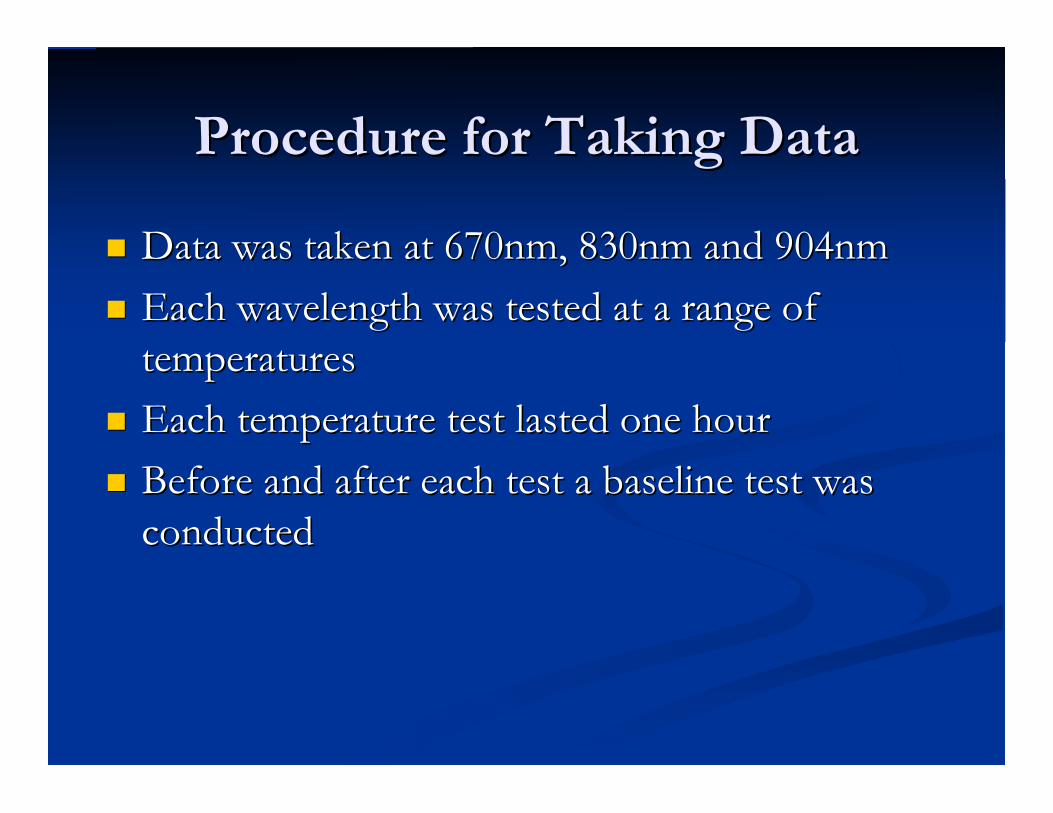
Procedure for Taking DataProcedure for Taking Data
Data was taken at 670nm, 830nm and 904nmData was taken at 670nm, 830nm and 904nm Each wavelength was tested at a range ofEach wavelength was tested at a range of
temperaturestemperatures Each temperature test lasted one hourEach temperature test lasted one hour Before and after each test a baseline test wasBefore and after each test a baseline test was
conductedconducted
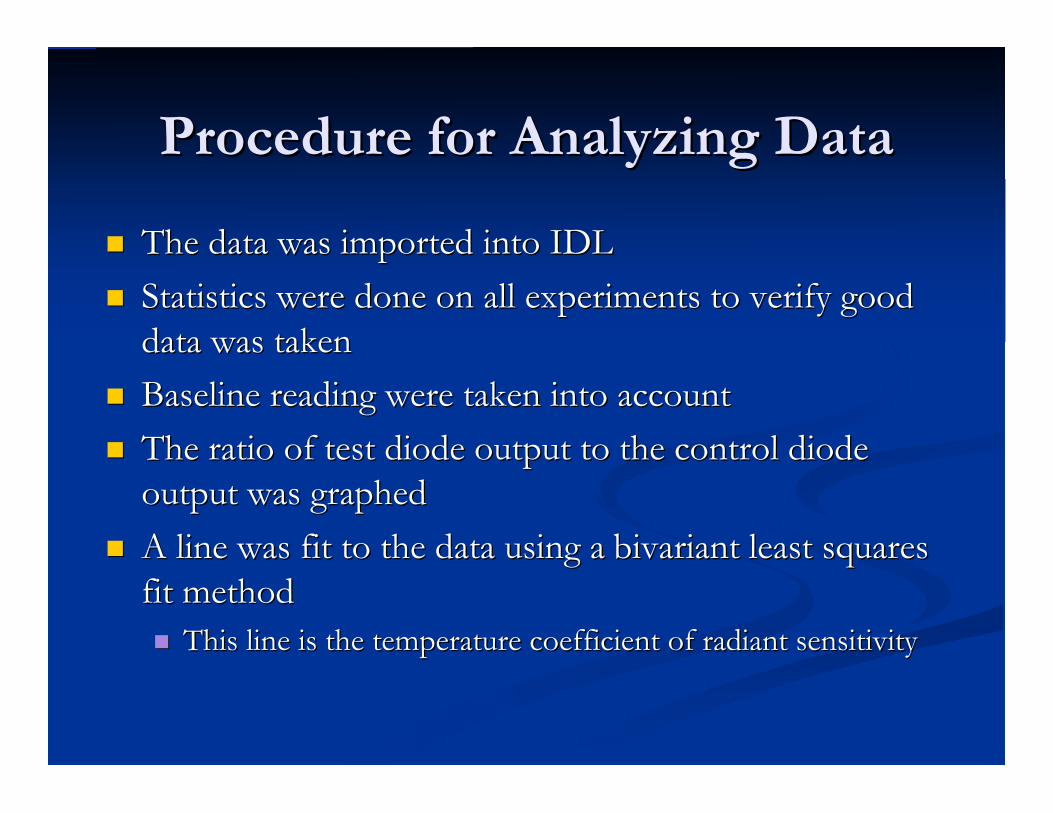
Procedure for Analyzing DataProcedure for Analyzing Data
The data was imported into IDLThe data was imported into IDL
Statistics were done on all experiments to verify goodStatistics were done on all experiments to verify gooddata was takendata was taken
Baseline reading were taken into accountBaseline reading were taken into account The ratio of test diode output to the control diodeThe ratio of test diode output to the control diode
output was graphedoutput was graphed
A line was fit to the data using a A line was fit to the data using a bivariantbivariant least squares least squaresfit methodfit method This line is the temperature coefficient of radiant sensitivityThis line is the temperature coefficient of radiant sensitivity
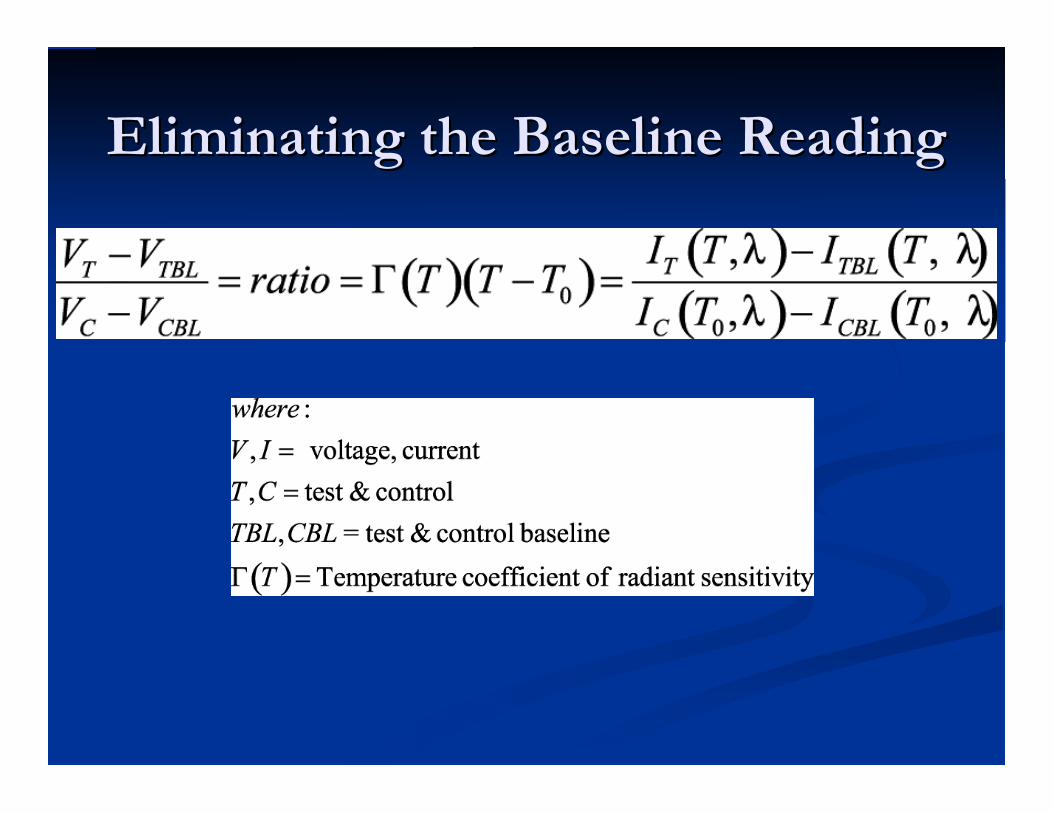
Eliminating the Baseline ReadingEliminating the Baseline Reading
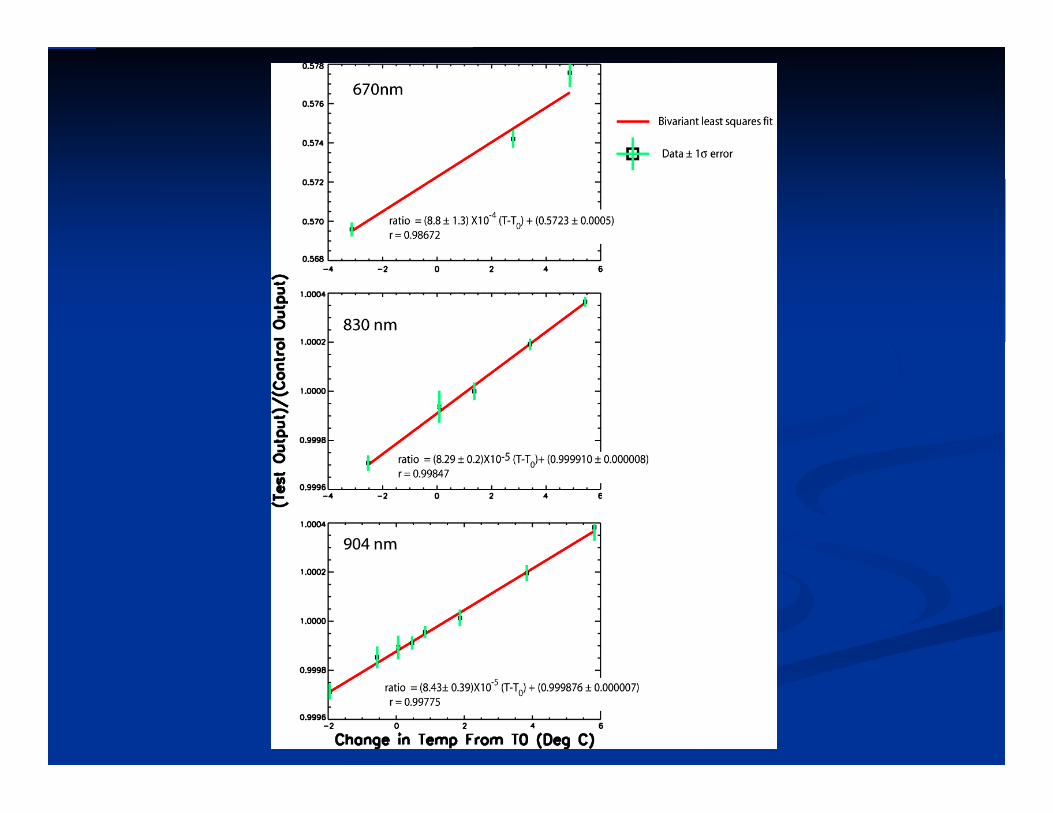
ResultsResults
The Next StepsThe Next Steps
Phased experiment needs to be createdPhased experiment needs to be created More wavelengths need to be measuredMore wavelengths need to be measured The lasers need to be tested accuratelyThe lasers need to be tested accurately
Final GoalFinal Goal
The next SIM should be calibrated with aThe next SIM should be calibrated with amachine that works like this experimentmachine that works like this experiment
This calibration will This calibration will accuratlyaccuratly find the find thetemperature coefficient of radiant sensitivity fortemperature coefficient of radiant sensitivity forall wavelengths measure by SIMall wavelengths measure by SIM
Without this correction it will be impossible forWithout this correction it will be impossible forSIM to meet the required 0.01% accuracySIM to meet the required 0.01% accuracy
Quick SummaryQuick Summary
SIM is designed to measures the solar spectrumSIM is designed to measures the solar spectrum This data is crucial to understanding the Sun andThis data is crucial to understanding the Sun and
itit’’s effect on Earths effect on Earth’’s climates climate This experiment was designed to help make theThis experiment was designed to help make the
SIM data more accurateSIM data more accurate
ItIt’’s over!s over!
Any Questions?Any Questions?