investigation of stabilizing agents in thin sol-gel zirconium
TRANSCRIPT

Investigation of Stabilizing Agents in Thin Sol-Gel
Zirconium Oxide Anti-corrosion Coatings on Iron
Materials
Vom Fachbereich Chemie
der Technischen Universität Darmstadt
Zur Erlangung des akademischen Grades eines
Doktor-Ingenieurs (Dr.-Ing.)
Dissertation
Ruperto Antonio Ugas Carrión
2010

Investigation of Stabilizing Agents in Thin Sol-Gel
Zirconium Oxide Anti-corrosion Coatings on Iron
Materials
Vom Fachbereich Chemie
der Technischen Universität Darmstadt
zur Erlangung des akademischen Grades eines
Doktor-Ingenieurs (Dr.-Ing.)
genehmigte
Dissertation
eingereicht von
Ruperto Antonio Ugas Carrión, Ing. Quim.
aus Carúpano (Venezuela)
Referent: Prof. Dr. Wolfgang Ensinger
Korreferentin: Prof. Dr. Barbara Albert
Tag der Einreichung: 13.08.2010
Tag der mündlichen Prüfung: 18.10.2010
Darmstadt 2010 D17

Dedicated to my loving mother Josefina

Acknowledgements
First I would like to thank Prof. Dr. Wolfgang Ensinger, my doctoral advisor, for
giving me the opportunity to begin this investigation on his crew, for his help in
several life occasions, Visa and DAAD support letters, for his comprehension
about my work and for his great help given me the HiWi job necesary for my
financing .
Likewise, I want to express my heartfelt gratitude to Dr. Falk Sittner, my co-
advisor, for his consistent assistance, interest and great help, continous
understanding and opportune observations. I greatly appreciate his patience in
reading my paper manuscripts and thesis and his useful annotations which
improved my thesis.
I would like special acknowledge Prof. Dr. Barbara Albert for her kind
acceptance to act as co-referee of my thesis.
My sincerely thanks to Dr. Stefan Flege for the important SIMS measurements,
his time, advice and for his continuos helpful and technical support in many
opportunities.
I would like to acknowledge Prof. Dr. Hans-Joachim Kleebe, his crew, Frau
Ulrike Kunz for the helpful cooperation with the TEM measurements and to Dr.
Roland Schierholz for his very important support in the crystals analysis.
I am also very thankful to Dr. Joachin Brötz for the countless and important
XRD measurements and for his necessary explanations about the crystalline
structure of my samples.
My special thanks go to Prof. Dr. Michael Reggelin and Frau T. Solms for their
understanding and help with the Promotionskolleg.
I am very thankful to Prof. Dr. Andreas Klein and his crew for the XPS
measurements.
I want to thank Veronika Metje for her great support from the DAAD office

My further Thanks go to:
Dr. Prof. Koumei Baba for his kind cooperation with the plasma ion bean
implantation samples and to Dr. Ruriko Hatada for her collaboration with the
deposition.
Dr. Prof. Victor Carrizales and Dr. Prof. Lucas Álvarez for their support.
Dr. Gunther Kraft for the ESMA analysis and for the good advice and humor.
Brunhilde Thybusch for SEM and microscopical pictures.
Claudia Fasel for the hardness measurements and support with microscopical
images.
Thomas Hermann for his help with SEM images.
Mehdi Yekehtaz, my working collegue, for his kind collaboration with SEM
images and in the electrochemistry laboratory.
Dorotea Berres and Renate Benz for their collaboration in chemistry laboratory
and for the constant support with new bulbs for our light microscop.
Jens von Ringleben for his productive advice and support with EIS
measurements.
Dr. Gerhard Miehe for the allowowance to use his PIES program for some TEM
crystal analysis.
Dr. Ljuba Schmitt and Jens Kling for their help with High Resolution TEM
analysis.
Antje Pappenhagen, our kind secretary, for her assistance during the
administrative procedures.
Eduard Gunnesch for the XPS measurements.
Dr. Olaf Baake for his kind advice
I am also very thankful to all my colleagues at the FG Materialanalytik, FB
Material-und Geowissenschaften, TU-Darmstadt for the friendly and affable
working ambience, helpful collaboration and the great Caferunde.
I would like to thank the government of Venezuela represented through the
Fundación Gran Mariscal de Ayacucho (FUNDAYACUCHO) for the financing of
a great part of my doctoral studies in Germany and to the German Academic
Exchange Service (DAAD) for the financing of my german course and for given

me the great opportunity to make doctoral studies in Germany and to the TU-
Darmstadt for supporting the working materials.
I express my hearty thanks to my loving mother Josefina, my sisters Cruz and
Teresa, my others brother and sisters, my nephews Henry Ugas, Rebeca and
Leonardo, to Sonia Negrau and her family, as well as to Oxana and my friends,
Kathrin, Rudi, Yuly, Danka, Heinrich, Daniel, Juan, Miguel, Manuel Heib, for
their love, comprehension and assistance during my stay in Germany and their
belief in me for the successful ending of this work.

Abstract
Thin protective zirconium oxide coatings prepared via sol-gel with zirconium
propoxide and acetyl acetone (acac) or hydroxypropyl cellulose as stabilizers
have been successfully deposited onto iron substrates at low temperature.
Electrochemical current density vs. potential scans showed a reduction of the
iron dissolution current density and coating porosity in comparison to uncoated
iron, with a strong decrease of these parameters around 5 orders of magnitude
for a HPC concentration = 0.004 g/l. This result is expected as the steric effect
of HPC.
A mixed oxide layer of zirconium and iron was observed in SIMS depth profiles.
The mixed oxide layer thickness showed a dependence on the acac molar ratio.
Increases of acac shorted the overall film thickness, while the mixed oxide layer
was thicker. ZrO2-HPC coatings displayed however, a thicker mixed oxide layer
and additional increases of the zirconium intensity direct onto substrate surface.
So a higher interdiffusion of zirconium into deeper layers and of iron towards
coating surface was reached.
XRD revealed that the mixed oxide layer is localized between the substrate and
coating surface and possess crystalline structure. At a HPC concentration =
0.004 g/l no ZrO2 reflexes could be detected. ZrO2 crystals of 70 nm size were
identified by TEM in ZrO2-acac coatings. However, ZrO2-HPC films showed an
amorphous structure constituted of ZrO2 and iron oxide containing
nanocrystalline zirconium oxide particles immersed in the mixed oxide layer.
The crystals (monoclinic 112) size was between 5 and 10 nm. This result
explains why there were not zirconium oxide reflexes visible in the XRD
analysis. Obviously the ZrO2 crystalline particles are too small (less than 10 nm)
to be detected by XRD so they appear as amorphous material [83]. The
particles are immersed in a compact and amorphous mixed oxide matrix. The
correlation between growth of the mixed oxide phase and decrease of
dissolution current density suggests that it is the mixed oxide phase with
zirconium nanoparticles that is responsible for the reduction of film porosity and
the good corrosion protection properties of the films.

Zusammenfassung
Dünne Zirkoniumoxidschutzschichten auf Basis von Zirkoniumpropoxid mit
Acetylaceton (acac) und Hydroxypropylcellulose (HPC) als Stabilisatoren
wurden erfolgreich durch Sol-Gel-Verfahren synthetisiert und auf
Eisenwerkstoffen bei Raumtemperatur abgeschieden. Potenzialmessungen
zeigten eine Erniedrigung der Stromdichte und der Porosität im Vergleich zu
unbeschichtetem Eisen, wobei die ZrO2-HPC-Beschichtungen besonders starke
Erniedrigungen um bis zum 5 Größenordnungen zeigten. Dies ist vermutlich ein
Ergebnis des sterischen Effekts von HPC und wurde bei einer optimalen
Konzentration von 0,004 g/l erreicht. In SIMS-Messungen wurde zusätzlich eine
Oxidschicht bestehend aus ZrO2 und Eisenoxid festgestellt. Die Dicke dieser
Oxidschicht weist eine Abhängigkeit von dem Molaranteil des Acetylacetons
auf. Mit ansteigendem Anteil von acac wird die gesamte Schichtdicke dünner
und die Oxidschicht dicker. SIMS-Messungen zeigten ZrO2-HPC-Schichten bei
den dennoch eine dickere Oxidschicht und zusätzlich einen Anstieg der
Zirkoniumintensitäten direkt auf der Substratoberfläche. Daher findet eine
starke Interdiffusion von Zirkonium in tiefere Schichten und von Eisen in
Richtung der Probenoberfläche statt.
Die kristalline Oxidschicht liegt zwischen Substrat und
Beschichtungsoberfläche, was durch die XRD-Messungen bestätig wurde. Bei
einer Konzentration von HPC = 0,004 g/l konnte kein Reflex von kristallinem
ZrO2 detektiert werden. ZrO2-Kristalle mit einer durchschnittlichen Größe von
70 nm wurden mittels TEM in ZrO2-acac-Schichten beobachtet. Allerdings
zeigten die ZrO2-HPC-Schichten eine amorphe Oxidschichtstruktur aus Eisen
und Zirkoniumoxid mit nanokristallinen ZrO2-Partikeln. Dies erklärt, warum
keine ZrO2-Reflexe bei den XRD-Messungen detektiert wurden. Offensichtlich
sind die ZrO2-Partikel keiner als 10 nm, sodass sie als amorphes Material beim
XRD erscheinen. Die Partikel sind eingebettet in eine kompakte und amorphe
Oxidmatrix. Die Zuordnung zwischen dem Wachstum der Oxidschichtphase und
der Reduzierung der anodischen Stromdichte weist darauf hin, dass die
Oxidschichtphase sowie die Nanopartikel für die Erniedrigung der Porosität und
die guten Korrosionsschutzeigenschaften der dünnen Schichten verantwortlich
sind.


6
Index of Content
Index of Content……………………………………………………………………..6
Symbols and Acronyms...…………………………………………………………11
Aim…………………..………………………………………………………………..12
A. Theory………………………………………………………………….…………14
I. Sol-Gel process…………………………………….……………….………14
1. General……………………....…………………………….............................14
1.1 Sol-gel mechanism...............................................................................16
1.2 Transition metals……………………………..……………………………19
2. Protective sol-gel coatings…………………………………………………...20
3. Porosity and protective coatings………………….…………………………21
II. Production of protective oxide films on metals….……………………….21
1. Role of stabilizers and modifiers……………………………………………21
1.1 Use of stabilizer as bridging and chelating agents…..……………….21
1.1.1 Acetyl acetone (acac)…………………………..………………..25
1.1.2 Hydroxypropyl cellulose (HPC) as stabilizer..………………...27
III. Corrosion……………………………………………………………………..29
1. General……………………………………………………..…………………29
1.1 Uniform corrosion……………………………………..…………………30
1.2 Pitting corrosion………………………………………..………………...30
1.3 Intergranular or intercrystalline corrosion…………..…………………32
1.4 Galvanic Corrosion…………………………………..………………….32
1.5 Bio-Corrosion………………………………………….………………...34
2. Passivation………………..………………………………………………….35
3. Thermodynamics and kinetics aspect…………..…………………………35
3.1 Fee standard energy……………………….…………..……………….35
3.2 Corrosion of iron………………………………………..………………37

7
3.3 Effect of pH……………………………………………….……………..39
3.4 Kinetics aspects of corrosion processes………..….………………...41
4. Corrosion protection………………………………………………………..43
5. Protection by sol-gel coatings……………………………….…………….45
5.1 Protective metal alkoxide coatings…...……………………………….45
5.2 Hybrid metal oxide films………………………………………………..46
5.3 Zirconium oxide- base films……………………………………………46
IV. Electrochemical methods on corrosion characterization.................47
1. Linear polarization resistance……………….……………………………47
1.1 Double Layer and Butler-Volmer equation…………………………..47
1.2 Polarization resistance and measure principle……………………...48
1.3 Stern-Geary equation and corrosion rate.........................................50
2. Tafel Plot…...……………………………………………..………………….52
2.1 Measure principle………………………………...……………………..52
2.2 Tafel fit and corrosion rate…...…...….…………..……………………..53
3. Cyclic voltammetry and potential scans………….....…………………….54
4. Electrochemical impedance spectroscopy…….........………………........57
4.1 Measure principle…………………………………..……………………57
4.2 Physical representation of impedance…………...……………………59
4.3 Equivalent circuit for coated metal………………...……………………60
B. Experimental……………...………………………………………………………62
I. Samples preparation……...………………………………………………….62
1. Polishing process...……………………………………………………………62
2. Sol preparation...…………………………..………………………………......64
2.1 Zirconium propoxide acetyl acetone sols…………….…………………64
2.2 Zirconium propoxide-hydroxypropyl cellulose sols...………………......64
2.3 Hybrid sols……………………………….…………………………………65
3. Deposition parameters and spin coating…….…..………………………......65
4. Heat treatment……………………..……………………………………………66
5. Film thickness…...……………………………………………………………...67

8
II. Electrochemical measurements………………………………………....67
1. Electrochemical cell…………………………………………………………...67
2. Electrolyte, pH and temperature……...……………………………………...68
3. Potentiodynamic scans and cyclic voltammetry…………………………....69
4. Linear polarization resistance………….…………………………….............70
5. Tafel plot………………………………….…………………………………….70
6. Electrochemical impedance spectroscopy…………………………............70
III. Structure and composition characterization…………………..………71
1. Scanning electron microscopy (SEM/EDX)………………………………...71
2. Electron probe microscope analysis (EPMA/ESMA)...……………………71
3. X-ray photoelectron spectroscopy (XPS)……………...……………………72
4. Secondary ion mass spectrometry (SIMS).…………...……………............72
5. X-ray diffraction (XRD)………………………………………………………..74
6. Transmission electron microscopy (TEM)..…………...…………………….74
C. Results and Discussion…………………………………………………..........75
I. Parameter optimization…………………………………………………….75
1. Influence of spinning rate and time on film thickness…………………......75
2. Heating time and temperature effect………………………………………..77
3. Effect of the electrolyte temperature………………….……………………..78
4. Types of electrolyte, pH and concentration………..……………………....79
II. Electrochemical porosity measurements………………………………80
1. Potentiodynamic scans………………………………………………………80
1.1 Zirconium oxide coatings with acetyl acetone (ZrO2-acac)………80
1.1.1 Influence of heating temperature…..…….……………….….81
1.1.2 Effect of propanol/water ratio……….….....…………...……..84
1.1.3 Effect of acetyl acetone concentration…..............................85
1.1.4 Effect of heating time…………………………………......…...89
1.1.5 Multilayer coatings………………………...…………...………91
1.2 Hybrid films.………………………………………………………….....92

9
1.3 Zirconium-silicon oxide coatings…………………………................93
1.4 Zirconium oxide coatings with HPC (ZrO2-HPC)…………....….....95
1.4.1 Effect of HPC concentration………………………………...95
1.4.2 Effect of heating temperature...............……………………..98
1.4.3 Effect of molar weight of HPC………………...…...………...99
1.4.4 Hybrid coatings..................................................................100
1.4.5 Steel samples………………...……....................................103
III. Film morphology and structure………………………………………...103
1. Scanning electron microscopy (SEM)……………....…………...............103
2. ESMA/EDX measurement of element distribution…...….......................106
3. X-ray photoelectron spectroscopy (XPS) analysis…...…………………108
3.1 Samples prepared with acac………….…………....……………….....108
3.2 Samples prepared with HPC…………………………..………………110
4. Crystalline structure analysis with X-ray diffraction (XRD)……………..113
4.1 Samples prepared with acetyl acetone……………………..………...113
4.2 ZrO2-acac samples heated at higher temperatures..........................115
4.3 Samples prepared with hydroxypropyl cellulose………….………...118
4.3.1 Effect of HPC concentration……………………………......118
4.3.2 Effect of heating temperature...…...……..………………....121
4.4 Comparison HPC-acac coatings……………….…………………….122
5. Secondary ion mass spectrometry (SIMS)……………………………….124
5.1 Zirconium oxide coatings prepared with acac…………………….....124
5.1.1 Effect of time and heating temperature……………............125
5.1.2 Effect of acac concentration………………...………………127
5.2 Zirconium oxide coatings prepared with HPC…………………….130
5.2.1 Effect of HPC concentration………………………………...131
5.2.2 Effect of time and heating temperature…………………….134
5.2.3 Effect of HPC molar weight……………..…………………...137
6. Crystalline analysis with TEM…………………………………………….140
6.1TEM measurements of ZrO2-acac ………………..…………………140
6.2 TEM measurements ZrO2-HPC………….…………….……………142

10
IV. Corrosion characterization………………………………………………145
1. Linear polarization …………………………………..………...…………...145
1.1 Zirconium oxide coatings prepared with acac……………...............146
1.2 Zirconium oxide coatings prepared with HPC……………………...147
2. Electrochemical impedance spectroscopy……………………………....147
3.1 Coatings in buffer sodium acetate/acetic acid……………..............147
3.2 Coatings in NaCl = 0.05M………………………………….………...150
Summary……………………………………………………………………...........153
References……....…………………………………………………………………155
List of chemicals............................................................................................167
Curriculum......................................................................................................168
List of publications........................................................................................170

11
Symbols and Acronyms
Acac ----------------------------- Acetyl acetone
SN1 ----------------------------- Nucleophilic substitution first order
SN2 ----------------------------- Nucleophilic substitution second order
M ----------------------------- Metal atom
O ----------------------------- Oxygen atom
--O-- ----------------------------- Oxo bridge
R ----------------------------- Radical alkyl group
HZ ----------------------------- Acidic reactant
VDWL ----------------------------- Van der Waals-London attraction forces
(c) ----------------------------- Ionic strength
NMR ----------------------------- Nuclear magnetic resonance
MW ----------------------------- Molar weight
HPC ----------------------------- Hydroxypropyl cellulose
ΔG ----------------------------- Free Gibbs energy
ΔQ ----------------------------- Charge flow
Φ ----------------------------- Electrical potential in electric work
E ----------------------------- Electrochemical potential
ΔN ----------------------------- Amount of transferred material
Z ----------------------------- Metal valence
E0 ----------------------------- Standard electrode potential
SHE ---------------------------- Standard hydrogen potential
ia ---------------------------- Current density
i0 ---------------------------- Maximum current density at equilibrium
Ecorr ---------------------------- Corrosion potential
icorr ---------------------------- Corrosion current
Rp ---------------------------- Polarization resistance
βa ---------------------------- Anodic Tafel slope
βc ---------------------------- Cathodic Tafel slope
k ---------------------------- Corrosion rate

12
Aim
The worldwide corrosion cost encloses every year billions of dollars equivalent
to approximately 3 % of the world´s gross domestic product [50]. These costs
arise not only from direct corrosion damage but also from its follow-up costs due
to repairs or downtimes of machines. Besides the financial aspect the
consequences for the environment may be dramatically higher if toxic
substances are involved.
The demands of high technology fields such as microelectronics and optics
have made the development of effective counter measures against corrosion a
real challenge. While the dimensions of technical devices shrink down to
nanometer scale new solutions against wear and corrosion have to be
developed to guarantee reliable protection also in nanotechnology applications.
Since some decades the sol-gel technique has generated efficient approaches
with the synthesis of thin metal oxide coatings. They can act as a barrier
between metal substrate and the aggressive environment and can be deposited
from a large spectrum of precursor materials. The sol-gel process combines
fast, cheap and convenient deposition with the possibility to produce new
classes of materials which can be designed through various process
parameters to the desired needs.
Major drawbacks of this method are the complexity of different reactions during
the deposition procedure and the process-related porosity which is undesirable
for corrosion protection applications. The interrelations of process parameters
and their effect on the final structure of the product are still not fully understood.
While a lot of applications in fields such as catalysis or separation benefit from
porous sol-gel materials there is only little knowledge existing about how to
reduce or eliminate the film porosity. One reason is the strong dependence of
the film properties on the subjacent substrate material which makes it hard to
establish general principles and mechanisms that can be transferred to other
coating/substrate systems.
In the present work metallic iron substrates are coated with thin zirconium oxide
sol-gel films from a zirconium n-propoxide precursor. This material has already

13
proven its favorable protection properties on iron materials. The aim of this work
is the investigation of sol-gel deposition parameters and film growth
mechanisms that are crucial for the formation of porous structures and to
develop a strategy to effectively reduce the process-related porosity.
The focus of the research will be on the role of certain substances that are used
in the process as modifying and stabilizing agents. They are known to control
various reactions pathways and to have decisive influence on the film structure.
But due to the complex changes that occur during the deposition procedure
their effect on film porosity and the mechanism how they affect the final film
structure is not clear, yet.
The stabilizing agents acetyl acetone (acac) and hydroxypropyl cellulose (HPC)
will be used to gather information about their structure building effect and to
investigate their potential for the development of low-porous, protective thin
films.

14
A. Theory
I. Sol-Gel process
1. General
Sol-gel process has its origin in the 19th century when Ebelmen carried out
experiments with SiCl4 and alcohol and observed a gelation of the material
when it was exposed to air [1]. Later on the method was picked up by ceramic
industry for the development of special kinds of glass from colloidal solutions of
metal alkoxides through controlled hydrolysis and condensation reactions.
Therefore the initially used silicon was replaced by more reactive transition
metals such as titanium, zirconium, cerium or vanadium [2,3]. Nowadays this
process is widely used for the development of a huge spectrum of ceramic
products such as films (e.g., by dip coating or spin coating), or monoliths by
casting into a desired shape, glasses, fibres, powders (microspheres,
nanospheres), membranes and highly porous materials like xerogels and
aerogels [4-9]. The technique has become a common method in glass industry
and optics for the fabrication of reflective and protective oxide coatings [10-12].
Recently protective sol-gel films have been applied to proteins for encapsulation
[13]. There are other applications in the micro- and nanotechnology for
protection of sensitive materials against abrasion or corrosion [14-17]. The
major advantages of this method are the uncomplicated technical equipment,
low process temperatures, the huge choice of available precursor materials and
the possibility to design all kinds of product properties such as porosity,
flexibility, hardness and density via different process parameters. A sketch of
the general process is shown in fig.1 [4].

15
Fig.1 schema of sol gel process
The precursor reacts via hydrolysis and condensation where small molecules
such as water or alcohol are released. In the further progress a colloidal
suspension is developed or a polymerized network with hundreds or thousands
of linear or branched monomers. When the size of the branched molecule
reaches the dimension of the solution the phase is called ―gel‖ [4]. At the gel
point the phase behaves like one giant molecule which extends over the whole
solution. A network of dispersed particles can be also achieved, resulting in a
colloidal gel depending on the chelating and bridging nature of different agents
and the flocculation or dispersion of gel particles. The following step after
gelation is called ―aging‖. It is characterized by further condensation,
precipitation of monomers or transformation reactions within the solid or liquid
phases. This includes the release of liquid solvent from pores and shrinkage.
During the drying step further liquid evaporation will occur through pores in the
structure and the network will show deformation and shrinkage effects. The final

16
product is a highly porous material called ―xerogel‖ which consists to 60-90% of
air. If the gel is dried under supercritical conditions in an autoclave, shrinkage
and capillarity can be suspended, resulting in the formation of so called
―aerogels‖ with an extremely low density, consisting of typically 90-99% air.
Aerogels are one of the best insulating materials. Both products are used
frequently in membrane and catalysis applications [3,4]. The final step of the
diagram is a heating procedure. Although most gels appear amorphous after
drying, crystalline structures can be obtained during the heating step at elevated
temperatures.
1.1 Sol-Gel mechanism
Precursors used in sol-gel applications are usually metal or semi-metal
compounds bonded to organic and inorganic ligands. The most common
precursors are alkoxides consisting of a silicon or transition metal central atom
and alkoxy groups as ligands [4]. Alkoxides react with water by hydrolysis. This
allows that a hydroxyl ion attaches a metal atom as shown in the reaction 1.
Normally the hydrolysis reaction of silicon compounds proceeds slowly.
Transition metals instead react very fast with crystalline precipitation of the
metal salt. There are different mechanisms of hydrolysis and the possible
products have a strong effect on the formation of chains, branches and complex
compounds.
The general hydrolysis reaction can be described as:
M(OR)4 + H2O HO—M(OR)3 + ROH (1)
M is a metal atom and R represents a radical alkyl group. Products of an
incomplete hydrolysis can react further with each other in a condensation
reaction:
HO—M(OR)3+ HO—M(OR)3 (OR)3M-O-M(OR)3 + H2O (2)

17
Through this reaction a polymerization of the phases is possible. A repetition of
the condensation step can produce more complex and highly branched
compounds that are the basis of sol-gel materials.
Low hydrolysis reactivity of silicon precursors can be enhanced by either basic
catalysis via SN2 mechanism or by acidic catalysis via SN1 mechanism and with
chelating ligands as modifiers as well [5]. The hydrolysis and condensation rate
of transition metals appear to be much higher than the rate of silicon alkoxides.
Their higher reactivity is due to their lower electronegativity compared to silicon
and to their ability to exist in different coordination states [6]. They are stronger
electron donators; therefore they react easily with water via SN1 mechanism
without additional catalysis.
The SN2 mechanism is described in the scheme 1 [5]:
In the presence of hydroxide ions silicon alkoxides will react in a nucleophilic
substitution following the SN2 mechanism with an alkoxide leaving group. The
latter can regenerate the catalyst OH- in a reaction with water. Usually the
hydrolysis of silicon alkoxides is slow because of the high electronegativity of
silicon compounds.
An alternative reaction may occur in acidic environment via SN1 mechanism [5]:
+ROH+ H+
OR
H Si
RO
OR RO
H2O +
+ H+
RO
OR
OR RO
Si Si
RO
OR
OR HO
Si
RO
OR
OR RO
+
H
HO- HO-
Si
OR
OR
OR RO
OR
OR
OR RO
O
+ RO- Si
OR
OR-
OR HO
Si

18
In the first step the alkoxy group is protonated, forming a very good alcohol
leaving group. A water molecule can bond to the positively charged silicon,
releasing a proton which can restart another hydrolysis cycle.
The hydrolysis rate needs to be moderated to allow further growth and
branching of the network in subsequent condensation reactions. There are
three different mechanisms of condensation that have to be considered:
Alcoxolation: a bridging oxo group (M---O---) is formed by elimination of an
alcohol molecule. This reaction follows the same process as hydrolysis with Si
replacing the entering group [6].
Oxolation: in this reaction an oxo bridge (---O---) between two central metal
atoms is formed and water is the leaving group.
Olation: a hydroxo bridge (―ol‖ bridge M--OH) is formed between two metal
atoms by elimination of a solvent molecule [3].
The occurrence of these mechanisms depends on the pH and coordination
number of the metal. All these reactions are catalyzed by acids but slowed
down in basic media [6].
Condensation can occur by two mechanisms:
When the coordination of the metal precursor is saturated the mechanism
occurs via nucleophilic substitution with hydroxo group (M---OH) (OH) as
nucleophile and H2O or OH- (OR) molecules are the leaving group (oxolation)
depending on acidic and basic catalysis, respectively [4]. However, via aquo
ligand M--(OH)2 none entering group (OH) is obtainable making this mechanism
inappropriate:
M1-OH + M2-OR M1 – O – M2 + OR (3)
H

19
In the case when the coordination of the molecular precursor is unsaturated
both oxolation and olation can occur only via addition with (M---OH) and/or (M---
O---) as nucleophiles producing chains and cycles:
H
M1-OH+ M2-OR M1 - O – M2 – OR (4)
An increase of the coordination number of M2 can be achieved as well. This
depends on the electronegativity, electronic configuration of the metal atom and
the water concentration [6].
1.1 Transition metals
Precursor alkoxides of transition metals react easily with water and the
mechanisms of hydrolysis and condensation depend on charge and
electronegativity of the metal and pH of the medium. Because of the high
reaction rate the addition of moderating and stabilizing agents such as β-
diketones, some carboxylic acids or alcohols is necessary to avoid instant
crystalline precipitation and to obtain homogeneous films [5, 7]. In contrast to
silicon compounds transition metals don’t need catalytic additives for hydrolysis
and they form stable cationic complexes favoring SN1 mechanism (scheme 3)
[5]:
According to Kessler et al. [8], during this mechanism the metal atoms can
increase their coordination number and remain connected to more ligands. The
ligand exchange, e.g. both hydrolysis and chemical modification, begin with
protonation of the partial negatively charged oxygen atom of the alkoxy. This
process generates reactive cationic species which coordinate also an additional
+ROH
+ HZ
OR
OR
OR RO
M M
OR
OR
OR Z
OR
H M
OR
OR RO
Z- +
M
OR
OR
OR RO
+
H

20
donor ligand releasing an alcohol group. The reaction rate depends on the
acidity of the HZ reactant, while the nucleophilic properties of the Z- ligand don’t
play an important role on the bonding interchange as recently shown for
tetravalent metals like titanium and zirconium alkoxide complexes [8].
Hydroxo-aquo precursors of tetravalent metal oxides such as Ti, Zr or Hf can
hydrolyze easily and form stable sols. However, the growth mechanism is
olation and therefore obtaining clear gels is limited because of dimerization and
formation of gelatinous material instead of sol [6]. For example, clear gel of
ZrO2 can be obtained by the formation of stable colloid or dispersion phases in
water or neutralizing chloride or nitrate precursors with urea. No defined
structure has been achieved until now for these colloidal gels. However, mixed
hydroxo –oxo bridges have been reported in the study of amorphous ZrO2
where a sheet-like structure with Zr atoms is connected through 3(OH)1 and/or
3(O)1 bridges [6]. The terminology of x(OH)y determines the number of M atoms
x bridged by the number of OH groups y [9].
2. Protective sol-gel coatings
Protective films provide corrosion or abrasion resistance, good adhesion,
strength and impart passivation or planarization. The advantages like low
process temperatures, cost-efficient hardware, variety of materials and product
properties have recommended the sol-gel technique to the field of protective
coatings [21-24].
An example of a protective sol-gel layer is shown in fig.2. In this application a
sol-gel overcoat is used to protect the sensitive surface of satellite mirrors in
aerospace industry. The planarization layer prevents galvanic corrosion of the
Fe-Ag couple while planarizing of stainless steel improves the mirror surface;
the protective coating protects the reflective silver interface [25,26-29].

21
Fig. 2 Reflective metal mirror design and sol-gel protective coating
3. Protective sol-gel coatings
For many applications of protective sol-gel coatings the process-related porosity
of the final film due to solvent evaporation is a serious limitation. Especially
corrosion resistant coatings have to be free from pores to avoid any exposition
of the sensitive metal surface to an aggressive medium. Brinker et al. [4]
developed a procedure to reduce the number of pores by controlling the relative
evaporation and condensation rate [22]. Likewise, other investigations have
revealed that modifying and stabilizing agents have a major influence on the
final film structure. Acting as chelating and bridging ligands these agents alter
the reactive positions on the alkoxide molecule during the condensation
reaction. This may result in a change of size and shape of the primary particles
formed in sol-gel treatment of metal alkoxides. They are not influenced by
kinetic effects during the hydrolysis or condensation, but by the ligands and
modifier properties. [5,8,22].
Another crucial step in the deposition of protective sol-gel coatings is the drying
and heating procedure because the average pore size can increase rapidly with
rising process temperature due to solvent evaporation. On the other hand a
densification is observed which is accompanied by shrinkage of the film
structure. Therefore these parameters have to be set up carefully. Porosity
means insufficient substrate surface coating and increasing of the risks to
development of local corrosion.
Sol-gel
overcoat
Substrate
Primary protective coating
Silver
Sol-gel
planarizing
layer

22
II. Production of protective oxide films on metals
1. Role of stabilizers and modifiers
1.1 Use of stabilizer as bridging and chelating agents
The addition of stabilizing or modifying agents is necessary to moderate the
reaction rate of transition metal alkoxides. Beyond that these stabilizers offer
the possibility to adjust certain structural film properties such as density and
flexibility to the desired needs. The general effect is based on the chelating and
bridging properties of the stabilizing molecules. Reaction rates of hydrolysis and
condensation can be controlled via substitution or elimination of metal-ligand
bonds. This way certain reactive sites of the precursor molecule are stabilized
and will preferably react in the polycondensation-process. As a result the sol
density and the number of interconnections in the three-dimensional network
will be altered.
The option to decrease the process-related porosity by modifying additives is
especially attractive to the preparation of thin protective metal oxide coatings.
The best stabilizing agents for this application contain carboxyl functional
groups [30], but also hydroxy-, ester-, amino- and ß-diketone-groups can be
advantageous. The affinity of each group to the surface of the suspended
colloidal particles in the gel determines the effectiveness of stabilization.
Hydrophobic or hydrophilic groups interact with corresponding polar or non-
polar sites of the particle surface in the presence of water, forming bonds by
electrostatic force.
Besides the type of stabilizer its concentration is also important because the
stabilizer/precursor ratio determines the number of available reactive sites when
more than one stabilizing molecule may aggregate with the precursor particle
[30]. Another crucial parameter is the choice of an appropriate solvent because
the polar character of the solvent, i.e. its affinity to both stabilizer and precursor
molecule can either increase or even reverse the stabilizing effect, resulting in
flocculation instead of stabilization [17].
Different stabilizing mechanisms have been reported [31,32]:

23
Electrostatic or charge stabilization: acts similar to an electrical double layer
Fig. 3 Charged particles with nonionic polymers [31]
The principle is shown in fig. 3: ionic groups adsorb colloidal particles on the
dispersed gel and form an electric barrier around the particle surface, resulting
in mutual repulsion of equal charges in the electrostatic field. Hereby the
thickness of the double layer plays an important role. It is related to the van der
Waals-London (VDWL) attraction force which is defined as the minimal distance
(5-10 nm) that prevents the aggregation of attractive particles. This way the
particles are stabilized by the balance of attractive and repulsive forces. If the
ionic strength of the dispersion medium (c) is > 10-1 M, the thickness of the
double layer will shrink below the minimal distance to prevent attraction
between particles and coagulation will be inevitable [31]. This type of
stabilization is limited to polar media.
Steric stabilization: adsorbed or chemically bonded polymeric molecules as
shown in fig. 4:

24
Fig. 4 Steric stabilization schema [31]
Steric stabilization occurs when suspended colloidal particles of a sol are
adsorbed to polymeric macromolecules via chemisorption or grafting. It
prevents the flocculation of particles and allows dispersion, that way steric
stabilization is achieved. Good polymeric stabilizers are most commonly those
with large polymer chains. This provides enough repulsion to reduce the VDWL
attraction in the colloidal sol. This type of mechanism is more stable than
electrostatic stabilization and has more advantages. For example the steric
stabilization is relatively independent on the electrolyte concentration in the
dispersion medium. Steric stabilization can be utilizable in non-polar and polar
media. Another aspect to be considered is the fact that charge stabilized gels
can produce irreversible particle agglomeration. However, a flocculation due to
the steric effect is reversible. This can be explained by the electrostatic effect
which generates thermodynamically metastable dispersions while steric
stabilizers provide thermodynamically stable sols [4, 31].
Polymers are the best stabilizing agents due their high molar weight, especially
when they contain repeating double units. Very effective segments are
repeatable carboxyl or hydroxyl groups with alternating polar and nonpolar parts
[34]. These substances can be used in both aqueous and non-aqueous
dispersion mediums.

25
Depletion stabilization: free polymer in the dispersion medium
Fig. 5 Depletion stabilization [31]
Macromolecules are dispersed in a soluble medium and prevent coalescence of
particles (fig. 5). The exact mechanism of this type of stabilization is not
completely clear until now [3,4,31].
1.1.1 Acetyl acetone (acac)
The structure of the complex compounds formed after the gelation step in the
sol-gel process is still unknown [4,35]. It becomes even more complex when the
original precursor is modified by a stabilizing agent. In the case of metal
alkoxides acetyl acetone, which is also used in the preparation of
acetylacetonate catalysts, is often applied as a bidentate ligand [23,36,37].
With the molecular formula CH3COCH2COCH3 = C5H8O2 acetyl acetone is a
diketone with a keto and an enol form which remain coexistent in solution as
shown in fig. 6.

26
Fig. 6 Enol and Keto forms of acetyl acetone
This reagent has the ability to form several complexes with transition metals
such as titanium, zirconium, hafnium, manganese, niobium, etc. [4,6]. In the
exothermic reaction of the metal alkoxide with acetyl acetone a proton is
released and the chelating anion acetylacetonate = acac (C5H7O2-) is formed
with the negative charge delocalized between both oxygen atoms. The latter
bound readily to the transition metal atom and form chelate complexes which
are freely soluble in organic solvents.
The structure of a stable zirconium alkoxides - acac complex is shown in Fig. 7.
Fig. 7 Molecular structure of [Zr(OiPr)3(acac)]2 [36]
The structural form showed in fig.7 is one of the most stable complexes of
modified zirconium n-propoxide Zr(OPr)4 studied by nuclear magnetic
resonance (NMR) in [36].

27
Fig. 8 Different molecular structures of zirconium compounds induced by
acac [36]
However, depending of the amount of acetyl acetone the stable form (b) can
change into an unstable form (c) or further into another stable form (d). Likewise
they can reversibly change back into the original precursor as shown in fig. 8.
This behavior can be transferred to other transition metal alkoxides. The
crystalline structure and particle size of the final coating are also affected by the
amount of acetyl acetone [4, 24, 36]
1.1.2 Hydroxypropyl cellulose (HPC) as stabilizer
This polymer is available with different molar weights (MW) as a crystalline
powder, for example: 80,000, 100,000 or 370,000 g/mol.
Hydroxypropyl cellulose (HPC) is an ether derivative of cellulose in which some
of the hydroxyl groups in the glucose units have been hydroxypropylated as
shown in fig. 9.

28
Fig. 9 Molecular structure of HPC
The main applications of HPC include the use as thickener, binder, emulsion
stabilizer or surfactant polymer because of its solubility both in water and in
non-polar solvents. Recent studies revealed that HPC contributes efficiently to
the steric stabilization of some transition metal alkoxides during sol-gel
hydrolysis and condensation [38]. It is also known that HPC can be used to
reduce the sol-gel particle size and stabilize certain crystalline phases of some
metal oxides, for example titanium or zirconium oxides [34,38,39].
HPC acts as a dispersant decreasing the VDWL attraction force between
particles via chemisorption, i.e. the polymeric structure of HPC adsorbs
dispersed micelles of the bulk sol reducing the interaction between the
precursor particles. This allows that the ligands inside the micelle interact with
the metal atom shortening the distance between metal atom and ligands.
Therefore HPC can act as chelating and bridging agent as well because of its
polar and nonpolar segments; it inhibits the agglomeration of particles and thus
reduces the average particle size [38-43]. This stabilization can even persist
until and beyond the heat treatment where the final metal oxide is formed.
Monodipersed, submicron sized ZrO2 particles required for manufacturing ZrO2
ceramic components at lower sintering temperatures and minimum sintering
time have been synthesized via sol-gel method [39]. The sol-gel technique
applied in this investigation is used to synthesize nanocrystalline protective
zirconium oxide coatings based on controlled hydrolysis and condensation of
zirconium alkoxide in an alcohol solution, in the absence or presence of the
polymeric steric stabilizer hydroxylpropyl cellulose [44].

29
III. Corrosion
1. General
In all fields of industry as well as in our everyday life we encounter corrosion
phenomena [45]. It could be an old car as shown in fig.10, a piece of metal or a
ship, but the consequence is always a deterioration of the material. Corrosion
occurs because of the tendency of all materials to return to their lowest energy
state which is usually the oxidized state. Not only metals are affected by
corrosion though metal corrosion is the most common and important one [46].
For example a simple representation of a corrosion process is the chemical
reaction of iron, water and oxygen:
222 )(21 OHFeOOHFe (5)
Iron water oxygen ferrous hydroxide
In this reaction iron reacts with oxygen in water to form ferrous hydroxide. In
case of steel and other iron materials this process is called ―rusting‖. It can be
found on iron surfaces that are in contact with a wet and aerated medium. If any
of these elements is absent, rusting will not occur.
Fig. 10 Corroded metal objects

30
Metal Corrosion can be understood as the result of an electrochemical reaction
between an oxidant and a metal material. Different types of corrosion
mechanisms have been found which are described in the following:
1.1 Uniform corrosion
Surface corrosion is one of the most important corrosion phenomena. It affects
large areas of the metal surface as shown in fig. 11
Metal corrosion
Fig. 11 Surface corrosion
The mechanism of this type of corrosion involves anodic and cathodic reactions.
The corresponding anodic and cathodic areas of the metal surface change
statistically in place and time resulting in an average uniform surface abrasion.
It can be initiated by contact of the metal with oxygen and humidity. Uniform
corrosion can be easily detected and avoided with cathodic protection or
painting or other protective coatings. This form of corrosion affects steel and
iron (rusting). It can be also seen on copper structures (green color).
1.2 Pitting corrosion
Pitting corrosion is a localized destruction of the metal. As intercrystalline or
transgranular corrosion, pitting corrosion originates from local elements or local
cells [47]. In the case of non-alloyed or low-alloyed steel the absence of oxygen
in a small area generates a concentration gradient, resulting in the formation of
anodic and cathodic sites.
On passivating metals such as aluminum pitting corrosion is initiated by
aggressive ions like Cl-, I- or F-. These anions are able to penetrate the
protective oxide layer giving the electrolyte access to the metal surface.

31
Fig.12 Schema of pitting corrosion
Pitting may be caused by an abnormal anodic site surrounded by a surface that
plays the cathode role or by the vice versa process. Some literatures have
coincided that four steps maybe occur during pitting corrosion:
a) Initiation which is caused by the local cell;
b) Propagation: at this stage the corrosion rate increases due to changes in the
anodic and cathodic local cell;
c) The termination phase: characterized by corrosion products that precipitate
on the cathodic surface and inhibit further corrosive attack and the last step:
reinitiation: can occur when pits are rebuilt.
Metals which corrode uniformly are not prone to pitting corrosion [47].
1.3 Intergranular or intercrystalline corrosion
This is a localized corrosion form that begins at a narrow path or crack and
proceeds along the grain boundaries of a metal. The mechanism is initiated by
a potential difference between a thin particle boundary and the nearby adjacent
bulk grain. This potential is usually a result of different chemical composition in
the crystalline structure.
It can also be initiated by migration of alloy impurities into the grain boundary.
When the concentration of impurities increases in a lateral portion of particles, a
second phase may precipitate in the adjacent part and a local corrosion cell is
developed which promotes intercrystalline corrosion [48].
Fe
Anodic
Cathodic
Fe2
+
e-

32
Fig.13 Effect of intercrystalline corrosion on particles boundaries
Intercrystalline corrosion is a common phenomenon on aluminium, copper and
18-8 stainless steel alloys. It can also be a consequence of heat treatment in
alloy production because shape and size of the crystalline particles are affected
by temperature, followed by a change of composition and concentration in grain
boundaries. During the preparation of coatings based on metal oxides
crystalline impurities and cracks can be the initiation of intergranular corrosion.
1.4 Galvanic corrosion
When two different metals are brought into electrical contact while they are
immersed in an electrolyte the potential difference between them causes a
current and ionic flow that result in the deterioration of the base metal.
The nobility of a metal, i.e. its resistance to corrosion and oxidation in moist air,
can be derived from galvanic series. In these tables metals are classified on
behalf of their potential against a standard reference electrode. (Table 1) [48].
Intercrystalline
corrosion

33
Table1. Galvanic series of metals used in metallurgy [48]
Metallurgy Index
(V)
Gold, solid and plated, Gold-platinum alloy 0.00
Rhodium plated on silver-plated copper 0.05
Silver, solid or plated; monel metal. High nickel-copper alloys 0.15
Nickel, solid or plated, titanium an s alloys, Monel 0.30
Copper, solid or plated; low brasses or bronzes; silver solder; German silvery high copper-nickel alloys; nickel-chromium alloys
0.35
Brass and bronzes 0.40
High brasses and bronzes 0.45
18% chromium type corrosion-resistant steels 0.50
Chromium plated; tin plated; 12% chromium type corrosion-resistant steels
0.60
Tin-plate; tin-lead solder 0.65
Lead, solid or plated; high lead alloys 0.70
Aluminum, wrought alloys of the 2000 Series 0.75
Iron, wrought, gray or malleable, plain carbon and low alloy steels 0.85
Aluminum, wrought alloys other than 2000 Series aluminum, cast alloys of the silicon type
0.90
Aluminum, cast alloys other than silicon type, cadmium, plated and chromate
0.95
Hot-dip-zinc plate; galvanized steel 1.20
Zinc, wrought; zinc-base die-casting alloys; zinc plated 1.25
Magnesium & magnesium-base alloys, cast or wrought 1.75
Beryllium 1.85
Higher potentials indicate that the metal will corrode easier than metals with
lower potentials. There are also more specified galvanic series described in the
bibliography [48,49]. The mechanism of galvanic corrosion can be also used as
corrosion protection. This principle of the ―sacrificial anode‖ is widely used to
protect ships or pipelines in seawater environment. The base metal acts as
anode when it is in contact with the noble cathodic metal. The base metal will

34
More noble metal
Less noble
anodic
corrode and dissolve while the noble metal is protected. This can decrease the
corrosion process of the other metal for long time. For example, if small parts of
zinc are connected to longer pieces of steel the zinc will corrode instead of steel
[50]. However, very small anodic areas are undesirable because the material of
the sacrificial anode would dissolve too quickly. This principle is used for
cathodic protection. The figure 14, shows an example of galvanic corrosion
where the less noble metal loses mass as effect of contact with a noble metal in
a given electrolyte.
Fig.14 Example of galvanic corrosion
1.5 Bio-Corrosion
Microbial corrosion has attracted interest because it can do severe damage to
both metallic and non-metallic materials. The corrosive damage is similar to
other corrosion types and therefore the actual cause is often overlooked. The
damage originates from metabolites of microorganisms that grow on the surface
of the material in both aerobic and anaerobic environments. A typical biofilm is
found on the surface which protects the microorganisms and promotes its
growth as well. Such biofilm deposits can form concentration cells and may
cause galvanic and pitting corrosion. Underground and underwater pipelines of
oil- and gas-industry are often affected by this special type of corrosion.

35
Fig. 15 Steel corroded by microorganisms [51]
Sulfate reducing bacteria are able to generate hydrogen sulfide which reacts
easily with iron or steel producing iron sulfide FeS and hydrogen. However,
other sulfate–reducing bacteria oxidize the iron directly or by formation of
sulfuric acid. These types of iron corrosion occur frequently in oil and gas
industry where the products of biofilm generate sulfide stress cracking [51,52].
Even in anaerobic environments iron and steel can take damage without the
presence of oxygen from bacteria such as Desulfovibrio or desulfuricans.
2. Passivation
Metals such as aluminum, zinc, copper or stainless steel have the ability to
produce a natural and invisibly thin but dense oxide layer on their exposed
surface, which separates the bulk metal from further attacks of the environment
reducing this way the anodic reaction with movement of the potential further
towards positive potentials [53].
Passivation can be also reached and even increased with an external current
source. This process is called ―anodizing‖ which is a common method for
corrosion protection of aluminum. It means that at a specific current and
potential have to be reached in order to inhibit the anodic reaction. Another
example is phosphate conversion coatings to protect ferrous materials.

36
Passivation layers of nickel fluoride on nickel alloys such as ―monel‖ allow
handling of hydrogen fluoride or elemental fluorine.
3. Thermodynamics and kinetics aspect
3.1 Free standard energy
Gibbs free energy G determines the feasibility of a chemical reaction. A reaction
can take place spontaneously when the difference of free energy is negative ΔG
< 0.
When a metal is exposed to a solution containing ions of the same metal, more
ions will dissolve from the bulk metal into the solution and ions from the solution
will be deposited on the metal surface in a reverse process. Finally, a state of
equilibrium will be reached when the rates of dissolution and deposition
equalize. In this state free energy is defined as:
QG (6)
Energy is proportional to the charge flow ΔQ and the electrical potential (φ)
which moves the charges. For an amount Δn of transferred material it can be
expressed by the following equation:
nEG (7)
E is called electrical potential of the reaction. Each mole of a reacting species of
valence z transports a charge of Q = z · F. The change of Gibbs free energy per
mole of a reacting species is proportional to the difference of electrical
potentials ΔE and can be expressed with Faraday’s number F = 96485 C mol-1:
EzFG (8)
For the dissolution reaction of a metal Ared → Aox + e- free energy can be
calculated as:
(9)
Combination with equation (8) gives:
red
ox
A
ARTGG ln0

37
(10)
This equation is called the Nernst Equation. Free standard energy G0 has been
replaced by the standard electrode potential E0 which is defined as the
electrode potential of a reversible electrode at 298 K, an effective concentration
of 1 mol/l and a gas pressure of 101300 Pa against standard hydrogen
electrode (SHE) with E0 = 0 V. The latter determines the reference point for all
potential measurements. Because of the laborious handling of the SHE in
practice other reference electrodes with known potentials are used. According
to the Nernst equation the energy of an electrochemical reaction can be
calculated and the feasibility of the reaction can be predicted on the basis of
electrochemical potentials.
This principle can be demonstrated with the corrosion reaction of iron in
deoxygenated acid solution [53]:
Fe + 2H+ Fe2+ + H2 (11)
This reaction can be described as an electrochemical cell:
2
2 2 HHFeFe (12)
The standard cell potential can be calculated from the difference of the
individual reaction potentials:
anodicEcathodicEcellE 000 (13)
By definition the cathodic hydrogen potential (SHE) is 0.0 V and the anodic
potential of iron dissolution is -0.44 V [53]. The resulting cell potential is positive
which means that the free energy becomes negative and therefore the reaction
can occur as a spontaneous process.
Reverse non-spontaneous processes can be achieved with the application of
external work induced by an external current source like it is done in electrolysis
[53].
)a(M
)a(M
zF
RTEE
red
oxln0

38
A corrosion reaction may occur spontaneously when stable products such as
oxides or sulfides are built under release of energy. However, the analysis of
thermodynamic data alone is not a sufficient criterion to decide about a possible
corrosive threat. Even if a reaction can proceed spontaneously it may be
hindered by a kinetic barrier and the reaction rate will be slowed down or even
inhibited and no measurable change will occur. Examples are metals such as
aluminum or titanium which develop a natural oxide passive layer which
protects them against corrosive media [53].
3.2 Corrosion of Iron
Iron (Fe) is found in nature as a mixed oxidized material (hematite Fe2O3) or
accompanied with sulfur as pyrite FeS2. The metal can be obtained from its
minerals by reversing the natural oxidation reaction. This can be achieved in a
reduction process with carbon at high temperatures above 2000 K. The raw
metal contains a high amount of carbon which can be removed in a purification
procedure. The amount of carbon determines hardness as well as corrosion
resistance of the final material. Besides carbon other alloy compounds such as
nickel, chrome, tungsten or vanadium are used to design very hard, malleable
or corrosion resistant alloys in the refining process of steel production. Because
of the tendency of iron materials to return to their natural oxidized state they are
very susceptible to corrosion when exposed to air and moisture, resulting in the
formation of the well known rust [49, 52].
The corrosion of iron is a result of the contact between metal and oxygen in the
presence of an electrolyte. Iron corrosion can be described as an
electrochemical process of two partial reactions:
anodic reaction:
Fe Fe2+ + 2e- (14)
The formation of iron hydroxide and iron oxide also known as rust encloses the
following reactions:
2Fe+ +4OH- 2Fe(OH)2 (15)

39
2Fe(OH)2 + 1/2O2 Fe2O3 + 2H2O (16)
During this reaction the metal suffers a decrease of electron charge because of
metal dissolution and consequently damage of the metallic structure. This
anodic reaction is known as oxidation. In a complementary reaction hydrogen is
developed from proton reduction:
cathodic reaction in neutral or weakly acidic electrolytes:
2H+ + 2e- H2 (17)
The electrons released in the anodic reaction flow through the metal to the
cathodic site while at the same time a transfer of positively charged ions occurs
inside the electrolyte. In order to maintain the charge balance between
electrons and cations the amount of transferred charge through the phase
boundaries must be the same for anodic and cathodic reaction. This way the
two reactions are linked to each other. The exchange rate of both reactions
equates an exchange current density, which is strongly dependent on the
electrode material and surface properties. Exchange current density has also a
major influence on corrosion reaction rate which will be described in detail in
chapter 3.3.
3.3 Effect of pH
Because proton reduction is a common cathodic reaction in most metallic
corrosion reactions, the pH value is a crucial parameter in the investigation of
corrosion phenomena. The corrosion potential can be calculated from the
relationship between potential and ion concentration using the Nernst equation:
red
ox
a
a
nF
RTEE lg
3.20 (18)
The reduction of H+ to H2 is a thermodynamically feasible manner to incite the
oxidation of Fe specifically in deoxygenated solutions. This fact indicates the
importance of the H+ concentration which is determined by the pH value:

40
HanF
RTEE lg
3.20 (19)
The activity of Fe can be considered one because it is in solid phase.
a is the chemical activity of products or reactants (oxidation or reduction;
ions or molecules)
E is the measured potential
E0 is the standard electrode potential
R is the ideal gas constant 1.986 calories/(mole K)
T is the temperature in degrees Kelvin (K)
n is the number of transferred electrons in the half reaction (e.g., n = 2 in
Equation 9)
F is the Faraday constant 96485 coulombs/equivalent or 23060
Kcalories/Volt
[H+] is the concentration of dissolved hydrogen ions
An (equilibrium) phase diagram of an aquous electrochemical system where the
corrosion or passivation phases vary according to the pH and potential is shown
in fig.16. It is well known as Pourbaix diagram of iron corroding in 1M of acid
solution [54]. pE values are obtained from reduction potentials by dividing E0 by
0.059. Solid lines separate species attributed to acid-base equilibria. Line a
shows the pH at which half of the 1M iron occurs as Fe3+ and half is precipitated
as Fe(OH)3. Solid double lines separate species related to redox equilibria
(lines c & d). Likewise redox equilibria of species that do not contain hydrogen
or hydroxide ions appear as horizontal boundaries (line b). However, species
involving hydrogen or hydroxide appear as diagonal boundaries because they
are in the part acid-base equilibria (line c).
Diagonal boundary lines from upper left to lower right represent basic solutions
which tend to favor the more oxidized species. Longer dashed lines denote the
theoretical region where water changes from oxidation to reduction (lines d & f)
while shorter dashed lines enclose the practical region of stability of water (e &
g).

41
Dashed line d represents the potential of water saturated with O2 at 101,325 Pa
(very well aerated water), above this potential water is oxidized to oxygen:
2 H2O + 4 H+ (aq) O2 + 4e- Eo = +1.229 V (20)
Dashed line e indicates the overvoltage of oxygen formation. Dashed line f
represents the potential of water saturated with dissolved H2 at 101,325 Pa
pressure (high level or reducing agents in solution). Below this potential water is
reduced to hydrogen:
2 H+ + 2 e- Eo = +1.229 V (21)
In practice, an overvoltage effect prevents significant release of hydrogen until
the lower dashed line g is reached [54].
Fig. 16 Pourbaix diagram for iron [54]
It is observable that for applied potentials less than -0.6 Volts iron will not
corrode except for high pH more than 8. However at positive potentials above -
0.6 V iron will corrode with different products depending of the pH conditions. It
Corrosion
Passivation
Fe2O3
Corrosion HFeO-2
Corrosion
Inmunity
Fe3O4

42
is also important to see that iron forms a passive layer at different pH and
potential ranges which can protect the metal from oxidation. This principle is
applied to generate a passive layer on the metal to prevent the corrosion
through cathodic and anodic protection.
3.4 Kinetics aspects of corrosion processes
As mentioned before, thermodynamic data provide information about the
possibility of a spontaneous reaction. But the actual susceptibility to corrosion
can only be estimated with the consideration of kinetic effects.
The anodic reaction of iron dissolution is:
Fe → Fe2+ + 2e- (14)
The reaction rate of this reaction can be expressed as:
v = Kcorr c(Fe) (22)
rate constant K as well as reaction rate v are proportional to the corresponding
current density icorr on the electrode surface:
v icorr (23)
Kcorr also depends on temperature. This is described by the Arrhenius-
Equation:
RTEAeKK 0 (24)
K is the rate constant for the chemical reaction and the units are time reciprocal,
K0 is the theoretical maximum reaction rate if all reactants would react
completely spontaneous. But only a small part of all reactants possesses the
necessary activation energy EA which is expressed by the exponential part of
the formula. R is the gas constant and T the absolute temperature in Kelvin’s
degree. An increase of the temperature will increase the reaction rate.
In analogy to the Arrhenius-Equation the current densities can be expressed as:
TR
EFnii
exp0 (25)

43
In this equation the constant K and K0 of the reaction rate where substituted by i
and io (current density and maximal current density at equilibrium, respectively).
The term α is a proportional factor for charging step which lies usually around α
= 0.5 generally. Activation energy is represented by the term from the equation
(8) zFΔE.
This equation can be applied to both the anodic and cathodic reactions ia and ic:
RT
EnFiia
exp0 (26)
RT
EnFiic
1exp0 (27)
Next to the equilibrium both reactions overlay and the resulting current density
is the sum of the current densities of both reactions:
RT
EEnFii corr
exp0
RT
EEnF corr1exp (28)
Ecorr is the corrosion potential.
This formula which relates the current density of interfacial reaction with both
applied potential and E0 for each specific system is the Butler-Volmer equation
[49].
In the study of corrosion processes the determination of the corrosion rate is a
very important parameter which is directly proportional to the interchange
current density at equilibrium or open circuit potential (OCP):
kii corro (29)
k is the corrosion rate, io is the measured current and icorr the current at no
applied potential.
This equation can be therefore applied to experimental determination of
corrosion rates.

44
4. Corrosion protection
The worldwide corrosion cost encloses every year billions us dollars equivalent
to approximately 3 % of the world´s gross domestic product [50].
Different methods have been developed to manage this problem.
Cathodic protection
An external negative potential is applied to the metal making it nobler or
immune. The ultimate objective is to suppress all current flowing from the anode
in a corrosion cell. This technology uses an external electrical circuit or attaches
a sacrificial anode which dissolves instead of the metal that has to be protected.
This will result in a cathodic rather than anodic behavior on these surfaces.
Anodic protection
In this technique a passive layer is generated on the metal surface by
application of a positive potential by an external power supply. Control of pH-
value and potential is crucial to avoid accidental increase of corrosion when the
potential shifts into the active dissolution region. The main advantages of this
method are: a) low current requirements; b) efficient reduction of corrosion
rates; and c) applicability to certain strong, hot acids or other highly corrosive
media [51].
Both methods are used in the industry but actually cathodic protection is the
most important. They are used for example in the sheathing of pipelines in
seawater or underground, protection of ship hulls, tubings and many others.
Inhibitors
The use of inhibitors or additives is very common in oil and natural gas industry.
These implement corrosion inhibitors such as sodium nitrite, aldehydes, and
hydrazine. In most cases they help to produce a thin passive layer on the metal
surface to prevent corrosion. The major corrosive agents that come with natural
gas and oil are hydrogen sulfide and carbon dioxide. The concentration of
inhibitors has to be controlled very thoroughly, because some of them like nitrite
can also produce pitting corrosion [54].

45
Protective coatings
Another solution against corrosion is the deposition of a protective film onto the
metal surface which separates the material from the aggressive environment.
Various deposition techniques have been developed for different coating
materials and applications. For example thin films of diamond-like carbon are
used to protect sensitive data storage media such as hard disks against
corrosive and mechanical damage [55]. The use of thin protective films (< 1μm)
has also proved to be an interesting alternative with low cost [55]. Transition
materials and silicon coatings provide many types of thin protective coatings
[4,6,57,58].
5. Protection by sol-gel coatings
5.1 Protective metal alkoxide coatings
The application of metal alkoxides as a precursor for protective metal oxide
films has been investigated extensively over the last decades. In the special
case of iron and steel the most promising oxide-based materials are zirconium
propoxide or isopropoxide, titanium propoxide or ethoxide, aluminum propoxide,
vanadium pentoxide, niobium propoxide, etc. The oxides formed with these
compounds have proven good adhesion, reflectivity or UV protection,
hydrophobic behavior and corrosion protection [44,59-61]. Metal alkoxies have
the property to react quickly with water by hydrolysis and when a partial
hydrolysis and polycondesation are reached, clear gels can be produced. That
way after appropriate deposition and heat treatment ceramic-like films can be
formed with very favorable properties such as high hardness, homogeneity and
density [20,62]. Due to the high reactivity of metal alkoxides, the use of
modification agents is necessary to control the rate of hydrolysis and
condensation. That way it is also possible to design specific properties of the
final coating.
Metal alkoxides are very potent precursors for the preparation of protective
coatings because they promote a relative stable structure. β-diketones,
carboxylic agents, amines or surfactants are frequently used as modifiers which

46
provide either chelating and bridging or additional functionality in the precursor
molecule. This way stable bonds are formed between metal and hydroxyl or oxo
ligands which turn into metal–oxygen–metal bonds after heat treatment.
Consequently, protective ceramic-like films are generated with low porosity,
better temperature resistance, high hardness, hydrophobicity and resistance
against corrosive attack. It must be mentioned that the reaction mechanism of
metal alkoxies is complex and it needs careful preparation. However various
fast, easy and cheap deposition techniques at low temperatures make them a
very interesting and promising alternative for the production of ceramic-like
coatings.
5.2 Hybrid metal oxide films
The composition of sol-gel coatings can be altered from pure inorganic to
almost organic, resulting in a huge spectrum from very hard to soft, polymer-like
materials. New classes of materials are available that are not accessible in
traditional ceramic synthesis methods. These so called ‖hybrid materials‖ are a
combination of inorganic and organic structures, where the inorganic part
supplies mechanical stability while the organic part promotes highly branched
networks and flexibility. For example the addition of zirconium precursors to
titanium films provides a much higher resistance against corrosion and
temperature. Alkyl- or aryl- substituted trialkoxysilanes can increase the
hydrophobicity of the final coating. It can be also enhanced adding molecule of
fluorinate. Toughness and scratch resistance can be improved with the use of
hard nanoparticles in some polymers [30]. Silicon coatings are often combined
with zirconium-based materials to increase the adhesion on metallic substrates.
Inorganic gels could present better stability and performance if either organic or
biomolecules are included.
5.3 Zirconium oxide- base films
As a transition element with an incomplete d sub-shell (allows multi ligands
connections) zirconium is an excellent precursor for applications against
corrosive and temperature damage. In the other hand, zirconium oxide ZrO2
(Baddeleyite) is the most occurring mineral of this metal with a monoclinic

47
crystal phase. Zirconium oxide can occur in tetragonal and cubic phase, but it
needs high temperatures to obtain those phases. During the heating and
cooling processes cracks may occur in the final coating due to volume
expansion during phase transition [56]. Therefore it needs either to be
combined with other metal oxides like: calcium, magnesium, yttrium, cerium,
etc. or other additives to stabilize the crystalline structure. The resulting material
is hard, decorative, and crystalline with numerous applications [24,63]. Another
interesting property of this metal is its thermal expansion coefficient (5.7
µm·m−1·K−1) which is close to that of iron (11.8 µm·m−1·K−1) and titanium (8.6
µm·m−1·K−1), respectively. This aspect is used to prepare individual or hybrids
coatings of zirconium and titanium oxide on iron or steel against corrosion,
because of its excellent adhesion [30,44].
There are other different ways to make ZrO2 from zirconium precursors: via
vapor phase deposition or reduction/oxidation at high temperature in a furnace,
plasma, electrochemical deposition, electron beam, etc [63-67]. Gels derivable
from compounds of zirconium can be obtained for example by neutralization of
chloride or nitrate precursors with urea or by peptization [4,6]. An alternative
way is the fragmentation of zirconium tert-butoxide molecules at high
temperatures in oven via pyrolysis [4]:
Zr(C4H9)4 ZrO2 + alcohol + olefin (30)
The problem of zirconium precursors is the low electronegativity of zirconium in
the last electron shell. Therefore precursors of this metal react very quickly with
water via hydrolysis forming crystalline precipitates. However the gel structure
remains unknown until now [4,68].
IV. Electrochemical methods on corrosion characterization
1. Linear polarization resistance
1.1 Double layer and Butler –Volmer equation
Changes of the equilibrium potential of electrochemical reactions generate a
polarization on the metal electrode. Because the Nernst Equation does not

48
relate electrical currents with electrochemical reactions, other principles such as
Ohm’s have to be considered:
IRV (31)
It states that an electrical voltage (V) is equal to the product of electrical
resistance and (R) electrical current (I).
When a metal electrode is exposed to an electrolyte and an external potential is
applied, an electrical current will be generated. When a metal is exposed to an
electrolyte ions leave their lattice while electrons are left behind. The metal ions
are surrounded and shielded by water molecules. These hydrated ions are
attracted by the negative surface charge of the electrode surface and a potential
is developed between surface and ion layer in the near surface region. This
layer containing metal ions, water molecules and bulk electrolyte is known as
electrical double layer (EDL) [46].
When the EDL is in equilibrium the rate of metal ions leaving the metal surface
is the same as the rate of ions being reduced and re-deposited in the lattice. But
when the equilibrium is disturbed a net current will be generated, resulting in a
mass transport through the phase boundaries. In the case of corrosion
reactions the metal will be oxidized. Such a disturbance can be produced by an
external potential resulting in a characteristic response of the metal electrode.
This method is the basis of various electrochemical techniques that can be used
for the investigation of corrosion phenomena on metallic surfaces.
The relationship between electrical current and potential change is given by the
Butler-Volmer equation:
RT
EEnFii corr
exp0
RT
EEnF corr1exp (18)
When the overpotential (E-Ecorr) is very small, the exponential function can be
expressed as a power series which can be terminated after the first element:
....!4!3
3
!21
!
4
0
2
xxxx
n
xe
n
nx (32)

49
This allows a simplification of the Butler-Volmer equation:
i
nFi
RTEor
RT
EEnFii corr
0
0 (33)
For very low variations of the potential ΔE < 0.01 V the term 0nFi
RTrepresents a
resistance similar to Ohm’s law which is well known as polarization resistance
(Rp):
Fig. 17 Voltage-Current density Polarization resistance [55]
The slope of the line is the change of the potential Y-values divided by the
change of its X-values, which is the polarization resistance:
iRp
(34)
The range of linear dependence of current on the applied potential (fig.17) is
described by a corroding electrode (anodic and cathodic reactions) because of
small deviations produced on the Tafel slopes. This linear dependence can be
explained as a simple difference between two logarithmic functions of current
approximated to a linear function when the logarithmic functions are of the
same order of magnitude, as described by Stern and Geary [70,71].
Current density / A/cm2
Po
lariza
tio
n /
(E
-Ecorr)
V
OCP

50
At a range from - 20 mV to +20 mV from the open circuit potential OCP (fig. 18),
it is possible to calculate Rp from the measured current-potential plots.
1.2 Stern-Geary equation and corrosion rate
Apart from Rp values other useful information can be obtained from polarization
measurements. For example the corrosion current can be converted into a
corrosion rate or depth penetration. A mathematical relationship between
corrosion resistance and corrosion current was developed by Stern and Geary.
It allows the calculation of corrosion rates from linear polarization data:
corr
pi
BR (35)
where:
ca
ca
303.2 (36)
caERp
cai
corr
corr
303.2,303.2 (37)
icorr is the corrosion current density in A/cm2
Rp is the polarization resistance in Ohms·cm2
βa is the anodic Tafel slope in V/decade of current density
βc is the cathodic Tafel slope in V/decade of current density
Tafel slopes can be obtained from Tafel-plots (see chapter 2).

51
Fig. 18 Current density-Potential curve for a reaction in equilibrium [69]
The corrosion rate can be converted into an abrasion rate by Faraday´s law, or
by the next equation:
))(/1)(( corriMPY (38)
MPY is the corrosion rate in mils/years (mpy)
Λ is a conversion factor of 1.2866x10⁵ [equivalents·s·mils] /
[Coulombs·cm·years]
icorr with the unit A/cm2 (1 A = 1 Coulomb/s)
ρ is the metal density in grams/cc
ε is the equivalent weight in grams/equivalent (the metal´s molar weight
in gram divided by the number of electrons transferred in a half anodic
reaction) [46]
Conversion tables are available for different materials for an easy corrosion rate
calculation:
OCP
Rp region
E, V
i0,a
i0,c
Tafel exponential region
Tafel exponential region

52
Table 2. Current and corrosion rate conversion factors for iron and steel [46]
Iron and steel Corrosion current
Penetration rates
Penetration rates
Mass loss
mA cm-2
mm year-1
mpy g m-2
day-1
mA cm-2
1 11.6 456 249
mm year-1
0.0863 1 39.4 21.6
mpy 0.00219 0.0254 1 0.547
g m-2
day-1
0.00401 0.0463 1.83 1
2. Tafel Plot
Tafel plots measurements use the same principle as linear polarization except
for a wider potential range between - 200 mV and + 200 from OCP as shown in
fig.19. Additionally, it delivers more information than linear polarization
experiments. The currents of anodic and cathodic branches are defined by the
Butler-Volmer equation as:
RT
EEnFii corrcorr
exp
RT
EEnF corr1exp (39)
At very high overpotentials ΔE≥ 50 mV one part of the equation becomes
insignificant. This means that an electrode with an anodic overpotential beyond
+50 mV can be considered to show purely anodic behavior. This applies also for
cathodic behavior with negative overpotenials of ≥ -50 mV. In this region the two
branches can be described in logarithmic scale as:
RT
EEnFii corrcorra
3.2loglog
at anodic potential (40)
RT
EEnFii corrcorrc
3.2
)(1loglog
at cathodic potential (41)

53
This relationship allows the extraction of corrosion rates from the linear parts of
anodic and cathodic branches of Tafel plots which occur around ± 50 mV from
OCP (fig. 19):
corri
ilog (42)
In this equation the term β represents the anodic reactionnF
RTa
3.2and in
case of the cathodic reactionnF
RTb
)1(
3.2
. Both terms are the Tafel-slopes of
both partial electrochemical reactions. This calculation is well known as Tafel-fit.
There are two types of Tafel plots that can be observed:
a) Activation controlled: when the corrosion rate is determined by the rate of
metal ions passing over into the electrolyte.
b) Diffusion controlled: when the corrosion rate is determined by the transport of
the reacting species to and from the metal surface.
Fig. 19 shows an example of Tafel plots for activation controlled reactions. In
these experiments a three-electrode setup must be used and the potential scan
rate should be slow to establish equilibrium conditions. Therefore plotting log IiI
vs. E for both half reactions allows the extrapolation of anodic and cathodic
slopes which appear as straight lines in fig. 17. The intersection gives log icorr.

54
Fig. 19 Tafel fit indicating the slopes of anodic and cathodic reactions [69]
In the case of diffusion control the corrosion current is the diffusion current
when cathodic current remains constant at decreasing potentials [46,69].
With the values of density and equivalent weight and using Rp both icorr and
corrosion rate can be calculated with equation 38 or by using corresponding
software.
3. Cyclic voltammentry and potential scans
The last chapters described electrochemical methods such as linear
polarization that provides information about corrosion rates in a very small
potential range. Tafel plots provide corrosion rate and kinetic information as well
in a wider potential spectrum. This chapter will illustrate how even more
information can be gained from a further increased potential range in
potentiodynamic scanning (PDS) or cyclic voltammetry (CV) experiments.
Both techniques are carried out in a typical three electrode setup as shown in
fig. 20.

55
Fig. 20 Electrochemical cell for cyclic voltammetry measurements
(C: counter electrode; W: working electrode and R: reference electrode)
Potentiodynamic scanning is based on a linear potential waveform; i.e., the
potential is changed as a linear function of time. The rate of change is called
scan rate.
The simplest technique used in this method is Linear Sweep Voltammetry
(LSV). The potential range is scanned starting from an initial potential and
ending at the final potential. The wide potential spectrum covers the cathodic
range from several hundreds of mV in negative direction from OCP and a large
anodic area up to e.g. 1000 mV from OCP as well. Therefore a lot of information
can be extracted from the plots about the corrosion behavior, dissolution current
densities in the active region, formation of passive layers and transpassive
oxidatin, etc. CV is an extension of LSV where the direction of the potential
scan is reversed at the end of the first scan (the first Switching Potential), and
the potential range is scanned again in the reverse direction. A typical current
density-potential plot is shown in fig. 21.
W
R C
V
A Potentiostat

56
Fig. 21 Foward sweep and reverse cycle (Potentiogram) [72]
Ipa, Epa and ipc and Epc are the maximun current density and the corresponding
potential at the anodic and cathodic area, respectively. The reverse cycle
usually does not show the same behavior and amplitude as the foward sweep.
It depends on the scan rate, reversibility of oxidation and reduction reactions,
electrolyte concentration, surface roughness and the velocity of charge transfer
into the electrolyte. Often it shows a positive or negative hysteresis indicating
that pitting corrosion is either initiated or a damaged passive film is repaired
[73].

57
Fig. 22 Foward sweep and backward cycles of iron
Cyclic voltammetry can be used to predict the long term behavior of a sample
which has to bare oxidizing and reductive potentials over and over with each
cycle. Although typical data like pitting potentials and dissolution current
densities are not intrinsic properties of the material, they can be used to
compare different samples to investigate film porosity and corrosion resistance
as long as any other parameters of the system are kept constant. The average
film porosity of a coated sample can be measured for instance, when it is
compared with an uncoated reference sample and a higher coating porosity will
result in higher current densities [23,24]. Imax expresses the maximum iron
dissolution rate before the passive film formation starts at higher potentials. Also
the shift of OCP can be an indicator for a change of porosity when the coating
material is electrochemically inert [23,24].
4. Electrochemical impedance spectroscopy
4.1 Measure principle
In electrochemical impedance spectroscopy (EIS) the samples are polarized
with a range of low magnitude voltages at different frequencies. The change of
Imax
→
←
Cu
rren
t d
ensi
ty L
og
IiI /
Acm
-2
Potential / V

58
amplitude and phase of the current response of the observed system is
recorded and from this data the impedance is calculated on the basis of an
appropriate equivalent circuit. This circuit is a theoretical model that describes
the investigated system as a sum of electro-technical components such as
capacitors, resistors and inductors. The major problem of EIS is the fact that the
equivalent circuit has to match the measured system perfectly in order to
receive reliable data. On the other hand this method provides information about
corrosion behavior, corrosion rates, diffusion and coating properties in a fast
and non-destructive way [46,74-76].
Due to the sinusoidal shape of the AC signal the mathematical calculation may
be difficult. However, because of the small excitation signal (amplitude between
5 and 10 mV) the response of the electrochemical cell is pseudo-linear, that is a
sinusoid at the same frequency but shifted.
The mathematic form for a sinusoidal signal is:
)sin(wtEE st (43)
Et is the potential at time t, Es is the amplitude of the signal and (w) is the radial
frequency which is also known as w = 2πf in Hertz.
The pseudo-linear response of the system will be measured at the phase angle
(Φ) as current:
)(sin wtII st (44)
Using Ohm’s law from equation 30 and assuming that impedance (Z) is
analogous to a resistance:
)sin(
)sin(
)sin(
)sin(/
wt
wtZ
wtI
wtEIEZ s
s
stt (45)
It is known that for bigger excitation signals the impedance can be written as a
complex function [46,77]:
)exp( jwtEE st (46)
)(exp0 jwtII t (47)
)sin(cos)exp(/)( ss ZjZIEwZ (48)

59
Z(w) is the impedance of the system and it is the sum of a real and an
imaginary magnitude. It can be expressed in absolute values as a vector
function in a so called Nyquist plot (fig. 23). Y axis depicts the imaginary
component and the X axis contains the real part. Absolute impedance IZI can
be obtained for each frequency from the angle between both parts.
Fig. 23 Nyquist plot with impedance vector [77]
There is another common form to graph EIS data. It is called Bode-plot where
the total impedance or phase angle Φ is plotted at logarithmic scale on the Y-
axis vs. the logarithm of frequency on the X-axis. A corresponding Bode-plot for
the above diagram is shown in fig. 24
Phase angle

60
Fig. 24 Bode-plot for a single time constant
4.2 Physical representation of impedance
It is necessary to use equivalents electrical circuits for analysis of impedance
measurements and to relate them with physical phenomena:
Fig. 25 Simple electrical circuit for uncoated metal
Rcorr
CEDL
RΩ
RΩ+Rcorr
RΩ
Negative slope due
the capacitive
reactant
ZfCEDL
2
1
m =-1

61
Electrical equivalent circuit model in fig. 25, also known as Randles cell,
represents a metal submerged in an electrolyte with an electrical double formed
at the surface. The capacitor (CEDL) corresponds to the capacity of the electrical
double layer to be charged or discharged, RΩ is the solution resistance and Rcorr
is the polarization resistance or the resistance of the metal to the transfer of
active species into the electrolyte.
This circuit appears always as a semi circle in Nyquist plot. In fig. 23 the
solution resistance can be found in the real axis value at the high frequency
intercept (next to the origin). The lowest frequency (right hand side of the plot)
represents the sum of solution resistance and polarization resistance, i. e. the
polarization resistance Rp. The Nyquist plot does not allow an estimation of the
capacitance which can be obtained from the Bode plot. The slope is zero when
the polarization is caused by a resistance and it is negative when it is caused by
a capacitance. The slope (m) can be calculated by the ratio of Rp or Rcorr and
RΩ and approaches -1 when the ratio increases [46,77]. Therefore extrapolation
of the slope line and intercepting it with the frequency w allows the calculation of
the capacitance as shown in fig. 24.
4.3 Equivalent circuit for coated metal
When a coated metal is exposed to an electrolyte active species may diffuse
through pores inside the film material to and from the metal surface. This can
produce a new interface where corrosion processes can occur. This highly
complex behavior has been studied for years on the basis of different equivalent
circuits and researchers still do not agree about the interpretation of impedance
data and the physical processes [77]. Because of the different opinions about
this system only the most common electrical circuit for coated metals will be
shown here and it is displayed in the fig. 26.
In a quasi-perfect pore free coating impedance consists of a parallel circuit
containing the capacitance Ccoat and the coating resistance Rcoat:
coatcoat
coat
CjwR
RjwZ
1)( (49)

62
A capacitance is defined as two conducting plates are separated by a
nonconductive medium known as dielectric [46]. The capacitance magnitude
depends on parameters like distance, size and dielectric properties and it can
be calculated from:
d
ACcoat
0 (50)
ε is the relative electrical permittivity; ε0 is the electrical permittivity in vacuum,
considering the plate to be the exposed coating surface, A is the surface of one
plate and d is the coating thickness. Reference values of ε are predicted for
different materials: vacuum 1; water 80.1 (293 K); organic coating = 4 – 8 [46].
When the coating is free from pores the resistance disappears [57] and only the
capacitance will be measured.
However, usually after some time electrolyte will diffuse into the coating
structure and because ε of the coating material is lower than ε of water, the
coating resistance will decrease and can be measured. It is supposed that a
pocket will be formed where the electrolyte solution concentration is different
from the bulk solution. This interface zone between the blank metal and the
electrolyte is considered as a double layer capacity (Cedl) in parallel with the
electrochemical transfer reactions.
Fig. 26 Equivalent electrical circuit for coated metal
Rcorr
CEDL
RΩ Rcoat
Ccoat

63
According to literature much more information can be obtained from Nyquist
and Bode plots when two time constants are used [78-80]. There are also other
aspects to be considered like mixed kinetic and diffusion control (Warburg
impedance) which are not discussed in detail here. Finally the value of
polarization resistance can be used to calculate corrosion rate according to the
Stern-Geary equation as described before.
B. Experimental
I. Samples preparation
1. Polishing process
Pure iron rods (99,8%) were cut into round cylindrical slides (29 mm in diameter
x 3 mm thick). They were ground with silicon carbide paper by different steps
(180, 320 and 1200 mesh), using the parameters presented in the following
table.
Table 3. Polishing parameters
Step Polishing
material
Mesh size Solution Time(min) Force Speed
1 SiC Paper P320 Water 3 min 30 N 300
Rpm
2 SiC Paper P1200 Water 3 min 30 N 300
Rpm
3 Micro
Floc
MetaDi
Supreme
3 µm
Dialub
SW
3 min 15 N 180
Rpm

64
Finally they were polished with a 3 μm polycrystalline diamond suspension to
reach a reproducible mirror-like surface as shown in fig. 27.
In order to remove the rest of impurities from the samples surface, they were
dried under warm air and afterwards degreased and cleaned with technical iso-
propanol for 20 seconds in an ultrasonic bath between each step.
Fig. 27 Rough and mirror–like polished iron sample
2. Sol preparation
2.1 Zirconium n-propoxide-acetyl acetone sols
Films were prepared from a precursor solution of zirconium n-propoxide (70% in
n-propanol). 2.5 ml of this solution were filled with a syringe into a beaker that
had been cleaned with iso-propanol and dried with warm air. Then 1.25 ml of
anhydric acetic acid 99% was added under stirring to reduce the hydrolysis
reaction of the precursor. Afterwards 1.25 ml of acetyl acetone was added to
the solution as a stabilizing agent and to incite the polycondensation reaction
[24,27]. A yellow color indicated the reaction of acetyl acetone with the
precursor. Finally a mixture of propanol and water (3.5/0.5 ml) was added. This
solution was kept stirring and covered for one hour.

65
A second solution was prepared by mixing 1.7 ml (0.1 M) of zirconium
propoxide with 0.85 ml of acetic acid 99 %. Then 0.54 ml acetyl acetone and
finally a mixture of 2 ml n-propanol and 0.5 ml water were added.
2.2 Zirconium n-propoxide-hydroxypropyl cellulose sols
The solution of zirconium n-propoxide and hydroxypropyl cellulose as stabilizing
agent was prepared as follows.
The first part was prepared by mixing 2.8 ml of distilled water with 1.3 ml of
absolute ethanol and adding 0.001 g of the stabilizer HPC (80,000 g/mol MW)
per ml of ethanol under rapid stirring in a beaker which has been previously
cleaned with anhydrous ethanol and dried with warm air. This solution was
covered and stirred overnight [44] to promote the dissolution reaction of HPC.
A second beaker was cleaned with absolute ethanol, dried with warm air and
used as recipient for the second part of the solution. This part was prepared by
mixing 0.54 ml of glacial acetic acid 99% with 1.70 ml of zirconium propoxide
(0.1M) under stirring and adding 2 ml of absolute ethanol. This solution was
rapidly stirred and covered for a few minutes. The first part was mixed with the
second solution under vigorous stirring for few minutes. The resulting sol was
kept covered and stirred for 2 hours and left still at room temperature for 2 more
hours. This time is important in order to allow the complete reaction of the
stabilizing agent with the precursor.
2.3 Hybrid sols
It is known that silicon compounds promote elasticity and other mechanical
properties of the final coating [29]. Therefore silicon compounds such as phenyl
triethoxysilane and tetraethylortosilicate (TEOS) were used to improve the
protective properties of the film material. All recipes are shown in table 4.

66
Table 4. Sol composition
Different sol proportions were applied to study film structure and protective
properties. The respective volume ratios are enclosed in table 4.
3. Deposition parameters and spin coating
Before coating the samples were cleaned with ethanol and warm air to remove
any residues or impurities from the surface. Films were deposited in a spin-
coater at room temperature with a syringe through a 0.45 µm mesh nylon filter.
The sol was deposited onto the rotating iron sample as soon as the final
spinning speed was reached. The spinning speed and rotation time were
optimized until a reproducible and homogeneous film was produced.
The best results were obtained after a rotating time of 90 seconds. After this
time the films showed good coverage and a reproducible homogeneous
surface. The spinning speed was varied from 500 to 10000 rpm (revolutions per
minute). Lower speeds resulted in thicker but cracked films; higher speeds from
8000 to 10000 rpm were not practicable due to the weight of the iron samples.
As the optimum speed 4000 rpm was chosen which yielded the most
homogeneous and reproducible films of all samples.
During the deposition process the spin coater was kept covered to prevent the
formation of comets or irregularities on the sample surface [27].

67
4. Heat treatment
After the coating deposition all samples were kept covered for one hour at room
temperature to prevent the precipitation and incorporation of impurities or dust
particles and to promote the polymerization and network-formation process.
During this phase some organic compounds of the sol began to evaporate from
the surface. Besides time and speed the heat treatment of the samples had to
be optimized, too. Therefore different temperatures and heating times were
applied because the ceramic or ceramic-like character of the film structure
depends strongly on these parameters. The temperature range was studied
from room temperature (295K) up to 1073K. The exact temperatures were:
room temperature, 373, 473, 573, 673, 773, 873 and 1073 K, respectively. All
samples were treated with a heating rate of 50 K/15 min. The heating time at
the final temperature in the furnace was one and two hours, respectively.
Fig. 28 Iron coated with zirconium propoxide and heated at 673 K
5. Film thickness
To determine the film thickness and its dependence on spinning speed and
heating parameters, a Dektak® D8000 surface profilometer was used. Therefore
the dimensions of sputter craters from secondary ion mass spectrometry (SIMS)

68
investigations were measured. Additional thickness measurements were
estimated with X-ray diffraction (XRD) by the penetration depth of photons with
energy of 8000 eV as a function of the incidence angle ω. Below a certain angle
of incidence only the reflections of the film were visible [81]
II. Electrochemical measurements
1. Electrochemical cell
Electrochemical measurements were carried out with a typical three electrode
setup and the assembly of the samples and the electrochemical cell are shown
in fig. 29 and fig. 30, respectively. Samples were hold inside a plastic protector
holder with silicon sealings leaving only a defined area of 2 cm2 of the polished
surface exposed to the electrolyte.
The coated sample acts as working electrode and the potential was measured
against a standard saturated silver/silver-chloride electrode (0.197 V) vs. SHE.
This reference electrode was placed inside a Luggin-capillary with the capillary
tip close to the sample surface to avoid adverse effects from the potential drop
of the solution. The counter electrode was a cylindrical rod made of platinated
titanium.
Fig. 29 Assembly of iron samples in the sample holder

69
Fig. 30 Electrochemical cell
2. Electrolyte, pH and temperature
The electrolyte for electrochemical porosity measurements had to fulfill special
demands: the pH-value had to be stable and the corrosion rate of iron should be
moderate. The rate had to be as high as necessary to detect even small pores
or defects of the coating but not too high to avoid distortion of the shape of the
current density potential plots to guarantee a good visibility and reproducibility
of the active metal dissolution area (fig. 31).
According to the Pourbiax diagram different electrolytes were chosen: sulfuric
acid 2 M, pure water, sodium chloride 0.01M and 0.05M, sodium sulfide 0.05M,
sodium sulfate 0.01M and a buffer of sodium acetat / acetic acid 0.1M/0.01M.
The pH was measured with a pH-meter.

70
Fig. 31 Potential scan of pure iron in a sodium acetate/acetic acid (0.1/0.01M)
Best results of all tested electrolytes were obtained with a sodium acetate/
acetic acid buffer (0.1M/0.01M) with a pH value of 5.65. Each portion of
electrolyte was prepared with de-ionized water.
Electrolyte temperature was verified with help of an equipment that controls the
temperature of the electrochemical cell. Different temperatures were adjusted
from room temperature 298 K to 308 K. This study was done to investigate the
influence of the temperature on the corrosion process of bare samples. The
working temperature was optimized at room temperature.
3. Potentiodynamic scans and cyclic voltammetry
Potential scans were carried out with the setup shown in fig. 30. A potential
scan rate = 100 mV/s was applied for all experiments; a relatively high scan rate
was chosen to avoid additional corrosive damage of the sample. The potential
range was swept from -1 V to +1 V; and the surface exposed area was 2.01
cm2; in cyclic voltammetry measurements 20 cycles were recorded to study the
stability of the coating over a longer period of time. Each experiment was done
in a fresh electrolyte. Potentiodynamic polarization curves were obtained with a

71
Princeton Applied Research Potentiostat ―Parstat 2273‖ with the software
Power Suite 2.58.
4. Linear polarization resistance
The linear polarization measurements were carried out with the same three
electrode setup as in 1.5.3. Polarization resistance (Rp) measurement is a well
known corrosion test to investigate the corrosion process and to determine the
corrosion current and corrosion rate of the coated iron samples [80]. In this case
the electrolyte was exchanged with a sodium chloride solution (NaCl) of 0.01
and 0.05 M. A low scan rate of 1 mV/s was used to establish equilibrium
conditions. The scanned range was – 0.20 Volts and + 0.20 Volts vs. OCP.
Open circuit potential was measured for 45 min. prior to each linear polarization
experiment to guarantee equilibrium conditions. The Power Suite software was
used for the calculation of Rp and corrosion rate.
5. Tafel Plot
The setup for the Tafel Plot experiments was the same as for linear polarization
except the scan rate was decreased to 0.116 mV/s [46]. At the beginning of
each experiment the OCP was recorded for 45 min until equilibrium had
established. The potential range was scanned from – 250 mV to +250 mVolt vs.
OCP. The extrapolation of Tafel plots was done with the PowerSUITE® software
package and corrosion currents and corrosion rates were fitted based on
density, equivalent weight and exposed area of iron.
6. Electrochemical impedance spectroscopy
The measurements were made in the same three electrode setup as in the
section 1.5.3 after the samples reached equilibrium at invariable OCP. The
electrolyte solutions were sodium actetate / acetic acid buffer (0.1M/0.01M) and
sodium chloride with a concentration of 0.1M and 0.05M, as well. The frequency
range was set between 0.005 Hertz and 10.000 Hertz. The electrical equivalent

72
circuit was verified with the ZSimpWin 3.21 software (Echem Software, Bruno
Yeum, Dimauril 2005) and the evaluation of circuit components was done with
Power Suite®.
III. Structure and composition characterization
1. Scanning electron microscopy (SEM/EDX)
Scanning electron microscopy (SEM) was applied to characterize the
morphology of the different films. Microphotographs were obtained at
acceleration voltages of 10kV and 20kV to generate high resolution images.
Because of the three-dimensional appearance of SEM images a detailed
observation of the surface is possible. In the mechanism of SEM, the primary
electrons coming from the source strike the surface and are inelastically
scattered by sample atoms. Secondary electrons emitted from the sample
surface are detected to produce an image; because the high energy of the
primary electrons excite electrons at the magnetic shell of the sample producing
X-rays. These were detected in an energy dispersive X-ray (EDX)
spectroscope. The use of EDX allows the identification of elements in the upper
sample surface. The SEM equipment can be also adapted for different detection
modes such as the detection of backscattered electrons or electron backscatter
diffraction (EBSD) which gives crystallographic information about the sample.
Generally a resolution down to several nm is possible [82]. The SEM used in
this investigation was from FEI Company, Series XL 30 (FEG).
2. Electron probe microscope analysis (ESMA/EPMA)
This method was utilized to receive an element composition map of the sample
surface and to verify the coating homogeneity as well. This method is a
combination of X-ray microanalysis and scanning electron microscopy. ESMA
provides the opportunity to obtain information about the local elemental
composition in conjunction with the surface topography. Here the use of SEM
allows the optical electron micrographic view. In this technique electrons are

73
emitted from a common source and bunched in the middle of an
electromagnetic lens system that will spotlight the electrons to the analyzed
sample. It works similarly to a SEM where the sample is bombarded with an
electron beam, and signals that come from the sample are collected. Specific X-
ray wavelengths are selected and counted. This enables the elements present
within sample volumes of 10-30 cubic micrometers or less to be determined, by
comparing the intensities of characteristic X-rays from the sample material with
intensities from known composition (standards). The equipment used in this
work was a Cameca serie SX50.
3. X-ray photoelectron spectroscopy (XPS)
XPS is a surface sensitive analytical tool which objective is the determination of
chemical composition and electronic state of the sample. During the XPS
measurement, the samples are kept under high vacuum and are bombarded
with X-rays. The photons penetrate several nanometers deep into the
superficial layer of the sample, exciting photoelectrons. The emissions
emanated from the excited electrons from about 5 nm depth can be detected.
The energy of these electrons is measured by an analyzer.
With help of monochromatic X-rays it is possible to quantify the binding energy
emitted of the electron by an equation of Einstein:
Ebinding = Ephoton − Ekinetic – Φ (51)
Φ is the work function of the material. Because the energy of the electrons shell
is specific for each element the spectrum provides information about the
elemental composition of the thin surface region. XPS provides also the
possibility of creating depth profiles of the elemental composition by surface
sputtering [82,83]. The XPS spectra were measured on a Thermo VG Scientific
ESCALAB 250.

74
4. Secondary ion mass spectrometry (SIMS)
In order to study the film structure and the element distribution, a depth profile
of the coating was received from secondary ion mass spectrometry (SIMS)
measurements. The films were bombarded with Cs+ ions with a current of 15 nA
and 5.5 keV as impact energy. SIMS is an analytical technique that can detect
very low concentrations of dopants and impurities. It can provide elemental
depth profiles over a depth range from a few nanometers to tens of microns.
SIMS works by sputtering the sample surface with a beam of primary ions.
Secondary ions formed during the sputtering are extracted and analyzed using
a mass spectrometer. These secondary ions can range from matrix levels down
to sub-parts-per-million trace levels [83,84]. A scheme of the SIMS equipment is
presented in the next picture.

75
Fig. 32 Scheme of the SIMS equipment [85]
5. X-ray diffraction (XRD)
Knowledge of the chemical composition and the physical phases of the inner
structure of the coating material are essential to understand the effects and
interaction of deposition parameters on the protection performance. Therefore
the crystalline phases of the films were studied with X-ray diffraction (XRD)
using a four circle diffractometer (Seifert PTS 3003). The diffractometer was
operated with Cu Kα1 and Kα2 radiation with 8027 eV as X-ray energy, using an
X-ray mirror at the primary side and a long Soller slit with a 0.3° divergence with

76
respect to the sample surface plane as well as a graphite monochromator at the
secondary side [81]. For the surface sensitive grazing incidence X-ray
diffraction measurements (GIXD) the inclination angles were: = 0.1°; 0.3°;
0.8°; 1°; 3° and = 5°. X-ray diffraction was also used to verify the film
thickness of the coating.
In an X-ray diffraction measurement, the sample is rotated precisely and
irradiated with X-rays at different angles. From the obtained diffraction patterns
at a variety of rotation angles a three-dimensional model of the electron density
can be created within the crystal and combined with chemical data of a known
sample. Poor resolution or even errors may result if the crystals are too small or
non-uniform in their internal structure [86].
X-ray diffraction is commonly used to identify different phases of polycrystalline
samples. The two most important advantages for analysis of hybrid materials
are the speed and nondestructive conditions of this technique. The positions
and intensities of a diffraction pattern are unique for a single substance. The X-
ray pattern of a substance can be seen as a fingerprint and mixtures of different
crystallographic phases can be easily distinguished by comparison with
reference data [86].
6. Transmission electron microscopy (TEM)
Transmission electron microscopy (TEM; FEI, CM20STEM) was performed to
distinguish and identify the particle size and structure of the zirconium oxide
film. High-resolution TEM images were analyzed with the software Gatan
DigitalMicrographTM. Electron patterns were analyzed with Fourier Transform
and with special interpreting software PIEP. In TEM measurements images are
obtained by focusing a beam of electrons onto a very thin sample. The beam
will partially penetrate the thin film and the electrons will interact with the sample
material on their way through the sample yielding information about its inner
structure. The images are recorded at a photographic plate or a light sensitive
CCD sensor and the image can be displayed in real time. Due to the weak
interaction of the samples with the electron beam it is often difficult to observe
detailed structures in TEM, especially for samples that have a high content of

77
organic components. Often heavy metals are used to overcome this problem.
The dense electron clouds of the heavy atoms interact strongly with the electron
beam. TEM allows also determination of the elemental composition of the
specimen by analyzing its X-ray spectrum or the energy-loss spectrum of the
transmitted electrons. Additionally if the observed material is crystalline,
diffraction patterns are obtained that give information about the crystal
orientation [84].
C. Results and Discussion
I. Parameters optimization
Prior to the analysis of coated samples certain parameters needed to be
adjusted to guarantee reproducible and informative data. These parameters
include: spinning speed and time and its influence on film thickness,
temperature and time of heat treatment, electrolyte composition and
dependence of current density-potential plots on temperature.
1. Influence of spinning rate and time on film thickness
As described in the experimental part, the film thickness depends on the
spinning speed and time during the spin coating deposition process, as well as
on heating temperature and time in the furnace.
Fig. 33 shows the results of profilometer thickness measurements of zirconium
oxide films on iron samples obtained at different rotation rates and different
heating temperatures.
As can be clearly seen in the graph, low spinning speeds result in thicker films
but the thickness variation becomes less significant at temperatures higher than
873 K.

78
Fig. 33 a) Film thickness as function of spin coater rate for different heat
treatment temperatures
It can be also seen that beyond 4000 revolutions per minute (rpm) the further
decrease of thickness with increasing speed becomes marginal. Therefore and
due to the relatively high weight of the iron samples a moderate spinning rate of
4000 rpm was chosen as the standard speed for all samples. Under these
conditions the film thickness was 120 nm ± 20 nm. These data was obtained
from zirconium oxide coatings stabilized with acetyl acetone (acac). In the case
of zirconium oxide coatings stabilized with hydroxypropyl cellulose (HPC) the
films were 30 nanometers thicker than acac-films [37].
2. Heating time and temperature effect
Between samples that were dried at room temperature or treated at 373 K in a
furnace for one hour no significant dependence on temperature was observed
(see Fig. 33 b). After treatment at these low temperatures the coatings could be
easily washed off with distilled water. Obviously the properties of these films
matched the original precursor-gel rather than a ceramic-like coating. However,
heating temperatures above 473 K yielded coatings that could not be removed
with water. Their thickness was much thinner as can be seen in fig. 33 b. They
showed good adhesion to the metal surface.

79
Fig. 33 b) Influence of temperature on film thickness
It can be also seen in fig. 33 b) that a heat treatment above 673 K will no longer
change the film thickness significantly. Therefore it can be expected that the
most critical structure changes occur in the lower temperature region. Samples
treated at higher temperatures over 773 K showed rises on the edges because
of pressure and metal expansion that probably could be later no
recommendable for the good performance of the coatings.
As a consequence of different film thicknesses in the range of hundreds of
nanometers, coated samples showed typical decorative interference colors from
bright blue, silver, green up to red and gold [23].
3. Effect of the electrolyte temperature
Because electrochemical reactions among other factors depend on mass
transport through different phases, it was necessary to investigate the effect of
temperature on the electrochemical data to ensure the reliability of these
experiments. Therefore dissolution current densities vs. potential plots of
uncoated iron samples were recorded at different temperatures of the sodium
acetate/acetic acid buffer solution (0.1M/0.01M). Each potential scan was
repeated 20 times to receive information about the long term behavior of the
sample. From the current density vs. potential curves the maximun current (Imax)

80
of anodic iron dissolution was extracted. Fig. 34 shows Imax as a function of the
number of potential cycles, recorded at different electrolyte temperatures. The
electrolyte dissolution current densities increase over 20 cycles because the
metal surface takes damage over time from the corrosive attack, as can be
seen in fig. 34. A dependence on temperature is clearly visible, though it is
insignificantly small at the first cycle and lies within the range of natural current
density variation. The first one is also the most important cycle for the
determination of film porosity because here the sample’s condition is very close
to its original state right after film deposition and the sample has not suffered
severe corrosion damage yet. Because of the increased mass transport at
higher electrolyte temperatures the corrosive damage will also increase
stronger with the duration of the experiment. Therefore the rise of current
densities becomes much more significant with increasing number of cycles.
Since the ambient temperature in the laboratory varies only a few degrees from
293 K and usually only the first cycle is considered in porosity evaluation, all
experiments could be done without temperature control. Additionally, the
influence of other sol composition parameters was found to be orders of
magnitude stronger than electrolyte temperature.
Fig. 34 Variation of the current density at different electrolyte temperatures for
pure iron

81
4. Types of electrolyte, pH and concentration
For the electrochemical evaluation of film porosity a suitable electrolyte had to
be found that allowed a moderate corrosion rate of coated and uncoated
samples and clear identification of typical corrosion phenomena in the graph,
i.e. anodic oxidation, maximum dissolution current density, formation of passive
layers, etc. Therefore various parameters such as electrolyte salt concentration,
pH-value and scanning speed had to be adjusted. Thereby various electrolytes
have been tested at different concentrations, such as sodium sulfite, sodium
chloride, sodium sulfate and sulfuric acid. None of them met the desired
demands because current densities were either too high or low or specific
corrosion phenomena could not be observed in the graph. Instead, best results
were obtained from a sodium acetate / acetic acid buffer solution (0.1 mol/l /
0.01 mol/l) with a pH-value of 5.65 as shown in fig. 35. Similar buffer
concentrations have been successfully applied to the analysis of iron corrosion
behavior before [23,43].
Fig. 35 Current density behavior of iron in buffer sodium acetate/acetic acid
(NaAc/HAc; 0.1/0,01M)
H+ H2
Fe++ FeOx
Fe Fe++

82
A particular advantage of the acetate buffer solution is its ability to keep the pH-
value constant in contrast to most pure salt solutions. A pH-alteration would
result in strong disturbances of electrochemical reactions and therefore
reproducibility of porosity evaluation could hardly be accomplished.
II. Electrochemical porosity measurements
1. Potentiodynamic scans
Fig. 36 shows a linear potential scan of an uncoated iron sample. The current
density is plotted in logarithmic scale vs. potential for better visualization. At
negative potentials left from the open circuit potential (OCP) the sample
behaves cathodic and reduction reactions dominate on the metal surface. At the
OCP cathodic and anodic reactions proceed with the same ratio, resulting in a
sum current density of zero. At higher potentials the sample will show anodic
behavior and an increase of current density can be observed due to beginning
metal dissolution. With growing potential current density rises further until a
maximum current density Imax can be observed as a peak in the graph. It
expresses the maximum iron dissolution rate before the passive film formation
starts at higher potentials. The value Imax of the uncoated sample can be used
as a reference current density representing a porosity of 100 %. As long as the
sample has not suffered significant corrosion damage the current density is
primarily dependent on the size of the uncovered substrate surface, i.e. the film
porosity. Therefore a high scan rate was chosen to avoid change of the pore
structure due to precipitation or delamination. This way the coverage and
porosity of different insulating coating materials can be determined in relation to
the uncovered metal surface.
In addition the open circuit potential (OCP) gives an indication of the nobility
and resistance of the coated sample. However, the reliability of this information
is limited because various parameters like surface condition and oxide films
have a strong effect on the position of the OCP. In some cases though, when

83
the coating material is absolutely inert, an OCP-shift can provide information
about the change of the average pore size of different coatings [23,24].
Fig. 36 Potential scan of uncoated iron
1.1 Zirconium oxide coatings with acetyl acetone (ZrO2-acac)
1.1.1 Influence of heating temperature
Fig. 37 shows the influence of the heating temperature on the dissolution
current density Imax for samples coated at 4000 rpm with zirconium propoxide
and acetyl acetone (1:1) as stabilizer.
Imax
OCP

84
Fig. 37 Effect of heat treatment temperature on current density
From 473 to 673 K the current density decreases due to drying and
densification processes in the coating material. These reactions lead to a
reduction of both number and size of pores. At 673 K the dissolution current
density is decreased by approximately 4 orders of magnitudes with respect to
the 473 K sample. At 773 K the current density is still very low but increases
when temperature is raised to 873 K. This behavior could be related to stress
phenomena in the coating material, especially in the interface region between
substrate and coating. In the literature it has been indicated that zirconium
propoxide shows a phase transition around 698 K into crystalline material [56].
Together with electrochemical porosity evaluation also structural
characterization experiments such as XRD, SIMS and TEM were done to verify
whether this transition might have a beneficial effect on the corrosion resistance
of the coating. At higher temperatures the sol-gel films will show more ceramic-
like behavior, that is high hardness and density. But unless these structures
have a positive effect on the protection ability there is no reason to apply more
energy in the process than necessary. According to fig. 37 a further temperature
raise beyond 673 K does not contribute significantly to porosity reduction,
therefore the focus of further investigation was on the lower temperature range
and the structural changes that can be observed there.

85
In another experiment current densities were recorded over 20 cycles for each
sample to investigate whether higher temperatures will yield more stable film
structures. The results are shown in fig. 38.
Fig. 38 Maximum current density peaks as a function of potential cycles for a
coating rate of 4000 rpm
All samples show rising dissolution current densities over 20 cycles because
they take increasing damage from the corrosive attack of the electrolyte. But
while the sample heated at 473 K shows a quite steep rise of current density
this effect diminishes consequently with increasing temperature. This was the
minimum temperature that was necessary to obtain a coating which could not
be removed with water any more, indicating good adhesion to the substrate.
However, the film remains in an amorphous state because of the low
temperature. After heating at 873 K the rise of current density over time
becomes negligible. On the other hand this sample shows a higher porosity
during the first five cycles compared to the 673 K sample.
It looks like higher temperatures can fortify the coating structure, leading to
more stable coatings but unfortunately the benefit of stability comes along with
a higher porosity. This experiment also suggests that the best results can be
expected from the low to medium temperature range. Apart from porosity one
also has to consider the substrate material which may limit the available
temperature range of the heating procedure. The advantage of greater stability

86
will be obsolete when the metal substrate suffers from structural damage or
undesirable oxidation.
1.1.2 Effect of propanol/water ratio
Several potential scans were recorded with different volume ratios of the
solvents propanol and water. The volume ratio of propanol and water in the
solution of zirconium n-propoxide was varied from 4:1 to 3:1, respectively. The
variation of this parameter has obviously at most a very small effect on the
current density which is hardly significant as can be seen in fig. 39.
Fig. 39 Effect of propanol/water ratio on current density for coated samples after
heating at 573K for 1 hour
The solvent mixture of propanol and water acts as solvent and hydrolysis
initiator as well. Therefore variations of both volumes have no considerable
effect on the proceeding of the condensation reaction and final network
structure, thus the film porosity remains the same.

87
Fig. 40 Effect of propanol/water variation on current density for samples treated
at 673K
This is supported by samples that have been treated in the same way except
that the heating temperature was raised to 673 K. As can be seen in fig.40 both
current density and OCP do not change significantly and again pore structure is
not affected by neither volume variation.
1.1.3 Effect of acetyl acetone concentration
-8
-7
-6
-5
-4
-3
-2
-1.0 -0.5 0.0 0.5 1.0
potential / V
Lo
g |
i| [
Ac
m-2
]
AcAc: 0.0AcAc: 0.5AcAc: 1.0AcAc: 1.2AcAc: 1.5
Fig. 41 Potential scans of coatings with different acac concentrations
heated at 573K [24]
Lo
g IiI / A
cm
-2
Potential / V

88
In the fig.41 the dissolution current density vs. potential plots of samples with
different amounts of acac are shown. The shift of the open circuit potential of
the curves towards anodic direction (positive potentials) might be an indication
of the reduction of the average pore size [23]. The maximum current density
peaks have decreased in comparison to the uncoated iron by two orders of
magnitude for the sample with a ratio of 1:1. This ratio seems to be the optimum
providing the lowest current densities as can be seen in the linear graph in fig.
42.
0
20
40
60
80
100
120
0.0 0.5 1.0 1.5 2.0
molar ratio acetylacetone vs. precursor
I max [
µA
cm
-2]
Fig. 42 Current density vs. molar ratio of acetyl acetone/precursor [24]
According to the literature the precursor structure is stabilized at a determined
precursor/acac ratio [38]. Obviously this structure also promotes the formation
of a low-porous film. A further increase of acac conentration will destabilize the
precursor which corresponds to the observed rise of current density in fig. 39
when the ratio is raised beyond 1:1.
I max /
μA
cm
-2

89
Fig. 43 Current density of coated iron prepared with different molar ratios
of acac and heated at 573K
Fig. 43 shows another record of maximum current densities over 20 cycles to
see whether the amount of acac affects the stability of the sample in a similar
way like it was observed for higher drying temperatures. When the coating is
prepared without acac the current densities rise abruptly which indicates that
the sample is not stable at all. As soon as acac is added the stability improves
significantly and the samples remain in good condition, even after 20 cycles.
This result underlines the importance of the effect of stabilizing agents on the
final film structure of protective sol-gel coatings.

90
Fig. 44 Potential scans of different coatings heated at 673 K
The effect of acac concentration seems to be independent on the applied
heating temperature as can be seen in fig. 44, 45 and 46. After heating at 673 K
the samples show a very similar behavior like the 573 K samples before.
Lowest current densities are again found at an acac/precursor ratio of 1:1. The
coating material is subjected to substantial changes during the drying and
heating step due to solvent evaporation, densification and bond-fragmentation.
Since the effect of acac can be verified in the final coating it seems that the
stabilizer promotes some fundamental structure change which persists through
the heating step.
Fig. 45 Current density and molar ratio acetyl acetone vs. precursor

91
Fig. 46 Cyclic voltammetry of coatings prepared with different molar ratios of
acac and heated at 673K
During the condensation and gelation phases the alkoxide tends to be stabilized
in a compact and dense film because of the chelating influence of acetyl
acetone. This can provide better particle accommodation and better adhesion to
the substrate, reducing thus the film porosity and therefore also reducing the
contact between film and electrolyte. These experiments were repeated in more
occasions throwing reproducible results.
1.1.4 Effect of heating time
In the fig. 47 and fig. 48 potential scans of coated samples heated for one and
two hours in a furnace at 573 and 673 K are shown. Samples heated for two
hours show additional reduction of the current density in comparison with
samples treated for one hour. It appears to indicate that a prolongation of
heating can improve the film properties; however from an application point of
view, additional heat exposition means also higher energy costs to obtain only a
little improvement.

92
Fig. 47 Comparison ZrO2-acac coatings heated for 1 and 2 hours at 673 K
Fig. 48 Comparison of ZrO2-acac coatings heated for 1 and 2 hours at 573 K
1.1.5 Multilayer coatings
An alternative way of reducing film porosity is the deposition of a second
coating layer on top of the first ZrO2 film. The second layer should improve the
protection ability of the coating for two reasons: remaining pores in the first layer
will be covered and the coating becomes a much stronger electrolyte barrier

93
due to its higher film thickness. This method has been also successfully tried for
other coatings systems in [87-90]. The current density vs. potential plot of such
a multilayer coating is shown in fig. 49.
Fig. 49 Current densities for double layer ZrO2 coating heated at 673 K
The coating consists of two ZrO2 films that were deposited one after the other.
Both were subjected to the full deposition procedure, including the heating step
at 673 K for one hour. However, a significant enhancement of protection cannot
be observed in comparison to the corresponding monolayer system. The
current densities of both coatings are almost identical. Actually the cathodic
OCP-shift of the multilayer system suggests a less noble behavior with
increased average pore size.
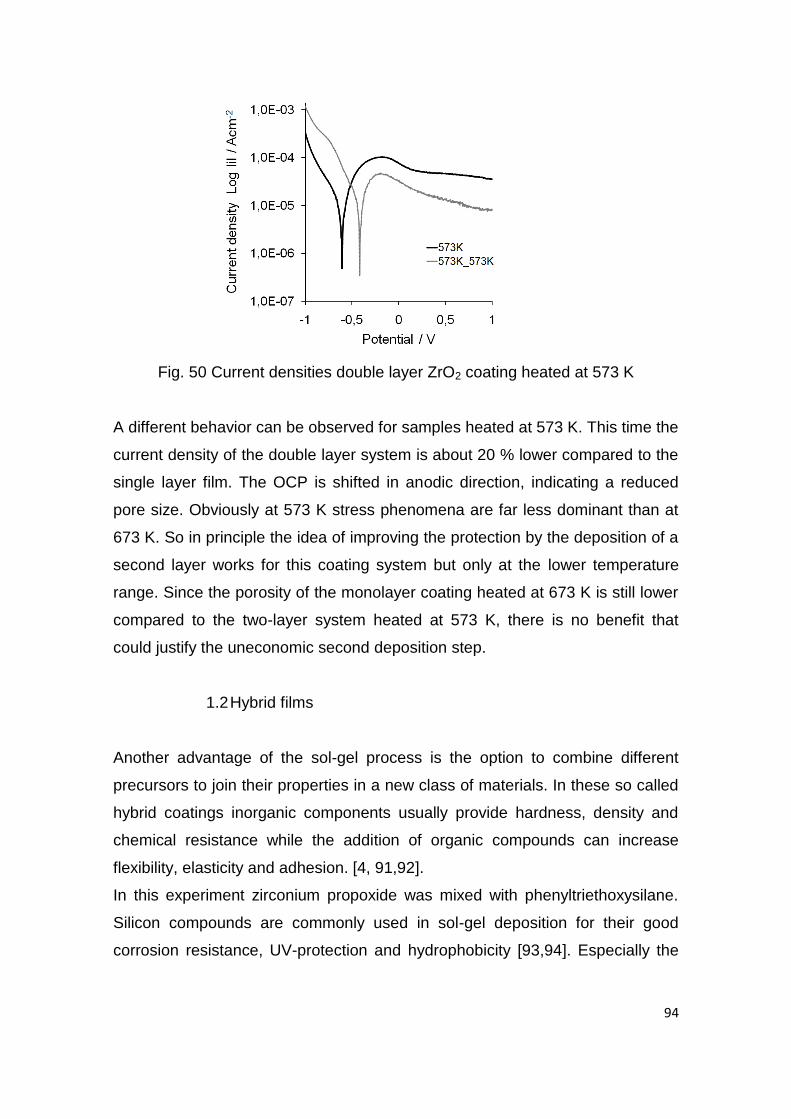
94
Fig. 50 Current densities double layer ZrO2 coating heated at 573 K
A different behavior can be observed for samples heated at 573 K. This time the
current density of the double layer system is about 20 % lower compared to the
single layer film. The OCP is shifted in anodic direction, indicating a reduced
pore size. Obviously at 573 K stress phenomena are far less dominant than at
673 K. So in principle the idea of improving the protection by the deposition of a
second layer works for this coating system but only at the lower temperature
range. Since the porosity of the monolayer coating heated at 673 K is still lower
compared to the two-layer system heated at 573 K, there is no benefit that
could justify the uneconomic second deposition step.
1.2 Hybrid films
Another advantage of the sol-gel process is the option to combine different
precursors to join their properties in a new class of materials. In these so called
hybrid coatings inorganic components usually provide hardness, density and
chemical resistance while the addition of organic compounds can increase
flexibility, elasticity and adhesion. [4, 91,92].
In this experiment zirconium propoxide was mixed with phenyltriethoxysilane.
Silicon compounds are commonly used in sol-gel deposition for their good
corrosion resistance, UV-protection and hydrophobicity [93,94]. Especially the

95
latter could have a favorable effect on the corrosion protection ability in aqueous
media.
1.3 Zirconium-silicon oxide coatings
Fig. 51 Hybrid coating based on zirconium oxide and silicon oxide
Fig. 51 shows the potential scan of a hybrid film prepared with a mixture of
zirconium propoxide and phenyltriethoxysilan (1:1) that was heated for one hour
at 673 K. The maximal current density of the hybrid film is about 3 orders of
magnitude lower than uncoated iron. However, in comparison to the
corresponding ZrO2 monolayer coating the differences in current density and
OCP are very small and hardly significant.

96
Fig. 52 Multilayer hybrid coating of ZrO2 and SiO2
Fig. 52 shows another kind of hybrid coating. This time the two precursors were
combined in a multilayer system, one coating on top of the other. During the film
preparation the samples showed increased oxidation when the silicon precursor
was deposited first directly on the iron surface, therefore the zirconium layer
was deposited on the substrate instead and the silicon component was
deposited on top. To avoid stress phenomena like they occurred during the
deposition of ZrO2 double layers at 673 K the silicon/zirconium multilayers were
only heated at 573 K. At this temperature a significant effect of the additional
layer was found for the ZrO2 system (fig. 49).
Although the multilayer coating shows a considerable reduction of dissolution
current density in fig.49 compared to the uncoated metal the performance of the
pure ZrO2 double layer film without silicon is still better with a 20 % lower
current density and an anodic OCP-shift, as well.
The addition of the silicon precursor does not show any improvement to the
protection performance, neither as a hybrid coating nor as a multilayer system.
Since the best results can be obtained with the monolayer ZrO2 film, there is no
need for unnecessary complication of the deposition process.

97
1.4 Zirconium oxide coatings with hydroxypropyl cellulose (ZrO2-HPC)
It was found that the amount of acetyl acetone has a significant effect on film
porosity of ZrO2 coatings. Therefore experiments with the stabilizing agent HPC
were done to investigate whether a similar dependence occurs and how the
ability of HPC to decrease the particle size affects the porosity of the coating.
1.4.1 Effect of HPC concentration
Fig. 53a Effect of HPC molecule (80,000 g/mol) concentrations (g/l) on
current density
Fig. 53a shows potential scans for ZrO2-coated iron samples treated at 673 K
and prepared with different concentrations of HPC. It can be seen that the HPC
concentration has a considerable effect on the coating quality and the lowest
current density corresponds to the HPC concentration of 0.004 g/l. This
indicates that this concentration promotes a compact and homogeneous
structure with a strongly reduced inner porosity. Interestingly both lower and
higher HPC concentrations lead to increased metal dissolution, indicating very
porous film structures. For better visualization the maximal current density
peaks are plotted against the HPC concentration in fig. 53b.

98
Fig. 53b Current densities at different HPC concentrations
This graphic reveals that similar to the correlation found for acetyl acetone there
is an optimum HPC concentration of 0.004 g/l that provides the most compact
and dense film structure. Again a small variation of the stabilizer amount has a
major effect on the final coating structure. It is very likely that the ratio between
precursor and stabilizer determines the number of reactive sites on the
precursor molecule during gelation phase according to the number of
substituent’s connected to the metal atom [32]. Low HPC concentrations might
not provide enough stabilization while higher concentrations can reduce particle
mobility during polycondensation and result in increasing flocculation. Therefore
the stabilizer amount controls also the shape and density of the final network
structure. The quality and degree of this change was further investigated with
SIMS and XRD and will be discussed in detail in chapter (5,6).

99
1.4.2 Effect of heating temperature
Fig. 54 Potential scans of ZrO2-HPC coatings treated
at different temperatures
Potential scans of coatings prepared with zirconium propoxide and
hydroxypropyl cellulose (0.004 g/l) are shown in the fig. 54. The samples have
been dried at different temperatures. The maximal current density peak of
uncoated iron is used as reference. The 573 K sample shows a considerable
reduction of approximately 2 orders of magnitude compared to the uncoated
material; however, there is still a certain amount of polymeric compounds and
solvent remaining in the film material. Because of incomplete evaporation of
these residues the densification progress of the coating material is not finished
yet and a moderate porosity persists in the film. At 673 K an exceptional low
current density can be found. It is reduced by more than four orders of
magnitude compared to the blank sample, indicating a minimum porosity of the
coating system ZrO2/HPC. On the other hand, the higher temperature of 773 K
does not result in a further decrease of porosity but, on the contrary the current
densities rise again. This might be related to stress phenomena during the
heating procedure. This is again a similar behavior like it was observed for
acetylacetone stabilized coatings. Again the film with the lowest porosity is
obtained at a moderate heating temperature.

100
1.4.3 Effect of molar weight of HPC
Fig. 55 Potential scans of coatings prepared with zirconium propoxide
and different HPC molecules
Three kinds of HPC with different molar weight have been investigated to
determine the influence of the molecule size of the stabilizer on the structural
change of the film material. The coatings were prepared with zirconium
propoxide and an HPC concentration of 0.004 g of HPC per liter of ethanol. The
letters A, B and C, correspond to the molar weights (MW) of HPC molecules:
80,000; 100,000 and 370,000 g/mol, respectively. As can be seen there is a
significant effect on the current densities and obviously a lower molecule size is
advantageous for the formation of low porous coatings. Lowest dissolution
current is found for sample A with 80,000 g/l and the current increases with
growing molecular weight from 100,000 (B) until 370,000 (C). The different
currents densities shown by the HPC molecules can be explained because very
long polymer chains can overcome the saturation of the particle surface
coverage. In this case the bridging between particles in form of flocculation
becomes inevitable, reducing thus the stabilization and increasing defects
(porosity) on the coating structure [31]. However, low-weight HPC molecules
posses better surface contact around the particles surface [31,32,97-99],

101
reducing the particle size and resulting in better stabilization and lower
dissolution current densities.
1.4.4 Hybrid coatings
Fig. 56 Potential scans of hybrid coatings prepared of ZrO2 and SiO2 basis and
heated at 673 K
In aqueous sol-gel processes water acts as solvent and ligand, as well. Oxygen
for the formation of the oxidic compound is supplied by water molecules. In
nonaqueous systems, where intrinsically no water is present, the oxygen for the
metal oxide is provided by solvents or the organic constituent of the precursor
[4, 104]. Hybrid coatings were prepared with and without water according to
table 6 in order to find out which preparation way provides the structure with the
lowest porosity. Potentiodynamic scans of samples prepared with propanol and
with/without water as solvent and with 0.004 g/l HPC are shown in fig. 56. The
sample with H2O appears to be more dense (low porosity) and its maximum
current density peak was reduced by two orders of magnitude in comparison to
the sample without water. This indicates that in this case the absence of water
limits the formation of dispersed particles and oxygen-metal-oxygen bonds
specifically for the low reactive silicon precursor. This results in a porous and
poorly stabilized structure.

102
Fig. 57 Potential scans of hybrid coatings prepared with Zr and Si alkoxides and
heated at 673 K
A similar pair of samples was prepared with ethanol instead of propanol. An
additional aging step was introduced for a third sample to investigate whether
the increased condensation time could overcome the lack of water. Current
densities are shown in fig. 57. Both samples prepared with and without water
show similar current densities with a small OCP-shift for the sample without
water. Considerably lower current densities are found for the sample that was
aged for three days. The resulting coating structure provides a major increase in
protection performance with a further reduction of current density. During film
preparation sometimes a problem occurred because the sol showed visible
alteration before the heating step resulting in inhomogeneous films. The sol
containing water showed a reduced life time because after 3 hours significant
precipitation of the precursor material occurred. HPC acts in nonaqueous as
surfactant providing stabilization in absence of water [104].

103
Fig. 58 Comparison of ZrO2-SiO2 hybrids coatings
and pure zirconium oxide films
Fig. 58 summarizes the experiments about the effect of water content in the sol.
It can be seen that the best hybrid coatings show a considerable reduction of
current densities but cannot compete against the single precursor sol which still
provides the lowest porosity. A similar result was found for acac-stabilized
coatings where the best protection performance was also found for the pure
precursor. It might be that the different precursor materials are not fully
compatible resulting in a less uniform structure or increased susceptibility to
stress during the heating procedure. Obviously the best results are obtained
with the simple sol composition and the more complex sols showed no further
advantage.

104
1.4.5 Steel samples
Fig. 59 Potential scans of construction steel coated with ZrO2-HPC measured in
sodium acetate/acetic acid buffer 0.1/0.01M
The application of HPC stabilizer in zirconium oxide coatings has probed good
results not only on iron but onto construction steel as well as shown in fig. 59.
Only the relevants coatings were used to test the behavior on this material. The
porosity and current density were also reduced by the coatings.
III. Film morphology and structure
For a better understanding of the film constitution and to obtain more details
about the effect of the stabilizing agents and other parameters, surface and
structure characterization methods have been applied.
1. Scanning electron microscopy (SEM)
Physical characterization of the sample surface has been verified with SEM
microscopic observations. Coatings prepared with zirconium propoxide and
acetyl acetone and hydroxypropyl cellulose as stabilizing agents have been
investigated.

105
Fig. 60 SEM image of the coating prepared with Zr-propoxide and acac
as stabilizer heated at 573K
Fig. 61 SEM image of the coating surface for samples prepared with Zr-
propoxide and acac and heated at 673 K
Fig. 60 and fig. 61 show SEM pictures of zirconium oxide films, stabilized with
acac and heated for 1 hour at 573 and 673 K, respectively. The sample treated
at 673 K shows a more compact structure with fewer cavities in comparison to
the 573 K sample. This supports the results of electrochemical porosity

106
characterization but on the other hand SEM gives only an image of the
superficial morphology and not of the inner structure of the coating. The
obviously more compact structure supports the idea that higher temperature
leads to the formation of a denser network with lower porosity. On the other
hand higher temperatures often come along with stress phenomena and crack
formation that can result in deterioration of the protective film. The SEM pictures
suggest a well distributed, homogeneous coating structure with smaller particle
size for higher temperatures but for the evaluation of the sample’s protection
performance the piercing porosity over the whole film thickness has to be
considered (see II. 1).
Fig.62 SEM image of a coating prepared with Zr-propoxide and HPC as
stabilizer heated at 673K
The use of HPC as stabilizing agent leads to an even finer grained structure as
can be seen in fig. 62. The particle size seems to be further reduced compared
to acac-samples. This supports the ability of HPC to decrease particle size and
porosity as well. In the fig. 63 a magnification of the above image is shown for
better visualization.
.

107
Fig. 63 SEM magnification of the image 62
Fig. 64 SEM image of the edge for the sample shown in figure 62
A scanning electron microscopy image from the edge of the coating is shown in
fig.63. The film structure looks like irregular elevations constituting of a species
of an amorphous mass with different form and slopes.
2. ESMA/EDX measurement of element distribution
Additional characterization of film composition was done on the sample surface
with ESMA and EDX. Fig.65 shows an image of the element distribution of

108
zirconium and oxygen. The brightness corresponds to the intensity of the
observed element. The picture on the left hand side shows a homogeneous
distribution of the main precursor element zirconium, verifying the uniformity of
the deposition process. There is a light texture visible in the oxygen picture on
the right hand side that may arise from deeper coating regions, probably the
interface zone in contact to the iron/iron oxide substrate surface. Additional
SIMS measurements were done to determine the nature of this effect (see
chapter SIMS).
Fig. 65 ESMA of zirconium and oxygen made on coated samples
Fig. 66 EDX of ZrO2 coating prepared with HPC=0.004g/l as stabilizer
heated at 673K

109
In fig. 66 the KL peaks of Zr, Fe, O and Hf (usually accompanied with Zr) are
shown as received from EDX measurement. The small peak next to the bigger
Fe signal corresponds also to a low intensity iron signal. Scans were made in
different parts of the surface showing the same results. This method imparts a
qualitative identification of the coating elements. This characterization proves
the existence of a zirconium oxide layer on the coating surface. EDX
measurements were also used at TEM and XPS characterization.
3. X-ray photoelectron spectroscopy (XPS) analysis
A problem of thin film analysis is the fact that many methods such as EDX
deliver information from a certain depth of the material depending on the energy
of the exciting ions or photons. In order to characterize the element composition
in the upper surface region of the coating (few nanometers) XPS has been
applied. Samples coated with zirconium n-propoxide and stabilized with acetyl
acetone and hydroxypropyl cellulose have been characterized.
3.1 Samples prepared with acetyl acetone
Fig. 67 XPS overview of coated and uncoated iron samples
60
40
20
0
1200 800 400 0 Binding Energy (eV)
Coated
Uncoated
Uncoated not heated.
O1
s
O1
s
O1
s Zr3p
Zr3d
Zr4p
Fe2
p Inte
nsity x
10
3
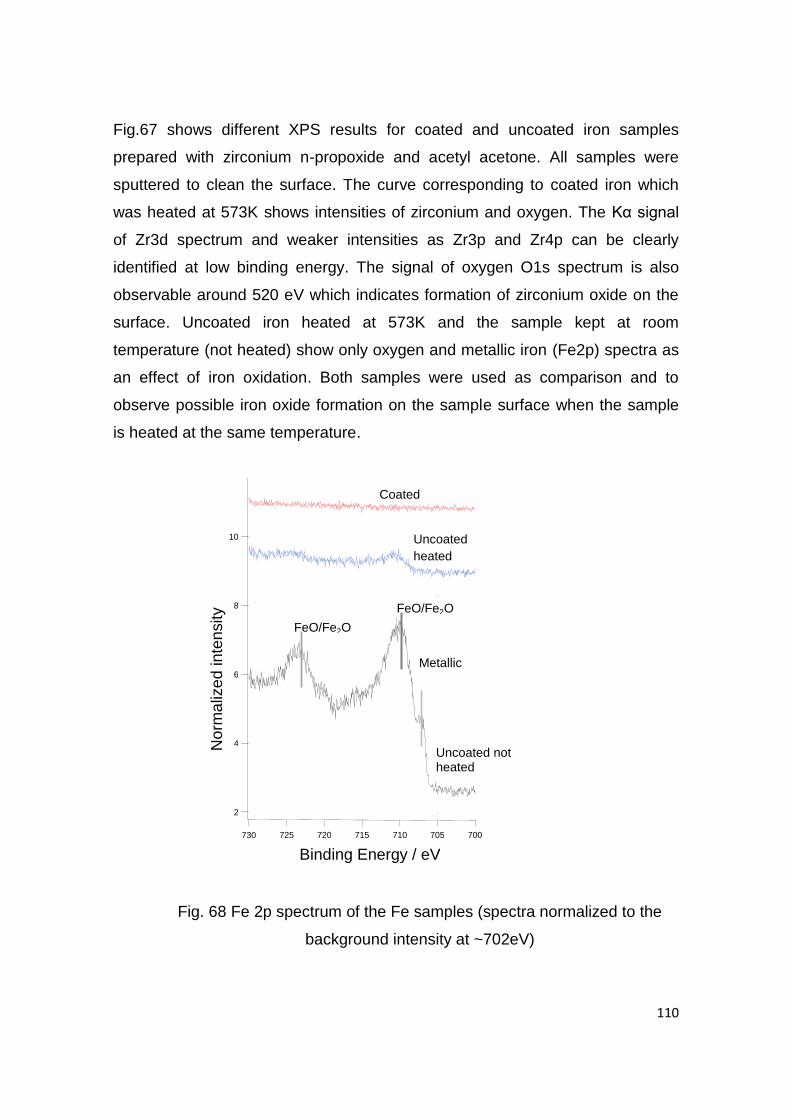
110
Fig.67 shows different XPS results for coated and uncoated iron samples
prepared with zirconium n-propoxide and acetyl acetone. All samples were
sputtered to clean the surface. The curve corresponding to coated iron which
was heated at 573K shows intensities of zirconium and oxygen. The Kα signal
of Zr3d spectrum and weaker intensities as Zr3p and Zr4p can be clearly
identified at low binding energy. The signal of oxygen O1s spectrum is also
observable around 520 eV which indicates formation of zirconium oxide on the
surface. Uncoated iron heated at 573K and the sample kept at room
temperature (not heated) show only oxygen and metallic iron (Fe2p) spectra as
an effect of iron oxidation. Both samples were used as comparison and to
observe possible iron oxide formation on the sample surface when the sample
is heated at the same temperature.
Fig. 68 Fe 2p spectrum of the Fe samples (spectra normalized to the
background intensity at ~702eV)
10
8
6
4
2
730 725 720 715 710 705 700
Coated
Uncoated
heated
Uncoated not heated
FeO/Fe2O
3 FeO/Fe2O
3
Metallic
Fe
Norm
aliz
ed
in
ten
sity
Binding Energy / eV

111
Fig. 68 shows a Fe2p spectrum for the samples described above. Metallic iron
is identified at a binding energy of 707 eV and iron oxides (FeO/Fe2O3) are
localized at binding energies of 710.9 and between 724-725 eV according to the
NIST online database and the XPS Handbook [82]. This result can be also
indexed as the phase Fe3O4 as result of the iron oxidation. In the case of
uncoated heated sample only a small peak of iron oxide can be seen around
710 eV, probably because of magnetic interference with the detector during the
measurement. However, for the coated sample it is not easy to distinguish at
this depth the existence of iron oxide.
3.2 Samples prepared with Hydroxypropyl cellulose (HPC)
Fig. 69 shows an overview of one iron sample prepared with zirconium n-
propoxide and HPC = 0.004 g/l and of an uncoated not heated sample as well.
The coated sample was heated at 673K. Signals of Fe, Zr, C and O are emitted
which indicate the existence of a very thin ZrO2 layer on the surface of the Fe
sample. According to the binding energy, Fe is oxidized and metallic Fe is
localized at ~707eV. The existence of iron oxide on the upper coating surface
can be a product of diffusion processes between substrate and coating during
the heating procedure or of the surface roughness.

112
Fig. 70 Survey spectra of coated and uncoated iron samples prepared
with HPC as stabilizer
Emissions of FeO and Fe2O3 can be observed at binding energies of 710.9 and
724 eV approximately. According to the data base for Fe2p spectrum [82]
Fig.71, iron oxide peaks can be indexed with respect to the orientation of the
spin in the orbital p as the doubling 2p1/2 and 2p3/2, respectively (fig.72).
Fig. 71 Binding energies of iron [82]
60
40
0
Inte
nsity x
10
3
1200 800 400 0
Binding Energy / eV
Uncoated not heated
O1s
Zr3d
Zr3p
Zr3s
O1s
O KLL
Fe2p
Coated
C1s

113
Fig. 72 Fe 2p spectrum of Fig. 70
Fig. 73 Carbon C (1s) spectrum of the Fig. 70
The C (1s) spectrum in fig. 73 confirms the existence of remaining organic
compounds in the coating material after heating at 673 K. The observed peak
can be related to the carbon between the binding energies of 286 and 284 eV.
According to the carbon data base this emission corresponds to carbon and
hydrogen (CxHx) compounds like: C-O-H, C-H or C=O which are residues of the
HPC polymer as described by [39,100].
290 289 288 287 286 285 284 283 282 281 280
HPC4_C1s
CxHx
Binding energy / eV
735 730 725 720 715 710 705 700
Binding energy /eV
2p3/2
FeO/Fe2O3
2p1/2
Fe2O3
Norm
aliz
ed
in
ten
sity

114
Table 5. Binding energies of zirconium [82]
Fig. 74 Zr 3d spectrum of the coating in fig.70
Table 5 shows the binding energies of zirconium components obtained from the
XPS database [82]. According to these values the zirconium emissions shown
in the fig. 74 and localized at the binding energies of 182.3 and 185 eV, are
zirconium oxide (ZrO2). The orientation of the spin allows to achieves these as
ZrO2 (Zr 3d5/2 and Zr3d3/2) coupling, respectively.

115
4. Crystalline structure analysis with X-ray diffraction (XRD)
The influence of heating temperature on the crystalline structure of the
zirconium oxide coatings was investigated with X-ray diffraction. Samples were
coated with zirconium propoxide and acetyl acetone as stabilizing agent and
heated at 573, 673, 773 and 873 K for one hour.
4.1 Samples prepared with acetyl acetone
Fig.75 shows a comparison of X-ray diffraction measurements of two iron
samples coated with zirconium tetra-propoxide and acac after heating at 573
and 673 K, respectively. An inclination angle of omega = 3°, using a theta /2°
constant was applied. At 673 K the films reflect more crystalline ZrO2 in
tetragonal and monoclinic phases than for samples treated for two hours at 573
K. It is supposed that the phase transformation of crystalline (tetragonal-
monoclinic) zirconium oxide occurs at heating temperatures between 673-773 K
[56]. This explains the appearance of the Kα reflex of ZrO2 at approximately 28°
for the sample treated at 673 K. This reflex is hardly visible in the diffractogram
of the 573 K sample because this temperature is too low to form greater
amounts of crystalline phases.

116
Fig. 75 XRD comparison at omega ω = 3° of coated iron samples heated
at 573 and 673 K for 1 h in furnace
Both graphs shows also iron and iron oxide reflexes. At 573 K only α-Fe2O3
could be observed. When the temperature is further increased up to 673 K an
additional phase of magnetite (Fe3O4) can be observed. The appearance of Fe
reflexes results from X-ray reflections at deeper layers of the coating and the
substrate surface.
ZrO2
Fe
Fe
2O
3
Fe
2O
3
573 K
ZrO2
ZrO2
Fe
Fe2O3
Fe3O4
673 K
Inte
nsity /
cp
s
Inte
nsity /
cp
s

117
4.2 ZrO2-acac samples heated at higher temperatures
Fig. 76 XRD scans at incidence angles omega = 0.1°; 0.3°; 1°; 2° and 3° of
ZrO2-coatings after heating at 673 K
XRD measurements were made at different incidence angles to obtain
information about the crystalline structure at different depths in the coating
material. Higher incidence angles represent reflexes from deeper film regions.
As can be seen in Fig.76 with an inclination angle of omega ZrO2
reflexes appear from the upper few nanometres of the coating surface. This
reflex is clearly detectable at approximately 28° through the Kα reflex of
zirconium oxide. At greater depths additional ZrO2 reflexes with less intensity
can be observed at 51 and 52° degree. However the clearest indication of
crystalline phases corresponds to the high intensity reflex. Iron oxide phase’s
magnetite and hematite (Fe3O4, Fe2O3) appear at the same inclination angle. It
can be seen in the diffractogram that in deeper film regions (120 – 160 nm) at
the interface zone both reflexes from iron / iron oxide and zirconium oxide
appear together. This might indicate the formation of a mixed layer consisting of
iron oxide and zirconium oxide as well.
2 (120 nm) Fe
0.1 (2 nm)
0.3 (nm)
1 (10 nm)
3 (160 nm)
ZrO
2 te
trago
nal/m
onoclin
ic
ZrO
2
tetr
ago
na
l/m
onoclin
ic
Mix
ed
oxid
e
laye
r

118
To verify whether these oxide reflexes originate from the same depth the
relative position of this layer was calculated for a coated iron sample treated at
673 K in relation to the Kα reflex of ZrO2 and Fe2O3 reflected at different
inclination angles [13]. This means that the thickness was estimated with X-ray
diffraction by the penetration depth of photons with an energy of 8000 eV as a
function of the incidence angle ω. Below a certain angle of incidence only the
reflections of the film were visible. The mixed oxide layer is located
approximately between 4 nm and 120 nm from the coating surface as indicated
in with the arrow in fig. 76. The formation of the mixed interlayer is most likely a
product of the diffusion processes between the coating material and the bulk
iron substrate during the heating procedure. It is supposed that the mixed layer
consists of both crystalline and amorphous phases of zirconium and iron oxide
which will be described in the next chapter.
Fig. 77 XRD of uncoated iron measured at = 3 and heated at 873 K
In addition supplementary X-ray diffraction measurements were carried out for
samples treated at higher oven temperatures between 673–873 K. This
experiment was made without coating to investigate the behaviour of growth
ω = 0.3°
Fe3O
4
Fe3O
4
Fe2O
3
Fe2O
3
Fe2O
3
Fe2O
3
Fe2O
3
Fe3O
4
Fe2O
3
ω = 0.5°
ω = 0.8°
ω = 1.5°
ω = 3°
Fe2O
3
Fe2O
3
Fe2O
3
Fe2O
3
Fe2O
3
Fe2O
3
Fe2O
3
Fe3O
4
Fe2O
3
Fe2O
3
Fe2O
3
Fe3O
4
Fe3O
4

119
and possible influence of iron oxides on the film properties. Samples showed a
formation of more iron oxide reflexes of hematite and magnetite as shown in
fig.78. The increase of the intensity of the signal of iron oxide can be related to
increased oxidation. These intensities are proportional to the heating
temperature and to the inclination angle omega as can be observed in fig. 77.
Likewise new reflexes appear with increases of the incidence angle. They are
localized in a major proportion in deeper layers and are related to magnetite
(Fe3O4). However, hematite (Fe2O3) is found throughout the sample. This effect
can increase the oxide thickness as observed from removing the samples from
the oven. This effect is also present in coated samples as shown in fig.76.
When the samples were heated up to 873 K, defects on the edges with some
stress-related cracks were observed. These can be undesirable for low
temperature application.
4.3 Samples prepared with Hydroxypropyl cellulose
As described in the last chapter, the use of a stabilizer in the sol preparation
has a major effect on the crystalline structure of the coating even at lower
temperature [24]. Since HPC is known to promote the formation of crystalline
nanoparticles, further investigations should prove whether any of such
structures can be found in the prepared zirconium oxide coatings and whether
they have a beneficial effect on the protective properties of the HPC samples
with lowest porosity.
4.3.1 Effect of HPC concentration
Fig. 78 shows X-ray diffraction measurements of iron samples coated with
zirconium propoxide and HPC as stabilizing agent. The concentration of HPC
was varied from 0.002 to 0.008 g/l ethanol and the heating temperature was
673 K. All samples were measured at an incidence angle of = 3° and for HPC
= 0.004 g/l inclination angle = 5° was also used to increases the detection
range. The reflexes of crystalline (ZrO2) were identified according to the crystal
data base from the software and literature as monoclinic (a: 5.15070; b:
5.20280; c: 5.31560, β: 99.196; S.G.:P21/a) and cubic (a: 5.106=b=c)

120
[81,85,101]. These reflexes can be observed in fig.78 around 28° and are
indicated with arrows.
Fig. 78 Comparison of HPC (80,000 g/mol) samples measured at
= 3° and heated at 673K
It can be seen that even a small variation of the stabilizer concentration
specifically with HPC = 0.004 g/l has a significant effect on the crystalline
structure of the coating. ZrO2 reflexes for the HPC concentrations 0.002; 0.006
and 0.008 g/l can be easily identified. So the stabilizing agent promotes the
formation of crystalline structure at lower heating temperatures [39].
There is one sample coated with a HPC concentration of 0.004 g/l that does not
show the peak corresponding to the zirconium oxide phase at 28°. Possible
explanations for this behavior are: a) the film structure is completely
amorphous; b) the iron and iron oxide reflexes overlap and cover the reflexes of
zirconium oxide; c) the texture or amount of crystalline material is too low for
detection and d) the crystalline particles have a very small size and appear to
be polycrystalline and undetectable by the X-ray diffraction measurements. In
ZrO
2 R
efl
ex
No
ZrO
2 R
efl
ex
Fe3O
4 Fe
3O
4 Fe
2O
3
Fe3O
4
Fe3O
4
Fe e
Fe2O
3
Fe2O
3 Fe2O
3
Fe2O
3
Fe e
Fe e
Fe2O
3

121
order to find an appropriate explanation to this question, TEM measurements
were made and they will be discussed in the following chapter.
Fig. 79 Comparison of coated iron heated at 673 K (HPC = 0.004 g/l; 80
MW measured at = 5° and = 0.8°
Fig.79 shows X-ray diffraction scans for two iron samples coated with zirconium
n-propoxide and HPC as stabilizing agent. The samples were measured at
incidence angles of = 5° and = 0.8° in order to detect zirconium oxide
reflexes from different depths of the coating. However, no reflexes of crystalline
zirconium oxide could be detected, neither in the upper region of the coating nor
at the interface, close to the substrate. Only peaks corresponding to the phases
Fe and Fe2O3 and Fe3O4 could be detected. This result supports the assumption
that a HPC concentration of 0.004 g per liter of ethanol changes the internal
structure of the coating material significantly. Further TEM measurements were
carried out to reveal whether ZrO2 is either amorphous or nanocrystalline.
No
ZrO
2 R
efl
ex

122
Fig. 80 XRD comparison for coated iron heated at 573 K (HPC = 0.004 g/l; 80
MW measured at = 0.05°; 0.8° and 3°
In order to investigate the effect of HPC in samples heated at a lower
temperature like 573 K, XRD scans were made using three different incidence
angles as shown in fig. 80. The higher intensities are found at an incidence
angle of = 0.5° but only the phases Fe; Fe2O3 and Fe3O4 are detected. At this
incidence angle the signals are received from a few nanometers of the coating
surface and through the other two angles the information is received from
deeper layers. However, no reflexes of ZrO2 are detected at this heating
temperature.
Fe3O
4
Fe3O
4
Fe e
Fe2O
3
Fe
Fe2O
3
Fe e
Fe e
No
ZrO
2 R
efl
ex

123
4.3.2 Effect of heating temperature
Fig. 81 XRD of coated iron heated at different temperatures and
measured at = 3°
Fig. 81 shows X-ray diffraction graphics for coated samples with zirconium
propoxide together with and without HPC as stabilizer. They were heated at
different temperatures in a furnace to investigate the effect of HPC and
temperature on the crystalline structure. According to the fig.81 a similarity for
all samples can be observed: no ZrO2 reflexes are detected between 28-30°
where the signal of ZrO2 K-α always appears as observed in the case of acetyl
acetone. Although in some cases the temperature is higher than 573 K for
coated samples and heated at 673 and 773 K ZrO2 crystalline is not detectable
with X-ray diffraction.
No Z
rO2 R
eflex

124
4.4 Comparison HPC-acac coatings
Fig. 82 Comparison between HPC, acac and no stabilized coatings
For better understanding the effect of the stabilizers a comparison of samples
prepared with HPC, acac and a sample prepared without stabilizer is shown in
fig. 82. All samples were heated at 673 K. The curve of acetyl acetone shows
the crystalline phase of ZrO2 around 28° corresponding to monoclinic and/or
tetragonal as described above. However, in the case of HPC no reflexes of
zirconium oxide crystalline have been detected.
On the other hand, the fact that the sample treated without HPC does not show
crystalline ZrO2 is probably related to the instability of the precursor zirconium
propoxide during the polycondensation phase. Because of the absence of a
stabilizer the phase transformation from amorphous to crystalline can not take
place at low temperatures [56]. It is known that during the sol-gel process in the
gelation and polycondensation stages the formation of the final structure begins
and will be finalized during the heating step. However, zirconium materials
require higher temperatures as 1443 K and 2643 K to reach crystalline phases,
like tetragonal and cubic, respectively. The monoclinic phase is considered the
low-temperature phase of stabilized zirconium oxide produced by displacive
transformation of the tetragonal form between 1273-1473 K [56]. Usually higher
Fe2O
3
ZrO
2 R
efle
x
Fe e
Fe
2O
3
Fe
3O
4
Fe
2O
3
Fe
e F
e2O
3
No Z
rO2 R
eflex
Fe
3O
4
Fe
3O
4
Fe
2O
3
Fe
2O
3
Fe
3O
4
Fe
e
Fe
3O
4
Fe
2O
3
Fe
2O
3
Fe
e
Fe
e
Fe
2O
3
Fe
2O
3
Fe
3O
4
Fe
2O
3

125
temperatures are necessary to reach crystalline structures; however, the use of
stabilizing agents during the sol-gel process reduces the transition temperature
allowing synthesis of crystals at lower temperatures [39]. In the case of HPC the
double function with hydrophilic and hydrophobic parts stabilizes the zirconium
oxide particles in nanocrystalline structures that could interferes its detection via
XRD [31,32]
5. SIMS analysis
SIMS measurements were performed to obtain a more detailed view on the
position of different layers and structures inside the coating material. The
distribution of elements was investigated by means of depth profiles of the
coated samples.
5.1 Zirconium oxide coatings prepared with acac
Fig. 83 shows a depth profile for a sample prepared with acetyl acetone as
stabilizer. The molar ratio of precursor solution to acetyl acetone was 1:1.5. As
shown in the graph, the expected elements of the coating material are all
present in the film. An abrupt rise of iron intensity can be observed between 400
and 500 s sputter time that can be attributed to the formation of α-Fe2O3 which
was found in the XRD-analysis. At the same time the intensity of zirconium
decreases and remains constant together with iron until the substrate is
reached after 1500 s. Obviously, the lower part of the coating contains a high
amount of iron which wouldn’t be expected from a homogeneous ZrO2 film.
Diffusion processes during the heating procedure between substrate and
coating material must be responsible for the formation of this mixed layer that
consists of iron oxide and zirconium oxide, as well.

126
Fig. 83 Depth profile of acac-coated iron sample heated at 573 K for 1 h
As revealed by XRD, at 573 K the zirconium oxide layer remains amorphous,
because the transition temperature has not been reached yet. There is also a
certain amount of remaining organic components present as can be seen from
the intensity of the C12 curve.
5.1.1 Effect of time and heating temperature
To get a better understanding of the mechanisms that are responsible for the
formation of the mixed oxide layer the influence of heating temperature and time
was further investigated with SIMS.
Fig. 84 shows the depth profile of a sample that has been treated in the same
way as the one discussed in fig. 83 except for the heating time which was
increased for another hour. The substrate is now reached after 2000 s
compared to 1500 s afer heating for one hour.
Apparently, the thickness of the coating has increased but since the thickness
was the same for both samples prior to the heating step, this effect must be a
result of increased diffusion in either direction. This is supported by the
thickness of the mixed oxide layer which has also expanded and ranges now up
Mixed oxide layer
Substrate
eee
Coating surface

127
to 1700 seconds of sputtering time. Correspondingly, the upper ZrO2 region is
reduced to almost the half of the thickness as in fig.83, the rise of iron intensity
now appears already after 300 s.
Fig. 84 Depth profile of acac-coated sample heated at 573 K for 2 h
Even a stronger effect than heating time can be found for the heating
temperature as displayed in fig. 85. After heating at 673 K for 1 hour the overall
film thickness seems to be the doubled compared to the 573 K sample (fig. 82).
It takes now 4000 s of sputter time to reach the bulk substrate material and the
mixed oxide layer has broadened further and expands now over almost the
whole coating thickness.
Mixed oxide layer
Substrate
Coating surface

128
Fig. 85 Depth profile of coated iron heated at 673 K for 1h in furnace
At 673 K the diffusion is much more distinctive than after the increase of heating
time and the mixed oxide layer which contains a high amount of crystalline ZrO2
now expands deeper into the bulk substrate material. According to the
electrochemical results of the 673 K samples it appears that the formation of the
mixed layer plays a major role in the observed decrease of film porosity (see
chapter 1 Results).
Mixed oxide layer
Substrate
Coating surface

129
5.1.2 Effect of acetyl acetone concentration
Fig. 86 SIMS profiles of coated samples with different molar ratios of acetyl
acetone after heat treatment at 573K: a) acac:0 b) acac:0.5 c) acac:1.0 d)
acac:1.2 e) acac:1.5 [24]
Fig.86 shows a series of SIMS depth profiles of samples with increasing acetyl
acetone concentration in relation to the precursor zirconium n-propoxide. Only
the intensities of the relevant elements of coating and substrate are shown:
Mixed oxide layer
Mixed oxide layer
Mixed oxide layer
Mixed oxide layer

130
Zr90, Fe56 and O16. It can be seen that the overall film thickness depends
strongly on the acetylacetone concentration, as the sputter time until the
substrate is reached decreases with rising acac-concentration. This effect was
also verified with profilometry thickness measurements.
The thickness of the final coating decreases from 200 ±10 nm for samples
prepared without acac down to 70 ±10 nm for samples prepared with a molar
ratio precursor/acac of 1:1. More or less addition of acetyl acetone than 1:1 can
contribute either to the formation of a [Zr(OiPr)(acac)3] complex without trans-
stabilization or the regression to the instable precursor Zr(OnPr)4 and a
destabilization of the film structure will be inevitable as described in [36,102].
The formation of these instable compounds could affect the reactivity and
evaporation rate of the constituents connected to the metal atoms during the
heating process leading to a thinner or thicker structure. Interestingly the
sample without acetyl acetone shows the smallest mixed oxide layer and the
highest overall film thickness but also the highest porosity as the
electrochemical experiments revealed.
Apart from the film thickness the general structure of the coating is the same for
all samples: a zirconium oxide layer at the surface, followed by a mixed layer of
zirconium and iron oxide and finally the iron substrate. The rise of the iron
intensity shortly before the zirconium intensity drop is another indication for the
presence of the mixed oxide layer, because the higher concentration of oxygen
in this layer increases the number of secondary ions of iron, leading to a higher
signal.
Similar to the samples discussed before the pure zirconium oxide part
decreases continuously whereas the mixed oxide layer grows with increasing
acetyl acetone concentration.

131
Fig. 87 Thickness ratios of d(ZrO) / d(coating) and d(mixed oxide) / d(coating)
depending on the acetyl acetone content [24]
In fig. 87 the part of each layer of the overall coating thickness is displayed for
better visualization. The thickness ratios were calculated from the ratios of
sputter times. It can be clearly seen that the part of the mixed oxide layer
increases with higher stabilizer concentration in the same way as the part of
pure zirconium oxide decreases. It is known that stabilizing agents can act as
chelating or bridging ligands and therefore their concentration determines the
number of substituents and reactive sites at the precursor molecule. Higher
concentrations promote monomeric precursors with a higher number of
substituents [33,103]. Obviously these stabilized precursor molecules lead to
film structures that offer a high mobility of zirconium, iron and oxygen during the
heating step and therefore the final coating contains an expanded layer of both
iron and zirconium oxide. If this mixed layer also contributes a low porosity then
one should expect the lowest current densities at higher acac-concentrations.
Unfortunately the decreasing film thickness that is found at higher acac-
amounts has a contrary effect on the porosity. Since thinner films usually
provide less protection than thicker films in the case of acac there should be an
optimum concentration at which both effects are in balance, leading to a
0.0
0.2
0.4
0.6
0.8
1.0
0.0 0.5 1.0 1.5 2.0
molar ratio acetylacetone vs. precursor
d(l
ay
er)
/ d
(co
ati
ng
)
ZrO
ZrO + FeO

132
minimum porosity. This behavior was exactly observed in the potentiodynamic
scans. Porosity decreased with increasing acac-concentration until a minimum
value at an acac/precursor ratio of 1:1. Further addition of stabilizer resulted in
higher porosities again.
5.2 Zirconium oxide coatings prepared with HPC
Samples prepared with HPC have shown a lower porosity than acac-films
according to the potentials scans. Therefore a significant difference in the film
structure and element composition compared to acac can be expected. For this
reason samples with different amounts of HPC were also investigated with
secondary ion mass spectrometry.
5.2.1 Effect of HPC concentration
Changes of the film structure in dependence on the HPC concentration with a
molecule mass of 80,000 g/mol were analyzed.
Fig. 88 SIMS depth profile of ZrO2 coating prepared with HPC = 0.002 g/l and
heated at 673 K

133
In fig. 88 the element distribution is shown for a coated iron sample prepared
with zirconium propoxide and 0.002 g/l of a HPC (80,000 g/mol) because this
molecule size showed the best protective properties. The graph looks similar to
the acac depth profile, with increased iron/zirconium intensities in the interface
region between coating and substrate which are probably a result of increased
diffusion during the heating step. Carbon is also observed and can be attributed
to remaining polymer fragments of HPC which are still present in small portions
inside the coating.
An iron sample coated with zirconium propoxide (0.1M) and HPC = 0.004 g/l,
heated at 673 K is shown in fig. 89.
.
Fig. 89 SIMS depth profile of iron sample coated with ZrO2 (0.1M)-HPC
(0.004 g/l) and heated at 673K
The intensities of zirconium (Zr90) and zirconium oxide (Zr90O16) are very low
in the upper coating region until 2000 s of sputter time. Instead the mixed oxide
layer seems to extend over a much wider range far beyond the interface zone.
High intensities for both zirconium and iron are now found between 1200 and
3800 s before the iron substrate is reached around 4000 s.

134
Fig. 90 SIMS depth profile for iron sample coated with zirconium propoxide-
HPC = 0.006 g/l and heated at 673 K
The sample coated with 0.006 g/l HPC (fig. 90) looks very similar to the 0.002
g/l sample (fig. 88). There is a small layer of more or less pure zirconium oxide
at the top of the coating then the Zr-intensity drops and rises again in the region
close to the phase boundary between substrate and coating. Although the
mixed oxide layer appears directly after the thin layer of zirconium oxide, higher
concentrations of zirconium and iron are only found in the interface region,
similar to the 0.002 g/l sample.

135
Fig. 91 SIMS depth profile for iron sample coated with ZrO2-basis-
HPC = 0.008 g/l and heated at 673K
The 0.008 g/l sample looks alsmot identical in fig. 91. Again there is a small
layer of zirconium oxide, followed by a mixed phase with lower zirconium
concentration at the beginning of the mixed layer and high concentrations of
iron and zirconium in the interface region.
It appears that the correlation between HPC-concentration and extension of the
mixed oxide layer is not as linear as in the case of acac. Also a significant
dependence of film thickness on the stabilizer amount cannot be found for HPC.
Instead the structure changes at a specific HPC/precursor ratio. At this ratio the
steric control of the HPC component seems to direct the degree and shape of
network formation in a way that promotes the growth of an expanded mixed
oxide layer. The corresponding potential scans showed that the lowest film
porosity is achieved at exactly the same HPC-concentration of 0.004 g/l that
yields the extended mixed oxide layer. Since a similar observation was already
found for acac-coated samples this is a strong indication that the formation of a
mixed oxide phase is also responsible for the low-porous nature of the coating.

136
5.2.2 Effect of heating temperature
Iron samples were prepared at three temperatures 573, 673 and 773 K in order
to investigate the effect of temperature on film structure. Fig. 92 shows a depth
profile of iron sample coated with ZrO2-basis-HPC heated at 573 K in a furnace
for one hour. The film profile indicates a coating formed by a surface of
zirconium oxide which thickness reaches 1000 s follows by the mixed oxide
layer (zirconium, oxygen and iron) with a thickness of 1500 s and finally the iron
substrate.
Fig. 92 SIMS depth profile for coated sample with ZrO2-basis –
HPC 0.004 g/l and heated at 573 K
As can be observed this is the typical structure for zirconium oxide coatings on
iron revealed also for samples treated with acetyl acetone. At 573 K the coating
structure appears to be amorphous according to the X-ray results.

137
Fig. 93 SIMS profile for iron sample coated with ZrO2-HPC = 0.004 g/l
treated at 673 K
Fig. 93 displays a depth profile for coated iron treated at 673 K. The structure
shows a thicker mixed oxide layer (3500 s) about twice than for the sample
heated at 573 K.
However, the intensities of Zr90 and Zr90O16 arise until 1500 s remaining
constant until the substrate appears. This behavior has been not observed for
the sample treated at 573 K. An increase of the temperature, result in a thicker
mixed oxide layer with significant reduction of the porosity. High diffusion of
zirconium into deeper layer and iron oxide towards coating surface is observed.
The steric effect of HPC could also influence part of this structure in connection
with the temperature increases. During this process the oxygen-metal-oxygen
bridges distance will be reduced, allowing easily particles diffusion which remain
adhered on the substrate surface.
To verify the correlation between thickness of the mixed oxide layer and
temperature effect, a temperature of 773 K was tested and the coating depth
profile is shown in fig. 94.
Mixed oxide layer

138
Fig. 94 SIMS depth profile of iron sample coated with
ZrO2-basis-HPC = 0.004 g/l heated at 773 K
As can be clearly seen in the graph the effect of diffusion is much more
dominant at the higher temperature of 773 K. Not only the mixed layer thickness
has increased, but also the overall film thickness has growth by factor 3.
However, this increase of film thickness has not significantly contributed to the
reduction of porosity compared to the 673 K samples.

139
5.2.3 Effect of HPC molar weight
Fig. 95 Depth profile of ZrO2 coating prepared with HPC=0.004 g/l (100MW)
and heated at 673 K
Coatings prepared at this concentration but with a higher HPC molar weight
show a similarity in the structure: the ZrO2 intensity increases from the coating
surface toward the mixed oxide layer with a major deposit localized direct onto
substrate surface as shown in fig.95. A higher molar weight than 80,000 g/mol
does not enhance the protection ability of the film much more than HPC with
lower MW, however, the film structure showed in this graph reveals few
changes on the thickness and element distribution of the mixed oxide layer.
This result is an effect of the length of the polymeric molecules because of
lower steric stabilization and flocculation of particles during the
polycondensation phase [4,33,34,104].
Fig.96 shows a depth profile for coatings prepared with a HPC molecule of
higher molar weight (370,000 g/mol).

140
Fig. 96 Depth profile of a ZrO2 coating prepared
with HPC = 0.004 g/l (370MW) and heated at 673 K
The graph shows the same behavior of the other molar weight molecules
prepared at the same HPC concentration and heated at the same temperature.
However, in this case a major presence of ZrO2 can be observed on the coating
surface. That probably is the result of the bigger HPC molecule that does not
contribute in high manner to the diffusion of Zr into inner layers. It was observed
in electrochemical porosity investigation that higher molar weights of HPC have
a contrary effect and do actually increase the film porosity. It is known that big
polymeric molecules are not desirable for steric stabilization because they can
promote particle flocculation instead of dispersion [34].
6. Crystalline analysis with TEM
It was found in the XRD analysis of HPC coatings that the crystalline structure
changed at a certain concentration of the stabilizing agent. At 673 K and above
all samples showed a crystalline phase of zirconium oxide except for a HPC
concentration of 0.004 g/l. Since HPC is known to promote the formation of
nanocrystalline particles which can be too small to be detected by XRD this
might be a reasonable explanation for the exceptional structure in this case.
Finally the verification of the coatings crystalline structure was done with TEM

141
measurements. Due to the complexity of sample preparation and availability of
TEM equipment only the most relevant samples have been analyzed. HPC
samples were prepared with a concentration of 0.004 g/l (molar weight of
80.000 g/mol) and heated at 673 K for one hour. Another sample was prepared
with acetylacetone as stabilizing agent under the same conditions with a
precursor/acac ratio of 1:1.
6.1 TEM measurements of ZrO2-acac
Fig. 97 High resolution TEM image of iron oxide crystal of ZrO2-basis-acac
coating heated at 673 K [44]
Fig. 97 shows a crystalline iron oxide particle with a size of 170 nm
approximately. This high resolution image was obtained by TEM measurements
of small pieces of the film. This part of the coating is related to the mixed oxide
layer revealed in the SIMS depth profile for zirconium oxide coatings prepared
with acetyl acetone as stabilizing or chelating agent. The presence of these iron
oxide particles also proves the strong diffusion effects that appear during the
heating procedure.
50 nm

142
Fig. 98 Crystalline ZrO2 particle received from TEM measurement of a ZrO2-
acac coated sample heated at 673 K [44]
In the fig.98 a crystalline zirconium oxide particle is shown. The size of the
particle is around 70 nm. According to EDX scans made in this region the K-α
signal of the elements zirconium and oxygen were detected. That proves the
results of the X-ray diffraction, where monoclinic and tetragonal ZrO2 phases
have been reflected. From the shape and orientation of this crystal it could be
identified as monoclinic ZrO2. This high resolution TEM image is also a part of
the mixed oxide layer which is formed after heating the coating at 673 K.
6.2 TEM analysis of ZrO2-HPC
Fig.99 shows the electron diffraction map of a zirconium oxide coating prepared
with 0.004 g/l HPC and heated at 673 K for one hour.

143
Fig. 99 Electron pattern of mixed oxide layer in a ZrO2/HPC coated
sample (0.004 g/l)
The image of the mixed oxide layer reveals the existence of dispersed
crystallites immersed in an amorphous region that consists of zirconium, iron
and oxygen, as revealed by EDX analysis. The small black points are related to
the different reflexes received from the electrons localized in determined
crystalline particles.
The size of the black points could be an indication of the distribution and size of
the crystals in the mixed oxide layer. For better understanding detailed high
resolution images of this region have been taken.
(b) (b)

144
Fig.100 High resolution TEM image of a) amorphous phase of mixed oxide layer
b) dispersed ZrO2 nanocrystal c) enlarged section of the amorphous mixed layer
of ZrO2-FeOx with finely immersed nanocrystalline ZrO2 particles [44]. In the
(b)
(a)
ZrO2 nanocrystalline
particle
(c)

145
upper right: Fourier-filtered image of the selected region; lower right: diffraction
pattern of monoclinic ZrO2 particle with [112] orientation.
In fig.100 high resolution TEM images of ZrO2/HPC coatings are shown. Picture
a) is an image of the mixed oxide layer. It can be seen that two regions can be
distinguished inside the mixed layer as indicated with arrows. One part is
formed by an amorphous layer on the boundaries. EDX made on this region
revealed the presence of iron, zirconium and oxygen. However, other regions
can be found with agglomerations of nanocrystalline zirconium oxide particles
as shown in the figure. Therefore the mixed oxide layer of coatings prepared
with 0.004 g/l HPC can be considered as an amorphous region with immersed
nanocrystalline ZrO2 particles. According to the SIMS results this interlayer
shows an increased zirconium oxide concentration in the near substrate surface
region. This is most likely due to the steric effect of HPC which promotes the
formation of a network structure that allows a high mobility of zirconium and iron
ions, as well [44].
According to the steric stabilization of HPC the bonding distance between the
zirconium atoms and the adjacent oxygen atoms is reduced resulting in the
formation of nanocrystalline particles [34,105,106].
Image b) is a magnification of a nanocrystalline zirconium oxide particle
immersed in the amorphous layer. In picture c) of fig.83 the results of crystal
structure analysis can be seen. On the upper right-hand side the crystal
orientation is shown as a Fourier-filtered image and in the lower right corner as
an electron pattern. The analysis of this pattern with Gatan DigitalMicrograph
software and verification with the PIES program allowed the identification of the
particle’s crystal structure as monoclinic ZrO2 with a [112] orientation [44]. The
size of this crystal is approximately 10 nm. Further XRD results for other HPC
concentrations showed reflexes of cubic phase as well.

146
IV. Corrosion characterization
Potential scans already proved that it is possible to reduce the film porosity of
zirconium oxide coatings significantly with the right choice of stabilizing agents.
Therefore additional electrochemical corrosion tests were done with acac- and
HPC-stabilized coatings to investigate their actual corrosion resistance in
different aqueous media. Samples with both stabilizers were prepared under the
optimum conditions for the formation of low-porous films as they were found
during the potential scan experiments. Acetylacetone samples were prepared
with a stabilizer/precursor ratio of 1:1 and heated at 673 K. HPC-samples were
deposited from a sol containing 0.004 g HPC per liter ethanol. The overall
corrosion performance was investigated with linear scans and electrochemical
impedance spectroscopy in a mild acetate-buffer as it was used for porosity
evaluation and in a 0.05 M sodium chloride solution, as well. The results are
discussed in the following chapter.
1. Linear polarization
1.1 Zirconium oxide coatings with acac
Fig.101 Linear polarization curves of uncoated iron and ZrO2-acac sample
measured in NaCl = 0.05 M

147
A linear polarization resistance curve of zirconium oxide–acac coating is shown
in fig.101. In comparison to the uncoated sample, an anodic shift of the curve
reflects the tendency of good corrosion protection. The slope of the curve allows
the calculation of the polarization resistance (Rp) and with the values of
corrosion current (Icorr) and corrosion potential (Ecorr), the corrosion rate (k) can
be calculated from equation (29). Higher inclinations mean increased corrosion
resistance [79,107]. According to the software analysis the values of Rp and k
for uncoated iron were: Rp = 699.7 Ohm and k = 0.11 millimeter per year
(mmpy). In the case of ZrO2-acac coated samples the resistance was increased
to: Rp = 2265.6 Ohm and the corrosion rate was reduced down to k = 0.035
mmpy. This means an improvement of polarization resistance and corrosion
rate by factor 3. This result matches the observations of the porosity evaluation.
1.2 Zirconium oxide coatings with HPC
Fig.102 Linear polarization of uncoated and ZrO2-HPC coating measured in
NaCl = 0.05 M
This graph displays a linear polarization comparison of uncoated iron and a
coated sample prepared with HPC after heating at 673 K. In comparison with
the uncoated iron the ZrO2-HPC samples shows an almost vertical inclination
and a strong OCP-shift towards anodic direction, which both indicate a very

148
good corrosion resistance. The polarization resistances and corrosion rates
calculated from the graphs are: uncoated iron: Rp = 699.7 Ohm and k = 0.10
mmpy; ZrO2-HPC: Rp = 140712.4 Ohm and k = 0.00052 mmpy. It can be seen
that the polarization resistance of the coated sample was even further increased
when HPC was chosen as stabilizing agent. The corrosion rate was reduced by
three orders of magnitude and the polarization resistance raised almost 4
orders of magnitude. The strong improvement of corrosion resistance can be
again correlated with the very low average porosity of HPC films.
2. Electrochemical impedance spectroscopy
In analogy to the porosity study, impedance measurements were made in the
same buffer solution of sodium acetate/ acetic acid and additional samples have
been submerged in 0.1 M and 0.05 M NaCl solution.
2.1 Coatings in buffer sodium acetate/acetic acid
Fig. 103 Nyquist diagram of uncoated iron and ZrO2-HPC coating measured in
buffer solution of sodium acetate/acetic acid (0.1/0.01)
In fig.103 a typical semi circle in the complex plane plot (Nyquist plot) for
uncoated iron is observed from 20 to approximately 80 Ohm. According to
(high frequency)
(low frequency)

149
literature this shape corresponds to a capacitive reactance [79]. This means
that the polarity alternates so rapidly that the EDL does not change its
composition and that not impede corrosion of the metal surface and the
uncompensated solution resistance is the only component that contributes to
the resistance. However, towards low frequency range, the semi circle tends to
open in a straight line with a slope of 45°. This portion of line can be related to
Warburg diffusion that takes place at low frequency. Thereby, a diffusion of
active species occurs between the flat working electrode and the electrolyte.
The polarization is due to the combination of kinetic and diffusion processes.
The actual polarization resistance can be calculated from the difference
between the low frequency and the high frequency end of the semi-circle. Other
physical explanation for the 45° line can be attached to modifications of the
sample surface which probably was covered with a thin passive layer product of
iron oxide compounds.
The curve related to the ZrO2-HPC coating shows negative impedance values
at high frequencies. This is a result of the charge resistance of the EDL caused
by the effect of an induction generated by the applied AC voltage. Adsorption or
desorption reactions of surface active species on the metal surface can also
produce induction. The induction can appear both at low or high frequencies
[46]. As can be seen the resistance to charge is reflected in a steep line which
indicates a high impedance magnitude. The upper end of the Y-axis is not
shown to avoid compression of the uncoated-iron-plot. The high impedance of
the HPC-sample can be much better visualized in the Bode plot of fig. 106.

150
Fig. 104 Bode Plot of the samples described in fig.103
Both axes are plotted in common logarithm. At high frequency range only the
uncompensated electrolyte contributes to the resistance. However, as soon as
the frequency decreases the overall corrosion resistance increases too,
because more elements offer additional resistance to the applied voltage such
as the corrosion resistance (Rcorr) and coating resistance (Rcoat). The orientation
of the uncoated iron line at low frequency is related to the Warburg diffusion
shown in Nyquist diagram. Likewise the invariability of coated sample curve
indicates very few reactions or no oxidation changes on the coating surface.
The small peak at 0.1 Hz can be related to noise interference with the
equipment. The corrosion resistance was increased by a high magnitude in
comparison with the uncoated iron and can be obtained by the intersection of
the curve with the Y-axis at low frequency (approximately 1x10⁶ Ohm/cm-2).
This result is in agreement with the corresponding potential scans of HPC-
samples.

151
2.2 Coatings in NaCl = 0.05 M
Fig. 105 Nyquist diagram of ZrO2-acac, ZrO2-HPC and uncoated iron measured
in NaCl = 0.05 M
Further impedance measurements were done in a more aggressive 0.05 M
NaCl solution which are shown in fig.105 and 106. The Nyquist diagram
displays a typical semi circle for uncoated iron, which indicates that corrosion on
the sample surface is present and only the uncompensated electrolyte
resistance acts as corrosion resistance. In the case of the acetyl acetone-ZrO2
coating an increase of the corrosion resistance can be observed by the
increasing radius of the large semi circle. In the real impedance magnitude the
polarization resistance of the acac-ZrO2 coating is around 1600 Ohm/cm-2. In
the case of ZrO2-HPC coating a large straight line with almost vertical slopes
found that indicates very high impedance. The value of the polarization
resistance is around 1x10⁶ Ohm, approximately. Obviously the low porosity
observed in the potential scans is responsible for the better protection
performance of the HPC-coatings.

152
Fig. 106 Corresponding Bode plot magnitude graphic of samples described in
fig. 105
The corresponding Bode plot is shown in fig.106. The curves of uncoated iron
and ZrO2-acac remain constant at the low-frequency end which indicates that
not structural changes occurr on the sample surface. However, above 1 Hz the
curves show a constant slope due to changes on the surface like film
delamination or corrosion processes at the exposed area. In the case of ZrO2-
HPC the curve appears as a straight line with negative slope. The increase of
the corrosion resistance from higher frequencies towards lower frequencies
indicates a relatively stable film structure. The corrosion resistance is in the
range close to 1x10⁶ Ohm/cm2 which is very high compared to the acac sample
and even more compared to uncoated iron. A low frequency is blocked by the
corrosion and coating resistance. In the middle frequencies range EDL and
electrolyte offers also resistance, that way the corrosion resistance at low
frequency is the sum of all resistances [46,49]. At high frequency range the
coating and corrosion resistance and EDL as well look like they do not exist,
reflecting very low resistance because the impedance is dominated by the
capacitive element of the uncompensated electrolyte [46]. The linear scan
experiments and the electrochemical impedance tests both support the results
from electrochemical porosity evaluation. Zirconium oxide coatings prepared
with acetylacetone already show good corrosion protection but it can be even

153
further improved when the precursor solution is stabilized with HPC. Corrosion
tests and porosity evaluation show a very high corrosion resistance which is
due to very low average film porosity.

154
Summary
Thin zirconium oxide coatings have been successfully deposited on iron
substrates via sol-gel route at low temperature. Electrochemical investigations
of these films have shown a significant reduction of the Fe substrate dissolution
current density, indicating a good protection ability of the coating material. It
was found that the film porosity which is a crucial parameter for good corrosion
protection can be successfully reduced by the use of the stabilzing agents
acetyl acetone and HPC. In the case of acetyl acetone the dissolution current
densities could be reduced by 3 orders of magnitude compared to the uncoated
metal substrate. With the use of HPC a redution by 5 orders of magnitude could
be achieved. Additional corrosion test with linear scans and electrochemical
impedance spectrometry verified the good protection ability of the stabilized
zirconium oxide coatings.
Structure characterization of the deposited films revealed common parameters
for both stabilizing agents that promote the formation of low-porous film
structures, although the individual mechanisms are quite different for
acetylacetone and HPC.
In both cases there exists an optimum ratio between the amount of stabilizing
agent and alkoxide precursor that leads to the formation of a film structure with
a minimum porosity. For acac-stabilzed coatings there are two contrary effects
that determine the optimum ratio. With increasing acac-concentration on the
one hand the film porosity is lowered while on the other hand the overall film
thickness is also reduced which weakens the benefit of reduced porosity. This
dependence of film thickness on stabilizer concentration was not found for HPC.
It could be shown that at certain stabilizer/precursor ratios a mixed phase of
zirconium oxide and iron oxide is formed in the coating which is responsible for
the reduction of film porosity. The formation of this phase can be attributed to
the presence of the stabilizing agents which control the reactive sites.
A crystalline structure was achieved in ZrO2-acac coatings, but ZrO2-HPC films
showed at the optimum concentration an amorphous mixed oxide layer
containing nanocrystalline ZrO2 particles. The correlation between growth of the
mixed oxide phase and decrease of dissolution current density suggests that it

155
is the mixed oxide phase with ZrO2 nanoparticles, initiated by the stabilizers,
that is responsible for the reduction of film porosity and the good protection
properties of the films.
It is well known that corrosion may occur along pores and cracks and also along
grain boundaries. A chemically stable low-porous amorphous coating, as
obtained unter the described circumstances, therefore offers a very effective
protection to the substrate.

156
References
1. J.J. Ebelmen, Ann, 57 (1846) 331.
2. M.A. Aegerter and M. Mennig, Sol-gel technologies for glass producers
and users, Kluwer Academic Publishers, (2004), Massachussetts, USA.
3. E.M. Rabinovich, in Sol-Gel Technology for Thin Films, Fibers, Performs,
Electronics and Speciality Shapes, L.C Klein, (1988), New Jersey, USA.
4. C.J. Brinker, G.W. Scherer, Sol-gel science: The physic and chemistry of
sol-gel processing, Academy Press, (1990), San Diego, USA.
5. V.G. Kessler, G.I. Spijksma, G.A. Seisenbaeva, S. Håkansson, D.H.A.
Blank, H.J.M. Bouwmeester, J. Sol-Gel Sci. Technol. 40 (2006) 163-179.
6. J. Livage, M. Henry and C. Sanchez, Sol-Gel Chemistry of Transition Metal
Oxides, Prog. Solid St. Chem., 18 [4] (1988), 259-342.
7. M. Chatry, M. Henry, M. In, C. Sanchez and J. Livage, The Role of
Complexing Ligands in the Formation of Non-Aggregated Nanoparticles in
Zirconia, J. Sol-Gel Scie. Technol., 1 (1994) 233-240.
8. R. Kreiter, M.D.A. Rietkerk, B.C. Bonekamp, H. M. van Veen, V.G.
Kessler, J. F. Vente, Sol–gel routes for microporeuse zirconium and
titania membranes, J. Sol-Gel Sci. Technol., 48, (2008), 203-211.
9. V. Baran, Hydroxyl ion as a ligand, Coordin. Chem. Rev., 6, (1971), 65-93.
10. H. Choi, S. H. Wang, Sol-gel-derived magnesium oxide precursor for thin-
film fabrication, Mater. Res. Soc. 15, (2000), 842-845.
11. N. Özer, Electrochemical properties of sol-gel deposited vanadium
pentoxide films, Thin Solid Films, 305, (1997), 80-87.
12. M. Yang, C. Zhou and D. Jiang, Comparison of different strategies to
realize highly reflective thin film coatings at 1064 nm, Infra. Phys.
Technol., 51, (2008), 572-575.

157
13. V. G. Kessler, G. A. Seisenbaeva, M. Unell and S. Håkansonn, Chemically
Triggered Biodelivery Using Metal-Organic Sol-Gel Synthesis, Angew.
Chem. Int. Ed., 47, (2008), 8506-8509.
14. E. Eisenbarth, D. Velten, M. Müller, R. Thull and J. Breme, Nanostructured
niobium oxide coatings influence osteoblast adhesion, J. Biomed. Mater.
Res. Part A, 79, (2006), 166-175.
15. R. Romero Pareja, R. López Ibáñez, F. Martín, J.R. Ramos-Barrado, D.
Leinen, Corrosion behaviour of zirconia barrier coatings on galvanized
steel, Surf. Coat. Technol, 200, (2006), 6606-6610.
16. H. Li, K. Liang, L. Mei, S. Gu, S. Wang, Oxidation protection of mild steel
by zirconia sol–gel coatings, Mater. Lett., 51, (2001), 320-324.
17. A. Nazeri, S.B Qadri, Alumina-stabilized zirconia coatings for high-
temperature protection of turbine blades, Surf. Coat. Technol., 86, (1996),
166-169.
18. F. Sittner, W. Ensinger, Ion permeability of amorphous hydrogen- and
fluorine-containing carbon films formed by plasma enhanced chemical
vapour deposition, Nuclear Instruments and Methods in Physics Research
Section B, 257, (2007), 737-740.
19. K. Bobzin, E. Lugscheider, M. Maes and P. Immich, Developing PVD
zirconium-oxide coatings for use of thixoforming of steel, Internat. J. of
Microstruct. and Mater. Proper., 3, (2008), 262 – 270.
20. A. Amadeh, B. Pahlevani and S. Heshmati-Manesh, Effects of rare earth
metal addition on surface morphology and corrosion resistance of hot-
dipped zinc coatings, Corr. Sci., 44, (2002), 2321- 2331.
21. S.G. Shyu, T.J. Smith, S. Baskaran and R.C. Buchanan in Better
Ceramics Through Chemistry III, eds. C.J. Brinker, D.E, Clark and D.R.
Ulrich, Mat. Res. Soc., (1988), 767.

158
22. P. T. Nguyen, Korrosionsschutz von Eisenwerkstoffen durch intrinsisch
leitfähige Polymere, Doctoral Thesis, Techn. Uni. Dresden, 2003,
Germany.
23. F. Sittner, W. Ensinger, Electrochemical investigation and characterization
of thin - film porosity, Thin Solid Films, 515, (2007), 4559-4564.
24. R. Ugas-Carrión, F. Sittner, C.J. Ochs, S. Flege, W. Ensinger,
Characterization of the porosity of thin zirconium oxide coatings prepared
at low temperatures, Thin Solid Films, 517 [6], (2009), 1967-1969.
25. M. L. Zheludkevich, I. Miranda Salvado and M.G.S. Ferreira, Sol-Gel
Coatings for Corrosion Protection, J. Mater. Chem., 15, (2005), 5099-
5111.
26. P. B. Kirk, M.J. Filiaggi, R.N.S. Sodhi, R. M. Pilliar, Evaluating sol-gel
ceramic thin films for metal implant applications: III. In vitro aging of sol-
gel-derived zirconia films on Ti-6Al-4V, J. Biomed. Mater. Res. (Appl
Biomater), 48, (1999), 424-433.
27. C. J. Ochs, F. Sittner, R. Ugas-Carrión, M. Yekehtaz, S. Flege, W.
Ensinger, Structural and electrochemical characterization of zirconium and
silicon based sol-gel coatings for corrosion protection, Current Topics in
Electrochemistry, 13, (2008), 59-65.
28. M. Yekehtaz, K. Baba, R. Hatada, S. Flege, F. Sittner, W. Ensinger,
Corrosion Resistance of Magnesium Treated by Hydrocarbon Plasma
Immersion Ion Implantation, Nuclear Instruments and Methods in Physics
Research Section B 267, (2009), 1666-1669.
29. G. Kickelbick, Hybrid Materials. Synthesis, Characterization, and
Applications. Wiley-VCH, (2007), Weinheim, Germany.
30. F.C.M. Woudenberg, Nanostructured oxide coatings via emulsion
precipitation. Thesis, University of Twente, Enschede, Netherlands, 2001.
31. J. Shi, CISM, Steric stabilization, Literature Review, Ohio State University,
06502, 2002.

159
32. A.A. Parker, G.H. Armstrong and D.P. Hedrick, NMR and sedimentation
studies ofa polymeric steric stabilizer for alumina, J. Appl. Polymer Sci.,
47, (1993), 1999-003.
33. G.H. Armstrong, L. Johnson and A.A. Parker, Effect of polymeric steric
stabilizers on the settling of alumina, Journal of Applied Polymer Science,
52, (1994), 997-1004.
34. D.H Napper, Polymeric Stabilization of Colloidal Dispersions, Academic
Press, (1983), New York, USA.
35. G.I. Spijksma, G.A. Seisenbaeva, A. Fischer, H.J.M Bouwmeester, D.H.A.
Blank and V.G. Kessler, The molecular composition of non-modified and
acac-modified propoxide and butoxide precursors of zirconium and
hafnium dioxides, J. Sol- Gel Sci. Technol., 51, (2009), 10-22.
36. G.I. Spijksma, H.J.M. Bouwmeester, D.H.A. Blank, V.G. Kessler,
Stabilization and destabilization of zirconium propoxide precursors by
acetylacetone, Chem. Commun., (2004), 1874-1875.
37. G.I. Spijksma, L. Kloo, H. J.M. Bouwmeester, D.H.A. Blank and V.G.
Kessler, Nona-coordinated MO6N3 centers M=Zr,Hf as a stable building
block for the construction of heterometallic alkoxide precursors, Inorg.
Chim. Acta, 360, (2007), 2045-2055.
38. S. Shukla, S. Seal, Phase stabilization in nanocrystalline zirconia, Rev.
Adv. Mater. Sci., 5, (2003), 117-120.
39. S. Shukla, S. Seal, R. Vij and S. Bandyopadhyay, Polymer Surfactant
Incorporated Ceramic Oxide Nanoparticles, Rev. Adv. Mater. Sci. 4,
(2003), 1-9.
40. E. Berstein, M. G. Blanchin, R. Ravelle-Champuis and J. Rodriguez-
Carvajal, Structural studies of phase transformations in ultrafine zirconia
powders, J. Mater. Sci., 27, (1992), 6519-6524.

160
41. A.G. Gaynor, R.J. Gonzalez, R.M. Davis, R. Zallen, Characterization of
nanophase titania particles synthesized using in-situ steric stabilization, J.
Mater. Res., 12, (1997), 1755-1765.
42. R.J. Hunter, Zeta Potential in Colloid Science, Academic Press, (1981),
New York, USA.
43. J.C. Sanders, M.C. Breadmore, Y.C. Kwok, K.M. Horsman and J.P.
Landers, Hydroxypropyl Cellulose as an Adsorptive Coating Sieving Matrix
for DNA Separations, Amer. Chem. Soc., 75, (2003), 986-994.
44. R. Ugas-Carrión, F. Sittner, M. Yekehtaz, S. Flege, J. Brötz and W.
Ensinger, Influence of stabilizing agents on structure and protection
performance of zirconium oxide films, Surf. Coat. Technol., 204 (2010),
2064-2067.
45. P. Marcus, Corrosion Mechanisms in Theory and Practice, Marcel Dekker,
Inc., (2002), New York, USA.
46. W.S. Tait, An introduction to the electrochemical corrosion testing for
practicing engineers and scientists, PairODaoes Publications, (1994),
Racine, Wisconsin, USA.
47. L-S. Van Delinder, Corrosion Basis an Introduction, NACE Publication,
(1984), Houston, USA.
48. R. G. Kelly, J. R. Scully, D. W. Shoesmith and R. G. Buchheit,
Electrochemical Techniques in Corrosion Science and Engineering, Marcel
Dekker, Inc., (2003), New York, USA.
49. K-H. Tostmann, Korrosion Unsachen und Vermeidung, Wiley-VCH, (2001),
Weinheim, Germany.
50. G.H. Koch, M.P.H. Brongers, N.G. Thompson, Y.P. Virmani, J.H. Payer,
Corrosion Costs and Preventive Strategies in the United States,
Publication No. FHWARD-01 (Washington, D.C.: FHWA, (2002) 156.

161
51. H. Huber, P. Crimmann, D. Bendix, K. Roth, Neuentwicklung eines
Korrosionstestsystems: Hochtemperaturmikroben als Prüfingenieure, Uni
Regensburg, ATZ Entwicklungzentrum, (2006) pp. 2.
52. H. A. Videla, Manual of Biocorrosion, Press by CRC Lewis, Inc., (1996),
Florida, USA.
53. P. Atkins and J. De Paula, Atkins´ Physical Chemistry, Oxford University
Press, 8th edition, (2006), Oxford, Great Britain.
54. A. Courtney, Ch 412 Advanced Inorganic Chemistry, Western Oregon
University press, (2001), USA.
55. http://www.corrosion-doctors.org
56. S. Li, W.T. Zheng, Q. Jiang, Size and pressure effects on solid transition
temperatures of ZrO2, Scripta Materialia, 54, (2006), 2091–2094.
57. T. K. Gupta, J. H. Bechtold, R. C. Kuznicki, L. H. Cadoff and B.R. Rossing,
Stabilization of tetragonal phase in polycrystalline zirconia, Journal of
Material Science, 12 (1977), 2421-2426.
58. W. Córdova-Martínez, E. De la Rosa-Cruz, L. A. Díaz-Torres, P. Salas, A.
Montoya, M. Avendaño, R. A. Rodríguez and O. Barbosa-García,
Nanocrystalline tetragonal zirconium oxide stabilization at low
temperatures by using rare earth ions: Sm3+ and Tb3+, Optical Materials, 20
(2002), 263-271.
59. F. Namavar, G. Wang, C. Li Cheung, R. F. Sabirianov, X.C. Zeng, W.N.
Mei, J. Bai, J. R. Brewer, H. Haider and K. L. Garvin, Thermal stability of
nanostructurally stabilized zirconium oxide, IOP Nanotechnology, 18,
(2007), 415702.
60. N. El Habra, M. Bolzan, C. De Zorzi, M. Favaro, M. Casarin, C. Sada and
G. Rossetto, Stabilized Zirconia-Based Materials for Solid Oxide Fuel Cells
(SOFC) obtained by MOCVD and Aerosol-CVD, Online free paper,
Electrochemical.Org/meeting.

162
61. Y. Kuo, Mixed Oxide High-k Gate Dielectrics - Interface Layer Structure,
Breakdown Mechanism, and Memories, ECS 210th Meeting, (2006),
Abstract 1115.
62. K. Schenk-Meuser, D. Velten, E. Eisenbarth, V. Biehl, H. Duschner, J.
Breme, XPS analysis of sol-gel-generated mixed-oxide layers for
biomedical application, Surface and Interface Analysis, 34 (2002), 59-62.
63. H. Hasuyama, Y. Shima, K. Baba, G. K. Wolf, H. Martin and F. Stippich,
Adhesive and corrosion-resistant zirconium oxide coatings on stainless
steel prepared by ion beam assisted deposition, Nuc. Instr. and Meth.
Phys. Res. Sect. B: 127-128, (1997), 827-831.
64. P. Mechnich and W. Braue, ZrO2-Environmental Barrier Coatings for
Oxide/Oxide Ceramic Matrix Composites fabricated by Electron-beam
Physical Vapor Deposition, electronic library, Deusches Zentrum für Luft
und Raumfahr (2009).
65. G. Tian, J. Huang, T. Wang, H. He and J. Shao, Microstructure and laser-
induced damage threshold of ZrO2 coatings dependence on annealing
temperature, Appl. Surf. Sci., 239, (2005), 201-208.
66. P.B. Srinivasan, J. Liang, C. Blawert and W. Dietzel, Dry sliding wear
behaviour of magnesium oxide and zirconium oxide plasma electrolytic
oxidation coated magnesium alloy, Appl. Surf. Sci., 256, (2010), 3265-
3273.
67. R. Shacham, D. Mandler and D. Avnir, Electrochemically Induced Sol-Gel
Deposition of Zirconia Thin Films, Chem. Eur. J., 10, (2004), 1936-1943.
68. K. S. Alber and J. A. Cox, Electrochemistry in Solids Prepared by Sol-Gel
Processes, Mikrochim. Acta, 127, (1997), 131-147.
69. http://www.princeton.edu/~pccm/outreach/REU2006/REU2006Presentatio
ns/gilida.pdf
70. M. Stern and A. L. Geary, J. Electrochem. Soc., 104(1), (1957), 56-63.

163
71. M. Stern, Corrosion, 14 (10), (1958), 61-64.
72. http://wpcontent.answers.com/wikipedia/commons/4/4c/Cyclovoltammogra
m.jpg
73. C. H. Hamann and W. Vielstich, Electrochemie, 3., vollständige
überarbeitete Auflage, Wiley-VCH, (1998), Weinheim, Germany.
74. Z. Ahmad, Principles of Corrosion Engineering and Corrosion Control,
IChemE, BH, (2006), Oxford, UK.
75. Gamry Instruments, © Copyright, Electrochemical impedance
spectroscopy primer, (2005).
76. E. Barsoukov and J. R. Macdonald, Impedance Spectroscopy: Theory,
Experimental and Applications, 2 ed. Wiley-Interscience, (2005), New
Jersey, USA.
77. Tesis Doctoral, Universidad Politécnica Cataluña,
http://www.tesisenxarxa.net/TESIS_UPC/AVAILABLE/TDX-0529101-
130232/07CAP5.pdf
78. U. Rammelt, G. Reinhard, Characterization of active pigments in damage
of organic coatings on steel by means of electrochemical impedance
spectroscopy, Prog. Org, Coat. 24, (1994), 309.
79. P. A. Schweitzer, Fundamentals of Metallic Corrosion: Atmospheric and
media corrosion metals, Corrosion Engineering Handbook 2 ed., CRC
Press, (2006), Florida, USA.
80. P.J. Gellings and H.J.M Bouwmeester, The CRC Handbook of Solid State
Electrochemistry, CRC Press, (1997), Florida, USA.
81. L. Spieß, R. Schwarzer, H. Behnken, G. Teichert, Moderne
Röntgenbeugung, B.G. Teubner Verlag, (2005), Wiesbaden, Germany.
82. J. F. Moulder, W. F. Stickle, P. E. Sobol, and K. D. Bomben, Handbook of
X-ray Photoelectron Spectroscopy, Physical Electronics, Inc., (1995), Eden
Prairie.

164
83. H. Düsterhürft, M. Riedel and B.-K. Düsterhöft, Einführung in die
Sekundärionmassenspektrometrie -SIMS-, B.G Teubner, (1998), Leipzig,
Germany.
84. D.A. Skoog and J.J. Leary, Instrumentelle Analytik, Grundlagen Geräte-
Anwendungen, Springer, (1996), Milan, Italy.
85. Ims6f synopsis, Cameca, Gennevilliers Cedex, 2000, France.
86. J. Als-Nielsen, D. McMorrow, Elements of Modern X-Ray Physics, John
Wiley & Sons Ltd, (2001), New York, USA.
87. M. Fujimoto, T. Ohno, H. Suzuki, H. Koyama and J. Tanaka, Nanostructure
of TiO2 Nano-Coated SiO2 Particles, J. Amer. Ceram. Soc, 10.1111/j.1551-
2916.2005.00583.x.
88. H. Dun,W. Zhang, Y. Wei, S. Xiuqing, Y. Li and L. Chen, Layer-by-Layer
Self-Assembly of Multilayer Zirconia Nanoparticles on Silica Spheres for
HPLC Packings, Anal. Chem., 76, (2004), 5016–5023.
89. J. Voelkel, Improvement in Quality of Sol-Gel Derived Zirconia Multilayer
Coatings by Polymeric Additive, Molec. Cryst. and Liq. Cryst., 354, (2000),
1563-5287.
90. H. Li, K. Liang, L. Mei and S. Gu, Oxidation resistance of mild steel by
zirconia sol–gel coatings, Mater. Sci. and Eng. A, 341, (2003), 87-90.
91. E. Rubio, J. Almaral, R. Ram rez-Bon, V. Casta o and V. Rodr guez,
Organic–inorganic hybrid coating (poly(methyl methacrylate)/monodisperse
silica), Optic. Mater., 27, (2005), 1266-1269.
92. M.E. Pires de Souza, E. Ariza, M. Ballester, I. V. Pagotto Yoshida, L.A.
Rocha, C.M. de Alvarenga Freire, Characterization of organic-inorganic
hybrid coatings for corrosion protection of galvanized steel and
electroplated ZnFe steel, Mat. Res., 9, (2006).

165
93. J.M. Keijman, Inorganic Organic Hybrid Coatings in the Protective
Coatings Industry, former Technical Director Ameron BV, (2003),
Netherlands.
94. S. Wang, C. Liu and F. Shan, Structural investigation of the zirconium-
titanium based amino trimethylene phosphonate hybrid coating on
aluminum alloy, Acta Metallurgica Sinica (English Letters), 22, (2009), 161-
166.
95. S. Roux, P. Audebert, J. Pagettia and M. Roche, Electropolymerization of
carboxylic acid functionalized pyrrole into hybrid zirconium–silicon
oxopolymer sol–gel coatings, New J. Chem., 26, (2002), 298–304.
96. Q. Liu, L. Zhang, L. Cheng and Y. Wang, Chemical vapour deposition of
zirconium carbide and silicon carbide hybrid whiskers, Mater. Lett., 64,
(2010), 552-554.
97. A. Collazo, A. Covelo, C. Pérez, Structural transformation of silane-based
zirconium-modified sol-gel coatings, Surface and Interface Analysis,
(2010), 10.1002/sia.3186.
98. L. Téllez, J. Rubio, M. A. Valenzuela, F. Rubio and J. L. Oteo, Zirconium
Effect on the Synthesis and Textural Properties of Organic Inorganic
Hybrid Materials, Advan. Technol. Mater. Mater. Process. J., 8, (2006),
226-231.
99. D. L. Versace, O. Soppera, J. Lalevée and C. Croutxé-Barghorn, Influence
of zirconium propoxide on the radical induced photopolymerisation of
hybrid sol–gel materials, New J. Chem., 32, (2008), 2270 – 2278.
100. Y. Chen, H-W. Yang, Hydroxypropyl cellulose (HPC)-stabilized
dispersion polymerization of styrene in polar solvents: Effect of reaction
parameters, J. Poly. Sci. Part A: Poly. Chem., 30, (2003), 2765-2772.
101. F. H. Allen, The Cambridge Structural Database: a quarter of a million
crystal structures and rising, Acta Cryst., B58, (2002), 380-388.

166
102. M. Sedlar and M. Sayer, Reactivity of Titanium Isopropoxide, Zirconium
Propoxide and Niobium Ethoxide in the System of 2-Methoxyethanol, 2,4-
Pentanedione and Water, J. Sol-Gel Sci. Technol., 5, (1995), 27-40.
103. G. I. Spijksma, D. H. A. Blank, H. J. M. Bouwmeester and V. G. Kessler,
Modification of Different Zirconium Propoxide Precursors by
Diethanolamine. Is There a Shelf Stability Issue for Sol-Gel Applications?,
Int. J. Mol. Sci., 10, (2009), 4977-4989.
104. M. Niederberger and N. Pinna, Metal Oxide Nanoparticles in Organic
Solvents: Synthesis, Formation, Assembly and Application, Springer,
(2009), 217 p.67 iIlus, London.
105. S. Mezdour, A. Lepine, P. Erazo-Majewicz, F. Ducept and C. Michon,
Oil/water surface rheological properties of hydroxypropyl cellulose (HPC)
alone and mixed with lecithin: Contribution to emulsion stability, Coll. Surf.
A: Physicochem. Eng. Asp., 331, (2008), 76-83.
106. A. Ain-Aia and P. K. Gupta, Effect of arginine hydrochloride and
hydroxypropyl cellulose as stabilizers on the physical stability of high drug
loading nanosuspensions of a poorly soluble compound, Int. J. Pharma.,
351, (2008), 282-288.
107. P. R. Roberge, Corrosion Basics: An Introduction, NACE International,
(2006), Houston, USA.

167
List of chemicals and materials
Iron 30 mm diameter 99,8 %, Typical Analysis: Mn <800, C <200, P <200,
S <150 (ppm), ARMCO®, Goodfellow
Ethanol absolut 99.9 %, G CHROMASOLV®, Sigma-Aldrich
Acetylacetone ReagentPlus® , >= 99 %, Sigma-Aldrich
Glacial acetic acid purum ≥ 99.0 %, Fluka Analytical
1-Propanol ≥ 99.80 %, Sigma-Aldrich
Hydroxypropyl cellulose, powder, Aldrich, 80,000; 100,000 and 370,000
g/mol
Zirconium (IV) propoxide solution, purum ~70 % in propanol, Fluka
Phenyl-triethoxysilane = 98 % (GC) Aldrich chemistry

168
Curriculum Vitae RUPERTO A. UGAS CARRION [email protected]
Study_________________________________________________________________
2006 – October 2010 Doktor-Ingenieurs (Dr.-Ing.), Chemistry and Material sciences
Departments, Material analytics, TU-Darmstadt, Germany
Thesis “Study of stabilizing agents in thin sol-gel zirconium oxide protective coatings
on iron materials
- Diploma, Chemical Engineer, Universidad de Oriente, July, 2003, Venezuela.
Thesis “Mathematical model for the bioremediation of contaminated soils with
hydrocarbons in a bioreactor of packed bed”
Academic Courses_____________________________________________________
- German Course for Technical Presentation, Philipps Universität Marburg, 2008
- English intermediate stage Oral, TU-Darmstadt, 2008
- English intermediate stage Writing, TU-Darmstadt, 2007
- English high intermediate intensive, Dolphin Institute, Dublin, 2006
- German intensive Mittelstufe 6 months, Speak & Write School, Marburg, 2006
- Gas Measurement and Technology, ABB, Venezuela, 2005
- Gas Measurement and Technology, Repsol, Venezuela, 2005
- Gas Engineering Levels I, II and III, PDVSA, Venezuela, 2004-2005
169
Work Experience______________________________________________________
2009 – 2010 Laboratory Assistant sol-gel and corrosion, Technische
Universität Darmstadt
2004 – 2005 Chemical Engineer, Projects supervisor in construction and
maintenance of gas and oil production and treatment
installations and as district supervisor, Energy and Oil
Ministry, Pdvsa, Venezuela
2004 Junior Professor in Chemistry, Technology Institute
University of Táchira, Venezuela
2002 – 2003 Professor Assistant, Units Process Laboratory, Chemical
Engineering, Universidad de Oriente, Venezuela
2001 Cense Supervisor, Cense -2001, National Statistics Institute,
Venezuela
Languages
Spanish (native languish), German (fluent), English (advanced)

170
List of Publications
1. C. J. Ochs, F. Sittner, R. Ugas-Carrión, M. Yekehtaz, S. Flege and W.
Ensinger, Structural and electrochemical characterization of zirconium and
silicon based sol-gel coatings for corrosion protection, Current Topics in
Electrochemistry 13, 59-65 (2008).
2. R. Ugas-Carrion, F. Sittner, C.J. Ochs, S. Flege, W. Ensinger, Characterization
of the porosity of thin zirconium oxide coatings prepared at low temperatures,
Thin Solid Films, 517 [6] 1967-1969 (2009).
3. R. Ugas-Carrion, F. Sittner, M. Yekehtaz, S. Flege, J. Brötz and W. Ensinger,
Influence of stabilizing agents on structure and protection performance of
zirconium oxide films, Surf. Coat. Technol., 204, 2064-2067 (2010).
4. M. Yekehtaz, F. Sittner, R. Ugas-Carrión, S. Flege, J. Brötz and W. Ensinger,
Characterization of Protective Sol-Gel Coatings on Magnesium Based on
Phenyl-triethoxysilane Precursor, Thin Solid Films 518, 5223-5226 (2010).
Presentations
1. Poster (oral poster presentation): Influence of stabilizing agents on structure and
protection performance of zirconium oxide films, E-MRS Spring Meeting
Strasbourg Symposium P: Protective Coatings and Thin Films – June, France,
2009.
2. Poster presentation: Effect of stabilizing agents on the structure and interface
composition of thin protective zirconium oxide films, 17th
ISSC Conference,
University of Reading, England, March-April, 2009.
Academic Awards
-DAAD – Fundayacucho scholarship for Ph.D. Study, 2006-2009 at the Technische
Universität Darmstadt, Germany
-Student Award, EMRS-09, Strasbourg, France.
.

171
Darmstadt, 10.08.2010
Ruperto Ugas Carrión,
Wendelgasse 4, 35037 Marburg
Eidesstattliches Erklärung
Ich erkläre hiermit an Eides Statt, dass ich meine Dissertation selbständig
und nur mit den angegebenen Hilfsmitteln abgefertigt habe.
Unterschrift
Ruperto Ugas Carrión

172
Darmstadt, 10.08.2010
Ruperto Ugas Carrión
Wendelgasse 4, 35037 Marburg
Erklärung
Ich erkläre hiermit, noch keinen Promotionsversuch unternommen zu
haben.
Unterschrift
Ruperto Ugas Carrión