enhanced defluoridation of water using zirconium—coated
TRANSCRIPT
materials
Article
Enhanced Defluoridation of Water Using Zirconium—CoatedPumice in Fixed-Bed Adsorption Columns
Wondwosen Sime Geleta 1,2 , Esayas Alemayehu 3,4,* and Bernd Lennartz 2,*
�����������������
Citation: Geleta, W.S.; Alemayehu, E.;
Lennartz, B. Enhanced Defluoridation
of Water Using Zirconium—Coated
Pumice in Fixed-Bed Adsorption
Columns. Materials 2021, 14, 6145.
https://doi.org/10.3390/ma14206145
Academic Editors: Agnieszka
Gładysz-Płaska and Ewa Skwarek
Received: 1 September 2021
Accepted: 13 October 2021
Published: 16 October 2021
Publisher’s Note: MDPI stays neutral
with regard to jurisdictional claims in
published maps and institutional affil-
iations.
Copyright: © 2021 by the authors.
Licensee MDPI, Basel, Switzerland.
This article is an open access article
distributed under the terms and
conditions of the Creative Commons
Attribution (CC BY) license (https://
creativecommons.org/licenses/by/
4.0/).
1 School of Chemical Engineering, Jimma Institute of Technology, Jimma University,Jimma P.O. Box 378, Ethiopia; [email protected]
2 Faculty of Agricultural and Environmental Sciences, University of Rostock, Justus-Von-Liebig-Weg 6,18059 Rostock, Germany
3 Faculty of Civil and Environmental Engineering, Jimma Institute of Technology, Jimma University,Jimma P.O. Box 378, Ethiopia
4 Africa Center of Excellence for Water Management, Addis Ababa University, Addis Ababa 1176, Ethiopia* Correspondence: [email protected] (E.A.); [email protected] (B.L.);
Tel.: +49-381-498-3180 (B.L.)
Abstract: Millions of people across the globe suffer from health issues related to high fluoride levelsin drinking water. The purpose of this study was to test modified pumice as an adsorbent for thepurification of fluoride-containing waters. The adsorption of fluoride onto zirconium-coated pumice(Zr–Pu) adsorbent was examined in fixed-bed adsorption columns. The coating of zirconium onthe surface of VPum was revealed by X-ray diffractometer (XRD), Inductively coupled plasma-optical emission spectroscopy (ICP-EOS), and X-ray fluorescence (XRF) techniques. The degree ofsurface modification with the enhanced porosity of Zr–Pu was evident from the recorded scanningelectron microscope (SEM) micrographs. The Brunauer-Emmett-Teller (BET) analysis confirmed theenhancement of the specific surface area of VPum after modification. The Fourier transform infrared(FTIR) examinations of VPum and Zr–Pu before and after adsorption did not reveal any significantspectrum changes. The pH drift method showed that VPum and Zr–Pu have positive charges atpHPZC lower than 7.3 and 6.5, respectively. Zr–Pu yielded a higher adsorption capacity of 225 mg/kg(2.05 times the adsorption capacity of VPum: 110 mg/kg), at pH = 2 and volumetric flow rate (QO)of 1.25 mL/min. Breakthrough time increases with decreasing pH and flow rate. The experimentaladsorption data was well-matched by the Thomas and Adams-Bohart models with correlationcoefficients (R2) of ≥ 0.980 (Zr–Pu) and ≥ 0.897 (VPum), confirming that both models are suitabletools to design fixed-bed column systems using volcanic rock materials. Overall, coating pumice withzirconium improved the defluoridation capacity of pumice; hence, a Zr–Pu-packed fixed-bed can beapplied for defluoridation of excess fluoride from groundwater. However, additional investigationson, for instance, the influences of competing ions are advisable to draw explicit conclusions.
Keywords: adsorption; defluoridation; fluoride; VPum; zirconium–coated pumice
1. Introduction
Fluoride is among the many vital trace elements required in drinking water withinthe allowable range (<1.5 mg/L) [1] for the normal growth of humans and animal bones.Nevertheless, it is detrimental to bone development when ingested beyond the acceptableconcentration limit (>1.5 mg/L) [2]. Excess fluoride hurts bones because of its high elec-tronegative value, enabling interrelations with calcium in bones. Hence, it causes dentalfluorosis and/or skeletal fluorosis (bone cancer) [3]. Alzheimer’s syndrome, arthritis,thyroid, etc., are additional adverse consequences of excess fluoride in drinking water [4].
In several places around the globe, groundwater is the principal and favored sourceof potable water, as is the case for many communities in rural and urban areas in theAfrican rift valley. However, over 200 million people around the globe, including East
Materials 2021, 14, 6145. https://doi.org/10.3390/ma14206145 https://www.mdpi.com/journal/materials
Materials 2021, 14, 6145 2 of 20
Africa, ingest groundwater with high fluoride concentrations, which has a serious effecton people’s welfare [5,6]. Fluorosis is the most prevalent geochemical disease in the EastAfrican Rift, affecting over 80 million people [5,7,8]. Ethiopia is one of the East Africancountries with a large community residing where excess fluoride is becoming a significantconcern, especially along the country’s central Rift [9,10]. The dissolution of fluoride-containing minerals has intensified excessive fluoride in the Ethiopian Rift in parent rocksand soils, which is usually linked to high bicarbonate and low calcium levels [11,12]. Levelsof fluoride in wells in Ethiopia’s Rift are typically up to ten times higher than that of theWHO norm, putting millions of Ethiopians at risk of severe fluoride ion toxicity [9,13].Similar to Ethiopia, countries like India, China, Pakistan, and others, deal with similarissues. Hence, excess fluoride in drinking water is among the most pressing issues theworld faces today; therefore, valuable and easy-to-apply techniques to maintain fluorideconcentrations within the allowable standard are urgently required.
Despite several fluoride removal methods, economic, procedural, and environmentaldisadvantages restrict their wide usage in many parts of the world. Although reverseosmosis [14,15], ultrafiltration [16], electrodialysis [17], and ion exchange [18–20] have goodfluoride removal efficiency and are fairly steady, their operating costs are prohibitively highfor developing countries like Ethiopia. The coagulation sedimentation methods [21–24]are simple to use, low cost and simple to apply; nevertheless, the dosage is too high andcannot be regenerated, causing secondary pollution and difficulty reducing fluoride topermissible levels. Adsorption using low-cost and locally available materials has beenconsidered a highly efficient and well-accepted fluoride removal process by researchers ofrecent decades [25–28].
Adsorbent materials investigated for fluoride removal are numerous [26,29–35]. How-ever, many of the materials suffer from either time-consuming synthesis procedures, highmanufacturing costs, scarcity of raw materials, or a short lifetime, making them impracticalto apply in remote regions of Africa. Subsequently, efforts have been made to acquirereadily available, long-lasting, inexpensive, and effective materials that can be utilized topurify polluted water in low-income countries. Surface modification of locally availablematerials to treat fluoride-laden water is also under review since this could have a capacityfor cost minimization and increasing sustainability.
Pumice (VPum) is among the most encouraging and low-priced naturally availablematerials that have been broadly examined and applied for pollutant removal in watertreatment [5,36–38]. Owing to the release of gasses during solidification, VPum has alight color and porous configuration. Good removal capabilities, mechanical strength,and absence of toxicity are the major benefits of VPum over other natural or syntheticadsorbents [37]. Many nations, including Spain, Greece, Turkey, Ethiopia, and Eritrea,have plenty of pumice deposits [5,36]. From the previous report, it is generally recognizedthat natural adsorbents modified with multivalent metal cations, such as Fe3+, Mn4+, andZr4+, may change the surface properties and the affinity of fluoride [39]. Among these,zirconium (Zr4+) is paid more attention due to its non-toxicity, high binding affinity withfluoride ions, and acceptable cost [40,41]. Studies have found that surface-modified pumicemight perform better as an adsorbent for water contaminants [42–44]. Hence, research intozirconium-based adsorbents with good performance should be considered.
With the above issues in mind, fixed-bed columns packed with zirconium (IV) oxychlo-ride octahydrate (ZrOCl2.8H2O) coated pumice (abbreviated as Zr–Pu hereafter), whichwas not previously tested to treat fluoride contaminated water, the objectives of the presentstudy were to (1) compare the defluoridation capacity of Zr–Pu and VPum in a fixed-bedcolumn mode; (2) investigate the effect of solution pH and flow rate on the fluoride adsorp-tion process; and (3) describe and analyze the adsorption processes employing well-knownfixed-bed adsorption kinetic models such as the Thomas and Adams-Bohart model.
Materials 2021, 14, 6145 3 of 20
2. Materials and Methods2.1. Adsorbent Preparations2.1.1. Natural Pumice
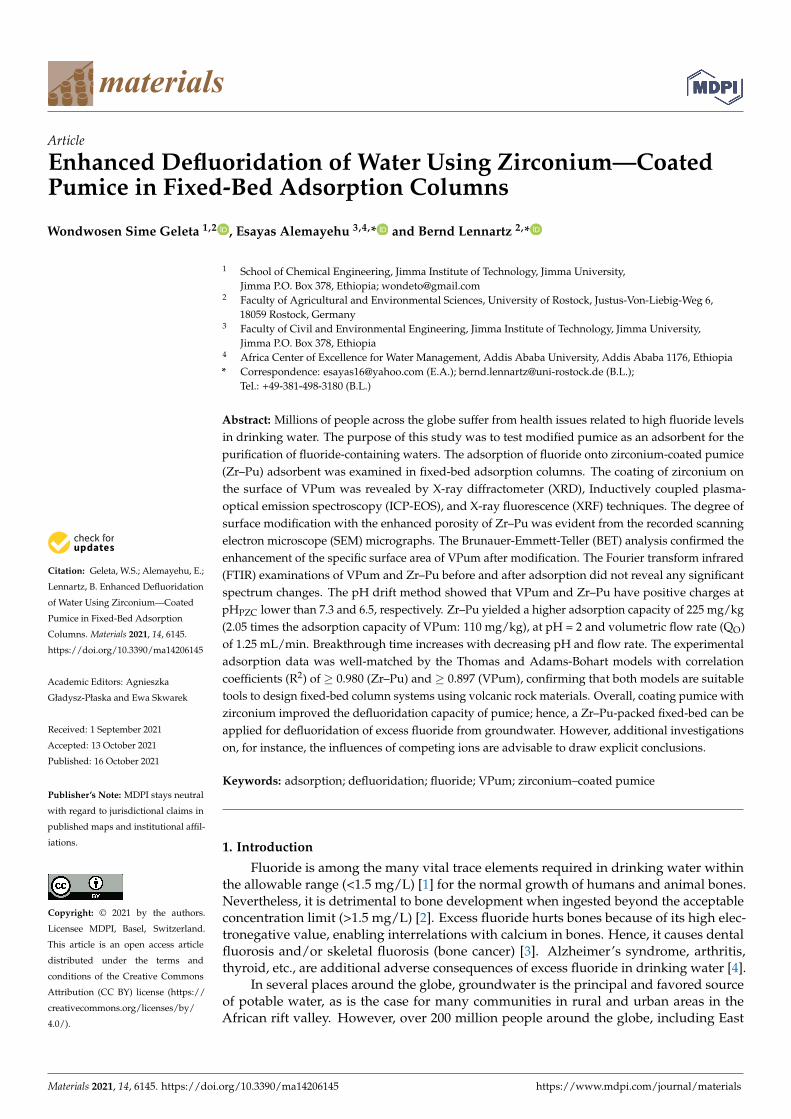
The natural pumice (VPum) used in this work was gathered from volcanic cones ofthe Main Rift Valley area of Oromia Regional State, East Showa Zone, Ethiopia, around50–100 km East of Addis Ababa (Figure 1). VPum was repeatedly washed to eliminatepossible attachments and other water-soluble substances from its surface. The washedVPum was dried in an oven at a temperature of 70 ◦C for 48 h, and subsequently, it wasseparated into four different mesh size fractions, as indicated in [5,45].
Materials 2021, 14, 6145 3 of 20
2. Materials and Methods
2.1. Adsorbent Preparations
2.1.1. Natural Pumice
The natural pumice (VPum) used in this work was gathered from volcanic cones of
the Main Rift Valley area of Oromia Regional State, East Showa Zone, Ethiopia, around
50–100 km East of Addis Ababa (Figure 1). VPum was repeatedly washed to eliminate
possible attachments and other water‐soluble substances from its surface. The washed
VPum was dried in an oven at a temperature of 70 °C for 48 h, and subsequently, it was
separated into four different mesh size fractions, as indicated in [5,45].
Figure 1. The geographical location of natural pumice (VPum) sample collections.
In our very recent study [5], VPum with a fine particle size (0.075–0.425 mm) revealed
a good fluoride uptake performance compared to the other particle sizes. Hence, this fine
particle size was used for coating with zirconium.
2.1.2. Coating of VPum with Zirconium
The coating of VPum with zirconium was performed using 0.1 M ZrOCl2.8H2O in
accordance with the methods applied by Salifu et al. [46], in which pumice was coated
with aluminum (hydr) oxide. An adequate amount of ZrOCl2∙8H2O solution was added
to completely soak the dried pumice in acid‐washed cylindrical polyethylene wide‐mouth
plastic bottles. The mixture was shaken with a horizontal shaker (SM25, Edmund Bühler
7400 Tübinger, Germany) at 200 rpm for 12 h. The zirconium‐coated pumice (Zr–Pu) was
decanted, dried in an electric oven at 70 °C for 48 h, and soaked in 2 M NH4OH. The Zr–
Pu was washed repeatedly with deionized water, dried at 70 °C for 48 h, and stored in a
plastic bag for subsequent experiment and characterization.
2.2. Chemicals and Reagents
All bottles and glassware were properly cleaned and rinsed with deionized water
before use. All chemicals and reagents used in the experiments were of analytical quality.
Zirconium oxychloride (IV) octahydrate (ZrOCl2∙8H2O), ammonium hydroxide (NH4OH),
Figure 1. The geographical location of natural pumice (VPum) sample collections.
In our very recent study [5], VPum with a fine particle size (0.075–0.425 mm) revealeda good fluoride uptake performance compared to the other particle sizes. Hence, this fineparticle size was used for coating with zirconium.
2.1.2. Coating of VPum with Zirconium
The coating of VPum with zirconium was performed using 0.1 M ZrOCl2.8H2O inaccordance with the methods applied by Salifu et al. [46], in which pumice was coatedwith aluminum (hydr) oxide. An adequate amount of ZrOCl2·8H2O solution was added tocompletely soak the dried pumice in acid-washed cylindrical polyethylene wide-mouthplastic bottles. The mixture was shaken with a horizontal shaker (SM25, Edmund Bühler7400 Tübinger, Germany) at 200 rpm for 12 h. The zirconium-coated pumice (Zr–Pu) wasdecanted, dried in an electric oven at 70 ◦C for 48 h, and soaked in 2 M NH4OH. The Zr–Puwas washed repeatedly with deionized water, dried at 70 ◦C for 48 h, and stored in a plasticbag for subsequent experiment and characterization.
2.2. Chemicals and Reagents
All bottles and glassware were properly cleaned and rinsed with deionized waterbefore use. All chemicals and reagents used in the experiments were of analytical quality.Zirconium oxychloride (IV) octahydrate (ZrOCl2·8H2O), ammonium hydroxide (NH4OH),sodium hydroxide (NaOH), and hydrochloric acid (HCl) were purchased from Merck
Materials 2021, 14, 6145 4 of 20
KGaA, Darmstadt, Germany. A 1000 mg/L fluoride stock solution was made by dissolving2.21 g of NaF in 1000 mL of deionized water and stored at 4 ◦C in a refrigerator. Thesynthetic solution for fixed-bed adsorption experiments was prepared by diluting the stocksolution with deionized water to obtain the desired concentration. NaOH (0.1 M) and/orHCl (0.1 M) solutions were added to adjust the pH values of the fluoride solution.
2.3. Adsorbent Characterizations2.3.1. Crystalline Structure
The crystalline structure of VPum and Zr–Pu before and after the adsorption ex-periment was determined by an X-ray diffractometer (XRD-7000, Drawell, Shanghai,China) with Cu Kα as a radiation source (1.54056 Å) generated at 30 kV using a 25 mAinstrument. The diffractogram was obtained with a step width of 2θ and a scan rate of0.01◦/min. The mineralogical buildup of the adsorbents was illustrated by contrastingthe X-ray diffractogram with the database of the X’pert HighScore Plus software package(Version: 2.2b 2.2.2).
2.3.2. Chemical Composition
The inductively coupled plasma-optical emission spectroscopy (ICP-OES) was em-ployed to examine the elemental composition of the VPum and Zr–Pu. The oxide contentsof VPum and Zr–Pu were analyzed by X-ray fluorescence (XRF) spectroscopy.
2.3.3. Fourier Transform Infrared (FT-IR) Analysis
The Fourier Transform Infrared (FT-IR) analysis was run on KBr pellets to learn aboutthe different functional groups of the samples. The spectra were recorded over a range of5000 to 400 cm−1 at a resolution of 0.1 cm−1 in a PerkinElmer spectrometer (UNSW Sydney,Australia) using a lithium tantalite (LiTaO3) detector.
2.3.4. Surface Area (SBET) and Pore-Size Distribution Analysis
The Brunauer-Emmett-Teller (BET) was used to analyze the surface area (SBET) of theadsorbents. Barrett–Johner–Halenda (BJH) equation was used to determine the pore sizedistribution of the adsorbents.
2.3.5. Scanning Electron Microscope (SEM) Analysis
A scanning electron microscope (SEM) (JCM-6000plus, Version 0.2, JEOL Ltd., Peabody,MA, USA), operated at 15 kV, was used to determine the morphologies of VPum, Zr–Pubefore and after adsorption.
2.3.6. pH and Point of Zero Charges (pHPZC)
The pH of VPum, Zr–Pu before and after adsorption was determined using a pHmeter in a 1:10 adsorbent/water ratio as per the standard method [5,47]. The point of zerocharges (pHPZC) of the adsorbents was determined by the pH drift method [5,48], using0.01 M of NaCl solutions as an electrolyte and adding 0.1 M of NaOH or HCl solutions.
2.3.7. Surface Acidity/Basicity Analysis
Boehm’s titration method [49] was used to determine the surface acidity/ basicityof VPum and Zr–Pu. A dried adsorbent sample (0.1 g) was mixed with 50 mL of 0.05 MNaOH or 0.05 M HCl under the N2 atmosphere. The samples were shaken for 2 h and thenfiltered to remove the adsorbent. The excess base and acid were titrated with 0.05 M HCland 0.05 M NaOH, respectively. The acidity and basicity of the surface were determinedassuming that HCl and NaOH neutralize all basic groups and acidic groups, respectively.
2.4. Fixed-Bed Column Adsorption Studies
The fluoride adsorption capacity of Zr–Pu for fluoride was evaluated by continuousup-flow column systems, as indicated in [5]. A small-scale cylindrical filter column with an
Materials 2021, 14, 6145 5 of 20
inner diameter of 8.1 cm and a height of 10 cm was used to conduct continuous up-flowadsorption experiments. A weighted amount of Zr–Pu was packed uniformly with careinto the column as a fixed-bed absorber. One pore volume of deionized water was passedthrough the bed to avoid the potential occurrence of voids, channeling, or cracking. Thefluoride solution as influent was pumped into the fixed-bed column in up-flow mode by avariable flow peristaltic pump (REGLO ICC, Ismatec, Cole-Parmer Barrington, IL, USA).All experiments were performed at a temperature of 298 K. An automatic fraction collector(RFI, MA-RON GmbH, Reichelt Chemietechnik GmbH + Co., Heidelberg, Germany) wasused to collect effluent samples at the outlet of the column set-up. Ion chromatography(930 Compact IC Flex, Metrohm, Herisau, Switzerland) was employed to measure theconcentration of fluoride in the effluent samples. The desired breakthrough concentration(Cb) was considered to be 1.5 mg/L [50]. The exhaustion point was characterized as thepoint at which the fluoride concentration in the effluent was equal to 90% of the fluorideconcentration in the influent (i.e., 0.9 Ct/CO).
The influence of experimental variables such as the pH of the feed solution (2, 4, and 6)and influent volumetric flow rate (1.25, 2.50, and 3.75 mL/min) on the shape of the break-through curves and amount of fluoride removed by Zr–Pu were tested at a constantfixed-bed column height of 10 cm and an initial fluoride concentration of 10 mg/L. Thedefluoridation performance of Zr–Pu was compared with the performance of VPum pre-sented in our very recent study [5]. The plots of experimental breakthrough curves weredisplayed only for Zr–Pu.
2.5. Analysis of Column Data
The shape of the breakthrough curve is an essential feature for describing the ad-sorption capacity of the adsorbent in a flow-through column. The breakthrough curvesand breakthrough time (tb) are the characteristic features resulting from the adsorptiondynamics and process design of the packed-bed column. These two parameters have asignificant effect on the feasibility and economics of the adsorption process [5,51]. Thebreakthrough parameters are influenced by the experimental conditions of the experiment,such as the initial flow rate and pH of the influent solution. The breakthrough curve isstated as the ratio of effluent to influent fluoride concentrations (Ct/CO) as a functionof time. The exhaustion or saturation time and the breakthrough time are expressed byEquations (1) and (2), respectively.
te =∫ t=ttotal
t=0
(1 − Ct
Co
)dt (1)
tb =∫ tb
t=0
(1 − Ct
Co
)dt (2)
where, te is the saturation time (min), and tb is the breakthrough time (min) at whichCt = Cb (mg/L) (for the current system, Cb = 1.5 mg/L).
The total amount of fluoride adsorbed (qtotal: mg) in the column for a given feedconcentration (Ct), and initial flow rate (Q) can be obtained from Equation (3) [52].
qtotal =QA1000
=Q × CO
1000
∫ t=ttotal
t=0
(1 − Ct
CO
)dt (3)
where Q (mL/min) is the volumetric flow rate, and ‘A’ is the area under the breakthrough curve.The equilibrium fluoride uptake capacity (qe: mg kg−1) of the packed-bed column is
determined by dividing the total amount of fluoride adsorbed (qtotal) by the amount of drymass of the adsorbent used (m), Equation (4).
qeq =qtotal
m=
CoQtem
(4)
Materials 2021, 14, 6145 6 of 20
The experimental uptake capacity or amount of fluoride removed at tb (qb: mg kg−1)can be calculated from Equation (5).
qb =CoQtb
m(5)
The volume of effluent (Ve) and the volume of treated effluent or breakthrough volume(Vb) of solution can be calculated from Equations (6) and (7), respectively.
Ve = Qte (6)
Vb = Qtb (7)
where Ve is the total volume of the effluent until exhaustion/saturation time (mL) andVb is the total volume of the effluent until the breakthrough time (mL).
The Mass Transfer Zone (MTZ) or unused bed length (HUNB) can be obtained fromEquation (8) [53].
MTZ = HT
(te − tb
te
)(8)
where HT is total bed height (cm), te (min) is exhaustion time, and tb is breakthroughtime (min).
The Empty Bed Contact Time (EBCT) is defined as the time of contact between theadsorbent and the adsorbate solution, which can be evaluated from Equation (9).
EBCT =VB
Q(9)
where VB (mL) and Q (mL/min) designate the bed volume and the influent flowrate, respectively.
2.6. Breakthrough Curve Modeling
Before upscaling the study to a manufacturing application, the column data shouldbe validated with theoretical modeling. Different kinetic models have been tested forestimating the breakthrough performance of fixed-bed column adsorption systems [54,55].Besides, these kinetic models have been employed to evaluate the kinetic column parame-ters and uptake capacity of the column. In this work, to describe the dynamic behavior offluoride adsorption using Zr–Pu in a fixed-bed column filter, the two most important andwidely used mathematical models, the Thomas model and Adams-Bohart model, wereapplied to the experimental data. The acquired model parameters for the defluoridationof water were compared with the Thomas model and Adams-Bohart model parametersobtained for the defluoridation of water onto VPum from our recent work [5].
2.6.1. Thomas Model
The Thomas model is among the most common and highly employed dynamic modelsin a fixed-bed column performance operation. The model assumes that the process obeysLangmuir kinetics of adsorption-desorption with no axial dispersion, and the driving forceobeys second-order reversible reaction kinetics [56].
The Thomas model can be used to determine the maximum uptake of adsorbate andadsorption rate constants for the continuous adsorption process [56]. The non-linear formof the Thomas model is given by Equation (10).
Ct
Co=
1
1 + exp[KTqo
mQ − KTCot
] (10)
where KT is the Thomas rate constant (L/min mg), Co (mg/L) is the inlet or initial con-centration, Ct (mg/L) is the effluent fluoride concentration at the time, t, Q (L/min) is the
Materials 2021, 14, 6145 7 of 20
flow rate, qo (mg/kg) is the equilibrium adsorbate uptake, and m (kg) is the amount ofadsorbent (dry mass) in a fixed-bed.
2.6.2. Adams-Bohart Model
The Adams–Bohart model [57] was developed to analyze the dynamics of fixed-bedsystems. It is based on the hypothesis that the adsorption rate is related to both the residualadsorbent and adsorbate concentration. For the estimation of breakthrough curves andmodel parameters, the non-linear form of the Adams–Bohart model (Equation (11)) [58]was applied.
Ct
Co=
1
1 + exp[KABNo
Zv − KABCot
] (11)
where KAB (L/mg. min) is the kinetic constant, v (mL/min) is the linear flow rate, Z (cm) isa column bed depth, NO (mg/L) is the saturation concentration, and time t (min) rangesfrom the start to breakthrough points for fluoride. The linear flow rate (superficial velocity)was determined by Equation (12).
v =QA
(12)
where A is the cross-sectional area of the fixed-bed (cm2), and Q is the volumetric flowrate (mL/min).
The root-mean-squared error (RMSE) (Equation (13)) was used to measure the differ-ences between the results predicted by the models and experimental data.
RMSE =
√√√√ 1N
N
∑i=1
(predicted value − experimental value)2 (13)
where N is the number of data points.
3. Results and Discussions3.1. Characterization of Adsorbents3.1.1. Crystalline Structure
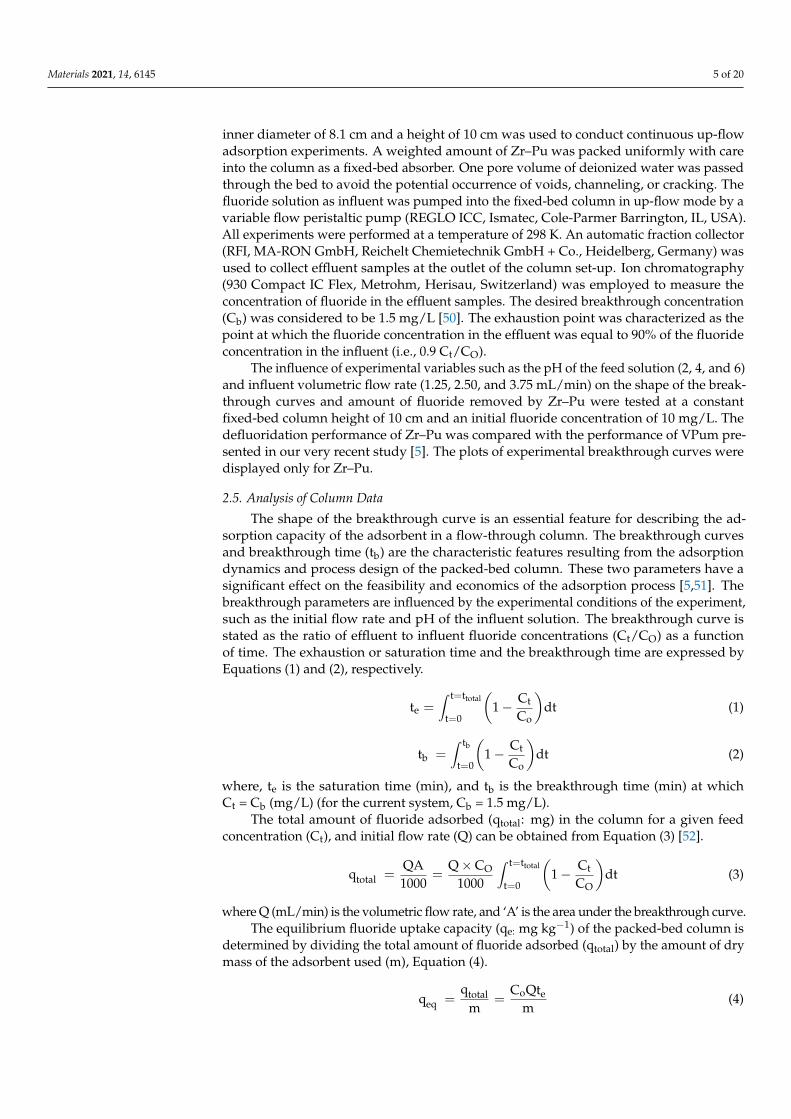
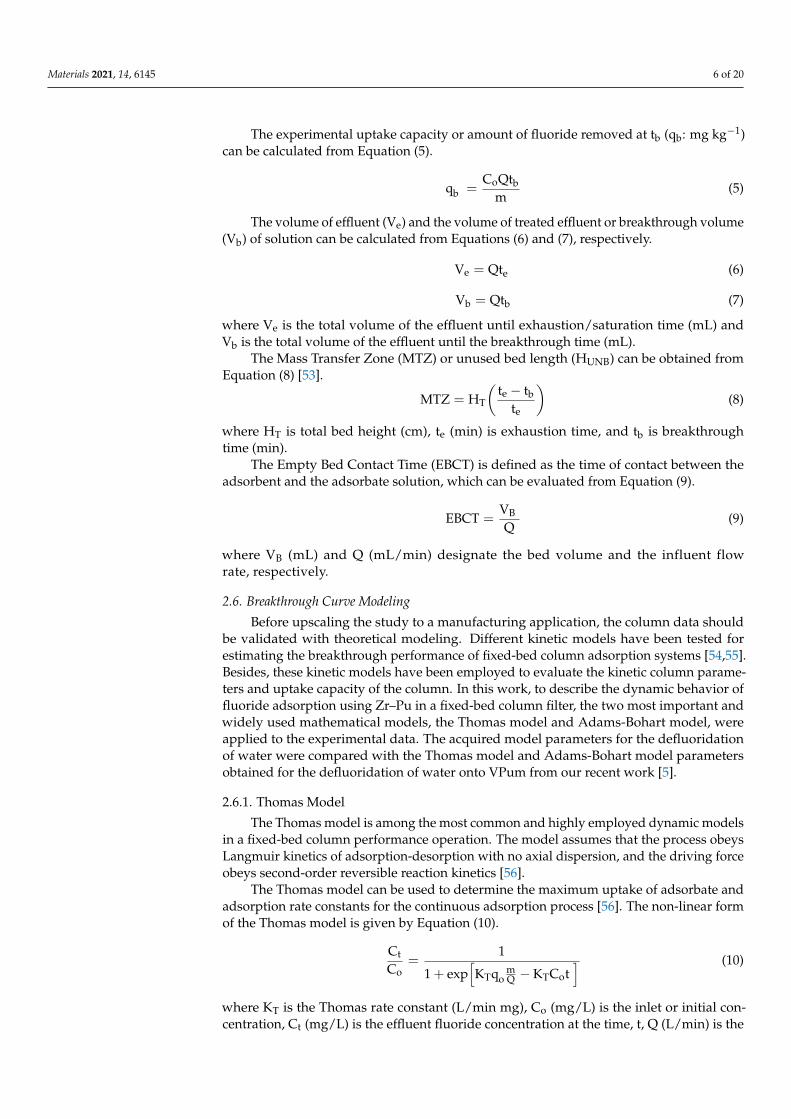
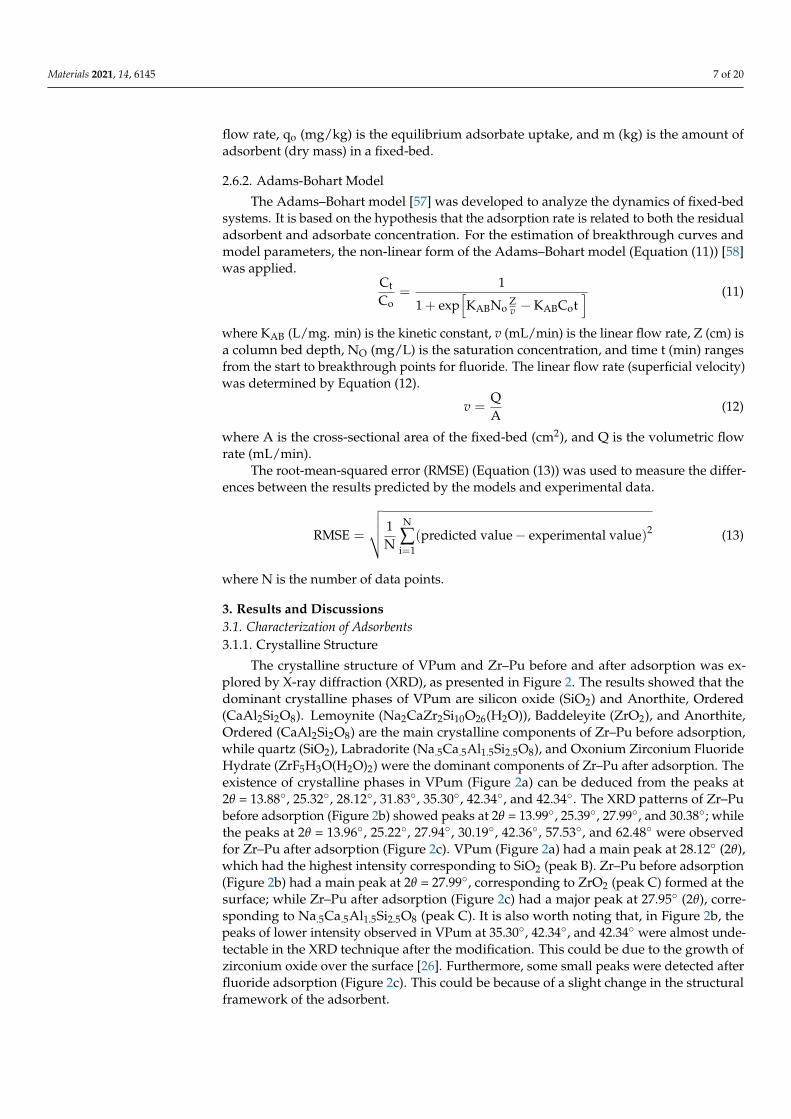
The crystalline structure of VPum and Zr–Pu before and after adsorption was ex-plored by X-ray diffraction (XRD), as presented in Figure 2. The results showed that thedominant crystalline phases of VPum are silicon oxide (SiO2) and Anorthite, Ordered(CaAl2Si2O8). Lemoynite (Na2CaZr2Si10O26(H2O)), Baddeleyite (ZrO2), and Anorthite,Ordered (CaAl2Si2O8) are the main crystalline components of Zr–Pu before adsorption,while quartz (SiO2), Labradorite (Na.5Ca.5Al1.5Si2.5O8), and Oxonium Zirconium FluorideHydrate (ZrF5H3O(H2O)2) were the dominant components of Zr–Pu after adsorption. Theexistence of crystalline phases in VPum (Figure 2a) can be deduced from the peaks at2θ = 13.88◦, 25.32◦, 28.12◦, 31.83◦, 35.30◦, 42.34◦, and 42.34◦. The XRD patterns of Zr–Pubefore adsorption (Figure 2b) showed peaks at 2θ = 13.99◦, 25.39◦, 27.99◦, and 30.38◦; whilethe peaks at 2θ = 13.96◦, 25.22◦, 27.94◦, 30.19◦, 42.36◦, 57.53◦, and 62.48◦ were observedfor Zr–Pu after adsorption (Figure 2c). VPum (Figure 2a) had a main peak at 28.12◦ (2θ),which had the highest intensity corresponding to SiO2 (peak B). Zr–Pu before adsorption(Figure 2b) had a main peak at 2θ = 27.99◦, corresponding to ZrO2 (peak C) formed at thesurface; while Zr–Pu after adsorption (Figure 2c) had a major peak at 27.95◦ (2θ), corre-sponding to Na.5Ca.5Al1.5Si2.5O8 (peak C). It is also worth noting that, in Figure 2b, thepeaks of lower intensity observed in VPum at 35.30◦, 42.34◦, and 42.34◦ were almost unde-tectable in the XRD technique after the modification. This could be due to the growth ofzirconium oxide over the surface [26]. Furthermore, some small peaks were detected afterfluoride adsorption (Figure 2c). This could be because of a slight change in the structuralframework of the adsorbent.
Materials 2021, 14, 6145 8 of 20
Materials 2021, 14, x FOR PEER REVIEW 8 of 20
to Na.5Ca.5Al1.5Si2.5O8 (peak C). It is also worth noting that, in Figure 2b, the peaks of lower intensity observed in VPum at 35.30°, 42.34°, and 42.34° were almost undetectable in the XRD technique after the modification. This could be due to the growth of zirconium oxide over the surface [26]. Furthermore, some small peaks were detected after fluoride adsorp-tion (Figure 2c). This could be because of a slight change in the structural framework of the adsorbent.
(a) (b)
(c)
Figure 2. XRD patterns for (a) VPum and Zirconium–coated pumice (Zr–Pu) (b) before and (c) after adsorption.
3.1.2. Chemical Composition The chemical analysis revealed that the major elements in VPum were Si, Al, K, and
Fe (Table 1). Other elements were available in limited fractions or were below the instru-ment’s detection limit.
Through XRF measurement, the main components of VPum are oxides of Si, Fe, K, and Al. A previous study has reported comparable values for natural pumice [59].
The average amount of zirconium coated onto VPum was 3.9% (wt). The XRF meas-urement designated that 8.9% (wt) (Table 1) zirconium oxide was coated on VPum, ena-bling it to enhance its fluoride removal capacity.
Figure 2. XRD patterns for (a) VPum and Zirconium–coated pumice (Zr–Pu) (b) before and (c) after adsorption.
3.1.2. Chemical Composition
The chemical analysis revealed that the major elements in VPum were Si, Al, K, and Fe(Table 1). Other elements were available in limited fractions or were below the instrument’sdetection limit.
Through XRF measurement, the main components of VPum are oxides of Si, Fe, K,and Al. A previous study has reported comparable values for natural pumice [59].
The average amount of zirconium coated onto VPum was 3.9% (wt). The XRF measure-ment designated that 8.9% (wt) (Table 1) zirconium oxide was coated on VPum, enabling itto enhance its fluoride removal capacity.
3.1.3. Fourier Transform Infrared (FTIR) Analysis
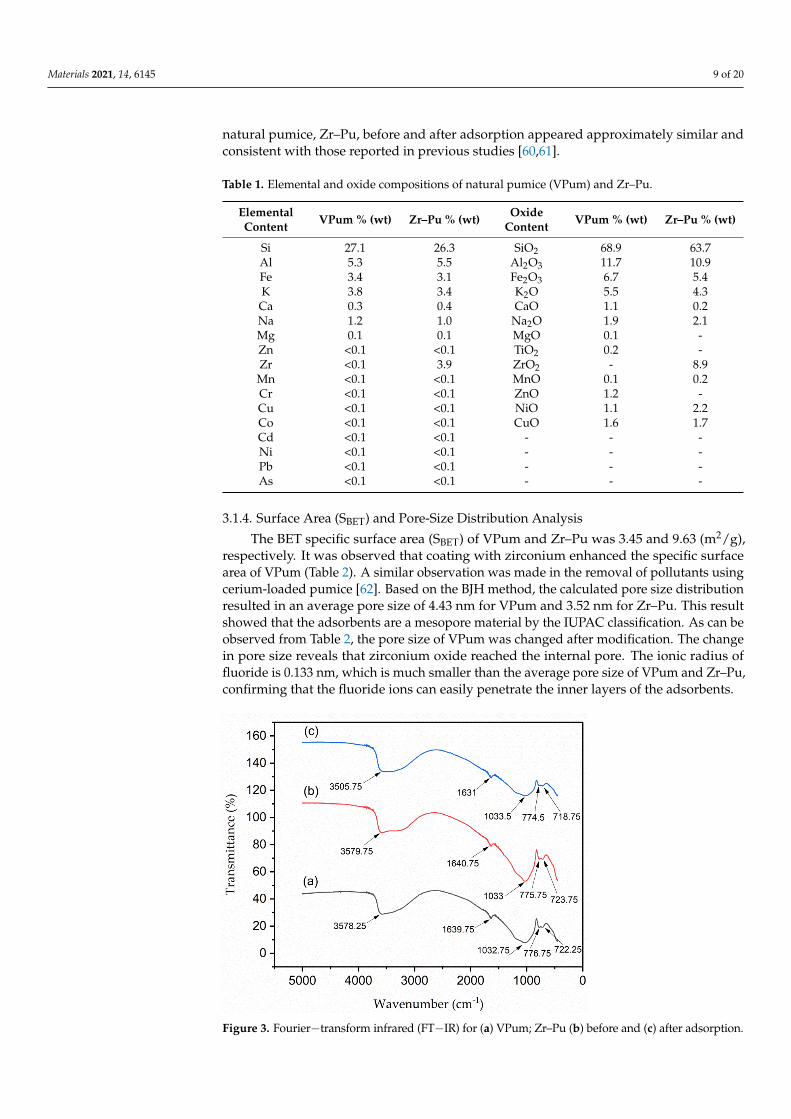
The FTIR spectrums of VPum, Zr–Pu before adsorption and after adsorption at wave-lengths between 400 cm−1 and 5000 cm−1 are shown in Figure 3a–c, respectively. Because ofthe Si–O–Si symmetric stretching vibration, the absorption band at ~1033 cm−1 can beattributed to the (SiO4)2− groups. The peaks at ~775.75 and ~723.75 cm−1 belong to thestretching and bending vibrations of the Si–O groups. Some peaks, like the broadeningpeak at ~3579.75 cm−1 that belongs to the asymmetric stretching vibration of the H–Obond, can be allocated to adsorbed water molecules, and the peak at ~1640.75 cm−1 can beallotted to the bending vibration of the H–O–H bond. In general, the IR spectrum of the
Materials 2021, 14, 6145 9 of 20
natural pumice, Zr–Pu, before and after adsorption appeared approximately similar andconsistent with those reported in previous studies [60,61].
Table 1. Elemental and oxide compositions of natural pumice (VPum) and Zr–Pu.
ElementalContent VPum % (wt) Zr–Pu % (wt) Oxide
Content VPum % (wt) Zr–Pu % (wt)
Si 27.1 26.3 SiO2 68.9 63.7Al 5.3 5.5 Al2O3 11.7 10.9Fe 3.4 3.1 Fe2O3 6.7 5.4K 3.8 3.4 K2O 5.5 4.3Ca 0.3 0.4 CaO 1.1 0.2Na 1.2 1.0 Na2O 1.9 2.1Mg 0.1 0.1 MgO 0.1 -Zn <0.1 <0.1 TiO2 0.2 -Zr <0.1 3.9 ZrO2 - 8.9Mn <0.1 <0.1 MnO 0.1 0.2Cr <0.1 <0.1 ZnO 1.2 -Cu <0.1 <0.1 NiO 1.1 2.2Co <0.1 <0.1 CuO 1.6 1.7Cd <0.1 <0.1 - - -Ni <0.1 <0.1 - - -Pb <0.1 <0.1 - - -As <0.1 <0.1 - - -
3.1.4. Surface Area (SBET) and Pore-Size Distribution Analysis
The BET specific surface area (SBET) of VPum and Zr–Pu was 3.45 and 9.63 (m2/g),respectively. It was observed that coating with zirconium enhanced the specific surfacearea of VPum (Table 2). A similar observation was made in the removal of pollutants usingcerium-loaded pumice [62]. Based on the BJH method, the calculated pore size distributionresulted in an average pore size of 4.43 nm for VPum and 3.52 nm for Zr–Pu. This resultshowed that the adsorbents are a mesopore material by the IUPAC classification. As can beobserved from Table 2, the pore size of VPum was changed after modification. The changein pore size reveals that zirconium oxide reached the internal pore. The ionic radius offluoride is 0.133 nm, which is much smaller than the average pore size of VPum and Zr–Pu,confirming that the fluoride ions can easily penetrate the inner layers of the adsorbents.
Materials 2021, 14, 6145 9 of 20
Table 1. Elemental and oxide compositions of natural pumice (VPum) and Zr–Pu.
Elemental Content VPum % (wt) Zr–Pu % (wt) Oxide Content VPum % (wt) Zr–Pu % (wt)
Si 27.1 26.3 SiO2 68.9 63.7
Al 5.3 5.5 Al2O3 11.7 10.9
Fe 3.4 3.1 Fe2O3 6.7 5.4
K 3.8 3.4 K2O 5.5 4.3
Ca 0.3 0.4 CaO 1.1 0.2
Na 1.2 1.0 Na2O 1.9 2.1
Mg 0.1 0.1 MgO 0.1 ‐
Zn < 0.1 < 0.1 TiO2 0.2 ‐
Zr < 0.1 3.9 ZrO2 ‐ 8.9
Mn < 0.1 < 0.1 MnO 0.1 0.2
Cr < 0.1 < 0.1 ZnO 1.2 ‐
Cu < 0.1 < 0.1 NiO 1.1 2.2
Co < 0.1 < 0.1 CuO 1.6 1.7
Cd < 0.1 < 0.1 ‐ ‐ ‐
Ni < 0.1 < 0.1 ‐ ‐ ‐
Pb < 0.1 < 0.1 ‐ ‐ ‐
As < 0.1 < 0.1 ‐ ‐ ‐
3.1.3. Fourier Transform Infrared (FTIR) Analysis
The FTIR spectrums of VPum, Zr–Pu before adsorption and after adsorption at wave‐
lengths between 400 cm−1 and 5000 cm−1 are shown in Figure 3a–c, respectively. Because
of the Si‐O‐Si symmetric stretching vibration, the absorption band at ~1033 cm−1 can be
attributed to the (SiO4)2− groups. The peaks at ~775.75 and ~723.75 cm−1 belong to the
stretching and bending vibrations of the Si‐O groups. Some peaks, like the broadening
peak at ~3579.75 cm−1 that belongs to the asymmetric stretching vibration of the H‐O bond,
can be allocated to adsorbed water molecules, and the peak at ~1640.75 cm−1 can be allotted
to the bending vibration of the H‐O‐H bond. In general, the IR spectrum of the natural
pumice, Zr–Pu, before and after adsorption appeared approximately similar and con‐
sistent with those reported in previous studies [60,61].
Figure 3. Fourier−transform infrared (FT−IR) for (a) VPum; Zr–Pu (b) before and (c) after adsorption.
Figure 3. Fourier−transform infrared (FT−IR) for (a) VPum; Zr–Pu (b) before and (c) after adsorption.
Materials 2021, 14, 6145 10 of 20
Table 2. Textural properties of VPum and Zr–Pu.
Adsorbent Specific Surface Area (m2/g) Average Pore Size (nm)
VPum 3.45 4.43Zr–Pu 9.63 3.52
3.1.5. Scanning Electron Microscope (SEM) Analysis
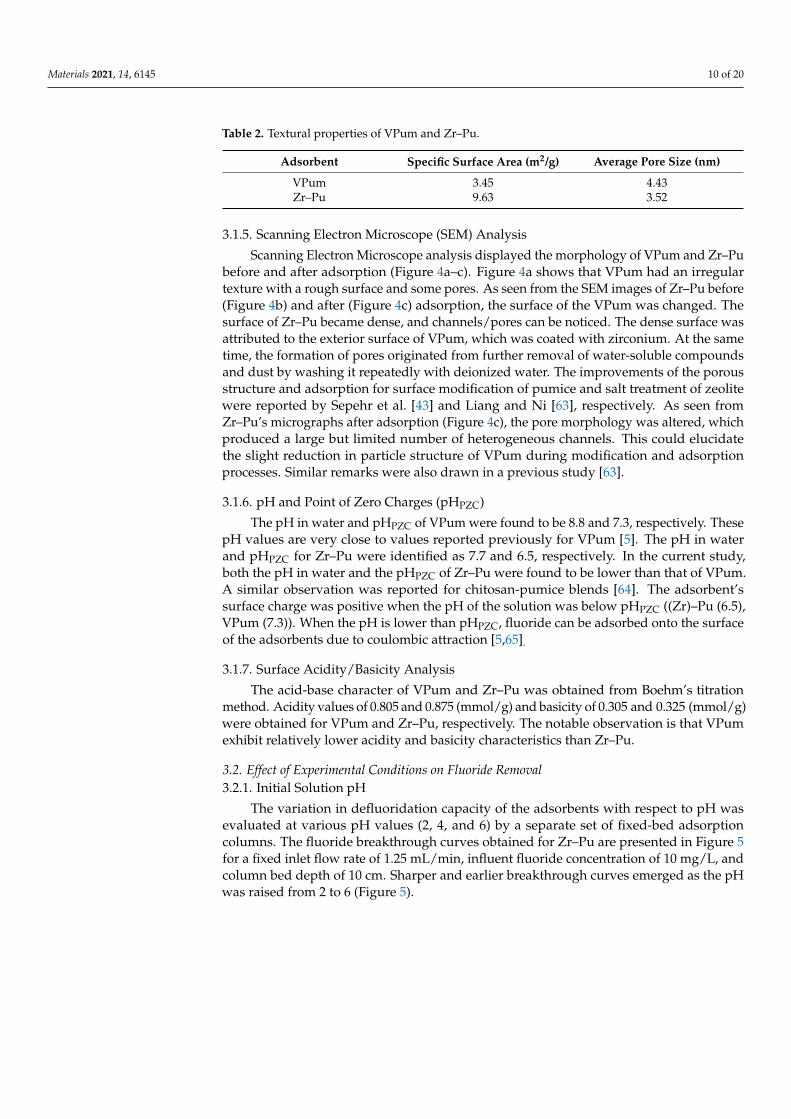
Scanning Electron Microscope analysis displayed the morphology of VPum and Zr–Pubefore and after adsorption (Figure 4a–c). Figure 4a shows that VPum had an irregulartexture with a rough surface and some pores. As seen from the SEM images of Zr–Pu before(Figure 4b) and after (Figure 4c) adsorption, the surface of the VPum was changed. Thesurface of Zr–Pu became dense, and channels/pores can be noticed. The dense surface wasattributed to the exterior surface of VPum, which was coated with zirconium. At the sametime, the formation of pores originated from further removal of water-soluble compoundsand dust by washing it repeatedly with deionized water. The improvements of the porousstructure and adsorption for surface modification of pumice and salt treatment of zeolitewere reported by Sepehr et al. [43] and Liang and Ni [63], respectively. As seen fromZr–Pu’s micrographs after adsorption (Figure 4c), the pore morphology was altered, whichproduced a large but limited number of heterogeneous channels. This could elucidatethe slight reduction in particle structure of VPum during modification and adsorptionprocesses. Similar remarks were also drawn in a previous study [63].
3.1.6. pH and Point of Zero Charges (pHPZC)
The pH in water and pHPZC of VPum were found to be 8.8 and 7.3, respectively. ThesepH values are very close to values reported previously for VPum [5]. The pH in waterand pHPZC for Zr–Pu were identified as 7.7 and 6.5, respectively. In the current study,both the pH in water and the pHPZC of Zr–Pu were found to be lower than that of VPum.A similar observation was reported for chitosan-pumice blends [64]. The adsorbent’ssurface charge was positive when the pH of the solution was below pHPZC ((Zr)–Pu (6.5),VPum (7.3)). When the pH is lower than pHPZC, fluoride can be adsorbed onto the surfaceof the adsorbents due to coulombic attraction [5,65].
3.1.7. Surface Acidity/Basicity Analysis
The acid-base character of VPum and Zr–Pu was obtained from Boehm’s titrationmethod. Acidity values of 0.805 and 0.875 (mmol/g) and basicity of 0.305 and 0.325 (mmol/g)were obtained for VPum and Zr–Pu, respectively. The notable observation is that VPumexhibit relatively lower acidity and basicity characteristics than Zr–Pu.
3.2. Effect of Experimental Conditions on Fluoride Removal3.2.1. Initial Solution pH
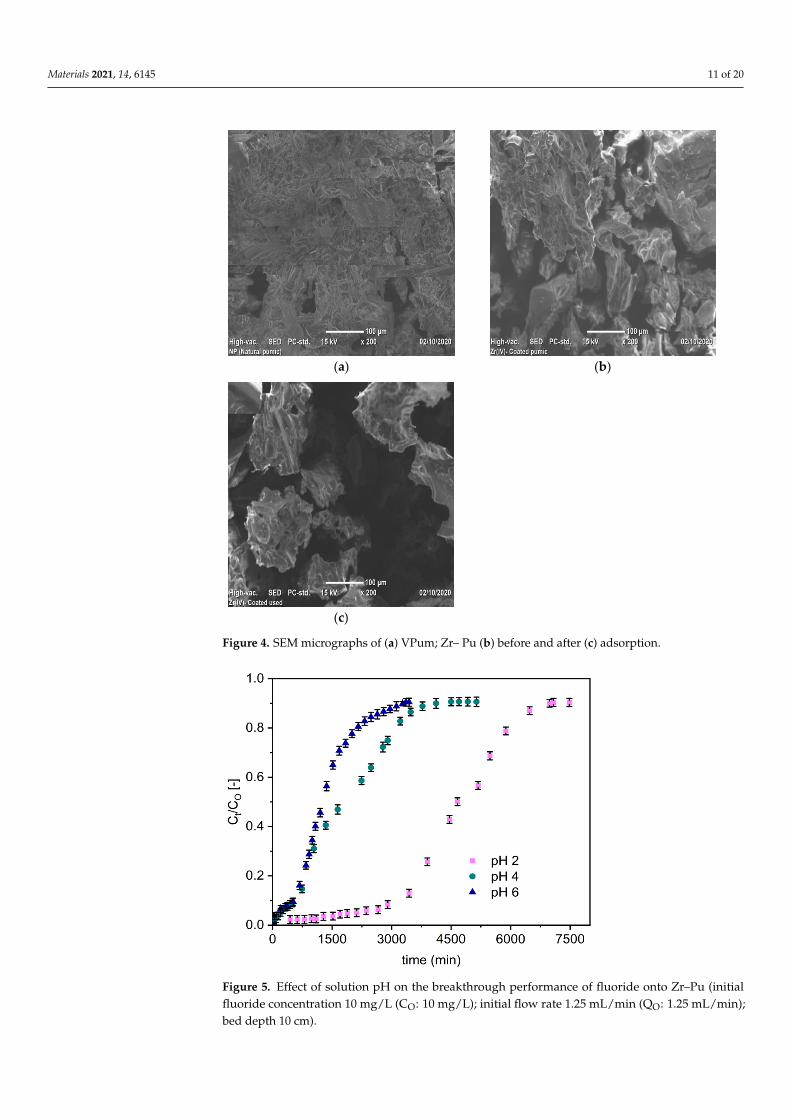
The variation in defluoridation capacity of the adsorbents with respect to pH wasevaluated at various pH values (2, 4, and 6) by a separate set of fixed-bed adsorptioncolumns. The fluoride breakthrough curves obtained for Zr–Pu are presented in Figure 5for a fixed inlet flow rate of 1.25 mL/min, influent fluoride concentration of 10 mg/L, andcolumn bed depth of 10 cm. Sharper and earlier breakthrough curves emerged as the pHwas raised from 2 to 6 (Figure 5).
Materials 2021, 14, 6145 11 of 20
Materials 2021, 14, 6145 10 of 20
3.1.4. Surface Area (SBET) and Pore‐Size Distribution Analysis
The BET specific surface area (SBET) of VPum and Zr–Pu was 3.45 and 9.63 (m2/g),
respectively. It was observed that coating with zirconium enhanced the specific surface
area of VPum (Table 2). A similar observation was made in the removal of pollutants using
cerium‐loaded pumice [62]. Based on the BJH method, the calculated pore size distribu‐
tion resulted in an average pore size of 4.43 nm for VPum and 3.52 nm for Zr–Pu. This
result showed that the adsorbents are a mesopore material by the IUPAC classification.
As can be observed from Table 2, the pore size of VPum was changed after modification.
The change in pore size reveals that zirconium oxide reached the internal pore. The ionic
radius of fluoride is 0.133 nm, which is much smaller than the average pore size of VPum
and Zr–Pu, confirming that the fluoride ions can easily penetrate the inner layers of the
adsorbents.
Table 2. Textural properties of VPum and Zr–Pu.
Adsorbent Specific Surface Area (m2/g) Average Pore Size (nm)
VPum 3.45 4.43
Zr–Pu 9.63 3.52
3.1.5. Scanning Electron Microscope (SEM) Analysis
Scanning Electron Microscope analysis displayed the morphology of VPum and Zr–
Pu before and after adsorption (Figure 4a–c). Figure 4a shows that VPum had an irregular
texture with a rough surface and some pores. As seen from the SEM images of Zr–Pu
before (Figure 4b) and after (Figure 4c) adsorption, the surface of the VPum was changed.
The surface of Zr–Pu became dense, and channels/pores can be noticed. The dense surface
was attributed to the exterior surface of VPum, which was coated with zirconium. At the
same time, the formation of pores originated from further removal of water‐soluble com‐
pounds and dust by washing it repeatedly with deionized water. The improvements of
the porous structure and adsorption for surface modification of pumice and salt treatment
of zeolite were reported by Sepehr et al. [43] and Liang and Ni [63], respectively. As seen
from Zr–Pu’s micrographs after adsorption (Figure 4c), the pore morphology was altered,
which produced a large but limited number of heterogeneous channels. This could eluci‐
date the slight reduction in particle structure of VPum during modification and adsorp‐
tion processes. Similar remarks were also drawn in a previous study [63].
(a) (b)
Materials 2021, 14, 6145 11 of 20
(c)
Figure 4. SEM micrographs of (a) VPum; Zr– Pu (b) before and after (c) adsorption.
3.1.6. pH and Point of Zero Charges (pHPZC)
The pH in water and pHPZC of VPum were found to be 8.8 and 7.3, respectively. These
pH values are very close to values reported previously for VPum [5]. The pH in water and
pHPZC for Zr–Pu were identified as 7.7 and 6.5, respectively. In the current study, both the
pH in water and the pHPZC of Zr–Pu were found to be lower than that of VPum. A similar
observation was reported for chitosan‐pumice blends [64]. The adsorbent’s surface charge
was positive when the pH of the solution was below pHPZC ((Zr)–Pu (6.5), VPum (7.3)).
When the pH is lower than pHPZC, fluoride can be adsorbed onto the surface of the adsor‐
bents due to coulombic attraction [5,65].
3.1.7. Surface Acidity/Basicity Analysis
The acid‐base character of VPum and Zr–Pu was obtained from Boehm’s titration
method. Acidity values of 0.805 and 0.875 (mmol/g) and basicity of 0.305 and 0.325
(mmol/g) were obtained for VPum and Zr–Pu, respectively. The notable observation is
that VPum exhibit relatively lower acidity and basicity characteristics than Zr–Pu.
3.2. Effect of Experimental Conditions on Fluoride Removal
3.2.1. Initial Solution pH
The variation in defluoridation capacity of the adsorbents with respect to pH was
evaluated at various pH values (2, 4, and 6) by a separate set of fixed‐bed adsorption col‐
umns. The fluoride breakthrough curves obtained for Zr–Pu are presented in Figure 5 for
a fixed inlet flow rate of 1.25 mL/min, influent fluoride concentration of 10 mg/L, and
column bed depth of 10 cm. Sharper and earlier breakthrough curves emerged as the pH
was raised from 2 to 6 (Figure 5).
The column adsorption parameters obtained for uptake of fluoride onto Zr–Pu, and
VPum are presented in Table 3. Reduced mass transfer zone values were found at a low
pH level (pH 2), resulting in longer breakthrough and exhaustion times. Furthermore, a
lower solution pH (pH 2) improved column performances, increased treated water vol‐
ume, improved defluoridation efficacy, and enhanced adsorption capability at break‐
through and exhaustion time. The highest fluoride uptake capacity was 225 mg/kg by Zr–
Pu, whereas the fluoride uptake was 110 mg/kg by VPum. This showed Zr–Pu removed
2.05 times fluoride compared to the VPum. The breakthrough capacity of Zr–Pu was 163
mg/kg (3.02 times that of VPum (54 mg/kg)). A breakthrough time of 3471 min for Zr–Pu
and 1206 min for VPum; and an exhaustion time of 4781 min for Zr– Pu and 2339 min for
VPum were achieved at a pH of 2. Hence, VPum has the quickest time to breakthrough
and exhaustion, while Zr–Pu had the longest time to breakthrough and exhaustion and a
Figure 4. SEM micrographs of (a) VPum; Zr– Pu (b) before and after (c) adsorption.
Materials 2021, 14, 6145 12 of 20
better adsorption capacity. When the initial pH values of the solution were greater than
two, the fluoride removal rate for Zr–Pu, and VPum decreased (Table 3). At pH values of
four and six, the decrease in the fluoride uptake may be ascribed to the decrease in the
amount of H+ or HF adsorption because of electrostatic attraction [5,66]. The higher uptake
capacity at pH 2 could be attributed to the fact that the adsorbent surface has more posi‐
tive charges at lower pH and electrostatically adsorbs fluoride ions [66]. Hence, the ad‐
sorption of fluoride ions was due to an electrostatic phenomenon and surface complexa‐
tion, which can occur alone or in combination with the fluoride ion’s uptake on the adsor‐
bents. In general, Zr–Pu, and VPum showed similar pH‐dependent fluoride uptake per‐
formances. However, a noticeable performance enhancement was seen due to the zirco‐
nium coating, primarily because of the specific interaction between fluoride ions and zir‐
conium (hydr) oxide. A similar observation was made in the removal of pollutants using
cerium‐loaded volcanic rocks [62].
Figure 5. Effect of solution pH on the breakthrough performance of fluoride onto Zr–Pu (initial
fluoride concentration 10 mg/L (CO: 10 mg/L); initial flow rate 1.25 mL/min (QO: 1.25 mL/min); bed
depth 10 cm).
The breakthrough time was longer, and the volume of treated water was high at pH
2 for Zr–Pu. Accordingly, the pH of the solution was maintained at pH 2 in the subsequent
experiment.
Table 3. Fixed‐bed column parameters obtained for defluoridation by zirconium–coated pumice (Zr–Pu) and on VPum
(recent study) [5].
Parameter Studied pH CO
(mg/L)
QO
(mL/min)
EBCT
(min)
tb
(min)
te
(min)
Vb
(mL)
Ve
(mL)
MTZ
(cm)
qb
(mg/kg)
qtot
(mg)
qe
(mg/kg) Adsorbent
Variation of pH
keeping CO and QO
constant
2 10 1.25 412 3471 4781 4338.94 5976.76 2.74 163.18 59.78 224.78
Zr–Pu 4 10 1.25 412 689 2058 861.25 2572.50 6.65 32.39 25.73 96.75
6 10 1.25 412 604 1469 755.00 1836.25 5.89 28.39 18.36 69.06
2 10 1.25 412 1206 2339 1507.50 2923.70 4.84 54.20 29.24 110.00
VPum 4 10 1.25 412 278 500 347.50 625.00 4.44 13.00 6.25 23.51
6 10 1.25 412 135 315 168.75 393.75 5.71 6.40 3.94 14.81
Variation of QO
keeping pH and CO
constant
2 10 1.25 412 3471 4781 4338.94 5976.76 2.74 163.18 59.78 224.78
Zr–Pu 2 10 2.50 206 1807 1360 2717.50 3400.00 2.00 102.20 34.00 127.87
2 10 3.75 137 557 768 2088.75 2880.00 2.75 78.55 28.80 108.31
2 10 1.25 412 1206 2339 1507.50 2923.70 4.84 54.20 29.24 110.00 VPum
Figure 5. Effect of solution pH on the breakthrough performance of fluoride onto Zr–Pu (initialfluoride concentration 10 mg/L (CO: 10 mg/L); initial flow rate 1.25 mL/min (QO: 1.25 mL/min);bed depth 10 cm).
Materials 2021, 14, 6145 12 of 20
The column adsorption parameters obtained for uptake of fluoride onto Zr–Pu, andVPum are presented in Table 3. Reduced mass transfer zone values were found at a lowpH level (pH 2), resulting in longer breakthrough and exhaustion times. Furthermore, alower solution pH (pH 2) improved column performances, increased treated water volume,improved defluoridation efficacy, and enhanced adsorption capability at breakthrough andexhaustion time. The highest fluoride uptake capacity was 225 mg/kg by Zr–Pu, whereasthe fluoride uptake was 110 mg/kg by VPum. This showed Zr–Pu removed 2.05 timesfluoride compared to the VPum. The breakthrough capacity of Zr–Pu was 163 mg/kg(3.02 times that of VPum (54 mg/kg)). A breakthrough time of 3471 min for Zr–Pu and1206 min for VPum; and an exhaustion time of 4781 min for Zr– Pu and 2339 min for VPumwere achieved at a pH of 2. Hence, VPum has the quickest time to breakthrough andexhaustion, while Zr–Pu had the longest time to breakthrough and exhaustion and a betteradsorption capacity. When the initial pH values of the solution were greater than two, thefluoride removal rate for Zr–Pu, and VPum decreased (Table 3). At pH values of four andsix, the decrease in the fluoride uptake may be ascribed to the decrease in the amount ofH+ or HF adsorption because of electrostatic attraction [5,66]. The higher uptake capacityat pH 2 could be attributed to the fact that the adsorbent surface has more positive chargesat lower pH and electrostatically adsorbs fluoride ions [66]. Hence, the adsorption offluoride ions was due to an electrostatic phenomenon and surface complexation, which canoccur alone or in combination with the fluoride ion’s uptake on the adsorbents. In general,Zr–Pu, and VPum showed similar pH-dependent fluoride uptake performances. However,a noticeable performance enhancement was seen due to the zirconium coating, primarilybecause of the specific interaction between fluoride ions and zirconium (hydr) oxide. Asimilar observation was made in the removal of pollutants using cerium-loaded volcanicrocks [62].
Table 3. Fixed-bed column parameters obtained for defluoridation by zirconium–coated pumice (Zr–Pu) and on VPum(recent study) [5].
Parameter Studied pH CO(mg/L)
QO(mL/min)
EBCT(min)
tb(min)
te(min)
Vb(mL)
Ve(mL)
MTZ(cm)
qb(mg/kg)
qtot(mg)
qe(mg/kg) Adsorbent
Variation of pHkeeping CO and
QO constant
2 10 1.25 412 3471 4781 4338.94 5976.76 2.74 163.18 59.78 224.78Zr–Pu4 10 1.25 412 689 2058 861.25 2572.50 6.65 32.39 25.73 96.75
6 10 1.25 412 604 1469 755.00 1836.25 5.89 28.39 18.36 69.06
2 10 1.25 412 1206 2339 1507.50 2923.70 4.84 54.20 29.24 110.00VPum4 10 1.25 412 278 500 347.50 625.00 4.44 13.00 6.25 23.51
6 10 1.25 412 135 315 168.75 393.75 5.71 6.40 3.94 14.81
Variation of QOkeeping pH and
CO constant
2 10 1.25 412 3471 4781 4338.94 5976.76 2.74 163.18 59.78 224.78Zr–Pu2 10 2.50 206 1807 1360 2717.50 3400.00 2.00 102.20 34.00 127.87
2 10 3.75 137 557 768 2088.75 2880.00 2.75 78.55 28.80 108.31
2 10 1.25 412 1206 2339 1507.50 2923.70 4.84 54.20 29.24 110.00VPum2 10 2.50 206 215 634 538.47 1585.16 6.60 20.30 7.93 29.80
2 10 3.75 137 75 359 282.69 1346.42 7.90 7.10 4.49 16.89
tb = breakthrough time, te = exhaustion time, Vb = total effluent volume at a breakthrough time, Ve = total effluent volume at exhaustiontime MTZ = Mass Transfer Zone, EBCT = Empty Bed Contact Time, qb = amount of fluoride removed at a breakthrough time per kg ofadsorbent, qtotal = total amount of fluoride adsorbed from the column, qe = equilibrium fluoride uptake per kg of the adsorbent.
The breakthrough time was longer, and the volume of treated water was high atpH 2 for Zr–Pu. Accordingly, the pH of the solution was maintained at pH 2 in thesubsequent experiment.
3.2.2. Flow Rate
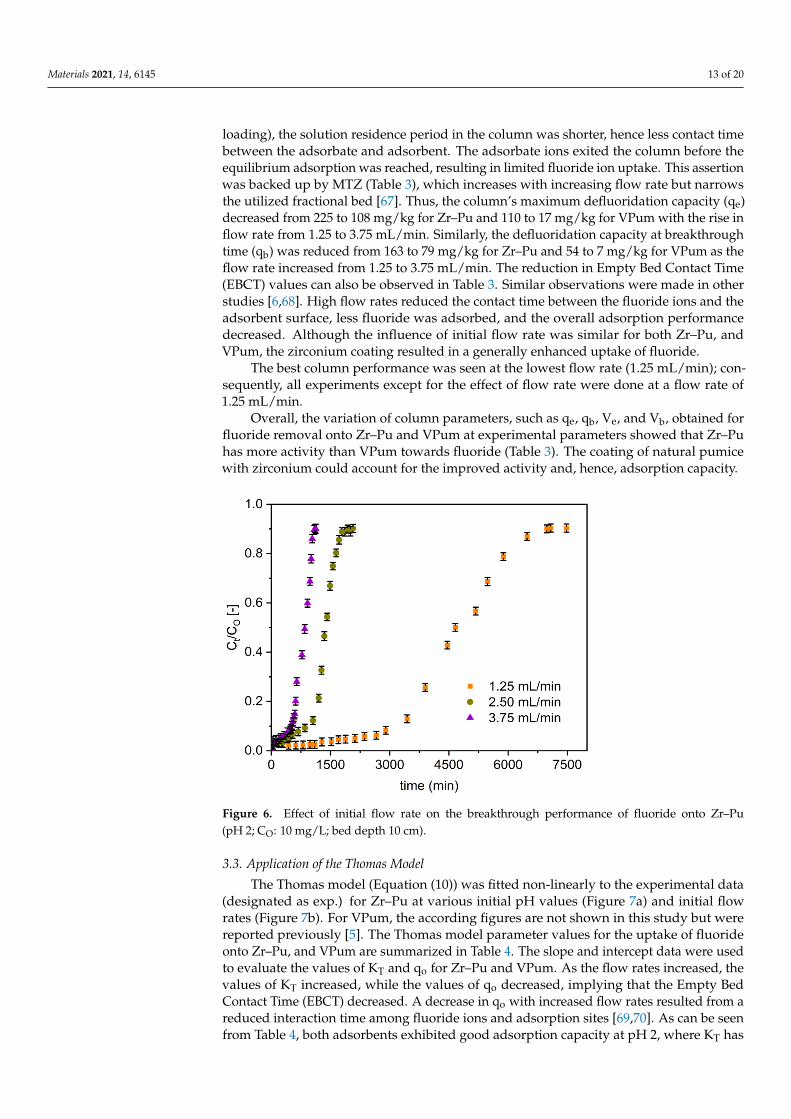
Figure 6 presents the effect of various flow rates (1.25, 2.50, and 3.75 mL/min) on the flu-oride breakthrough curves of Zr–Pu. When the flow rate increased from 1.25 to 3.75 mL/min,the breakthrough curves became steeper and occurred earlier (Figure 6). The breakthroughdata displayed in Table 3 also confirmed that the flow rate rose from 1.25 to 3.75 mL/minresulted in the reduction of breakthrough time from 3471 to 557 min for Zr–Pu and from1206 to 75 min for VPum. The exhaustion time also reduced from 4781 to 768 min and from2339 to 359 min, Zr–Pu and VPum, respectively. At higher flow rates (higher hydraulic
Materials 2021, 14, 6145 13 of 20
loading), the solution residence period in the column was shorter, hence less contact timebetween the adsorbate and adsorbent. The adsorbate ions exited the column before theequilibrium adsorption was reached, resulting in limited fluoride ion uptake. This assertionwas backed up by MTZ (Table 3), which increases with increasing flow rate but narrowsthe utilized fractional bed [67]. Thus, the column’s maximum defluoridation capacity (qe)decreased from 225 to 108 mg/kg for Zr–Pu and 110 to 17 mg/kg for VPum with the rise inflow rate from 1.25 to 3.75 mL/min. Similarly, the defluoridation capacity at breakthroughtime (qb) was reduced from 163 to 79 mg/kg for Zr–Pu and 54 to 7 mg/kg for VPum as theflow rate increased from 1.25 to 3.75 mL/min. The reduction in Empty Bed Contact Time(EBCT) values can also be observed in Table 3. Similar observations were made in otherstudies [6,68]. High flow rates reduced the contact time between the fluoride ions and theadsorbent surface, less fluoride was adsorbed, and the overall adsorption performancedecreased. Although the influence of initial flow rate was similar for both Zr–Pu, andVPum, the zirconium coating resulted in a generally enhanced uptake of fluoride.
The best column performance was seen at the lowest flow rate (1.25 mL/min); con-sequently, all experiments except for the effect of flow rate were done at a flow rate of1.25 mL/min.
Overall, the variation of column parameters, such as qe, qb, Ve, and Vb, obtained forfluoride removal onto Zr–Pu and VPum at experimental parameters showed that Zr–Puhas more activity than VPum towards fluoride (Table 3). The coating of natural pumicewith zirconium could account for the improved activity and, hence, adsorption capacity.
Materials 2021, 14, 6145 13 of 20
2 10 2.50 206 215 634 538.47 1585.16 6.60 20.30 7.93 29.80
2 10 3.75 137 75 359 282.69 1346.42 7.90 7.10 4.49 16.89
tb = breakthrough time, te = exhaustion time, Vb = total effluent volume at a breakthrough time, Ve = total effluent volume
at exhaustion time MTZ = Mass Transfer Zone, EBCT = Empty Bed Contact Time, qb = amount of fluoride removed at a
breakthrough time per kg of adsorbent, qtotal = total amount of fluoride adsorbed from the column, qe = equilibrium fluoride
uptake per kg of the adsorbent.
3.2.2. Flow Rate
Figure 6 presents the effect of various flow rates (1.25, 2.50, and 3.75 mL/min) on the
fluoride breakthrough curves of Zr–Pu. When the flow rate increased from 1.25 to 3.75
mL/min, the breakthrough curves became steeper and occurred earlier (Figure 6). The
breakthrough data displayed in Table 3 also confirmed that the flow rate rose from 1.25
to 3.75 mL/min resulted in the reduction of breakthrough time from 3471 to 557 min for
Zr–Pu and from 1206 to 75 min for VPum. The exhaustion time also reduced from 4781 to
768 min and from 2339 to 359 min, Zr–Pu and VPum, respectively. At higher flow rates
(higher hydraulic loading), the solution residence period in the column was shorter, hence
less contact time between the adsorbate and adsorbent. The adsorbate ions exited the col‐
umn before the equilibrium adsorption was reached, resulting in limited fluoride ion up‐
take. This assertion was backed up by MTZ (Table 3), which increases with increasing
flow rate but narrows the utilized fractional bed [67]. Thus, the column’s maximum
defluoridation capacity (qe) decreased from 225 to 108 mg/kg for Zr–Pu and 110 to 17
mg/kg for VPum with the rise in flow rate from 1.25 to 3.75 mL/min. Similarly, the defluor‐
idation capacity at breakthrough time (qb) was reduced from 163 to 79 mg/kg for Zr–Pu
and 54 to 7 mg/kg for VPum as the flow rate increased from 1.25 to 3.75 mL/min. The
reduction in Empty Bed Contact Time (EBCT) values can also be observed in Table 3. Sim‐
ilar observations were made in other studies [6,68]. High flow rates reduced the contact
time between the fluoride ions and the adsorbent surface, less fluoride was adsorbed, and
the overall adsorption performance decreased. Although the influence of initial flow rate
was similar for both Zr–Pu, and VPum, the zirconium coating resulted in a generally en‐
hanced uptake of fluoride.
The best column performance was seen at the lowest flow rate (1.25 mL/min); conse‐
quently, all experiments except for the effect of flow rate were done at a flow rate of 1.25
mL/min.
Figure 6. Effect of initial flow rate on the breakthrough performance of fluoride onto Zr–Pu (pH 2;
CO: 10 mg/L; bed depth 10 cm). Figure 6. Effect of initial flow rate on the breakthrough performance of fluoride onto Zr–Pu(pH 2; CO: 10 mg/L; bed depth 10 cm).
3.3. Application of the Thomas Model
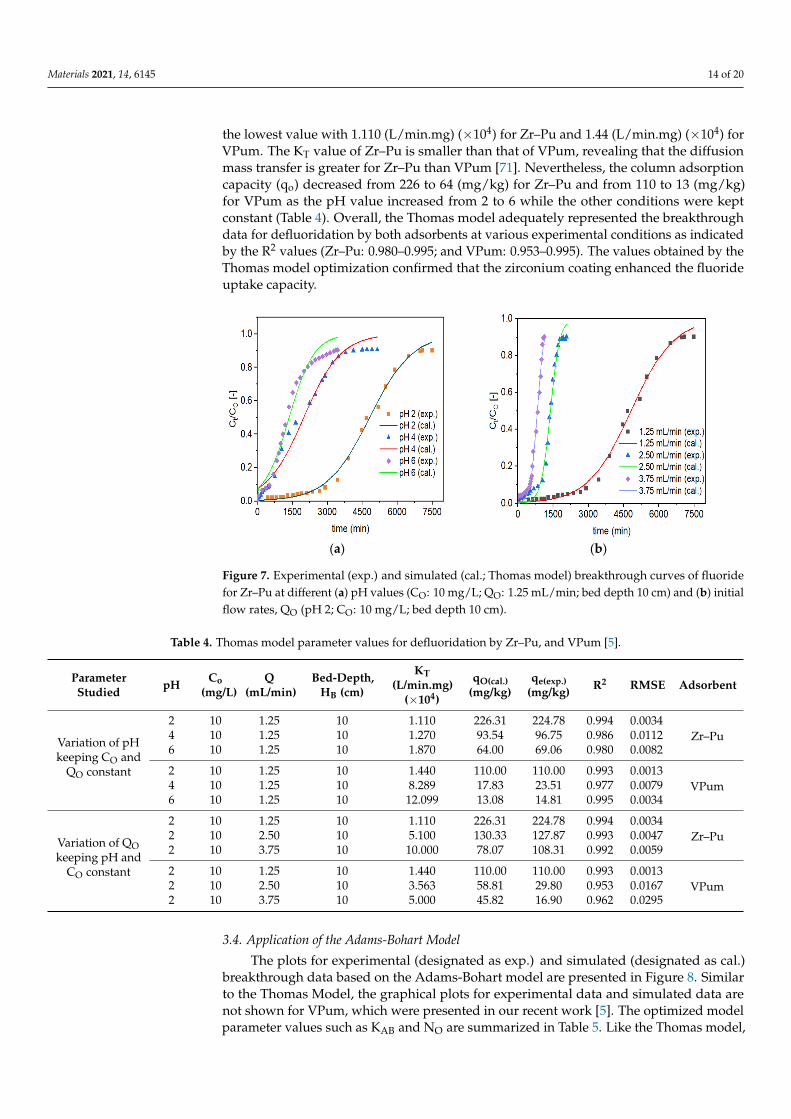
The Thomas model (Equation (10)) was fitted non-linearly to the experimental data(designated as exp.) for Zr–Pu at various initial pH values (Figure 7a) and initial flowrates (Figure 7b). For VPum, the according figures are not shown in this study but werereported previously [5]. The Thomas model parameter values for the uptake of fluorideonto Zr–Pu, and VPum are summarized in Table 4. The slope and intercept data were usedto evaluate the values of KT and qo for Zr–Pu and VPum. As the flow rates increased, thevalues of KT increased, while the values of qo decreased, implying that the Empty BedContact Time (EBCT) decreased. A decrease in qo with increased flow rates resulted from areduced interaction time among fluoride ions and adsorption sites [69,70]. As can be seenfrom Table 4, both adsorbents exhibited good adsorption capacity at pH 2, where KT has
Materials 2021, 14, 6145 14 of 20
the lowest value with 1.110 (L/min.mg) (×104) for Zr–Pu and 1.44 (L/min.mg) (×104) forVPum. The KT value of Zr–Pu is smaller than that of VPum, revealing that the diffusionmass transfer is greater for Zr–Pu than VPum [71]. Nevertheless, the column adsorptioncapacity (qo) decreased from 226 to 64 (mg/kg) for Zr–Pu and from 110 to 13 (mg/kg)for VPum as the pH value increased from 2 to 6 while the other conditions were keptconstant (Table 4). Overall, the Thomas model adequately represented the breakthroughdata for defluoridation by both adsorbents at various experimental conditions as indicatedby the R2 values (Zr–Pu: 0.980–0.995; and VPum: 0.953–0.995). The values obtained by theThomas model optimization confirmed that the zirconium coating enhanced the fluorideuptake capacity.
Materials 2021, 14, 6145 15 of 20
(a) (b)
Figure 7. Experimental (exp.) and simulated (cal.; Thomas model) breakthrough curves of fluoride
for Zr–Pu at different (a) pH values (CO: 10 mg/L; QO: 1.25 mL/min; bed depth 10 cm) and (b) initial
flow rates, QO (pH 2; CO: 10 mg/L; bed depth 10 cm).
3.4. Application of the Adams‐Bohart Model
The plots for experimental (designated as exp.) and simulated (designated as cal.)
breakthrough data based on the Adams‐Bohart model are presented in Figure 8. Similar
to the Thomas Model, the graphical plots for experimental data and simulated data are
not shown for VPum, which were presented in our recent work [5]. The optimized model
parameter values such as KAB and NO are summarized in Table 5. Like the Thomas model,
it can also be possible to deduce that the increase in KAB with increased flow rates or de‐
creased EBCT decreases the values of NO. A decrease in NO with increasing flow rates was
attributed to EBCT reduction due to the direct proportion of the adsorption capacity to
the interaction time. Similar observations were reported in previous studies [69,71]. Simi‐
lar to the Thomas model, at pH 2, with a lower KAB value (1.110 (L/min∙mg) (×104) for Zr–
Pu and 2.568 (L/min∙mg) (×104) for VPum), both materials showed good adsorption prop‐
erties (Table 5).
(a) (b)
Figure 8. Experimental (exp.) and simulated (cal.; Adams‐Bohart model) breakthrough curves of
fluoride for Zr–Pu at different (a) pH values (CO: 10 mg/L; QO: 1.25 mL/min; bed depth 10 cm) and
(b) QO (pH 2; CO: 10 mg/L; bed depth 10 cm).
The lower value of KAB for Zr–Pu than VPum suggests that the mass transfer by dif‐
fusion within the column packed with Zr–Pu was superior to VPum [71]. However, it is
clear from Table 5 that the values of NO decreased from 117 to 33 mg/L for Zr–Pu and from
Figure 7. Experimental (exp.) and simulated (cal.; Thomas model) breakthrough curves of fluoridefor Zr–Pu at different (a) pH values (CO: 10 mg/L; QO: 1.25 mL/min; bed depth 10 cm) and (b) initialflow rates, QO (pH 2; CO: 10 mg/L; bed depth 10 cm).
Table 4. Thomas model parameter values for defluoridation by Zr–Pu, and VPum [5].
ParameterStudied pH Co
(mg/L)Q
(mL/min)Bed-Depth,
HB (cm)
KT(L/min.mg)
(×104)
qO(cal.)(mg/kg)
qe(exp.)(mg/kg) R2 RMSE Adsorbent
Variation of pHkeeping CO and
QO constant
2 10 1.25 10 1.110 226.31 224.78 0.994 0.0034Zr–Pu4 10 1.25 10 1.270 93.54 96.75 0.986 0.0112
6 10 1.25 10 1.870 64.00 69.06 0.980 0.0082
2 10 1.25 10 1.440 110.00 110.00 0.993 0.0013VPum4 10 1.25 10 8.289 17.83 23.51 0.977 0.0079
6 10 1.25 10 12.099 13.08 14.81 0.995 0.0034
Variation of QOkeeping pH and
CO constant
2 10 1.25 10 1.110 226.31 224.78 0.994 0.0034Zr–Pu2 10 2.50 10 5.100 130.33 127.87 0.993 0.0047
2 10 3.75 10 10.000 78.07 108.31 0.992 0.0059
2 10 1.25 10 1.440 110.00 110.00 0.993 0.0013VPum2 10 2.50 10 3.563 58.81 29.80 0.953 0.0167
2 10 3.75 10 5.000 45.82 16.90 0.962 0.0295
3.4. Application of the Adams-Bohart Model
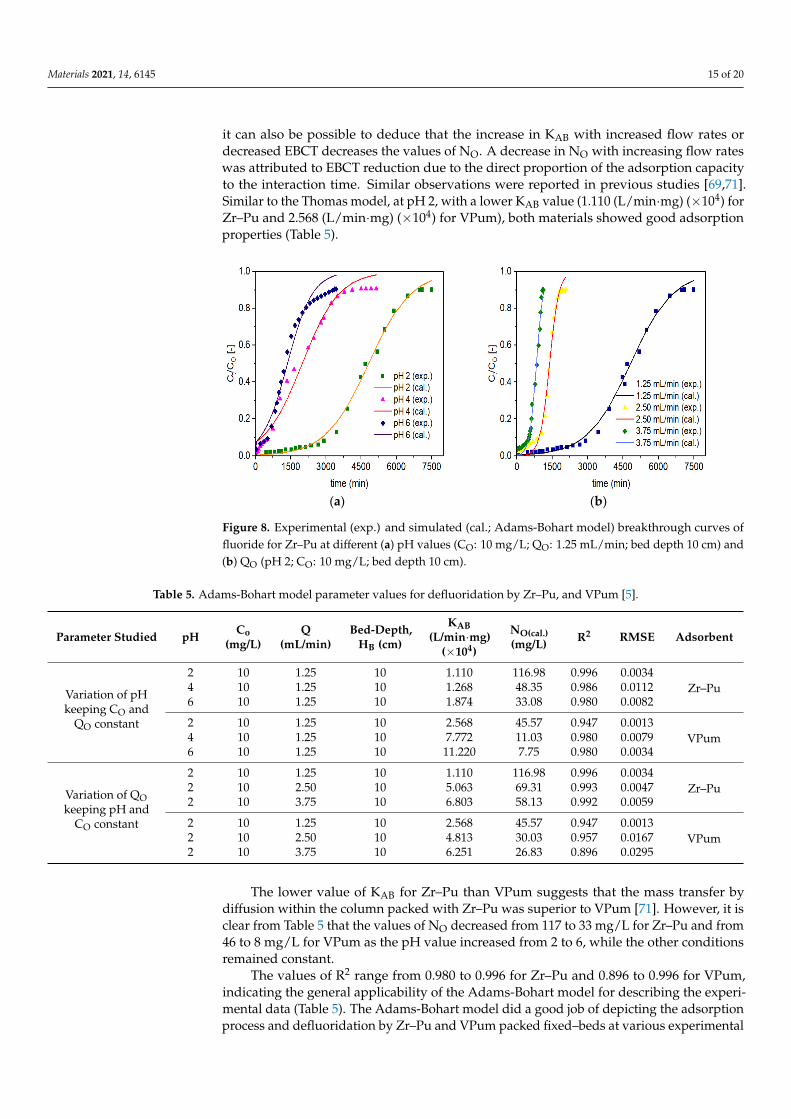
The plots for experimental (designated as exp.) and simulated (designated as cal.)breakthrough data based on the Adams-Bohart model are presented in Figure 8. Similarto the Thomas Model, the graphical plots for experimental data and simulated data arenot shown for VPum, which were presented in our recent work [5]. The optimized modelparameter values such as KAB and NO are summarized in Table 5. Like the Thomas model,
Materials 2021, 14, 6145 15 of 20
it can also be possible to deduce that the increase in KAB with increased flow rates ordecreased EBCT decreases the values of NO. A decrease in NO with increasing flow rateswas attributed to EBCT reduction due to the direct proportion of the adsorption capacityto the interaction time. Similar observations were reported in previous studies [69,71].Similar to the Thomas model, at pH 2, with a lower KAB value (1.110 (L/min·mg) (×104) forZr–Pu and 2.568 (L/min·mg) (×104) for VPum), both materials showed good adsorptionproperties (Table 5).
Materials 2021, 14, 6145 15 of 20
(a) (b)
Figure 7. Experimental (exp.) and simulated (cal.; Thomas model) breakthrough curves of fluoride
for Zr–Pu at different (a) pH values (CO: 10 mg/L; QO: 1.25 mL/min; bed depth 10 cm) and (b) initial
flow rates, QO (pH 2; CO: 10 mg/L; bed depth 10 cm).
3.4. Application of the Adams‐Bohart Model
The plots for experimental (designated as exp.) and simulated (designated as cal.)
breakthrough data based on the Adams‐Bohart model are presented in Figure 8. Similar
to the Thomas Model, the graphical plots for experimental data and simulated data are
not shown for VPum, which were presented in our recent work [5]. The optimized model
parameter values such as KAB and NO are summarized in Table 5. Like the Thomas model,
it can also be possible to deduce that the increase in KAB with increased flow rates or de‐
creased EBCT decreases the values of NO. A decrease in NO with increasing flow rates was
attributed to EBCT reduction due to the direct proportion of the adsorption capacity to
the interaction time. Similar observations were reported in previous studies [69,71]. Simi‐
lar to the Thomas model, at pH 2, with a lower KAB value (1.110 (L/min∙mg) (×104) for Zr–
Pu and 2.568 (L/min∙mg) (×104) for VPum), both materials showed good adsorption prop‐
erties (Table 5).
(a) (b)
Figure 8. Experimental (exp.) and simulated (cal.; Adams‐Bohart model) breakthrough curves of
fluoride for Zr–Pu at different (a) pH values (CO: 10 mg/L; QO: 1.25 mL/min; bed depth 10 cm) and
(b) QO (pH 2; CO: 10 mg/L; bed depth 10 cm).
The lower value of KAB for Zr–Pu than VPum suggests that the mass transfer by dif‐
fusion within the column packed with Zr–Pu was superior to VPum [71]. However, it is
clear from Table 5 that the values of NO decreased from 117 to 33 mg/L for Zr–Pu and from
Figure 8. Experimental (exp.) and simulated (cal.; Adams-Bohart model) breakthrough curves offluoride for Zr–Pu at different (a) pH values (CO: 10 mg/L; QO: 1.25 mL/min; bed depth 10 cm) and(b) QO (pH 2; CO: 10 mg/L; bed depth 10 cm).
Table 5. Adams-Bohart model parameter values for defluoridation by Zr–Pu, and VPum [5].
Parameter Studied pH Co(mg/L)
Q(mL/min)
Bed-Depth,HB (cm)
KAB(L/min·mg)
(×104)
NO(cal.)(mg/L) R2 RMSE Adsorbent
Variation of pHkeeping CO and
QO constant
2 10 1.25 10 1.110 116.98 0.996 0.0034Zr–Pu4 10 1.25 10 1.268 48.35 0.986 0.0112
6 10 1.25 10 1.874 33.08 0.980 0.0082
2 10 1.25 10 2.568 45.57 0.947 0.0013VPum4 10 1.25 10 7.772 11.03 0.980 0.0079
6 10 1.25 10 11.220 7.75 0.980 0.0034
Variation of QOkeeping pH and
CO constant
2 10 1.25 10 1.110 116.98 0.996 0.0034Zr–Pu2 10 2.50 10 5.063 69.31 0.993 0.0047
2 10 3.75 10 6.803 58.13 0.992 0.0059
2 10 1.25 10 2.568 45.57 0.947 0.0013VPum2 10 2.50 10 4.813 30.03 0.957 0.0167
2 10 3.75 10 6.251 26.83 0.896 0.0295
The lower value of KAB for Zr–Pu than VPum suggests that the mass transfer bydiffusion within the column packed with Zr–Pu was superior to VPum [71]. However, it isclear from Table 5 that the values of NO decreased from 117 to 33 mg/L for Zr–Pu and from46 to 8 mg/L for VPum as the pH value increased from 2 to 6, while the other conditionsremained constant.
The values of R2 range from 0.980 to 0.996 for Zr–Pu and 0.896 to 0.996 for VPum,indicating the general applicability of the Adams-Bohart model for describing the experi-mental data (Table 5). The Adams-Bohart model did a good job of depicting the adsorptionprocess and defluoridation by Zr–Pu and VPum packed fixed–beds at various experimental
Materials 2021, 14, 6145 16 of 20
conditions. Similar to the Thomas model, the optimized model parameter values confirmedthat zirconium coating improved the fluoride uptake capacity of VPum.
In general, the Thomas and Adams-Bohart models described the experimental datavery well, revealing that the models are suitable tools for designing fixed-bed columnsystems using VPum and Zr–Pu.
3.5. Performance of various Adsorbents on Fluoride Uptake
The adsorbent (Zr–Pu) utilized in this work was compared to previously studiedadsorbents for uptake of fluoride in a flow-through fixed-bed column system, as shown inTable 6.
Table 6. Fluoride adsorption capacity of various adsorbents.
Adsorbents Bed Height (cm) Fluoride Level in(mg L−1)
Adsorption Capacity(mg g−1) References
Granular acid-treated bentonite 28 6.34 0.190 [72]Granular acid-treated bentonite 28 2.85 0.169 [72]
MnO2-coated Tamarind Fruit Shell 6 2 0.883 [71]Aluminum modified iron oxide 10.5 4 0.139 [73]
Activated alumina (Grade OA-25) 10 5 0.74 [74]Virgin Pumice (VPum) 10 10 0.110 [5]
Virgin Scoria (VSco) 10 10 0.022 [5]Zr–Pu 10 10 0.225 This study
The fluoride uptake capacity of Zr–Pu used in this study is higher than those ofgranular acid-treated bentonite, aluminum modified iron oxide, VPum, and VSco. Aboveall, the raw material (VPum) is easily accessible and readily available, in contrast to some ofthe other substrates, confirming that Zr–Pu could be a promising candidate for the uptakeof excess fluoride from water.
4. Conclusions
In this study, the defluoridation performance of the Zr–Pu-packed fixed-bed columnsystems were examined and compared with that of VPum. The XRD analysis showed thatzirconium oxide was coated on the surface of VPum. The enhancement of the specificsurface area was confirmed by the BET technique. The degree of surface modification withthe improved porosity of Zr–Pu was evident from the recorded SEM image. The ICP-OESand XRF analysis were conducted for VPum and Zr–Pu to confirm the absence of harmfulsubstances and to quantify the amount of zirconium coated onto the VPum. Fluorideadsorption was influenced by pH and input flow rate. The highest uptake capacity offluoride by Zr–Pu was 225 mg/kg (2.05 times that of VPum: 110 mg/kg), at pH 2, inputfluoride concentration of 10 mg/L, and input flow rate of 1.25 mL/min. A fixed-bed columnof 265 g Zr–Pu can generate a volume of 4339 mL (~2.9 times that of VPum: 1508 mL)treated water with an acceptable fluoride level of < 1.5 mg/L. Such enhanced performanceis most likely associated with the coating of VPum with zirconium. The Thomas andAdams–Bohart models were employed to evaluate the breakthrough curves and obtainvalues for the kinetic parameters. Both models were capable of depicting the full range ofthe fluoride breakthrough curves, revealing that the models are suitable tools to designfixed-bed systems using VPum and Zr–Pu. This study demonstrated that the coating withzirconium enhances the fluoride adsorption capacity of VPum and that the Zr–Pu couldbe a promising candidate for the removal of high levels of fluoride from groundwaterat a technical scale. However, additional investigations on, for instance, the influence ofcompeting ions, regeneration of fluoride-laden adsorbents, and technical and economicanalysis are advisable to draw explicit conclusions.
Materials 2021, 14, 6145 17 of 20
Author Contributions: W.S.G. prepared the adsorbents, designed and conducted the adsorptionexperiments, analyzed the data, and prepared the first draft manuscript; E.A. supervised the researchwork, updated and reviewed the manuscript; B.L. supervised the research work, reviewed and editedthe article. All authors have read and agreed to the published version of the manuscript.
Funding: This research received no external funding.
Institutional Review Board Statement: Not applicable.
Informed Consent Statement: Not applicable.
Data Availability Statement: The data used in this study are available from the authors atreasonable request.
Acknowledgments: The first author is very thankful to the German Academic Exchange Service(DAAD) for providing the scholarship during the study.
Conflicts of Interest: The authors declare no conflict of interest.
References1. Fawell, J.; Bailey, K.; Chilton, J.; Dahi, E.; Fewtrell, L.; Magara, Y. Fluoride in Drinking-Water; World Health Organization (WHO)
with IWA Publishing: London, UK, 2006; ISBN 9781900222969.2. Tao, W.; Zhong, H.; Pan, X.; Wang, P.; Wang, H.; Huang, L. Removal of Fluoride from Wastewater Solution Using Ce-AlOOH
with Oxalic Acid as Modification. J. Hazard. Mater. 2020, 384, 121373. [CrossRef] [PubMed]3. Kumari, U.; Mishra, A.; Siddiqi, H.; Meikap, B.C. Effective Defluoridation of Industrial Wastewater by Using Acid Modified
Alumina in Fixed-Bed Adsorption Column: Experimental and Breakthrough Curves Analysis. J. Clean. Prod. 2021, 279, 123645.[CrossRef]
4. Kumari, U.; Behera, S.K.; Meikap, B.C. Defluoridation of Synthetic and Industrial Wastewater by Using Acidic Activated AluminaAdsorbent: Characterization and Optimization by Response Surface Methodology. J. Environ. Sci. Health—A Toxic/Hazard. Subst.Environ. Eng. 2019, 54, 79–88. [CrossRef] [PubMed]
5. Geleta, W.S.; Alemayehu, E.; Lennartz, B. Volcanic Rock Materials for Defluoridation of Water in Fixed-Bed Column Systems.Molecules 2021, 26, 977. [CrossRef] [PubMed]
6. Zhang, Y.; Xiong, L.; Xiu, Y.; Huang, K. Defluoridation in Fixed Bed Column Filled with Zr(IV)-Loaded Garlic Peel. Microchem. J.2019, 145, 476–485. [CrossRef]
7. Kut, K.M.K.; Sarswat, A.; Srivastava, A.; Pittman, C.U., Jr.; Mohan, D. A Review of Fluoride in African Groundwater and LocalRemediation Methods. Groundw. Sustain. Dev. 2016, 2–3, 190–212. [CrossRef]
8. Mohan, S.; Singh, D.K.; Kumar, V.; Hasan, S.H. Effective Removal of Fluoride Ions by RGO/ZrO2 Nanocomposite from AqueousSolution: Fixed Bed Column Adsorption Modelling and Its Adsorption Mechanism. J. Fluor. Chem. 2016. [CrossRef]
9. Rango, T.; Vengosh, A.; Jeuland, M.; Whitford, G.M.; Tekle-Haimanot, R. Biomarkers of Chronic Fluoride Exposure in Groundwa-ter in a Highly Exposed Population. Sci. Total Environ. 2017, 596–597, 1–11. [CrossRef] [PubMed]
10. Žácek, V.; Rapprich, V.; Šíma, J.; Škoda, R.; Laufek, F.; Legesa, F. Kogarkoite, Na3(SO4)F, from the Shalo Hot Spring, MainEthiopian Rift: Implications for F-Enrichment of Thermal Groundwater Related to Alkaline Silicic Volcanic Rocks. J. Geosci. 2015,60, 171–179. [CrossRef]
11. Rango, T.; Bianchini, G.; Beccaluva, L.; Tassinari, R. Geochemistry and Water Quality Assessment of Central Main Ethiopian RiftNatural Waters with Emphasis on Source and Occurrence of Fluoride and Arsenic. J. Afr. Earth Sci. 2010, 57, 479–491. [CrossRef]
12. Demelash, H.; Beyene, A.; Abebe, Z.; Melese, A. Fluoride Concentration in Ground Water and Prevalence of Dental Fluorosis inEthiopian Rift Valley: Systematic Review and Meta-Analysis. BMC Public Health 2019, 19, 1298. [CrossRef]
13. Tekle-Haimanot, R.; Melaku, Z.; Kloos, H.; Reimann, C.; Fantaye, W.; Zerihun, L.; Bjorvatn, K. The Geographic Distribution ofFluoride in Surface and Groundwater in Ethiopia with an Emphasis on the Rift Valley. Sci. Total Environ. 2006, 367, 182–190.[CrossRef] [PubMed]
14. Shen, J.; Schäfer, A. Removal of Fluoride and Uranium by Nanofiltration and Reverse Osmosis: A Review. Chemosphere 2014, 117,679–691. [CrossRef] [PubMed]
15. Bejaoui, I.; Mnif, A.; Hamrouni, B. Performance of Reverse Osmosis and Nanofiltration in the Removal of Fluoride from ModelWater and Metal Packaging Industrial Effluent. Sep. Sci. Technol. 2014, 49, 1135–1145. [CrossRef]
16. Liu, C.C.; Liu, J.C. Coupled Precipitation-Ultrafiltration for Treatment of High Fluoride-Content Wastewater. J. Taiwan Inst. Chem.Eng. 2016, 58, 259–263. [CrossRef]
17. Majewska-Nowak, K.; Grzegorzek, M.; Kabsch-Korbutowicz, M. Removal of Fluoride Ions by Batch Electrodialysis. Environ. Prot.Eng. 2015, 41, 67–81. [CrossRef]
18. Jamhour, R.M.A.Q. New Inorganic Ion-Exchange Material for Selective Removal of Fluoride from Potable Water Using Ion-Selective Electrode. Am. J. Environ. Sci. 2005, 1, 1–4. [CrossRef]
19. Li, Q.; Wang, B.; Li, W.; Wang, C.; Zhou, Q.; Shuang, C.; Li, A. Performance Evaluation of Magnetic Anion Exchange ResinRemoving Fluoride. J. Chem. Technol. Biotechnol. 2016, 91, 1747–1754. [CrossRef]

Materials 2021, 14, 6145 18 of 20
20. Castel, C.; Schweizer, M.; Simonnot, M.O.; Sardin, M. Selective Removal of Fluoride Ions by a Two-Way Ion-Exchange CyclicProcess. Chem. Eng. Sci. 2000, 55, 3341–3352. [CrossRef]
21. Gan, Y.; Wang, X.; Zhang, L.; Wu, B.; Zhang, G.; Zhang, S. Coagulation Removal of Fluoride by Zirconium Tetrachloride:Performance Evaluation and Mechanism Analysis. Chemosphere 2019, 218, 860–868. [CrossRef] [PubMed]
22. Huang, H.; Liu, J.; Zhang, P.; Zhang, D.; Gao, F. Investigation on the Simultaneous Removal of Fluoride, Ammonia Nitrogen andPhosphate from Semiconductor Wastewater Using Chemical Precipitation. Chem. Eng. J. 2017, 307, 696–706. [CrossRef]
23. López-Guzmán, M.; Alarcón-Herrera, M.T.; Irigoyen-Campuzano, J.R.; Torres-Castañón, L.A.; Reynoso-Cuevas, L. SimultaneousRemoval of Fluoride and Arsenic from Well Water by Electrocoagulation. Sci. Total Environ. 2019, 678, 181–187. [CrossRef][PubMed]
24. Zhai, L.Z.; Sun, Y.H.; He, C. Research on Coagulation/Sedimentation Process for Simulation of Fluorine-Containing WastewaterTreatment. Appl. Mech. Mater. 2013, 361–363, 755–759. [CrossRef]
25. Banerjee, A. Groundwater Fluoride Contamination: A Reappraisal. Geosci. Front. 2015, 6, 277–284. [CrossRef]26. Chaudhary, M.; Rawat, S.; Jain, N.; Bhatnagar, A.; Maiti, A. Chitosan-Fe-Al-Mn Metal Oxyhydroxides Composite as Highly
Efficient Fluoride Scavenger for Aqueous Medium. Carbohydr. Polym. 2019, 216, 140–148. [CrossRef]27. Teng, S.X.; Wang, S.G.; Gong, W.X.; Liu, X.W.; Gao, B.Y. Removal of Fluoride by Hydrous Manganese Oxide-Coated Alumina:
Performance and Mechanism. J. Hazard. Mater. 2009, 168, 1004–1011. [CrossRef] [PubMed]28. Zhou, J.; Yu, J.; Liao, H.; Zhang, Y.; Luo, X. Facile Fabrication of Bimetallic Collagen Fiber Particles via Immobilizing Zirconium
on Chrome-Tanned Leather as Adsorbent for Fluoride Removal from Ground Water near Hot Spring. Sep. Sci. Technol. 2019, 55,658–671. [CrossRef]
29. Chatterjee, S.; Mukherjee, M.; De, S. Defluoridation Using Novel Chemically Treated Carbonized Bone Meal: Batch and DynamicPerformance with Scale-up Studies. Environ. Sci. Pollut. Res. Int. 2018, 25, 18161–18178. [CrossRef] [PubMed]
30. Raj, R.M.; Raj, V. Electrosynthesis of Zr-Loaded Copolymer Coatings on Al for Defluoridation of Water and Its CorrosionProtection Ability. Prog. Org. Coat. 2019, 137, 105065. [CrossRef]
31. Ghanbarian, M.; Ghanbarian, M.; Mahvi, A.H.; Tabatabaie, T. Enhanced Fluoride Removal over MgFe2O4–Chitosan–CaAlNanohybrid: Response Surface Optimization, Kinetic and Isotherm Study. Int. J. Biol. Macromol. 2020, 148, 574–590. [CrossRef][PubMed]
32. Zhang, T.; Yu, H.; Zhou, Y.; Rong, J.; Mei, Z.; Qiu, F. Enhanced Adsorption of Fluoride from Aqueous Solutions by HierarchicallyStructured Mg-Al LDHs/Al2O3 Composites. Korean J. Chem. Eng. 2016, 33, 720–725. [CrossRef]
33. Wan, S.; Lin, J.; Tao, W.; Yang, Y.; Li, Y.; He, F. Enhanced Fluoride Removal from Water by Nanoporous Biochar-SupportedMagnesium Oxide. Ind. Eng. Chem. Res. 2019, 58, 9988–9996. [CrossRef]
34. Cai, J.; Zhang, Y.; Qian, Y.; Shan, C.; Pan, B. Enhanced Defluoridation Using Novel Millisphere Nanocomposite of La-Doped Li-AlLayered Double Hydroxides Supported by Polymeric Anion Exchanger. Sci. Rep. 2018, 8, 11741. [CrossRef] [PubMed]
35. Abu Bakar, A.H.; Abdullah, L.C.; Mohd Zahri, N.A.; Alkhatib, M. Column Efficiency of Fluoride Removal Using QuaternizedPalm Kernel Shell (QPKS). Int. J. Chem. Eng. 2019, 2019, 5743590. [CrossRef]
36. Aregu, M.B.; Asfaw, S.L.; Khan, M.M. Identification of Two Low—Cost and Locally Available Filter Media (Pumice and Scoria)for Removal of Hazardous Pollutants from Tannery Wastewater. Environ. Syst. Res. 2018, 7, 10. [CrossRef]
37. Asgari, G.; Roshani, B.; Ghanizadeh, G. The Investigation of Kinetic and Isotherm of Fluoride Adsorption onto FunctionalizePumice Stone. J. Hazard. Mater. 2012, 217–218, 123–132. [CrossRef]
38. Mekonnen, D.T.; Alemayehu, E.; Lennartz, B. Adsorptive Removal of Phosphate from Aqueous Solutions Using Low-CostVolcanic Rocks: Kinetics and Equilibrium Approaches. Materials 2021, 14, 1312. [CrossRef] [PubMed]
39. He, Y.; Zhang, L.; An, X.; Wan, G.; Zhu, W.; Luo, Y. Enhanced Fluoride Removal from Water by Rare Earth (La and Ce) ModifiedAlumina: Adsorption Isotherms, Kinetics, Thermodynamics and Mechanism. Sci. Total Environ. 2019, 688, 184–198. [CrossRef][PubMed]
40. Chaudhry, S.A.; Khan, T.A.; Ali, I. Zirconium Oxide-Coated Sand Based Batch and Column Adsorptive Removal of Arsenic fromWater: Isotherm, Kinetic and Thermodynamic Studies. Egypt. J. Pet. 2017, 26, 553–563. [CrossRef]
41. Zhou, H.; Chen, W.; Gao, Z.Y.; Chen, D. Removal of Fluoride from Aqueous Media by Zirconium Modified Zeolite. Asian J. Chem.2014, 26, 8062–8068. [CrossRef]
42. Dehghani, M.H.; Faraji, M.; Mohammadi, A.; Kamani, H. Optimization of Fluoride Adsorption onto Natural and ModifiedPumice Using Response Surface Methodology: Isotherm, Kinetic and Thermodynamic Studies. Korean J. Chem. Eng. 2017, 34,454–462. [CrossRef]
43. Sepehr, M.N.; Sivasankar, V.; Zarrabi, M.; Senthil Kumar, M. Surface Modification of Pumice Enhancing Its Fluoride AdsorptionCapacity: An Insight into Kinetic and Thermodynamic Studies. Chem. Eng. J. 2013, 228, 192–204. [CrossRef]
44. Geleta, W.S.; Alemayehu, E.; Lennartz, B. Enhanced Defluoridation from Aqueous Solutions Using Zirconium—Coated Pumicein Fixed-Bed Column Systems. In Proceedings of the MOL2NET 2021, International Conference on Multidisciplinary Sciences; MDPI:Basel, Switzerland, 2021; pp. 1–5. [CrossRef]
45. Liu, C.; Evett, J.B. Soil Properties-Testing, Measurament, and Evalution; Banta Book Company: Upper Saddle River, NJ, USA, 2003;ISBN 0-13-093005-9.
Materials 2021, 14, 6145 19 of 20
46. Salifu, A.; Petrusevski, B.; Ghebremichael, K.; Modestus, L.; Buamah, R.; Aubry, C.; Amy, G.L. Aluminum (Hydr) Oxide CoatedPumice for Fluoride Removal from Drinking Water: Synthesis, Equilibrium, Kinetics and Mechanism. Chem. Eng. J. 2013, 228,63–74. [CrossRef]
47. Appel, C.; Ma, L. Concentration, PH, and Surface Charge Effects on Cadmium and Lead Sorption in Three Tropical Soils.J. Environ. Qual. 2002, 31, 581–589. [CrossRef] [PubMed]
48. Newcombe, G.; Hayes, R.; Drikas, M. Granular Activated Carbon: Importance of Surface Properties in the Adsorption of NaturallyOccurring Organics. Colloids Surf. A Physicochem. Eng. Asp. 1993, 78, 65–71. [CrossRef]
49. Boehm, H.P. Some Aspects of the Surface Chemistry of Carbon Blacks and Other Carbons. Carbon N. Y. 1994, 32, 759–769.[CrossRef]
50. WHO World Health Organization. Guidelines for Drinking-Water Quality, 4th ed.; WHO World Health Organization: Geneva,Swizerland, 2011; ISBN 978 92 4 154815 1.
51. Golie, W.M.; Upadhyayula, S. Continuous Fixed-Bed Column Study for the Removal of Nitrate from Water Using Chitosan/Alumina Composite. J. Water Process Eng. 2016, 12, 58–65. [CrossRef]
52. Han, R.; Zou, L.; Zhao, X.; Xu, Y.; Xu, F.; Li, Y.; Wang, Y. Characterization and Properties of Iron Oxide-Coated Zeolite asAdsorbent for Removal of Copper (II) from Solution in Fixed Bed Column. Chem. Eng. J. 2009, 149, 123–131. [CrossRef]
53. Futalan, C.M.; Yang, J.H.; Phatai, P.; Chen, I.P.; Wan, M.W. Fixed-Bed Adsorption of Copper from Aqueous Media Using Chitosan-Coated Bentonite, Chitosan-Coated Sand, and Chitosan-Coated Kaolinite. Environ. Sci. Pollut. Res. 2020, 27, 24659–24670.[CrossRef]
54. Adeyi, A.A.; Nurul, S.; Jamil, A.; Abdullah, L.C.; Shean, T.; Choong, Y.; Lau, K.L.; Alias, N.H. Simultaneous Adsorption ofMalachite Green and Methylene Blue Dyes in a Fixed-Bed Column Using Poly(Acrylonitrile-Co-Acrylic Acid) Modified withThiourea. Molecules 2020, 25, 2650. [CrossRef]
55. Chittoo, B.S.; Sutherland, C. Column Breakthrough Studies for the Removal and Recovery of Phosphate by Lime-Iron Sludge:Modeling and Optimization Using Artificial Neural Network and Adaptive Neuro-Fuzzy Inference System. Chin. J. Chem. Eng.2020, 28, 1847–1859. [CrossRef]
56. Thomas, H.C. Heterogeneous Ion Exchange in a Flowing System. J. Am. Chem. Soc. 1944, 66, 1664–1666. [CrossRef]57. Bohart, G.S.; Adams, E.Q. Some Aspects of the Behavior of Charcoal with Respect to Chlorine. J. Am. Chem. Soc. 1920, 42, 523–544.
[CrossRef]58. Chu, K.H. Breakthrough Curve Analysis by Simplistic Models of Fixed Bed Adsorption: In Defense of the Century-Old Bohart-
Adams Model. Chem. Eng. J. 2020, 380, 122513. [CrossRef]59. Alemayehu, E.; Lennartz, B. Virgin Volcanic Rocks: Kinetics and Equilibrium Studies for the Adsorption of Cadmium from Water.
J. Hazard. Mater. 2009, 169, 395–401. [CrossRef] [PubMed]60. Li, X.; Yang, W.; Zou, Q.; Zuo, Y. Investigation on Microstructure, Compostion, and Cytocompatibility of Natural Pumice for
Potential Biomedical Application. Tissue Eng. C 2010, 16, 427–434. [CrossRef] [PubMed]61. Sepehr, M.N.; Amrane, A.; Karimaian, K.A.; Zarrabi, M.; Ghaffari, H.R. Potential of Waste Pumice and Surface Modified Pumice
for Hexavalent Chromium Removal: Characterization, Equilibrium, Thermodynamic and Kinetic Study. J. Taiwan Inst. Chem. Eng.2014, 45, 635–647. [CrossRef]
62. Asere, T.G.; Verbeken, K.; Tessema, D.A.; Fufa, F.; Stevens, C.V.; Du Laing, G. Adsorption of As(III) versus As(V) from AqueousSolutions by Cerium-Loaded Volcanic Rocks. Environ. Sci. Pollut. Res. 2017, 24, 20446–20458. [CrossRef]
63. Liang, Z.; Ni, J. Improving the Ammonium Ion Uptake onto Natural Zeolite by Using an Integrated Modification Process.J. Hazard. Mater. 2009, 166, 52–60. [CrossRef]
64. Asere, T.G.; Mincke, S.; De Clercq, J.; Verbeken, K.; Tessema, D.A.; Fufa, F.; Stevens, C.V.; Du Laing, G. Removal of Arsenic (V)from Aqueous Solutions Using Chitosan–Red Scoria and Chitosan–Pumice Blends. Int. J. Environ. Res. Public Health 2017, 14, 895.[CrossRef]
65. Ayoob, S.; Gupta, A.K. Performance Evaluation of Alumina Cement Granules in Removing Fluoride from Natural and SyntheticWaters. Chem. Eng. J. 2009, 150, 485–491. [CrossRef]
66. Shang, Y.; Wang, Z.; Xu, X.; Cheng, C.; Gao, B.; Yue, Q.; Liu, S.; Han, C. Enhanced Fluoride Uptake by Bimetallic HydroxidesAnchored in Cotton Cellulose/Graphene Oxide Composites. J. Hazard. Mater. 2019, 376, 91–101. [CrossRef] [PubMed]
67. Lin, X.; Huang, Q.; Qi, G.; Shi, S.; Xiong, L.; Huang, C.; Chen, X.; Li, H.; Chen, X. Estimation of Fixed-Bed Column Parametersand Mathematical Modeling of Breakthrough Behaviors for Adsorption of Levulinic Acid from Aqueous Solution Using SY-01Resin. Sep. Purif. Technol. 2017, 174, 222–231. [CrossRef]
68. Abdolali, A.; Ngo, H.H.; Guo, W.; Zhou, J.L.; Zhang, J.; Liang, S.; Chang, S.W.; Nguyen, D.D.; Liu, Y. Application of a BreakthroughBiosorbent for Removing Heavy Metals from Synthetic and Real Wastewaters in a Lab-Scale Continuous Fixed-Bed Column.Bioresour. Technol. 2017, 229, 78–87. [CrossRef] [PubMed]
69. Ghosh, A.; Chakrobroty, S.; Biswas, K.; Ghosh, U.C. Column Performances on Fluoride Removal by Agglomerated Ce (IV)—Zr(IV) Mixed Oxide Nanoparticles Packed Fixed-Beds. J. Environ. Chem. Eng. 2015, 3, 653–661. [CrossRef]
70. Ghosh, A.; Chakrabarti, S.; Biswas, K.; Ghosh, U.C. Agglomerated Nanoparticles of Hydrous Ce(IV) + Zr(IV) Mixed Oxide:Preparation, Characterization and Physicochemical Aspects on Fluoride Adsorption. Appl. Surf. Sci. 2014, 307, 665–676.[CrossRef]

Materials 2021, 14, 6145 20 of 20
71. Sivasankar, V.; Ramachandramoorthy, T.; Chandramohan, A. Fluoride Removal from Water Using Activated and MnO2-CoatedTamarind Fruit (Tamarindus Indica) Shell: Batch and Column Studies. J. Hazard. Mater. 2010, 177, 719–729. [CrossRef]
72. Ma, Y.; Shi, F.; Zheng, X.; Ma, J.; Gao, C. Removal of Fluoride from Aqueous Solution Using Granular Acid-Treated Bentonite(GHB): Batch and Column Studies. J. Hazard. Mater. 2011, 185, 1073–1080. [CrossRef]
73. García-Sánchez, J.J.; Solache-Ríos, M.; Martínez-Miranda, V.; Morelos, C.S. Removal of Fluoride Ions from Drinking Water andFluoride Solutions by Aluminum Modified Iron Oxides in a Column System. J. Colloid Interface Sci. 2013, 407, 410–415. [CrossRef]
74. Ghorai, S.; Pant, K.K. Investigations on the Column Performance of Fluoride Adsorption by Activated Alumina in a Fixed-Bed.Chem. Eng. J. 2004, 98, 165–173. [CrossRef]