zirconium transport dynamics in the purex solvent extraction process
TRANSCRIPT

Zirconium Transport Dynamics in the Purex Solvent Extraction Process
Scott F. DeMuth Los Alamos National Laboratory, Los Alamos, NM 87545
Robert M. Counce Chemical Engineering Dept., University of Tennessee, Knoxville, TN 37996
The primary objective of this study was to develop and validate experimental and mathematical procedures that can be used to determine the fundamental mechanisms of the Purex (plutonium and uranium) extraction process. The mechanisms of this solvent extraction process have been established by classical chemical engineering principles.
In the past, modeling of transport phenomena for the solvent extraction of spent nuclear fuel by the Purex process has typically ( I ) relied solely on diffusion, ( 2 ) relied solely on chemical reaction, ( 3 ) combined diffusion and chemical reaction in a semiempirical fashion, or ( 4 ) combined diffusion and chemical reaction in a nonclassical chemical engineering manner.
This study was conducted with the single Purex species, aqueous Zr4', to simplify the chemistry and modeling mathematics. The validated procedures and model are applicable to most all Purex species.
Introduction Objectives and relevance
Optimizing the fission product and waste actinide decon- tamination will be the focus for future nuclear fuel reprocessing development. Successful efforts to minimize the radioactivity of reprocessed fuel will decrease radioactive exposure during handling of recycled uranium and plutonium and decrease poisoning (neutron adsorption) of fuel fabricated from recy- cled uranium and plutonium. In addition, separation of short- lived highly radioactive fission products from long-lived lower- activity waste actinides can significantly improve waste han- dling and storage techniques. Actinides could then be trans- muted by way of neutron bombardment to short-lived fission products. In response to these future reprocessing needs, the proper application of fundamental mass-transfer and simul- taneous chemical reaction principles to the Purex (plutonium and uranium extraction) solvent extraction process could lead to the development of an advanced modeling tool for opti- mizing decontamination of spent nuc!ear fuels.
Most methods for reprocessing spent nuclear reactor fuel are based on solvent extraction. The most common processes
Corrrspondence concerning this article should be addressed to Scott F. DeMuth, Los Alamos National I aboralory, P.O. Box 1663. MS K560, Los Alamos, NM 87545.
are: (1) the Redox process based on methyl isobutyl ketone as the extractant and alumina nitrate as the salting agent; (2) the Purex process based on tri-n-butyl phosphate (TBP) as the extractant and nitric acid as the salting agent. The aqueous fission product Zr4+ was selected for this study because it has a relatively high concentration in spent nuclear fuel as com- pared to other fission products, and it is readily available as a nonradioactive species. Because it is more commonly used by industry, the Purex process was selected for this study rather than the Redox process.
Significant prior work Much of the existing literature concerning Purex solvent
extraction deals primarily with defining the chemical com- plexation reaction. Little effort has been made to describe the mass-transfer process, because it depends on the contacting vessel. However, without understanding the mass-transfer process for the contacting vessel, it is not possible to estimate accurately the chemical complexation reaction rate constants.
The aqueous chemistry of zirconium in a nitric acid medium has been studied by many experimenters and is discussed in detail by Baes and Mesmer (1976) and summarized by Siczek
AIChE Journal June 1992 Vol. 38, No. 6 801

and Steindler (1978) and Lo et al. (1983). They conclude that at zirconium concentrations below 0.0001 to 0.001 M and nitric acid concentrations above 3 t o 5 M, concentrations of poly- merized and hydroxylated zirconium are much less than those of the Zr4+ species. These concentrations are similar to data in sections of actual fuel reprocessing flow sheets.
A large number of publications have discussed proposed chemical complexation reactions for the solvent extraction of zirconium by the Purex process (see DeMuth, 1989 for the list). Some of the more noted publications include Tsvetkova et al. (1961), Adamskii et al. (1980), Alcock et al. (1957), Egorov et al. (1960), Benedict et al. (1981), Nikitina and Push- lenkov (1962), and Reznik et al. (1963). They all give Eq. 1 as the generalized zirconium-Purex complexation reaction, where n depends on the degree of hydrolysis:
Zr4' + n(OH -) + (4 - n)(NO;) + 2TBP--Zr(OH),(N03)4-n.2TBP (1)
None of the above-mentioned publications indicate whether Eq. 1 is an aqueous phase, organic phase, or interfacial re- action.
The test vessel selected for this study was a stirred cell for which generalized mass-transfer coefficient correlations had been previously developed by numerous investigators. Lewis (1954), Bulicka and Prochazka (1976), McManamey (1961), and Mayers (1961) reported various forms of a mass-transfer coefficient correlation for the stirred cell. Lewis' expression depends only on the Reynolds number and consequently as- sumes only eddy diffusion, not molecular diffusion. Other expressions depend on the Reynolds number and Schmidt num- ber, which incorporates the molecular diffusion effect. The mass-transfer correlation selected for this study was that of Bulicka and Prochazka, which utilizes a Schmidt number de- pendency of 1/2 in accordance with penetration and surface renewal theories. Equation 2 is the expression of Bulicka and Prochazka, where the parameters z, and z, are constants se- lected to fit the test vessel of this study. The parameter j refers to the phase of interest.
Major results and conclusions This study focused on demonstrating and validating a method
for determining the complexation reaction rate constants for the extraction of Zr4+ by the Purex process. With known re- action rate constants, extraction'in almost any contacting vessel with known mass-transfer coefficients can be predicted. The techniques used are directly applicable to most other fission products and actinides.
To estimate reaction rate constants, we had t o develop an extraction model for Zr4+ in the Purex system. This was done by incorporating chemical reaction and simultaneous mass- transfer principles as applied to the specific process conditions and the test vessel. The chemical complexation reaction expres- sion and rate constants have been applied to a continuous stirred-tank reactor (CSTR) model, which is similar to nuclear fuel reprocessing equipment such as mixer-settlers and cen- trifugal contactors.
Using statistical methods, mass-transfer coefficient esti-
mates, and analysis of existing data in the literature, we con- cluded for the system of this study that the Zr4+ extraction rate was controlled predominantly by (1) the chemical com- plexation reaction rate in the aqueous phase and (2) diffusion of the complexed Zr4+ species in the organic phase. The chem- ical reaction and mass-transfer differential equations describ- ing this process were simultaneously solved using Laplace transforms. Complexation reaction rate constants were re- gressed from the nonlinear solution to the differential equa- tions by a weighted least-squares method. The regression analysis used stirred-cell transient zirconium concentration data.
It has long been understood that the slower kinetics of fission product extraction, as compared to the more rapid kinetics of uranium or plutonium extraction, could be utilized to aid de- contamination; however, past efforts have been generally qual- itative. The model presented here could be utilized to provide a quantitative tool for optimization of flowsheets and equip- ment.
Experimental Studies Determination of the complexation reaction rate constants
was the primary objective of the experimental portion of this study. The following steps were required to obtain these rate constants.
1. Select an appropriate mass-transfer test vessel. 2. Characterize the mass-transfer coefficient correlation for
the test vessel and estimate mass-transfer coefficients for the zirconium-Purex species of interest.
3. Determine the equilibrium constants for the Zr4+-Purex system, that is, the distribution coefficients and complexation reaction equilibrium constant.
4. Ascertain the significant components of mass transfer for the zirconium-Purex process in the test vessel and develop an extraction model.
5. Utilize the extraction model to regress the complexation reaction rate constants from zirconium-Purex transient data collected in the test vessel.
A stirred cell was selected for the mass-transfer tests of this study. The design was modeled after that originally used by Lewis (1954). The stirred cell selected was operated as a closed system (rather than a flow-through), as shown in Figure 1 . It consisted of a 1-L glass vessel in which each phase was stirred by a single-shafted central paddle. The paddle diameter could be changed, allowing independent control of the Reynolds number in each phase. Stainless steel vertical wall baffles were placed circumferentially along the vessel wall to minimize cav- itation. The interfacial area was adjustable by means of a circular teflon block. The entire stirred cell was immersed in a water bath to control temperature.
A mass-transfer coefficient correlation was selected and characterized for the test vessel of this study. The correlation selected (Eq. 2) was that of Bulicka and Prochazka, in which the constants zo and z1 represent the unique hydrodynamic characteristics of the test vessel. The constants zo and z, were regressed from acetic acid/water/isobutanol mass-transfer data collected in the selected test vessel. Acknowledging data in the literature and data collected during this study, we determined that the Marangoni effect (DeMuth, 1989, p. 19), ionization (Barrow, 1972, p. 418), and dimerization (Olander, 1980) had
802 June 1992 Vol. 38, No. 6 AIChE Journal

Ring Stand 1 Motor to I
- Mixer Paddle 0 . h\\\\>
3rganic Phase
Ring / Stand
I 1 -L Glass Beaker
.L
'\ Wall Baffle
istable ?dace p\\\\\u
ieous
I
Figure 1. Stirred cell.
negligible effects on the mass transfer of acetic acid from water to isobutanol, or the reverse, for the conditions of this study.
The zirconium-Purex equilibrium constant of Eq. 1 (where n = 0) was determined by zirconium distribution shake tests, which consisted of equal phases of nitric acid and TBP/do- decane mixed at constant temperature. The zirconium con- centration was measured spectrophotometrically by the color indicator Arsenazo 111. See DeMuth (1989) for details of these analyses.
Significant components of Zr4+ mass transfer for the Purex conditions of the study were determined from stirred-cell zir- conium-Purex mass-transfer data. Distribution of zirconium in the aqueous and organic phases was measured with time and was statistically analyzed to determine the mass-transfer behavior. Figure 2 shows how such parameters as interfacial area, mixer diameter or consequent mass-transfer coefficient, and concentrations were used to ascertain the controlling mech- anisms of mass transfer. Statistical methods were used to de- termine if the interfacial area and mass-transfer coefficient significantly affected the zirconium mass-transfer rate.
Each zirconium mass-transfer test began by equilibrating the aqueous nitric acid and TBP/dodecane before introducing zirconium. Following equilibration, a known amount of zir- conium was added to the aqueous phase in the Zr4+ form with a pipet. Zirconium samples collected for the analysis were removed from the stirred cell at selected times. At 1- to 5-mL
(5) Interfacial Area I
- Reaction Dependency Unknown
(9) Organic Phase Diffusional Resistani
(ka) Aqueous Phase Dtffusional Resislar
Aqueous Diffusion -Aqueous Diffusion Independent Dependent - Organic D~ifusion . Organic Diffusion r-==-r Dependent Dependent
* Reaction Dependency * Reaction Dependency I Unknown, I I Unknown 1 4
(Reactant Concentraton)
rN-LY,
Figure 2. Selection of mass-transfer components.
pipet was used for collecting the samples. The total cumulative samples per test never exceeded 5% of the original phase vol- ume. Organic samples were back-extracted with dilute nitric acid before the spectrophotometric analysis with Arsenazo 111, Details of these analyses are discussed by DeMuth (1989).
The complexation reaction rate constants were regressed from zirconium-Purex stirred-cell mass-transfer data. This was the same data used to determine significant components of mass transfer.
Results and Discussion Mass-trans fer coefficient correlation
Estimation of both mass-transfer coefficients and reaction rate constants from the zirconium data of this study would introduce too many degrees of freedom for reliable regression. Many mass-transfer coefficient models for stirred cells can be found in the literature. The model selected for this study was presented in the Introduction section, Eq. 2. It was necessary to use a nonreacting system to characterize the mass-transfer coefficient model. The transfer of acetic acid from water to isobutanol was selected because of the well-behaved chemical nature of acetic acid and isobutanol, and a solid literature database established by J . B. Lewis.
To determine the mass-transfer coefficient for the acetic acid/water/isobutanol system, we had to:
Prove the Marangoni effect was insignificant Ascertain the vessel hydrodynamics were well-behaved such
AIChE Journal June 1992 Vol. 38, No. 6 803

3 I - 9 - m 3 -0 c
2 6 - 0 C .-
8 .- 0 3 -
2 c Q,
0 20 40 60 Time (min)
Figure 3. Acetic-acid mass-transfer test for S,, Wa2, VO2, da2 and do,.
that phase volume and interfacial area did not affect the Reyn- olds number and consequent mass-transfer coefficient
Determine which phase or phases controlled mass transfer. Marangoni Effect. The significance of the Marangoni ef-
fect was determined by comparing Lewis' forward and reverse acetic acid mass-transfer coefficients in water and isobutanol. We judged from the data, as detailed by DeMuth (1989, p. 19), that the mass-transfer coefficient for acetic acid was not significantly different when transferring from water to iso- butanol or the reverse with identical operating conditions. Hence, we concluded that the Marangoni effect was insignif- icant.
The test conditions selected for the acetic-acid mass-transfer data were based on a half factorial experimental design. The half factorial design provided for determination of the single and the 1 x 1 interaction effects of interfacial area, phase volume, and mixer diameter on the mass-transfer coefficient, Figure 3 shows the aqueous-phase overall mass-transfer coefficient regression for conditions of large interfacial area, large aqueous and organic-phase vol- umes, and large aqueous-phase mixer diameter, and small or- ganic-phase mixer diameter. Table 1 shows the aqueous-phase overall mass-transfer coefficients for the entire half factorial experimental design. Initial conditions of the tests were 0.5 M aqueous acetic acid at 25°C and mixed at 150 rpm.
Vesselffydrodynarnics.
Table 1. Acetic-Acid Aqueous-Phase Overall Mass-Transfer Coefficient
Overall Mass Transfer Coefficient (cm/s) Mixer Diameter Phase ~~~~
Area Vol. d,l,dol do2,dol dol.do2 do2,do2 ~~
V,,,, V,, 0.000036 -
s, Vo2rVol - 0.000604 Vd 9 v02 - 0.000215 Vo,,Vo2 0.000057 -
Vd. V"I - 0.00008 3 V,2,Vo, 0.000092 -
V,I,Vo2 0.000034 - s2
v02, V"2 - 0.001 055
- 0.000925 0.000771 -
0.000956 - -
0.001 151
0.00087 8 - -
0.000872
- 0.001 0 1 9 0.000774 -
Mass-transfer controlling phasefs) The aqueous-phase overall mass-transfer coefficient was re-
gressed from the acetic-acid mass-transfer data (acetic acid transferred from water to isobutanol) based on integration of Eq. 3, which yields Eq. 4. The acetic-acid distribution coef- ficient was measured as 1.28 (DeMuth, 1989).
(3)
where
m = C,/C,t VJC" ( t = O)] = v,c, + V,C,
where
A = V,/(mV,).
The half factorial experimental design shown in Table 1 was evaluated by using a half normal plot. A half normal plot is used to ascertain significance in much the same way as an analysis of variance. The half factorial design is evaluated by a half normal plot when significance of interaction effects is sought with a minimum of data. The half normal plot utilizes a pooled error estimated by assuming the data to be normally distributed. The assumption of normally distributed data al- lows the degrees of freedom, otherwise consumed by estimating the pooled error, to be used for estimating interaction effects. For a discussion of half normal plots, see Johnson and Leone (1964).
Figure 4 shows the half normal plot produced from data in Table 1, from which the following conclusions can be drawn.
1. Statistically, in more than 95 out of 100 tests the organic- phase mixer diameter should significantly affect the mass- transfer rate. Each of the other effects would be signifi- cantly less than 80 times out of 100.
2 . Acknowledging conclusion 1, it follows that for the op-
D Data (only three most significant 300 1 effects labeled)
200
3
too 0
I I I I
0.0 0.5 1 .o 1.5 2.0 Z
Figure 4. Acetic-acid half normal plot.
804 June 1992 Vol. 38, No. 6 AIChE Journal
erating conditions of this study, the acetic-acid mass-transfer rate from water to isobutanol was predominantly controlled by mass-transfer resistance in the organic phase.
3. It also follows from conclusion 1 that the vessel hydro- dynamics were not affected significantly by the range of in- terfacial areas and phase volumes used in this study. This is desirable for a controlled experiment.
Based on predominant organic-phase mass-transfer resist- ance, the aqueous-phase overall mass-transfer coefficient can be related to the organic-phase individual mass-transfer coef- ficient by Eq. 5:
) / K O = l / ( m k o ) . ( 5 )
Equation 5 can be combined with Eq. 2 to provide a correlation between the organic-phase mixer diameter and aqueous-phase overall mass-transfer coefficient as shown by Eq. 6:
K, = 0.0000934( mD/d,) (NRe,o)1.38 (Nsc,o)”2. (6)
The constants 0.000093 and 1.38 of Eq. 6 were determined by linear regression of the aqueous-phase overall mass-transfer coefficients in Table 1 (see DeMuth, 1989, p. 31).
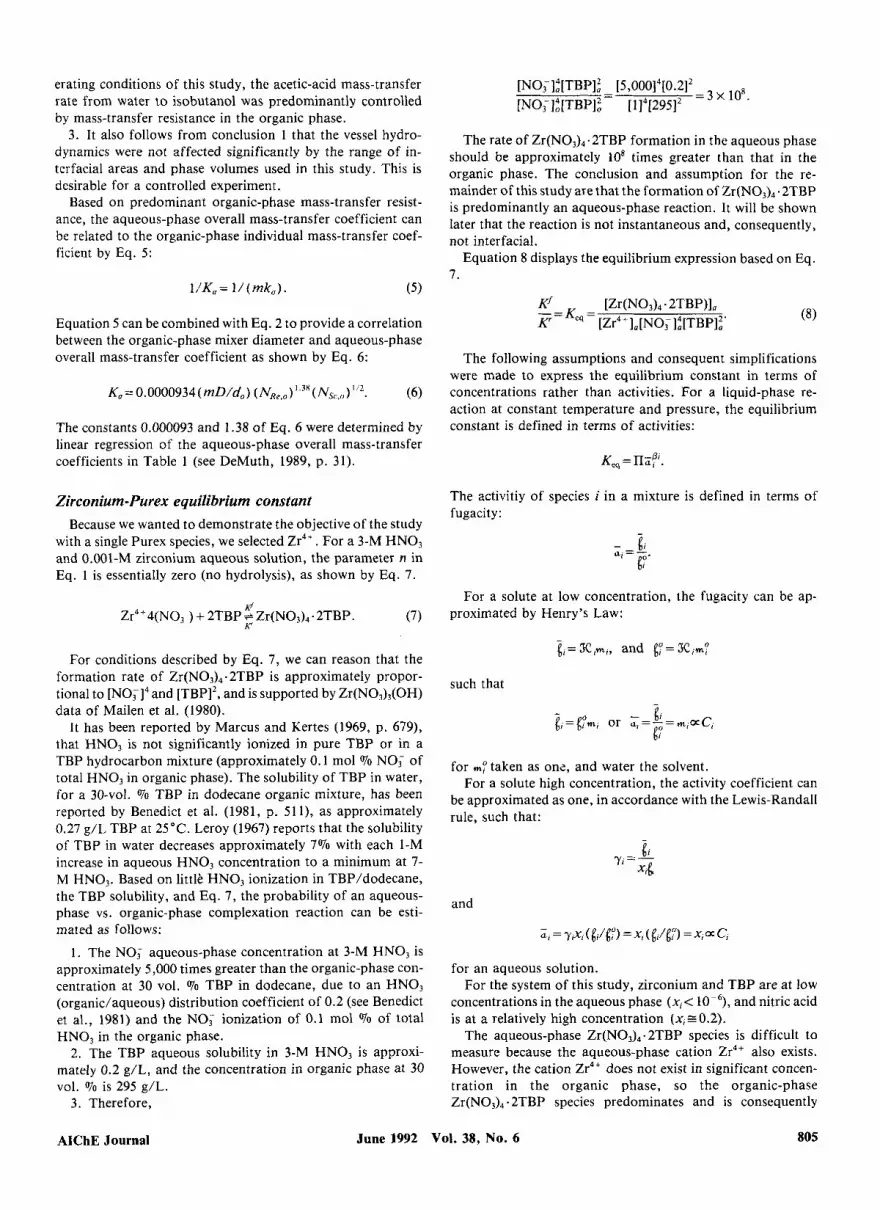
Zirconium-Purex equilibrium constant Because we wanted to demonstrate the objective of the study
with a single Purex species, we selected Zr4+. For a 3-M HN03 and 0.001-M zirconium aqueous solution, the parameter n in Eq. 1 is essentially zero (no hydrolysis), as shown by Eq. 7.
Zr4+4(NOT) + 2TBP ;Zr(NO3),.2TBP. (7)
For conditions described by Eq. 7, we can reason that the formation rate of Zr(N03),. 2TBP is approximately propor- tional to [N0;I4 and [TBP]’, and is supported by Zr(N03),(OH) data of Mailen et al. (1980).
It has been reported by Marcus and Kertes (1969, p. 679), that HN03 is not significantly ionized in pure TBP or in a TBP hydrocarbon mixture (approximately 0.1 mol Vo NO; of total HNO, in organic phase). The solubility of TBP in water, for a 30-vol. 070 TBP in dodecane organic mixture, has been reported by Benedict et al. (1981, p. 511), as approximately 0.27 g/L TBP at 25°C. Leroy (1967) reports that the solubility of TBP in water decreases approximately 7% with each 1-M increase in aqueous H N 0 3 concentration to a minimum at 7- M HNO,. Based on littlt HN03 ionization in TBP/dodecane, the TBP solubility, and Eq. 7, the probability of an aqueous- phase vs. organic-phase complexation reaction can be esti- mated as follows:
1. The NO; aqueous-phase concentration at 3-M HNO, is approximately 5,000 times greater than the organic-phase con- centration at 30 vol. 070 TBP in dodecane, due to an H N 0 3 (organic/aqueous) distribution coefficient of 0.2 (see Benedict et al., 1981) and the NO; ionization of 0.1 mol 070 of total HNO, in the organic phase.
2. The TBP aqueous solubility in 3-M HN03 is approxi- mately 0.2 g/L, and the concentration in organic phase at 30 vol. Vo is 295 g/L.
3. Therefore,
=3X1O8. [NO<]~[TBP]~ - [5,000]4[0.2]2 [NO;]:[TBP]: - [ 114[295]’
The rate of Zr(N03),.2TBP formation in the aqueous phase should be approximately lo8 times greater than that in the organic phase. The conclusion and assumption for the re- mainder of this study are that the formation of Zr(N03),.2TBP is predominantly an aqueous-phase reaction. It will be shown later that the reaction is not instantaneous and, consequently, not interfacial.
Equation 8 displays the equilibrium expression based on Eq. 7.
The following assumptions and consequent simplifications were made to express the equilibrium constant in terms of concentrations rather than activities. For a liquid-phase re- action at constant temperature and pressure, the equilibrium constant is defined in terms of activities:
The activitiy of species i in a mixture is defined in terms of fugacity :
For a solute at low concentration, the fugacity can be ap- proximated by Henry’s Law:
such that
for For a solute high concentration, the activity coefficient can
be approximated as one, in accordance with the Lewis-Randall rule. such that:
taken as onz, and water the solvent.
and
for an aqueous solution. For the system of this study, zirconium and TBP are at low
concentrations in the aqueous phase (x,< and nitric acid is at a relatively high concentration ( 4 ~ 0 . 2 ) .
The aqueous-phase Zr(N03),. 2TBP species is difficult to measure because the aqueous-phase cation Zr4+ also exists. However, the cation Zr4+ does not exist in significant concen- tration in the organic phase, so the organic-phase Zr(NO,), .2TBP species predominates and is consequently
AIChE Journal June 1992 Vol. 38, No. 6 805

measurable. The zirconium at the beginning of the test exists only in the aqueous phase and predominantly as the Zr4' species.
Distribution coefficients reported in the literature for zir- conium at chemical process conditions similar to this study must be defined by Eq. 9:
7 -
6.5 - 6-
5.5 - 5-
4.5 - 4 -
3.5 -
[Zr(NO,),. ZTBP], [Zr4+lO + [Zr(N03),.2TBP],'
m,p. = (9)
Equation 9 can be combined with the zirconium material bal- ance and re-arranged to yield a linear form capable of regres- sion, yielding the [Zr4'], and [Zr(NO,),. 2TBP], reaction equilibrium constant and Zr(N03), .2TBP distribution coef- ficient based on the equilibrium organic-phase total zirconium concentration.
1 [Zr4+ (t=O)],+ [Zr(NO3),.2TBP1, -- - mzr4+ [Zr(NO,),. 2TBP1,
where
[Zr(NO,), . ZTBP], [Zr(NO,), .2TBP],' mzrr =
Zirconium equilibrium shake tests were performed over a range of HNO, and TBP concentrations. The data were re- gressed by Eq. 9, and the results are shown in Figure 5, where:
Keq = 3.5 x ld2 (mol/mL)6 mzrt ~ 0 . 3 5 and R2>0.95.
Zirconium-Purex significant components of mass transfer
As done with acetic acid, the effects of phase volume, mixer diameter, and interfacial area on the Zr4' mass-transfer rate were ascertained by use of a half factorial experimental design evaluated with a half normal plot. Table 2 shows the mass of zirconium transferred from aqueous phase to organic phase at two, four and six hours. The initial test conditions (before equilibrium) for Table 2 were the following:
~~ ~
Aaueous Phase Organic Phase
3.5 M HNO, in water 0.00137 M Zr(NO,), 25°C 25°C 150 rpm 150 rpm
30 vol. 070 TBP 70 vol. 070 dodecane
The half normal plot corresponding to two hours in Table 2 is shown in Figure 6. It is evident from Figure 6 that only the organic-phase mixer diameter significantly affected the mass-transfer rate at greater than the 0.05 significance level, at up to two hours into each test. Conclusions from the half normal plot for zirconium mass transfer up to two hours are:
1. Mass-transfer resistance in the organic phase predomi- nated up to two hours into each test; consequently, aqueous
7.5 I
0 Data - Regression
1--
3 : I I I I I
5 15 25 35 4 5 55
Figure 5. Complexed zirconium distribution coefficient and equilibrium constant.
bulk and aqueous interfacial concentrations were approxi- mately equal up to two hours.
2. Based on the first conclusion, the organic-phase Zr(N03)4.2TBP diffusional resistance significantly affects the zirconium mass-transfer rate.
The effect of each reactant concentration on the zirconium mass-transfer rate was used to demonstrate that the chemical complexation reaction significantly affected the mass-transfer
Table 2. Accumulated Zirconium in Organic Phase for Changes in Interfacial Area, Phase Volume, and Mixer Di-
ameter
Mass Transferred (g x 10') Zr Mixer Diameter Phase
Area Vol. h &i&i do2,doi &,do2 do2do2
X
130 243 321
75 115 166
X
X
147 269 356 139 252 337
X
27 1 403 570
X
X
250 454 607
s2 ~ , I , V , , 2 177 389 4 X 306 53 1 6 423 619
V,2,V0I 2 137 4 268 X X 6 28 1
V d , Vd 2 76 4 145 X X 6 206
Vo2rVoZ 2 194 240 4 X 373 42 1 6 410 532
X
280 445 612 319 520 632
X
806 June 1992 Vol. 38, No. 6 AIChE Journal

0 Data (only four most significant effects labeled)
0.0 0.5 1 .o 1.5 2.0 Z
Figure 6. Zirconium half normal plot.
rate. Table 3 shows the range of test conditions used to in- vestigate the reactant concentration effect.
Equations 10 through 12 define the zirconium mass transfer if it were assumed that the chemical reaction is instantaneous.
Chemical complexation reaction:
-Kf[Zr4+],[N0,]lf - v,-- d[Zr4 '1, d t
- K[Zr(N03),.2TBP],, = 0 (instantaneous reaction). (10)
D$fusion:
- V, d[Zr(NOJ4.2TBP], s d t
= k,( [Zr(N03),.2TBP],* - [Zr(N03),.2TBP],). (11)
Material balance:
vO[Zr4+ ( t = O)], = v,[z~,+ 1, + V,[Zr(N03),.2TBP],+ V,[Zr(N03),~2TBPl,. (12)
The solution to Eqs. 10 through 12 is shown as Eq. 13, in which the only unknown constant is the organic-phase indi- vidual mass-transfer coefficient for Zr(N03),.2TBP. The in- terfacial concentration [Zr(NO,),. 2TBP],* is eliminated by use of mzrj:
Table 3. Tests Demonstrating Concentration Effect
Reacta-t' Time Test 1 Test 2 Test 3 Test 4 mol/L
[Zr4+I0 ( t=o) 1 . 4 ~ lo-' 0 . 7 ~ lo-' 1 . 4 ~ lo-' 1 . 4 ~ lo-' "0, ( t = O ) 0.0029 0.0029 0.0015 0.0029 [TBPI,,.,, ( t = O ) 1.1 x 1.1 x lo-' 1.1 x lo-' 0 . 6 ~ lo-'
[Zr(NO,),.2TBP], (g/L x 105)
2 h 399 133 70 136 4 h 510 173 113 187 6 h 629 240 133 216
* eq refers to aqueous-organic equilibrated concentrations before zirconium in- troduction.
(13) k, = (I/t)ln[A ' / ( A ' - B' CZr,,)],
where
and initial conditions are:
[Zr4+ ( t = O)], = Zr4+ introduced initially [Zr(NO,), .2TBP], = 0 [Zr(N03),.2TBP], = 0.
Simplifications for two-hour data are:
[No, ( t ) lQ= [No; (t=o)lQl
since [NO; ( t = O)],>> [Zr4+ ( t = O)],,
and
[TBP ( t)], = [TBP ( t = O)],,
since organic-phase mass-transfer resistance was predominant up to two hours.
Table 4 displays the k, values regressed from Table 3 using Eq. 13, which assumes an instantaneous chemical complexa- tion reaction. When reactant concentrations are reduced (ex- cept for NO;, test 3), the value of k, decreases. Viscosity changes, due to reduction of the reactant concentrations, would either have a negligible effect on k, or would actually increase k,. The k, calculated when reducing the NO; concentration in test 3 was found to be highly sensitive to the fourth-power exponent in Eq. 10 and was consequently considered an un- certain data point. It was concluded from Table 4 that an additional resistance to mass transfer occurs when reducing reactant concentrations. This additional resistance to mass transfer is actually a result of the chemical reaction, implying a noninstantaneous complexation reaction. Therefore, during the initial two hours of each test, the mass-transfer rate of Zr4+ was predominantly controlled by the chemical complex- ation reaction in the aqueous phase and the mass-transfer resistance t o the complexed species Zr(N03),.2TBP in the or- ganic phase.
Components of the mass-transfer model describing the zir- conium-Purex stirred-celI tests of this study (up t o two hours) are based on: the chemical complexation reaction in the aqueous phase; insignificant diffusional resistance in the aqueous phase and hence, lack of position-related concentration gradients in
Table 4. Organic-Phase Individual Mass-Transfer Coeffi- cient Assuming Instantaneous Complexation Reaction
Test 1 Test 2 Test 3 Test 4
ko (cm/s) x lo4 2.4 1.5 2.4 1.3
AIChE Journal June 1992 Vol. 38, No. 6 807

the aqueous phase; and the organic-phase diffusional resistance of the zirconium complex. These components of mass transfer can be modeled by Eqs. 10 through 12, where Eq. 10 does not equal zero (noninstantaneous complexation reaction).
Beyond two hours of each test, aqueous diffusion was sig- nificant, which required Eq. 10 to be nonlinear, and then required a numerical simultaneous solution to Eqs. 10 t o 12. Consequently, only two-hour data were used t o regress the complexation reaction rate constants. Two-hour data involved insignificant aqueous diffusion, which allowed Eq. 10 to be linear and permitted an exact simultaneous solution to Eqs. 10 to 12.
The simultaneous solution of Eqs. 10 through 12 was ac- complished with Laplace Transforms to yield Eqs. 14 t o 16.
[Zr4+l0 = b2 + ble-""+ b,e-uor.
1 [Zr(N03)4.2TBP],=- [A2b2+ b2(AI -aI)e-""
A , + b,(A2 - ~ , ) e - ~ ~ ~ ] .
- b
where
a, = t - f 4 + a, = { - f 4 -
A , = R / V a
Equation 16 was used to regress the reaction rate constants because the zirconium cation and zirconium complex could not be easily distinguished in the aqueous phase. The regression was based on a single degree of freedom, that is, only one
regression constant was unknown. The constants included in Eq. 16 were determined by the following procedures.
(1) Phase volumes V, and V , were measured directly. (2) Interfacial area S was measured directly. (3) Initial concentrations [Zr4+ ( t = 0)10, [NO, ( t = 0)10, and
[TBP(t = O)], were measured directly. (4) The organic-phase complexed species [Zr(NO,), .2TBP],
mass-transfer coefficient was calculated by Eqs. 2 and 6. For the 3-cm-dia. paddle at 150 rpm and 25"C, k, was calculated to be 0.000167 cm/s in 30 vol. To TBP and 70 vol. 070 dodecane. For the 6-cm paddle a t similar conditions, k, was calculated to be 0.000567 cm/s.
(5) The Zr4+ complexation equilibrium constant Keq and [Zr(NO,), . ZTBP] distribution coefficient mzri were deter- mined from regression of equilibrium data using Eq. 9 as shown by Figure 5. The equilibrium constant was then used to elim- inate either the forward or reverse Zr4+ complexation reaction rate constant, @ or K'.
Since the two reaction rate constants were related to the equilibrium constant by Keq =Kf /K , only one constant re- mained to be defined in Eq. 16, K'or r. The regression analysis utilized a trial-and-error computer program to select the con- stant (@ or K ) based on the weighted least-square error be- tween the measured and predicted [Zr(N03)4.2TBP], value of Eq. 16 (see DeMuth, 1989, p. 206).
Data were selected for regression of reaction rate constants from Tables 2 and 3, such that one change of each parameter and reaction concentration was included. The two-hour data were exclusively used for regression, because aqueous mass transfer at four and six hours was more significant (see DeMuth, 1989, p. 96). The aqueous resistance at four and six hours was probably a result of TBP diffusion into the aqueous phase. Before zirconium introduction at the beginning of the test, the aqueous and organic phases were equilibrated. Judging from the solubility of TBP in the aqueous phase and the total amount of zirconium transferred to the organic phase at equilibrium, TBP was well in excess in the aqueous phase up to about two hours of mass transfer (see DeMuth, 1989, p. 184).
The value of the forward compIexation reaction rate con- stant regressed from the data of Tables 2 and 3 was determined to be:
Kr= 6.5 x lo2' [(rnol/s)(mL/mol)'].
The average error was 24% of the predicted [Zr(N03),.2TBP], value, with a variance of 1 . I x (mol/mL)*. The reverse rate constant was calculated from the forward rate constant and equilibrium constant to be:
K = 0.059 (mL/s).
Figure 7 shows the measured value of [Zr(N03)4.2TBP], and predicted values of [Zr4+],, [Zr(N03),.2TBP], and [Zr(N03),.2TBP], as calculated from Eqs. 14 through 16 with the regressed distribution coefficient and rate constants. The approximate 95% confidence interval band is shown for data at only two hours. The data a t four and six hours fall below the predicted curve as would be expected with additional aqueous-phase mass-transfer resistance. The approximate 95% confidence interval was estimated as two standard errors, in which one standard error equals the square root of the variance.
June 1992 Vol. 38, No. 6 AIChE Journal 808

A standard error-propagation analysis was performed, which related the measured concentration variance to the predicted concentration variance. This was necessary because of the non- linearity of the model (see DeMuth, 1989, p. 213).
0
X 7
= 12- 0 Measured organic Zr concentration E
F 0 9 - [Zr(NOg)d* 2TBPla
2 k 6- 0" .- E, 8 0- I
. - E .- c
c
V c [zr4+]a
3 - C
i;r
Zirconium-Purex application to CSTR Modern nuclear fuel reprocessing facility designers promote
the use of mixer-settlers or centrifugal contactors for fission product decontamination. The short residence time of mixer- settlers and centrifugal contactors is useful when attempting to extract uranium and plutonium (with relatively fast com- plexation reaction kinetics) from fission products (with rela- tively slow complexation reaction kinetics). In addition, their short residence time reduces hydrolytic and radiolytic solvent (TBP and diluent) degradation.
A mixer-settler or centrifugal contactor interfacial-area/ phase-volume ratio would be orders of magnitude greater than the same ratio for the stirred cell of this study (see DeMuth, 1989, p. 105). For mixer-settler or centrifugal contactor con- ditions, the mass-transfer rate of zirconium extraction via the Purex process is likely to be predominantly controlled by the complexation reaction. The large interfacial-area/phase-vol- ume ratio would render diffusional resistance insignificant.
0
The complexation reaction for zirconium fined by Eq. 10 can be combined with the CSTR, Eq. 13 of Levenspiel (1972, p. 103),
[Zr4+ (t=O)],- [Zr4+], - r t =
or
extraction as de- expression for a to yield Eq. 17.
(17) [Zr4+ ( t = O)], - [Zr4+ 1,
KJ[Zr4 +]$NT - K[Zr(N03), .2TBP],' t =
The degree of extraction can be defined in terms of initial zirconium concentration [Zr4+ ( t = O)], and the zirconium transferred to the organic phase [ZT(NO~)~.~TBP] , , as shown in Eq. 18 by rearranging Eq. 17.
and organic reactants can coexist only at the interface. The equilibrium constant based on Eq. 19 is shown by Eq. 20.
The equilibrium constant of Benedict differs from the equi- librium constant of this study by the HN03 and TBP distri- bution coefficients, as shown by Eq. 21.
The ratio of the Keq determined by this study and Keq' reported by Benedict is:
Keg [2.7x (mL/m01)~](1 L/l,OOO rnL)(, K q ' 0.0032 (L/mol)6
= 8.4 x lo6. -- -
Equation 18 can be applied to most all of the Purex species, which would provide a.modeling tool for optimization of de-
in terms of contacting equipment residence time. The ratio OfK,,/K,,' determined from HN03 and TBP dis-
tribution coefficients differs from the K,, (of this study) and Keqf (of Benedict) ratio by approximately a factor of three. This should be considered good agreement based on the com- plexity of controlling the zirconium species of interest, that is, Zr(OH)"(NO,)'-" hydrolysis and polymerization.
The zirconium complexation rate constants KJ and K can be compared with similar constants determined by Mailen et al. (1980). Mailen performed mass-transfer tests with zircon- ium in the Pure= system using a stirred cell similar to this study. Mailen's mass-transfer model is shown by Eq. 22.
Conclusions Literature comparison
The Zr4+ complexation equilibrium constant Keg and corn- plexation reaction rate Constants KJand JC from this study can be compared with similar constants reported in the literature.
Benedict et al. (1981, p. 192) report a zirconium complex- ation equilibrium constant based on Eq. 19.
[Zr4+], + 4[NO;], + 2[TBP], = [ZT(NO~)~.~TBP] , .
Equation 19 must be assumed to be interfacial, because aqueous S
VO -- (K')[Zr(N03),.2TBP],. (22)
AIChE Journal June 1992 Vol. 38, No. 6 809

The mass-transfer model of this study, Eq. 10, can be related to Mailen’s as shown by Eq. 23.
By rearranging the equation, one can make a comparison of KJ (this study) and Kf’ (Mailen’s) as follows:
@ (this study) = 6.5 x 10” [(mol/~)(mL/mol)~],
S(K/‘) ”0; 1: f [ T B P l d m ~ w 1 *
= (4.2 - 5.4) x 10” [(mol/s)(mL/mol)’].
Multiple values for Mailen’s K’‘ exist because it depended on the interfacial area. Comparison of Mailen’s forward rate con- stant with the forward rate constant of this study agrees within a factor of two. This should be considered good agreement.
Acknowiedgmen t Research was conducted at and sponsored by the Consolidated Fuel
Reprocessing Program of Oak Ridge National Laboratory, under US. Government contract no. DE-AC05-840R21400.
Notation - * = c =
C N T = d = D =
g = g o _ = g =
Keq =
x = k =
K = Kf =
R = M = m =
NRe = Ns, =
R = S = t =
TBP = V = W =
IVI = z =
m =
x =
activity in mixture concentration
mixer diameter; d , = 3 cm, d2 = 6 cm diffusion coefficient fugacity of pure species fugacity at standard state fugacity in a mixture Henry’s law constant individual mass-transfer coefficient K f / R , complexation reaction equilibrium constant overall mass-transfer coefficient forward complexation reaction rate constant reverse complexation reaction rate constant molar C,/C,, equilibrium distribution coefficient molality ( a d 2 / ” ) , Reynolds number ( u / D ) , Schmidt number correlation coefficient interfacial area; S , = 62 cm2, S2 = 79 cmz time tributyl-phosphate phase volume; V, = 350 mL, Vl = 450 mL half normal plot W-factor mole fraction concentration of species y (mol/mL) half normal plot weighting factor
“0; (t=0)1:1 [TBP(t=O)lo/(mm,)12
Greek letters 0 = stoichiometric equivalent y = activity coefficient Y = kinematic viscosity
w = mixing speed (rpm)
Subscripts a = aqueous phase o = organic phase
Literature Cited Adamskii, N. M., S. M. Karpacheva, I. N. Melnikov, and A. M.
Rozen, “The Distribution of Zirconium on Extraction with n-Tri- butyl Phosphate,” Radiokhimiya, II(4), 400 (1980).
Alcock, K., F. C. Bedford, W. H. Hardwick, and H. A. C. McKay, “Tri-n-Butyl Phosphate as an Extracting Solvent for Inorganic Ni- trates,” J. Znorg. Nucl. Chem., 4, 100 (1957).
Baes, C. F., Jr., and R. E. Mesmer, The Hydrolysis of Cations, Wiley, New York (1976).
Barrow, G . M., General Chemistry, Wadsworth Publishing, Belmont, CA (1972).
Benedict, J., T. H. Pigford, and H. W. Levi, Nuclear Chemical En- gineering, 2nd ed., McGraw-Hill, New York (1981).
Bulicka, J., and J. Prochazka, “Mass Transfer between Two Turbulent Liquid Phases,” Chem. Eng. Sci., 31, 137 (1976).
DeMuth, S. F., “The Transport Dynamics of Zirconium Liquid-Liquid Extraction Based on the Purex Process used for Reprocessing Spent Nuclear Reactor Fuels,” Diss., University of Tennessee (1989).
Egorov, G. F., V. V. Fomlin, Yu G . Frolov, and G . A. Yagodin, “Tributyl Phosphate Solvates of Zirconium and Hafnium Nitrates,” Russian J. of Inorg. Chem., 5 , 503 (1960).
Johnson, N. L., and F. C. Leone, Statistics and Experimental Design: II , Wiley, New York (1964).
Leroy, P., “Study of the Solvent 30% Tributyl Phosphate in Dode- cane,” Fontenay-aux-Roses Nuclear Research Center report CEA- 3207 (Mar., 1967).
Levenspiel, O., Chemical Reaction Engineering, 2nd ed., Wiley, New York (1972).
Lewis, J. B., “The Mechanism of Mass Transfer of Solutes Across Liquid-Liquid Interfaces,” Chem. Eng. Sci., 3 , 248, 260 (1954).
Lo, T. C., M. H. I. Baird, and C. Hanson, Handbook of Solvent Extraction, Wiley, New York (1983).
Mailen, J. C., D. E. Horner, S. E. Doris, H. Pih, S. M. Robinson, and R. G. Yates, “Solvent Extraction Chemistry and Kinetics of Zirconium,” Sep. Sci. and Technol., 15(4), 959 (1980).
Mayers, G . R. A., “The Correlation of Individual Film Coefficients of Mass Transfer in a Stirred Cell,” Chem. Eng. Sci., 16, 69 (1961).
Marcus, Y., and A. S. Kertes, Ion Exchange and Solvent Extraction of Metal Complexes, Wiley-Interscience, New York (1969).
McManamey, W. J., “Interfacial Resistance in the Liquid Extraction of Inorganic Nitrates,” Chem. Eng. Sci., 15, 251 (1961).
Nikitina, G . P., and M. F. Pushlenkov, “Mechanism of Zirconium Extraction by Organophosphorus Compounds,” Radiokhimiya, IV(2), 137 (1962).
Olander, D. R., “Simultaneous MassTransfer and Equilibrium Chem- ical Reaction,” AIChE J . , 6(2), 233 (1980).
Reznik, A. M., A. M. Rozen, S. S. Korovin, and I. A. Apraksin, “The Extraction of Zirconium and Hafnium from Solutions Con- taining Nitric and Hydrochloric Acids by Tributyl Phosphate,” Radiokhimiya, V(1), 49 (1963).
Siczek, A. A., and M. J. Steindler, “The Chemistry of Ruthenium and Zirconium in the Purex Solvent Extraction Process,”Atomic Energy Rev., 16(4), 575 (1978).
Tsvetkova, Z. N., A. S. Solovkin, N. S. Povitskii, and I . P. Davydov, “Mechanism of the Extraction of Zirconium Nitrate from Highly Acid Solutions with Tri-n-Butyl Phosphate,” Russian J. of Inorg. Chem., 6(2), 247 (1961).
Manuscript received Mar. 21, 1991, and revision received Oct. 2, 1991.
810 June 1992 Vol. 38. No. 6 AlChE Journal