international journal of management cases
TRANSCRIPT
Volume 11 Issue 3
InternationalJournal of ManagementCases
AwAreness on energy efficiency within governmentAl Bodies
cAse study: legA mArketing strAtegy
strAtics model Building- reseArch ApplicAtion
estABlishment of BulgAriAn retAiler’s mArketing profile
increAsing consumers’ sAtisfAction By developing compAny’s core competences
pAkizA
orgAnic food mArketing in croAtiA – producer’s perspective
impediments in knowledge shAring And mAnAgement in Advertising Agencies - A cAse study to understAnd the impediments of knowledge shAring in An Advertising Agency
customers’ perception of services in uk’s conference And meeting industry
polArizAtion of consumption - poverty And weAlth of the polish households
sAles trAining techniques in croAtiA
frAnchising And its impAct on smAll-medium enterprises: A focus on sAudi ArABiAn Business environment
hospitAlity grAduAtes in sme’s: A need for competencies trAnsformAtion?
EDITORSWestern EuropeProfessor Barry J. DaviesProfessor of Marketing, University of Gloucestershire, UK [email protected].
The Rest of the WorldProfessor Claudio VignaliArnold Ziff Chair in Retailing, Leeds Metropolitan University, UK [email protected]
Central EuropeProfessor Tihomir VranesevicThe Graduate School of Economics, The University of Zagreb [email protected]
EDITORIAL BOARD Dr. David J. Bennett Head of Department, Operations & Information Management Division, Aston Business School, Birmingham, UK [email protected] Dr. Leo Dana University of Canterbury, New Zealand [email protected] Alberto MattiacciProfessor of Retailing and Marketing,The University of Sienna, Italy mattiaccialbunisi.itDr. Hans-Rüdiger Kaufmann University of Nicosia, Cyprus [email protected] Dr. Jürgen Polke Associate Dean, University of Applied Science, Vorarlberg, Austria [email protected] Professor Carlo A. Pratesi Professor of Retailing Marketing, University of Urbino, Italy [email protected] Brenda Sternquist Professor, International Retail Management, Michigan State University, USA [email protected] Dr. Tomasz Wisniewski The University of Szczecin Poland [email protected] Irena NeganovaUral Sate University, [email protected] Ulrich ScholzFontys Fachhochschule, [email protected] Sanda RenkoGraduate School of Economics Zagreb, [email protected] Lutz SommerUniversity of Albt, [email protected]. Jantima BanjongprasertSilpakon University, [email protected] Vitor AmbrosioUniversity of Estoril, [email protected] Bernd BritzelmaierPforzeim University, [email protected] Evangelos TsoukatosTEI, [email protected] Ihn Hee ChungKumoh Institute of Technology, South [email protected] Gianpaolo BasileUniversity of [email protected]
PRODUCTION EDITORGianpaolo Vignali [email protected]
www.ijmc.org
ISSN 1741-6264
International Journal of Management Cases is published by:
Access Press UK, 1 Hillside Gardens , Darwen, Lancashire, BB3 2NJUK
Copyright © Access Press UK
Centre for International Research in Consumers Location and their Environments (CIRCLE)
1
I n t e r n a t i o n a l J o u r n a l o f M a n a g e m e n t C a s e s
ContentsAWARENESS ON ENERGy EffICIENCy WITHIN GOVERNMENTAL BODIES 4HRVOJE MEDARAC & CLAUDIO VIGNALI
CASE STUDy: LEGA MARKETING STRATEGy 11HRVOJE MEDARAC & IVAN MEDARAC
STRATICS MODEL BUILDING- RESEARCH APPLICATION 28HRVOJE MEDARAC
ESTABLISHMENT Of BULGARIAN RETAILER’S MARKETING PROfILE 36SEPTEMVRINA KOSTOVA
INCREASING CONSUMERS’ SATISfACTION By DEVELOPING COMPANy’S CORE COMPETENCES 45IRINA S. NEGANOVA
PAKIzA 53ROSHAN J M KAZI & R C NATARAJAN
ORGANIC fOOD MARKETING IN CROATIA – PRODUCER’S PERSPECTIVE 71Nataša ReNko, aNte Vuletić & Ružica ButigaN
IMPEDIMENTS IN KNOWLEDGE SHARING AND MANAGEMENT IN ADVERTISING AGENCIES - A CASE STUDy TO UNDERSTAND THE IMPEDIMENTS Of KNOWLEDGE SHARING IN AN ADVERTISING AGENCy 80SUPRIyA M. KALLA & RAJEN GUPTA
CUSTOMERS’ PERCEPTION Of SERVICES IN UK’S CONfERENCE AND MEETING INDUSTRy 88IRENA PANDZA & PROFESSOR CLAUDIO VIGNALI
POLARIzATION Of CONSUMPTION - POVERTy AND WEALTH Of THE POLISHHOUSEHOLDS 94JOLANTA WITEK
SALES TRAINING TECHNIqUES IN CROATIA 101MARIJA TOMASEVIC LISANIN, MIRKO PALIC & KRISTINA OZIMEC
fRANCHISING AND ITS IMPACT ON SMALL-MEDIUM ENTERPRISES: A fOCUS ON SAUDI ARABIAN BUSINESS ENVIRONMENT 112MUHAMMAD ASAD SADI & WAJDI KHALIL AL-FUZAI
HOSPITALITy GRADUATES IN SME’S: A NEED fOR COMPETENCIES TRANSfORMATION? 131NACHMIAS N. STEFANOS & yIANNA ORPHANIDOU
2
I n t e r n a t i o n a l J o u r n a l o f M a n a g e m e n t C a s e s
Subscription Fees2010 subscriptions are available in a number of major currencies. Exchange rates and prices will be held throughout 2010.
Subscription fees per volume are:
$US 300 £Stg 150 $Aus 370
€ 210 SFr 345 ¥ 33,740
Individual journal editions can be purchased at the following prices:
10 Journals @ £15 per journal 20 Journals @ £10 per journal 50 Journals @ £7 per journal
Subscription information is available from the Publishers at:
G Vignali Access Press UK 1 Hilllside Gardens Darwen Lancashire BB3 2NJ UK
+447815737243
Reproduction RightsThe publishers of the International Journal of Management Cases have granted, free of charge, unlimited photocopying and other reproduction rights to subscribers, for teaching and study use within the subscribing organization. Authors may also photocopy or otherwise reproduce their particular case from International Journal of Management Cases, subject to an acknowledgement of publication and copyright details.

3
I n t e r n a t i o n a l J o u r n a l o f M a n a g e m e n t C a s e s

AWARENESS ON ENERGy EFFICIENCy WITHIN GOVERNMENTAL BODIES
HRVOJE MEDARACLEEDS METROPOLITAN UNIVERSITy, UK
CLAUDIO VIGNALILEEDS METROPOLITAN UNIVERSITy, UK
ABSTRACT
The main subject of this research was finding out what is the level of awareness on Energy Efficiency within governmental bodies in Croatia.
Under “Directive 2006/32/EC of the European Parliament and of the Council, of 5 April 2006 on energy end-use efficiency and energy services and repealing Council Directive 93/76/EEC” Republic of Croatia will have to, as all the Member States of the European Union, achieve the target of 9% in national energy savings in the future nine years. The first step in this direction was enacting The Act On Energy End-Use Efficiency.
This will be achieved by the Directorate for Energy and Mining within the Ministry of Economy, Labour and Entrepreneurship. At the time when this research was done (Spring 2007), the Energy department consisted of only 12 people plus a secretary and an assistant minister, and these people were responsible for creating and implementing the energy policy in Croatia. Every one of them had responsibility for his/ her sector and each one of them was crucial in gaining aims for their sectors.
Some of measures to achieve these aims are related to the public sector. The exploratory research showed the awareness on Energy Efficiency of people who work in this sector and on whose effort these measures will give results. The main research showed the awareness on Energy Efficiency among people who will have to implement the Energy Efficiency measures in their ordinary work. The exploratory research was done in the Energy Department with aims to find out what Energy Efficiency measures do employees of Department think of, what level of internal education is needed in order to achieve goals as
easiest as possible and what kind of questions are needed in the main research to find out more about the awareness on Energy Efficiency in governmental bodies.
Key words: Energy Efficiency, Governmental Body, Ministry, Interview, Qualitative Research, Content Analysis, Directive 2006/32/EC, Croatia
Introduction
Governmental bodyThe governmental body can be defined as an organized group of people with a common function in the system by which a state or community is governed. Governmental bodies in Croatia are the Government with Offices, Ministries, Central State Administrative Offices, State Administrative Organizations and Public Organizations. The other organizations within the Public Sector are organizations related to the Office of the President, the Parliament, twenty-one counties, the City of Zagreb, municipalities, army and juridical authority bodies. All of these organisations as of the state owned companies are obligated to use public procurement in everyday business.
The Directorate for Energy and MiningThe Directorate for Energy within the Ministry of Economy, Labour and Entrepreneurship of the Republic of Croatia is the governmental body responsible for energy (The Ministry of Economy, Labour and Entrepreneurship, 2009) and this means that this Directorate will have to transpose all European energy legislation into national. One of directives that will have to be fully transposed
5
I n t e r n a t i o n a l J o u r n a l o f M a n a g e m e n t C a s e s
is the “Directive 2006/32/EC of the European parliament and of the Council of 5 April 2006 on energy end-use efficiency and energy services and repealing Council Directive 93/76/EEC” which gives the target of 9% in national energy savings in the future nine years. (Directive 2006/32/EC, 2006)
The Energy Department within the Directorate for Energy and mining consists of only twelve people plus a secretary and an assistant minister, and these people create the energy policy in Croatia. Every one of them is responsible for his sector.
energy efficiencyThe Article 3 of the Directive 2006/32/EC gives the following definition of the Energy Efficiency: “…a ratio between an output of performance, service, goods or energy, and an input of energy;” (Directive 2006/32/EC, 2006)
It is clear that there are two main ways to reach as highest as possible values of the Energy Efficiency:
By reducing the input of energy with the same output of work
By increasing the output of work with the same input of energy.
Directive 2006/32/EC is aimed at increasing energy savings and at this moment it is important to find out more about aims regarding public sector which means that in this research only measures regarding the increase of the output of work with the same input of energy were examined. This can be done by more efficient equipment or more efficient use of the equipment but both of these measures should be accepted by the people who use the equipment. This is the reason why is it important to find out more about the Awareness on Energy Efficiency within Governmental Bodies.
Background and purposeEnergy consumption can be measured, but it is quite hard to measure the Energy Efficiency because one has to measure the energy that was not consumed, but would be consumed if Energy Efficiency measures were not implemented.
1.
2.
Since Energy Efficiency is an engineering based term, much research was done in order to find appropriate Energy Efficiency measures and to lower the costs of those measures. On the other hand, there was not much research aimed at awareness on Energy Efficiency. Institutions interested in awareness on Energy Efficiency are governmental bodies responsible for energy and they need those data for defining energy strategies.
Since April 2006 all of the Member States of the EU have the obligation to achieve the target of 9% in national energy savings in the future nine years. The energy savings are not aimed only at electricity or heating sector, but at total energy consumption which means that traffic and public sector will also be examined.
In the public area the energy savings can be done by involving Energy Efficiency conditions in public procurement. The exploratory research was done before the main research on the awareness on Energy Efficiency. The aim of the exploratory research was to find out what measures do people from the Energy Department in the Ministry of Economy, Labour and Entrepreneurship think of, what level of internal education is needed for achieving the goals stated in Directive 2006/32/EC as easiest as possible and what kind of questions are needed in the main research to find out more about the awareness on Energy Efficiency among the employees in the public sector.
On the other hand, the aim of the main research was to find out if employees in governmental bodies think of Energy Efficiency and their influence in total energy consumption.
Aims of this research were as follows:
To find out what measures of Energy Efficiency do people from the Energy Department in the Ministry of Economy, Labour and Entrepreneurship think of?
To find out what level of internal education is needed within the Energy Department in the Ministry of Economy, Labour and Entrepreneurship for achieving the goals stated in Directive 2006/32/EC as easiest as possible
To find out if employees in the governmental bodies think of Energy Efficiency
1.
2.
3.
I n t e r n a t i o n a l J o u r n a l o f M a n a g e m e n t C a s e s
6
To find out if employees in the governmental bodies think of their influence in total energy consumption.
Research methodsDuring the time of preparing the research (Spring 2007), accession negotiations for the Republic of Croatia were proceeding and negotiating positions were supposed to be taken as soon as possible, so that the time limitations for the research were quite strong.
The Ministry of Economy, Labour and Entrepreneurship employed more than 200 employees and only fifteen of them worked in the field of energy. This gave the opportunity to find appropriate representative sample of governmental bodies’ employees in the Ministry.
According to these facts the most appropriate research method was the in-depth interview. Ten people were interviewed and the only selection criteria were that they should not be the experts from the field of energy. Interviewees did not have the same level of education and did not work in the same working environment.
Data was collected during the working time in the Ministry and interviews were done in Croatian language because the interviewees feel more comfortable when using their mother tongue. On the other hand, some of interviewees spoke only Croatian language.
Exploratory Research
Research MethodsAccording to the fact that the number of interviewees was strongly limited and that the aim of research was to find out the state of awareness on individuals, the most appropriate research method was the in-depth interview.
Eight out of the twelve people were interviewed which covered all areas of energy. Data was collected during the working time and interviews were done in Croatian language because, although all the interviewees speak English very well, they felt more comfortable when using their mother tongue.
4. Analysis of the Exploratory ResearchThe questions were designed to get the most of the interviewees from as small amount of questions as possible.
Which is your field of work in energetics?
What does the term Energy Efficiency mean to you?
According to the Directive 2006-32-EC, Croatia will have to increase the Energy Efficiency by 9% in the next 9 years. How do you think that is possible in your field of work in energetics?
Which of the measures of Energy Efficiency do you think would be the easiest to implement into the work of the State Directorate?
At your work place, do you work according to the principles of Energy Efficiency?
This research showed that there was awareness on Energy Efficiency in the Directorate, but mostly it was restricted on specific working area of the interviewee.
Most of the interviewees pointed out turning off the lights when needed and improving the insulation in buildings. Beside these measures, some of the interviewees pointed out promotion and more efficient vehicles.
Of course, it was expected that employees on the higher level have a better picture of the Energy Efficiency.
Some of them pointed out the following:
market based energy prices can influence energy efficiency, but social consequences have to be taken into account
the energy using products are not part of energy systems,
there is the need to finance the Energy Efficiency measures,
the green public procurement and co-financing of energy audits were highlighted as easily to be applied on the State Directorate,
pessimism for reaching the goal of 9% in energy saving,
1.
2.
3.
4.
5.
•
•
•
•
•
7
I n t e r n a t i o n a l J o u r n a l o f M a n a g e m e n t C a s e s
promotion is the most important energy efficiency measure.
On the other hand, employees who were not on the management level did not have such a clear idea of wider Energy Efficiency measures except in their own field of work and turning off the lights. Many of proposed measures were aimed on automation of energy regulation which are very expensive measures and hard to implement. The other proposed measures were aimed at energy based public procurement.
Some of them pointed out the following:
the need to use more efficient household appliances,
some funding for energy efficiency measures in heating sector were already implemented,
energy efficiency measures in the State Directorate should be those which give the best results with the least possible expense,
the insulation of buildings should be improved,
more efficient vehicles should be used,
energy efficient products must have more popular prices than they are,
there is the need to promote Energy Efficiency in the State Directorate,
centralized heating systems should be implemented in State Directorate Buildings.
In the end, one can see that interviewees were aware of Energy Efficiency methods in all fields, especially when talking about electricity (in household appliances, transportation etc.) and heating (centralized systems and insulations), but nobody mentioned leaking of water which is huge and which directly influences total energy savings. Many interviewees mentioned turning off the lights, but no one mentioned that the elevators in the Ministry were not adjusted good enough, which allowed people to call both elevators at the same time even if they were aware that they could use only one of them at the same time. Also nobody mentioned that maybe more efficient cars could be bought for the purpose of the employees’ transportation. These cars could use
•
•
•
•
•
•
•
•
•
alternative engines and could have labels which show that Ministry supports Energy Efficiency. Maybe some of these vehicles could be donated for the purpose of Promotion.
Everyone was aware that the Energy Efficiency measures are not cheap measures and that they have to be financed. Some of interviewees saw direct financing measures as appropriate measures for managing Energy Efficiency from the Ministry.
Employees were aware of Energy Efficiency measures, but not enough to implement those measures in every single aspect of their job. There was a need to find out if the awareness on Energy Efficiency in wider public administration is high enough to implement the Energy Efficiency measures in public sector as easy as possible.
Employees knew and introduced some of Energy Efficiency measures into their field of work, but they had to be internally educated to find the other possibilities that could be introduced. There was a need to find out if wider public administration thinks of implementing Energy Efficiency measures in their everyday work.
Conclusions of the Exploratory Research are as follows:
There was the awareness on Energy Efficiency in the Directorate, but it was relatively low according to the fact that employees work in the field of energy.
There was a need to make a good internal education to raise the awareness, especially within low-level staff.
There was a need to raise the awareness on costs of Energy Efficiency measures.
Hypotheses in the main research should be aimed at
the awareness on Energy Efficiency in governmental bodies, and not only in the Directorate for Energy and Mining
the awareness on possibilities of the influence on the Energy Efficiency in governmental bodies
1.
2.
3.
4.
•
•
I n t e r n a t i o n a l J o u r n a l o f M a n a g e m e n t C a s e s
8
Main ResearchHypotheses of the main research were:
H1: The awareness on Energy Efficiency in Governmental Bodies is very low.
H2: Employees at Governmental Bodies do not see the possibility of their own influence on the Energy Efficiency in their business environment.
The research was conducted through interviews.
PilotingInterviewees were employees of the Ministry of Economy, Labour and Entrepreneurship of the Republic of Croatia. They were employees working at different kind of jobs and with all kind of the education level. The only condition in choosing interviewees was that they should not work in the field of energy because of the influence on research results. The sample represented an average employee in Croatian governmental bodies.
Interviews were structured with the intention to find the state of awareness on Energy Efficiency and the state of awareness on possibilities to influence the Energy Efficiency of the Ministry.
Research analysisHypotheses were tested through the following questions:
What does the term Energy Efficiency mean to you?
1.
Can you identify some of the Energy Efficiency measures?
In what way do you implement Energy Efficiency measures at home?
Do you work according to the principles of Energy Efficiency at your workplace?
How big is your influence on the Energy Efficiency of the Ministry?
How important for you is the reduction of water and paper consumption at your workplace?
Do you find economizing or exclusivity more important when choosing the vehicle of similar technical characteristics and price category for a business trip?
Do your superiors incite the measures of Energy Efficiency?
Are there any educations dealing with the question of Energy Efficiency in your business environment?
In your opinion, which of the Energy Efficiency measures could be the easiest to implement in your business environment?
In your opinion, which of the Energy Efficiency measures would be the easiest to implement in governmental bodies?
Most of interviewees were on good track to define the Energy Efficiency, but some of them associated it to savings, some did not have a clue what was it all about and some mixed it with renewable energy sources. At the same time most of interviewees could not identify Energy Efficiency measures.
2.
3.
4.
5.
6.
7.
8.
9.
10.
11.
9
I n t e r n a t i o n a l J o u r n a l o f M a n a g e m e n t C a s e s
Almost all of interviewees recognized at least one of Energy Efficiency measures that they implement at home. Power savings, heat savings (not explicit, but through the installation of better windows), water saving and gas savings were recognized. This was expected because the Energy Efficiency measures have a significant impact on home budget.
Interviewees showed the awareness that their influence in total Energy Efficiency of the Ministry is relatively small. There was also an interesting answer of one interviewee who showed a huge amount of honesty in the answer “Well, there is no use of me. I work opposite to Energy Efficiency measures.”
Some Interviewees stated that the reduction of water and paper consumption is important for them and some of them said that they do not mind about it. On the other hand, majority said that they find economizing more important than exclusivity when choosing the vehicle for a business trip.
Regarding the education on energy efficiency within the Ministry, some interviewees found this question suitable to express their frustrations like “Being in the State Directorate for twenty-five years, I didn’t see it happen yet.” and “I don’t think that it is their priority.”
Some interviewees mentioned energy efficiency measures regarding electricity, heating, water, but the most interesting and funny answer was given by one interviewee who besides the measures regarding especially electricity (“Replacement of existent consumers with more economic ones, regular maintenance …”) proposed an interesting solution as a heating measure (“…we could come during the summer, in order not to waste energy, in short pants like Japanese Prime Minister.”).
Regarding measures which would be the easiest to implement, the following ones were recognized:
“…to waste less paper, maybe water, heating and lightning. Maybe by buying appropriate equipment which would meet those criteria which incite that energy efficiency.”
“…vehicle fleet…” and “…the State Directorate on one place…”,
“Papers, electricity and water.”
•
•
•
It is very interesting that majority of interviewees could identify Energy Efficiency measures for the Ministry, but could not apply those measures to a wider public administration.
It is interesting that nobody proposed energy efficient public procurement, financial instruments for energy savings, energy performance contracting, requirements to purchase equipment and vehicles based on lists of energy-efficient product specifications, requirements to purchase equipment that has efficient energy consumption in all modes, including the standby mode and requirements to use energy audits and implement the resulting cost-effective recommendations as stated in the Directive.
Conclusions of the main researchThe research confirmed the Hypothesis H1 but the confirmation was not very strong. The Awareness on Energy Efficiency in Governmental Bodies is low, but not Very Low. Employees in Governmental bodies have some kind of a feeling of the Energy Efficiency but do not know how to express it and what are their possibilities.
The research also confirmed the Hypothesis H2 but again the confirmation was not very strong. Employees at governmental bodies do not see the possibility of their own influence on the energy efficiency in their business environment good enough to act by themselves, but there is a huge potential that these people will have the will to introduce the energy efficiency measures into their business.
Energy Efficiency measures that will probably be recognized as something positive are measures concerning reduction of electricity, paper and water consumption, better insulation of buildings and more economic vehicle fleet.
Regarding the public opinion on every single Energy Efficiency measure proposed for the public sector by the Directive 2006/32/EC there is a need of another research because this research was aimed at identifying the awareness on Energy Efficiency and proposing the initial direction for the Energy Efficiency Action Plan for the public sector.
1.
2.
3.
4.
I n t e r n a t i o n a l J o u r n a l o f M a n a g e m e n t C a s e s
10
REFERENCESDirective 2006/32/EC of the European Parliament and of the Council of 5 April 2006 on energy end-use efficiency and energy services and repealing council Directive 93/76/eec (oJ l 114, 27.4.2006, p. 64–85)
energy institute „Hrvoje Požar“, 2006, energy in Croatia 2005, The Ministry of Economy, Labour and Entrepreneurship, Zagreb
kolega, V., (2006) uvođenjem oznaka energetske učinkovitosti do energetski osviještenog tržišta kućanskih uređaja u Hrvatskoj, ege, Vol. 5/2006, p. 48-57
Marušić, M., Vranešević, t. (2001), istraživanje tržišta, 5th edition, adecco, Zagreb
Medarac, H (2007), Awareness on Energy Efficiency within Governmental Bodies, MA Thesis, Leeds Metropolitan University, UK
Strategy of the energy development of the Republic of croatia (og 38/2002) http://www.nn.hr/clanci/sluzbeno/2002/0839.htm
The European Union official web site, 2007, The EU at a glance- Europe in 12 lessons, viewed January 2nd 2007, http://europa.eu/abc/12lessons/index_en.htm
The Ministry of Economy, Labour and Entrepreneurship official web site, 2007, viewed January 2nd 2007 http://www.mingorp.hr/
The Ministry of Foreign Affairs and European Integration official web site, 2007, viewed January 2nd 2007 http://www.mvpei.hr/MVP.asp?pcpid=1123
Vignali c. et al. (2004), upravljanje streteškim marketingom, Accent, Zagreb
11
I n t e r n a t i o n a l J o u r n a l o f M a n a g e m e n t C a s e s
CASE STUDy: LEGA MARKETING STRATEGy
HRVOJE MEDARACLEEDS METROPOLITAN UNIVERSITy, UK
IVAN MEDARACLEGA MARKETING, CROATIA
ABSTRACT
This Case Study has been presented in order to show an example of the use of marketing strategy tools and procedures in order to make a small company which acts on developing market as competitive as possible. Lega is the company that produces mathematical models, business analyses and technical studies. Lega’s products are highly sophisticated products which help managers to improve their business. The main idea is to make the model which enables the manager to test different scenarios (real and possible) for managing the company and to get the optimal managing solution for every single expected situation on the market. The Market for Lega’s products is the market in development phase. In order to position itself better on the market, Lega needed to make the marketing strategy which showed that there is the need to extend promotion activities and enter international markets.
Key Words: Marketing, Strategy, Case Study, BCG, Ansoff, Marketing Mix, 4P, Swot, Stratics, Lega, Mathematical Model
Current Statein the end of 2008, lega was in the final stage of the life cycle, but stuck in the middle regarding business influencing factors. This means that the company, if nothing is to be done, will probably end its life cycle. But it also means that with only a small amount of effort, the company’s position can improve significantly. Lega makes high quality unique products for unique users. These products have appropriate price for current economy position of Croatian investors and the price continuously keeps its trend towards the real value of the product. But the problem is that Lega does not give too much effort into promotion activities, which has the consequence that it is much harder to access any new client who does not know what mathematical model is. The aim of the management of the company is to position Lega to start the new life cycle.
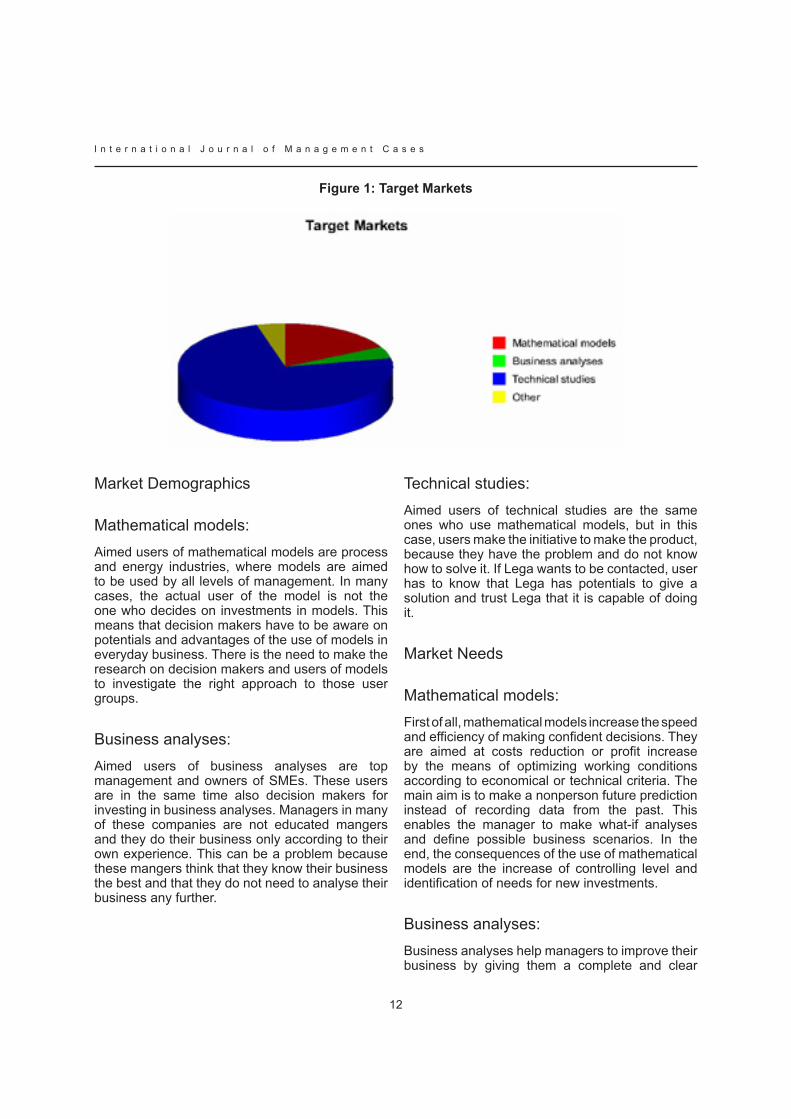
Market The main market for mathematical models is all levels of management in process and energy industries. The main market for business analyses is top management and owners of Small And Medium Enterprises (SME’s). Target Markets are shown in the Figure 1.
I n t e r n a t i o n a l J o u r n a l o f M a n a g e m e n t C a s e s
12
figure 1: Target Markets
Market Demographics
Mathematical models:Aimed users of mathematical models are process and energy industries, where models are aimed to be used by all levels of management. In many cases, the actual user of the model is not the one who decides on investments in models. This means that decision makers have to be aware on potentials and advantages of the use of models in everyday business. There is the need to make the research on decision makers and users of models to investigate the right approach to those user groups.
Business analyses:Aimed users of business analyses are top management and owners of SMEs. These users are in the same time also decision makers for investing in business analyses. Managers in many of these companies are not educated mangers and they do their business only according to their own experience. This can be a problem because these mangers think that they know their business the best and that they do not need to analyse their business any further.
Technical studies:Aimed users of technical studies are the same ones who use mathematical models, but in this case, users make the initiative to make the product, because they have the problem and do not know how to solve it. If Lega wants to be contacted, user has to know that Lega has potentials to give a solution and trust Lega that it is capable of doing it.
Market Needs
Mathematical models:First of all, mathematical models increase the speed and efficiency of making confident decisions. They are aimed at costs reduction or profit increase by the means of optimizing working conditions according to economical or technical criteria. The main aim is to make a nonperson future prediction instead of recording data from the past. This enables the manager to make what-if analyses and define possible business scenarios. In the end, the consequences of the use of mathematical models are the increase of controlling level and identification of needs for new investments.
Business analyses:Business analyses help managers to improve their business by giving them a complete and clear
13
I n t e r n a t i o n a l J o u r n a l o f M a n a g e m e n t C a s e s
picture of their business position. It identifies roots of inappropriate presence on the market, big business costs and possibly inadequate structure of employees. This is done through the analysis of financial reports and interviews, focus groups and surveys done on various levels of employees. Results of Business analyses are propositions for future business activities (redefinition of strategy, business plan, marketing plan, controlling activities etc.)
Technical studiesTechnical studies are aimed at solving needs of customers who want to invest in new plants or improving existing ones.
Market TrendsAt this moment, there is a strong trend on the market that the use of computers is present at almost every single company. Everybody wants to be computerized, because they think that the use of computers will make them more competitive. Many companies implement IT in order to efficiently collect and summarize business data from the past. This is helpful for managers
because they have every data they need at their disposal and in this way they can more easily and accurately make decisions.
On the other hand, in many cases the market still does not recognize the use of mathematical models as an advantage in their everyday business. The awareness on the use of mathematical models for the purpose of advanced managing of companies is still in development. The difference between the use of mathematical models and ordinary IT solutions for data management is that mathematical models are developed for one unique company in order to give the manager the opportunity to predict future consequences and not in order to collect data from the past.
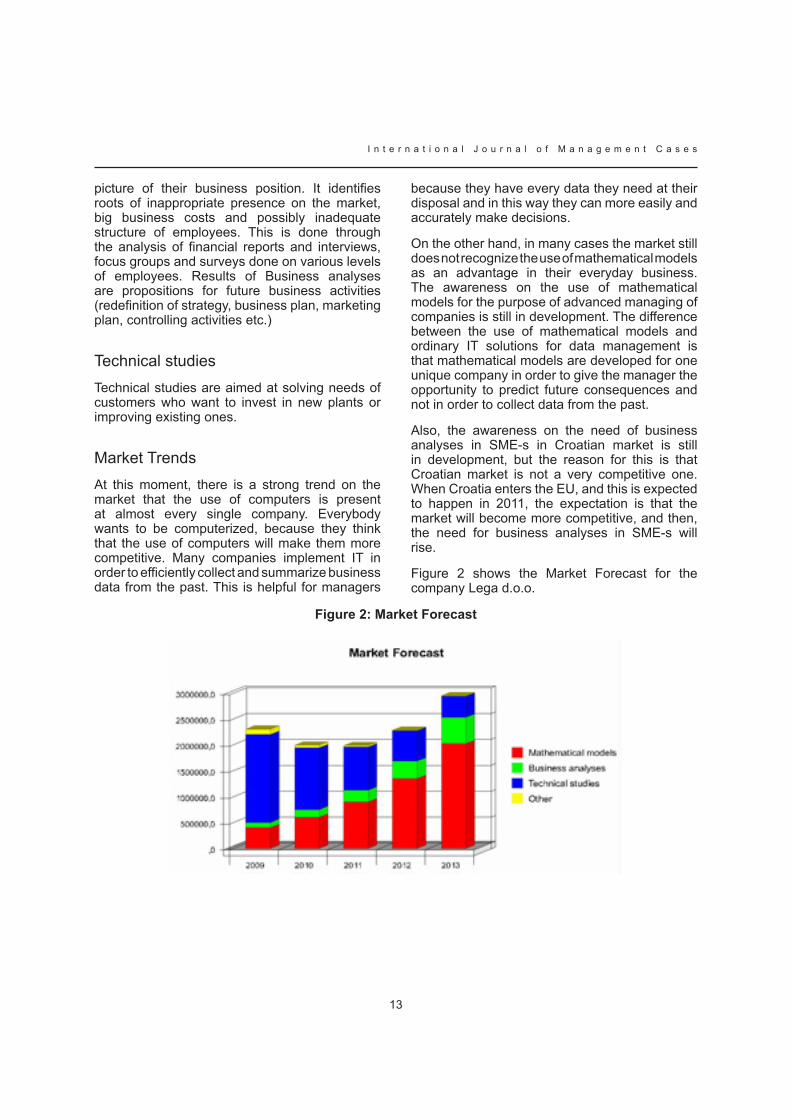
Also, the awareness on the need of business analyses in SME-s in Croatian market is still in development, but the reason for this is that Croatian market is not a very competitive one. When Croatia enters the EU, and this is expected to happen in 2011, the expectation is that the market will become more competitive, and then, the need for business analyses in SME-s will rise.
Figure 2 shows the Market Forecast for the company Lega d.o.o.
figure 2: Market forecast
I n t e r n a t i o n a l J o u r n a l o f M a n a g e m e n t C a s e s
14
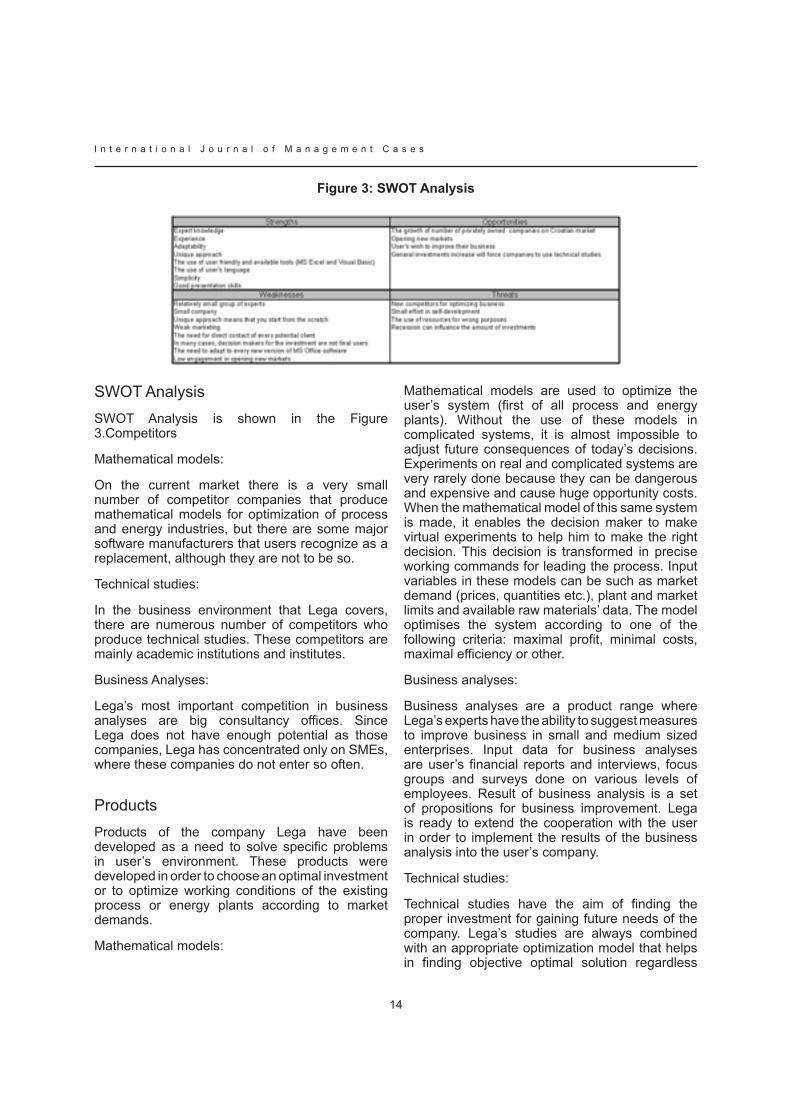
figure 3: SWOT Analysis
SWOT AnalysisSWOT Analysis is shown in the Figure 3.Competitors
Mathematical models:
On the current market there is a very small number of competitor companies that produce mathematical models for optimization of process and energy industries, but there are some major software manufacturers that users recognize as a replacement, although they are not to be so.
Technical studies:
In the business environment that Lega covers, there are numerous number of competitors who produce technical studies. These competitors are mainly academic institutions and institutes.
Business Analyses:
Lega’s most important competition in business analyses are big consultancy offices. Since Lega does not have enough potential as those companies, Lega has concentrated only on SMEs, where these companies do not enter so often.
ProductsProducts of the company Lega have been developed as a need to solve specific problems in user’s environment. These products were developed in order to choose an optimal investment or to optimize working conditions of the existing process or energy plants according to market demands.
Mathematical models:
Mathematical models are used to optimize the user’s system (first of all process and energy plants). Without the use of these models in complicated systems, it is almost impossible to adjust future consequences of today’s decisions. Experiments on real and complicated systems are very rarely done because they can be dangerous and expensive and cause huge opportunity costs. When the mathematical model of this same system is made, it enables the decision maker to make virtual experiments to help him to make the right decision. This decision is transformed in precise working commands for leading the process. Input variables in these models can be such as market demand (prices, quantities etc.), plant and market limits and available raw materials’ data. The model optimises the system according to one of the following criteria: maximal profit, minimal costs, maximal efficiency or other.
Business analyses:
Business analyses are a product range where Lega’s experts have the ability to suggest measures to improve business in small and medium sized enterprises. Input data for business analyses are user’s financial reports and interviews, focus groups and surveys done on various levels of employees. Result of business analysis is a set of propositions for business improvement. Lega is ready to extend the cooperation with the user in order to implement the results of the business analysis into the user’s company.
Technical studies:
Technical studies have the aim of finding the proper investment for gaining future needs of the company. Lega’s studies are always combined with an appropriate optimization model that helps in finding objective optimal solution regardless
15
I n t e r n a t i o n a l J o u r n a l o f M a n a g e m e n t C a s e s
of what the brand stands behind each of the equipment that is taken into account.
Keys to SuccessLega’s keys to success are as follows:
Users must be aware on potentials and advantages of the use of mathematical models in ordinary business. The idea of the use of mathematical models has to intrigue the user enough to make him contact Lega on his own initiative.
High quality and reliable products which are actively used ensure user’s trust and new markets.
Customer care and maintenance for implemented products at least once a year enforce cooperation between Lega and users and stimulate users to use models more often in their ordinary business.
MacroenvironmentRepublic of Croatia is aiming at a very soon enter to the European Union. Aimed year of entering is 2011. Then, it is expected that Croatian market will be more opened, as the EU market already is. Mathematical models of energy and process plants are relatively new product not just in Croatia but in the EU too. Lega expects to have easier contacts to potential customers in neighbouring countries.
Until autumn 2007, the inflation rate in Croatia was 3%. At this moment, the rate is 5% and the minister of finances has predicted the same in near future. Increase of inflation rate could influence buying power of potential users and decrease interest in new investments.
Since spring 2008, the indexes of both world and Zagreb stock markets fall. Many investors have taken their money out of the stock market and are looking for better alternatives.
For the first time, Croatian government stimulates citizens for savings and makes the atmosphere of crisis in the country. This causes lower economy activities in the industry and investors are more cautious on where are they going to invest their money.
1.
2.
3.
Inappropriate number of students on technical faculties in recent 15 years resulted in older labour structure in significant number of industrial plants and lack of technically educated personnel, especially outside Zagreb. This means that users may not understand the way the model works. This is the reason why models have to be more customer oriented and user friendly.
Marketing Strategy
Vision and MissionLega’s vision is to become the “brand to improve business”.
The mission of the company is “production of tools which help managers”.
Objectives
Marketing objectives for 2009 are as follows:
Market share in Croatia in the amount of 25%.
Entering international markets
Increase promotion for 100%
Financial objectives are as follows:
Income increase for 50%
Marketing costs in the amount of 5% of total income
Quick ratio in the amount of 30%
PositioningAt this moment Lega is not well positioned on Croatian market. With the increase on promotion activities and ensuring at least 5% of income for marketing activities, Lega should position itself regarding the awareness on a new approach in optimizing the business.
The strategy of the company is seen through the vision to become the brand to improve business and the mission to make tools to help managers. The way to implement this strategy is to promote advantages of the use of mathematical models and business analyses in everyday business. The other thing Lega has to focus on is to continue the
1.
2.
3.
1.
2.
3.
I n t e r n a t i o n a l J o u r n a l o f M a n a g e m e n t C a s e s
16
use of user friendly environment on which users got used to (MS Excel and Visual Basic). Lega also has to continue to make high quality models developed only for unique user.
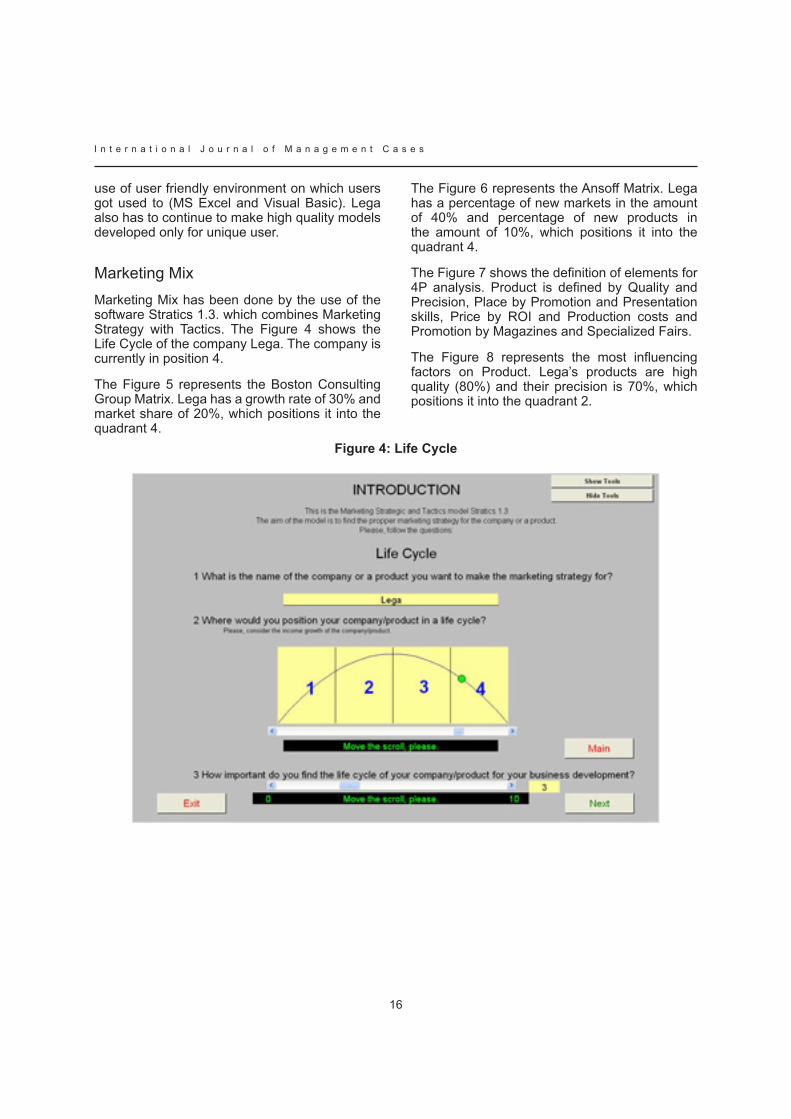
Marketing MixMarketing Mix has been done by the use of the software Stratics 1.3. which combines Marketing Strategy with tactics. the Figure 4 shows the Life Cycle of the company Lega. The company is currently in position 4.
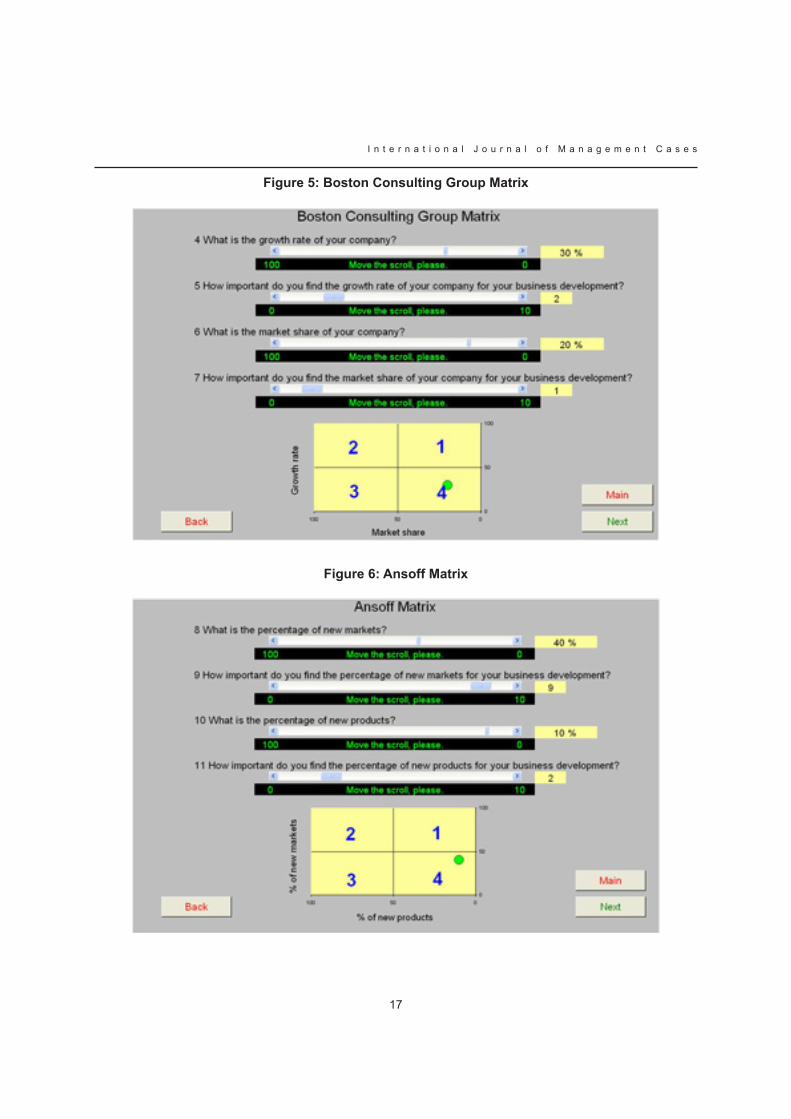
The Figure 5 represents the Boston Consulting Group Matrix. Lega has a growth rate of 30% and market share of 20%, which positions it into the quadrant 4.
The Figure 6 represents the Ansoff Matrix. Lega has a percentage of new markets in the amount of 40% and percentage of new products in the amount of 10%, which positions it into the quadrant 4.
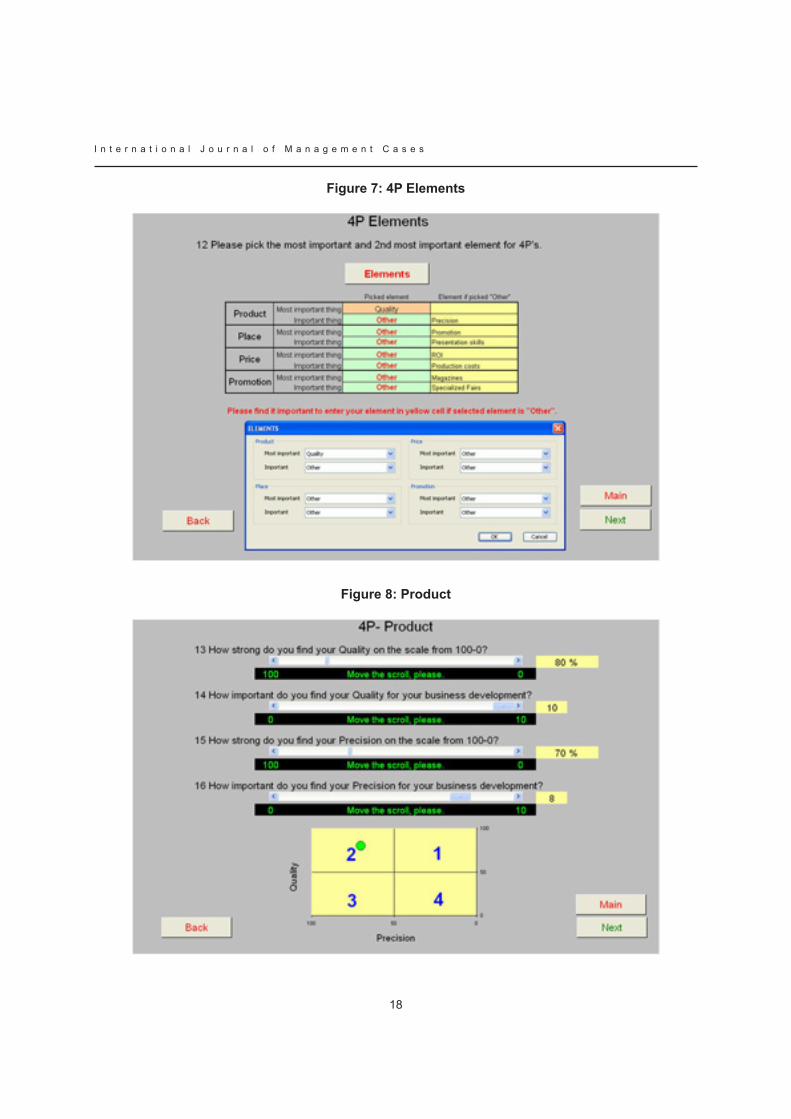
The Figure 7 shows the definition of elements for 4P analysis. Product is defined by Quality and Precision, Place by Promotion and Presentation skills, Price by ROI and Production costs and Promotion by Magazines and Specialized Fairs.
the Figure 8 represents the most influencing factors on Product. Lega’s products are high quality (80%) and their precision is 70%, which positions it into the quadrant 2.
figure 4: Life Cycle
17
I n t e r n a t i o n a l J o u r n a l o f M a n a g e m e n t C a s e s
figure 5: Boston Consulting Group Matrix
figure 6: Ansoff Matrix
I n t e r n a t i o n a l J o u r n a l o f M a n a g e m e n t C a s e s
18
figure 7: 4P Elements
figure 8: Product
19
I n t e r n a t i o n a l J o u r n a l o f M a n a g e m e n t C a s e s
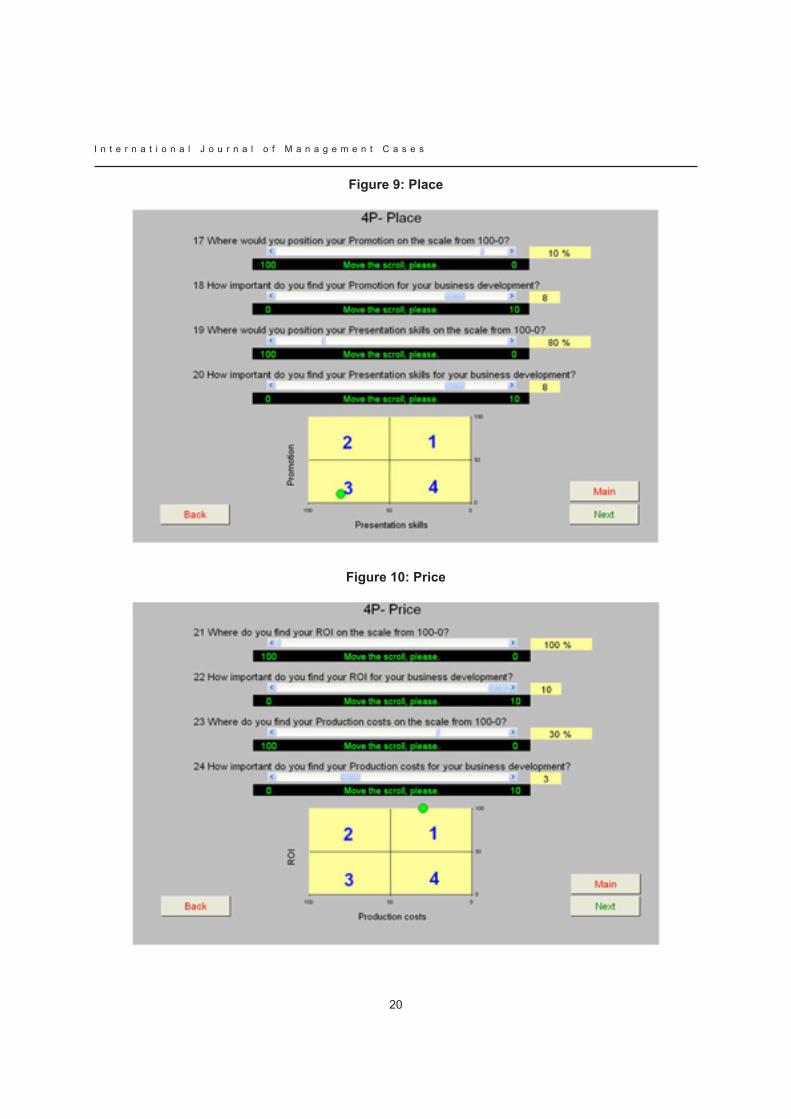
The Figure 9 represents the most influencing factors on Place. Lega’s place is influenced by Promotion (10%) and Presentation skills (80%), which positions it into the quadrant 3.
The Figure 10 represents the most influencing factors on Price. Lega’s price is influenced by ROI (100%) and Production costs (30%), which positions it into the quadrant 1.
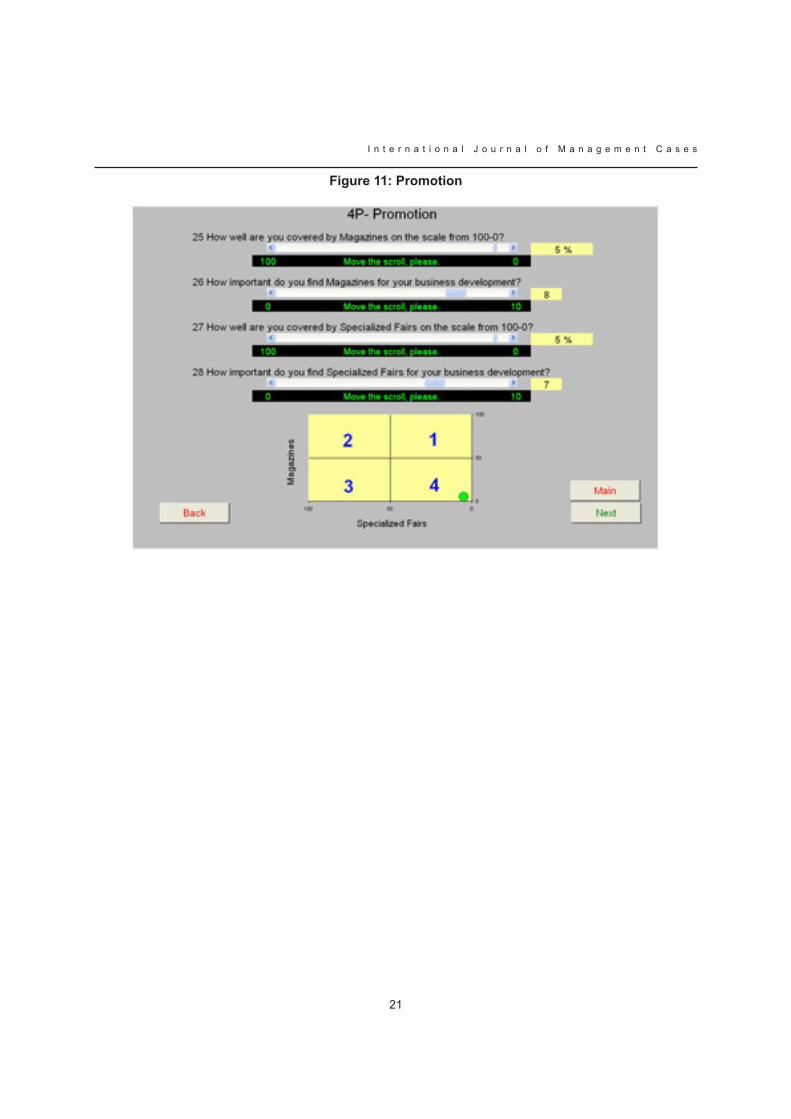
Figure 11 represents the most influencing factors on Promotion. Lega’s products are promoted in Magazines (5%) and Specialized Fairs (5%), which positions it into the quadrant 4.
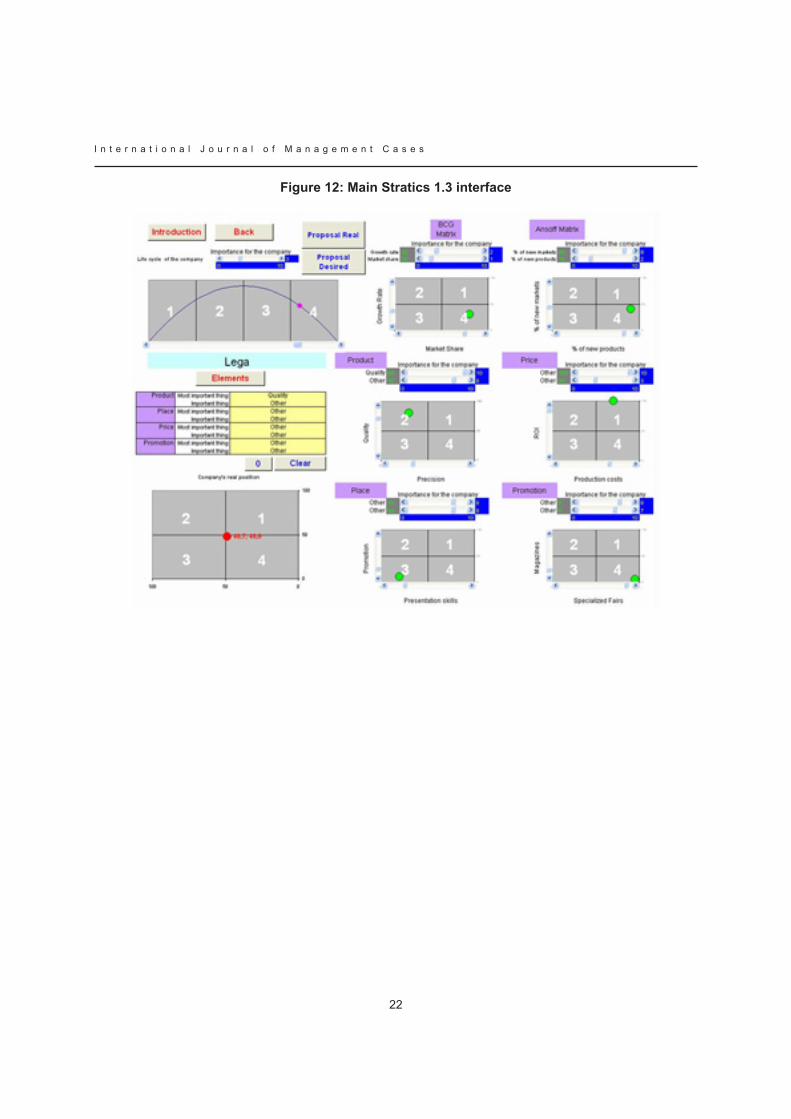
The Figure 12 represents the main Stratics 1.3 interface. According to the model, The real position of the company Lega is stuck in the middle and a little bit in quadrant 4 (48,7; 48,0).
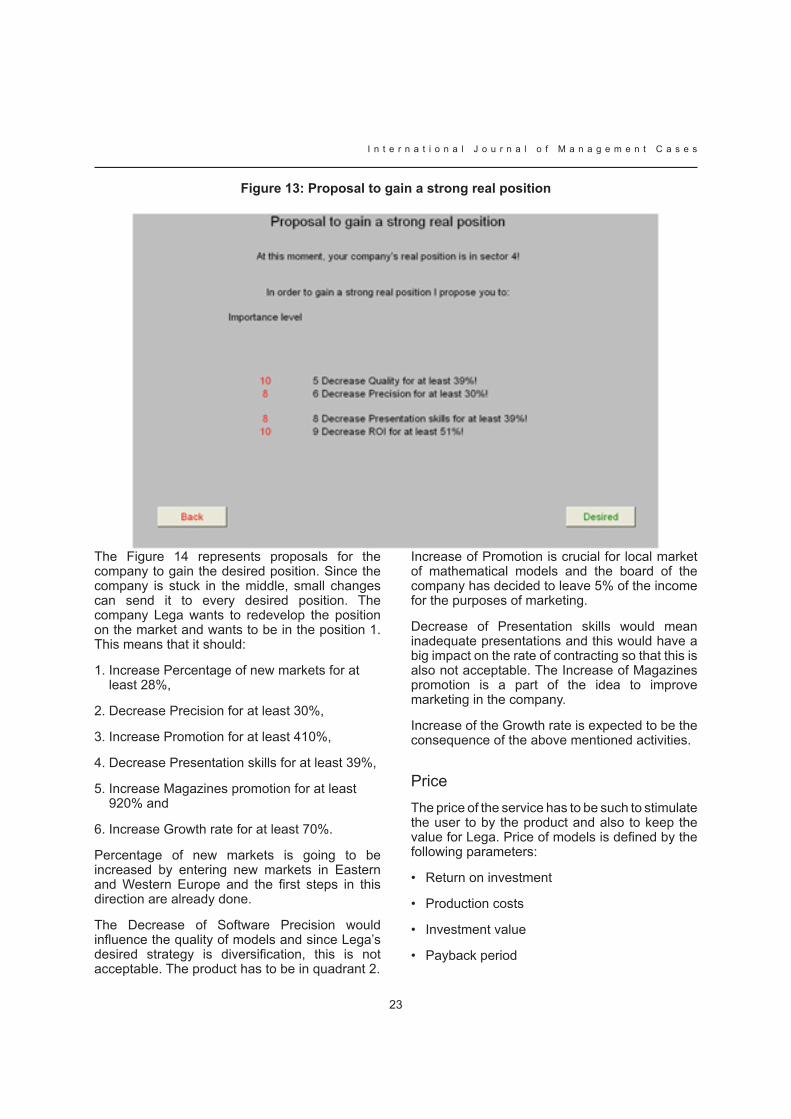
The Figure 13 represents proposals for the company to gain its strong real position. If the company wants to gain the strong real position, which is 4, it should first
Decrease Product Quality for at least 39% and
Decrease Product’s ROI for at least 51%, and then, it should
Decrease Product Precision for at least 30% and
Decrease Presentation skills for at least 30%.
By doing this, the company would decrease production costs of models, decrease production time and this would enable higher quantity of new models.
1.
2.
3.
4.
I n t e r n a t i o n a l J o u r n a l o f M a n a g e m e n t C a s e s
20
figure 9: Place
figure 10: Price
21
I n t e r n a t i o n a l J o u r n a l o f M a n a g e m e n t C a s e s
figure 11: Promotion
I n t e r n a t i o n a l J o u r n a l o f M a n a g e m e n t C a s e s
22
figure 12: Main Stratics 1.3 interface
23
I n t e r n a t i o n a l J o u r n a l o f M a n a g e m e n t C a s e s
figure 13: Proposal to gain a strong real position
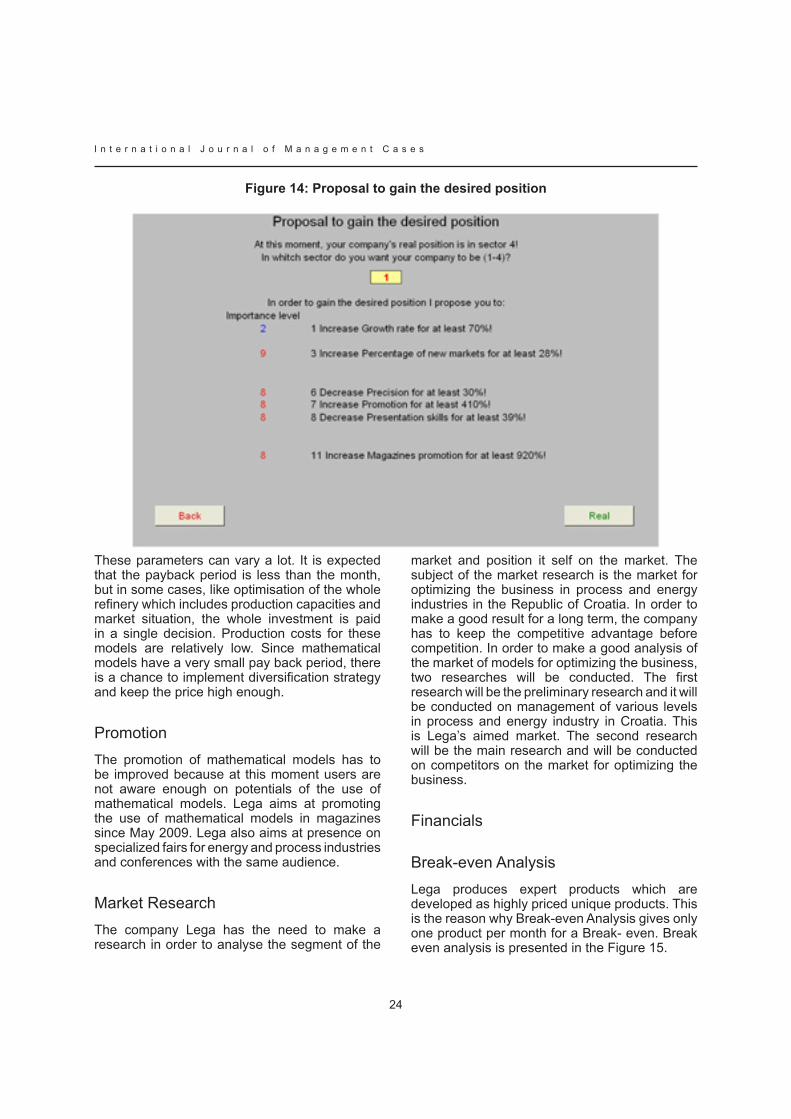
the Figure 14 represents proposals for the company to gain the desired position. Since the company is stuck in the middle, small changes can send it to every desired position. The company Lega wants to redevelop the position on the market and wants to be in the position 1. This means that it should:
Increase Percentage of new markets for at least 28%,
Decrease Precision for at least 30%,
increase Promotion for at least 410%,
Decrease Presentation skills for at least 39%,
Increase Magazines promotion for at least 920% and
Increase Growth rate for at least 70%.
Percentage of new markets is going to be increased by entering new markets in Eastern and Western Europe and the first steps in this direction are already done.
The Decrease of Software Precision would influence the quality of models and since Lega’s desired strategy is diversification, this is not acceptable. The product has to be in quadrant 2.
1.
2.
3.
4.
5.
6.
Increase of Promotion is crucial for local market of mathematical models and the board of the company has decided to leave 5% of the income for the purposes of marketing.
Decrease of Presentation skills would mean inadequate presentations and this would have a big impact on the rate of contracting so that this is also not acceptable. The Increase of Magazines promotion is a part of the idea to improve marketing in the company.
Increase of the Growth rate is expected to be the consequence of the above mentioned activities.
PriceThe price of the service has to be such to stimulate the user to by the product and also to keep the value for Lega. Price of models is defined by the following parameters:
Return on investment
Production costs
Investment value
Payback period
•
•
•
•
I n t e r n a t i o n a l J o u r n a l o f M a n a g e m e n t C a s e s
24
figure 14: Proposal to gain the desired position
These parameters can vary a lot. It is expected that the payback period is less than the month, but in some cases, like optimisation of the whole refinery which includes production capacities and market situation, the whole investment is paid in a single decision. Production costs for these models are relatively low. Since mathematical models have a very small pay back period, there is a chance to implement diversification strategy and keep the price high enough.
PromotionThe promotion of mathematical models has to be improved because at this moment users are not aware enough on potentials of the use of mathematical models. Lega aims at promoting the use of mathematical models in magazines since May 2009. Lega also aims at presence on specialized fairs for energy and process industries and conferences with the same audience.
Market ResearchThe company Lega has the need to make a research in order to analyse the segment of the
market and position it self on the market. The subject of the market research is the market for optimizing the business in process and energy industries in the Republic of Croatia. In order to make a good result for a long term, the company has to keep the competitive advantage before competition. In order to make a good analysis of the market of models for optimizing the business, two researches will be conducted. The first research will be the preliminary research and it will be conducted on management of various levels in process and energy industry in Croatia. This is Lega’s aimed market. The second research will be the main research and will be conducted on competitors on the market for optimizing the business.
Financials
Break-even AnalysisLega produces expert products which are developed as highly priced unique products. This is the reason why Break-even Analysis gives only one product per month for a Break- even. Break even analysis is presented in the Figure 15.

25
I n t e r n a t i o n a l J o u r n a l o f M a n a g e m e n t C a s e s
figure 15: Break-even Analysis
figure 16: Monthly Sales forecast
I n t e r n a t i o n a l J o u r n a l o f M a n a g e m e n t C a s e s
26
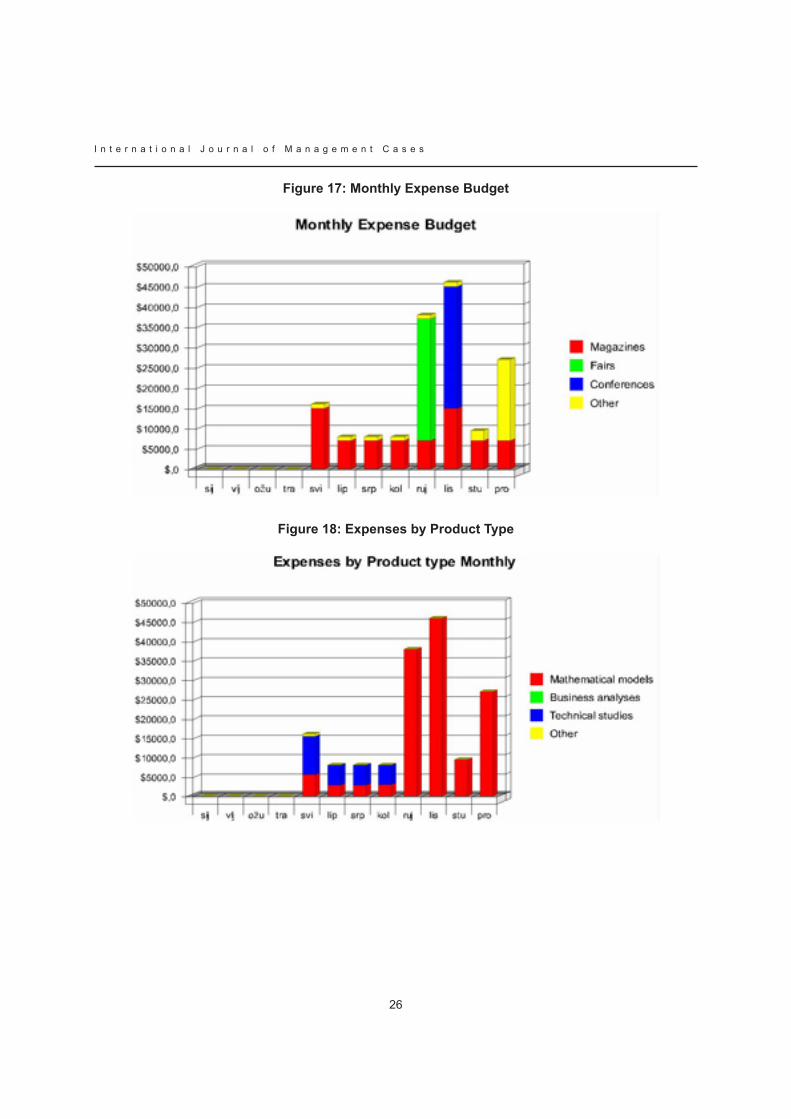
figure 17: Monthly Expense Budget
figure 18: Expenses by Product Type
27
I n t e r n a t i o n a l J o u r n a l o f M a n a g e m e n t C a s e s
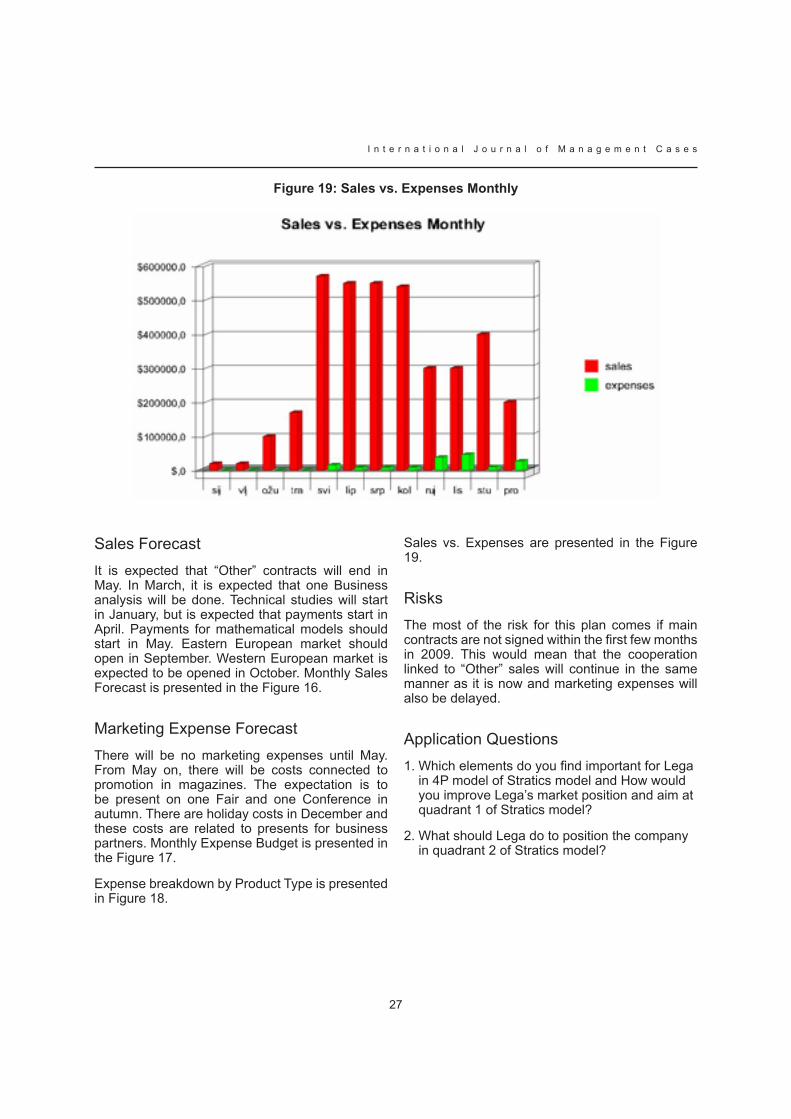
figure 19: Sales vs. Expenses Monthly
Sales ForecastIt is expected that “Other” contracts will end in May. In March, it is expected that one Business analysis will be done. Technical studies will start in January, but is expected that payments start in April. Payments for mathematical models should start in May. Eastern European market should open in September. Western European market is expected to be opened in October. Monthly Sales Forecast is presented in the Figure 16.
Marketing Expense ForecastThere will be no marketing expenses until May. From May on, there will be costs connected to promotion in magazines. The expectation is to be present on one Fair and one Conference in autumn. There are holiday costs in December and these costs are related to presents for business partners. Monthly Expense Budget is presented in the Figure 17.
Expense breakdown by Product Type is presented in Figure 18.
Sales vs. Expenses are presented in the Figure 19.
RisksThe most of the risk for this plan comes if main contracts are not signed within the first few months in 2009. This would mean that the cooperation linked to “Other” sales will continue in the same manner as it is now and marketing expenses will also be delayed.
Application QuestionsWhich elements do you find important for Lega in 4P model of Stratics model and How would you improve Lega’s market position and aim at quadrant 1 of Stratics model?
What should Lega do to position the company in quadrant 2 of Stratics model?
1.
2.
I n t e r n a t i o n a l J o u r n a l o f M a n a g e m e n t C a s e s
28
STRATICS MODEL BUILDING- RESEARCH APPLICATION
HRVOJE MEDARACLEEDS METROPOLITAN UNIVERSITy, UK
ABSTRACT
As Sun Tzu says: “Judge advantages when accepting advices, and then, in accordance with that, arrange your forces supplementing them with extraordinary tactics. Forces should be arranged strategically, based on that what gives the advantage.” This though directly points that strategy and tactics need to be developed in the same direction to gain success.
This is the application of the research on building the new model which will combine strategy and tactics in marketing. The model will have to satisfy three conditions. It will have to be applicable, simple and interactive. The research will consist of three parts. The first part will be the literature review aimed at making the historical overview on research subject and developing the first instance of the model. The second part of the research will be the main research in the form of interviews with managers responsible for the implementation of strategy and tactics in companies. The result of the main research will be the final version of the model which will be tested in the third part of the research, an experiment on the real company which is present on the real market. Results of the experiment will be evaluated through business results of the company before the implementation of the model and results after the implementation.
The Stratics model will follow the line of modelling presented by Vranešević, Vignali and Vrontis which includes the combination of various strategy and tactics models like Life Cycle of the Company, Boston Consulting Group Matrix, Ansoff Matrix and Marketing Mix. Resulting model will give the company’s management a chance to see whether company’s real position lays where management thinks it does. The other purpose of the model will be initial propositions on what should be done on tactical level in order to achieve company’s targeted strategy position.
Key words: Marketing, Strategy, Tactics, BCG, Life Cycle, Ansoff, Marketing Mix, 4P, PhD
IntroductionMatrix Marketing and the academic use of models in the strategic process has, in recent years, been accepted by practitioners. The frequent and recent changes in technology and the Internet allow greater access to both academic and tacticians in the commercial world. Vignali C. (2007) has developed the Stratics process and created a live model building process that adapts some of the academic models used by academics in the modern world.
As Sun Tzu says: “Judge advantages when accepting advices, and then, in accordance with that, arrange your forces supplementing them with extraordinary tactics. Forces should be arranged strategically, based on that what gives the advantage.” This though directly points that strategy and tactics need to be developed in the same direction to gain success. In other way, the risk of failure increases significantly.
The purpose of marketing is to make customers more interested in company’s products. Stralser (2004) describes marketing in the following way: “Often, people immediately equate marketing with advertising and see only the amount of money that advertising cost. However, by definition, marketing is actually the process by which we offer goods or services up for sale. Forward- thinking marketing strategies suggest that marketing is not a ‘cost’ or ‘expense’ but rather an investment, because much of the benefit of marketing is longer- term and may take years to fully provide it’s benefit.” Kennedy (1989) finds very important to answer the question: “Why should I, your prospective customer, choose you vs. any and every other alternative available to me?” This is the question that leads to identify the proper strategy for the company. Vranešević, Vignali and Vrontis (2004) combine life cycle of
29
I n t e r n a t i o n a l J o u r n a l o f M a n a g e m e n t C a s e s
the Company, Boston Consulting Group Matrix, Ansoff Matrix and Marketing Mix. This approach has given the main direction for this research. According to Buble and group of authors (2005), marketing strategy represents the implementation of the whole strategy of the company and main duties of the marketing strategy are: analysis of market opportunities, the choice of the aimed market, marketing mix development and marketing management.
The main focus of marketing strategy can be the development of marketing mix and marketing management. According to Thompson, Strickland and Gamble (2005) “Strategy of a company is a plan of the game which management uses for business increase, gaining market position, attracting and pleasing customers, successful competing, leading their operation and gaining desired aims.” On the other hand, Robbins and Coulter (2005) sate that strategic management is “That set of managerial decisions and action that determines a long-run performance of an organisation.” This definition can also be applied to the managing of marketing strategy. In the introduction sentence of the chapter “What is the Marketing Strategy”, Renko (2005) explains that “combining of terms Marketing and Strategy emphasises that the strategy has to be marketing oriented, i.e. leaded by the market and surroundings where the company operates.” Berry and Wilson (2000) have elaborated the way the strategy and tactics should work in combination: “The tactical decisions you make should directly complement your marketing strategy in a manner that is practical and can be implemented.” This means that tactics and strategy have to be consistent. Johnston and Bate (2003) state the following: “It is interesting to note how many companies in recent years have adopted ‘‘innovation’’ as a core value or as part of their mission statements. If we as a society have moved from the Information Age to the Knowledge Age, then this relatively new emphasis on innovation is quite logical. When information is ubiquitous and is no longer a source of competitive advantage, it is the innovative use of that information (via knowledge) that differentiates people, companies, and nations. Innovation may become the basis of all competition in the future. Innovation is the new competitive arena where present-day gladiators, equipped with similar information and access to similar resources, try to outsmart one another to victory.” This is the reason why the development
of new models has potential to make companies more competitive on the market.
Research purposeThe purpose of this research is development of a simple and interactive Marketing Model which will combine Marketing Strategy with Tactics in order to gain a straight forward business strategy which is easy to apply. The researcher has the intention to conduct the main research in Croatian companies and develop the model according to findings from this research. In this way, the model will be fully applicable to Croatian market, but on the other hand, the model will be based on the main market rules, which are the same worldwide. This is the reason why is it expected that the model could also be applicable worldwide. The model will evolve during the research period according to new findings during the research process.
Aims and objectivesThe research will be conducted through three stages.
The aim of the first research is to find out which Marketing Strategy and Tactics models have already been developed and what are their advantages and disadvantages.
The aim of the second research will be to identify the variables which companies find the most important for combining their strategy with tactics.
The aim of the third research is to test the applicability of the developed model on a specific company.
Research plan and methodology
Research structureThe research will consist of three stages. The first stage will be the literature review on Marketing Strategy and Tactics. The second stage will involve interviews with Croatian managers responsible for strategy and tactics. These interviews will be aimed to identify variables which Croatian companies find the most important to implement tactics in line with the strategy of their business. The third
1.
2.
3.
I n t e r n a t i o n a l J o u r n a l o f M a n a g e m e n t C a s e s
30
stage will be an experiment on the applicability of developed model on a company.
Literature reviewThe literature review aims to identify existing marketing models for strategy and tactics. It will help in identifying gaps in modelling, which will be the starting point of development of the Stratics model. Vignali (1995) used The Nicosia Model, The Howard- Sheth Model, The Engel, Kollat and Blackwell Model, The Du Pont Model and The Andreasen Model as the basis for developing The Nicosia Model Redefined in a Benetton Franchise. a few years later, Vranešević, Vignali and Vrontis (2004)[28] developed a model which combines life cycle of the company, Boston Consulting Group Matrix, Ansoff Matrix and Marketing Mix. This research will be based on this line of the evolution of models. Strategic models such as Boston Consulting Group Matrix and Ansoff Matrix are able to give the manager the main direction to improve the business, but do not identify the means of gaining the aims from Boston Consulting Group Matrix and Ansoff
Matrix. Marketing Mix is used to gain these aims.
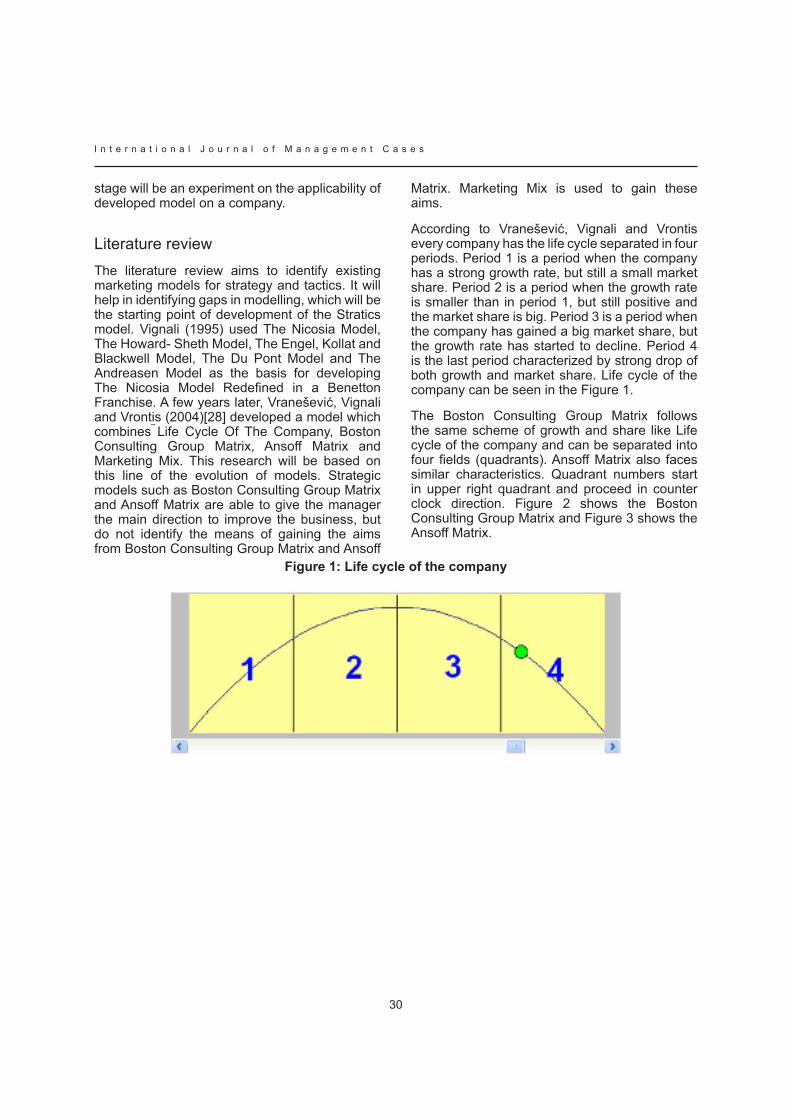
according to Vranešević, Vignali and Vrontis every company has the life cycle separated in four periods. Period 1 is a period when the company has a strong growth rate, but still a small market share. Period 2 is a period when the growth rate is smaller than in period 1, but still positive and the market share is big. Period 3 is a period when the company has gained a big market share, but the growth rate has started to decline. Period 4 is the last period characterized by strong drop of both growth and market share. Life cycle of the company can be seen in the Figure 1.
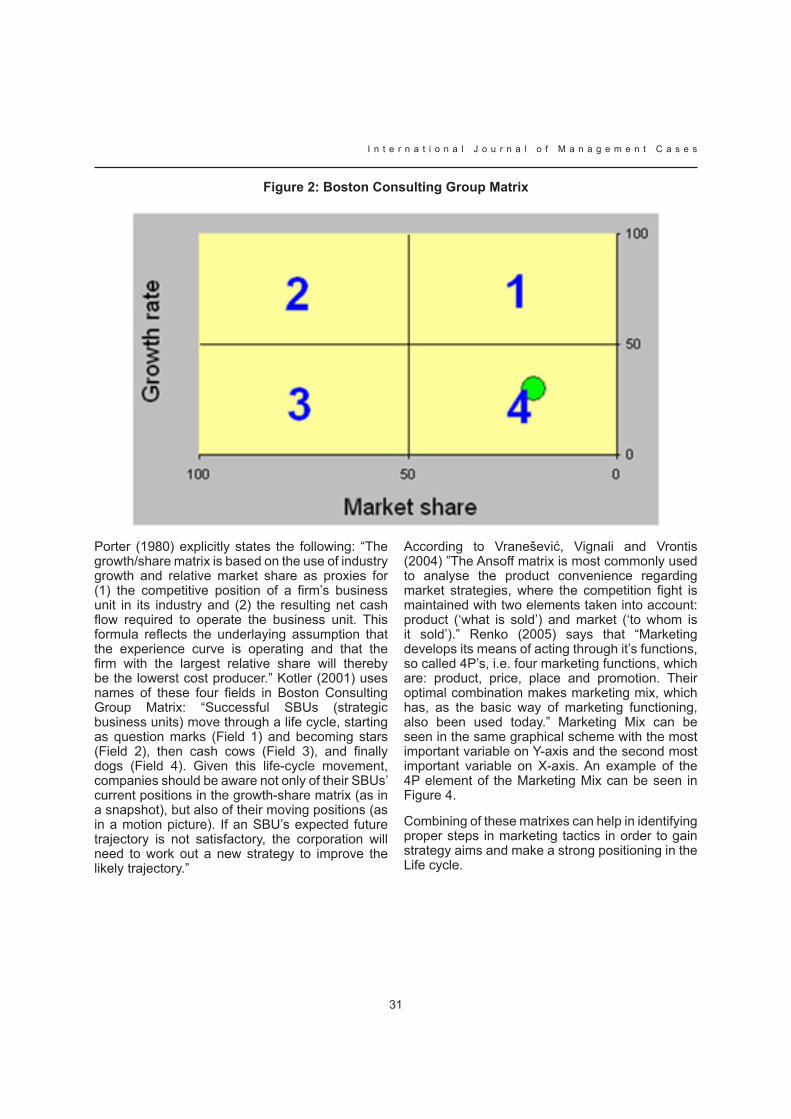
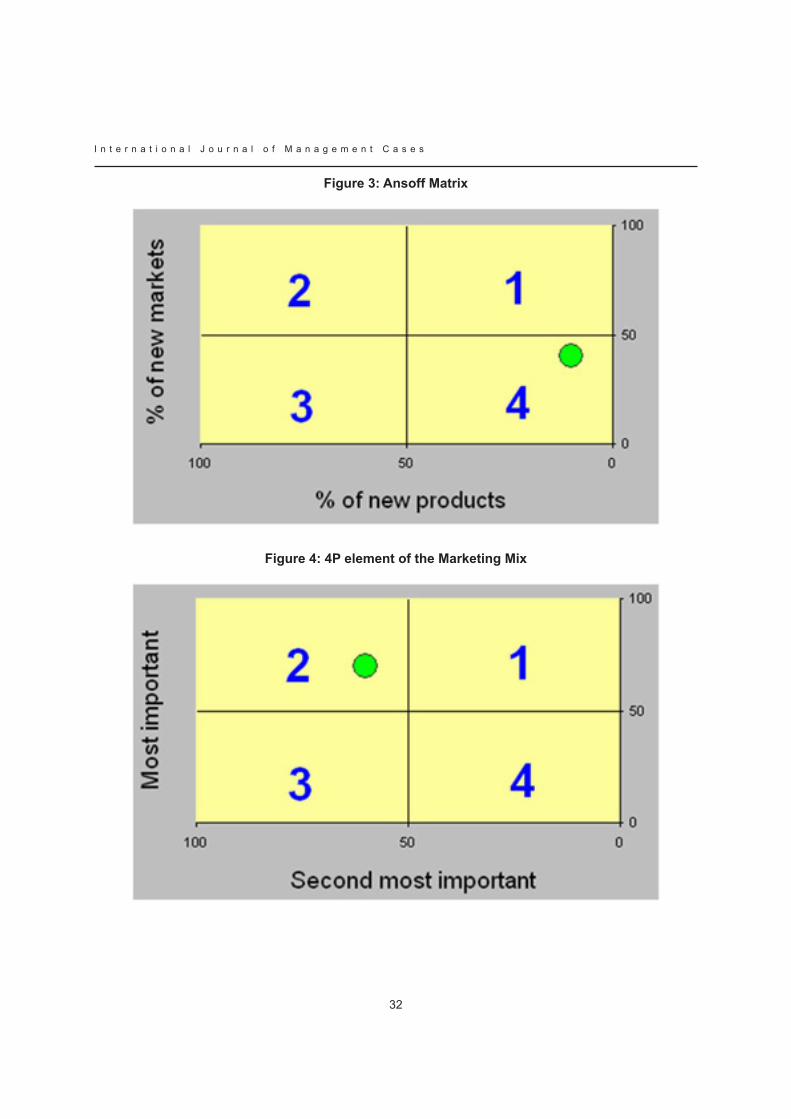
The Boston Consulting Group Matrix follows the same scheme of growth and share like Life cycle of the company and can be separated into four fields (quadrants). Ansoff Matrix also faces similar characteristics. Quadrant numbers start in upper right quadrant and proceed in counter clock direction. Figure 2 shows the Boston Consulting Group Matrix and Figure 3 shows the Ansoff Matrix.
figure 1: Life cycle of the company
31
I n t e r n a t i o n a l J o u r n a l o f M a n a g e m e n t C a s e s
figure 2: Boston Consulting Group Matrix
Porter (1980) explicitly states the following: “the growth/share matrix is based on the use of industry growth and relative market share as proxies for (1) the competitive position of a firm’s business unit in its industry and (2) the resulting net cash flow required to operate the business unit. This formula reflects the underlaying assumption that the experience curve is operating and that the firm with the largest relative share will thereby be the lowerst cost producer.” Kotler (2001) uses names of these four fields in Boston Consulting Group Matrix: “Successful SBUs (strategic business units) move through a life cycle, starting as question marks (Field 1) and becoming stars (Field 2), then cash cows (Field 3), and finally dogs (Field 4). given this life-cycle movement, companies should be aware not only of their SBUs’ current positions in the growth-share matrix (as in a snapshot), but also of their moving positions (as in a motion picture). If an SBU’s expected future trajectory is not satisfactory, the corporation will need to work out a new strategy to improve the likely trajectory.”
according to Vranešević, Vignali and Vrontis (2004) ”the ansoff matrix is most commonly used to analyse the product convenience regarding market strategies, where the competition fight is maintained with two elements taken into account: product (‘what is sold’) and market (‘to whom is it sold’).” Renko (2005) says that “Marketing develops its means of acting through it’s functions, so called 4P’s, i.e. four marketing functions, which are: product, price, place and promotion. Their optimal combination makes marketing mix, which has, as the basic way of marketing functioning, also been used today.” Marketing Mix can be seen in the same graphical scheme with the most important variable on y-axis and the second most important variable on X-axis. An example of the 4P element of the Marketing Mix can be seen in Figure 4.
Combining of these matrixes can help in identifying proper steps in marketing tactics in order to gain strategy aims and make a strong positioning in the Life cycle.
I n t e r n a t i o n a l J o u r n a l o f M a n a g e m e n t C a s e s
32
figure 3: Ansoff Matrix
figure 4: 4P element of the Marketing Mix
33
I n t e r n a t i o n a l J o u r n a l o f M a n a g e m e n t C a s e s
figure 5: The General Electric Model
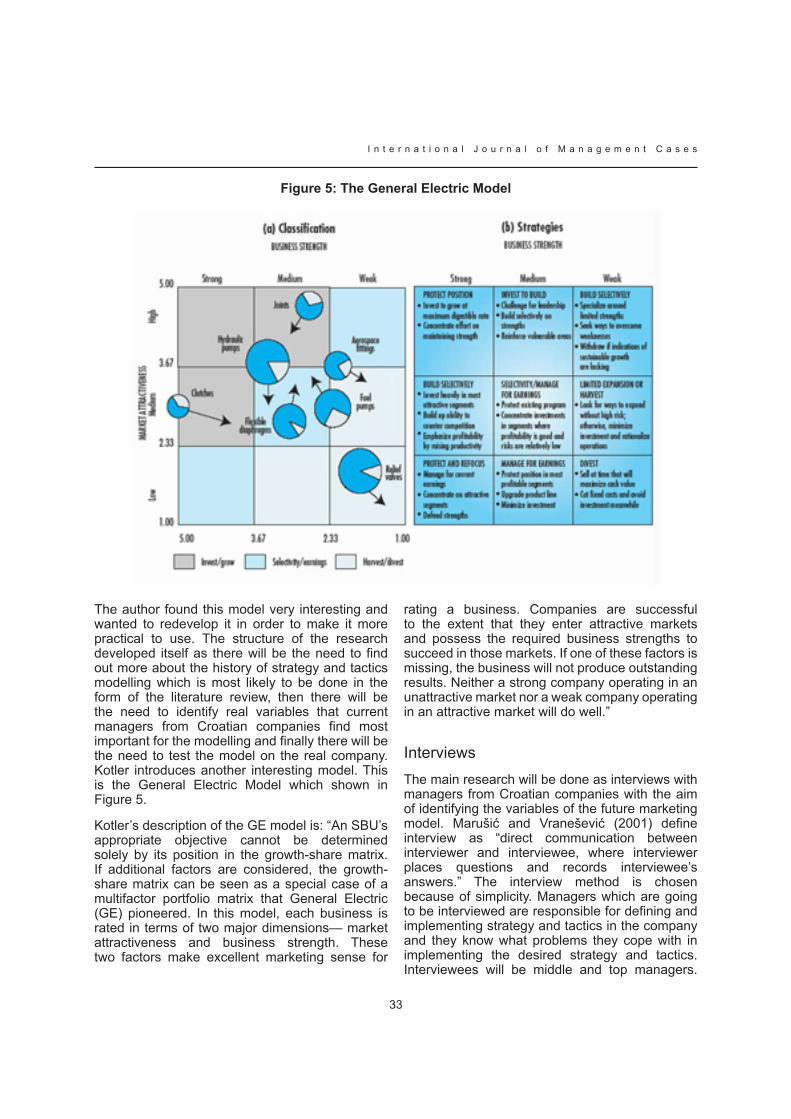
The author found this model very interesting and wanted to redevelop it in order to make it more practical to use. The structure of the research developed itself as there will be the need to find out more about the history of strategy and tactics modelling which is most likely to be done in the form of the literature review, then there will be the need to identify real variables that current managers from Croatian companies find most important for the modelling and finally there will be the need to test the model on the real company. Kotler introduces another interesting model. This is the General Electric Model which shown in Figure 5.
Kotler’s description of the GE model is: “An SBU’s appropriate objective cannot be determined solely by its position in the growth-share matrix. If additional factors are considered, the growth-share matrix can be seen as a special case of a multifactor portfolio matrix that General Electric (GE) pioneered. In this model, each business is rated in terms of two major dimensions— market attractiveness and business strength. These two factors make excellent marketing sense for
rating a business. Companies are successful to the extent that they enter attractive markets and possess the required business strengths to succeed in those markets. If one of these factors is missing, the business will not produce outstanding results. Neither a strong company operating in an unattractive market nor a weak company operating in an attractive market will do well.”
InterviewsThe main research will be done as interviews with managers from Croatian companies with the aim of identifying the variables of the future marketing model. Marušić and Vranešević (2001) define interview as “direct communication between interviewer and interviewee, where interviewer places questions and records interviewee’s answers.” The interview method is chosen because of simplicity. Managers which are going to be interviewed are responsible for defining and implementing strategy and tactics in the company and they know what problems they cope with in implementing the desired strategy and tactics. Interviewees will be middle and top managers.
I n t e r n a t i o n a l J o u r n a l o f M a n a g e m e n t C a s e s
34
The assumption is that managers do not have patience for surveys, but could be interested in interviews because of the chance of expressing their ideas in conversation. The aimed sample will be 30 interviewees.
The result of the main research will be a new marketing model which has to satisfy the following conditions:
Applicability- it should be applicable on various types of companies because if it is not applicable, then the research has missed the purpose
Simplicity- if the model is simple, more users will be interested in using it
Interactiveness- in the modern time, if something is not interactive, it will probably not be widely used
ExperimentThe third research will be an Experiment on a company. The before developed model will be implemented in a company. The experiment company is a small sized Croatian company in which the researcher has inside information and possibility to influence the decision making process and implementation of the experiment. In this way the researcher will have control of the experiment process. The management of this company is interested in participating in this research in order to improve position on the market. The implementation of the model will start as soon as it will be developed as a consequence of the main research.
The examination of the experiment is going to be done through business result of the company before (control sample) and after (test sample) the implementation of the model. The monitoring will start as soon as possible. There will also be an opportunity to take internal and external influences on business into account and easier identify the influence of the use of the model on business result. This company is a Ltd. type of the company which means that according to žager, tušek, Vašiček and žager (2007) it has the obligation to present only The Balance Sheet and The Income Statement. The evaluation of the experiment will be done by reviewing data from these documents according to the methodology presented by žager
1.
2.
3.
and žager (1999). in order to identify the influence of the model, indicators for the period before the implementation of the model will be compared to indicators for the period after the implementation of the model and indicators for the period after the implementation of the model excluding contracts signed model-use result. As the result of this methodology, the influence of the model will be clearly visible.
Some parts of the methodology that is going to be used in the experiment are going to be as follows:
Defining the problem (The problem is actually the main research question for the experiment: “Does the developed marketing model improve the business of the company?”),
Defining hypotheses (Hypothesis for the experiment is H3: “The developed marketing model improves the business of the company?”),
Defining the independent variable (Independent variable is the use of the model, and the value of the variable is simply “yes” or “no”.),
Defining the dependent variable (Dependent variables are Balance, Indebtness, Liquidity, Financial stability, Sales income, Total income, Profit, Income/ Costs Ratio, Turnover, Payback Period, Return On Investment, Return On Equity, Return On Sales, Number of new contracts, Amount of new contracts and Average contract size),
experiment type choice (according to Marušić and Vranešević (2001)[17], the experiment will be the type E Pre-Post),
Experiment control (The researcher has the ability to ensure that there will be no other influence on usual business of the company, except the influence of the use of the model.),
Experiment conducting procedure (The company will do their ordinary business for a period until the model is developed, and the researcher will evaluate dependent variables in that time. When the model is developed, it will be implemented into company’s strategy and tactics and this will be the start of the evaluation of dependent variables after the implementation.),
1.
2.
3.
4.
5.
6.
7.
35
I n t e r n a t i o n a l J o u r n a l o f M a n a g e m e n t C a s e s
Statistical analysis and results interpretation (There will be the comparation of the results before and after the implementation and also “business as usual”, which means that the influence of the implementation will be excluded.).
Contribution to knowledgeIt is the intention of the author to examine all the present physical evidence in the Strategic Marketing Process field and through Secondary Research establish the relevance and connection of existing models. Through interviews, the author will examine the most influencing variables on marketing strategy and tactics and use them to develop the new interactive model. The use of marketing models improves position of companies on the market. Furthermore, a new model may be more applicable to some companies. This research can be used by other researchers either in a way that they use results of three researches which are going to be conducted or in a way that they use methods that are going to be used in this research. Practical validity of this research is that a new simple and interactive marketing model will be available for companies who will find it interesting for usage. Since the model will be based on findings from interviews with Croatian managers and most of all applicable to Croatian market, but in the same time it is expected that it could be applicable to other markets too, this research has the potential to be the starting point for the research which can prove or disprove the applicability of the model on markets worldwide.
ReferencesBerry T., Wilson D. (2000) On Target: The Book of Marketing Plans, Palo Alto Software, Inc, Eugene, USA
Buble, M., cingula, M., Dujanić, M., Dulčić, ž., gonan Božac, M., galetić, l.,
Johnston, R. E. Jr., Bate, J. D. (2003) The Power of Strategy Innovation- A New Way of Linking Creativity and Strategic Planning to Discover
8. Great Business Opportunities, AMACOM, New york, USA
kennedy, D. S. (1989) 63 ‘killer’ Marketing Strategies- How To Insure That your Product/ Service/ Offer Is The Best It Can Be, Presented The Best Way It Can Be, Kimble and Kennedy Publishing, Austin, USA
Kotler, P. (2001) Marketing Management, Millenium Edition, Pearson Custom Publishing, Boston, USA
Marušić, M., Vranešević, t. (2001) istraživanje tržišta, adeco, Zagreb, croatia
Porter, M. e. (1980): competitive Strategy, Free Press, New york, USA
Renko, N. (2005) Strategije marketinga, Naklada Ljevak, Zagreb, Croatia
Robbins, P., Coulter, M. (2005) Management, Pearson, Prentice Hall, New Jersey, USA
Stralser, S. (2004) MBa in a Day- What You Would Learn at Top-Tier Business Schools (If you Only Had the Time!), John Wiley & Sons, Inc., New Jersey, USA
Thompson, A. A. Jr., Strickland, A. J. III, Gamble, J.E. (2005) Crafting and Executing Strategy: The Quest for the Competitive Advantage: Concepts and cases, 14/e, Mcgraw-Hill/irvin, uSa
Vignali, C. (1995) Branding and the Female Consumer Examined in a Benetton Franchise, MPhil dissertation, Manchester Metropolitan University, Manchester, UK
Vranešević, t., Vignali, c., Vrontis, D. (2004) upravljanje strateškim marketingom, accent, Zagreb, Croatia
žager, k. and žager, l. (1999) analiza financijskih izvještaja, Masmedia, Zagreb, croatia
žager, k., tušek, B., Vašiček, V. and žager, l. (2007) osnove računovodstva, Hrvatska zajednica računovođa i financijskih djelatnika, Zagreb, Croatia
I n t e r n a t i o n a l J o u r n a l o f M a n a g e m e n t C a s e s
36
ESTABLISHMENT OF BULGARIAN RETAILER’S MARKETING PROFILE
SEPTEMVRINA KOSTOVAuNWe – SoFia, BulgaRia
Abstract
The purpose of the paper is to establish a framework for analyzing competitor strategies for development operating marketing profile of the company to analyze the marketing strategies and tactics employed by competitors. The research is made with expert assessment.
Use judgment in any effort to categorize of organizations into finite categories. Many organizations tend to merge one or more broad generic strategies in order to either maintain their presence in the market place or increase their share of market in cost-efficient manner. The organization can choose one from the three Porter’s strategies: create a low-cost advantage, focus on segments of opportunity or differentiate through market and product development.
In the research chain stores in Bulgaria were assessed. Their marketing profil was established. The investigated companies are METRO and BILLA. METRO opened its first Cash & carry stores in 1999 in Sofia and Plovdiv. One year later BILLA entered the Bulgarian market.
The research is made with expert assessment. The valuations are complex and they are average of the individual appraisals.
The results show, that the Bulgarian chain “Fantastiko” has the strategy of “follow the leader”. The competitors METRO, BILLA and later HIT are very different. The SWOT analysis demonstrated their strong and weak sides. For example METRO “S” are: prices, big quantities, industrial wares. BILLA “S” are: advertising, promotions, high-quality service. HIT “S” are: the variety of products, premiums, branding and demonstrations.
The conclusion is that the strategy of Fantastiko is to pay attention to high performance work force, customer orientation. There are two parts of the program: (1) customer and market knowledge
and (2) customer satisfaction and relationship enhancement.
Key words: marketing profile, marketing strategy, competition, customer orientation
IntroductionMany organizations tend to merge one or more broad generic strategies in order to either maintain their presence in the market place or increase their share of market in cost-efficient manner. The organization can choose one from the three Porter’s strategies: create a low-cost advantage, focus on segments of opportunity or differentiate through market and product development. Nowadays there some others strategies connected with market entry, market orientation and maintaining used from the companies in different market stages.
1. Where is Bulgarian Retailing?The large number of retailers might suggest that retailing is a field of small business. The market research in Bulgaria has shown that about 55 percent of all retailers had annual sales of less than 60 000 leva . only about 20.4% of the retail stores in Bulgaria are superstores (supermarkets or hypermarkets). They sell more than 1 mill leva annually. They are big international and some national store chains. The kind of those chains is different: corporate, joint ventures, cooperative, voluntary or franchising. One way for a retailer to achieve economies of scale is to develop a kind of chain store. It is very important to analyze this format and to become a marketing profile of the company to compete successfully. The speed of the changes of different formats is also different (Figure 1).
37
I n t e r n a t i o n a l J o u r n a l o f M a n a g e m e n t C a s e s
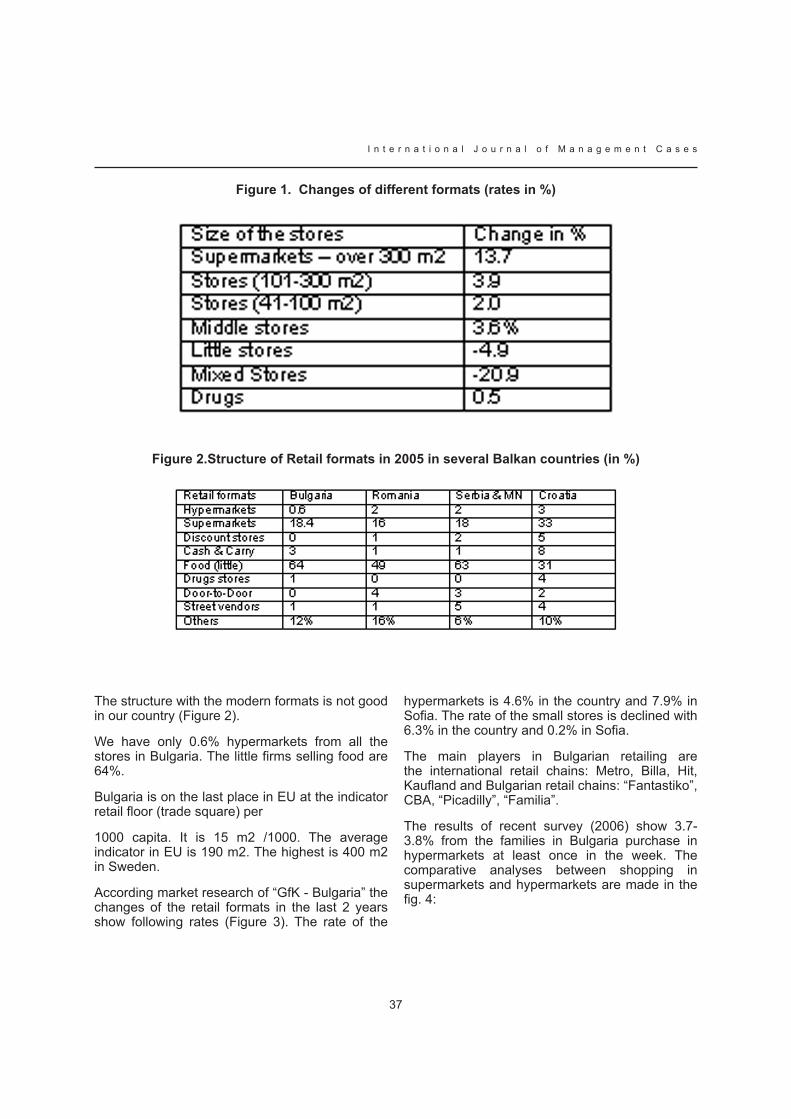
figure 1. Changes of different formats (rates in %)
figure 2.Structure of Retail formats in 2005 in several Balkan countries (in %)
The structure with the modern formats is not good in our country (Figure 2).
We have only 0.6% hypermarkets from all the stores in Bulgaria. The little firms selling food are 64%.
Bulgaria is on the last place in EU at the indicator retail floor (trade square) per
1000 capita. It is 15 m2 /1000. The average indicator in eu is 190 m2. the highest is 400 m2 in Sweden.
According market research of “GfK - Bulgaria” the changes of the retail formats in the last 2 years show following rates (Figure 3). The rate of the
hypermarkets is 4.6% in the country and 7.9% in Sofia. The rate of the small stores is declined with 6.3% in the country and 0.2% in Sofia.
The main players in Bulgarian retailing are the international retail chains: Metro, Billa, Hit, Kaufland and Bulgarian retail chains: “Fantastiko”, CBA, “Picadilly”, “Familia”.
The results of recent survey (2006) show 3.7-3.8% from the families in Bulgaria purchase in hypermarkets at least once in the week. The comparative analyses between shopping in supermarkets and hypermarkets are made in the fig. 4:
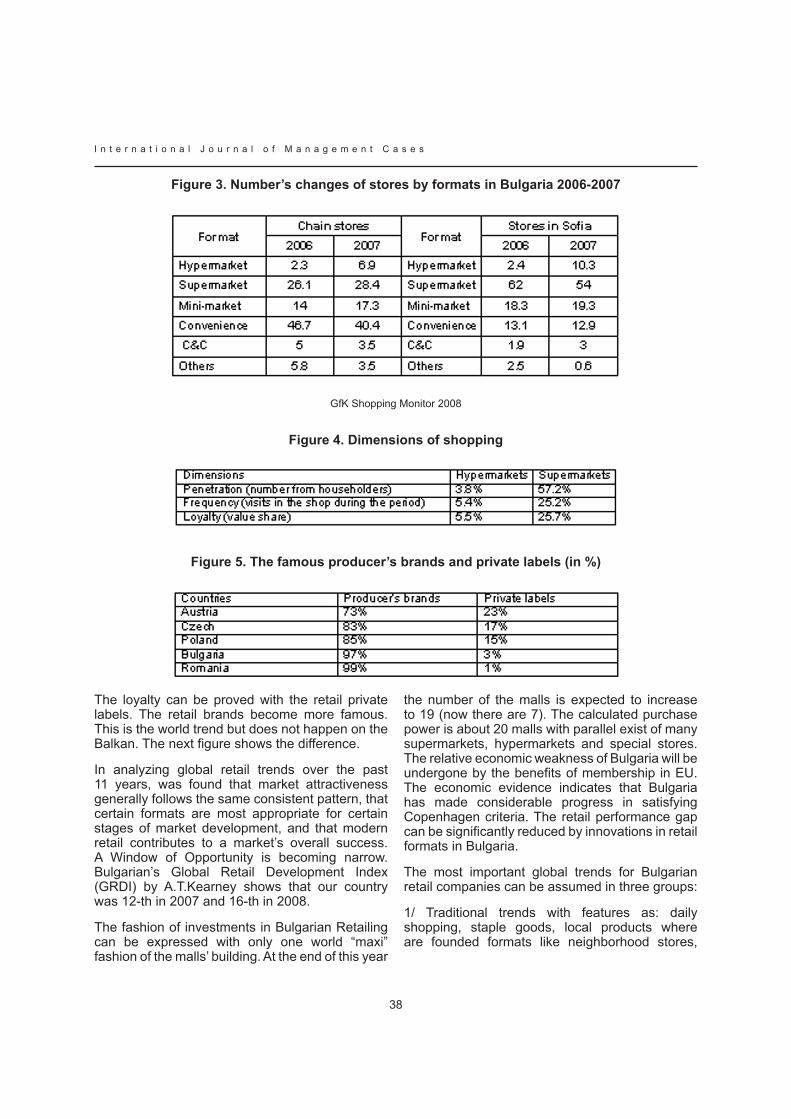
I n t e r n a t i o n a l J o u r n a l o f M a n a g e m e n t C a s e s
38
figure 3. Number’s changes of stores by formats in Bulgaria 2006-2007
gfk Shopping Monitor 2008
figure 4. Dimensions of shopping
figure 5. The famous producer’s brands and private labels (in %)
The loyalty can be proved with the retail private labels. The retail brands become more famous. This is the world trend but does not happen on the Balkan. The next figure shows the difference.
In analyzing global retail trends over the past 11 years, was found that market attractiveness generally follows the same consistent pattern, that certain formats are most appropriate for certain stages of market development, and that modern retail contributes to a market’s overall success. A Window of Opportunity is becoming narrow. Bulgarian’s Global Retail Development Index (GRDI) by A.T.Kearney shows that our country was 12-th in 2007 and 16-th in 2008.
The fashion of investments in Bulgarian Retailing can be expressed with only one world “maxi” fashion of the malls’ building. At the end of this year
the number of the malls is expected to increase to 19 (now there are 7). The calculated purchase power is about 20 malls with parallel exist of many supermarkets, hypermarkets and special stores. The relative economic weakness of Bulgaria will be undergone by the benefits of membership in EU. The economic evidence indicates that Bulgaria has made considerable progress in satisfying Copenhagen criteria. The retail performance gap can be significantly reduced by innovations in retail formats in Bulgaria.
The most important global trends for Bulgarian retail companies can be assumed in three groups:
1/ Traditional trends with features as: daily shopping, staple goods, local products where are founded formats like neighborhood stores,
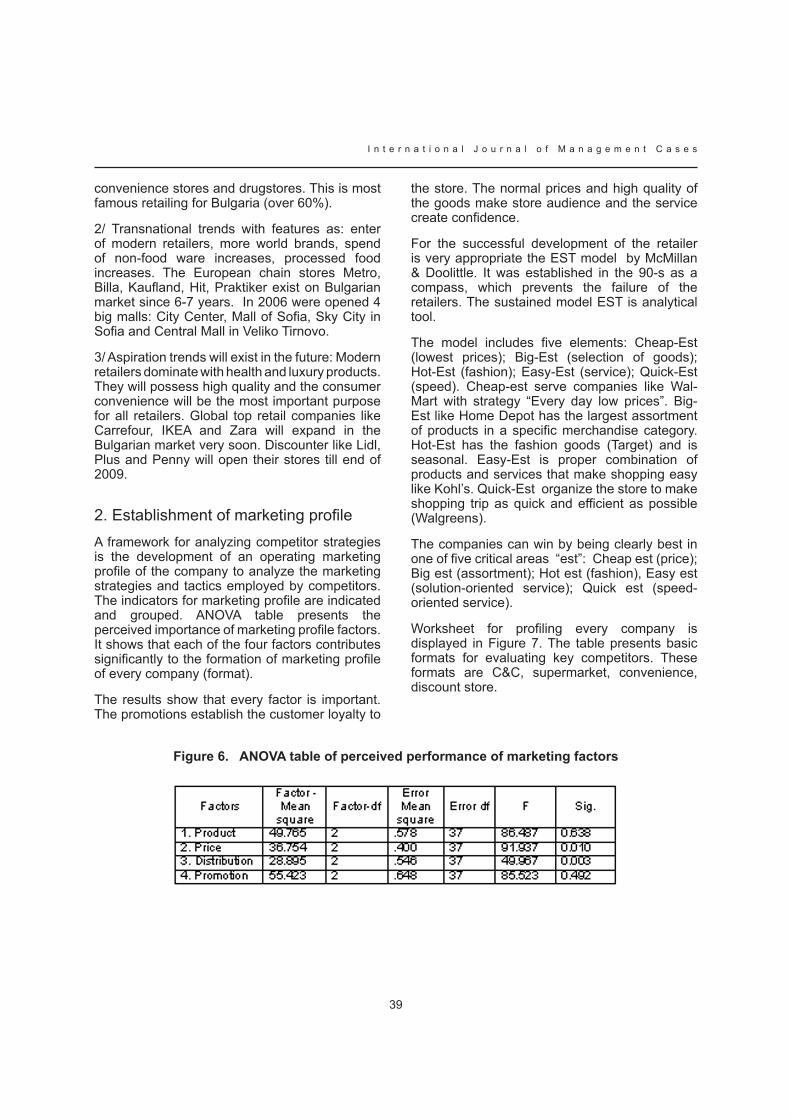
39
I n t e r n a t i o n a l J o u r n a l o f M a n a g e m e n t C a s e s
convenience stores and drugstores. This is most famous retailing for Bulgaria (over 60%).
2/ Transnational trends with features as: enter of modern retailers, more world brands, spend of non-food ware increases, processed food increases. The European chain stores Metro, Billa, Kaufland, Hit, Praktiker exist on Bulgarian market since 6-7 years. in 2006 were opened 4 big malls: City Center, Mall of Sofia, Sky City in Sofia and Central Mall in Veliko Tirnovo.
3/ Aspiration trends will exist in the future: Modern retailers dominate with health and luxury products. They will possess high quality and the consumer convenience will be the most important purpose for all retailers. Global top retail companies like Carrefour, IKEA and Zara will expand in the Bulgarian market very soon. Discounter like Lidl, Plus and Penny will open their stores till end of 2009.
2. establishment of marketing profile A framework for analyzing competitor strategies is the development of an operating marketing profile of the company to analyze the marketing strategies and tactics employed by competitors. The indicators for marketing profile are indicated and grouped. ANOVA table presents the perceived importance of marketing profile factors. It shows that each of the four factors contributes significantly to the formation of marketing profile of every company (format).
The results show that every factor is important. The promotions establish the customer loyalty to
the store. The normal prices and high quality of the goods make store audience and the service create confidence.
For the successful development of the retailer is very appropriate the EST model by McMillan & Doolittle. It was established in the 90-s as a compass, which prevents the failure of the retailers. The sustained model EST is analytical tool.
The model includes five elements: Cheap-Est (lowest prices); Big-Est (selection of goods); Hot-Est (fashion); Easy-Est (service); Quick-Est (speed). Cheap-est serve companies like Wal-Mart with strategy “Every day low prices”. Big-Est like Home Depot has the largest assortment of products in a specific merchandise category. Hot-Est has the fashion goods (Target) and is seasonal. Easy-Est is proper combination of products and services that make shopping easy like Kohl’s. Quick-Est organize the store to make shopping trip as quick and efficient as possible (Walgreens).
The companies can win by being clearly best in one of five critical areas “est”: Cheap est (price); Big est (assortment); Hot est (fashion), Easy est (solution-oriented service); Quick est (speed-oriented service).
Worksheet for profiling every company is displayed in Figure 7. The table presents basic formats for evaluating key competitors. These formats are C&C, supermarket, convenience, discount store.
figure 6. ANOVA table of perceived performance of marketing factors
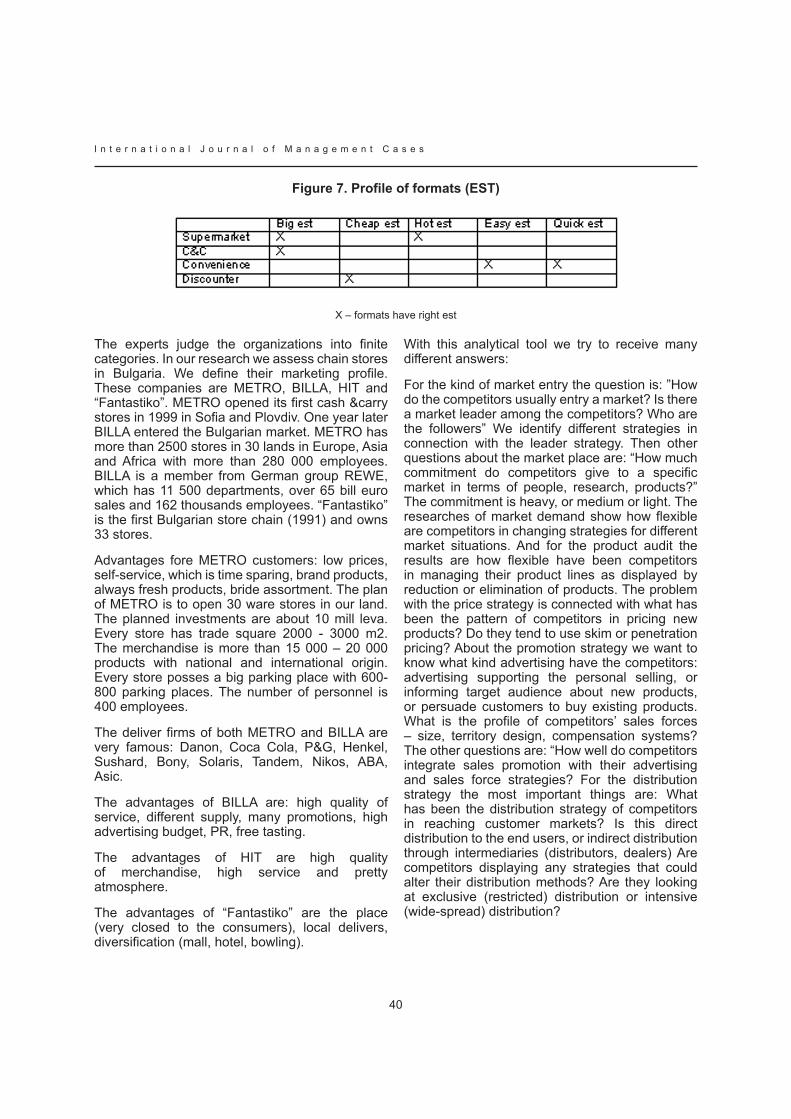
I n t e r n a t i o n a l J o u r n a l o f M a n a g e m e n t C a s e s
40
figure 7. Profile of formats (EST)
X – formats have right est
The experts judge the organizations into finite categories. In our research we assess chain stores in Bulgaria. We define their marketing profile. These companies are METRO, BILLA, HIT and “Fantastiko”. METRO opened its first cash &carry stores in 1999 in Sofia and Plovdiv. One year later BILLA entered the Bulgarian market. METRO has more than 2500 stores in 30 lands in Europe, Asia and africa with more than 280 000 employees. BILLA is a member from German group REWE, which has 11 500 departments, over 65 bill euro sales and 162 thousands employees. “Fantastiko” is the first Bulgarian store chain (1991) and owns 33 stores.
Advantages fore METRO customers: low prices, self-service, which is time sparing, brand products, always fresh products, bride assortment. The plan of METRO is to open 30 ware stores in our land. The planned investments are about 10 mill leva. Every store has trade square 2000 - 3000 m2. the merchandise is more than 15 000 – 20 000 products with national and international origin. Every store posses a big parking place with 600-800 parking places. the number of personnel is 400 employees.
The deliver firms of both METRO and BILLA are very famous: Danon, Coca Cola, P&G, Henkel, Sushard, Bony, Solaris, Tandem, Nikos, ABA, Asic.
The advantages of BILLA are: high quality of service, different supply, many promotions, high advertising budget, PR, free tasting.
The advantages of HIT are high quality of merchandise, high service and pretty atmosphere.
The advantages of “Fantastiko” are the place (very closed to the consumers), local delivers, diversification (mall, hotel, bowling).
With this analytical tool we try to receive many different answers:
For the kind of market entry the question is: ”How do the competitors usually entry a market? Is there a market leader among the competitors? Who are the followers” We identify different strategies in connection with the leader strategy. Then other questions about the market place are: “How much commitment do competitors give to a specific market in terms of people, research, products?” The commitment is heavy, or medium or light. The researches of market demand show how flexible are competitors in changing strategies for different market situations. And for the product audit the results are how flexible have been competitors in managing their product lines as displayed by reduction or elimination of products. The problem with the price strategy is connected with what has been the pattern of competitors in pricing new products? Do they tend to use skim or penetration pricing? About the promotion strategy we want to know what kind advertising have the competitors: advertising supporting the personal selling, or informing target audience about new products, or persuade customers to buy existing products. What is the profile of competitors’ sales forces – size, territory design, compensation systems? The other questions are: “How well do competitors integrate sales promotion with their advertising and sales force strategies? For the distribution strategy the most important things are: What has been the distribution strategy of competitors in reaching customer markets? Is this direct distribution to the end users, or indirect distribution through intermediaries (distributors, dealers) Are competitors displaying any strategies that could alter their distribution methods? Are they looking at exclusive (restricted) distribution or intensive (wide-spread) distribution?
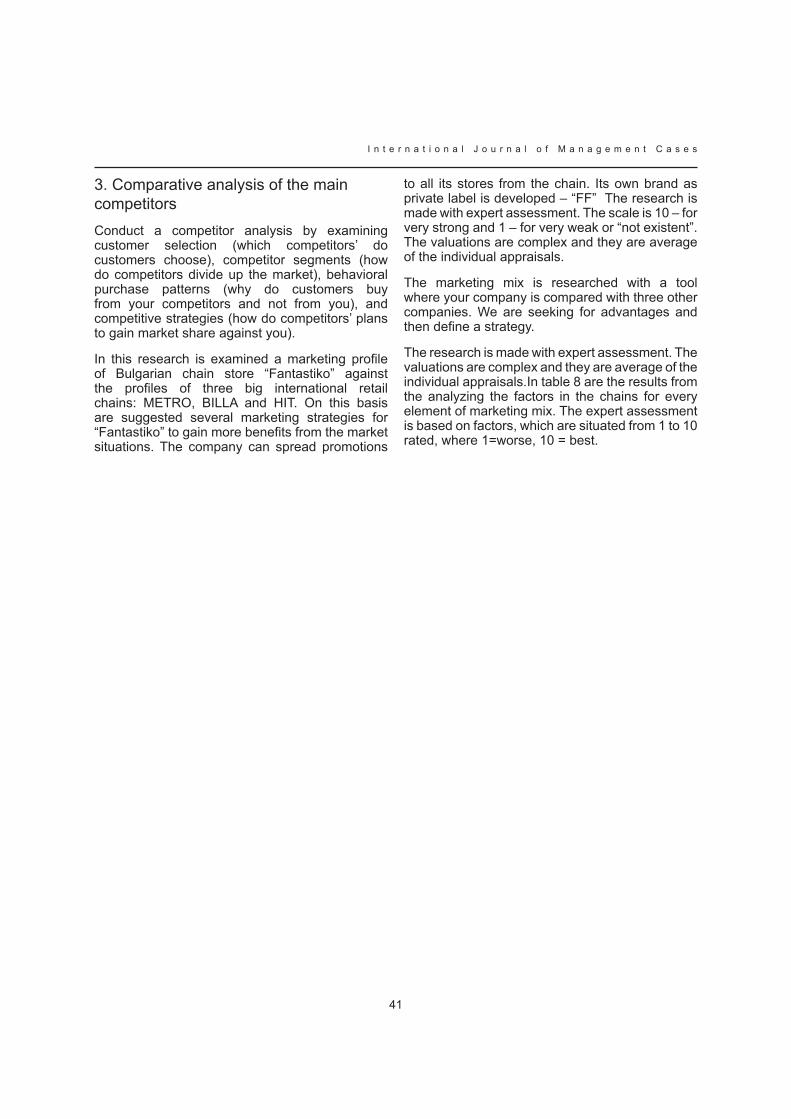
41
I n t e r n a t i o n a l J o u r n a l o f M a n a g e m e n t C a s e s
3. Comparative analysis of the main competitorsConduct a competitor analysis by examining customer selection (which competitors’ do customers choose), competitor segments (how do competitors divide up the market), behavioral purchase patterns (why do customers buy from your competitors and not from you), and competitive strategies (how do competitors’ plans to gain market share against you).
In this research is examined a marketing profile of Bulgarian chain store “Fantastiko” against the profiles of three big international retail chains: METRO, BILLA and HIT. On this basis are suggested several marketing strategies for “Fantastiko” to gain more benefits from the market situations. The company can spread promotions
to all its stores from the chain. Its own brand as private label is developed – “FF” the research is made with expert assessment. the scale is 10 – for very strong and 1 – for very weak or “not existent”. The valuations are complex and they are average of the individual appraisals.
The marketing mix is researched with a tool where your company is compared with three other companies. We are seeking for advantages and then define a strategy.
The research is made with expert assessment. The valuations are complex and they are average of the individual appraisals.in table 8 are the results from the analyzing the factors in the chains for every element of marketing mix. The expert assessment is based on factors, which are situated from 1 to 10 rated, where 1=worse, 10 = best.

I n t e r n a t i o n a l J o u r n a l o f M a n a g e m e n t C a s e s
42
figure 8. Comparative analysis between companies
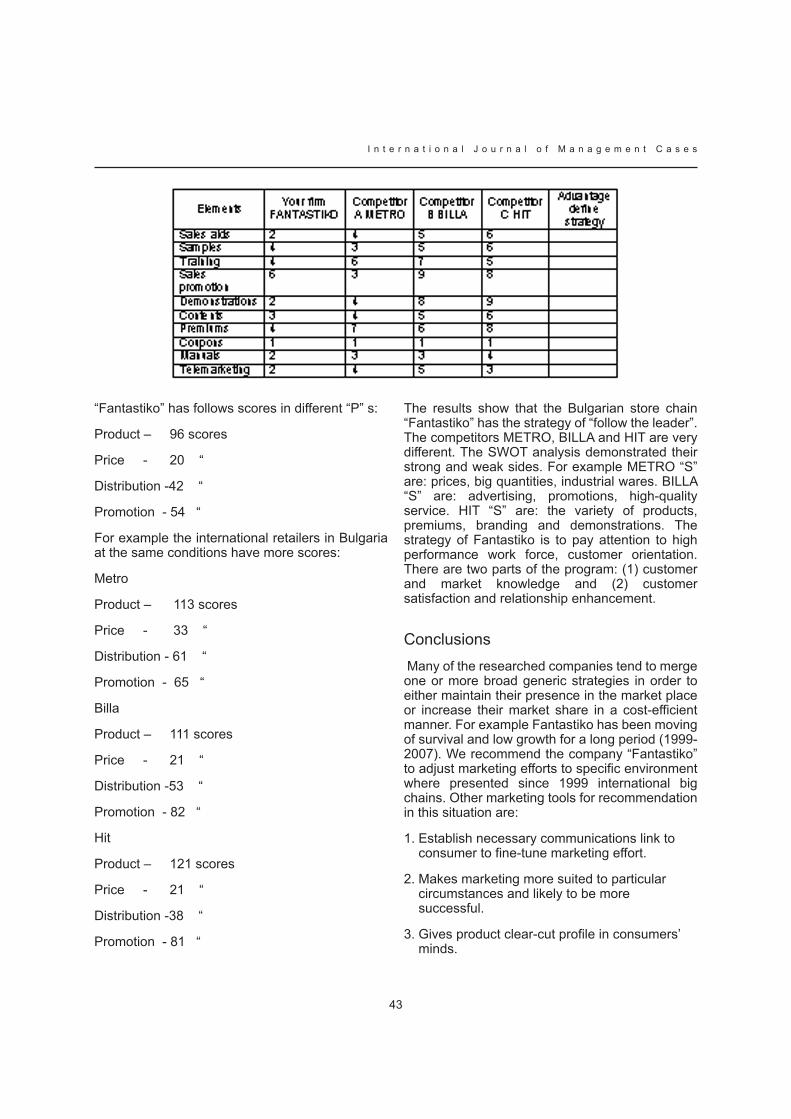
43
I n t e r n a t i o n a l J o u r n a l o f M a n a g e m e n t C a s e s
“Fantastiko” has follows scores in different “P” s:
Product – 96 scores
Price - 20 “
Distribution -42 “
Promotion - 54 “
For example the international retailers in Bulgaria at the same conditions have more scores:
Metro
Product – 113 scores
Price - 33 “
Distribution - 61 “
Promotion - 65 “
Billa
Product – 111 scores
Price - 21 “
Distribution -53 “
Promotion - 82 “
Hit
Product – 121 scores
Price - 21 “
Distribution -38 “
Promotion - 81 “
The results show that the Bulgarian store chain “Fantastiko” has the strategy of “follow the leader”. The competitors METRO, BILLA and HIT are very different. The SWOT analysis demonstrated their strong and weak sides. For example METRO “S” are: prices, big quantities, industrial wares. BILLA “S” are: advertising, promotions, high-quality service. HIT “S” are: the variety of products, premiums, branding and demonstrations. The strategy of Fantastiko is to pay attention to high performance work force, customer orientation. There are two parts of the program: (1) customer and market knowledge and (2) customer satisfaction and relationship enhancement.
Conclusions Many of the researched companies tend to merge one or more broad generic strategies in order to either maintain their presence in the market place or increase their market share in a cost-efficient manner. For example Fantastiko has been moving of survival and low growth for a long period (1999-2007). We recommend the company “Fantastiko” to adjust marketing efforts to specific environment where presented since 1999 international big chains. Other marketing tools for recommendation in this situation are:
Establish necessary communications link to consumer to fine-tune marketing effort.
Makes marketing more suited to particular circumstances and likely to be more successful.
Gives product clear-cut profile in consumers’ minds.
1.
2.
3.
I n t e r n a t i o n a l J o u r n a l o f M a n a g e m e n t C a s e s
44
Gives consumers good, convincing reasons to buy product over others.
Generates consumer business and dealer loyalty.
Associates your product with the right kind of outlet – the shops Fantastiko – shops for energy!
Keep product design in line with consumer wants in order to serve them better. Makes “silent salesperson” on the shelf easily recognized and persuasive.
The emphasis falls on the high performance work force, key company processes and business results. It is the focal point for examining how a company internalyse the voices of customer and the market place.
4.
5.
6.
7.
References1.Porter, M. (1980) competitive strategy, london, McMillan
2.kotler, P. (1986) Marketing Management, NY, Prentice Hall
3.Baldrige, M. (1998) criteria for performance excellence, L, Pitman
4.Pearce, J., R. Robinson (1991) competitive strategy
5.Grant, R. (1995) Contemporary strategy analysis
6.oster, S. (1994) Modern competitive analysis
7.thompson, a., a. Strickland (1987) Strategic Management
8.Willard,a. & N.Stern (2004)Winning at Retail& Developing a sustained Model for Success, Wiley
45
I n t e r n a t i o n a l J o u r n a l o f M a n a g e m e n t C a s e s
INCREASING CONSUMERS’ SATISFACTION By DEVELOPING COMPANy’S CORE
COMPETENCES
IRINA S. NEGANOVAURAL STATE UNIVERSITy OF ECONOMICS, RUSSIA
Abstract
This article investigates the role of company’s core competences in increasing consumers’ satisfaction. The proposed conceptual model illustrated the core competences nature, dimensions and influence on product’s benefits for customers confirms that developing core competences makes company’s products more valuable for its customers and thus provides its competitiveness in the global market. Nowadays Russian poultry farming enterprises are facing with the growing competition from the direction of foreign companies. The quality of Russian poultry products in terms of its benefits for customers would be better if national companies give more attention to developing their core competences. However, the research indicates that very often companies don’t give enough attention to their core competencies in this regard. The implication is that core competences should be used for making company’s products more valuable for its customers. A better understanding of company’s core competencies allow to satisfy customers’ needs better in order to become more competitive in the global market.
Key words
consumers’ satisfaction, company’s competitiveness, core competences
There can be little debate that globalisation of the markets, increasing number of existing and potential competitors, transformation of customer expectations determine new approaches to make a company competitive.
It is our contention that with the business environment becoming more unpredictable and business requiring innovations, it calls for returning back to company’s internal resources; especially it applies to core competences of a company. We believe our paper contributes to
the literature by adding to the knowledge that exists about relationships between company’s core competences and consumer satisfaction by company’s products. We argue that developing company’s core competences makes its products more valuable for customers and thus provides a company with sustainable competitive advantage in a market. Finally, we identify Russian poultry farming enterprises’ core competences and their influence on developing poultry products features that are the most important for their customers.
Conceptual background/hypothesis developmentWhile a comprehensive review of the vast literature pertaining to core competences is beyond the scope of this paper, in this section we’ll provide a brief overview of elements of core competence research that we suppose to be important to the understanding of our research.
Andrews (1979) is one of the first to use the term ‘distinguishing competence’ to define the field of activity in which a company operates at its best. He proposed that ‘distinguishing competences of an organisation mean not only what it can do. they mean what it can do especially well’ (p 48). He concluded that a firm should ‘define the skills which are the basis for success and ‘identify and create the skill which is really distinguishable’.
The core competence is defined by Prahalad and Hamel (1990) as ‘skills and abilities…, which mean harmonising various technological directions…, relate to providing values…, are the result of the joint experience of a company as a whole’ (p 81). The authors found that a unique combination of the core competences creates competitive advantage, and core competences’ development is a key to company’s competitiveness.
I n t e r n a t i o n a l J o u r n a l o f M a n a g e m e n t C a s e s
46
Furthermore the work cited later by Prahalad and Hamel (1994) relative to core competence as the essence of company’s competitiveness provides support for the contention the core competence may be used by a company to create benefits for customers.
Similarly, Durand (1997), arguing that the concept of competences can give more than resource-oriented point of view, defined competences as company’s abilities to gather and integrate resources into goods and services. Accordingly, the author described organisational competences using three dimensions: knowledge, know-how and interaction (Figure 1).
Knowledge is structured sets of the received information in incomplete and partly contradicting interpretation which help to understand the world. Thus, knowledge includes access to data, ability to take them as information and process it.
Know-how is an ability to take a certain course of action according to the previously set objectives and processes. Know-how does not exclude knowledge. It implies the most complete understanding why skills, abilities, technologies and innovations really work.
Interaction is often ignored in approaches that are based on resources, though behaviour, identification and desire are the most important parts of an ability to achieve the goal.
Bogner at al (1998) report a study designed to investigate the role of dynamic competences in choosing an optimal organisational form of multinationals. The authors argue that the cost-benefit analysis of competences development better explains reorganisation decisions than the model of operating cost or the model based on knowledge.
Research by McGrath at al (1995) provides some evidence of such competitive advantage of a company as rental revenue resulted from company’s competences and innovativeness in recognising its own efficiency, values and strong customer relations compared to those of competitors’.
The common thread in these research streams is that competences mean the specific skills, knowledge, behaviour patterns that are unique
for a company and are the basis for developing its competitive advantage. Thus,
Hypothesis 1. Competences are a unique combination of knowledge, skills and technologies which is used by a company to manage its resources and business-processes to increase the value of goods for its customers.
Prahalad and Hamel (1990) proposed that there is a hierarchy of competences. They defined a core competence as joint knowledge which allows managing other competences and is used for creating the maximum value for a customer. They found the key features of core competence: core competence creates the distinctive value of a company’s product; it is unique for each company and can’t be reproduced by competitors; core competence provides a company with access to different markets; it is one of the longest lasting assets of a company.
Hypothesis 2. Company’s core competences apply to the product features that are the most beneficial for customers. Identification of core competences will help to increase value of company’s products for customers.
Our research is set specifically within the context of Russian poultry farming industry which we believe to be an area in which Russian customers satisfaction is likely to be problematic for a variety of reasons. First, nowadays more than 50% of poultry products are imported to Russia from abroad. Empirical data provides some evidence for higher quality of imported products in comparison with domestic ones. Second, there is a lack of government support in this sector which would help to develop productive capacities and infrastructure. Thus, Russian poultry farming enterprises facing with the strong competition from the direction of foreign companies need to increase their competitiveness in Russian market.
Hypothesis 3. If Russian poultry farming enterprises start to identify and develop their core competences they will be able to increase the product value, achieve better customer satisfaction and become more competitive in the poultry farming market in Russia.
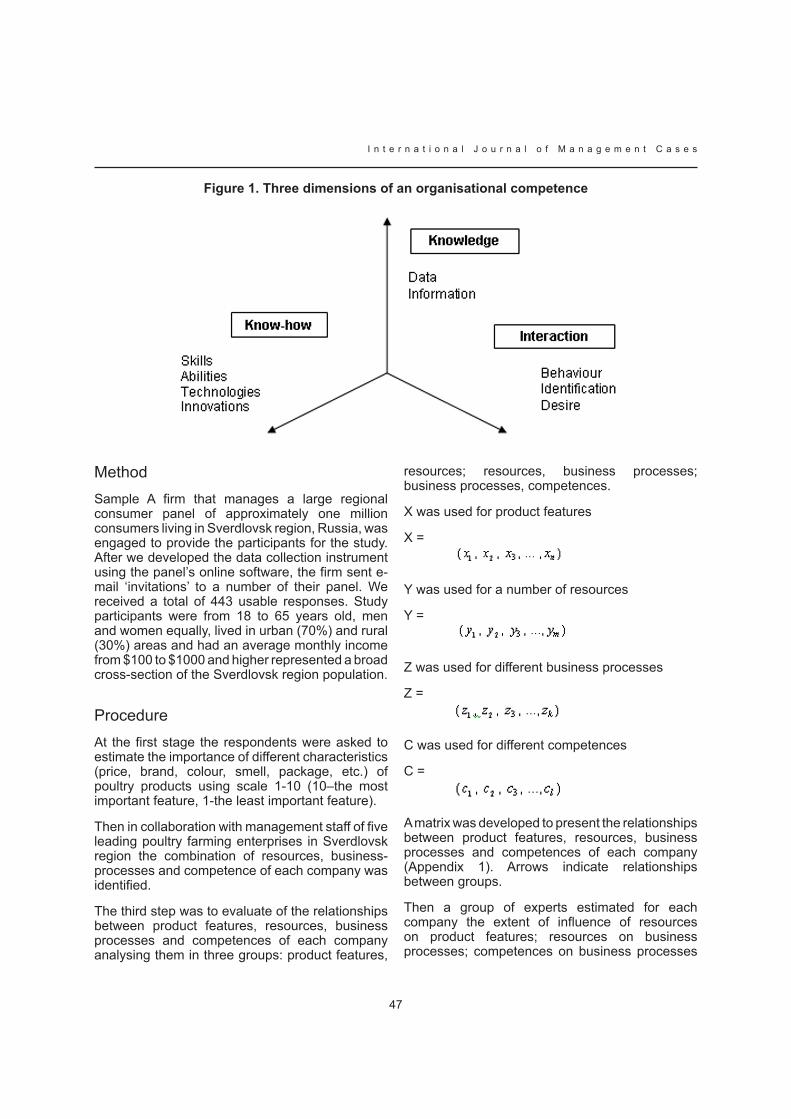
47
I n t e r n a t i o n a l J o u r n a l o f M a n a g e m e n t C a s e s
figure 1. Three dimensions of an organisational competence
MethodSample A firm that manages a large regional consumer panel of approximately one million consumers living in Sverdlovsk region, Russia, was engaged to provide the participants for the study. After we developed the data collection instrument using the panel’s online software, the firm sent e-mail ‘invitations’ to a number of their panel. We received a total of 443 usable responses. Study participants were from 18 to 65 years old, men and women equally, lived in urban (70%) and rural (30%) areas and had an average monthly income from $100 to $1000 and higher represented a broad cross-section of the Sverdlovsk region population.
ProcedureAt the first stage the respondents were asked to estimate the importance of different characteristics (price, brand, colour, smell, package, etc.) of poultry products using scale 1-10 (10–the most important feature, 1-the least important feature).
Then in collaboration with management staff of five leading poultry farming enterprises in Sverdlovsk region the combination of resources, business-processes and competence of each company was identified.
The third step was to evaluate of the relationships between product features, resources, business processes and competences of each company analysing them in three groups: product features,
resources; resources, business processes; business processes, competences.
X was used for product features
X =
y was used for a number of resources
y =
Z was used for different business processes
Z =
C was used for different competences
С =
A matrix was developed to present the relationships between product features, resources, business processes and competences of each company (Appendix 1). Arrows indicate relationships between groups.
Then a group of experts estimated for each company the extent of influence of resources on product features; resources on business processes; competences on business processes
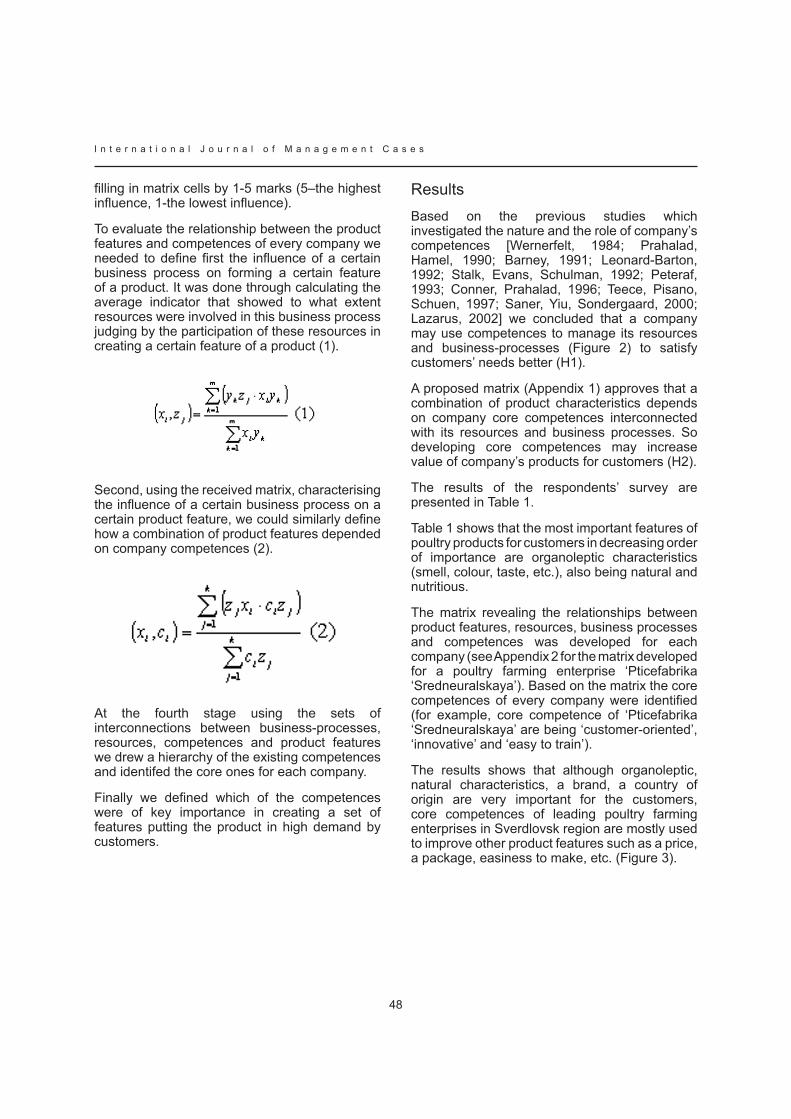
I n t e r n a t i o n a l J o u r n a l o f M a n a g e m e n t C a s e s
48
filling in matrix cells by 1-5 marks (5–the highest influence, 1-the lowest influence).
To evaluate the relationship between the product features and competences of every company we needed to define first the influence of a certain business process on forming a certain feature of a product. It was done through calculating the average indicator that showed to what extent resources were involved in this business process judging by the participation of these resources in creating a certain feature of a product (1).
Second, using the received matrix, characterising the influence of a certain business process on a certain product feature, we could similarly define how a combination of product features depended on company competences (2).
At the fourth stage using the sets of interconnections between business-processes, resources, competences and product features we drew a hierarchy of the existing competences and identifed the core ones for each company.
Finally we defined which of the competences were of key importance in creating a set of features putting the product in high demand by customers.
ResultsBased on the previous studies which investigated the nature and the role of company’s competences [Wernerfelt, 1984; Prahalad, Hamel, 1990; Barney, 1991; Leonard-Barton, 1992; Stalk, Evans, Schulman, 1992; Peteraf, 1993; Conner, Prahalad, 1996; Teece, Pisano, Schuen, 1997; Saner, yiu, Sondergaard, 2000; lazarus, 2002] we concluded that a company may use competences to manage its resources and business-processes (Figure 2) to satisfy customers’ needs better (H1).
A proposed matrix (Appendix 1) approves that a combination of product characteristics depends on company core competences interconnected with its resources and business processes. So developing core competences may increase value of company’s products for customers (H2).
The results of the respondents’ survey are presented in Table 1.
Table 1 shows that the most important features of poultry products for customers in decreasing order of importance are organoleptic characteristics (smell, colour, taste, etc.), also being natural and nutritious.
The matrix revealing the relationships between product features, resources, business processes and competences was developed for each company (see Appendix 2 for the matrix developed for a poultry farming enterprise ‘Pticefabrika ‘Sredneuralskaya’). Based on the matrix the core competences of every company were identified (for example, core competence of ‘Pticefabrika ‘Sredneuralskaya’ are being ‘customer-oriented’, ‘innovative’ and ‘easy to train’).
The results shows that although organoleptic, natural characteristics, a brand, a country of origin are very important for the customers, core competences of leading poultry farming enterprises in Sverdlovsk region are mostly used to improve other product features such as a price, a package, easiness to make, etc. (Figure 3).
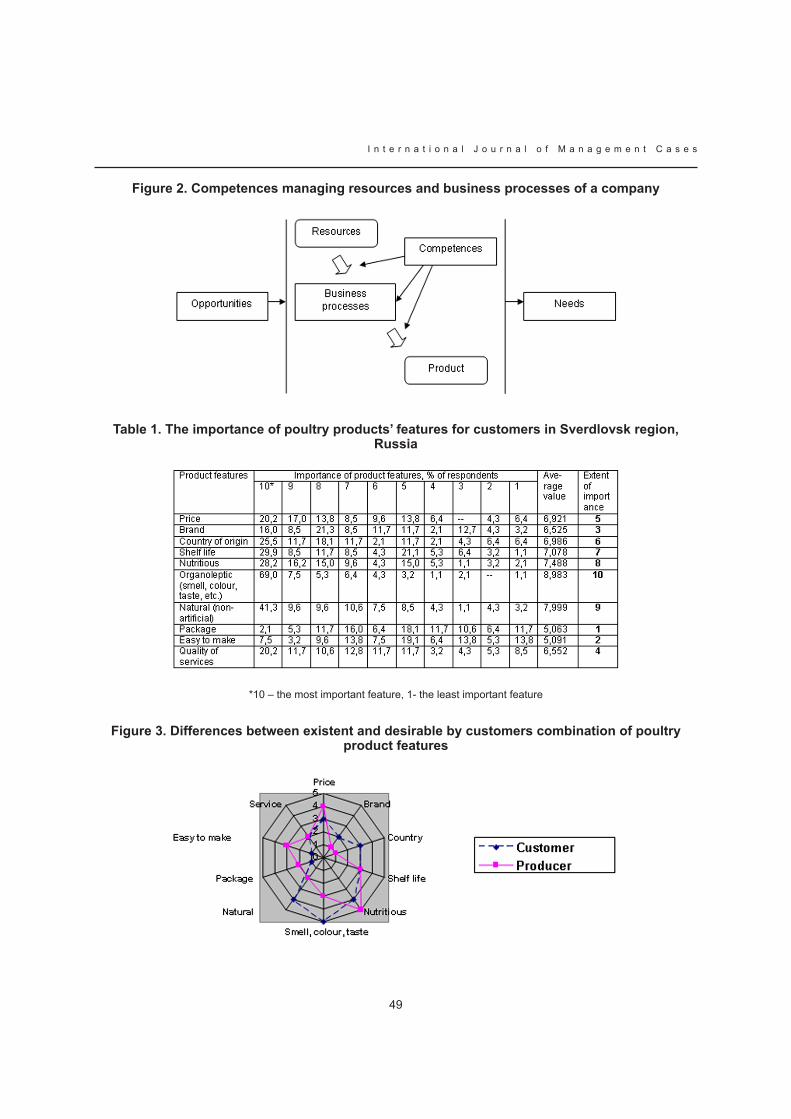
49
I n t e r n a t i o n a l J o u r n a l o f M a n a g e m e n t C a s e s
figure 2. Competences managing resources and business processes of a company
Table 1. The importance of poultry products’ features for customers in Sverdlovsk region, Russia
*10 – the most important feature, 1- the least important feature
figure 3. Differences between existent and desirable by customers combination of poultry product features
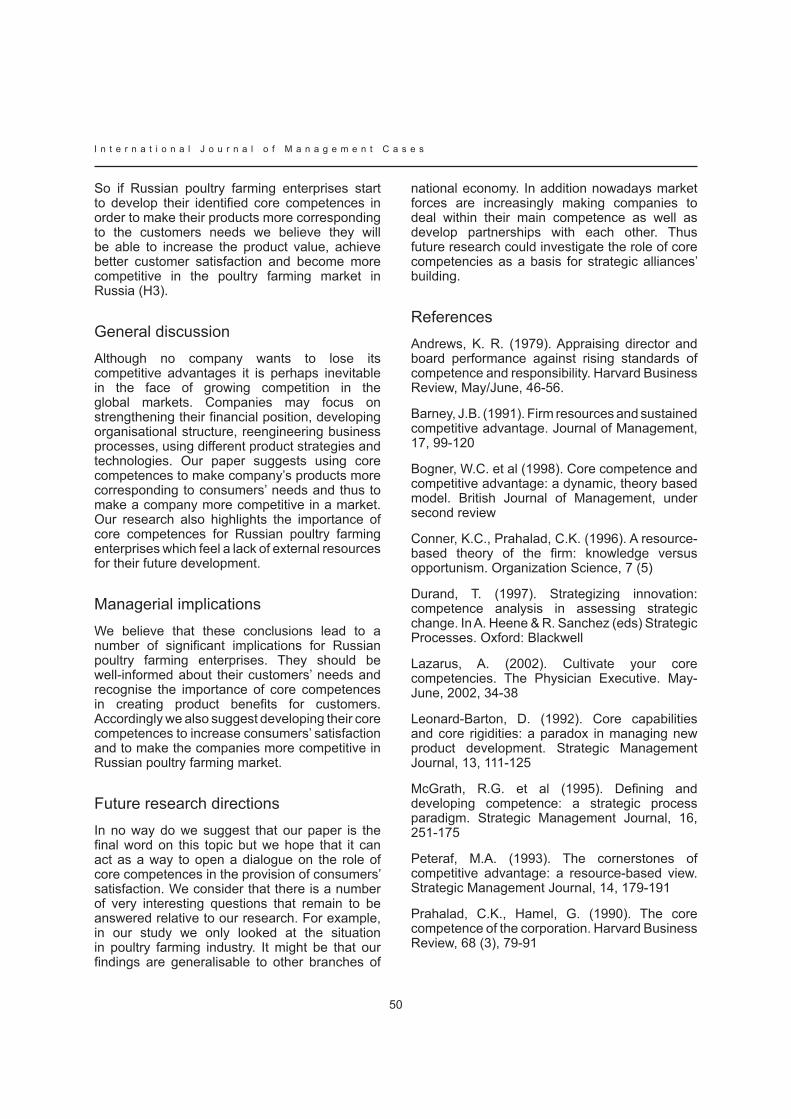
I n t e r n a t i o n a l J o u r n a l o f M a n a g e m e n t C a s e s
50
So if Russian poultry farming enterprises start to develop their identified core competences in order to make their products more corresponding to the customers needs we believe they will be able to increase the product value, achieve better customer satisfaction and become more competitive in the poultry farming market in Russia (H3).
General discussionAlthough no company wants to lose its competitive advantages it is perhaps inevitable in the face of growing competition in the global markets. Companies may focus on strengthening their financial position, developing organisational structure, reengineering business processes, using different product strategies and technologies. Our paper suggests using core competences to make company’s products more corresponding to consumers’ needs and thus to make a company more competitive in a market. Our research also highlights the importance of core competences for Russian poultry farming enterprises which feel a lack of external resources for their future development.
Managerial implicationsWe believe that these conclusions lead to a number of significant implications for Russian poultry farming enterprises. They should be well-informed about their customers’ needs and recognise the importance of core competences in creating product benefits for customers. Accordingly we also suggest developing their core competences to increase consumers’ satisfaction and to make the companies more competitive in Russian poultry farming market.
Future research directionsIn no way do we suggest that our paper is the final word on this topic but we hope that it can act as a way to open a dialogue on the role of core competences in the provision of consumers’ satisfaction. We consider that there is a number of very interesting questions that remain to be answered relative to our research. For example, in our study we only looked at the situation in poultry farming industry. It might be that our findings are generalisable to other branches of
national economy. In addition nowadays market forces are increasingly making companies to deal within their main competence as well as develop partnerships with each other. Thus future research could investigate the role of core competencies as a basis for strategic alliances’ building.
ReferencesAndrews, K. R. (1979). Appraising director and board performance against rising standards of competence and responsibility. Harvard Business Review, May/June, 46-56.
Barney, J.B. (1991). Firm resources and sustained competitive advantage. Journal of Management, 17, 99-120
Bogner, W.c. et al (1998). core competence and competitive advantage: a dynamic, theory based model. British Journal of Management, under second review
Conner, K.C., Prahalad, C.K. (1996). A resource-based theory of the firm: knowledge versus opportunism. Organization Science, 7 (5)
Durand, T. (1997). Strategizing innovation: competence analysis in assessing strategic change. In A. Heene & R. Sanchez (eds) Strategic Processes. Oxford: Blackwell
Lazarus, A. (2002). Cultivate your core competencies. The Physician Executive. May-June, 2002, 34-38
Leonard-Barton, D. (1992). Core capabilities and core rigidities: a paradox in managing new product development. Strategic Management Journal, 13, 111-125
McGrath, R.G. et al (1995). Defining and developing competence: a strategic process paradigm. Strategic Management Journal, 16, 251-175
Peteraf, M.A. (1993). The cornerstones of competitive advantage: a resource-based view. Strategic Management Journal, 14, 179-191
Prahalad, C.K., Hamel, G. (1990). The core competence of the corporation. Harvard Business Review, 68 (3), 79-91
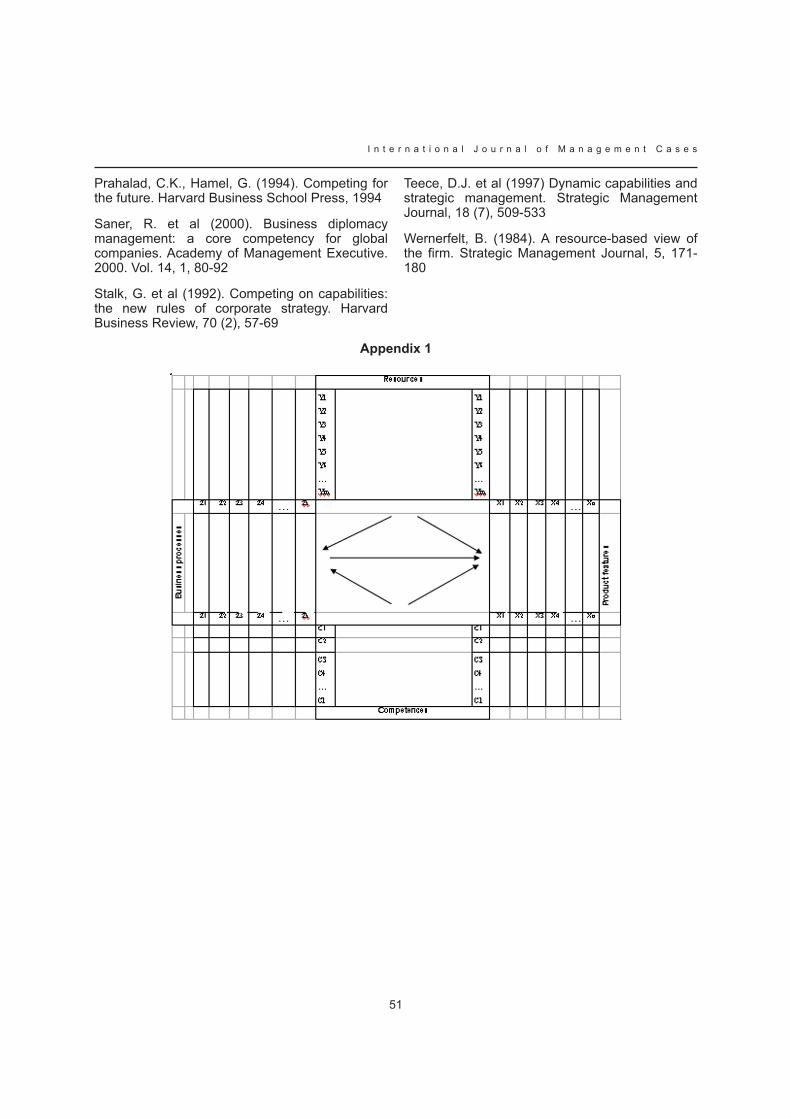
51
I n t e r n a t i o n a l J o u r n a l o f M a n a g e m e n t C a s e s
Prahalad, c.k., Hamel, g. (1994). competing for the future. Harvard Business School Press, 1994
Saner, R. et al (2000). Business diplomacy management: a core competency for global companies. Academy of Management Executive. 2000. Vol. 14, 1, 80-92
Stalk, G. et al (1992). Competing on capabilities: the new rules of corporate strategy. Harvard Business Review, 70 (2), 57-69
Teece, D.J. et al (1997) Dynamic capabilities and strategic management. Strategic Management Journal, 18 (7), 509-533
Wernerfelt, B. (1984). a resource-based view of the firm. Strategic Management Journal, 5, 171-180
Appendix 1
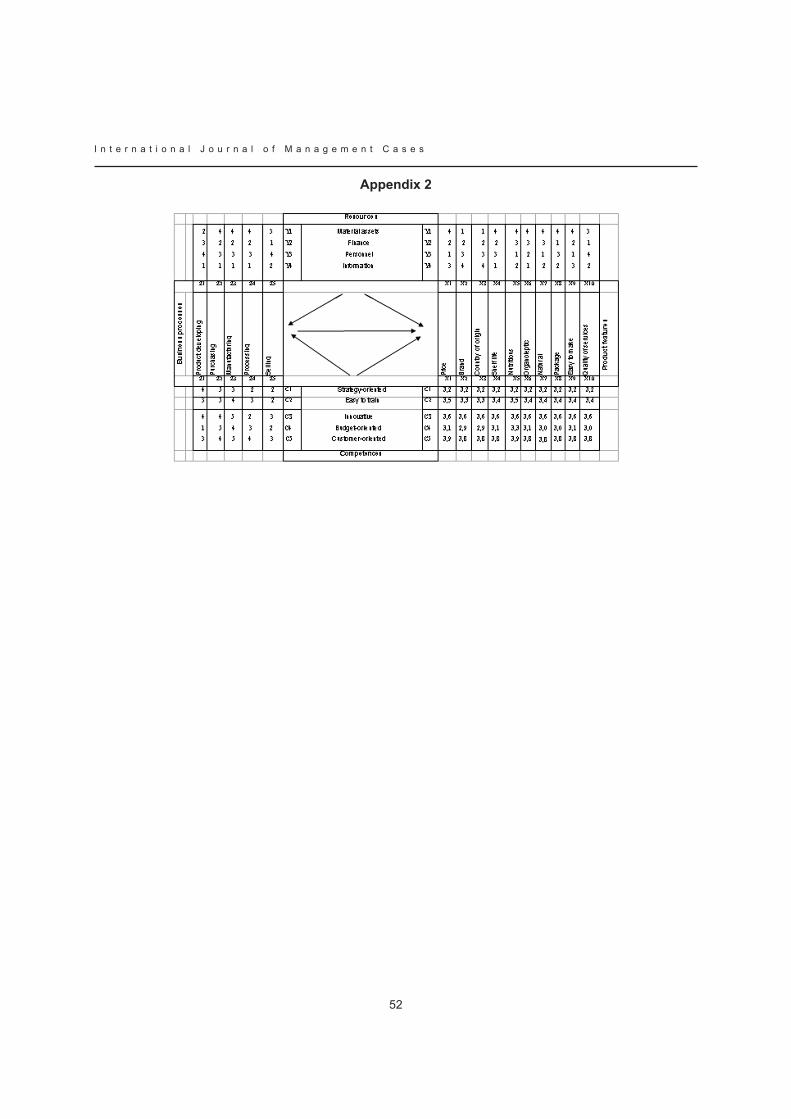
I n t e r n a t i o n a l J o u r n a l o f M a n a g e m e n t C a s e s
52
Appendix 2
53
I n t e r n a t i o n a l J o u r n a l o f M a n a g e m e n t C a s e s
PAKIZA
ROSHAN J M KAZIALLANA INSTITUTE OF MANAGEMENT SCIENCES, INDIA
R C NATARAJANINDIAN INSTITUTE OF MANAGEMENT INDORE, INDIA
Abstract
The case focuses on the history of Pakiza, and records the challenges faced by it on its path in becoming a brand. It also analyzes the strategies that primarily contributed to the steady growth of Pakiza. In particular the case provides insight into how Pakiza differs fundamentally from other retail organizations in terms of its values and principles. It presents the students with philosophies of Pakiza along with SWOT analysis to help them approach the case problem in a more logical manner. It concludes with a discussion of expansion issues and its impact on the brand image of Pakiza. The case intentionally finishes prior to the development of the expansion strategy, presenting a clear focus for student assignments. It helps develop an understanding of the role and importance of branding, relationship marketing and customer service. It raises numerous discussion points on aspects of innovation, customer focus, employee satisfaction, retail expansion and marketing strategy. The case is widely applicable. It can be used in teaching retailing, relationship marketing, strategic marketing and brand science. The case study has four parts. The first part briefly reviews the history of Pakiza. The second part deals with the brand strategy. The third part covers SWOT analysis of Pakiza and the fourth part presents expansion issue and its effect on the brand Pakiza as a problem for case discussion. The study ends at the point where the top management has to decide on the future expansion strategy and its wider implications.
Key words: Brand philosophy, brand communication, brand strategy, customer service.
“Our mission is to give customers what they need, at a price affordable, in a luxurious setting. Our products range from economy to premium. It is for all – A One-Stop Family Store.”
Maqsood Gori, Managing Director, Pakiza Retail Private Limited
On 1st January 2009, a colorful function was held to mark the third foundation day celebrations of P3 (Pakiza store at AB Road, Indore). Hordes of customers congregated at the entrance even before the store could open. The overwhelming response was a result of a major discount offer promoted through leading newspapers and local cable TV. This exhilarating event was witnessed by more than15,000 customers who were greeted with Pedaa and complimented with coupons for free snacks and ice-cream. While the patrons enjoyed shopping with free popcorn, coffee, chana-jor-garam, tattoo decoration and mehndi designs, the economically underprivileged availed 2 meters shirt material for just Rs. 11, under a social scheme. These shirt materials were distributed through a Mandapb outside the store to about 6000 persons lined in a 1-km long queue. It was nothing less than an extravaganza that required special effort from the local police to set things right.
Background Pakiza is a chain of departmental stores with its presence in Indore since 1975. It has the credit of pioneering the concept of departmental store in Indore. It became a brand, born and nurtured over 33 years. This multibrand low priced departmental store chain is recognized for its affordable prices, courteous and supportive people and quality of merchandise. It stands true to the meaning of its name – “Purity” in arabic. Pakiza has built up a reputation of first-rate service to customers, loyalty to stakeholders and conscientiousness towards the society, guided by its two visionary founders Iqbal Gori and Maqsood Gori.
I n t e r n a t i o n a l J o u r n a l o f M a n a g e m e n t C a s e s
54
The Goris’ is a typical rags-to-riches story. These cousins started out from meager beginnings, did not complete schooling because they could not afford tuition. The history of Pakiza dates back to 1975. Before founding Pakiza, Gori brothers had a bicycle repair workshop at the crowded Santha Bazaar in Indore. This job involved overhauling bicycle with kerosene. Iqbal developed an allergic reaction to kerosene and ultimately decided to venture into a different trade. In 1975 he started selling Clothing Cut-Piecesc on handcartd with an initial investment of Rs. 3000. Maqsood, Iqbal’s first cousin, who has a good sense of consumer psychology, joined him eight months later and “Customer Intimacy” became the initial strategy to cut into the fierce competition and keep the customers coming back. As a part of this strategy it was decided to take “attending the customers” as the first job. This strategy has been so successful that today Rs. 510 million Pakiza chain has its business spread over three mega stores in 1,50, 000 sq. ft. of total area.
The first Pakiza store was opened at Santha Bazaar in 1981. this 15000 sq. ft. store caters to customers of the old city and customers who flock from the neighboring suburbs. The second Pakiza store was started in 1994 at the Regal Square with a total area of 45000 sq. ft. the third 90000 sq. ft. store situated at AB road caters to the need of Modern Township. Referred as P1, P2 and P3 respectively, these three stores carry the best in the retail product categories, with 125 top Indian and international brands in fashion, jewelry, footwear, watches etc and other accessories. In addition, Pakiza has also been placing emphasis on selling its own private label brands in men’s apparels. Some of the well-accepted Pakiza private label brands include Sketch, MacKen, Scorpio, Casino, Lecarde, Aflatoon, S-class, Pacific, Passion, Privilege and comfort Zone. Selling private label brands enables Pakiza to eliminate intermediaries and transfer the benefit to the customers by selling such brand at much lower prices. On an average the traffic at all the three stores is about 1,00,000 walk-ins per month with a conversion rate of 90% to 95%. Pakiza operate with a simple supply chain. Suppliers ship all goods to a single distribution center located at P3, AB Road. Merchandise is consolidated for reshipment to the three stores through Pakzia delivery vans. All stores are located with 8 km of the distribution center.
the Santha Bazaar Store – early years Iqbal Gori the current Director Operations, Pakiza Retail Private Limited was the first to break out from the traditional family business of bicycle repair and start as a Hawker selling clothing cut-pieces at the busy Santha Bazaar in 1975. His cousin Maqsood joined him 10 months later and went on to become the Managing Director of Pakiza Retail Private Limited. The market then was an unorganized sector and was dominated by the local business community known as Baniyas.e The market trend was tailor-made clothes – men preferred to get their clothes stitched by their trusted tailors. ‘Clothing Cut-Pieces’ were most preferred because not only were they inexpensive they were also available in three different sizes, between 25 cm and 45 cm called Rags, between 76 cm and 74 cm called Phant and between 75 cm and 77 cm called Cut-Piece. Customers would prefer to buy these as per their requirement. However, normally for adult, tailors suggested a size of 2 meters for a shirt and 1.2 meters for a trouser.
Though the Baniyas were ruling the market, the Gori brothers could manage to attract customers through the volume game. The Baniyas followed a fixed rate policy, which discouraged bargaining. Iqbal and Maqsood accepted lower margins and entertained the practice of bargaining. Polite words and lower prices paved a road for success and the business got the start it needed. As they managed to pull a crowd they could also persuade their parents to transform the 54 sq. ft. bicycle repair workshop into a cut-piece-cloth store. This store was named ‘Kohinoor Cloth Store’ and four salesmen were appointed as the first members of staff. The Gori brothers continued with the basic philosophy of politeness, courtesy and lower prices. The customer base kept increasing demanding more and more store space, this made the Gori brothers to buy the neighboring stores at more than the market rate. on 8 March 1981 the 900 sq store was renamed Pakiza after the Gori brothers took fancy to the famous Hindi movie ‘Pakeezah’ staring Ashok Kumar, Raaj Kumar and Meena Kumari.
55
I n t e r n a t i o n a l J o u r n a l o f M a n a g e m e n t C a s e s
till 1984, Pakiza was thought as a cut-piece-cloth store. However, by the end of 1984 Saree, the Indian female attire, which symbolizes the essence of purity and represents the rich Indian tradition, was introduced at Pakiza, which gave a boost to the store’s growth.
The Gori brothers were apparently very pleased with the response the new merchandise generated. Much of the initial success of Pakiza is attributed to Iqbal, his business insight and management style. This charismatic personality while in store was the center of attention of the customers, pulling more customers leaving other salesman completely blank. He is gifted with an instinct for dealing with customers. Good humored, with a baritone voice and the adept use of the lingua franca ensured that he was always surrounded by customers. Maqsood observed this talented cousin at play and realized that the wonderful talents that Iqbal possessed could be better utilized. Thus was born the first training module of Pakiza. Iqbal skillfully trained the other salesmen and created whole team of Iqbal clones. This strategy worked and the store could serve more customers resulting in the Gori brothers’ decision to decentralize and further expand the business.
By 1992, the ready-to-wear (also called ready-made) garments started gaining popularity in Indore. Society liberated, females started searching for more comfortable attire compared to Saree and men wanted something trouble-free to buy and fashionable to wear. Not surprisingly men preferred ready-made garments, married women shifted to salwar-suits and unmarried women opted for the Western wear. Thus Salwar-suitsf and Western wear took off in Indore. Understanding the growing need of the market, ready-to-wear garments for both men and women moved into Pakiza. As business improved, the Gori brothers kept searching for better premises and better people.
the first departmental store of indorePakiza as a departmental store was the pet project of the Indore-based Gori brothers. Recalling one of his early experiences of late 1992, Iqbal said, “During an official visit to Bangalore I met a gentleman, Subramanium. After having explained about the customer-centric credo of Pakiza, the fervent Subramanium discussed more business and suggested selling everything that the adored customer needed.” Enthralled by Subramamium’s business insight, Iqbal could visualize a family store and the first department store was opened up at the Regal Square on 22 October 1993. There were several reasons for selecting Regal Square as the location for the first of its kind One-stop-family-store. Post 1992 brought enormous changes in the size and characteristic of the Indore market. New businesses sprang up and more jobs were available. Rapidly growing middle class with increasing disposable income was the distinct feature of this change. Better education led to better jobs and the whole society was becoming upwardly mobile and so did the needs and wants of consumers. Liberated females began seeking jobs to improve their economic status. Double income families mushroomed and these time-impoverished customers started looking for more convenient shopping, a place where they could by as much as they needed in their monthly home life.
The Gori brothers felt they were being out of synch by being confined to one store. At the same time a new upcoming business-market at MG Road was being established. A few stores selling apparels such Agarwal Stores, had already sprung up at MG Road and were doing well. Seizing an opportunity, the second Pakiza store was started at the Regal Square, MG Road on 22 October 1993 with a total of 24000 sq ft area. Manohar Hotwani and Altaf Shaikh were appointed the Store Managers of the new Pakiza store. The new store was attracting the middle class and the affluent class. However quality merchandise, affordable prices and customer service still continued to be the key differentiators. Customers were saved from visiting several mom-and-pop stores as every thing was
I n t e r n a t i o n a l J o u r n a l o f M a n a g e m e n t C a s e s
56
made available under one roof. Pakiza’s success formula was offering shopping convenience for time-pressured customers interested in buying a variety of merchandise at single location at reasonable prices. Customers kept pouring in and the first year sale was a remarkable 9 million on an average of 0.75 million per month. Later more space was added increasing the total store space to 45000 sq. ft.
Pakiza opens at A B Road The city was spreading and a New Indore was developing towards the northern part of the city. Modern residential societies, widened concrete roads and a fast growing business market was certainly a potential retailing opportunity. Though Iqbal was content with level of success achieved, Maqsood kept pushing him for further expansion. Maqsood was particularly known for his innate eye on prospective superior retail locations. He had a good understanding of upcoming commercial locations. This resulted in all the Pakiza locations being picked up by Maqsood featuring high-traffic sites, good visibility and accessibility. The Gori brothers wanted the third store to be a Western-style store meeting the expectation of the modern, upbeat, stylish and liberated consumers. P3 resembled the collection of specialty stores and was supposed to be the largest department store in Indore next to Treasure Island with a total retail space of 90000 sq. ft. P3 was created with the objective of providing a luxurious shopping experience. This massive, modern looking, seven-floor, air-conditioned store sought to offer every possible convenience to the customers in making their shopping a pleasurable and truly delightful experience. It offered a wide range of products designed to match the lifestyles of customers across income groups and classes. P3 was opened on 1 January 2006, seven days after the launch of Treasure Island at MG Road.
While the key feature of P3 was its convenience, pleasing ambience and attentive service, it has
everything for everybody in an easy to shop environment. This seven-floor mega store sells all kind of goods including soft goods (apparels, accessories, home furnishings and bedding); hard goods (cosmetics, home appliances, and consumer electronics); convenience goods (food, grocery, house keeping and others). It had separate sections displaying broad variety and deep assortment of merchandise. Each department was like a store-within-a-store with exclusive staff. Customers purchased as they moved from one department to the next. The seven floors were connected by three automatic elevators, which made access to all the floors easy. P3 has point-of-sale (POS) terminals in each department, and a centralized dispatch section near the store entrance so that the customer could select merchandise from different departments, pay for it at respective departments and get the delivery at the entrance once when they were ready to leave. Merchandise in each department was displayed across variety of fixtures that is most appealing to the eye and making all the merchandise visible. Certainly Gori brothers had high expectations from this state-of-the-art store.
However to the disappointment of everybody P3 could not get the number of customer as expected. Two major reasons were recorded. One P3 was in the hands of a new management and two, the birth of the first biggest mall of Indore city, Treasure Island. Gori brothers decided to stay away from the new P3 business and turned over the reins to their sons Wasim Gori (son of Iqbal Gori) and Shadab Gori (son of Maqsood Gori). Both Wasim and Shadab being young, energetic, and professionally qualified had different plans and management style for the new store. They were more professional in their approach and less emotional. They ignored the traditional Pakiza philosophy of customer intimacy and the focus was on quick sales. Individual operations, personal values and professionalism were given more importance than networking and human interactions. Prescribed rules and standard operating procedures were to become central rather than personalities. As a result the
57
I n t e r n a t i o n a l J o u r n a l o f M a n a g e m e n t C a s e s
effect was seen on customer footfalls and sales. Besides being in the hand of new management P3 also suffered a major setback from the Mega Shoppertainment Mall called Treasure Island. The impact of TI was also seen on P2 as sales started stagnating. Iqbal said, “We knew it was not going to be easy, with fierce competition and informed customer, however listening to customers made all the difference as they reciprocated with all sincerity.”
Treasure Island (TI) was launched by EWDPL backed by Manish Kalani Group on 23 December 2005 just 8 days before the launch of P3. TI was introduced with the aim of providing ‘Shoppertainment’ to the customers of Indore complete with retail outlets, food courts, recreation facilities, entertainment conveniences, and a large parking space. The shopping arcade of the mall is spread across 400,000 sq. ft. it houses almost all major branded retail outlets. TI was expected to begin a new era in Indian shopping. The mall attracted huge crowds during the initial stages of its opening and experienced about 15,000-20,000 footfalls on weekends and holidays. Commenting on TI’s obsession Maqsood explained, “TI was the first of its kind providing world class shopping facilities to the customers of Indore; so it was natural for everybody to be curious about it; however, we knew it will fade gradually.”
Surfaced with the problem of competition from a major strong player Pakiza started devising strategies to bounce back. As a first move in this direction the senior Gori brothers were brought back. Further it was researched as to what made TI different from Pakzia. What does TI has that Pakiza does not and vice versa? This study revealed three major strengths of TI: enormous size, many types of stores and entertainment complementing shopping. Whereas, TI’s weaknesses identified as poor conversion ratio, larger number of window shoppers, over crowded, less personal attention and reduced customer service. Pakiza could see a large scope in terms of personal touch and customer care. Thus it was felt necessary to get back to the original strategy of ‘customer intimacy’ and get the basics of service right. A host of customer services were brought back to practice – guest greeters, Palm Rolling Rule and several free services discussed later in the case. This strategy worked and toward the end of 2006 the sales graph of P3 started showing an upward trend. Quality, price and service led the company
from to grow and revenues soared from Rs 27 Million in 2004 to Rs 510 Million in 2008.
Brand PhilosophyPakiza aims to provide its customers an ambience of a star hotel, quality of a specialty store, price of a discount store, variety of a departmental store and service of a pop and mom store. Pakiza decided on a “Customer Intimacy” strategy from the very beginning. Speaking about an old business philosophy, Iqbal recalled, “Metal balls are commonly used in bicycles to make the handle move freely. these small balls come in a set of 144 per pack, which are fitted in the hub by hand. At times they slip to the floor if not handled carefully and get mixed with the old ones making it difficult to identify the new ones. In such a situation the new balls fallen down were described as ‘haram’. In Arabic ‘haram’ means forbidden or unlawful. The philosophy of quality and service was there before and will always remain for Pakiza be it any business.” Thus quality goods and brilliant customer service were to become the major drivers of the Pakiza brand.
The Gori brothers recognize that Indian customers love hospitality and they feel comfortable dealing with neighborhood stores because they get convivial atmosphere in such stores. Maqsood added, “Customers must feel welcome and comfortable when they enter the store.” Thus an unusual site at every store is the Pakiza men at the entrance welcoming the incoming customer what they call as “Guest Greeters.” A scene unseen at the competitors’ stores. These “Guest Greeters” have come to become an important and visual part of the total brand experience. The Pakiza “Guest Greeters” exhibit Indian culture and values. They will bow, wish the customer and extend assistance. this greet is continued with a follow-up remark – “May I help you Sir/Madam?” or “Any thing specific you are looking for?” Customers are taken by a pleasant surprise but like the gesture. The Guest Greeters have contributed immensely to the success of Pakiza’s brand strategy. It is normal to see Iqbal at the P3 entrance and Manjoor (elder brother of Iqbal) at the P2 entrance. Doing so provides them an opportunity to speak to the customers and keep the employees motivated. Every male employee is required to offer a handshake to minimum 20 male customers in a day.
I n t e r n a t i o n a l J o u r n a l o f M a n a g e m e n t C a s e s
58
Pakiza earnestly realizes that every employee is different when it comes to brand delivery and customer service. It is wrong to expect all employees to be friendly and courteous. Similarly, not all are polite or soft-spoken. Pakiza undertakes training programs for its employees to educate such employees to be responsive, pleasant and caring. This is also initiated to ensure that the Pakiza brand experience is delivered as promised. Training programs are conducted for all levels of staff.
Bringing them together Pakiza is a rare example of communal harmony. Work force at Pakiza is diverse and belongs to different religions. Founders of Pakiza are the believers of islam and over 80% of employee strength of Pakiza is of different faith. Every Pakiza store has a prayer hall for Muslims to offer ‘namaz’.g While this is true, Pakiza also respected the sentiments of the Non-Muslim employees. Every morning after his regular prayers a ‘Pundit’ is appointed to visit all the three stores of Pakiza and ‘Tilak’h the Hindu employees.
‘Tilak’ on the forehead of a Hindu employee has become a part of his uniform. Pakiza is a platform where employees believing in different faith come together in the true spirit of harmony and brotherhood. At Pakiza the day begins with a morning prayer attended by all the staff. At this prayer meeting the staff sings the famous Hindi devotional song , “Itni Shakti Hame Dena Daata, Man ka Vishwas Kamzor Ho Na, Hum Chale Nek Raste Se Hum Se, Bhool Kar Bhi Koi Bhool Ho Na…”. Pakiza is a sincere believer of ‘Good service to consumers is in by giving equal treatment to employees’.
Brand Communication Pakiza is very consistent in its brand communication. the primary message of Pakiza – “Aapka Hukm Sar Aankhon Par” meaning “At your Command” which also forms a part of the Pakiza logo (see exhibit 2) has been there since 1995. Commenting on customer orientation, Maqsood remarked, “Customer should direct the business. If customer is the king let the king command.” This brand positioning makes customers feel regal as it reads in Hindi, a local language in Indore. It encapsulates the Pakiza philosophy and brand
strategy “Customer Intimacy”. This trendy message communicates a clear and consistent brand image to the consumers. It fosters understanding the brand image and relating to it. It has become a critical component in building a base of loyal customers. However Pakiza has never made use of advertisement or PR for brand promotion unlike other competitors.
Pakiza has achieved this status of cult brand with absolutely no Media publicity. The only brand communication Pakiza has made use of in the last 33 years is word-of-mouth. One will find print and electronic ads for Pakiza, done only for announcing offers newly introduced. It has been successful in building an almost iconic brand without resorting to the traditional ways of brand building
Brand strategyPakiza is not the first to walk the talk. While there are a dozen other stores promising and delivering excellence, very few have been able to match Pakiza in consistency, and precision. Such a delivery requires commitment from everybody in the organization from the Chairman to the doorman. With such dedication on delivering the brand promises, it is not surprising that Pakiza has maintained a large loyal customer base that keeps coming back year after year. In the words of Maqsood, “There are customers who have relationship with Pakiza from the past thirty years. Their children who are now young also patronize Pakiza.” These and others who are brand loyal to Pakiza are referred to as “Pakiza Pearls”. Not surprising Pakiza pearls are given extra attention and special service.
Pakiza has based its success on five basic beliefs:
Personal touch and customer care
Respect the employees
Innovation
Non-institutional
Giving back to the society
Personal touch and customer care One of the biggest strengths of pop and mom stores is their ability to extend personal touch.
•
•
•
•
•
59
I n t e r n a t i o n a l J o u r n a l o f M a n a g e m e n t C a s e s
Small stores are natural in managing customer relationships. These stores are able to remember customer names and understand their need much better. Customers demonstrate their loyalty to such stores because they feel good while in store and are pampered by the staff and the owner himself. Pakiza wants to ensure that every customer gets special treatment and is made as comfortable as possible once s/he is in the store. Maqsood always emphasized on the importance of treating customers like guest when they are in the store,
“Devotion to customers is quite a routine at Pakiza. This has been practiced since the days of the bicycle workshop. Our customers are important to us, and we undertake many activities to make them realize this once they are inside the store. Every entrant is a special guest to us, be it a visitor or a window-shopper or a genuine customer. They get the same respect and treatment. We believe that these visitors and window-shoppers are potential salesmen and possibly potential customers of Pakiza.”
Gori brothers are very specific when it comes to customer shopping experience. For example Pakiza has an interesting canon called “Palm-Rolling Rule”. This rule entitles a customer an assistant at every stage of his shopping experience. Vehicles entering the parking area are handed over to the valet parkers who park and retrieve them. At the entrance, patrons are greeted by the ‘Guest Greeters’ with a warm smile and guided to the preferred floor. Every floor has additional Pakiza men to assist the customers locate the product and select one. Finally they are billed at the billing section and delivery of goods is given at the delivery section as they proceed to the parking area with a free popcorn pouch. Customers can choose from a variety of Indian and international brands at prices affordable to them.
Pakiza has an unconditional return policy. Returned merchandise is accepted on all days with an option of exchange or money back. Interestingly customer can return merchandise at any time. Pakiza has a “Asaan Vapasi Counter” (Trouble-Free Return Counter) right at the entrance, making it most convenient for the customer to return the merchandise if he is not completely satisfied. Pakiza has instructed its men that no customer with returnable merchandise will wait for more than 15 minutes from the time he is attended and till he gets a refund or an exchange. Further it is necessary to attend such customer quickly. One of
the most famous examples of Pakiza’s customer service occurred in 1992 when a customer was allowed to return the merchandise twelve years after its purchase and gladly given a refund. The customer had purchase a ‘Elpar’ brand cloth for his eight years old child in 1980. gori brothers always wanted their staff to be honest and focused. Saying ‘Thank you’ is compulsory both in deal and no deal situations.
Innovation Every employee at Pakiza is encouraged to try various ideas and is given complete liberty to test his instincts. Throughout the course of its 33 years history, Pakiza has been committed to its brand Philosophy of “Customer Intimacy” which has become a crucial strategy for customer retention. It has been vigorously experimenting with in-store free services making customer’s visit to Pakiza a delightful experience. One-way auto fare, popcorn, Chana-jor-garami, coffee, valet parking, Mehndij designs, weighing machine are entertaining customers while they shop at Pakiza. Pakiza understands that innovations are difficult to hide so new ideas are welcomed and tested regularly.
One-way auto fare: to reduce crowd during the peak hours, Pakiza introduced the concept of one-way auto fare. Under this scheme Pakiza pays the one-way auto fare for customers who will prefer to shop at Pakiza between 10:30 am and 4 pm on all days. Such a customer is supposed to pay the fare at first place and get a receipt of the amount at the entrance. This amount is automatically deducted from the bill once s/he is ready to leave.
Popcorn and chana-jor-garam: free 20 grams of popcorn and 15 grams of chana-jor-garam is fun for customers who visit Pakiza. Customers enjoy the fresh taste of butter-flavored popcorn and the tangy chana-jor-garam as they navigate through various sections.
Free coffee: free brewed coffee is another way of enjoying shopping at Pakiza. on an average 2400 cups (55ml) of coffee is consumed daily, all three stores combined. This figure further increase on weekends.
Valet parking: Valet parking at Pakiza is more about comfort and less about parking. This first impression ultimately adds to the total shopping experience at Pakiza. Valet parkers provide an
I n t e r n a t i o n a l J o u r n a l o f M a n a g e m e n t C a s e s
60
affectionate smile, a helping hand to open the door, park and retrieve the vehicle, politeness, an escort to the Pakiza entrance and a sincere ‘Thank you.’
Free mehndi designs: yet another attraction at Pakiza especially for the females is the grace of the mahendi artist. A Mahendi artist circled by female patrons waiting for their turn is a common scene at Pakiza. On an average 150 palms are decorated in a day. Applying mehndi offers a great opportunity to customer to reduce wait time and opportunity to Pakiza to leave a lasting impression.
Person weighing machine: Indian shoppers are not alien to the concept of coin-operated weighing machine. But patrons of Pakiza get this service absolutely free. Customers go amazed to see weighing machine with a bowl containing loose one-rupee coins. Coin bowl was placed after Pakiza noticed that customers desire to determine weight but do not have loose one-rupee coin.
Pakiza also runs a ‘Pakiza Tea Club’ where in the top management and staff gathers once a month to participate in an informal friendly chitchat. Participants are encouraged to share their experiences with customers, challenges faced and put forward ideas and suggestions that may improve work efficiency and customer satisfaction. Many service innovations at Pakiza are an outcome of the tea club discussions. A constant hunt for new ideas and continuous improvement in the existing ones has always helped Pakiza in giving the customer better and better. Speaking on innovation Maqsood said, “These are the small things that we keep doing to please our customer, it does come at an extra cost but the customers like it and generally reciprocate with repeat buying.”
Respect for the employees Pakiza respects its staff. Commenting on management and staff relationship Iqbal mentioned, “We are a team of ordinary, dedicated and likeminded people committed to customer service. My staff is first a human and then an employee of Pakiza.” Pakiza understands that a motivated employee is vibrant, energetic and loyal. Several activities are undertaken to keep the employees customer-focused. Having said this, lesser employee development practices at Pakiza is a fact.
Non-institutional Pakiza has a unique work atmosphere. Pakiza is not bogged down by too much of rules and conventions. Internal communication is not along the official hierarchy. An open diagonal communication prevails at Pakiza making it very convenient for everybody to talk freely with anyone in the organization. Access to the top authorities is rather easy. Hierarchies are flat and work style is informal. Everybody knows his/her job, how to do it and does it with all sincerity. Networking and human interactions are strong. Most of the managerial and other staff that Pakiza recruits is primarily people who have lesser college degrees, but fit in Pakiza’s work atmosphere. Maqsood added,
“We have people who are without self-interest and stubbornness that facilitates Pakiza’s philosophy of customer respect and service. There are less prescribed rules and procedures. Personalities and performances are given more importance than written documents describing set rules of doing things. Managers and staff have the power to decide when customer has a problem. This unique work culture has always enabled us to go beyond customer satisfaction.”
Giving back to the societyPakiza is passionate about giving back to the community. Pakiza has attempted to discharge its social responsibility in various ways. One example of how Pakiza gives back to the community is through the Pakiza charity. Two of the Pakzia staff are permanently placed at My Hospital, Indore and pays for the medicines of poor patients. Maharaja yashwantrao Hospital popularly known as My Hospital is a government owned hospital providing medical facilities and services at very nominal fees. Normally medicines are provided to the patients through hospital’s druggist store but at times when the medicines are costly or not in stock the patients are expected to procure them on their own from a private chemist shop. Pakiza takes care of medicine expenses of such patients, thus helping them live a ‘happier and healthier’ life. Pakiza also runs a charitable school named Ahmed Noor Memorial School. This school is open to all and free. Good acts seldom go unnoticed. Pakiza dislikes making social acts public, however society does acknowledge them and such acts ultimately add to the overall Pakiza brand image.
61
I n t e r n a t i o n a l J o u r n a l o f M a n a g e m e n t C a s e s
SWOT
Strengths
Strong brand: Pakiza has earned a reputation in the market for quality merchandise at affordable price and excellent customer service. It has established itself as a brand in retailing and thus has a strong base of loyal customers.
Local player: Pakzia has the benefit of being a local player. One of Pakiza’s internal strengths is its early experience in the Indore market. It is into the retailing business since 1975. It has a good reading of local consumer’s mindset and behavior than any other player. It has a vast 33 years of retailing experience. It was the first to introduce the concept of ‘family shopping’ in Indore.
Skillful leaders: Pakiza has a team of skilled leaders. They may not have high-level education or professional degrees but are very proficient in their respective fields. They have a blend of attributes requiring creativity, decisiveness, flexibility and stress tolerant.
Goodwill: Pakiza is one of the largest retailers in Madhya Pradesh. It has a good control over suppliers and enjoys goodwill amongst stakeholders and general public. Pakiza has strong vendor relations coupled with credibility benefits of emergency replenishment, lower prices, credit and buyback facilities. Pakiza is known for its prompt payment of bill.
Family business: Pakiza is a family owned business. Majority of the higher positions are occupied by the family members. This overrules the prevalence of uncertainty of trust and there is a natural propensity to shield the company and ensure that it flourishes. This has enabled to further strengthen the family relations through strong family values and open communication.
High conversion rate: Conversion ratio is very high at Pakiza. It is noted that actual conversions of footfall into sales for Pakiza is about 90-95%.
Weaknesses
Family business: While family business can be strength, it can also be a weakness. Effects of family problems are seen on business performance. Able employees may never get a chance to climb the top management cadre leaving them demoralized
as they sometimes may see the non-deserving family members at the helm.
Less focus on HRM: Over the years while the focus on customer has increased, unfortunately employees at Pakiza have failed to get the required attention. This has resulted in significant staff turnover, which in turn has raised the recruitment and training cost. Value of effective human resource management is undisputed. Good personnel are needed to carry out retail strategies and good HRM is needed to retain them. As said earlier Pakiza is doing everything to please its employee force however a stable HRM is needed to instill professionalism in them.
Slow growth: Pakiza has seen a steady growth in the past, but this growth has been slow considering the span of 33 years in operation. A simple comparison between Pakiza Retail Private Limited with Pantaloon Retail (India) Limited validates this. Pantaloon Retail (India) Limited launched in october 1987, operates over 10,000,000 square feet of retail space, has over 1,000 stores across 61 cities in India and employs over 30,000 people. Some of its leading retail formats include Pantaloons, Big Bazaar, Central, Food Bazaar, Home Town, eZone, Depot, Future Money and online retail format.1 Considering these figures the growth of Pakiza seems rather slow.
Opportunities
E-retailing: Internet is extensively used today to sell goods and services. There are over 35 million active Internet users in India and only few thousand e-commerce sites.2 ‘Time-Poverty’ consumers will continue buying via Internet. The Internet is fast catching up as an alternative channel. It is expected to grow at a CAGRk of 79 percent to Rs 2300 crore this year.3 With increasing population of middle-class, their growing purchasing power and the growth in the use of credit and debit cards e-retailing will be unavoidable.4
Rural-retailing: Rural-retailing provides increased potential for long-term success. India has a huge rural population. 70 % of India’s population lives in 627000 villages in rural areas, there are almost twice as many ‘lower middle income’ households in rural areas as in the urban areas.5 Quite a few companies are already experimenting with this kind of retailing. ITC has started “Chaupal Sagar” – the first rural mall, a one-stop family store for rural
I n t e r n a t i o n a l J o u r n a l o f M a n a g e m e n t C a s e s
62
consumers. DCM Sriram group’s “Hariyali Bazar” offers agriculture related goods and services.
The Godrej group has launched “Adhaar” an ‘agri-store’ that sells fertilizers & animal feed to farmers along with ‘agri-consultancy’.6 HLL’s project Shakati, Mahamaza.com has stretched its tentacles to remote corners of the country, DSCL’s Hariyali Kisan Bazar and Biyani’s Aadhar are other existing player. Reliance has plans to start rural-business-hubs (RBH) which will provide farm input, food, grocery, consumer durables, and financial and health services. It will also provide farmers a platform to sell their produce, an equivalent of village haat. A community hall and entertainment facilities will form part of the hub.7 Led by the rising purchasing power, changing consumption patterns, increased access to information and communication technology and improving infrastructure, rural retail market is estimated to cross uS$ 45.32 billion mark by 2010 and uS$ 60.43 billion by 2015, according to a study by the Confederation of Indian Industry (CII) and yES Bank.8
Semi-urban retailing: Semi-urban retailing is another hot sector. India will see a growth of organized retailing in semi-urban and rural areas in the next 10 years. Organised retailing, which is limited to metros and ‘A’ class cities, is likely to become a feature of semi-urban and rural areas where disposable income is increasing.9
Shoppertainment: The idea of entertainment and shopping has been well received by consumers across the country. Entertainment and shopping complement each other.
Threats
Competition: Pakiza has a very active and rigorous competition. There is extreme rivalry in the retail industry. Today it is faced with never-seen-before competition in retail industry. There are more than 10 other departmental stores operating in the city that Pakiza competes with. There is always a threat of new competition as there are new chains developing from time to time in the industry. The construction of several new shopping malls like the Treasure Island, Mangal City, Orbit, M2K Mega Mall , Cine Mall, Indore Center and the C21 Mall (10 Floor Mall) has imposed new challenges to Pakiza. Multiplex chains like PVR, INOX, IMAX, Adlabs, Velocity have apparently brought a new vigor in the Indore market. PRIL’s Big Bazzar,
Pantaloon, Food Bazaar, with innovative offers aims to capture a larger pie of the market. Reliance Fresh has already made its foray in major parts of the city. Vishal Mega Mart and Apoorti are on the look out for expanding their domain. Then there are several mom and pop stores besides the traditional bazaars with numerous retail outlets.
Pakiza will also have to keep in mind the future competition. EWDP has planned to launch the Treasure Market City, Largest Indoor Family Entertainment Centre which will include an Indoor Roller-coaster, Drop tower, go-karting and 4D Cinema at MR10 Road, NH3, Indore with a total retail space of 3,684,000 sq ft.10 kishore Biyani of PRIL is determined to have 3000 new stores by 2010. Biyani’s next call is ‘Small Bazaar’, these non-AC, basic format stores will offer limited stock-keeping units with massive discounts. The group plans to set up 1500 stores over 18 months across top cities.11 A number of global retailers, including Wal-Mart, planned to enter the Indian market if and when the Indian government decided to allow foreign direct investment (FDI) in the retail sector. 12
Present Indian Retail Scenario
India retail industry is the largest and the fastest growing industry in India, with an employment of around 8% and contributing to over 10% of the country’s GDP. 13 The Indian retail market is literally on the go. The share of retail trade in the country’s gross domestic product is likely to reach 22 per cent by 2010. 14 the retail business in india is estimated to grow at 13 per cent per annum from US $ 322 billion in 2006-07 to US $ 590 billion in 2011-12. The unorganized retail sector is expected to grow at about 10 per cent per annum from US & 309 billion 2006-07 to uS $ 490 billion in 2011-12. Organized retail which now constitutes a small 4 per cent of retail sector in 2006-2007 is likely to grow at 45-50 per cent per annum and quadruple it share of total retail trade to 18 per cent by 2011-12. 15
As per estimates, there are over 200 retail mall projects under construction or under active planning stage spanning over 25 cities, translating into over 25 million sq. ft. of new retail space within the next 24 months. organized retailing will slowly penetrate the second rung and the smaller towns, which will catapult the growth rate for the sector.16 Says Simon Bell of AT Kearney, “Though doubts
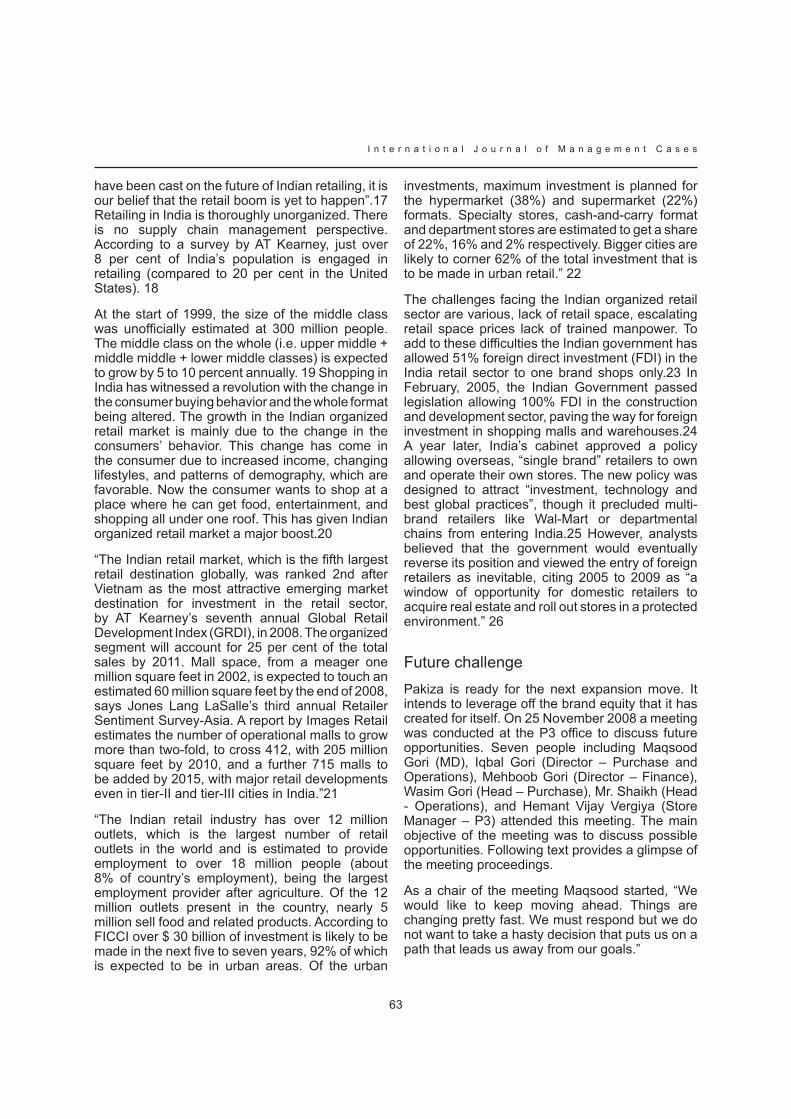
63
I n t e r n a t i o n a l J o u r n a l o f M a n a g e m e n t C a s e s
have been cast on the future of Indian retailing, it is our belief that the retail boom is yet to happen”.17 Retailing in India is thoroughly unorganized. There is no supply chain management perspective. According to a survey by AT Kearney, just over 8 per cent of india’s population is engaged in retailing (compared to 20 per cent in the United States). 18
At the start of 1999, the size of the middle class was unofficially estimated at 300 million people. The middle class on the whole (i.e. upper middle + middle middle + lower middle classes) is expected to grow by 5 to 10 percent annually. 19 Shopping in India has witnessed a revolution with the change in the consumer buying behavior and the whole format being altered. The growth in the Indian organized retail market is mainly due to the change in the consumers’ behavior. This change has come in the consumer due to increased income, changing lifestyles, and patterns of demography, which are favorable. Now the consumer wants to shop at a place where he can get food, entertainment, and shopping all under one roof. This has given Indian organized retail market a major boost.20
“The Indian retail market, which is the fifth largest retail destination globally, was ranked 2nd after Vietnam as the most attractive emerging market destination for investment in the retail sector, by AT Kearney’s seventh annual Global Retail Development index (gRDi), in 2008. the organized segment will account for 25 per cent of the total sales by 2011. Mall space, from a meager one million square feet in 2002, is expected to touch an estimated 60 million square feet by the end of 2008, says Jones Lang LaSalle’s third annual Retailer Sentiment Survey-Asia. A report by Images Retail estimates the number of operational malls to grow more than two-fold, to cross 412, with 205 million square feet by 2010, and a further 715 malls to be added by 2015, with major retail developments even in tier-II and tier-III cities in India.”21
“The Indian retail industry has over 12 million outlets, which is the largest number of retail outlets in the world and is estimated to provide employment to over 18 million people (about 8% of country’s employment), being the largest employment provider after agriculture. Of the 12 million outlets present in the country, nearly 5 million sell food and related products. According to FICCI over $ 30 billion of investment is likely to be made in the next five to seven years, 92% of which is expected to be in urban areas. Of the urban
investments, maximum investment is planned for the hypermarket (38%) and supermarket (22%) formats. Specialty stores, cash-and-carry format and department stores are estimated to get a share of 22%, 16% and 2% respectively. Bigger cities are likely to corner 62% of the total investment that is to be made in urban retail.” 22
The challenges facing the Indian organized retail sector are various, lack of retail space, escalating retail space prices lack of trained manpower. To add to these difficulties the Indian government has allowed 51% foreign direct investment (FDI) in the India retail sector to one brand shops only.23 In February, 2005, the Indian Government passed legislation allowing 100% FDI in the construction and development sector, paving the way for foreign investment in shopping malls and warehouses.24 A year later, India’s cabinet approved a policy allowing overseas, “single brand” retailers to own and operate their own stores. The new policy was designed to attract “investment, technology and best global practices”, though it precluded multi-brand retailers like Wal-Mart or departmental chains from entering India.25 However, analysts believed that the government would eventually reverse its position and viewed the entry of foreign retailers as inevitable, citing 2005 to 2009 as “a window of opportunity for domestic retailers to acquire real estate and roll out stores in a protected environment.” 26
Future challengePakiza is ready for the next expansion move. It intends to leverage off the brand equity that it has created for itself. on 25 November 2008 a meeting was conducted at the P3 office to discuss future opportunities. Seven people including Maqsood gori (MD), iqbal gori (Director – Purchase and operations), Mehboob gori (Director – Finance), Wasim gori (Head – Purchase), Mr. Shaikh (Head - Operations), and Hemant Vijay Vergiya (Store Manager – P3) attended this meeting. the main objective of the meeting was to discuss possible opportunities. Following text provides a glimpse of the meeting proceedings.
As a chair of the meeting Maqsood started, “We would like to keep moving ahead. Things are changing pretty fast. We must respond but we do not want to take a hasty decision that puts us on a path that leads us away from our goals.”
I n t e r n a t i o n a l J o u r n a l o f M a n a g e m e n t C a s e s
64
In an involved discussion two future actions were felt worth considering and were supported by most: moving to the semi-urban market with a new standard business model and second introducing shoppertainment at the P2 and P3. About fifty percent of the participants including the senior Gori members preferred going with the first option, whereas the remaining felt that shoppertainment (shopping and entertainment under one roof) made more sense. The idea of opening any additional mall in Indore was ruled out for saturation reasons.
Iqbal commented, “Pakiza has an image of a departmental store for a customer who values service, quality and reasonable prices. Let us move forward with the same to the semi-urban markets of Madya Pradesh. We do not want to confuse the customers. We want to sustain the brand image that Pakiza has for the last so many year. Let us offer a wider brand portfolio and a demographically designed product range to lure customers.”
Mehboob added, “Cities are saturated with retailers, we could prosper in towns that the others have ignored. However, considering a semi-urban market a clothing store for men and women will be profitable and not a departmental store concept. In fact, we should bank on low-price private label brands. We do have buying power, operational efficiency certainly needs a thought.”
The battle was going to go long. Wasim argued, “The Indian customers’ idea about retailing is changing as also their shopping behavior. Today’s customers want fun as they shop. One of the important reasons behind growing walk-ins at majority of malls in Indore is their entertainment feature.”
Hemant Vijay Vargiya raised a specific point: “I am concerned about the man power requirement in case we consider a move to the semi-urban. An expansion strategy of such a nature will require a system in place. I suspect that we will have to work very diligently to get the right personnel; there is
a dearth of skilled people in retailing. Besides role of supply chain management and inventory management cannot be overlooked.”
Iqbal was of the opinion: “Pakiza is recognized as a departmental store. A smaller version of this with an area not more than 20,000 sq. ft. managed by 20 staff will protect the Pakiza brand.” Senior Gori members wish to try the less competitive markets, what is called as the Blue Ocean Strategy, rather than risk countering the big competitor in cities. They believed that semi-urban is dominated by the traditional bazaars thus a modern organized retailing will be welcomed. Iqbal said, “we call it value innovation because instead of focusing on beating the competition, you focus on making the competition irrelevant by creating a leap in value for buyers and your organization thereby opening up new and uncontested market space.”
Shoppertainment plan included starting a restaurant and an amusement nook at P2 and P3. As an expansion strategy catering to the semi-urban markets, it was suggested by the senior Gori members to begin with two specialty stores in clothing for men, women and children with an area not more than 3000 sq. ft. and maximum staff of 10 people each at Dewas and Ujjain. If this strategy is succeeded more towns were to be considered. However, the idea of smaller version of multi-brand departmental stores is not completely ignored. One member also pointed out the need for a books and music section in the present departmental stores.
Maqsood concluded, “We do not wish to compete with any body. We just want to be there. We want to provide job security to our employees who have been serving us from the last so many years and continue serving our customers and the society.” Both sides have agreed to operate temporarily under a “yellow Flag” plan. (Each side continues to operate as before)
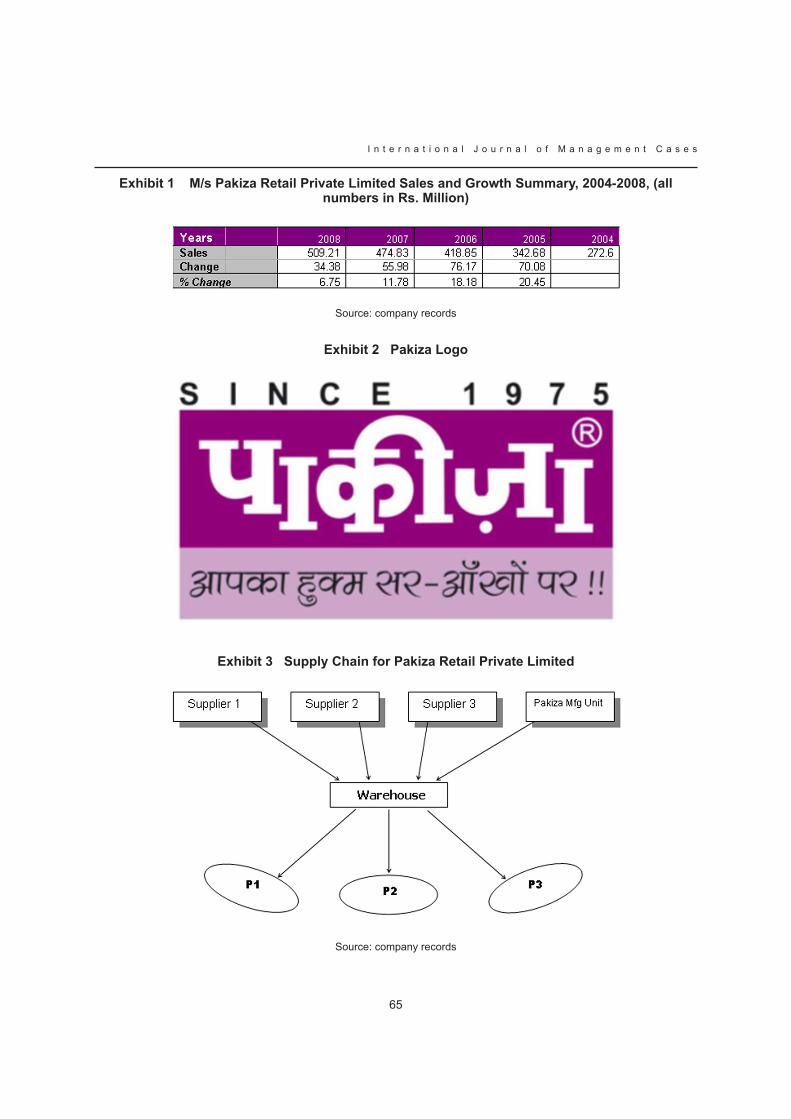
65
I n t e r n a t i o n a l J o u r n a l o f M a n a g e m e n t C a s e s
Exhibit 1 M/s Pakiza Retail Private Limited Sales and Growth Summary, 2004-2008, (all numbers in Rs. Million)
Source: company records
Exhibit 2 Pakiza Logo
Exhibit 3 Supply Chain for Pakiza Retail Private Limited
Source: company records
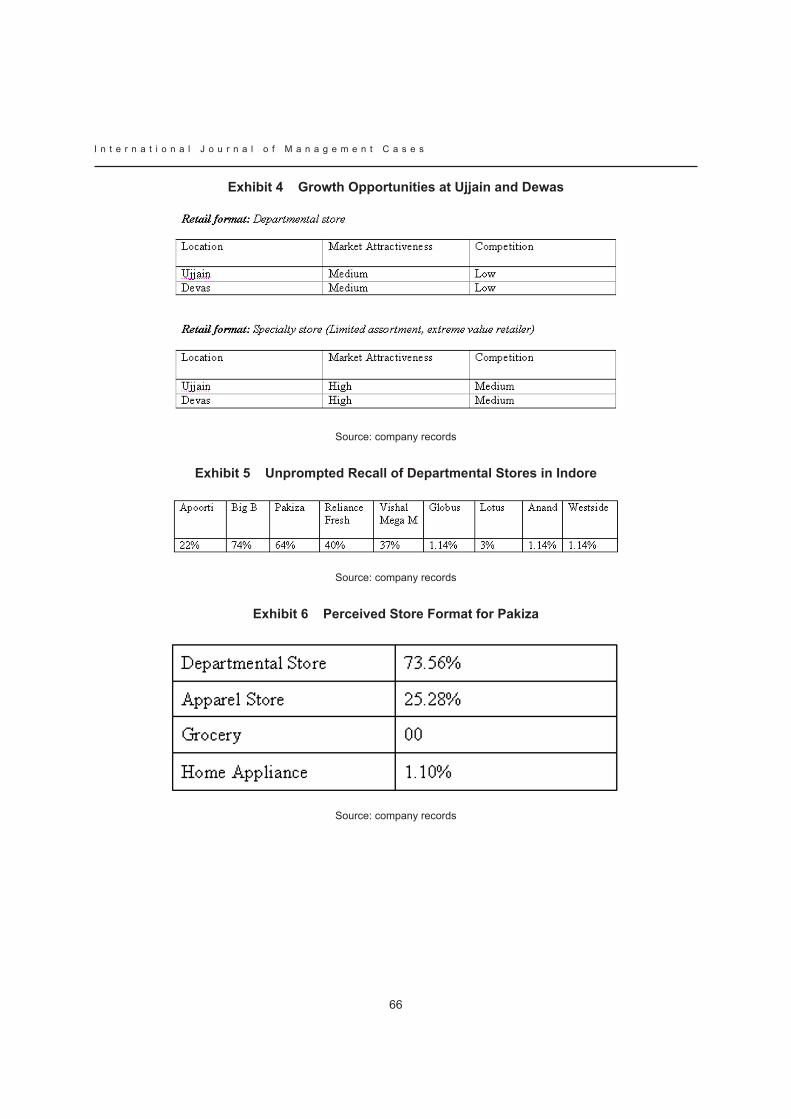
I n t e r n a t i o n a l J o u r n a l o f M a n a g e m e n t C a s e s
66
Exhibit 4 Growth Opportunities at Ujjain and Dewas
Source: company records
Exhibit 5 Unprompted Recall of Departmental Stores in Indore
Source: company records
Exhibit 6 Perceived Store format for Pakiza
Source: company records
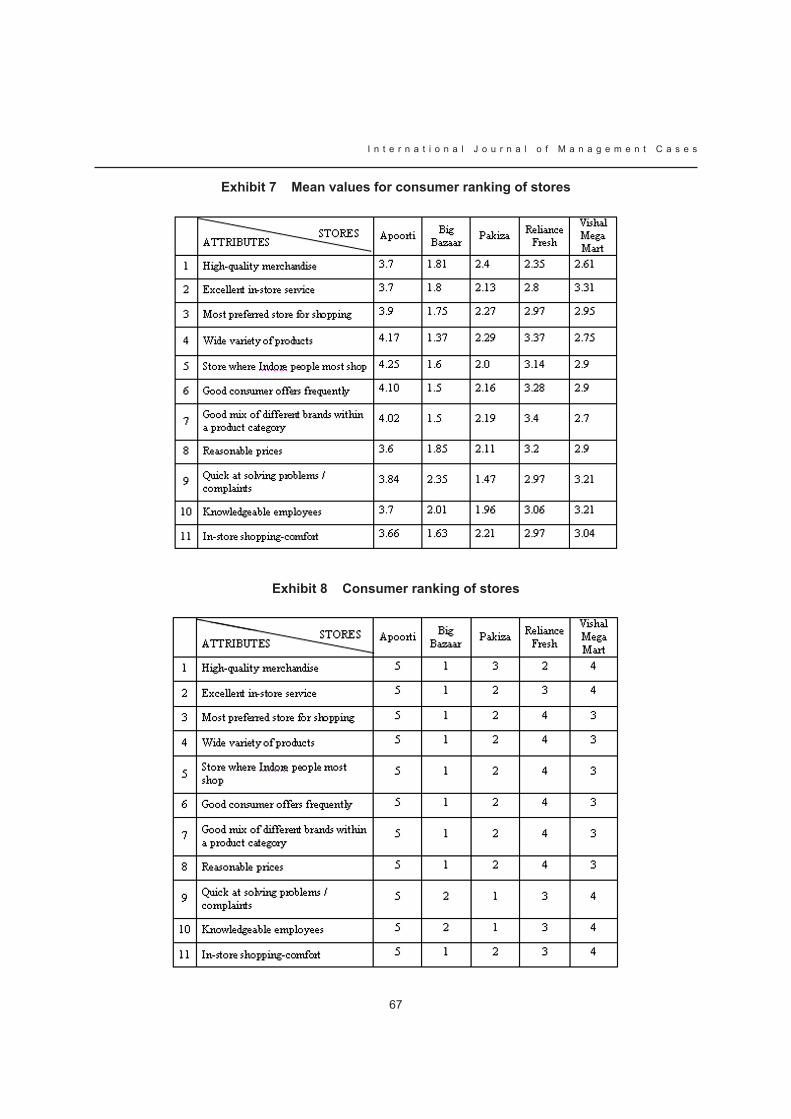
67
I n t e r n a t i o n a l J o u r n a l o f M a n a g e m e n t C a s e s
Exhibit 7 Mean values for consumer ranking of stores
Exhibit 8 Consumer ranking of stores
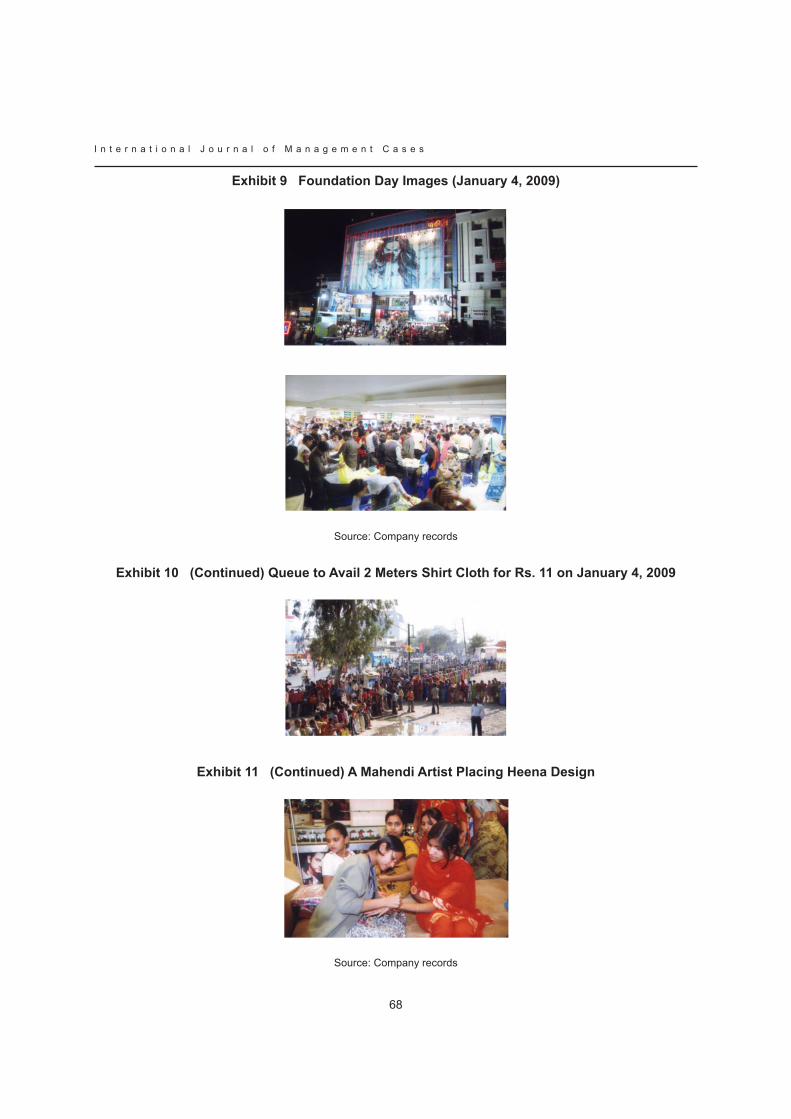
I n t e r n a t i o n a l J o u r n a l o f M a n a g e m e n t C a s e s
68
Exhibit 9 foundation Day Images (January 4, 2009)
Source: Company records
Exhibit 10 (Continued) queue to Avail 2 Meters Shirt Cloth for Rs. 11 on January 4, 2009
Exhibit 11 (Continued) A Mahendi Artist Placing Heena Design
Source: Company records
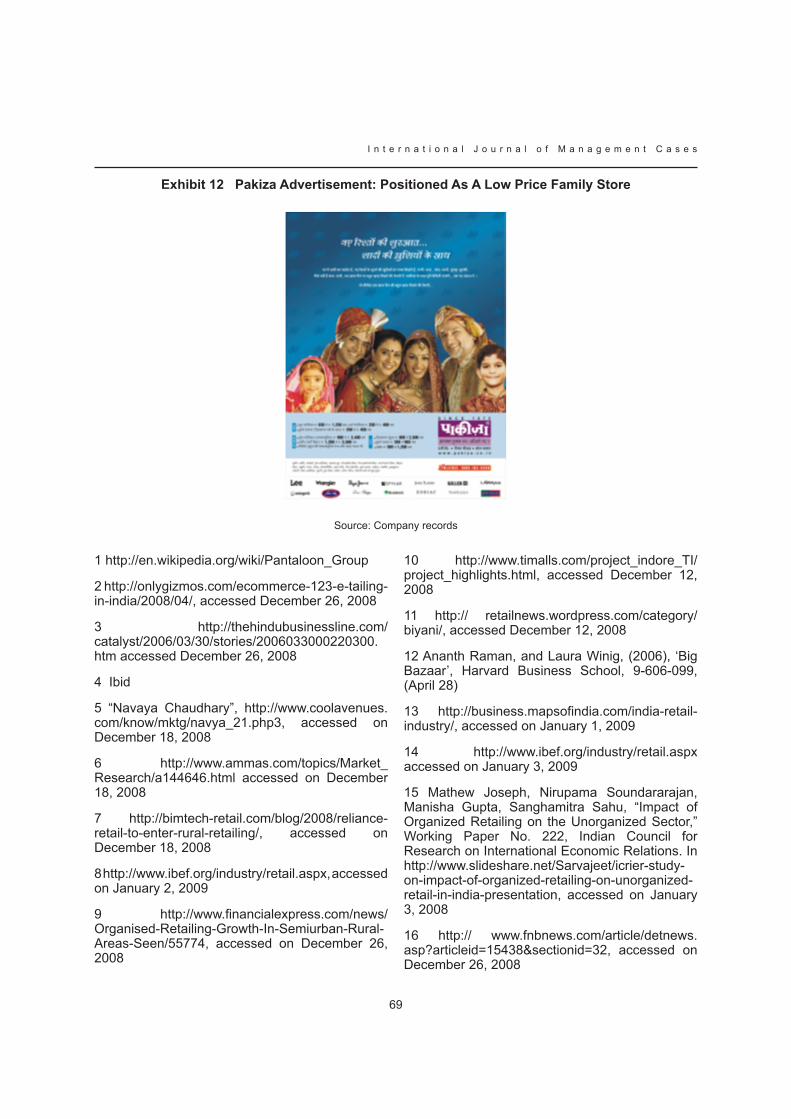
69
I n t e r n a t i o n a l J o u r n a l o f M a n a g e m e n t C a s e s
Exhibit 12 Pakiza Advertisement: Positioned As A Low Price family Store
Source: Company records
1 http://en.wikipedia.org/wiki/Pantaloon_Group
2 http://onlygizmos.com/ecommerce-123-e-tailing-in-india/2008/04/, accessed December 26, 2008
3 http://thehindubusinessline.com/catalyst/2006/03/30/stories/2006033000220300.htm accessed December 26, 2008
4 ibid
5 “Navaya Chaudhary”, http://www.coolavenues.com/know/mktg/navya_21.php3, accessed on December 18, 2008
6 http://www.ammas.com/topics/Market_Research/a144646.html accessed on December 18, 2008
7 http://bimtech-retail.com/blog/2008/reliance-retail-to-enter-rural-retailing/, accessed on December 18, 2008
8 http://www.ibef.org/industry/retail.aspx, accessed on January 2, 2009
9 http://www.financialexpress.com/news/Organised-Retailing-Growth-In-Semiurban-Rural-areas-Seen/55774, accessed on December 26, 2008
10 http://www.timalls.com/project_indore_TI/project_highlights.html, accessed December 12, 2008
11 http:// retailnews.wordpress.com/category/biyani/, accessed December 12, 2008
12 Ananth Raman, and Laura Winig, (2006), ‘Big Bazaar’, Harvard Business School, 9-606-099, (april 28)
13 http://business.mapsofindia.com/india-retail-industry/, accessed on January 1, 2009
14 http://www.ibef.org/industry/retail.aspx accessed on January 3, 2009
15 Mathew Joseph, Nirupama Soundararajan, Manisha Gupta, Sanghamitra Sahu, “Impact of Organized Retailing on the Unorganized Sector,” Working Paper No. 222, Indian Council for Research on International Economic Relations. In http://www.slideshare.net/Sarvajeet/icrier-study-on-impact-of-organized-retailing-on-unorganized-retail-in-india-presentation, accessed on January 3, 2008
16 http:// www.fnbnews.com/article/detnews.asp?articleid=15438§ionid=32, accessed on December 26, 2008
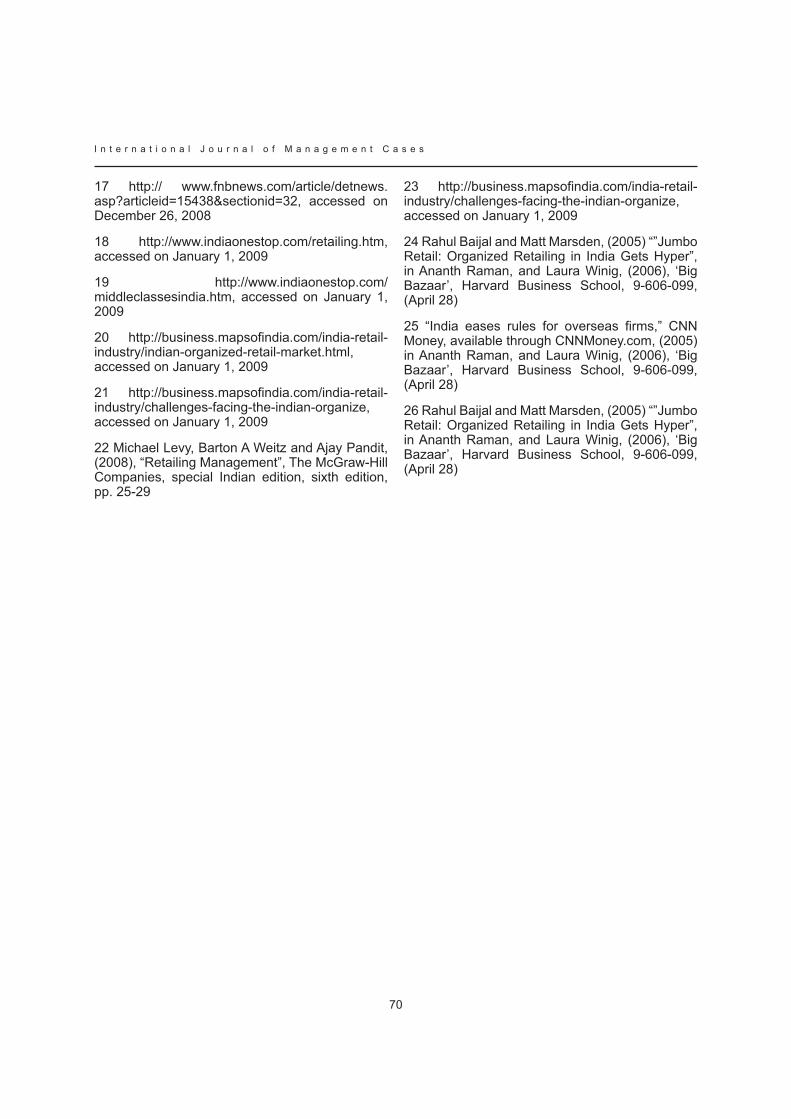
I n t e r n a t i o n a l J o u r n a l o f M a n a g e m e n t C a s e s
70
17 http:// www.fnbnews.com/article/detnews.asp?articleid=15438§ionid=32, accessed on December 26, 2008
18 http://www.indiaonestop.com/retailing.htm, accessed on January 1, 2009
19 http://www.indiaonestop.com/middleclassesindia.htm, accessed on January 1, 2009
20 http://business.mapsofindia.com/india-retail-industry/indian-organized-retail-market.html, accessed on January 1, 2009
21 http://business.mapsofindia.com/india-retail-industry/challenges-facing-the-indian-organize, accessed on January 1, 2009
22 Michael Levy, Barton A Weitz and Ajay Pandit, (2008), “Retailing Management”, the Mcgraw-Hill Companies, special Indian edition, sixth edition, pp. 25-29
23 http://business.mapsofindia.com/india-retail-industry/challenges-facing-the-indian-organize, accessed on January 1, 2009
24 Rahul Baijal and Matt Marsden, (2005) “”Jumbo Retail: Organized Retailing in India Gets Hyper”, in Ananth Raman, and Laura Winig, (2006), ‘Big Bazaar’, Harvard Business School, 9-606-099, (april 28)
25 “India eases rules for overseas firms,” CNN Money, available through CNNMoney.com, (2005) in Ananth Raman, and Laura Winig, (2006), ‘Big Bazaar’, Harvard Business School, 9-606-099, (april 28)
26 Rahul Baijal and Matt Marsden, (2005) “”Jumbo Retail: Organized Retailing in India Gets Hyper”, in Ananth Raman, and Laura Winig, (2006), ‘Big Bazaar’, Harvard Business School, 9-606-099, (april 28)
71
I n t e r n a t i o n a l J o u r n a l o f M a n a g e m e n t C a s e s
ORGANIC FOOD MARKETING IN CROATIA – PRoDuceR’S PeRSPectiVe
NATAšA RENKOUNIVERSITy OF ZAGREB, CROATIA
aNte VuletićUNIVERSITy OF ZAGREB, CROATIA
Ružica ButigaNUNIVERSITy OF ZAGREB, CROATIA
Abstract
Purpose: The concept of sustainable development is present for decades in the global agriculture and the modern man is more and more aware of the impact of the quality of food on his health and overall quality of life. However, Croatia has only about 300 farmers who define their production as organic, despite the significant price premium on such products. Given the growth of organic food production in Europe and the existing possibilities for the development of Croatian organic food markets, but also the fact that Croatia’s organic food manufacturers marketing knowledge is limited and so marketing of their products is almost completely undeveloped, the application of marketing will have a key role in its development. The aim of this paper is to determine the state of the organic food marketing in Croatia and problems present from producers’ perspective, as well as indentify its development potential, direction and dynamics. The role and impact of government and regulation is also to be indentified and analyzed, with special concern on Croatia joining the European Union.
Methodology: Methodology which was used in this paper is based on secondary (desk) and primary (field) research. Within the framework of secondary research, the relevant domestic and foreign literature with the topic of consumer behaviour, marketing strategy, competitive advantage, organic agriculture and sustainable development was used.
Within the framework of primary research, the method of in-depth interviews with officially certified producers of the organic food in Croatia was applied. The interview is divided into 3 major sections: production process itself, 4Ps (product,
price, promotion, place) and development forecast.
Key words: organic food, Croatia, marketing, sustainable development
IntroductionThesis that the overall economic development strategy for Croatia should be based on two industries: tourism and agriculture is generally accepted.
Within the agriculture, relatively new field is emphasized - organic agriculture. The need for food is primary and undoubtedly a political issue as well as the goal of every state is to meet the larger part of its needs with its own production. In the race for the greater volume and effectiveness of food production, conventional agriculture’s impact on environment and food contamination is often forgotten. Conventional farming uses large number of inputs: machinery, artificial fertilizers, various chemical preparations in the form of herbicides, pesticides and insecticides, and genetically modified organisms.
Ecological agriculture strives for minimum number of inputs. Two basic ideas of ecological agriculture are use of renewable resources and sustainable development.
Great interest for this type of agricultural production in Croatia is a result of several factors. Some of them are large areas with soil suitable for organic production, low environment pollution, linking agriculture and tourism, improving the overall tourist offer, increased concern for consumer
I n t e r n a t i o n a l J o u r n a l o f M a n a g e m e n t C a s e s
72
health, and increasing importance of renewable resources in the global environment.
Mentioned reasons are just starting point for the quality development of organic agriculture. The most important factor for the development of organic agriculture is the market itself. And while consumer as the „sovereign“ of the modern market is often being in focus of scientific research, producers as starting-point of supply-demand process are usually overseen when non-technological scientific research is in scope.
Agriculture in CroatiaCroatia has a total of 1.2 million hectares of agricultural land. About 1 million hectares of this is cultivated and the remainder consists of pastures, moors, reeds and fish farms. 81.5% of cultivated land and a little more than 80% of the total livestock is privately owned.
According to the List of agriculture from 2003, the average size of agricultural land is 1.07 hectares out of which 84% is owned by family rural economies, while corporate subjects own 16%.
From data entered in the Register of rural economies of the Ministry of agriculture, forestry, and water management for 2003 follows that the total surface of agricultural land is 849.549 ha, which is approximately 79% of total agricultural land.
It is important to note that Croatia, despite a significant production potential, is still a net importer of food. Comparison of growth rate of export, import and trade balance in the last two four-year periods (2000.-2003 and 2004.-2007) shows that the growth rate of export of agro-food products was 87.3%, while import grew at a rate of 85.0%.
Similarly, the average degree of coverage of import by export of agri-food products last ten years has always been higher than the average for other products.
The most important export destinations in 2007. were the markets of neighboring countries: Bosnia and Herzegovina (32%), Italy (16%), Slovenia (9%), Serbia (6%), and the market of Japan (5%),
because of tuna export. The structure of import of agricultural and food products by the countries of origin is dominated by European countries: Italy (12%), Germany (11%), Hungary (7%) and Netherlands (7%) from which Croatia imports more than one third of total value of imported products.
The family rural economies in Croatia own on an average 2.9 ha. Only 2.6 % out of total number of economies own over 10 ha of land surface. The family economies are poorly rational and inadequately equipped, and they can hardly provide high-quality production for the market, as shown in Table 1.
The desire for acceptance of new knowledge and technologies is weakly expressed. The joint co-operative marketing is not developed. The old socialist farm cooperatives were established on coercive principle, not organized in terms of marketing, and new market associations have not been established at all. It is necessary to create IT system which will help family economies in restructuring agricultural production and creating such production units which will produce for certain market segment and satisfy in terms of quality and quantity, price, assortment, packaging, and optimum distribution channels according to consumers’ requests and desires. Development of family economies in Croatia can be carried out only by way of adaptation of family economies to the new market economic system, by keeping up with new technologies and acquiring new knowledge, and especially marketing skills.
Organic food market in CroatiaIn extensive research conducted in English and Danish market following factors were positively associated with increased demand for organic food :
Increase in the available income,
Longer life,
Higher level of education,
Presence of children younger than 15 years,
Higher level of urbanization.
•
•
•
•
•
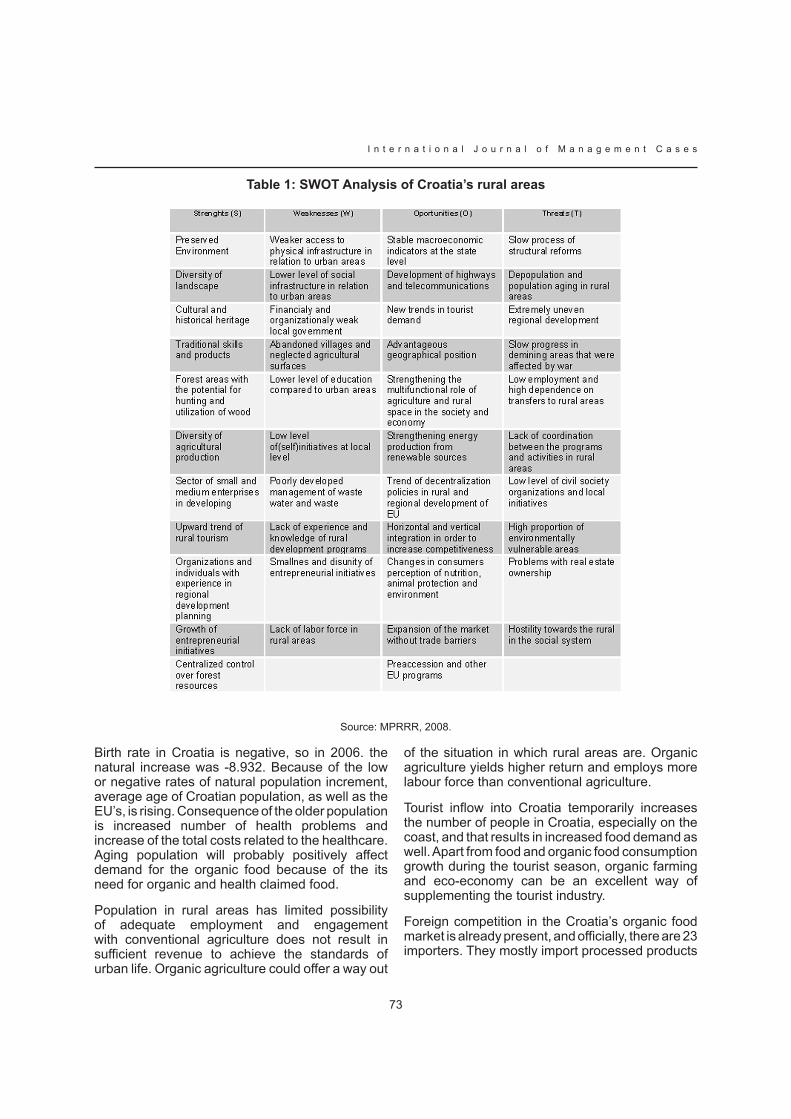
73
I n t e r n a t i o n a l J o u r n a l o f M a n a g e m e n t C a s e s
Table 1: SWOT Analysis of Croatia’s rural areas
Source: MPRRR, 2008.
Birth rate in Croatia is negative, so in 2006. the natural increase was -8.932. Because of the low or negative rates of natural population increment, average age of Croatian population, as well as the EU’s, is rising. Consequence of the older population is increased number of health problems and increase of the total costs related to the healthcare. Aging population will probably positively affect demand for the organic food because of the its need for organic and health claimed food.
Population in rural areas has limited possibility of adequate employment and engagement with conventional agriculture does not result in sufficient revenue to achieve the standards of urban life. Organic agriculture could offer a way out
of the situation in which rural areas are. Organic agriculture yields higher return and employs more labour force than conventional agriculture.
Tourist inflow into Croatia temporarily increases the number of people in Croatia, especially on the coast, and that results in increased food demand as well. Apart from food and organic food consumption growth during the tourist season, organic farming and eco-economy can be an excellent way of supplementing the tourist industry.
Foreign competition in the Croatia’s organic food market is already present, and officially, there are 23 importers. They mostly import processed products

I n t e r n a t i o n a l J o u r n a l o f M a n a g e m e n t C a s e s
74
and market them thru through supermarkets and health food stores.
There is no data on the organic food exports from Croatia.
Fact that one of Croatia’s leading retail chains Kerum has share of organic products in total sales of 1% is more than indicative . There is no data on share of organic food products in the sale of other retailers. Most of the organic food offered in supermarkets is of foreign origin, but strategic goal expressed in the Strategy for the development of ecological agriculture is that total area under organic production in Croatia occupies 10% of the total arable area by the year 2010.
Motives for switching to organic production Most frequent motives for switching to organic production are divided into few categories :
Ideological reasons (concern about the protection of nature and environment, concern for others’ health and for the upcoming generations, cutting dependence to the multinational companies that produce seeds and plant protection products...)
Social reasons (desire to return the dignity to the rural population and encouraging sustainable development of rural areas)
Health reasons (fear of the danger of poisoning with pesticides treated products, the risk of pesticide residues in food or the desire for better and more tasteful food)
Economic reasons (such as higher prices usually achieved for organic products, increasing demand for such products, more lucrative production due to better cost and profit ratio, possible incentives)
Producers are often in great doubt when considering such a change because of the uncertainty of volume of production process modifications that they will have to conduct. It is important to gather as much information as possible about the very methods of organic agriculture and to be familiar with the problems that may occur in the period of adaptation. It is recommended that prior to complete redirection, economy tries some of the often used agro technical measures, such as mixed culture
•
•
•
•
of planting, nonchemical weed control and use of simple weaponry such as hoes and so on. Such tests can facilitate the decision-making process and allow manufacturers to adopt completely some new or rarely used techniques. Great effort should also be in potential market and distribution channels analysis. In order to achieve a higher price for such products, many manufacturers choose to add value by further processing and their own sales. Contracts with hotels, restaurants or “health food” shops may be of key importance for the success of redirected economy.
The time it takes to redirect the economy to organic production method is called diversion period. It usually lasts between one and three years, depending on previous management, state of soil, number of cultures, cattle. It is not possible to switch immediately from conventional to organic production. Transition period from conventional to organic production during which the soil has to refine from previously used chemicals is necessary.
One of the major shortcomings when speaking about of organic agriculture is higher price of ecological products. General accepted public opinion is that the price of organic products is unreasonably high, which largely affects (un)willingness of consumers to buy such products. Current trend of constant decline of purchasing power may represent a very important issue when planning production and sales of organic products. Fact is that organic products are sometimes more expensive than conventional. On the other hand, situation in which, due to various reasons (insufficient incentives for organic production, reduced yields, insufficient market demand...), price of organic products, especially when bought directly from the manufacturer, is almost equal to that of industrial or conventional origin is very common in Croatia.
There is no general rule by which the costs of organic production are higher than those in conventional, but they do depend on many factors, primarily on supply and demand. It should be noted that the final retail price does not tell anything about what is the dealer’s part of it. The case is very often that merchants and agents, not the manufacturers themselves, take the maximum profit cut. According to this, it is obviously more profitable to bypass intermediaries and sell the products directly to interested consumers whenever possible. This channel creates a win-win scenario for both consumers and producers-
75
I n t e r n a t i o n a l J o u r n a l o f M a n a g e m e n t C a s e s
retailers, for one side because of lower price paid, for the other because of higher profit achieved.
Figures shown in Table 2 show that Croatia is still at the very bottom of the world’s organic production with approximately 0.11% of area under organic production in total agricultural area.
Organic farming is very important part of production for a large number of EU member states, and that part is constantly increasing. Much attention is given to general validity and food safety in the EU.
The main aspect of this new approach is the definition of requirements for food safety for humans and animals, the responsibility of all participants throughout the food chain, the system of official supervision and control on the ground of independent scientific opinion on risk assessment and the consumers’ food choices based on comprehensive information about its origin and composition. It is necessary to harmonize Croatia’s legislation with the EU, in order to regulate the area of food safety in order to achieve a higher level of protection of human life and health, consumers’ interests and overall food market liberalization.
ResearchWithin the framework of primary research, survey sample included three officially certified organic food producers. All of them were family economies, as 84% of croatia’s farms, and therefore the sample is indicative. Method of in-depth interviewing was applied. The interview questionnaire was divided into 3 major sections: questions about production process itself, marketing mix (product, price, promotion, place) and market development forecast with special focus on market implications of Croatia joining EU.
Producer 1 is farm owned by family Volarić that deals with organic production of honey and honey products. He has long tradition in honey production - almost thirty years in the business. This is actually a family tradition that the owner continued to deal with, first as a hobby, but after certain period as his main source of income.
Six years ago, farm redirected to organic production, primarily because of the love for pure nature and the natural mode of production (ideological reasons), and at the same time encouraged by the initiatives
(as well as expert and financial help) of the local government for the organic honey production.
At the moment, farm employs four workers. All the employees are family members and they are self-sufficient for now. They consider organic production very labour-intensive. Although, as already pointed out, producer has long tradition of beekeeping, organic production requires additional training in this area, so the owner attended professional seminars and continues to educate himself. He is unsatisfied with state’s incentives for organic production of honey and bees – they are almost equal to those awarded for conventional production. His opinion is that the incentives from the government are not sufficient when it comes to honey production.
The process of official certification requires long preparation. Owner spent almost three years collecting necessary documents. He believes that additional instructions and expert guidance are crucial for the process.
Farm produces honey and variety of honey-based products with volume up to ton per year. Range of products offered is very wide and new products are frequently launched, all based on consumer claims. Whole line of products based on honey with herbs cultivated on a part of the farm was recently introduced.
Products are usually sold in specialized exhibitions and fairs, and these are the channels through which the farm generates the largest part of its sales volume. Producer finds these channels also regarding in terms other than sales. He considers direct contact with consumer both promotionally important and valuable for market research. On the other hand, he considers sales through retail chains in Croatia not to be the best choice for small producers because the bond traders are looking for great money for product placement, so the organic products retail prices increase further and are becoming unacceptable to consumers.
Products are promoted mainly through exhibitions and trade fairs. Part of promotional mix includes articles about producer himself and his products published on the Internet. Promotion highlights the organic character of Croatian products that makes impact on some of consumers while most of them are not even aware of the term.
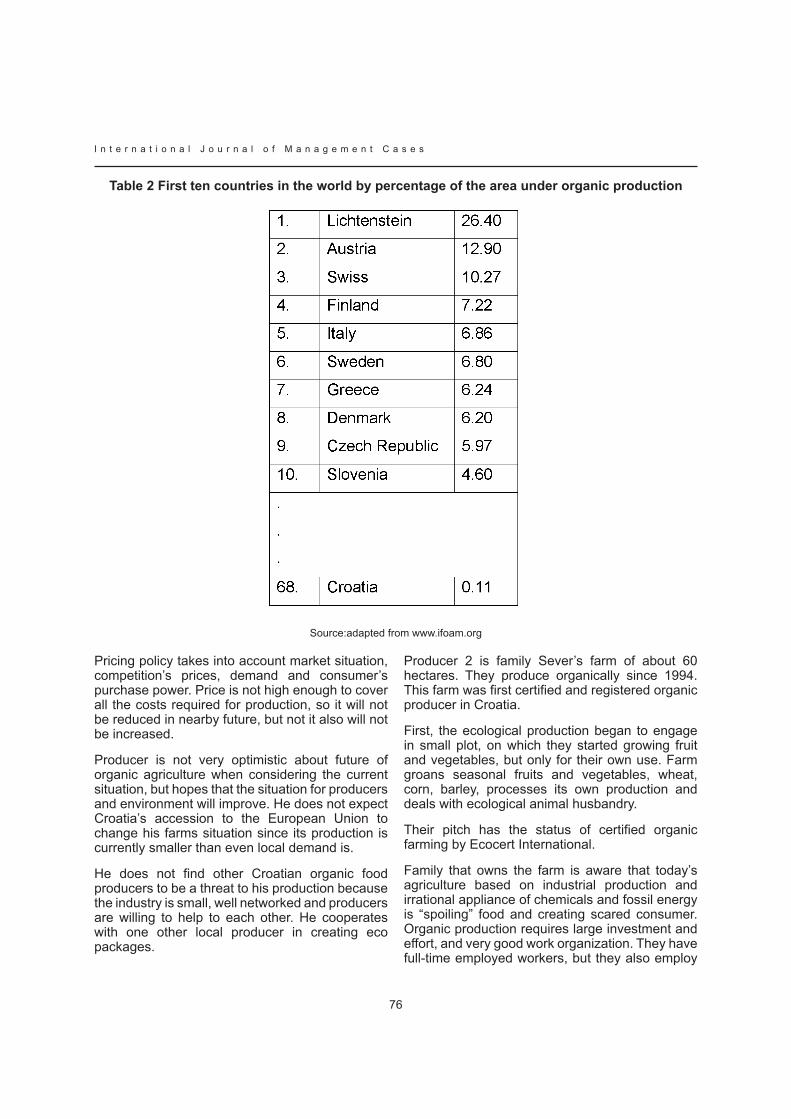
I n t e r n a t i o n a l J o u r n a l o f M a n a g e m e n t C a s e s
76
Table 2 first ten countries in the world by percentage of the area under organic production
Source:adapted from www.ifoam.org
Pricing policy takes into account market situation, competition’s prices, demand and consumer’s purchase power. Price is not high enough to cover all the costs required for production, so it will not be reduced in nearby future, but not it also will not be increased.
Producer is not very optimistic about future of organic agriculture when considering the current situation, but hopes that the situation for producers and environment will improve. He does not expect Croatia’s accession to the European Union to change his farms situation since its production is currently smaller than even local demand is.
He does not find other Croatian organic food producers to be a threat to his production because the industry is small, well networked and producers are willing to help to each other. He cooperates with one other local producer in creating eco packages.
Producer 2 is family Sever’s farm of about 60 hectares. they produce organically since 1994. This farm was first certified and registered organic producer in Croatia.
First, the ecological production began to engage in small plot, on which they started growing fruit and vegetables, but only for their own use. Farm groans seasonal fruits and vegetables, wheat, corn, barley, processes its own production and deals with ecological animal husbandry.
Their pitch has the status of certified organic farming by Ecocert International.
Family that owns the farm is aware that today’s agriculture based on industrial production and irrational appliance of chemicals and fossil energy is “spoiling” food and creating scared consumer. Organic production requires large investment and effort, and very good work organization. They have full-time employed workers, but they also employ
77
I n t e r n a t i o n a l J o u r n a l o f M a n a g e m e n t C a s e s
seasonal workers, whose number depends on the season, from 10 to 50. They have problem with finding quality workers.
Farmer considers state’s incentives for organic production not sufficient. As for the official certification of products, farm had no problems with the certification as they possessed European certificate Eccort International, but the owner believes that the process of obtaining certificate would be rather long and complicated without prior experience.
Large number of products i grown on the farm: cereals, fruits and vegetables, healing herbs, and meat production started in year 2003. They introduced chickens and organic eggs. A year later, they started to raise goats and increased the number of duck, goose and turkey on their farm. They also produce goat milk and cheese. Since year 2007 they are also dealing with pigs, so pork meat products are offered. They process and add value to about 50 to 60% of products. Farm also has a stone mill with a netting system and a mini bakery that produces organic bread.
Product portfolio expansion is guided by customers’ wishes and market opportunities. For now, there is not any complementary activity, but this possibility is not excluded in the future.
Sales are done mainly thru city markets. There is possibility of home delivery, and some of the products are distributed in Konzum and Drogerie Markt.
Farm cooperates with the organic association from Zagreb, Dutch Foundation, Avalon Foundation and Faculty of Agriculture that conducted several experiments in organic production and tested use of new machines. They also cooperate with an exporter that is in system of control and certification by Ecocert International, in order for medicinal herbs export to Europe.
Together with association Ekologika, farmer developed project of green eco baskets is funded by European Commission through the Regional Environmental Center for Central and Eastern Europe. The project includes product delivery to consumers’ homes. Delivery is usually done once a week, but depending on demand, it can be done more or less frequent. Consumer selects the content himself, regarding on seasonal availability. This type of relationship with consumer allows
direct and rapid answer to consumers’ needs and wishes.
Promotional mix combines web site, fairs and occasional reports in agricultural show on public television.
Price mainly depends on contributions or on the season. The contributions and effectiveness also depends on season.
Producer believes that organic food market in Croatia is developing very slowly. He does not expect significant change in the situation regarding Croatia’s accession to the EU, but he believes that there is danger of hard competition with EU producers.
Producer 3, family Veselić, produces organically for four years on area of 7 hectares.
This family farm employed organic production because of its positive impact on the land and health of owner’s family. Only family members work at the moment, but due to increase in the production, owner expects need for additional labour force.
Organic production is production in which work organization and human factor is of crucial importance. The whole family took courses on organic production, which were organised by the county.
They collect state incentives, as well as additional incentives from local. Farmer finds the certification procedure quite complicated.
Farm’s main product are organic strawberries with production of about 5 tons per year. Owner emphasizes that they decided for strawberries because they are quite sensitive and it was a challenge to deal with organic ecological production of this fruit. Farm also produces medicinal herbs and some types of vegetables and meat for its own needs. They plan to star with processing strawberries to jam.
Product decisions are made based on both market situation and consumer wishes. They will expand their portfolio soon with rural tourism using existing field house that will be converted to a restaurant that will offer organic food and other products grown on their farm.

I n t e r n a t i o n a l J o u r n a l o f M a n a g e m e n t C a s e s
78
Products are sold mostly thru fairs. Fairs where farm sells their products are promotional activity at the same time.
Price is almost equal to price of conventional products. That is the reason that without incentives it would be very difficult to cover production costs.
Producer regards Croatia’s accession to the European Union possibly positive that for Croatian products, which will then be able to qualify easily for the foreign market, since for now existing certificates are not recognized outside the Croatian borders. Hope to entry into the Union such a situation could change, which would act positively on the performance of local organic production.
ConclusionConventional agricultural production is one of the largest environment pollutants. Organic agriculture is future of agriculture, whose importance and necessity developed countries recognized long time ago but that also increases in developing countries.
In Croatia, this production is still at the beginning and although positive changes in this area are visible, a lot of investment in organic farming is still necessary.
Producers interviewed in this paper recognized issues that can be easily solved: complicated certification process and too small incentives. Both issues, caused by state’s regulation, can be solved in very short time period by simple legislation changes.
On the other hand, lack of distribution channel presence can be compensated with producers cooperation and creation of product baskets.
Organic production and distribution of these products, especially in the phase when majority of products is purchased directly from the manufacturer, returns the market to the basic producer-consumer relationship that creates a whole range of advantages for both sides. From direct information flow between producers and consumers to lower prices for consumers and higher profit margins for farmers because intermediaries in the channel are eliminated. This does not implicate that the market should focus only on direct sales, because in such way it would not able to reach a large number of consumers,
but it gives opportunity for necessary education for all participants in the process.
Organic food market is currently present in Croatia but there is also fear of early opening of the now under-developed market to the EU producers with longer experience and economy of scale effect.
Proper marketing strategy and promotional activities will most certainly attract more consumers, and at the same time eliminate the prejudices of the organic food as food for people of bad health or food for the rich.
Providing accurate and positive information, new possibilities will open to both consumers and producers.
ReferencesFarodoye, L. (1999), “Focus on organic food”, Meat Demand Trends
Foster, C., Lampkin, N. (1999), “European organic production statistics 1993-1996”, Universität Hohenheim, Hohenheim, .
Padel, S. (1994), “adoption of organic farming as an example of the diffusion of an innovation: a literature review on the conversion to organic farming”, Journal of Agriculture and Human Values, Vol. 16
Raven, H. (2000), “New voice for Scotland’s organic farmers”, The Scottish Farmer, ABC Business Publications Ltd, Glasgow
Republic of Croatia, Ministry of Agriculture, Forestry, and Water Management (2003),“ Review of Croatia“
Republic of Croatia, Ministry of Agriculture, Forestry and Water Management (2004), „SaPaRD Programme Agriculture and Rural Development Plan, 2005 – 2006“
Republic of Croatia, Ministry of Agriculture, Fishery and Rural Development (2008), Strategy of Republic of croatia’s rural development 2008 - 2013
Ross, A. (2002), “Soil Association suppresses report claiming organics in supermarkets are overpriced”, available at: www.just-food.com/news_detail.asp?art=47365&dm=yes (accessed 22 January)

79
I n t e r n a t i o n a l J o u r n a l o f M a n a g e m e n t C a s e s
Wier, M. i Calverley, C. (2002) Market Potential for Organic Foods in Europe, British Food Journal, vol. 104
Zanoli, R. i Jukic, N. (2005) Marketing study on organic and other selected special quality products from Croatia, FAO
Znaor, D. (1996), ekološka poljoprivreda, Nakladni zavod Globus
www.ifoam.org
www.poduzetnistvo.org/tag/izvoz, accessed 19th of February, 2009.
www.vjesnik.hr/pdf/2009%5c03%5c09%5c04a4.PDF, accessed 19th of February, 2009.
I n t e r n a t i o n a l J o u r n a l o f M a n a g e m e n t C a s e s
80
IMPEDIMENTS IN KNOWLEDGE SHARING AND MANAGEMENT IN ADVERTISING
AGENCIES - A CASE STUDy TO UNDERSTAND THE IMPEDIMENTS OF KNOWLEDGE SHARING IN AN
ADVERTISING AGENCy
SUPRIyA M. KALLAMANAGEMENT DEVELOPMENT INSTITUTE, GURGAON, INDIA
RAJEN GUPTAMANAGEMENT DEVELOPMENT INSTITUTE, GURGAON, INDIA
Abstract
The advertising agencies are faced with a whole host of impediments to knowledge sharing and consequently knowledge management is seen as a relatively weak area in the agency system. This, over a period of time, starts affecting the agency performance, market image and business.
This case, which is based on personal interviews conducted with people in various departments of the agency, by the way of a dialogue between department heads, brings out the impediments to knowledge sharing and management in the agency system. The discussion unearths a large set of issues which, apart from inter-personal factors like absence of cohesive team work, also include attitudinal as well as mindset issues. And also, the case talks about the impact of the nature of the task, client involvement, lack of mutual trust between client and agency, high attrition rate and other issues that lead to mismanagement of tacit knowledge and its resultant impact on agency performance.
The discussion presented in the case goes on to look into possible solutions to the problems.
Key words: Advertising, agencies, knowledge sharing, management
Review of the literatureSeveral scholars have sought to distinguish between information and knowledge (Kock et al., 1997; Davenport and Prusak, 1999; Natarajan and Shekhar, 2000,). The former is commonly defined as data that are being interpreted through analysis, correlation and summary, while the latter is defined as information that is validated and endowed with meaning through experiences, beliefs, values and insights (Davenport and Prusak, 1999) (see Alton Chua, 2003). Information is usually person-independent whereas knowledge is context-sensitive (Natarajan and Shekhar, 2000). This means that information can be easily detached and transferred from its source without losing its meaning, but knowledge has to be shared within a specific context for its essence to be grasped. Since knowledge is enriched with insights and is socially embedded in organizational practices, it is not easily imitated, traded or substituted. Hence, knowledge sharing is an important strategy for developing a competitive advantage for any organizations (McEvily et al., 2000).
Knowledge is increasingly recognized as being of central importance to organizations in the contemporary knowledge society. Changes in the workings of capitalism, the advent of advanced communication technologies, the complexity of social and cultural changes, the shrinking of the world due to increasing globalization, intensifying competition – all these factors and
81
I n t e r n a t i o n a l J o u r n a l o f M a n a g e m e n t C a s e s
more point towards an increasing need for placing “knowledge” at the center of the philosophy of the contemporary knowledge society (Blackler et al., 1993; Badaracco, 1991).
Knowledge sharing is the process by which individuals collectively and iteratively refine a thought, an idea or a suggestion in the light of experiences. The original idea may be progressively modified or gradually rejected until a shared perspective emerges (West and Meyer, 1997; Rogers, 1986). knowledge can be shared through face-to-face interactions (Dixon, 2000), or other means of communication in the organization. The degree of explicitness of knowledge shared is influenced by the media richness of the communication channels used (Chua, 2001). For example, highly tacit knowledge can be shared through face-to-face interactions, but knowledge has to be codified first when a text-based electronic discussion is used.
Considered as both, a cause and a cure for competition, the management literature sans doute has seen a recent surge of academic writings to explore and unpack “knowledge” as a construct. This construct has been probed by scholars with perspectives as varied as – symbolic interactionism, post-modernism, economics, resource-based theory, evolutionary theory, innovation and organizational learning, and sociology. “Knowledge”, thus, means different things when viewed from different perspectives. Even within management literature, alternative thoughts exist as to what knowledge means – is it a process of leveraging resources for organizational learning or innovation; is it a resource – a form of capital (other forms of capital being land, labor, and financial); or is it both – a process and a resource? if it is a resource, then is it an input resource (human capital, information technology, know-how, etc.); is it an output resource (new knowledge created as intellectual capital, new learning, product and/or process innovations, etc); or is it both? Many such questions abound with the term itself, and the different ways the different scholars have conceptualized it (Rashmi Assudani, 2005).
Successful knowledge-intensive firms (KIFs) gain competitive advantage from the human and social capital which makes up their unique trading assets (Alvesson, 2001; Starbuck, 1992).
Consequently, sharing knowledge between client projects, for example, becomes critical to the
performance of the knowledge intensive firms like advertising agencies.
The category of knowledge-intensive firms (Alvesson, 1995; Starbuck, 1992) refers to those where most work is said to be of an intellectual nature and where well-educated, qualified employees form the major part of the workforce (Alvesson, 2000). Furthermore, the company claims to produce qualified products and/or services (Alvesson, 2000, 2001). Typical examples of KIFs include law and accounting firms, management, engineering and computer consultancy companies, advertising agencies, research and development units and high-tech companies. The key resource in KIFs is often referred to as human capital or the intellectual material – knowledge, information, intellectual property and experience – that can be put to use to create wealth (Stewart, 1997). Starbuck (1992) suggests that ‘knowledge intensive’ can be applied to firms in which knowledge has more importance than other inputs, and human capital, as opposed to physical or financial capital, dominates. Thus, employee skills are central to the creation of competitive advantage and, indeed, to the survival of the organization when market conditions are tough. However, it is not only the presence of human capital that it is important in defining Knowledge intensive firms: it is also the way in which it is applied that makes these organizations distinctive.
Recent literature also suggests remedies to the problems of knowledge sharing that have shown encouraging results for some organizations in the recent past. These organizations are successfully linking knowledge sharing and management with employees’ performance. Hansen et al. (1999) cite the performance review process at Ernst & young where consultants are evaluated on their contribution to and utilization of the knowledge asset of the firm. They provide a further example of the global consultancy Bain & Co., which rewards people for sharing knowledge. Bain & Co. evaluates partners’ performance on how much direct help they have given colleagues and include in this category the degree of dialogue a partner has had with others. Evaluation of this dimension can contribute up to as much as a quarter of a partner’s annual salary. These examples highlight the growing recognition placed by firms within particular sectors on the need to introduce specific policies that will encourage individuals to share knowledge – fundamental to knowledge Management.
I n t e r n a t i o n a l J o u r n a l o f M a n a g e m e n t C a s e s
82
As a matter of fact, some extent of knowledge sharing takes place among organization members regardless of whether this process is deliberately managed. When a technician asks a fellow colleague how a work-related problem can be solved, knowledge is shared when help is given. However, even as a natural social phenomenon, unmanaged knowledge sharing processes are local and fragmentary (Davenport and Prusak, 1999). They may neither be efficient nor effective (Gupta and Govindarajan, 2000; Szulanski, 1996).
Many studies have been done to examine the factors that impede knowledge sharing. One factor is the lack of visible top management support for knowledge sharing activities (Trussler, 1998). another factor is the failure to make knowledge sharing a basis for advancement in the organization (Hiebeler, 1996). Most existing incentive systems neither recognize nor reward knowledge sharing behavior. The third factor is the ignorance among organization members (o’Dell and grayson, 1998). especially in large organizations, organization members may not be aware of someone who would be interested in the knowledge they have or has the knowledge they require. When there is an absence of a strong personal tie that warrants listening to or helping each other, knowledge sharing is hampered (o’Dell and grayson, 1998; von krogh, 1998). These factors are mutually reinforcing. There are currently two ways of thinking that could shed some light on the underlying forces that govern knowledge sharing (cohen, 1998). the first is the notion of a knowledge market (Davenport and Prusak, 1999). Knowledge sharing is conceived as a transaction that takes place among buyers, sellers and brokers in the knowledge market. Given their limited time and energy, individuals engage in a knowledge transaction only when they believe it will give them a worthwhile return on those scarce resources. The knowledge market perspective builds on the economic exchange theory and it asserts that individuals are driven by rational self-interest (Gee and Kim, 2002). Knowledge sharing will occur when its reward exceeds its costs (kelley and thibaut, 1978; constant et al., 1994). The second is the notion of knowledge community (von krogh, 1998, Nonaka and takeuchi, 1995). This perspective emphasizes less on knowledge transactions but more on personal connection and commitment to shared success. On the basis of trust and relationships, individuals develop a genuine concern for each other. The motivation
to share knowledge is therefore inspired by love, care and generosity.
In particular, since knowledge sharing is heavily social in nature, the perceived payoff of knowledge sharing is affected by social factors such as trust (Schrader, 1990), care (von krogh, 1998), emotional commitment and the quality of the relationship (Weiss, 1999). Since social factors are precipitated by a bilateral relationship between the one who shares and the one who receives knowledge, knowledge sharing behavior can only be sustained through reciprocity. An individual shares knowledge in reciprocation because it is both a socially expected behavior (constant et al., 1994) as well as a means to obtain desired resources for mutual benefits (Tyler, 1999). In contrast when knowledge sharing is not reciprocated, knowledge sharing behavior is stopped. This is consistent with the social exchange theory (Kelley and Thibaut, 1978).
A review of the literature indicates a finite array of factors influencing the status of knowledge management and sharing in knowledge intensive firms. The review, hence leads us to two significant conclusions. First, there are impediments to evolution of knowledge sharing as a practice in advertising agencies. Second, the tacit nature of knowledge in KIFs like advertising agencies leads to a bigger area of concern … that is management of tacit knowledge. However, there are gaps in the area of how can the knowledge sharing and management become a part of routine in an advertising agency. The perceived complexity and certain geniousness that is associated with the creative process makes the entire business operates on tacitness of knowledge that stays embedded in the people’s mind.
Hence the case study attempts to understand the possible impeding and facilitating factors of knowledge sharing in the advertising agency culture.
Research MethodologyThis research is essentially exploratory wherein the attempt of the researcher is to obtain an in-depth understanding of the current level of awareness, response and usage of knowledge sharing in advertising agencies… so as to generate a battery of factors that have a bearing on the knowledge sharing phenomenon in the agencies. And hence,
83
I n t e r n a t i o n a l J o u r n a l o f M a n a g e m e n t C a s e s
research will also attempt to understand the possible impediments towards knowledge sharing and management in the advertising agency system.
The research instrument is semi structured face to face interview with respondents in the below mentioned three departments in the advertising agency. The effort was to recruit those people for interviews who are at middle and senior levels. This was done to reach people who are campaign strategy makers and not just implementers. The intention was to keep the process as non-directive and open ended as possible. All interviews were recorded on audiotapes and transcribed verbatim for analysis.
Hence, as discussed above, the data was gathered by in-depth interviews with key people involved in three departments
New business department
Creative department
Account planning department
The case study
Agency -
Paradise advertising is a part of a large agency network of Paradise group. Paradise has 8900 employees and 251 offices across 82 countries, spanning all disciplines.
The India branch of Paradise advertising has offices in major metros of the country. This study focuses on one of the offices of Paradise advertising. This office handles many accounts but the key accounts are in the categories of FMCG, computer hardware and banking.
1.
2.
3.
Situation faced by the agency -
Increasing competition in the market is putting a pressure on the volume of business handled by Paradise. The agency is gearing up to offer more value to their customers through efficient management and sharing of knowledge
Knowledge management and sharing is actually a very sensitive issue in agencies. There are many employee views on this topic. And these views are mostly around the perceived importance; requirement and differentiating value of knowledge creation, sharing and management in the agency system.
Creative, client servicing and planning form the core teams in an agency. The discussion between the various department heads in the agency leads to following views about knowledge sharing and management in the agency.
Advertising industry, as the world knows it, is a knowledge intensive industry. But lack of sharing of knowledge due to various reasons leads to the absence of real efforts towards knowledge creation and sharing.
“There is no real sharing and management of knowledge, and so, the end delivery is more dependent on chance and luck. It is upto us to decide that we want to live by chance ad luck or we want to put some process to this madness?”
People in various departments, especially, account planning department, feel that the agency staff, structure and operations are not true to the paradigm of knowledge creation. And hence, there is an absence of the same.
However, the creative department feels differently compared to other departments in the agency. They are strictly of the opinion that advertising is about creativity and creativity is always to do with the creation and it’s unfair to fall back on existing bank of knowledge. The already done campaigns and existing consumer knowledge fall in the premises of used and hence old source of information for
I n t e r n a t i o n a l J o u r n a l o f M a n a g e m e n t C a s e s
84
them. This creates a disagreement with account planning department of the agency which feels that there can be no real, effective and true creation of communication without knowing in-depth about the brand, the consumer and the interaction between two. Also the account planners in the agency feel that absence of a proper archiving process and lack of access to global knowledge bank stays as the key access issue to knowledge management.
The servicing and operations department does feel strongly about the need to thoroughly know the brand and the consumer, but the budgetary and client investment constraints keep them worried and only partially involved in the whole matter of knowledge creation. And further, the pressures of campaign delivery deadlines keep them from getting involved in knowledge sharing. These day to day pressures make servicing people relatively unaware of the true knowledge requirements on the brand. This further leads to their inability to get involved in the brand and product category discussions at the client end. This lack of involvement leads to decreased client interest in the agency teams and translates into their reluctance to invest time and resources in the knowledge sharing and management processes
The second area of issues, department heads feel, emerges from the attitudes of people involved in the process. People in possession of certain crucial brand information are averse to sharing it because they start thinking that knowledge is power and why should they let go of this power. There are other related issues that further hamper the process, like, lack of sense of belonging to the agency, lack of integration…stemming from no time or money investment from the agency in individuals and there career plans. And that is why people have started seeing advertising as a stop-gap in their career. This throws open another can of worms, i.e., high attrition rates. A burning issue faced by advertising agencies. Also, high attrition rate enhances the lack of trust in the client agency relationship.
The third issue, brought up by almost all the department heads, is about absence of linkage between knowledge sharing process and performance.
And what adds to it is the fact that it is seen as an extra activity by employees. The workshops that are held for knowledge dissemination are sold to employees as holiday and socialization trips and
so are not taken seriously. The top management involvement, though, good for the operating teams, leads to three kinds of problems - people use this as an opportunity to show off there individual talents, complete breakdown of team happens and the feeling of lack of teamwork continues as the work progresses. And the other issue is subjectivity that gets into the process even before meeting the client. This subjectivity, at times, discourages people and lack of objectivity certainly means lack of respect for knowledge acquiring and sharing. Also, people fail to link knowledge sharing and efficient management of the same with advantages of the same. The onus is on top management to drive the process.
Conclusion & DiscussionThe text above outlines problems faced by advertising agency, as far as, knowledge sharing and management is concerned. From the existing literature as well as from the case above, it comes across, that following are the issues to be considered and the later part of conclusion talks about possible solution to the situation faced by advertising agencies.
As per the literature, advertising agency is a typical example of a knowledge intensive firm. The category of knowledge-intensive firms (alvesson, 1995; Robertson and 1998; Starbuck, 1992) refers to those where most work is said to be of an intellectual nature and where well-educated, qualified employees form the major part of the workforce (Alvesson, 2000). The key resource in KIFs is often referred to as human capital or the intellectual material – knowledge, information, intellectual property and experience – that can be put to use to create wealth (Stewart, 1997). Starbuck (1992) suggests that ‘knowledge intensive’ can be applied to firms in which knowledge has more importance than other inputs, and human capital, as opposed to physical or financial capital, dominates. The end product is communication, which has to not just inform but do a task of subliminally or overtly shaking the prospective customer to take action. These are the reasons which set the ground for the fact that advertising agency would produced a half baked cake if it’s low on its knowledge about consumer, consumer psychology and related aspects. So the case text discusses a whole host of impediments to knowledge sharing in an advertising agency. If the issue is seen in a broader light, then following
85
I n t e r n a t i o n a l J o u r n a l o f M a n a g e m e n t C a s e s
are the issues that come in the way of creating knowledge creating, sharing and management culture in an advertising agency –
Advertising is a creation resulting from a highly cohesive team work. The teams are formed at various levels essentially internal and external teams and a joint team i.e. servicing, creative and planning; client-servicing and client-agency (including all the departments of agency). Looking at the vertical and horizontal nature of teams that are formed; the dimensions and individual and group interactions are expected to be highly mature to achieve the task. And so, the absence of cohesiveness and maturity leads to a less productive advertising process. The absence of cohesive team work is to be partially blamed for it. Advertising professionals’ especially creative people in the agency have a misconception that creativity is about originality that does not need any prior understanding. This needs to be taken care of by working teams and the top management. There is so much unhealthy internal competition that sharing of knowledge is seen as let going of one’s power. This attitude towards knowledge is a big hassle in creating a sharing culture the organization. There is a lack of management of the existing information / explicit knowledge as there is no archiving process that could take care of the same. The other big issue is tacit knowledge which stays in people’s heads and leaves when the person concerned leaves the agency. Since the culture of knowledge sharing is not there, this ends up in a clear loss of information and knowledge. Knowledge sharing and to an extent knowledge management is not put forward as a keen initiative of top management. This perspective makes it perceived as a non-serious proposition by the other employees of the organization. The target pressures, day to day deadlines, client pressures are another set of deterrents towards knowledge sharing and management as decrease the mental and physical time available with the employees. Lack of technical support towards knowledge sharing and management makes it come across as a cumbersome activity. Not much investment by the top management in the same makes it further lose its expected seriousness. Another big issue is client involvement in the pre campaign and post campaign process. Since client is only concerned with the creative output, he tends to overlook other requirements of the procedure. The picture given to him i.e. It’s the work of creative genius is partly to be blamed for it. But the reflection of same is visible in the agency itself where teams are not
prepared to extract information in client meetings. There homework for the topic under discussion is sometimes not in place. So that is another reason to be blamed for it.
Both knowledge and wisdom sharing take mental structural changes to reach learning effect. Therefore, to ask the employees to change their perception, the organization has to actively and initially compulsorily implement the sharing of knowledge; and to ask the employees to change their thinking habits, the organization has to act as a facilitator and make wisdom sharing possible. In wisdom sharing, sharing of belief is an experiential and sentimental sharing. We are not supposed to believe until we truly understand the content. And without belief, we are not supposed to look up on the happenings related to our belief. However, most people still believe without first learning what it is all about, and still look up on the happenings through their own conjecture. The general public believe what others do and say, thus belief is very sentimental (it often fails the tests of validity and reliability). Sharing of belief has become an exchange of feelings. These are some of the interpersonal issues that a set-up like advertising agency may face. Given this scenario, the harnessing of tacit knowledge has to be given a priority through a serious effort to contain the attrition rates.
References Alawi, Adel Ismail Al and Marzooqi, Nayla yousif Al (2007), Organizational culture and knowledge sharing: critical success factors, Journal of Knowledge Management, Vol. 11 Iss. 2.
Alvesson, M. (1995). Management of Knowledge Intensive Companies, Berlin/New york: de Gruyter.
Alvesson, M. (2000). Social identity and the problem of loyalty in knowledge-intensive companies’. Journal of Management Studies, Vol 3, iss 8.
Alvesson, M. (2001). Knowledge work: ambiguity, image and identity’. Human Relations, Vol 54, iss 7.
Assudani, Rashmi (2005). Catching the chameleon: understanding the elusive term ‘Knowledge’ Journal of knowledge management, Vol. 9 Iss. 2
I n t e r n a t i o n a l J o u r n a l o f M a n a g e m e n t C a s e s
86
Badaracco, J. (1991). The Knowledge Link: How Firms Compete through Strategic Alliances, Harvard Business School Press, Boston, MA.
Blackler, F. (1995). Knowledge, knowledge work and organizations: an overview and interpretation, Organization Studies, Vol. 16 No. 6.
Bharadwaj, Meeta and Monin, John (2006). Tacit to explicit: an interplay shaping organizations knowledge, Journal of Knowledge Management, Vol. 10 Iss. 3.
Chua, A. (2001).Relationship between the types of knowledge shared and the types of communication channels used, Journal of Knowledge Management Practice, Vol. 2.
Chua, A. (2003). Knowledge sharing: A game people play, Aslib Proceedings. Bradford: Vol. 55, Iss. 3.
cohen, D. (1998). toward a knowledge context: report on the first annual U.C. Berkeley forum.
constant, D., kiesler, S. and Sproull, l. (1994). What’s mine is ours, or is it? A study of attitudes about information sharing, Information Systems Research, Vol. 5 No. 4.
Davenport, T. and Prusak, L. (1999). Working Knowledge, Harvard Business School Press, Boston, MA
Dixon, N.M. (2000). “Common Knowledge: How Companies Thrive by Sharing What They Know, Harvard Business School Press, Boston, MA.
Erez, M. and Earley, C. (1993). Culture, Self-identity, and Work, Oxford University Press, New york, Ny. Friedman.
Gee, W.B. and Kim, y.G. (2002). Breaking the myths of rewards: an exploratory study of attitudes about knowledge sharing, Information Resources Management Journal, Vol. 15 No. 2.
Grant, John (1996). The Time Is Right for Re-inventing Account Planning, Marketing (March 7), 25.
Grant, R.M. (1996), Towards a knowledge-based theory of the firm, Strategic Management Journal.
Gupta, A.K. and Govindarajan, V. (2000). Knowledge flows within multinational corporations, Strategic Management Journal, Vol. 21 No. 4.
Hiebeler, R.J. (1996). Benchmarking: knowledge management, Strategy & leadership, Vol. 24 No. 2.
Hansen, M.T. (1999). The search-transfer problem: the role of weak ties in sharing knowledge across organization subunits, Administrative Science Quarterly, Vol. 44.
Hong Jon Chao and Kuo Chia Ling (1999). Knowledge management in the learning organization, The Leadership and Organization Development Journal, Vol 20, iss 4.
Jarvenpaa and Staples (2001). Exploring perceptions of organizational ownership of information and expertise, Journal of Management information Systems, Vol. 18 No. 1.
kelley, H.H. and thibaut, J. (1978). the Social Psychology of Groups, Wiley, New york, Ny.
Kock, N.F. Jr, McQueen, R.J. and Corner, J.L. (1997). The nature of data, information and knowledge exchange in business processes: implications for process improvement and organizational learning, the learning organization, Vol. 4, No. 2.
Mark, Davies and Prince, Melvin (2005), Dynamics of trust between clients and their advertising agencies: Advances in performance theory, Academy of Marketing Science Review.
Natarajan, G. and Shekhar, S. (2000). Knowledge Management: Enabling Business Growth, McGraw-Hill, Tata, New Delhi.
Nonaka, i. and konno, N. (1998). the concept of ‘ba’: building a foundation for knowledge creation, california Management Review, Vol. 40, No. 3.
Nonaka, I. and Takeuchi, H. (1995). The Knowledge Creating Company: How Japanese Companies Create the Dynamics of Innovation, Oxford University Press, New york, Ny.
Nunnally (1978). Psychometric theory, Mcgraw-Hill, New york, Ny
o’Dell, c. and grayson, c.J. (1998). if only we knew what we know: identification and transfer of internal best practices, California Management Review, Vol. 40 No. 3.
Rogers, e.M. (1986). communication technology: The New Media in Society, Free Press, New york, Ny.
87
I n t e r n a t i o n a l J o u r n a l o f M a n a g e m e n t C a s e s
Ruggles, R. (1998). the state of the notion: knowledge management in practice, California Management Review, Vol. 40 No. 3.
Scheraga, D. (1998). knowledge management competitive advantages become a key issue, chemical Market Reporter, Vol. 254 No. 17.
Susan K McEvily, Shobha Das, Kevin McCabe (2000). Avoiding competence substitution through knowledge sharing, The Academy of Management Review. Briarcliff Manor: Vol. 25, Iss. 2.
Starbuck, W. H. (1992). Learning by knowledge-intensive firms, Journal of Management Studies, Vol.3, iss.4.
Stewart, T.A. (1997). Intellectual Capital: The New Wealth of Organizations, New york: Doubleday
Szulanski, G. (1996). Exploring internal stickiness: impediments to transfer of best practice within the firm, Strategic Management Journal, Vol. 17, Winter Special Issue.
triandis, H.c. (1989). the self and social behavior in differing culture contexts, Psychological Review, Vol. 96 No. 3.
trussler, S. (1998). the rules of the game, the Journal of Business Strategy, Vol. 19 No. 1.
Tyler, T.R. (1999). Why people cooperate with organizations: an identity-based perspective, in Sutton, R. (Ed.), Research in Organizational Behavior, Vol. 21, JAI Press, Greenwich, CT.
Von Hippel, e. (1994). ‘Sticky information’ and the locus of problem solving: implications for innovation, Management Science, Vol. 40 No. 4.
Von krogh, g. (1998). care in knowledge creation, california Management Review, Vol. 40 No. 3.
Weiss, L. (1999). Collection and connection: the anatomy of knowledge sharing in professional service firms, Organization Development Journal, Vol. 17 No. 4.
Wenger, E., McDermott, R. and Synder, W. (2002). Cultivating Communities of Practice, Harvard Business School Press, Boston, MA.
West, P. and Meyer, G.D. (1997). Communicated knowledge as a learning foundation, International Journal of Organizational Analysis, Vol. 5 No. 1.
I n t e r n a t i o n a l J o u r n a l o f M a n a g e m e n t C a s e s
88
CUSTOMERS’ PERCEPTION OF SERVICES IN UK’S CONFERENCE AND MEETING
INDUSTRy
IRENA PANDZAUNIVERSITy OF ZAGREB, CROATIA
CLAUDIO VIGNALILEEDS METROPOLITAN UNIVERSITy, UK
Abstract
Business Travelling industry is providing ₤3.5 billion to the British Economy every year in average and in ten year showed a growth rate of 53%. ‘Conferences and Meetings’ is sub-sector of Business Travel sector which had generated an annual average of ₤8 billion for three year period (2005-2007). Generally, that is a global multibillion business, involving millions of people worldwide, with competition not only between venues providers, but also among cities and countries. The Meeting industry has a huge impact to British economy and provides millions of pounds each year which venues’ providers offer makes as an important issue. Venues’ providers have to recognize all important factors of customers’ perception in order to offer the value which consumers want, rather than the value which the firm perceived. Offering the service consistent to consumer perception and expectations leads to higher levels of customer satisfaction which results with business expansion and bigger market share, and finally, with higher profitability.
Key words: conference and meeting industry, venue provider, customer perception, gap
IntroductionBusiness Travel is a sector of the wider tourism industry, bringing over 7 million visits to the UK each year on average. Over the ten-year period, between 1996 and 2006, this sector showed a growth rate of 53%, surpassing the overall tourism one. Economically speaking, international business visitors are responsible for 29% of the uk’s inbound tourism earnings, providing ₤3.5 billion to the British Economy. It should be noted
that business travellers spend more then twice as much per day, when compared with leisure ones, being the biggest spenders trade shows and exhibitions’ visitors and conference delegates. The importance for the British Economy of this sector is such that, in 2007, 25 British destinations were spending over ₤5 billion in total, on infrastructure supporting business events (BACD, 2007).
Business travel includes five sub–sectors: conferences and meetings (gathering of people to exchange information), exhibitions (gathering of people to exchange business), incentive travel (job related rewards), corporate events and corporate hospitality (events as business rewards) and business travel (job related travelling).
Conference and Meeting Industry in UKThe meeting industry provide services of appropriate setting, with certain features for: a speaker or trainer disseminate complex information more effectively to others; accommodating people coming from far a field, requiring somewhere to rest and have meals.
‘Conferences and Meetings’ is sub-sector of Business Travel sector which had generated an annual average of ₤8 billion for three year period 2005-7 (BacD, 2008). generally, that is a global multibillion business, involving millions of people worldwide, with competition not only between venues providers, but also among cities and countries (Davidson and Beulah, 2003; Llambi, 2005). The Meeting industry has a huge impact in the local economies of the destinations and it also generates employment and balances leisure tourism seasonality. The BACD (2007) mentioned that there are instances in which previous visitors
89
I n t e r n a t i o n a l J o u r n a l o f M a n a g e m e n t C a s e s
return to their meetings destinations to invest and establish new business operations: this would multiply the mentioned benefits for local economies. Two basic reasons why this industry is so attractive are:
The average expenditure and length of stay of guests usually increase, when compared with leisure guests;
It fosters the growth of leisure tourism, since nearly 40% of meetings’ participants return to the destinations accompanied by families, friends or colleagues.
The accumulated number of meetings of the 5 year period 2000 to 2004 ranked the uk as the world’s fourth destination for international meetings (Llambi, 2005). The UK Conference Market Survey 2007 revealed that, during the twelve months prior to it, the events’ volume, of the UK conference market, had increased in both the not-for-profit and corporate segments - 1.4% and 27%.
Theoretical framework
Customers’ perception and customer satisfaction The organizations which hires the venue has its specific needs like: venue’s location, a suitable lead – time, number and size of the meeting rooms, meals served on time, equipment, outdoor space (Allen, 1999; Davidson, 2003). The consumers of service might have different ones: easy access, comfort of the chairs and the rooms, quality of the food, special dietary needs, helpful and friendly staff (Parasuraman, 1998; allen, 1999; Davidson, 2003). The organization needs could be considered as ‘macro needs’ and the consumers’ as ‘micro needs’. The consumers are in a service environment exposed to service encounters and some of their needs and wants are related with their personal subjective or emotional characteristics (Parasuraman, 1998). the consumers of service are ones who give a feedback about the conference or meeting; therefore their perception should have the priority for service providers.
According to the representative research projects higher level of consumer perceived value leads to higher level of customer satisfaction, the higher levels of customer loyalty and to a greater success
•
•
of organizations. Due to this, firm has to identify the factors of consumers’ perceived value in order to offer the value which consumers want, rather than the value which the firm perceived. According to Jacoby and chestnut (1978, according to Roig et al, 2006), firms should strive to maintain long term relationships with their customers in order to obtain clientele loyal to the firm. Therefore, it is necessary for the service firm to work on service value improvements which lead to creating, maintaining and growing long term relationships with clients (Roig et al, 2006).
Customer satisfaction is considered as one of the most important results of marketing activities in market oriented firm. High level of consumer satisfaction results with business expansion and bigger market share, which finally leads to higher firm profitability (Barsky, 1992; Kandampully and Suhartanto, 2000). Research conducted in service sectors (cronin and taylor, 1994) shows that customer satisfaction has an important influence on purchase decision making in service industries.
Consumer’s feeling of satisfaction is a result of comparison between perceived performance and comparable standard as expectations, or according to kotler (2001, pp 40) satisfaction is function of performance and expectations. The consumer is satisfied if perceives that received product or service is the same as expected (confirmation of expectations). If received outcome exceeds the expectations, consumer is very satisfied but if it is below the expectations the consumer will be disappointed and unsatisfied. Satisfaction is determined by a cognitive process of comparing what customers receive against what they give up to acquire the service, but on the other side satisfaction is seen also as an emotional feeling resulting from an evaluative process. It is important to stress that satisfaction means the evaluation of specific transaction or more continuously transactions (Vranesevic, 2000, pp 185), while the value and quality do not have to be based on real product using or service providing.
the gap between clients’ and firm’s perception and expectations The service quality is a result of expectations and perception of the firm management, its employees and consumers (Markovic, 2005), and if there are the differences between those expectations or
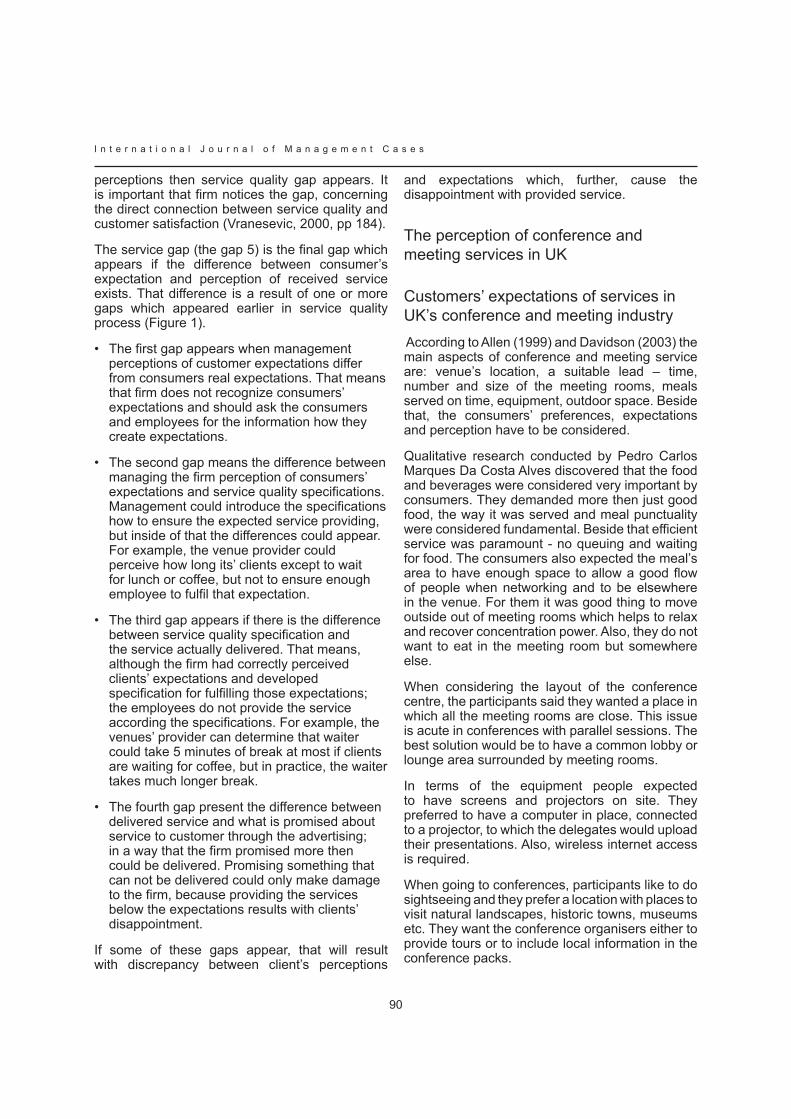
I n t e r n a t i o n a l J o u r n a l o f M a n a g e m e n t C a s e s
90
perceptions then service quality gap appears. It is important that firm notices the gap, concerning the direct connection between service quality and customer satisfaction (Vranesevic, 2000, pp 184).
The service gap (the gap 5) is the final gap which appears if the difference between consumer’s expectation and perception of received service exists. That difference is a result of one or more gaps which appeared earlier in service quality process (Figure 1).
The first gap appears when management perceptions of customer expectations differ from consumers real expectations. That means that firm does not recognize consumers’ expectations and should ask the consumers and employees for the information how they create expectations.
The second gap means the difference between managing the firm perception of consumers’ expectations and service quality specifications. Management could introduce the specifications how to ensure the expected service providing, but inside of that the differences could appear. For example, the venue provider could perceive how long its’ clients except to wait for lunch or coffee, but not to ensure enough employee to fulfil that expectation.
The third gap appears if there is the difference between service quality specification and the service actually delivered. That means, although the firm had correctly perceived clients’ expectations and developed specification for fulfilling those expectations; the employees do not provide the service according the specifications. For example, the venues’ provider can determine that waiter could take 5 minutes of break at most if clients are waiting for coffee, but in practice, the waiter takes much longer break.
The fourth gap present the difference between delivered service and what is promised about service to customer through the advertising; in a way that the firm promised more then could be delivered. Promising something that can not be delivered could only make damage to the firm, because providing the services below the expectations results with clients’ disappointment.
If some of these gaps appear, that will result with discrepancy between client’s perceptions
•
•
•
•
and expectations which, further, cause the disappointment with provided service.
The perception of conference and meeting services in UK
Customers’ expectations of services in UK’s conference and meeting industry According to Allen (1999) and Davidson (2003) the main aspects of conference and meeting service are: venue’s location, a suitable lead – time, number and size of the meeting rooms, meals served on time, equipment, outdoor space. Beside that, the consumers’ preferences, expectations and perception have to be considered.
Qualitative research conducted by Pedro Carlos Marques Da Costa Alves discovered that the food and beverages were considered very important by consumers. They demanded more then just good food, the way it was served and meal punctuality were considered fundamental. Beside that efficient service was paramount - no queuing and waiting for food. The consumers also expected the meal’s area to have enough space to allow a good flow of people when networking and to be elsewhere in the venue. For them it was good thing to move outside out of meeting rooms which helps to relax and recover concentration power. Also, they do not want to eat in the meeting room but somewhere else.
When considering the layout of the conference centre, the participants said they wanted a place in which all the meeting rooms are close. This issue is acute in conferences with parallel sessions. The best solution would be to have a common lobby or lounge area surrounded by meeting rooms.
In terms of the equipment people expected to have screens and projectors on site. They preferred to have a computer in place, connected to a projector, to which the delegates would upload their presentations. Also, wireless internet access is required.
When going to conferences, participants like to do sightseeing and they prefer a location with places to visit natural landscapes, historic towns, museums etc. They want the conference organisers either to provide tours or to include local information in the conference packs.
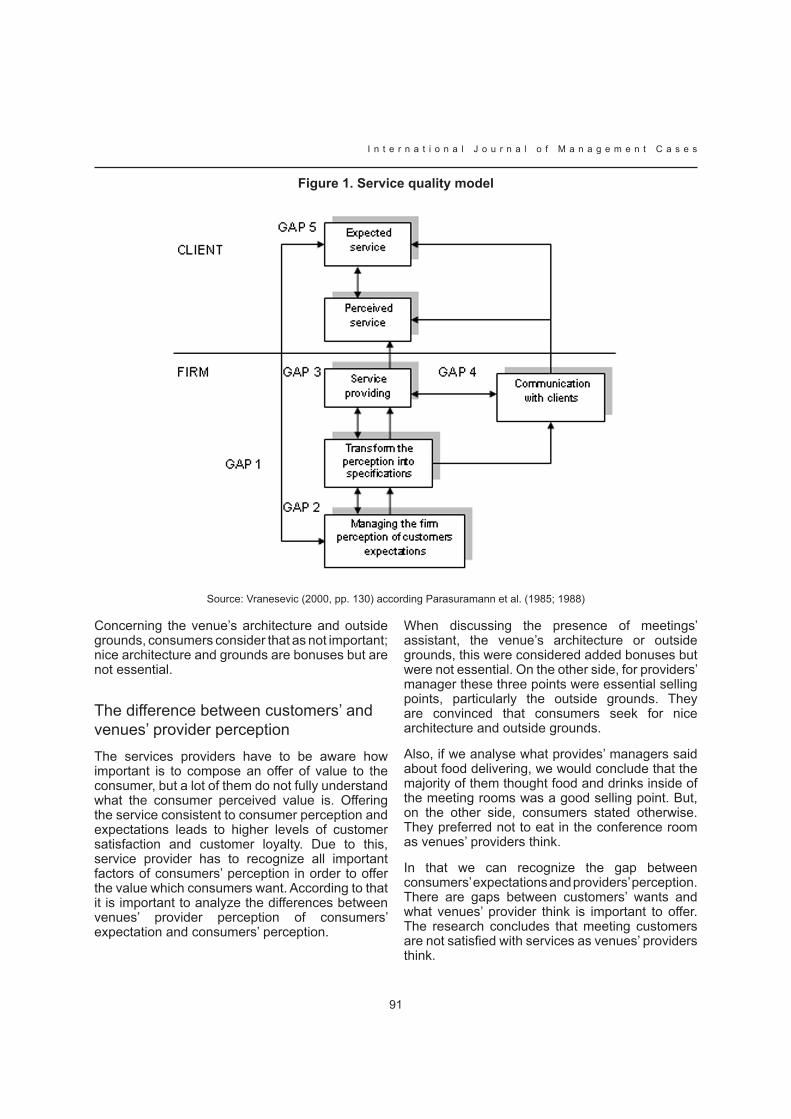
91
I n t e r n a t i o n a l J o u r n a l o f M a n a g e m e n t C a s e s
figure 1. Service quality model
Source: Vranesevic (2000, pp. 130) according Parasuramann et al. (1985; 1988)
Concerning the venue’s architecture and outside grounds, consumers consider that as not important; nice architecture and grounds are bonuses but are not essential.
The difference between customers’ and venues’ provider perception The services providers have to be aware how important is to compose an offer of value to the consumer, but a lot of them do not fully understand what the consumer perceived value is. Offering the service consistent to consumer perception and expectations leads to higher levels of customer satisfaction and customer loyalty. Due to this, service provider has to recognize all important factors of consumers’ perception in order to offer the value which consumers want. According to that it is important to analyze the differences between venues’ provider perception of consumers’ expectation and consumers’ perception.
When discussing the presence of meetings’ assistant, the venue’s architecture or outside grounds, this were considered added bonuses but were not essential. On the other side, for providers’ manager these three points were essential selling points, particularly the outside grounds. They are convinced that consumers seek for nice architecture and outside grounds.
Also, if we analyse what provides’ managers said about food delivering, we would conclude that the majority of them thought food and drinks inside of the meeting rooms was a good selling point. But, on the other side, consumers stated otherwise. They preferred not to eat in the conference room as venues’ providers think.
In that we can recognize the gap between consumers’ expectations and providers’ perception. There are gaps between customers’ wants and what venues’ provider think is important to offer. The research concludes that meeting customers are not satisfied with services as venues’ providers think.
I n t e r n a t i o n a l J o u r n a l o f M a n a g e m e n t C a s e s
92
ConclusionWhether a firm produces products or services is no longer a debate among academics that firm’s focus has to be primarily on the customer and customer’s perception. A lot of previous researches have indicated that service quality, customer perceived value and satisfaction are the key success factors in gaining competitive advantage within service providers (Parasuraman, Barry & Zeithaml, 1991). When evaluating the service value, consumers consider the transaction’s specific attributes as well as the price and the quality of the service (andreassen & lanseng, 1998). according to that every service provider has to indicate which service dimensions have the strongest influence on consumers’ perception.
The most of UK venues’ providers mean that their customers were satisfied with organized conferences or meetings. They are convinced that they offered the service value which consumers wanted. But on the other side, several selling points, highlighted by suppliers, would not be considered by users. It was important to underline that the consumers’ needs were specific and fewer than what the suppliers offer. The meetings’ assistant, the venue’s architecture or outside grounds were considered by consumers as not important service dimensions. That means supplier could provide a service with less costs, if they stop spending money with things users do not value as important ones. If a supplier is aware of those, before building the facility, on the long-run, its costs would be lower and its profitability would increase. Customer’ perception of service can be heightened by either delivering better service or reducing customer costs associated with using service (Ravald & Gronroos, 1996). So, the venue’ provider could reduce the services price in order to increase consumer’s perceived value. The lower price for high quality of service can be important competitive advantage especially in this period of recession.
ReferencesAllen, J. (1999), Event planning: The ultimate guide to successful meetings, corporate events, fundraising galas, conferences, conventions and other special events, New york, Chichester: Wiley
andreassen, t.W., lanseng, e. (1998), customer loyalty and complex services: The impact of corporate image on quality, customer satisfaction
and loyalty for customers with varying degrees of service expertise, International Journal of Service Industry Management, Vol. 9(1), pp 7-23
BACD (2007) General characteristics, benefits and value of business tourism: fact sheet, British Association of Conference Destinations
BacD (2008) British conference Venues Survey 2008, British association of conference Destinations
cronin, J. J. Jr., taylor, S. a. (1994), SeRVPeRF versus SERVQUAL: reconciling performance-based and perceptions-minus-expectations measurement of service quality, Journal of Marketing, Vol. 58, pp 125-131
Davidson (2003), Business Travel: Conferences, incentive travel, exhibitions, corporate hospitality and corporate travel, Harlow: Financial Times Prentice Hall
Davidson and Beulah (2003), Conferences, incentive travel, exhibitions, corporate hospitality and corporate travel, Harlow: Financial Times Prentice Hall
Kandampully, J., Suhartanto, D. (2000), Customer loyalty in the hotel industry: the role of customer satisfaction and image, International Journal of Contemporary Hospitality Management, Vol. 12, No. 6, pp 346-351
Kotler, P. (2001), Marketing management, MATE, Zagreb
Llambi, F. (2005), The congress and conventions market in the Americas: Basic introductory report presented in the International Seminar on “Conventions and Congress Tourism and Business Tourism”, World Travel Organisation
Markovic, S. (2005), Quality of services in hotel industry: concept and measuring, Tourisam and Hospitality Management, Vol. 11, No. 1, pp 47-69
Parasuraman, a. (1998), customer service in business-to-business markets: An agenda for research, Journal of Business & Industrial Marketing, Vol. 13(4/5), pp 309-321
Parasuraman, A., Barry, L.L., Zeithaml, V.A. (1991), Refinement and reassessment of the SERVQUAL scale, Journal of Retailing, 67(4), pp 420-450

93
I n t e r n a t i o n a l J o u r n a l o f M a n a g e m e n t C a s e s
Ravald, A., Gronroos, C. (1996), The value concept and relationship marketing, European Journal of Marketing, 30(2), pp 19-30
Roig, J.C.F., Garcia, J.S., Tena, M.A., Monzonis, J.L., (2006), Customer perceived value in banking
services, International Journal of Bank Marketing Vol. 24 No. 5, pp. 266-283
Vranesevic, T. (2000), Customer satisfaction management, Golden marketing, Zagreb
I n t e r n a t i o n a l J o u r n a l o f M a n a g e m e n t C a s e s
94
POLARIZATION OF CONSUMPTION - POVERTy AND WEALTH OF THE POLISH
HOUSEHOLDS
JOLANTA WITEKUNIVERSITy OF SZCZECIN, POLAND
Abstract
Economic, political and social changes which occurred in Poland in the early 90s led to the transformation of the social structure. The structural transformations resulted in the creation of a stratification according to income differentials and the level of consumption. The focus of research should be the process of the creation of the inequality in consumption as the most conspicuous symptom of the new social stratification. The analysis of the economic dimension of these transformations lets us view the system of inequalities in consumption as a result of changes in their macroeconomic determinants.
On the basis of conducted research referring to the trend in the transformation of consumption patterns, the process can be observed, which makes the consumption pattern of Polish households similar to consumption patterns characteristic of consumer societies, since changes in socio-economic conditions led to an increase in quantitative and qualitative fitting in equipment and appliances to fulfil consumer needs as well as luxury goods. This tendency is strengthened by transformations in the social structure, i.e. an increasing representation of the middle class with a relatively high income, which consumes goods supporting their social advance. However, in lower classes the pace of this process is slower, and a growing differentiation in access to luxury goods is observed. Along with economic changes in consumption conditions, which strengthen inequalities in consumption. Therefore, the polarization of the society into the poor and the rich is deepening.
Key words: household, income, consumption, consumer behaviour
Introduction Economic, political and social changes that took place in Poland in the early 1990s resulted in the transformation of the social structure. As a consequence of this structural transformation new social strata emerged with diversified incomes and types of consumption behaviour. The major factors that contributed to the changes in the distribution of wealth in the Polish society include: ownership transformation in the economy; restructuring of the economy; changed characteristics of the job market; the appearance of unemployment; new priorities in job evaluation such as increased importance of education (of a university degree in particular) and expertise in the development-oriented areas and falling demand for some outdated skills; an increased number of healthcare and old-age pensioners in the situation when the state could hardly compensate their income or social benefits.
The aim of the paper is to show the deepening income inequality in households in some social and economic groups that affected consumption during an introduction of the free market into the Polish economy. The presented research problem refers to the stream of synthetic generalisations concerning the changes in households . The confrontation of needs with economic resources of household members (their incomes, own work, durables resources, etc.) allows to demonstrate the differences among households located in various social and economic groups, their living conditions as well as the level and the structure of consumption which is an important structure-building element. It is in accordance with the modern concept of needs by L. Doyal and I. Gough who say that the criterion to assess needs is to be found not in their genesis nor in the mechanism of their emergence, but in the capacity to satisfy them . Therefore it seems that the Poles’ expectations in
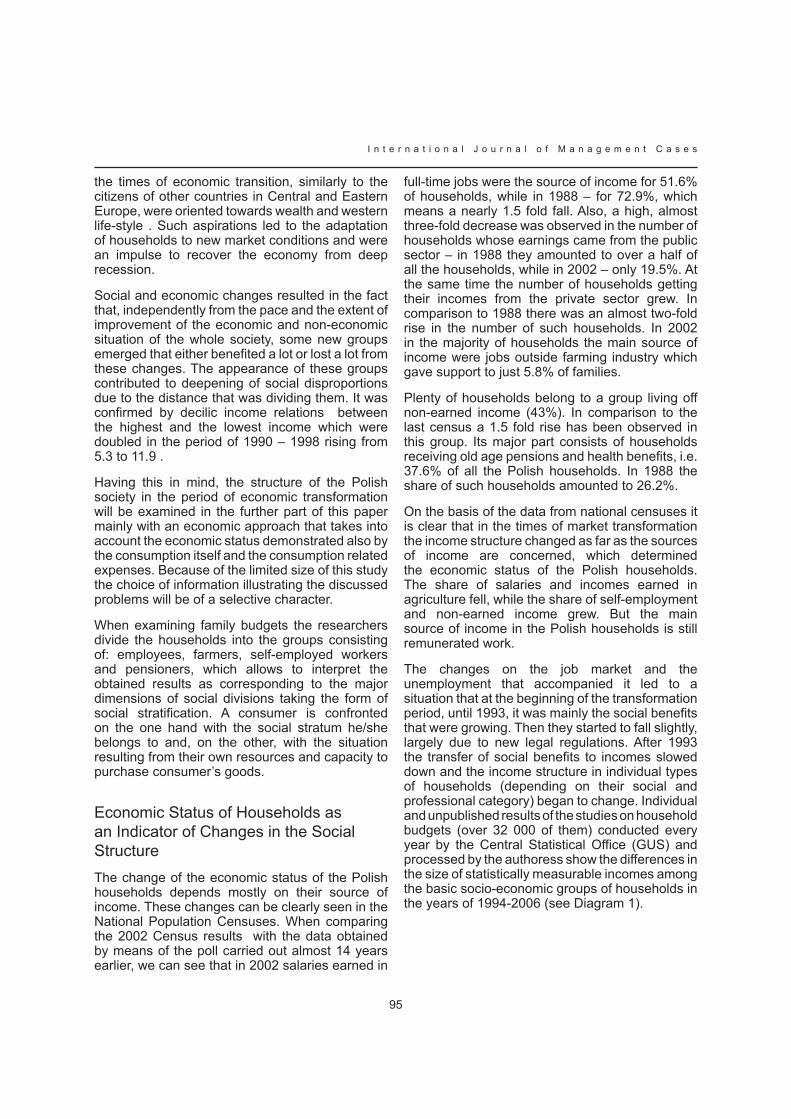
95
I n t e r n a t i o n a l J o u r n a l o f M a n a g e m e n t C a s e s
the times of economic transition, similarly to the citizens of other countries in Central and Eastern Europe, were oriented towards wealth and western life-style . Such aspirations led to the adaptation of households to new market conditions and were an impulse to recover the economy from deep recession.
Social and economic changes resulted in the fact that, independently from the pace and the extent of improvement of the economic and non-economic situation of the whole society, some new groups emerged that either benefited a lot or lost a lot from these changes. The appearance of these groups contributed to deepening of social disproportions due to the distance that was dividing them. It was confirmed by decilic income relations between the highest and the lowest income which were doubled in the period of 1990 – 1998 rising from 5.3 to 11.9 .
Having this in mind, the structure of the Polish society in the period of economic transformation will be examined in the further part of this paper mainly with an economic approach that takes into account the economic status demonstrated also by the consumption itself and the consumption related expenses. Because of the limited size of this study the choice of information illustrating the discussed problems will be of a selective character.
When examining family budgets the researchers divide the households into the groups consisting of: employees, farmers, self-employed workers and pensioners, which allows to interpret the obtained results as corresponding to the major dimensions of social divisions taking the form of social stratification. A consumer is confronted on the one hand with the social stratum he/she belongs to and, on the other, with the situation resulting from their own resources and capacity to purchase consumer’s goods.
Economic Status of Households as an Indicator of Changes in the Social Structure The change of the economic status of the Polish households depends mostly on their source of income. These changes can be clearly seen in the National Population Censuses. When comparing the 2002 Census results with the data obtained by means of the poll carried out almost 14 years earlier, we can see that in 2002 salaries earned in
full-time jobs were the source of income for 51.6% of households, while in 1988 – for 72.9%, which means a nearly 1.5 fold fall. Also, a high, almost three-fold decrease was observed in the number of households whose earnings came from the public sector – in 1988 they amounted to over a half of all the households, while in 2002 – only 19.5%. at the same time the number of households getting their incomes from the private sector grew. In comparison to 1988 there was an almost two-fold rise in the number of such households. In 2002 in the majority of households the main source of income were jobs outside farming industry which gave support to just 5.8% of families.
Plenty of households belong to a group living off non-earned income (43%). in comparison to the last census a 1.5 fold rise has been observed in this group. Its major part consists of households receiving old age pensions and health benefits, i.e. 37.6% of all the Polish households. in 1988 the share of such households amounted to 26.2%.
On the basis of the data from national censuses it is clear that in the times of market transformation the income structure changed as far as the sources of income are concerned, which determined the economic status of the Polish households. The share of salaries and incomes earned in agriculture fell, while the share of self-employment and non-earned income grew. But the main source of income in the Polish households is still remunerated work.
The changes on the job market and the unemployment that accompanied it led to a situation that at the beginning of the transformation period, until 1993, it was mainly the social benefits that were growing. Then they started to fall slightly, largely due to new legal regulations. After 1993 the transfer of social benefits to incomes slowed down and the income structure in individual types of households (depending on their social and professional category) began to change. Individual and unpublished results of the studies on household budgets (over 32 000 of them) conducted every year by the Central Statistical Office (GUS) and processed by the authoress show the differences in the size of statistically measurable incomes among the basic socio-economic groups of households in the years of 1994-2006 (see Diagram 1).
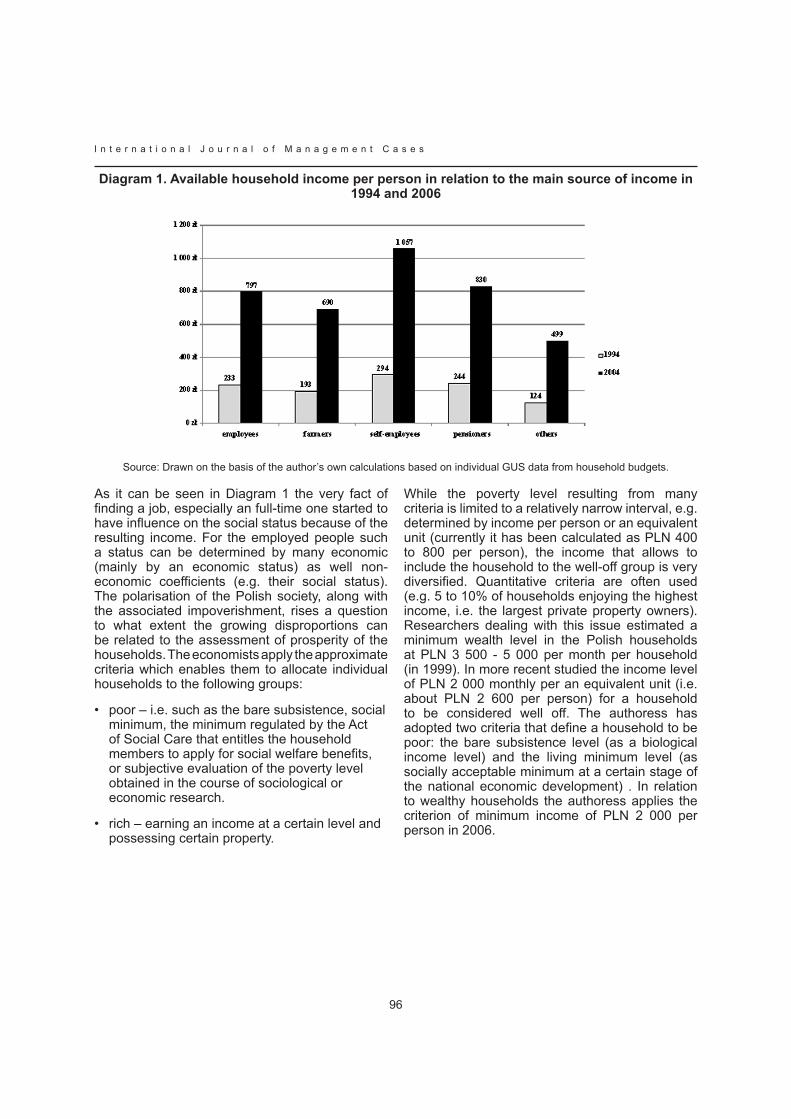
I n t e r n a t i o n a l J o u r n a l o f M a n a g e m e n t C a s e s
96
Diagram 1. Available household income per person in relation to the main source of income in 1994 and 2006
Source: Drawn on the basis of the author’s own calculations based on individual GUS data from household budgets.
As it can be seen in Diagram 1 the very fact of finding a job, especially an full-time one started to have influence on the social status because of the resulting income. For the employed people such a status can be determined by many economic (mainly by an economic status) as well non-economic coefficients (e.g. their social status). The polarisation of the Polish society, along with the associated impoverishment, rises a question to what extent the growing disproportions can be related to the assessment of prosperity of the households. The economists apply the approximate criteria which enables them to allocate individual households to the following groups:
poor – i.e. such as the bare subsistence, social minimum, the minimum regulated by the Act of Social Care that entitles the household members to apply for social welfare benefits, or subjective evaluation of the poverty level obtained in the course of sociological or economic research.
rich – earning an income at a certain level and possessing certain property.
•
•
While the poverty level resulting from many criteria is limited to a relatively narrow interval, e.g. determined by income per person or an equivalent unit (currently it has been calculated as PlN 400 to 800 per person), the income that allows to include the household to the well-off group is very diversified. Quantitative criteria are often used (e.g. 5 to 10% of households enjoying the highest income, i.e. the largest private property owners). Researchers dealing with this issue estimated a minimum wealth level in the Polish households at PLN 3 500 - 5 000 per month per household (in 1999). In more recent studied the income level of PLN 2 000 monthly per an equivalent unit (i.e. about PLN 2 600 per person) for a household to be considered well off. The authoress has adopted two criteria that define a household to be poor: the bare subsistence level (as a biological income level) and the living minimum level (as socially acceptable minimum at a certain stage of the national economic development) . In relation to wealthy households the authoress applies the criterion of minimum income of PLN 2 000 per person in 2006.
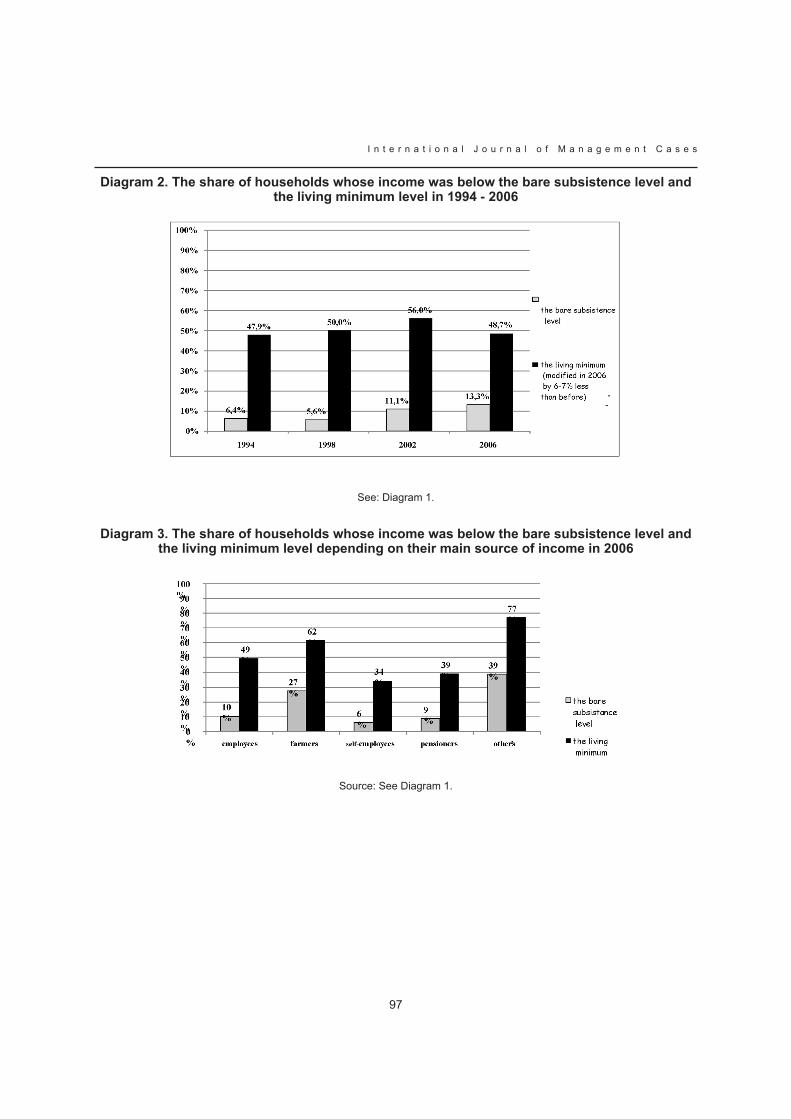
97
I n t e r n a t i o n a l J o u r n a l o f M a n a g e m e n t C a s e s
Diagram 2. The share of households whose income was below the bare subsistence level and the living minimum level in 1994 - 2006
See: Diagram 1.
Diagram 3. The share of households whose income was below the bare subsistence level and the living minimum level depending on their main source of income in 2006
Source: See Diagram 1.
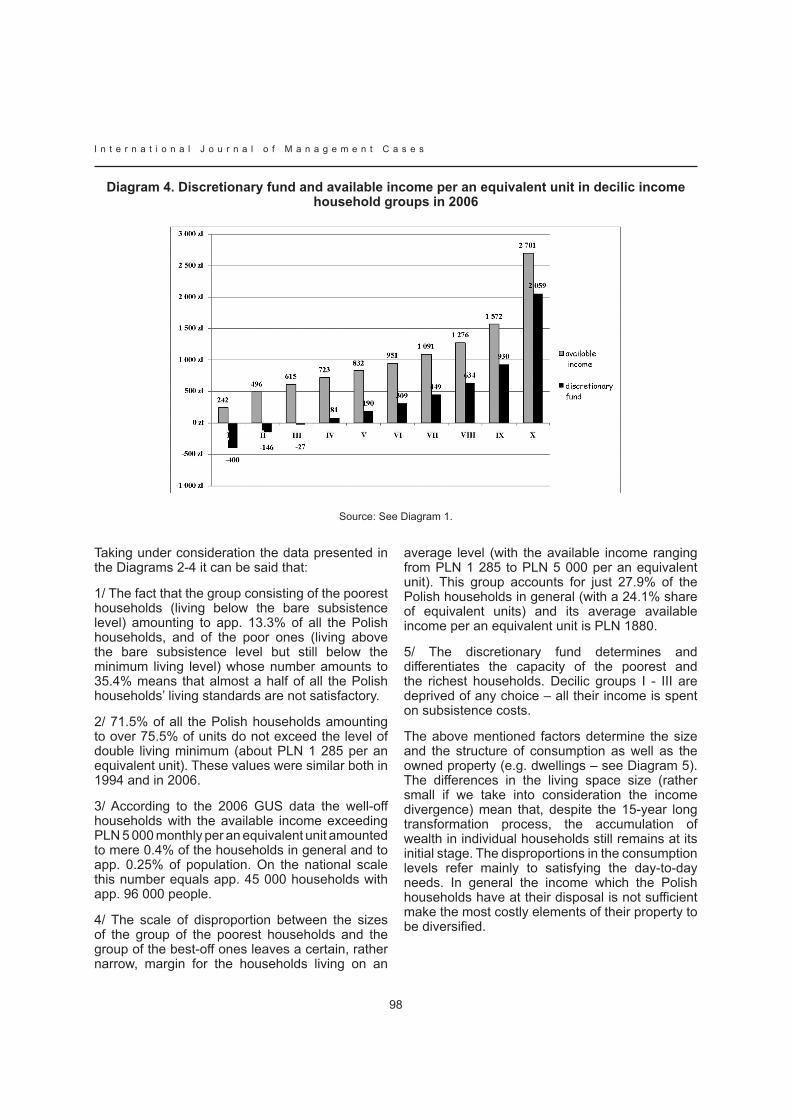
I n t e r n a t i o n a l J o u r n a l o f M a n a g e m e n t C a s e s
98
Diagram 4. Discretionary fund and available income per an equivalent unit in decilic income household groups in 2006
Source: See Diagram 1.
Taking under consideration the data presented in the Diagrams 2-4 it can be said that:
1/ The fact that the group consisting of the poorest households (living below the bare subsistence level) amounting to app. 13.3% of all the Polish households, and of the poor ones (living above the bare subsistence level but still below the minimum living level) whose number amounts to 35.4% means that almost a half of all the Polish households’ living standards are not satisfactory.
2/ 71.5% of all the Polish households amounting to over 75.5% of units do not exceed the level of double living minimum (about PlN 1 285 per an equivalent unit). These values were similar both in 1994 and in 2006.
3/ According to the 2006 GUS data the well-off households with the available income exceeding PLN 5 000 monthly per an equivalent unit amounted to mere 0.4% of the households in general and to app. 0.25% of population. On the national scale this number equals app. 45 000 households with app. 96 000 people.
4/ the scale of disproportion between the sizes of the group of the poorest households and the group of the best-off ones leaves a certain, rather narrow, margin for the households living on an
average level (with the available income ranging from PlN 1 285 to PlN 5 000 per an equivalent unit). This group accounts for just 27.9% of the Polish households in general (with a 24.1% share of equivalent units) and its average available income per an equivalent unit is PlN 1880.
5/ The discretionary fund determines and differentiates the capacity of the poorest and the richest households. Decilic groups I - III are deprived of any choice – all their income is spent on subsistence costs.
The above mentioned factors determine the size and the structure of consumption as well as the owned property (e.g. dwellings – see Diagram 5). The differences in the living space size (rather small if we take into consideration the income divergence) mean that, despite the 15-year long transformation process, the accumulation of wealth in individual households still remains at its initial stage. The disproportions in the consumption levels refer mainly to satisfying the day-to-day needs. In general the income which the Polish households have at their disposal is not sufficient make the most costly elements of their property to be diversified.
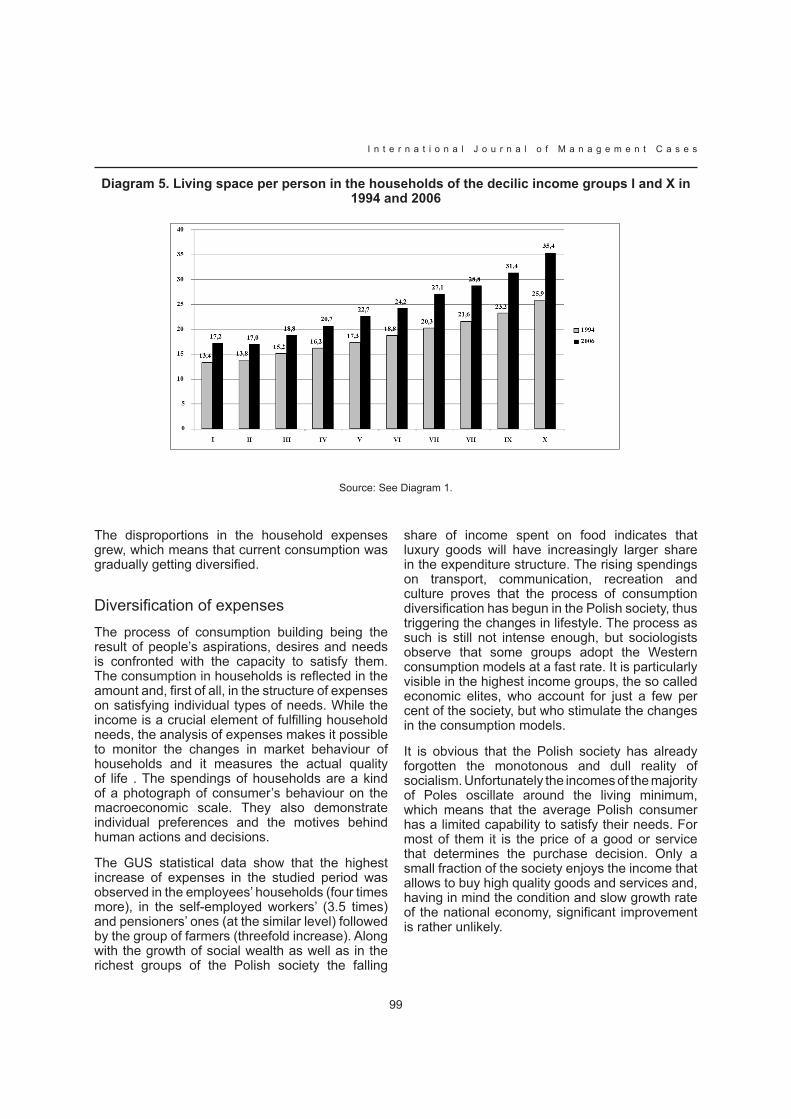
99
I n t e r n a t i o n a l J o u r n a l o f M a n a g e m e n t C a s e s
Diagram 5. Living space per person in the households of the decilic income groups I and X in 1994 and 2006
Source: See Diagram 1.
The disproportions in the household expenses grew, which means that current consumption was gradually getting diversified.
Diversification of expensesThe process of consumption building being the result of people’s aspirations, desires and needs is confronted with the capacity to satisfy them. The consumption in households is reflected in the amount and, first of all, in the structure of expenses on satisfying individual types of needs. While the income is a crucial element of fulfilling household needs, the analysis of expenses makes it possible to monitor the changes in market behaviour of households and it measures the actual quality of life . The spendings of households are a kind of a photograph of consumer’s behaviour on the macroeconomic scale. They also demonstrate individual preferences and the motives behind human actions and decisions.
The GUS statistical data show that the highest increase of expenses in the studied period was observed in the employees’ households (four times more), in the self-employed workers’ (3.5 times) and pensioners’ ones (at the similar level) followed by the group of farmers (threefold increase). Along with the growth of social wealth as well as in the richest groups of the Polish society the falling
share of income spent on food indicates that luxury goods will have increasingly larger share in the expenditure structure. The rising spendings on transport, communication, recreation and culture proves that the process of consumption diversification has begun in the Polish society, thus triggering the changes in lifestyle. The process as such is still not intense enough, but sociologists observe that some groups adopt the Western consumption models at a fast rate. It is particularly visible in the highest income groups, the so called economic elites, who account for just a few per cent of the society, but who stimulate the changes in the consumption models.
It is obvious that the Polish society has already forgotten the monotonous and dull reality of socialism. Unfortunately the incomes of the majority of Poles oscillate around the living minimum, which means that the average Polish consumer has a limited capability to satisfy their needs. For most of them it is the price of a good or service that determines the purchase decision. Only a small fraction of the society enjoys the income that allows to buy high quality goods and services and, having in mind the condition and slow growth rate of the national economy, significant improvement is rather unlikely.
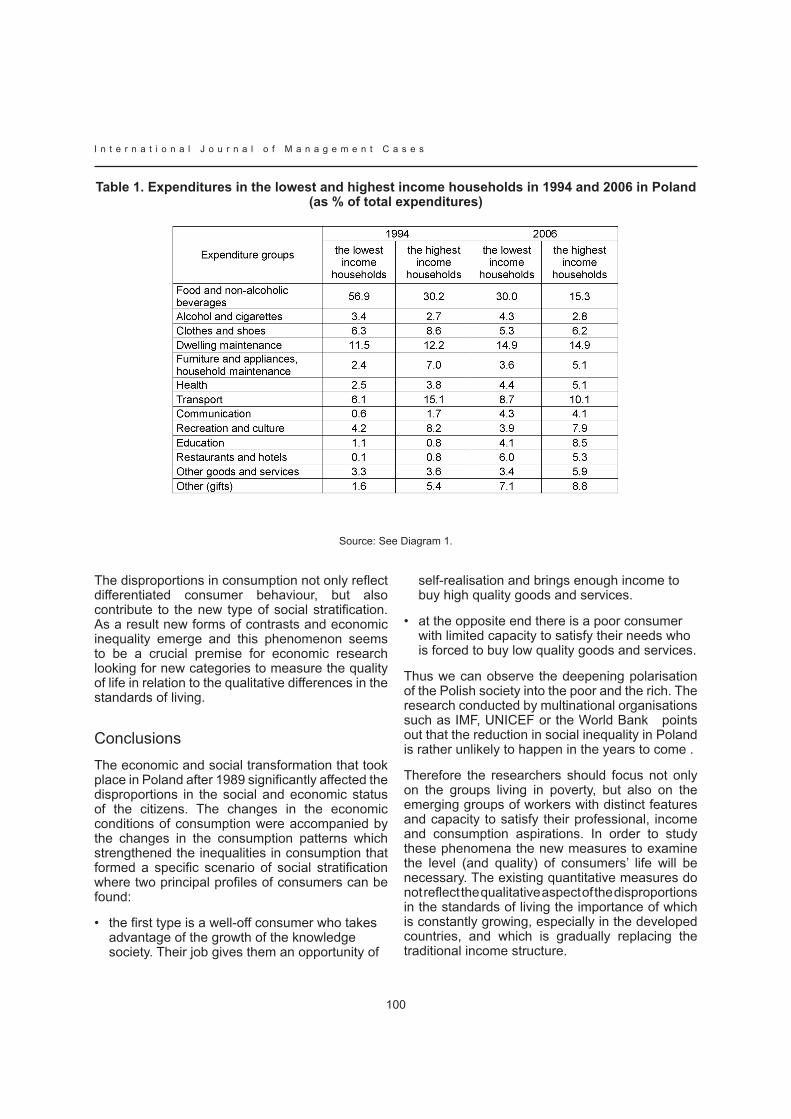
I n t e r n a t i o n a l J o u r n a l o f M a n a g e m e n t C a s e s
100
Table 1. Expenditures in the lowest and highest income households in 1994 and 2006 in Poland (as % of total expenditures)
Source: See Diagram 1.
The disproportions in consumption not only reflect differentiated consumer behaviour, but also contribute to the new type of social stratification. As a result new forms of contrasts and economic inequality emerge and this phenomenon seems to be a crucial premise for economic research looking for new categories to measure the quality of life in relation to the qualitative differences in the standards of living.
ConclusionsThe economic and social transformation that took place in Poland after 1989 significantly affected the disproportions in the social and economic status of the citizens. The changes in the economic conditions of consumption were accompanied by the changes in the consumption patterns which strengthened the inequalities in consumption that formed a specific scenario of social stratification where two principal profiles of consumers can be found:
the first type is a well-off consumer who takes advantage of the growth of the knowledge society. Their job gives them an opportunity of
•
self-realisation and brings enough income to buy high quality goods and services.
at the opposite end there is a poor consumer with limited capacity to satisfy their needs who is forced to buy low quality goods and services.
Thus we can observe the deepening polarisation of the Polish society into the poor and the rich. The research conducted by multinational organisations such as IMF, UNICEF or the World Bank points out that the reduction in social inequality in Poland is rather unlikely to happen in the years to come .
Therefore the researchers should focus not only on the groups living in poverty, but also on the emerging groups of workers with distinct features and capacity to satisfy their professional, income and consumption aspirations. In order to study these phenomena the new measures to examine the level (and quality) of consumers’ life will be necessary. The existing quantitative measures do not reflect the qualitative aspect of the disproportions in the standards of living the importance of which is constantly growing, especially in the developed countries, and which is gradually replacing the traditional income structure.
•
101
I n t e r n a t i o n a l J o u r n a l o f M a n a g e m e n t C a s e s
SALES TRAINING TECHNIQUES IN CROATIA
MARIJA TOMASEVIC LISANINUNIVERSITy OF ZAGREB, CROATIA
MIRKO PALICUNIVERSITy OF ZAGREB, CROATIA
KRISTINA OZIMECUNIVERSITy OF ZAGREB, CROATIA
Abstract
Developing a successful and productive salesperson is a great challenge to sales managers. Sales training seems to moderate the relationship between sales force performance and effectiveness. As considerable amount of time and money is annually invested in sales training programs the interest for its effects on sales trainees and company’s performance is understandable. The aim of this article is to explore recent developments and find out the prevailing attitudes of Croatian companies towards the Sales training practice as well as to explore different training concepts designed for Sales personnel in Croatia. The paper also encompasses an extensive overview of used training types, training frequency and continuity, and estimation of average training budgets. The research has also examined who is in charge of delivering sales trainings in Croatian companies. The special questionnaire was designed to carry out the research and to test and verify hypothesis. The questionnaire was applied to purposive sample of SMEs as well as to large companies. The importance of well conducted research on presently used sales training behavior can be extremely beneficial for the development of more efficient trainings in the future as sales efficiency represents one of the core components of company’s competitive performance in the turbulent and progressively more competitive marketplace.
Key words: sales, marketing, training, Croatia
IntroductionToday’s dynamic marketplace forces companies to constantly look for new ways to improve the productivity and profitability of their sales force. According to Learning International Organization there are seven sales challenges organizations have to meet when they are to survive in the competitive market: (1) Distinguish between similar products and services, (2) Putting together groups of products to form a business solution, (3) Handling the more educated buying population, (4) Mastering the art of consultative selling, (5) Managing a team selling approach, (6) Knowing the customer’s business and (7) Adding value through service (Jobber and Lancaster, 2003). It is obvious that only producing the best product or service is not enough, these products or services also have to be sold and that is not an easy task nowadays. Market globalization trends increased competition and created more demanding customers. Therefore, in order to survive companies must have highly knowledgeable and skillful sales force at their disposal. It is not enough to expect that salespeople will learn everything they need to know to close a successful sale by chance or along the way. To enhance the sales force performance both Top management and HR management must consider implementing more versatile, frequent and interactive additional education. As salespeople are the variable that has the most significant impact on company’s success they must be provided with suitable and adequate training that is able to respond to organizational change, internal issues and external pressures.
I n t e r n a t i o n a l J o u r n a l o f M a n a g e m e n t C a s e s
102
Sales training and educationDubinsky and Staples (1982) conceptualize sales training as providing the salesperson with requisite knowledge and selling skills. Goldstein (1993) defines training as the systematic acquisition of skills, rules concepts and attitudes that results in improved performance in another environment. When Goldstein’s definition is put in sales environment, changes in a salesperson behavior and performance must be evident. And after all that is the main objective of the sales training. Wilson at al. (2002) found that learning oriented salespeople are more likely to approach sales training as an opportunity to do their jobs more effectively and consequently because of their inherent desire to acquire increased understanding and knowledge such individuals are more likely to apply what they learned during training. Therefore sales organization should pay more attention to these personality traits and implement adequate psycho-diagnostic instruments in their recruitment procedure.
Training must be an ongoing commitment for new and veteran employees and type of the training should be different, based on the trainee’s level of experience. (Pell, 1989). too often, salespeople receive initial sales training which is usually not reinforced. (Pettijohn & Pettijohn, 1994). Such training concept can work for a while but it does not have a potential to establish long lasting effects on sales performance.
There are usually three typical stages of sales training:
assessment (determination of training needs and objectives),
training (selection of topics to covered, trainers, methods, facilities and implementation plan) and
evaluation (assessment of programme effectiveness).
Integration of those three stages has objective to increase sales performance.
Sales training topicsBased on their research Chonko at al. (1993) reported important training topics in descending order of importance as follows: Selling Techniques,
1.
2.
3.
Product knowledge, Negotiation skills, Sales Aids, Technical training, Customer service, Professionalism, Rapport building, Quality control, Competitive knowledge and Time management. That indicates that sales personnel consider Selling techniques and Product knowledge as the two most important training issues.
Jobber and Lancester (2003) described five components a sales training programme usually covers:
the company – objectives, policies and organization
Products
Competitors and their products
Selling procedure and techniques
Work organization and report preparation.
The first component includes a brief history of the company, relevant policies and description of sales function and its relationship with marketing function. The second component includes a description of how products are made and the implications product quality and reliability as well as product’s features and benefits. Under the third component competitors and their products are analyzed. Selling procedure and techniques is considered to be the major component of a training program and it involves practical sessions where trainees develop skills. The final component endeavors to establish good habits among trainees.
Companies must also consider using various training materials to enhance sales education. Training materials must be chosen smartly to fit the particular training topic and sales training method. The most frequently used training materials are lecture manuals, videotapes, role playing, computer simulation and case studies.
Sales training methodsDubinsky at al. (2001) found that training that occurs within the firm appears to be more satisfying for trainees than when the training is held off-site (at another company’s location or college).
Over the last ten years the CIPD Learning and Development survey has identified the changes in workplace learning. in 2008, report included a number of questions that have appeared regularly
1.
2.
3.
4.
5.
103
I n t e r n a t i o n a l J o u r n a l o f M a n a g e m e n t C a s e s
in previous surveys to assess how far these changes have taken place, as well as a number of questions to identify anticipated changes for the next five years.
It is clear that all types of organization across both the public and private sector have experienced change over the last two years in delivering learning and training. in 2008 survey organizations were asked to identify the key changes over the past two years. The results indicate that forecasts organizations made in 2005 and 2007 were mostly right, which means that coaching by line managers is the aspect that has been used more in the last two years than any other learning and development practice. Usage of e-learning is also increasing and almost half organizations that took part in the research said they used e-learning more in the last two years than ever before. Mentoring and buddying is an aspect highlighted as a growth area in 2007 as well and about one third of organizations included in research said they use this practice more than previously. Furthermore, in-house development programmes are slightly more widespread than it was anticipated.
Sales training evaluationTraining evaluation can be defined as the systematic collection of descriptive and judgmental information necessary to make effective training decisions related to selection, adoption, value, and modification of various instructional activities (Goldstein, 1993). Training evaluation is inseparably linked to training objectives while the successfulness and effectiveness of the conducted training depend on achieving training goals. But some authors (Dubinsky at al., 2001.) emphasize the problem of insufficient measuring of training benefits. So, there are still many organizations that implement the sales training programs but don’t focus enough on evaluating it. Dubinsky at al. (2001) summarized reasons for training evaluation importance. According to their report training should be evaluated because it entails allocation and utilization of organizational resources, it serves as diagnostic tool providing information about what changes, deletions or additions should be made in program, and it can be used as input into determining trainee needs.
A study by Stamford-Bewley and Jobber sought to identify the methods used to evaluate training courses among a sample of UK companies. They
found out that only 57% attempted to measure changes in sales volume which may occur as a result of the training course. More popular were field visits with sales person (78%) where the sales manager would subjectively gauge whether ability had improved as a result of the training course.
Research goalsThe purpose of this article is to discuss the amount and type of the education courses and training that are used in sales departments in Croatian firms.
The following hypothesis have been tested - referring to Croatian sales force training activities that have been made the scope of this research:
Education and training programmes in Croatian companies are mostly focused on products and selling procedure and techniques.
The most commonly used training methods in Croatian companies are in-house courses.
Croatian companies do not evaluate their training programmes systematically and consistently.
MethodologyBased on previous research in sales training field, literature review, Croatian market insights and authors’ personal experience a highly structured questionnaire was developed. The questionnaire was constructed to examine research goals. Based on these objections the items in our survey were designed to cover information about training topics, training methods, training evaluation and general company data. The questionnaire was web based. It was uploaded using Survey monkey and the link to the questionnaire was delivered to companies using e-mail together with brief research goals outline.
The questionnaire was intended to be filled in by sales managers or human resource managers. The questionnaire was distributed to 300 companies. 125 questionnaires were returned but only 86 questionnaires were completely valid and used in further data analyses, that makes response rate of 28,7%. according to business size attribute our analyzed sample was pretty much balanced, that is 30% of companies were small businesses, 28% medium sized businesses and 42% big
1.
2.
3.
I n t e r n a t i o n a l J o u r n a l o f M a n a g e m e n t C a s e s
104
businesses. There was only one questionnaires distribution yet, but in further research we intend to resend our request for questionnaire completion.
Data were analyzed using SPSS.
Research resultsMain findings of our research are mostly presented in Tables 1, 2 and 3. Results shown in Table 1 provide some insights concerning sales training content covered, Table 2 presents situation in usage of sales training methods and Table 3 summarizes sales training evaluation status in Croatian companies.
86 companies in total took part in our research. graph 1 displays that 90% out of 86 companies reported that they have been investing in education and training of sales staff during last two years, while there were 10% of companies that didn’t made any investment in educational training. Furthermore it is evident that not all companies that invest in training also make some analyses prior to training realization. Graph 2 shows that only 62 companies or 76% of those companies that invest in training conduct some training need analyses as well.
Product knowledge topics are the most usually covered topics in sales training in Croatian companies as it can be seen in table 1. 74% of companies often provide education concerning product knowledge. Half of the companies also often cover Market and competition knowledge and Selling techniques topics. Interpersonal and communication skills and Presentation and demonstration skills are very well represented in training programs and almost 90% of companies provide training on these topics often or sometimes. it is surprising that only 24% of companies often provide Motivational training and Computer skills, 26% of companies never cover these topics, while half of the companies sometimes involve its
salespeople in Motivational training and Computer skills. Motivational training is of great importance for people employed in sales and companies should consider using training covering motivation more often. There is a similar situation with Time management which is only in 10% of the companies often included in training.
Organization policy and Work ethics topics are highly represented in company training schemas while about 75% of companies use it sometimes or even often.
Strategic planning is in 53% of companies used sometimes, in 18% of companies often and about 29% of companies never include it in training. Team work is used sometimes in half of the companies, often in 33% of companies but surprisingly in 17% of companies such a training is never conducted.
Territory management, Foreign language skills and Sales forecasting appear to be underestimated topics and most of the companies don’t cover them in training programs.
More than 80% of all companies mostly use in-house courses run by company trainers and Conferences, workshops and events in education programs. On the job training is also very popular method and 74% of croatian companies use it to educate their sales employees. External short courses and in-house courses run by an external provider are also frequently used methods while about two thirds of companies applied them.
Academic education, Coaching and Mentoring make up a group of methods that are half used. About 50% of companies incorporated these methods in their training methods supply and 50% didn’t.
External training programs longer than a week are not used by 73% of the companies and 62% of the companies don’t use E-learning at all for their trainings.
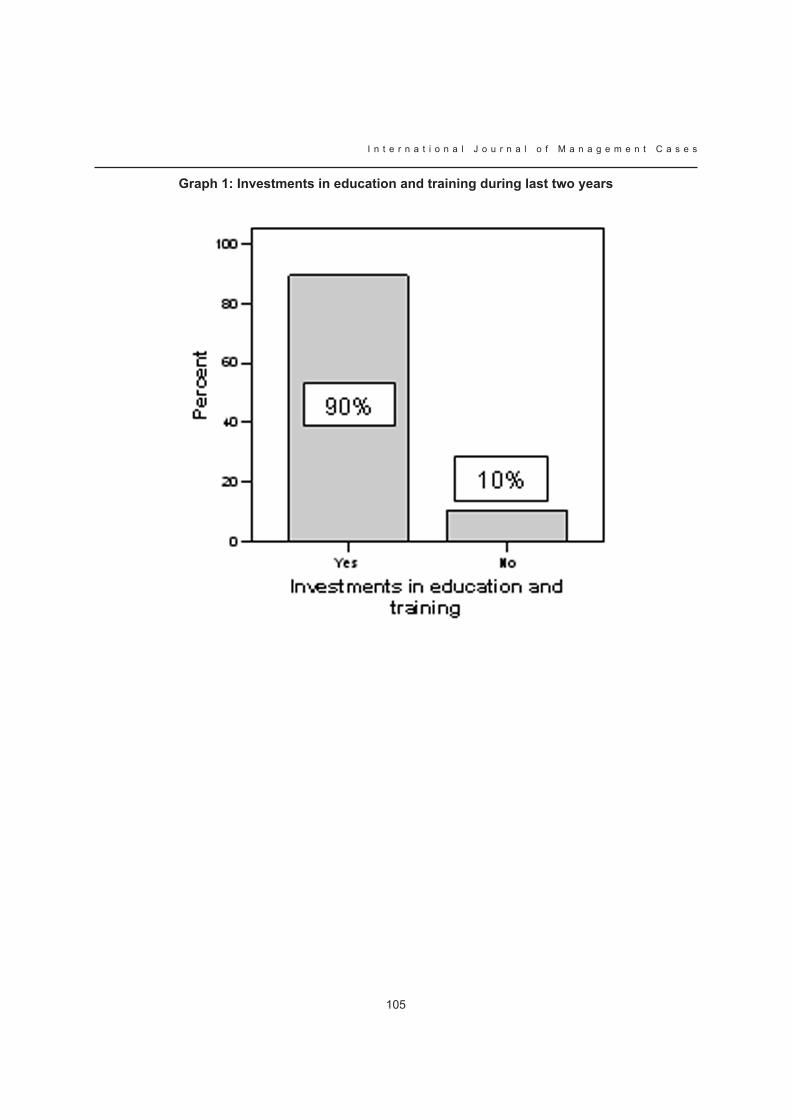
105
I n t e r n a t i o n a l J o u r n a l o f M a n a g e m e n t C a s e s
Graph 1: Investments in education and training during last two years
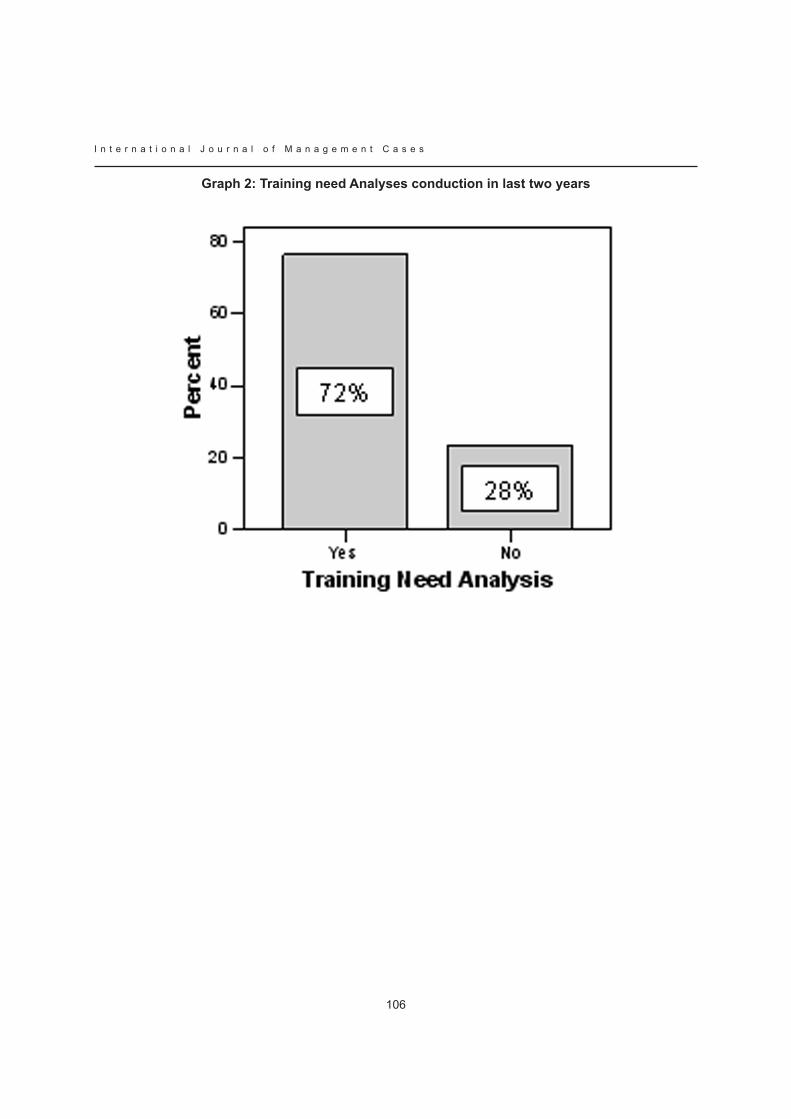
I n t e r n a t i o n a l J o u r n a l o f M a n a g e m e n t C a s e s
106
Graph 2: Training need Analyses conduction in last two years
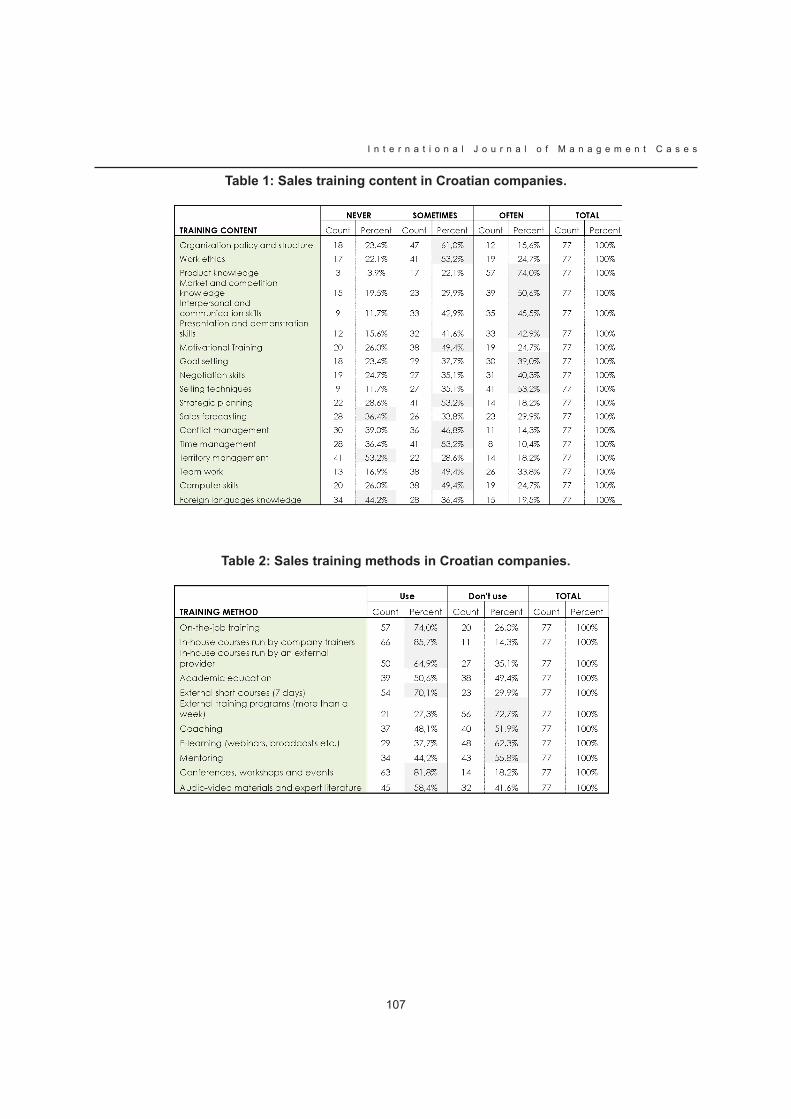
107
I n t e r n a t i o n a l J o u r n a l o f M a n a g e m e n t C a s e s
Table 1: Sales training content in Croatian companies.
Table 2: Sales training methods in Croatian companies.
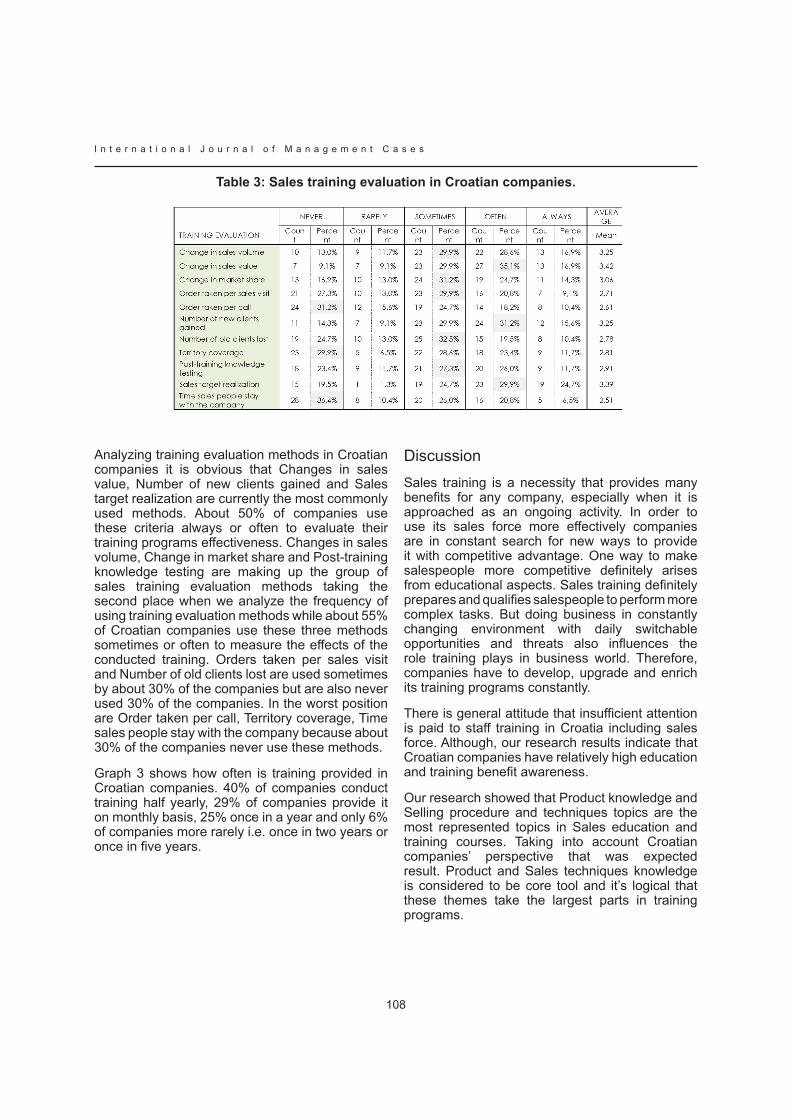
I n t e r n a t i o n a l J o u r n a l o f M a n a g e m e n t C a s e s
108
Table 3: Sales training evaluation in Croatian companies.
Analyzing training evaluation methods in Croatian companies it is obvious that Changes in sales value, Number of new clients gained and Sales target realization are currently the most commonly used methods. About 50% of companies use these criteria always or often to evaluate their training programs effectiveness. Changes in sales volume, Change in market share and Post-training knowledge testing are making up the group of sales training evaluation methods taking the second place when we analyze the frequency of using training evaluation methods while about 55% of Croatian companies use these three methods sometimes or often to measure the effects of the conducted training. Orders taken per sales visit and Number of old clients lost are used sometimes by about 30% of the companies but are also never used 30% of the companies. In the worst position are Order taken per call, Territory coverage, Time sales people stay with the company because about 30% of the companies never use these methods.
Graph 3 shows how often is training provided in croatian companies. 40% of companies conduct training half yearly, 29% of companies provide it on monthly basis, 25% once in a year and only 6% of companies more rarely i.e. once in two years or once in five years.
DiscussionSales training is a necessity that provides many benefits for any company, especially when it is approached as an ongoing activity. In order to use its sales force more effectively companies are in constant search for new ways to provide it with competitive advantage. One way to make salespeople more competitive definitely arises from educational aspects. Sales training definitely prepares and qualifies salespeople to perform more complex tasks. But doing business in constantly changing environment with daily switchable opportunities and threats also influences the role training plays in business world. Therefore, companies have to develop, upgrade and enrich its training programs constantly.
There is general attitude that insufficient attention is paid to staff training in Croatia including sales force. Although, our research results indicate that Croatian companies have relatively high education and training benefit awareness.
Our research showed that Product knowledge and Selling procedure and techniques topics are the most represented topics in Sales education and training courses. Taking into account Croatian companies’ perspective that was expected result. Product and Sales techniques knowledge is considered to be core tool and it’s logical that these themes take the largest parts in training programs.
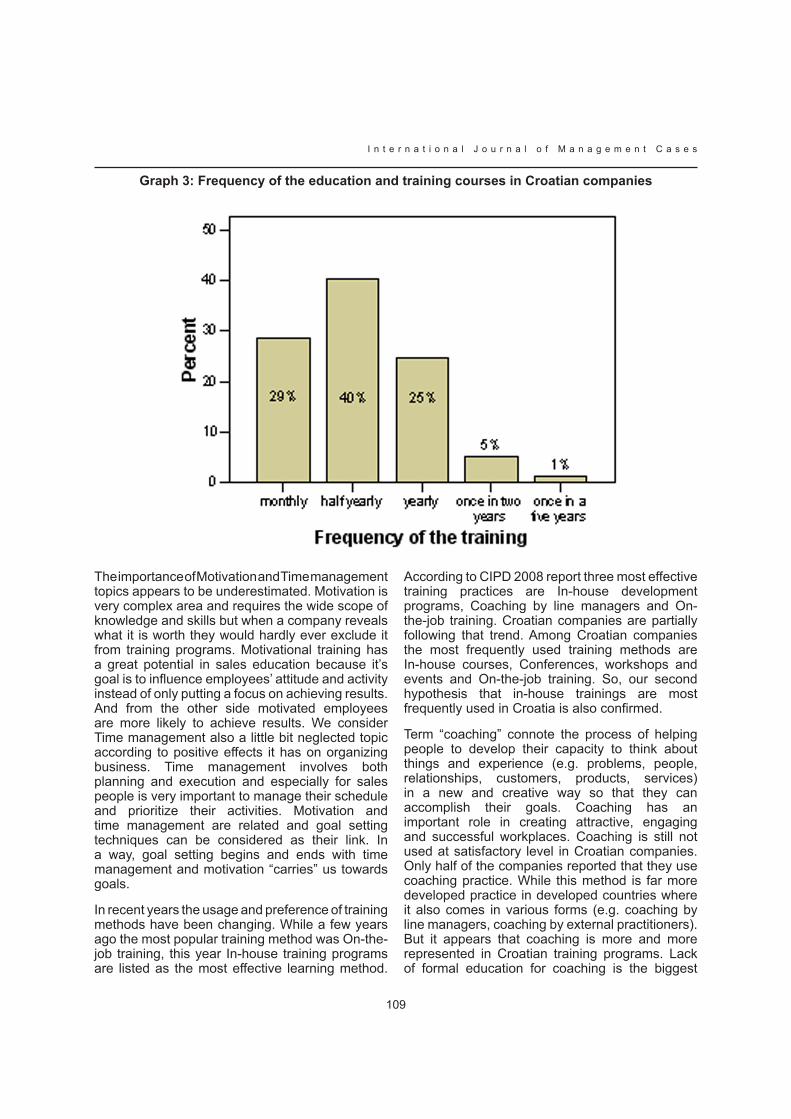
109
I n t e r n a t i o n a l J o u r n a l o f M a n a g e m e n t C a s e s
Graph 3: frequency of the education and training courses in Croatian companies
The importance of Motivation and Time management topics appears to be underestimated. Motivation is very complex area and requires the wide scope of knowledge and skills but when a company reveals what it is worth they would hardly ever exclude it from training programs. Motivational training has a great potential in sales education because it’s goal is to influence employees’ attitude and activity instead of only putting a focus on achieving results. And from the other side motivated employees are more likely to achieve results. We consider Time management also a little bit neglected topic according to positive effects it has on organizing business. Time management involves both planning and execution and especially for sales people is very important to manage their schedule and prioritize their activities. Motivation and time management are related and goal setting techniques can be considered as their link. In a way, goal setting begins and ends with time management and motivation “carries” us towards goals.
In recent years the usage and preference of training methods have been changing. While a few years ago the most popular training method was On-the-job training, this year In-house training programs are listed as the most effective learning method.
according to ciPD 2008 report three most effective training practices are In-house development programs, Coaching by line managers and On-the-job training. Croatian companies are partially following that trend. Among Croatian companies the most frequently used training methods are In-house courses, Conferences, workshops and events and On-the-job training. So, our second hypothesis that in-house trainings are most frequently used in Croatia is also confirmed.
Term “coaching” connote the process of helping people to develop their capacity to think about things and experience (e.g. problems, people, relationships, customers, products, services) in a new and creative way so that they can accomplish their goals. Coaching has an important role in creating attractive, engaging and successful workplaces. Coaching is still not used at satisfactory level in Croatian companies. Only half of the companies reported that they use coaching practice. While this method is far more developed practice in developed countries where it also comes in various forms (e.g. coaching by line managers, coaching by external practitioners). But it appears that coaching is more and more represented in Croatian training programs. Lack of formal education for coaching is the biggest
I n t e r n a t i o n a l J o u r n a l o f M a n a g e m e n t C a s e s
110
obstacle to application of that method. Coaching is most usually performed by psychologists and people that have much experience in human resource field, but some integrated programs for developing coachers is starting to emerge yet.
Although new technology is more and more welcomed and accepted in business procedures, the learning arena is still dominated by more traditional methods. Computer and web based learning are used in 30% of companies in Croatia which is pretty good for developing country. Croatian companies definitely don’t use E-learning in its full potential. But during EU accession period we can expect that percentage to grow. So, it would be interesting to repeat our study next year again to see in which direction E-learning adoption will go in Croatia.
Croatian companies should also consider using some other methods such as Job rotation, secondment and shadowing that are used in foreign companies and were not included in our research.
According to our results there are no evaluation methods that are always used for measuring training effects. So, we can consider our third hypothesis that Croatian companies do not evaluate their training programes systematically and consistently correct as well. To rate expenditures for training it is important to develop business intelligence tools that will help companies improve the measurement of training effectiveness. These tools need to provide a methodology to measure, evaluate, and continuously improve training.
It is expected that over the next five years greater responsibility will be devolved to line managers to determine the learning and development needs of the organization as a whole. However, the main changes anticipated that affect learning and development in organizations over the next five years include a closer integration of learning and development activity and business strategy and more emphasis on monitoring, measurement and evaluation of training effectiveness.
It is still needed to work on developing the training importance awareness in Croatia. Although our research results are rather optimistic we have to keep in mind that our questionnaire was mainly answered by those companies that have higher training necessity sense. Also the question is what treatment do education and training get in those
two thirds of companies that didn’t answer our questionnaire. So, it is important to try to find out their reasons for not participating in our research.
Croatian companies still have to find the best combination of training topics and methods to induce desirable changes in salesperson behavior to reach higher level of performance.
ConclusionTraining is a critical component in any organization’s strategy. Topics covered in training must be various and well adjusted to each company and its business type and business style. Education and training programmes in Croatian companies are mostly focused on Products and Selling procedure and techniques. Also more accent should be put on motivational training and Time management. The most commonly used training methods in Croatian companies are in-house courses. Although Coaching has great potential is still not used by satisfactory level in Croatian companies. It is important to keep the track of education and training effectiveness organizations don’t always evaluate the business impact of a training program. To rate expenditures for training it is important to develop business intelligence tools that will help companies improve the measurement of training effectiveness. These tools need to provide a methodology to measure, evaluate, and continuously improve training, as well as the organizational and technical infrastructure to implement the methodology. Companies usually provide training half-yearly and their education and training awareness increases.
References
Artis, A., & Harris, E. (2007). Self-directed learning and sales force performance: an integrated framework. Journal of Personal Selling & Sales Management, 27(1), 9-24. Retrieved March 12, 2009, from Business Source Complete database.
Chonko, L., Tanner Jr., J., & Weeks, W. (1993). Sales Training: Status and Needs. Journal of Personal Selling & Sales Management, 13(4), 81-86. Retrieved March 12, 2009, from Business Source Complete database.
ciPD (2008), learning and Develpment, annual survey report.
111
I n t e r n a t i o n a l J o u r n a l o f M a n a g e m e n t C a s e s
Dubinsky, A. (1996). Some Assumptions about the Effectiveness of Sales Training. Journal of Personal Selling & Sales Management, 16(3), 67-76. Retrieved March 12, 2009, from Business Source Complete database.
Dubinsky, A.J; Mehta, R.; Anderson, R.E. (2001), „Satisfaction with sales manager training“, European Journal of Marketing, Vol. 35, pp. 27-50.
Jobber, D. and Lancaster, G. (2003). Selling and Sales Management 6th Edition, London: Prentice Hall.
Leach, M., & Liu, A. (2003). Investigating interrelationships among sales training evaluation methods. Journal of Personal Selling & Sales
Management, 23(4), 327-339. Retrieved March 12, 2009, from Business Source Complete database.
Pettijohn, l.S. and Pettijohn, c.e. (1994), “Retail Sales training – Practices and Prescriptions”, Journal of Services Marketing, Vol. 8, pp. 17-26.
Roman, S.; Ruiz, S. and Munuera, J.L. (2002), “The effects of sales training on sales force activity”, European Journal of Marketing, Vol. 36, pp. 1344-1366.
Wilson, P., Strutton, D., & Farris II, M. (2002). Investigating the Perceptual Aspect of Sales Training. Journal of Personal Selling & Sales Management, 22(2), 77-86., Spring, Retrieved March 12, 2009, from Business Source Complete database.
I n t e r n a t i o n a l J o u r n a l o f M a n a g e m e n t C a s e s
112
FRANCHISING AND ITS IMPACT ON SMALL-MEDIUM ENTERPRISES: A
FOCUS ON SAUDI ARABIAN BUSINESS ENVIRONMENT
MUHAMMAD ASAD SADIKING FAHD UNIVERSITy OF PETROLEUM AND MINERALS, DHAHRAN (SAUDI ARABIA)
WAJDI KHALIL AL-FUZAIARMACELL ZAMIL MIDDLE EAST COMPANy, DAMMAM (SAUDI ARABIA)
Abstract
This study is conducted to examine the usefulness of franchising concept for business success among Small-Medium Enterprises (SMEs) and to evaluate the factors that govern that success. The study is descriptive in nature but several hypotheses were tested empirically. The hypotheses are drawn from the conceptual foundation developed in the literature on franchising and SMEs. The study reveals that the perception and attitude toward franchising does not reflect the perceived importance of the concept and the success of companies has a significant relationship with perceived benefits of franchising. The tested success factors have shown strong impact of the overall success of organization. The study also tested the failure of franchising.
Key Words: Franchising Concept, Small-Medium Enterprises, Perception and Attitude
IntroductionFranchising has grown tremendously over the last ten years in terms of total sales and market share in Saudi Arabia. American, European and local franchises continue to remain successful as SMEs. Many of franchise brand names have already proven successful in the market place and crated fortunes for business entrepreneurs. Saudi entrepreneurs generally have sufficient capital and craving for business entrepreneurship. However, they do not always have the vision to venture out on their own with a totally new operation or idea, creating excellent potential for franchising.
The concept of franchising has been a popular mode of business expansion, especially with the younger generation of entrepreneurs in Saudi arabia. the younger generation make up to 44.4 percent of total population and comprises men and women between the ages of 18 to 45. Some of the franchise concepts that proven successful in Saudi Arabia are found in the fast-food sector such as burger king, popeys, hard Rock, McDonald’s, Hardee’s, Pizza Hut, Pizza in, Fuddruckers, TGI, Chilies and Wendy’s, XOXO, Harvey Nichols, Debenhams, Sakes Faith Avenue, Floreesheim, Martinizing, Sheraton, Helton, Four Seasons, Avis, Hertz, Budget, Limited Too, Mail Boxes, Alphagraphics, Ann Kleine, Guess and many others in addition to local franchisers such as Al-Tazag, Kudu, Zahoor Alreef, Hot and Crispy, Othaim Corner, Sweet Corn and N&A.
According to the statistics available, fast food franchise alone account for nearly 35 to 45 percent of the fast food market, total revenue from fast food franchise business has grown substantially since the adoption of this concept. The revenue from local franchisers has also grown considerably from 1995 to 2005, at an average annual rate of 10 percent. Revenue generated by non-food franchises was estimated at US 350 Million 1996, and revenue was projected to increase by 10 to 12 percent each year. US trade marks in the Saudi non-food sector are estimated to account for almost 80 percent of total revenue, and Saudi non-food franchises are worth an estimated uS 45 Million.
The success of franchising in the Saudi Arabian market is attributed to finding an appropriate
113
I n t e r n a t i o n a l J o u r n a l o f M a n a g e m e n t C a s e s
brand name franchisor and suitable location. Most franchises are located near shopping centers or areas of high traffic flow. The large and relatively inexpensive workforces come from Bangladesh, India, the Philippines, Nepal and Egypt. And have been one of reasons for the sector’s phenomenal success which has outpaced that of other industry sectors. In addition, the franchisors have realized that the culture and religious background of the Saudi people is of utmost important when it comes to doing business with them. They therefore have modified their franchise offerings and operational tactics to suit the Saudi market. such modification include hallal meet, use of local items, separation of the sexes, and general prohibition on photographs or advertising that would be considered only mildly suggestive in the west.
The success of franchise businesses in Saudi Arabia has been the subject of analysis both in government circles as well as in the popular press. However, what is relevant for the present research proposal is the fact that franchising has not been examined in the context of the expansion of SMEs. In addition, no study to this date has ascertained the the factors that determine the success of franchising, especially those of relevance to SMEs in Saudi Arabia.
The objectives formulated for this study are to examine whether franchising is a useful tool for business success among SMEs and to evaluate the elements that govern that success as well as drawbacks of successful implementation of franchise agreement. Through theoretical and empirical research, it is hoped to determine the forced that drive the increasing popularity of franchising concept as a route to business expansion for SMEs.
Literature ReviewFranchise is defined as (legal dictionary, 2008) “A special privilege to do certain things that is conferred by government on an individual or a corporation and which does not belong to citizens generally of common right”. In continuing with the preceding, franchise represents “A privilege granted or sold, such as to use or to sell products or services” (legal dictionary, 2008). in commercial terms, franchising is a licensing agreement where the franchisor, who is the owner of rights of the business, markets or distributes the product and or service that exists under a trademark through
a dealer network that is affiliated to the franchisor, with these individual outlets termed as the franchisee (Schnitthoff, 1990).
In most cases the franchisor derives a royalty or a sales percentage on the operation of the franchisee as a result of the latter’s use of the franchisor’s services and products, the business systems of the franchisor, trademarks, brand name, patents, the recognition of the public, marketing techniques as well as advertising support, and in many cases the franchisee must pay a fee regardless of whether they earn a profit on the operation (Edwards, 2002). The physical look of the franchise in terms of free standing structures, interior, signage, placement of equipment, arrangement of the interior and all other facets are set by the franchisor, and uniforms, service handling, product specifications and quality, marketing and promotions, pricing, and other facets (Schnitthoff, 1990). The preceding tight controls are done to create uniformity throughout the franchise system as well as provide the public with a uniform and consistent view of the company, regardless of location. In terms of location, franchisees are provided with either exclusive territory in areas that are calculated to be able to support the business, and thus free of competing franchisees from the same franchisor (Schnitthoff, 1990).
The franchisor’s benefits accrue as a result of being the right’s owner, along with trademarks as well as the system that the method of franchising provides for rapid business growth through the use of franchisee funds and entrepreneurs that are screened for qualifications to expand the franchisor’s outlets at a fraction of the cost it would take to open up new outlets under their own financing (European Franchising Network, 2006). Franchising is not without its critics, as they point out the franchisee represents a de facto franchisor employee, thus the autonomy that the relationship implies is not as clear cut, or autonomous as it seems (European Franchising Network, 2006):
The growth of franchising as a business format developed primarily in the United States where the industry exhibited a growth rate of around 94 percent between 1983 through 1993 (Hoffman, and Preble, 1995). That phenomenal growth rate has slowed in the ensuing years. For the period 2000 through 2006, the franchise industry in the United States grew 33 percent from approximately 283,000 to 376,000 units:
I n t e r n a t i o n a l J o u r n a l o f M a n a g e m e n t C a s e s
114
Growth of Franchising Units in the United StatesThe preceding summary of franchising growth in the United States has been utilized as a baseline example to indicate the strength of this business form in the country that has originated the franchising concept. Internationally, franchising is growing at a tremendous rate mainly due to the marketing foundation, globalisation and the lessening of the trade barriers between countries. Franchises from the United States represent the largest segment of international forms, owing in part to the highly developed nature of this industry segment in that country, as well as the tremendous number of franchising operations (Franchise Direct , 2008).
In terms of growth in Saudi Arabia, the most popular form of franchising outlet is the boutique retail outlets that offer Western clothes and accessories, with fast food becoming another upcoming area (Saudi Network, 2007). In terms of growth, franchising in Saudi Arabia is said to be around 9 to 10 percent. The sectors that represent high growth are: boutique fashion apparel, business services, automotive products, mail services and packaging, graphic design and printing, telecommunications, hotels, and business services
Franchising has taken hold in Saudi Arabia, and while exact statistics are not available, Swartz (1999) estimated that in 2001, franchising accounted for 40% of all retail trade in the country. The preceding did not place fast food franchising in the top 8 categories, so either this data is flawed, or fast food has not been considered seriously. In a contravening article MENAFN.com (2005), which is the Middle East North Africa Financial Network, states that fast food franchising holds approximately 35 to 45 percent of the franchising market, naming the above categories as the non-food sector. The articles further went on to add that “Many of the brand names are already well entrenched in the market, and the failure rate is also minimal” (MENAFN.com, 2005).
The foregoing view is also supported by an analysis conducted by Info-Prod Research (Middle East) Ltd. (2001) citing the fact that half of the population in Saudi Arabia is under fifteen years of
age, in 2001 and that the younger generation has acquired a taste for Western food offerings. Info-Prod Research (Middle East Ltd, 2001) adds that fast food franchises from the United States account for 20 percent of the fast food segment, and were averaging a growth rate of 8 percent annually since 1998. the info-Prod Research (Middle east Ltd, 2001) also confirms the fast food segment as accounting for between 35 to 45 percent of all franchises in the country.
The preceding ramifications of franchising would not be presently applicable in Saudi Arabia without the country joining the World Trade Organization, as said membership represents the foundational underpinnings via which franchising has been able to flourish in the country. Saudi Arabia’s accession to the World Trade Organization in 2005 represented the culmination of a process that began on 13 June 1993 (World Trade Organisation, 2005). The course of acceptance for the Kingdom of Saudi Arabia called for it to change internal policies. In order to gain admittance to the World Trade Organization, Saudi Arabia was called upon to (Loeffler Tuggey Pauerstein Rosenthal LLP , 2005) liberalise its markets, to restructure its legal systems, as well as to expand its fundamental economic goals
Franchising represents a critical part of the announced objectives of Saudi Arabia in terms of increasing foreign investment, as well as creating jobs in the private sector has made dramatic as well as highly important moves in changing the foundation of its economic structure to be in consort with free market principles necessary to put the country in a competitive position to operate an economy that has been dependant upon oil exports. The nuances of such change are more difficult than one would think as it entails cultural, religious and social ramifications that have been the identity of Saudi Arabia since King Abdulaziz bin Saud unified the country in 1922 (Wilson and graham, 1994). that foundation laid the premise for the country’s political system as well as government (Wilson and graham, 1994).
The data needed in this area is obviously not merely academic in nature. Research should concentrate not only on developing and testing hypothetical constructs, but also on answering questions which deal with the practical nature of franchising for
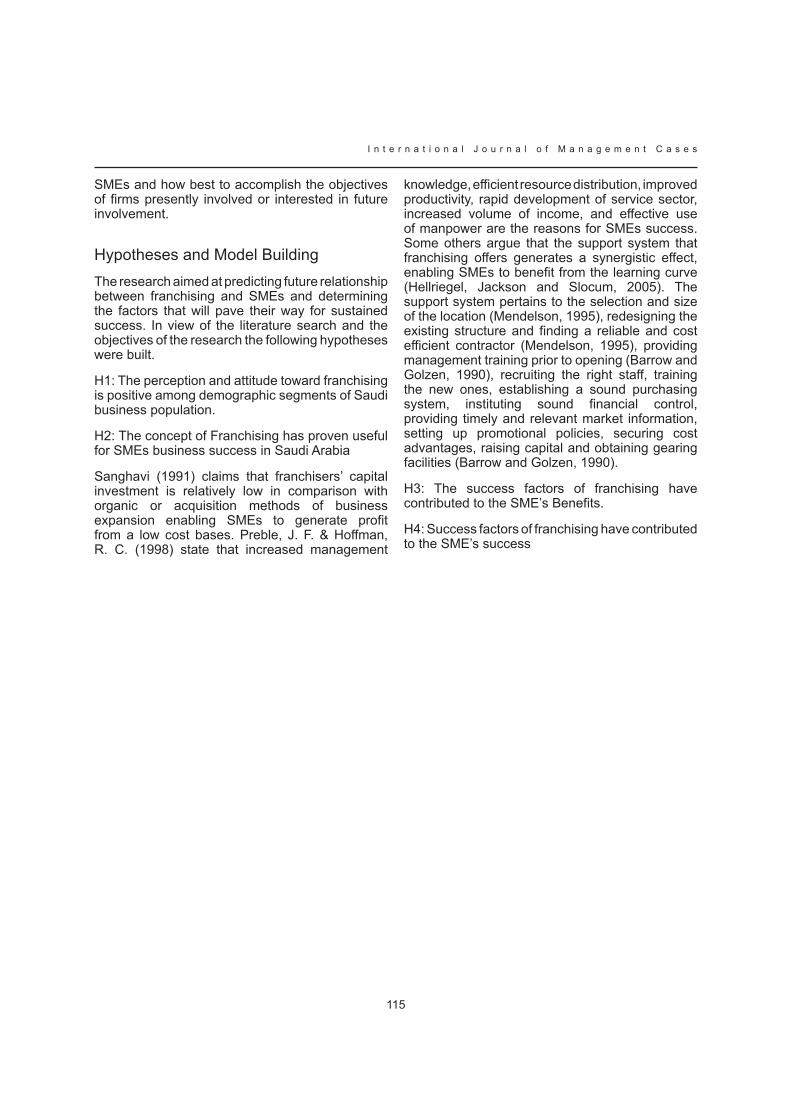
115
I n t e r n a t i o n a l J o u r n a l o f M a n a g e m e n t C a s e s
SMEs and how best to accomplish the objectives of firms presently involved or interested in future involvement.
Hypotheses and Model Building The research aimed at predicting future relationship between franchising and SMEs and determining the factors that will pave their way for sustained success. In view of the literature search and the objectives of the research the following hypotheses were built.
H1: The perception and attitude toward franchising is positive among demographic segments of Saudi business population.
H2: The concept of Franchising has proven useful for SMEs business success in Saudi Arabia
Sanghavi (1991) claims that franchisers’ capital investment is relatively low in comparison with organic or acquisition methods of business expansion enabling SMEs to generate profit from a low cost bases. Preble, J. F. & Hoffman, R. c. (1998) state that increased management
knowledge, efficient resource distribution, improved productivity, rapid development of service sector, increased volume of income, and effective use of manpower are the reasons for SMEs success. Some others argue that the support system that franchising offers generates a synergistic effect, enabling SMEs to benefit from the learning curve (Hellriegel, Jackson and Slocum, 2005). The support system pertains to the selection and size of the location (Mendelson, 1995), redesigning the existing structure and finding a reliable and cost efficient contractor (Mendelson, 1995), providing management training prior to opening (Barrow and Golzen, 1990), recruiting the right staff, training the new ones, establishing a sound purchasing system, instituting sound financial control, providing timely and relevant market information, setting up promotional policies, securing cost advantages, raising capital and obtaining gearing facilities (Barrow and Golzen, 1990).
H3: The success factors of franchising have contributed to the SME’s Benefits.
H4: Success factors of franchising have contributed to the SME’s success
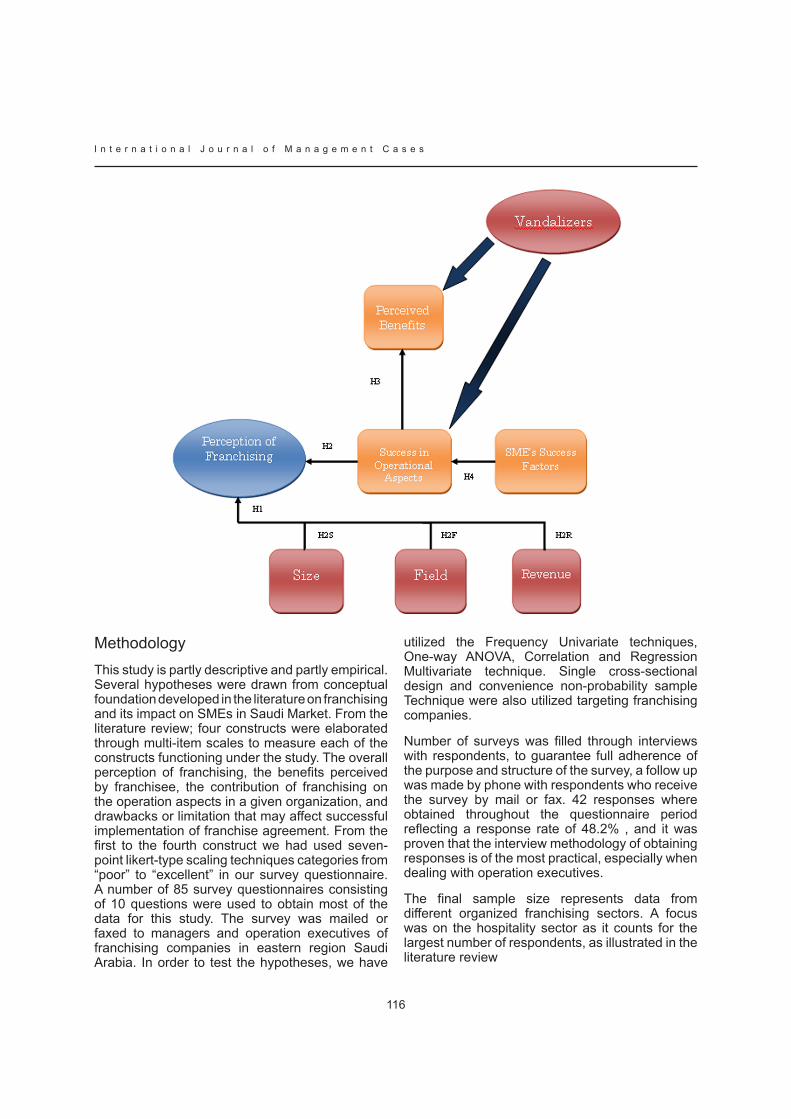
I n t e r n a t i o n a l J o u r n a l o f M a n a g e m e n t C a s e s
116
MethodologyThis study is partly descriptive and partly empirical. Several hypotheses were drawn from conceptual foundation developed in the literature on franchising and its impact on SMEs in Saudi Market. From the literature review; four constructs were elaborated through multi-item scales to measure each of the constructs functioning under the study. The overall perception of franchising, the benefits perceived by franchisee, the contribution of franchising on the operation aspects in a given organization, and drawbacks or limitation that may affect successful implementation of franchise agreement. From the first to the fourth construct we had used seven-point likert-type scaling techniques categories from “poor” to “excellent” in our survey questionnaire. a number of 85 survey questionnaires consisting of 10 questions were used to obtain most of the data for this study. The survey was mailed or faxed to managers and operation executives of franchising companies in eastern region Saudi Arabia. In order to test the hypotheses, we have
utilized the Frequency Univariate techniques, One-way ANOVA, Correlation and Regression Multivariate technique. Single cross-sectional design and convenience non-probability sample Technique were also utilized targeting franchising companies.
Number of surveys was filled through interviews with respondents, to guarantee full adherence of the purpose and structure of the survey, a follow up was made by phone with respondents who receive the survey by mail or fax. 42 responses where obtained throughout the questionnaire period reflecting a response rate of 48.2% , and it was proven that the interview methodology of obtaining responses is of the most practical, especially when dealing with operation executives.
The final sample size represents data from different organized franchising sectors. A focus was on the hospitality sector as it counts for the largest number of respondents, as illustrated in the literature review
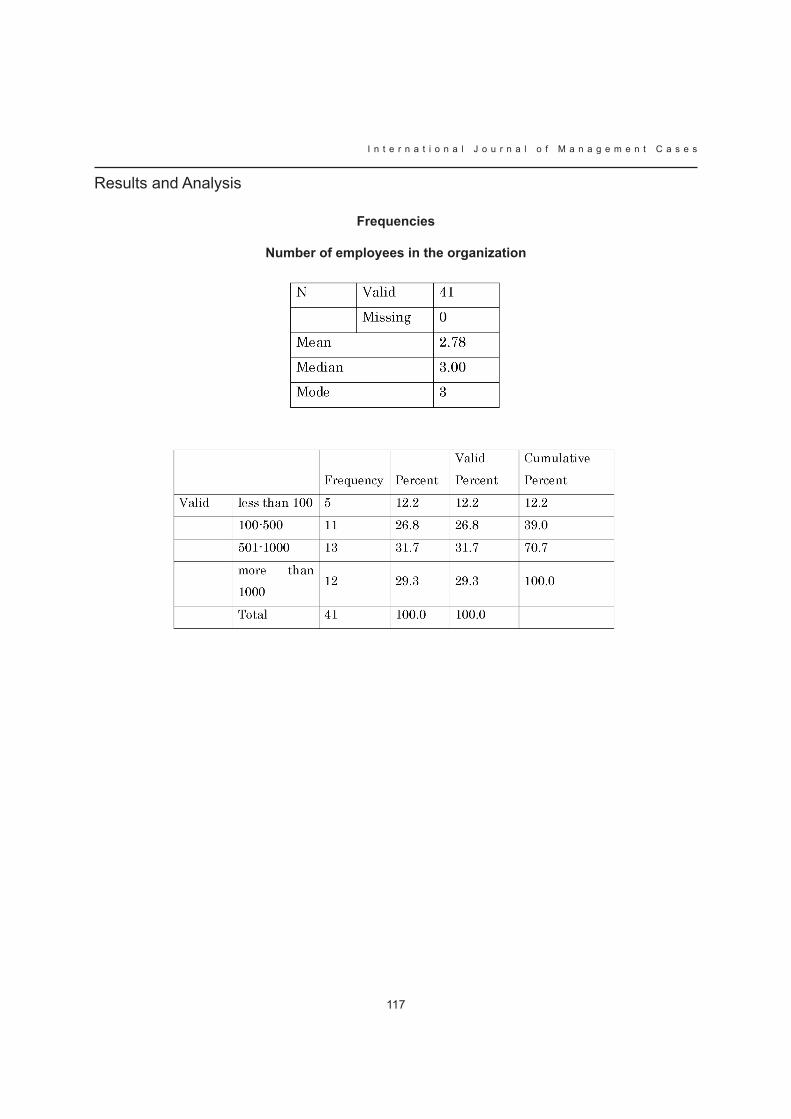
117
I n t e r n a t i o n a l J o u r n a l o f M a n a g e m e n t C a s e s
Results and Analysis
frequencies
Number of employees in the organization
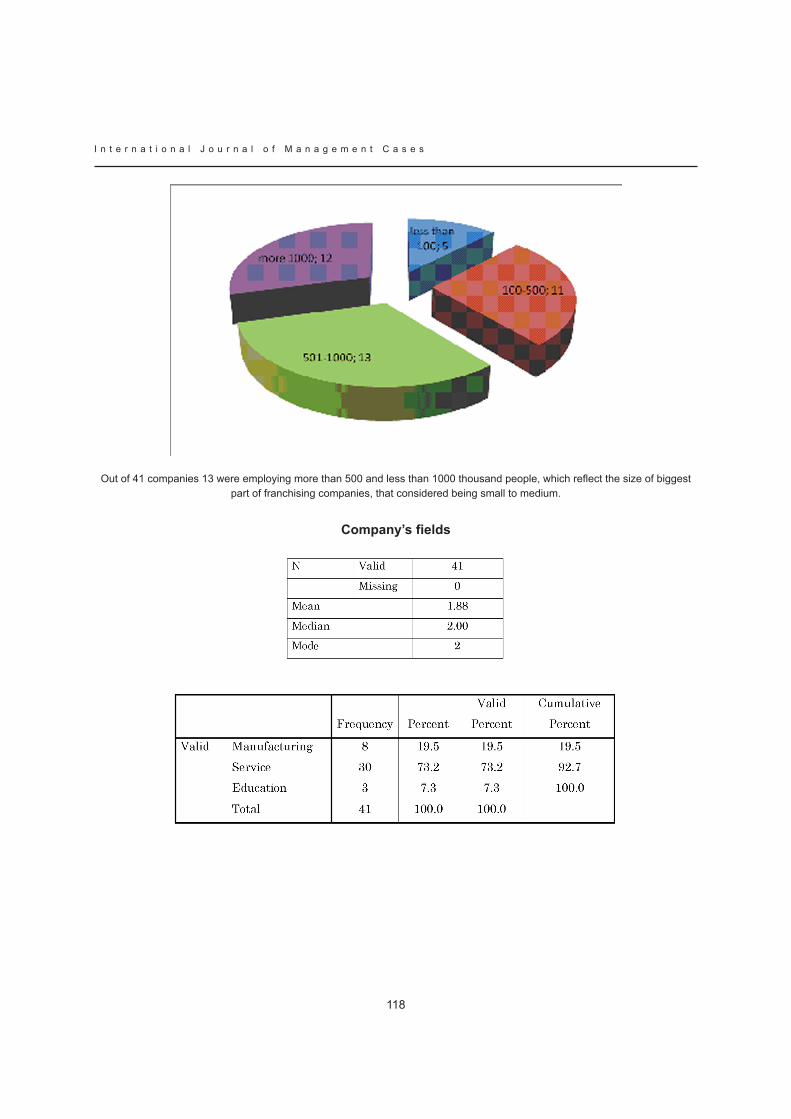
I n t e r n a t i o n a l J o u r n a l o f M a n a g e m e n t C a s e s
118
out of 41 companies 13 were employing more than 500 and less than 1000 thousand people, which reflect the size of biggest part of franchising companies, that considered being small to medium.
Company’s fields
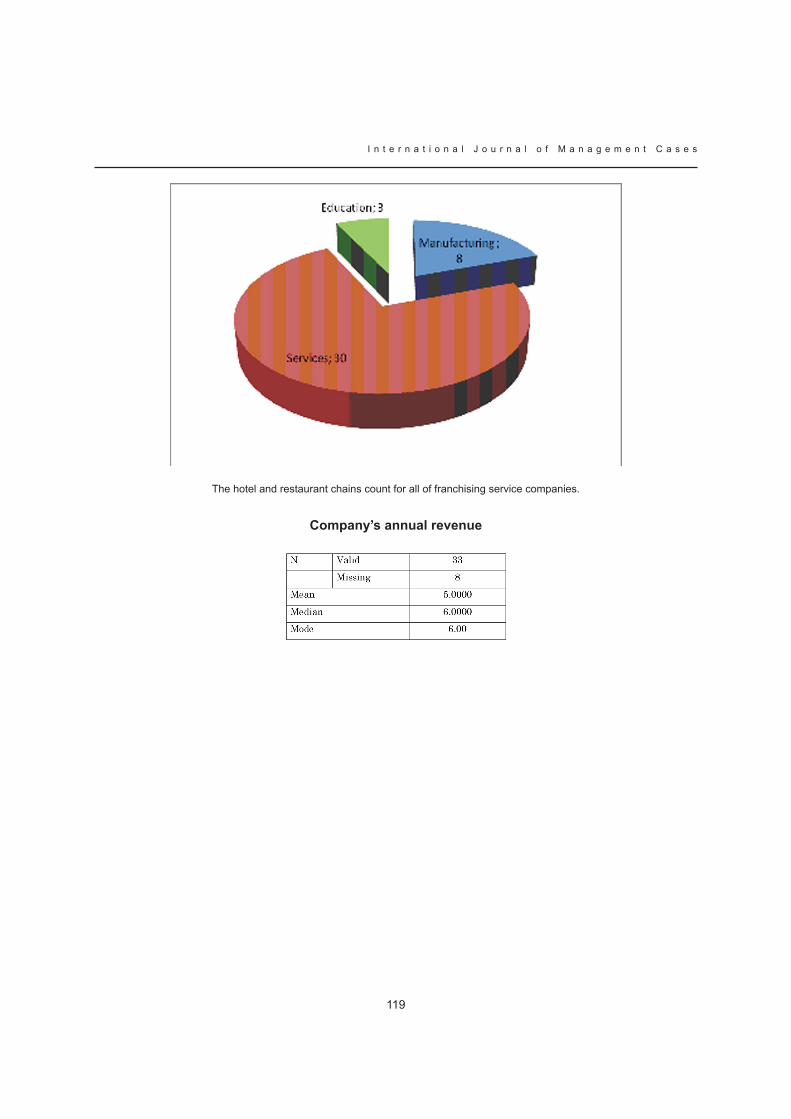
119
I n t e r n a t i o n a l J o u r n a l o f M a n a g e m e n t C a s e s
The hotel and restaurant chains count for all of franchising service companies.
Company’s annual revenue
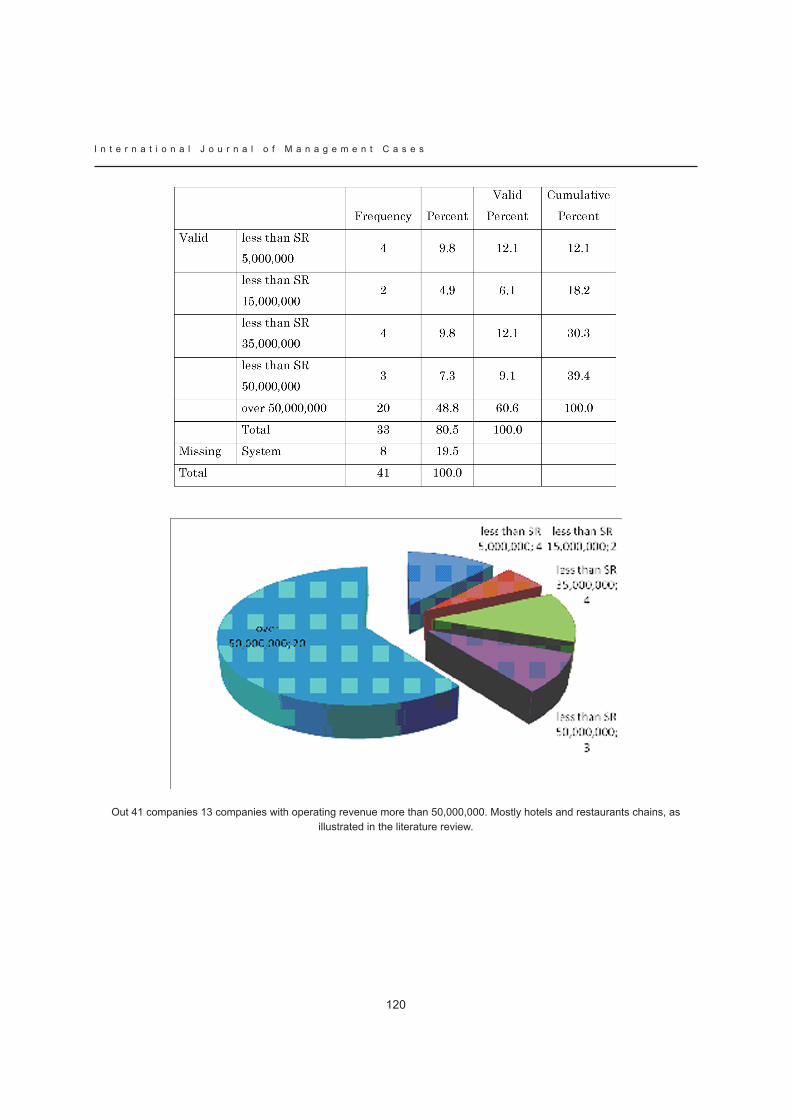
I n t e r n a t i o n a l J o u r n a l o f M a n a g e m e n t C a s e s
120
out 41 companies 13 companies with operating revenue more than 50,000,000. Mostly hotels and restaurants chains, as illustrated in the literature review.
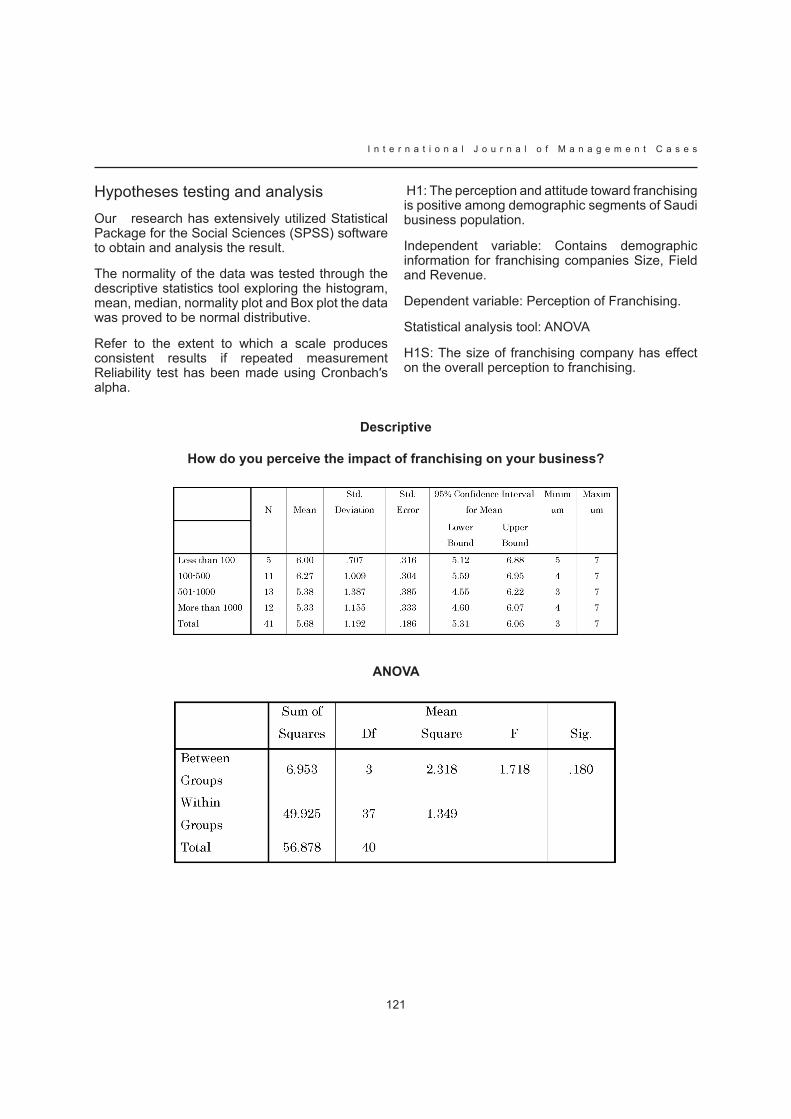
121
I n t e r n a t i o n a l J o u r n a l o f M a n a g e m e n t C a s e s
Hypotheses testing and analysisOur research has extensively utilized Statistical Package for the Social Sciences (SPSS) software to obtain and analysis the result.
The normality of the data was tested through the descriptive statistics tool exploring the histogram, mean, median, normality plot and Box plot the data was proved to be normal distributive.
Refer to the extent to which a scale produces consistent results if repeated measurement Reliability test has been made using cronbach′s alpha.
H1: The perception and attitude toward franchising is positive among demographic segments of Saudi business population.
Independent variable: Contains demographic information for franchising companies Size, Field and Revenue.
Dependent variable: Perception of Franchising.
Statistical analysis tool: ANOVA
H1S: The size of franchising company has effect on the overall perception to franchising.
Descriptive
How do you perceive the impact of franchising on your business?
ANOVA
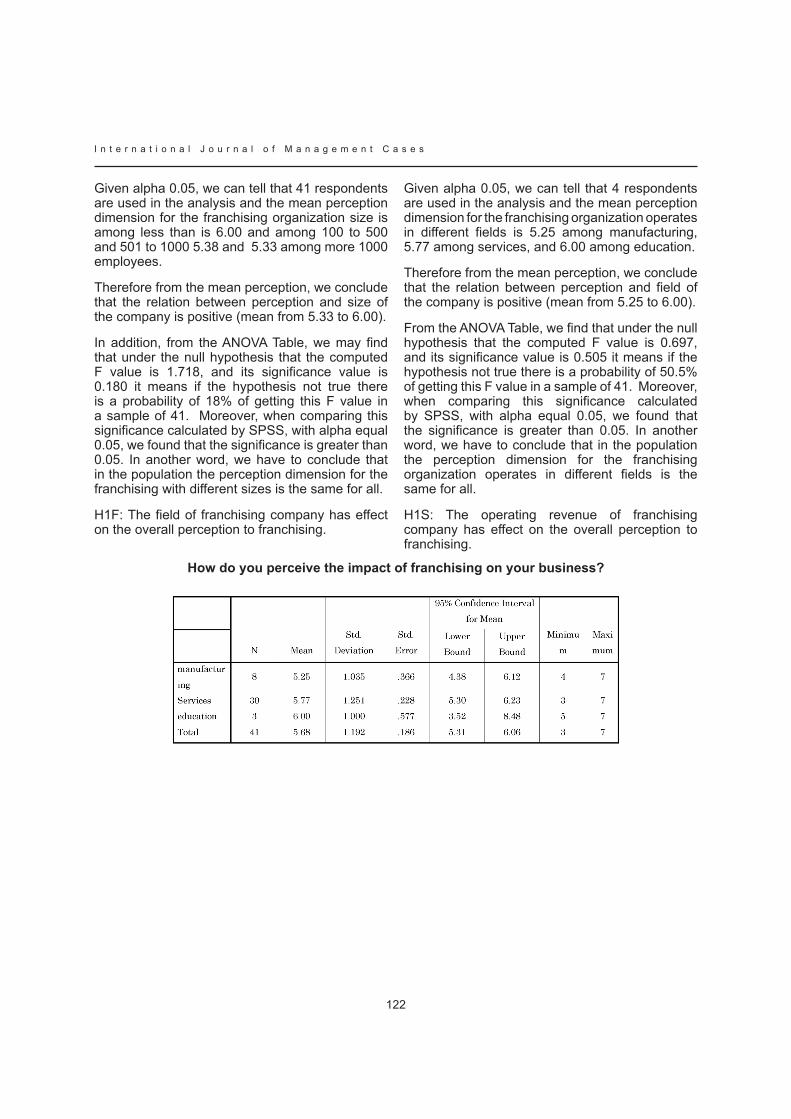
I n t e r n a t i o n a l J o u r n a l o f M a n a g e m e n t C a s e s
122
given alpha 0.05, we can tell that 41 respondents are used in the analysis and the mean perception dimension for the franchising organization size is among less than is 6.00 and among 100 to 500 and 501 to 1000 5.38 and 5.33 among more 1000 employees.
Therefore from the mean perception, we conclude that the relation between perception and size of the company is positive (mean from 5.33 to 6.00).
In addition, from the ANOVA Table, we may find that under the null hypothesis that the computed F value is 1.718, and its significance value is 0.180 it means if the hypothesis not true there is a probability of 18% of getting this F value in a sample of 41. Moreover, when comparing this significance calculated by SPSS, with alpha equal 0.05, we found that the significance is greater than 0.05. In another word, we have to conclude that in the population the perception dimension for the franchising with different sizes is the same for all.
H1F: The field of franchising company has effect on the overall perception to franchising.
given alpha 0.05, we can tell that 4 respondents are used in the analysis and the mean perception dimension for the franchising organization operates in different fields is 5.25 among manufacturing, 5.77 among services, and 6.00 among education.
Therefore from the mean perception, we conclude that the relation between perception and field of the company is positive (mean from 5.25 to 6.00).
From the ANOVA Table, we find that under the null hypothesis that the computed F value is 0.697, and its significance value is 0.505 it means if the hypothesis not true there is a probability of 50.5% of getting this F value in a sample of 41. Moreover, when comparing this significance calculated by SPSS, with alpha equal 0.05, we found that the significance is greater than 0.05. In another word, we have to conclude that in the population the perception dimension for the franchising organization operates in different fields is the same for all.
H1S: The operating revenue of franchising company has effect on the overall perception to franchising.
How do you perceive the impact of franchising on your business?
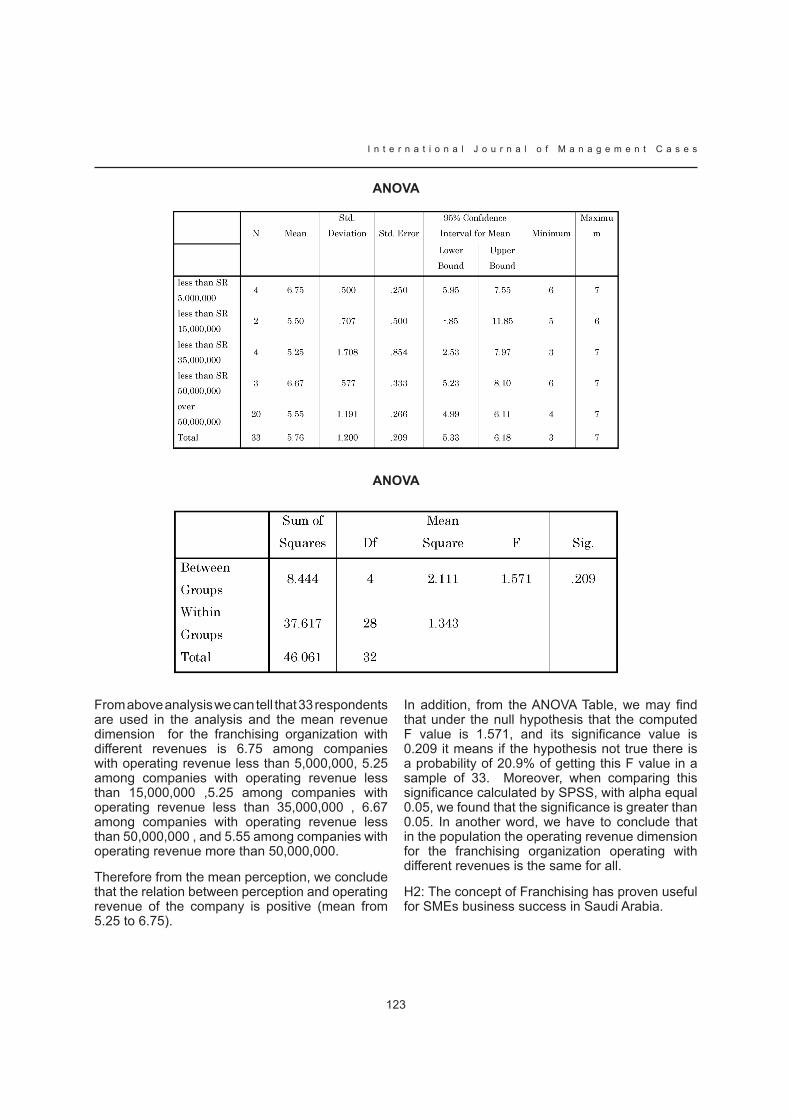
123
I n t e r n a t i o n a l J o u r n a l o f M a n a g e m e n t C a s e s
ANOVA
How do you perceive the impact of franchising on your business?
ANOVA
From above analysis we can tell that 33 respondents are used in the analysis and the mean revenue dimension for the franchising organization with different revenues is 6.75 among companies with operating revenue less than 5,000,000, 5.25 among companies with operating revenue less than 15,000,000 ,5.25 among companies with operating revenue less than 35,000,000 , 6.67 among companies with operating revenue less than 50,000,000 , and 5.55 among companies with operating revenue more than 50,000,000.
Therefore from the mean perception, we conclude that the relation between perception and operating revenue of the company is positive (mean from 5.25 to 6.75).
In addition, from the ANOVA Table, we may find that under the null hypothesis that the computed F value is 1.571, and its significance value is 0.209 it means if the hypothesis not true there is a probability of 20.9% of getting this F value in a sample of 33. Moreover, when comparing this significance calculated by SPSS, with alpha equal 0.05, we found that the significance is greater than 0.05. In another word, we have to conclude that in the population the operating revenue dimension for the franchising organization operating with different revenues is the same for all.
H2: The concept of Franchising has proven useful for SMEs business success in Saudi Arabia.
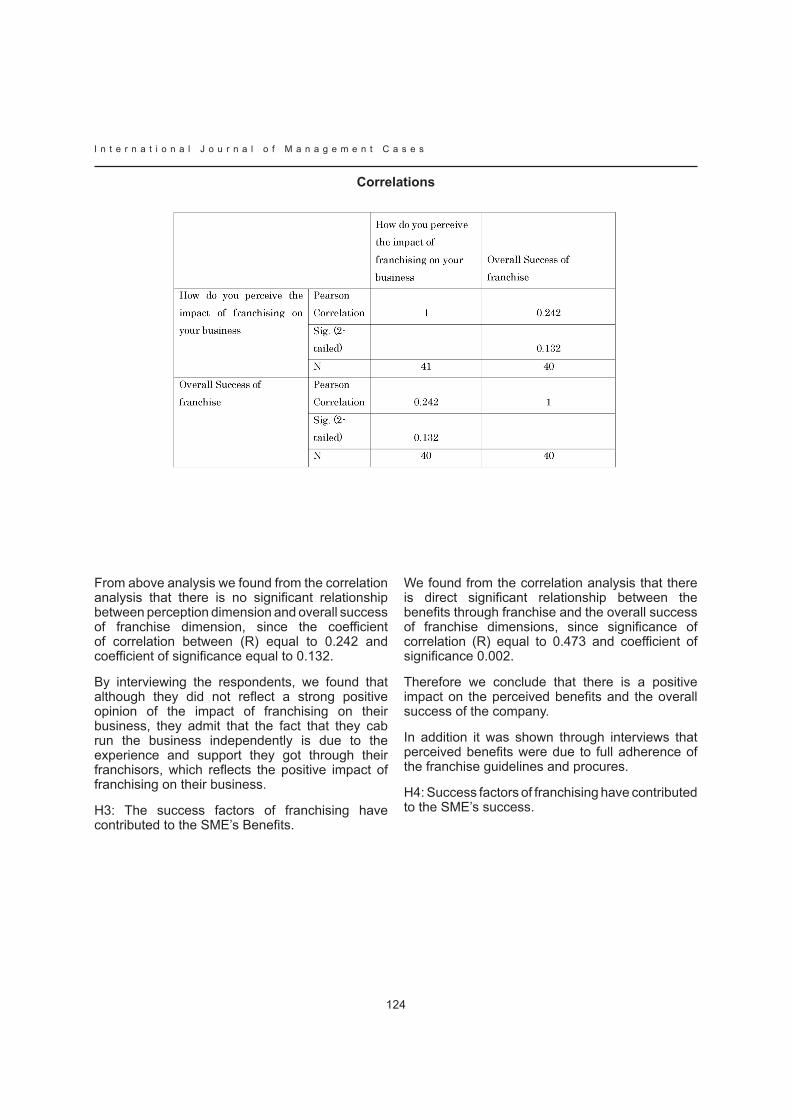
I n t e r n a t i o n a l J o u r n a l o f M a n a g e m e n t C a s e s
124
Correlations
From above analysis we found from the correlation analysis that there is no significant relationship between perception dimension and overall success of franchise dimension, since the coefficient of correlation between (R) equal to 0.242 and coefficient of significance equal to 0.132.
By interviewing the respondents, we found that although they did not reflect a strong positive opinion of the impact of franchising on their business, they admit that the fact that they cab run the business independently is due to the experience and support they got through their franchisors, which reflects the positive impact of franchising on their business.
H3: The success factors of franchising have contributed to the SME’s Benefits.
We found from the correlation analysis that there is direct significant relationship between the benefits through franchise and the overall success of franchise dimensions, since significance of correlation (R) equal to 0.473 and coefficient of significance 0.002.
Therefore we conclude that there is a positive impact on the perceived benefits and the overall success of the company.
In addition it was shown through interviews that perceived benefits were due to full adherence of the franchise guidelines and procures.
H4: Success factors of franchising have contributed to the SME’s success.
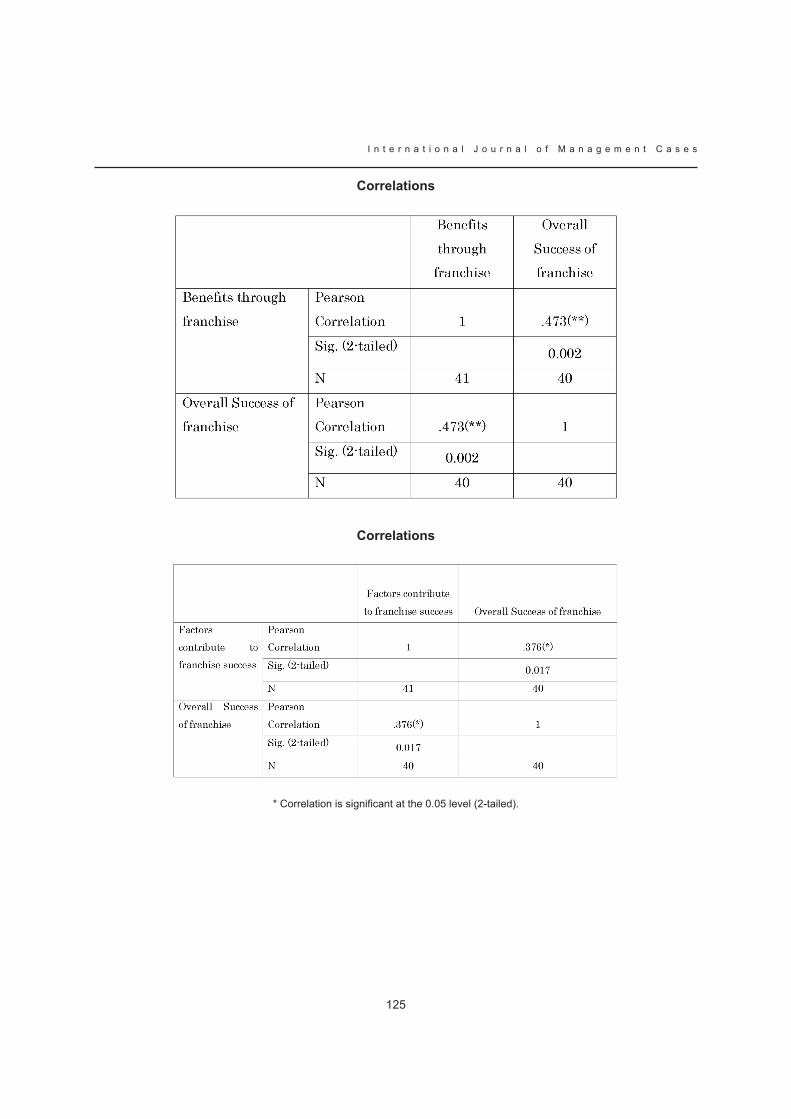
125
I n t e r n a t i o n a l J o u r n a l o f M a n a g e m e n t C a s e s
Correlations
Correlations
* Correlation is significant at the 0.05 level (2-tailed).
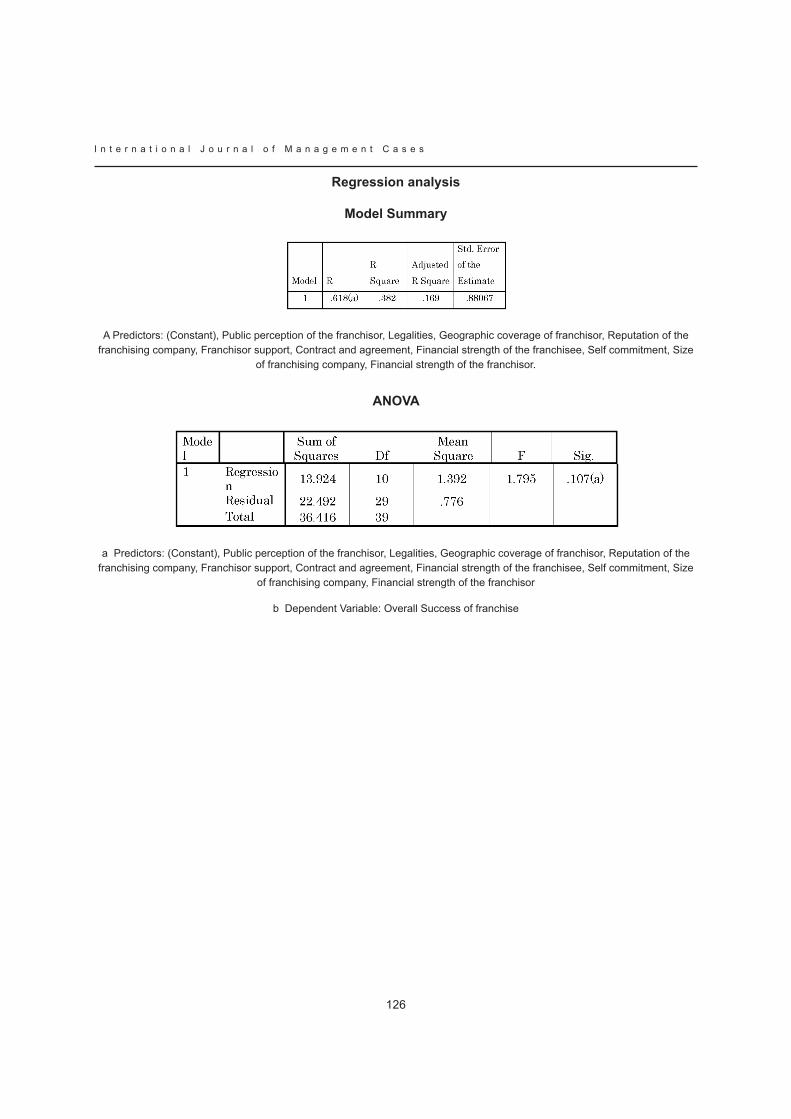
I n t e r n a t i o n a l J o u r n a l o f M a n a g e m e n t C a s e s
126
Regression analysis
Model Summary
A Predictors: (Constant), Public perception of the franchisor, Legalities, Geographic coverage of franchisor, Reputation of the franchising company, Franchisor support, Contract and agreement, Financial strength of the franchisee, Self commitment, Size
of franchising company, Financial strength of the franchisor.
ANOVA
a Predictors: (Constant), Public perception of the franchisor, Legalities, Geographic coverage of franchisor, Reputation of the franchising company, Franchisor support, Contract and agreement, Financial strength of the franchisee, Self commitment, Size
of franchising company, Financial strength of the franchisor
b Dependent Variable: Overall Success of franchise
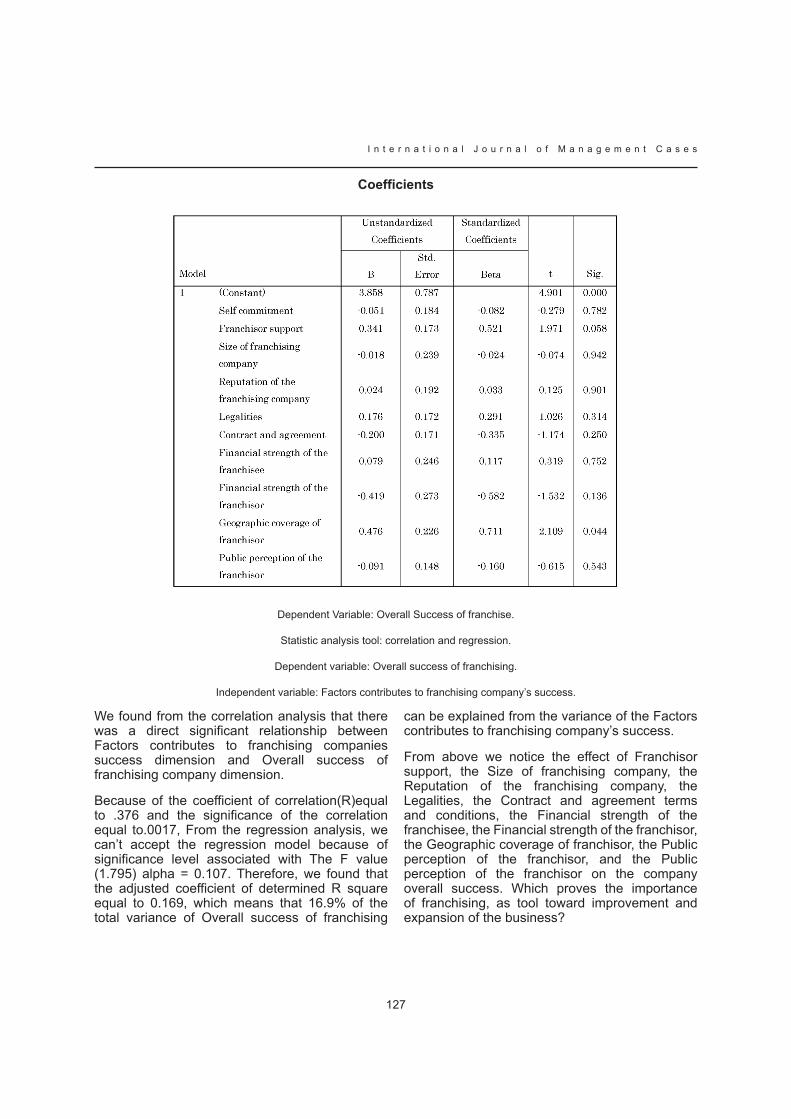
127
I n t e r n a t i o n a l J o u r n a l o f M a n a g e m e n t C a s e s
Coefficients
Dependent Variable: Overall Success of franchise.
Statistic analysis tool: correlation and regression.
Dependent variable: Overall success of franchising.
Independent variable: Factors contributes to franchising company’s success.
We found from the correlation analysis that there was a direct significant relationship between Factors contributes to franchising companies success dimension and Overall success of franchising company dimension.
Because of the coefficient of correlation(R)equal to .376 and the significance of the correlation equal to.0017, From the regression analysis, we can’t accept the regression model because of significance level associated with The F value (1.795) alpha = 0.107. Therefore, we found that the adjusted coefficient of determined R square equal to 0.169, which means that 16.9% of the total variance of Overall success of franchising
can be explained from the variance of the Factors contributes to franchising company’s success.
From above we notice the effect of Franchisor support, the Size of franchising company, the Reputation of the franchising company, the Legalities, the Contract and agreement terms and conditions, the Financial strength of the franchisee, the Financial strength of the franchisor, the Geographic coverage of franchisor, the Public perception of the franchisor, and the Public perception of the franchisor on the company overall success. Which proves the importance of franchising, as tool toward improvement and expansion of the business?
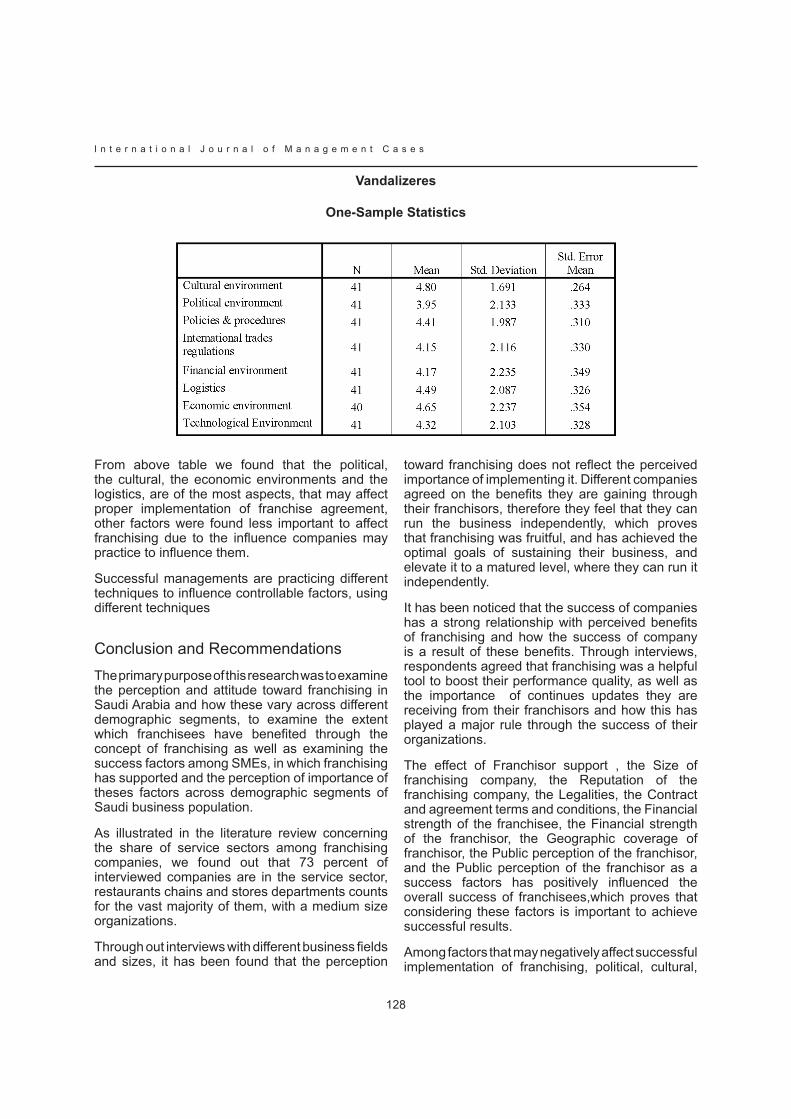
I n t e r n a t i o n a l J o u r n a l o f M a n a g e m e n t C a s e s
128
Vandalizeres
One-Sample Statistics
From above table we found that the political, the cultural, the economic environments and the logistics, are of the most aspects, that may affect proper implementation of franchise agreement, other factors were found less important to affect franchising due to the influence companies may practice to influence them.
Successful managements are practicing different techniques to influence controllable factors, using different techniques
Conclusion and RecommendationsThe primary purpose of this research was to examine the perception and attitude toward franchising in Saudi Arabia and how these vary across different demographic segments, to examine the extent which franchisees have benefited through the concept of franchising as well as examining the success factors among SMEs, in which franchising has supported and the perception of importance of theses factors across demographic segments of Saudi business population.
As illustrated in the literature review concerning the share of service sectors among franchising companies, we found out that 73 percent of interviewed companies are in the service sector, restaurants chains and stores departments counts for the vast majority of them, with a medium size organizations.
Through out interviews with different business fields and sizes, it has been found that the perception
toward franchising does not reflect the perceived importance of implementing it. Different companies agreed on the benefits they are gaining through their franchisors, therefore they feel that they can run the business independently, which proves that franchising was fruitful, and has achieved the optimal goals of sustaining their business, and elevate it to a matured level, where they can run it independently.
It has been noticed that the success of companies has a strong relationship with perceived benefits of franchising and how the success of company is a result of these benefits. Through interviews, respondents agreed that franchising was a helpful tool to boost their performance quality, as well as the importance of continues updates they are receiving from their franchisors and how this has played a major rule through the success of their organizations.
The effect of Franchisor support , the Size of franchising company, the Reputation of the franchising company, the Legalities, the Contract and agreement terms and conditions, the Financial strength of the franchisee, the Financial strength of the franchisor, the Geographic coverage of franchisor, the Public perception of the franchisor, and the Public perception of the franchisor as a success factors has positively influenced the overall success of franchisees,which proves that considering these factors is important to achieve successful results.
Among factors that may negatively affect successful implementation of franchising, political, cultural,
129
I n t e r n a t i o n a l J o u r n a l o f M a n a g e m e n t C a s e s
economic environments and the logistics burdens of the most vandalizers, may affect successful franchising agreements, factors like policies and procedures, technological environment, can be controlled through marketing and lobbying techniques. Trade regulations were found less harmful since they do not have direct impact on their business.
Franchising has been proven to be a successful tool toward success and growth of SMEs in Saudi business environment, with considering success operation factors, and how those may positively impact the overall results of a company.
Giving above franchising has proven positive impacts, through successful results and improved performance. The sustainability of business was achieved in most cases, and symptoms for further growth were guaranteed.
Limitations and Suggestions for Future ResearchThrough out surveying and interviews, clear reservations were found from executives toward financial and operation data, they over concept the privacy of these data, and feel it may harm their companies to reveal. It was found that the business society is not well equipped to accept questionnaires, surveys and interviews specially when talking about their business to others.
The conservativeness of the business society needs to be resolved through proper education and awareness, although resolving this problem is not part of this research objectives, but it is suggested to investigate this phenomenon and come up with valid technique to resolve it.
It has been found companies do not perceive direct benefits of contributing to academic researches, therefore, they consider it wasting time to fill up survey or questionnaire.
From the companies list, it was found that most companies are international franchising companies, with clear absence of local franchising companies, for future researches it is suggested to concentrate in local franchising to examine the impact on both franchisors and franchisees.
ReferencesArab News (2005) Huge Potential for Franchising. Retrieved on 23 December 2008
Edwards. M. (2002) Business Format Franchises. Business Law Review. 265-267
European Franchising Network. (2006)What are the advantages and disadvantages of franchising? Retrieved on 19 December 2008 from http://www.europeanfranchising.com/introtofranchising/3whatadvantages.aspx
Franchise Direct (2008) international Franchising – global growth of Franchise Businesses. 10 January 2008. Retrieved on 22 December 2008 from http://www.franchisedirect.com/blog/2008/01/10/international-franchising-%e2%80%93-global-growth-of-franchise-businesses/
Hellriegel, Jackson and Slocum, (2005). Management: International Student Edition, Thompson-South-Western, USA
Hoffman, R., Preble, J. (1995) Convert to Compete: Competitive Advantage through conversion Franchising. (Vol.4, No. 1. Journal of Small Business Management. P. 191
kirby, D. & Watson, a. (2004). Franchising as a small business development strategy: a qualitative study of operational and “failed” franchisors in the UK. Journal of Small Business and Enterprise Development, 28(4).
legal dictionary (2008) Franchise. http://legal-dictionary.thefreedictionary.com/franchise Retrieved on 19 December 2008
Loeffler Tuggey Pauerstein Rosenthal LLP (2005) terms of Saudi accession. (2005) 12(4). Middle East Policy Council Journal
Mello, A. & Setton, F. (1999). Franchising in Brazil - Experiences and Perspectives. Management Re search News, 22(4)
Mendelson, (1995). Franchising Growth Continues in United Kingdom, Franchising World, Vol. 27 No. 6, pp.42
MENAFN.com (2005) Jeddah, 16 May 2005. Franchising is marking a tremendous growth across Saudi Arabia, especially in the past few years. 16 May 2005. Retrieved on 19 December
I n t e r n a t i o n a l J o u r n a l o f M a n a g e m e n t C a s e s
130
2008 from http://www.menafn.com/qn_news_story_s.asp?StoryId=91736
Sanghavi, N. (1991). Retail Franchising: A European: A European Perspective, In Franchising: Embracing the Future, John R. Nevin, ed., Lincoln, NE: International Center for Franchise Studies, University of Nebraska, Paper No. 15.
Saudi Arabia Network (2007) Saudi Arabia: Economics. Saudi British Bank
Schnitthoff, C. (1990)Schnitthoff Export Trade: The Law and Practice of International Trade. Stevens & Sons, New york, New york, United States. pp. 272-273
Swartz, L. (1999) Franchising Successfully Circles the Globe,” in D. Welsh, I. Alon International Franchising in Emerging Markets: Central and Eastern Europe and Latin America. Chicago: CCH, inc., 43-61.
Wilson, P., and graham, D. (1994) Saudi arabia: The Coming Storm. M.E. Sharpe. Armonk, N.y., United States. P. 35
World Trade Organization (2005) Report of the Working Party on the Accession of the Kingdom of Saudi Arabia to the World Trade Organization. World Trade Organization. Document WT/ACC/SAU/6
131
I n t e r n a t i o n a l J o u r n a l o f M a n a g e m e n t C a s e s
HOSPITALITy GRADUATES IN SME’S: A NEED FOR COMPETENCIES
TRANSFORMATION?
NACHMIAS N. STEFANOSLEEDS METROPOLITAN UNIVERSITy, UK
yIANNA ORPHANIDOUUNIVERSITy OF NICOSIA, CyPRUS
Abstract
The literature reveals that SMEs sector is viewed as an alternative career route for graduates (Pittaway and Thedham, 2005) and a key area of growing demand in graduate employment (Westhead, et al., 2005). At the same time, Hospitality graduates must be equipped with such competencies that will enhance their career prospects in SME’s in hospitality. Research such as Goodman & Sprague (1991) suggest that students of hospitality education will remain in the industry longer if they have a strong base understanding of what is expected of them by the industry. Therefore, it is apposite to explore a) how the existing higher hospitality education can strengthen or not graduate career prospects b) how the existing competencies gained from higher hospitality education may affect their career choice behavior towards SME’s and c) discuss the prospects of SME’s as a first destination career choice.
Key Words: Graduates, Career Choices, SMEs, Management Competencies, Hospitality
IntroductionThis research paper provides an in-depth presentation and critically analysis of the existent informed literature relating to the hospitality graduate first destination employment preferences in SME’s and identification of competencies needed by hospitality management graduates. In a world of uncertainty, it is likely that many graduates experience difficulties in obtaining a job relevant to their aspirations. Many more new graduates are available to recruiters and such growth is set to continue. Graduate career pathway becomes
highly diverse and there is a greater effort to meet individual career aspirations and goals. No longer stability and linear career progression is expected without graduates be informed about the growing varied of employment opportunities within SME’s. At the same time, the identification of competencies needed of the hospitality management graduates for curricula revisions and relevance has been widely supported (Christou, 2000; Nelson and Dopson, 1999). Thus, it is essential to develop curriculum interventions that enable students to make clear connections between their education and employment aspirations, and assist them recognise the relevant value of their studies.
The Graduate Labour Market and Competencies Needed The traditional career route to graduate employment is changing. New graduates are seeking first destination employment in a more fragmented and more competitive employment environment, due to an increasingly turbulent graduate labour market. It is widely acknowledged that the total number of students in He in the uk, showing a growth of 49 per cent in 2005/6 in comparison to the statistical results of the previous decade (HESA, 2006) mainly due to the UK Government initiatives to increase the participation rate in HE (Moreau and Leathwood, 2006). However, the increase in the number of graduates entering the labour market has had a fundamental impact on labour supply and the occupational structure of graduates.
Elias and Purcell (2003:5) in an attempt to address the changing relationship between HE and potential employment and emphasize the changing range
I n t e r n a t i o n a l J o u r n a l o f M a n a g e m e n t C a s e s
132
and diversity of career outcomes for graduates developed a new two-fold graduate occupations classification: a) External classification b) Intrinsic classification.
The external classification describes the jobs graduates can do and the job titles and the Intrinsic classification attempts to assess a number of key competencies that graduates need to use in their employment. This confirms the view of Arnold and Helmes (2002) who argue in their research on graduates’ experiences of work in small organisations that the mass expansion of HE has an impact on the supply of graduates entering traditional occupations and make graduate employment more diverse in character and more complex in the context of graduate career choices.
At the same time, the mass expansion of HE has led to transform the career landscape (Arnold and Helmes, 2002) and a significant proportion of graduates have troubles in accessing employment and make a full use of their potentials after graduation (Harvey, 1999). Thus, many graduates experienced initial difficulty in obtaining a job relevant to their aspirations, partly as a result of changes in the labour supply. Accordingly, Pitcher and Purcell (1998:6) argue that it is “no longer makes sense to talk about a uniform graduate labour market” especially after the extensive changes in HE which have led to a far greater diversity of graduates in the labour market.
Hospitality management education has the responsibility to provide industry with graduates equipped with relevant management competencies (Christou, 2002). This research paper agrees with this view and supports that industry is not only the international and multinational hotel establishments. As Lashley and Morrison (2000) state, ‘hospitality requires the guest to feel that the host is being hospitable through feelings of generosity, a desire to please and a genuine regard for the guest as an individual’. The article of Hemmington (2007) analyse in depth the differences of hospitality industry from any other service industry supporting the authors opinion for specific management competencies needed for the hospitality industry and especially for the SME sector.
Historically, the traditional career route to graduate employment has taken place in large organisations which is considered to be the normal route via an
undergraduate degree programme (Purcell et al., 2004). it is typically “the importance of secure employment and predictable progression within one company after the graduation” (King, 2003:10). However, research findings suggest that only a minority of graduates has access to traditional careers “involving predictable increase in pay and status through promotion and development opportunities” (King, 2003:6). The rise in the number of graduates in conjunction with the downsizing and outsourcing of larger organisations has created a great uncertainty for traditional careers with larger employers and formal graduate training programmes (Hawkins and Winter, 1996). Mc Dermott et al. (2006) speculate that the proportion of graduates entering the workplace via formal graduate scheme has fluctuated over the last decade. No longer is it the case that a company’s graduate training scheme is the dominate route to graduate employment and career prospects (cited in connor et al., 2008).
In this changing environment, graduate are now seeking first destination employment in a very diverse environment with a greater availability of non-traditional jobs. Purcell et al., (2004) in their new graduate occupational classification note that non-traditional careers are typically found in jobs that are likely to constitute under-utilization of their HE skills and Knowledge, where the greatest potential is likely to be in smaller business sector. As Moy and Lee (2002) state, SME’s offers opportunities for graduates to pursue a successful career. However, many graduates tend to have negative perception towards small businesses (Hanage et al., 2000) and seem to prefer a career within large organisations (Ahmadi and Helmes, 2006). According to a research on graduate employment, one-third of new graduates preferred a multinational or national company to start a career and only a small proportion of them consider SME’s as a first destination employment (Summers, 1997). Career in large organisations seems to be more attractive for graduates. However, SME’s could provide more opportunities for rapid career progression (connor et al., 2008).
The UK Hospitality Industry and Competencies TransformationNowadays, hospitality industry is viewed as one of the fastest growing sectors in the UK, creating a wide range of jobs for graduates. It is estimated that 85 per cent of the Hospitality enterprises are
133
I n t e r n a t i o n a l J o u r n a l o f M a n a g e m e n t C a s e s
classed as SMEs (People 1st, 2006). In fact, the Sector Skills Council also notes that within the industry, 76 per cent of establishments employ fewer than ten people and 50 per cent fewer than five. At the same time, the education of hospitality management and courses leading to hospitality career are relatively new to UK HE (CHME, 2006). Universities offering hospitality programmes aim to develop links with the industry in order to create operational dynamics and courses that will flood the market with capable and high expertise hospitality graduates (HecSu, 2004). the educational system supporting the hospitality industry by creating entry level managers have been faced with many changes that affect the methods used to prepare highly educated and qualified graduates to fit the demands of the hospitality industry (Davies, 1995). Hospitality managers today need to work harder in handling new areas of specialization and in processing information at a more sophisticated level than did their predecessors.
In this new world of graduate careers, it is believed that the fastest growing sector for graduate employment is now SME’s (Nabi, 2003; Hawkins and Winter, 1996). However, research evidence support that hospitality graduates tend to search mainly for a career in large international or national hospitality companies. In particular, a study conducted by Jenkins (2001) shows that 77,5 per cent of hospitality graduates stated that they would like to work for an international company after their graduation. Only a small percentage of the respondents stated that the size and type of the organisation did not matter in their career choice decision behaviour. However, this research study is focused mainly upon two European HE institutions and cannot offer an appropriate research context to fully interpreter hospitality graduates career preferences.
A study called the Graduate Facts Survey (2002) found that 21 per cent of graduates expressed interest in working in a large company compared with only 3 per cent of them who said they wanted to be employed by a smaller business. Similarly, a study conducted by Mukhtar (1999) in the North West region found that 88 per cent of graduates had never considered applying to an SME’s (cited in Ahmadi and Helmes, 1997). However, the key point to note is that both two studies treat a wide range of academic subjects and industry sectors as one homogeneous group without segmenting the SME sector by size. As Pittaway and Thedham
(2005) note, this is extremely problematic because every sector has different aspirations for growth and different characteristics in terms of career prospects.
At the same time, graduates tend to believe that their skills and knowledge is ‘best fit’ for larger organisations (Ahmadi and Helms, 2006). Graduate perceive that a multinational or international company can offer them more opportunities for personal and professional development in achieving their career goals (Summers, 1997). The Association of Graduate Careers Advisory Services (2006) state that the traditional route of new hospitality graduates into employment focuses predominantly on the large employer. According to Arnold and Helmes (2002) large organisations have the power and the resources to foster graduate links in order to attract the most qualified and competent graduates. SME’s recruiters rarely develop links with HE institutions as part of their recruitment strategy; therefore make it difficult for graduates to find a job in SME’s in a first place (Westhead, 1999).
Research evidence reveals the difficulty that the majority of graduate students experience in securing a place in traditional graduate occupations or graduate training schemes. However, the graduate training schemes of large organisations are not adequate to satisfy the high supply of graduates produced by He (Purcell et al., 2004). According to the Higher Education Statistical Agency (2007) only 21 per cent of all graduate from UK universities each year can secure a career in large organisations. Only a minority of graduates from universities have access to a traditional career or is still recruited on structured training schemes (King, 2003) as well as “the proportion of graduate employers who recruit through the ‘Milk-round’ and other graduate trainee schemes has steadily declined” (Rowley and Purcell, 2001:417).
The traditional graduate destinations cannot longer be a secure source for graduate employment providing a much greater role for SME’s to attract more graduates. In fact, graduates need to be alert to the growing range of graduate opportunities in areas that were formerly seen as non-traditional. More recent work on graduate perceptions of work found that half of all employees surveyed believe that they have found their ideal job in SME’s (Harris, 2005). In this study graduates have reported that SME’s are not a ‘stop-gap’ or a second career option; it is a sector that graduates can have the
I n t e r n a t i o n a l J o u r n a l o f M a n a g e m e n t C a s e s
134
chance to control their career more easily and get involved in a wider range of activities and business functions, something which is difficult in a large organisation.
In this perspective, recruitment of competent management graduate development will be critical. Eight out of ten industry executives agree that the ability to recruit experienced management personnel will be an important human resource challenge. Industry executives are also concerned with the availability of skilled employees and the adequacy of a hospitality education. The outcomes of the Hospitality (2000) research shows that as the hospitality industry moves into the knowledge-based era hierarchical and matrix-like structures will need to give way to flat, flexible learning organisations that look to the market for guidance, take risks and balance analysis with creativity. The hospitality industry’s external and internal organisational structures have shifted significantly from their historical foundation as noted by Purcell and demands more competencies for management (Purcell, 1993). For instance, it is more likely in SME’s to operate within a flexible organisational structure and job design. Those organisations that pursue such courses will clearly be better able to compete in a customer-focused market space.
Consequently, Hospitality management programmes must turn out managers who are more human and more aware of the environment, work place diversity, and obtain the necessary competencies to peruse a successful career. In short, the industry needs managers who can translate knowledge into operations (Kay and Russette, 2000). Identifying the traits or competencies of successful hospitality managers could enable hospitality experts to develop leaders within organisations, allow recruiters to identify potentially successful leaders for the industry, reduce turnover, and encourage hospitality educators to write and implement a curriculum which encompasses specific traits found in potential hospitality management leaders (Graves, 1996).
DiscussionIt is clear that the massive changes in the HE and the socio-economic environment have had considerable implications on graduate employment in both obtaining and retaining careers in traditional occupations. It is also examined that graduate are
now seeking first destination employment in a very diverse environment. SME’s is viewed as the fastest growing sector for graduate employment with a wide range of non-traditional occupations. Even though, a prevailing assumption concerning graduate career within SME’s is that earnings, training, marketability, job security, fringe benefits and prospects is less attractive in SME’s and more common in large organisations (Burns, 2007; Belfield, 1999). Graduates tend to view “SME’s as a ‘second’ option, despite the advantage that may come from working for a SME such as the opportunities for learning, innovation, and creativity” (Moy and Lee, 2002:365). It is clear that many graduates prefer to start their professional career in larger and as they call ‘better-quality’ organisations (Szamosi, 2006) due the lack of challenge, role ambiguity, time pressure and the nature of the work in small businesses (Hanage et al., 2000).
In addition, it is a great concern that many of the best graduates of the HE hospitality management programs terminate their career in the industry because of unfulfilled expectations of joining a large organisation. Jenkins (2001:15) speculates that “the majority of hospitality and tourism graduates do not enter the industry on graduation”. Focusing on placement impacts on future career choices, the overall impression one gains from the tourism and hospitality literature is not entirely encouraging. Thus, studies (i.e. Kusluvan et al., 2003; Callan, 1997; Barron and Maxwell, 1993; West and Jameson, 1990) indicate that a large number of placement students are discouraged from entering the tourism and/or hospitality industry by their experiences. Hospitality industry suffers from a poor image due to a lack of understanding about the available jobs and career opportunities (littlejohn and Watson, 2004) and this may discourage hospitality students from entering the industry and seeking first destination employment. It is a challenge for the higher hospitality education and hospitality industry to motivate graduates to continue persuading a career in the industry.
This research paper used an extensive literature to support that traditional graduate destinations can no longer be a secure provider for graduate employment providing a much greater role for SME’s to attract hospitality graduates. Based on the outcome of this research, it is revealing that there is a need for competencies that are most valuable to graduates entering the industry. The authors suggest that HE needs to develop
135
I n t e r n a t i o n a l J o u r n a l o f M a n a g e m e n t C a s e s
conceptual and analytical competencies that will enhance employability of hospitality graduates for a broaden market of hospitality establishments.
Critically review the existing literature, there is a deficiency in terms of robust data about the choices made by hospitality students in respect of their career employment preferences. Recent research suggests that SME’s is viewed as an alternative career route for graduates and a key area of growing demand in graduate employment (Pittaway and Thedham, 2005). However, the lack of extensive research and data on first destination employment amongst hospitality graduates gives a partial picture of the industry and make it difficult to explore if an increasingly number of hospitality graduates will launch and maintain their careers in SME’s. Thus make it likely, graduates to have either none opinion or negative perception towards SME’s as a first career choice. This is partly because graduate employment and career research has mainly dealt with traditional careers within larger organisations. At the same time, little research has been conducted in the field of hospitality management competencies for the SME’s market.
ConclusionWith higher or changing work expectations the hospitality industry and education must work together to enable graduates to meet workplace expectations. Hospitality educators have long recognised the importance of matching program outcomes with industry needs and there have been a number of studies of hospitality employer expectations of graduates in the UK (Baum, 1991). Indeed, questions on the balance between generic competencies skills and hospitality management specific skills as learning outcomes of the HE require further research. As such, this research study is of more immediate value to those responsible for designing graduate hospitality management programmes first to ensure that they meet academic standards and second to satisfy industry and student expectations regarding the competencies sets needed in the workplace. There is also little evidence about to what extend different job attributes affect hospitality graduate career aspiration and choice.
Consequently, in order to develop a richer and deeper picture of graduate career choices within the hospitality industry, it requires rigorous qualitative
research methodologies to fulfil significant gaps in our understanding about graduate career choices and the effect of different job attributes in job choice and behaviour. Also, an impoverished database in terms of hospitality graduates first destination employment characteristics is essential to explore the first choice of hospitality graduates and develop an accurate picture of graduate employment in SME’s. The authors believe that there is a must for a new framework that will illustrate the competencies needed to cover the vibrant demand of hospitality SME’s. The authors’ viewpoint pose opportunities for further research in the area of competencies framework and exploring graduate first destination employment preferences within SME’s.
ReferencesAhmadi, M. and Helmes, M.M. (1997) Small firms, big opportunities: the potential of careers for business graduates in SMEs. “Journal of Education and Training”, 39 (2), pp.52-57.
Arnold, J., Schalk, R., Bosley, S. and Overbeek, S.V. (2002) Graduates’ experiences of work in small organisations in the UK and the Netherlands: better than expected. “International Small Business Journal”, 20 (4), pp.477-497.
Association of Graduate Recruiters, (2006) An overview of the graduate job market [internet]. available from: <http://www.agr.org.uk/> [accessed 10 February 2009].
Barron, P. and Maxwell, G. (1993) Hospitality management students’ image of the hospitality industry. “International Journal of Contemporary Hospitality Management”, 5 (5), pp.5-8.
Baum, T. (1991) Management trainees in the hotel industry: what do managers expect?. “Journal of european industrial training”, 15 (2), pp. 3-8.
Belfield, G.R. (1999) The behaviour of graduates in the SME labour market: Evidence and perceptions. “Small Business economics”, 12 (1), pp. 249-259.
Burns, P. (2007) “Entrepreneurship and small business”. 2nd Ed. China, Palgrave Macmillan.
Callan, R. (1997) Supervised work experience in Europe: a profile of UK undergraduate perceptions. “International Journal of Contemporary Hospitality Management”, 9 (1), pp.35-39.
I n t e r n a t i o n a l J o u r n a l o f M a n a g e m e n t C a s e s
136
Christou, E. (2000) Revisiting competencies for hospitality management: contemporary views of the stakeholders. “Journal of Tourism and Hospitality education”, 14 (1), pp.25-32.
connor, H. and Shaw, S. (2008) graduate training and development: current trends and issues. “Education + Training Journal” (50) 5, pp.357-365.
Council for Hospitality Management Education, (CHME) (2006) “A review of Hospitality Management education in the UK 2006”. Research Report, Jameson, S. & Walmsley, A., Compass Group.
Davies, R. (1995) “A comparative analysis of graduate’s and hospitality management recruiter’s perceptions of hospitality degree program content and curricular structure”. The Graduate College University of Wisconsin Stout.
Elias, P. and Purcell, K. (2003) On Higher Ground. “People Management”, 19 (11), pp.24-31.
Graves, N.S. (1996) Personality Traits of Successful Managers as Perceived by Food and Beverage Human Resource Executives and Recruiters. “Hospitality Research Journal”, 20 (2), pp.95-112.
Hanage, R., Johnson, D. and Mullein, D. (2002) “Employing graduates for growth”. Research Report 1. Durham, Durham University Business School.
Harris, R (2005) “Improving Tacit Knowledge Transfer within SMEs through E-Collaboration” acta Press [internet]. available from: <http://www.actapress.com/PaperInfo.aspx?PaperID=19671&reason=500> [accessed 19 February 2009].
Harvey, L. (1999) “New Realities: The relationship between higher education and employment”. Keynote presentation at the European Association of Institutional Research Lund, Sweden, August.
Hawkins, P. and Winter, J. (1996) The self-reliant graduate and the SME. “Journal of Education and training”, 38 (4), pp.3-9.
Hemmington, N. (2007) From service to experience: understanding and defining the Hospitality business. “The Service Industries Journal”, 27 (6), pp.747–755.
Higher Education Statistics Agency (2006) Table All students FTE by institution and level of study 2004/05. HeSa.
Hospitality (2000) “A View to the Next Millennium Global Study yield Insights about the Future”, USA, Arhur Andersen.
Jenkins, A.K. (2001) Making a career of it? Hospitality students’ future perspectives: an Anglo-Dutch study. “International Journal of Contemporary Hospitality Management”, 13 (1), pp.13-20.
Kay, C. and Russette, J. (2000) Hospitality management competencies: identifying manager’s essential skills. “The Cornell Hotel and Restaurant administration Quarterly”, 41 (2), pp. 52-63.
King, Z. (2003) New or traditional careers? A study of UK graduates’ preferences. “Human Resource Management Journal”, 13 (1), pp.5-26.
Kusluvan, S., Kusluvan, Z. and Eren, D. (2003) “Undergraduate tourism students’ satisfaction with student work experience and its impact on their future career intentions: a case study”, in Kusluvan, S. (Eds) Managing Employee Attitudes and Behaviors in the Tourism and Hospitality Industry, Nova Science Publishers, New york, Ny.
Lashley, C. and Morrison, A. (2000) “In Search of Hospitality; Theoretical Perspectives and Debates”. Oxford, Butterworth- Heinemann.
littlejohn, D. and Watson, S. (2004) Developing graduate managers for hospitality and tourism. “International Journal of Contemporary Hospitality Management”, 16 (7), pp. 408-414.
Moreau, M.P. and Leathwood, C. (2006) Graduates’ employment and the discourse of employability: a critical analysis. “Journal of Education and Work”, 19 (4), pp.305-324.
Moy, J.W. and Lee, S.M. (2002) The career choice of business graduates: SMEs or MNCs? “Career Development”, 7 (6), pp.339-347.
Nabi, R.G. (2003) Graduate employment and underemployment: opportunity for skill use and career experiences amongst recent business graduates. “Journal of education and training”, 45 (7), pp.371-382.
137
I n t e r n a t i o n a l J o u r n a l o f M a n a g e m e n t C a s e s
Nelson, A.A. and Dopson, L. (1999) Future of hotel education: required skills and knowledge for graduates of US hospitality programs beyond the year 2000 – part one. “Journal of tourism and Hospitality education”, 13 (5), pp. 58-67.
O’Connor, D. (2005) Towards a New Interpretation of Hospitality, International Journal of Contemporary Hospitality Management, 17 (3) pp.267–71.
People1st, (2006) industry Report [internet]. Available from: <http://www.people1st.co.uk/default.asp?siD=1139851079195&nStart=5> [accessed February 2009].
Pitcher, J. and Purcell, k. (1998) Diverse Expectations and Access to Opportunities: is there a graduate labour market?. “Higher Education Quarterly”, .52 (2), pp. 179-203.
Pittaway, L. and Thedham, J. (2005) ‘Mind the gap’: Graduate recruitment in small businesses. “international Small Business Journal”, 23 (403), pp.403-424.
Purcell, K. (1993) Equal opportunities in the hospitality: custom and credentials. “International Journal of Hospitality Management”, 12 (2).
Purcell, k., elias, P. and Wilton, N. (2004) Researching graduate career seven years on. Higher education, skills and employment: careers and jobs in the graduate labour market. Research Report Warwick, Warwick Institute for Employment Research, Employment Studies Research Unit.
Rowley, G. and Purcell, K. (2001) Up to the job? Graduates’ perceptions of the UK Higher Education careers service. Higher Education Quarterly, 55 (4), pp.416-435.
Summers, D. (1997) Top of the student wish list. Financial Times, 30 July.
Szamosi, L.T. (2006) Just what are tomorrow’s SME employees looking for? “Journal of Education and training”, 48 (8/9), pp.654-665.
The Higher Education Careers Service Unit, (HecSu) (2004) Seven years on: graduate careers in a changing labour market [internet]. available from: <http://www.prospects.ac.uk/downloads/csdesk/members/reports/seven_years_on.pdf> [accessed 9 February 2009].
West, A.J. and Jameson, S. (1990) Supervised work experience in graduate employment. “International Journal of Contemporary Hospitality Management”, 2 (2), pp.29-32.
Westhead, P. and Matlay, H. (2005) Graduate employment in SMEs: A longitudinal perspective. Journal of Small Business and Enterprise Development, 12 (3), pp.353-365.
Additional ReadingHolden, R. and Jameson, S. (2002) Employing graduates in SMEs: towards a research agenda. “Journal of Small Business and Enterprise Development”, 9 (3), pp.271-284.
Holden, R., Jameson, S. and Walmsley, A. (2007) New graduate employment within SMEs: still in the dark? “Journal of Small Business and Enterprise Development”, 14 (2), pp.211-227.
Jameson, S. (2000) Recruitment and training in small firms. “Journal of European Industrial training”, 24 (1), pp.43-49.
Jameson, S.M. and Holden, R. (2000) “Graduateness” - who cares? Graduate identity in small hospitality firms. “Journal of Education and training”, 42 (4/5), pp. 264 – 271.