editorial policy - texila international journal
TRANSCRIPT


EDITORIAL POLICY
Papers must be submitted with the understanding that they have not been published elsewhere (except in the form of an abstract or as part of a published lecture, review, or thesis) and are not currently under consideration by another journal published or any other publisher. The submitting (Corresponding) author is responsible for ensuring that the article’s publication has been approved by all the other coauthors. It is also the authors’ responsibility to ensure that the articles coming from a particular institution are submitted with the approval of the necessary institution. Only an acknowledgment from the editorial office officially establishes the date of receipt. It is a condition for submission of a paper that the authors permit editing of the paper for readability. All enquiries concerning the publication of accepted papers should be addressed to [email protected]
PEER REVIEWERS
Prof Dr Neeraj Bedi, Professor, Technical Advisor and Adjunct Professor
Dr. Krutarth Brahmbhatt, Associate Professor, Community Medicine
Dr. S. M. Kadri, Epidemiologist, Kashmir Province, Directorate of Health Services Principal/Head Regional Institute of Health and Family Welfare
Dr. Donald S. Christian, Assistant Professor Department of Community Medicine.
Dr Oladapo Okareh, Senior Lecturer, Department of Environmental Health Sciences.
Dennis Aribodor, Chairperson, Academic Staff Union Of Universities
Roy Marzo, Head of Clinical Division, Asia Metropolitan University/Texila American University

ABOUT PLAGIARISM
Plagiarism is the use or close imitation of the language and ideas of another author and representation of them as one’s own original work. Duplicate publication, sometimes called self plagiarism, occurs when an author reuses substantial parts of his or her own published work without providing the appropriate references. This can range from getting an identical paper published in multiple journals, where authors add small amounts of new data to a previous paper.
Plagiarism can be said to have clearly occurred when large chunks of text have been cut and pasted. Such manuscripts would not be considered for publication in TIJBMS Journal. But minor plagiarism without dishonest intent is relatively frequent, for example when an author reuses parts of an introduction from an earlier paper. The editors will judge any case of which they become aware (either by their own knowledge of and reading about the literature, or when alerted by referees) on its own merits.
The paper containing the plagiarism will be obviously returned back to the author’s for review, but we earnestly request the authors to avoid submitting plagiarized

DISCLAIMER
Texila International Journal of Public Health (TIJPH) make every effort to ensure the accuracy of all the information (the “Content”) contained in its publications. However, the TIJPH and its agents make no representations or warranties whatsoever as to the accuracy, completeness or suitability for any purpose of the Content and disclaim all such representations and warranties whether express or implied to the maximum extent permitted by law. Any views expressed in this publication are the views of the authors and are not necessarily the views of the Editor’s or Texila International Journal of Public Health.

TABLE OF CONTENT
1 Assessing Community Health Workers Compliance to Who Best Practices for Safe Injection of Contraceptive in a Rural Community Setting of Tanzania
1
A. Kalolella
2 New Ways of Working: How Well are Public Hospital Staff in Nigeria Willing to be Knocked off Their Comfort Zones?
12
Maclawrence Kolapo Famuyiwa
3 An Assessment of Depo-Provera Injection Practice in Primary Health Care Facilities of Kilombero District, Tanzania
24
A.Kalolella
4 Health Impact of the Indiscriminate use of Herbicides in Nigeria 33
Oche Joseph Otorkpa
5 Ultrasonographic Study in Pregnancy and Sex Preference in Bangladesh 41 Irin Hossain
6 Factors that Influence Practice-Nurses to Promote Physical Activity 52 Sophonie Ndahayo
7 Knowledge, Attitude and Perceptions of Pregnant Women towards Caesarean Section among Antenatal Clinic Attendants in Cape Coast, Ghana
58
James Kojo Prah
8 Hypertension and Isolated Office Hypertension in HIV-Infected Patients Determined by Ambulatory Blood Pressure Monitoring: Prevalence and Risk Factors
66
Orji Ikechukwu Anthony
9 Perception of Parents on Adolescents’ use of Contraceptives in Igbogbo District in Ikorodu Local Government, Lagos State, Nigeria
73
Aremu Bukola Janet
10 Implications for Factors Affecting Prevention of Mother-to-Child Transmission of HIV Programs in University Teaching Hospitals in
91

Anambra State Michael Olugbamila Dada
11 Epidemiological Updates of Zika Transmission and Emphasizing the Critical Role of Public Health Interventions
100
Soosanna Kumary
12 Use of Technology to Improve Healthcare Outcomes is the Need of the Hour!
107
D. Chirundu
13 Environmental Indices and Awareness among Residents of Klerksdorp, South Africa (A Cross-Section Study)
118
O.O Alewi
14 HIV/AIDS: Group versus Individual Right 128
Oladimeji Akeem Akinyemi
15 Knowledge and Attitude towards Obesity among Secondary School Students of Royal Crystal College, Ile-Ife, Nigeria
134
Arilewola Abosede Omotola
16 Willingness to Pay for HIV Treatment - A Case of Clients Seeking Care at Rimuka TB and HIV Site Kadoma Zimbabwe (2016)
148
D. Chirundu
17 Diabetes Mellitus Prevalence in HIV Patients on Antiretroviral Therapy at Parirenyatwa Group of Hospitals Opportunistic Infections Clinic, Harare, Zimbabwe
158
Pasipanodya Ian Machingura
18 Knowledge and Practices of Food Safety among Senior Secondary School Students of International School, ObafemiAwolowo University, Ile- Ife, Nigeria
163
Ilesanmi Oluwafemi Temitayo
Texila International Journal of Public Health Volume 5, Issue 1, Mar 2017
Assessing Community Health Workers Compliance to who Best Practices for Safe Injection of Contraceptive in a Rural Community
Setting of Tanzania
Article by A. Kalolella1, D. Danda2, I. Nyarusi3, J. Baraka4, A. Rusibamayila5, E. Mlay6, C. Festo7, C. Baynes8, F. Eetaama9, M. Hiza10, J. Phillips11
1, 2, 4, 6, 7Ifakara Health Institute, Dar es Salaam, Tanzania, 3, 10Ministry of health and Social Welfare,
9Dar es salaam, Tanzania 5, 8, 11Columbia University, New York, United States
1E-mail: [email protected]
Abstract
The objective of this study was to assess Community health workers (CHW) compliance to WHO guideline of safe injection steps in community settings. The cross sectional descriptive study design using structured observation checklist was adopted to collect injection safety steps data. The CHWs trained to provide injectable contraceptive were direct observed by reproductive health nurse while administering intramuscular injection to women in need of injectable contraceptiveas part of family planning program in Kilombero district, Tanzania. About 1704 women received injection from 35 trained CHW. In this study we assessed if intramuscular injection and infection prevention steps taken complied to WHO based best practices for safe injections when CHW interacted with client.
Results: Majority of CHW complied to WHO best practice for safe injection: Over 89 % steps for infection prevention measures and over 91% steps for intramuscular injection technical performance complied to WHO safe injection guideline. The result also shows that CHW are likely to comply to WHO safety when they conduct injection at their own homes compared to other locations; infection prevention at CHW’s home -90.7%, health centre -80%, client home - 77% and 59.4% in other settings, while intramuscular injection steps; CHW’s home -89.6%, health centre- 83.1%, patient’s home -84% and other places -81%. Young CHW aged 18-25 years are highly likely to comply to the guideline for infection prevention steps by 79.3% compared to 77.2% CHWs aged 25 years and above, while for safe intramuscular steps -91.7% for CHW aged 17-24, and 82.4% for CHW aged over 25 years.
Keywords: WHO Compliance, Safe injection procedures, community health workers, Blood borne infection, intramuscular injection technical performance, infection prevention.
Introduction
Noncompliance to World health organization (WHO) injection guideline leads to unsafe injection and poor waste management that leads to increasing direct health care cost and causing millions of deaths. Non compliance causes various diseases acquired from contaminated injection, inappropriate injection technical performance and poor handling of biological waste from injection procedures (Nilsson et al., 2013, WHO, 2010). Non compliance to WHO injection guideline is public health issue that need to be dressed in order to prevent transmission of blood born infections during this era of increasing use of informal health care workers, particularly community health workers (CHW) to provide injectable medication (Nilsson et al., 2013, WHO, 2010;Olawo et al., 2013; Brunie et al., 2011 ). Implementing safe injection procedure is one of the major challenges that developing countries health care service providers are facing (Gyawali et al., 2013). Unsafe injection is the one that lead to transmission of different types of pathogens, including bacteria, parasites, viruses, bacteria and fungi and also cause non-infectious adverse events such as abscesses and toxic reactions. (WHO, 2010; Pruss et al., 2005).
1

Texila International Journal of Public Health Volume 5, Issue 1, Mar 2017
In 2010, in sub-saharan Africa alone, non compliance to injection guidelines contributed to 1.9 million cases of HIV infection, which is 17% of new HIV infection due to unsafe injection procedures (Nilsson et al., 2013). Health care workers (HCW) in sub-Saharan Africa are more exposed to waste that are highly infectious including contaminated needles, sharps, and syringes that causing them annual estimated infection of 16,000 of HCV infections, 66,000 HBV and 1,000 HIV infections (Pruss-Ustun et al., 2005; WHO, 2010; Nilsson et al., 2013). In Many African nations waste is burn in open places exposing surrounding people with hazardous substances (Nilsson et al., 2013). The recommended solution to address the problem of non compliance is to involve all necessary stakeholders in the training and appropriate educational program. Effective management policy and active participation of stakeholders responsible for injection activities can help reduce unsafe injection practice effectively (Gyawali et al., 2013). All governments, health professionals, patients and communities in general are responsible to ensure safety for injection procedures (WHO, 2010).
WHO recommends safe injection procedures in its guideline manual as the best practice for safe injection. Unfortunately almost half of the developing nations do not follow WHO guideline for safe injection procedures (Nilsson et al, 2013; WHO, 2010). The guideline indicates how to conduct safe injection, how to dispose syringes, sharps and other health care waste (WHO, 2010). Best injection practice as dictated in the injection guideline by WHO is the one that is performed aiming at protecting patients, health workers and the community from contaminated post-injection waste (WHO, 2010). WHO Best infection control practices for injections advocate for use of new sterile single-use injection equipment for each procedure, while HCWs are required to discard any injection package that is damaged (WHO, 2008, WHO, 2010, WHO, 2015). Providers are required to anticipate and take measures to prevent needle stick by preparing and preventing sudden patient movement and avoiding recapping and other manipulation of needle or if necessary use a single-handed scoop recapping technique (WHO, 2015). Providers are required to collect used injection equipment at the point of use in a sharps container that has no leakages and is puncture proof that can be sealed-shut during transportation to disposal site (WHO, 2015). The guideline for safe injection put emphasis on separation of infectious waste from non-infectious waste, sharp from non- sharp and be disposed at different containers while avoiding overfill of the waste collecting container to reduce risk of exposure to needle stick injury (NSI) and infections (Pruss et al., 2005;Nilsson et al., 2013; WHO, 2010). Disposal of waste should be done in the standard incinerator that complete destroy and disinfect all infectious materials that can be buried or disposed elsewhere. The HCWs are at risk of post-injection NSI due to fault of injection technical performance. The NSI is estimated to cause 23–62% of new HBV and 7% for HCV. In 2003, WHO published the NSIs in HCWs showing that there were 3 million accidental episodes of needle-stick injuries which caused 37% of all new HBV incidences in HCWs, 39% of new HCV cases and about 5.5% of new HIV infections (WHO, 2015). An accidental needle-stick injury (NSIs) is common observed to health care workers who have poor knowledge of handling sharps before and after use including infected ones before disposal, while recapping needle after it has been used is among high risk practices (NILSSON et al., WHO, 2015; Hunter, 2007). The contamination of CHW’s hands and working environment surface may also transmit blood borne pathogens among HCW and patients (Pruss et al., 2005, WHO, 2010). Compliance to safe injection procedure is the only solution to reduce harm and limit exposure to blood borne disease for both, patient receiving injection and the services provider (WHO, 2015).
The use of CHW to provide primary health care is now growing, changing their role from health promotion and disease prevention to provision of curative services using injectable medication (Parez et al., 2009; Kate et al., 2013; Coffey et al., 2012; Brunie et al., 2011). There is an increase of African countries to use community health workers (CHW) to provide health care services in hard to reach and rural areas (Parez et al., 2009; Olawo et al., 2013; Kate et al., 2013). Critical shortage of clinical staffs is the main cause that pushed many
2

Texila International Journal of Public Health Volume 5, Issue 1, Mar 2017
African countries to use CHW to administer health care services to increase access of preventive and curative care (Parez et al., 2009; Olawo et al., 2013; Burke et al., 2014). This changing perspective of using CHW has been observed to be successful in Sub-Saharan Africa including Kenya, Madagascar and Uganda, countries with critical shortage of health care staffs. In these countries CHW have been used to provide mainly injectable family planning services. Studies indicate the CHW has been used successfully to prevent neonatal sepsis through provision of pre-dosed gentamycin in Nepal (Coffey et al., 2011).
Tanzania has started using CHW to administer injectable medication as community based services to increase access of injectable contraceptive since 2015. This is one of national efforts to ensure availability and accessibility of injectable contraceptive to reduce unmet needs of family planning.
Tanzania is one of many African countries that have high prevalence of HIV infection (Nilsson et al., 2013. Recently study conducted in Tanzania indicates that health care workers have inadequate knowledge of risks associated with unsafe injection practice and post-injection waste (Nilsson et al., 2013). The study also indicated that 46% of health care workers had NSI for the past five years, while 50% were exposed to blood in their mucus membrane or skin wounds (Nilsson et al., 2013). Despite all injection activities conducted by the community health workers in the country, few information is available on CHW compliance to WHO guideline on safety, waste disposal and technical perceptive of intramuscular injection. While few data on unsafe injection is available, unsafe injection will continue to transmit blood bone diseases in Tanzania. If this situation is not brought to the control unsafe injection practices will continue to fuel blood borne diseases such as Ebola, malaria, Marburg viruses and hemorrhagic fevers in Africa (WHO, 2015).
We planned to evaluate the compliance to WHO injection guideline of a paid community health worker employed by a non- government organization that was trained and supervised by Ministry of health. This Study has assessed the safety infection prevention and technical performance procedures as WHO guidelines elements for safe injection during CHW’s performance of intramuscular injection in the community setting at Kilombero district in southern Tanzania.
Methodology
About 35 CHWs with ordinary level secondary education were trained for one month to administer injectable contraceptive. The trained CHWs were later deployed to the community to administer intramuscular injection of medroxyprogesterone acetate as part of family planning program in Kilombero district, southern part of Tanzania.
The cross sectional descriptive study design was used to collect data. The structured direct observation checklist form was used to collect information of injection processes and safety steps. The checklist was prepared using guidelines of the Tanzanian Ministry of Health adopted from WHO guidelines for safe injection (Nilsson et al., 2013; WHO, 2010, Tanzania, 2004). About 12 registered reproductive health nurses participated to conduct direct observation of injection steps being performed and filled direct observational checklist form. Nurses direct observed and filled the direct observation form for CHWs who were administering injection for at least 24 injections for each CHW for the period of June-2015 to May 2015. The close-ended checklist of injection performance steps were defined as 0 for non- compliance and 1 as compliance to safe step of intramuscular injection respectively. The first part of checklist form was the demographic characteristic including age and sex of CHW performing the injection steps. The second section was infection prevention steps conducted by CHW while using syringes, needles, sharps, pads and other blood contaminated materials and third one is recommended safe steps of injecting the DMPA. The injection observation was conducted at setting convenient for client either at client’s home or at CHW’s home, nearest health facility or other places.
3

Texila International Journal of Public Health Volume 5, Issue 1, Mar 2017
Ethical consideration
The study was approved by the Medical Research Coordinating Committee of National Institute for Medical Research (NIMR) while research clearance was obtained from Ifakara health Institute and I formed consent was sought from women receiving injection.
Data analysis
EpiData software was used to develop data entry screen for processing of direct observation checklist. Data analysis was performed using Stata version 13 (College Station, Texas). Variables were categorized as: Age and sex of CHW, settings of giving injection, Infection prevention and intramuscular injection technical performance compliance procedures. Frequencies tables and cross tabulations were used to determine compliances to WHO recommended safe intramuscular steps and associations between variables. The infection prevention steps observed were; (1) washing hands well with soap and water or apply alcohol hand rub on the hands, (2) drying hands with a clean single use towel or let them air dry, (3) Opens (appropriate size) sterile package for syringe/needle, (4) Do not recap needle to avoid needle stick injury, (5) Cleans injection site with dry swab (without using any antiseptic), (6) washing hands with soap and water or apply alcohol hand rub on both hand after the procedures (7) , Do not massage injection site, (8) Instructs the client not to massage after injection to avoid introducing infection to injection site, and (9) discards the used syringe and needle into the safety-box (WHO, 2015, Hunter, 2007). Intramuscular injection technical performance compliance steps observed are: (1) checks the vial for content, dose, and expiration date, (2) mix the contents by rolling bottle between palms or shakes gently to homogenize the solution, (3) correctly filling of syringe with contents of the bottle, (4) expels air from syringe without pushing any of the DMPA out, (5) Inserts needle deep into the deltoid muscle, (6) aspirates to ensure needle is not in a vein, (7) inject the entire contents of the syringe. (WHO, 2015, Hunter, 2007).
For categorical data, the proportional and confidence interval are presented with non-overlapping confidence suggesting a significant difference. Data were analyzed into two ways. (1) Overall compliance of CHW to WHO steps of safe injection in the areas of: (a) infection prevention steps and (b) intramuscular injecting steps. (2) Cross tabulations to determine if age, sex and setting or places of giving injection were associated with compliance to WHO safe injection in the above mentioned areas of infection prevention steps and intramuscular injecting steps. In cross tabulation, performance of these steps were quantified and categorized as very well if CHW provided injection to client with all steps complied to WHO safe practise (100% compliance), well for 75-99% and Fair for 50-74% and poor if less than 50%.
Results
A total of 35 CHW were assessed for injection safety steps compliance. Among CHW participated, 8 were aged between 15-24, and 27 aged between 25- 45, while 21 of them were male and 14 were female (Table 1). There were a total of 1717 DMPA injections administered by CHWs of which all steps were direct observed by Nurses and checklist forms filled: Among the filled forms 13 were excluded due to incomplete information. The total of 1704 forms was included for data analysis.
Overall compliance of CHW to WHO infection prevention steps
In infection prevention steps, majority of injections administered by CHWs complied to WHO practice for safe infection prevention steps (Table 2).
The overall percentage of compliance to WHO Infection prevention for each step are indicated below (Table 2, Overall column):
1. washing hands well with soap and water or apply alcohol hand rub on the hands, 96.7% 2. drying hands with a clean single use towel or let them air dry, 93% 3. Opens (appropriate size) sterile package for syringe/needle, 93%
4

Texila International Journal of Public Health Volume 5, Issue 1, Mar 2017
4. Cleans injection site with dry swab (without using any antiseptic),95.6% 5. Do not massage injection site, 94.7% 6. Instructs the client not to massage after injection to avoid introducing infection to
injection site, 89.1% 7. Do not recap needle to avoid needle stick injury, 96.2% 8. Discards the used syringe and needle into the safety-box 96.2% and 9. Washing hands with soap and water or apply alcohol hand rub on both hand after the
procedures, 89.7%.
Overall compliance of CHW to WHO safe intramuscular DMPA injecting steps
Majority of injections administered by CHWs complied to WHO practice of safe DMPA intramuscular injecting steps (Table 3, Overall column). The overall percentage of compliance to WHO intramuscular injecting steps for each step are indicated below (Table 3).
1. Checks the vial for content, dose, and expiration date, 92.9% 2. Mix the contents by rolling bottle between palms or shakes gently to homogenize the
solution, 94.1% 3. Correctly filling of syringe with contents of the bottle, 95.8% 4. Expels air from syringe without pushing any of the DMPA out, 91.6% 5. Inserts needle deep into the deltoid muscle, 95.9% 6. Aspirates to ensure needle is not in a vein, 96.2% 7. Inject the entire contents of the syringe, 96.4%.
Cross tabulations to determine if age, sex and setting or places of giving injection were associated with compliance to WHO infection prevention steps
In infection prevention steps, cross tabulation, performances of these steps were quantified and categorized (Table 4). The result indicates that when compliance was quantified, about 79% of injection performed by CHW aged between 18- 25 years and 77% of injection administered by CHW aged 25 – 45 years were done very well (100% compliances with all step collect complied to WHO guideline) (Table 4). Although the compliance of CHW aged 17 – 24 looks higher than 25 – 45 years age, but since the confidence intervals overlap each other, then the difference is not significant. The CHW aged 17-24 had no (0%) none compliance to WHO safe steps of injection administration compared to aged 25-45 who had 3.9% non compliance to WHO safe injection (Table 4). The highest compliance of infection prevention (Very well) was 94.9% for male compared to 80.5% for female. There is an indication that male performance was better than that of females but the difference was not statistically significant. The none compliance was more for female 4.2% compared to male 1.8%. The result also shows the different in compliance to infection prevention step is significance if injection was conducted at CHW’s home than another location. The infection prevention steps compliance based on setting where injection was administered: CHW’s home by 90.7%, health centre by 80%, client home by 77% and 59.4% in other settings (Table 4). Poor infection prevention performance was more observed at other places by 4.5% followed by client home of 3.7% and 0.3% at CHW’s home. No non compliance (0-50%) was observed at Health centre setting (Table 4).
Cross tabulations to determine if age, sex and setting or places of giving injection were associated with compliance to WHO intramuscular injecting steps
In intramuscular injecting, the result indicate that 91% of injections performed by CHW aged 17-24 were very wells (100% complied), while CHW aged between 25- 45 administered 82% of intramuscular injection with all steps complied (Table 5).
The CHW aged 17-24 had no none compliance performance while aged 25-45 had none compliance of 4% and the difference is statistically significant since the confidence interval doesn’t overlap (Table 5). The Compliance to intramuscular injecting steps indicate compliance of 91.7% among CHW aged 17-24, and 82.4% of CHW aged between 25- 45 , while CHW aged 17-24 had no non compliance (0-50%), while aged 25-45 had non compliance of 4% and the difference is statistically significant since the confidence interval
5

Texila International Journal of Public Health Volume 5, Issue 1, Mar 2017
doesn’t overlap (Table 5). Intramuscular Injecting steps compliance by gender of CHW shows that majority complied, but male compliance is higher (88.1%) than female (80.9 and the difference is significant since the confidence intervals don’t overlap (Table 5). Intramuscular injecting steps compliance based on setting where injection conducted indicates that CHW’s home performance looks a bit higher than the others ( home 89.6%, health centre, 83.1%, patient home 84% and other places 81%, but the difference is not significant (Table 5).
Discussion
Community health workers complied to WHO guidelines for safe injection steps that can change health policy to add a new cadre for family planning services in the community setting. CHWs successfully followed infection prevention and intramuscular injection steps as established by WHO.
The objective of this study was to assess CHW compliance to WHO guideline of safe injection steps in community to inform policy makers on the evidence of capability of CHW to take over the task of distributing and administering the most popular and preferred by women injectable contraceptive, DMPA in Tanzania. Safety was addressed through ability of CHW to follow guideline of steps while administering injection. The community health workers in this study reported overall higher compliances to WHO guidelines of safe injection steps while injecting contraceptive. They have demonstrated compliance to infection prevention steps and intramuscular injecting steps as indicator of good training received from health care staffs of the ministry of health. They have demonstrated reliability for task shifting injectable contraceptive from overloaded health care workers to CHW.
WHO infection prevention steps
With respect to WHO compliances on infection prevention steps, CHW aged between 18- 25 are more likely to comply with guideline steps compared to CHW aged 25 years and above, while female CHWs are less likely to compliance to the guideline steps compared to male when receiving similar training. The CHWs are more likely to comply to WHO guideline steps to infection prevention when performing their activities at their own home compared to other places that the client may choose to get injection. This result findings may be contributed by the well know environment that CHW is used to provide injection procedure.
WHO intramuscular injecting steps
The majority of CHW complied with WHO guideline for safe intramuscular injecting steps. However young CHWs aged 17-24 are more likely to comply to all guideline if they are well taught and motivated, while at similar situation, CHW aged 25 and above are likely to non- compliance to the guidelines and instructions provided. Male CHWs are more likely to comply compare to their opposite gender. Based on setting where injection was given, CHW’s home setting is the best place to help CHW to comply with guideline for intramuscular injecting steps, probably due to privacy and undisturbed environment where service is provided. Further study is needed to evaluate if CHW can provide more advanced long term family planning method of ‘implant’.
Conclusion
The study indicated that CHWs can provide safe injection of Depo-provera. The findings help to inform the Ministry of Health that if CHW is well trained and prepared is capable of providing safe family planning services and can even increase access to contraceptives. The Ministry of Health can use this result for policy change and give opportunity to CHW to provide contraceptive services while reducing workload to health facility staffs.
6

Texila International Journal of Public Health Volume 5, Issue 1, Mar 2017
Acknowledgements
We would like to acknowledge the contribution professor James Phillips, and Colin Baynes from Columbia University, Kilombero district medical officer, project staffs and all participants for time and efforts to make this study successful. The study was funded by the United States International Development.
References
[1]. Alice Auma Olawo, Issak Bashir, Marsden Solomon, John Stanback, Baker Maggwa Ndugga, Isaac Malonza. 2013. A cup of tea with our CBD agent … ’’: community provision of injectable contraceptives in Kenya is safe and feasible. Global Health: Science and Practice 2013 | Volume 1 | Number 3. [2]. Brunie A, Hoke TH, Razafindravony B. (2011). Community-based distribution of injectable contraceptives in an African setting: community trial in Madagascar. Sante.2011 Jan-Mar; 21(1):21-6. doi: 10.1684/san.2011.0232. [3]. Coffey PS1, Sharma J, Gargi KC, Neupane D, Dawson P, Pradhan YV. (2012) Feasibility and acceptability of gentamicin in the Uniject prefilled injection system for community-based treatment of possible neonatalsepsis: the experience of female community health volunteers in Nepal. J Perinatol. 2012 Dec; 32(12):959-65. doi: 10.1038/jp.2012.20. [4]. Gyawali S1, Rathore DS, Shankar PR, Kumar KV. (2013). Strategies and challenges for safe injection practice in developing countries. J Pharmacol Pharmacother. 2013 Jan; 4(1):8-12. doi: 10.4103/0976-500X.107634. [5]. Kate Ramsey1,2*, Ahmed Hingora2, Malick Kante1,2, Elizabeth Jackson1, Amon Exavery2, Senga Pemba3, Fatuma Manzi2, Colin Baynes1,2, Stephane Helleringer, James F Phillips (2013). The Tanzania Connect Project: a cluster randomized trial of the child survival impact of adding paid community health workers to an existing facility-focused health system. BMC Health Serv Res. 2013;13 Suppl 2:S6. doi: 10.1186/1472-6963-13-S2-S6. [6]. Nilsson J, Andrea B. Pembe, Miriam Urasa, and Elisabeth Darj (2013). Safe injections and waste management among healthcare workers at a regional hospital in northern Tanzania. Tanzania Journal of Health Research Doi: http://dx.doi.org/10.4314/thrb.v15i1.8 Volume 15, Number 1, January 2013. [7]. Perez F, Ba H, Dastagire SG, Altmann M. (2009). The role of community health workers in improving child health programmes in Mali. BMC Int Health Hum Rights. (2009) Nov 10;9:28. doi: 10.1186/1472-698X-9-28. [8]. Prüss-Üstün A, Rapiti E, Hutin Y. Estimation of the global burden of disease attributable to contaminated sharps injuries among health-care workers. American Journal of Industrial Medicine, 2005, 48(6):482–490. Retrieved from http://www.who.int/quantifying_ehimpacts/global/7sharps.pdf. [9]. Tanzania (2004) National Infection Prevention and Control Guidelines for Health Care Services in Tanzania. Ministry of Health and Social welfare, The United Republic of Tanzania, Dar es Salaam. [10]. World Health Organization, 2010. WHO Best Practices for Injections and Related Procedures Toolkit Geneva: 2010 Mar. ISBN-13: 978-92-4-159925-2. Retrieved from http://www.ncbi.nlm.nih.gov/books/NBK138491/PubMed. [11]. World Health Organization, 2015. WHO Guideline on the Use of Safety-Engineered Syringes for Intramuscular, Intradermal and Subcutaneous Injections in Health-Care Settings. Geneva: Retrieved from http://www.ncbi.nlm.nih.gov/books/NBK305368/.
7

Texila International Journal of Public Health Volume 5, Issue 1, Mar 2017
Table 1. Demographic characteristics of CHWs
Demographic characteristics of CHWs Variable Response Frequency Percent
Age group in years
15- 24 8 23%
25- 45 27 77% Gender in sex
Male 21 60%
Female 14 40% Total 35
8

Tex
ila
Inte
rnat
iona
l Jou
rnal
of
Pub
lic
Hea
lth
Vol
ume
5, I
ssue
1, M
ar 2
017
Tab
le 2
. Com
plia
nces
to W
HO
infe
ctio
n pr
even
tion
ste
ps a
mon
g in
ject
ion
adm
inis
tere
d by
CH
W b
ased
on
Age
and
Gen
der
of C
HW
adm
inis
tere
d in
ject
ions
and
Set
ting
of
givi
ng in
ject
ion
(n=
1704
).
Infe
ctio
n P
reve
ntio
n st
eps
Inje
ctio
ns a
dmin
iste
red
that
com
plie
d to
WH
O p
ract
ice
Age
G
ende
r P
ract
ice
sett
ing
O
vera
ll
18-2
4yea
rs
25-
45ye
ars
Mal
e
Fem
ale
CH
W
hom
e H
ealt
h C
ente
r P
atie
nt
hom
e O
ther
T
otal
N=
? , (
%
?)
N=
? , (
% ?
) N
=?
, (%
?)
N
=?
, (%
?)
N
=?
, (%
?)
N
=?
, (%
?)
N
=?
, (%
?)
N
=?
, (%
?)
N
=?
, (%
?)
Was
hes
hand
s
359(
98.9
0%
) 1,
201(
96.1
6%
) 76
3(98
.15
%)
797(
95.3
8%
) 26
8(99
.26
%)
128(
98.4
6%
) 10
23(9
6.3
3%)
229(
94.5
5%
) 16
12(9
6.77
)
Dri
es h
ands
35
5(97
.80
%)
1,14
6(91
.75
%)
763(
93.9
7%
) 73
8(92
.25
%)
261(
96.6
7%
) 11
6(89
.23
%)
990(
93.2
2%
) 21
8(92
.73
%)
1,61
2(93
.11
%)
Ope
ns s
teri
le
syri
nge/
need
le
360(
99.1
7%
) 1,
182(
94.6
4%
) 78
2(96
.31
%)
760(
95.0
0%
) 25
3(99
.26
%)
112(
96.6
7%
) 96
6(95
.08
%)
207(
93.6
7%
) 1,
612(
93.1
1%
) C
lean
s in
ject
ion
36
0(99
.17
%)
1,18
1(96
.74
%)
782(
96.3
1%
) 75
9(94
.88
%)
264(
97.6
5%
) 11
5(95
.83
%)
969(
95.3
7%
) 20
8(94
.12
%)
1,61
2 (9
5.60
%)
Do
not m
assa
ge
inje
ctio
n si
te.
349(
96.1
4%
) 1,
178(
94.3
2%
) 77
7(93
.75
%)
750(
95.6
9%
) 24
8(97
.25
%)
118(
98.3
3%
) 95
3(93
.80
%)
208(
94.1
2%
) 1,
612(
94.7
3%
) In
stru
cts
the
clie
nt n
ot to
m
assa
ge
338(
93.1
1%
) 1,
099(
87.9
9%
) 70
9(87
.32
%)
728(
91.0
0%
) 24
6(96
.47
%)
109(
90.8
3%
) 90
9(89
.47
%)
173(
78.2
8%
) 1,
612(
89.1
4%
)
Do
not r
ecap
ne
edle
35
5(97
.80
%)
1,19
6(95
.76
%)
792(
97.5
4%
) 75
9(94
.88
%
253(
99.6
1%
) 11
8(98
.33
%)
96
8(95
.28
%)
21
1(95
.48
%)
1,61
2(96
.22
%)
Dis
card
s th
e us
ed s
yrin
ge a
nd
need
le
358(
98.6
2%
) 1,
193(
95.5
2%
) 78
6(96
.80
%)
765(
95.6
3%
) 25
3(99
.22
%)
119(
99.1
7%
) 97
0(95
.47
%)
20
9(94
.57
%)
1,61
2(96
.22
%)
Was
hes
hand
s af
ter
proc
edur
e.
334(
92.0
1%
) 1,
113(
89.1
1%
) 78
6(96
.80
%)
765(
95.6
3%
) 24
6(96
.47
%)
111(
92.5
0 %
) 90
4(88
.98
%)
186(
84.1
6%
) 1,
612(
89.7
6%
)
9

Tex
ila
Inte
rnat
iona
l Jou
rnal
of
Pub
lic
Hea
lth
Vol
ume
5, I
ssue
1, M
ar 2
017
Tab
le 3
. Com
plia
nces
to W
HO
intr
amus
cula
r in
ject
ing
step
s am
ong
inje
ctio
ns a
dmin
iste
red
by C
HW
bas
ed o
n A
ge a
nd G
ende
r of
CH
W a
dmin
iste
red
inje
ctio
ns a
nd S
ettin
g of
giv
ing
inje
ctio
n (n
=17
04)
Inje
ctin
g st
eps
Pro
cedu
res
that
com
plie
d (n
= 1
704)
A
ge
Gen
der
Pra
ctic
e se
ttin
g
Ove
rall
18-2
4yea
rs
25-
45ye
ars
Mal
e
Fem
ale
CH
W
hom
e H
ealt
h C
ente
r P
atie
nt
hom
e O
ther
T
otal
N=
? , (
%
?)
N=
? , (
% ?
) N
=?
, (%
?)
N
=?
, (%
?)
N
=?
, (%
?)
N
=?
, (%
?)
N
=?
, (%
?)
N=
? , (
% ?
) N
=?
, (%
?)
C
heck
s th
e vi
al
355(
97.8
0%
) 1,
143(
91.5
1%
) 76
8(94
.58
%)
730(
91.2
5%
) 24
5(96
.08
%)
118(
90.0
0%
) 94
1(92
.62
%)
20
4(92
.31%
) 1,
612(
92.9
3%)
Rol
ls b
ottl
e or
sh
akes
(17
04)
356(
98.0
7%
) 1,
162(
93.0
3%
) 76
6(94
.33
%)
752(
94.0
0%
) 25
2(98
.82
%)
115(
95.8
3%
) 94
9(93
.41
%)
202(
91.4
0%)
1,61
2(94
.17%
) 50
3Cor
rect
ly
fill
s sy
ring
e 35
9(98
.90
%)
1,18
6(94
.96
%)
785(
96.6
7%
) 76
0(95
.00
%)
253(
99.2
2%
) 11
6(96
.67
%)
95.3
7(95
.37
%)
207(
93.6
7%)
1,61
2(95
.84%
) E
xpel
s ai
r 35
9(98
.90
%)
1,11
8(89
.51
%)
789(
97.1
7%
) 68
8(86
.00
%)
240(
94.1
2%
) 11
6(96
.67
%)
920(
90.5
5%
) 20
1(90
.95%
) 1,
612(
91.6
3%)
Inse
rts
need
le
into
mus
cle.
35
7(98
.35
%)
1,19
0(95
.28
%)
789(
97.1
7%
) 75
8(94
.75
%)
252(
98.8
2%
) 11
7(97
.50
%)
970(
95.4
7%
) 20
8(94
.12%
) 1,
612(
95.9
7%)
Asp
irat
es
359(
98.9
0%
) 1,
192(
95.4
4%
) 79
3(97
.66
%)
758(
94.7
5%
) 25
2(98
.82
%)
118(
98.3
3%
) 97
0(95
.47
%)
21
1(95
.48%
) 1,
612(
96.2
2%)
Inje
cts
the
cont
ents
36
0(99
.17
%)
1,19
4(95
.60
%)
792(
97.5
4%
) 76
2(95
.25
%)
251(
98.4
3%
) 51
1(98
.33
%)
974(
95.8
7%
)
211(
95.4
8%)
1,61
2(96
.40%
)
10

Texila International Journal of Public Health Volume 5, Issue 1, Mar 2017
Table 4. The Quantification of Infection prevention compliance performances
Performance level
Infection Prevention 18- 24years
25- 45years
Male Female CHW home
Health Center
Patient home
Other
% (CI) %(CI) % (CI)
%(CI) % (CI)
%(CI) % (CI) %(CI)
Very Well (100%)
79.3 (74.9 – 83.2)
77.2 (74.8–79.4)
74.9 (71.8 -78.8)
80.5 (77.6-83.1)
90.7 (86.6 – 93.7)
80.0 (72.2 – 86.0)
77.7 (75.1 – 80.1)
59.4 (52.8 – 65.6)
Well (75-99)%
20.1 (16.3 – 24.6)
17.2 (15.2 – 19.4)
21.1 (18.5 – 24.1)
14.5 (12.2-17.1)
8.1 (5.4 – 12.1)
13.8 (8.9 – 20.9)
17.9 (15.3 – 19.9)
34.4 (28.4 – 40.9)
Satisfactory (50-74)%
0.6 (0.1 – 2.1)
1.6 (1.1 – 2.6)
2.1 (1.3-3.3)
0.8 (0.3 – 1.7)
0.7 (1.8 – 2.9)
6.2 (3.1 – 11.9)
1.1(0.6 – 2.0)
1.8 (0.6 – 4.7)
Poor (0-50)%
3.9 (2.9 – 5.1)
1.8 (1.1 – 3.0)
4.2 (3.1 – 5.9)
0.3(0 – 2.6)
3.7 (2.7 – 5.0)
4.5 (2.4 – 8.1)
Table 5. Quantification of Intramuscular Injection technical compliance performance
Performance level
Intramuscular Injection technical performance of steps 18- 24years
25- 45years
Male Female CHW home
Health Center
Patient home
Other
% (CI) %(CI) % (CI)
%(CI) % (CI) %(CI) % (CI) %(CI)
Very Well (100%)
91.7(88.4-94.2)
82.4(80.2-84.4)
88.1(85.6 – 90.1)
80.9(78.0 – 83.5)
89.6(85.4-92.8)
83.1(75.6-88.6)
84.2(81.9 - 86.3)
81.7(76.1-86.2)
Well (75-99)%
6.6(4.5-9.7)
10.2(8.6-12.0)
7.6 (6.0 – 9.7))
11.1 (9.1 – 13.5)
8.9(6.0 – 12.9)
12.3(7.7-19.2)
8.9(7.4-10.8)
9.8(6.5-14.5)
Satisfactory (50-74)%
1.7(0.1-3.6)
3.4(2.5-4.6)
2.5 (1.6 – 3.8)
3.6 (2.5 – 5.2)
0.7(0.2-2.9)
3.1(1.2-7.9)
3.2(2.2-4.6)
4.5(2.4-8.1)
Poor (0-50)%
4.0(3.0-5.2)
1.8 (1.1 – 3.0)
4.4 (3.2 – 6.0)
0.7(0.2-2.9)
1.5(3.8-6.0)
3.6(2.6-4.9)
4.0(2.1-7.6)
11

Texila International Journal of Public Health Volume 5, Issue 1, Mar 2017
New Ways of Working: How Well are Public Hospital Staff in Nigeria Willing to be Knocked off Their Comfort Zones?
Article by Maclawrence Kolapo Famuyiwa Apapa General Hospital, Apapa, Lagos, Nigeria
E-mail: [email protected]
Abstract
Purpose: The study examines how welcoming the staff of public hospitals in Nigeria will find the introduction and implementation of new ways of working to satisfy the yearnings of hospital patients for flexibility in receiving health care services in these public hospitals in Nigeria.
Methodology: The study was done in a General Hospital in Nigeria. Staff preference for a way of working was assessed by self-administered and pretested questionnaire. Descriptive statistics to elucidate on the demography of the respondents were done; mean score and standard deviation values were used to examine the variables. Spearman’s rho correlation was used to identify the association in the responses.
Findings: The mean score of the traditional ways of working (TWW) and the new ways of working (NWW) were 2.66 ± 1.27 and 3.88± 1.73 respectively and with a negative relationship (r= −0.926, p < 0.001).
Research Limitations: More General Hospitals should be involved in new studies for more generalizability.
Practical implications: The benefits of NWW have to be more preached to health workers, since probably because of the fear of the unknown they still prefer their traditional way of working.
Social implications: ‘New Ways of Working’ will allow patients to access care anywhere, while staff will have the opportunity of combining work and home life better.
Value of the Paper: The introduction and successful implementation of ‘New Ways of Working’ will be able to meet the satisfaction of both staff and their patients in terms of flexibility to the work and clinic appointments of both respectively.
Keywords: New Ways of Working, Traditional Ways of Working, Public Hospitals, Staff, Patients, Satisfaction.
Introduction
It is now apparent that patients have over the years been clamoring for a change in the way they are given out-patient clinics appointments in public hospitals, where hitherto, no consideration has been given to the peculiarity of the type of work they do or the traffic quagmire the metropolitan lifestyles imposes on their easy movement. These patients, like all other clients of any organization are increasingly expecting to be able to determine when, where and how they wish to receive health care in public hospitals like they wish to conduct business with other organizations (Kotler, Kartajaya & Setiawan, 2010), Keuning, 2007).
In meeting this obvious challenge many governments in Nigeria, especially the Lagos State Government, has toyed with the idea of enforcing afternoon clinics in which patients not able to attend the conventional morning clinics can suitably attend, but this was resented by health workers giving the excuse of dearth of personnel and the inconveniences this arrangement will bring, not only to their modus vivendi, but also to the state of their own wellness, so the idea was stifled into obscurity.
However, it is expedient that a way has to be fashioned out in which these patients can achieve their agitation for flexibility in their clinic appointments, and the patient can also achieve their desired work flexibility, so a way has to be fashioned out in which these have to
12

Texila International Journal of Public Health Volume 5, Issue 1, Mar 2017
be balanced. The idea of developing ‘New Ways of Working’ (NWW), as has been effectively implemented in other sectors as well as in some other countries has to be introduced. The UK Department of Health (2010) observed that NWW will lead to increased staff responsibility for the improvement of patients’ lots in terms of the services they receive, and this brings to the fore the necessity to build and sustain a capable, flexible workforce to respond effectively and efficiently to the patients and staff needs.
The new ways of working
‘The New Ways of Working’ (NWW), has various definitions (Baane, Houtkamp, & Knotter, 2010; Volberda, Jansen, Tempelaar, & Heij, 2011). For example, Bijl (2009) defined NWW as a vision whereby recent developments in information technology act as a catalyst for a better design and management of knowledge work. This definition has been established to encompass all other definitions as it includes the four most important focus areas (people, organizations, work environment and technology). Bijl, (2007, 2009) and Blok, Groenesteijn, Schelvis, & Vink, (2012), all identified four cornerstones of NWW to be:
1. The individual: this includes elements such as motivation and competence (development)
2. The organization: this includes organizational structure, organizational culture and leadership style.
3. The work environment: this includes office space and design. 4. The technology: this includes ICT equipment and support.
The individual and competency (Development)
Many different skills have been identified to be important to realize NWW, and according to Stam (2011), the most important of these skills are: managing staff, organizing one's own work, commitment, networking, independence, decision-making skills, goal-orientation, communication, flexible behavior and collaboration. And it is when these skills are well developed that NWW can be ensured (Pierick, 2009).
The organization
Bijl, (2009) and De Leede, and Kraijenbrink, (2014), stated that there are three elements that are closely knitted together within any organization: vision/ambition, organizational structure and organizational culture. Vision and ambition gives the direction the organization intends to tow. It is thus mandatory for the vision and the ambition of the organization to accommodate NWW so as to ensure staff motivation and successful implementation of NWW. This may mean the re-organization of the hospital structures, tending towards a network structure which allows collaborations between different levels of hospital workers with copious use of ICT for self-management, self-organization, enterprise and exchange of information (Bijl, 2009, Kuipers, Amelsvoort, & Krame, 2010).
Organizational culture is about the correlation between how individuals within the organization want to interact (Bijl, 2009) and how they actually communicate and collaborate with each other (Egmond van, 2010), and leadership plays an important role in this (Egmond van, 2010, Cameron, & Quinn, (2008) and Keuning, (2007). According to Bijl, (2007, 2009) NWW ensures the need of person-centered leadership, staff support, collaboration, and the realization of connections with staff.
The work environment
A hybrid organization may be formed with the partial implementation of NWW in which components of a traditional organization are combined with those following NWW (Stam, 2011). NWW however, aims at working methods free of the constraints of time and place, this involves flexible work spaces within the organization customized specifically to various sorts of activities (Bijl, 2007, 2009) and Egmond van, (2010). NWW makes the office to
13

Texila International Journal of Public Health Volume 5, Issue 1, Mar 2017
become a place where staff gladly physically meet each other there to work together (Bijl, 2009).
The technology
Introduction of ICT to NWW will help staff to be more productive, more creative and more flexible since this will help the implementation of NWW to be more smooth (Wensing, 2009), will enable collaboration and communication, (Haterd, 2010), and contribute to social cohesion (De Leede, & Kraijenbrink, 2014).
Bijl (2007) also added that a relationship exists between these four cornerstones of NWW described above, and change or renewal is required in all these four cornerstones of NWW in order to achieve the NWW objective. The proper implementation of NWW involves the emphasis on knowledge work, with an insignificant attention paid to the physical presence of staff at their workplace and the willingness and ability of people in the position of leadership willing to apply NWW so as to encourage motivation and competence. De Leede and Kraijenbrink (2014) outline four important conditions for working according to NWW to achieve positive results, and these are trust between colleagues, trust between employees-supervisors, social cohesion and result-oriented leadership, and they further pinpointed trust and social cohesion as mediators when they demonstrated the result of NWW on an organization's performance. Hence it is helpful for any organization to be able to showcase all benefits and shortcomings that can be attributable to NWW.
Heuver (2015), found out that in the service industry he studied, NWW has a positive impacts on productivity and organizational commitments, but that these impacts vary depending on the component of NWW being studied, he conceded that it is teleworking and the use of information technology that have the most positive impacts. He also established that there was a non-existing correlation between flexibility in work place and in working hours. He further noticed that all these NWW variables except teleworking, were found to improve organizational commitment.
The emphasis NWW places on the result demands a different organization of the work place, the organizational structure and the style of leadership. Additionally, the current technology offers the opportunity to work without the restriction of time or location (Bijl, 2009). The New Ways of Working explores the separation of the constraints of time and place from staff flexibility and the usage of innovative technological developments, resulting in the rendering of a satisfying service to the patient. It is also believed that NWW will offer staff the opportunity to combine work and home life better, enabling them to work with more flexibility, as well as further their personal development (Baane, Houtkamp, & Knotter, 2010). To effectively achieve NWW it then means that staff will now also be expecting different opportunities than they have ever had, which means a change in the leadership style is inevitable in order for NWW to be accommodated.
NWW is thus important to ensure that patients especially those attending out-patient clinics and seeking specialist consultations in General Hospitals can be in the confines of their offices and homes as well as other places and still be able to receive quality healthcare from their doctors and other hospital staff making use of latest technologies most notably social media such as Facebook, Twitter, Skype, Whatsapp, Oovoo, Join me etc, and this will also ensure that these health workers will also be able to flexibly attend to the health needs of their patients from anywhere without compulsorily needing to be physically present within the hospital premises except when they need to attend to emergency cases. NWW involves an employee successfully juxtaposing his work with the working environment, and the flexibility of the work ambience to suit various sorts of activities (Bijl, 2007; Bijl, 2009; Egmond van, 2010), which often resulting in offices of these employees being mere meeting points for staff and should be designed in such a way that staff gladly physically meet each other there to work together (Bijl, 2009). Stam (2011) stated that NWW can be fully or partially introduced in any organization, a partial implementation leads to a hybrid organization in which there is the combination of the components of a traditional organization with those following NWW.
14

Texila International Journal of Public Health Volume 5, Issue 1, Mar 2017
It is however saddening that despite the obvious advantages that the new ways of working will introduce into patients management and staff satisfaction, it is still a rarity in any public hospitals in Nigeria, and the feasibility of its introduction is further hampered by political and bureaucratic bottle necks and the fear of the unknown that it may have on the hospital staff, since it will be like dislodging them from their comfort zones and expectedly oppositions are to be expected if this new ways of working is to be introduced and implemented in these public hospitals.
These are all the concerns that this study tries to address, so as to add to current knowledge about the effect of NWW on flexibility of staff of public hospitals in Nigeria and how their utilization of new technological developments can aid their working independently of time and place with the view of offering greater service to the patients, to make these hospital patients to appear apparently in charge.
Methods
Description of the study site
The study site is a General Hospital in Lagos, Nigeria. It is a multi-specialties hospital consisting of five medical departments: Pediatrics; Obstetrics and Gynecology; Medicine, Surgery, and Community Health. It also has Dental, Physiotherapy, Pharmacy, Laboratory and Nursing departments as well as Health Information Management, Administration and Medical Social Worker departments. It is a 45 bedded hospitals with about 357 members of staff with 25 of these staff belonging to the management cadre, who constituted the Hospital Management Committee, Head of Departments and Head of Sub-units, while the rest can be categorized as non-management staff.
The sample size used in this study was calculated using Taro Yamane formula as follows:
n =. . 1+ N (e) 2
Where n = Sample Size N = Elements of population in this study is 357 e = Error of sampling, in this study is 10 percent or 0.10 proportion.
Therefore, substitution in the formula:
n =. 357 . 1 + 357 (0.10) 2
= 78.12
The diversity in the professionals available at the study site made it imperative to use a stratified sampling method for this study.
Data collection method
Questionnaire was used for data collection. I sought for expressions of interest from all surveyed respondents using an introductory letter explaining the aim of the study and the anonymity of the answers, I also gave polite reminders to the respondent three days and repeated again a day to the deadline for the collection of the questionnaire. I designed the study instrument after a rigorous literature review (Memish et al, 2014, WHO, 2013, Gautre, 2013, and Al-Tawfiq & Memish, 2014). The draft of the questionnaire was validated in 2 steps. Firstly, it was discussed with other senior academics versed in research work to give their expert opinion with respect to its simplicity, relativity and importance. Secondly, a pilot study was conducted by the selection of a small sample of health care professionals (n = 9) who gave their opinions on making the questionnaire simpler and shorter. Samples selected for the pilot study took cognizance of all professions working within the hospital studied. The result was used to modify the questionnaire, while ensuring its consistency with the published
15

Texila International Journal of Public Health Volume 5, Issue 1, Mar 2017
literature (Memish et al, 2014, WHO, 2013, Gautret, 2013, and Al-Tawfiq & Memish, 2014). I finalized the questionnaire. After a thorough discussion, and subsequently distributed to the participants for their response. The data of the pilot study was not used for the final analysis.
The questionnaire consists of two sections (I and II). The first section consists of questions on demographic information: Gender, Age, Education level, Specialty/Department, and job functions. The second section contains questions on the research question for this study which is the way of working preferred by the staff between their traditional ways of working and the new ways of working intended to be introduced. Responses were evaluated through a 7 point Likert scale of agreement, A score of 1 was given to strongly agree, 2 to agree, 3 to somewhat agree, 4 to neither agree nor disagree, 5 to somewhat disagree, 6 to disagree and 7 to strongly disagree. A mean score of ˂5 was considered as agreement to the statement of the research question while score of ≥5 was taken as disagreement to the statement of the research question.
The primary source of data collection for this study was through the use of validated questionnaire and data was collected in May, 2016.
Reliability and validity of data collection instrument
Reliability
The contents of the final questionnaire have a reliability coefficient calculated using SPSS v.20 and the value of Cronbach’s alpha (Cronbach, 1951) was 0.81. Cronbach’s Alpha values higher than 0.7 is considered reliable (Nunnally, 1978).
Validity
In order to increase the reliability of this study, a validated questionnaire was used. It has been stated that a validated questionnaire ensures that the research actually measures what it is supposed to measure, this is the extent to which the collection of data, the techniques used and the analysis ensured inter-dependent findings (Saunders, Lewis. Thornhill, Booijl & Verckens, 2011).
Data analysis method
The data generated from this study was analysed using SPSS version 20. The descriptive statistics was used for the general characteristics of the study participants. Bivariate relationships between 7-item Likert scales were analysed using Spearman’s correlation coefficient ‘r’ to measure the correlation, because the measurement scale is ranked (Bryman & Bell, 2011).
Ethical approval
Ethical approval was obtained from the management of the hospital before the commencement of the study.
Results
See table 1
Table 1 shows that 69.1% of the respondents were female while 30.9% were male. This indicates that both male and female sexes are well represented.
See table 2
Table 2 reveals that 80.4% of the respondents were between 26 and 50 years age range, out of which 60.3% are within the age group 41 and 50 years. Those below 25 years and those above 56 years of age were 1.2% respectively of the respondents. Overall, the data shows that all working age groups are represented.
16

Texila International Journal of Public Health Volume 5, Issue 1, Mar 2017
See table 3
Table 3 indicates that 65.5% of the respondents have more than a bachelor degree, with 20.8% of these group of respondents even having a post-graduate degree, 9.9% had OND/NCE, 21.0% had a School of Nursing certificate, and only 2.5% had a Secondary School certificate, this is a confirmation that the respondents are well educated to understand the questions and provide reliable answers.
See table 4
The core staff of the hospital, supposedly including the Nurses, Doctors, Dentists, Pharmacists, Physiotherapists and Laboratory workers, as seen in Table 4, constituted 76.6% of the respondents, an indication that all the core hospital staff needed for the purpose of this research are well represented.
See table 5
The non-managerial staff among the respondents as revealed in Table 5 constituted 74.1% of the respondents while 25.9% were managerial staff which include Head of Departments, Head of subunits and members of Hospital Management Committee, a confirmation of a good representation of all cadres of staff in the sample.
See table 6
Table 6 shows that on the average the respondents agreed most with the statement that states that hospital workers should be provided with a means of accessing relevant information that will make their work more efficient and effective outside their workplace, with a mean of 1.84. The standard deviation of 1.08 shows that the study instrument is a good measure of this variable. The mean of Table 6 is 3.88 which shows that the respondents marginally agreed that they will prefer the introduction and the implementation of new ways of working in their hospital, the standard deviation is 1.73, an indication that the instrument is a good measure of this variable.
See table 7
Table 7 shows that the respondents mostly agreed that making patients to attend clinics physically for their appointments will be convenient to both staff and patients, and this they believe is their most preferred component of their traditional ways of working with a mean of 2.41, and a standard deviation of 1.36, an indication of the study instrument being a good measure of the variable. The mean of Table 2 also shows that on the average that the respondents agreed that they have a high preference for their traditional ways of working.
Furthermore, the Spearman’s correlation test (r= −0.926, p < 0.001) showed a negative relationship between new ways of working and the traditional ways of working, and also the comparison of the means of Tables 6 and 7, which are 3.88 and 2.66 respectively, showed that the ways of working preferred by the staff of the General Hospital studied is the traditional ways of working over the new ways of working, though they showed a marginal preference for the new ways of working.
Discussion
The result of this study is however, expectedly, imbued with the reluctance of the respondents to adopt the changes a new way of working may bring and so they still prefer their current traditional ways of working over the introduction of new ways of working, this is in tune with the findings of Stoffers, Kurstjens, & Schrijver (2015), who observed that contrary to the theoretical views of Stam (2011), that NWW satisfies employees needs and wishes which can lead to better development of competences necessary for NWW, and that of Baane, Houtkamp & Knotter (2010), that opined that it can lead to greater staff motivation, Stoffers, Kurstjens, & Schrijver (2015), however, in their study contrarily concluded that NWW couldn’t, even where it is practicalized, offer staff more opportunity to demonstrate
17

Texila International Journal of Public Health Volume 5, Issue 1, Mar 2017
and develop competences such as responsibility, flexibility and entrepreneurship. This is not surprising because one of the disadvantages of the introduction of “New Ways of Working”, according to Stoffers, Kurstjens, & Schrijver (2015), is that NWW is most often not desirable by staff and usually meets with resistance when it is introduced, but according to Balfour and Clarke (2001) for change to be embraced and sustained, people must identify with and value these changes that new ways of working will bring, especially since there can be extension of staff roles and practice as well as introduction of new roles and which according to UK Department of Health (2007) can come through leadership and development in the context of service developments.
It is heartening that 65.5% of the respondents have at least a bachelor or higher national diploma degrees, with 13.6% of them even having a post graduate degree, so also is the existence of about half of the respondents (45.7%) being below 40 years of age, a situation which means the respondents will be easy to convince of the benefits of the new ways of working, because as Auer and Speckesser (1997) observed, a younger, well-educated and trained work force are commonly required for continuous learning and adaptation in a work environment.
The health service sector in Nigeria requires a more strict organizational process for patient satisfaction to be continually paramount, and like any expected reaction of people to any change, there will be initial dislike and resistance of hospital employees in terms of their independence and flexibility and the wishes of patients’ for more flexibility, as well as the ability of these patients to exercise their power of "being in charge", which if not fathomed into the whole essence of NWW, may truncate the fruition of the implementation of NWW in public hospitals in Nigeria, so the preference of the respondents in this study is not unexpected. However, 58% of the responses of the respondents that constituted those that will actually be involved in the workability of the new ways of working in public hospitals, physiotherapists, doctors, and dentists, in this study, agreed to the introduction of the new ways of working, this sounds gladdening, but not rubbing off the fact that 65% of their responses still shows preference for the traditional ways of working.
In as much as this study has strived to show that the introduction of new ways of working might not be a totally bad idea going by the responses of the respondents in this study, but it has exposed the fact that more efforts should still be done by more researchers to involve more of these health workers especially those that are actively involved in giving out-patient clinics appointments, and also the study should be extended to involve more public hospitals so as to be able to arrive at a welcoming result that will be generalizable.
Conclusion
The staff of public hospitals in Nigeria still prefer the traditional ways of working over the traditional ways of working, though it is not melancholic all the way since there is still some level of preference for the new ways of working, and this means that there is still chance of the workability of new ways of working in public hospitals in Nigeria, only if more awareness can be created on the advantages it will bring not only to hospital patients but also to hospital workers. The new ways of working is really imperative in terms of the flexibility it will bring to both the patients and health workers and in the process leads to lessening the tension that often exists between the health workers and the public hospitals on one hand, and that that exist between them and the government that own these public hospitals
Tables
Table 1. Gender of the respondents
Gender Number Percentage Male 25 30.9 Female 56 69.1 Total 81 100.0
18

Texila International Journal of Public Health Volume 5, Issue 1, Mar 2017
Table 2. Age range of the respondents
Age Number Percentage <25 1 1.2 26-30 11 13.6 31-35 9 11.1 36-40 16 19.8 41-45 19 23.5 46-50 19 23.5 51-55 5 6.2 >56 1 1.2 Total 81 100.0
Table 3. Education level of the respondents
Education Number Percentage Secondary School 2 2.5 OND/NCE 8 9.9 School of Nursing 17 21.0 Bachelor/HND 42 51.9 Post Graduate 11 13.6 Others 1 1.2 Total 81 100.0
Table 4. Specialty/Department of the respondents
Specialty/Department Number Percentage Nursing 29 35.8 Medical 11 13.6 Dental 3 3.7 Pharmacy 11 13.6 Physiotherapy 2 2.5 Health Information Management
5 6.2
Laboratory 6 7.4
Account 6 7.4 Administration 5 6.2 Medical Social Worker 3 3.7 Total 81 100.0
Table 5. Job function of the respondents
Job function Number Percentage Managerial 21 25.9 Non-managerial 60 74.1 Total 81 100.0
Table 6. Means and standard deviations of opinions on ‘New Ways of Working’ as the preferred way of working by hospital staff
STATEMENT SA A SMA N SMD D SD Mean St D+
1 2 3 4 5 6 7 Working hours’ should rather be
7 24 13 4 4 15 14 3.93 2.12
(8.6) (29.6) (16.1) (4.9) (4.9) (18.5) (17.3)
19

Texila International Journal of Public Health Volume 5, Issue 1, Mar 2017
chosen by each worker to achieve the best balance between work and private lives. Hospital staff should be given the opportunity to work independently of the physical walls of the hospital.
5 28 13 9 5 13 8 3.64 1.89
(6.2) (34.6) (16.1) (11.1) (6.2) (16.1) (9.9)
Hospital workers should be given the freedom to determine the time of starting and closing each day work
3 6 10 6 7 27 22 5.19 1.80
(3.7) (7.4) (13.6) (7.4) (8.6) (33.3) (27.2)
Social media tools and virtual interactive media should rather be used to attend to patients health needs.
3 12 20 9 7 20 10 4.30 1.82 (3.7) (14.8) (24.7) (11.1) (8.6) (24.7) (12.4)
Hospital workers should be allowed to choose when to be physically present at work and when to use social media to attend to patients’ needs.
1 6 14 5 11 26 18 5.11 1.71 (1.2) (7.4) (17.3) (6.2) (13.6) (32.1) (22.2)
The hospital should be provided with facilities to attend to their private patients within the hospital.
10 7 5 8 5 28 18 4.81 2.08 (11.1) (8.7) (6.2) (9.9) (6.2) (34.6) (22.2)
Relevant knowledge and information exchanged on virtual interactive media should be made use of by hospital staff in doing their work
23 37 9 7 0 2 3 2.28 1.41 (28.4) (45.7) (11.1) (8.7) (0) (2.5) (3.7)
Relevant information on patients’ management should be easily accessible to workers when they attend to patients outside their workplace.
36 33 6 3 2 0 1 (44.4) (40.7) (7.4) (3.7) (2.5) (0) (1.2) 1.84 1.08
3.88 1.73 + Standard deviation
SA= Strongly Agree, A= Agree, SMA= Somewhat Agree, N= Neutral, SMD= Somewhat Disagree, D= Disagree, SD= Strongly Disagree
20

Texila International Journal of Public Health Volume 5, Issue 1, Mar 2017
Table 7. Means and Standard deviations of opinions on Traditional Ways of Working as the preferred ways of working by staff
Statement SA A SMA N SMD D SD Mean St D+
1 2 3 4 5 6 7
The present way of working in the hospital is producing the desired results that are satisfying to both staff and patients.
22 24 18 5 3 7 2 2.65 1.63 (27.2) (29.6) (22.2) (6.2) (3.7) (8.6) (2.5)
The present way of working in the hospital is allowing knowledge and information to be freely shared amongst staff
21 21 18 7 4 9 1 2.79 1.66 (25.9) (25.9) (22.2) (8.6) (4.9) (11.1) (1.2)
The present 8am to 4pm working hour routine in the hospital is very appropriate and satisfies both patients and staff.
12 30 17 9 7 6 0 2.84 1.44 (14.8) (37.0) (21.0) (11.1) (8.6) (7.4) (0)
Patients coming to the clinic physically for their appointments is convenient for both staff and patients.
19 37 12 4 4 5 0 2.41 1.36 (23.5) (45.7) (14.8) (4.9) (4.9) (6.2) (0)
The hospital requirement for workers to be physically present at work between 8am and 4pm is achieving the best result for both staff and patients.
15 33 17 6 5 4 1 2.62 1.41 (18.5) (40.7) (21.0) (7.4) (6.2) (4.9) (1.2)
2.66 1.27 + Standard deviation
SA= Strongly Agree, A= Agree, SMA= Somewhat Agree, N= Neutral, SMD= Somewhat Disagree, D= Disagree, SD= Strongly Disagree
References
[1]. Al-Tawfiq JA, Memish ZA: What are our pharmacotherapeutic options for MERS-CoV?. Expert Rev Clin Pharmacol. 2014, 7: 235-238. 10.1586/17512433.2014.890515. [2]. Auer, P. & Speckesser, S. (1997). Labour markets and organizational change: Future working structures for an ageing work force. Journal of Management & Governance 1: 177. doi:10.1023/A:1009915203329 [3]. Baane, R. H., Houtkamp, p., Knotter, M., (2010). Het nieuwe werken ontrafeld [New ways of working figured out]. Assen: Koninklijke Van Gorcum. [4]. Balfour M, & Clarke C (2001) Searching for sustainable change. Journal of Clinical Nursing; 10: 1, 44-50.
21

Texila International Journal of Public Health Volume 5, Issue 1, Mar 2017
[5]. Bijl, D., (2007). Het nieuwe werken: Op weg naar een productive kenniseconomie [New Ways of working: heading for a productive knowledge economy]. Den Haag: Sdu Publishers bv. [6]. Bijl, D., (2009). Aan de slag met het nieuwe werken [Let’s get to the new ways of working]. Zeewolde: Par CC. [7]. Blok, M. M., Groenesteijn, L., Schelvis, R., & Vink, P. (2012). New ways of working: does flexibility in time and location of work change work behavior and affect business outcomes? Work: A Journal of Prevention, Assessment and Rehabilitation, 41, 5075-5080. [8]. Bryman, A., & Bell, E. (2011). Business Research Methods (3rd edition). New York: Oxford University Press Inc. [9]. Cameron, K. S., & Quinn, R. E., (2008). Onderzoeken en veranderen van organizatiecultuur [Researching and changing organizational culture]. Den Haag: Sdu Publishers bv. [10]. Cronbach L.J., (1951) Coefficient alpha and the internal structure of tests. Psychometrika. 16:297-334. [11]. De Leede, J., & Kraijenbrink, J. (2014). The Mediating Role of Trust and Social Cohesion in the Effects of New Ways of Working: A Dutch Case Study. Human Resource Management, Social Innovation and Technology (Advanced Series in Management, Volume 14). England. Emerald Group Publishing Limited, 14, 3-20. [12]. Egmond van, H., (2010). Het nieuwe werken: Van visie naar praktijk [New ways of working: From vision to practice]. Alphen aan den Rijn: Kluwer. [13]. Gautret P, Benkouiten S, Salaheddine I, Belhouchat K, Drali T,& Parola P., (2013). Hajj pilgrims knowledge about Middle East respiratory syndrome coronavirus, August to September 2013. Euro Surveill. 2013, 18: 20604. [14]. Haterd van de, B., (2010). Werken nieuwe stijl [Working on a new style]. Amersfoort: A.W. Bruna Publishers B.V. [15]. Heuver, P. (2015). Building a bridge between new ways of working and leadership. A Master of Business Administration Thesis. Enschede: University of Twente. [16]. Keuning, D., (2007). Structuur doorzien [Structure seen]. Groningen: Wolters Noordhoff. [17]. Kotler, P., Kartajaya, H., & Setiawan, I., (2010). Marketing 3.0: Vind de klik met je klant [Marketing 3.0: From products to customers to the human spirit]. Den Haag: Sdu Publishers bv. [18]. Kuipers, H., Amelsvoort, P., & Kramer, E.H., (2010). Het nieuwe organisatie: Alternatieven voor de bureaucratie [New ways of organizing: Alternatives for bureaucracy]. Leuven: Acco. [19]. Memish ZA, Al-Tawfiq JA, Makhdoom HQ, Al-Rabeeah AA, Assiri A, Alhakeem RF, Alrabiah FA, Alhajjar S, Albarrak A, Flemban H, Balkhy H, Barry M, Alhassan S, Alsubaie S, & Zumla A., (2014). Screening for Middle East respiratory syndrome coronavirus infection in hospital patients and their healthcare worker and family contacts: a prospective descriptive study. Clin Microbiol Infect. 2014, 20: 469-474. 10.1111/1469-0691.12562. [20]. Pierik, C., (2009). Talent management: Hét middel om vitaal te blijven [Talent management: the tool to remain vital]. Het Grootste Vaktijdschrift over Bedrijfsgezondheid [The largest magazine about organizational health], nr. 5, 8-11. [21]. Stam, P., (2011). Het nieuwe werken meegewogen [New ways of working weighed in]. Utrecht: Utrecht University. [22]. Stoffers J., Kurstjens J., & Schrijver I.(2015). Leadership and New Ways of Working: A Case Study in a Financial Service OrganiZation. International Journal of Business and Economics Research. Vol. 4, No. 3, 2015, pp. 157-162. doi: 10.11648/j.ijber.20150403.18 [23]. UK Department of Health (2010). Responsibility and accountability: Moving on for new ways of working to a creative, capable workforce best practice guidance. London: UK Department of Health, 2010. Retrieved from: http://www.rcpsych.ac.uk/pdf/Responsibility%20and%20Accountability%20Moving%20on%20for%20New%20Ways%20of%20Working%20to%20a%20Creative,%20Capable%20Workforce.pdf [24]. Volberda, H., Jansen, J., Tempelaar, M., & Heij, K., (2011). Monitoren van sociale innovatie: Slimmer werken, dynamisch managen en flexible organiZeren: Monitoring social innovation: working smarter, dynamic management and organiZing flexible. Magazine for HRM, 1, 85-110.
22

Texila International Journal of Public Health Volume 5, Issue 1, Mar 2017
[25]. Wensing, L., (2009). Technologie is en blijft de sleutel tot het nieuwe werken [Technology is and remains the key to New [26]. Ways of Working]. Retrieved from: http://hetnieuwewerkenblog.nl/technologie-sleutel-hetnieuwe- werken/
23

Texila International Journal of Public Health Volume 5, Issue 1, Mar 2017
An Assessment of Depo-Provera Injection Practice in Primary Health Care Facilities of Kilombero District, Tanzania
Article by A. Kalolella1, E. Mlay2, D. Danda3 1,2,3Ifakara Health Institute, Dar es Salaam, Tanzania
E-mail: [email protected]
Abstract
The objective of this study was to assess Depo-Provera injection practice among health care workers (HCW) in primary health care facilities in kilombero district, Tanzania. The cross sectional descriptive design using structured observation checklist was used to collect data. About 261 HCWs participated in the study to assess best practise of intramuscular injection technics and infection prevention measures. The SPSS descriptive statistics and chi-square tests were used to analyze data. Results indicate that majority of HCWs had adequately practiced infection prevention and intramuscular technics but did not perform well hand washing steps before and after giving injection. Many of them didn’t check labels or shake vials before giving injection. Three quarter practiced critical steps of using sterile syringes, avoiding recapping the needle and use of safety box to discard contaminated sharps, while three quarter of HCW could not practice steps of hand wash before and after giving injection. Three quarter of participants correctly practiced filling drug into syringes, expel air from it, injected deep muscles, aspirated and pushed all drug into the muscles, Secondary graduates and nurse officer with diploma have significantly performed well in injection practice to ensure that before injecting the drug, aspirated through syringes and needle to ensure that the injecting needle is in the muscle and not in the vein. In conclusion, healthcare workers showed adequate practice of injection technics and infection prevention. However hand washing, drug label check and Depo-Provera preparation needs in house training and supervision.
Keywords: injection practice, contaminated waste, Blood borne infection, intramuscular injection technics, infection prevention.
Introduction
The injectable contraceptive such as Depo-Provera injection is among the most common family planning injection methods administered in health facilities worldwide for the purpose of prevention of pregnancy for the period of 3 months (WHO, 2011). The injectable contraceptive is most popular and preferred by Tanzanian women probably due to its simplicity in administering, privacy and confidentiality when using it (WHO, 2011). In this regards the use of injectable contraceptive-Depot-Provera is on increase especially in the rural areas where long term methods are not accessible. Usually the administration of injection is performed at heath facilities. Injection practice especially in low- and middle-income countries (LMICs) is blamed for multiple uses of unsafe injection procedures that lead to higher rate of transmission of blood-borne diseases (WHO, 2015). Individuals interacting in injection procedures and waste handling management: patients, health care worker (HCW), community members may acquire blood borne infection as a results of contaminated waste (WHO, 2015). Unsafe injection practice and incorrect technique are common in many places in Sub-saharan Africa including Tanzania (Nilsson et al, 2013; WHO, 2015). Unsafe injection procedure is a risk factor for infection at injection sites, new incidences of HIV infection and fuel transmission of deadly blood borne virus such as: hepatitis B virus (HBV), hepatitis C virus (HCV) that may cause long term disability (WHO, 2010; Manchikanti, 2011).
According to Nilsson et al. (2013) unsafe injection contributed to 1.9 million (17%) of new HIV infection in Sub-saharan Africa in 2010 alone. It is estimated that one third of two
24

Texila International Journal of Public Health Volume 5, Issue 1, Mar 2017
million individuals suffering from Hepatitis B acquired the disease through unsafe injection, while each year more than 3 million people acquires Hepatitis of which 40% was due to blood contaminated injection (Nilsson et al, 2013). Health care workers (HCW) in sub-Saharan Africa are more exposed to waste that are highly infectious including contaminated needles, sharps, and syringes that causing them annual estimated infection of 16,000 of HCV infections, 66,000 HBV and 1,000 HIV infections (Pruss-Ustun et al. 2005, WHO, 2010 ; Nilsson et al, 2013). Exposure to unsafe injection practice and incorrect technique may cause more harm which is costly to individuals and governments (Manchikanti, 2011; Nilsson et al, 2013).
A safe injection encompasses appropriate performance of introducing drug into the body without harming the patient, while not exposing any one to risk of infection or body damage due to injection and its waste products (Dolan et al, 2016; WHO, 2010; Nilsson et al, 2013). The injection safety practice is translated into a list of critical steps that must be followed in order to reduce risk to patient, service provider and surrounding community (Manchikanti, 2011; Nilsson et al, 2013). In these steps each injection should be administered with a new sterile syringe and needle, and provider should ensure right medication for patient (WHO, 2008; Hunter, 2007). The provider may avoid risk of exposure to infection by avoiding recapping the needle, and immediately discard used syringe and needle in a puncture-proof closed container (WHO, 2008; Hunter, 2007). The waste product after injection procedures should be safely managed to minimize risk hazard for the people, while all waste material should be disposed according to guidelines (WHO, 2008; Hunter, 2007; Hutin 2003). To ensure that any waste produced during performance of an injection procedure does not become a hazard for other people, used sharps waste and infectious non-sharps waste should be separated and safely managed and the final disposal of sharps containers and other medical waste should be conducted according to local and international health and environmental standards (WHO, 2008; Bartley, 2014).
The unsafe and risk practices include: reuse of injection equipment to administer to more than one client, use of multiple dose vials without changing used needles, reuse of syringes barrels or syringes barrels with needles, re use of injection equipment without sterilization and inadequate waste management (Hunter, 2013; Pepin et al, 2013). Incorrect practice exposes patients to harm and infectious diseases either directly, through contaminated needle and syringes or indirectly through medication vials that are contaminated with infectious blood or wrong medication and technical performance causing disability (WHO, 2015; Pepin et al, 2013).
Intramuscular injection is done in the denser part of the muscles: Mid-deltoid, Dorsogluteal, Rectus femoris, Vastus lateralis, and Ventrogluteal sites which are less painful due to fewer pain sensing nerve compared to other part of the body that is able to accommodate larger amount of solution. (Pepin et al, 2013; WHO, 2010). The Depo- Provera is conveniently administered in Mid-deltoid. The injection related infections and harm or complications are associated with wrong technical performance including: wrong site, incorrect depth of needle insertion, and wrong use of needle and syringes (Bartley, 2014, Hunter, 2008; WHO, 2010). Wrong intramuscular injection technical skills may result into intravascular injection, cellulitis, excessive pain, nerve damage, tissue fibrosis, and necrosis and abscess (Pepin et al, 2013; Bartley, 2014). Wrong or low dosage may result in medication error and efficacy problem (Bartley, 2014, Hunter, 2008). When giving injection HCW is required to choose an appropriate site where to insert the needle deep into muscles and then to withdraw the plunger slightly to ensure that the needle has not punctured or entered a blood vessel (Gyawali et al, 2013; Pepin et al, 2013). The plunger can then be pushed while injecting the medicinal solution slowly to give enough time for muscle tissue to expand to allow the required volume of solution to be accommodated (Pepin et al, 2013; Bartley, 2014). It is not advised to massage the area after injection, because the action may cause the drug content to be expelled from the injection site, introduce infection into injection wounds and may cause local tissue reaction and irritation (Hunter, 2008, WHO, 2015). Appropriate
25

Texila International Journal of Public Health Volume 5, Issue 1, Mar 2017
Infection prevention measures when combine with technical performance of injection procedures can reduce risks of harm and infection to patient, HCW and the community where injection exercise is conducted due to poor waste management (Nilsson et al., 2013; Hutin et al., 2003).
In this study we assessed Depo-Provera (injectable contraceptive) intramuscular injection practice among health care workers in public primary health care facilities of Kilombero district, Tanzania.
Procedures and methods
Study design
The cross section design was used in combination with structured observation checklists of important steps in giving Depo- Provera injection. The study was conducted in April- June, 2016 at 29 public primary health facilities that provide Depo-Provera in Kilombero district, southern part of Tanzania. The HCWs that practiced Depo-Provera were enrolled in this study. There were 261 HCWs that participated in giving injection of Depo-Provera; Primary and secondary school graduates, trained nurse, enrolled nurse and nurse officers. Data collection was done using direct observation questionnaires developed using WHO and Tanzanian Ministry of health guideline for infection prevention and injection technical performance procedures (Tanzania, 2004; Hutin, 2003; WHO, 2015). The questionnaire employed close-ended responses of “1” when HCW performed the required step or number “o” when the step was not performed.
Infection prevention and intramuscular injection technical steps were observed. The following steps were observed for infection prevention; washing hands using clean water and soap or alcohol hand rub, use of clean towel to dry hand or drying them on open air, using of sterile syringe and needle, avoiding recapping needle to prevent NSI, avoiding antiseptic to clean injection site, to wash hand after injection procedures, to avoid messaging injection site, informing client not massage injection site to avoid introducing infection and discarding all contaminated injection equipment and material into the safety-box (WHO, 2015, Hunter, 2007; Bartley. 2014). During the administration of Depo-Provera, HCW were observed if they have conducted all necessary technical steps for intramuscular injection; checking the vial for appropriateness and expiry dates, gently shaking of the vial to homogenize the solution, filling the syringe with all drug from the vial, pushing solution to expel air from the syringe, properly inserting the needle deep the muscle, (6) aspirates to ensure needle is not in a vein, inject the entire contents of the syringe. (WHO, 2015, Hunter, 2007).
Ethical permission
The ethical permission for the study was sought from the Medical Research Coordinating Committee of National Institute for Medical Research (NIMR), while Ifakara health Institute provided research clearance. An informed consent was sought from nurse to be observed and women receiving injection.
Data analysis
The data entry and analysis was conducted using the Statistical Package for Social Sciences (SPSS) version 19.0. Different variables were categorized and entered and as follows; gender, academic qualification, professional qualification, work experience, steps observed for infection prevention during injection practice, and steps observed for intramuscular injection technical performance. All steps were categorized as “performed “or “not performed” critical safety step of Depo-Provera injection practice (WHO, 2010). Frequency tables and cross tabulations were used to inform any associations between these variables and was also used to determine if academic and professional achievements and work experience among HCW were associated with practice of safe injections practice. The chi- squire test was used to analyze categorical data to test statistical significance between these
26

Texila International Journal of Public Health Volume 5, Issue 1, Mar 2017
differences or association between proportions of steps observed during direct observation process, while the association or the differences were considered significant if P-values <0.05.
Results
Two hundred and sixty one (n=261) healthcare workers were involved in the research. Among them 8 (3%) were males and 253 (97%) were female. With respect to academic qualification, 76 (29.2%) completed primary education while 179 (65.3%) attended ordinary level secondary education. These who received professional training were as follows; 67 (25.7%) were trained nurse, 160 (61.3%) enrolled nurse, 18 (6.9%) were diploma holder nurses. About one-third had experience of 1-4 years and two third had experience of 5 years and above (Table I).
Table I. Demographic characteristics (n= 261)
Variable Response Frequency Percent Gender in sex Male 8 3.07
Female 253 96.93 Academic Qualification
Primary education 76 29.23 Secondary education 179 65.38 Missing Data 6 2.30
Profession Qualification
Trained- No certificate 67 25.7
Enrolled nurse-certificate 160 61.30 Nurse officer- Diploma 18 6.90 Missing Data 16 6.13
Working experience
1-4 years 86 32.95 5 years and above 167 63.98 Missing Data 8 3.07
In infection prevention, about three quarter of HCW could not perform critical steps of hand wash and drying before and after giving injection (Table II). However more than three quarter were able to perform critical steps of using sterile syringes, avoiding recapping the needle and use of safety box to discard contaminated sharps (Table II). In injection giving technics more than three quarter of participants were able to correctly fill drug into syringes, expel air from it injected deep muscles, aspirated to ensure that needle is not in vein and pushed all drug into the muscles, while about three quarter were not able to check the vials for appropriateness and expiry date and could not shake the vial to mix up drug contents (Table II).
Table II. The practice of critical steps in intramuscular injection technics and Infection prevention (n= 261)
Variable Performed Not performed Missing Data Injection Infection Prevention Practice
n (%) n (%) n (%)
Before Injection hand cleaning
64(24.52) 195(74.71 ) 2(0.77%)
Hand drying 65(24.90) 195(74.33 ) 2(0.77%) Using sterile syringe and needle
246(95.25) 15(5.75)
No recapping of needle
220(84.29) 41(15.71)
Cleaning injection site 176(67.43) 85(32.57) Safety box Injection discard
194 (74.33) 66(25.29) 1(0.38%)
27

Texila International Journal of Public Health Volume 5, Issue 1, Mar 2017
After injection hand cleaning
69(26.44) 189(72.41 ) 3(1.15%)
No message of injection site
114(43.68) 147(56.32)
Injection Technical performance Practice (ITP)
Vial check 65(24.90) 189(72.41) 7(2.68%) Vial gently shaking 63( 24.14) 198(75.86) Correctly filling of syringe
248(95.02) 13(4.98)
Expels air 199(76.25) 62(23.75) Inserts needle deep the muscle
231 (88.51) 30(11.49)
Aspirate through needle
220(84.29) 41(15.71)
inject the entire contents
227(86.97) 34(13.03)
Nurses with secondary education reported significant more performance of critical safety steps of cleaning hands after providing injection and avoiding messaging the injection site to prevent introducing infection to injection wound (Table III). Performance of other infection prevention steps were not significantly different among primary and secondary graduates. In in injection technics, secondary graduates showed significant more performance in checking vials for appropriateness and expiry dates and aspiration of injected needle to make sure that the needle is not in vein to avoid injecting drugs into blood vessels that may cause drug complications (Table III).
Table III. Practice of critical safety steps in Infection prevention and intramuscular injection technics based on academic qualification
Variable Primary education (n=76)
Secondary education (n=179)
P- Value
Injection Infection Prevention Practice n (%) n (%) Before Injection hand cleaning 15(19.74) 46(25.70) NS Hand drying 16(26.26) 47(21.05) NS Using sterile syringe and needle 73(96.05) 168(93.85) NS No recapping of needle 63(82.89) 153(85.47) NS Cleaning injection site 50(68.16) 122(65.79) NS Safety box Injection discard 52(68.42 ) 138(77.09) NS After injection hand cleaning 17(22.37) 51(28.49) 0.020 No message of injection site 23(30.26) 90(50.28) 0.003 Injection Technical Performance Practice
Vial check 14(18.42) 51(28.49) <0.001 Vial gently shaking 53(69.74) 142(79.33) NS Correctly filling of syringe 72(94.74 ) 171(95.53) NS Expels air 59(77.63) 135(75.42) NS Inserts needle deep the muscle 63(82.89) 163(91.06) NS
Aspirate through needle 58(76.32) 157(87.71) 0.022 inject the entire contents 68(89.47) 156(87.15) NS
28

Texila International Journal of Public Health Volume 5, Issue 1, Mar 2017
In infection prevention, nurses with diploma showed significant more performance of hand cleaning and drying before and after giving injection and in avoiding messaging the injection site to prevent introduction of infection in injection site (Table IV). The trained nurses showed significant more performance in avoiding the recapping the needle to prevent NSI, while enrolled nurse showed significant more performance in using of safety box to discard sharps. In injection technics, nurse officers with diploma have significantly performed well in ensuring that before injecting the drug, they were able to aspirate through syringes and needle to ensure that the injecting needle is in the muscle and not in the vein or artery for safe medication of Depo-Provera (Table IV)
Table IV. Practice of critical safety steps of Infection prevention and intramuscular technics based on professional qualification
Variable Trained N= 67
Certificate N= 160
Diploma N=18
P- Value
Infection Prevention practice N (%) N (%) N (%) Before Injection hand cleaning 2(31.25) 47(29.38) 10(55.56) <0.001 Hand drying 0(0.000) 49(30.63) 9(50.00) <0.001 Using sterile syringe and needle 64(95.52) 151(94.38) 16(88.89) NS No recapping of needle 61(91.04) 134(83.75) 15(83.33) 0.044 Cleaning injection site 45(67.16) 102(63.75) 14(77.78) NS Safety box Injection discard 51(76.12) 124(77.50) 13(72.22) 0.037 After injection hand cleaning 5(7.46) 48(30.00) 11(61.11) <0.001 No message of injection site 16(23.88) 78(48.75) 9(50.00) 0.001 Injection Technical Performance Practice
Vial check 11(16.42) 45(28.19) 6(33.33) NS Vial gently shaking 51(76.12) 120(75.00) 14(77.78) NS Correctly filling of syringe 66(98.51) 150(93.75) 16(88.89) NS Expels air 54(80.60) 115(71.88) 16(88.89) NS Inserts needle deep the muscle 60(89.55) 142(88.75) 17(94.44) NS Aspirate through needle 64(95.52) 128(80.00) 16(85.89) 0.019 inject the entire contents 59(88.06) 139(86.88) 17(94.44) NS
The work experience has little to do with practices of infection prevention and injection technical performance. There were no significant differences in the performances between different study groups (Table V).
Table V. Practice of critical safety steps for infection prevention and technical performance according to working experience
Variable <5 years N= 86
>5 years and above N=167s
P- Value
Injection Infection Prevention Practice
Before Injection hand cleaning 20(23.26) 40(23.95) NS Hand drying 24(27.91) 37(22.16) NS Using sterile syringe and needle 81(94.19) 157(94.01) NS No recapping of needle 76(88.37) 137(82.04) NS Cleaning injection site 55(63.95) 114(68.26) NS Safety box Injection discard 66(76.74) 122(73.05) NS After injection hand cleaning 15(17.44) 50(29.94) NS No message of injection site 38(44.19) 70(41.92) NS Injection Technical Performance practice
29

Texila International Journal of Public Health Volume 5, Issue 1, Mar 2017
Vial check 22(25.58) 40(23.95) NS Vial gently shaking 70(81.40) 73.65(73.65) NS Correctly filling of syringe 83(96.51) 157(94.01) NS Expels air 70(81.40) 123(73.65) NS Inserts needle deep the muscle 79(91.86) 145(86.83) NS Aspirate through needle 68(79.07) 145(86.83) NS inject the entire contents 79(91.86) 140(83.83) NS
For hand cleaning for injection, only 24 % of participants were able to clean their hand before handling injection equipment and material and only 26% were able to wash they hand after administering injection which is risk practice for spreading of infectious diseases between client and health service provider as well as spreading infection to others through contaminated hands and surfaces touched (Table II). In injection technical performance, very few staffs (25%) were able to carefully check vial label for appropriateness and for expiry date which is very important for contraceptive function. Expired contraceptive cannot work as expected and cannot prevent pregnancy resulting into unintended pregnancy. Only 24% participants shacked the vial to homogenize the mixture for proper functions of the contraceptive medicine (Table II).
Both groups of nurses with primary and secondary academic qualifications could not perform well for hand cleaning before injection by 19% and 25% respectively, while only 17% participants with primary academic qualification washed their hand after injection procedures and only 30% of them followed the guideline of avoiding messaging the injection site risk factor of infection to injection wound (Table III).
Trained nurse and enrolled nurse had poor performance of infection prevention steps of cleaning hand before injection at 31% and 29% respectively, while washing hand after performance of injection procedure were 7% and 30% respectively, and few of them follow the guideline of avoiding messaging the injection site to avoid introducing infection by 23% and 48% respectively (Table IV).
The performance of hand washing was a big problem for both group of work experience (these with less than 5 years and those more than five years). Before injection procedure hand washing was 23% for participant with experience of less than five years and 23% for others (Table IV), while hand washing after injection administration was 17% and 29% respectively. In checking the vials for expiry date and labels only 25% participants with experience less than five years and 23% for other did follow the step (Table V).
Discussion
This study was conducted in public facilities providing injectable contraceptive in kilombero district eastern Tanzania, may be considered as an example of many primary health care facilities in the rural areas in low income country with a high burden of blood transmissible diseases such as HIV cases. The Sub Saharan Africa, experience the highest levels of HIV/AIDS, while millions of women of reproductive age expected to receive injectable contraceptive are currently living with HIV in sub-Saharan Africa (Calvert & Ronsmans, 2015). In Tanzania, almost 7% of pregnant women who are expecting to start any form of contraceptive including injectable after delivery were diagnosed with HIV in antenatal clinics in 2015 (PMTCT Tanzania, 2016). The injection practices; infection prevention and injection technical steps for safety are important to preventing new HIV and other blood borne infection to reduce mortality.
The healthcare workers in this research showed acceptable professional behaviors of following guidelines of important safety steps when injecting contraceptive drug. However observed lower performance of washing hands before and after giving injection. Performance of washing hand is expressed as a important safety step toward infection prevention as established in guideline (WHO, 2010, Tanzania, 2004). Washing hand prevent contamination
30

Texila International Journal of Public Health Volume 5, Issue 1, Mar 2017
of injection equipment and materials and reduce transmission of infection from one individual to another.
The study indicated that many health care worker were not able to care full check the vial label for appropriateness and for expiry date which is very important for contraceptive. Expired contraceptive cannot work as expected and cannot prevent pregnant resulting into unintended pregnancy which is very common in Tanzania. The label checking is important to avoid harming patients by injection them other drug that are not prescribed by their doctors. This problem may not be for injectable contraceptive only, but may also be practiced for other drugs, medications and contraceptives which is dangerous for health of clients.
The study shows that large majority of participants did not shake the vial to homogenize the mixture of the contraceptive medicine. The Depo-provera should be vigorously shaken just before use to ensure that the dose being administered represents a uniform suspension as indicated in the manufacturer guideline (Pharmacia and Upjohn Company, 2009). The Depo-provera contraceptive injection contains; medroxyprogesterone acetate, a derivative of progesterone, as its active ingredient of medroxyprogesterone acetate sterile aqueous suspension 150 mg/mL. Each mL contains: Medroxyprogesterone acetate 150 mg, Polyethylene glycol 3350-28.9 mg, Polysorbate 80- 2.41 mg, Sodium chloride 8.68 mg, Methylparaben 1.37 mg, Propylparaben 0.150 mg, and water for injection (Pharmacia and Upjohn Company, 2009). All components are important and can functions well only when homogenized. For example, sodium chloride has a function of maintenance of PH important factor in drug efficacy (Pharmacia and Upjohn Company, 2009). Unshaken vials may be contributing to poor efficacy, unintended pregnancy and drug side effects.
The observation highlighted the gap in the basic practices of infection prevention and intramuscular technical performance, particular in Depo-Provera preparations. The research finding showed that there is need of further training and education about washing hand to avoid transmitting infection including HIV and other blood borne infections. The Training is also needed on how to prepare Depo-Provera before it is administered in the muscles with emphasis of manufacturer guidelines, such as vigorously shaking the vial to homogenize the solution for effective functions.
Conclusion
In this research we can conclude that health workers in primary health care facilities of Tanzania, to a large extent observed to adequately practice Depo-provera intramuscular injection and infection preventive measures to avoid health complications and prevent acquiring serious infections. They have practiced according to the guideline while working with Depo-provera drug, injection equipment and materials. However more improvements can be made to ensure satisfactory hand washing to avoid and prevent transmission of infections. Health care workers should also improve their ways of preparation of Depo-Provera prior to its administration.
Acknowledgements
We would like to thank and express our gratitude to the District reproductive health coordinator in Kilombero district, in charges of health facilities and health workers of reproductive and child health section of the primary health care facilities and all participants for their support of time and willingness to accept this study. The study was funded by the United States International development.
31

Texila International Journal of Public Health Volume 5, Issue 1, Mar 2017
References
[1]. Bartley N, 2014. Guidelines on the Administration of Intramuscular and Sub-Cutaneous Injections, Retrieved January 16, 2016 from http://www.olchc.ie/Healthcare-Professionals/Nursing-Practice-Guidelines/Intramuscular-and-Sub-Cutaneous-Injections-Administration.pdf. [2]. Calvert C, Ronsmans C. (2015). Pregnancy and HIV disease progression: a systematic review and meta-analysis. Journal of Tropical Medicine and International Health, 20(2):122-45. Retrieved June 5, 2016, from PubMed. [3]. Gyawali S1, Rathore DS, Shankar PR, Kumar KV. (2013). Strategies and challenges for safe injection practice in developing countries. J Pharmacol Pharmacother. 2013 Jan; 4(1):8-12. doi: 10.4103/0976-500X.107634. [4]. Hutin Y, Anja Hauri, Linda Chiarello, Mary Catlin, Barbara Stilwell, Tesfamicael Ghebrehiwet, Julia Garner & the Members of the Injection Safety Best Practices Development Group (2003). Best infection control practices for intradermal, subcutaneous, and intramuscular needle injections, Bulletin of the World Health Organization 2003;81:491-500. Retrieved January 20, 2016 from http://www.who.int/bulletin/volumes/81/7/Hutin0703.pdf. [5]. Hunter J. Intramuscular injection techniques. Nurs Stand. 2008 Feb 20-26;22(24):35-40. [6]. Nilsson J, Andrea B. Pembe, Miriam Urasa, and Elisabeth Darj (2013). Safe injections and waste management among healthcare workers at a regional hospital in northern Tanzania. Tanzania Journal of Health Research Doi: http://dx.doi.org/10.4314/thrb.v15i1.8 Volume 15, Number 1, January 2013. [7]. Pharmacia and Upjohn Company DEPO-PROVERA®, 2009. Medroxyprogesterone acetate injection, suspension: Physician Information. Retrieved from https://dailymed.nlm.nih.gov/dailymed/archives/fdaDrugInfo.cfm?archiveid=1156. [8]. Laxmaiah Manchikanti, MD, Yogesh Malla, MD, Bradley W. Wargo, DO, and Bert Fellows, M, 2011. Infection Control Practices (Safe Injection and Medication Vial Utilization) for Interventional Techniques: Are They Based on Relative Risk Management or Evidence? Pain Physician 2011; 14:425-434 • ISSN 1533-315. [9]. Pepin J, Abou Chakra CN, Pe´pin E, Nault V, 2013. Evolution of the Global Use of Unsafe Medical Injections, 2000–2010. PLoS ONE 8(12): e80948.doi:10.1371/journal.pone.0080948. [10]. Prüss-Üstün A, Rapiti E, Hutin Y. Estimation of the global burden of disease attributable to contaminated sharps injuries among health-care workers. American Journal of Industrial Medicine, 2005, 48(6):482–490. Retrieved from http://www.who.int/quantifying_ehimpacts/global/7sharps.pdf. [11]. PMTCT Tanzania. National resource centre for prevention of mother to child HIV transmission (2016). Retrieved June 15, 2016 from http://pmtct.or.tz/pmtct-tanzania/pmtct-in-tanzania/. [12]. Susan A. Dolan, Kathleen Meehan Arias, Gwen Felizardo, Sue Barnes, Susan Kraska, Marcia Patrick, Amelia Bumsted (2016). APIC POSITION PAPER: SAFE INJECTION, INFUSION, AND MEDICATION VIAL PRACTICES IN HEALTH CARE. Retrieved 20 March, 2016 from http://www.apic.org/Resource_/TinyMceFileManager/Position_Statements/2016APICSIPPositionPaper.pdf. [13]. Tanzania (2004) National Infection Prevention and Control Guidelines for Health Care Services in [14]. Tanzania. Ministry of Health and Social welfare, The United Republic of Tanzania, Dar es Salaam. [15]. World Health Organization, 2010. WHO Best Practices for Injections and Related Procedures Toolkit Geneva: 2010 Mar. ISBN-13: 978-92-4-159925-2. Retrieved from http://www.ncbi.nlm.nih.gov/books/NBK138491/PubMed. [16]. World Health Organization. (2008). Revised injection safety assessment tool. Retrieved from http://www.who.int/injection_safety/Injection_safety_final-web.pdf [17]. World Health Organization, 2015. WHO Guideline on the Use of Safety-Engineered Syringes for Intramuscular, Intradermal and Subcutaneous Injections in Health-Care Settings. Geneva: Retrieved from http://www.ncbi.nlm.nih.gov/books/NBK305368/. [18]. World Health Organization, 2011. Family planning: a global handbook for providers. WHO regional publication.
32

Texila International Journal of Public Health Volume 5, Issue 1, Mar 2017
Health Impact of the Indiscriminate use of Herbicides in Nigeria
Article by Oche Joseph Otorkpa Master of Public Health, Texila American University, Guyana
E-mail: [email protected]
Abstract
The health impact of the indiscriminate use of herbicides in Nigeria is a public health concern. randomly selected food crops were found to be contaminated with residues of herbicides such as 2, 4-dichlorophenoxyacetic acid (2, 4-D) at 0.59mg/kg beyond maximum residue limits of 0.1mg/kg, while residues appear to persist in the soil at very high concentration of 0.180 and 0.023 mg/kg for atrazine and paraquat respectively, therefore increasing the risk of surface and ground water contamination with potentially lethal consequences on humans, livestock, and the environment. There is high prevalence of disregard for safety measures amongst horticultural farmers, (42%) of them do not use any form of protective wear during application of herbicides. Despite the establishment of links between the most commonly used herbicides in the country and certain forms of cancer, the sales of herbicide is still controlled mainly by semi-literate traders in open markets which appears to be contributing significantly to the level of pollution in the country. Based on the weight of evidence analyzed, the haphazard nature of the agrochemicals market and the indiscriminate use of herbicides in Nigeria cannot be completely extricated from the increasing rate of cancer in the country.
Keywords: Herbicides, Indiscriminate, Contamination, Health, Impact
Introduction
Herbicides are substances, mainly chemicals used to destroy, slow down, inhibit, or control the growth of plants or vegetation. Some are selective which implies that they act only on certain types of plant while the non-selective ones have impact on any vegetation they come in contact with. Most times the impact of herbicides tend to be underestimated largely due to the wrong perception of the word ‘’herb’’, and the wrong notion that herbicides hardly come in contact with our food. This is not so because the contamination of groundwater, soil, plants, and habitats has a huge impact not just on humans, but also on animals. A vast number of chemical agents found in the environment are known to be toxic to biological systems, especially in high concentrations. These substances found in the environment are usually as a result of industrial and agricultural activities. They sometimes occur naturally in the lithosphere. Human exposure to toxic materials carries a great risk of morbidity, and mortality[1].
The vast majority of the Nigerian population are into agriculture, and this vocation accounts for a significant portion of the nation’s gross domestic product (GDP). Over the years, as environmentalists continue to mount pressure on government, successive regimes have responded by initiating policies that deter bush burning, due to its attendant risk and negative impact on the environment. These measures have compelled many farmers and households to switch to herbicides and other chemicals as their principal means of clearing lands, and for the control of seasonal weeds and unwanted plants. With relatively little or no knowledge about the composition of the chemicals they purchase or the required ratio of water to herbicides, these users are transforming Nigerian farms and communities into enclaves saturated with toxic levels of dangerous chemicals especially organophosphates and organochlorides which has the potential of persisting in the environment for a long time, and impacting negatively on the wellbeing of the population.
33

Texila International Journal of Public Health Volume 5, Issue 1, Mar 2017
An ecological study of Kentucky counties linked water contamination, corn crop production, pesticide use, and triazine herbicides to breast cancer risk, suggesting an increased risk of breast cancer in relation to an increased level of triazine herbicide exposure. Herbicide toxicity may also be linked to birth defects. Defects were 60-90% more likely in counties where large amounts of wheat were grown, as well as in babies conceived in springtime when nearby wheat crop herbicide spraying was heaviest, (up to 5x more likely). Likewise, herbicides have been linked to female infertility. Reports indicate that mixing and applying herbicides 2 years before attempting conception was more common among infertile women, as was the use of fungicides. A trazine (the most commonly used herbicide), and other chemicals have also been shown to have an adverse effect on endocrine, immune, and nervous system function. This links herbicides to such things as Attention Deficit Disorder/Attention Deficit Hyperactivity Disorder (ADD/ADHD), among other disorders and illnesses.[2] A large percentage of those who suffer from the haphazard use of these herbicides are children. Children also breathe faster and have faster heart rates than adults, making them more vulnerable to aerosolized biological and chemical agents. Children metabolize drugs differently, requiring different dosages of drugs and different antidotes to many agents, as well as specially sized equipment to administer many treatments[3].
Objective
The objective of this research is to provide an overview of the health impact of the indiscriminate use of herbicides with a view to elicit a change in the current policy regarding the administration of herbicides and related products.
Methodology
Review of Literature and direct observation.
Basic findings
Level of food contamination by herbicides
Due to the wide spread use of herbicides in agricultural activities in Nigeria, several studies have evaluated the concentration of herbicide residue and other organic contaminant on crops. Based on a study conducted in Plateau State, North Central Nigeria, Gushit et al reported that root crops like potato, yam and cassava were observed to contain considerably high concentration of herbicide residues with their derivatives. The three samples studied consist of at least one or two of the residues of herbicides which include 2, 4-dichlorophenoxyacetic acid 0.02mg/kg, atrazine-0.10mg/kg and atrazine-0.08mg/kg respectively, being herbicide residues with relatively significant concentration. These substances were identified as residues of the herbicides which were widely used in these farms. The trend showed that benzene carboxylic acid and its derivatives detected in majority of the crops under review are most likely the derivatives of organic based chemicals, and other pesticides commonly used for farming activities within the area of study. Atrazine and 2,4-D derivatives present in the samples was high with an average concentration of 0.09 and 0.59 mg/kg respectively. The average concentration of 2, 4-D is below the maximum residue limit (MRL) of 0.10mg/kg for edible offal’s, and is above the MRL of 0.10mg/kg for set rice husked, and polished rice. While the average concentration of atrazine was well below the MRL of 0.10mg/kg stipulated for atrazine in maize, pineapple, sugar cane and sweet corn [7].In addition PAN assessment the study (2007) revealed that containers of used pesticides and insecticides were being used by the local people to store consumable products like water, palm oil and vegetable oil. [20]
34

Texila International Journal of Public Health Volume 5, Issue 1, Mar 2017
Table 1. Residue profile of selected crop samples
Source: Gushit, J. S. (2013) Analysis of Herbicide Residues and Organic Priority Pollutants in Selected Root and Leafy Vegetable Crops in Plateau State, Nigeria
Level of safety consciousness
Due to the toxic nature of herbicides, there is the constant need to always put safety first in the handling, storage, and application of herbicides. However, the level of safety consciousness amongst Nigerian farmers is low, due to low literacy level in the country. Majority of users do not even know the content of the chemicals they purchase, how dangerous the substances could be, and the safety measures to be adopted while applying such chemicals. In his work, Assessing the safety use of herbicides by horticultural farmers in River state south Nigeria, Iyagba Reported that 58 % of horticultural farmers used protective wears during the application of herbicides, representing just over half the population sampled. Furthermore, 51 % discard left over spray mixture into rivers and seas, and 58% kept talking during the application period. [8].
35

Texila International Journal of Public Health Volume 5, Issue 1, Mar 2017
Level of persistence in the soil
Persistence of herbicides refers to the length of time herbicide remains active in the soil after application which is usually expressed in terms of half-life (abbreviated t1∕2), defined as the time required for a quantity to reduce to half its initial value. A lot of factors such as microbial population, PH, soil texture, and structure influence the persistence of herbicide residue in the soil. In their work Persistence of herbicide residue in fadama and upland soil in Plateau State, Nigeria, Gushit et al reported that the average concentration in mg/kg of the residues in the soils were as follows; atrazine (0.123), 2,4-D (0.013), paraquat (0.020), oxadiazon (0.100) and pendimethalin (0.020) for fadama soils. While the concentration of the atrazine, 2, 4-D, paraquat, oxadiazon and pendimethalin in upland soils were 0.180, 0.023, 0.030, 0.0130 and 0.010 mg/kg respectively, suggesting that herbicide residues persist at considerably high concentration” 10].
Herbicides and water sources
One of the characteristics of herbicides is their ability to persist in the environment long after they have effected their weed killing function. Their persistence in the soil is a public health dilemma because of the potential of leaching into ground water and contaminating surface water either as a result of spills, erosion, run-off, or waste water discharges. Majority of Nigerians, especially rural dwellers still depend on stream, rivers, and lakes for their drinking water supply, about 51% of Nigeria’s 165 million population resides in rural or remote areas and only 47% of this rural populace have access to improved water sources. Of the 49% that live in urban and peri-urban areas, only 72% of have access to improved water source [21] The Nigerian standard for drinking water quality approved by the governing council of the Standards Organization of Nigeria in 2007 Stipulates the mandatory limits regarding constituents and contaminants of water that could be deleterious to human health.
36

Texila International Journal of Public Health Volume 5, Issue 1, Mar 2017
The document provided parameters for 2, 4, 6 - trichlorophenol at a maximum permitted level of 0.02mg/l but providing no limits for majority of the most commonly used herbicides in Nigeria [12].Water sources in Nigeria are highly exposed to contamination and pollution due to lack of stringent environmental laws. Iyagba in his study reported that 51 % of horticultural farmers discarded left over spray mixture into rivers and seas, [8] while Ezemonye et al recorded concentrations of organochlorides, organophosphate, and carbamates in Warri River, Niger Delta, Nigeria[9].
Human health and herbicides
There are many ways in which herbicides gain entry into the human body, access could either be via inhalation, through the oral route, or through the skin. The impact of human exposure to herbicides could be acute in which case there is a rapid onset and manifestation of symptoms of the poison, or chronic as a result of the long term exposure and accumulation of these substances in the body. The exposure of humans to herbicides have been linked to female infertility, miscarriages, birth defects, attention deficit disorder and increased risk of cancer .There is a wide spread exposure of Nigerians to herbicides especially during rainy season as a result of the use of herbicides for land preparation by famers, and elimination of weeds and unwanted vegetation by households. Many are oblivious of the potential consequences of these lethal substances as attested to by the report of the Strategic Assessment of the Status of POPs Pesticides Trading in South Western Nigeria, which indicated that there was an increasingly low knowledge level among members of the public including POP pesticide users, on the health risks associated with exposure to these substances going by the report of people storing consumable products like water, palm oil and vegetable oil in evacuated pesticide container[23].The World Health Organization’s International Agency for Research on Cancer (IARC) recently classified a widely used herbicide 2,4-dichlorophenoxyacetic acid otherwise known as 2,4,-D as a product that could “possibly” cause cancer in humans. The agency’s reclassification of this herbicides followed a review of latest scientific literature which also led to the reclassification of another widely used herbicide glyphosate which the agency labelled as “probably carcinogenic to humans. [20] This is consistent with the findings of Swanson et al who reported in their study that glyphosate disrupts the endocrine system and the balance of gut bacteria, it damages DNA and is a driver of mutations that lead to cancer. A conclusion arrived at after a correlation analyses returned a Pearson correlation coefficients that were highly significant (< 10-5) between glyphosate applications and a long list of diseases, illnesses, and conditions including cancer [22].
Regulations of herbicides
The National Agency for Food Drug Administration and Control, (NAFDAC) is the body saddled with the responsibility of regulating the registration, import, production and administration of herbicides and other chemicals in Nigeria, while the Standards Organization of Nigeria (SON) is the agency that ensures standards. The registration of new products involves the submission of data relating to product composition, manufacturer, product risk to humans, and the environment as well as field trials to evaluate the efficacy of claims made. The Nigerian agrochemicals market is indiscriminately saturated with both registered and unregistered products and majority of users obtain these products from the open market. This is consistent with the findings of an earlier survey which reported that (55%) of horticultural farmers obtained their herbicides from the open market [8].
Open markets in Nigeria are largely unregulated, as such unregistered and banned substances easily find their way into the market. This is consistent with the findings of the Strategic Assessment of the Status of Persistent Organic Pollutants carried out by Pesticides Action Network (PAN) Nigeria, which reported that despite the ban on certain categories of Persistent Organic Pollutants (POPs), these substances are still common in the markets,
37

Texila International Journal of Public Health Volume 5, Issue 1, Mar 2017
utilized in various locations in the society, and are considered potential threats to the environment and health of the population” [23].
A typical agrochemicals market in rural Nigeria.
Photo Credit: VenuMargam
Discussion
As People seek for faster means of clearing farm lands, improving crop yield, and clearing vegetation, larger quantities of herbicides will be used, and more herbicide residues will find their way into our food. The presence of 2,4-dichlorophenoxyacetic acid otherwise known as 2,4,-D derivatives at a concentration of 0.02mg/kg, [7]beyond the maximum residue limit (MRL) of 0.10mg/kg set for edible offal’s [7]is a public health concern because of the recent finding that labelled the herbicide as a possible cause of cancer. The high level of noncompliance with recommended safety regulations as regards the handling of herbicides is also worrisome, owing to the fact that almost half, (42%) [8] of herbicide users do not comply with the use of protective wears during herbicide application. This could affect the potential of the country to feed itself when the long term impact of the direct exposure of farmers to herbicides weighs in .Another health impact of the indiscriminate use herbicides could come from water sources. The constant dumping of mixed herbicides into water bodies in Nigeria,
38

Texila International Journal of Public Health Volume 5, Issue 1, Mar 2017
especially rivers and seas as practiced by 51% of horticultural farmers surveyed by Iyagba[8] is dangerous, especially when those water bodies also serve as a source of drinking water or fishing. The haphazard nature of the Nigerian agrochemicals market remains one of the major contributing factor to pollution and contamination of the environment. The post registration product neglect by NAFDAC and SON and their apparent non regulation of sales as required, rendered the Nigerian population vulnerable to a greater risk of exposure to these carcinogens. Available data, (2001-2005) from Ibadan showed increasing incidence and the Age-standardized rate (ASR) for all cancers as 81.6 per 100,000 for males, and 115.1 per 100,000 for females with 65.9% and 34.1% in females and males respectively.[25]In addition, Cancer incidence data from two population based cancer registries in Nigeria suggests substantial increase in incidence of breast cancer in recent times.[24] Herbicides and their residues which are prevalent in food and water sources in Nigeria cannot be completely extricated as a possible or associated cause of these conditions.
Conclusion
The impact of the indiscriminate use of herbicides in Nigeria has far reaching consequences beyond the location of where the herbicide was sprayed. Although some of these effects may not be immediate, most times the consequences are irreversible. Considering the level of exposure to herbicides in Nigeria due to lack of awareness, illiteracy, non-regulation, and the haphazard nature of the agrochemicals market, herbicides cannot the completely extricated from the increasing rate of cancer in the country, as such further research is recommended. Furthermore, there is an urgent need for government and other key players in policy making process to review the current nature of the agrochemicals market, especially herbicides in order to prevent an impending health crisis in the country.
References
[1]. Nnodimele, O.A. (2016). Module 6 Exposure to Environmental Hazardous Materials. In Nnodimele, O.A (Ed), Environmental Health (pp. 1-7). Guyana: Texila American University. [2]. Nnodimele, O.A. (2016). Module 7 Environmental Toxicology. In Nnodimele, O.A (Ed), Environmental Health (pp. 1-7). Guyana: Texila American University. [3]. Wikipedia.(2015).Wikipedia.org. Retrieved 11 August, 2016, from https://en.wikipedia.org/wiki/Herbicide [4]. North Central Weed Science Society. (2006). Ncwss.org. Retrieved 11 August, 2016, from http://ncwss.org/proceed/2006/abstracts/94.pdf [5]. Herbicide resistance action committee (HRAC) group - o Weed Science Society of America (WSSA) group - 4. (2004). Agron. Retrieved 23 August, 2016, from http://agron-www.agron.iastate.edu/Courses/Agron317/Synthetic_auxins.htm [6]. Sustainablebabysteps.com (N.P.). Sustainable baby steps. Retrieved 30 August, 2016, from http://www.sustainablebabysteps.com/herbicide-toxicity.html [7]. Gushit, J. S. (2013). Analysis of Herbicide Residues and Organic Priority Pollutants in Selected Root and Leafy Vegetable Crops in Plateau State, Nigeria. World Journal of Analytical Chemistry, 1(2), 23-28. [8]. Iyagba A.G. (2010). Assessing the Safety Use of Herbicides by Horticultural Farmers in Rivers State. Nigeria. European Scientific Journal 9(15), 1-12 [9]. Ezemonye, L Ikpesu, T. O., Isioma, I. (2010), Distribution of endosulfan in water, sediment and fish from Warri River, Nigeria. Africa journal of Ecology; 48 (1), 248-254 [10]. John. S. Gushit, Eno. O. Ekanem, Harami. M. Adamu and Ovi. J. Abayeh (2012). The Persistence of Herbicide Residues in Fadama and Upland Soils in Plateau State, Nigeria. Journal of Environment and Earth Science, 2(10), 148-149. [11]. Akinloye, O. A., Adamson, I., Ademuyiwa, O. & Arowolo, T. (20110). Occurrence of paraquat residues in some Nigerian crops, vegetables and fruits. Journal of Environmental Chemistry and Ecotoxicology, 3(7), 195-198.
39

Texila International Journal of Public Health Volume 5, Issue 1, Mar 2017
[12]. Standards Organization of Nigeria. (2007). Uniceforg. Retrieved 30 August, 2016, from http://www.unicef.org/nigeria/ng_publications_Nigerian_Standard_for_Drinking_Water_Quality.pdf [13]. Wilson C, Tisdell C (2001). Why farmers continue to use pesticides despite environmental, health and sustainability costs. Ecol. Econ.39, 449 – 462,doi: 10.1016/S0921-8009(01)00238-5 [14]. Vasilescu, M.N. Medvedovici, A.V.(2005). Herbicides. Encyclopedia of Analytical Science. 2nd ed. Elsevier, Oxford, 243-260, 2005. http://dx.doi.org/10.1016/ B0-12-369397-7/00256-9 [15]. Akpomie, T. M., Ekanem, E. O., & Akpomie, J. O. (2016) Estimating the Degradation Half-life of Herbicides in the Soil Using Computer-developed Models. World Journal of Analytical Chemistry, 4. (2), 17-18. [16]. Ayansina ADV, Oso, BA. (2006). Effect of two commonly used Herbicides on soil micro flora at two different concentrations. African Journal of Biotechnology, 5(2) 129 - 132. [17]. Rolando, C. A., Garrett, L. G., Baillie, B. R., & Watt, M. S. (2013). A survey of herbicide use and a review of environmental fate in New Zealand planted forests. New Zealand Journal of Forestry Science, 43:7. [18]. Galadima, A., Garba, Z. N., Leke, L., Almustapha, M. N. & Adam, I. K.(2011). Domestic Water Pollution among Local Communities in Nigeria ---- Causes and Consequences. European Journal of Scientific Research, 52(4), 92-603 [19]. Ibrahim MA, Bond GG, Burke TA, Cole P, Dost FN, & Enterline PE.(1991) Weight of evidence on the human carcinogenicity of 2,4-D. Environ Health Perspect. 96, 213–22. [20]. Reuters. (23 June 2015). The guardian. Retrieved 30 August, 2016, from https://www.theguardian.com/environment/2015/jun/23/herbicide-24-d-possibly-causes-cancer-world-health-organisation-study-finds [21]. Akali, D. M., O. T. Iorhemen, Otun J. A., and Alfa M. I. (2014). Provision of Sustainable Water Supply System in Nigeria: A Case Study of Wannune-Benue State. World Journal of Environmental Engineering 2, (1) 1-5. [22]. Swanson NL, Leu A, Abrahamson J, Wallet B (2014). Genetically engineered crops, glyphosate and the deterioration of health in the United States of America. Journal of Organic Systems 9. [23]. Pesticides action network (pan) nigeria. (2007). Pan-ukorg. Retrieved 1 September, 2016, from http://www.pan-uk.org/archive/Projects/Obsolete/MDTF%2008-09/Nigeria%20Trading%20Case%20study.pdf [24]. Jedy-Agba E, Curado MP, Ogunbiyi O, Oga E, Fabowale T, Igbinoba F, Osubor G, Otu T, & Kumai H, Koechlin A: Cancer incidence in Nigeria: A report from population-based cancer registries. Cancer Epidemiology,36 (5). [25]. Fatimah Abdulkareem (2009); Epidemiology and Incidence of Common Cancers in Nigeria; Cancer Reg & Epid Workshop April ‘09 [26]. Margam, V. (n.p.). entmpurdueedu. Retrieved 1 September, 2016, from https://www.entm.purdue.edu/NGICA/ejournal/pub01.html
40

Texila International Journal of Public Health Volume 5, Issue 1, Mar 2017
Ultrasonographic Study in Pregnancy and Sex Preference in Bangladesh
Article by Sultana Arju1, Afroza Begum2, Irin Hossain3, Shazly Bari4, M.M.Aktaruzzaman5
1,2,3,4 National Institute of Preventive and Social Medicine, Mohakhali, Dhaka 5VBDC, DGHS, Mohakhali, Dhaka 3E-mail: [email protected]
Abstract
A cross sectional descriptive study was conducted to find out the ultrasonographic evaluation in pregnancy and sex preference among rural pregnant mother. A semi structured questionnaire was used for data collection and face-to-face interviews were conducted to collect data regarding socio-demographic characteristics, ultrasonographic evaluation in pregnancy and sex preference related information. The result showed that the mean age of the respondents was 22.60 (±4.5) years. In this study according to ultrasound scan about 55% pregnant women were come for USG in third trimester and among the respondents about 66% were done USG for the purpose of sex detection. There was significant association between personal income and sex preference of the respondent. This study found that there was significant association between parity and sex preference of the respondents. This study revealed that about 55% of the respondents had preference about sex of the child before child birth, on the other hand about 76% respondent’s husband had preference about sex of the children. The present study detected son preference 41% whereas daughter preference only 14%, son preference was higher than the daughter preference among the respondents and also son preference was more high among the respondents husband than daughter.
Keywords: Sex Preference, Ultrasonogram, Respondent
Introduction
Obstetric sonography is invaluable in modern antenatal care. Ultrasound scan in obstetrics is widely accepted to be the best and most accurate medical technique to assess pregnancy. This is because it uses no form of ionization radiation [5]. It has ability to detect pregnancy of about five week gestational age [6]. Sex of the baby is genetically determines at conception. In 20th week scan it is fairly easy to tell the sex of the baby. Ultrasound is also used to identify sex starting at around 16 weeks of pregnancy and is noninvasive [8] making it less technically demanding and low risk. Generally mother prefers to do ultrasonogram at the time of second and third trimester of pregnancy. Bangladeshi women’s strong preference for son may contribute an additional 4-8% of overall fertility. In Bangladesh, more than 95% of parents preferred to have a son. Timely uptake of ultrasound and ANC are potentially life- saving. Patient’s expectations include discovering fetal position, fetal sex and pregnancy problem [2].
A standard ultrasound exam in the first trimester checks the following attributes: The number and location of the gestational sacs that contain the embryo, the size and age of the embryo, embryonic heart activity, the condition of the uterus, fallopian tubes and ovaries. A standard ultrasound exam in the second or third trimesters checks: Age and size of the fetus, the number of fetuses, location of the placenta, fetal heartbeat, amount of amniotic fluid, basic fetal anatomy including the brain, spine, kidneys, bladder and all four chambers of the heart. (Consensus Conference, The use of diagnostic ultrasound imaging during pregnancy)
Some providers recommend a routine ultrasound examination at 16-20 weeks of gestation for all pregnant women performed by a skilled provider to look for fetal birth defects. A recent Institute of Medicine report encourages wider use of ultrasound before 20 weeks of pregnancy to more accurately establish gestational age, as a step toward learning more about the causes of
41

Texila International Journal of Public Health Volume 5, Issue 1, Mar 2017
preterm birth. (“Ultrasonography in Pregnancy” Washington, DC: American College of Obstetricians and Gynecologists; 1993).
Ultrasounds are performed to identify specific conditions, such as: suspected ectopic pregnancy, possible miscarriage, presence of more than one baby, age of fetus, certain birth defect, screening for Down Syndrome, fetal growth, causes of second and third trimester bleeding, determining fetal position around date of delivery. In particular, the appropriate use of obstetric ultrasound has directly contributed to the improvement of maternal health and the lowering of child mortality. In several instances, its use in developing countries has resulted in lack of communication between the doctor and patient and abandonment of effective traditional diagnostic procedures. Most significantly, ultrasound technology is commonly used inappropriately to determine the sex of a baby prior to birth so that an abortion can be performed if the baby is not of the desired gender. In many parts of the world, especially in India and China, “daughters are regarded as a liability (Gentleman, “India’s Lost Daughters”). Behind this belief lie many socioeconomic reasons that depend on the region of the world and the economic status of the family. Additionally, the spread of ultrasound technology throughout the developing world has had the unexpected consequence of facilitating sex-specific abortion, since ultrasound allows the gender of a fetus to be determined as early as the eighteenth week of pregnancy.
Male child is more likely to be preferred than female child in developing countries. Variation in sex preference among countries and religions have been linked with a wide range or factor. Macro-level factor that are expected to have an impact on sex preference include population policy, modernization, culture settings, socio-economic and political transformation. Micro-level factor involve level of education of parents. Son preference, the oldest and deeply rooted of the three factors, may be motivated by economic, social and religious factors [9].
Sex preference can also lead to gender bias in the allocation of food and health care [7] and imbalance in the sex ratio of the population. It has adversely impact on country’s fertility rate. Unanticipated consequences of ultrasound imaging have also resulted in an increase in sex-specific abortions, indirectly decline in progress toward MDG.A related negative consequence arises from parental gender bias in the provision of basic care, such as breastfeeding, nutrition, immunizations, medical treatment and schooling. Therefore, this gender bias may affect the health and well-being of children. In societies in which couples have the resources and the means to achieve their reproductive goals (i.e. access to modern birth control methods and to sex-screening technology) gender preferences are likely to translate into behaviors such as the abortion of fetuses of the undesired sex, or the cessation of childbearing after the desired sex composition of children has been achieved.
By using appropriately, ultrasound imaging can be a powerful tool to advance fetal and maternal healthcare, thereby improving the overall quality of life for women and newborns in developing countries. By reducing son preference and increasing daughter preference can help in prosperity of a nation.
Background
The economic importance of male children in Ghana is also evident from the fact that while less pressure is put on the daughters to make contributions towards the support of their parents, sons are morally obligated to take care of their parents in old age. Sex preferences for children have been a great concern to many researches and policy makers because of its consequences. The desire to have a particular sex of a child can lead to sex selective abortions and hence skewed sex ratios at birth [11]. Advanced medical technologies such as ultrasound and amniocentesis have been used to determine the sex of an unborn child. Therefore, most parents abort a foetus which is not a preferred sex [9]. The persistence and adherence to this can lead to an imbalance in the sex ratio of the population [10]. In some areas, notably India, daughters are expected to move in with the family of their husband when they marry and therefore, they do not contribute to their birth family after reaching adulthood. In many parts of India, parents of a bride also have to pay large amounts of money for a dowry, further increasing the cost of having a daughter. In other countries such as China, parents not only have a deep cultural bias against
42

Texila International Journal of Public Health Volume 5, Issue 1, Mar 2017
daughters, but they also face legal restrictions in the number of children they are allowed to have. (Yi et al., “Causes and Implications”). The combination of cultural beliefs, laws allowing parents only one child, and disparities in the economic opportunities available to men and women, cause Chinese parents to feel a very strong preference for having a son.
Many previous studies have examined gender preferences for children, especially son preference in South Asia, East Asia, and the Middle East. Most of them have studied the extent of gender preference through observable behavior measures, such as the practice of sex-selective abortions, imbalances in sex ratios, sex differentials in infant/child mortality, and gender disparities in the health and well-being of children. A number of studies have also looked at gender preference in terms of parity progression, and the contraceptive use of women with certain sex compositions of surviving children. Using these different methods, scholars have found evidence for gender preferences for children around the globe. Chung and Das Gupta (2007) found that son preference is a significant factor that influences the practice of induced abortion among women in South Korea. Also based on the results of a longitudinal study of Matlab in Bangladesh [1] reported that the effect of son preference on abortion and fertility behavior became stronger with declining fertility, because couples strive to have a certain number of sons and daughters within a smaller family size. Son preference has also been observed in connection with the cessation of childbearing among women in countries such as Bangladesh.
Methods
Study design and sample
This study was conducted to find out ultrasonographic evaluation in pregnancy and sex preference in selected rural area according to the following methodologies:
This study was a cross sectional study on pregnant women in rural area. We conducted our study in Borohorispur union, a small rural area in the district of Natore, Bangladesh.
We conduct our interview using face-to-face interview technique in 5 different diagnostic centers and maintaining privacy as far as possible. Before the data collection, the detail of the study was explicitly explained to each eligible respondent and informed consents were taken from the respondents. A semi-structured questionnaire was developed initially in English for the collection of data from research participants. Collected data were checked, re-checked, coded and recoded for quality management. Data consistency were checked and verified. Appropriate statistical tests were used for data quality management. The respondents were selected through purposive sampling from the study population. Sample size was determined statistically through the formula of Daniel (Daniel, 1991; Kothair, 1985). There is no baseline study for prevalence of USG done pregnant women in their pregnancy. So, we can assume prevalence P= 50% = .50. The calculated number of sample size was 384 if simple random sampling technique would be used. But as in this study purposive sampling technique was used and the non responsive rate was 10%, we got 280 respondents who met our desired criteria.
Analysis
The focus of this analysis is on the pathways linking sex preference and socio-demographic status. Data processing and analysis was done using SPSS (Statistical Package for Social Sciences) version 22. The test statistics was used to analyze the data are descriptive statistics and inferential statistic according to the demand of the study with 95% confidence interval. Level of significance was set at 0.05. Qualitative data were analyzed on the basis of themes.
Result
Socio-demographic status of rural mothers
Socio-demographic statistics are presented in Table 1. Most mothers of the study population belongs from the age group 20-29 years, the average monthly family income was around 12000 taka with the SD of around ± 5483.22 taka within the range of 5000 to 40000 taka. Only 5%
43

Texila International Journal of Public Health Volume 5, Issue 1, Mar 2017
respondents have some sort of personal income. Majority of the family have 4 or less than 4 members. The percentage of joint families is higher, than that of the single families, around 57% and 43% respectively. Respondents without having any formal education corresponds about 25% of the population, whereas the primary education group consists about 38% who finished I - V class and rest of the respondents were studied higher than primary class. Among the husbands of respondent 16% did not have any formal education and around one fourth of them had completed their primary education. Two large groups of respondent’s husband were businessman about 28% and service holder about 30%. Rests of them were day laborer and labour. Among the respondents almost 95% were Muslims and rests of them were Hindu.
Table 1. Distribution of respondents by age, monthly family income and family size (n=280)
Characteristics Frequency Percentage (%)
Age of the respondents (years)
≤19 75 26.8
20-29 181 64.6
≥ 30 24 8.6
Monthly family income (Taka)
≤ 10000 148 52.9
10001-20000 119 42.5
≥20001 13 4.6
Mother’s personal income
Yes 14 5
No 266 95
Family size
≤ 4 139 49.6
5-6 45 16.1
≥ 7 96 34.3
Family Type
Single 121 43.2
Joint 159 56.8
Educational level of respondents
Can sign only 70 25.0
Primary ( I-V) 106 37.9
Secondary (VI-X) 64 22.9
Higher secondary and above 40 14.3
Educational level of husbands
Can sign only 46 16.4
Primary (I- V) 66 23.6
Secondary (VI- X) 85 30.4
Higher secondary and above 83 29.6
Occupational status of respondents
44

Texila International Journal of Public Health Volume 5, Issue 1, Mar 2017
housewife 266 95.0
service 10 3.6
teacher 3 1.1business
1 .4
Occupational status of husbands
day labour 50 17.9
labour 68 24.3
service 83 29.6
business 79 28.2
Religion
Muslim 266 95
Hindu 14 5
Reproductive characteristics of rural mothers
Reproductive measures showed in Table 2 indicate that almost 65% of the respondent got married before the legal age of marriage that is before 18 years. Rests of them got married above the age of 18 years. Average age of marriage was at 17 years with the SD ± 2.28. The study records percentage of adolescent pregnancy was 67, where the mean age of first conceive was 18.65 years with the SD of ± 2.69. Almost 40% of the respondents had no parity means first time pregnant mother and rest of them had 2 children or less than that, others have more than 2 children.
Table 2. Distribution of reproductive characteristics of respondent.
Characteristics Freq Per(%) Mean(SD)
Age at first marriage of the respondents (years)
Early marriage 181 64.6
17.09 ± 2.28 Legal Marriage
99 35.3
Age at first conception of the respondents (years)
Adolescent 188 67.1 18.65 ±2.69
Not adolescent 92 32.8
Parity
No Parity 111 39.6 1.60 ± 0.49
Have Parity 169 60.4
Sex preference related information
Distribution of preference of child sex of the respondent and respondent’s husband about 55% of the respondents had preference about sex of the child before child birth and rest of them had no preference of sex of the child. Almost 41% of the respondents had son preference whereas only 14% respondents had daughter preference of study population. Rest of them preferred any one means boy or girl child.
On the other hand about 76% of the respondent’s husband had expectation about sex of the child before child birth and rest of them had no expectation of child sex. Among them about 56%
45

Texila International Journal of Public Health Volume 5, Issue 1, Mar 2017
had son preference whereas 20% respondent’s husband had daughter preference and rests of them prefer any of child. (Figure – 1)
Fig: 1. Distribution of preference of child sex of the respondent and respondent’s husband
Ultrasonographic evaluation related information
Distribution of reason of Ultrasonogram in pregnancy: Among the respondents about 66 % were done USG for the purpose of sex detection and rest
of them came for other reason. (Fig- 2)
46

Texila International Journal of Public Health Volume 5, Issue 1, Mar 2017
Fig: 2. Distribution of reason of Ultrasonogram in pregnancy
Distribution of gestational age of respondent according to USG
According to Ultrasound scan about 55% pregnant women were in third trimester of pregnancy who were come for USG and 33% were in second trimester. Rests of them were in first trimester of pregnancy. (Fig- 3)
Fig: 3. Distribution of Gestational age of respondent according to USG
Educational Status of the respondents was found in significant association with preference of child sex of respondent (p< 0.05, ᵪ2 =14.32, df = 3). Among the primary education group more than half (65.1%) of the cases had preference of sex of child whereas only 32% higher secondary and above education completed group had preference of sex of child. (Table- 3)
Table 3. Association between educational status of the respondents and expectation of child sex.
Character (Respondent education)
Expectation of child sex
ᵪ2 p value Yes n(%) No n(%)
Can sign only 42 (60.0%) 28 (40.0%)
14.37 .002 Primary 69 (65.1%) 37 (34.9%)
Secondary 31(48.4%) 33 (51.6%)
47

Texila International Journal of Public Health Volume 5, Issue 1, Mar 2017
Higher secondary & above
13 (32.5%) 27 (67.5%)
Total 155 (55.4%) 125 (44.6%)
This table shows that there was significant association between personal income and expectation of child sex of the respondent (p <0.05, ᵡ2 = 4.27, df = 1). Preference of child sex of the respondent was more in rural women who have no personal income. (Table-4)
Table 4. Association between personal income of the respondents and preference of child sex
Characteristic Expectation of child sex
ᵪ2 P value Personal income Yes n (%) No n (%)
No personal income 151 (56.8%) 115 (43.2%) 115 (43.2%)
4.27 .039 Have personal income
4 (28.6%) 10 (71.4%)
Total 155 (55.4%) 125 (44.6%)
This table shows that there was significant association between parity of the respondent and preference of child sex of the respondent (p< 0.05, ᵡ2 = 4.94, df = 1). Among the respondent more than half (55%) of the multi gravida group had preference of child sex whereas only 40% primi-gravida group had preference of child sex.
Table 5. Association between parity of the respondents and preference of child sex
Characteristic Expectation of child sex
ᵪ2 p
value Parity Yes n (%) No n (%)
Primi gravida 46 (41.4%) 46 (41.4%)
65 (58.6%)
4.94 .026 Multi gravida
93 (55.0%) 93 (55.0%) 76 (45.0%)
Total 139 (49.6%) 141 (50.4%)
Multiple Regression to predict the impact of socio-demographic factors related to sex preference among pregnant women
Binary logistic regression model was constructed with all variables showed significant relationship by univariate analysis to see the effect of independent variable after removing the effect of other variables. The full model was significant. The true association was found significant with one predictor which was educational qualification of the respondent. In comparison to Illiterate group, primary, secondary and higher secondary group have around 0.73, 1 and 2 times less likely to have sex preference respectively. Among the respondents who had personal income are 3 times less likely to have sex preference in comparison to respondents who have no personal income.
48

Texila International Journal of Public Health Volume 5, Issue 1, Mar 2017
Variables Multiple regression to predict the impact of sex preference
Odds ratio 95% CI Lower Upper
Education of the respondent
Illiterate (Ref) Primary 0.735 0.390 1.384 Secondary 1.549 0.778 3.084 Higher secondary and above
2.359 0.987 5.642
Respondent’s personal income
No (Ref) 1 Yes 3.005 0.731 12.350
Parity of the respondent
No (Ref) 1 Yes 0.661 0.400 1.095
Discussion
This cross sectional study was done to find out the ultrasonographic evaluation in pregnancy and sex preference among pregnant women which was conducted in selected area of BoroHorispur union in Natore district. In this section the findings of the study are explained elaborately-
The study showed that among 280 pregnant women majority (64.6%) of them were age group within (20- 29) years (Table- 1) their mean age was 22.60 (±4.5). The mean age at first marriage was 17 (± 2.28)(Table-2), which was similar to the study conducted by Yadavannavar MC. And Shailaja S. (2011) Karnataka, India, their findings showed the mean age of pregnant women and mean age at first marriage was 24.66 and 16 years respectively. In this study the respondents who got married before legal age is quite more in quantity. Almost 65% of them gave history of early marriage and rest of them got married above the age of 18 years which is not similar to the study conducted by Md Golam Hossain (2015) “Prevalence of early marriage among Bangladeshi women”, Bangladesh. According to this study prevalence of early marriage was found 81.8% among Rajshahi division women which is higher than the present study. This difference might be due to small sample size.
In this study out of 280 respondents almost 95% were Muslims and rest of them were Hindu. The family size found to be ranged from 2 to 15 members where the average family members were around 5 people (± 2.76). Almost 50% families had family size of <=4 (Table- 1). About 57% respondents were lived in joint family and 43% were in nuclear family (Table-1).
Majority of the respondent 37.9% had completed primary education one to class five, 22.9% had completed secondary (VI- X) education and only 14.3% had completed education higher secondary and above. Rest of them (25.0%) can sign only (Table- 1). The present study showed that maternal education had significant association with child sex preference. Among the respondents primary education completed group (65.1%) had more child sex preference than other education group. (Table- 3)
In this study most of the respondents about 95% were housewife (Table- 1). So among the respondents 95% have no personal income but only 5% of them have some sort of personal income (Table-1). This study showed that maternal personal income had significant association with child sex preference. Among the respondents those who have no personal income (about 95%) had more child sex preference than those who have personal income. (Table-4) This study finding was similar (no personal income 92.8%) to the study which was conducted by Himadri Bhattacharjya et al. “Gender preference of mothers attending Antenatal clinic” (2014), Tripura, India.
49

Texila International Journal of Public Health Volume 5, Issue 1, Mar 2017
Most of the respondent’s (53%) monthly family income was <=10000 taka and their maximum income was 40000 and minimum 5000 taka. Monthly family expenditure was maximum 40000 taka and minimum 5000 taka (Table-1).
The record of adolescent pregnancy from this study was 67% and rest of them had adult pregnancy, the mean age of first pregnancy was 18.65 years (± 2.69). (Table-2) which was similar to the study conducted by S.M Mostafa Kamal (2009) “Adolescent motherhood in Bangladesh”. In this study 64.3% of the Bangladeshi married adolescents experience motherhood in their teen ages. According to BDHS report, almost one-third (32.7%) of the adolescents begins childbearing in their teen ages. This difference might be due to small sample size at the studying population.
Almost 40% respondents have no parity that means first time pregnant mother. Among the respondents about 23% had boy child, almost 32% respondents had girl child and only 5% of them had both child (boy and girl). This study showed that respondent’s parity had significant association with child sex preference. Among the respondent’s more than half (55%) multi gravid group had preference of child sex whereas only 40% primi gravida group had preference of child sex. (Table-5)
In this study out of 280 respondents about 97% of pregnant women came for ultrasound scan by the reference of doctor through written prescription. In present pregnancy almost 60% of the respondents were done USG in one time which is equal to the USG done in their previous pregnancy. In this study found that, according to Ultrasound scan about 55% pregnant women were in third trimester of pregnancy who were came for USG and 33% were in second trimester. (Fig-3) All of the respondents have done USG for their pregnancy complication. Among them about 66% were done USG for the purpose of sex detection and rest of them come for other reasons in their pregnancy. (Fig-2)
Out of the 280 study women about 55% of the respondents had expectation about sex of the child before child birth. Among them 41% respondents had son preference whereas only 14% respondents had daughter preference and rest of them had no preference which was similar (son preference 40.8%) to the study conducted by HimadriBhattacharjya et al. Gender preference of mothers attending Antenatal clinic (2014), Tripura, India. On the other hand about 76% respondent’s husband had expectation about sex of child before child birth. Among them 56% had son preference whereas 20% respondent’s husband had daughter preference and rest of them preferred any of children. (Fig-1)
Conclusion
Based on the finding, the most commonly anticipated outcomes of ultrasound were discovering fetal sex, fetal position and pregnancy problem. Ultrasound would increase antenatal care attendance. Preference for male child was higher than female. Literacy and sex of existing child were important determinants of the gender preference of expectant mothers. Son preference predominant among primary education completed rural mother. More capability of supporting the parents during old age, son are reason for economic progress, son are productive and continuation of generations name, etc were the important reasons in favor of son preference. Some social custom like ‘old parents are the responsibility of son’ need to be restructuring, not only sex selection but also properly used ultrasound scan can be a powerful tool to advance fetal and maternal healthcare. This will improve the quality of life for women and newborns in developing countries.
Acknowledgement
I would like to thank my research supervisor Dr. Afroza Begum for her invaluable support, concern and participation. I would especially like to thank Dr. Ashraful Alam, Dr. Irin Hossain, Saddam Hossain. for helping me write and design the report. A special thanks goes to Dr. Asha for hosting and supporting me while I was in Natore and my interview team there–ShailaApa, Mishu. I also wish to thank the women who were come for ultrasound scan in different diagnostic centers. I would not be able to pull it all together without you.
50

Texila International Journal of Public Health Volume 5, Issue 1, Mar 2017
References
[1]. Bairagi R, Datta A.K. “Demographic Transition in Bangladesh: What Happened in the Twentieth Century and What Will Happen Next?” Asia Pacific Population Journal; (2001), 16:3–16. [2]. CaugheyA.B, Nicholson J.M. Washington A.E. First-vs. second- trimester ultrasound: the effect on pregnancy dating and perinatal outcomes. Am J ObstetGynecol; (2001), 198(6): 703.e 1-703.e6 [3]. Census Figures of 2001. Office of the Registrar General and Census Commissioner, New Delhi, India. [4]. Gupta D.M. Selective Discrimination against Female Children in Rural Punjab, India; (1987) Population and Development Review 13, 77-100 [5]. Hutchon. Fetal ultrasound and the risk factors; (2006). www.pubmed. Accessed july [6]. Hyam B, Raghda, H, Asmaa. Syrian women’ perceptions and experiences of ultrasound screening in pregnancy; implications for Antenatal policy. Syrian Journal of Medicine; (2004) 11 (2); 69-72 [7]. Mishra V, Roy T. K, Retherford R. D. Sex Differentials in Childhood Feeding, Health Care, and Nutritional Status in India; (2004) Population and Development Review 30, 269- 295 [8]. WHO, Preventing Gender-biased Sex Selection [9]. Wongboonsin, Ruffolo V P. Sex preference for children in Thailand and some other South-East Asian Countries. Asia-Pacific Population Journal; (1995)10(3), 43-62. [10]. Johansson S, NygrenO. The Missing Girls of China: A New Demographic Account. Population and Development Review; (1995) 17, 35-51. [11]. Zeng Y, Ping T, Baochang G. Causes and Implications of the Recent Increase in the Reported sex ratio at birth in china, Population and Development Review; (1993), 19, 283-302.
51

Texila International Journal of Public Health Volume 5, Issue 1, Mar 2017
Factors that Influence Practice-Nurses to Promote Physical Activity
Article by Sophonie Ndahayo Ph.D in Public Health, Texila American University, India
E-mail: [email protected]
Source
McDowell, N., McKenna, J., and Naylor, P-J. (1997). Factors that influence practice-nurses to promote physical activity. British Journal of Sports Medicine volume 31 number 4, pages 308-313.
Introduction
McDowell, McKenna, and Naylor (1997) research article entitled “Factors that influence practice nurses to promote physical activity”, which appeared in the British Journal of Sports Medicine number 31, pages 308-313 had as objective to investigate what factors may influence practice-nurses to promote physical activity. The study is of paramount importance because there is a worldwide concern about increasing rates of obesity and decreasing population levels of physical activity. Yet, it has been argued that primary healthcare professionals are ideally placed to promote physical activity within local communities (Douglas et al 2006).Though it has been argued that primary healthcare professionals are ideally placed to promote physical activity within local communities (Douglas et al 2006), Steptoe et al. (1999) stated that in Catalonia in the United Kingdom, there was a lack of evidence regarding the levels of physical activity promotion. There are various constraints that impede the success of physical activity promotion programmes. Nevertheless, this study showed that the two stage measures (activity promotion and personal behaviour) of the health care professional are associated with important differences in patient and practice factors for physical activity promotion.Their view will be presented in the following order: summary of the article; structure; critique that will focus on: the authority of the authors/ researchers, accuracy of style of writing, relevance of the study subject or topic, objectivity of the research and its stability. Finally, the review will analyze the graph and draw a conclusion on the whole article.
Review of literature
The Health Education Authority (1992) stipulated that recent evidence suggested that British adults do not participate in sufficient physical activity to offset health problems. Recently, Donaldson (2009) stated that the benefits of regular physical activity to health, longevity, well-being and protection from serious illness have long been established. They easily surpass the effectiveness of any drugs or other medical treatment. The challenge for everyone, young and old alike, is to build these benefits into their daily lives. If a medication existed which had a similar effect, it would be regarded as a “wonder drug” or “miracle cure”. Donaldson (2009) concluded that it is crucial to encourage a culture of physical fitness in the population which spans all ages. However, (Hillsdon & Thorogood 1992) had noted that the challenge remained to identify efficient strategies that encourage, even modest, increases of physical activity in large sections of the public. According to the United Kingdom (UK): Department of Health (1992)and the General Medical Services (1993) one possible means to increase levels of physical activity in the UK is the government supported concept of preventative care in which general practitioners (GPs) are encouraged to offer regular health checks to their adult patients, and health promotion services to all registered patients. These facts have been supported by Douglas et al 2006 whose findings revealed that there were high levels of enthusiasm for physical activity promotion amongst health visitors and practice nurses. This is in line with the World Health Organisation’s 2008-2013 action plan for global strategy for the prevention and control of non-communicable whose one of the objectives
52

Texila International Journal of Public Health Volume 5, Issue 1, Mar 2017
states: to promote interventions to reduce the main shared modifiable risk factors for non-communicable diseases including unhealthy diets and physical activity. It is noteworthy that there are various barriers to effective PA promotion that include patients’, health-provider and system barriers. The review of literature evaluated the quality and the meaning of the studies done before, and arrived at a conclusion about the problem based on the studies evaluated. It has shown the gap in knowledge which prompted the research. The literature was relevant, up-to-date and coherent.
Article summary
The reviewed article, McDowell, McKenna, and Naylor (1997) investigated factors that may influence practice nurses to promote physical activity (PA) in Avon in England. The problem has been that England is faced with diseases of affluence that can be alleviated by regular PA. However, research has shown that Britons do not participate in sufficient PA to offset health problems. Though general practice-based (GPs) PA promotion has been found ideal, GPs are overwhelmed by workloads and various barriers. Actually, PA promotion is carried out by Practice Nurses (PNs), whose knowledge and skills are uncertain, which justified the study. A questionnaire was sent to all PNs (n=272), with 72.1% return rate after data cleaning. Data were collected under personal, patient status, and practice fact factors respectively. Data were analyzed statistically using a Mann-Whitney test at 0.05% level of significance. Analyzing results based on the trans-theoretical model appeared difficult, a further analysis was done using a dichotomized stage: promotion behaviour and own activity. Results showed that a large proportion of PNs are promoting PA. Furthermore, data revealed that PNs who are active themselves promoted regularly PA and perceived system barriers as of less limiting effects on their level of PA promotion. There was a significant difference in the hours of training that the promoting and restricted promoting PNs had received in the past five years. It is noteworthy that lack of time was limiting for all PNs. According to authors, findings may illustrate behaviours and perceptions of 1994 - year of data collection.
Article structure
With the page number in top left corner, name of the publishing journal in the top-right corner, the topic centred a little bit lower the above, followed by the name of the authors, the article started with an abstract, which gave the objective, methods, results, and the conclusions. Full addresses of the authors, date the article was accepted by the journal are indicated on the first page. The methods followed the systematic way of research; however, there was no mention of how ethical considerations were followed. Results section highlighted the data collection return rate. The proportion of respondents who promote physical activity and the level of significance of the statistic test were also stipulated. Though the article was written in paragraph form, starting by a tab, which facilitated the sequence of ideas, some paragraphs were too long, thwarting the benefit of the shorter ones. It is noteworthy that the use of sub-headings under methods allowed getting the flow of the description of data collection, analysis and results. However, the concept was abandoned in the discussion, which made reading appear tiring, though paragraphing lessened the effects. The conclusions suggested factors contributing to PA promotion and what further investigations could be done. The section was short, precise and to the point. Though the article does not have an acknowledgements’ section, thanks were expressed to Pat Turton of Avon Health and all respondents. The references were given and appeared up-to-date. However, following the American Psychological Association guidelines – references appear in alphabetical order could have been the best option. The article structure was reasonably developed and accessible in PDF, which improves its viral spoilage on the worldwide web. The publishing journal, the topic and authors’ names appear on the right-hand side with page numbers indicated alternating on left and right-top side of each page.
53

Texila International Journal of Public Health Volume 5, Issue 1, Mar 2017
Article critique
Authority
The article was published in the British Journal of Sports Medicine, which was established in 1964. It is a peer-reviewed medical journal that publishes the latest advances in clinical practice and research in all aspects of sports medicine. It is an official journal of the British Association of Sports and Exercise Medicine. The journal covers scholarly work under the coordination of Professor Karim Khan, a medical doctor, FASCM and PhD as editor-in-chief.
The author’s credibility was established through their professional qualification and a number of publications in the subject area covered by the article reviewed. The authors are professionals in the schools of physiotherapy and occupational therapy and that of exercise and health resource unity, as well as in the Ministry of health in Britain, which shows the credibility of both the journal and the authors of the article. Finally, up-to-date references crowned the authority at hand.
Accuracy
Accuracy or precision is their quality of being true or correct. The article contained information from then current research findings. All important facts advances by the researchers had supported from empirical evidence-based sources. The literature review presented in the article was from recent sources from scientific research articles, many of which were from peer-reviewed journals. The conclusions were derived from the data. However, the precision in measurements and analyses could be improved through use of a parametric statistical test since the sample was not small, and there was no comparison of magnitude was to be done. Furthermore, parametric could have added the generalizability of conclusions. Factors could be grouped together with respective loadings, which could clearly show the effects on the studied population. Nevertheless, considering the caliber of the editorial and peer-review process the article went through, it is safe to say that the article’s accuracy met the standards.
Currency
At the time of publication, the article was current and used current literature. However, the reader must take note of the delay in publication. The article reported that the data of this study were collected in 1994 and illustrates behaviours and perceptions related to that time period according to the authors. It was accepted for publication in July 1997. The year of publication of the references ranged from 1992 to 1996. Only one source seemed old, which was 1989. The content and the topic were also current as problems of alleviating physical inactivity health effects were and still issues on public health and clinical medicine.
Relevance
The article was relevant. It had a scientific relevance in that scientists benefited from its findings which elucidated factors may influence practice nurses to promote physical activity in the studied population. This was very beneficial as scientists faced a challenge of identify efficient strategies that would encourage increases of physical activity in large sections of the public. Furthermore, the article had a societal relevance in that it addressed a problem that affected the target population, even the whole nation. A solution to the problem would bring relief to the studied population through prevention and control of diseases of affluence. Lastly, the solution would contribute to the development of the society. Finally, results of the research helped in preparation of the curriculum for future practice nurses, which added the educational relevance. Therefore, the article was very relevant.
Objectivity
The objectivity of the article was demonstrated through statement of the aim of the research, which guided the process. There was elimination of researchers’ bias through the use of questionnaire to collect data – respondents freely filled-in the tool. In addition,
54

Texila International Journal of Public Health Volume 5, Issue 1, Mar 2017
scientific measurements were used through data cleaning – exclusion of tools with incomplete information. The use of statistical data analysis stating the level of significance of the test also demonstrated the objectivity of the article. Furthermore, there was balance in selection of source material. Finally, the researchers mentioned the limitations of the findings – uneven distribution for stage measures, which made them adopt dichotomized stages (Fig 2 in the article). It was also mentioned that results could illustrate behaviours and perceptions of the year 1994, when data were collected, which is a good indicator of objectivity of the article.
Stability
The article, with its source in a reputable academic journal, which is run by reliable academic researchers, is a stable source of information. In addition, the authors used evidence-based literature to support their both the justification of the problem and discuss their findings.
Analysis of graph/image/table
The article has two tables, and two figures. Table one contains the stage of change and statements thereof. It is well-labeled with a title which included the name of the variable. Columns are mutually exclusive, but the rows could have been indicated by lines to improve readability. Table two has: ssummary of patient, personal, and practice factors by dichotomised stage measures as a valid title and has a number. Neither columns nor rows are mutually exclusive, something which could simplify readability. It is worth mentioning that frequencies, percentages and totals were included in the tables. Figures were well-labelled and allocated numbers. Variables are indicated and one can easily decipher the information contained in the figure.
Recent advances related to the topic
General practice is an important setting for promoting physical activity (PA) given the great population-wide access to people of all ages. Health-care providers are seen by the public as credible sources of information, and patients perceive health promotion to be part of the general practice’s role, including physical exercise promotion (nphp, 2002).However, the World Health Organisation (WHO) recognises that health promotion requires a comprehensive and lifespan approach across different groups and settings, and is enhanced through partnership across multiple sectors. The WHO guidelines are validated by the findings of Ribera, McKenna and Riddoch (2005): physical activity promotion was opportunistic, focused on selected patients, highly dependent on personal activity interests. Health policy should focus on integrating PA promotion into more practice consultations. Nevertheless, the Royal College of Nursing (RCN) (2012) argued that nurses have a key role in minimising the impact of illness, promoting health and function, and helping people maintain their roles at home, at work, at leisure and in their communities… nurses are in a unique position to contribute to the lifespan approach to health protection and health improvement. Every interaction should be seen as an opportunity to promote health and prevent illness. RCN has come up with innovation in upstream nursing with good practice grouped under prevention, protection and promotion, which should include PA promotion.
Furthermore, results of Douglas et al. (2006) stated that 90% (n = 149) of health visitors and 88% (n = 186) of practice nurses said that they were very likely or likely to recommend all apparently healthy adult patients to take moderate exercise. However, Huijg et al. (2013) seems to argue against saying that introduction of efficacious physical activity interventions in primary health care is a complex process. Within primary health care practice, rates of PA promotion are suboptimal (Glasgow et al 2001 & Fallon, Wilcox, & Laken 2006). A conclusion was made that organizations and professionals need to make the decision to work with an intervention -adoption, deliver it as intended- implementation, and continue to use it over a longer period of time – continuation (Durlak & DuPre 2008).
55

Texila International Journal of Public Health Volume 5, Issue 1, Mar 2017
Conclusion
This article provides a valuable understanding into the physical activity promotion behaviours of practice nurses (PNs). The literature review showed the discrepancy in knowledge, which prompted the study. Due to attitudinal and system barriers, the duty of promoting physical activity (PA), which initially belong to general practitioners (GPs) has been delegated to PNs, whose effectiveness is unclear. Therefore, it has been pertinent to investigate the factors that may influence PNs to promote PA. Based on a reliable model – stage of change model, the study was based on three elements: patient, practice and personal (provider) factors. Results showed that a large number of active PNs are promoting PA. Two clusters of barriers were identified; lack of time, measurable success, and lack of resources have the greatest effect. Contrary to previous studies (PA promotion depends on smaller number of patient lists), in this study, active PNs were PA promoting and rated lack of resources, protocols and success as of less limiting effect on PA promotion. Of the PNs who reported not promoting PA, 2/3 had not received formal training in the past five years. Having followed the systematic research process, despite the limitations of the study, the article stands a high stability. However, suggestions would be: including males in the sample; changing the target population to patients as results were self-reports of PNs; encouraging PNs to avoid selective PA counselling; organising in-service- training to equip PNs with PA skills, and PNs and general practitioners’ curriculum should include PA skills.
References
[1]. Calnan, M., Coyle, J. and Williams, S. (1994). Changing perceptions of general practitioner care. European Journal of Public Health vol 4, pp. 108-14. [2]. Douglas, F., Teijliingen, V.E., Torrance, N., Fearn, P., Kerr, A. and Meloni, S. (2006). Promoting physical activity in primary care settings: health visitors' and practice nurses' views and experiences Journal of Advanced Nursing 55, (2) pp. 159-68. [3]. Donaldson (2009). www.dh.gov.uk/publications [4]. Department of Health. (1992). The Health of the Nation: a Strategy for Health in England. London: HMSO. [5]. Douglas, F., Teijlingen, V. E., Torrence, N., Fearn, P., Kerr, A., and Meloni, S. (2006). Promoting physical activity in primary care settings: health visitors' and practice nurses' views and experiences. Journal of Advanced Nursing vol 55(2) pp. 159-68. [6]. Durlak, J.A. and DuPre, E.P. (2008). Implementation matters: a review of research on the influence of implementation on program outcomes and the factors affecting implementation. American Journal of Community Psychology 41, pp. 327–350. [7]. Fallon, E.A., Wilcox, S. and Laken, M. (2006). Health care provider advice for African American adults not meeting health behavior recommendations. Prev Chron Dis 3, pp. 1–12. [8]. Florindo, A.A., Mielke, G.I., Gomes, G.A.d.O., Ramos, L.R., Bracco, M.M., Parra, D.C., Simoes, E.J., Lobelo, F. and Hallal, P.C. (2013). Physical activity counselling in primary health care in Brazil: a national study on prevalence and associated factors. BMC Public health 13, p. 794. [9]. Glasgow, R.E, Eakin, E.G., Fisher, E.B., Bacak, S.J. and Brownson, R.C. (2001). Physician advice and support for physical activity: results from a national survey. American Journal of Preventive Medicine 21, pp. 189–196. [10]. General Medical Services Committee. (1993). The New Health Promotion Package. London: British Medical Association. [11]. Health Education Authority. (1992). Allied Dunbar National Fitness Survey. Ipswich: Ancient House. [12]. Hillsdon, M., Thorogood, M. (1996). A systematic review of physical activity promotion strategies. Br _J Sports Med vol 30, pp. 84-89. [13]. Huijg, J.M., Crone, M.R., Verheijden, M. W., Zouwe, N.v.d., Middelkoop, B. J.C. and Gebhardt, W. A. (2013). Factors influencing the adoption, implementation and continuation of physical activity intervention sin primary health care: a Delphi study. BMC Family Practice 14, p. 142.
56

Texila International Journal of Public Health Volume 5, Issue 1, Mar 2017
[14]. Steptoe, Doherty, Kendrick, Rink, and Hilton (1999). Attitudes to cardiovascular health promotion among general practitioners and practice nurses. Family practice 16 (2), 158-163. [15]. www.who.int. [16]. www.nphp.gov.au2002 [17]. www.rcn.org.uk
57

Texila International Journal of Public Health Volume 5, Issue 1, Mar 2017
Knowledge, Attitude and Perceptions of Pregnant Women towards Caesarean Section among Antenatal Clinic Attendants in Cape
Coast, Ghana
Article by James Kojo Prah1, Andreas Kudom2, Obed Uwumbornyi Lasim3, Emmanuel Kwasi Abu4
1University of Cape Coast Hospital, Cape Coast, Ghana 2Department of Conservation Biology and Entomology, University of Cape Coast, Cape Coast, Ghana. 3 Department of Health Information Management, School of
Allied Health Sciences, University of Cape Coast, P.M.B, Cape Coast, Ghana. 4Department of Optometry, School of Allied Health Sciences, University of Cape
Coast, Ghana. E-mail: [email protected], [email protected], [email protected],
Abstract
Over the years, caesarean section has become increasingly safe and remains one of the most commonly performed surgeries in obstetric practice worldwide. Even though there is an increased rate of Caesarean section in both developed and developing countries, some studies have suggested that African women have an aversion for it. We therefore set out to assess the knowledge, attitude and perceptions of Ghanaian women towards caesarean section.
A descriptive cross sectional study was conducted in the University of Cape Coast Hospital. A structured questionnaire was used to assess the knowledge, attitude and perception of 412 pregnant women towards caesarean section. Total knowledge was categorized as inadequate (<50%) and adequate (≥50%). All the 412 respondents were aware of caesarean section. There was, however, a low level of adequate knowledge (39.6%) among the respondents. Majority of the women (94%) preferred vaginal delivery to caesarean section as their primary mode of delivery. Although 40% perceived that most women undergoing CS may die, 95.7% were willing to undergo the operation when indicated. However, 4.3% of the pregnant women would refuse the surgery even if indicated. Formal education (p=0.018), parity (p=0.035) and a previous experience of caesarean section (p<0.0001) were significantly associated with adequacy of knowledge on caesarean section.
Even though there was a high awareness among the pregnant women, there was a low level of knowledge on caesarean section in our setting. Educational messages on caesarean section should be prepared to address especially issues on safety of the procedure and how post-operative pain is managed. Doctors should actively get involved in the education on caesarean section at the antenatal clinics, probably this will increase the knowledge of antenatal clinic attendants on CS.
Keywords: Caesarean section, awareness, knowledge, perception, University of Cape Coast Hospital, Ghana.
Introduction
Caesarean section (CS) is one of the most commonly performed surgical procedures in obstetrics and is certainly one of the oldest surgeries [6]. Probably the term caesarean was derived from the decree in Roman law, which made it mandatory for the operation to be performed on women dying during child birth, a term called lex caesarae [15]. This surgery has been reported throughout medical history and has steadily progressed from being fatal resulting in mortality for the mother or the child to being rendered safe for both mother and fetus during the 20th century [15]. Caesarean section has greatly contributed to improved obstetric care throughout the world [18]. Even though there is an increased rate of Caesarean
58

Texila International Journal of Public Health Volume 5, Issue 1, Mar 2017
section in both developed and developing countries, there is a widely held belief that African women have an aversion for it [4, 14] and is perceived as a “curse” of an unfaithful woman [2]. It is therefore accepted reluctantly even in the face of obvious clinical indications. Previous studies conducted among Ghanaian women [1] indicated that majority of women prefer vaginal delivery to caesarean section and there are some who will not accept the surgery even if indicated. There is evidence to show that pregnant women who are knowledgeable about their condition are able to participate in shared decision-making [8]. With many more Ghanaian women now experiencing caesarean delivery [17], and about 97% of pregnant women now attending antenatal clinic [13] where education on caesarean section is expected to be given, it is expected that pregnant women in Ghana should be more knowledgeable on caesarean section than found in previous studies. We therefore set out to assess the knowledge, attitude and perceptions of Ghanaian women towards caesarean section.
Methods
Study design and setting
A descriptive cross sectional study was conducted in the University of Cape Coast Hospital, a primary health care institution located in Cape Coast, in the Central region of Ghana. It is an eighty (80) bed capacity hospital that serves the health care needs of students, staff of University of Cape Coast and people in Cape Coast and the neighbouring communities. Among the services provided by the hospital include antenatal care and emergency obstetric care to all pregnant women. About 1400 women deliver every year at the facility [21].
Study population and sample
The study population consisted of pregnant women of all ages attending the antenatal clinic of the University of Cape Coast Hospital from January to December 2015. A systematic sampling technique was used to recruit women into the study. Based on the average daily attendance at the clinic, a sampling interval of three was obtained. The first respondent was selected by balloting and picking a number between one and three. Every third woman in the queue waiting to be seen by the attending midwives was recruited into the study. Pregnant women who had visited the antenatal clinic at least twice in their current pregnancy irrespective of their delivery history were eligible for the study. Any woman who was interviewed had her antenatal card marked with a sign (√) to avoid repeat of interview during her subsequent clinic attendance.
The sample size (n) was calculated from the formula n= z pq/d2 where z is the normal standard deviation set at 1.96 which corresponds to 95% confidence interval, d is the degree of accuracy desired set at 5% in this study, (q=1-p), and p was 50%. A minimum sample of 384 was therefore needed. This was adjusted to accommodate for a possible data loss of 10%. The final minimum sample size was 422.
Research instrument
A structured interviewer-administered questionnaire used in an earlier study [3] with slight modification was employed in this study to assess the pregnant women’s knowledge, perception and attitudes towards caesarean sections. In addition, age, parity, marital status and educational background of respondents were collected. Nine questions were used to assess respondents’ knowledge of caesarean section. Some of the questions used to assess their knowledge included whether they would be able to identify listed 4 common indications of CS, which were explained in simple English and in local dialect where applicable. A correctly identified indication of CS scored a quarter point. Also the women were asked if they knew of any risks or benefits of caesarean section. Any correct benefit or risk given scored a point. Respondents were asked about the usual length of hospital stay after surgery. The practice at the University of Cape Coast Hospital is to discharge women within a week after surgery.
59

Texila International Journal of Public Health Volume 5, Issue 1, Mar 2017
Most women are discharged on the third post operative day. Respondents were also asked whether a pregnant woman could have a vaginal delivery after a caesarean section. If a woman responded yes to the question she scored a point, a no response scored zero. A woman was categorized as having adequate knowledge if she scored at least 50%. A respondent was considered to be aware of caesarean section if she had ever heard about it. Perceptions of respondents were assessed by their response to the statement that most women who have CS die. Their attitudes were assessed by their preferred mode of delivery and whether they would be willing to undergo the surgery if indicated. The pregnant women were also asked to suggest ways to make caesarean section more acceptable to them. The questionnaire were administered by trained student nurses who translated the questions into the local language in situations the pregnant women did not understand English.
Data analyses
Frequencies and percentages were computed using SPSS (Statistical package for social sciences) statistical software version 20.0. Association between level of knowledge on caesarean section and respondents’ characteristics were carried out using a chi-square (χ2) test. Characteristics with significant differences between groups by the χ2 test were included in a multivariate logistic regression analysis to predict their independent associations within the group. Statistical significance was set at p<0.05.
Ethical consideration
The study was approved by the Institutional Review Board of University of Cape Coast with reference number UCCIRB/EXT/2015/06. Written informed consent was obtained from the participants prior to being interviewed. Permission was also obtained from the authorities of University of Cape Coast Hospital before the study was conducted.
Results
Out of the 422 pregnant women invited into the study, 412 agreed to participate in the study. The ages of the respondents ranged from 15 to 41 years with a mean of 24.9 ± 6.1, parity ranged from 0 to 8. Gravidity ranged from 1 to 12 with an average of 3.2±2.2. The basic demographic data and obstetric history of respondents are shown in table 1.
All 412 (100%) pregnant women had ever heard about caesarean section. With regards to respondents’ knowledge about caesarean section 163 (39.6%) had adequate knowledge with the remaining 249 (60.4%) found to have inadequate knowledge. In the assessment of their knowledge on CS, only 185 (45%) respondents could correctly identify one indication for the surgery. When asked to state one risk and one benefit they knew about CS, there were varied responses. When asked about the usual hospital stay after surgery, 181 (43.9%) were able to say that women are discharged within a week after surgery. Only 173 (42%) of respondents knew that a woman could deliver vaginally after a caesarean section. Participants’ level of knowledge about CS was significantly associated with parity (p=0.035), past experience of CS (p<0.0001) and level of formal education (p=0.018). With regards to parity, only women who had at least three deliveries had statistically significant level of knowledge when compared to those who had never given birth (O R = 2.1, p = 0.004) while women who had given birth once or twice only having no significant level of knowledge (Table 2). Women who had undergone previous CS where 8 times more likely to have adequate knowledge than women who had no previous experience of CS. By comparing with participants with no formal education, individuals who had basic, secondary and tertiary education were more likely to have adequate level of knowledge about CS (p = 0.02, 0.01 and 0.05 respectively). The age of the pregnant woman (p=0.828), her occupation (p=0.328) and her gravidity (p=0.713) were not significantly associated with her adequacy of knowledge on caesarean section.
On their preferred mode of delivery, 387 (94%) preferred vaginal delivery to CS, 16 (4%) preferred CS as their primary mode of delivery and the remaining 8 (2%) were undecided.
60

Texila International Journal of Public Health Volume 5, Issue 1, Mar 2017
Reasons given for choosing vaginal delivery as the preferred mode of delivery included: it is the safest (89%), it is natural (90%), less pain after delivery (63%), and early discharge from hospital (24%). The main reasons given by the pregnant women who preferred CS were avoidance of labour pains (49%), fear of having episiotomies (54.6%), safer route of delivery (24.3%), and avoidance of emergency CS (11.8%). Majority 390 (94.6%) of the pregnant women, however, said they would agree to the operation if it was indicated. A minority 18(4.3%) said they would not agree to undergo the procedure even when indicated. The rest were undecided.
Of the 412 women interviewed, 165 (40%) perceived caesarean section as being dangerous to the mother as they agreed with the statement that most women who have CS die; 232 (56.3%) did not believe that most women who have CS die, whilst 15 (3.7%) could not give an opinion on the statement. Among the 412 respondents, 23 (6.1%) had had a previous caesarean section. Of these, 18 (78.3%) said CS was their preferred mode of delivery, 3(13.0%) preferred vaginal delivery whilst 2(8.7%) were undecided. All 23 (100%) were willing to undergo another CS if indicated.
The main source of information about CS among the respondents was the media (55.7%), family and friends (12.3%) and antenatal clinic (32%). With regards to the level of education on CS at the antenatal clinic, 288 (70%) rated it as good whilst 124 (30%) said it was bad. When asked to suggest ways to make CS more acceptable to pregnant women, all 412 respondents were of the opinion that more education on CS should be done during antenatal clinics. Other responses were: doctors should be part of the education on CS (94.9(%), CS should be made less painful (48.5 (%) and the use of evidence-based leaflets and videos at the antenatal clinics (5.3%).
Discussion
All of the pregnant women surveyed were aware of caesarean section as a mode of delivery. This level of awareness among pregnant women found in this study is higher than that found in some previous studies conducted in Ghana [1] and Nigeria [3]. The difference could be due to the difference in study designs, study population and the years between the studies. Despite this high awareness, only 39.5% of the respondents had adequate knowledge on CS. This finding is similar to a previous study among Nigerian women [3]. This might be because as much as 68% of the pregnant women in this study said their main sources of information on CS were the media and from family and friends which are usually unreliable sources unlike knowledge gained at antenatal clinics. Formal education was significantly associated with knowledge of respondents on CS. This is probably because the educated women could easily assess the media including the internet for any information they need on CS. The multivariate logistic regression analysis revealed that the higher a respondent’s level of education did not necessarily mean a higher adequacy of knowledge on CS compared to those with lower levels of formal education. This suggests that some of the women even though highly educated it does not necessarily mean they have adequate knowledge on CS. Thus, there is a need for all pregnant women irrespective of level of formal education to seek knowledge about caesarean section from authentic and reliable sources. The study revealed that a previous experience of CS was highly associated with adequate knowledge on CS. This could probably be due to the likelihood that women who had CS in the past had received adequate pre-operative information on the surgery coupled with the knowledge they might have received during their antenatal clinics as well as their own personal experiences. The finding that only women who had at least three deliveries had statistically significant level of knowledge when compared to those who had never given birth shows that probably pregnant women in our setting do not receive adequate information on CS when they attend the antenatal clinics for any given pregnancy and would therefore need at least three pregnancies to consolidate their knowledge about CS. Health educators at the antenatal clinics should therefore give more attention to education on CS so that a pregnant woman could become adequately knowledgeable on CS after completing antenatal visits for only one pregnancy. An
61

Texila International Journal of Public Health Volume 5, Issue 1, Mar 2017
overwhelming majority of the respondents 387 (94%) preferred vaginal delivery to caesarean section. This is consistent with findings from other studies in different populations [7, 20]. Despite the high preference for vaginal delivery, it is interesting to note that 97.5% of the respondents were willing to have CS when indicated. Similar results have been reported in some studies where the acceptability of the operation was found to be 85% in Nigeria [4] and 90.5% in Ghana [1]. Compared to a previous study in Ghana [1] which reported that 6% of those surveyed would not accept CS even if indicated, it can be inferred that many more Ghanaian women are now accepting CS as a safe alternative to vaginal delivery. This may be because with the increasing rise in caesarean section rates worldwide, many more women who have successfully undergone the surgery tell their stories thus allaying the fears of others about the surgery. The finding is also contrary to the widely held belief that African women have an aversion for CS [9, 12, 19]. On their perception about CS, 40% of women in the present study think that most women who undergo CS die. This finding means that a significant number of pregnant women still consider CS very dangerous and this must be adequately addressed through education. Although studies have reported increased risk of maternal death for CS as compared to vaginal delivery [10, 11], CS remains one of the most commonly performed surgical operation in obstetric practice all over the world [4]. Over the years, it has become relatively very safe because of improved surgical technique, better anaesthesia, safe blood transfusion and the use of highly effective antibiotics [5]. All the women in the study wanted education on CS to be included in antenatal health education topics. Since 124 (30%) of the pregnant women rated the level of education on CS at the antenatal level as bad, effort should be made to ensure that education about CS is done at almost every clinic session. This will increase the knowledge level of the pregnant women on the surgery and avoid their over reliance on the media, family and friends which are unreliable sources of information. Among strategies suggested by the pregnant women to improve acceptability of CS, 391 (94.9%) of them wanted doctors’ involvement in the education process. Studies conducted in different populations worldwide found that in most cases only midwives are the educators at antenatal clinics [16]. It is clear from the findings in this survey that the pregnant women want this practice to change. A small number of respondents (5.3%) suggested the use of evidence-based leaflets and videos. This suggestion is important because in recent years there has been considerable interest in the potential for transmitting information to clients using resources such as digital video discs (DVDs), compact disc read-only memory (CD ROMs), evidence-based leaflets, and posters that are less expensive than health practitioners’ time [16]. This should, however, not replace the face to face interactive sessions that take place at the antenatal clinics. A study [22] found that women prefer receiving information from health care professionals over and above any other source. Since most of the pregnant women were concerned about the safety and post operative pain management, the content of educational messages on CS should address these issues effectively.
Limitations of study
One of the limitations of this study was that it involved only women excluding the men who are important stakeholders in decision making on caesarean sections. Also the study did not explore the reasons why some women in our setting would not give consent for the surgery even when indicated. The social, cultural and economic states of the women which may influence their knowledge, attitude and practices towards caesarean section were not explored. Further studies would have to be done in our setting to assess the adequacy of pre-operative counselling and the effectiveness of other forms of education such as the use of videos and leaflets and posters to the pregnant women.
Conclusion
Although all the women were aware of CS there was still a low level of knowledge on the surgery in our setting. Whilst majority of them were willing to undergo the surgery when
62

Texila International Journal of Public Health Volume 5, Issue 1, Mar 2017
necessary, some women would still not accept to undergo CS under any circumstances. This brings to light the need to intensify education on CS at the antenatal clinics with a look at the content of such educational messages aimed at addressing the fears being entertained by women about the surgery and also further studies conducted to ascertain the reasons why some women will not accept the surgery even if indicated. Also doctors should actively get involved in the education of pregnant women. Other resources such as DVDs and leaflets could be employed to augment what is done at the antenatal clinics. All these will possibly help pregnant women to be well informed about caesarean section which could be lifesaving and thus be in better positions to make informed decisions about the procedure.
Acknowledgements
The authors are grateful to the staff of the antenatal clinic and management of the University of Cape Coast Hospital for making this study possible.
References
[1]. Adageba, R.K., Danso, K.A., Adusu-Donkor A., & Ankobea-Kokroe F. (2008). Awareness and perception of and attitude towards caesarean delivery among antenatal. Ghana Med J. 42: 137 – 140. [2]. Adeoye-Sunday, I., & Kalu, C.A. (2011). Pregnant Nigerian women's view of caesarean section. Niger J ClinPract. 14: 276 – 9. [3]. Ashimi, A.O., Amole, T.G., & Aliyu, L.D. (2013). Knowledge and attitude of pregnant women to caesarean section in a semi-urban community in northwest Nigeria. J West AfrColl Surg. 3(2): 46-61 [4]. Awoyinka, B.S., Ayinde, O.A., & Omigbodum, O.A. (2006). Acceptability of caesarean delivery to antenatal patients in a tertiary health facility in South West Nigeria. J OBstetGynaecol. 26(3); 208-10 [5]. Aziken, M., Omo-Aghoja, L., & Okonofua, F. (2007). Perceptions and attitudes of pregnant women towards caesarean section in urban Nigeria. ActaObstetGynecol Scand. 86(1):42–47. [6]. Chaser, M.J. (1956). Caesarea section, sterilization and hysterectomy. In: Munro Kerr’s Operative obstetrics, BallierreTindall and Cox, London, 1956; p.539 [7]. Chong, E.S.Y, & Mongelli, M. (2003). Attitudes of Singapore women towards caesarean and vaginal deliveries. Int J Gynaecol Obstet. 80:189-194. [8]. Coulter, A., Parsons, S., & Askham, J. (2008). Where Are The Patients In Decision- Making About Their Own Care? Copenhagen, Denmark: WHO Regional Office For Europe;2008 [9]. Danso, K., Schwandt, H., Turpin, C., Seffah, J., Samba, A., & Hindin, M. (2009). Preference of Ghanaian women for vaginal or caesarean delivery postpartum. Ghana MedJ 43(1):29-33. [10]. Deneux-Tharau, C., Carmona, E., Bouvier-Colle, M.H., & Breart ,G. (2006). Postpartum maternal mortality and caesarean delivery. ObstetGynaecol. 108(3 pt1):541–548. [11]. Devendra, K., & Arulkumaran, S. (2003). Should doctors perform elective caesarean section on request? Ann Acad Med Singapore. 32(5):577–581. [12]. Etuk, S.J., Asuquo, E.E.J., & Ekanem, A.D. (1999). Maternal mortality following Caesarean section at the University of Teaching Hospital, Calabar, Nigeria. Niger J Med. 8: 62 – 65. [13]. Ghana Demographic Health Survey, 2014. [14]. Ilesanmi, A.O., Odukogbe, A., & Olaleye, D.O. (1997). Vaginal delivery after one previous Caesarean section in Nigerian women. J Obstet Gynecol. 17: 139 -41. [15]. Kwawukume, E.Y. Caesarean section. In: Kwawukume EY, Emuveyan EE, editors. Comprehensive Obstetrics in the Tropics. Dansoman: Asante and Hittscher Printing Press; 2002. p. 321-329 [16]. Mary, L.N. Information Giving and Education In Pregnancy: A Review Of Quanlitative Studies. J Perinat Educ. 2009 Fall;18(4):21-30 [17]. Multiple Indicator Survey, Ghana Statistical Services, 2011 [18]. Nkwo, O.P., & Onah, H.E. (2002). Feasibility of reducing Caesarean section rate of the University of Nigeria Teaching Hospital, Enugu-Nigeria. Trop J ObstetGynaecol. 19 (2): 86-9. [19]. Orji, E.O., Ogunniyi, S.O., & Onwudiegwu, U. (2003). Beliefs and perception of pregnant women at Ilesa about Caesarean section. Trop J ObstetGynaecol. 20: 141 -143.
63

Texila International Journal of Public Health Volume 5, Issue 1, Mar 2017
[20]. Osis, M.J.D., Padua, K.S., Duarte, G.A., Souza, T.R., & Faundes, A. (2001). The opinion of Brazilian women regarding vaginal labour and caesarean section. Int J Gynaecol Obstet 75:S59-S66. [21]. Prah, J., Ameyaw, E.O., Afoakwah, R., & Kudom, A. (2016). Factors affecting birth weight in Cape Coast, Ghana. Int J ReprodContraceptObstetGynecol. 5:1536-9. [22]. Risica, P.M., & Phipps, M.G. (2004). Educational preferences in a prenatal clinic. Int J Childbirth Educ 21(4):4–7.
Tables
Table 1. Basic demographic data and obstetric history of respondents
Characteristic n (%) Age group 15-19 79 (19.2) 20-24 143 (34.8) 25-29 111 (27.0) 30-34 32 (7.8) >35 47 (11.2) Parity 0 130 (31.6) 1 89 (21.6) 2 33 (8.0) ≥3 160 (38.8) Previous CS experience Yes 28 (6.8) No 388 (93.2) Marital status Married/cohabiting 400 (97.1) Single 12 (2.9) Gravidity 1 85 (20.6) 2 150 (36.4) 3 93 (22.6) ≥4 84 (20.4) Occupation Employed 62 (15.0) Unemployed 350 (85.0) Formal education None 20 (4.9) Basic 116 (28.2) Secondary 202 (49.0) Tertiary 74 (17.9)
Table 2: Multivariate logistic regression analysis between participants’ knowledge about CS and demographic characteristics
Characteristic Number with adequate knowledge n(%)
OR (95% CI) p-value
Parity (n=412)
0 39(23.9) Reference - 1 36(22.1) 1.6 (0.9-2.8) 0.11 2 13(8.0) 1.5. (0.7-3.4) 0.30 ≥3 75(46.0) 2.1 (1.3-3.4) 0.004
64

Texila International Journal of Public Health Volume 5, Issue 1, Mar 2017
Previous CS (n=163)
No 140(85.9) Reference - Yes 23(14.1) 8.0 (3.0-21.6) ˂ 0.001 Formal Education (n=412)
None 2 (1.2) Reference - Basic 47(28.8) 6.1 (1.4-27.7) 0.02 Secondary 89 (54.60) 7.1 (1.6-31.4) 0.01 Tertiary 25 (15.4) 4.6 (1.0-21.4) 0.05
OR, odds ratio; CI, confidence interval
65

Texila International Journal of Public Health Volume 5, Issue 1, Mar 2017�
Hypertension and Isolated Office Hypertension in HIV-Infected Patients Determined by Ambulatory Blood Pressure Monitoring:
Prevalence and Risk Factors
Article by Orji Ikechukwu Anthony1, Bernardino Jose Ignacio2, Mora Marta3, Zamora Francisco Xavier4, Arribas Blanca5, Montes Maria Luisa6, Pascual-Pareja Francisco7,
Jose Belen San8, Peña Jose Maria9, Arribas Jose Ramon10
1Disease Control Unit, Health Department, AMAC, Abuja, Nigeria E-mail: [email protected]
Abstract
This review extensively evaluated literatures related to the subject, and assessed the structure, accuracy currency, authority, relevance, objectivity and stability of the article. Other sections assessed were the analysis of the tables, appraisal of the recent advances on the topic in addition to the credibility and accessibility of the article. The study has its objective as determining the prevalence as well as the risk factors of hypertension and isolated office hypertension (IOH), among people living with HIV/AIDS. The study was a cross-sectional study that used a 24-hour ambulatory blood monitor to measure the blood pressure of the participants. A prevalence of 14.8% for hypertension and 5.5% for isolated office hypertension was recorded in the study amongst others. The study also found hypertension to be strongly associated with family history of hypertension, age, male gender and number of antiretroviral regimens. Largely, the article is an objective, credible and relevant scholarly piece which has contributed significantly to the body of knowledge in this important field of HIV/AIDS. Hypertension with its attendant cardiovascular morbidities/mortalities expected in the rising aging population of HIV infected patients underscores the importance and timely nature of this work. It will be useful to clinicians, researchers, academicians and donor agencies sponsoring HIV/AIDS programs. The article is current, accessible and relevant for clinical services, further research, academic purposes and policy decision making in HIV/AIDS programs.
Keywords: Hypertension, Isolated office hypertension, Prevalence, Risk factors, HIV infected patients, Ambulatory Blood Pressure Monitoring.
Introduction
This work is a critical review of the article titled “Hypertension and Isolated Office Hypertension in patients infected with HIV determined by Ambulatory Blood Pressure Monitoring: Prevalence and Risk Factors” written by Bernardino Jose Ignacio, Mora Marta, Zamora Francisco Xavier, Arribas Blanca, Montes Maria Luisa, Pascual-Pareja Francisco, Jose Belen San, Peña Jose Maria & Arribas Jose Ramon in the Journal of Acquired Immune Deficiency Syndromes. This topic is relevant as the available data about the prevalence of Hypertension among People Living With HIV/AIDS (PLWHAs) is conflicting ranging from 5% to 38%, while some studies show high prevalence in comparison to the general public, others show low prevalence, therefore, the need to carry out this type of study especially using Ambulatory blood pressure monitoring (ABPM) which has numerous benefits over office Blood Pressure (BP) monitoring, thereby revealing the actual prevalence of hypertension among PLWHAs in addition to associated cardiovascular risk factors. At the first instance, the review evaluated the literatures relevant to the topic besides delineating the summary of the article. Then, it briefly analyzed the effectiveness of the structure of the article; undertook an exploration of the information flow to determine whether it can be efficiently accessed while reading the article. Furthermore, the review critiqued the article, in view of its authority, currency, accuracy, relevance, objectivity and stability. The tables were
66

Texila International Journal of Public Health Volume 5, Issue 1, Mar 2017�
analyzed; appraisal of recent advances related to the topic was done before lastly looking into the credibility as well as the accessibility of the article.
Review of literature
According to Irish Heart Foundation report, Ambulatory blood pressure monitoring refers to the process of measuring blood pressure at regular intervals for instance every 15–30 minutes, in a 24-hour period while the client goes about his or her routine daily activities. The Blood Pressure is measured both day& night while client is asleep. This is the added advantage over office blood pressure measurement. It further states that ABPM is better than single BP measurement which can mislead because it gives a snapshot only, of Blood Pressure behavior. It is now well known that Blood Pressure can vary extensively over a 24 hour period. ABPM therefore is the most reliable way of measuring blood pressure as it also measures night time blood pressure which gives valuable information and can predict potential problems associated with high blood pressure. ABPM is now recommended in UK for all patients suspected of having hypertension.
The SpaceLabs 90207 ambulatory monitor was recommended for ambulatory blood measurement following the validation research work done by O’Brien et, al, (1991), a group of independent investigators which reported that the device achieved a B rating by the standards of British Hypertension Society protocol for diastolic and systolic blood pressure measurement as well as fulfilled the criteria set by the Association for the Advancement of Medical Instrumentation for diastolic and systolic blood pressure measurement. This validation of Spacelabs 90207 oscillometric monitor was reaffirmed by Xavier et.al, (2013).
In view of the cardiovascular complications associated with HIV/AIDS, study of Hypertension and risk factors prevalence among PLWHAs is of utmost importance. In the study by Saves et al, (2003), as well as Bergersen et al (2003), it was reported that hypertension prevalence was lower than that of the control group. However, some authors like Carmine et.al (2003) and Baekken et al, (2008) reported higher prevalence of 34.2%and 36.5% respectively. Furthermore, Bavinger et al, (2013) reported that some recent research studies revealed that certain types of Anti-retroviral drugs may be linked with an increased risk of cardiovascular diseases. This is of great concern because PLWHAs may be on these drugs for many decades.
Article summary
The objective of the study was to determine the Hypertension prevalence and Isolated Office Hypertension (IOH) prevalence, and risk factors among PLWHAs. A Hospital-based cross sectional survey of patients selected randomly at the Hospital La Paz HIV Unit in Madrid, where comprehensive careered given to HIV-infected adults.
Hypertension and IOH were diagnosed using 2007 European Society of Cardiology and European Society of Hypertension guidelines and the researchers obtained patients’ information on prescribed drugs and laboratory outcomes from clinical records/Lab databank.
Arm, waist & hip circumferences, weight & height were measured. Bioelectrical Impedanciometer (OMRON BF400) was used to measure total body fat. All Blood pressure readings were taken with a validated semiautomatic oscillometric device (Omron HEM 7001-E. Omron Corp, Tokyo, Japan). For ambulatory monitoring assessment, a 24-hour (morning to morning) ABPM was done using a validated oscillometric device (Spacelabs 90207) with the BP readings set at interval of 15-minutes in the daytime (from hours of 07 AM to 10 PM) &20-minute intervals during night (from 11 PM to 07 AM.
The result revealed 15% prevalence of hypertension & 39% of these had IOH, underscoring the importance of ABPM for hypertension confirmation. Furthermore, hypertensive HIV patients were older, in longer duration of the infection, with lower cd4 & havelipoatrophy, are more likely to be taking anti-retroviral medications, and had more cardiovascular risk factors than their normotensive counterparts. Moreover, age, male gender,
67

Texila International Journal of Public Health Volume 5, Issue 1, Mar 2017�
family history of hypertension & number of anti-retroviral regimens increased the risk of hypertension. On circadian rhythm, 5% were extreme dippers, and 12% were risers.
Article structure
The article was presented starting with the title, authors & author information. This was trailed by the abstract, succinctly presenting the objectives, methods, results and conclusion, thus, giving a quick overview of the work. The main text followed, and is presented with appropriate sections as is normally required with research report of this category facilitating easy access to any desired information. The under listed sections applied to this report: introduction, patients and methods, results, discussions & summary, acknowledgments & references. The introduction section explained the background of the problem, supported by the literatures reviewed, uncovered the existing gap in research regarding the hypertension prevalence/cardiovascular risk factors among PLWHAs, as well, stated the hypothesis that guided the research. The Patients and methods section stated the study design, population and study area. The instruments of data collection, measurements & definitions as well as data analysis techniques were clearly demonstrated. Also documented is the ethical approval & patients consent.
Further, the result section presented the important findings of the study addressing the objectives of the work with appropriate use of tables to support and illustrate the findings for clear understanding of the results.
Discussion section brought to bear, the area of strength and comparative advantage of this research over previous ones as regards use of ABPM to confirm hypertension especially among PLWHAs. The objectives of the research as achieved were focused on and compared with previous researches in the subject area. Moreover, the limitation of the study was acknowledged especially as it concerns small sample size, BP measurement only on a single day, use of clinical definition for lipoatrophy and use of number of antiretroviral drugs as an indirect measurement of duration of therapy.
The summary section was incorporated into the discussion section, which should have been on separate section for easy access to the reader; nevertheless, it was clear, concise and unambiguous bringing out the substance of the whole research work. On the whole, the main text of the article was very well written and presented.
Critique
Authority
Journal of Acquired Immune Deficiency Syndromes (JAIDS) is a reliable multidisciplinary material for HIV and AIDS-related issues with editors who are distinguished in fields of clinical virology, epidemiology & molecular biology. JAIDS publishes peer-reviewed articles on HIV/AIDS related information from around the globe which are indexed / abstracted in MEDLINE/PUBMED, COPUS, BIOSIS, biological sciences/life sciences, PsychINFO and others. The authors are authority in the HIV/AIDS discipline, some of whom are clinicians who manage HIV infected patients and seasoned researchers in the subject with the university hospital, while some are biostatisticians who are working in the biostatistics department of the university, with many years of research experience.
Accuracy
The Accuracy Of The Article Is Supported By The Fact That The Information Was Extracted From A Recent Research Work Of Less Than Five Years Old. As Well, Most Of The References As Cited In The Text Were Current Research Works On The Subject Of Study, Thereby, Supporting The Accurateness Of The Article. Moreover, JAIDS Publishers Take On A Rigorous Peer Review And Editorial Process By Their Editors Who Are Experts In The Field Of HIV/AIDS When Reviewing Articles For Acceptance For Publication, Thus, Only Thoroughly Scrutinized Articles With High Level Of Accuracy Make It The Press. Generally Speaking, The Accuracy Of The Article Is Of Acceptable Standard.
68

Texila International Journal of Public Health Volume 5, Issue 1, Mar 2017�
Currency
This work was received by journal of acquired immune deficiency syndromes (JAIDS) on 6th February, 2011, accepted for publication on 26th may, 2011 and subsequently published on 1st September, 2011; therefore, this is a recent as well as current research study. Besides, the cited references used for the study are current works most of which were done between 2003 and 2010. This article dealt with a present-day health challenge as it affects people living with HIV & aids, a contemporary health problem needing urgent research attention and intervention to curb its rising tide. This article is a work that can actually be relied upon.
Relevance
Journal of Acquired Immune Deficiency Syndromes (JAIDS) is a thorough peer reviewed journal relevant for students, academicians, health professionals, policy makers, donor agencies, all of whom have interest in HIV/AIDS related issues around the world. This article was published to inform clinicians, researchers, academicians, healthcare professionals as well as organizations involved in the care/treatment of PLWHAs & HIV/AIDS programming globally. The article is very relevant to HIV/AIDS researchers for further research, to clinicians and health care professionals for accurate diagnosis and effective treatment, to academicians for teaching and to donor organizations for decision regarding improved funding and better program planning /implementations.
Objectivity
The article in focus is very objective. The research design is highly standardized, and meticulously conducted following the rigors associated a hospital based study. The objective which very was clear was achieved as evidenced from the findings of the research work. The references cited were current and appropriate, these were also well acknowledged. The sample population as stated was HIV positive adults who are 18 years and above, attending regular clinic appointments at the Hospital of study. Exclusion criteria were also documented appropriately, thus, the study can be generalized for other PLWHAs attending clinic elsewhere and can be repeated following the clearly laid down methodology as used in this index study.
Stability
Journal of Acquired Immune Deficiency Syndromes (JAIDS) is trusted peer-review journal of high repute, being the source of this article confers considerable stability to the work. The information can be used for decision making in the following settings amongst others: clinical management of HIV/AIDS cases, program planning for HIV/AIDS activities, allocation of funds for HIV/AIDS programs etc. It can also be used by academicians for teaching and researchers for further research reference.
Analysis of graph/Chart/Table
Table 1:Baseline characteristics of the study population (n=310) The social-demographic characteristics, cardiovascular risk factors, the laboratory
parameters and the drug regimen of the patients were clearly presented. The information presented are needful, unambiguous, well organized and easily assessable.
Figure 1: Patient study disposition This is a clear schematic presentation of the patients’ disposition as regards prior
hypertension, isolated office hypertension, ABPM hypertension and normal blood pressure. The figure is relevant giving the actual figures for ease of comprehension by the reader.
Table 2: Prevalence of different hypertension definitions The table is very relevant, presenting the prevalence of the different hypertension
definitions in a clear and concise outline, aiding the reader to appreciate the result. Table 3: Clinical characteristics of hypertensive and normotensive patients
69

Texila International Journal of Public Health Volume 5, Issue 1, Mar 2017�
This is an important table that helps a reader to compare the clinical characteristics of the hypertensive and normotensive HIV infected patients. It is clearly documented and easy to comprehend.
Table 4: Adjusted odds ratio of factors associated with hypertension Table 4 is relevant in understanding the factors associated with hypertension which is one
of the objectives of the study. It’s unambiguous and very well presented, distinguishing the univariate and multivariate analysis of these factors.
Conclusion
This review of the article ‘Hypertension and Isolated Office Hypertension in HIV-Infected Patients Determined by Ambulatory Blood Pressure Monitoring: Prevalence and Risk Factors’ has appraised and critiqued the content & structure of the work as well as evaluated the merits and weaknesses of the study. Largely, the article is an objective, credible and relevant scholarly piece which has contributed significantly to the body of knowledge in this important field of HIV/AIDS. Hypertension with its attendant cardiovascular morbidities/mortalities expected in the rising aging population of HIV infected patients underscores the importance and timely nature of this work. There is the need to have accurate data so that an informed evidenced based intermediation can be introduced to reduce the mortality and morbidity associated with hypertension among this population of PLWHAs. This study will be of immense importance to clinicians who are managing HIV/AIDS cases as there is need to accurately diagnose hypertension among this group as well as associated risk factors for proper. Furthermore, donor agencies sponsoring HIV/AIDS programs will benefit from the work for informed decision on funding of the activities and programming. Researchers and academicians are not left out as the information will be beneficial for teaching and further research. The article is current, accessible and relevant for clinical services, further research, academic purposes and policy decision making in HIV/AIDS programs.
Recent advances related to the topic
The SpaceLabs 90207 ambulatory monitor was used for this study. It is a standard and validated Ambulatory Blood Pressure monitor recommended by British Hypertension Society (BHS) and Association for the Advancement of Medical Instrumentation (O’Brien et.al, 2001). This device is used to measure peripheral blood pressure but not able to measure central blood pressure (pressure in the aorta).
According to Uscom (2014), Central blood pressure is the pressure in the aorta, the large artery that receives blood directly from the heart. It has become of increased health importance having been shown to relate to vascular disease and outcome more than traditional upper arm (peripheral) blood pressure (Roman et.al, 2009). The central blood pressure can distinguish between the effects of various hypertension drugs where peripheral blood pressure and pulse wave velocity do not (Boutouyrie et.al, 2010).Central blood pressure is that pressure that the heart must overcome to pump blood to all parts of the body. The higher the central blood pressures, the harder the heart must work to pump blood to the rest of the body and this can cause the heart to fail over time (Avolio, 2008).
Previously, Central blood pressure can be measured only directly using a pressure sensor or catheter inserted into the aorta which is invasive and can cause serious complications.
However, advances in medical sciences have led to discovery of non-invasive way of measuring CBP which is by tonometric and the more recent oscillometric techniques. This later technique is growing in popularity and do not have the challenge of calibration & operator dependency as encountered in tonometric technique (Black, 2015).
The recent advance in the ambulatory blood pressure measurement is that new devices has been developed which can now measure the ambulatory blood pressure (peripheral blood pressure) and at the same time measure the central blood pressure non-invasively. This is the case with - SunTech Medical and AtCor Medical who have been given clearance from the
70

Texila International Journal of Public Health Volume 5, Issue 1, Mar 2017�
United States Food and Drug Administration for U.S. distribution of their jointly developed Oscar 2 ambulatory blood pressure monitor (ABPM) with SphygmoCor Inside, a device that provides noninvasive measures of central arterial pressure waveforms, central aortic blood pressures and arterial stiffness indices, in addition to the highly-accurate data associated with a 24-hour ABPM measurement.
Source: Bernardino Jose Ignacio et, al, 2011, ‘Hypertension and Isolated Office Hypertension in HIV-Infected Patients Determined By Ambulatory Blood Pressure Monitoring: Prevalence and Risk Factors’, JAIDS: Journal of Acquired Immune Deficiency Syndromes, 1 September 2011 - Volume 58 - Issue 1 - pp 54-59doi: 10.1097/QAI.0b013e3182267406.
References
[1]. Avolio A. (2008). Central Aortic Blood Pressure and Cardiovascular Risk: A Paradigm Shift? Hypertension, (51), pp. 1470-1471. [2]. Baekken M, Os I, Sandvik L, Oektedalen O. (2008). Hypertension in an urban HIV-positive population compared with the general population: influence of combination antiretroviral therapy. Journal of Hypertension.26(11):2126-33. doi: 10.1097/HJH.0b013e32830ef5fb [3]. Bavinger C, Bendavid E, Niehaus K, Olshen R.A, Olkin I, Sundaram V, Wein N, Holodniy M, Hou N, Owens D.K. and Desai M. (2013). Risk of Cardiovascular Disease from Antiretroviral Therapy for HIV: A Systematic Review; 8(3): e59551. doi: 10.1371/journal.pone.0059551 [4]. Bergersen B. M, Sandvik L, Dunlop O, Birkel and K, Bruun J.N. (2003). Prevalence of Hypertension in HIV-Positive Patients on Highly Active Retroviral Therapy (HAART) Compared with HAART-Naïve and HIV-Negative Controls: Results from a Norwegian Study of 721 Patients. European Journal of Clinical Microbiology and Infectious Diseases. 12(22): pp731-736. Retrieved from http://link.springer.com/article/10.1007/s10096-003-1034-z [5]. Black H.R, Townsend R.R. (2015). Central blood pressure measurement: any added value? Medscape cardiology, retrieved from http://www.medscape.com/viewarticle/843552#vp1 [6]. Boutouyrie P, Achouba A, Trunet P, Laurent S. (2010). Amlodipine-Valsartan Combination Decreases Central Systolic Blood Pressure More Effectively Than the Amlodipine-Atenolol Combination: The EXPLOR Study. Hypertension, (55), pp. 1314-1322. [7]. Carmine G, Raffaele B, Adriana G, Stefano G, Pietro F, Paolo S, Gaetano F. (2003). Hypertension among HIV patients: prevalence and relationships to insulin resistance and metabolic syndrome. Journal of Hypertension: 7 (21): pp 1377-1388. Retrieved from: http://journals.lww.com/jhypertension/Abstract/2003/07000/ [8]. Irish heart foundation. http://www.irishheart.ie/iopen24/ambulatory-blood-pressure-monitoring-t-7_19_1357.html [9]. O’Brien E, Mee F, Atkins N, O’Malley K. (1991) Accuracy of the spacelabs 90207 determined by the British Hypertension Society Protocol. Journal of hypertension.9 (5), pp s25-s31. Retrieved from http://www.eoinobrien.org/wp-content/uploads/2008/08/x.Accuracy-of-the-Spacelabs-90207-determined-by-the-Brit.Hyp_.Soc_.protocol-J.of-Hyp.19911.pdf [10]. O'Brien E, Waeber B, Parati G, Staessen J, & Myers M.G. (2001). Blood pressure measuring devices: recommendations of the European Society of Hypertension. 322 (7285): 531- 536. Retrieved from http://www.ncbi.nlm.nih.gov/pmc/articles/PMC1119736/ [11]. Roman M.J, Devereux R.B, Kizer J.R, Okin P.M, Lee E.T, Wang W, Umans J.G, Calhoun D. and Howard B.V. (2009). High Central Pulse Pressure Is Independently Associated With Adverse Cardiovascular Outcome: The Strong Heart Study. Journal of American College of Cardiologist, (54), pp. 1730-1734. [12]. Saves M, Chene G, Ducimetiere P.(2003). Risk factors for coronary heart disease in patients treated for human immunodeficiency virus infection compared with the general population. Journal of Clinical Infectious Diseases. (37): pp292-298. Retrieved from: cid.oxfordjournals.org/content/37/2/292 [13]. SunTech Medical and AtCor Medical (2015).Retrieved from http://www.suntechmed.com/about-suntech/new
71

Texila International Journal of Public Health Volume 5, Issue 1, Mar 2017�
[14]. Trudel X, Milot A, Brisson C. (2013) Persistence and Progression of Masked Hypertension: A 5-Year Prospective Study.International Journal of Hypertension. Volume 2013, pp 1-7, doi.org/10.1155/2013/836387 Uscom (2014). The measure of life. Retrieved from http://www.uscom.com.au/education/central-blood-pressure.html
72

Texila International Journal of Public Health Volume 5, Issue 1, Mar 2017
Perception of Parents on Adolescents’ use of Contraceptives in Igbogbo District in Ikorodu Local Government, Lagos State, Nigeria
Article by Aremu Bukola Janet Master of Public Health, Texila American University, Guyana
E-mail: [email protected]
Abstract
Problem: Adolescent reproductive health has become a major public health concern as the number one killer of adolescent girls worldwide is unwanted pregnancy and childbirth-related deaths. The adolescence period is characterized by the inclination towards risky behaviors. Among these risky behaviors is unprotected sexual intercourse that can lead to unwanted pregnancy and infections from HIV and other sexually transmitted diseases, STDs.
Objective: The purpose of this study is to determine the perception of parents on adolescents’ use of contraceptives in Igbogbo district in Ikorodu Local Government of Lagos State, in Southwest Nigeria.
Method: A multi-stage sampling technique was employed to select 120 secondary school students, the parents of the selected students were given a self developed questionnaire that has already been validated and tested for reliability to fill and return and out of 120 questionnaires only 110 was properly filled and returned. A descriptive analysis was used to describe the data generated and out of the respondents.
Outcome: The findings from this study showed that 74 (67.3%) of the respondents were females and 36 (32.7) were males. It was deduced from this study that parents are aware of adolescent engagement in sexual relations, have a fair knowledge on modern forms of contraceptives, communicate well with their children but have a low perception on adolescents’ use of contraceptives. The findings from this study did not show any association between parents’ socio-demographic characteristics and their perception. This study revealed the fear of serious side effects, promiscuity tendency, cultural beliefs and religion beliefs as the major factors that might have contributed to this low perception. This study also showed that parents want adolescents to abstain from any form of sexual relation but wants them to be educated on the uses and benefits of contraceptives. This study therefore concluded that parents should be educated on the types, uses, and benefits of contraceptives and be encouraged to pass the knowledge across to their children.
Introduction
Background
Adolescence can be described as a period between childhood and adulthood with the age range of 10 – 19 years. This period is not without its problems of inclination towards risky behaviors. Among these risky behaviors is unprotected sexual intercourse that can lead to unwanted pregnancy and infections from HIV and other sexually transmitted diseases, STDs (Gomes et al, 2006; Mestad et al. 2011).
Health risk behaviors among adolescents are very common. A study conducted by Heneghan et al, (2015) in U.S reported that 65% of teen are involved in at least one health-risk behavior. Adolescents face many sexual and reproductive health risks stemming from early, unprotected, and unwanted sexual activity (WHO, 2012). Key factors fundamental for this issue are lack of access to sexuality education, and to accessible, affordable, and appropriate contraception (WHO, 2012).
Adolescent sexual and reproductive health has become a major concern to public health. The number one killer of adolescent girls worldwide is unwanted pregnancy and childbirth-related deaths (UNICEF, 2002). The incidence of unsafe abortion among adolescents is 2.2-4 million per year
73

Texila International Journal of Public Health Volume 5, Issue 1, Mar 2017
(Olukoya, 2001). Also, 99% of all maternal deaths occur in the developing nations, Nigeria inclusive (Bale et al, 2003) and 74% of these deaths are preventable (Wagstaff and Claeson, 2004).
Globally 34 million people were living with HIV at the end of 2011 with an estimated 0.8% of adults aged 15-49 years (UNAIDS, 2012). According to UNAIDS (2014), about 40% of new HIV infections are among those under age 25. In 2010, youth accounted for estimated 26% of all new HIV infections in the United States (CDC 2015). In Nigeria, according to the 2008 National Seroprevalence, infection rates among young people aged 15-19 was put at 3.3% (UNFPA, 2010).
There has been an increase in the levels of premarital sexual activity among Nigerian adolescents (Fatusi and Blum, 2008; NPC and ORC, 2004; NPC and ICF 2009). Abstinence from sex is the most efficient way of preventing pregnancy and sexual transmitted diseases but for sexually active adolescents this might be impossible to achieve. Many efforts are been made to improve the availability and access to reproductive health by the adolescents and among these efforts is the introduction of contraceptives to this age group. The level of usage of contraceptives is still low among this age group (Ikeme et al., 2005; Orji and Esimai, 2005) with resultant increase in the incidence of unwanted pregnancies, risky abortions, HIV and other sexually transmitted diseases, STDs (Bankole et al., 2006; FMOH, 2009)..
Many factors have been recognized to act as barriers to the use of contraceptives and other reproductive health services by adolescents; among them are the cultural belief and the influence of parents. A study conducted in Bolivia identified the feeling of shame, anxiety, guilt and fear of being punished by family as psychological barrier to the uptake of reproductive health services by teenagers (Belmonte et al., 2000). Also, Lebese et al (2013) reported cultural taboos as a major obstacle to the use of contraceptive by the adolescents.
The perception of parents is very important in motivating adolescents towards the use of contraceptives and in improving their sexual and reproductive health. According to the result of a study conducted in Kenya, one of the main perceived barriers to use of contraceptive by adolescents is the parental approval (Kinaro, 2013). Parental influence and communication have been found to positively influence adolescents’ decision making on sexuality and contraception (Aspy et al., 2007; Lagana, 1999). Parents have significant role to play in reducing sexual risk behaviors and promoting healthy adolescent sexual development. One way that parents can successfully carry out this duty is by communicating with their adolescents about sexual behaviors and decision-making (Martino et al., 2008). This is also supported by Jaccard and Dittus (2000) who stated that maternal approval is very important in contraceptive use by adolescents; however, this finding was correlated with increased incidence of sexual activity. A study conducted in the Rivers State of Nigeria reported that a greater proportion of parents did not favor the use of contraceptives by sexually active adolescents (Briggs, 1998). Biddlecom, et al (2009), in their own research concluded that programs to improve adolescent sexual and reproductive health should include different levels of parental involvement.
There is dearth of literature to ascertain the opinion of parents concerning contraception by adolescents in Lagos State, one of the most populous states in Nigeria therefore, the purpose for this study is find out the perception of parents on adolescents’ use of contraceptives.
Statement of problem
According to Commendador (2010), adolescence is a period of transition that involves biological, cognitive, psychological, social, physical changes with an increasing interest in sex. Dangal (2006) reported that approximately one-fourth of adolescents have testified to have intercourse prior to the age 15. Although there are several safe and effective contraceptives available, adolescents’ pregnancy is still on the increase (Commendador, 2010).
Abstinence as the only method of contraception has not been in all successful. Kirby (2008) reported that abstinence programs do not work. This is also supported by Santelli et al. (2006) who stated that although abstinence from sexual intercourse is a healthy choice for adolescents, “abstinence only” as a single option is flawed and according to many adolescents are very sexually
74

Texila International Journal of Public Health Volume 5, Issue 1, Mar 2017
active and the use of contraceptives is still a very important part of the national efforts to reduce adolescents’ pregnancy.
Several studies have been conducted in some parts of the world to find out factors that can influence adolescents’ sexual activity, decision making and contraceptives use (Brown, 2000; Belsky et al., 1991; Brooks-Gunn and Furstenberg, 1989). Also, some studies have Commendatory (2010), been carried out here in Nigeria with respect to adolescents’ sexual and reproductive health ( Oyediran et al., 2013; Atere et al., 2010; Omobude-Idiado and Bazuaye, 2009; Oye-Adeniran et al., 2006; Briggs, 1998) but among all these studies, only few were narrowed down to really find out the perception of parents on adolescents’ use of contraceptives, and none in Igbogbo local council area of Lagos state in Nigeria, thus the impetus for this study.
This research answered the following questions;
1. What is the socio-demographic of the parents of some selected adolescents? 2. Do parents have knowledge about adolescents’ sexual behavior and contraceptives? 3. What is the level of communication and relationship between parents and their children? 4. What is the perception of parents on adolescents’ use of contraceptives? 5. What is the association between parents’ socio-demographic variables and perception on
adolescents’ use of contraceptives?
The objectives of the study
1. To determine the socio-demographic of the parents of some selected adolescents 2. To determine the knowledge of parents on adolescents’ sexual behavior and forms
contraceptives 3. To determine the level of communication and relationship between parents and their children 4. To determine the perception of parents on adolescents’ use of contraceptives 5. To determine the association between parents’ socio-demographic variables and perception
on adolescents’ use of contraceptives.
The limitation of the study
Some questionnaires were not returned and some not properly completed.
Definition of terms
Adolescents: these are young people between the ages of 10 and 19 years. Contraceptives: these are methods used to prevent pregnancy and condom as a form of
contraceptive has the ability of preventing sexually transmitted diseases. Perceptions: this is the opinion someone has towards to a thing.
Literature review
Adolescent development and risky behaviors
Adolescence is a period between childhood and adulthood with age range of 10-19, nearly half of the world's population that is, about 6.2 billion people comprises the adolescents and young people and 85% of these group of people are from developing countries (WHO, 2004). This period is characterized by secondary sexual growth, changes in hormonal secretion, emotional, cognitive and psychosocial development and engagement in risky behaviors e.g. sexual relations, substance use and abuse, intentional and unintentional injuries etc.( WHO 2015). These biological and psychological changes can lead to awareness of sexuality and tendency to demand for autonomy in this critical period (Connel, 1990.)
Adolescent sexual behavior
Adolescents can experience sexual feelings at one point or the other, some can react to these feelings by engaging in sexual intercourse; some don’t have intercourse but can have anal intercourse
75

Texila International Journal of Public Health Volume 5, Issue 1, Mar 2017
or oral sex (Remez, 2000). Some deny their sexual feelings by engaging intensely in non-sexual pursuits; other adolescents are able to have socially acceptable intercourse through early, sometimes pre-arranged, marriages (WHO, 2004).
According to Alan Guttmacheer Institute, (1998), 8 out of 10 young women in sub-Saharan Africa have had their first sexual intercourse before the age of 20 and 4 out 10 before marriage; 8 out 10 young women in five developed countries have engaged in intercourse as adolescents and 7 out of 10 had theirs before marriage and lastly 6 out of 10 young women in Latin America and the Caribbean have had sex in adolescence and 3 out of 10 before marriage.
A study conducted in Nigeria with a sample size of 690 and 814 male and female students respectively showed that 398 (57.7%) and 216 (26.5%) male and female students respectively were sexually active as at the time of the study and also that 68 (17.0%) of the male students had their first sexual intercourse at 9 years while 131 (33%) had their first intercourse at 10-14 years, and 147 (37%) at 15-18 years. For the female students, 119 (55.1%) had their first sexual intercourse between ages 15-18 years and while only about 61 (28.5%) had their first sexual intercourse at less than 15 years (Idonije et al, 2011). Odimegwu et al (2002) reported in their study among Nigeria adolescent, that adolescents with low parental income were more sexually active than those who reported high or medium parental income.
Consequences of adolescent sexual behavior
Unwanted pregnancy
Adolescent pregnancies may be accompanied by increased levels of mortality and morbidity, which may be as a result of less antenatal care and delayed intrapartum care due to stigma attached to adolescent pregnancy, and also obstructed and prolonged labor (Alan Guttmacher Institute, 1998; Anandlakshmy & Buckshee, 1993), studies have shown that babies of adolescent mothers are more likely to be born prematurely and have a low birth weight (International Planned Parenthood Federation, 1994; Alan Guttmacher Institute, 2002b; Anandalakshmy & Buckshee, 1993).
Unsafe abortion
Though safe legal abortion may be available in some parts of the world especially in the developed countries rarely, unsafe abortion is common in areas where abortion is illegal especially in developing countries and happened to be more dangerous for adolescents as they tend to seek abortion through crude methods and very late in pregnancy (International Planned Parenthood Federation, 1994). Unsafe abortion accounts for 13% of maternal death globally with the incidence of 2.2-4 million per year (Olukoya et al., 2001). A study conducted by Aderibigbe et al (2001) reported 100% abortion prevalence among the sampled Nigerian adolescents and that all abortion were induced and carried out by unqualified personnel.
HIV and other sexually transmitted diseases
According to WHO, (2004) one out of 20 adolescents and young people contract an STI each year. Factors that may prevent adolescents from getting help for STDs include inability to know that they contracted STIs, stigma involved in seeking for help and lack of access to treatment Late-treated or untreated STIs can potentially hinder the adolescent’s long-term health and fertility (WHO, 2004).
Globally 34 million people were living with HIV at the end of 2011 with an estimated 0.8% of adults aged 15-49 years (UNAIDS, 2012). According to UNAIDS (2014), about 40% of new HIV infections are among those under age 25. In 2010, youth accounted for estimated 26% of all new HIV infections in the United States (CDC 2015). In Nigeria, according to the 2008 National Seroprevalence, infection rates among young people aged 15-19 was put at 3.3% (UNFPA, 2010).
76

Texila International Journal of Public Health Volume 5, Issue 1, Mar 2017
Contraceptives knowledge and use among adolescents
Though abstinence from any form of sexual activities may be seen as the most efficient way of preventing pregnancy and sexual transmitted diseases, but achieving this with sexually active adolescents might proved difficult. Many efforts are been made to improve the availability and access to reproductive health by the adolescents and among these efforts is the introduction of contraceptives to this age group. The level of usage of contraceptives is still low among this age group (Ikeme et al., 2005; Orji and Esimai, 2005).
A study conducted in three Bolivian cities deduced that Knowledge about contraception is often incomplete and/or incorrect, and this does not automatically resulted in contraceptive use among those who are sexually active. It also reported that 71 percent of respondents said they were likely to use a method and less than half of those who had had sexual relations used any method to prevent pregnancy or STDs. The method used was primarily the condom, with 44 percent of all those who had had sexual relations have used a condom at one time or more (Belmonte et al, 2000).
Idonije et. al (2011), reported in the study conducted in Nigeria that 292 (42.3%) and 492 (60%) males and females respectively had good knowledge of contraception while 206 (29.9%) and 122 (15%) males and females had no knowledge of contraception; parents (25.5%), friends (17%), books and magazines (16.2%) and internet (10.7%) were the main sources of information about sex and contraception; condom was the major available contraceptive for the males while Andrew liver salt (29%), oral pills (10.3%), 7 Up (7.4%) were the used by the females and that about 40% of the total sampled population believed contraception is not safe.
Types of contraceptives
Dual protection and dual method
Two approaches (other than abstinence) exist to simultaneously protect against pregnancy and STIs. One is the use of condoms only to provide “dual protection” i.e. against STIs and pregnancy. However to ensure maximum contraceptive efficacy, condom use also requires a willingness and ability to use emergency contraception in the event of condom slippage, breakage or failure to use. The second method is the practice of “dual method use”, which involves always using a condom with another method that has a lower contraceptive typical-use failure rate (WHO, 2004).
Barrier method
Substances use in barrier method include spermicidal foams, jellies, creams, films and suppositories; male condom; female condom; diaphragm; contraceptive sponge, and cervical cap. All these are generally available over the counter except diaphragm and cervical cap. These methods prevent pregnancy through the provision of a physical and/ or chemical barrier to sperm (WHO, 2004). The major disadvantages are comfort of use, allergic reactions and incorrect use of this method.
Oral contraceptives
These are birth control medications or pills taken by mouth. They are taken once daily and are widely available. They can be in the form of combined oral pills containing both estrogen and progestin and the progestin-only pills. Failure rate of this method is as high as 15 pregnancies per 100 adolescents and this rate has been linked with errors in pill taking (Kaunitz, 1992). Side effects may include nausea, dizziness, mild headache, breast tenderness, mood changes and breakthrough bleeding may occur in some cases. As with adults, adolescents must be counseled about possible side-effects before initiating use and reassurance should be given that these side-effects usually settle within the first three months of use (WHO, 2002). A population-based study shows no statistically significant increase in weight gain among a population of women using oral contraceptives (Coney et al., 2000).
77

Texila International Journal of Public Health Volume 5, Issue 1, Mar 2017
Injectables
This is progestin-containing injection given in the arm or buttock every 3 months for birth control. The side effects of this method may include irregular, unpredictable, prolonged or heavy bleeding or spotting, breast tenderness, headaches, dizziness, hirsutism, hair loss, nervousness, acne and weight gain (WHO, 2004).
Implants
These are small rods put under the skin the arm and they release slowly progesterone hormone into the body. They are two types available Levonorgestrel implants (Norplant® and Jadelle®) and Etonogestrel implant (Implanon®). The high contraceptive effectiveness, its duration, and easy compliance are important advantages for adolescents who desire long-term contraception (WHO, 2004). The side effects of this method include nausea, dizziness, change in appetite with subsequent weight gain or loss, hair growth or loss, oiliness of the skin, acne, headaches and menstrual irregularities (WHO, 2004).
Intrauterine devices (IUDs)
These are small T-shaped plastic devices that are inserted into the uterus. There are two major types; the hormonal IUDs and the copper IUDs. The most important side-effects experienced with copper-bearing IUD use are increased menstrual bleeding, pain and pelvis inflammatory disease (PID). The risk of PID among women who are appropriate candidates for IUD use is about 1 case per 1000 users (WHO, 2004).
Natural family planning
This is a method of birth control that is approved by the Roman Catholic Church and it involves the use of ovulation cycles. This method involve recognition of the fertile days of the cycle by observing fertility signs such as cervical secretions and/or basal body temperature (Ott et al., 2002; Santelli et al., 1998) or by clinging to a set number of abstinent days (“Standard Days Method” or “Fixed Formula Method”) (Arevalo et al., 2000) during each menstrual cycle.
Withdrawal method
This method involves the removal of the male genital from the female vagina before ejaculation. Withdrawal requires a high degree of motivation and discipline, which may be quite difficult for a young adolescent couple and it is the mostly frequently-used method by adolescent couples (WHO, 2004).
Emergency contraceptives
This method is also referred to as ‘morning-after pill’. Pills that can prevent ovulation and fertilization are used immediately after unprotected copulation; also IUDs can be used. Copper-bearing IUDs are the most effective form of emergency contraception and when put in place within five days of unprotected copulation, 99% of expected pregnancies are prevented (Glasier, 1997). Nausea and vomiting are frequent side-effects of this method, especially with oral pills regimen (WHO, 2004).
Barriers to adolescent use of contraceptives
A number of factors have been found to affect the use, non-use, and the correct and consistent use of contraceptive methods by adolescents and amongst these factors are personal, social and cultural factors in the environment. The result of a study conducted in Kenya showed that the main perceptions associated with contraceptive use are parental approval, opinion of adolescents, ability to get a method for self and discussion with sexual partner (Kimoru, 2013). Lebese et al (2013) reported cultural taboos as a major obstacle to the use of contraceptive by the adolescents and maternal
78

Texila International Journal of Public Health Volume 5, Issue 1, Mar 2017
approval for contraception resulted in higher use of contraceptives by adolescents (Jaccard and Dittus, 2000).
Parental perception on adolescents’ use of contraceptives
Parental approval especially maternal approval for contraception has been linked to higher use of contraceptives by adolescents (Jaccard and Dittus, 2000). The result of the study conducted by Ankomah et al (2011) in Nigeria suggested that participants in their study felt that parents could have either negative or positive influence on the sexual activity of their children. A study conducted in the Rivers State of Nigeria reported that a greater proportion of parents did not favor the use of contraceptives by sexually active adolescents (Briggs, 1998) and this also supported by Oyediran et al. (2013) that reported parents had negative attitude towards provision of contraceptives to the adolescents. Biddlecom, et al (2009), in their own research concluded that programs to improve adolescent sexual and reproductive health should include different levels of parental involvement.
Communication between parents and children
Adolescents often get themselves involved in risky sexual behaviors with resultant adverse health outcome like unintended pregnancy and sexually transmitted diseases. Parent-adolescent communication is very vital since sexual activities begin at early age for many adolescents (Jaccard et al., 2002). Rates of sexual initiation during young adulthood are on the increase in many developing countries, and high HIV prevalence adds to the risks connected with early sexual activity (WHO, 2009). Parents have significant role to play in reducing sexual risk behaviors and promoting healthy adolescent sexual development. One way that parents can successfully carry out this duty is by communicating with their adolescents about sexual behaviors and decision-making (Martino et al., 2008).
Methodology
Participants
The participants for this study were parents of pupils in SS1 – SS3 classes of the secondary schools that were randomly selected.
Instrument
The instrument for this study was a semi-structured questionnaire that was designed by the researcher and it was divided into four parts. Part 1 was used to gather information about the socio-demographic of the participants, part 2 was used to collect information about the knowledge/awareness of the participants on adolescents’ sexual behavior and contraceptives, part 3 was used to retrieve information about the relationship and communication between parents and their wards and lastly part 4 was used gather information on the perception of parents on the adolescents’ use of contraceptives. The questionnaire went through face-validity by professionals in the field of psychology and reproductive health and test- retest reliability was also done by administering the questionnaire to 10 parents and after 2 weeks, the same questionnaire was re-administered to the same parents and the reliability was calculated to be 0.77.
Study site
The study site for this study was Igbogbo district in Ikorodu Local Government Area of Lagos State in the South-Western part of Nigeria. It is considered to be outside Lagos Metropolis, it is within Ikorodu which is situated in the South East of Lagos State and shares border with Ogun State in Nigeria. The people’s major language is Yoruba and they engage themselves majorly white collar jobs, trading and some in farming. There are five public secondary schools in this location.
79

Texila International Journal of Public Health Volume 5, Issue 1, Mar 2017
Sample size
The minimum sample size was calculated using the Leslie and Kish formula for descriptive studies
N = P (1-P) Z2/D2 Where N is the minimum sample size needed D is the level of error that can be tolerated (0.05 chance of error) P is the estimated prevalence rate (0.93) of parents’ knowledge on contraceptives Z is the standard variate corresponding to confidence level. At confidence level of 95%, Z=
1.96 N = 0.93(1-0.93) 1.962/0.052 N= 100 To allow for a non-response rate of 10% (10 respondents), the sample size was 120
Sampling method
A multi-stage Sampling method was employed to select participants for this study. Three secondary schools were randomly selected out of the five public secondary schools and 20 pupils in SS1-SS3 were randomly selected from each class in the 3 schools making a total of 120 students. Ethical approval was sought and obtained and, parents of the selected pupils in SS1-SS3 of the selected schools were contacted, their informed consents were obtained and the questionnaires were given to them for completion.
Data analysis
The data collected in this study were analyzed using SPSS version 22. Descriptive analysis in the form of frequencies, percentages, and bar charts were used to describe the data and also chi-square was used to find the association between variables.
Results
Socio-demographic characteristics of participants
Table 1. Percentage distribution of the socio-demographics of the participants
Sex Frequency (n) Percentage%
Female 74 67.3
Male 36 22.7
Total 110 100
Age group
20-29 6 5.5
30-39 37 33.6
40-49 54 49.1
50 & above 13 11.8
Total 110 100
80

Texila International Journal of Public Health Volume 5, Issue 1, Mar 2017
Educational level
Primary 7 6.4
Secondary 26 23.6
Tertiary 77 70.0
Total 110 100
Religion
Christianity 89 80.9
Islam 21 19.1
Traditional 0 0.0
Total 110 10
Marital status
Married 92 83.6
Separated 6 5.5
Single parent
3 2.7
Widowed 9 8.2
Total 110 100
One hundred and twenty (120) questionnaires were given out for completion out of these only 110 (91.7%) participants properly filled and returned their questionnaires. Out of these participants, 74 (67.3%) were females, 36 (32.7%) were males, 6 (5.5%) were within the age range of 20-29, 37 (33.6%) fell within 30-39, 54 (49.1%) within 40-49 and 13 (11.8%) were 50 years and above. Seven (6.4%) had only primary education, 26 (23.6%) had only up to secondary education and 77 (70.0%) had tertiary education. Eighty-nine (80.9%) practiced Christianity, 21 (19.1%) practiced Islam and none of participants was a traditionalist. Ninety-two (83.6%) were married, 6 (5.5%) separated, 3 (2.7%) were single parents and 9 (8.2%) widowed (Table 1).
Knowledge/awareness of parents on adolescents’ sexual behavior
Table2. Percentage distribution of parents’ knowledge/ awareness on adolescents’ sexual behavior
Frequency (n) percentage%
Adolescents engage in sexual relations:
YES 99 90.0
NO 11 10.0
81

Texila International Journal of Public Health Volume 5, Issue 1, Mar 2017
Can be influenced by peers and other sources:
YES 104 94.5
NO 6 5.5
Adolescents can contract HIV & STDs:
YES 102 92.7
NO 8 7.3
Contraceptives can prevent pregnancy & STDS:
YES 63 57.3
NO 47 42.7
Ninety-nine (90.0%) of the parents said that they believed that adolescents engage in sexual relations while 11(10.0%) said that they don’t believed that adolescents engage in sexual relations. One-hundred and four (94.5%) said that adolescents sexual behavior can be influenced by peers and information from different sources, 102 (92.7%) knew that adolescents are at risk of contracting HIV and other sexually transmitted diseases (STDs) and 63 (57.3%) said that contraceptives can prevent unwanted pregnancies, HIVs and STDs in adolescents (Table 2).
Knowledge on the forms of contraceptives
Table3. Percentage distribution of parents’ knowledge on the forms of contraceptives
Forms of Contraceptives Frequency (n) percentages%
Condoms 85 77.3
Pills 42 38.2
Injections 44 40.0
Withdrawal method 53 48.2
IUDs 20 18.2
Calendar method 35 31.8
Others 14 12.7
Eighty-three (77.3%) parents said they know condom as a form of contraceptives, 42 (38.2) knew about pills, 44 (40.0) knew about injectable contraceptives, 53 (48.2) knew about withdrawal method, only 20 (18.2) knew about IUDs, 35 (31.8) have knowledge about calendar method and 14 parents (12.7) knew some other forms of contraceptives e.g. implants and abstinence (Table 3).
82

Texila International Journal of Public Health Volume 5, Issue 1, Mar 2017
Communication/relationship between parents and children
Table 4. Percentage distribution of parents’ level communication with their children
Frequency (n) percentage %
General discussions with children YES 103 93.6
NO 7 6.4
Sex education YES 84 76.4
NO 26 23.6
Freedom of children to discuss challenges
YES 103 93.6
NO 7 6.4
One-hundred and three parents (93.6%) said that they discuss general issues with their children, 84 (76.4) said they give sex education to their children at home and 103 (93.6%) said that their children are free to discuss the challenges they are facing with them (Table 4).
Perception on adolescents’ use of contraceptives
Ninety-six parents out of 110 participants (87.3%) said that the use of contraceptives by adolescents can lead to promiscuity while 8 (10.8%) females and 6 (16.7%) males affirmed that contraceptives usage by adolescents cannot make them become promiscuous. Eighty-two parents (74.5%) said their religions do not allow adolescents to make use of contraceptives while only 18 (24.3%) females and 10 (27.8%) males said that their religions do not have anything against adolescents’ use of contraceptives. Eighty-one parents (73.6%) affirmed that Nigeria culture disapproves of adolescents’ use of contraceptives while 20 (27.0%) females and 9 (25.0%) males said that the culture in Nigeria is not against adolescents’ use of contraceptives. One-hundred and one parents (91.6%) support abstinence from any form of sexual relations by the adolescents but 8 (7.3%) females and 1(2.8%) male said there is no need for adolescents to abstain from sexual relations. Eighty (72.7%) parents said education on the use and benefits of contraceptives should be given to the adolescents while 16 (20.2%) females and 15 (41.7%) males said adolescents should not be educated on the use and benefits of contraceptives. Ninety-three (86.3%) parents believed that contraceptives may have serious side effects in the future while 12 (16.2%) females and 3 (8.3%) males said that contraceptives will not have side effects (Figure 1).
83

Texila International Journal of Public Health Volume 5, Issue 1, Mar 2017
Figure1. Gender distribution of Perception of Parents on Adolescents’ Use of Contraceptives
Association between socio-demographic characteristics of parents and perception
There is no association between parents’ socio-demographic characteristics and perception on adolescents’ use of contraceptives (p-value>0.05). That is the perception of parents is not affected by the parents gender, age, religion, level of education and marital status (Table 5).
84

Tex
ila
Inte
rnat
iona
l Jou
rnal
of
Pub
lic
Hea
lth
Vol
ume
5, I
ssue
1, M
ar 2
017
Tab
le 5
. Ass
ocia
tion
betw
een
soci
o-de
mog
raph
ic v
aria
bles
of
pare
nts
and
perc
epti
on
P
rom
otes
p
rom
iscu
ity
Rel
igio
n d
oes
not
su
pp
ort
adol
esce
nt
use
of
con
trac
epti
ves
Cu
ltu
re p
roh
ibit
s ad
oles
cen
t u
se o
f co
ntr
acep
tive
s
Ad
oles
cen
ts
shou
ld
abst
ain
fr
om s
ex
Ed
uca
ted
on
co
ntr
acep
tive
sC
ontr
acep
tive
s h
ave
sid
e ef
fect
s
p
-val
ue
p-v
alu
e p
-val
ue
p-v
alu
e p
-val
ue
p-va
lue
Sex
0.
282
0.43
3 0.
507
0.14
1 0.
119
0.19
7
Age
0.
731
0.10
9 0.
132
0.37
1 0.
118
0.46
9
Ed
uca
tion
al
Lev
el
0.50
1 0.
742
0.15
2 0.
598
0.62
9 0.
497
Rel
igio
n
0.09
6 0.
255
0.49
7 0.
456
0.34
0 0.
413
Mar
ital
S
tatu
s 0.
187
0.93
8 0.
579
0.31
5 0.
446
0.78
0
p<
0.05
as
the
leve
l of
sign
ific
ance
85

Texila International Journal of Public Health Volume 5, Issue 1, Mar 2017
Discussion
Parents are key players in adolescent reproductive health and the roles of parents in delaying the age of sexual initiation and in the uptake of contraceptives have been well documented. This study therefore assesses the perception of parents on adolescents’ use of contraceptive. Findings from this study reveal that female parents, 67.3% participate more than the male parents. This might be due to the relationship that exists between mothers and their children because in the part of Nigeria where this study was conducted mothers are seen to be homemakers who are suppose to train their children and spend time with them and this finding is in tandem with the findings in the work of Oyediran et al. (2013) and Ladapo (2004) that had more female parents respondents in their studies. From this study it is deduced that majority of the parents, 49.1% fell within the age range of 40-49 and more than half of the respondents have tertiary education as their highest level of education which might be buttressed by the fact that majority of the people living in Igbogbo local government district of Lagos State in Nigeria engage themselves in white-collar jobs. Majority of the respondents, 80.9% and 83.6% are Christians and married respectively.
Findings from this study show that majority of the sampled parents are aware of adolescents’ engagement in sexual relations, have knowledge that adolescent sexual behaviors can be influenced by peers and information from different sources e.g. media, that they are at risk of contracting HIVs and other STDs and more than half of the respondents know that contraceptives can prevent pregnancy, HIVs and other STDs in adolescents. These findings might be as a result of several awareness programs on HIV and STDs in Nigeria. Also, these findings are supported by Olubusayo-Fatiregun (2012); Ojo et al. (2011) and Mturi (2003) but not in tandem with the report of Mollborn and Everett (2010) that reported that more than a half of their sampled parents reported inaccurately about their children sexual behaviors.
It can also be deduced from this study that parents of adolescent have a fair knowledge of modern forms of contraceptives; condom is the most common form of contraceptives known; intra-uterine devices (IUDs) is the least known and 12.7% of the parents know abstinence and implants as other forms of contraceptives. This is in line with Oyediran et al., 2013, who stated that more than half of the sampled parents in their study conducted in a state in Nigeria have good knowledge of contraception and also supported by Obisesan et al. (1998), who reported a good awareness of contraceptives by married women in a South-Western state in Nigeria and that condom is the most known form of contraceptives.
Good parent-child communication has been documented to be effective in shaping the stage of adolescence, improving adolescent reproductive health and the use of contraceptives by adolescents in Nigeria and other African countries (Onifade et al., 2013; Ojo et al., 2011; Biddlecom et al., 2009 Odimegwu et al., 2002). Majority of the parents in this study report to communicate well with their children on general issues, only about 23.6% do not give home-based sex education and majority report that their children are free to discuss challenges they are facing with them. This is not in line with the work of Briggs, 1998 that stated most of the sampled parents in the Eastern part of Nigeria do not usually discuss sexual issues with their children.
Parental perception on the use of contraceptives by adolescents can influence adolescents’ decisions in taking up the option of contraception in preventing unwanted pregnancies and in the prevention of HIVs and other sexually transmitted diseases. The findings from this study indicate a low perception by parents as regards the use of contraceptives by the adolescents and it is in accordance with the report of Briggs, (1998). The main factors contributing to this low perception include; the fear of serious side effects and promiscuity and also cultural and religion beliefs. Majority of the respondents in this study affirm that the use of contraceptives by adolescents can promote promiscuity and that their culture and religion do not support contraceptives usage by adolescents-. From this present study it is observed that majority of the parents believe that contraceptives can have serious side effects in future and advocate for total abstinence from any form of sexual relations by
86

Texila International Journal of Public Health Volume 5, Issue 1, Mar 2017
the adolescents but they want them to be educated on the uses and benefits of contraceptives. Lastly this study does on find any association between parents’ gender, age, marital status, educational level and religion and perception and this is supported by Omo-Aghoja et al. (2009) who also found no association between religion and perception of contraception in rural Southern Nigeria.
Conclusion
In conclusion, this study reveals a good knowledge on the part of the parents about adolescents’ sexual behavior, a fair knowledge on the modern forms of contraceptive and a good parent-children communication as reported by the parents. It reveals a low perception by parents on adolescents’ use of contraceptives resulting from the fear of serious side effects, promiscuity tendency, cultural beliefs and religion beliefs. It shows that parents want adolescents to abstain from any form of sexual relations but want them to be educated on the uses and benefits of contraceptives. Lastly this study shows no relationship between parents’ socio-demographics characteristics and their perception on the use of contraceptives by adolescents.
Recommendation
Adolescent reproductive health has become a major public health concern, therefore this study recommends an intervention in the form awareness and education program for the parents in Nigeria on the types, uses and benefits of contraceptives to allay them of the fear of side effects and other myths associated with the use of contraceptives in order to improve their perception and also to educate and motivate their children to take up the option of contraceptives.
Also, sex education should be included in the secondary school curriculum in Nigeria and also encouraged at homes. Teachers should be properly trained for this purpose and proper educational materials should be provided for both parents and teachers.
References
[1]. Aderibigbe, S.A., Araoye, M. A., Akande, M.T., Musa I O., Monehin, J. O., Babatunde, O.A (2011). Teenage Pregnancy And Prevalence of Abortion Among In-school Aolescents in North Central Nigeria. Asian Social Sciences, Vol.7, No1. [2]. Alan Guttmacher Institute, (1998). Into a New World – Young Women’s Sexual and Reproductive Lives. New York, 5–14, and 26–44. [3]. Alan Guttmacher Institute (2002). Facts in Brief. Teen Sex and Pregnancy, 1999. Accessed February 2002. [4]. Ankomah, A., Mamman-Daura, F., Omoregie G., Anyanti, J. (2011). Reasons for Delaying or Engaging in Early Sexual Initiation among Adolescents in Nigeria. Adolescent Health, Medicine and Therapeutics, Vol. 2: 75–84. [5]. Anandalakshmy, P.M., Buckshee, K. (1993). Teenage pregnancy and its effect on maternal and child health – A hospital experience. Indian J Medical Sciences, 47(1):8–11. A [6]. Arevalo, M., Sinai, I., Jennings, V. (2000). A fixed formula to define the fertile window of the menstrual cycle as the basis of a simple method of natural family planning. Contraception, Vol. 60:357–360. [7]. Atere, A.A., Wahab, E.O., Ajiboye, O.E., Shokoya, H.O., Akinwale, A.A., Oyenuga, A.J. (2010). Awareness of STIs and Contraceptives Use Among Out of School Youths in Nigeria. Ethno Med., Vol. 4 (2): 131-137. [8]. Aspy, C.B., Vesely, S.K., Oman, R.F., Rodines, S., Marshall, L., Mcleroy, K. (2009). Parental Communication and Youth Sexual Behavior. Journal of Adolescence, vol., 30(3), 449-460. [9]. Bale, J. R., Stoll, B.J., Lucas, A.O. (2003). Improving Birth Outcomes: Meeting the Challenge in the Developing World. Washington, DC: The National Academies Press. [10]. Bankole A, Oye-Adeniran BA, Singh S, Adewole IF, Wulf D, Sedgh G. et al. Unwanted pregnancy and induced abortion in Nigeria: causes and consequences. New York: Guttmacher Institute, 2006. [11]. Belmonte, L.R., Gutierrez, E.Z., Magnari, R., Lipovsek, V. (2000). Barriers to Adolescents’Use of Reproductive Health Services in Three Bolivian Cities. Washington D.C: FOCUS on Young Adults/Pathfinder International.
87

Texila International Journal of Public Health Volume 5, Issue 1, Mar 2017
[12]. Belsky, J., Steinberg, L., Draper, P. (1991). Childhood Experience, Interpersonal Development and Reproductive Strategies: An Evolutionary Theory of Socialization. Child Development, 64(4): 647-670. [13]. Berry, G. (2000). Multicultural Media Portrayals and Changing Demographic Landscape: the Psychosocial Impact of Television Representations on the Adolescent of Color. Journal of Adolescent Health, 27(2): 35-44. [14]. Biddlecom, A., Awusabo-Asare, K., Akinrinola, B. (2009). Role of Parents in Adolescent Sexual Activity and Contraceptive Use in Four African Countries. International Perceptives on Sexual and Reproductive Health, Vol. 35(2) [15]. Briggs, L.A. (1998). Parents’ Viewpoint on Reproductive Health and Contraceptive Practice among Sexually Active Adolescents in the Port Harcourt Local Government Area of Rivers State, Nigeria. Journal of Advanced Nursing, Vol. 27: 261-266. [16]. Brooks-Gunn, J., Furstenberg, F. (1989). Adolescent sexual Behavior. American psychologist, Vol. 44(2): 249-257. [17]. Center for Disease Control and Prevention (2015). HIV Among Youth. www.cdc.gov/hiv/....youth/index.html assessed 12/06/15. [18]. Commendador, K.A. (2010). Parental Influences on Adolescent Decision Making and Contraceptive Use. Pediatric Nurs., Vol. 36(3): 147-156. [19]. Connel J. P. (1990). Context, Self and Action: A Motivational Analysis of Self System Processes Across the Life Span. In: Dchichetti and M Beeghly (Eds). The self in Transition: Infancy to childhood Chicago: University of Chicago Press, pp. 61-97 [20]. Dangal, G. (2006). An Update on Teenage Pregnancy. Internet Journal of Gynecology and obstetrics, Vol. 5(1), 3. [21]. Fatusi, A.O, Blum, R.W (2008). Predictors of early sexual initiation among a nationally representative sample of Nigerian adolescents. BMC Public Health, 8: 136 [22]. Federal Ministry of Health [Nigeria]. National HIV/AIDS and reproductive health survey. Abuja: Federal Ministry of Health, 2009. [23]. Glasier, A. (1997). Emergency Postcoital Contraception. N Engl J Med, Vol. 337 (15) :1058–1064. [24]. Gomes, E.R., Speizer, I.S., Oliveira, D.C., Moura, L.B., Gomes, F.M.(2006). Contraceptive method used by adolescents in Brazilian State Capital. Journal of Pediatric and Adolescent Gynecology, vol.21 (4), 213-219. [25]. Heneghan A., Stein, R.E.K., Hurburt, M.S., Zheng, J., Rolls-Reutz, J., Kerker, B.D., Landsverk, J., McCue Horwitz, S. (2015). Health-risk Behavior in Teen Investigated by U.S. Child Welfare Agencies. Journal of Adolescent Health, vol.56 (5), 508-514. [26]. Idonije B.O., Oluba, O.M, Otamere, H.O. (2011). A Study on Knowledge, Attitude and Practice of Contraception among Secondary School Students in Ekpoma Nigeria. JPCS, Volume, 2. [27]. Ikeme ACC, Ezegwui HU, Uzodinma, AC. Knowledge, attitude and use of emergency contraception among female undergraduates in eastern Nigeria. J Obstet Gynaecol 2005; 25: 491-3. [28]. International Planned Parenthood Federation (1994). Understanding Adolescents. London [29]. Jaccard, J., Dittus, P. (2000). Adolescent Perceptions of Maternal Approval of Birth Control and Sexual Risk Behavior. American Journal of Public Health, Vol. 90 (9): 1426-1430. [30]. Jaccard J, Dodge T, Dittus P. (2002). Parent-Adolescent Communication about Sex and Birth Control in Talking Sexuality. New Directions in Child and Adolescent Development San Francisco, CA: Jossey-Bass pp. 9-41. [31]. Kaunitz, A.M. (1992) Guiding Adolescents in Proper Contraceptive Use. Cont OB/GYN, pp. 15–33. [32]. Kinaro, J.W. (2013). Perceptions and Barriers to Contraceptive use among adolescents: A Case Study of Nairobi. http://erepository.unobi.ac.ke:8080/xmlui/handle/123456789/43838. [33]. Kirby, D. (2008). The Impart of Abstinence and Comprehensive Sex and STD/HIV Reduction Program on Adolescent Sexual Behavior. Sexuality Research and Social Policy, Vol. 5(3): 6-17. [34]. Lagana, L. (1999). Psychosocial correlates of contraceptive Practices During the Late Adolescence. Adolescence, Vol. 34(135):463-483.
88

Texila International Journal of Public Health Volume 5, Issue 1, Mar 2017
[35]. Lebese, R.T., Maputle, S.M., Ramathuba, D.U., Khoza, L.B. (2013). Factors Influencing the Uptake of Contraception Services by Vatsonga Adolescents in Rural Communities of Vhembe District in Limpopo Province, South Africa. Health SA Gesondheid, vol. 18(1) [36]. Martino, S.C., Elliott, M.N., Corona, R., Kanouse, D.E., Mark, S.A.(2008). The Roles of Breadth and Repetition in Parent-adolescent Communication about Sexual Topics. Off J Am Acad Pediatrics 121(3):612-618. [37]. Mestad, R., Secura, G., Allsworth, J.E., Madden, T., Zhao, Q., Pelpert, J. F. (2011). Acceptance of long-acting reversible contraceptive methods by adolescent participants in the contraceptive CHOICE project. Contraception, vol. 84 (5), 493-498. [38]. Mollborn, S & Everett, B. (2010). Correlates and Consequences of Parent-teen Incongruence in Reports of Teens Sexual Experience. J Sex Res, Vol. 47 (4): 314-329. [39]. Mturi, A. J. (2003). Parents’ Attitude to adolescent Sexual Behavior in Lesotho. African Journal of Reproductive Health, Vol. 7 (2): 25-33. [40]. National Population Commission (NPC) and ORC Macro (2003). Nigeria demographic and health survey. NPC and ORC Macro, Calverton, Maryland, 2004. [41]. National Population Commission (NPC) and ICF Macro (2009). Nigeria demographic and health survey 2008. Abuja: NPC and ICF Macro. [42]. Obisesan K. A., Adeyemo, A., Fakokunde, B. O. (1998). Awareness and Use of Family Planning Methods among Married Women in Ibadan, Nigeria. East African Medical Journal, Vol. 75 (3): 135-138. [43]. Odimegwu, C.O., Solanke, L.B, Adedokun, A (2002). Parental characteristics and adolescent sexual behaviour in Bida LGA of Niger State, Nigeria. African Journal of Reproductive Health, Vol. 6(1): 95-106. [44]. Ojo, O., Aransiola, J., Fatusi, A., Akintomide, A. (2011). Pattern of Socio-demographic Correlates of Parent-child Communication on Sexual and Reproductive Health Issues in South-Western Nigeria; A Mixed Method Study. The African Symposium, Vol. 11 (2). [45]. Olukoya, A.A., Kaya, A., Ferguson, B.J., AbouZahr, C. (2001). Unsafe Abortion in Adolescents. International Journal of Gynecology and obstetrics, Vol. 75, pp. 137-147. [46]. Olubusayo-Fatiregun, M.A. (2012). Parenting Attitude Towards Adolescent Sexual Behavior in Akoko-Edo and Estako-West Local Government Areas, Edo State, Nigeria. World Journal of Education, Vol. 2, No 6. [47]. Omo-Aghoja, L.O., Omo-Aghoja, V.W., Aghoja, C.O., Okonofua, F.E., (2009). Factors Associated with the Knowledge, Practice and Perception of Contraception Rural Southern Nigeria. Ghana Med J, 43 (3): 115-211. [48]. Omobude-Idiado, S.N., Bazuaye, G.N. (2009). Patterns of Sexually Transmitted Infections (STIS) Reported Among Students in a Federal University in Mid-Western Nigeria. College Student Journal, Vol. 43(2). [49]. Onifade, C.A., Osibanjo, D., Taiwo, A. (2013). The Role of Parents in the Prevention of HIV/AIDS among Secondary Students in Ijebu-ode, Ogun State, Nigeria. Canadian Social Science, Vol. 9 (2): 95-106. [50]. Orji EO, Esimai OA. Sexual behaviour and contraceptive use among secondary school students in Ilesha southwest, Nigeria. J Obstet Gynaecol. 2005; 25: 269–72. [51]. Ott, M.A., Adler, N.E., Millstein, S.G., Tschan, J.M., Ellen, J.M. (2002). The trade-off between hormonal contraceptives and condoms among adolescents. Perspectives on Sexual and Reproductive Health, 34(1):6–14. [52]. Oye-Adeniran, B.A., Adewole, I.F., Umoh, A.V., Oladokun, A., Gbadegesin, A., Ekanem, E.E., Yusuf, B. (2006). Community Based Study of Contraceptive Behavior in Nigeria. African Journal of Reproductive Health, Vol. 10(2); 90-1 04. [53]. Oyediran, O.O., Faronbi, J., Ajibade, B.L. (2013). Parental Attitude towards the Use of Contraceptives by Adolescents in Osogbo, Osun State. IOSR Journal of Pharmacy and Biological Sciences, Vol. 8, issue 3. [54]. Remez, L. (2000) Oral Sex Among Adolescents: Is it Sex or is it Abstinence. Fam Plann Perspect, Vol. 32(6):295–298. [55]. Santelli, J.S., Brener, N.D., Lowry, R., Bhatt, A., Zabin, L.S. (1998) Multiple sexual partners among US adolescents and young adults. Fam Plann Perspect, 30(6):271–275. [56]. UNAIDS (2012). UNAIDS Report on Global Aids Epidemic 2012. [57]. UNAIDS (2014). Epidemiology Slides- GAP report 2014.
89

Texila International Journal of Public Health Volume 5, Issue 1, Mar 2017
[58]. UNFPA (2010). HIV and AIDS in Nigeria [59]. UNICEF (2002). Adolescence: a time that matters. New York: UNICEF. [60]. Wagstaff, A., Claeson, M. (2004). The Millennium Development Goals for Health: rising to the challenges. Washington DC: the World Bank. [61]. World Health Organization (2004). Adolescent Health and Development. Department of Child and Adolescent Health and Development. [62]. World Health Organization (2009): Adolescent pregnancy: a culturally complex issue. Bull World Health Organ, 87(6):405-484. [63]. World Health Organization (2012). Expanding Access to Contraceptive Services for Adolescents. Policy Brief WHO/RHR/12.21 [64]. World Health Organization (2015). Adolescent Development, Maternal, Newborn, Child and Adolescent health.
90

Texila International Journal of Public Health Volume 5, Issue 1, Mar 2017
Implications for Factors Affecting Prevention of Mother-to-Child Transmission of HIV Programs in University Teaching Hospitals in
Anambra State
Article by Michael Olugbamila Dada1, Ogbodo, Uchechukwu Chibuzo2
1 HSS and Lab Department, FHI360, Anambra State, 3rd Floor, State Ministry of Health, Awka, Anambra State, Nigeria
2M&E Department, FHI360, Anambra State, 3rd Floor, State Ministry of Health, Awka, Anambra State, Nigeria
E-mail: [email protected]
Abstract
Background: Vertical Mother-to-child transmission of human immunodeficiency virus (HIV) remains a cause for alarm in the course of new HIV infections in newborns in Sub-Saharan Africa. Poor utilization of PMTCT services accounts for the high HIV burden recorded in Anambra State of Nigeria. Aiming pregnant women attending antenatal clinics provide a unique opportunity for implementing prevention of mother-to-child transmission (PMTCT) programs against HIV infection of newborn babies.
Objective: This study aimed to investigate obstacles and implications associated with the poor access and utilization of PMTCT services in selected teaching hospitals in Anambra State.
Methods: A descriptive cross-sectional study was employed using interviews with 128 adult pregnant HIV-infected women attending antenatal care clinics of two teaching hospitals in Anambra State of Nigeria. Trained data collectors administered structured questionnaires to collect data on socio-demographic characteristics, knowledge about HIV and PMTCT, satisfaction with service care providers and obstacles to utilization of PMTCT services.
Results: 99% of the study participants knew that HIV was a deadly virus transmitted through sex and other blood contact routes. 76% of the participants knew that HIV could be transmitted from mother to child and about 53% of them actually knew the major ways of MTCT of HIV. 41% of the participants did not know how HIV could be passed from mother to child. Lack of awareness and knowledge about HCT, late presentation at ANC clinics, low numbers of PMTCT centers within locality of respondents, poor involvement of male partners/spouses and stigma were the main reasons cited for poor utilization of PMTCT programs in the state.
Conclusion: In order to overcome the obstacles highlighted in this study, strong political and economic commitments need to be incorporated in PMTCT service provider delivery. HIV counselling and testing among ANC attendees and creating knowledge/awareness about MTCT of HIV ought to be a priority. Further research should be conducted qualitatively to augment the quantitative data.
Keywords: Human immunodeficiency virus, Prevention of mother to child transmission HIV counselling and testing, Antenatal Care
Background
HIV/AIDS is one of the global pandemics facing the world today. It is acknowledged the world’s deadliest without proper care and optimum interventions. In 2009, the United Nations AIDS Program (UNAIDS) reported that 430,000 of the approximately 2.5 million children under the age of 15 living with HIV were newly infected, the majority in sub-Saharan Africa (United Nations Aids Programme, 2010). Many of these children acquired the infection from their mothers during pregnancy, birth, or breastfeeding. Timely administration of antiretroviral drugs to a HIV-positive pregnant woman and her newborn child significantly
91

Texila International Journal of Public Health Volume 5, Issue 1, Mar 2017
reduces the risk of mother-to-child transmission (WHO, 2006). Now recognized as an attainable public health strategy, preventing mother-to-child transmission (PMTCT) has four basic components: (i) prevention of primary infection among women, (ii) prevention of unintended pregnancies among HIV positive women, (iii) provision of specific interventions to reduce the risk of mother-to-child transmission, and (iv) provision of care, treatment and support to HIV infected women, their infants and families (WHO, 2007; WHO, 2010). Providing highly active antiretroviral therapy to a woman will reduce viral replication and viral load during pregnancy, and as a post-exposure prophylaxis, prevent infection in newborns (WHO, 2006; Siegfried et al., 2011; Dabis, 2000).
Interventions to reduce pediatric HIV infection have become readily available worldwide, especially in low and middle-income countries. In 2009, 53% of HIV-infected pregnant women worldwide received antiretroviral (ARV) drugs to prevent mother-to-child transmission (WHO, 2010). While coverage is increasing in sub-Saharan Africa, ranging from 8% in some settings to 54% in others (WHO, 2007), PMTCT programs in the continent are still plagued by multiple problems. For instance, many HIV positive pregnant women still face constraints in accessing ARV drugs because they refuse to participate or are lost to follow-up in existing programs. Health system factors (critical shortage of personnel, lack of skilled attendant at birth, poor infrastructure, and inadequate supply of PMTCT kits) as well as individual and socio-cultural factors (stigma, nonawareness of PMTCT services, lack of spousal and family support, loss to follow-up, negative experiences with hospital staff, the preference for home delivery) have been highlighted as barriers in the literature (Barker et al., 2011; Thielgaard et al., 2011; Chinkonde et al., 2009; Manzi et al., 2005; WHO, 2005). Nigeria, like most countries in sub-Saharan Africa, is experiencing a high prevalence of HIV with about 4.1% of the adult population living with the virus (NACA, 2011; UNAIDS, 2008) largely due to heterosexual transmission. Besides heterosexual transmission, vertical transmission of HIV from mother-to-child accounts for more than 90% of pediatric AIDS cases (NACA, 2011). To reduce the number of mother-to-child HIV infections, the governments of various countries have set a goal of universal access and increased the capacity for the delivery of HIV counseling and testing, prevention of mother-to-child transmission, and provision of ARVs by about 2-, 6-, and 8-fold, respectively (UNAIDS, 2008). Despite this increase, the number of women accessing these services is still low. For instance, after more than 5 years since the goal for universal access was established, less than 7,000 HIV positive pregnant women received ARV prophylaxis, representing about 19% of the annual targets (Federal HIV/AIDS Prevention and Control Office, 2011).
The reasons why HIV positive pregnant women are not accessing PMTCT services or return for follow-up vary from one context to another. Generally however, biological, operational, and local-contextual factors continue to impede the uptake of PMTCT services in many parts of sub-Saharan Africa even when services are available (WHO, 2007; Painter et al, 2004). To address the problem of low utilization of PMTCT interventions, it is important to highlight and understand unique contextual factors and how they affect the performance of PMTCT programs. The aim of this study was to highlight and describe specific sociocultural, health system and operational barriers that contribute to the low uptake of PMTCT services in Anambra State of Nigeria, a region in the country ranked 4th for the HIV/AIDS burden of 8.7% (HSS, 2010) and a high risk rate for mother-to-child transmission and, understand why the transmission rate from mother to child has remained high amongst the eastern states of Nigeria. Understanding first the obstacles that affect the success of PMTCT and possible implications for these barriers would help develop new strategies to achieve high uptake, create alternate accessibility routes for the program, if Nigeria were to meet the United Nations Global Plan for eliminating new HIV infections and sustaining these goals.
92

Texila International Journal of Public Health Volume 5, Issue 1, Mar 2017
Materials and methods
Study design
A cross-sectional descriptive method that applied quantitative surveys was used to triangulate findings.
Study setting and population
Anambra State is situated in South-East zone geopolitical zone of Nigeria with Awka as the state capital. Ethnically, Anambra state is 98% of Igbo population and 2% LGAs. The state is bounded in the northeast by Enugu state, in the east by Enugu and Abia states, in the west by Delta while in the south and northwest by Imo and Kogi states respectively. Administratively, the state is divided into 21 Local Government Areas, 235 health districts, 330 wards and 177 communities. Anambra state has an annual growth rate of about 2.80% and the state was projected to have approximately 4,984,127 people at the end of 2012. It is a densely populated state with about 1,500 to 2,000 persons/km (Anambra state, 2013; FMOH, 2010). There are 1,085,949 women of reproductive age (WRA) (15-49 years of age), while the children under five years and below one year of age are 966,749 and 193,350, respectively. There are about 1,485 health facilities in the state, 72% of which are private. Within the public sector, there are two tertiary health facilities-(one owned by federal and one owned by the state government and 31 public secondary health care facilities that are managed by the Anambra state government through the State Hospital Management Board of the State Ministry of Health (SMOH).
Nnamdi Azikiwe University Teaching Hospital (NAUTH) located in Nnewi and Anambra State University Teaching Hospital (ANSUTH) in Awka were selected for this study because of presence of comprehensive PMTCT services. This facility-based cross-sectional study was conducted among pregnant HIV-infected women attending ANC clinics in these two comprehensive hospitals. Women of reproductive age (15–49 years) constitute about 22% of the total population while 2.4% of the population is estimated to be pregnant women.
Sample size and sampling procedures
The study used quantitative data collection methods in two selected comprehensive facilities offering large-scale PMTCT services. The study population included pregnant women who received the services of ANC clinics of the selected health institutions. Two opted out of the study. The sample size for this study was determined using an appropriate statistical formula for estimating sample size in health studies: n = Z2Pq/d2
Where: n = the required sample size; Z = the coefficient of Z statistic (the standard normal deviate at 95% confidence level
obtained from the standard normal distribution table); P = prevalence rate in %; q = 100-P; d = the desired precision of the study or sampling error tolerated in %. Using a prevalence rate P of 9.2% obtained from a previous similar study in Anambra
state, a confidence limit of 95% (d=5%), and Z of 1.96, the calculated sample size, n will be 130. Two pregnant women opted mid-way into the study, making the study participants to be 128.
Data collection
Data collection commenced in February 2016 after relevant ethical approvals were obtained and ended in August of the same year. All pregnant women attending the ANC clinic who consented to the interview and met the inclusion criteria participated in the study. A pre-tested structured questionnaire was used for data collection. The questionnaire mainly consisted of multiple response sets with some open-ended questions addressing socio-
93

Texila International Journal of Public Health Volume 5, Issue 1, Mar 2017
demographic characteristics, knowledge about the MTCT of HIV, ANC visit, HCT, partner’s HIV testing status, privacy and confidentiality and satisfaction with the services. Four trained data collectors administered a questionnaire using face-to-face exit interviews. Completed questionnaires, carefully examined for missing values by the researcher were submitted to the statistician for analysis.
Data analysis
Statistical analysis was done using IBM SPSS Statistics version 21 to analyze quantitative data. Characteristics of the mothers were summarized and presented using proportions, means, medians, frequency tables or cross-tabulations for continuous variables and proportions for categorical variables. Chi square (Χ2) test was performed to test for statistical significance between proportions for the cross tabulated variables. Level of significance was set at p < 0.05.
Ethical approval
Ethical approval and clearance for the study was obtained from the Research Ethics Committees of both comprehensive facilities where large scale PMTCT services are offered. Consent to conduct the study was also obtained from the health facilities. Individual verbal informed consent was obtained from every study participant who agreed to participate in the study based on the study inclusion criteria of having attended ANC clinic more than once and between 18-49 years. Strict confidentiality and anonymity practices were followed in the administration of the questionnaires for all clients both during and after data collection.
Results
Socio-demographic characteristics of respondents
The final sample for quantitative data analysis included 128 pregnant HIV-infected women, who consented to participate in the study. A response rate of 99% was recorded. 65% (n = 83) of the respondents were ANC attendees at NAUTH while 35% (n = 45) of the respondents were from ANSUTH. Their age ranged from 18 to 49 years with a mean±SD and median ages of 25.4+4.5 years and 25 years respectively. 70%of the study participants resided in urban areas, 84% were married, 57% had formal education with 40% of them having secondary and tertiary education and 51% were employed.
Table 1. shows the sociodemographic characteristics of the 128 mothers
Variable Respondents by Health Facility Total (n, %) ANSUTH NAUTH
Maternal age 18-24 14, 31% 32, 39% 46, 36% 25-34 22, 49% 43, 52% 65, 51% 35-44 9, 20% 8, 9% 17, 13% Location Urban 34, 76% 55, 66% 89, 70% Rural 11, 24% 28, 34% 39, 30% Marital Status Married 40, 88% 68, 82% 108, 84% Single 5, 11% 15, 18% 20, 16% Separated 0, 0% 0, 0% 0, 0% Widowed 0, 0% 0, 0% 0, 0% Level of Education No formal education
16, 36% 29, 35% 40, 31%
Primary 9, 20% 24, 29% 36, 17%
94

Texila International Journal of Public Health Volume 5, Issue 1, Mar 2017
Secondary 10, 22% 15, 18% 22, 17% Tertiary 10, 22% 15, 18% 30, 23% Employment status Employed 29, 64% 36, 43% 65, 51% Unemployed 16, 36% 47, 57% 63, 49%
Nauth: Nnamdi Azikiwe University Teaching Hospital; ANSUTH: Anambra State University Teaching Hospital
Knowledge of respondents about MTCT of HIV and PMTCT services
Almost all study participants (99%) had knowledge of HIV to be a deadly sexually transmitted viral infection that can be contracted through blood contact. 76% of the participants knew that HIV could be transmitted from mother to child and about 53% of them actually knew the major ways of MTCT of HIV. 41% of the participants did not know how the transmission occurs raising concern about creating awareness and educating women of reproductive age and people in general about HIV transmission from mother to child. Respondents in ANSUTH (84%) had better understanding of what PMTCT is all about and had readily accessible PMTCT services in their area (about 84%).
Table 2. Shows the knowledge of respondents about PMTCT services
Variable Respondents by Health Facility
Total (n, %)
ANSUTH NAUTH Understanding of HIV A deadly disease 10, 22% 3, 4% 13, 10% An immunodeficiency disease
8, 18% 24, 29% 32, 25%
A sexually transmitted disease
22, 49% 31, 37% 53, 41%
An infection that can contracted through blood
5, 11% 25, 30% 30, 23%
Don’t know HIV can be transmitted from mother to child Yes 30, 67% 67, 81% 97, 76% No 12, 27% 10, 12% 22, 17% Don’t know 3, 6% 6, 7% 9, 7% Time of transmission from mother to child During pregnancy 12, 27% 10, 12% 22, 17% During labour 9, 20% 8, 10% 17, 13% During breastfeeding 6, 13% 23, 28% 29, 23% Other 2, 4% 17, 20% 19, 15% Don’t know 16, 36% 25, 30% 41, 32% Understanding of PMTCT Prevention of HIV from mother to child
38, 84% 51, 61% 89, 70%
Don’t know 7, 16% 32, 39% 39, 30% Availability of PMTCT services in your area Yes 38, 84% 77, 93% 115, 90% No 7, 16% 6, 7% 13, 10%
Nauth: Nnamdi Azikiwe University Teaching Hospital; ANSUTH: Anambra State University Teaching Hospital
95

Texila International Journal of Public Health Volume 5, Issue 1, Mar 2017
Barriers to access and utilization of PMTCT services
The findings of the study highlighted as obstacles to successful access, utilization and uptake of PMTCT services by the study participants, the following: the way health workers treat the mothers (mistreatment), the time taken to get ANC service (long wait time, long wait time to get laboratory tests and obtain results), long walking distance to facility, getting off work, and late presentation to ANC for HIV testing and counselling were among the barriers that contribute to the low utilization of ANC/PMTCT services in the state.
Most study participants (80%) were content with the level of service provided by the health workers as they affirmed that they were knowledgeable about their work and showed competence. However, some cited hostile attitude towards them and disaffection from the health workers. Cost, convenience, fear of stigma and discrimination were stated as reasons for dropping out of PMTCT services even when informed of their HIV-positive status. In addition, tired of taking the drugs was identified as a major obstacle to keeping up with the PMTCT schedule.
Low utilization of PMTCT programs in the state was also attributed to the fact that male partners showed little or no concern for health issues. This was seen in most of the study participants making decisions for PMTCT services without their partners/spouses. As deduced by the study, the men believed in being in a steady healthy state and needed no services of the hospital in any form. It was also due to a lack of financial commitment to the health of the mother and child during pregnancy, by the male partners.
The result findings showed constraints stratified at individual, family and facility levels. Other limitations included economic and work-related.
Discussion
In Africa, where about 90% of the world's new paediatric HIV infections occur, attaining high PMTCT coverage has the potential to contribute substantially to eradicating infant HIV infection globally. In this study, we found a number of economic, health system and family factors hindering utilization and uptake of PMTCT services in Anambra State. To address/mitigate new infections in young children, the factors need to be checked in the face of achieving the global targets set by the United Nations for reducing HIV MTCT, for which Nigeria accounts 30% of the global PMTCT gaps.
Financial constraint was found to be a major barrier of PMTCT uptake in this study. Women defaulted ANC attendance because of lack of money. Often, they have to choose between coming to ANC and pursuing other financially yielding ventures. Also, the husbands of these women could not provide transport fees, and coming for ANC by these HIV-infected women is a common cause of family dispute. With the gradual withdrawal of financial assistance by the implementing partners, such as reimbursements of transport costs and abolition of users fees associated with institutional care and delivery services to HIV-infected pregnant women for ANC attendance may become increasingly impossible. Therefore, the need for couples to be educated to see PMTCT services as a family priority and a positive way of life cannot be overemphasized. Families and most especially male partners should be encouraged to give priorities to provision of transport fees for ANC attendance in the midst of competing financial obligations (Deressa et al, 2014).
The poor quality of PMTCT services experienced by the HIV women was another barrier identified in this study as the mothers complained of long wait times, judgmental and poor staff attitude. While recruitment of more staff could reduce the burden of work load on health workers, the financial implication may not make this option an easy and immediate solution; therefore, efforts should be geared toward improving the efficiency of the existing workers via training and retraining on issues of PMTCT services. As earlier suggested by Barker et al (2011),the health system efficiency can be optimized by close examination of the clinic flow, documentation of requirements, and other logistical improvements which can maximize the efficiency of services and decrease women’s waiting times even with the existing staff
96

Texila International Journal of Public Health Volume 5, Issue 1, Mar 2017
strength. Shifting tasks among health workers may be another way of maximizing staff roles where feasible for a smoother service delivery (Zachariah et al., 2009).
Stigma and discrimination was another major barrier identified in this study. This barrier was general as it affected the uptake of PMTCT services at all levels of the cascade. This is in line with studies done by Link & Phelan, 2001; UNAIDS, 2005; Nguyen et al., 2008). Stigma and discrimination was responsible for the following identified reasons for less than optimized utilization of PMTCT programs in the state. These included why mothers did not come for HIV testing; why mothers did not disclose HIV-positive status to their male partners; why mothers did not want to take ARV medicine in the presence of friends and family members either at home, elsewhere or when they travelled; why mothers did not want to administer NVP to their infants in the presence of family members, in-laws and friends; why mothers did not want to come for ANC visits; why mothers will breastfeed their babies outside their homes but will revert to replacement feeding at home; and partly the reason mothers preferred home delivery by TBAs (Deressa et al., 2014; Anigilaje et al., 2015).
The findings of the study have several implications pertinent to the success of PMTCT programs and impact of HIV burden in the state. These include increased socio-economic outcomes for the state since women are known to be involved in different walks of life. Others are improved health outcomes for mother and child and reduced HIV burden in the state. Spousal support and encouragement, when available tend to strengthen the system for better access and use of PMTCT services. In Deressa et al. (2004), the support of women by husbands in ANC has several implications for uptake of PMTCT and these include the high rate of partner counselling and testing and less drop-out cases of pregnant women in PMTCT services. Studies by Chikonde et al (2009) revealed that one of the reasons women drop out of these programs is because of male partners’ reaction to HIV-seropositive status. Similar to the present findings, male partners’ reaction to HIV status contribute to low throughput in PMTCT interventions and high rates of result disclosure in the state (Kasenga et al., 2008; Medley et al., 2004; Gari et al., 2009; Kelley et al., 2011).
Some of the study participants recommended that government should do more to encourage participation by HIV-seropositive pregnant mothers by creating awareness of the program and instituting free MNCH programs. Where possible, a reward system should be put in place at the facilities to increase ANC attendance. Also, anti-discrimination acts available at the federal level should be enforced at all levels of government-owned facilities to ensure wide PMTCT acceptance. Mother-to-mother support groups was advocated to be restored by the study participants. This is worthwhile as women tend to connect with those who have experiences in what they are going through and desire to be emotionally nurtured. More strategic efforts need to come in the area of male partner involvement, couple testing and counselling and promoting PMTCT.
Conclusion
Late presentation to ANC, stigma and discrimination experienced by HIV-infected mothers, financial constraints, weak health system orchestrated by poor staff attitude, non-participatory roles of male partners, were the identified major barriers against effective PMTCT interventions in the study setting. The recommendations suggested by the participants of the study, if properly used in program and policy planning can go a long way to improving quality of PMTCT utilization in the state.
Recommendations
The researcher suggests a qualitative approach to the study, for both health service providers and ANC attendees to augment the quantitative data obtained in the study area. For non-government organization interventions to record success in PMTCT thematic area of HIV prevention, care and treatment, the researcher recommends an integration of family, community, government and legal mechanisms of control at facility level for effective and efficient delivery of services. To that effect, indicators tracking success at different levels
97

Texila International Journal of Public Health Volume 5, Issue 1, Mar 2017
would need to be developed to measure impact of receptiveness of PMTCT interventions at these levels.
References
[1]. Barker, P.M., Mphatswe, W. and Rollins, N. (2011). “Antiretroviral drugs in the cupboard are not enough: the impact of health systems' performance on mother-to-child transmission of HIV,” Journal of Acquired Immune Deficiency Syndromes, Vol. 56, No. 2, pp. e45–e48. [2]. Chinkonde, J.R., Sundby, J. and Martinson, F. (2009). “The prevention of mother-to-child HIV transmission programme in Lilongwe, Malawi: why do so many women drop out,” Reproductive Health Matters, Vol. 17, No. 33, pp. 143–151. [3]. Dabis, F., Newell, M.L., L. Fransen, L. et al. (2000). “Prevention of mother-to-child transmission of HIV in developing countries: recommendations for practice,” Health Policy and Planning, vol. 15, no. 1, pp. 34–42. [4]. Deressa, W., Seme, A., Asefa, A., Teshome, G. and Enqusellassie, F. (2014). Utilization of PMTCT services and associated factors among pregnant women attending antenatal clinics in Addis Ababa, Ethiopia. BMC Pregnancy and Childbirth Vol. 14 p.328-341. [5]. Eshleman, S.H., Mracna, M., Guay, L., et al. (2001). Selection and fading of resistance mutations in women and infants receiving nevirapine to prevent HIV-1 vertical transmission (HIVNET 012). AIDS, Vol. 15:1951-1957. [6]. Federal HIV/AIDS Prevention and Control Office (2011). In Multi-sectoral HIV/AIDS Response Annual Monitoring and Evaluation Report 202 EFY. [7]. Federal Ministry of Health (2010). National HIV Sero-Prevalence Sentinel Survey. FMOH Abuja Nigeria. [8]. Federal Ministry of Health. (2003). National HIV/AIDS and Reproductive Health Survey (NARHS). [9]. Gari,T., Habte, D. and Markos, E. (2009). HIV positive status disclosure to sexual partner among women attending ART clinic at Hawassa University Referral Hospital, SNNPR, Ethiopia. Ethiop J Health Dev. 24 (1): 9-14. [10]. Kasenga F, Hurtig A, Emmelin M (2008). HIV-positive women’s experiences of a PMTCT programmeme in rural Malawi. Midwifery. [11]. Kelley, A.L., Karita, E., Sullivan, P.S., Katangulia, F., Chomba, E., Carael, M., Telfair, J., Dunham, S.M., Vwalika, C.M.,Kautzman, M.G., Wall, K.M. and Allen, S.A. (2011). Knowledge and perceptions of couples’ voluntary counseling and testing in urban Rwanda and Zambia: a cross-sectional household survey. PLoS One. 6(5). [12]. Lallement, M. (2005). Response to the therapy after prior exposure to nevirapine. 3rd IAS Conference on HIV Pathogenesis and Treatment, Rio de Janeiro, Brazil, July 24–27. [13]. Link B, Phelan J. (2001). On stigma and its public health implications. Paper presented at: Stigma and Global Health: Developing a Research Agenda; Bethesda, MD. Washington: National Institutes of Health. [14]. Manzi, M., Zachariah, R., Teck, R. et al., (2005). “High acceptability of voluntary counselling and HIV-testing but unacceptable loss to follow up in a prevention of mother-to-child HIV transmission programme in rural Malawi: scaling-up requires a different way of acting,” Tropical Medicine and International Health, Vol. 10, No. 12, pp. 1242–1250. [15]. Medley, A., Garcia-Moreno, C., McGill, S. (2004). Rates, barriers and outcomes of HIV sero-status disclosure among women in developing countries: Implications for prevention of mother-to-child transmission programmes. Bull World Health Organ. 82: 299-307. [16]. Mofenson, L.M. (2003). Advances in the prevention of vertical transmission of human immunodeficiency virus. SeminPediatr Infect Dis, Vol 4(4), p. 295–308. [17]. Mofenson, L.M., Lambert, J.S., Stiehm, E.R., et al. (1999). Risk factors for perinatal transmission of human immunodeficiency virus type 1 in women treated with zidovudine. N Engl J Med, Vol. 341 p.385–393. [18]. National Agency for the Control of AIDS (2011). Factsheet 2011: Update on the HIV/AIDS Epidemic and Response in Nigeria.
98

Texila International Journal of Public Health Volume 5, Issue 1, Mar 2017
[19]. National Agency for the Control of AIDS (2012). Global AIDS Response Country Progress Report: Nigeria GAPR 2012. [20]. National Agency for the Control of AIDS (2013). President’s Comprehensive Response Plan for HIV/AIDS in Nigeria. [21]. Nguyen, T.A., Oosterhoff, P., Ngoc, Y.P., Wright, P. and Hardon, A. (2008). Barriers to access prevention of mother-to-child transmission for HIV-positive women in a well-resourced setting in Vietnam. AIDS Res Ther 17:5-7. [22]. Painter, T.M., Diaby, K.L., Matia, D.M., et al. (2004). “Women's reasons for not participating in follow up visits before starting short course antiretroviral prophylaxis for prevention of mother to child transmission of HIV: qualitative interview study,” British Medical Journal, Vol. 329, No. 7465, pp. 543–546. [23]. Siegfried, N., van der Merwe, L., Brocklehurst, P. and Sint, T.T. (2011). “Antiretrovirals for reducing the risk of mother-to-child transmission of HIV infection,” Cochrane Database of Systematic Reviews, no. 7, p. CD003510. [24]. Theilgaard, Z.P., Katzenstein, T.L., Chiduo, M.G. et al., (2011). “Addressing the fear and consequences of stigmatization—a necessary step towards making HAART accessible to women in Tanzania: a qualitative study,” AIDS Research and Therapy, Vol. 8, No. 1, p. 28. [25]. United Nations AIDS Program (2010). http://www.unaids.org/globalreport/Global_report.htm [26]. United Nations AIDS Program (2008). Epidemiological Fact Sheet on HIV and AIDS: Core Data on Epidemiology and Response. Ethiopia. [27]. UNAIDS (2005). HIV-related stigma, discrimination and human rights violations: case studies of successful programs. [28]. World Health Organization (2005). The World Health Report, Geneva, Switzerland. [29]. World Health Organization (2006). Antiretroviral Drugs for treating Pregnant women and preventing infection in Infants: Towards Universal Access: Recommendations for a Public Health Approach, WHO, Geneva, Switzerland. [30]. World Health Organization (2007). Prevention of Mother to Child Transmission (PMTCT). Briefing note, Department of HIV/AIDS. [31]. World Health Organization (2010).New guidance on prevention of mother-to-child transmission of HIV and infant feeding in the context of HIV. [32]. World Health Organization (2010). “Towards Universal Access Progress Report. [33]. Zachariah, R., Ford, N., Philips, M., et al. (2009). Task shifting in HIV/AIDS: Opportunities, challenges and proposed actions for sub-Saharan Africa. Trans R Soc Trop Med Hyg. 103:549–558.
99

Texila International Journal of Public Health Volume 5, Issue 1, Mar 2017
Epidemiological Updates of Zika Transmission and Emphasizing the Critical Role of Public Health Interventions
Article by Soosanna Kumary1, Vijay Kumar Chattu2 1Researcher-Department of Preclinical sciences, Faculty of Medical Sciences, UWI-
St. Augustine
2Lecturer-Public Health, Public Health and Primary Care Unit, FMS, UWI- Trinidad and Tobago
E-mail: [email protected]
Abstract
Since the start of Zika epidemic this year, till date there are more than 45 countries with active Zika virus transmission. Considering its spread at an alarming rate with large clusters of microcephaly and neurological complications, the Emergency Committee of the World Health Organization (WHO) under the International Health Regulations (IHR) announced that Zika constitutes Public Health Emergency of International Concern (PHEIC) on February 1, 2016. Countries in Central America and South America show a decreasing trend of cases where as there is an increasing number of cases in USA and some Caribbean states. Recently after careful review of the existing evidence the scientists at CDC concluded that Zika virus causes Microcephaly a condition in which the size of baby’s brain and head is smaller than the normally expected. For planning more effective disease control and prevention activities for Zika fever there is great need for a functional and intensified Public Health Surveillance system Preparedness for the prevention and control of Zika virus infection. Risk communications should be enhanced in countries with Zika virus transmission to address population concerns, enhance community engagement, improve reporting, and ensure application of vector control and personal protective measures. Vector control measures and appropriate personal protective measures should be aggressively promoted and implemented to reduce the risk of exposure to Zika virus. Attention should be given to women of childbearing age and particularly pregnant women so that they have the necessary information and materials to reduce risk of exposure
Keywords: Zika virus, Public Health Emergency of International Concern, International Health Regulations, Guillain-Barre Syndrome, Microcephaly, Vector control
Introduction
Zika virus is a member of the Flaviviridae family (which includes Dengue, West-Nile and Japanese encephalitis viruses) transmitted to humans by Aedes mosquitoes and produces a comparatively mild disease in humans but confirmed to cross the placenta of pregnant women and affect the foetus makes it very unique from other Arboviruses [1]. It is considered an emerging infectious disease with the potential to spread to new areas where the Aedes mosquito vector is present and have already spread to 45 countries through autochthonous transmission since its recent emergence in 2015. The highly suspected association between microcephaly and the rapid increase in Zika cases during the current outbreak has contributed to the virus’ notoriety and is one of the key reasons behind ongoing global containment efforts [2].Considering its spread at an alarming rate with large clusters of microcephaly and neurological complications, the Emergency Committee of the World Health Organization (WHO) under the International Health Regulations (IHR) announced that Zika constitutes Public Health Emergency of International Concern (PHEIC) on February1, 2016[3].WHO has warned that a warming weather throughout Europe and could mean an increased chance of spreading the virus in the region as the two species of Aedes mosquito which transmit the virus will begin to circulate in the community. Apart from the local transmission the
100

Texila International Journal of Public Health Volume 5, Issue 1, Mar 2017
likelihood of sexual transmission could lead to an increase in number of Zika related complications. The eight countries that have reported transmission through sexual contact includes France, Italy and Portugal.
Zika virus- incidence and trends in the americas
Since the start of Zika epidemic this year, till date there are more than 45 countries with active Zika virus transmission. In the North America, Mexico is showing a downward trend in the number of confirmed cases while in the United States of America, the area of Zika transmission continues to expand in Miami-Dade County and the Florida Department of Health has confirmed an autochthonous case of Zika virus infection [4]. In Central America, with the exception of Costa Rica and Nicaragua, countries in Central America show a decreasing trend of cases over the previous four weeks. The greatest increase in Zika cases in Central America occurred between late 2015 and early 2016.In the Caribbean Saint Barthelemy and Puerto Rico continue to show an increasing trend of Zika cases; however, in other Caribbean countries and territories, the trend is declining. Finally in South America, all countries are reporting decreasing numbers of Zika cases. In the following weeks, it will be necessary to monitor the evolution of the outbreak to confirm whether the declining trend will continue. Canada reported two cases of maternal-fetal transmission of Zika Virus, including one with severe neurological congenital anomalies
To date, 14 countries and territories in the Americas reported congenital syndrome associated with Zika virus. Five additional countries and territories reported confirmed cases of congenital syndrome associated with Zika virus infection: Costa Rica, the Dominican Republic, Haiti, Honduras, and Suriname. Additionally, three countries reported suspected and probable cases of congenital syndrome associated with Zika virus infection: Barbados, Guatemala, and Nicaragua.
Fig 1. Countries and Territories in the Americas with the confirmed cases of Zika virus (as of 25 August, 2016) source: PAHO/WHO
101

Texila International Journal of Public Health Volume 5, Issue 1, Mar 2017
Clinical features
The most common symptoms of Zika include fever, rash, joint pains, conjunctivitis. The illness is mild and symptoms lasts for few days to a week after being bitten by an infected mosquito and many people don’t realize that. It is estimated that four out of five people with Zika infection have no symptoms at all [5].
Transmission of virus
People with asymptomatic infections and those who are viraemic in the incubation period of Zika disease could potentially donate contaminated substances of human origin without their infections being recognised at the time of donation. The virus can also be transmitted by substances of human origin from donors after clinical recovery from Zika virus disease due to possible prolonged viraemia or a persistence of the virus in semen after viraemia has cleared. Zika virus RNA has been detected in blood, urine, saliva, seminal fluid and breast milk but there is no data on the survival of Zika virus in processed and stored substances of human origin as well as no documented transmissions of the virus via saliva, urine or breastfeeding [6-17]. Cases of Zika virus transmission through donated cells, tissues and organs have not been reported, but this possibility cannot be excluded due to the confirmed presence of the virus in human blood and bodily fluids.
Neurological complications
The recent Zika virus infection (Zika) epidemic in Brazil has been associated with neurological anomalies, including an increase in the number of cases of microcephaly and, more recently, Guillain-Barré syndrome (GBS) [18,19]. The correlation between Zika and GBS was first reported in 2013 in French Polynesia [20]. GBS symptoms include weakness of the arms and legs that is usually the same on both sides of the body. In some cases, the muscles of the face that control eye movement or swallowing may also become weak. In the most serious cases, this muscle weakness can affect breathing, and people sometimes need a breathing tube to help them breathe. These symptoms can last a few weeks or several months. Although most people fully recover from GBS, some people have permanent damage, and in 1 out of 20 cases people have died.
Pregnant women and birth defects
To date, 14 countries and territories in the Americas reported congenital syndrome associated with Zika virus. The foetus can be infected in womb from the pregnant mother and recently after careful review of the existing evidence the scientists at CDC concluded that Zika virus causes Microcephaly a condition in which the size of baby’s brain and head is smaller than the normally expected. Apart from that there may be other severe brain defects in the new born baby. This implies that the woman who is infected with Zika during pregnancy has an increased risk of having baby with these problems and not all women who have Zika virus infection during pregnancy will have babies with problems since some infected women have delivered babies that appear to be healthy.
Public health interventions
Prevention and Control remains the main stay for controlling the number of new cases. There is a great need for the public health authorities to reach the communities and establish good partnerships with all the stakeholders like the community groups, NGOs, private sector including the medical and non-medical professionals to combat the mosquito menace.
Surveillance
For planning more effective disease control and prevention activities for Zika fever there is great need for a functional and intensified Public Health Surveillance system that can be based on the same system for Dengue and Chikungunya fever. As per the recommendations of PAHO/WHO[21], the surveillance for Zika fever should be focused to
102

Texila International Journal of Public Health Volume 5, Issue 1, Mar 2017
i. Determine if the virus is autochthonous or has been introduced to an area ii. Monitor the Zika virus in case if its introduced and
iii. Monitor the disease process once it has been established. iv. Monitor for neurological and autoimmune complications
Considering the broad distribution of Aedes mosquito in the Americas and the high mobility of people in and outside of this region now Zika has spread to the states of Florida and Texas
The Emergency Committee of WHO has emphasized on the following measures which helps to contain the growing epidemic.
Surveillance for Zika virus infection should be enhanced, with the dissemination of standard case definitions and diagnostics to at-risk areas,
The development of new diagnostics for Zika virus infection should be prioritized to facilitate surveillance and control measures,
Risk communications should be enhanced in countries with Zika virus transmission to address population concerns, enhance community engagement, improve reporting, and ensure application of vector control and personal protective measures,
Vector control measures and appropriate personal protective measures should be aggressively promoted and implemented to reduce the risk of exposure to Zika virus,
Attention should be given to ensuring women of childbearing age and particularly pregnant women have the necessary information and materials to reduce risk of exposure,
Pregnant women who have been exposed to Zika virus should be counseled and followed for birth outcomes based on the best available information and national practice and policies.
Longer-term measures
Appropriate research and development efforts should be intensified for Zika virus vaccines, therapeutics and diagnostics. In areas of known Zika virus transmission health services should be prepared for potential
increases in neurological syndromes and/or congenital malformations. Preventive Recommendations (Adapted from PAHO/WHO guidelines on prevention of
Zika virus transmission)
Strategy 1: Reduction of Mosquito density: It can be done through the following actions:
1. Strengthen environmental management 2. Ensure no vector breeding sites in common areas like parks, schools etc. to prevent
vector propagation 3. Organize mass sanitation campaigns to sensitize the public about cleanliness 4. By applying risk stratification, identify the places like schools, hospitals, transport
terminals and ensure mosquitoes are removed with a radius of 400 meters around these places.
5. In areas with virus, use adulticide treatment by spraying to interrupt transmission 6. Ensure proper monitoring during integrated actions for vector control (larval control
and adulticide treatment)
Strategy 2: Interruption of human-vector contact/ Personal prevention measures
A. Individual protection
1. Rest under bed nets treated with or without insecticides 2. Appropriate clothing to cover the extremities and exposed areas of skin 3. Use repellents containing DEET, IR3535, Icaridin can be applied to exposed skin or
clothing as per the instructions on the product label
103

Texila International Journal of Public Health Volume 5, Issue 1, Mar 2017
B. Household protection
1. Use wire-mesh screens on doors and windows 2. At least once a week, empty, clean, turn over or dispose the containers that can hold
water such as buckets, flower pots, tires inside and outside of dwellings to eliminate the mosquito breeding sites.
C. Patient isolation
1. A Zika virus infected person should avoid being bitten by Aedes mosquitoes during the first week of illness.
2. It is advised to stay under the bed-net and the treating health care workers should also protect from mosquito bites by appropriate measures.
Travel Recommendations (Adapted from PAHO/WHO guidelines on prevention of Zika virus transmission)
i. Prior to departure
Travellers heading to a country with circulation of virus are advised to protect themselves from mosquito bites
Use mosquito repellents, appropriate full sleeve clothing to minimize skin exposure Use insecticides or bed-nets treated with or without insecticide Sensitize and inform the travellers about the signs and symptoms of Zika/Dengue/
Chikungunya virus in order to identify it promptly and to consult the physician as early as possible during their trip
ii. While visiting places with zika virus transmission:
Avoid mosquito-infested areas Protect from mosquito bites by appropriate measures by using repellents and
appropriate clothing to reduce skin exposure Avoid the mosquito bites especially during day time as Aedes bites mostly at night
time Use of bed-nets and/or insecticide Seek professional care in case there are symptoms of Zika/ dengue/ Chikungunya
iii. Upon return
Contact the health care provider in case if they suspect they have Zika. Dengue/ Chikungunya after returning home.
The CDC has given the following advice to the pregnant women and the women trying to get pregnant [22]
Pregnant women
Should not travel to any area with Zika If you must travel to or live in one of these areas, talk to your healthcare provider first
and strictly follow personal protection measures like using repellents, covering the exposed skin, using mosquito nets and insecticide sprays.
If you or your partner live in or travel to an area with Zika, use condoms or other barriers, the right way, every time you have sex or do not have sex throughout the pregnancy.
Women trying to get pregnant
Before you or your partner travel, talk to your healthcare provider about your plans to become pregnant and the risk of Zika virus infection.
You and your partner should strictly follow steps to prevent mosquito bites as described in the personal protection measures.
104

Texila International Journal of Public Health Volume 5, Issue 1, Mar 2017
WHO zika research agenda
The goal of the WHO Zika Virus Research Agenda is to support the generation of evidence needed to strengthen essential public health guidance and actions to prevent and limit the impact of Zika virus and its complications. The Research Agenda identifies critical areas of research where WHO is uniquely placed to implement or coordinate global activities. Research and evidence are the foundation for sound health policies.
WHO/PAHO and other partnering institutions have initiated to design and generate standardized clinical and epidemiological research protocols and questionnaires to address key public health questions. Specifically, data collected using the standardized protocols will be used to refine and update recommendations for prevention of Zika virus spread, surveillance and case definitions for microcephaly, to help understand the spread, severity, spectrum and impact on the community of ZIKV and to guide public health measures, particularly for pregnant women and couples planning a pregnancy.
These protocols have been designed to maximize the likelihood that data and biological samples are systematically collected and shared rapidly in a format that can be easily aggregated, tabulated and analysed across many different settings globally
Conclusions
Zika virus transmission has become a real global health security threat and it emphasizes again for the great need for strengthening the health systems to have a robust and functional surveillance systems with adequate laboratory and clinical support. The clinical, virologic and epidemiologic data related to the increased rates of microcephaly and/or GBS, and Zika virus transmission, should be rapidly shared with the World Health Organization to facilitate international understanding of the these events, to guide international support for control efforts, and to prioritize further research and product development. There is a great need for public and private partnerships to fight this epidemic through community involvement. The preventive measures for halting mosquito breeding sites and personal protective measures to avoid mosquito bites remains the key strategies for effective prevention at community level through proper implementation of the integrated vector control.
Acknowledgements
The authors wish to thank the reviewers and editors of E-International Journals of Academics and Scientific Research whose comments and reviews strengthened this work. The authors are also grateful to the authors & publishers of all those articles from where the literature has been reviewed and discussed.
References
[1]. Atkinson B, Hearn P, Afrough B, Lumley S, Carter D, Aarons. Emma J, et al. (2016) Detection of Zika virus in semen. Emerg Infect Dis. 22(5). 72. [2]. Barzon L, Pacenti M, Berto A, Sinigaglia A, Franchin E, Lavezzo E, et al. (2016) Isolation of infectious Zika virus from saliva and prolonged viral RNA shedding in a traveller returning from the Dominican Republic to Italy, January 2016. Euro Surveill. March; 21(10). [3]. Besnard M, Lastere S, Teissier A, Cao-Lormeau V, Musso D. (2014). Evidence of perinatal transmission of Zika virus, French Polynesia, December 2013 and February 2014. Euro Surveill [Internet]. 2014; 19(13): [pii=20751 p.]. Available from: http://www.eurosurveillance.org/ViewArticle.aspx?ArticleId=20751. [4]. Centers for Disease Control and Prevention, US Department of Health and Human Services, USA. www.cdc.gov/zika. (Accessed on 26 August 2016) [5]. Cancian N. (2016) Study confirms that Zika virus can cross placenta during pregnancy; http://www1.folha.uol.com.br/internacional/en/scienceandhealth/2016/01/1731436 studyconfirmsthatzikaviruscancrossplacentaduringpregnancy.shtml. Last accessed January 31, 2016. [6]. Dupont-Rouzeyrol M, Biron A, O'Connor O, Huguon E, Descloux E. (2016). Infectious Zika viral particles in breastmilk. Lancet. 387(10023):1051.
105

Texila International Journal of Public Health Volume 5, Issue 1, Mar 2017
[7]. Fauci AS (2016) Morens DM (2016) Zika Virus in the Americas—yet another arbovirus threat. N Engl J Med 374: 601–604 3. [8]. Gourinat AC, O'Connor O, Calvez E, Goarant C, Dupont-Rouzeyrol M. (2015). Detection of Zika virus in urine. Emerg Infect Dis. Jan21(1):84-6 [9]. Hearn PT, Atkinson B, Hewson R, Brooks T. (2014). Identification of the first case of imported Zika Fever to the UK: A novel sample type for diagnostic purposes and support for a potential non-vectorborne route of transmission. Am J Trop Med Hyg. 91(5):62-3. 71. [10]. Lucey DR, Gostin LO (2016) The emerging Zika pandemic: enhancing preparedness. JAMA 315:865–866 [11]. Musso D, Nhan T, Robin E, Roche C, Bierlaire D, Zisou K, et al. (2014) Potential for Zika virus transmission through blood transfusion demonstrated during an outbreak in French Polynesia, November 2013 to February 2014. Euro Surveill 19(14):[pii=20761 p.]. Available from: http://www.eurosurveillance.org/ViewArticle.aspx?ArticleId=20761 [12]. Musso D, Roche C, Tu-Xuan N, Robin E, Teissier A, Cao-Lormeau VM.(2016) Detection of Zika virus in saliva. J ClinVirol. 68:53-5. [13]. Maria A, Maquart M, Makinson A, Flusin O, Segondy M, Leparc-Goffart I, et al. (2016) Zika virus infections in three travellers returning from South America and the Caribbean respectively, to Montpellier, France, December 2015 to January 2016. Euro Surveill [Internet]. 2016; 21(6): [pii=30131 p.]. Available from: http://www.eurosurveillance.org/ViewArticle.aspx?ArticleId=21374 [14]. Musso D, Roche C, Robin E, Nhan T, Teissier A, Cao-Lormeau VM. (2015) Potential sexual transmission of Zika virus. Emerg Infect Dis.21(2):359-61. [15]. Mansuy JM, Dutertre M, Mengelle C, Fourcade C, Marchou B, Delobel P, et al. (2016) Zika virus: high infectious viral load in semen, a new sexually transmitted pathogen? Lancet Infect Dis. EpubApr 16 (4): 405 [16]. Oehler E, Watrin L, Larre P et al (2014) Zika virus infection complicated by Guillain-Barre syndrome—case report, French Polynesia, December 2013. Eurosurveill Mar 6:19(9) [17]. Regional Zika Epidemiological Update (Americas) 25 August 2016. www.paho.org/hq/index.php?option=com_content&view=article&id=11599%3Aregional-zikaepidemiological-update-americas&catid=8424%3Acontents&Itemid=41691&lang=en (accessed on 25-8-2016) [18]. Rozé B, Najioullah F, Fergé J, Apetse K, Brouste Y, Cesaire R, et al. (2016). Zika virus detection in urine from patients with Guillain-Barré syndrome on Martinique, January 2016. Euro Surveill [Internet]. 2016; 21(9): [pii=30154 p.]. Available from: http://www.eurosurveillance.org/ViewArticle.aspx?ArticleId=21400 [19]. Sikka V, Chattu VK, Popli RK, Galwankar SC, et al. (2016). The emergence of Zika virus as a global health security threat: A review and a consensus statement of the INDUSEM Joint working Group (JWG). J Global Infect Dis 8:3-15 [20]. www.paho.org/hq/index.php?option=com_content&view=article&id=11640&Itemid=135&lang=en (accessed on 25 Aug 2016) [21]. Zika virus updates from FDA, available at http://www.fda.gov/%20EmergencyPreparedness/Counterterrorism/MedicalCountermeasures/MCMIssues/ucm485199.htm (accessed on 1 May 2016) [22]. Zika virus infection, Epidemiological Alert, PAHO/WHO 7 May 2015.
106

Texila International Journal of Public Health Volume 5, Issue 1, Mar 2017
Use of Technology to Improve Healthcare Outcomes is the Need of the Hour!
D. Chirundu1, S. Tapesana2, P.N.Magande3, Gershem Madzingaidzo4, T. Mduluza5 1,4Kadoma City Health Dept. Zimbabwe
2,3University of Zimbabwe Dept. of Community Medicine, Zimbabwe 5University of Zimbabwe Dept. of Biochemistry Zimbabwe
E-mail: [email protected], [email protected], [email protected], [email protected], [email protected]
Abstract
Introduction: Forgetfulness is often cited as a cause for non-adherence to antiretroviral therapy. High cell phones usage has provided opportunities for utilization of mhealth to improve health outcomes. Short message reminders can be used as a behavioral intervention to remind clients to take medication. It is against this background that we investigated the willingness of HIV clients on ART at Rimuka Clinic to receive SMS reminders for adherence.
Method: We used a cross sectional study design. We randomly selected 522 respondents from HIV clients registered at Rimuka Health Centre. Data were collected by means of a pretested interviewer-administered questionnaire and analyzed using Epi-Info 7 statistical software. Independent factors were identified using a stepwise backward logistic regression model.
Results: Five hundred and twenty-two respondents were recruited into the study. Respondents who reported owning a cell phone were 512 (92.75%). Ninety-seven (17.8%) reported a lost or damaged cell phone12 months prior to the study. Four hundred and ninety-nine respondents (97.4%) thought a text message could be useful in adherence to ART. However, 496 (97.06%) among those with cellphones were willing to be reminded by SMS to take their ART medication .Independent factors for willingness to receive SMS reminders were perceiving anti-retroviral therapy to be of benefit (a OR=0.2 p=0.04), having disclosed HIV status to family (a OR=5.37; p=0.04), indicating review schedules at 3 months (a OR=6.59; p=0.04), thinking text messages are helpful in adherence to ART (a OR=185.7; p<0.05), and using a cellphone as a medication reminder (a OR=4.8; p=0.03).
Conclusion: Clients attending Rimuka Clinic are willing to receive SMS reminders for adherence.
Keywords: Cellphone, SMS, ART, Rimuka Kadoma Adherence
Background
Forgetfulness is cited in a number of studies as the major cause of non-adherence to antiretroviral therapy (ART).1, 2, 3in this regard, a behavioral intervention that reminds an individual to take medication would be required to improve medication. Non-adherence, in turn, is associated with adverse health outcomes.4, 5
Of late mobile health technology (mHealth) has emerged as a tool to support healthcare delivery including improving adherence. There are 12 common Health and ICT applications. This broadly covers client education including behavior change, sensor & point of care diagnostics, registries / vital events tracking, data collection /reporting, health records, electronic decision support, provider to provider communication, provider work planning, provider training and education, human resources management, supply chain management and financing transactions and incentives that are used in the health sector.6,7
The ubiquity of cell phones has provided opportunities for utilization of such applications in health care.8The cell phone penetration rate has been increasing the world-over. By end 2015, there were more than 7 billion mobile cellular subscriptions, corresponding to a
107

Texila International Journal of Public Health Volume 5, Issue 1, M 2017
penetration rate of 97%, up from 738 million in 2000.9 Africa has provided an environment where utilization of cell phones is ever increasing.10 The cell phone penetration rate in Zimbabwe as of December 2015 was 95.4%.11 A number of studies in the US, Papua New Guinea, Cameroon, and Kenya have provided varying evidence on the utility of SMS to improve adherence to ART.12-17
There is, however, high-quality evidence that a brief weekly SMS improves adherence and virological outcomes.15.17 Daily messages have been shown to have no effect on adherence.16 There is also very low to moderate quality evidence that messages at other intervals improve adherence.18Whilst evidence may be available in other parts of the world, that use of mHealth improves adherence, adherence remainsa challenge in some low-income settings including Kadoma. A 2015 study on adherence to ART in Kadoma City reported an adherence rate of 87%based on self-reports. Based on pill counts among a subset of respondents, the adherence was reportedly 65%.19It is against this background that we investigated the acceptability and factors associated with willingness to receive SMS as an ART medication reminder to improve adherence to ART.
Methodology
Study design
We carried out a clinic-based cross-sectional study at Rimuka Integrated TB and HIV Care Centre (Rimuka ITHC) at Kadoma (Zimbabwe). We collected the data as part of the Kadoma Mobile Phone study (KAMPS). KAMPS is a randomized control trial whose objective is to investigate the efficacy of cellphone based SMS in improving adherence to ART. We collected the data between September 2016 and October 2016.
Study site
Rimuka ITHC is a primary health care facility that caters for TB/HIV collaborative activities at Kadoma. It offers comprehensive HIV services that include voluntary counseling and testing, pre-ART counseling, ART initiation & follow up and CD4+ testing. As of October 2016, 7300 clients were registered at the center.
Study subjects and sample size
The study population was clients registered for HIV care at Rimuka. Inclusion criteria were age above18, and, willing to provide written informed consent. Eligible respondents were also supposed to have been on ART for at least four weeks prior to the commencement of the study, usual residents of Kadoma City who did not have intentions of moving. The severely ill were not eligible to take part in the study. Random sampling was used to select 522 respondents.
Study variables
The outcome variable in the study was “willingness to receive a text message ART reminder” measured as a dichotomous yes/no variable. From literature review, we developed the independent variables for the questionnaire.20-28These were used to develop a conceptual framework comprising of:
Psychosocial factors- Social support, family support, support by significant others, perceived satisfaction with the social support
Socio-demographics- age, sex, religion, educational status, marital status, employment, monthly income, home ownership, religion
Pattern of cellphone use- owning a cell phone, use cell phone alarm reminders, carry mobile phone always, don't answer unknown numbers, perceived privacy in using cell phone, confidentiality
Environmental Factors-transportation access, travel time, transportation facility, transport cost, cost income, frequency of visits
Behavioral factors-HIV status disclosure, substance abuse.
108

Texila International Journal of Public Health Volume 5, Issue 1, Mar 2017
Data collection and analysis
We collected data using an interview-administered questionnaire that was pretested at the same center. However, we excluded from the main study all those who participated in the pre-test. We prepared the questionnaire in English and translated into Shona then back into English. We contacted a one-day training to explain the purpose of the study, standardize the questioning approach, and etiquette for the data collectors. Eight health workers administered the questionnaire. The investigator and clinic manager did supervision of the data collectors. We checked all questionnaires for completeness on submission.
We captured and analyzed the data using Epi Info 7 TM Centers for Disease Control (CDC2007) statistical package. We used descriptive statistics to describe the study population. The package was used to generate, frequencies, means, and odds ratios (OR). The strength of the association was described using Odds Ratio (OR) and 95% confidence interval (95% C.I.). We used a stepwise backward logistic regression model to identify independent factors. Factors that had p values less than 0.25 in bivariate analysis were included in the logistic regression model.29
Ethical considerations
We obtained written informed consent from all participants. Participants were free to terminate the interview at any time. We obtained permission to proceed from Kadoma City Council. Ethical approval was granted by Joint Research and Ethic Committee at Parerenyatwa Hospital Zimbabwe.
Results
Demography
We interviewed 522 respondents. Among these 156 (28%) were males and 396 (72%) were females. The median age of males was 42 years (q1=37: q3=49) and 42 years (q1=34: q3=49) for females. The median duration on ART was 46 months (q1=26; q3=49) for males and 46 months (q1=31; q3=49) for females. Among the respondents 512 (92.75%) owned a cell phone. The preferred language for SMS communication was Shona 359 (72%) followed by English 132 (27 %) Among those who owned a cell phone, 378 (75.73%) preferred a text message as a means of communication. Ninety-seven (18.95%) of the respondents who owned cellphones, reported losing or having the phone damaged 12 months prior to the study. Four hundred and ninety-nine respondents (97.4%) thought a text message could be useful in adherence to ART. However, 496 (97.06%) among those with cellphones were willing to be reminded by SMS to take their ART medication. Demographic characteristics stratified by sex are presented in Table 1.
Socio-demography bivariate analysis
Females were 1.24 times more likely to report a willingness to receive SMS reminders compared to men (p=0.77). Age above 40 years (OR=1.3; p=0.54); being on ART for less than 12 months (OR=1.7; p=0.6); being in a union (OR=3; p=0.06) and being in a polygamous relationship (OR=1.8; p=0.59) were positively associated with willingness to receive SMS reminders. Those who were employed (OR= 1.5; p=0.39) were more likely to report a willingness to receive SMS reminders. However, those whose household income was above US$100 (OR=0.8; p=0.18) were less likely to report a willingness to receive SMS. Those who stayed with a spouse, (OR=2.4; p=0.18), children (OR=1.22; p=0.79) and a relative (OR = 1.96; p>0.05) were likely to report willingness to receive SMS reminders. On the other hand, those who stayed with parents (OR=0.3; p=0.11), took alcohol (OR=0.64; p=0.5) and were smokers (OR=0.36; p=0.2) were less likely to report a willingness to receive SMS reminders.
109

Texila International Journal of Public Health Volume 5, Issue 1, M 2017
Environmental factors bivariate analysis
Environmental factors positively associated with willingness to receive SMS reminders included; transport cost to health centre below US$1.00 (OR=1.8: p=0.59), duration of travel to health centre< 30 minutes (OR=2.2: p=0.13), reportedly losing income due to coming to health centre for reviews (OR=1.5; p=0.39), collecting medicine on their own all the time (OR=1.24; p=0.69), being satisfied with appointment schedule (OR=1.7; p=0.6) and walking to health centre as the mode of transport (OR=3 p=0.06). Those who reported a change in household expenditure due to being on ART (OR=0.8; p=0.18), being away from home as a cause for missing a dose (OR=0.2; p=0.2), were less likely to report a willingness to receive SMS reminders for adherence. None of the environmental factors was statistically significant.
Provider-patient relationship bivariate analysis
We found respondents who thought they were treated with respect at the ART Centre (OR=3.3; p=0.28), given a chance to ask questions (OR=7.7; p=0.1), were satisfied with health workers at the Centre (OR=3.1; p=0.04), satisfied with confidentiality at the centre (OR=2.3; p=0.4),fully convinced that were infected and need ART (OR=18; p=0.05), those who thought ART was of benefit to them (OR=6.1; p=0.06) and were satisfied with health changes since they commenced ART (OR=2.5; p=0.3) were more likely to report willingness to receive SMS reminders for adherence. Those who had missed ART for at least 3 days in the 3 months preceding the study (OR=0.3; p=0.37), had missed ART 4 weeks prior to the study (OR=0.81; p=0.5), had ever missed an appointment since initiation (OR=0.7; p=0.5) were less likely to report willing to receive an SMS reminder for adherence. However, only being satisfied with health workers at the center (OR=3.1; p=0.04) was statistically significant.
Behavioral factors bivariate analysis
Feeling comfortable to take ART in front of others (OR=1.6; p= 0.37); use of a reminder mechanism (OR=2.4; p=0.16); having disclosed HIV status to someone, (OR=6.5; p=0.17), disclosure to spouse (OR= 3.68; p=0.03); disclosure to parents (OR=2.6; p=0.07), disclosure to children (OR=1.6; p=0.36) and disclosure to church mates (OR=1.1 p>0.05) were positively associated with reporting willingness to receive SMS reminders for adherence. Other factors that had positive associations were, reporting a feeling of confidence in the ability to take medication (OR=6.5; p=0.5), having another person to remind to take medicine (OR=2.1; p=0.17), the ‘medicine buddy’ knowing what the medicine is for (OR=2.9; p= 0.8); confidence that client will take medicine daily (OR=3.3; p=0.23) and confidence that one would take the medication at the right time (OR=3.8; p=0.18). On the other hand, having disclosed to an employer (OR=0.4; p=0.45) and having disclosed to a friend (OR=0.9; p=0.88) were negatively associated with willingness to receive SMS reminders. Those who had doubts about HIV in general (OR=0.05; p<0.05), or doubted their ability to take ART (OR=0.5; p>0.05) were less likely to report a willingness to be reminded to take ART using SMS reminders. Having a sense of support from family (OR=1.5; p=0.6) and a sense of support from significant others (OR=3.06 p=0.05) was positively associated with willingness to receive SMS reminders. Being satisfied with the support of family (OR=4.5 p=0.13) and being satisfied with the support from significant other (OR=7; p=0.4) were also positively associated with willingness to receive SMS reminders.
Patterns of cell phone use on bivariate analysis
There was a positive association between, thinking that an SMS is useful for adherence (OR=241; p<0.05), ability to read and send SMS from the phone (OR=6.78; p=0.01), having text message as preferred communication means (OR=22.8; p<0.05) using cell phone as a medication reminder (OR=6.9; p<0.05) and willingness to receive SMS reminder for adherence. All these were statistically significant. Those who shared cellphone (OR=0.68; p=0.4) or put their cell phone where other people had access (OR=0.8; p>0.05), whose phone
110

Texila International Journal of Public Health Volume 5, Issue 1, Mar 2017
had a lock code (OR=0.57; p=0.5) were less likely to be willing to receive SMS reminders for adherence. However, these were not statistically significant at 95% confidence level.
Independent factors
In backward stepwise logistic regression, those who thought ART benefits them (a OR=0.2 p=0.04), had disclosed HIV status to family (a OR=5.37; p=0.04),indicated schedules appointments are 3 months (a OR=6.59; p=0.04), thinking text messages are helpful in adherence to ART (a OR=185.7; p<0.05), and used a cellphone as a medication reminder (a OR=4.8; p=0.03) remained statistically significant. The variables with a p value less than 0.25 are presented in Table 3.
Discussion
In this study, we found a higher cell phone ownership percentage of 92.75% among clients on ART. Similar cell phone coverages were reported in studies carried out by Xiaoab in China (88%), Kabede in Ethiopia (84%), and Person in the USA reported (77%).22,28,30 However, these were all lower than the cell phone coverage among clients at Rimuka whose coverage was 92.75%. The majority of respondents in this study 318 (75%) preferred text as routine communication; similar findings were reported Kabede et. al. (2015) who reported a text preference of 70%. We found 483 (84%) of the respondents, already using cellphones as reminders for medication. This is similar to 79% usage of cellphones as medicine reminders reported by Tamaryn et. al. (2010) in a study done in South Africa.20 Theft or damage to phones may derail any SMS interventions; in this study 97(18%) of respondents reported phone theft or damage in the 12 months preceding the study. This was lower than 28% reported by Tamaryn et. al. (2010) in South Africa and 51% reported by Kabede et. al. (2015) in Ethiopia.20, 28
We found that males were less likely to be willing to receive SMS reminders (OR=0.8; p=0.77). This was consistent with Xiaoab et. al. (2013) in China and Leite et al (2014) in America.22.24This may be explained in part by the late health seeking behavior of males. We found that as age increased above 40 years respondents were willing to receive SMS reminders (OR=1.3; p=0.54), those in a union (OR=3; p=0.06) were also likely to report a willingness to receive SMS reminders. Those with education attainment above ordinary level (Form 4) (OR=2.2; p=0.13) were more likely to report a willingness to receive SMS reminders. These findings are consistent with what was reported by Xiaoab et. al. (2013) and Bologun et. al. (2012).22.25Being in a union, advancing age and having attained education above the fourth form are all signs of maturity. It follows that such respondents are expected to be responsible in life and are motivated by any intervention that may prolong their lives. Contrary to our findings Madhvani et. al. (2015) and Kabede et. al. (2015) reported that younger ages were more likely to accept receiving SMS reminders.4,28We also found that those who took alcohol were less likely to be willing to receive SMS reminders (OR=0.64; p=0.5).This is consistent with the finding of Xiaoab et. al. (2013).22
We found that there was a positive association between duration of travel to health center less than 30 minutes (OR=2.2; p=0.13), and disclosing HIV status to someone (OR=6.5; p=0.17). We would like to think that our respondents did not have transport barriers; this implies that our findings are contrary to what was reported by Piette et. al. (2010); in Honduras, who reported that clients who had transport barriers were more likely to report a willingness to receive SMS reminders.23 There may be a need to investigate why those who miss ART due to being away from home (OR=0.2 p=0.2), are less likely to report willingness as this may be due to perceived stigma by respondents.
All respondents in this study indicated that they were satisfied with the service at the Health Centre.This is near twice the 42.4% satisfaction rate with HIV services reported by Tran BX (2012) in Vietnam.38Client satisfaction is a determinant of treatment uptake, adherence and retention, and an important health systems outcome.34,35,36 Therefore, dissatisfaction with antiretroviral services could threaten attainment of anti-retroviral
111

Texila International Journal of Public Health Volume 5, Issue 1, M 2017
treatment objectives.37The provider needs to gain the confidence and trust of the client. If trust is established, the client will be in a better position to listen and follow the advice of the provider ultimately this may translate into behavior change. The respondents who had ever missed appointments since initiation (OR=0.7; p=0.5), were less likely to report willingness to receive SMS reminders and this is inconsistent with Piette et. al. (2010) who reported that ‘patients who had missed appointments were significantly more likely to report willingness to receive SMS reminders for medication.23
Whilst, we found that those who had disclosed their HIV status to employers were less likely to report a willingness to receive SMS reminders (OR=0.4; p=0.45). We also found out that disclosure to a friend was negatively associated with willingness to receive SMS reminders. Under normal circumstances, one would expect employers and friends to provide a supportive environment to promote positive living including behavioral intervention. Disclosure to family (OR=2.6; p=0.07), parents (OR=1.7; p=0.32), children (OR=1.6; p=0.36), or church mates (OR=1.1; p>0.05) was positively associated with willingness to receive SMS reminders. Disclosure is an important entry point for psychosocial support; however, it is often hindered by internal and perceived stigma as well as enacted stigma. Disclosure can be considered a proxy measure for stigma and discrimination.31We found a positive association between the perceived efficacy of taking ART medication daily (OR=3.3; p=0.23), taking the medication at the right time (OR=3.8; p=0.18) and willingness to receive SMS reminders for ART. Self-efficacy for treatment adherence has been identified as an important correlate of medication adherence in the treatment of HIV and other medical conditions.32
In this study, we report a positive association between a perception that SMS is useful (OR=241; p<0.05) and willingness to receive SMS reminders for ART. We found that those who shared cellphones (OR=0.68; p=0.4) or had reported that others could see their messages (OR=0.7; p=0.79) were less likely to report a willingness to receive SMS reminders. This indicates the need for confidentiality in any SMS intervention. Confidentiality of the SMS reminder is important as some clients have internal stigma. If others see the message, it may result in acted stigma. All these are pertinent issues that HIV control programs should take into consideration at the design stage. Mbuagbaw et. al. (2012), reported withdrawal of participants in the CAMPS study due to compromise in confidentiality.16Curioso et. al. (2009) reported that keeping the medication reminders confidential was the most important concern that many clients on ART expressed. Clients did not want “sensitive” words like ‘HIV’, ‘antiretroviral’, or any other word related to HIV included in the SMS text.38
Conclusion
Patients on ART attending Rimuka Integrated TB and HIV clinic are willing to receive SMS messages as medical reminders. The local language (Shona) is the most preferred language for the SMS. Confidentiality of the messages is an issue among the respondents, hence, those who share phones or whose messages are likely to be read by others are less likely to report a willingness to receive SMS reminders. Independent factors for willingness to receive SMS reminders included prior use of cell-phone as medication reminder; thinking a text message could be helpful in adherence to ART; having disclosed HIV status to family; having appointments scheduled at 3-month intervals.
Table 1. Socio Demographics of Respondents Kadoma 2016
Variable Male (156) n= (%)
Female (396) n= (%)
p value
Median Age 42 (q1=37: q3=49) 42 (q1=34: q3=49) Marital status: Married 114 (73.08) 168 (42.53) <0.05 Divorces 10 (6.41) 38 (9.62) <0.05 Separated - 18 (4.56) <0.05 Single 5 (3.21) 29 (7.34) <0.05
112

Texila International Journal of Public Health Volume 5, Issue 1, Mar 2017
Widowed 17 (10.9) 142 (35.95) <0.05 Religion: Apostolic 29 (18.95) 94 (23.86) 0.19 Catholic 34 (22.22) 49 (12.44) <0.05 Muslim 5 (3.27) 9 (2.29) 0.528 None 15 (9.8) 11(2.79) <0.05 Pentecostal 35 (22.8) 158 (40.1) <0.05 Protestant 23 (15.03) 63 (15.99) 0.72 Traditional 12 (7.84) 8(2.03) <0.05 Other 0 2 (0.5) 0.3 Educational attainment: None
3 (1.9) 29 (7.34) <0.05
Primary Education 28(17.95) 82(20.76) 0.46 Secondary Education 120(76.92) 276(69.87) 0.08 Tertiary Education 5 (3.21) 8 (2.03) 0.40 Employment status: Formally Employed
43 (27.74) 40 (10.34) <0.05
Self Employed 73 (42.10) 149 (38.50) 0.04 Not Employed 73 (47.10) 198 (51.16) 0.49 Median Time (months) since diagnosis
46(q1=26; q3=74) 62 (q1=36; q3=94)
Duration on ART (months) 35(q1=30; q3=60.5)
46 (q1=31; q3=7)
Who owns the house: Council rented
10(6.4) 35(8.95) 0.34
Owner 35(22.58) 94(24.04) 0.74 Employer 4(2.58) 9(2.3) 0.83 Family 48(30.9) 113(28.9) 0.52 Private rented 2(1.29) 0 0.04 Subtenant 24(15.48) 72(18.41) 0.40 Other 2(1.29) 0 0.04 Who do you stay with: Relative
0 56(14.15) <0.05
Unstable 13(8.33) 1(0.25) <0.05 Parents 11(7.05) 36(9.11) 0.34 Children 63(40.35) 217(59.94) <0.05 Spouse 105(67.31) 147(37.22) <0.05 Alone 20(12.82) 48(12.15) 0.98
Table 2. Patterns of Cellphone Use Kadoma 2016
Variable Male (156) n= (%)
Female (396) n= (%)
p value
Processes a cellphone 147(94.23) 365 (92.17) Use Cellphone as medication Reminder 125 (85.63) 307 (84.11) 0.4 Willing to be reminded by SMS to take medication.
142(96.6) 353(97.5) 0.5
Preferred cellphone Communication: Voice
30 (20.55) 64 (17.53) 0.5
WhatsApp 8 (5.48) 22 (6.03) 0.38 Text 108 (73.97) 279(76.44) 0.78 How often do you have phone with you: Always
143 (97.280 346(94.79) 0.1
Seldom 1 (0.68) 6(1.64) 0.4 Sometimes 3(2.04) 13(3.56) 0.3
113

Texila International Journal of Public Health Volume 5, Issue 1, M 2017
Cellphone damaged or lost in last 12 months
26 (17.69) 71 (19.45) 0.72
Have alternate number 31 (21.23) 59(16.21) 0.15 Switch off phone during day 16 (10.96) 32 (8.82) 0.41 Times and places where phones are not allowed
36 (24.66) 125(34.25) 0.04
Stores phone where others have access 92 (62.59) 268(73.63) 0.05 Shares phones with others 58 (40.56) 134(36.81) 0.45 Phone has lock code /pattern 26(17.69) 64 (17.53) 0.88 Able to read or send text 136 (92.52) 335 (92.29) 0.44 Delete text deliberately without reading 9 (6.16) 28 (7.73) 0.58 Text likely to be seen by others: Somewhat likely
17(11.56) 39(10.71) 0.71
Somewhat unlikely 5(3.4) 7(1.92) 0.29 Very likely 85(57.82) 224(61.54) 0.65 Very unlikely 40(27.21) 94(25.52) 0.63 Use of internet on phone 32(21.77) 61(16.55) 0.14 Website visited Email 2(6.25) 0 0.02 Google 10(31.25) 4(6.67) 0.0028 Social network 19(59.35) 54(90.04) 0.65 Others 1(3.13) 2(3.33) 0.84 Willingness to be contacted by phone Perception of text message: Useful for adherence
142(96.6) 356(97.8) 0.68
Ruins privacy 1(50) 0 0.11 Other 1(50) 3(100) 0.88 Preferred SMS language: English 58 (40.85) 74 (20.90) 0 Shona 82 (57.75) 277 (78.25) 0.00012 Ndebele 1 (0.70) 3 (0.85) 0.88 Chewa 1 (0.70) - 0.11
Table 3 Bivariate and Multivariate Analysis Kadoma 2016
Variable Willingness to Receive SMS Reminder
OR 95% C.I. p-value
aOR
p-value
Yes No In a union (Coding marriage)
Yes 285 5 2.7 0.90-8.02 0.06 No 211 10
Education above Form 4 (coding Education)
Yes 295 6 2.2 0.77-6.2 0.13 No 201 9
Stays with spouse Yes 234 4 2.4 0.77-7.8 0.18 No 263 11
Stays with parents Yes 39 3 0.34
0.09-1.2 0.11 No 457 13
Fully convinced infected by HIV and needs ART
Yes 492 13 18 3.17-112.7
0.01 0.16
0.04
No 4 2
Use of Cellphone as medication reminder
Yes 425 7 6.93
2.4-19.7 0.0003
4.8 0.03
No 70 8
Prefers Text Yes 411 7 5.5 1.9-1500 0.00
114

Texila International Journal of Public Health Volume 5, Issue 1, Mar 2017
Communication No 85 8 03 Can read and send text on phone
Yes 461 10 6.77
2.1-20.9 0.0003
No 34 5
Thought a text message could be helpful in adherence to ART
Yes 493 6 246 53-1143 0.0000
185.7
<0.05
No 3 9
Duration of travel to Health center < 30 minutes
Yes 334 6 3.09
1.08-8.8 0.02 No 162 9
Given individual health education
Yes 433 11 2.4 0.77-8.08 0.12 No 63 4
Disclosed HIV status to family
Yes 416 10 2.4 0.86-7.8 0.08 5.37
0.04
No 80 5
Appointments scheduled at 3months
Yes 462 11 4.9 1.4-16.3 0.01 6.59
0.04
No 34 4
Acknowledgements
This work was supported financially by Kadoma City Health Department. The KAMP Study Team includes Gift Scholtz, Stella Manyere, Moffat Habibu, Alfred
Maruma, Cecilia Suga, Blessing Banda, Precious Banda, Hamilton Gomba, Pamela Mautsa and Edith Mhike.
References
[1]. Butler LM: Mobile health technologies (mHealth) for promoting adherence to antiretroviral therapy: a systematic review: WHO. [2]. Balogun MR, et. al. Access to information technology and willingness to receive text message reminders for childhood immunization among mothers attending a tertiary facility in Lagos, Nigeria. South Afr J Child Health. 2012. [3]. Bangure D et. al. Effectiveness of Short message services on Childhood Immunization program in Kadoma BMC [4]. Curioso W et. al. at Universidad Peruana Cayetano Heredia. “Evaluation of a Computer-Based System Using Cell Phones for HIV-Infected People in Peru.” ClinicalTrials.gov # NCT01118767 [5]. David L. Paterson, Adherence to Protease Inhibitor Therapy and Outcomes in Patients with HIV Infection: Ann Intern Med. 2000; 133:21-30. [6]. da Costa et. al. Results of a randomized controlled trial to assess the effects of a mobile SMS-based intervention on treatment adherence in HIV/AIDS-infected Brazilian women and impressions and satisfaction with respect to incoming messages. Int J Med Inform. 2012. [7]. El-Khatib Z. Virologic failure and HIV-1 drug resistance among antiretroviral therapy recipients in an urban resource-limited setting — the South African Virologic Evaluation (SAVE) study. Karolinska Institute, Stockholm, Sweden. 2011. [8]. Edward L. Machtinger Adherence to HIV Antiretroviral Therapy: HIV InSite Knowledge Base Chapter. [9]. GSMA Intelligence: The Mobile Economy Sub-Saharan Africa 2014. GSMA Intelligence 2014. [10]. International Telecommunication Union: measuring the information society.2012. http://www.itu.int/dms_pub/itu-d/opb/ind/D-IND-ICTOI-2012-SUMPDF- E.pdf. Accessed 11 July 2015.). [11]. ITU: ICT facts and Figure 2015: ITU 2016. [12]. Ikeda et. al. SMS messaging improves treatment outcome among the HIV-positive Mayan population in rural Guatemala. In: XIX International AIDS Conference, Washington, 22-27 July 2012, #TUPE673 (Poster).
115

Texila International Journal of Public Health Volume 5, Issue 1, M 2017
[13]. Kabede et. al. Willingness to receive text message medication reminders among patients on antiretroviral treatment in North West Ethiopia: A cross-sectional study. BMC Medical Informatics and Decision Making (2015) 15:65 [14]. Kayode O. Osungbade et. al. Patients’ Satisfaction with Quality of Anti-Retroviral Services in Central Nigeria: Implications for Strengthening Private Health Services; World Journal of Preventive Medicine, 2013 [15]. Leite L et. al. Cell phone utilization among foreign-born Latinos: a promising tool for dissemination of health and HIV information. J Immigr Minor Health. 2014. [16]. Lindsay S. Youth’s acceptance of mobile phone text messaging for STI Health promotion. Edited by Columbia Tuob. Vancouver: The University of British Columbia; 2013. [17]. Lester et al. Effects of a mobile phone short message service on antiretroviral treatment adherence in Kenya (WelTel Kenya1): a randomised trial. Lancet 2010. [18]. Mills, E.J., Nachega, J.B., Bangsberg, D.R., et al. Adherence to HAART: a systematic review of developed and developing nation patient-reported barriers and facilitators. PLoS Med. 3 (11), e4382006 [19]. Madhvani Naieya: Correlates of mobile phone use in HIV Care: Results from a cross-sectional study in South Africa: Preventative Medicine Reports 2 (2015) [20]. Mbuagbaw et. al. The Cameroon Mobile Phone SMS (CAMPS) trial: a randomized trial of text messaging versus usual care for adherence to antiretroviral therapy. PLoS One. 2012; 7(12):e46909. [21]. Muringazuva et. al. Factors associated with Adherence to Anti-retroviral therapy among HIV clients Kadoma City accessed 12 October 2015 on http://reserachdatabase.ac.zw/view/creators/muringazuva [22]. Mallory O. Johnson; The Role of Self-Efficacy in HIV Treatment Adherence: Validation of the HIV [23]. Natsayi Chimbindi, Till Bärnighausen, Marie-Louise Newell Patient satisfaction with HIV and TB treatment in a public programme in rural KwaZulu-Natal: evidence from patient-exit interviews . BMC Health Services Research 2014, 14:32 [24]. POTRAZ: Postal and Telecommunication Sector Performance Report fourth Quarter 2015: POTRAZ 2015 [25]. Pop-Eleches et. al. Mobile phone technologies improve adherence to antiretroviral treatment in a resource-limited setting: a randomized controlled trial of text message reminders. AIDS 2011 [26]. Piette JD, et. al. Access to mobile communication technology and willingness to participate in automated telemedicine calls among chronically ill patients in Honduras. Telemed J E Health. 2010. [27]. Person Anna K. Text Messaging for Enhancement of Testing and Treatment for Tuberculosis, Human Immunodeficiency Virus, and Syphilis: A Survey of Attitudes Toward Cellular Phones and Healthcare; TELEMEDICINE and e-HEALTH APRIL 2011 [28]. Rodrigues, R., Shet, A., Antony, J., et al. Supporting adherence to antiretroviral therapy with mobile phone reminders: results from a cohort in South India. PLoS One 7 (8), e40723. 2012 [29]. Reiter GS, Stewart KE, Wojtusik L. Elements of success in HIV clinical care: Multiple interventions that promote adherence. Topics in HIV Medicine 2000: 867. [30]. Roberts MJ, Hsiao W, Berman P, Reich MR: Getting health reform right: a guide to improving performance and equity. New York: Oxford University Press; 2003. [31]. Stephen M, Franz E, Thomas S. A conceptual framework for designing mHealth solutions for developing countries. In: UN Foundation – Vodafone Foundation Partnership. 2009. [32]. Suzanne Maman; HIV Status Disclosure to Families for Social Support in South Africa (NIMH Project Accept/ HPTN 043) AIDS Care. 2014 February [33]. Tamaryn C, Corless IB, Janet G, Patrice KN, Quentin E, Lisa MB. Exploring the patterns of use and the feasibility of using cellular phones for clinic appointment reminders and adherence messages in an antiretroviral treatment clinic, Durban, South Africa. AIDS Patient Care STDS. 2010. [34]. Tran BX, Nguyen NPT (2012) Patient Satisfaction with HIV/AIDS Care and Treatment in the Decentralization of Services Delivery in Vietnam. PLoS ONE 7(10): e46680. doi:10.1371/journal.pone.0046680),
116

Texila International Journal of Public Health Volume 5, Issue 1, Mar 2017
[35]. Xiaoab Y, Jic G, Tiana C, Lia H, Biaod W, Hu Z. Acceptability, and factors associated with willingness to receive short messages for improving antiretroviral therapy adherence in China. AIDS Care. 2013. [36]. Zoran Bursac et. al. Purposeful selection of variables in logistic regression: Source Code for Biology and Medicine 2008, 3:17 [37]. WHO: World health report: Health systems: improving performance. Geneva: WHO; 2000. [38]. Walter H. Curioso, “It´s time for your life": How should we remind patients to take medicines using short text messages? AMIA 2009 Symposium Proceedings.
117

Texila International Journal of Public Health Volume 5, Issue 1, Mar 2017
Environmental Indices and Awareness among Residents of Klerksdorp, South Africa (A Cross-Section Study)
Article by O.O Alewi Ph.D in Public Health, Texila American University, South Africa
E-mail: [email protected]
Abstract
While increase in urbanization and industrialization has brought many social benefits, including high living standard, economic prosperity, and education. Regrettably, it has also “invited” many material and social problems, diseases, epidemics from poor environmental awareness and behaviour-which all lead invariably to reduce health status of the population; by way of increased air pollution from vehicular congestion, and industrial revolution with their attendant noise pollution, human activities tampering with the eco system and ozone depletion just among others.
The aim of this cross-sectional study is to assess the level of environmental indices awareness and education about the associated diseases that results from poor environmental health practices; among residents of Klerksdorp city in South Africa. A cross sectional study of 100 residents was conducted using a random multistage cluster sampling technique. The target population was drawn from Klerksdorp residents (55% male and 45% female) between the ages of 20 and 65 years. Data collection was performed using a well-structured self-administered, 35-item questionnaire covering environmental awareness on ten indices of environmental factors, and knowledge of adverse health effects associated with them with therapeutic options. Only 13% on the average have basic environmental health awareness of the indices; leading to a very poor correlation between awareness and associated diseases. 21% of the respondents have knowledge of adverse health effects associated with environmental hazards. Therapeutic options were fairly demonstrated however; as over 70% know they have to seek medical attention from hospital if they feel sick. Males score relatively higher than females especially on air pollution and its ill-effects. The study concludes that, there is an urgent need for health promotion in terms of environmental health and indices awareness and health education about healthy environmental practices among the residents survey with a view to enhance health care system.
Introduction
The study of disease is really the study of man and his environment (Park, 2013).Environmental health is one of the core subjects of public health. It is a study of the determinants of the distribution of disease that are exogenous to the correct functioning of human beings. (Rothman & Greenland, 1998). Indices for environmental health includes, air pollution (from organic fossil burning, car exhausts and industrial wastes), contaminated water, sewage remains, noise pollution, ozone depletion, greenhouse effects, radiation, etc. A number of human activities are the causes of the disruptions of the environment, resulting in ill-health. For example fossil fuel releases a lot of carbon dioxide (CO2) into the atmosphere, thereby altering the natural Eco balance of CO2 in the air. Evaluation of environmental health starts with analyzing the awareness of environmental health indices among population of any particular community. This also includes raising awareness and education about environmental health issues across different stakeholders (policy-makers, health practitioners, industry, public, and the media, etc). Investigating potential links between the environment and health (Briggs, 1994).
Environmental health priorities vary significantly from country to country, especially, between developed nations and less developed ones (WHO 1992, 1999). This capstone
118

Texila International Journal of Public Health Volume 5, Issue 1, Mar 2017
project aim is to look at these environmental indices, the level of awareness about them and knowledge about the associated health risks or diseases among the studied population.
For a practical application of environmental health awareness to be meaningful, policy makers or government must integrate the knowledge and wholesome practice of environmental health among its citizenry.
For example, addressing water pollution and sustainability issues is of great importance to environmentalist and public health specialist (Bugyi & McKeown, 2015). Man need to manage diseases firstly, from paying more than usual attention to its immediate environment.
Background of study area
Klerksdorp is a city located within the Matlosane Municipality in the Northwest province of South Africa. The municipality comprises the towns of Orkney, Kanana, Stilfontein, Haartbeesfontein, Khuma and Tigane. It is resident to a population of 398,676 (population 2011). Total area of the city is 3,561km2 (1,375 sq mi). Klerksdorp racial profiling is made up of Blacks 81%, Whites 14.5%, Coloured 3.5%, and Indian/Asian 0.8%. This distribution is closely similar to the South African national racial population; hence this cross section study in Klerksdorp gives a good national representation of the level of environmental health awareness among the various racial groups.
Aims of the study
To evaluate the level of awareness of environmental indices and knowledge about environmental related diseases among Klerksdorp residents.
Significance of the study
The outcome of this study will contribute to the following: 1. This study will provide useful information about the people’s knowledge about
environmental health. 2. This study will evaluate the awareness among the residents of the environmental
indices. 3. This study will help policy makers and local government authorities about the need for
necessary health promotion and awareness practice.
Picture 1. Midvaal water treatment plant in Klerksdorp.
Study limitation
The sample size was small due to time constraint. A larger representative sample would have yielded a more valid result.
Literature review
A study by Badr Hel-S, found that the level of environmental worry among high school teacher in Kuwait is significantly positively related to their environmental awareness. (Badr Hel-S, 2003). Such is the significance of this study among the residents of Klerksdorp. Their
119

Texila International Journal of Public Health Volume 5, Issue 1, Mar 2017
level of awareness is relatively very poor. There has not been a national survey or research in South Africa to assess or evaluate environmental health awareness and its impact on government health system and population behaviours. The available literature is on-going in the city of Cape Town public environment awareness, education and training strategy study, which aim among others is to have an environmentally informed, empowered, and educated skill city. (PEAETS, 2011).
On an international scale, the National Institute of Environmental Health Sciences (NIEHS) under the United States department of health and human services has been involving in innovative research in the area of environmental health with a goal to improve the public health by preventing diseases and disabilities. The institute was able to realise that because environmental health issues crosses national and international boundaries, conducting research studies all across the globe will benefit not only the local population living where the studies are being conducted but all the populations with environmental health problems. (NIEHS, 2015). Most of the studies start with checking the level of environmental health awareness among the people being studied. Effects of environmental health awareness have been observed to be growing among human. (Liu, 2015). More studies are on-going at investigating the exposure effects of chemical, social or physical factors in relation to complex ailments.
Health effects of environmental hazards: The WHO in 2014 releases in its news centres that 7 million premature deaths occur annually due to exposure to air pollution. This is 1 in 8 of total global mortality. (WHO, 2014).Air pollution causes chronic bronchitis, bronchiectasis, emphysema, chronic obstructive pulmonary disease (COPD), lung cancer, skin cancer, etc. (Fowkes, 1992). According to a study conducted in Connecticut, USA, regarding the harmful effects of vehicular air pollution it was found that asthma, COPD, lung cancer, diabetes mellitus, are all exacerbated by motor vehicle pollution exposure.(John, et al, 2006). Radiation exposure from hazardous chemicals and electromagnetic sources reduces the number of fighting blood cells and lymphocytes in the human body, causes central nervous system (CNS) damage, alopecia (baldness), and skin erythema when radiation dose is equal to or exceeds 100mSv. (Kamiya & Susatani, 2012).
Ozone depletion: Ozone layer protects the earth from the damaging effect of ultraviolet radiation. Man emits chlorofluorocarbons (CFCs) to the atmosphere depleting ozone layer which results in harmful radiations of the sun reflected back to earth. According to skin cancer statistics, in the United Kingdom, ultraviolet radiation remains the major avoidable risk factor for skin cancer. (Cancer research UK, 2012). Ozone layer depletion from unhealthy human practices also increases the amount of ultraviolet radiation B, (UVB) reaching us which causes non-melanoma cancer and malignant melanoma development. (EPA, 2014). Noise pollution from cities and industrial workplaces is associated with hearing loss, ischemic heart disease, hypertension, annoyance and of course sleep disturbance. Evidence link exposure to noise above 60 decibel (dB) in the day time and above 45dB at night to an increased evidence of arterial hypertension, mental health disorder, noise induced stress, and sleep disturbances. (SPH, 2011). Noise effects are not only stressful, disturbing and irritating; it also causes after-effects health wise. (Spreng, 2004). Some of the common sources of noise pollution and the amount of rating in decibels are provided in Table1. below.
Table 1.Source credited to NIDCD.
SOURCES NOISE RATING IN DECIBEL The humming of a refrigerator 45 Normal conversation 60 Noise from heavy traffic 85 Motorcycles 95 An MP3 player at max. volume 105 Sirens 120 Firecrackers and firearms 150
120

Texila International Journal of Public Health Volume 5, Issue 1, Mar 2017
Hazards also come from poor water treatment, sewage treatment, car pollution, deforestation among others. Comprehensive research into the environmental health becomes more imperative in order to prevent diseases associated with these menace and improve public health practice. According to Gilberto Talero (2004), even with improved public awareness about environmental issue, lack of enough environmental knowledge can still impede achieving a sustainable health for humankind both at local and global levels. Legislation on water safety precautions, banning toxic chemicals in industrial discharge into water sources are also necessary steps of environmental health practice. (Joshua, et al, 2015).
Methodology
This study is a qualitative research. Qualitative research paradigms offer a perspective in exploring and in understanding human behaviours that comes from a different philosophy than quantitative research methods. (Portney & Watkins, 2009). In this research, details of the participant’s feedback from the questionnaire given were analysed with narrative summaries to express the data.
Study type
This study is a cross sectional study.
Study setting
The study was conducted at Klerksdorp city, South Africa.
Study population
The study population was 100 people, 55 males, and 45 females. These numbers were randomly selected. Sample size calculation done using: The minimum sample size (n) using Slovin’s formula: n = N/1+Ne2
• Where n is the minimum sample size needed • e is the level of error that can be tolerated (0.05 chance of error) • N is the target population = (140) n = 140/1 + (140*0.052) n= 140/1 + (0.35) n=103 , approximately 100.
Data collection and analysis
Data were collected using a pretested, self-administered questionnaire which contains 35 open and close ended questions in a proportionate sampling of people that make up the city of Klerksdorp. Sampling was drawn from Klerksdorp, Orkney, Kanana, Stilfontein, Haartbeesfontein, Khuma, and Tigane in a cluster fashion. From Klerksdorp, 15 respondents; Orkney, 15; Kanana, 15; Stilfontein, 15; Haartbeesfontein, 15; Khuma, 15; and Tigane, 10. Sampling was done using random multistage cluster sampling technique. Information was collected over a period of 2 weeks travelling between these towns.
Collected data was summarized using frequency tables and bar chart. The analytical approach used was deductive reasoning
Ethical considerations
The institution (Texila American University) has not sent an ethical clearance certificate yet; however, a bonafide letter will be given in 3 days’ time. Written informed consent was sought from the participants. Permission to carry out this study was given by individual consent as studied population provided questionnaire feedback signed an informed consent.
121

Texila International Journal of Public Health Volume 5, Issue 1, Mar 2017
Results
Demographics
A total of 100 respondents took park in this study. Of these numbers, 55 were male, while 45 were female. This is depicted in figure 1 below. From these numbers, eighty five percent (n=85) were university/college graduate, while fifteen percent (n=15) have grade 12 qualification.
Fig.1
Fig.2
Figure 2 above represent the age distribution of the respondents. Majority were in the age range of 30-40 years (35%); followed by individuals age 40-50 (25%); 20% were between the age of 20 and 30. Old adults (60-70 years) represent 10%, while people between the age of 50 and 60 also represent 10%.
122

Texila International Journal of Public Health Volume 5, Issue 1, Mar 2017
Fig.3
Environmental health awareness
Figure 3 above summarises the outcome of interest as per the knowledge and awareness about the determinants or indices of the environment. Approximately, one-third, representing (34%) of the respondents demonstrate good knowledge and awareness about the effects of car pollution on human health. They acknowledge that car pollution especially in commercial cities can cause various lung diseases and negatively impact health. A quarter (25%) expresses knowledge of hazards associated with poor management or handling or treatment of domestic garbage. They offer practical advice on how to better manage our daily garbage by regular disposal in an airtight polythene plastic and quick removal from homes by the municipal council workers for utmost treatment. This is a common practice in the city of Klerksdorp. Meanwhile, a greater proportion of the respondents (over 90%) know about garbage disposal, only 25% demonstrate acceptable knowledge of the impact of not disposing garbage properly can cause to health. They indicate that diseases such as cholera, lung disease, skin infection can result from poor garbage handling at home or at the work places.
Diseases associated with poor environmental indices awareness
This study only show that the respondents although, few could only attribute ill health to poor water treatment (15%), poor sewage treatment (15%), car pollution (34%), industrial pollution (17%) and poor garbage handling (25%); most do not know or made aware that other environmental health determinants like noise pollution, deforestation, ozone depletion, greenhouse effects, and radiation has tremendous negative impact on our health. These five indices really need attention in the community in terms of health education. Only four of the respondents acknowledge that putting mobile phones in chest pocket can be dangerous as it emits some amount of electromagnetic radiation dangerous to the body when frequently exposed.
123

Texila International Journal of Public Health Volume 5, Issue 1, Mar 2017
Fig.4
As clearly indicated in figure 4 above, men demonstrate relatively better level of environmental health awareness and education than women. This study, however, did not seek the reason for this difference. The difference could be due to level of education and information; as men appears to be better educated from the data.
Table. 1 Table 1 indicate the racial proportion of the study. Most of the respondents (85%) are black
South Africans; white represent 9%; coloured, 4%; while Indians only constitute 2%. This ratio is similar to the South African national distribution (Blacks 79.2%, Whites, 8.9%, Coloured 8.9%, and Indian 2.5%) (census 2011).
124

Texila International Journal of Public Health Volume 5, Issue 1, Mar 2017
Table. 2. Knowledge about environmental related diseases was very poor as demonstrated by table 2
above.
Discussion
This cross sectional study has been able to show that there is an unacceptable level of environmental health indices and awareness among the population studied.85% of the respondents were college graduates, while 15% were grade 12 holders. The level of awareness in this study can be said to be adapted from educated ones in the society, yet the outcome was very poor. Fig.2. shows the age distribution as between 20 and 65 years. This is a working age in South Africa, and one would have expected a more knowledge base from this age group; but the result did not correlate. In Fig.3, the indices that received fairly good outcome were car pollution (34%) and garbage treatment/handling (25%) at least relatively. Knowledge and awareness in the other 8 indices or determinants were terrible. Many natural or human physical activities are responsible for the release of toxic chemicals into the environment, especially causing air pollution. (Kampa & Castanas, 2007). Thus, people should be aware of the health implications of these actions. In this study there is also a poor correlation between the adverse effects associated with environmental health and health care consumption. The city should as a matter of urgency, do more in terms of health education, awareness campaigns and health promotion to inform its citizens, especially on environmental health issues. This could be achieved by providing the citizens with health education information via social media, formal and informal training. The results of this study indicate the level of health promotion as very poor. While there has been a study on the effects of environmental knowledge among children (Fisman, 2005), there should be among adults as well. People in the study area are not equipped with adequate knowledge about their health in terms of environmental impact. Many do not even know there is a layer of the atmosphere called ozone, or its relevance to their health. People will continue to degrade the environment through pollution, release of CFCs and unnecessarily exposed themselves to unacceptable decibels, and radiation because of lack of awareness about the effects of these actions on their health. These issues are a global concern, particularly in developing nations such as evident in South Africa from this study. Poor environmental health induced diseases like, cholera, typhoid fever, skin cancer, tuberculosis, silicosis, and lung disorders have killed millions in Africa and this scourge is still on the increase particularly in developing nations of the world. Glasgow et al (1999) observed that there is a need for comprehensive evaluation framework to improve public health and community based interventions. With the local results from this cross sectional study in Klerksdorp district comprehensive evaluation and advocacy for health
125

Texila International Journal of Public Health Volume 5, Issue 1, Mar 2017
promotion is equally non-negotiable. This study collaborates well with previous two studies done to evaluate the impact of environmental health education and awareness among various populations. First, there was a study in the year 2000 in Malaysia to evaluate the effect of introducing environmental health education and awareness course among student in a pre-post -test design. Post assessments a year later indicate that the level of awareness and knowledge of environmental health has improved. (Amin et al, 2012). In another study, held in Palestinian refugee camp in 2006, a one year study was done to evaluate the impact of environmental health and awareness program among the refugees. After one year on intervention in a pre-post-test design there was also an improvement of environmental health in the camp. (Mourad, 2006). These two studies supported the importance and significance of environmental health education and awareness at improving and promoting environmental health.
Conclusion
This study clearly demonstrates a low level of awareness about environmental health indices and the diseases associated with them. Hearing loss due to noise pollution referred to as noise-induced hearing loss continues to plaque our society. Environmental health remains one of the core subjects of public health and there is more than urgent need to create the much needed awareness about environmental issues and disease in the context of environmental health practices. With well informed and educated society, we all can positively impact our socio-economic status and environmental health. With the result obtained from this cross section study, is it concluded that there is an unacceptable poor level of environmental health knowledge among the studied population, hence, urgent need for health promotion in this regard.
Recommendations
There is a need for the South African governments, to include environmental health education in the school curricula, starting from elementary school. Health promotion should receive a boost in terms of educating the public through mass media, social media, formal and informal methods. Benchmarking of the Norwegian environmental education system can be adapted to South Africa local scenario and need. The Norwegian approach was in line with the United Nations Educational Scientific and Cultural Organization (UNESCO) goal. Their ministry of education strategy was that all pupils should receive environmental education. Because the study find out that people could not relate well with governmental intervention in terms of its health economics and management principles, environmental health public awareness should be shaped by economic, social, religion, cultural and educational inputs. It has been shown through similar study that public environmental education and communication are the key tools for reaching out on effective delivery of awareness campaign. (Talero, 2004).
Further studies on environmental health awareness should be conducted with larger sample size in order to add to the reliability and validity of the study. A quantitative research on this subject should also be undertaking with a view to having a systematic review literature on the subject.
References
[1]. Badr, Hel-S. (2003). Environmental awareness and worry among high school teachers in Kuwait. J Egypt Public Health Assoc, 78(3-4), 319-39. Retrieved from http://www.ncbi.nlm.nih.gov/pubmed/17265620 [2]. Briggs, D. (1994). Environmental Health Indicators: Framework and methodologies. WHO, Geneva. http://apps.who.int/iris/bitstream/10665/66016/1/WH [3]. Bastable, B. Susan, Gramet, Pamela, Jacobs, Karen, Sopczyk, L. Deborah. (2011). Health Professional as Educator: Principles of Teaching and Learning. Sandbury. Jones & Bartlett Learning.
126

Texila International Journal of Public Health Volume 5, Issue 1, Mar 2017
[4]. Cancer Research UK. (2012). Skin cancer diagnosis and treatment statistics. Retrieved from www.cancerresearchuk.org/health-professional/cancer-statistics-by-cancer-type/skin-cancer/diagnosis-and-treatm [5]. City of Matlosane. (2011). Retrieved from https://en.wikipedia.org/wiki/City_of_Matlosana [6]. Demographics of South Africa. (2011). Retrieved from https://en.wikipedia.org/wiki/Demographics_of_So [7]. Fowkes, F.G.R. Maxcy-Rosenau-Last Public Health and Preventive Medicine. (1992). J Epidemiol Community Health, 46(6), 631. [8]. Glasgow, R.E., Vogt, T.M. & Boles, S.M.(1999). Evaluating the public health impact of health promotion interventions: the RE-AIM Framework. American Journal of Public Health, 89(9), 1322-1327. Doi:10.2105/AJPM.89.9.132 [9]. George, Bugyi; Elaine, A. Mckeown. (2015). Impact of water pollution on Human and Environmental Sustainability. Retrieved from https://www.safaribooksonline.com/library/view/impact-of-water/9781466695597 [10]. Health and Environmental Effects of Ozone Layer Depletion. (2015). Retrieved from https://www.epa.gov/ozone-layer-protection/health-and-environmental effects-ozone-layer-depletion. [11]. John, Wargo; Linda, Wargo; Nancy, Alderman. (2006). The Harmful Effects of Vehicle Exhaust: A case for policy change. Retrieved from www.ehhi.org/exhaust06.pdf. [12]. Joshua, Nizel, Halder; M. Nazral, Islam. (2015). Water Pollution and its Impact on the Human Health. Journal of Environment and Human, 2(1). [13]. Kamiya, K; Sasatani, M. (2012). Effects of radiation exposure on human body. NihonRinsho, 70(3), 367-74. Retrieved from http://www.ncbi.nlm.nih.gov/pubmed/22514910. [14]. Liu, Chen-Yu. (2015). Epidemiology of Environmental Health. Environmental Epigenetics, Molecular and Integrative Toxicology, DOI 10.1007/978-1-4471-6678-8_2 [15]. Latifah, Amin., Zurina, Mahadi., Rozita, Ibrahim., Mashitoh, Yaacob & Zubaidah, Nasir. (2012). The Effectiveness of the ‘Environment &Health’ course in Increasing Students’ Awareness & Knowledge on Environment Health Issues. Procedia-Social and Behavioral Sciences, 59, 77-84. http://dx.doi.org/10.1016/j.sbspro.2012.09.248 [16]. Lianne, Fisman. (2005). The effects of Local Learning on Environmental Awareness in Children: An Empirical Investigation. The Journal of Environmental Education, 36(3). [17]. Marilena, Kampa & Elias, Castanas. (2007). Human health effects of air pollution. Environmental Pollution, 151, 362-367. [18]. National Institute of Environmental Health Sciences (NIEHS). (2015) Retrieved from http://www.niehs.nih.gov/research [19]. Portney, L.G. & Watkins, M.P. (2009). Foundations of Clinical Research: Applications to Practice. Upper Saddle River. Pearson prentice hall. [20]. Park, K. (2013). Social and Preventive Medicine. Jabalpur. Bhanot [21]. Public Environmental Awareness, Education and Training Strategy (PEAETS). (2011). [22]. Rothman & Greenland. (1998). Modern Epidemiology. Philadelphia. Lippincolt-Raven Publishers. [23]. Spreng, M. (2004). Noise induced nortunal cortisol secretion and tolerable overhead flights. Noise & Health Journal, 6(22), 35-47. Retrieved from www.noiseandhealth.org/article.asp? [24]. South Africa’s population. (2015) .Retrieved from http://www.southafrica.info/about/people/population [25]. Talero, G. (2004). Environmental Education And Public Awareness. Victoria, Canada. Retrieved from http://worldfish.org/PPA/PDFs/Semi-Annual%/2011%/ [26]. Tayser, A.M, Abu, Mourad. (2006). The impact of an environmental health and awareness program on Palestinian refugees of Nuseirat camp: A one-year-after report. JEHR, 5(1). Retrieved from www.cieh.org/JEHR/EH_awareness_palestinian_refugees.html [27]. WHO. (1992). Our planet, our health. Geneva. WHO [28]. WHO. (1992). The global health report. Geneva. WHO [29]. Retrieved from https://www.capetown.gov.za/en/EnvironmentalR
127

Texila International Journal of Public Health Volume 5, Issue 1, Mar 2017
HIV/AIDS: Group versus Individual Right
Article by Oladimeji Akeem Akinyemi Public Health, Texila America University, Namibia
E-mail: [email protected]
Abstract
HIV/AIDS management keeps on evolving since its discovery, so also are the ethical issues surrounding it. Policies formulated and laws enacted by various nations also keep on changing like the mutant variants of the virus itself. International organisations (WHO, UNHCR) guidelines have been instrumental to streamline the ethical issues about HIV/AIDS worldwide. Disparities in implementation of the guidelines still exist among nations despite the guidelines. To certain extent, this may be due to cultural differences. This article explains the ethical issues on HIV/AIDS in relation to “Individual vs. Group/community rights”
Keywords: HIV/AIDS; mutant; WHO; UNHCR; ethical issues; guidelines.
Introduction
Since the discovery of Acquired Immunodeficiency Syndrome (AIDS) in 1981 and its link with Human immunodeficiency Virus (HIV) as the cause (Bragdon vs Abbot 1998), it has continued to spread like a wild fire with poor effort to put it out. It has eaten deep into the fabric of many nations with the Sub-Sahara Africa most affected. It has become a global problem and as such the word ‘epidemic’ is ascribed to HIV/AIDS.
According to the UNAIDS global statistics of 2015, a total of 36.7 million people are living with HIV among of which 34.9 million are adults and 1.8 million are children (less than 15 years). In the same year, 1.1 million people died of AIDS-related illnesses (UNAIDS 2016). Since the start of the epidemic, an estimated 78 million people have become infected with HIV and 35 million people have died of AIDS-related illnesses (UNAIDS 2016). An estimated 25.5 million people living with HIV live in sub-Saharan Africa. The vast majority of them (an estimated 19 million) live in east and southern Africa which saw 46% of new HIV infections globally in 2015 (UNAIDS 2016). Around 40% of all people living with HIV do not know that they have the virus (UNAIDS Prevention Gap 2016). In 2015, there were roughly 2.1 million new HIV infections, 150,000 of which were among children. Most of these children live in sub-Saharan Africa and were infected via their HIV-positive mothers during pregnancy, childbirth or breastfeeding (UNAIDS/AIDSINFO 2016).
The factors fuelling the HIV epidemic in Sub-Sahara Africa are poverty, conflict, unemployment and illiteracy. Though, transmission also occurs among the drug users but the predominant mode of transmission in Sub-Sahara Africa is heterosexual (Murilo 2015). Few studies have been done on other modes of transmission in this region due to high level of denial, stigma and discrimination.
The epidemic affects all spheres of life with the individuals, families and nations having shares of its burden. Broadly speaking, the impacts are on the household, demographic structure, firms and economy. The health, agriculture and education sectors are not spared from the devastating effects of HIV. The health care spending (budget) of the affected nations has increased dramatically with the HIV/AIDS spending taking the greater percentage of the total health care budget. This invariably reduces budgetary spending on other sectors of the economy.
The cornerstone of controlling the epidemic is prevention and given the above scenario, the individuals, communities, nations and world at large need to be protected from the devastating effects of HIV. Protecting the individuals, communities, nations and the world in
128

Texila International Journal of Public Health Volume 5, Issue 1, Mar 2017
general against HIV is a complex issue with interplay between political, ethnic values, international relations, individuals’ right and communal right.
Prior to the HIV/AIDS epidemic, the link between health policies and human rights was rarely drawn (Hnin 2010). Indeed, public health, which traditionally has employed measures that can be coercive, compulsory, and restrictive, has often been considered as one of the legitimate grounds for restricting human rights (Mann 1996).
Whenever the issue of rights come up, the traditions (norms and culture) of the community must be taken into consideration. The issue of public versus individual rights in relation to HIV/AIDS is a double edged sword that requires critical analysis and evaluation. Considering the complexity of this matter, the analysis can be bi-directional and either of the directions will be absolutely right or wrong.
There are no universally valid moral principles and that we need to look at ethical problems in non-Western countries using different set of ethical framework (Niekerk 2005). Therefore, the approach to AIDS problem in Western countries cannot be directly applied to non-Western countries, especially Africa without modifications to suit the cultural and moral values of the people. Ankra and Gostin, in their book ‘Ethical and legal consideration of the HIV epidemic in Africa support this approach (Ankra et al 1994).
Group vs. individual right
The perspective with which HIV is seen regarding private right and public right to be protected against HIV will be discussed and evaluated under the following headings:
Informed consent and confidentiality Compulsory/voluntary testing Privacy Disclosure Condom use/protection among sexual partners Adherence/non-adherence to ARV Vaccine trials Compulsory quarantine/isolation
Informed consent and confidentiality
Informed consent and confidentiality in respect to HIV is born out of respect for human dignity and rights. It is also the pillar on which the prevention of HIV is built. HIV is an epidemic and therefore considered as a threat to public health.
This raises a question as to whether the right be individualised or made a public right. In either of the ways, public or individual rights, there are merits and demerits. Though, the meagre resources of the affected nations especially Sub-Sahara Africa is channelled to the prevention of HIV thereby reducing budgetary allocation to other sectors of the economy. Should the scarce resources be spent on HIV at the expense of other sectors? I am of the opinion that a balance should be achieved in this regard. We should remember that “a stitch in time saves nine”. The health care spending on HIV may be high presently but the end will justify the means bearing in mind the devastating effect of its negligence and denial. Neglecting the HIV issue today will lead to a vicious cycle that may eventually paralyse other sectors of the economy. For instance, the effects on households (increased orphans), firms (loss of workforce and reduced productivity), agriculture (decrease food production) and education (low literacy level).
It is tempting to clamour for abolishment of informed consent and confidentiality so as to protect the “public” against HIV. This act will prevent people from seeking medical help even for non-HIV related illness for fear of being subjected to HIV test without their consent. The consequences of this will be increased populace with ill-health harbouring both communicable and non-communicable disease without medical help with dire implication on the economy. This act therefore jeopardises the interest of the ‘public’ it is trying to protect.
129

Texila International Journal of Public Health Volume 5, Issue 1, Mar 2017
On the other hand, knowing quite well that their consent is needed before HIV test can be done will make people to freely present for proper evaluation and treatment. This is a good avenue for trained counsellors to discuss with people on need for routine HIV test. This subtle way respects the individual right and experience has shown to increases the number of people voluntarily testing for HIV. This provides a good and reliable source of data on the epidemic as well as education on protection and prevention of its spread by the HIV positive and negative individuals respectively.
Informed consent, counselling and confidentiality is the gateway through which people voluntarily agree to HIV testing. This also has the advantages of reinforcing positive health behaviour and also encouraging them on the need for disclosure as a way of reducing the stigma and discrimination associated with being HIV- positive.
The more people disclose their status, the lower the level of stigma and discrimination because the perspective through which people see HIV changes and it is eventually seen as one of the chronic diseases like hypertension and diabetics.
Compulsory/voluntary testing
Concerning HIV testing, the advocates of public/group right will argue for compulsory testing while the advocates of individual right will favour voluntary testing. As discussed in the page above, compulsory HIV testing will scare people from seeking medical attention from health facilities. Majority will prefer to die in silence than carrying the burden of being HIV positive. The group that we are trying to protect through compulsory testing is made up of individuals and the behaviour of the individual to a greater extent determines the rate of the spread of the disease. If the group right prevails regarding testing, then the same group must be forcefully restrained from risky behaviour that spread HIV for the compulsory testing to be justified.
What McDonald identifies in the alleged “group rights” is the fact that they are positive, rather than negative rights (McDonald 1991). He stated further that individual human rights in the liberal tradition are normally thought of as negative rights or “elbow room” or “breathing space” rights. The advocates of group rights also think of rights as positive, involving duties and not so much liberties (Niekerk 2004). But is compulsory testing a duty of everyone? Are people ready to accept this as a duty? What do we think of this when the same group we are trying to protect cannot uphold this sense of duty? They shy away from compulsory testing for fear of stigma and discrimination. For the group rights, for the compulsory testing to be effective, the issue of stigma and discrimination must be addressed. This means that the HIV positive people as a group on their own need to be protected. How many groups do we now have to protect without conflicts? At this juncture, individual rights remain the best option.
The evidences below further support individual right: Illinois, USA introduced mandatory reporting and contact tracing of HIV/AIDS cases
and the percentage of those not appearing for appointments to be tested at Chicago’s two city test centres rose from 34 percent in April to 41 percent in May to 46 percent in June (Cohen et al 1990).
In Germany, the state government of Bavaria required mandatory testing of prostitutes and drug users, many of them moved out of the state to avoid the test, whereas others dropped out of research projects, causing the projects to close (Cohen et al 1990).
In 1985, Australian minister of health proposed a legislation which mandated reporting of HIV-positive test results and criminalised sexual relations with people infected with HIV (unless the partner was notified prior to the relation). This led to an immediate drop in requests for HIV tests by 40 percent from August to September (Cohen et al 1990).
Given the scenarios above, voluntary testing should be the standard to respect individual rights regardless of group rights
130

Texila International Journal of Public Health Volume 5, Issue 1, Mar 2017
Privacy
There is at present a lack of systematic monitoring and worldwide assessment of HIV/AIDS-related human rights violations (UNCHR 1994). Mandatory testing without informed consent is explicitly prohibited by WHO Guidelines. Although, the right to privacy can be justifiably disregarded by governments for the greater good of protecting public health, provided the stringent conditions are met (Hnin 2010). Everyone has a right to privacy and the issue of HIV cannot be discussed in isolation. The argument in favour of group rights implies that the right of individual to privacy will be eroded. Considering the stigma and discrimination associated with the disease, people will prefer not to use health facilities for the fear of compulsory testing. This will greatly affect the control of the epidemic negatively and the magnitude of the disease will be undermined leading to grave consequences. It may lead to a vicious cycle and the solution to the epidemic may never see the light of the day.
On the other hand, individual rights that protect their privacy will indirectly lead to openness about people’s HIV status. Invariably, the secrecy about HIV will soon become ’open secret’ and voluntary disclosure becomes the order of the day for majority of the populace.
Disclosure
This is an important aspect of HIV prevention program. Given that stigma and discrimination are eliminated or reduced to a significant level in our society, disclosure will play an important role to step down the epidemic. Which way should disclosure discussion swing in relation to the ‘group versus individual rights’? If it swings in favour of ‘group rights’ which means that the society /community have the ‘right’ to be protected against HIV then disclosure becomes mandatory. But to whom do they disclose? Should they disclose to their status to everyone at risk of contacting it from them? From the ‘group right’ point of view, I think they should disclose to everyone at risk. Another issue is disclosure involving children and the underage individuals. In what manner should their status be disclosed? Do the parents have the right to disclose their status on their behalf? So many questions will remain unanswered about ‘group rights’ in relation to disclosure.
We should also bear in mind the complexities of disclosure in our society. Some of these are discussed below:
Poverty: Disclosing the HIV status in the face of poverty is a difficult task. Considering the situation in which a financially dependent individual risks losing all benefits he/she is getting by disclosing his/her HIV status. This society is not yet ripe for that type of practice because stigmatization is deeply rooted.
Gender inequality: Gender inequality and violence against women is a problem on its own in Africa. Despite the awareness and campaign to correct this problem, it persists. In a typical African tradition, women have no right and are fully dependent on their husband. The same society accepts men promiscuity as sign of macho whereas a woman practicing same is regarded as a whore. A woman has no right to deny her husband sex and at the same time cannot negotiate safer sex. Often times men refuse to do HIV test and any woman that discloses her HIV status to the same faces discrimination. A woman that discloses her status risks losing her home and therefore faces social discrimination (regarded as an outcast) and hunger because she totally dependent on her husband. This may not be the case in some urban areas but the issue of rights must be universal and as such no segment of the society can be isolated. The proponents of ‘group rights’ should bear in mind the number of “social outcasts” that will result from the ‘compulsory disclosure’ that they thought will protect the society from the HIV scourge. The ultimate right to disclosure should lie with individual and voluntary disclosure should be encouraged and not enforced.
Stigma and discrimination: This is as old as the HIV/AIDS itself. HIV cannot be discussed in isolation without mentioning stigma and discrimination. Stigmatization is deeply rooted in people and most dreaded in HIV positive individuals. Compulsory HIV status disclosure will only increase the level of stigma and discrimination among people. Instead of wasting
131

Texila International Journal of Public Health Volume 5, Issue 1, Mar 2017
precious efforts on compulsory disclosure to protect the society, the energy should be channelled towards education and awareness programmes to eliminate stigmatization and encourage openness about HIV status.
Condom use/protection among sexual partners
The scenario given in the book ‘Ethics & AIDS in Africa, The Challenge of Our Thinking’ that refusal to use safety belt while driving is a punishable offence because it endangers the live of the driver can be liken to the use of condom (Niekerk et al 2008). From the ‘group rights’ point of view, refusal to use condom for protection against HIV constitutes public health hazard and should be punishable. This is not possible in real life situation unless a clause is added stating that is not punishable if the individuals involved consented to the act. This again negates the purpose for which the’ right’ issue is intended. It invariably becomes a vicious cycle. Another bottleneck is procreation among HIV positive individuals. To protect the society or the group from HIV, the HIV positive individuals will have no right to give birth so as to avoid bringing forth HIV positive baby. This on the other hand becomes a human right issue which will further aggravate stigma and discrimination. ‘The right of men and women of marriageable age to marry and to found a family shall be recognised’. (International Covenant on Civil and Political Rights, Article 23, in UN 1988) Mandatory premarital HIV testing, coupled with the denial of a marriage licence to those infected with HIV and prohibiting the marriage of individuals known or suspected to be HIV-infected, interferes with the right to marry and found a family (UNCHR 1994). A public health rationale does not provide sufficient justification for violating this right, because such a restriction does not serve as an effective means of preventing either sexual or perinatal transmission of HIV as extramarital and premarital sexual activity are common.
The hallmark in this situation is ‘individual rights’. The onus to use condom lies on the individual and this should be greatly supported to encourage behavioural change. This is the way forward in the struggle to stem the spread of HIV and protect individuals thereby protecting the society indirectly.
Adherence to ART
It’s a widely acknowledged fact that poor adherence to anti-retroviral drugs leads to emergence of resistance strains of the virus. The conventional/existing drugs become ineffective against the virus. This is of a great public health concern because it does not only fuel the epidemic but also increases the health care budgets. The cost of developing new drugs and its antecedent high price to the public could be better imagined.
If a “group” right is to prevail in adherence, people on ARV must protect the society/group by strict adherence to their drugs. Failure to do so should be punishable just like the use of safety belt. But the question is how do we monitor adherence? Even if it can be monitored, is it not going to discourage people from getting tested not to talk of agreeing to start ARV? I believe the goal standard regarding adherence is individual rights”.
Vaccine trial
The concept of the best interests of the child is well established in international law. The Article 3 of the Convention on the Rights of the Child (1989) provides that in all actions concerning children, their best interests are of primary consideration (Niekerk et al 2008). Although, children has right to effective health care including ARV but is their enrolment in vaccine trial in their best interest? The children as a group will benefit greatly if an effective vaccine can be found but what becomes of the children used as “Guinea pig” in vaccine trials if they eventually develop the disease during trials? Is it in their best interest? This is an area that must be treated with caution. I take no side in this regard because is a very sensitive and a necessary evil one cannot avoid. Trials must be done for effective vaccine to be licensed and at the same time participants must be enrolled. The hallmark is for the researchers to adhere to the best ethical standard and refrain from frivolous researches.
132

Texila International Journal of Public Health Volume 5, Issue 1, Mar 2017
Compulsory quarantine
The legitimate ground for depriving an individual of liberty through public health measures includes compulsory quarantine or internment. This is commonly employed in cases of communicable diseases. However, such measures need to be in accordance with a procedure established by law (UNCHR 1994). The government would have to establish a case that the individual who has been detained indeed has the infection and that the detention is essential for preventing the spread of the virus. WHO recommends ‘that persons suspected or known to be HIV-infected should remain integrated within society to the maximum possible extent and be helped to assume responsibility for preventing HIV transmission to others’ (UNCHR 1994).
Conclusion
The group right is extremely limited as far as protection against HIV/AIDS is concerned. The HIV positive individuals and the HIV negative individuals all have rights to be protected and the summation of these are individual rights. Clamouring for group rights will only complicate the issue thus creating a vicious cycle in the overall prevention strategies of HIV/AIDS.
References
[1]. Ankrah E.M and Gostin L.O (1994) Ethical and legal considerations of the HIV epidemic in Africa. AIDS in Africa. New York: Raven Press, 547-58 [2]. Bragdon vs Abbort (1998) AIDS Treatment and Medical Technology: The Supreme Court Abandons the CDC. Bragdon vs Abbort, 524, US.624. [3]. Cohen, R., and L. Wiseberg. 1990. Double Jeopardy: Threat to Life and Human Rights. Human Rights Internet. Cambridge, Massachusetts: Harvard Law School. [4]. Hnin H P: International Law and the Rights of the People Living with HIV/AIDS. [5]. http://ec.europa.eu/development/body/theme/aids/limelette/pdfs/confront_aids_chapter_05.pdf (Accessed 23/10/2016) [6]. Mann, J., D. Tarantola, and T. Netter, eds. 1992. ‘AIDS in the World: A Global Report’. Cambridge, Massachusetts: Harvard University Press. [7]. McDonald, M. (1991) ‘Should Communities Have Rights? Reflections on Liberal Individualism’, Canadian Journal of Law & Jurisprudence, 4(2), pp. 217–237. [8]. Murilo J. (2016) HIV Update 2015. www.cme.baptist.net/infectionsymposium/documents/2015/presentation/murilo_1106_915.pdf [9]. Niekerk A. A (2005) Individual versus “group” rights in the HIV/AIDS debate: does more bad news make any difference? [10]. Niekerk A.A and Kopelman L (2008) Ethics and AIDS in Africa, the Challenge of Our Thinking. [11]. UNAIDS (2016) Fact Sheet. www.unaids.org/en/resources/fact-sheet (Accessed 23/10/2016) [12]. UNAIDS (2016) Prevention Gap Report. www.unaids.org/en/resources/documents/2016/prevention-gap (Accessed 22/10/2016) [13]. UNAIDS/AIDSINFO (2016) www.aidsinfo.unaids.org (Accessed 20/10/2016) [14]. United Nations Commission on Human Rights (UNHCR). 1994. Report of the Secretary- General on International and Domestic Measures Taken to Protect Human Rights and Prevent Discrimination in the Context of HIV/AIDS. E/CN.4/45. Geneva, December.
133

Texila International Journal of Public Health
Volume 5, Issue 1, Mar 2017
Knowledge and Attitude towards Obesity among Secondary School Students of Royal Crystal College, Ile-Ife, Nigeria
Article by Arilewola Abosede Omotola Ph.D in Public Health, Texila American University, Nigeria
E-mail: [email protected]
Abstract
Background: Obesity has reached an epidemic proportion in the developing and developed
countries. It contributes or serves as risk factors to many non-communicable diseases.
Knowledge and attitude of adolescent needs be assessed as childhood obesity has been found
to translate to obesity in adulthood.
Methods: This study is a cross-sectional study to investigate knowledge about obesity risk
factors and attitudes of students of secondary school, Ile-Ife, Osun State, Nigeria.
A pretested 34 item, purpose designed and structured, self-administered questionnaire
were used to collect information on knowledge and attitudes of the respondent on knowledge
and attitudes towards obesity. Data were collated and analyzed based on descriptive and
inferential study design.
Results: The result showed that the total percentages of respondents with good level of
knowledge is 58.2% (232), and 42.2% (168) respondents having poor knowledge level. About
24.1% of the respondents had favorable attitude to obesity, 531.9% had moderate favorable
attitude and 22% had unfavorable attitude toward obesity. In addition, the result showed no
significant association between demographic variables and knowledge scores and significant
association between attitude scores and class and type of housing composition of secondary
school students (p <0.05). The results also showed significant correlation between knowledge
score and attitude score of the students (p <0.05).
Conclusion: It was, therefore, concluded that the secondary school students of Royal
Crystal College, Ile- Ife have good knowledge and favorable attitude towards obesity.
Keywords: Obesity, knowledge, attitude.
Introduction
Obesity has reached an epidemic proportion in the developing and developed countries
(Bocquier et al 2005). The prevalence is increasing in the world generally. The major cause is
said to be an imbalance between the calories intake and calories output and other factors of
importance are dietary change, inactivity and genetic predisposition (Ekpenyong et al, 2011,
Obirikorang et al 2016). Obesity is defined as excessive or abnormal accumulation of fat in
the body that predisposes risk to health (Njelekela et al, 2015; Ranjit Kaur 2014, Shrivastava
et al 2013). Obesity is defined as a body mass index of 30kg/m2 or more (K. Duval et al,
2006). Obesity is a leading cause of death in the recent time and present as a cause of life
threatening diseases. (Tagbo et al, 2015, Chukwuonye et al, 2013; Ekpenyong et al, 2011).
Adolescent are the age group that falls between 10-19 years. There has being an increase in
childhood obesity over the past two decades. It is estimated that childhood obesity may likely
persist through adulthood. It is said to increase the risks of non-communicable disease in later
life. About 43 million children were estimated globally as overweight and obese in the year
2010, majorities were from developing countries. (Njelekela et al, 2015). Childhood obesity is
on the alarming increase in the world in terms of prevalence (Mwaikambo et al, 2015).
Obesity is understood as a growing health problem in Africa (Pangani et al, 2016)
Public health internationally gives priority to the prevention of childhood obesity because
of its significance on acute and chronic diseases, development and on general health (Waters
et al, 2011).
134

Texila International Journal of Public Health
Volume 5, Issue 1, Mar 2017
Knowledge is a major powerful toll in prevention. Knowledge as a weapon is needed in the
prevention of a disorder as obesity. Adolescents get involved in attitudes and habits that can
predispose them to being overweight or obese sometimes due to lack of knowledge about it
causes and how to prevent it (Adeleke et al 2015). The best effective way of dealing with
overweight and obesity is aimed at helping the masses have knowledge and understand it
adverse effect/dangers and have attitudes that prevent the condition. Also a good attitude
towards obese people and obesity can help prevent the rise in tide of obesity. This study
aimed at assessing the knowledge about obesity and its risks and attitudes of secondary school
student in Ile-Ife Nigeria.
There are many studies on obesity prevalence, knowledge in adult and young females
(under graduates). Likewise, knowledge and attitudes of mothers. There are limited research
findings to determine knowledge and attitudes of adolescent that is secondary school student
in Nigeria. However; this study is, therefore directed to investigate the knowledge and attitude
of secondary school students of royal crystal college, Ile-Ife Nigeria as a case sample.
Significance of study
There is need to assess the knowledge and attitude of adolescent because they are more
likely to engage in unhealthy eating habits, do less activity and exercises in this industrialized
age and are very susceptible to obesity in this age group which can span through adulthood
and create health challenges both now and in the future. Also assessing their basic knowledge
and attitude is essential for developing and educative and preventive programs. Lastly, the
results and findings from this study can help to put certain policies in place in-terms of
individual and community policies.
Statement of problem
Many studies have shown prevalence of obesity is on the increase almost from childhood
to adolescent and adult stage. Many have worked on the knowledge of adult especially on
obesity adult’s adverse effect. Since obesity is observed to be on the increase in adolescent
which spread to adulthood. To the best of my knowledge, limited studies focused on
adolescent has been found in the literature and there is no formal study conducted on
knowledge and attitude of secondary school student in Ile-Ife, Nigeria.
Therefore this study aimed at assessing the knowledge and attitude of adolescent to
obesity.
Research questions
The major research questions for this study include the followings.
What is the knowledge based level of Royal Crystal College student about obesity
What are the attitudes of Royal Crystal College student to obesity
Research objectives
1. To assess knowledge level of adolescents on obesity.
2. To assess attitude level of adolescents to obesity
3. To correlate knowledge score and attitude score of adolescent to obesity
4. To find out association between knowledge score and some demographic variables
5. To find out association between attitude score and some demographic variable
Literature review
Children obesity is seen as a potential health problem in Nigeria due to the changes in
lifestyle patterns. This is associated with a major medical, psychological and health
consequence for children and adolescents. (Adegoke et al, 2009). Obesity is a non-
communicable multi -factorial metabolic disorder characterized by accumulation of white
adipose tissue (WAT) in subcutaneous intra-abdominal and vascular organs in vertebrates
(Daniel et al, 2016). Obesity has become an epidemic afflicting all nations over the world.
The obesity epidemic affects all age groups including very young children and is a serious
135

Texila International Journal of Public Health
Volume 5, Issue 1, Mar 2017
and growing problem for public health systems worldwide. The rapid rise in the prevalence of
obesity is accompanied by the increasing number of co morbidities. (Mazur et al, 2013).
Obesity among children and adolescents is rising far more than two decades, appears to have
hit a plateau, a potentially significant milestone in the battle against excessive weight gain
among children and adolescent. In Brazil, the progression of the nutritional transition has
been detected. It has been characterized by the reduction of the prevalence of nutritional
deficits and the more expressive occurrence of overweight and obesity, not only in the adult
population, but also among children and adolescents. Triches and Giugliani 2005)
The World Health Organization classifies about 400 million people around the world as
obese. About 15% of adolescents (aged12-19years) and children aged (6-11years) are obese
in the United State and numbers are expected to continue to increase. In the United Kingdom
in 2004, it was estimated that 14% of boys and 17% of girls in the age group of 2 - 15 years
were obese. Childhood obesity represents one of the worlds’ greatest health challenges.
(Ismail et al, 2011). Obesity increases the risk for serious health conditions that affect their
present, future health and quality of life, including resistance type 2 diabetes, metabolic
syndrome, high blood pressure, abnormal blood lipid level and low self-esteem, Stroke,
certain cancers (Cardozo et al, 2013) heart and kidney failure (Adebayo et al, 2014;
Awotidebe et al, 2014;Ogunmola et al, 2013). Obesity is socially and culturally acceptable in
Nigeria and therefore, not usually recognized as a medical condition. (Iloh et al, 2010).
Obesity is a major health problem, and there is an increasing trend of overweight and obese
individual in developing countries (Bocquier et al, 2005). Being overweight or obese is
known to contribute significantly to morbidity and mortality rates in various countries around
the world.
There are several classifications and definitions of obesity; however, the commonly
adopted is the definition by the World Health Organization (WHO) which defines obesity as a
body mass index (BMI) of 30kg/m2 or more. Obesity is associated with major and minor
diseases (Chukwuonye et al, 2013). Ogunbode et al, (2014) cited obesity as a non-
communicable disease which is gaining increasing importance globally and is rapidly
emerging disease in the developed world. It is chronic a condition characterized by an
accumulation of body fat. It is one of the most important preventable diseases in developed
countries. The prevalence of the disease is increasing in both industrialized nations and in
those undergoing alterations in diet and activity patterns as a consequence of adoption of the
western culture.
The origin of obesity is unclear but it appears to be multi factorial and requires the
continuous differentiation of new adipocyte throughout life. This process of adipocyte
differentiation firm preadipocytes has been shown to be controlled by members of the
peroxisome prolife rator-activated receptor (PPARv). There is said to be genetic basis for the
development of obesity. There may be other factors influencing the expression of genetic
character tics that induce weight gain or allow weight loss. It leptin is a protein or hormone
that is produced by adipocytes it regulates body weight metabolism and reproductive
function. In obesity, there is excessive adipose tissue mass. Obesity results when the body’s
intake is greater than output over a period of time due to a sedentary lifestyle. This dietary
factors and physical activity patterns play a strong role in obesity and this is called exogenous
obesity. Obesity is positively associated with dietary factors such as increased fat intake, low
fiber consumption, increased hidden sugars in prepared foods, reduce amounts of unrefined
sugars, and inadequate fruit and vegetable intake. The daily eating pattern also see ms to be
associated with weight change, especially chrome diet, which can be measured in several
ways.
A physical activity pattern such as sedentary lifestyle is associated with weight change.
The physical activity pattern has important influence on physiological regulation of body
weight. Decrease physical activity plays an important influence on physiological regulation of
body weight. Other lifestyle factors which could cause obesity include insufficient sleep,
endocrine disruptors food substance which interface with lipid metabolism, decreased
136

Texila International Journal of Public Health
Volume 5, Issue 1, Mar 2017
variability in ambient temperature and decrease rates of smoking which suppress appertite
(Ogunbode et al, 2011) psychological factors, endocrine problems, other social determinants
to obesity include the income differential, marital status, and BMI change friends, sibling or
spouse irrespective of geographical distance. Childhood and adolescent obesity has also been
identified as risk factors for obesity in adulthood (Ogunbode et al, 2011).
In classifying obesity, it earn be classified as central or peripheral obesity. In central
obesity, otherwise called ‘android’ obesity, the distribution of fat is commonly on the upper
part of the trunk (chest and abdomen) and is more common in the males. Android obesity is
more clearly associated lipid and with disordered lipid and glucose metabolism and diseases
like diabetes mellitus gout, atherosclerosis, osteoarthritis, cardiovascular disease especially
hypertension, and some cancers. In the peripheral or “gynecoid” type of obesity, the
distribution of fat is mainly on the hip and thighs and is more common in females (Ogunbode
et al, 2011)
There are various measures of obesity and the BMI is a very useful and common one. It is
calculated as weight in kilograms divided by the square of the heights in meters. The BMI
takes into account both frame and size and body composition and considered to provide a
realistically achievable range of healthy weights and is a predictor of danger associated with
obesity. Normal BMI is between 18.5-24.9kg/m2, BMI greater or equal to 25kg/m2 is
overweight, obesity is BMI of 30kgm2 or more. There are 3 grades of obesity. Grades one is
between 30-34.9kg/m2 grade 2 (moderate) is between BMI 35-39.9kg/m 2 and grade 3,
extreme or morbid obesity is BMI of 40kg /m2 and more.
Waist hip ratio (WHR) is another means of knowing if a person is obese and is calculated
by using the ratio of waist circumference to hip circumference. WHR is classified as 0.70-
0.80 as normal, 0.81- 0.86 as moderate and 0.86 as severe obesity. (Ogunbode et al, 2011;
Ranjit Kaur et al, 2014)
Prevention of obesity should involve primary and secondary prevention with emphasizes.
The healthcare cost of obesity are considerable, especially when complicated by diabetes
mellitus, osteoarthritis, hypertension, gallstone disease, post menopausal breast cancer and
colon cancer. Prevention of obesity is thus cost effective and should begin in early childhood
by instilling and healthy patterns of exercises and diet.
Given that there is a much higher risk of overweight adolescents becoming overweight
adults, engaging young people in physical activity remain a key behavioral target for obesity
prevention. Specific treatment for obesity will be determined by the adolescent’s age, overall
health, and medical history, extent of the condition, adolescents’ tolerance for specific
medications, procedures or therapies, opinion or preference. Treatment for obesity in
adolescents may include the following nutritional and individual diet counseling.
Modification or diet and caloric content, increased exercise participation in an appropriate
exercise program behavior modification, individual or group therapy focused on changing
behaviors and confronting feelings related to weight and normal developmental issues.
Ranjit Kaur et al 2014. The increasing body or literature supporting that childhood obesity
persist throughout adult life make it very imperative to study and understand factors
associated with childhood obesity including knowledge and attitudes of adolescents towards
obesity.
Methods
Research design, study area and population
A descriptive cross sectional study was conducted on personal knowledge and attitude of
secondary school student of Royal Crystal College, Ile-Ife, Osun State, Nigeria. The study
was carried out in royal crystal college, a very well-known private secondary school in Ile-Ife
town. Ile-Ife is an ancient city of Yoruba land situated in Osun state which is located in the
south-western part of Nigeria. The study population consisted of the secondary school
students boys and girls both in the junior and senior secondary school one, two and three
(JSS1- JSS3,SSS1-SSS3) of the college.
137

Texila International Journal of Public Health
Volume 5, Issue 1, Mar 2017
Data collection
Information was collected from respondent by means of a pretested 34 item designed, self-
administered anonymous questionnaire containing open and close ended questions.
The questionnaire was divided into four major sections. Section 1 containing, 11 items
focused on demographic characteristics of respondents. Section 2 containing 4 items focus on
definition and source of information about obesity. Section 3: consist of 10 items related to
Adolescent knowledge on risk factors in obesity it’s a structured knowledge questionnaire
designed for adolescents. The items are multiple choice questions with 3 alternative
responses. A score of 1 is allotted to a correct response, score of 0 for wrong and don’t know
answers. The total score for knowledge is 10.
Section 4: Consisted of 9 items that assesses attitudes. It is a structured attitude scale.
AORK was modified from ORK 10. Swift et al, 2006
Ethical consideration
Permission to conduct this study was sought, obtained and granted by the school authority.
Likewise, informed consent was also obtained from the students
Sample size determination
The minimum sample size was calculated using the Leslie and kish formular for
descriptive studies.
N=P(I-P)z2/D2, where N is the minimum sample size needed; D is the level of error D2
that can be tolerated (0.05 chance of error) and P, the estimated proportion of level of
knowledge among primary school student from previous study (Njelekela et al 2015) was
45% i.e P= 0.45. Z is the standard variation corresponding to confidence level. At confidence
level of 95% Z = 1.96. Therefore N=0.45 (1-0.45) 1.96 2/ 0.052 = 380. To give allowance for
an anticipated non response rate of 10% (about 40 respondents), the sample size was increase
by 40 to make 420 respondents. Out of the 420, 400 respondent supplied adequate
information to an extent, others having unfilled spaces.
Sampling method
A sample of 400 student from royal crystal college Ile-Ife (48% males and 52% females)
were involved in the study. The age ranged from 10-21years, respondent were provided with
an assurance of confidentiality of information provided in the questionnaire.
Data analysis
The completed questionnaires were collated analyzed and presented using descriptive
statistics of simple percentages, frequency distribution, mean and range where applicable.
Inferential statistics of chi-square was used to determine the association between Socio-
demographic variable and knowledge and attitude. Pearson product moment correlation
coefficient was used to determine the correlation between knowledge and attitude of
secondary school students of Royal Crystal College, Ile Ife to obesity. Data was analyzed
with SPSS 17
Results
Demographic characteristics of the study population
A total number of 400 secondary school students of Royal Crystal College, Ile Ife
participated in the study in which (48%) of them were males and (52%) were female.
Majority of the respondents (47%) were between the ages of 13 and 15 years. The result also
showed that the highest percentage of students were from JSS 3 class distribution (20.8%).
Highest percentages of them were Christians (83.5%) as reflected by the result. The results
also showed that largest percentages of them were Yoruba (88.3%), majority of the mothers
were into business (41.3%) and highest fathers’ occupation was farming (31.0%). Mothers’
highest level of education was at secondary school (36.3%) and that of fathers was at the level
138

Texila International Journal of Public Health
Volume 5, Issue 1, Mar 2017
of college (47.8%). Monogamy ranked the highest under type of family (71.8%) and about
(39.5%) lives in duplex as shown in Table1.
Table 1. Demographic Characteristics of the study population
Serial numbers variables Frequency
(F)
Percentage
(%)
1 Age in years
10-12 135 33.8
13-15 188 47.0
16-18 70 17.5
19-21 7 1.8
2 Sex
Male 192 48.0
Female 208 52.0
3 Class
JSS 1 77 19.3
JSS2 34 8.5
JSS3 83 20.8
SSS1 77 19.3
SSS2 74 18.5
SSS3 55 13.8
4 Religion
Christianity 334 83.5
Islam 56 14.0
Traditional 7 1.8
Nil response 3 .8
5 Tribe
Yoruba 353 88.3
Igbo 28 7.0
Hausa 4 1.0
Others 14 3.5
Nil response 1 .3
6 Mother
occupation
Housewife 56 14.0
Business 165 41.3
Farmer 32 8.0
Government
Employee
97 24.3
Self employee 45 11.3
Nil response 5 1.3
7 Father
occupation
Business 116 29.0
Farmer 124 31.0
Government
Employee
119 29.8
Self employed 41 10.3
8 Mother
education level
No Formal 22 5.5
Primary 56 14.0
Secondary 145 36.3
139

Texila International Journal of Public Health
Volume 5, Issue 1, Mar 2017
College 134 33.5
University 40 10.0
Nil response 3 .8
9 Father
education level
No Formal 15 3.8
Primary 33 8.3
Secondary 102 25.5
College 191 47.8
University 49 12.3
Nil response 10 2.5
10 Type of family
Single Parent 37 9.3
Parents
Divorced
31 7.8
Monogamy 287 71.8
Polygamy 37 9.3
Nil response 8 2.0
11 Type of
housing
Single room 24 6.0
Room and
Parlour
49 12.3
2 bedroom 83 20.8
3 bedroom 12 3.0
Duplex 166 39.5
others 69 17.3
Nil response 5 1.3
Source of information and knowledge about obesity
About 74.3% of the respondents have heard about obesity. Majority of the students about
(63%) agreed that obesity is the result of long term energy imbalances in which daily energy
intake exceeds daily energy expenditure. Also (66.5%) agreed that obesity is having too much
body fat. Major source of information about obesity was through the school teacher (38.8%),
followed by that of radio (14.5%), then from books/newspapers (11.5%), relative and
neighbor (5.5%), health facility (10.5%), television (8.5%), friend at school (7.8%), other
sources (0.5%) while there was 2.5% nil response as shown in table 2.
Table 2. Knowledge about obesity
Serial
number
variables Frequency
(f)
Percentage (%)
1 Have heard of
obesity
Yes 297 74.3
no 103 25.7
2 Correct definition
of obesity 1
Yes 252 63.0
No 40 10.0
Don’t know 101 25.3
Nil response 7 1.8
3 Correct definition
of obesity 2
140

Texila International Journal of Public Health
Volume 5, Issue 1, Mar 2017
Yes 266 66.5
No 57 14.3
Don’t know 74 18.5
Nil response 3 0.8
4 Source of
information about
obesity
School Teacher 155 38.8
Radio 58 14.5
Books/newspaper 46 11.5
Friend at school 22 5.5
Relative/neighbour 42 10.5
Health facility 34 8.5
Television 31 7.8
Other sources 2 0.5
Nil response 10 2.5
Knowledge score of adolescent obesity risk knowledge scale (AORK)
To determine the level of knowledge, scoring for each question is assessed for correctness
and the total score obtained is between 0- 10. The total percentages of respondents with poor
level of knowledge risk, scoring between 0-4 of the total score is 42% (168), scores between
5-10 with 58%. (232) respondents have good level of knowledge of obesity (as in Table 3a).
The mean of the obesity risk knowledge score of the respondents was calculated to be 4.65
2.22.Table 3b shows the total number and the percentages of correct responses given by the
secondary school students of Royal Crystal College on the whole questionnaire on obesity
risk knowledge. More than half of the respondents (63.5%) knew a person who has diabetes
can sometimes get better by losing weight, item 1. Respondents also scored high in items 2, 5,
6, 8, 9, with 55.5%, 57.0%, 53.0%, 55.3% and 56.0% respectively. 84.0% were of the opinion
that it is less of a health problem when a person has fat around the stomach and waist than
someone who has fat around the hips and thighs. Incorrect answers also reflected high
percentages in items 4, 7, 10, with 52%, 51.7% and 84.3% respectively.
Table 3a. Grading of knowledge scores of samples on obesity risks
Score grade Frequency (f) Percentage (%)
0-4 Poor knowledge 168 42.1
5-10 Good knowledge 232 58.2
Total 400 100
Table 3b. Responses to adolescent obesity risk knowledge (AORK)
Adolescent obesity risk
questions and responses
Yes
(%)
No
(%)
Don’t
know
(%)
Nil
response
(%)
Percentage
correct (%)
Incorrect
(%)
A person who has diabetes
can sometimes get better by
losing weight (true)
63.5 17.0 18.8 0.8 63.5 36.6
Obese people have more of a
chance of getting stomach
cancer (true)
55.5 18.8 24.5 1.3 55.5 44.5
It is less of a health problem
when a person has fat around
the stomach and waist than
someone who has fat around
57.8 16.0 24.3 2.0 16.0 84.0
141

Texila International Journal of Public Health
Volume 5, Issue 1, Mar 2017
the hips and thighs (false)
When parents are obese, it
more likely that their children
will become obese (true)
47.5 39.8 12.0 0.8 47.5 52.0
On average, obese people do
not live as long as people with
normal weight (true)
57.0 24.8 16.8 1.5 57.0 43.0
Obesity increases the risk of
getting breast cancer in
women (true)
53.0 20.5 26.0 0.5 53.0 47.0
“being obese” and “being fat”
mean different things (true)
48.3 31.8 17.8 2.3 48.3 51.7
Taking a bottle of soft drink
every day is something that
can contribute to a person
obese (true)
55.3 21.3 16.8 6.8 55.3 44.7
Obesity can often cause
problem with your heart (true)
56.0 20.5 22.0 1.5 56.0 44
Being fat when you are in the
middle school is less of a
problem because it is easy for
teenagers to lose weight
(false)
61.8 15.8 20.5 2.0 15.8 84.3
Attitude score of adolescent to obesity
In the attitude of the respondents to obesity, 22% (88) had unfavorable attitude towards
obesity with a score between 0-3, 53.9% (215) had moderate favorable attitude with scores
between 4-6 and 24,1% (97) had favorable attitude with scores between 7-9. This reflected in
table 4a. The mean score for attitude was 4.78+- 2.13 as the standard deviation. Table 4b
shows the attitude response of the participants. Almost two third (63.8%) of the respondents
disagree with the statement that it is good to look obese and about 77.0% agrees that
adolescent should do physical activity. Majority (73.0%) agreed that eating unhealthy food is
risky to children
Table 4a. Grading of attitude scores of adolescents to obesity
Score grade Frequency
(f)
Percentage (%)
0-3 Unfavourable attitude 88 22.0
4-6 Moderate favourable 215 53.9
7-9 favourable 97 24.1
Table 4b. Participant responses to attitude questions
s/
n
Item Agree
(%)
Disagr
ee (%)
Don’t
know
(%)
Nil
resp
ons
e
(%)
Percent
age
Correct
(%)
Percent
age
incorrec
t (%)
1 It is good to look obese 24.0 63.8 11.8 0.5 63.8 36.2
2 It is good for adolescent to
do physical activity
77.0 11.0 11.3 0.8 77.0 23.0
3 Adolescents should not do
any physical work
20.3 61.8 15.5 2.5 61.8 38.2
4 Being obese is not a 36.0 44.5 17.5 2.0 44.5 55.5
142

Texila International Journal of Public Health
Volume 5, Issue 1, Mar 2017
problem to adolescents
5 Eating unhealthy food is
risky to children
73.0 15.3 10.3 1.5 73.0 27.0
6 Adolescent can be obese 49.5 25.8 23.8 1.0 49.5 50.5
7 An obese child is
presumed as healthy
39.5 40.8 19.0 0.8 40.8 59.2
8 Obesity is an indicator of
good health
27.5 54.8 16.0 1.8 54.8 45.2
9 Will be suspected with
HIV positive if you lose
weight
41.3 38.0 18.8 2.0 41.3 58.7
Correlation between knowledge level and attitude level
Table 5 shows the calculated correlation coefficient (r) between knowledge and attitude
scores of the secondary school students considered in the study. The result showed that there
was statistically moderately positive correlation between knowledge and attitude
scores.(r=0.335, n=400, p<0.05). correlation is significant at the 0.01 level when p=0.000.
Table 5. Correlations
Correlations
knowscore attiscore
knowscore Pearson Correlation 1 .335**
Sig. (2-tailed) .000
N 400 400
attiscore Pearson Correlation .335** 1
Sig. (2-tailed) .000
N 400 400
**. Correlation is significant at the 0.01 level (2-tailed).
Association of knowledge scores with selected demographic variables
Table 6 shows that were no statistically association between demographic variables and
knowledge.
Table 6. association between Chi-Square result of socio demographic characteristics and knowledge
among adolescents
variables Chi-Square
value
Df Result P.Valve
Age 32.533 30 NS 0.343
Sex 8.631 10 NS 0.567
Class 62.829 50 NS 0.105
Religion 26.539 30 NS 0.647
Tribe 40.788 40 NS 0.436
Occupation level of
mother
64.749 50 NS 0.078
Occupation level of
father
27.422 30 NS 0.601
Education level of
mother
47.664 50 NS 0.568
Education level of father 40.095 50 NS 0.841
Family structure 48.872 40 NS 0.159
143

Texila International Journal of Public Health
Volume 5, Issue 1, Mar 2017
Type of housing 75.689 60 NS 0.083
Association of attitude score with selected demographic variables
In table 7, class and housing structure showed statistical significance, while others did not
show any significant difference. It shows student class and type of housing having association
with attitude
Table 7. association between Chi- Square result of socio demographic characteristics and attitude on
obesity among adolescents
variables Chi-
Square
value
Df Result P.Valve
Age 28.342 27 NS 0.394
Sex 5.659 9 NS 0.774
Class 69.790 45 S 0.010
Religion 16.164 27 NS 0.950
Tribe 39.957 36 NS 0.299
Occupation level of
mother
47.899 45 NS 0.356
Occupation level of
father
33.927 27 NS 0.168
Education level of
mother
37.489 45 NS 0.779
Education level of
father
50.316 45 NS 0.271
Family structure 25.074 36 NS 0.961
Type of housing 72.318 54 S 0.049
Discussion
This study was conducted to assess the knowledge and attitude of the secondary school
students of Royal Crystal College, Ile- Ife and to determine the association that exists between
knowledge level and attitude level and socio-demographic characteristics of these students
and also to determine if any correlation exists between their knowledge and attitude.
Obesity is a public health concern and it remains (Njelekela et al, 2015: Waters et al, 2011), a
major critical issue as a precursor to non communicable diseases, such as diabetes, stroke and
heart disease.(Awotidebe et al, 2014 ; Daniel et al, 2016). Obesity is on the increase in the
world, the prevalence is reaching an epidemic proportion (Ranjit-Kaur, 2014). Knowledge
about obesity is very important among students since adolescent obesity can develop into
adulthood with its consequences (Njelekela et al, 2015). Adolescent is a vulnerable time for
obesity development. (Ranjit Kaur, 2014). The sex distribution in this study had more female
respondents than male respondents. This result is similar to a study carried out in 2015 which
also reported female respondents higher in number than male respondents (Njelekela et al,
2015). The result also showed higher Christian respondents and Yoruba respondents than any
other religions and tribes respectively. This result can be explained by the fact that the
sampled private school is primarily a Christian college school located in Yoruba land. This
invariably shows that the study environment will usually reflect the characteristics of the
study population.
The result in this study also showed that more than half (58.2%) of the respondents (232)
have good knowledge level about obesity,42.8% have poor knowledge (168) of the
respondents on obesity. The result is contrary to the result of Rutkowski and Connelly (2015)
who found out that the AORK scores were low in the two study groups they considered.
Majority of the respondents had moderate to good negative attitude towards obesity, in line
with Njelekela et al (2015) and Ranjit Kaur (2014). The outcome of this study also showed
144

Texila International Journal of Public Health
Volume 5, Issue 1, Mar 2017
that no significant associations were found between knowledge level and demographic
variables of respondents. (Ranjit- Kaur, 2014) on the contrary also her study showed that
there was strong association between sex, family income, type of family, dietary habits and
hobbies obesity knowledge level. The result also showed that significant association was
found between attitude scores and class, and type of housing of the respondents. This implies
that class and type of housing of the respondents is associated with their attitudes on the
contrary to significant association found in age, sex, family income, area of residence, type of
family and dietary habits in Ranjit- Kaur (2014) study. Finally, there was significant
correlation between obesity knowledge score and attitudes score in line with Ranjit Kaur
(2014) of the students.
Limitation of the study
One, the study is based on self- reported information and thus is subject to self- report bias.
To correct this, effort was made to reduce the impact of this bias by making the questionnaire
a guided self- administered process.
Two, the students involved in this study were drawn mainly from a private high school in
Ile-Ife and therefore the outcome of the study cannot be generalized as they are not true
representatives of all the secondary school students in Ile-Ife.
The study is limited to 400 samples.
Conclusion
The outcome of this study reveals that majority of the respondents had good knowledge
about obesity risks. Likewise, majority had moderate favorable to favorable attitudes towards
obesity. Also, the study shows no significant association between demographysic variables
and knowledge level and significant association between attitude score with class composition
of the secondary school and type of housing students. Lastly, in this study, there was
significant correlation between knowledge score and attitude score on obesity of the students.
Recommendation
In view of the above conclusions, the followings are therefore recommended:
1. A study can be conducted to compare male to female knowledge and attitude levels
2. There is need to introduce obesity and its risks to children early enough in schools to
reduce the alarming rates at which it is increasing among children and adolescents.
3. Knowledge about risks associated with obesity and attitude towards obesity of these
private college students can be compared with those in the public or rural secondary
schools.
4. Adult and adolescent knowledge level can also be considered in further research.
References
[1]. Adegoke S.A, Olowu W A, Adeodu O.O, Elusiyan J B, Dedeke I O (2009); prevalence of
overweight and obesity among children in Ile-Ife, Southwestern Nigeria. West Afri j. med. July- Aug;
28 (4); 216-21
[2]. Adeleke S.A, Abioye-kuteyi E.A. Sikuade O.O, Olusayo A. I (2016); knowledge of obesity among
the staff of the international institute of tropical agriculture, Nigeria: Int J Cur Res
[3]. Artur Mazur, Paweł Matusik, Krista Revert, Sergey Nyankovskyy, Piotr Socha, Monika
Binkowska-Bury, Joanna Grzegorczyk, Margherita Caroli, Sandra Hassink, Grzegorz Telega, Ewa
Malecka-Tendera (2013): Childhood Obesity: Knowledge, Attitudes, and Practices of European
Pediatric Care Providers. Pediatrics, July, Volume 132 / Issue1
[4]. Aurelie Bocquier, Pierre Verger, Arnaud Basdevant, Gerard Andreotti, Jean Baretge, Patrick
Villani and Alain Paraponaris (2005): Overweight and Obesity: Knowledge, Attitudes, and Practices of
General Practitioners in France. Obesity research, 13:787-795. DOI: 10.1038/oby.2005.89
[5]. C.Justin David and G. kumaresan (2016): Functional genomics, MIRNAS in lipid metabolism and
pharmaceutical sciences VOL3, lssue: 8, 513-523
145

Texila International Journal of Public Health
Volume 5, Issue 1, Mar 2017
[6]. Eden R Cardozo, Tanaka J Dune, Lisa M Neff, Maureen E Brocks, Geraldine E Ekpo, Randall B
Barnes and Erica E Marsh (2013):Knowledge of Obesity and Its Impact on Reproductive Health
Outcomes Among Urban Women. J Community Health, April; 38(2): 261-267.
[7]. Ekpenyong, C. E, Akpan, U. P., Nyebuk E. Daniel and John O. Ibu (2011): Prevalence and
assessment of overweight and obesity factors in adult population resident in uyo metropolis, Nigeria.
African Journal of Bioscience, Volume 4, Number 1.
[8]. Iloh G.U, Amadi A. N, Nwankwo B.O (2010): obesity in adult Nigerians: a study of it prevalence
and comment on primary co- morbidities in a semi- urban mission general hospital in south eastern
Nigeria. Niger J.Med Oct-Dec, 19 (4): 459-66.
[9]. Innocent Ijezie Chukwonye, Abali Chuku, Collins John, Kenneth Arinze Ohagwu, Miracle Erinma
Imoh, Samson Ejiji isa, Okechukwu Samuel Ogah and Efosa Oviasu (2013): Prevalence of overweight
and obesity in adult Nigerians-a systematic review. Diabetes metab syndr obes.vol 6: 43-47.
[10]. Ismail Pangani, Festus k kiplamai, Jane w. kamau, Vincent O.Onywera (2016)’ prevalence of
overweight and obesity among primary school children aged 8-13 years in Dar-es salaam city,
Tanzania.Adv Prev Med. Vol 2016:1345017
[11]. K. Duval, P. Marceau, L. Pérusse and Y. Lacasse (2006): An overview of obesity-specific quality
of life questionnaires. Obesity reviews 7, 347–360,347. doi: 10.1111/j.1467-789X.2006.00244.x
[12]. Marina A. njelekela, Alfa muhihi, Rose N.M Mpembeni, Amani Anaeli, Omary chillo, sulende
kubhoja, Benjamin Lujani, Davis Ngarashi and Mwanamkwu Magbembe (2015): knowledge and
attitudes toward obesity among primary school children in Dares Salaam, Tanzania, Niger med j. mar-
April, 56-2);103-106.
[13]. Mosleh A. Ismail, Mohammed H. Kamel and Dalia E Ibrahim (2011): assessment of knowledge
attitude and practice of adolescents towards obesity in the preparatory schools in Ismaila city Egypt.
Egyptian journal community medicine.vol7, issue22, pg22-28.
[14]. Mwaikambo S. A, Leyna G.H, killewo J, Simba A and Puoane T (2015): why are primary school
children overweight and obese? A cross sectional study undertaken in kinondoni district Dar-es
Salaam.BMC Public Health, Dec 21; 15; 1269, doi; 10. 1186/s/ 2889-015-2596-0.
[15]. Ogunbode A.M, Ladipo M, Ajayi I. O, Fatiregun A.A (2011): Obesity an emerging disease, Niger
J.Clin. Pract, 4:390-4.
[16]. Olarinde J Ogunmola; Adeleke O Olaifa, Olutoyin O Oladapo and Oluwole A Babatunde (2013):
Prevalence of cardiovascular risk factors among adults without obvious cardiovascular disease in a
rural community in Ekiti State, Southwest Nigeria. BMC Cardiovascular Disorders 13:89
[17]. Rasaaq A. Adebayo, Michael O Balogun, Rufus A. Adedoyin, Oluwayemisi A. Obashoro-John,
Luqman A. Bisiriyu and Olugbenga O Abiodun (2014): Prevalence and pattern of overweight and
obesity in three rural communities in southwest Nigeria. Diabetes, Metabolic Syndrome and Obesity:
Targets and Therapy: 7 153–158
[18]. Raujit kaur, Ramesh kumari, Samuel (2014); A study to assess the knowledge and attitude of
adolescents on obesity at selected senior secondary schools in Amritsar in a view to develop and
distribute information booklet. IJEAR vol 4, issue 1, jan- june ISSN; 2249-4944
[19]. Rozane Márcia Triches and Elsa Regina Justo Giugliani (2005): Obesity, eating habits and
nutritional knowledge among school children. Rev Saúde Pública;39(4)
[20]. Rutkowski E. M and Connelly C.D (2015): adolescent obesity risk knowledge (AORK): Let the
discussion begin. Journal for specialists in pediatric nursing, 21(2016)37-43
[21]. Shrivastava S, Shrivastava P., Ramasamy J (2013): Assessment of knowledge about obesity
among students in a medical college in Kancheepuram district, Tamil Nadu. Prog Health Sci, Vol 3,
No1 Knowledge about obesity.pp 54-60
[22]. Tagbo Beckie N, Ndubisi Nwaezuoke, Dorothy Ihekuna, Ifeoma Mbomi, Chima Robert Ifeoma
Ogbaji, Chinenye P. Tagbo (2015): Perception and attitude of Nigerian mothers toward obesity. British
Journal of Medicine and medical research 5(10); 1260-1270, Article no BJMMR.2015.143.ISSN:2231-
0614.
[23]. Taofeek Oluwole Awotidebe, Rufus Adesoji Adedoyin, Busola Fatoogun, Victor Adeyeye
Chidozie Mbada, Odunayo Theresa Akinola Olubusola Esther Johnson, Nicole De Wet (2014): An
146

Texila International Journal of Public Health
Volume 5, Issue 1, Mar 2017
assessment of knowledge of Nigerian female undergraduates on obesity as risk factor for cardio
vascular disease in women. American Journal of Health Research 2 (5-1): 50-55
[24]. Waters E, de- Silva-Saniqorski A, Hall B. J, Brown T, Campbell k. J, Gao Y, Armstrong R,
Prosser L, Summerbell C. D (2011): interventions for preventing obesity in children. Cochrane
database Syst Rev Dec 7; (12); CD001871
[25]. Yaa Obirikorang, Christain Obirikorang, Enoch Odame Anto, Emmanuel Acheampong, Nyalako
Dzah, Caroline Nkrumah Akosah and Emmanuella Batu Nsenbah (2016): Knowledge and Lifestyle-
Associated Prevalence of Obesity among Newly Diagnosed Type II Diabetes Mellitus Patients
Attending Diabetic Clinic at Komfo Anokye Teaching Hospital, Kumasi, Ghana: A Hospital-Based
Cross-Sectional Study. J Diabetes Res. V 2016:9759241. Doi:10.1155/2016/9759241
147

Texila International Journal of Public Health Volume 5, Issue 1, Mar 2017
Willingness to Pay for HIV Treatment - A Case of Clients Seeking Care at Rimuka TB and HIV Site Kadoma Zimbabwe (2016)
Article by D. Chirundu1, S. Tapesana2, P. Magande3, T. Mduluza4 1Kadoma City Health Dept, Zimbabwe
2,3University of Zimbabwe Dept. of Community Medicine, Zimbabwe 4University of Zimbabwe Dept. of Biochemistry Zimbabwe
E-mail: [email protected], [email protected], [email protected], [email protected]
Abstract
Introduction: In Zimbabwe, clients are not supposed to pay for HIV services. However, it is common for clients to purchase medical sundries from the private sector. This is in addition to other opportunity costs like transport. Of late, there is decreasing funding for HIV programs and the health system is constrained. We therefore, assessed the willingness to pay for HIV treatment in case there is a policy change.
Method: We used a cross sectional study design. The contingency valuation method was used to assess the willingness to pay. We randomly selected 552 respondents from the ART database. We used an interviewer-administered questionnaire to collect data. Analysis was done using Epi-Info 7 software. Independent factors were identified using stepwise backward logistic regression.
Results: Among the 552 respondents interviewed, 336 (66.4%) were willing to pay for HIV treatment. The independent factors predicting positive willingness to pay for ART services were being employed, (aOR=3.7; p=0000), satisfaction with health workers, (aOR=6.23; p=0.04) and disclosure of HIV status to a friend (aOR=1.59; p=0.02). Having a household budgetary change due to being on ART (aOR=0.6; p=0.05); practicing no religion (aOR=0.33; p=0.01) were negatively associated with willingness to pay for HIV treatment.
Conclusion: The majority of the people interviewed at RITHS are willing to pay for HIV treatment. However, whilst people on HIV treatment may be willing to pay for treatment we recommend sourcing extra funding from charity and donations in order to maintain equity in providing healthcare services to the population. We, therefore, recommend that treatment should continue to be free.
Keywords: ART, Rimuka, Kadoma
Background
In Zimbabwe HIV clients are not supposed to pay for HIV services in public health institutions. The government eliminated payment for HIV services in public health institutions in order to remove economic barriers to HIV treatment among the poor. This was further elaborated in the Zimbabwe 2016 treatment guidelines. Not with standing, this government and World Health Organization policy, at times clients are required to purchase sundries like syringes, needles, or blood collection specimen tubes from the private sectors.1 Besides such unforeseen expenditures, ordinarily there is an opportunity cost when clients come to the health centers to fulfil appointments.2
Some HIV services are expensive for the ordinary person in Zimbabwe, under normal circumstances, CD4+ cell count costs $20.00 per test, viral load test costs $95.00 per test, and medicines cost US$19 per month. Consequently, when costs are so high, Batavia et. al. (2010) reported that clients may default due to costs.3
Whilst, it maybe Zimbabwe government policy that clients do not pay for HIV services, there is need to investigate the willingness to pay for HIV services among clients on ART so that we evaluate if there is a commitment to pay. More so, at a time like this when donor
148

Texila International Journal of Public Health Volume 5, Issue 1, Mar 2017
funding is dwindling. It is against this background that we investigated the willingness and factors associated with willingness to pay for HIV services.
Methodology
Study design
The study design was across sectional study at Rimuka Integrated TB and HIV Care Centre (RITHS) at Kadoma (Zimbabwe). Data were collected as part of the Kadoma Mobile Phone study (KAMPS) a randomized controlled trial (PACTR201611001858240).The contingent valuation method was used to assess the willingness to pay.4 This is a survey based, hypothetical and direct method to determine willingness to pay. We collected the data between September 2016 and October 2016.
Study site
Rimuka ITHC is a primary health care facility that offers tuberculosis and HIV collaborative services at Kadoma. The services include comprehensive HIV services that comprise of voluntary counselling and testing, pre-ART counselling, ART initiation & follow up as well as CD4+ and viral load testing. Seven thousand three hundred clients were in the center’s register as of October 2016.
Study subjects and sample size
The study population were clientson ART register at RITHS. Inclusion criteria was being above the age of 18 years, and willing to provide written informed consent. Eligible respondents were also supposed to have been on ART for at least four weeks prior to the commencement of the study. We used computer generated random numbers to select 552 respondents.
Study variables
The outcome variable in the study was “willingness to pay for HIV services” measured as a dichotomous yes/no variable. From literature review, we developed the independent variables for the questionnaire.5-13
These were used to develop a conceptual framework comprising of: Psychosocial factors- social support, family support, support by significant others,
perceived satisfaction with the social support Socio demographics- age, sex, religion, educational status, marital status, employment,
monthly income, home ownership, religion Pattern of cellphone use- owning a cellphone, use cellphone alarm reminders, carry
mobile phone always, don’t answer unknown numbers, perceived privacy in using cellphone, confidentiality
Environmental factors-transportation access, travel time, transportation facility, transport cost, cost income, frequency of visits
Behavioural factors-HIV status disclosure, substance abuse.
Data collection and analysis
Data were collected using a pretested interview-administered questionnaire. We conducted a one day training for data collectors to explain the purpose of the study, etiquette, and, standardize the questioning approach. Eight health workers administered the questionnaire to eligible clients.
We captured and analyzed the data using Epi Info 7TM (Centers for Disease Control 2007) statistical package. Descriptive statistics were used to describe the study population. The statistical package was used to generate, frequencies, means, and odds ratios (OR). We used OR and 95% confidence interval (95% C.I) to describe the strength of association. Stepwise backward logistic regression was used to identify independent factors. Factors that had p-values less than 0.25 in bivariate analysis were included in the logistic regression model.14
149

Texila International Journal of Public Health Volume 5, Issue 1, Mar 2017
Ethical considerations
We obtained written informed consent from all participants. Participants were free to terminate the interview at any time. We obtained permission to proceed from Kadoma City Council.
Results
Demography
We interviewed 552 respondents. Among these 156 (28%) were males and 396 (72%) were females. The medianage of males was 42years (Q1=37; Q3=49) and 42years (Q1=34; Q3=49) for females. The median duration on ART was 46 months (q1=26; q3=49) for males and 46 months (Q1=31; Q3=49) for females. The demographic characteristics of respondents are shown in table 1.
Willingness to pay for HIV treatment
Five hundred and fifty-one respondents answered the questions on willingness to pay for HIV treatment, 336(66.4%) were willing to pay for HIV treatment, whilst, 185 (33.5%) were not willing to pay. Among the males 110 (70.97%) were willing to pay whilst 256 (64.65%) of females were willing to pay for services(p=0.19).The median amount that the respondent were willing to pay for a consultation per visit was US$1 (Q1=1; Q3=2); medication per month US$2 (Q1=1; Q3=5); CD4+ per test US$3 (Q1=1; Q3=5);viral load per test US$5 (Q1=1; Q3=10).The amounts proffered by respondents for the various services, stratified by sex are presented in table 2.
The main reason for non-willingness to pay for services was affordability mentioned by 98% of those who were not willing to pay (n=185). Among the males 45 (24.3%) were not able to pay whilst among females 140 (75.6%) were unable to pay (p=0.14).
Bivariate analysis
Demographic variables and willingness to pay for HIV services
In bivariate analysis were found a significant positive association between household income above 200 (OR=1.52 p=0.05), being a catholic (OR=1.8; p=0.02, being formally employed (OR=3.46; p<0.05) and willingness to pay for HIV treatment. The results are shown in table 3.
Psychosocial support and willingness to pay for HIV services
There was a positive association between having a sense of support from community (OR=1.96; p=0.001), financial support from community (OR=1.1; p=0.72), and being satisfied with family support (OR=4.01; p=0.08), community support (OR=1.77; p=0.45) and willingness to pay for HIV treatment. However, those who received financial support from family were less likely to report willingness to pay (OR=0.4; p=0.008).We also found a positive relation between disclosure to family and willing to pay for HIV treatment. Results of bivariate analysis between psychosocial support and willingness to pay for HIV treatment are shown in table 4.
Environmental factors and willingness to pay for HIV services
On analysis of the relationship between environmental factors and willingness to pay for HIV treatment, we found that those who had no direct transport costs when coming for reviews (OR=1.23 p=0.44); those who had three monthly appointment schedules, (OR=3.03; p=0.003) and those whose duration of travel to health centre was less than 40 minutes (OR=1.42; p=0.23) were likely to report willingness to pay for HIV treatment. Those who cited changes in household budget due to being on ART,(OR=0.6; p=0.02) were less likely to report willingness to pay. The associations between environmental factors and willingness to pay for HIV Services are shown in table 5.
150

Texila International Journal of Public Health Volume 5, Issue 1, Mar 2017
Patient provider relationships and willingness to pay for HIV services
We found positive associations between patient/provider attributes of being satisfied with health worker (OR= 5.05; p=0.03), being satisfied with changes in health since initiation on ART (OR=4.06; p=0.01) and reporting willing to pay for HIV treatment. These were all statistically significant at 95% confidence level. There were also positive associations between being treated with respect (OR=6; p=0.07), not getting medication at one time due to stock outs (OR=2.59; p=0.13), getting individual education (OR=1.10; p=0.69), beings satisfied with confidentiality at the centre (OR=1.71; p=0.33) and reporting willing to pay. However, these were not statistically significant. Bivariate analysis for patient provider relationships and willingness to pay for HIV treatment is presented in table 6.
Multivariate analysis
In a multi-logistic regression model, those who were employed, (aOR=3.7; p=0000), satisfied with health workers, (aOR=6.23; p=0.04) had disclosed HIV status to a friend (aOR=1.59: p=0.02) and going for reviews at three months’ interval were more likely to report willingness to pay for HIV treatment. However, practicing no religion (aOR=0.22; p=0.01); and being on ART resulting in household budget (aOR=0.6; p=0.05) Multivariate analysis results are shown in table 7.
Discussion
This was a cross sectional study to investigate the willingness to pay for HIV treatment among clients attending a public health centre. We found that 66% of the respondents were willing to pay, this is far higher than 16% reported in a similar study in Kenya by Otiso (2016).15The reason for not willing to pay was affordability. Similar findings were reported by Otiso et. al.(2016) and Binswanger et. al (2003).16The median amounts proffered for the services of consultation were US$1 (Q1=1; Q3=2); medication US$2 (Q1=1; Q3=5); CD4+ count per test US$3 (Q1=1; Q3=5); and viral load testing per test US$5 (Q1=1; Q3=10). Despite the client’s willingness to pay for HIV services, the amount proffered is far beyond the cost to meet cost of the service. The prevailing changes for consultation per visit is US$5 per visit, medication is US$19 per month; CD4+ cell count is US$20 per visit and viral load testing costs US$95 per test. A funding gap therefore, remains taking into account the amounts the respondents are willing to pay.
In our study, we found a positive significant association between being employed and willingness to pay for HIV treatment. This is because employed people have a steady income and can afford to pay for services. Batavia et. al. (2010) and Otiso et. al. (2016)reported that affordability is one major factor that militates against willingness to pay for HIV services.3.15 Similar findings were reported by Muko et. al. (2004) and Ayifah et. al. (2010) in rural Cameron and Ghana respectively. 17.18 However, the study by Ayifah et al. (2010) was evaluating willingness to pay for PMTC services.18Whilst clients may be willing to pay for treatment; it has to be considered that the cost of treatment goes beyond clinic and drug fees. The cost of transport, over the counter medicine purchases and loss of income due to illness also contribute heavily to family’s household expenditure on health.19.20
We found positive associations between psychosocial support aspects of family and community. Psychosocial support is important in managing HIV at individual and community level. It is a strong instrument of dealing with stigma in the community. It is not clear why those with a sense of support from family or those who get financial support from family in our study, were less likely to report willingness to pay for treatment. This could be that they were getting financial support because they were not financial independent. Hence, had other more pressing financial obligations like purchase of food, rentals, or transport to the health centre. We also found that respondents who disclosed to family were more likely to report willing to pay for HIV treatment, disclosure is a sign that a person have overcome perceived stigma. Consequently, disclosure opens opportunities for psychosocial support. In a study on
151

Texila International Journal of Public Health Volume 5, Issue 1, Mar 2017
willingness to pay for HIV services in rural Cameron, Muko et al (2004) reported that stigma was one of the factors that militated against willingness to pay.
In this study, we found a negative association between reporting budgetary changes due to being on ART and willingness to pay for treatment. Under normal circumstances, a person avoids incurring additional expenses if they have other commitments. In this case, it could be transport costs, costs of over the counter medication or sundries among others. This may explain why those who reported a change in their household budgets due to being on ART were less likely to be willing to pay for HIV services. In the same vein, those with no direct costs and visits the clinic at the longer interval of 3 months are more likely to report willingness to pay for HIV services. This is consistent with the findings of Rosen et. al. (2007) who that reported that non-drug cost of obtaining treatment may limit access, clients pay transport to get to the clinic, and some suffer loss of income when they came for review in addition to paying for non-prescription medicines.20
In our study we found that satisfaction with health workers was a statistical significant factor associated with willingness to pay for HIV treatment; so was satisfaction with changes since initiation on ART. This attests to the fact that a client would be more willing to pay were they have confidence and satisfaction with the health workers as we as the perceived effect of the medicine. Alexander et. al. (2012) and Govender et. al. (2000) reported that patient–physician relationships are an important factor in patients taking a more active role in their health and health care.21.22Payment for treatment is one aspect of taking a more active role in treatment.
Limitation of study
This study was not without limitation. We used the contingency valuation method to assess willingness to pay. In this method, respondents may say what they think the interviewer wants to here. However, on the other hand respondent may portray a picture that they are poor so that they get support. All these have an effect of introducing bias in the study. Lastly, this study was done among respondents who have been on ART for at least 4 months and have not been paying for any service. This may also have a bearing on the willingness to pay.
Conclusion
The majority of the people interviewed at RITHC are willing to pay for HIV treatment. However, the amounts they are willing to pay are far less than the actual costs of the services. Psychosocial support initiatives within the family and community are important to overcome stigma and promote willingness to pay for HIV treatment. Provider client relations are important in determining willingness to pay for HIV services. Additional cost due to being on cares may result in catastrophic health expenditure. Independent factors were being satisfied with the health workers, being on ART resulted in household budget changes, disclosed HIV status to a friend, belongs to no religion, being gainfully employed, scheduling reviews at three months.
In light of this we recommend that whilst, people on HIV treatment may be willing to pay, treatment in terms of medication, laboratory costs continue to be free as introduction of same may results in drop out and defaulting from treatment. Fees may also widen inequity gap in terms of treatment among the population. The opportunity cost being incurred is already too high for the people. If it becomes very essential to institute some recovery mechanisms, payment may be in the form of charity or donations rather than asking for a fee.
Acknowledgements
Kadoma City Health Department provided financial support for this work. The KAMP Study Team Includes: Gift Scholtz, Stella Manyere, Moffat Habibu, Alfred
Maruma, Cecilia Suga, Blessing Banda, Precious Banda, Hamilton Gomba, Pamela Mautsa, and Edith Mhike.
152

Texila International Journal of Public Health Volume 5, Issue 1, Mar 2017
Tables and Figures
Table 1. Demography of Respondents
Variable Females n=396 Males n=156 p-value Median Age (years) 42 (q1=34:q3=49) 42 (q1=37:q3=49) - Median Time Since Diagnosis (months)
62 (q1=36:q3=94.5)
46 (q1=26:q3=73) -
Median Duration on ART (months)
46 (q1=30.5:q3=75)
35 (q1=20:q3=60.5)
-
Median household income 60 (q1=30:q3=150)
100 (q1=50:q3=230)
-
Religion: Apostolic 95(23.9%) 29 (18.9%) 0.17 Catholic 49(12.3%) 34(22.2%) 0.005 Muslim 9(2.25%) 5 (3.2%) 0.52 None 11(2.11%) 15(9.8%) 0.00064 Traditional 8(2.02%) 12(7.8%) 0.00132 Pentecostal 159(40.1%) 35(22.8%) <0.05 Protestant 63 (15.9%) 23(15.05%) 0.72 Marital Status :Married 168 (43%) 114 (73%) 0 Divorced 38 (10%) 10 (6%) 0.23 Separated 18 (5%) 10 (6%) 0.36 Single 29 (7%) 5 (3.2) 0.07 Widowed 142 (36%) 17 (11%) 0 Polygamous marriage 19 (11%) 8 (7%) 0.87 Employment Status: Formally Employed
40 (10%) 43 (27%) 0
Informal Employment 149 (39%) 73 (47%) 0.04 Not Employed 198 (51%) 39 (25%) 0 Usual resident of Kadoma 395 (100%) 154(98%) 0.138 Educational attainment: None 3 (1.9) 29 (7.34) <0.05 Primary Education 28(17.95) 82(20.76) 0.46 Secondary Education 120(76.92) 276(69.87) 0.08 Tertiary Education 5 (3.21) 8 (2.03) 0.40 Who owns the house: Council rented
10(6.4) 35(8.95) 0.34
Owner 35(22.58) 94(24.04) 0.74 Employer 4(2.58) 9(2.3) 0.83 Family 48(30.9) 113(28.9) 0.52 Private rented 2(1.29) 0 (0%) 0.04 Subtenant 24(15.48) 72(18.41) 0.40 Other 2(1.29) 0 0.04
Table 2. Median Amounts Proffered for HIV among Those Willing to Pay Kadoma 2016
HIV Service Median Amount (US$)Proffered to Payment Females Males
Consultation Fee (per visit) 1 (Q1=1:Q3=3) 1 (Q1=1:Q3=3) Medication (per 3 months) 5 (Q1=1:Q3=5) 5 (Q1=1:Q3=5) CD4 Count (when needed) 5 (Q1=2:Q3=5) 5 (Q1=2:Q3=5) Viral load Count (when needed)
5(Q1=5:Q3=15) 5(Q1=5:Q3=10)
153

Texila International Journal of Public Health Volume 5, Issue 1, Mar 2017
Table 3. Contingent tables Demographic factors and Willingness to pay for HIV Treatment Kadoma 2016
Variable Willingness to Pay for HIV Services
Odds Ratio
95% C.I. p-value
Yes No Age (Above 40 years) Yes 215 120 0.772 0.53-1.11 0.16
No 151 65 Household income above $200
Yes 96 35 1.52 0.98-2.35 0.05 No 270 150
Apostolic Yes 81 43 0.93 0.61-1.43 0.76 No 285 142
Catholic Yes 64 19 1.8 1.07-3.1 0.02 No 302 166
Muslim Yes 10 4 1.2 0.39-4.10 0.78 No 356 181
Traditional Yes 11 9 0.60 0.24-1.48 0.27 No 355 176
None Yes 12 14 0.41 0.18-0.91 0.03 No 354 171
Pentecostal Yes 128 65 0.9 0.68-1.43 0.96 No 238 120
Marital Status :Married Yes 189 92 1.07 0.75-1.53 0.67 No 177 93
Single Yes 24 10 1.22 0.57-2.62 0.59 No 342 175
Divorced Yes 35 13 1.3 0.72-2.71 0.31 No 331 172
Separated Yes 14 14 0.48 0.22-1.04 0.058 No 352 171
Widowed Yes 103 56 0.9 0.61-1.32 0.60 No 263 129
Polygamous marriage Yes 14 15 0.47 0.21-1.04 0.06 No 176 77
Formally Employed Yes 241 64 3.64 2.51-5.288 <0.05 No 125 121
Median Time Since Diagnosis (36 months)
Yes 108 49 1.1 0.76-1.72 0.45 No 258 136
Duration on ART (less than 12 months)
Yes 29 18 0.7 0.43-1.47 0.47 No 337 167
Health status since starting art : Better
Yes 346 176 0.88 0.39-1.98 0.76 No 20 9
Members of support group
Yes 31 12 1.33 0.66-2.65 0.41 No 334 172
Smokers Yes 25 7 1.86 0.79-4.3 0.14 No 341 178
Alcohol User Yes 89 41 1.12 0.74-1.71 0.57 No 277 144
154

Texila International Journal of Public Health Volume 5, Issue 1, Mar 2017
Table 4. Contingent Psychosocial support and Willingness to pay for HIV Treatment Kadoma 2016
Variable Willingness to Pay for HIV Services
OR 95% C.I. p-value
Yes No Sense of support from family
Yes 333 169 0.95 0.51-1.78 0.88 No 33 16
Sense of support from community
Yes 298 127 1.966 1.30-2.95 0.001 No 68 57
Financial support from family
Yes 110 87 0.4 0.33-0.69 0.0008 No 256 98
Financial support from community
Yes 35 16 1.1 0.60-2.07 0.72 No 331 169
Satisfied with family support
Yes 331 165 4.01 0.72-22.13
0.08 No 2 4
Satisfied with community support
Yes 295 125 1.77 0.39-8.02 0.45 No 4 3
Disclosure to Friend Yes 152 52 1.81 1.2-2.6 0.002 No 214 133
Disclosure to parents Yes 150 65 1.28 0.88-1.85 0.18 No 216 120
Disclosure to family Yes 310 144 1.57 1.0063-2.4
0.04 No 56 41
Disclosure to Employer
Yes 11 2 2.83 0.62-12.92
0.23 No 355 183
Disclosure to church mate
Yes 82 34 1.28 0.82-2.0 0.27 No 284 151
Disclosure to spouse Yes 168 84 1.02 0.71-1.45 0.91 No 198 101
Table 5. Contingency table Environmental factors and Willingness to pay for HIV Treatment Kadoma 2016
Variable Willingness to Pay for HIV Services
OR 95% C.I. p-value
Yes No Cost of travel to Health Centre:- No Direct Cost
Yes 50 21 1.23 0.71-2.12 0.44 No 316 164
Frequency of reviews: 3 months
Yes 348 160 3.02 1.60-5.6 0.003 N0 18 25
Loss of income due to coming for ART
Yes 25 17 0.72 0.38-1.37 0.32 No 341 168
Mode of transport – Pedestrian
Yes 322 166 0.8 0.47-1.48 0.54 No 19 19
Time to centre more than 40 minutes
Yes 45 17 1.42 0.79-2.55 0.23 No 320 168
Changes in budget due to being on ART
Yes 54 41 0.60 0.38-0.95 0.02 No 312 144
155

Texila International Journal of Public Health Volume 5, Issue 1, Mar 2017
Table 6. Patient Provider Relations and Willingness to pay for HIV Treatment Kadoma 2016
Variable Willingness to Pay for HIV Services
Odds Ratio
95% C.I. p-value
Yes No Satisfied with health worker
Yes 364 180 5.05 0.97-26.3 0.03 No 2 5
Satisfied with changes since initiation
Yes 360 177 4.06 1.20-13.69 0.01 No 4 8
Treated with respect Yes 367 183 6.00 0.62-58 0.07 No 1 4
Get individual education
Yes 319 159 1.10 0.66-1.85 0.69 No 47 26
Times no medication Yes 15 3 2.59 0.74-9.07 0.13 No 351 182
Satisfied with confidentiality
Yes 359 179 1.71 0.5-5.1 0.33 No 7 6
Table 7. Independent factors for Willingness to Pay for HIV Services Kadoma 2HIV Treatment Kadoma 2016.
Term aOR 95% C. I. p-value
Being Satisfied with the Health Workers
6.2383 1.0665-36.4904 0.0422
Being on ART resulted in household budget changes
0.6200 0.3787-1.0152 0.0574
Disclosed HIV status to a friend 1.5951 1.0576-2.4058 0.0259
Belongs to no Religion 0.3396 0.1379-0.8359 0.0188
Employed 3.7340 2.5256-5.5206 0.0000
Reviews Scheduled at 3 months interval
3.3010 1.6321-6.6765 0.0009
References
[1] Ayifah Emmanuel et. al. Determinants of the willingness-to-pay for HIV/AIDS prevention: the case of mother-to-child transmission in selected hospitals in Ghana- Retrovirology 2010, 7 (Suppl 1):P137 [2] Ashita S Batavia, Adherence to Antiretroviral Therapy in Patients Participating in a Graduated Cost Recovery Program at an HIV Care Center in South India, AIDS and Behavior 14(4):794-8 · August 2010. [3] Balogun MR, et. al. Access to information technology and willingness to receive text message reminders for childhood immunization among mothers attending a tertiary facility in Lagos, Nigeria. South Afr J Child Health. 2012. [4] Bangure D et. al. Effectiveness of Short message services on Childhood Immunization program in Kadoma BMC [5] Govender, Veloshnee et. al. The Costs and Perceived Quality of Care for People Living with HIV/AIDS in the Western Cape Province in South Africa. Small Applied Research No. 14. Bethesda, MD: Partnerships for Health Reform Project, Abt Associates Inc. April 2000 [6] Govt. of Zimbabwe, Guidelines for therapy Prevention and Treatment of HIV in Zimbabwe 2018, National Medicines and Therapeutic Policy Advisory Committee 2016) [7] Hans S.Binwanger, Willingness to pay for AIDS treatment: myths and realities- Lancet 2003).
156

Texila International Journal of Public Health Volume 5, Issue 1, Mar 2017
[8] Jeffrey A. Alexander, Patient–Physician Role Relationships and Patient Activation among Individuals with Chronic Illness, Health Services Research, June 2012) [9] Klose T. The contingent valuation method in health care. Health Policy. 1999 May; 47 (2):97-123. [10] Kabede et. al.Willingness to receive text message medication reminders among patients on antiretroviral treatment in North West Ethiopia: A cross-sectional study. BMC Medical Informatics and Decision Making (2015) 15:65 [11] Leite L et. al. Cell phone utilization among foreign-born Latinos: a promising tool for dissemination of health and HIV information. J Immigr Minor Health. 2014. [12] Lindsay S. Youth’s acceptance of mobile phone text messaging for STI Health promotion. Edited by Columbia Tuob. Vancouver: The University of British Columbia; 2013. [13] Muko et. al. Shu Willingness to pay for treatment with highly active antiretroviral (HAART) drugs: a rural case study in Cameroon, Journal of Social Aspects of HIV/AIDS VOL. 1 NO. 2 AUGUST 2004) [14] Piette JD, et. al. Access to mobile communication technology and willingness to participate in automated telemedicine calls among chronically ill patients in Honduras. Telemed J E Health. 2010. [15] Syden Rosen et. al. Cost to patients of obtaining treatment for HIV/AIDS in South Africa- South Africa Medical Journal 2007.) [16] Stephen M, Franz E, Thomas S. A conceptual framework for designing mHealth solutions for developing countries. In: UN Foundation – Vodafone Foundation Partnership. 2009. [17] Tamaryn C, Corless IB, Janet G, Patrice KN, Quentin E, Lisa MB. Exploring the patterns of use and the feasibility of using cellular phones for clinic appointment reminders and adherence messages in an antiretroviral treatment clinic, Durban, South Africa. AIDS Patient Care STDS. 2010 [18] Xiaoab Y, Jic G, Tiana C, Lia H, Biaod W, Hu Z. Acceptability, and factors associated with willingness to receive short messages for improving antiretroviral therapy adherence in China. AIDS Care. 2013. [19] Zoran Bursac et. al. Purposeful selection of variables in logistic regression: Source Code for Biology and Medicine 2008 [20] Otiso L.D. Assessing the acceptability and willingness to pay for HIV services among patients at LVCT health HIV clinics (Thesis) Strathmor University (2016) [21] Rony Zachariah et. al, Acceptance of anti-retroviral therapy among patients infected with HIV and tuberculosis in rural Malawi is low and associated with cost of transport. 2006, 1:e121 PLoS ONE [22] Syden Rosen et. al. Cost to patients of obtaining treatment for HIV/AIDS in South Africa- South Africa Medical Journal 2007
157

Texila International Journal of Public Health Volume 5, Issue 1, Mar 2017
Diabetes Mellitus Prevalence in HIV Patients on Antiretroviral Therapy at Parirenyatwa Group of Hospitals Opportunistic
Infections Clinic, Harare, Zimbabwe
Article by Pasipanodya Ian Machingura1, Adam Chindore 1PhD Public Health, Texila American University, Zimbabwe
E-mail: [email protected]
Abstract
HIV patients have increased life expectancy due to the access to antiretroviral drugs treatment. However the increasing age comes with increased risk to non communicable diseases which include diabetes mellitus. However the prevalence of diabetes mellitus amongst HIV patients has not been extensively studied in Zimbabwe. Thus we sought to determine the prevalence of diabetes mellitus amongst HIV patients on antiretroviral therapy treatment attending Parirenyatwa Group of Hospitals Opportunistic Infections Clinic, Harare, Zimbabwe.
A cross-sectional study was conducted at Parirenyatwa Group of Hospitals Opportunistic Infections Clinic, Harare, Zimbabwe. All HIV patients (18 years and older) on antiretroviral therapy attending Parirenyatwa Group of Hospitals Opportunistic Infections Clinic during the study period were given information on the study. Only those who consented to participate in the study were recruited. Demographic data was obtained from patients by administration of questionnaires. Blood samples were collected for glycosylated haemoglobin analysis on a Mispa-i2 Chemistry Analyser.
A total of 60 HIV patients on antiretroviral therapy were recruited into the study, 33 (55%) were females and 27 (45%) were males. The mean age was 43.48 ± 10.3 years. Majority of the patients (33.3%) were on tenofovir, lamivudine and efavirenz. The prevalence of diabetes mellitus was 8.3%.
Diabetes mellitus prevalence amongst the HIV patients on antiretroviral therapy treatment was 8.3%. There is need for need to investigate the factors associated with diabetes mellitus in HIV patients on antiretroviral therapy treatment and confirm the prevalence in a study with a large sample size.
Keywords: Human Immunodeficiency Syndrome, antiretroviral therapy, diabetes mellitus
Introduction
The increased access to antiretroviral treatment has converted Human Immunodeficiency Virus (HIV) into a chronic disorder, allowing the patients with HIV to live longer. The increasing age also comes with an increased risk of non communicable disease (1). Non communicable diseases such as diabetes mellitus and cardiovascular disease are amongst the leading causes of premature morbidity and mortality in developed and developing countries (2).
There is some conflicting evidence regarding HIV infection as an independent risk factor for diabetes mellitus, some studies shows increased risk whilst others show no independent effect of HIV on diabetes mellitus or an inverse effect(3). Diabetes mellitus is a known complication of antiretroviral treatment, it is associated with exposure to some antiretroviral drugs (4).However the overall effect of current antiretroviral treatment on glucose metabolism is modest in most patients. The prevalence of diabetes mellitus amongst HIV infected patients range from 2 to 14% and varies according to composition of studied cohort, how diabetes mellitus diagnosis is ascertained and how diabetes mellitus risk factors are accounted for in the analysis(3).
158

Texila International Journal of Public Health Volume 5, Issue 1, Mar 2017
The success of antiretroviral therapy in controlling HIV replication and restoring the immunity has been tempered with the knowledge that metabolic diseases which include diabetes mellitus are increasing in incidence amongst people living with HIV (5). However the prevalence of diabetes mellitus amongst HIV patients has not been extensively studied in Zimbabwe. Thus we sought to determine the prevalence of diabetes mellitus amongst HIV patients on antiretroviral therapy treatment attending Parirenyatwa Group of Hospitals Opportunistic Infections Clinic, Harare, Zimbabwe.
Methods
Ethical considerations
The study was approved by the Joint Research Ethics Committee for the University of Zimbabwe, College of Health Sciences and Parirenyatwa Group of Hospitals (JREC 356/15). Informed consent was obtained from all participants enrolled into the study.
Study design and study site
The study was a cross-sectional study conducted at Parirenyatwa Group of Hospitals Opportunistic Infections Clinic, Harare, Zimbabwe, between 1 December 2015 and 1 April 2016.
Study subjects
All HIV patients (18 years and older) on antiretroviral therapy attending Parirenyatwa Group of Hospitals Opportunistic Infections Clinic between 1 December 2015 and 19 February 2016 were given information on the study. Only those who consented to participate in the study were recruited.
Data collection
Demographic data was obtained from patients by administration of questionnaires to all patients who gave informed consent. The patients’ clinical records were accessed from Parirenyatwa Group of Hospitals Opportunistic Infections Clinic database to confirm information given by the patient. Blood samples were collected into ethylenediaminetetraacetic acid (EDTA) tubes.
Sample analysis
The samples were then stored at 2°C to 8°C for not more than 7 days before analysis on a Mispa-i2 Chemistry Analyser using the nephelometry method. The assay kits and standards employed for the measurements were supplied by Agappe Biomedical Company Limited (Switzerland). The calibration of the analyser was provided in the smart card of the analyzer. Control samples were assayed every day before samples were assayed for glycosylated haemoglobin (HbA1c).
Data analysis
Data was captured using Microsoft Excel, normally distributed variables were summarised using the mean, standard deviation and 95% confidence interval, and skewed distributed variables were summarized using median and inter-quartile ranges. Analysis of the data was done using SPSS 23 statistical package.
Case definition
Diabetes mellitus was diagnosed as a HbA1c of ≥ 6.5%, pre-diabetes as a HbA1c of 6.0-6.4% and non diabetes as HbA1c of ˂6.0%(6)(7).
159
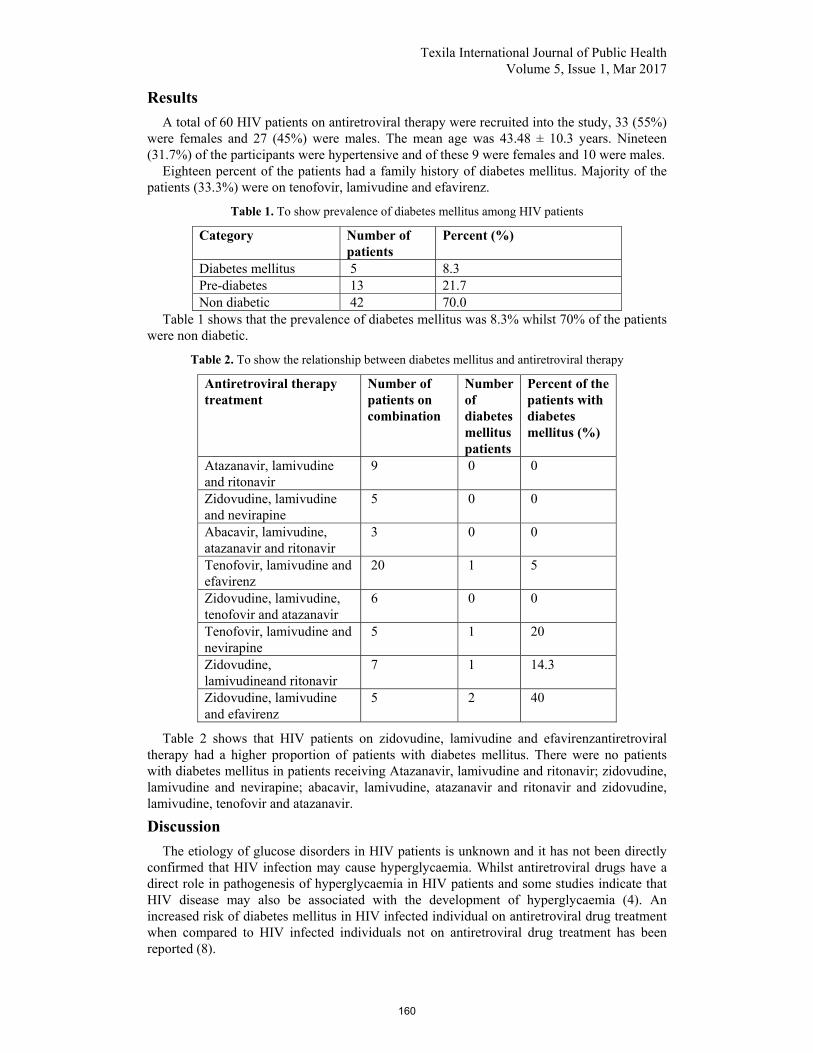
Texila International Journal of Public Health Volume 5, Issue 1, Mar 2017
Results
A total of 60 HIV patients on antiretroviral therapy were recruited into the study, 33 (55%) were females and 27 (45%) were males. The mean age was 43.48 ± 10.3 years. Nineteen (31.7%) of the participants were hypertensive and of these 9 were females and 10 were males.
Eighteen percent of the patients had a family history of diabetes mellitus. Majority of the patients (33.3%) were on tenofovir, lamivudine and efavirenz.
Table 1. To show prevalence of diabetes mellitus among HIV patients
Category Number of patients
Percent (%)
Diabetes mellitus 5 8.3 Pre-diabetes 13 21.7 Non diabetic 42 70.0
Table 1 shows that the prevalence of diabetes mellitus was 8.3% whilst 70% of the patients were non diabetic.
Table 2. To show the relationship between diabetes mellitus and antiretroviral therapy
Antiretroviral therapy treatment
Number of patients on combination
Number of diabetes mellitus patients
Percent of the patients with diabetes mellitus (%)
Atazanavir, lamivudine and ritonavir
9 0 0
Zidovudine, lamivudine and nevirapine
5 0 0
Abacavir, lamivudine, atazanavir and ritonavir
3 0 0
Tenofovir, lamivudine and efavirenz
20 1 5
Zidovudine, lamivudine, tenofovir and atazanavir
6 0 0
Tenofovir, lamivudine and nevirapine
5 1 20
Zidovudine, lamivudineand ritonavir
7 1 14.3
Zidovudine, lamivudine and efavirenz
5 2 40
Table 2 shows that HIV patients on zidovudine, lamivudine and efavirenzantiretroviral therapy had a higher proportion of patients with diabetes mellitus. There were no patients with diabetes mellitus in patients receiving Atazanavir, lamivudine and ritonavir; zidovudine, lamivudine and nevirapine; abacavir, lamivudine, atazanavir and ritonavir and zidovudine, lamivudine, tenofovir and atazanavir.
Discussion
The etiology of glucose disorders in HIV patients is unknown and it has not been directly confirmed that HIV infection may cause hyperglycaemia. Whilst antiretroviral drugs have a direct role in pathogenesis of hyperglycaemia in HIV patients and some studies indicate that HIV disease may also be associated with the development of hyperglycaemia (4). An increased risk of diabetes mellitus in HIV infected individual on antiretroviral drug treatment when compared to HIV infected individuals not on antiretroviral drug treatment has been reported (8).
160

Texila International Journal of Public Health Volume 5, Issue 1, Mar 2017
The prevalence of diabetes mellitus was 8.3%. The results a similar to the reported prevalence of diabetes mellitus amongst patients on zidovudine, lamivudine and nevirapine of 10.3% and 7.1% amongst patients on tenofovir, lamivudine and efavirenz in Ethopia (9). The prevalence of diabetes mellitus amongst patients on antiretroviral therapy was higher than 2.2% reported in South Africa (10). However the prevalence of diabetes mellitus was lower than 18% reported Tanzania (11).
We note that majority of the patients were on efavirenz containing regimen. Association between efavirenz exposure and diabetes mellitus has been reported. However is part of the first line of antiretroviral therapy treatment in sub Saharan Africa due to its perceived lower toxicity when compared to nevirapine (5). As antiretroviral access increases in sub Saharan Africa incidence of HIV associated diabetes mellitus is bound to grow (9)leading to an increase in diabetes mellitus prevalence.
Pre-diabetes produces no symptoms but it is a risk for the development of type 2 diabetes mellitus. The pre-diabetesperson is 5 to 15 times more likely to develop type 2 diabetes mellitus as compared to a person with normal blood glucose(12). The prevalence of pre-diabetes was 21.7% which is similar to the prevalence of pre-diabetes reported in Ethiopia of 22.4% (12).
Health care professional need working in HIV clinic need to create awareness to their HIV infected patients on diabetes mellitus prevention, diagnosis and treatment (9).We note the limitation of the small sample size and also the small number of patients with diabetes mellitus which did not enable us to carry association analysis.
Conclusion
Diabetes mellitus prevalence amongst the HIV patients on antiretroviral therapy treatment was 8.3%. There is need for need to investigate the factors associated with diabetes mellitus in HIV patients on antiretroviral therapy treatment and confirm the prevalence in a study with a large sample size.
References
[1]. Dave JA, Lambert EV, Badri M, West S, Maartens G, Levitt NS. Effect of nonnucleoside reverse transcriptase inhibitor–based antiretroviral therapy on dysglycemia and insulin sensitivity in South African HIV-infected patients. JAIDS J Acquir Immune DeficSyndr. 2011; 57 (4):284–9. [2]. Gebreyesus HA. Prevalence of prediabetes in HIV-1 infected adults receiving antiretroviral therapy in Addis Ababa, Ethiopia. Int J PharmaSci Res. 2015; 6 (2):440–3. [3]. Haregu TN, Olenburg B, Setswe G, Elliott J, Nanayakkara V. Epidemiology of Comorbidity of HIV/AIDS and Non--‐communicable Diseases in Developing Countries: A systematic review. J Glob Health Care Syst. 2012; 2 (1). [4]. Mohammed AE, Yemane Shenkute T, ChenekeGebisa W. Diabetes mellitus and risk factors in human immunodeficiency virus-infected individuals at Jimma University Specialized Hospital, Southwest Ethiopia. Diabetes MetabSyndrObes Targets Ther. 2015 Apr; 197. [5]. Maganga E, Smart LR, Kalluvya S, Kataraihya JB, Saleh AM, Obeid L, et al. Glucose Metabolism Disorders, HIV and Antiretroviral Therapy among Tanzanian Adults. Pacheco AG, editor. PLOS ONE. 2015 Aug 19; 10(8):e0134410. [6]. Manning K, Senekal M, Harbron J. Non-communicable disease risk factors and treatment preference of obese patients in Cape Town. Afr J Prim Health Care Fam Med. 2016; 8(1):1–12. [7]. Monroe AK, Glesby MJ, Brown TT. Diagnosing and Managing Diabetes in HIV-Infected Patients: Current Concepts. Clin Infect Dis. 2015 Feb 1; 60 (3):453–62. [8]. Moyo D, Tanthuma G, Mushisha O, Kwadiba G, Chikuse F, Cary MS, et al. Diabetes mellitus in HIV-infected patients receiving antiretroviral therapy. SAMJ South Afr Med J. 2014; 104 (1):40–2. [9]. Rasmussen LD, Mathiesen ER, Kronborg G, Pedersen C, Gerstoft J, Obel N. Risk of Diabetes Mellitus in Persons with and without HIV: A Danish Nationwide Population-Based Cohort Study. Atashili J, editor. PLoS ONE. 2012 Sep 12; 7 (9):e44575.
161

Texila International Journal of Public Health Volume 5, Issue 1, Mar 2017
[10]. Shen Y, Wang Z, Liu L, Zhang R, Zheng Y, Lu H. Prevalence of hyperglycemia among adults with newly diagnosed HIV/AIDS in China. BMC Infect Dis. 2013; 13 (1):79. [11]. The International Expert Committee. International Expert Committee Report on the Role of the A1C Assay in the Diagnosis of Diabetes. Diabetes Care. 2009 Jul 1; 32 (7):1327–34. [12]. World Health Organization. Use of glycated haemoglobin (HbA1c) in diagnosis of diabetes mellitus: abbreviated report of a WHO consultation. 2011 [cited 2016 Oct 28]; Available from: http://apps.who.int/iris/handle/10665/70523
162

Texila International Journal of Public Health Volume 5, Issue 1, Mar 2017
Knowledge and Practices of Food Safety among Senior Secondary School Students of International School, Obafemi Awolowo
University, Ile- Ife, Nigeria
Article by Ilesanmi Oluwafemi Temitayo Ph.D. in Public Health, Texila American University
E-mail: [email protected]
Abstract
Background: Food safety is a global public health concern. The problem of food safety not only affects human health but also causes the economic damage of nations. School children have been the foremost victim of food borne illnesses due to their unsafe behavior in food consuming. Knowledge and practices of food safety is very important among students since they are also consumers.
Objective: The objectives of this study were to assess the level of knowledge and practices of food safety; to investigate the association of certain demographic characteristics with the level of food safety knowledge and practices and to determine the correlation between the food safety knowledge and practices among senior secondary school students of International School, Obafemi Awolowo University, Ile-Ife, Osun State, Nigeria.
Methods: This is a cross- sectional study which used a pre-tested 27- item, purpose designed, self- administered questionnaires to collect information on knowledge and practices of the respondents on food safety. Data were collated and analyzed based on descriptive and inferential study design.
Results: The result showed that the total percentages of respondents with good level of food safety knowledge is 86.0% (339) with only 14.0% (55) respondents having poor food safety knowledge level as majority of the respondents 97.7% (385) also have high level of food safety practices with only 2.3% (9) of them having low practices on food safety. In addition, the result showed significant association between religion of the respondents and food safety knowledge scores and significant association between food safety practice scores and class of the students (p <0.05). The results also showed significant correlation between food safety knowledge and practices of the students (p <0.05).
Conclusion: It was, therefore, concluded that the senior secondary school students of International School, Obafemi Awolowo University, Ile- Ife, have good food safety knowledge and high food safety practices.
Keywords: Food safety, knowledge, practices
Introduction
Food safety is a vital issue which relates to the quality of food and producing, allocation as well as consumption avoiding the contaminated and deteriorated food (Prabhakar et al, 2010). Food safety is the inverse of food risk or can be described as the probability of not suffering some hazard from consuming a specific food (Henson and Traill, 1993). In general, food safety is public health precedence. This is due to the fact that millions of people get ill and leading many to die each year, as a consequence of consuming unsafe food (WHO, 2009). Food safety remains a critical issue with outbreaks of food-borne illness resulting in substantial costs to individuals, the food industry, community health systems, and to the economy in general (Egan et al., 2007). Currently, there is the spread of more than 200 diseases through food; and beyond, those foodborne illnesses are on the increase worldwide. Food safety, therefore, is a global concern.
Each year, millions of people worldwide suffer from food-borne diseases and illnesses resulting from the consumption of contaminated food, which has become one of the most
163

Texila International Journal of Public Health Volume 5, Issue 1, Mar 2017
widespread public health problems in the contemporary world (Sanlier, 2009). The association of food poisoning outbreaks and the consumption of contaminated food are significant in many countries (Sanlier, 2009). In less developed countries like Nigeria, many people are poisoned because of the consumption of foods produced under unhygienic conditions; lack of hygienic education, contaminated waters; lack of cleaning; inappropriate food storage conditions and pesticide residue (Sanlier, 2008).The most common factors contributing to food-borne disease outbreaks include safe keeping of food (time/temperature), contaminated equipment, food from unsafe sources, poor personal hygiene, and inadequate cooking (Lynch et al, 2006; WHO, 1989). The customer surveys undertaken by FAO 2006, and other investigators revealed that the main consumers of street foods in most countries were other members of the informal sector, such as fellow hawkers and hustlers and casual wage laborers. Other important categories of customer were children and students, office workers, and housewives (FAO, 2010). Although the public is increasingly concerned about food-related risks, the rise in food poisoning cases suggests that people still make decisions of food consumption, food storage and food preparation that are less ideal from a health and safety perspective (McCarthy et al., 2007).
College students are one of the most at- risk population groups due to their unsafe behaviour in food consuming (Dong, 2015). It is also believed that young adults have inadequate knowledge about measures needed to prevent foodborne illnesses (Osaili et al, 2011). Students are captive customers who are usually incompetent to purchase food from external sources during six hours they are at school (Abdul Aziz et al, 2013). School children have been the foremost victim in many food poisoning cases (Abdul Aziz et al, 2013). Children with weakened immune systems are more at risk of getting ill from food poisoning than those who are in good health. Children are most vulnerable to foodborne diseases because their immune systems are not fully developed (McSwane et al, 2003). Food poisoning cases are usually reported among school students that involve in school canteens, hostel kitchens and food prepared under the supplementary food programme. The contributing factors in these outbreaks of food poisoning are improper storage or holding temperature and poor personal hygiene (Khor et al, 1998).
The prevention of food borne illnesses requires educating food consumers on safe food handling practices (Jevsnik et al, 2008). Education must be provided to increase the level of knowledge. An efficient and continuous food safety education will enable consumers (children, youth, adults and the elderly) to learn the methods for preventing health threatening food safety problems and change their misguided habits (Sanlier, 2009). Knowledge of food safety is very important among students because they are also consumers (Turnbull-Fortune & Badrie 2014). Knowledge of food safety among school students should be developed in the early stage of age because they are the future food handlers. Food safety education requires basic training in safe food handling practices, preparation and storage of foods. Lifestyles such as student’s eating habit could have an effect on his or her present health and well- being, as habit established during early childhood can continue into later life (Turnbull-Fortune & Badrie 2014).
There are many studies about the knowledge and practices of food safety which was done on different groups (Dong, 2015; Webb & Morancie, 2014; Giritlioglu et al, 2011; Sanlier, 2009; Musa & Akande, 2003). There are limited research findings to determine practices and knowledge of food safety among secondary school students in Nigeria. However, This study is, therefore, directed to investigate the knowledge and practices of food safety among senior secondary school students of International School, Obafemi Awolowo University, Ile-Ife, Nigeria as a case sample, to determine the association of certain demographic characteristics of the students with their food safety knowledge and practices and to determine whether there is correlation between their food safety knowledge and practices.
164

Texila International Journal of Public Health Volume 5, Issue 1, Mar 2017
Significance of study
There is need to assess the food safety knowledge and practices of the students because of their unsafe behavior in food consuming which are more than other groups of people and thus be vulnerable to food poisoning and other food borne diseases. Furthermore, assessing their basic knowledge is essential for developing an effective health education programs on food safety. In addition, the findings from this study can also provide basic and useful information for policy makers on food safety interventions.
Statement of problem
Several studies have shown that prevention of food borne illnesses require educating food consumers on safe food handling practices. This food safety education would enable the consumers who are at risk to learn the methods of preventing health threatening food safety problems. However, prior to education, it is important to assess food safety issues relevant to consumers. Studies have shown that College students are one of the most at-risk population groups due to their unsafe behaviors in food consuming and that this category of students can be vulnerable to food poisoning and other food borne diseases in institutions such as schools and other places where food and drinks are served or sold. These students are vulnerable because their immune systems are not fully developed and there is a need to assess the level of their knowledge which will culminate to their food safety practices. Moreover, to the best of my knowledge, limited studies focused on young students have been found in the literature and formal studies conducted concerning food safety knowledge and practices of secondary school students in Ile- Ife, Nigeria is sparse. Food borne diseases have become serious public health problem in developing countries like Nigeria and people often affected are school children. Therefore, this study aimed at assessing food safety knowledge and practices of these senior secondary school students, investigate the association between their food safety knowledge and practices and certain demographic characteristics of these students and determine whether there is correlation between their food safety knowledge and practices.
Research questions
The major research questions for this study include the followings: 1. Do senior secondary school students of International School, OAU in Ile-Ife know about
food safety? 2. Do senior secondary school students of International School, OAU in Ile-Ife engage in
food safety practices? 3. Is there any association between food safety knowledge of these students and their
socio-demographic characteristics? 4. Is there any association between food safety practices of these students and their socio-
demographic characteristics? 5. Is there any correlation between food safety knowledge and practices of the senior
secondary school students of International School, OAU?
Research objectives
1. To assess the knowledge of the senior secondary school students of International School, OAU, Ile- Ife on food safety.
2. To assess the practices of the senior secondary school students of International School, OAU, Ile- Ife on food safety.
3. To determine the association between food safety knowledge level and socio-demographic characteristics of senior secondary school students of International School, OAU, Ile- Ife.
4. To determine the association between food safety practices level and socio-demographic characteristics of senior secondary school students of International School, OAU, Ile- Ife.
5. To determine the correlation between food safety knowledge and practices of senior
165

Texila International Journal of Public Health Volume 5, Issue 1, Mar 2017
secondary school students of International School, OAU, Ile- Ife.
Literature review
Food safety is a global public health concern. The problem of food safety not only affects human health but also causes the economic damage of nations. Annually, Health Canada estimates 2.2 million cases of foodborne illness in Canada, bringing about $1.3 billion of social cost annually (Harris, 1997). In United States, foodborne infection affects between 6.5 and 33 million people, with medical costs and productivity losses that have been calculated at around 9.3 to $12.9 USD billion (Busby et al, 1996). In 1996, it is estimated that at least 9,578 inhabitants that children are in the majority suffered from serious Escherichia coli infections related to white radish sprouts in a Japanese epidemic (Caroline et al, 2005). Additionally, approximately 700,000 people die of water and food safety related reasons in the mere Asia-Pacific region each year. Furthermore, based on the statistics of Vietnam food administration (VFA), food poisoning affects more than 3,187 people in the only first half of 2013. It is obvious that the developing countries and the developed nations all suffer foodborne diseases and the incidence of those infections is increasing (Redmond et al, 2003). In the United State, estimation of food borne disease may result in 76 million illnesses, 325,000 hospitalization and 5000 deaths each year (Mead, et al, 1999) while in England and Wales, food borne diseases resulted in an estimated of 1.3 million cases, 21,000 hospitalizations and 500 deaths yearly (Adak et al, 2002). It is of good concern that World Health Organization (WHO, 2007) reported in the year 2005 that 1.8 million people died from diarrhoea one of vary foodborne diseases. For this reason, foodborne diseases have captured public awareness worldwide in recent years. The Ministry of Health Malaysia (MOH, 2007, 2009, 2010) reported that the incident rate for food poisoning was 26.04, 62.47 and 36.17 per 100,000 populations in 2006, 2008 and 2009 respectively. In line with such report, there was in fact an increase in number of episodes of foodborne outbreak reported by various states in Malaysia commonly outbreaks occurring in schools (Zain and Naing, 2002; WHO, 2008; Sharif and Al-Malki, 2010). Besides, an epidemiology study found out that since 1997, foodborne outbreaks increased 66.5% among school age group in Malaysia (Meftahuddin, 2002; Naing et al, 2007). Centre Disease Control and Prevention (CDC, 2000) identified five risk factors of food handling that add to foodborne illnesses which include improper cooking procedure, temperature abuse during storage, lack of hygiene and sanitation by food handlers, cross contamination between raw and fresh ready to-eat foods.
Nowadays, in spite of general knowledge about the importance of hygiene, the incidence of food borne illness is high. A FAO/WHO assessment in 1983 said that consumption of infected food caused most of the illnesses and the biggest expense around the world (Haapala & Probart, 2004). National and international surveys show that people still do not have appropriate knowledge of food safety. As a result, more and more countries organize educational courses to improve skills and knowledge regarding food safety (Haapala & Probart, 2004). Inadequate food safety laws, weak regulatory systems, lack of financial resources to invest in safer methods of cooking, inadequate knowledge of food borne diseases and their causes, improper handling of food and unhygienic environments among others have been identified as some of the causes of food borne diseases (Adebukola et al, 2015). Quick et al, 2013 reported that Middle schoolers had insufficient food safety knowledge even though most reported washing their hands before making a snack and washing fruits and vegetables before eating them.
Food safety knowledge and behavior among young adults have been studied in different parts of the globe. The result revealed that these groups of consumers are engaged in food safety behavior that put their health at risk for food borne diseases. A recent study showed that over 50% of the Saudi college students consumed raw eggs and raw white cheese and 34% believed that there is no risk of disease from eating cooked food kept at room temperature for one day if covered. About one third of the American college students reported eating fried eggs with soft yolks and about half reported eating raw cookie dough, and undercooked
166

Texila International Journal of Public Health Volume 5, Issue 1, Mar 2017
chicken and hamburger. In Turkey, more than half of young consumers (Chapman et al, 2010) did not know that internal temperature of the food is the safest way to know if the meat was cooked well (Osaili et al, 2011).
Knowledge is defined as the capacity to acquire, retain and use information. It is also a mixture of comprehension, experience, discernment and skill (Ibrahim, 1995). It is a complicated construction characterized by the structure and the content of the information stored in the memory (Brucks, 1986). Practice is regarded as the application of rules and knowledge that leads to action (Ibrahim, 1995). Food safety knowledge is important to prevent food borne illness (Chapman et al, 2010). Vladimirov (2011) point outs the correlation of positive behaviour, attitudes and continued education of food handlers towards the maintenance of safe food handling practices. Earlier studies conducted on adults have also indicated that food safety knowledge tends to increase with age and practice: females have higher scores than males, and younger respondents show the greatest need for additional food safety education (Bruhn & Schutz, 1999; Byrd-Bredbenner et al., 2007; Rimal et al., 2001; Unusan, 2007). The need for enhanced food safety education started to be recognized in developed countries with the launch of national initiatives to find ways to educate consumers effectively, especially youngsters and adults who prepare food (Haapala & Probart, 2004). Better educated consumers often recognize the importance of food safety and younger respondents have shown the greatest need for additional education on food safety (Bruhn & Schutz, 1999; Li-Cohen & Bruhn, 2002; Sudershan et al., 2007). Learning about basic knowledge and practices of young consumers is essential for the development of effective health education programs in Nigeria. An efficient and continuous food safety education will enable consumers (children, youth, adults and the elderly) to learn the methods for preventing health threatening food safety problems and change their misguided habits (Sanlier, 2009).
Methods
Research design, study area and population
A cross- sectional study was conducted in December 2016 on food safety knowledge and practices of senior secondary school students of International School, Obafemi Awolowo University (OAU), Ile- Ife, Osun State, Nigeria. The study was carried out in International School, Obafemi Awolowo University, a well-known and reputable private secondary school of the University in Ile-Ife town. Ile-Ife is an ancient city of Yoruba land situated in Osun State which is located in the South- Western part of Nigeria. The study population consisted of the secondary school students’ boys and girls in the senior secondary one, two and three (SS1, SS2, and SS3) of the College.
Data collection
Information was collected from respondents by means of a pre-tested 27- item, purpose designed, self- administered anonymous questionnaire containing closed ended questions.
The questionnaire was divided into three major sections: Section A contained 7 items focusing on socio-demographic characteristics of the senior secondary school students. Section B contained 10 items focusing on questions related to knowledge of the senior secondary school students on food safety while section C contained 10 items focusing on questions related to food safety practices of the senior secondary school students of the College. All these questions were modified from the previous studies (Lamidi, 2016; Osaili et al, 2010; Sanlier, 2010; Mohd et al, 2009). Answers were graded by assigning 1 point for the right answers and 0 point for the wrong answers given to the questions on food safety knowledge. Scores regarding food safety knowledge range from 0 to 10. The cut off point for scores regarded as poor for food safety knowledge is 4 ( out of 10 while from 5( out of 10 is regarded as good food safety knowledge. Answers to the questions on food safety practices were graded as follows: ‘almost never’, 1 point, ‘sometimes’, 2 point, ‘often’. 3 point and ‘always’, 4 point. Scores regarding food safety practices vary from 10 to 40. The cut off point for scores regarded as low for food safety practice is 19 ( out of 40 while
167

Texila International Journal of Public Health Volume 5, Issue 1, Mar 2017
from 20 ( out of 40 is regarded as high food safety practice. Each questionnaire takes approximately 4 minutes to administer.
Sample size determination
The minimum sample size was calculated using the Leslie and Kish formula for descriptive studies N = P (1-P) Z2/D2 where N is the minimum sample size needed; D is the level of error that can be tolerated (0.05 absolute precision) and P, the estimated proportion of food safety knowledge among college students from a previous study (Osaili et al, 2011) was 33.9% i.e. p= 0.34. Z is the standard variation corresponding to confidence level. At confidence level of 95%, Z= 1.96. Therefore,
N = 0.34(1-0.34) 1.962/0.052
N= 345. To give allowance for an anticipated non-response rate of 10% (35 respondents), the sample size was increased by 35 to make 380 respondents. A total of 420 questionnaires were then taken to the school to be distributed for the study.
Sampling method
Each secondary class level from SSI to SS3 has four arms. A simple random sampling technique was employed to select a minimum of 140 senior secondary school students at random from each class level (i.e. 140 from SS1, 140 from SS2 and 140 from SS3) of the senior classes of International School, OAU, Ile-Ife with age ranges from 12 – 20 years to make a total of 420 students to participate in the study. Of the 420 questionnaires distributed, 394 (response rate of 94%) were returned and used for the analysis. Each respondent was provided with an assurance of confidentiality of information provided in the questionnaire.
Data analysis
The completed questionnaires were collated, analyzed and presented using descriptive statistics of simple percentages and frequency distribution. All statistical analyses were performed using the Statistical Package for the Social Sciences, Version 22.0 (SPSS, Inc., Chicago, IL, USA). Means and standard deviation were used to present the scores of food safety knowledge and practices of the students. Chi-square test was performed to test for differences in socio-demographic and academic variables between students who passed the food safety knowledge questions and those who failed. Findings with a P-value < 0.05 were considered to be statistically significant. Analysis was stratified by gender to show how responses to the variables of knowledge and practices on food safety differ for males and females. Also inferential statistics of Chi squares was used to determine the association between socio- demographic variables and food safety knowledge and also between socio- demographic variables and food safety practices of the respondents. Inferential statistics of Person product moment correlation coefficient was used to determine the correlation between food safety knowledge and practices of senior secondary school students of International School, OAU, Ile- Ife.
Results
Demographic characteristics of the study population
A total number of 394 senior secondary school students of International School, Obafemi Awolowo University participated in the study with a very close percentage distribution between the males (49.2%) and females (50.8%) respondents. Majority of the respondents (51.3%) were between the ages of 12 and 14 years. The result also showed that the percentage distribution of the students in their various classes were very close as we have 32.7% in SSI, 32% in SS2 and 35.3% in SS3. Largest percentages of them were Christians (79.2%) as shown by the result. The results also showed that largest percentages of them were Yoruba tribe (91.4%), living with parents (95.2%) and having their mother educational level being 12 or more years (91.6%) as shown in Table1
168

Texila International Journal of Public Health Volume 5, Issue 1, Mar 2017
Table 1. Demographic Characteristics of the study population
Socio- demographic characteristics
Number of respondent N
Percentage (%)
Age: 51.3
12- 14 202 48.0 15- 17 189 0.8
18- 20 3 100.0 Total 394 51.3
Gender: 49.2 Male 194 50.8 Female 200 100.0 Total 394 49.2 Class: 32.7 SS1 129 32.0 SS2 126 35.3 SS3 139 100.0 Total 394 32.7 Religion: 79.2
Christianity 312 20.6
Islam 81 0.3
Traditional 1 100.0
Total 394 79.2
Tribe: 91.4 Yoruba 360 3.6 Igbo 14 0.5 Hausa 2 4.6 Others 18 100.0 Total 394 91.4 Household Composition:
95.2
Living with parents 375 1.8 Living alone 7 3.0 Parents separated 12 100.0 Total 394 95.2 Mother educational level:
8.4
< 12 years 33 91.6 12 years or more 361 100.0 Total 394 8.4
Food safety knowledge levels of the respondents
To determine the level of food safety knowledge, scoring for each question is assessed for correctness and the total score obtained is between 0- 10. The total percentages of respondents with good level of knowledge of food safety scoring between 5- 10 of the total score is 86% (339) and only 14% (55) respondents have poor level of knowledge of food safety with total food knowledge scores between 0-4 (as in Table 2a). The mean of the food safety knowledge score of the respondents was calculated to be 6.44 1.657. Table 2b shows the total number and the percentages of correct responses given by the senior secondary school students of International School, OAU on the whole questionnaire on food safety knowledge. Only (15.5%) of the respondents knew that they should look at the expiry date to understand if the
169
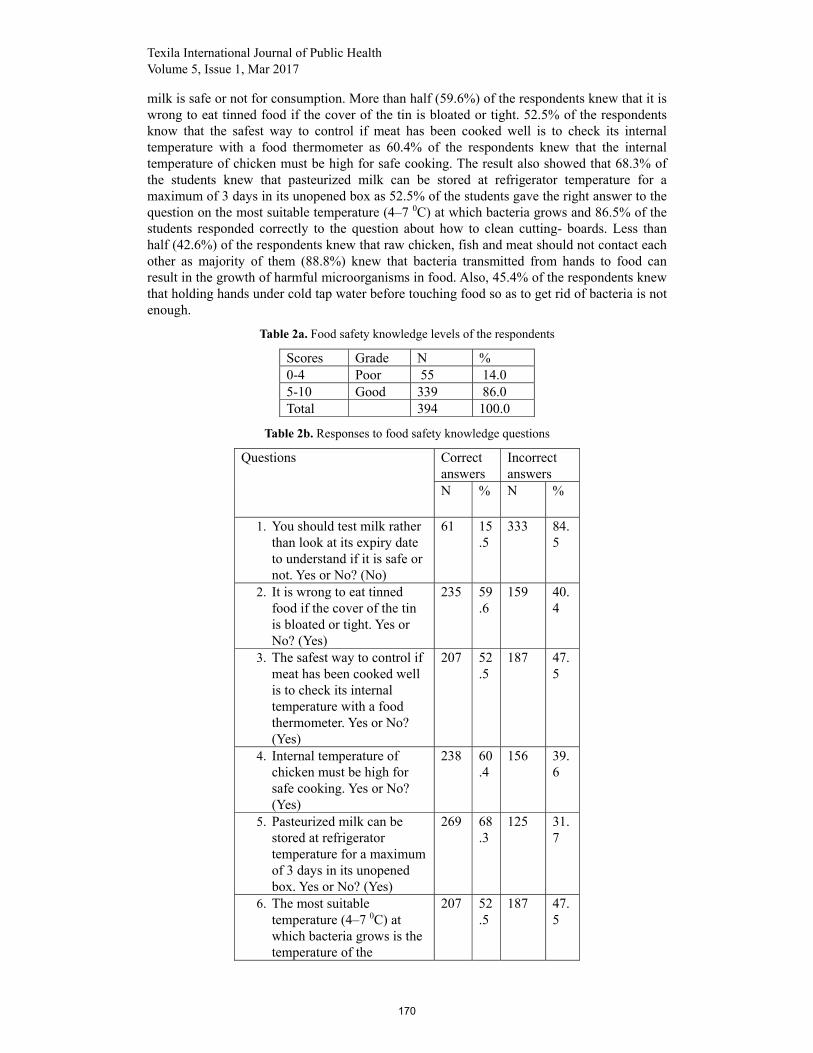
Texila International Journal of Public Health Volume 5, Issue 1, Mar 2017
milk is safe or not for consumption. More than half (59.6%) of the respondents knew that it is wrong to eat tinned food if the cover of the tin is bloated or tight. 52.5% of the respondents know that the safest way to control if meat has been cooked well is to check its internal temperature with a food thermometer as 60.4% of the respondents knew that the internal temperature of chicken must be high for safe cooking. The result also showed that 68.3% of the students knew that pasteurized milk can be stored at refrigerator temperature for a maximum of 3 days in its unopened box as 52.5% of the students gave the right answer to the question on the most suitable temperature (4–7 0C) at which bacteria grows and 86.5% of the students responded correctly to the question about how to clean cutting- boards. Less than half (42.6%) of the respondents knew that raw chicken, fish and meat should not contact each other as majority of them (88.8%) knew that bacteria transmitted from hands to food can result in the growth of harmful microorganisms in food. Also, 45.4% of the respondents knew that holding hands under cold tap water before touching food so as to get rid of bacteria is not enough.
Table 2a. Food safety knowledge levels of the respondents
Scores Grade N % 0-4 Poor 55 14.0 5-10 Good 339 86.0 Total 394 100.0
Table 2b. Responses to food safety knowledge questions
Questions Correct answers
Incorrect answers
N % N %
1. You should test milk rather than look at its expiry date to understand if it is safe or not. Yes or No? (No)
61 15.5
333 84.5
2. It is wrong to eat tinned food if the cover of the tin is bloated or tight. Yes or No? (Yes)
235 59.6
159 40.4
3. The safest way to control if meat has been cooked well is to check its internal temperature with a food thermometer. Yes or No? (Yes)
207 52.5
187 47.5
4. Internal temperature of chicken must be high for safe cooking. Yes or No? (Yes)
238 60.4
156 39.6
5. Pasteurized milk can be stored at refrigerator temperature for a maximum of 3 days in its unopened box. Yes or No? (Yes)
269 68.3
125 31.7
6. The most suitable temperature (4–7 0C) at which bacteria grows is the temperature of the
207 52.5
187 47.5
170

Texila International Journal of Public Health Volume 5, Issue 1, Mar 2017
refrigerator. Yes or No? (No)
7. If a cutting-board will be used to cut different types of food such as vegetables and meat, you should clean the board with a clean towel to prevent bacterial growth. Yes or No? (Yes)
341 86.5
53 13.5
8. Raw chicken, fish and meat should not contact each other. Yes or No? (Yes)
168 42.6
226 57.4
9. Bacteria transmitted from hands to food can result in the growth of harmful microorganisms in food. Yes or No? (Yes)
350 88.8
44 11.2
10. It is enough to hold your hands under cold tap water before touching food so as to get rid of bacteria. Yes or No? (No)
179 45.4
215 54.6
Food safety practices level of the respondents
The results showed that majority of the respondents (385) have high level of practices on food safety with total score of 97.7%%. Only 2.3% (9%) respondents have low practices on food safety as in Table 3a. The calculated mean and standard deviation of food safety practices score of the respondents are 30.10 5.159 with the scores ranging from 0 -40. Food safety practices of the senior secondary school students are presented in Table 3b. The result showed that 73.6% of the students always ensure purchasing food that is clean and in fresh condition and 64.5% always wash their hands before preparing and eating food at home while 28.7% always wash their hands before eating food in the school canteen/restaurant. The results also showed that 44.2% of the students always check the expiry date on the food packages before purchase, 43.7% always do not eat raw or uncooked eggs and foods made from raw eggs and 57.6% always put the easy-to-spoil foods into the refrigerator as soon as they buy them. In addition, 21.1% always taste food to see if it is safe or not and 31.5% always dry their hands with paper towel or tissue after washing them. Besides, a very large percentage (86%) always eat meat after it has been cooked well and do not consume raw meat while approximately one- third (34.3%) of the respondents always prefer to reheat the leftovers by using microwave oven.
Table 3a. Food safety practices level of the respondents
Scores Grade N % 0-19 Low 9 2.3 20-40 High 385 97.7 Total 394 100.0
171

Texila International Journal of Public Health Volume 5, Issue 1, Mar 2017
Table 3b. Responses to food safety practices questions
Practices No Response (%)
Almost never (%)
Sometimes (%)
Often (%) Always (%)
1. I always ensure purchasing food that is clean and in fresh condition.
0.8 1.8 9.1 14.7 73.6
2. I wash my hands before preparing and eating food at home.
0.5 2.0 15.2 17.8 64.5
3. I wash my hands before eating food in the school canteen/restaurant.
1.3 12.4 37.6 20.1 28.7
4. I check the expiry date on the food packages before purchase.
1.0 4.6 27.2 23.1 44.2
5. I do not eat raw or uncooked eggs and foods made from raw eggs.
1.0 27.2 18.5 9.6 43.7
6. I put the easy-to-spoil foods into the refrigerator as soon as I buy them.
0.8 4.6 16.5 20.6 57.6
7. I taste food to see if it is safe or not.
0.8 24.6 36.0 17.5 21.1
8. I dry my hands with paper towel or tissue after washing it.
0.3 16.0 32.5 19.8 31.5
9. I eat meat after it has been cooked well, I do not consume raw meat.
0.3 4.8 3.6 5.3 86.0
10. For leftovers, I prefer to reheat it by using microwave oven.
0.5 17.0 23.9 24.4 34.3
Association between socio-demographic characteristics and food safety knowledge level of the students
The association between socio- demographic characteristics and food safety knowledge level of the students is shown in Table 4.Using Pearson Chi- square test, significant association was found only between religion and food safety knowledge scores of the respondents among other socio-demographic variables considered in this study (p< 0.05). There was no significant association between food safety knowledge scores and age, gender, class, tribe, household composition and mothers’ educational level of the respondents (p> 0.05).
172

Texila International Journal of Public Health Volume 5, Issue 1, Mar 2017
The association between socio- demographic characteristics and food safety practices level of the students
The association between socio- demographic characteristics and food safety practice level of the students is shown in Table 5. Also, using Pearson Chi- square test, significant association was found between food safety practice scores and class of the respondents among the socio-demographic variables considered in this study (p< 0.05). There was no significant association between food safety practice scores and age, gender, religion, tribe, household composition and mothers’ educational level of the respondents (p> 0.05).
Table 4. The association between socio- demographic characteristics and food safety knowledge level of the students
Variable Total knowledge scores p- value Poor good
Age: 12-14 14-17 18- 20 Gender: Male Female Class: SS1 SS2 SS3 Religion: Christianity Islam Traditional Tribe: Yoruba Igbo Hausa Others Household composition: Living with parents Living alone Parents separated Mothers educational level: < 12 years 12 years or more
16.3 11.6 - 14.4 13.5 13.2 19.0 10.1 13.5 14.8 100.0 13.6 21.4 - 16.7 13.6 - 33.3 15.2 13.9
83.7 88.4 100.0 85.6 86.5 86.8 81.0 89.9 86.5 85.2 - 86.4 78.6 100.0 83.3 86.4 100.0 66.7 84.8 86.1
0.319 0.789 0.104 0.043 0.772 0.085 0.836
Correlation between food knowledge and food safety practice scores of the respondents
Table 6 shows the correlation between food knowledge and food safety practice scores of the senior secondary school students considered in the study. The result showed that there was a small, positive correlation between the two variables [r = 0.134, n =394, p . Correlation is significant at the 0.01 level when p = 0.008.
173

Texila International Journal of Public Health Volume 5, Issue 1, Mar 2017
Table 5. The association between socio- demographic characteristics and food safety practices level of the students
Variable Total practice scores p- value
low High Age: 12-14 14-17 18- 20 Gender: Male Female Class: SS1 SS2 SS3 Religion: Christianity Islam Traditional Tribe: Yoruba Ibo Hausa Others Household composition: Living with parents Living alone Parents separated Mothers educational level: < 12 years 12 years or more
2.5 2.1 - 3.1 1.5 0.8 5.6 0.7 2.2 2.5 - 1.9 7.1 - 5.6 2.1 - 8.3 3.0 2.2
97.5 97.9 100.0 96.9 98.5 99.2 94.4 99.3 97.8 97.5 100.0 98.1 92.9 100.0 94.4 97.9 100.0 91.7 97.0 97.8
0.938 0.290 0.012 0.981 0.462 0.338 0.764
Table 6. Correlation between food knowledge and food safety practice scores of the respondents
Correlations
Food safety practice scores
Food safety knowledge score
Food safety practice scores Pearson Correlation 1 .134xx Sig. (2-tailed) .008 N 394 394
Food safety knowledge score
Pearson Correlation .134xx 1 Sig. (2-tailed) .008 N 394 394
**. Correlation is significant at the 0.01 level (2-tailed).
Discussion
This study was conducted to assess the food safety knowledge and practices of the senior secondary school students of International School, OAU, Ile- Ife and to determine the association that exists between food safety knowledge level and between food safety practices level and socio-demographic characteristics of these students and also to determine if any correlation exists between their food safety knowledge and practices. Food safety is a global
174

Texila International Journal of Public Health Volume 5, Issue 1, Mar 2017
public health concern. The problem of food safety not only affects human health causing food borne illnesses but also causes the economic damage of nations. Knowledge of food safety is very important among students since they are also consumers (Turnbull-Fortune and Badrie, 2014).
The sex distribution in this study had more female respondents than male respondents. This is in contrast to similar studies conducted by Lamidi (2016) and Norazmir et al, 2012 which reported male respondents higher in number than female respondents.
The result also showed higher Christian respondents and Yoruba respondents than any other religion and tribes respectively. This result can be explained by the fact that the sampled private school reflects the dominant religion being practiced in the community and is located in Yoruba land. This invariably shows that the study environment will usually reflect the characteristics of the study population.
Majority of the students considered in this study have good level of knowledge on food safety. This study is in line with a related study conducted by Osaili et al, 2011 who rated the food safety knowledge of their respondents to be excellent/good. The result is also in line with that of Norazmir et al, 2012 who obtained that their respondents have a good knowledge on food safety which is about 88.7% (354) and only 0.3% respondents take in poor level of knowledge. It is also in line with that of Lamidi, 2016 who obtained that his respondents have a good knowledge on food safety which is about 65.8% (269) of all the respondents.
The result in this study also showed that majority of the respondents (385) have high level of practices on food safety with total score of 97.7% and only 2.3% (9) respondents have low practices on food safety. The percentage obtained by Norazmir et al, 2012 in their study was 79.1% which was lower than the one obtained in this study. Also, the percentage obtained by Lamidi, 2016 in his study was 65.8% which was lower than the one obtained in this study.
The outcome of this study also showed that significant association was found only between religion of the respondents and food safety knowledge scores. Lamidi (2016) on the contrary in his study found a significant association between mothers’ educational level and food safety knowledge scores. Osaili, et al (2011) on the contrary in their study showed that there was strong association between college status, students major and self -rated food safety knowledge and food safety knowledge score.
The result also showed that significant association was found between food safety practice scores and class of the respondents in this study. However, Lamidi, 2016 found a significant association between food safety practice and age, gender, class and household composition of the respondents in his study.
Finally, there was significant correlation between food safety knowledge and food safety practices of the students. This is similar to the result of Norazmir et al, 2012 which showed correlation between food safety knowledge and practices on food safety indicating a small positive correlation with [r = 0.148, n = 221, p<0.05] for Sekolah Tinggi Arab Maahad and [r = 0.053, n = 178, p<0.5] for Sekolah Menengah Kebangsaan Gelang Patah.
Limitation of the study
This study is not without some limitations. One, the study is based on self- reported information and thus is subject to self- report bias. To correct this, effort was made to reduce the impact of this bias by making the questionnaire a guided self- administered process. Two, the students used for this study were drawn mainly from a private high school in Ile-Ife and therefore the outcome of the study cannot be generalized as they are not true representatives of all the secondary school students in Ile-Ife.
Conclusion
The outcome of this study reveals that majority of the senior secondary school students considered in this study have good level of food safety knowledge and have high level of food safety practices. Also, the study shows a significant association between religion and food safety knowledge scores and significant association between food safety practice scores and
175

Texila International Journal of Public Health Volume 5, Issue 1, Mar 2017
class of the senior secondary school students. Lastly, in this study, there was significant correlation between food safety knowledge and food safety practices of the students.
Recommendation In view of the above conclusion, the followings are therefore recommended:
1. Attention should be given to the monitoring and evaluating food safety practices among International School, OAU College students as some of the students still have poor food safety knowledge scores.
2. There is need for continuous educational programs to improve the food safety practices of these students as it has been shown that class is associated to their food safety practice.
3. There is need to develop a state policy regarding education on food safety to be given to the schools on the practices of these young students who are also consumers as they are at risk of food borne diseases and they can be protected by the government.
4. Food safety knowledge and practices of these private college students can be compared with those in the public or rural secondary schools so that the results can become generalized.
5. Food safety knowledge and practices of students from other Colleges for the entire Ile- Ife town in a larger way can also be conducted.
References
[1]. Abdul Aziz, S.A., Dahan, H.M (2013). Food handlers’ attitude towards safe food handling in school canteens. Procedia- Sociaal and Behavioural Sciences. 105 (2013), 220-228. [2]. Adak, G.L., Long, S.M., O’Brien, S.J (2002). Trends in indigenous food borne diseases and deaths, England and Wales: 1992-2000. Gut. Pp 832-844. [3]. Adebukola, O. C., Opoyemi A. O. & Awosika I. A (2015). Knowledge of food borne infection and food safety practices among local food handlers in Ijebu-Ode Local Government Area of Ogun State. Journal of Public Health and Epidemiology 7 (9): 268- 273. [4]. Brucks, M. (1985). The effects of product class knowledge on information search behavior. Journal of Consumer Research, 12(1), 1-15. http://dx.doi.org/10.1086/20903. [5]. Bruhn, C. M., & Schutz, H. G. (1999). Consumer food safety knowledge and practices. Journal of Food Safety, 19, 73–87. [6]. Busby, J. C., Roberts, T., Lin, C. T., & MacDonald, J. M. (1996). Bacterial food borne diseases: Medical costs and productivity losses. USA: Food and Consumer Economics Division, Economic Research Service, US Department of Agriculture. [7]. Byrd-Bredbenner, C., Wheatley, V., Schaffner, D., Bruhn, C., Blalock, L., & Maurer, J.(2007). Development of food safety psychosocial questionnaires for young adults. Journal of Food Science Education, 6, 30–37. [8]. Caroline, S. D., & Nadine, R. (2005). Global and local: Food safety around the world. Washington, DC: Center for science in the public interest. [9]. Centers for Disease Control and Prevention. (2000). Surveillance for foodborne disease outbreak United States, 1993-1997.Morbidity Mortality Weekly Report 49 (SS01), 1-51. [10]. Chapman, B., Eversley, T., Fillion, K., MacLaurin, T., & Powell, D. (2010). Assessment of food safety practices of food service food handlers (risk assessment data): Testing a communication intervention (evaluation of tools). Journal of Food Protection, 73, 11011107. [11]. Dong, T.T.M (2015).The knowledge, attitude, and practice of consumers towards food safety issues: A review of Taiwan. International Journal of Research Studies in Management. 2015 October, Volume 4. Number 2. Pp 13-22 [12]. Egan, M. B., Raats, M. M., Grubb, S. M., Eves, A., Lumbers, M. L., Dean, M. S., & Adams, M. R. (2007). A review of food safety and food hygiene training studies in the commercial sector. Food Control, 18, 1180e1190. [13]. Food and Agriculture Organization, “The State of Food Insecurity in the World 2006,” http://www.fao.org/docrep/009/a0750e/a0750e00.htm.
176

Texila International Journal of Public Health Volume 5, Issue 1, Mar 2017
[14]. Food and Agriculture Organization, “The State of Food Insecurity in the World 2010,” http://www.fao.org/docrep/013/i1683e/i1683e.pdf. [15]. Giritlioglu, I., Batman, O., Tetik, N (2011). The knowledge and practice of food safety and hygiene of cookery students. Food Control, 22 (2011): 838-842. [16]. Haapala, I., & Probart, C. (2004). Food safety knowledge perceptions and behaviors among middle school students. Journal of Nutrition Education and Behavior, 36, 71–76. [17]. Harris, L. (1997). Hamburger hell: Better risk communication for better health. In D. A. Powell & W. Leiss (Eds.), Mad cows and mothers milk: the perils of poor risk communication (pp. 77–98). McGill-Queen’s University Press. [18]. Henson, S., & Traill, B. (1993). Consumer perceptions of food safety and their impact on food choice. In G. G.Birch & G. Campbell-Platt (Eds.), Food safety - the challenge ahead (pp. 39-55). [19]. Ibrahim, G. B. (1995). Knowledge, attitude and practice- the three pillars of excellence and wisdom: A place in the medical profession. Eastern Mediterranean Health Journal, 1(1), 8-16. [20]. Jevsnik, M., Hlebec, V., Raspor, P (2008). Consumers’ awareness of food safety from shopping to eating. J Food Control, 19: 737-745. [21]. Khor, G.L., Nasir, M.T., Kandiah, M., Hashim, N., Hashim, J.K., Nor, S., Dor, R (1998). Appraising the current food and nutrition situation with policy implication. Mal. J. Nutr 4: 91-106. [22]. Lamidi, R.A (2016). Knowledge and Practices of Food safety among senior secondary school students of Ambassadors College, Ile- Ife, Nigeria. South America Journal of Public Health. Volume 4, Issue 1. Pp 1-13. [23]. Li-Cohen, A. E., & Bruhn, C. M. (2002). Safety of consumer handling of fresh product from the time of purchase to plate: A comprehensive consumer survey. Journal of Food Protection, 65(8), 1287–1296. [24]. Lynch, M., Painter, J., Woodruff, R., & Braden, C. (2006). Surveillance for food-borne disease outbreaks United States, 1998–2002. MMWR 55 (SS10), 1–34. [25]. McCarthy, M., Brennan, M., Kelly, A. L., Ritson, C., de Boer, M., & Thompson, N (2007). Who is at risk and what do they know? Segmenting a population on their food safety knowledge. Food Quality and Preference, 18(2), 205–217. [26]. Mead, P.S., Slutsker, L., Dietz, V., McCaig, C.F., Breese, J.S., et al (1999). Food related illness and death in the United States. Emerg. Infect. Dis, 5: 607- 625. [27]. McSwane, D., Rue, N., & Linton, R. (2003). Essentials of food safety and sanitation. Third Edition. Pearson Education. New Jersey. [28]. Meftahuddin, T. (2002). Review of the trends and causes of food borne outbreaks in Malaysia from 1988 to 1997. Medical Journal Malaysia, 57(1), 70-9. [29]. MOH, 2010. Health Facts 2009. Ministry of Health. http://www.moh.gov.my/images/gallery/stats/heal_fact/healthfact_L_2009.pdf [30]. MOH, 2009. Malaysia Health Facts 2008. Ministry of Health. http://www.moh.gov.my/opencmc/export/sites/default/moh/download/health_fact_2008_page_by_page.pdf [31]. Ministry of Health, Malaysia. (2007). Incidence rate and mortality rate of communicable disease per 100,000 population in 2006. Retrieved from http://www.moh.gov. [32]. Mohd, R.O., Zuraini, M.I., Khamis, M.O (2009). Food safety attitude of culinary arts based students in public and private higher learning institutions (IPT). J. Int. Educ. Stud. 2: 168-178. [33]. Musa O.I & Akande, T. M. (2003). Food safety and food vendor. The Nigerian Postgraduate Medical Journal, Vol. 10, No. 3, September, 2003 [34]. Naing, N. N., Zain, M. M., Hamzah, W. M., Mat, H.A., Abdullah, N. & Bakar, A. M. H. (2007). A study on effective of health education program on knowledge, attitude and practice (KAP) of food handlers towards food-borne disease and food safety. International Medical Journal Tokyo, 14(4), 253-260. [35]. Norazmir, M.N., Hasyimah M.A., Shafurah, B.S., Sabariah, B.S., Norazlanshah, H (2012). Knowledge and Practices on Food Safety among Secondary School Students in Johor Bahru, Johor, Malaysia. Pakistan Journal of Nutrition 11 (2): 110-115. [36]. Osaili, T.M., Obeidat, B.A., Abu Jamous, D.O., Bawadi, H.A (2011). Food safety knowledge and
177

Texila International Journal of Public Health Volume 5, Issue 1, Mar 2017
practices among college female students in north of Jordan. Food Control, 22 (2011): 269-276 [37]. Prabhakar, S. V. R. K., Sano, D., & Srivastava, N. (2010). Food safety in the Asia-Pacific region: Current status, policy perspectives and a way forward. In Sustainable consumption and production in the Asia-Pacific Region: Effective responses in a resource constrained world, institute for global environmental strategies, white paper III (pp. 215-238). Hayama, Japan: Institute for Global Environmental Strategies. [38]. Quick, V., Byrd-Bredbenner, C., Corda, K.W, (2013) "Determinants of safe food handling behaviors among middle school youth", Nutrition & Food Science, Vol. 43. Issue 6, Pp.543 – 553. [39]. Redmond, E. C., & Griffith, C. J. (2003). Consumer food handling in the home: A review of food safety studies. Journal of Food Protection, 66(1), 130–161. [40]. Rimal, X., Fletcher, S. M., McWatters, K. H., Misra, S. K., & Deodhar, S. (2001). Perception of food safety and changes in food consumption habits: A consumer analysis. International Journal of Consumer Studies, 25(1), 43–52. [41]. Sanlier, N (2009). The knowledge and practice of food safety by young and adult consumers. Food Control, 20(6), 538e542. [42]. Sanlier, N (2010). Food safety knowledge and the safe food handling behaviours of female and male consumers. J. Med. Sci. 653-658. [43]. Sharif, L. & Al-Malki, T. (2010). Knowledge, attitude and practice of taif university students on food poisoning. Food Control, 21, 55-60. [44]. Turnbull-Fortune, S. and Badrie, N. (2014) Practice, Behavior, Knowledge and Awareness of Food Safety among Secondary & Tertiary Level Students in Trinidad, West Indies. Food and Nutrition Sciences, 5, 1463-1481. [45]. Unusan, N. (2007). Consumer food safety knowledge and practices in the home in Turkey. Food Control, 18(1), 45–51. [46]. Vladimirov, Z. (2011). Implementation of food safety management system in Bulgaria. British Food Journal, 113(1), 50- 65. [47]. Webb, M & Morancie, A (2015). Food safety knowledge of food service workers at a university campus by education level, experience, and food safety training. Food Control, 50 (2015) 259-264. [48]. World Health Organization (2009). Retrieve from http://www.who.int/features/factfiles/food_safety/en/ [49]. World Health Organization, (2008). Malaysia health situation and trend. Retrieved from www.wpro.who.int/countries/2008/maa/health_situation.htm. [50]. World Health Organization. (2007). Food safety and foodborne illness. Retrieved from: http://www.who.int/mediacentre/factsheets/fs237/en/print.htm [51]. WHO. (1989). Health surveillance and management procedures for food handling personnel. WHO Technical Report Series, 785, Geneva, 52 p. [52]. Zain, M. M., & Naing, N. N., (2002). Socio-demographic characteristics of food handlers and their knowledge, attitude and practice towards food sanitation, Southeast Asian Med Public Health. 33(2).
178
