international journal of - biology
TRANSCRIPT
VOLUME 13 NUMBER 1 2020 ISSN 2218-7979eISSN 2409-370X
International Journal of
Biology
and Chemistry
Al-Farabi Kazakh National University

International Journal of Biology and Chemistry is published twice a year by al-Farabi Kazakh National University, al-Farabi ave., 71, 050040, Almaty, Republic of Kazakhstanwebsite: http://ijbch.kaznu.kz/
Any inquiry for subscriptions should be sent to:Prof. Mukhambetkali Burkitbayev, al-Farabi Kazakh National Universityal-Farabi ave., 71, 050040, Almaty, Republic of Kazakhstane-mail: Mukhambetkali [email protected]
© 2020 al-Farabi Kazakh National University Int. j. biol. chem. (Online)
EDITORIAL
The most significant achievements in the field of natural sciences are reached in joint collaboration, where important roles are taken by biology and chemistry. Therefore publi-cation of a Journal, displaying results of current studies in the field of biology and chemis-try, facilitates highlighting of theoretical and practical issues and distribution of scientific discoveries.
One of the basic goals of the Journal is to promote the extensive exchange of informa-tion between the scientists from all over the world. We welcome publishing original papers and materials of biological and chemical conferences, held in different countries (by prior agreement, after the process of their subsequent selection).
Creation of special International Journal of Biology and Chemistry is of great impor-tance, since scientists worldwide, including other continents, might publish their articles, which will help to widen the geography of future collaboration.
The Journal aims to publish the results of the experimental and theoretical studies in the field of biology, biotechnology, chemistry and chemical technology. Among the em-phasized subjects are: modern issues of technologies for organic synthesis; scientific basis of the production of physiologically active preparations; modern issues of technologies for processing of raw materials; production of new materials and technologies; study on chemi-cal and physical properties and structure of oil and coal; theoretical and practical issues in processing of hydrocarbons; modern achievements in the field of nanotechnology; results of studies in various branches of biology, biotechnology, genetics, nanotechnology, etc.
We hope to receive papers from the leading scientific centers, which are involved in the application of the scientific principles of biological and chemical sciences on practice and carrying out research on the subject, related to production of new materials, technologies and ecological issues.
© 2020 al-Farabi Kazakh National University Int. j. biol. chem. (Online)
International Journal of Biology and Chemistry 13, № 1, 4 (2020)
IRSTI 31.25.01; 31.27.03 https://doi.org/10.26577/ijbch.2020.v13.i1.01
G.A. Mun1* , I. Moldakhan2 , A.M. Serikbay1 ,
D. Kaldybekov1 , I.E. Suleimenov3 , Kinam Park4
1Аl-Farabi Kazakh National University, Almaty, Kazakhstan 2Almaty University of Power Engineering and Telecommunications, Almaty, Kazakhstan
3Institute of Information and Computational Technologies, Almaty, Kazakhstan 4Purdue University, West Lafayette, USA
*e-mail: [email protected]
Hydrophilic interpolymer associates – the key to solving the problem of pre-biological evolution
Abstract. A new approach to the analysis of the processes that led to the appearance of Life on Earth was proposed. The approach is based on the idea of the evolution of the Earth’s shells as a system whole, which corresponds to the interpretation of the concept of “complex system” based on the analogy with neural networks. This analogy allows us to show that there are evolutionary mechanisms for which the primary one is the evolution of an analog of a neural network that is complementary to a specific complex system. The transformation of the system in this case takes place at the level of restructuring its structure, which at the next stage of evolution creates prerequisites for the “selection” of elements that correspond to the new state of the system as a whole. Experimental evidence of the validity of this approach for the interpretation of the origin of Life has been obtained based on the analysis of the formation of a comparative new class of macromolecular systems – hydrophilic interpolymer associates. It was shown that a solution of two interacting polymers, in which hydrophilic interpolymer associates are formed, is a direct analog of a neural network in a defined range of conditions. This object is capable of evolving as a whole, which proves the possibility of implementing an alternative mechanism of evolution considered in the framework of Darwinian theories.Key words: complex system, polymers, interpolymer complexes, hydrophilic interpolymer associates, origin of life, neural network analog, evolution.
Introduction
Currently, active research is continuing to un-cover the mystery of the origin of Life on our planet [1-3]. The authors of the vast majority of works car-ried out in this direction, either way, are guided by an approach that dating back to the theory of the origin of Darwinian’s species [1-3].
However, there is every reason to believe that at-tempts to interpret the mechanisms of evolution that precede biological evolution, based on theories that go back to Darwin’s point of view, cannot lead to success. This follows, among other things, from phil-osophical (methodological) judgments [4, 5]. Dar-winian theories have faced and will continue to face insurmountable difficulties in trying to establish the
mechanisms of evolution that led to the emergence of Life on Earth for fundamental reasons.
Darwin’s theory the origin of species successful-ly describes the evolution of existing biological spe-cies, but is unable to adequately answer the question of where Life came from as a system whole. The last clarification (the systemic integrity of the phenom-enon of Life) is extremely important. It is on this ba-sis that even purely philosophical methods can show that mutational mechanisms are not able to give an adequate picture of the evolution that preceded the biological one.
Namely, Life exists in the form of ecosystems, therefore mutation mechanisms cannot be consistent even from the point of view of General philosophi-cal concepts: they can explain the transformation of
5
Int. j. biol. chem. (Online) International Journal of Biology and Chemistry 13, № 1, 4 (2020)
G.A. Mun et al.
ecosystems, but they cannot explain the instantaneous emergence of an ecosystem with a rather complex and well-developed structure. Thus, the appearance of Life can only be the result of a certain qualitative leap (the emergence of a new quality), otherwise called aromor-phosis, the prerequisites for this point of view are set out in well-known review papers [6, 7].
In [4, 5] it was shown that it is possible to pro-pose a mechanism of evolution alternative to those that follow Darwinian theories. The corresponding theory is based on fundamentally new ideas about complex systems.
In the cited works, a hypothesis was put forward that a system of arbitrary nature should be interpreted as complex, when there is a complementary analog of a neural network. This means that for any complex system (a system that meets the category of complex in the philosophical sense), first of all, certain pro-cesses of information processing must be character-ized that qualitatively different from the processes of information processing, characteristic to its indi-vidual components. The system (in the philosophi-cal sense of this term) is something that qualitatively different from a simple set of its constituent elements – this idea is characteristic of the entire system ap-proach, which goes back to the works of L. von Ber-talanffy.
The proposed interpretation of the concept of “complex system” based on the analogy with neural networks, as well as the resulting philosophical un-derstanding of the category of complex, indeed allow to propose a mechanism of evolution that is funda-mentally different from Darwin’s.
Indeed, a complex system can evolve even when the characteristics of its individual elements remain unchanged. In fact, this means that in this system, it is not the elements themselves that change, but the architecture of the relationships between them. The analogy with a neural network is important in that way because the rearrangement of links between sys-tem elements can be interpreted in the language of information theory as the evolution of an analog of a neural network that is complementary to the complex system under consideration.
We emphasize that this paper uses these repre-sentations. The evolution of an analog of the neural network that is complementary to a complex system of arbitrary nature suggests that a complex system could become a system for processing information even if it is composed of extremely simple elements. It is appropriate to emphasize that the existing artifi-cial neural networks are also built from very simple elements that perform extremely simple functions,
but when combined into a single system, they allow to implement a new quality, new information pro-cessing systems.
If a complex system experiences a quantitative and qualitative transition associated with the emer-gence of a qualitatively new information processing system, then it could be converted into a filter that creates preferential conditions for the existence or appearance (reproduction) of those elements that cor-respond to its qualitatively new state.
In other words, from the proposed point of view, the primary one is not the evolution of elements that are driven by mutations, but the evolution of the sys-tem as a whole; it can cause the very qualitative leap that, in particular, could lead to the emergence of Life as a system whole, i.e. already in the form of an eco-system.
In other words, according to this point of view, Life on our planet arose due to a very specific com-plex system was able to process information in a very specific way.
The relationship between the philosophical inter-pretation of the category of information reflected in [8] and the proposed interpretation of prebiological evolution in this paper is as follows.
The simplest form of life, namely a virus, can be considered as a macromolecular object that performs a single function – the preservation of its genetic code, “its information”. The virus contains a single informational macromolecule, and all the rest per-form auxiliary functions. This example clearly shows that the origin of life can and should be interpreted purely from the position of information theory.
Further, as was shown in [9] based on the concept of dialectical positivism [8], information systems have a well-defined hierarchy.
What is called a message is an information object of the simplest type. At the next level are informa-tion systems, which are some rules for processing information. The simplest example of a more com-plex information system is a set of operating rules with binary numbers (addition, multiplication, etc.) or any other algorithm. At the highest level of the hi-erarchy of information objects is human intelligence, understood as a purely informational object (this ob-ject cannot be identified with the brain or processes occurring in it, just as you cannot identify a punched card and information written on it).
We emphasize that this work is not about identi-fying certain protocells, but about identifying the con-ditions when these protocells could have occurred. Returning to the idea of the existence of Life in the form of ecosystems, this means that the entire system
6
Int. j. biol. chem. (Online) International Journal of Biology and Chemistry 13, № 1, 4 (2020)
Hydrophilic interpolymer associates – the key to solving the problem of pre-biological evolution
as a whole is rebuilt and all the attributes of Life are created simultaneously in it. This, in particular, ex-cludes the criticism that was addressed to Darwinian theories, and which was based on the extremely low probability of spontaneous occurrence of such mol-ecules as DNA. From this point of view, this question is not worth it at all. It is not about the probabilities of random processes; it is about the evolution of the system as a whole.
Thus, to solve the problem of the origin of Life on our planet, it is necessary to show how such physi-cal and chemical systems as solutions of hydrophilic macromolecules can be transformed into informa-tion processing systems. The choice of these systems as the base object is obvious: the main information macromolecules (DNA and RNA) are hydrophilic polymers.
In the present paper, we assume that the first step in this direction already has all the prerequisites. Namely, it is shown that there are quite certain con-ditions under which a solution containing two types of hydrophilic macromolecules interacting with each other is transformed into a non-trivial information processing system.
This transformation becomes possible due to the fact that hydrophilic interpolymer associates (HIA) could be formed in systems of this type [10, 11], and their formation can be accompanied by phase tran-sitions of a stadial character. Experimental proof of the existence of staged phase transitions for the same system was given in [12] by the example of reactions between polyvinylcaprolactam (PVCL) and poly-acrylic acid (PAA).
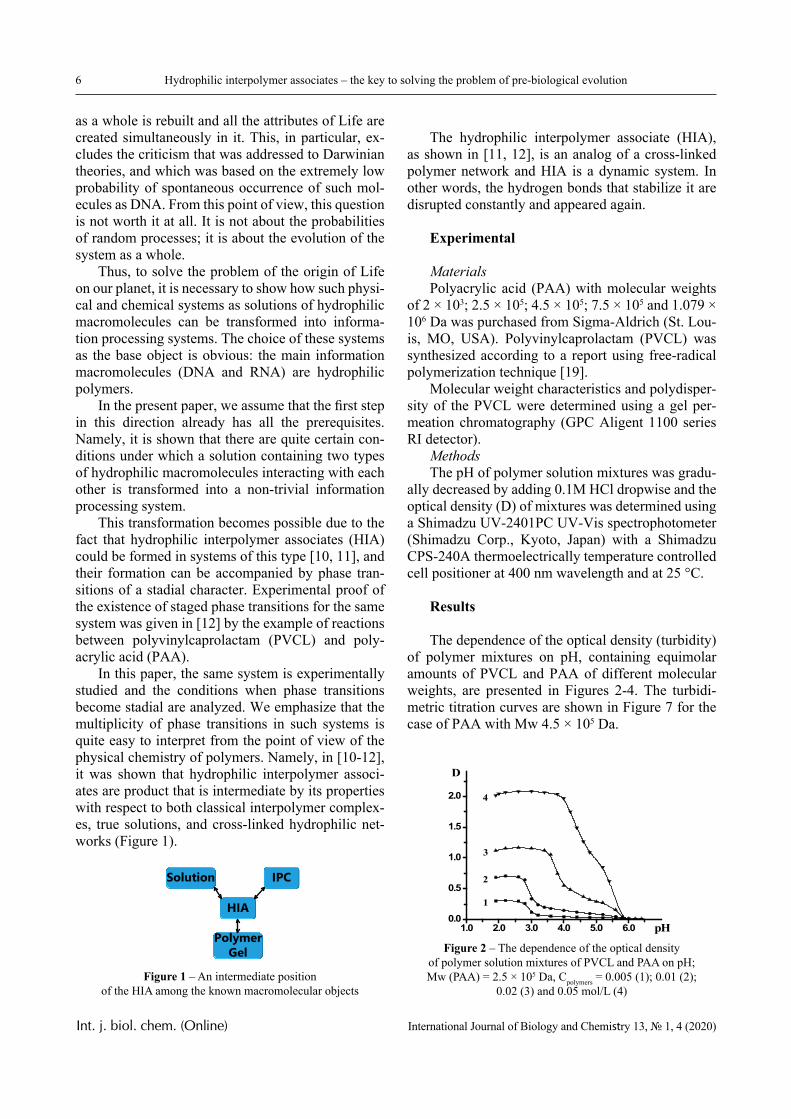
In this paper, the same system is experimentally studied and the conditions when phase transitions become stadial are analyzed. We emphasize that the multiplicity of phase transitions in such systems is quite easy to interpret from the point of view of the physical chemistry of polymers. Namely, in [10-12], it was shown that hydrophilic interpolymer associ-ates are product that is intermediate by its properties with respect to both classical interpolymer complex-es, true solutions, and cross-linked hydrophilic net-works (Figure 1).
HIA
IPC
Polymer Gel
Solution
Figure 1 – An intermediate position of the HIA among the known macromolecular objects
The hydrophilic interpolymer associate (HIA), as shown in [11, 12], is an analog of a cross-linked polymer network and HIA is a dynamic system. In other words, the hydrogen bonds that stabilize it are disrupted constantly and appeared again.
Experimental
MaterialsPolyacrylic acid (PAA) with molecular weights
of 2 × 10³; 2.5 × 10⁵; 4.5 × 10⁵; 7.5 × 10⁵ and 1.079 × 10⁶ Da was purchased from Sigma-Aldrich (St. Lou-is, MO, USA). Polyvinylcaprolactam (PVCL) was synthesized according to a report using free-radical polymerization technique [19].
Molecular weight characteristics and polydisper-sity of the PVCL were determined using a gel per-meation chromatography (GPC Aligent 1100 series RI detector).
MethodsThe pH of polymer solution mixtures was gradu-
ally decreased by adding 0.1M HCl dropwise and the optical density (D) of mixtures was determined using a Shimadzu UV-2401РС UV-Vis spectrophotometer (Shimadzu Corp., Kyoto, Japan) with a Shimadzu CPS-240A thermoelectrically temperature controlled cell positioner at 400 nm wavelength and at 25 °С.
Results
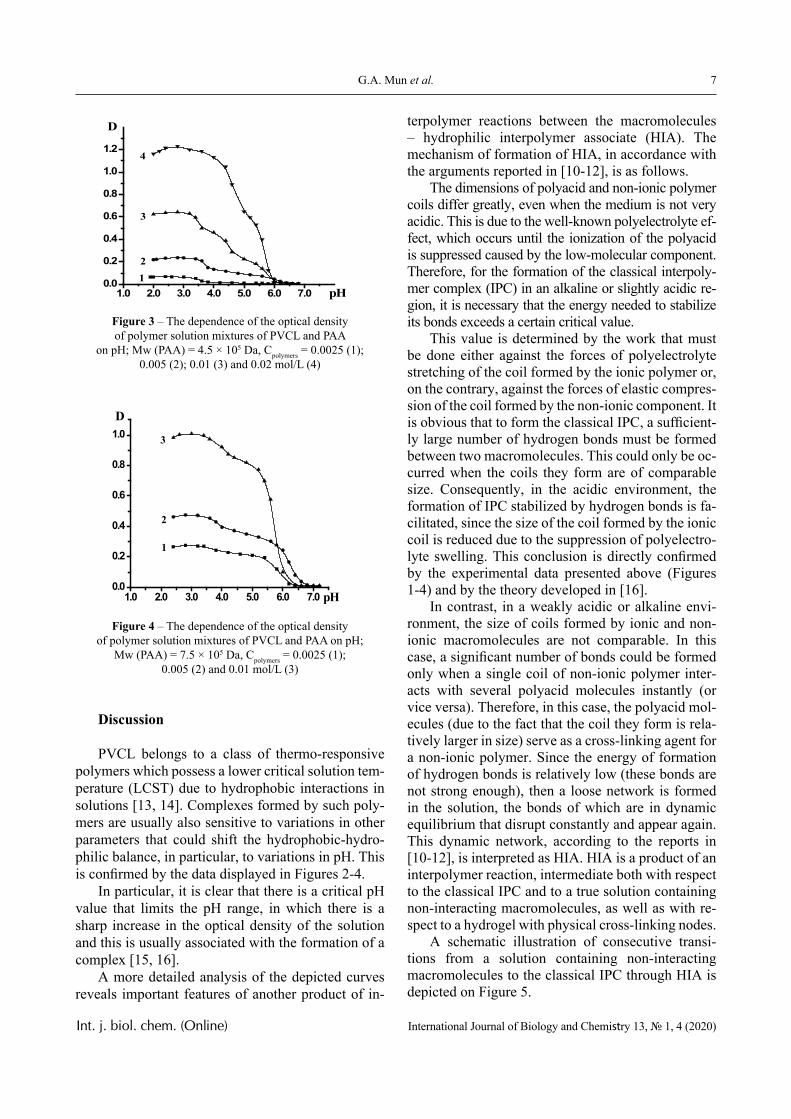
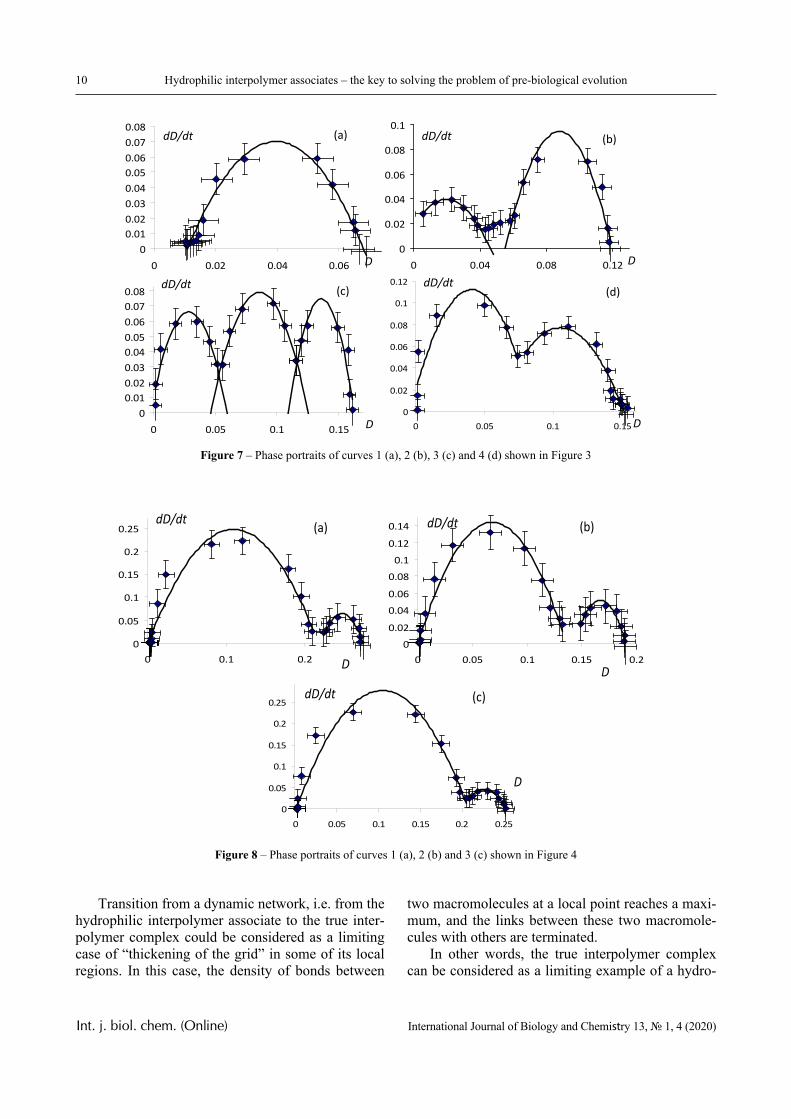
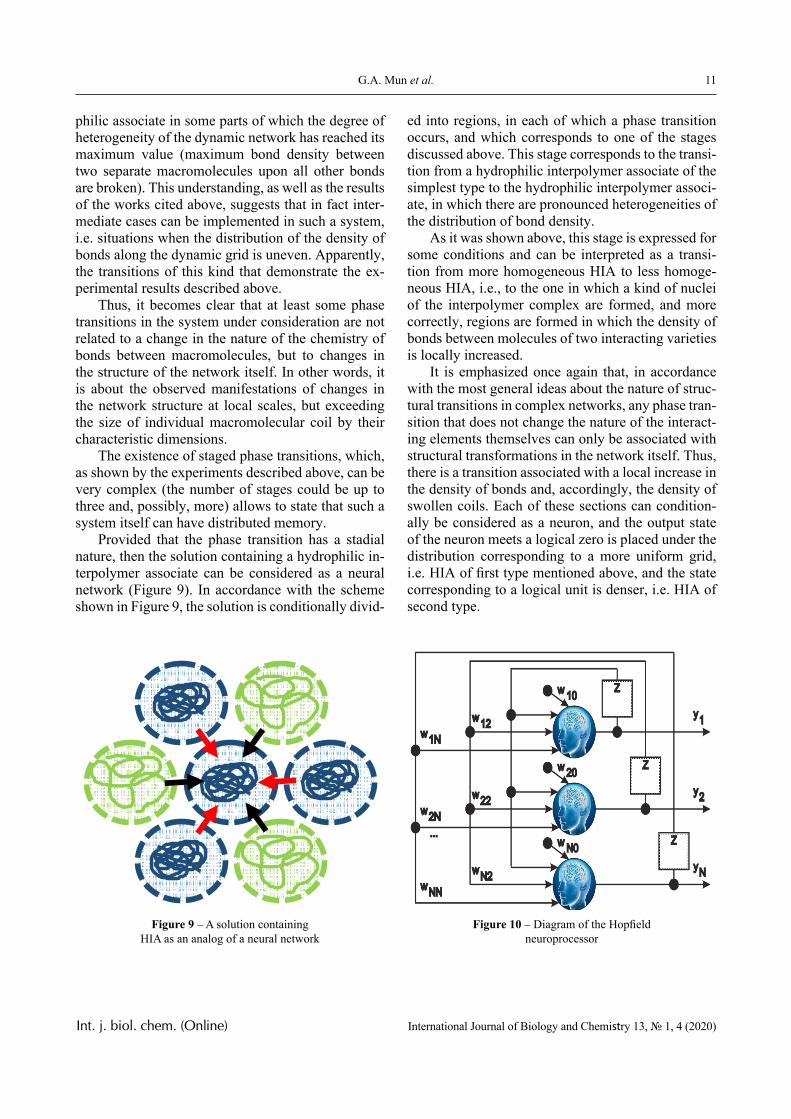
The dependence of the optical density (turbidity) of polymer mixtures on pH, containing equimolar amounts of PVCL and PAA of different molecular weights, are presented in Figures 2-4. The turbidi-metric titration curves are shown in Figure 7 for the case of PAA with Mw 4.5 × 10⁵ Da.
1.0 2.0 3.0 4.0 5.0 6.00.0
0.5
1.0
1.5
2.0 4
3
2
1
D
pH
Figure 2 – The dependence of the optical density of polymer solution mixtures of PVCL and PAA on pH; Mw (PAA) = 2.5 × 10⁵ Da, Cpolymers = 0.005 (1); 0.01 (2);
0.02 (3) and 0.05 mol/L (4)
7
Int. j. biol. chem. (Online) International Journal of Biology and Chemistry 13, № 1, 4 (2020)
G.A. Mun et al.
1.0 2.0 3.0 4.0 5.0 6.0 7.00.0
0.2
0.4
0.6
0.8
1.0
1.24
3
2
1pH
D
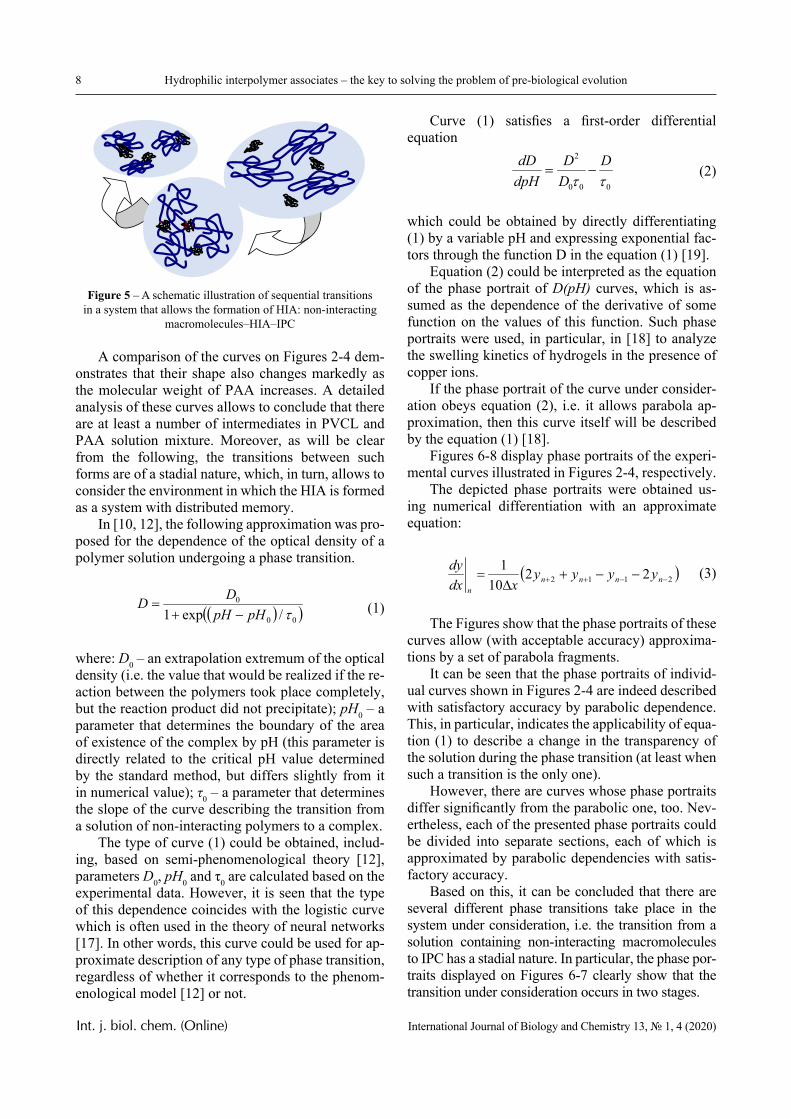
Figure 3 – The dependence of the optical density of polymer solution mixtures of PVCL and PAA
on pH; Mw (PAA) = 4.5 × 10⁵ Da, Cpolymers = 0.0025 (1); 0.005 (2); 0.01 (3) and 0.02 mol/L (4)
1.0 2.0 3.0 4.0 5.0 6.0 7.00.0
0.2
0.4
0.6
0.8
1.0 3
2
1
D
pH
Figure 4 – The dependence of the optical density of polymer solution mixtures of PVCL and PAA on pH;
Mw (PAA) = 7.5 × 10⁵ Da, Сpolymers = 0.0025 (1); 0.005 (2) and 0.01 mol/L (3)
Discussion
PVCL belongs to a class of thermo-responsive polymers which possess a lower critical solution tem-perature (LCST) due to hydrophobic interactions in solutions [13, 14]. Complexes formed by such poly-mers are usually also sensitive to variations in other parameters that could shift the hydrophobic-hydro-philic balance, in particular, to variations in pH. This is confirmed by the data displayed in Figures 2-4.
In particular, it is clear that there is a critical pH value that limits the pH range, in which there is a sharp increase in the optical density of the solution and this is usually associated with the formation of a complex [15, 16].
A more detailed analysis of the depicted curves reveals important features of another product of in-
terpolymer reactions between the macromolecules – hydrophilic interpolymer associate (HIA). The mechanism of formation of HIA, in accordance with the arguments reported in [10-12], is as follows.
The dimensions of polyacid and non-ionic polymer coils differ greatly, even when the medium is not very acidic. This is due to the well-known polyelectrolyte ef-fect, which occurs until the ionization of the polyacid is suppressed caused by the low-molecular component. Therefore, for the formation of the classical interpoly-mer complex (IPC) in an alkaline or slightly acidic re-gion, it is necessary that the energy needed to stabilize its bonds exceeds a certain critical value.
This value is determined by the work that must be done either against the forces of polyelectrolyte stretching of the coil formed by the ionic polymer or, on the contrary, against the forces of elastic compres-sion of the coil formed by the non-ionic component. It is obvious that to form the classical IPC, a sufficient-ly large number of hydrogen bonds must be formed between two macromolecules. This could only be oc-curred when the coils they form are of comparable size. Consequently, in the acidic environment, the formation of IPC stabilized by hydrogen bonds is fa-cilitated, since the size of the coil formed by the ionic coil is reduced due to the suppression of polyelectro-lyte swelling. This conclusion is directly confirmed by the experimental data presented above (Figures 1-4) and by the theory developed in [16].
In contrast, in a weakly acidic or alkaline envi-ronment, the size of coils formed by ionic and non-ionic macromolecules are not comparable. In this case, a significant number of bonds could be formed only when a single coil of non-ionic polymer inter-acts with several polyacid molecules instantly (or vice versa). Therefore, in this case, the polyacid mol-ecules (due to the fact that the coil they form is rela-tively larger in size) serve as a cross-linking agent for a non-ionic polymer. Since the energy of formation of hydrogen bonds is relatively low (these bonds are not strong enough), then a loose network is formed in the solution, the bonds of which are in dynamic equilibrium that disrupt constantly and appear again. This dynamic network, according to the reports in [10-12], is interpreted as HIA. HIA is a product of an interpolymer reaction, intermediate both with respect to the classical IPC and to a true solution containing non-interacting macromolecules, as well as with re-spect to a hydrogel with physical cross-linking nodes.
A schematic illustration of consecutive transi-tions from a solution containing non-interacting macromolecules to the classical IPC through HIA is depicted on Figure 5.
8
Int. j. biol. chem. (Online) International Journal of Biology and Chemistry 13, № 1, 4 (2020)
Hydrophilic interpolymer associates – the key to solving the problem of pre-biological evolution
Figure 5 – A schematic illustration of sequential transitions
in a system that allows the formation of HIA: non-interacting macromolecules–HIA–IPC
A comparison of the curves on Figures 2-4 dem-onstrates that their shape also changes markedly as the molecular weight of PAA increases. A detailed analysis of these curves allows to conclude that there are at least a number of intermediates in PVCL and PAA solution mixture. Moreover, as will be clear from the following, the transitions between such forms are of a stadial nature, which, in turn, allows to consider the environment in which the HIA is formed as a system with distributed memory.
In [10, 12], the following approximation was pro-posed for the dependence of the optical density of a polymer solution undergoing a phase transition.
00
0
/exp1 pHpHDD
(1)
where: D0 – an extrapolation extremum of the optical density (i.e. the value that would be realized if the re-action between the polymers took place completely, but the reaction product did not precipitate); pH0 – a parameter that determines the boundary of the area of existence of the complex by pH (this parameter is directly related to the critical pH value determined by the standard method, but differs slightly from it in numerical value); τ0 – a parameter that determines the slope of the curve describing the transition from a solution of non-interacting polymers to a complex.
The type of curve (1) could be obtained, includ-ing, based on semi-phenomenological theory [12], parameters D0, pH0 and τ0 are calculated based on the experimental data. However, it is seen that the type of this dependence coincides with the logistic curve which is often used in the theory of neural networks [17]. In other words, this curve could be used for ap-proximate description of any type of phase transition, regardless of whether it corresponds to the phenom-enological model [12] or not.
Curve (1) satisfies a first-order differential equation
000
2
D
DD
dpHdD
(2)
which could be obtained by directly differentiating (1) by a variable pH and expressing exponential fac-tors through the function D in the equation (1) [19].
Equation (2) could be interpreted as the equation of the phase portrait of D(pH) curves, which is as-sumed as the dependence of the derivative of some function on the values of this function. Such phase portraits were used, in particular, in [18] to analyze the swelling kinetics of hydrogels in the presence of copper ions.
If the phase portrait of the curve under consider-ation obeys equation (2), i.e. it allows parabola ap-proximation, then this curve itself will be described by the equation (1) [18].
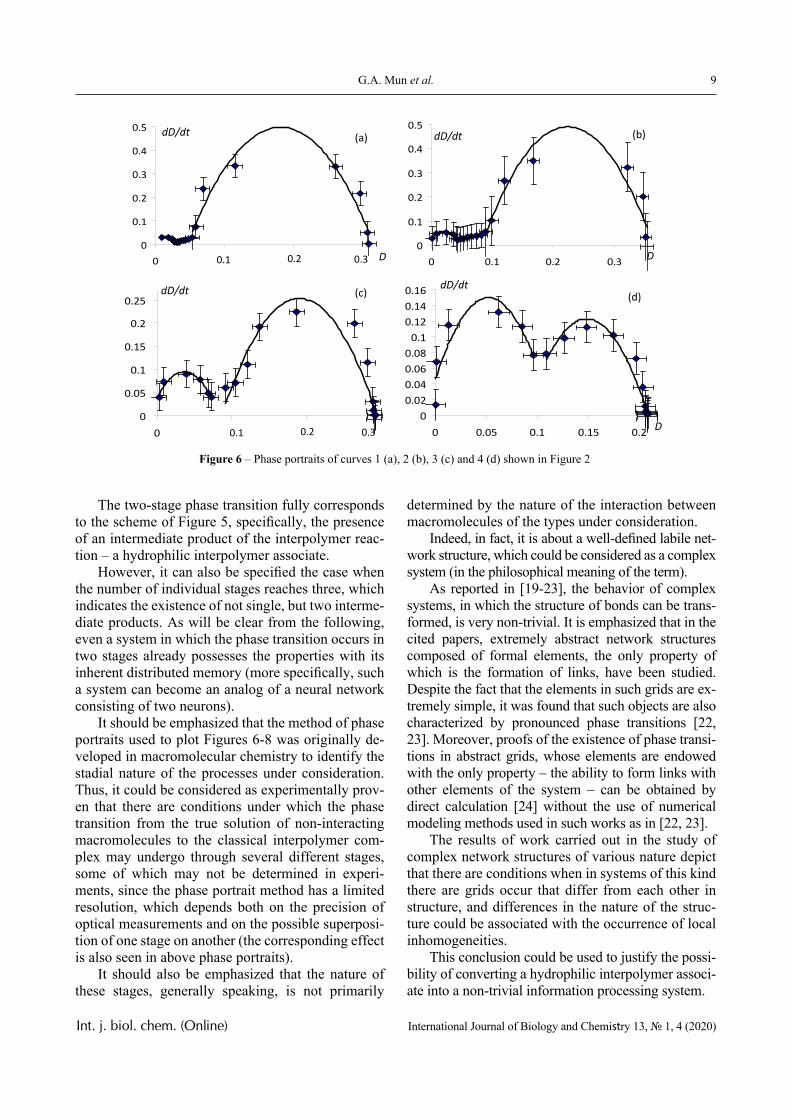
Figures 6-8 display phase portraits of the experi-mental curves illustrated in Figures 2-4, respectively.
The depicted phase portraits were obtained us-ing numerical differentiation with an approximate equation:
2112 2210
1
nnnn
n
yyyyxdx
dy
(3)
The Figures show that the phase portraits of these curves allow (with acceptable accuracy) approxima-tions by a set of parabola fragments.
It can be seen that the phase portraits of individ-ual curves shown in Figures 2-4 are indeed described with satisfactory accuracy by parabolic dependence. This, in particular, indicates the applicability of equa-tion (1) to describe a change in the transparency of the solution during the phase transition (at least when such a transition is the only one).
However, there are curves whose phase portraits differ significantly from the parabolic one, too. Nev-ertheless, each of the presented phase portraits could be divided into separate sections, each of which is approximated by parabolic dependencies with satis-factory accuracy.
Based on this, it can be concluded that there are several different phase transitions take place in the system under consideration, i.e. the transition from a solution containing non-interacting macromolecules to IPC has a stadial nature. In particular, the phase por-traits displayed on Figures 6-7 clearly show that the transition under consideration occurs in two stages.
9
Int. j. biol. chem. (Online) International Journal of Biology and Chemistry 13, № 1, 4 (2020)
G.A. Mun et al.
Figure 6 – Phase portraits of curves 1 (a), 2 (b), 3 (c) and 4 (d) shown in Figure 2
The two-stage phase transition fully corresponds to the scheme of Figure 5, specifically, the presence of an intermediate product of the interpolymer reac-tion – a hydrophilic interpolymer associate.
However, it can also be specified the case when the number of individual stages reaches three, which indicates the existence of not single, but two interme-diate products. As will be clear from the following, even a system in which the phase transition occurs in two stages already possesses the properties with its inherent distributed memory (more specifically, such a system can become an analog of a neural network consisting of two neurons).
It should be emphasized that the method of phase portraits used to plot Figures 6-8 was originally de-veloped in macromolecular chemistry to identify the stadial nature of the processes under consideration. Thus, it could be considered as experimentally prov-en that there are conditions under which the phase transition from the true solution of non-interacting macromolecules to the classical interpolymer com-plex may undergo through several different stages, some of which may not be determined in experi-ments, since the phase portrait method has a limited resolution, which depends both on the precision of optical measurements and on the possible superposi-tion of one stage on another (the corresponding effect is also seen in above phase portraits).
It should also be emphasized that the nature of these stages, generally speaking, is not primarily
determined by the nature of the interaction between macromolecules of the types under consideration.
Indeed, in fact, it is about a well-defined labile net-work structure, which could be considered as a complex system (in the philosophical meaning of the term).
As reported in [19-23], the behavior of complex systems, in which the structure of bonds can be trans-formed, is very non-trivial. It is emphasized that in the cited papers, extremely abstract network structures composed of formal elements, the only property of which is the formation of links, have been studied. Despite the fact that the elements in such grids are ex-tremely simple, it was found that such objects are also characterized by pronounced phase transitions [22, 23]. Moreover, proofs of the existence of phase transi-tions in abstract grids, whose elements are endowed with the only property – the ability to form links with other elements of the system – can be obtained by direct calculation [24] without the use of numerical modeling methods used in such works as in [22, 23].
The results of work carried out in the study of complex network structures of various nature depict that there are conditions when in systems of this kind there are grids occur that differ from each other in structure, and differences in the nature of the struc-ture could be associated with the occurrence of local inhomogeneities.
This conclusion could be used to justify the possi-bility of converting a hydrophilic interpolymer associ-ate into a non-trivial information processing system.
0
0.1
0.2
0.3
0.4
0.5
0 0.1 0.2 0.30
0.1
0.2
0.3
0.4
0.5
0
00.020.040.060.080.1
0.120.140.16
0 0.05 0.1 0.15 0.20
0.05
0.1
0.15
0.2
0.25
0
dD/dt
dD/dt
dD/dt
dD/dt
D D
D
(a)
(c)
(b)
(d)
0.1 0.2 0.3
0.1 0.2 0.3
10
Int. j. biol. chem. (Online) International Journal of Biology and Chemistry 13, № 1, 4 (2020)
Hydrophilic interpolymer associates – the key to solving the problem of pre-biological evolution
Figure 8 – Phase portraits of curves 1 (a), 2 (b) and 3 (c) shown in Figure 4
Figure 7 – Phase portraits of curves 1 (a), 2 (b), 3 (c) and 4 (d) shown in Figure 3
Transition from a dynamic network, i.e. from the hydrophilic interpolymer associate to the true inter-polymer complex could be considered as a limiting case of “thickening of the grid” in some of its local regions. In this case, the density of bonds between
two macromolecules at a local point reaches a maxi-mum, and the links between these two macromole-cules with others are terminated.
In other words, the true interpolymer complex can be considered as a limiting example of a hydro-
0
0.02
0.04
0.06
0.08
0.1
0.12
0 0.05 0.1 0.150
0.010.020.030.040.050.060.070.08
0 0.05 0.1 0.15
0
0.02
0.04
0.06
0.08
0.1
0 0.04 0.08 0.120
0.010.020.030.040.050.060.070.08
0 0.02 0.04 0.06
dD/dt dD/dt
dD/dt dD/dt
D D
DD
(a) (b)
(c) (d)
0
0.05
0.1
0.15
0.2
0.25
0 0.05 0.1 0.15 0.2 0.25
00.02
0.040.06
0.080.1
0.12
0.14
0 0.05 0.1 0.15 0.20.10
0.05
0.1
0.15
0.2
0.25
0 0.2
dD/dt dD/dt
dD/dt D D
D
(a) (b)
(c)
11
Int. j. biol. chem. (Online) International Journal of Biology and Chemistry 13, № 1, 4 (2020)
G.A. Mun et al.
philic associate in some parts of which the degree of heterogeneity of the dynamic network has reached its maximum value (maximum bond density between two separate macromolecules upon all other bonds are broken). This understanding, as well as the results of the works cited above, suggests that in fact inter-mediate cases can be implemented in such a system, i.e. situations when the distribution of the density of bonds along the dynamic grid is uneven. Apparently, the transitions of this kind that demonstrate the ex-perimental results described above.
Thus, it becomes clear that at least some phase transitions in the system under consideration are not related to a change in the nature of the chemistry of bonds between macromolecules, but to changes in the structure of the network itself. In other words, it is about the observed manifestations of changes in the network structure at local scales, but exceeding the size of individual macromolecular coil by their characteristic dimensions.
The existence of staged phase transitions, which, as shown by the experiments described above, can be very complex (the number of stages could be up to three and, possibly, more) allows to state that such a system itself can have distributed memory.
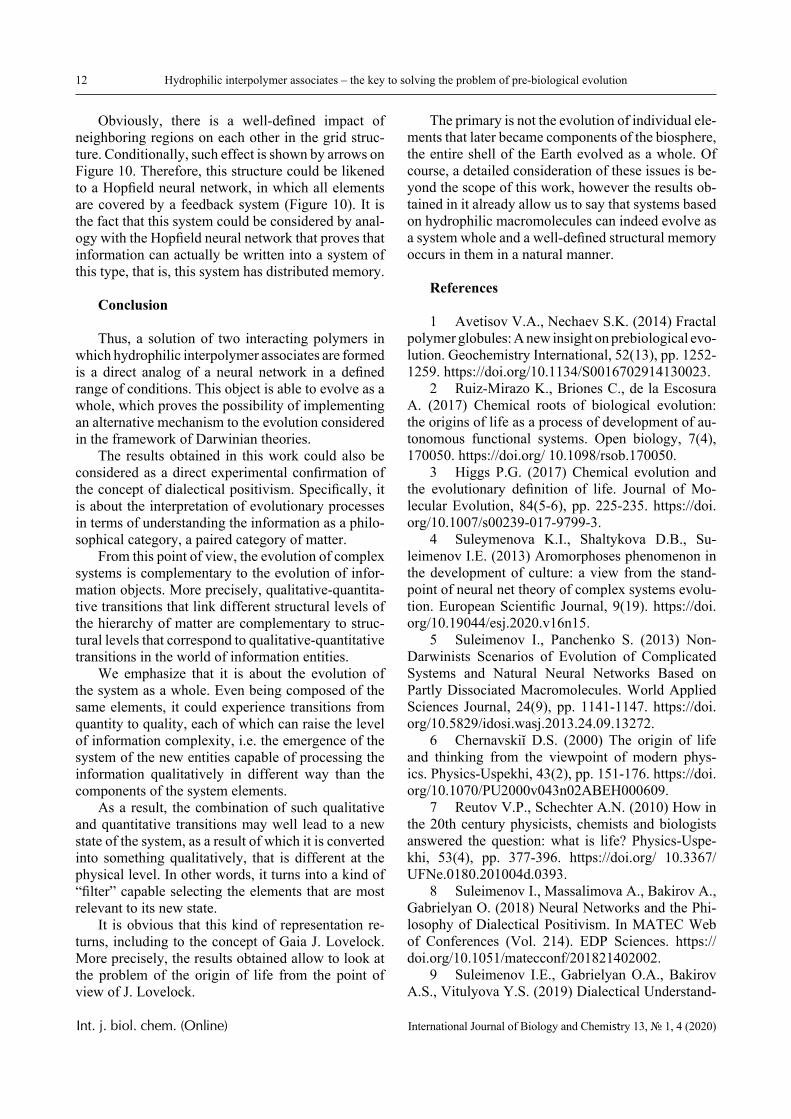
Provided that the phase transition has a stadial nature, then the solution containing a hydrophilic in-terpolymer associate can be considered as a neural network (Figure 9). In accordance with the scheme shown in Figure 9, the solution is conditionally divid-
ed into regions, in each of which a phase transition occurs, and which corresponds to one of the stages discussed above. This stage corresponds to the transi-tion from a hydrophilic interpolymer associate of the simplest type to the hydrophilic interpolymer associ-ate, in which there are pronounced heterogeneities of the distribution of bond density.
As it was shown above, this stage is expressed for some conditions and can be interpreted as a transi-tion from more homogeneous HIA to less homoge-neous HIA, i.e., to the one in which a kind of nuclei of the interpolymer complex are formed, and more correctly, regions are formed in which the density of bonds between molecules of two interacting varieties is locally increased.
It is emphasized once again that, in accordance with the most general ideas about the nature of struc-tural transitions in complex networks, any phase tran-sition that does not change the nature of the interact-ing elements themselves can only be associated with structural transformations in the network itself. Thus, there is a transition associated with a local increase in the density of bonds and, accordingly, the density of swollen coils. Each of these sections can condition-ally be considered as a neuron, and the output state of the neuron meets a logical zero is placed under the distribution corresponding to a more uniform grid, i.e. HIA of first type mentioned above, and the state corresponding to a logical unit is denser, i.e. HIA of second type.
Figure 9 – A solution containing HIA as an analog of a neural network
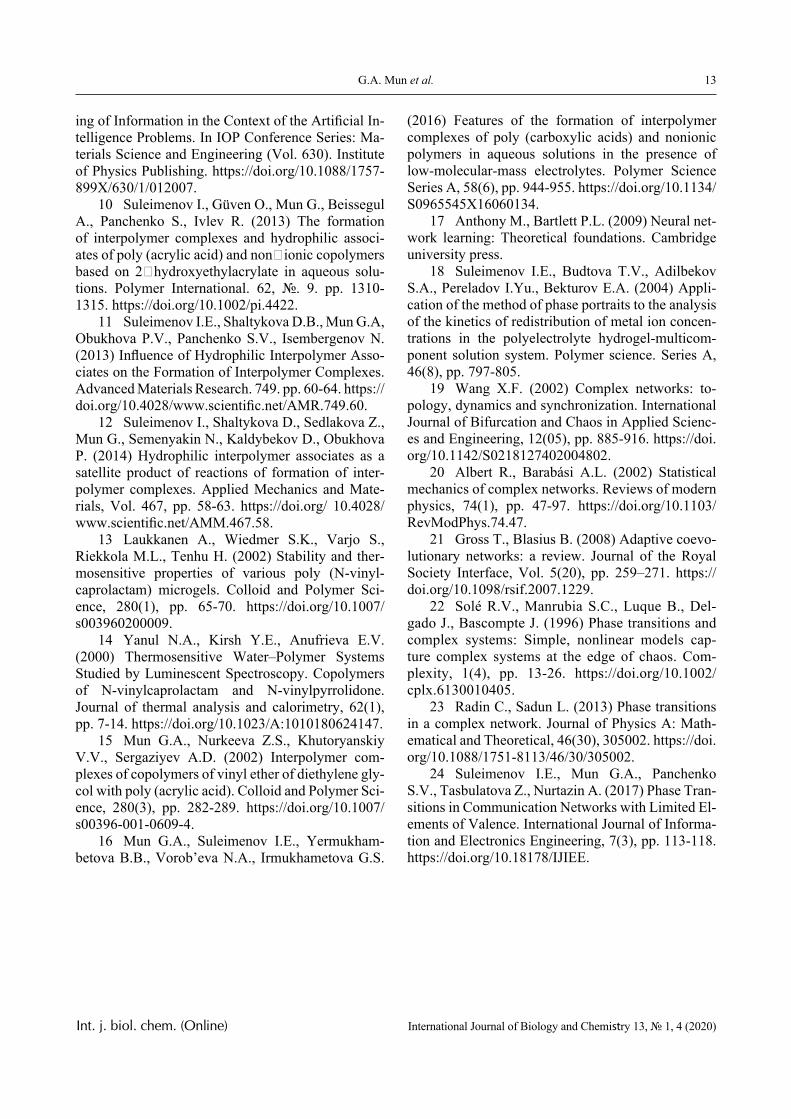
Figure 10 – Diagram of the Hopfield neuroprocessor
12
Int. j. biol. chem. (Online) International Journal of Biology and Chemistry 13, № 1, 4 (2020)
Hydrophilic interpolymer associates – the key to solving the problem of pre-biological evolution
Obviously, there is a well-defined impact of neighboring regions on each other in the grid struc-ture. Conditionally, such effect is shown by arrows on Figure 10. Therefore, this structure could be likened to a Hopfield neural network, in which all elements are covered by a feedback system (Figure 10). It is the fact that this system could be considered by anal-ogy with the Hopfield neural network that proves that information can actually be written into a system of this type, that is, this system has distributed memory.
Conclusion
Thus, a solution of two interacting polymers in which hydrophilic interpolymer associates are formed is a direct analog of a neural network in a defined range of conditions. This object is able to evolve as a whole, which proves the possibility of implementing an alternative mechanism to the evolution considered in the framework of Darwinian theories.
The results obtained in this work could also be considered as a direct experimental confirmation of the concept of dialectical positivism. Specifically, it is about the interpretation of evolutionary processes in terms of understanding the information as a philo-sophical category, a paired category of matter.
From this point of view, the evolution of complex systems is complementary to the evolution of infor-mation objects. More precisely, qualitative-quantita-tive transitions that link different structural levels of the hierarchy of matter are complementary to struc-tural levels that correspond to qualitative-quantitative transitions in the world of information entities.
We emphasize that it is about the evolution of the system as a whole. Even being composed of the same elements, it could experience transitions from quantity to quality, each of which can raise the level of information complexity, i.e. the emergence of the system of the new entities capable of processing the information qualitatively in different way than the components of the system elements.
As a result, the combination of such qualitative and quantitative transitions may well lead to a new state of the system, as a result of which it is converted into something qualitatively, that is different at the physical level. In other words, it turns into a kind of “filter” capable selecting the elements that are most relevant to its new state.
It is obvious that this kind of representation re-turns, including to the concept of Gaia J. Lovelock. More precisely, the results obtained allow to look at the problem of the origin of life from the point of view of J. Lovelock.
The primary is not the evolution of individual ele-ments that later became components of the biosphere, the entire shell of the Earth evolved as a whole. Of course, a detailed consideration of these issues is be-yond the scope of this work, however the results ob-tained in it already allow us to say that systems based on hydrophilic macromolecules can indeed evolve as a system whole and a well-defined structural memory occurs in them in a natural manner.
References
1 Avetisov V.A., Nechaev S.K. (2014) Fractal polymer globules: A new insight on prebiological evo-lution. Geochemistry International, 52(13), pp. 1252-1259. https://doi.org/10.1134/S0016702914130023.
2 Ruiz-Mirazo K., Briones C., de la Escosura A. (2017) Chemical roots of biological evolution: the origins of life as a process of development of au-tonomous functional systems. Open biology, 7(4), 170050. https://doi.org/ 10.1098/rsob.170050.
3 Higgs P.G. (2017) Chemical evolution and the evolutionary definition of life. Journal of Mo-lecular Evolution, 84(5-6), pp. 225-235. https://doi.org/10.1007/s00239-017-9799-3.
4 Suleymenova K.I., Shaltykova D.B., Su-leimenov I.E. (2013) Aromorphoses phenomenon in the development of culture: a view from the stand-point of neural net theory of complex systems evolu-tion. European Scientific Journal, 9(19). https://doi.org/10.19044/esj.2020.v16n15.
5 Suleimenov I., Panchenko S. (2013) Non-Darwinists Scenarios of Evolution of Complicated Systems and Natural Neural Networks Based on Partly Dissociated Macromolecules. World Applied Sciences Journal, 24(9), pp. 1141-1147. https://doi.org/10.5829/idosi.wasj.2013.24.09.13272.
6 Chernavskiĭ D.S. (2000) The origin of life and thinking from the viewpoint of modern phys-ics. Physics-Uspekhi, 43(2), pp. 151-176. https://doi.org/10.1070/PU2000v043n02ABEH000609.
7 Reutov V.P., Schechter A.N. (2010) How in the 20th century physicists, chemists and biologists answered the question: what is life? Physics-Uspe-khi, 53(4), pp. 377-396. https://doi.org/ 10.3367/UFNe.0180.201004d.0393.
8 Suleimenov I., Massalimova A., Bakirov A., Gabrielyan O. (2018) Neural Networks and the Phi-losophy of Dialectical Positivism. In MATEC Web of Conferences (Vol. 214). EDP Sciences. https://doi.org/10.1051/matecconf/201821402002.
9 Suleimenov I.E., Gabrielyan O.A., Bakirov A.S., Vitulyova Y.S. (2019) Dialectical Understand-
13
Int. j. biol. chem. (Online) International Journal of Biology and Chemistry 13, № 1, 4 (2020)
G.A. Mun et al.
ing of Information in the Context of the Artificial In-telligence Problems. In IOP Conference Series: Ma-terials Science and Engineering (Vol. 630). Institute of Physics Publishing. https://doi.org/10.1088/1757-899X/630/1/012007.
10 Suleimenov I., Güven O., Mun G., Beissegul A., Panchenko S., Ivlev R. (2013) The formation of interpolymer complexes and hydrophilic associ-ates of poly (acrylic acid) and non‐ionic copolymers based on 2‐hydroxyethylacrylate in aqueous solu-tions. Polymer International. 62, №. 9. pp. 1310-1315. https://doi.org/10.1002/pi.4422.
11 Suleimenov I.E., Shaltykova D.B., Mun G.A, Obukhova P.V., Panchenko S.V., Isembergenov N. (2013) Influence of Hydrophilic Interpolymer Asso-ciates on the Formation of Interpolymer Complexes. Advanced Materials Research. 749. pp. 60-64. https://doi.org/10.4028/www.scientific.net/AMR.749.60.
12 Suleimenov I., Shaltykova D., Sedlakova Z., Mun G., Semenyakin N., Kaldybekov D., Obukhova P. (2014) Hydrophilic interpolymer associates as a satellite product of reactions of formation of inter-polymer complexes. Applied Mechanics and Mate-rials, Vol. 467, pp. 58-63. https://doi.org/ 10.4028/www.scientific.net/AMM.467.58.
13 Laukkanen A., Wiedmer S.K., Varjo S., Riekkola M.L., Tenhu H. (2002) Stability and ther-mosensitive properties of various poly (N-vinyl-caprolactam) microgels. Colloid and Polymer Sci-ence, 280(1), pp. 65-70. https://doi.org/10.1007/s003960200009.
14 Yanul N.A., Kirsh Y.E., Anufrieva E.V. (2000) Thermosensitive Water–Polymer Systems Studied by Luminescent Spectroscopy. Copolymers of N-vinylcaprolactam and N-vinylpyrrolidone. Journal of thermal analysis and calorimetry, 62(1), pp. 7-14. https://doi.org/10.1023/A:1010180624147.
15 Mun G.A., Nurkeeva Z.S., Khutoryanskiy V.V., Sergaziyev A.D. (2002) Interpolymer com-plexes of copolymers of vinyl ether of diethylene gly-col with poly (acrylic acid). Colloid and Polymer Sci-ence, 280(3), pp. 282-289. https://doi.org/10.1007/s00396-001-0609-4.
16 Mun G.A., Suleimenov I.E., Yermukham-betova B.B., Vorob’eva N.A., Irmukhametova G.S.
(2016) Features of the formation of interpolymer complexes of poly (carboxylic acids) and nonionic polymers in aqueous solutions in the presence of low-molecular-mass electrolytes. Polymer Science Series A, 58(6), pp. 944-955. https://doi.org/10.1134/S0965545X16060134.
17 Anthony M., Bartlett P.L. (2009) Neural net-work learning: Theoretical foundations. Cambridge university press.
18 Suleimenov I.E., Budtova T.V., Adilbekov S.A., Pereladov I.Yu., Bekturov E.A. (2004) Appli-cation of the method of phase portraits to the analysis of the kinetics of redistribution of metal ion concen-trations in the polyelectrolyte hydrogel-multicom-ponent solution system. Polymer science. Series A, 46(8), pp. 797-805.
19 Wang X.F. (2002) Complex networks: to-pology, dynamics and synchronization. International Journal of Bifurcation and Chaos in Applied Scienc-es and Engineering, 12(05), pp. 885-916. https://doi.org/10.1142/S0218127402004802.
20 Albert R., Barabási A.L. (2002) Statistical mechanics of complex networks. Reviews of modern physics, 74(1), pp. 47-97. https://doi.org/10.1103/RevModPhys.74.47.
21 Gross T., Blasius B. (2008) Adaptive coevo-lutionary networks: a review. Journal of the Royal Society Interface, Vol. 5(20), pp. 259–271. https://doi.org/10.1098/rsif.2007.1229.
22 Solé R.V., Manrubia S.C., Luque B., Del-gado J., Bascompte J. (1996) Phase transitions and complex systems: Simple, nonlinear models cap-ture complex systems at the edge of chaos. Com-plexity, 1(4), pp. 13-26. https://doi.org/10.1002/cplx.6130010405.
23 Radin C., Sadun L. (2013) Phase transitions in a complex network. Journal of Physics A: Math-ematical and Theoretical, 46(30), 305002. https://doi.org/10.1088/1751-8113/46/30/305002.
24 Suleimenov I.E., Mun G.A., Panchenko S.V., Tasbulatova Z., Nurtazin A. (2017) Phase Tran-sitions in Communication Networks with Limited El-ements of Valence. International Journal of Informa-tion and Electronics Engineering, 7(3), pp. 113-118. https://doi.org/10.18178/IJIEE.
© 2020 al-Farabi Kazakh National University Int. j. biol. chem. (Online)
International Journal of Biology and Chemistry 13, № 1, 14 (2020)
IRSTI 34.27.15 https://doi.org/10.26577/ijbch.2020.v13.i1.02
H. Balouch1* , Z. Demirbag2 , B.K. Zayadan1 ,
A.K. Sadvakasaova1 , K. Bolatkhan1 , D. Gencer2 , D. Civelek2 1Al-Farabi Kazakh National University, Almaty, Kazakhstan
2Karadeniz Technical University, Trabzon, Turkey *e-mail: [email protected]
Isolation, identification, and antimicrobial activity of psychrophilic freshwater microalgae Monoraphidium sp.
from Almaty region
Abstract. Microalgae is one of the potential biotechnologically valuable groups of photosynthetic microorganisms and represent the most promising resource for new products and applications. In this study, our efforts were focused on identification, isolation, and characterization of psychrophilic microalgae from the underinvestigated extreme environment. Three new isolates were isolated from the frozen Big Almaty Lake, but only for one of them the attempt to clean from bacteria and fungus was successful and it was obtained in algologically and bacteriologically pure form. The taxonomy and phylogeny of the green microalgae, was examined based on morphological (light and scanning electron microscopy) and sequence-based approach using universal molecular markers of ITS region and rbcL gene. Morphological and molecular characterization showed that this green microalgae is Monoraphidium sp. (strain ZBD-06). The antibacterial activity of the isolate was determined as well and 60% methanol extract of Monoraphidium sp. was used for antibacterial activity by disk diffusion assay and minimum inhibitory concentration using eleven different types of pathogenic bacteria including Gram positive (Bacillus subtilis ATCC 6633, Enterococcus faecalis ATCC 29212, Staphylococcus aureus ATCC 25923, Staphylococcus epidermidis ATCC 12228) and Gram negative bacteria (Escherichia coli ATCC 25922, Klebsiella pneumoniae ATCC 13883, Pseudomonas aeruginosa ATCC 27853, Proteus vulgaris ATCC 13315, Salmonella typhimurium ATCC 14028, Yersinia pseudotuberculosis ATCC 911, and Enterobacter cloacae ATCC 13047). The zone of inhibition (10±2 mm in diameter with 10ul of extract and 20±2 mm in diameter with 30uL) was observed against Klebsiella pneumoniae ATCC 13883. Key words: Almaty region, psychrophilic, microalgae, Monoraphidium, phylogenetic analysis, antimicrobial assay.
Introduction
Microalgae is one of the potential biotechnologi-cally valuable groups of photosynthetic microorgan-isms and represent the most promising resource for new products and applications [1]. Recent decades have witnessed an increased appreciation of the role of microalgal diversity in ecosystem function and their significant value as source for important bio-logical materials such as antibiotics, drugs, enzymes, herbicides, growth promoters and source of energy [2]. For transition toward a modern and sustainable bio-based economy, the researchers are harnessing the maximum potential of microalgae for providing solutions for addressing the diverse global challenges
of the twenty-first century. Being instrumental for ef-ficient nutrient recycling for modern agriculture and wastewater treatment systems [3], a viable alterna-tive source of energy to replace the fossil fuels [4-5], valuable additive for food and animal feed products [6], serving as a raw material for amino acids, vi-tamins and productions of valuable bioactive com-pounds [7; 8], the unique attributes of microalgae has widened the scope of their utilization in nearly every research field.
Despite the widely acknowledged value of mi-croalgae virtually in all fields of biotechnology, studies about their diversity, various ecological func-tions and properties from understudied environment are still scarce. Speculation that the number of still
15H. Balouch et al.
Int. j. biol. chem. (Online) International Journal of Biology and Chemistry 13, № 1, 14 (2020)
undiscovered microalgal species exceeds such of known species has led researchers globally to search and collect new strains of microalgae, preserve, and explore their biotechnological potentials [9].
Owing to their extraordinary physiological, eco-logical, molecular and regulatory mechanisms, mi-croalgae can be found in number of environments and are capable of surviving in extreme conditions [10]. Thus, the novel natural products with diverse biological activities, notably antibacterial, are ex-pected to be obtained from microalgae, thriving in extreme conditions. It is important to understand the molecular and regulatory mechanism of such mi-croalgae in order to use their biochemical, ecologi-cal, evolutionary and industrial potential. Therefore, over the past few decades, new strains of microalgae thriving in extreme conditions have been extensively studied through various culture-dependent and inde-pendent approaches in pursuit of novel biologically active molecules [11; 12].
The precise identification of microalgae is of great practical importance to unlock their possible biochemical potential and aid in understanding the basis of their biological activity. Studies of micro-algae diversity have traditionally relied on morpho-logical traits and various valuable and highly descrip-tive taxonomic identifiers, web-based guides, keys, manuals and manuscripts for microalgae [13-19]. Nevertheless, the misleading similarities of charac-teristic morphological features within microalgae do not enable a reliable identification of microalgae.
The recent advancement in molecular biology has revolutionized the taxonomic studies and offer a more consistently reliable and accurate method for identification. However, there is also a mounting evi-dence that sequence similarity-based approach alone is not superior to morphological taxonomy [20]. Therefore, reliable identification to species level can only be achieved using hybrid approaches, traditional taxonomic methods complemented with molecular diagnostic markers.
In the present study, investigations were focused on finding new strain of microalgae from extreme cold environment, able to demonstrate antimicrobial activity. Here we describe the discovery of a novel strain of Monoraphidium sp. The present study aims to report the morphological and molecular character-ization of a psychrophilic green microalgae collected from glacial freshwater site, Big Almaty Lake in Al-maty region of Kazakhstan, and examine the antibac-terial activity of methanol extract of the isolate by performing disk diffusion and minimum inhibitory concentration (MIC) assays.
Materials and methods
Isolation and growth conditions. The microal-gae was isolated from Big Almaty Lake by separat-ing single microalgal cells from the mixed microbial suspension using capillary pipettes (repeated until single cell isolation) and cultivated in culture dishes containing BG-11 growth medium [21], with follow-ing composition (gL-¹): NaNO‐, 1.5; K‐HPO‐, 0.04; MgSO‐·7H2O, 0.076; CaCl‐·2H‐O, 0.036; citric acid, 0.006; EDTA, 0.001; Na‐CO‐, 0.02; FeSO‐, 0.006; trace elements solution: H‐BO‐, 2.86; MnCl‐·4H‐O 1.81; ZnSO‐·7H‐O, 0.222; CuSO4·5H‐O, 0.08; MoO‐, 0.015; NaBO‐.4H‐O, 2.63; (NH‐)‐Mo‐O‐‐ ·4H‐O, 1; FeSO‐.7H‐O, 2.3; CaCl‐·2H‐O, 1.2; Co(NO‐)‐·2H‐O, 0.02; EDTA, 10; and distilled water, 1.0 L.
To enumerate the growth of microalgae after successful direct isolation procedure and observ-able growth, the microalgae culture was transferred to separate 250-mL flask containing 100 mL of liq-uid BG-11 medium. The enrichment culture was kept at 22°C ±2 for about 20 days under fluorescent light with a photoperiod of 12 h, with shaker speed 100±10 rpm.
Later the microalgae were plated onto BG-11 agar medium (supplemented with antibiotics), which was placed at 22°C ±2 until single colonies of same size and similar appearance emerged. The isolate was further purified by selecting a single colony and re-streaked, followed by microscopic examination, and individual pure colony was placed in autoclaved liq-uid medium to obtain axenic monoculture.
Identification of microalgal species. Light micro-scopic examination. The preliminary morphological identification was done under a light microscope, with a system of image capturing (MicroOptix OP-TIX C600, Austria). Morphological identification was carried out based on some prominent morpho-logical features for differentiation such as cell size (length to width ratio) and shape, solitary or colonial, presence or absence of mucilage etc., mentioned in the guidelines of description keys, taxonomic litera-ture, manuals, manuscript and photo gallery available for microalgae species identification [15; 19; 21-24].
Sample preparation for scanning electron mi-croscopy. After determination of the genera accord-ing to the microscopic features, the SEM technique was carried out at Electron Microscope Laboratory, Gazi University, Ankara, Turkey. The cells were washed with phosphate buffered saline (PBS) to re-move culture medium and then they were collected by centrifugation at 1000xg for 5 min. After that, cells were fixed with 5% glutaraldehyde, dehydrat-
16 Isolation, identification, and antimicrobial activity of psychrophilic freshwater microalgae...
Int. j. biol. chem. (Online) International Journal of Biology and Chemistry 13, № 1, 14 (2020)
ed in ascending order of 20, 40, 60, 80 and 100% ethanol. After critical point drying with CO‐ (Polar-on CPD 7501), samples were coated with gold in a Polaron SC 502 sputer coater. The coated specimen was observed with JEOL JSM 6060 LV at acceler-ating voltage 10kV and SEM images were digitally produced.
Molecular identification of algal species. For molecular identification, the microalgal cell pel-let (approximately 30mg) was obtained from cul-ture medium by centrifugation at 6,000 rpm for 10 min and genomic DNA of strain was extracted us-ing Quick-DNA™ Fungal/Bacterial Miniprep Kit (Zymo Research, D6005), according to the manu-facturer instructions. The quality and quantity of DNA samples were measured with the Spectropho-
tometer Thermo Scientific™ NanoDrop 2000. DNA extracts were stored at -20 °C. The ribosomal ITS region and rbcL gene sequences were amplified us-ing the universal primer pair, listed in Table 1, cho-sen from published studies with microalgae from class Chlorophyceae.
The 50 μL PCR reaction mixture was composed of 27.75 μL of dH2O, 10 μL of GoTaq 5X PCR buf-fer, 6 μL MgCl2 25 mM, 1 μL dNTPs 10 mM, 0.25 μL of GoTaq DNA polymerase (5 U/μL) (Promega, USA), 1 μL of each primer (10 μM) and 3.0 μl of DNA template (30-50 ng/μL). The PCR amplifica-tion protocol used for both markers was: 95 °C for 2 min, 35 cycles of 95 °C for 50 sec, primer-annealing temperature 49 °C for 30 sec and 72°C for 1 min, with a final extension at 72 °C for 10 min.
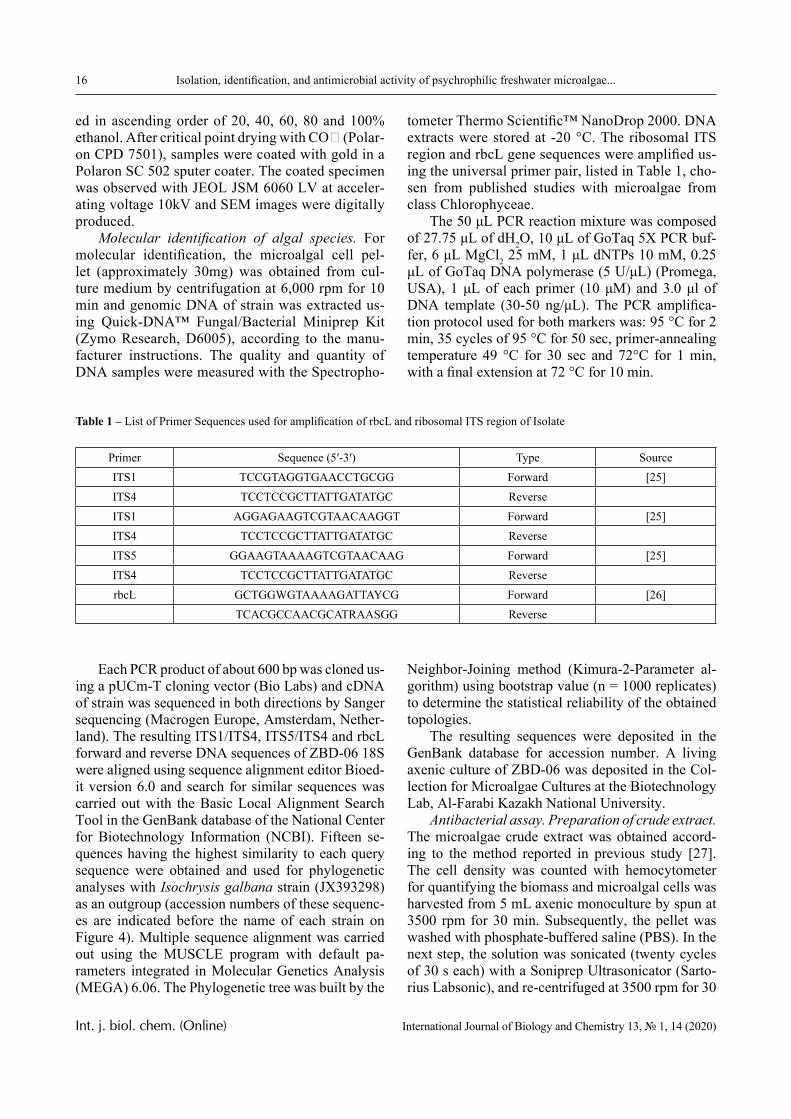
Table 1 – List of Primer Sequences used for amplification of rbcL and ribosomal ITS region of Isolate
Primer Sequence (5′-3′) Type SourceITS1 TCCGTAGGTGAACCTGCGG Forward [25]ITS4 TCCTCCGCTTATTGATATGC ReverseITS1 AGGAGAAGTCGTAACAAGGT Forward [25]ITS4 TCCTCCGCTTATTGATATGC ReverseITS5 GGAAGTAAAAGTCGTAACAAG Forward [25]ITS4 TCCTCCGCTTATTGATATGC ReverserbcL GCTGGWGTAAAAGATTAYCG Forward [26]
TCACGCCAACGCATRAASGG Reverse
Each PCR product of about 600 bp was cloned us-ing a pUCm-T cloning vector (Bio Labs) and cDNA of strain was sequenced in both directions by Sanger sequencing (Macrogen Europe, Amsterdam, Nether-land). The resulting ITS1/ITS4, ITS5/ITS4 and rbcL forward and reverse DNA sequences of ZBD-06 18S were aligned using sequence alignment editor Bioed-it version 6.0 and search for similar sequences was carried out with the Basic Local Alignment Search Tool in the GenBank database of the National Center for Biotechnology Information (NCBI). Fifteen se-quences having the highest similarity to each query sequence were obtained and used for phylogenetic analyses with Isochrysis galbana strain (JX393298) as an outgroup (accession numbers of these sequenc-es are indicated before the name of each strain on Figure 4). Multiple sequence alignment was carried out using the MUSCLE program with default pa-rameters integrated in Molecular Genetics Analysis (MEGA) 6.06. The Phylogenetic tree was built by the
Neighbor-Joining method (Kimura-2-Parameter al-gorithm) using bootstrap value (n = 1000 replicates) to determine the statistical reliability of the obtained topologies.
The resulting sequences were deposited in the GenBank database for accession number. A living axenic culture of ZBD-06 was deposited in the Col-lection for Microalgae Cultures at the Biotechnology Lab, Al-Farabi Kazakh National University.
Antibacterial assay. Preparation of crude extract. The microalgae crude extract was obtained accord-ing to the method reported in previous study [27]. The cell density was counted with hemocytometer for quantifying the biomass and microalgal cells was harvested from 5 mL axenic monoculture by spun at 3500 rpm for 30 min. Subsequently, the pellet was washed with phosphate-buffered saline (PBS). In the next step, the solution was sonicated (twenty cycles of 30 s each) with a Soniprep Ultrasonicator (Sarto-rius Labsonic), and re-centrifuged at 3500 rpm for 30
17H. Balouch et al.
Int. j. biol. chem. (Online) International Journal of Biology and Chemistry 13, № 1, 14 (2020)
min to remove cell debris. Afterwards, 60% metha-nol was added to the pellet in 1:5 w/w ratio of the ini-tial biomass concentration. The resulting sample was re-centrifuged at 3500 rpm for 20 min. The obtained supernatant was utilized to assess the antimicrobial activity, and cell suspension density (number of algal cells in one mL) at the start of the extraction process.
Evaluation of antimicrobial activity. Antibacte-rial activity of microalgae crude extract against elev-en bacterial strains, namely, Gram-positive (Bacillus subtilis ATCC 6633, Enterococcus faecalis ATCC 29212, Staphylococcus aureus ATCC 25923, Staph-ylococcus epidermidis ATCC 12228) and Gram-negative (Escherichia coli ATCC 25922, Klebsiella pneumoniae ATCC 13883, Pseudomonas aerugino-sa ATCC 27853, Proteus vulgaris ATCC 13315, Sal-monella typhimurium ATCC 14028, Yersinia pseu-dotuberculosis ATCC 911, and Enterobacter cloacae ATCC 13047) were examined by disk diffusion as-say. Pure colonies of test bacteria were obtained from the Microbiology Laboratory, Karadeniz Technical University. Turkey. The Mueller-Hinton agar (pH 7.2-7.4) plates were inoculated with broth cultures diluted to 0.5 turbidity (~1.5 × 10‐ cells·mL−1). Discs containing 10 μL of methanol extract of the isolate were placed on filter paper disc on the surface of an agar plate, pre-inoculated with bacterial suspension to be tested. Paper discs with only methanol and
antibiotic (rifampicin) were used as negative con-trols. Finally, the plates were incubated at 37 °C for 16-24 h. The inhibition zones were measured in mm. All experiments were carried out three times with similar results.
Determination of minimum inhibitory concen-tration (MIC). The crude extract were then added in serial dilution to Mueller-Hinton Broth culture in test tubes and bacterial strains were inoculated at the same concentration used for disk diffusion method. The tubes were incubated at 37°C for 24-48 h and then examined for bacterial growth. The MIC values were obtained from the lowest concentration of the extract where the tubes remained clear, indicating that the bacterial growth was completely inhibited at this concentration.
Results and discussion
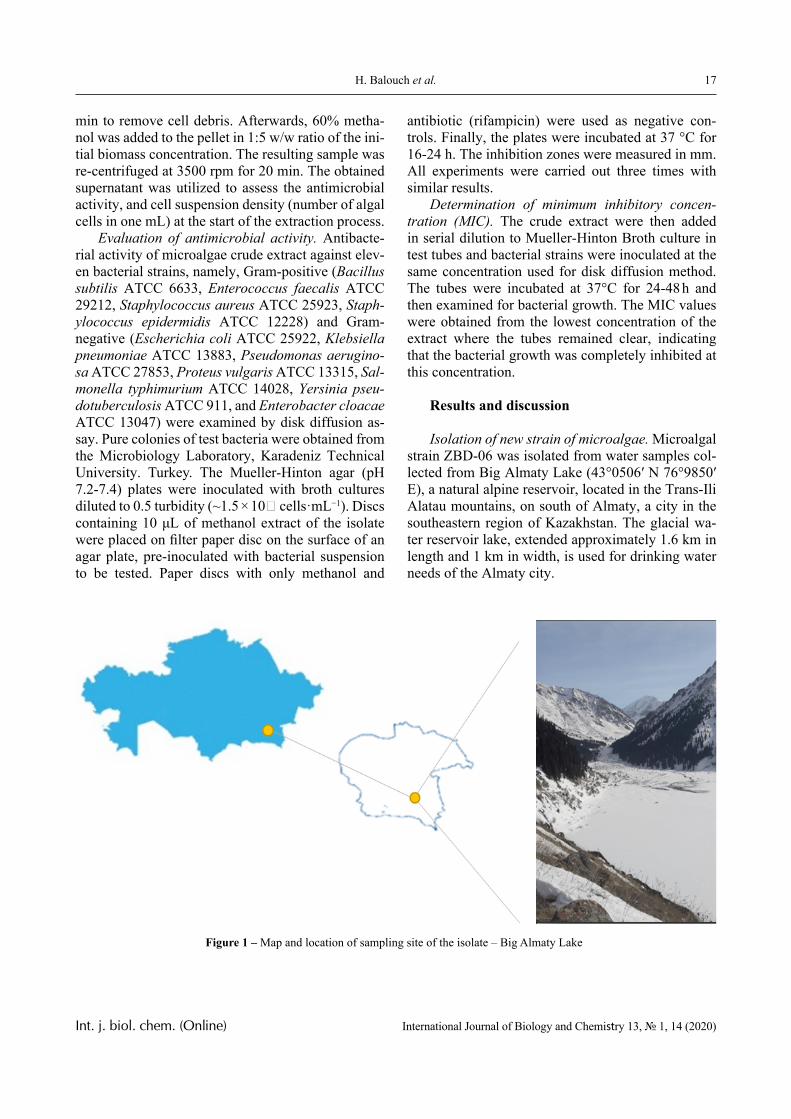
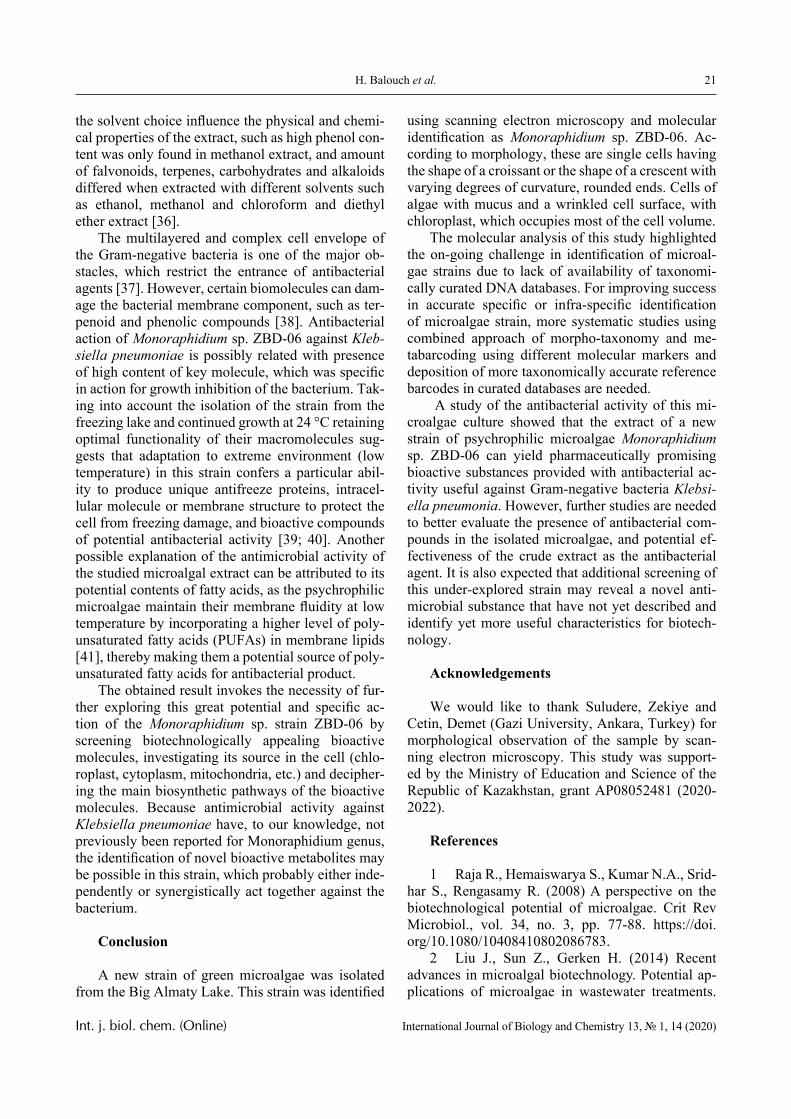
Isolation of new strain of microalgae. Microalgal strain ZBD-06 was isolated from water samples col-lected from Big Almaty Lake (43°0506′ N 76°9850′ E), a natural alpine reservoir, located in the Trans-Ili Alatau mountains, on south of Almaty, a city in the southeastern region of Kazakhstan. The glacial wa-ter reservoir lake, extended approximately 1.6 km in length and 1 km in width, is used for drinking water needs of the Almaty city.
Figure 1 – Map and location of sampling site of the isolate – Big Almaty Lake
18 Isolation, identification, and antimicrobial activity of psychrophilic freshwater microalgae...
Int. j. biol. chem. (Online) International Journal of Biology and Chemistry 13, № 1, 14 (2020)
Six algological samples were taken from this lake, the water temperature at the time of sampling was + 2 °C, pH 7.3. Water samples were taken from the coast of lake directly from the surface and from the water column (depth – 20 cm).
As a result, 4 accumulative cultures were ob-tained from the selected samples, of which 2 micro-algae cultures were isolated by successive reseeding. Various concentrations of mixture antibiotics from wide-spectrum antibiotics against Gram-positive and Gram-negative bacteria and antifungal antibiotics was used to clean the isolated cultures from bacteria, because the concomitant microflora reacted differ-ently to different antibiotics. Thus by treatment with a mixture of antibiotics, only 1 strain of microalgae was obtained in a bacteriologically pure form.
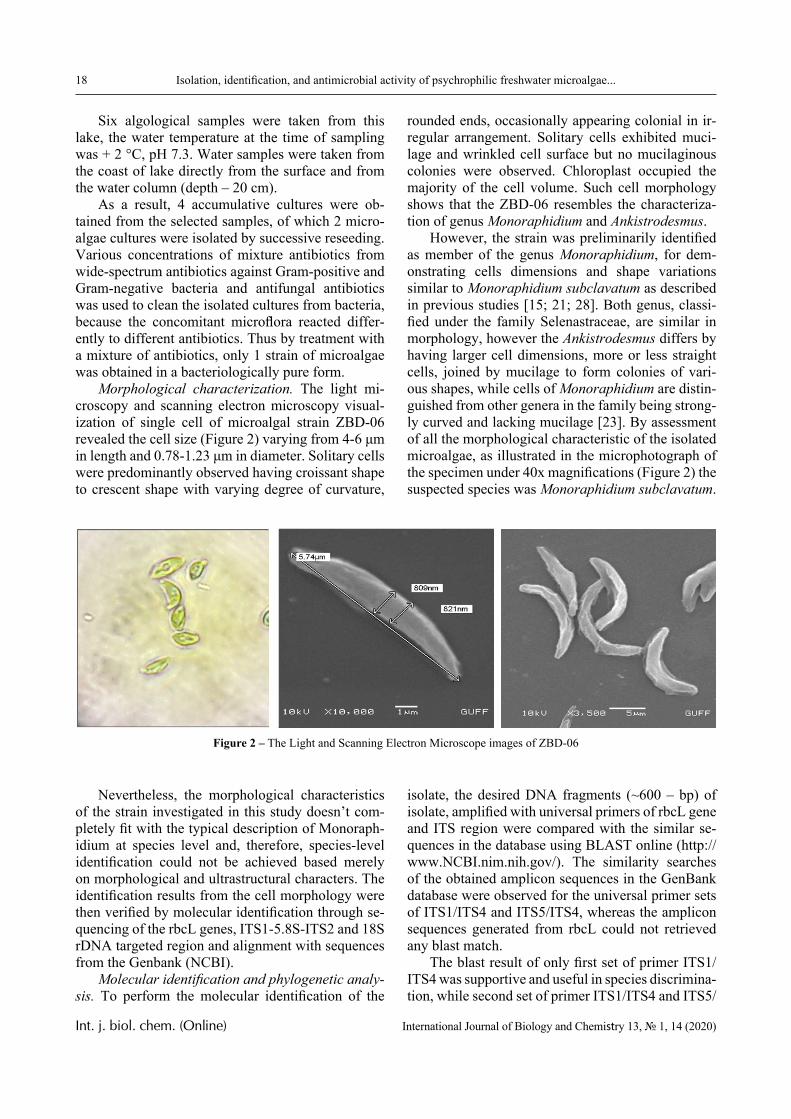
Morphological characterization. The light mi-croscopy and scanning electron microscopy visual-ization of single cell of microalgal strain ZBD-06 revealed the cell size (Figure 2) varying from 4-6 μm in length and 0.78-1.23 μm in diameter. Solitary cells were predominantly observed having croissant shape to crescent shape with varying degree of curvature,
rounded ends, occasionally appearing colonial in ir-regular arrangement. Solitary cells exhibited muci-lage and wrinkled cell surface but no mucilaginous colonies were observed. Chloroplast occupied the majority of the cell volume. Such cell morphology shows that the ZBD-06 resembles the characteriza-tion of genus Monoraphidium and Ankistrodesmus.
However, the strain was preliminarily identified as member of the genus Monoraphidium, for dem-onstrating cells dimensions and shape variations similar to Monoraphidium subclavatum as described in previous studies [15; 21; 28]. Both genus, classi-fied under the family Selenastraceae, are similar in morphology, however the Ankistrodesmus differs by having larger cell dimensions, more or less straight cells, joined by mucilage to form colonies of vari-ous shapes, while cells of Monoraphidium are distin-guished from other genera in the family being strong-ly curved and lacking mucilage [23]. By assessment of all the morphological characteristic of the isolated microalgae, as illustrated in the microphotograph of the specimen under 40x magnifications (Figure 2) the suspected species was Monoraphidium subclavatum.
Figure 2 – The Light and Scanning Electron Microscope images of ZBD-06
Nevertheless, the morphological characteristics of the strain investigated in this study doesn’t com-pletely fit with the typical description of Monoraph-idium at species level and, therefore, species-level identification could not be achieved based merely on morphological and ultrastructural characters. The identification results from the cell morphology were then verified by molecular identification through se-quencing of the rbcL genes, ITS1-5.8S-ITS2 and 18S rDNA targeted region and alignment with sequences from the Genbank (NCBI).
Molecular identification and phylogenetic analy-sis. To perform the molecular identification of the
isolate, the desired DNA fragments (~600 – bp) of isolate, amplified with universal primers of rbcL gene and ITS region were compared with the similar se-quences in the database using BLAST online (http://www.NCBI.nim.nih.gov/). The similarity searches of the obtained amplicon sequences in the GenBank database were observed for the universal primer sets of ITS1/ITS4 and ITS5/ITS4, whereas the amplicon sequences generated from rbcL could not retrieved any blast match.
The blast result of only first set of primer ITS1/ITS4 was supportive and useful in species discrimina-tion, while second set of primer ITS1/ITS4 and ITS5/
19H. Balouch et al.
Int. j. biol. chem. (Online) International Journal of Biology and Chemistry 13, № 1, 14 (2020)
ITS4 resulted in database mismatches with macro algae, uncultured microorganism and microalgae completely conflicting with morphological descrip-tion. As the results with the second set of primers were not satisfactory to infer generic identity, there-fore, the phylogenetic analysis was performed only with the first set of ITS/ITS4 primer. This reduced success in retrieving accurate sequence matches can be attributed to the fact that the number of well-de-scribed microalgae species are still not significantly represented in Genbank. The limitations in molecular identification of some microalgae at the species-level implied that further work is required to establish ef-ficient DNA barcode markers for revealing sufficient heterogeneity for species identification, maximizing the gene database, as well as employing combination of molecular and morphological methods for accu-
rate identification of species with extreme morpho-logical plasticity.
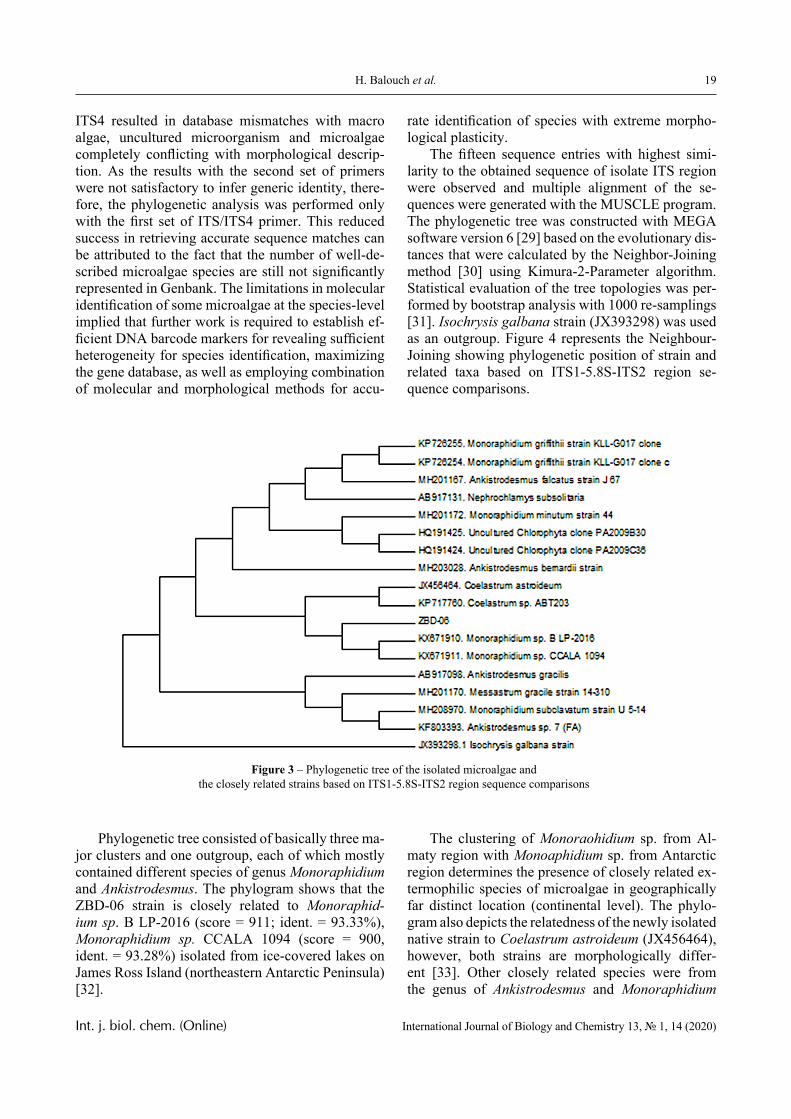
The fifteen sequence entries with highest simi-larity to the obtained sequence of isolate ITS region were observed and multiple alignment of the se-quences were generated with the MUSCLE program. The phylogenetic tree was constructed with MEGA software version 6 [29] based on the evolutionary dis-tances that were calculated by the Neighbor-Joining method [30] using Kimura-2-Parameter algorithm. Statistical evaluation of the tree topologies was per-formed by bootstrap analysis with 1000 re-samplings [31]. Isochrysis galbana strain (JX393298) was used as an outgroup. Figure 4 represents the Neighbour-Joining showing phylogenetic position of strain and related taxa based on ITS1-5.8S-ITS2 region se-quence comparisons.
Figure 3 – Phylogenetic tree of the isolated microalgae and the closely related strains based on ITS1-5.8S-ITS2 region sequence comparisons
Phylogenetic tree consisted of basically three ma-jor clusters and one outgroup, each of which mostly contained different species of genus Monoraphidium and Ankistrodesmus. The phylogram shows that the ZBD-06 strain is closely related to Monoraphid-ium sp. B LP-2016 (score = 911; ident. = 93.33%), Monoraphidium sp. CCALA 1094 (score = 900, ident. = 93.28%) isolated from ice-covered lakes on James Ross Island (northeastern Antarctic Peninsula) [32].
The clustering of Monoraohidium sp. from Al-maty region with Monoaphidium sp. from Antarctic region determines the presence of closely related ex-termophilic species of microalgae in geographically far distinct location (continental level). The phylo-gram also depicts the relatedness of the newly isolated native strain to Coelastrum astroideum (JX456464), however, both strains are morphologically differ-ent [33]. Other closely related species were from the genus of Ankistrodesmus and Monoraphidium
20 Isolation, identification, and antimicrobial activity of psychrophilic freshwater microalgae...
Int. j. biol. chem. (Online) International Journal of Biology and Chemistry 13, № 1, 14 (2020)
representing a polyphyletic group [34]. The overall morphological features and sequence-based phyloge-netic analysis of ZBD-06 with one of the primers of ITS1 region presented a good correlation and served as important molecular target for identification and taxonomical position of the isolate to great extent based on the availability of sequence database. The obtained molecular result suggests the consideration of ZBD-06 strain as Monoraphidium sp. that was also based on light and SEM microscopic observation and the genus belongs to the family Selenastracaceae (Cholorophyceae). The ITS sequence of the isolate was submitted with accession number of MT178772 in NCBI database, respectively. The relative phylo-genetic position based on the ITS1/ITS4 primer se-quence might not determine species-level resolution for this species, but when matched with the results of morphological studies, it provided more reliable identification of the isolate.
Antibacterial assay. In this study, the 60% meth-anol extract of ZBD-06 was tested for antimicrobial activity against eleven bacterial strains, including Gram-positive (Bacillus subtilis ATCC 6633, En-terococcus faecalis ATCC 29212, Staphylococcus aureus ATCC 25923, Staphylococcus epidermidis ATCC 12228) and Gram-negative (Escherichia coli
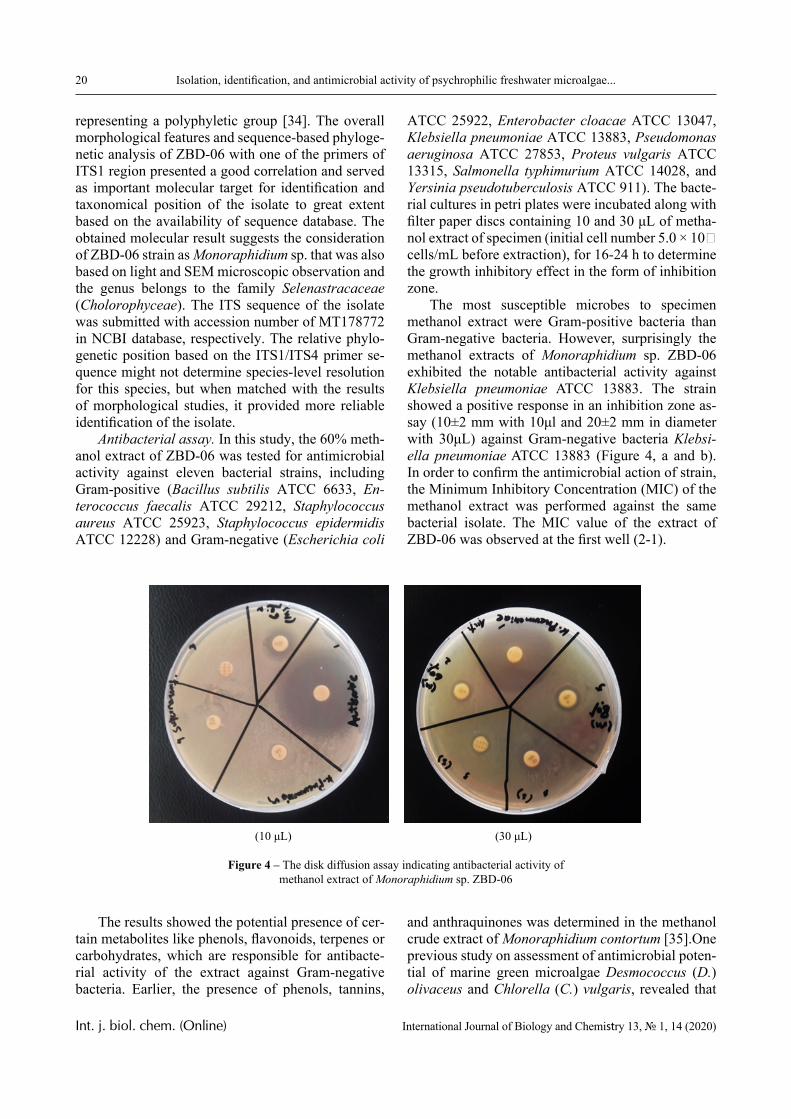
ATCC 25922, Enterobacter cloacae ATCC 13047, Klebsiella pneumoniae ATCC 13883, Pseudomonas aeruginosa ATCC 27853, Proteus vulgaris ATCC 13315, Salmonella typhimurium ATCC 14028, and Yersinia pseudotuberculosis ATCC 911). The bacte-rial cultures in petri plates were incubated along with filter paper discs containing 10 and 30 μL of metha-nol extract of specimen (initial cell number 5.0 × 10‐ cells/mL before extraction), for 16-24 h to determine the growth inhibitory effect in the form of inhibition zone.
The most susceptible microbes to specimen methanol extract were Gram-positive bacteria than Gram-negative bacteria. However, surprisingly the methanol extracts of Monoraphidium sp. ZBD-06 exhibited the notable antibacterial activity against Klebsiella pneumoniae ATCC 13883. The strain showed a positive response in an inhibition zone as-say (10±2 mm with 10μl and 20±2 mm in diameter with 30μL) against Gram-negative bacteria Klebsi-ella pneumoniae ATCC 13883 (Figure 4, a and b). In order to confirm the antimicrobial action of strain, the Minimum Inhibitory Concentration (MIC) of the methanol extract was performed against the same bacterial isolate. The MIC value of the extract of ZBD-06 was observed at the first well (2-1).
(10 μL) (30 μL)
Figure 4 – The disk diffusion assay indicating antibacterial activity of methanol extract of Monoraphidium sp. ZBD-06
The results showed the potential presence of cer-tain metabolites like phenols, flavonoids, terpenes or carbohydrates, which are responsible for antibacte-rial activity of the extract against Gram-negative bacteria. Earlier, the presence of phenols, tannins,
and anthraquinones was determined in the methanol crude extract of Monoraphidium contortum [35].One previous study on assessment of antimicrobial poten-tial of marine green microalgae Desmococcus (D.) olivaceus and Chlorella (C.) vulgaris, revealed that
21H. Balouch et al.
Int. j. biol. chem. (Online) International Journal of Biology and Chemistry 13, № 1, 14 (2020)
the solvent choice influence the physical and chemi-cal properties of the extract, such as high phenol con-tent was only found in methanol extract, and amount of falvonoids, terpenes, carbohydrates and alkaloids differed when extracted with different solvents such as ethanol, methanol and chloroform and diethyl ether extract [36].
The multilayered and complex cell envelope of the Gram-negative bacteria is one of the major ob-stacles, which restrict the entrance of antibacterial agents [37]. However, certain biomolecules can dam-age the bacterial membrane component, such as ter-penoid and phenolic compounds [38]. Antibacterial action of Monoraphidium sp. ZBD-06 against Kleb-siella pneumoniae is possibly related with presence of high content of key molecule, which was specific in action for growth inhibition of the bacterium. Tak-ing into account the isolation of the strain from the freezing lake and continued growth at 24 °C retaining optimal functionality of their macromolecules sug-gests that adaptation to extreme environment (low temperature) in this strain confers a particular abil-ity to produce unique antifreeze proteins, intracel-lular molecule or membrane structure to protect the cell from freezing damage, and bioactive compounds of potential antibacterial activity [39; 40]. Another possible explanation of the antimicrobial activity of the studied microalgal extract can be attributed to its potential contents of fatty acids, as the psychrophilic microalgae maintain their membrane fluidity at low temperature by incorporating a higher level of poly-unsaturated fatty acids (PUFAs) in membrane lipids [41], thereby making them a potential source of poly-unsaturated fatty acids for antibacterial product.
The obtained result invokes the necessity of fur-ther exploring this great potential and specific ac-tion of the Monoraphidium sp. strain ZBD-06 by screening biotechnologically appealing bioactive molecules, investigating its source in the cell (chlo-roplast, cytoplasm, mitochondria, etc.) and decipher-ing the main biosynthetic pathways of the bioactive molecules. Because antimicrobial activity against Klebsiella pneumoniae have, to our knowledge, not previously been reported for Monoraphidium genus, the identification of novel bioactive metabolites may be possible in this strain, which probably either inde-pendently or synergistically act together against the bacterium.
Conclusion
A new strain of green microalgae was isolated from the Big Almaty Lake. This strain was identified
using scanning electron microscopy and molecular identification as Monoraphidium sp. ZBD-06. Ac-cording to morphology, these are single cells having the shape of a croissant or the shape of a crescent with varying degrees of curvature, rounded ends. Cells of algae with mucus and a wrinkled cell surface, with chloroplast, which occupies most of the cell volume.
The molecular analysis of this study highlighted the on-going challenge in identification of microal-gae strains due to lack of availability of taxonomi-cally curated DNA databases. For improving success in accurate specific or infra-specific identification of microalgae strain, more systematic studies using combined approach of morpho-taxonomy and me-tabarcoding using different molecular markers and deposition of more taxonomically accurate reference barcodes in curated databases are needed.
A study of the antibacterial activity of this mi-croalgae culture showed that the extract of a new strain of psychrophilic microalgae Monoraphidium sp. ZBD-06 can yield pharmaceutically promising bioactive substances provided with antibacterial ac-tivity useful against Gram-negative bacteria Klebsi-ella pneumonia. However, further studies are needed to better evaluate the presence of antibacterial com-pounds in the isolated microalgae, and potential ef-fectiveness of the crude extract as the antibacterial agent. It is also expected that additional screening of this under-explored strain may reveal a novel anti-microbial substance that have not yet described and identify yet more useful characteristics for biotech-nology.
Acknowledgements
We would like to thank Suludere, Zekiye and Cetin, Demet (Gazi University, Ankara, Turkey) for morphological observation of the sample by scan-ning electron microscopy. This study was support-ed by the Ministry of Education and Science of the Republic of Kazakhstan, grant АР08052481 (2020-2022).
References
1 Raja R., Hemaiswarya S., Kumar N.A., Srid-har S., Rengasamy R. (2008) A perspective on the biotechnological potential of microalgae. Crit Rev Microbiol., vol. 34, no. 3, pp. 77-88. https://doi.org/10.1080/10408410802086783.
2 Liu J., Sun Z., Gerken H. (2014) Recent advances in microalgal biotechnology. Potential ap-plications of microalgae in wastewater treatments.
22 Isolation, identification, and antimicrobial activity of psychrophilic freshwater microalgae...
Int. j. biol. chem. (Online) International Journal of Biology and Chemistry 13, № 1, 14 (2020)
Published by OMICS Group eBooks, USA, ISBN: 978-1-63278-066-9.
3 Brennan L., Owende P. (2010) Biofuels from microalgae–a review of technologies for production, processing, and extractions of biofuels and co-prod-ucts. Renew Sustain Energy Rev., vol. 14, no. 2, pp. 557–577. doi:10.1016/j.rser.2009.10.009.
4 Markou G., Nerantzis E. (2013) Microalgae for high-value compounds and biofuels production: a review with focus on cultivation under stress condi-tions. Biotechnol. Adv., vol. 31, no. 8, pp. 1532–1542. https://doi.org/10.1016/j.biotechadv.2013.07.011.
5 Priyadarshani I., Rath B. (2012) Commercial and industrial applications of micro algae–A review. Journal of Algal Biomass Utilization, vol. 3, no. 4, pp. 89-100.
6 Larkum A.W., Ross I.L., Kruse O., Hanka-mer B. (2012) Selection, breeding and engineering of microalgae for bioenergy and biofuel production. Trends in biotechnology, vol. 30, no. 4, pp. 198-205. https://doi.org/10.1016/j.tibtech.2011.11.003.
7 Muñoz-Ochoa M., Murillo-Álvarez J.I., Zer-meño-Cervantes L. A., Martínez-Díaz S., Rodríguez-Riosmena R. (2010) Screening of extracts of algae from Baja California Sur, Mexico as reversers of the antibiotic resistance of some pathogenic bacteria. Eur. Rev. Med. Pharmacol. Sci, vol. 14, no. 9, pp. 739-747.
8 Pane G., Cacciola G., Giacco E., Mariottini G. L., Coppo E. (2015) Assessment of the antimicro-bial activity of algae extracts on bacteria responsible of external otitis. Marine drugs, vol. 13, no. 10, pp. 6440-6452. https://doi.org/10.3390/md13106440.
9 Guiry, M.D. (2012) How many species of algae are there?. Journal of phycology, vol. 48, no. 5, pp. 1057-1063. https://doi.org/10.1111/j.1529-8817.2012.01222.
10 Pradhan J., Das S., Das B. K. (2014) Anti-bacterial activity of freshwater microalgae: A review. African Journal of Pharmacy and. Pharmacology, vol. 8, no. 32, pp. 809-818. https://doi.org/10.5897/AJPP2013.0002.
11 Sydney E.B., Schafranski K., Barreti B.R.V., Sydney A.C.N., Zimmerman J.F.D.A., Cerri M.L., Demiate I.M. (2019) Biomolecules from extremo-phile microalgae: from genetics to bioprocessing of a new candidate for large-scale production. Pro-cess Biochemistry, vol. 87, pp. 37–44. https://doi.org/10.1016/j.procbio.2019.09.012
12 Heidari F., Shariatmadari Z., Riahi H., (2019) Screening of Extremophile Microalgae Isolated from High Background Radiation Areas as Source of Bio-active Materials, Current Bioactive Compounds, vol.
15, pp. 1-8. https://doi.org/10.2174/1573407215666181219104518.
13 Canter-Lund H., Lund J.W.G. (1995) Fresh-water algae: Their microscopic world explored. Bio-press Ltd., Bristol. 360 p. ISBN 0-948737-25-5.
14 Dillard, G.E. 1999) Common Freshwater Al-gae of the United States. An Illustrated Key to the Genera (Excluding the Diatoms). J. Cramer in der Gebr. Bomtraeger Verlagsbuchhandlung, Berlin-Stuttgart., pp.173, 298 Figs. DM 58. ISBN 3-443-50026-9.
15 Edward G.B., David C.S. (2010) Freshwater algae identification and use as bioindicators. A John Wiley & Sons, Ltd, 101. ISBN-13: 978-0470058145.
16 Huynh, M., Serediak, N. (2006) Algae identification field guide agriculture and agric food canada. Agri-Environment Services Branch, Majesty the Queen in Right of Canada, pp. 40. ISBN 9781100183077-1100183078
17 John D.M., Whitton B.A., Brook A.J. (2002) Freshwater algal flora of the British Isles: An identification guide to freshwater and terres-trial algae. Cambridge University Press. 702 p. ISBN 0‐521‐77051‐3.
18 Shayler H.A. and Siver P.A. (2006) Key to Freshwater Algae: A web-based tool to enhance un-derstanding of microscopic biodiversity. Journal of Science Education and Technology vol. 15, no. 3, pp. 298-303. https://doi.org/10.1007/s10956-006-9016-4.
19 Whitford L.A., Schumacher G.J. (1973) A manual of freshwater algae (p. 324). Raleigh: Sparks.
20 Stoykova P., Stoyneva-Gärtner M., Uzunov B., Gärtner G., Atanassov I., Draganova P., Borisova, C. (2019) Morphological characterization and phy-logenetic analysis of aeroterrestrial Vischeria/Eustig-matos strains with industrial potential. Biotechnol-ogy & Biotechnological Equipment, vol. 33, no. 1, pp. 231-242. https://doi.org/10.1080/13102818.2018.1561212.
21 Hindák, F. (1970) A contribution to the sys-tematics of the family Ankistrodesmaceae (Chloro-phyceae). Archiv für Hydrobiologie Supplement – Algological Studies 1, pp. 7-32.
22 Komárková – Legnerová J., (1969) The sys-tematics and ontogenesis of the genera Ankistrodes-mus Corda and Monoraphidium gen. nov. In: Studies in Phycology (Fott B, ed). E Schweizerbart’sche Ver-lagsbuchhandlung (Nägele u. Obermiller) Stuttgart. pp. 75 – 144.
23 Ramos G.J.P., Bicudo C.E.D.M., Góes-Neto A. Moura C.W.D.N. (2012) Monoraphidium and An-kistrodesmus (Chlorophyceae, Chlorophyta) from
23H. Balouch et al.
Int. j. biol. chem. (Online) International Journal of Biology and Chemistry 13, № 1, 14 (2020)
Pantanal dos Marimbus, Chapada Diamantina, Bahia State, Brazil. Hoehnea, vol. 39, no. 3, pp, 421-434. https://doi.org/10.1590/S2236-89062012000300006.
24 Ramos G.J.P., Bicudo C.E.D.M., Góes-Neto A. Moura C.W.D.N. (2014) New additions of coccoid green algae to the phycoflora of Brazil and the Neotropics. Acta Botanica Brasilica, vol. 28, no. 1, pp. 8-16. https://doi.org/10.1590/S0102-33062014000100002.
25 White T. J., Bruns T., Lee S.J.W.T., Taylor J. (1990) Amplification and direct sequencing of fungal ribosomal RNA genes for phylogenetics. PCR pro-tocols: a guide to methods and applications, vol. 18, no. 1, pp. 315-322. https://doi.org/10.1016/b978-0-12-372180-8.50042-1.
26 Saunders G.W., Kucera H. (2010) An evalu-ation of rbcL, tufA, UPA, LSU and ITS as DNA bar-code markers for the marine macroalgae. Cryptogam, Algol, vol. 31, no. 4, pp. 487–528.
27 Pane G., Cacciola G., Giacco E., Mariottini G.L., Coppo E. (2015) Assessment of the antimicro-bial activity of algae extracts on bacteria responsi-ble of external otitis. Marine drugs, vol. 13, no. 10, pp.6440-6452. https://doi.org/10.3390/md13106440.
28 Nygaard G. (1977) New or interesting plank-ton algae with a contribution on their ecology. Det Kongelige Danske Videnskabernes Selskab, Biolo-giske Skrifter, vol. 21, no. 1, pp. 1-107.
29 Tamura K., Stecher G., Peterson D., Filipski A., & Kumar S. (2013) MEGA6: molecular evolu-tionary genetics analysis version 6.0. Molecular biol-ogy and evolution, vol. 30, no. 12, pp. 2725-2729. https://doi.org/10.1093/molbev/mst197.
30 Saitou N, Nei M. (1987) The neighbor-join-ing method: a new method for reconstructing phylo-genetic trees. Mol Biol Evol, vol. 4, no. 4, pp. 406–25. https://doi.org/10.1093/oxfordjournals.molbev.a040454.
31 Felsenstein J. (1985) Confidence limits on phylogenies: an approach using the bootstrap. Evolution, vol. 39, no. 4, pp. 783–91. https://doi.org/10.2307/2408678.
32 Nedbalová L., Mihál M., Kvíderová J., Pro-cházková L., Řezanka T., & Elster J. (2017) Identity, ecology and ecophysiology of planktic green algae dominating in ice-covered lakes on James Ross Island (northeastern Antarctic Peninsula). Extremophiles, vol. 21, no. 1, pp. 187-200. https://doi.org/10.1007/s00792-016-0894-y.
33 Hentschke G.S., Prado J.F. (2012) Chloro-coccales sl (Chlorophyceae) e Zygnematales (Zygne-
matophyceae) em um açude do Balneário do Lérmen, Rio Grande do Sul, Brasil. Iheringia. Série Botânica., vol. 67, no. 1, pp. 59-74.
34 Krienitz L., Bock C., Dadheech P. K., Pro¨schold T. (2011) Taxonomic reassessment of the genus Mychonastes (Chlorophy-ceae, Chlorophy-ta) including the description of eight newspecies. Phycologia, vol. 50, no. 1, pp. 89–106. https://doi.org/10.2216/10-15.1.
35 Ferreira C.R.S., Gama F.S., Faustino S.M.M., Almeida S.S.M.S. (2017) Study of the Secondary Metabolites, Cytotoxic and Antioxidant Activity of the Methanolic Monoraphidium contortum Crude Extract. Journal of Chemical and Pharmaceutical Re-search, vol. 9, no. 6, pp. 327-331.
36 Ramar D., Rajendran N., Pichai S. (2016) Phytochemical and antimicrobial activity of green microalgae from Vellar Estuary, southeast coast of India. Journal of Coastal Life Medicine, vol. 4, pp. 374-376. https://doi.org/10.12980/jclm.4.2016J5-167.
37 Bergsson G., Arnfinnsson J., Steingrı́msson Ó., & Thormar H. (2001) In vitro killing of Can-dida albicans by fatty acids and monoglycerides. Antimicrobial agents and chemotherapy, vol. 45, no. 11, pp. 3209-3212. https://doi.org/10.1128/AAC.45.11.3209–3212.2001.
38 Helander I.M., Alakomi H.L., Latva-Kala K., Mattila-Sandholm T., et al. (1998) Characterization of the action of selected essential oil components on Gram-negative bacteria. Journal of agricultural and food chemistry, vol. 46, no. 9, pp. 3590-3595. https://doi.org/10.1021/jf980154.
39 Jung W., Gwak Y., Davies P.L., Kim H.J., Jin E. (2014) Isolation and characterization of antifreeze proteins from the antarctic marine microalga Pyra-mimonas gelidicola. Mar Biotechnol, vol. 16, no. 5, pp. 502–12. https://doi.org/10.1007/s10126-014-9567-y.
40 Varshney P., Mikulic P., Vonshak A., Beardall, J., Wangikar P.P. (2015) Extremo-philic micro-algae and their potential contribu-tion in biotechnology. Bioresource technology, vol. 184, pp. 363-372. https://doi.org/10.1016/j.biortech.2014.11.040.
41 Spijkerman E., and Wacker A. (2011) Inter-actions between P-limitation and different C condi-tions on the fatty acid composition of an extremo-phile microalga. Extremophiles, vol. 15, no. 5, pp. 597–609. https://doi.org/ 10.1007/s00792-011-0390-3.
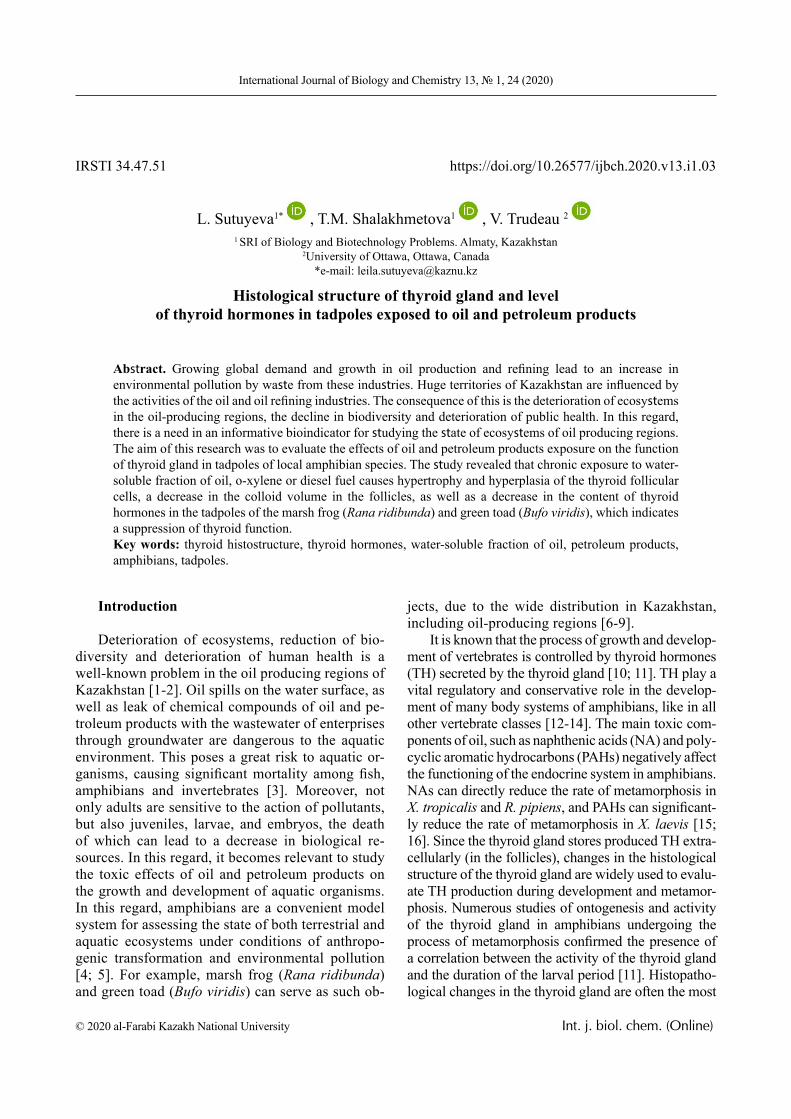
© 2020 al-Farabi Kazakh National University Int. j. biol. chem. (Online)
International Journal of Biology and Chemistry 13, № 1, 24 (2020)
IRSTI 34.47.51 https://doi.org/10.26577/ijbch.2020.v13.i1.03
L. Sutuyeva1* , T.M. Shalakhmetova1 , V. Trudeau 2
1 SRI of Biology and Biotechnology Problems. Almaty, Kazakhstan 2University of Ottawa, Ottawa, Canada
*e-mail: [email protected]
Histological structure of thyroid gland and level of thyroid hormones in tadpoles exposed to oil and petroleum products
Abstract. Growing global demand and growth in oil production and refining lead to an increase in environmental pollution by waste from these industries. Huge territories of Kazakhstan are influenced by the activities of the oil and oil refining industries. The consequence of this is the deterioration of ecosystems in the oil-producing regions, the decline in biodiversity and deterioration of public health. In this regard, there is a need in an informative bioindicator for studying the state of ecosystems of oil producing regions. The aim of this research was to evaluate the effects of oil and petroleum products exposure on the function of thyroid gland in tadpoles of local amphibian species. The study revealed that chronic exposure to water-soluble fraction of oil, o-xylene or diesel fuel causes hypertrophy and hyperplasia of the thyroid follicular cells, a decrease in the colloid volume in the follicles, as well as a decrease in the content of thyroid hormones in the tadpoles of the marsh frog (Rana ridibunda) and green toad (Bufo viridis), which indicates a suppression of thyroid function.Key words: thyroid histostructure, thyroid hormones, water-soluble fraction of oil, petroleum products, amphibians, tadpoles.
Introduction
Deterioration of ecosystems, reduction of bio-diversity and deterioration of human health is a well-known problem in the oil producing regions of Kazakhstan [1-2]. Oil spills on the water surface, as well as leak of chemical compounds of oil and pe-troleum products with the wastewater of enterprises through groundwater are dangerous to the aquatic environment. This poses a great risk to aquatic or-ganisms, causing significant mortality among fish, amphibians and invertebrates [3]. Moreover, not only adults are sensitive to the action of pollutants, but also juveniles, larvae, and embryos, the death of which can lead to a decrease in biological re-sources. In this regard, it becomes relevant to study the toxic effects of oil and petroleum products on the growth and development of aquatic organisms. In this regard, amphibians are a convenient model system for assessing the state of both terrestrial and aquatic ecosystems under conditions of anthropo-genic transformation and environmental pollution [4; 5]. For example, marsh frog (Rana ridibunda) and green toad (Bufo viridis) can serve as such ob-
jects, due to the wide distribution in Kazakhstan, including oil-producing regions [6-9].
It is known that the process of growth and develop-ment of vertebrates is controlled by thyroid hormones (TH) secreted by the thyroid gland [10; 11]. TH play a vital regulatory and conservative role in the develop-ment of many body systems of amphibians, like in all other vertebrate classes [12-14]. The main toxic com-ponents of oil, such as naphthenic acids (NA) and poly-cyclic aromatic hydrocarbons (PAHs) negatively affect the functioning of the endocrine system in amphibians. NAs can directly reduce the rate of metamorphosis in X. tropicalis and R. pipiens, and PAHs can significant-ly reduce the rate of metamorphosis in X. laevis [15; 16]. Since the thyroid gland stores produced TH extra-cellularly (in the follicles), changes in the histological structure of the thyroid gland are widely used to evalu-ate TH production during development and metamor-phosis. Numerous studies of ontogenesis and activity of the thyroid gland in amphibians undergoing the process of metamorphosis confirmed the presence of a correlation between the activity of the thyroid gland and the duration of the larval period [11]. Histopatho-logical changes in the thyroid gland are often the most
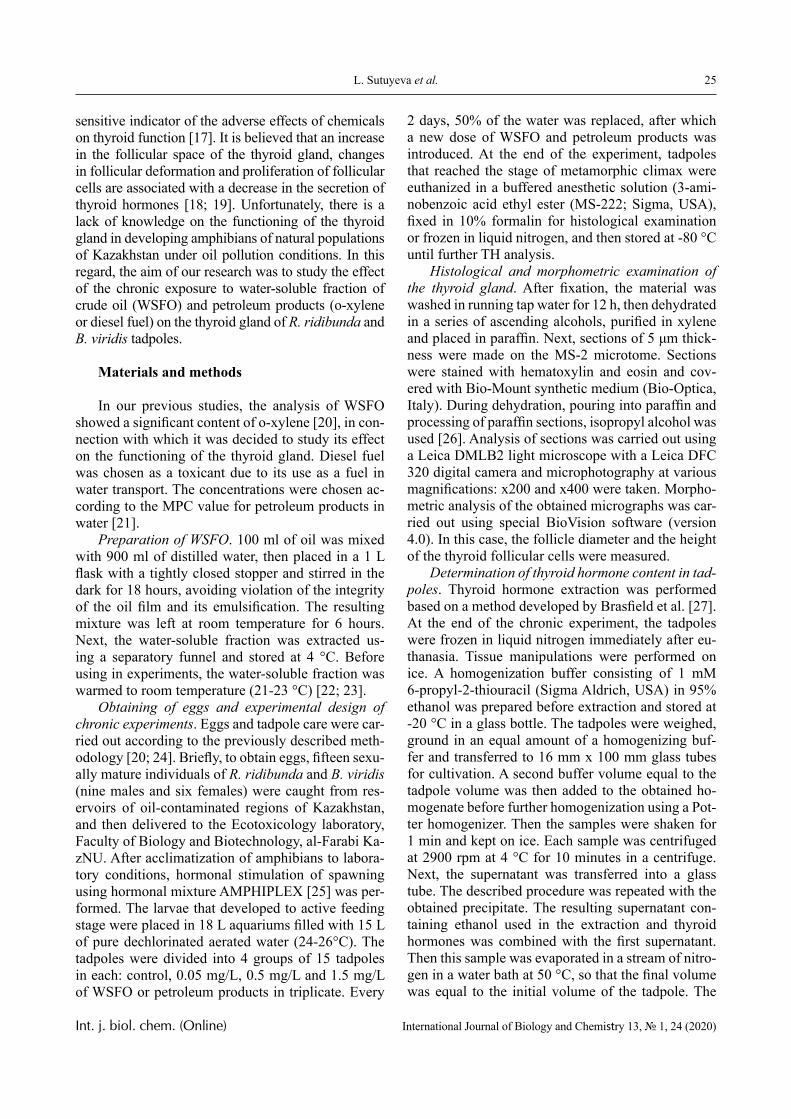
25L. Sutuyeva et al.
Int. j. biol. chem. (Online) International Journal of Biology and Chemistry 13, № 1, 24 (2020)
sensitive indicator of the adverse effects of chemicals on thyroid function [17]. It is believed that an increase in the follicular space of the thyroid gland, changes in follicular deformation and proliferation of follicular cells are associated with a decrease in the secretion of thyroid hormones [18; 19]. Unfortunately, there is a lack of knowledge on the functioning of the thyroid gland in developing amphibians of natural populations of Kazakhstan under oil pollution conditions. In this regard, the aim of our research was to study the effect of the chronic exposure to water-soluble fraction of crude oil (WSFO) and petroleum products (o-xylene or diesel fuel) on the thyroid gland of R. ridibunda and B. viridis tadpoles.
Materials and methods
In our previous studies, the analysis of WSFO showed a significant content of o-xylene [20], in con-nection with which it was decided to study its effect on the functioning of the thyroid gland. Diesel fuel was chosen as a toxicant due to its use as a fuel in water transport. The concentrations were chosen ac-cording to the MPC value for petroleum products in water [21].
Preparation of WSFO. 100 ml of oil was mixed with 900 ml of distilled water, then placed in a 1 L flask with a tightly closed stopper and stirred in the dark for 18 hours, avoiding violation of the integrity of the oil film and its emulsification. The resulting mixture was left at room temperature for 6 hours. Next, the water-soluble fraction was extracted us-ing a separatory funnel and stored at 4 °C. Before using in experiments, the water-soluble fraction was warmed to room temperature (21-23 °C) [22; 23].
Obtaining of eggs and experimental design of chronic experiments. Eggs and tadpole care were car-ried out according to the previously described meth-odology [20; 24]. Briefly, to obtain eggs, fifteen sexu-ally mature individuals of R. ridibunda and B. viridis (nine males and six females) were caught from res-ervoirs of oil-contaminated regions of Kazakhstan, and then delivered to the Ecotoxicology laboratory, Faculty of Biology and Biotechnology, al-Farabi Ka-zNU. After acclimatization of amphibians to labora-tory conditions, hormonal stimulation of spawning using hormonal mixture AMPHIPLEX [25] was per-formed. The larvae that developed to active feeding stage were placed in 18 L aquariums filled with 15 L of pure dechlorinated aerated water (24-26°С). The tadpoles were divided into 4 groups of 15 tadpoles in each: control, 0.05 mg/L, 0.5 mg/L and 1.5 mg/L of WSFO or petroleum products in triplicate. Every
2 days, 50% of the water was replaced, after which a new dose of WSFO and petroleum products was introduced. At the end of the experiment, tadpoles that reached the stage of metamorphic climax were euthanized in a buffered anesthetic solution (3-ami-nobenzoic acid ethyl ester (MS-222; Sigma, USA), fixed in 10% formalin for histological examination or frozen in liquid nitrogen, and then stored at -80 °C until further TH analysis.
Histological and morphometric examination of the thyroid gland. After fixation, the material was washed in running tap water for 12 h, then dehydrated in a series of ascending alcohols, purified in xylene and placed in paraffin. Next, sections of 5 μm thick-ness were made on the MS-2 microtome. Sections were stained with hematoxylin and eosin and cov-ered with Bio-Mount synthetic medium (Bio-Optica, Italy). During dehydration, pouring into paraffin and processing of paraffin sections, isopropyl alcohol was used [26]. Analysis of sections was carried out using a Leica DMLB2 light microscope with a Leica DFC 320 digital camera and microphotography at various magnifications: x200 and x400 were taken. Morpho-metric analysis of the obtained micrographs was car-ried out using special BioVision software (version 4.0). In this case, the follicle diameter and the height of the thyroid follicular cells were measured.
Determination of thyroid hormone content in tad-poles. Thyroid hormone extraction was performed based on a method developed by Brasfield et al. [27]. At the end of the chronic experiment, the tadpoles were frozen in liquid nitrogen immediately after eu-thanasia. Tissue manipulations were performed on ice. A homogenization buffer consisting of 1 mM 6-propyl-2-thiouracil (Sigma Aldrich, USA) in 95% ethanol was prepared before extraction and stored at -20 °C in a glass bottle. The tadpoles were weighed, ground in an equal amount of a homogenizing buf-fer and transferred to 16 mm x 100 mm glass tubes for cultivation. A second buffer volume equal to the tadpole volume was then added to the obtained ho-mogenate before further homogenization using a Pot-ter homogenizer. Then the samples were shaken for 1 min and kept on ice. Each sample was centrifuged at 2900 rpm at 4 °C for 10 minutes in a centrifuge. Next, the supernatant was transferred into a glass tube. The described procedure was repeated with the obtained precipitate. The resulting supernatant con-taining ethanol used in the extraction and thyroid hormones was combined with the first supernatant. Then this sample was evaporated in a stream of nitro-gen in a water bath at 50 °C, so that the final volume was equal to the initial volume of the tadpole. The
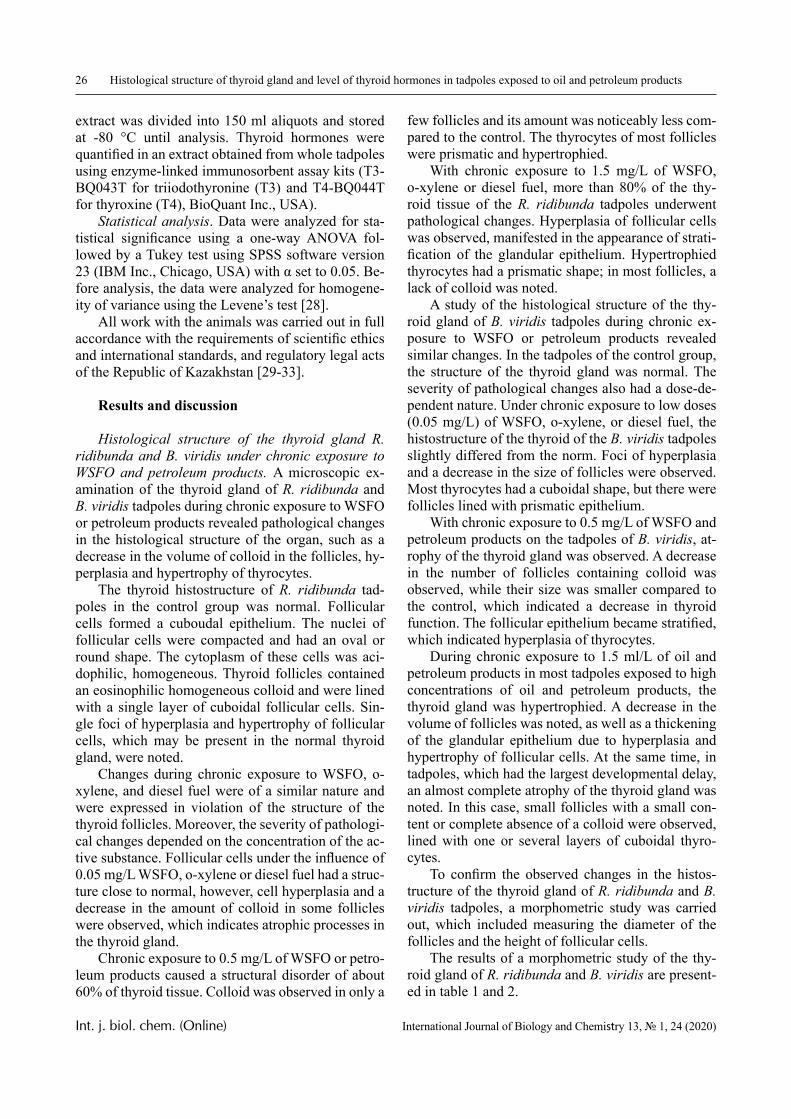
26 Histological structure of thyroid gland and level of thyroid hormones in tadpoles exposed to oil and petroleum products
Int. j. biol. chem. (Online) International Journal of Biology and Chemistry 13, № 1, 24 (2020)
extract was divided into 150 ml aliquots and stored at -80 °C until analysis. Thyroid hormones were quantified in an extract obtained from whole tadpoles using enzyme-linked immunosorbent assay kits (T3-BQ043T for triiodothyronine (T3) and T4-BQ044T for thyroxine (T4), BioQuant Inc., USA).
Statistical analysis. Data were analyzed for sta-tistical significance using a one-way ANOVA fol-lowed by a Tukey test using SPSS software version 23 (IBM Inc., Chicago, USA) with α set to 0.05. Be-fore analysis, the data were analyzed for homogene-ity of variance using the Levene’s test [28].
All work with the animals was carried out in full accordance with the requirements of scientific ethics and international standards, and regulatory legal acts of the Republic of Kazakhstan [29-33].
Results and discussion
Histological structure of the thyroid gland R. ridibunda and B. viridis under chronic exposure to WSFO and petroleum products. A microscopic ex-amination of the thyroid gland of R. ridibunda and B. viridis tadpoles during chronic exposure to WSFO or petroleum products revealed pathological changes in the histological structure of the organ, such as a decrease in the volume of colloid in the follicles, hy-perplasia and hypertrophy of thyrocytes.
The thyroid histostructure of R. ridibunda tad-poles in the control group was normal. Follicular cells formed a cuboudal epithelium. The nuclei of follicular cells were compacted and had an oval or round shape. The cytoplasm of these cells was aci-dophilic, homogeneous. Thyroid follicles contained an eosinophilic homogeneous colloid and were lined with a single layer of cuboidal follicular cells. Sin-gle foci of hyperplasia and hypertrophy of follicular cells, which may be present in the normal thyroid gland, were noted.
Changes during chronic exposure to WSFO, o-xylene, and diesel fuel were of a similar nature and were expressed in violation of the structure of the thyroid follicles. Moreover, the severity of pathologi-cal changes depended on the concentration of the ac-tive substance. Follicular cells under the influence of 0.05 mg/L WSFO, o-xylene or diesel fuel had a struc-ture close to normal, however, cell hyperplasia and a decrease in the amount of colloid in some follicles were observed, which indicates atrophic processes in the thyroid gland.
Chronic exposure to 0.5 mg/L of WSFO or petro-leum products caused a structural disorder of about 60% of thyroid tissue. Colloid was observed in only a
few follicles and its amount was noticeably less com-pared to the control. The thyrocytes of most follicles were prismatic and hypertrophied.
With chronic exposure to 1.5 mg/L of WSFO, o-xylene or diesel fuel, more than 80% of the thy-roid tissue of the R. ridibunda tadpoles underwent pathological changes. Hyperplasia of follicular cells was observed, manifested in the appearance of strati-fication of the glandular epithelium. Hypertrophied thyrocytes had a prismatic shape; in most follicles, a lack of colloid was noted.
A study of the histological structure of the thy-roid gland of B. viridis tadpoles during chronic ex-posure to WSFO or petroleum products revealed similar changes. In the tadpoles of the control group, the structure of the thyroid gland was normal. The severity of pathological changes also had a dose-de-pendent nature. Under chronic exposure to low doses (0.05 mg/L) of WSFO, o-xylene, or diesel fuel, the histostructure of the thyroid of the B. viridis tadpoles slightly differed from the norm. Foci of hyperplasia and a decrease in the size of follicles were observed. Most thyrocytes had a cuboidal shape, but there were follicles lined with prismatic epithelium.
With chronic exposure to 0.5 mg/L of WSFO and petroleum products on the tadpoles of B. viridis, at-rophy of the thyroid gland was observed. A decrease in the number of follicles containing colloid was observed, while their size was smaller compared to the control, which indicated a decrease in thyroid function. The follicular epithelium became stratified, which indicated hyperplasia of thyrocytes.
During chronic exposure to 1.5 ml/L of oil and petroleum products in most tadpoles exposed to high concentrations of oil and petroleum products, the thyroid gland was hypertrophied. A decrease in the volume of follicles was noted, as well as a thickening of the glandular epithelium due to hyperplasia and hypertrophy of follicular cells. At the same time, in tadpoles, which had the largest developmental delay, an almost complete atrophy of the thyroid gland was noted. In this case, small follicles with a small con-tent or complete absence of a colloid were observed, lined with one or several layers of cuboidal thyro-cytes.
To confirm the observed changes in the histos-tructure of the thyroid gland of R. ridibunda and B. viridis tadpoles, a morphometric study was carried out, which included measuring the diameter of the follicles and the height of follicular cells.
The results of a morphometric study of the thy-roid gland of R. ridibunda and B. viridis are present-ed in table 1 and 2.
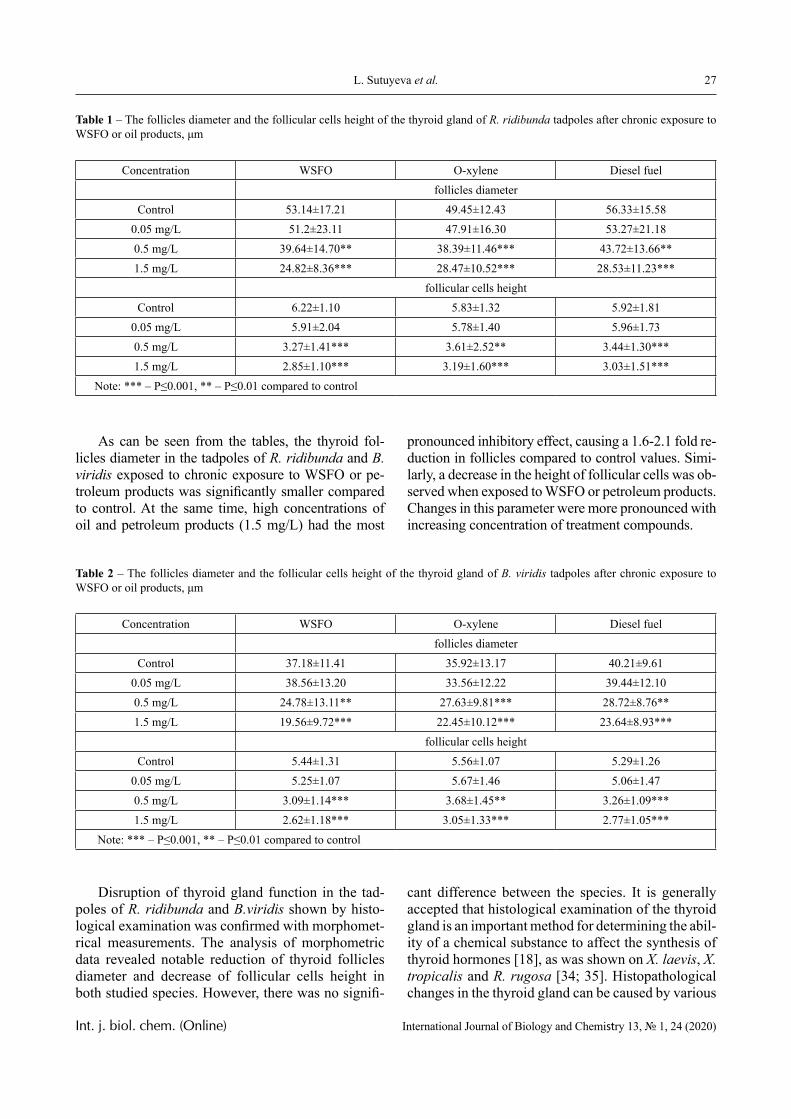
27L. Sutuyeva et al.
Int. j. biol. chem. (Online) International Journal of Biology and Chemistry 13, № 1, 24 (2020)
Table 1 – The follicles diameter and the follicular cells height of the thyroid gland of R. ridibunda tadpoles after chronic exposure to WSFO or oil products, μm
Concentration WSFO O-xylene Diesel fuelfollicles diameter
Control 53.14±17.21 49.45±12.43 56.33±15.580.05 mg/L 51.2±23.11 47.91±16.30 53.27±21.180.5 mg/L 39.64±14.70** 38.39±11.46*** 43.72±13.66**1.5 mg/L 24.82±8.36*** 28.47±10.52*** 28.53±11.23***
follicular cells heightControl 6.22±1.10 5.83±1.32 5.92±1.81
0.05 mg/L 5.91±2.04 5.78±1.40 5.96±1.730.5 mg/L 3.27±1.41*** 3.61±2.52** 3.44±1.30***1.5 mg/L 2.85±1.10*** 3.19±1.60*** 3.03±1.51***
Note: *** – P≤0.001, ** – P≤0.01 compared to control
As can be seen from the tables, the thyroid fol-licles diameter in the tadpoles of R. ridibunda and B. viridis exposed to chronic exposure to WSFO or pe-troleum products was significantly smaller compared to control. At the same time, high concentrations of oil and petroleum products (1.5 mg/L) had the most
pronounced inhibitory effect, causing a 1.6-2.1 fold re-duction in follicles compared to control values. Simi-larly, a decrease in the height of follicular cells was ob-served when exposed to WSFO or petroleum products. Changes in this parameter were more pronounced with increasing concentration of treatment compounds.
Table 2 – The follicles diameter and the follicular cells height of the thyroid gland of B. viridis tadpoles after chronic exposure to WSFO or oil products, μm
Concentration WSFO O-xylene Diesel fuelfollicles diameter
Control 37.18±11.41 35.92±13.17 40.21±9.610.05 mg/L 38.56±13.20 33.56±12.22 39.44±12.100.5 mg/L 24.78±13.11** 27.63±9.81*** 28.72±8.76**1.5 mg/L 19.56±9.72*** 22.45±10.12*** 23.64±8.93***
follicular cells heightControl 5.44±1.31 5.56±1.07 5.29±1.26
0.05 mg/L 5.25±1.07 5.67±1.46 5.06±1.470.5 mg/L 3.09±1.14*** 3.68±1.45** 3.26±1.09***1.5 mg/L 2.62±1.18*** 3.05±1.33*** 2.77±1.05***
Note: *** – P≤0.001, ** – P≤0.01 compared to control
Disruption of thyroid gland function in the tad-poles of R. ridibunda and B.viridis shown by histo-logical examination was confirmed with morphomet-rical measurements. The analysis of morphometric data revealed notable reduction of thyroid follicles diameter and decrease of follicular cells height in both studied species. However, there was no signifi-
cant difference between the species. It is generally accepted that histological examination of the thyroid gland is an important method for determining the abil-ity of a chemical substance to affect the synthesis of thyroid hormones [18], as was shown on X. laevis, X. tropicalis and R. rugosa [34; 35]. Histopathological changes in the thyroid gland can be caused by various
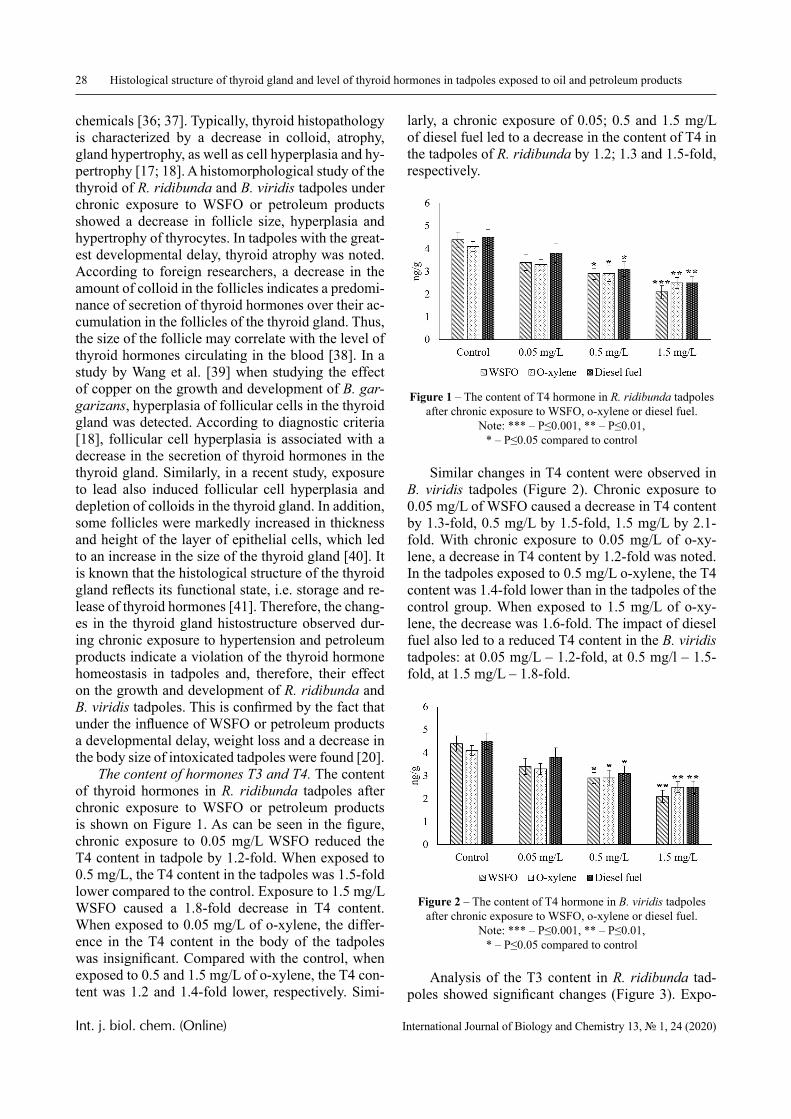
28 Histological structure of thyroid gland and level of thyroid hormones in tadpoles exposed to oil and petroleum products
Int. j. biol. chem. (Online) International Journal of Biology and Chemistry 13, № 1, 24 (2020)
chemicals [36; 37]. Typically, thyroid histopathology is characterized by a decrease in colloid, atrophy, gland hypertrophy, as well as cell hyperplasia and hy-pertrophy [17; 18]. A histomorphological study of the thyroid of R. ridibunda and B. viridis tadpoles under chronic exposure to WSFO or petroleum products showed a decrease in follicle size, hyperplasia and hypertrophy of thyrocytes. In tadpoles with the great-est developmental delay, thyroid atrophy was noted. According to foreign researchers, a decrease in the amount of colloid in the follicles indicates a predomi-nance of secretion of thyroid hormones over their ac-cumulation in the follicles of the thyroid gland. Thus, the size of the follicle may correlate with the level of thyroid hormones circulating in the blood [38]. In a study by Wang et al. [39] when studying the effect of copper on the growth and development of B. gar-garizans, hyperplasia of follicular cells in the thyroid gland was detected. According to diagnostic criteria [18], follicular cell hyperplasia is associated with a decrease in the secretion of thyroid hormones in the thyroid gland. Similarly, in a recent study, exposure to lead also induced follicular cell hyperplasia and depletion of colloids in the thyroid gland. In addition, some follicles were markedly increased in thickness and height of the layer of epithelial cells, which led to an increase in the size of the thyroid gland [40]. It is known that the histological structure of the thyroid gland reflects its functional state, i.e. storage and re-lease of thyroid hormones [41]. Therefore, the chang-es in the thyroid gland histostructure observed dur-ing chronic exposure to hypertension and petroleum products indicate a violation of the thyroid hormone homeostasis in tadpoles and, therefore, their effect on the growth and development of R. ridibunda and B. viridis tadpoles. This is confirmed by the fact that under the influence of WSFO or petroleum products a developmental delay, weight loss and a decrease in the body size of intoxicated tadpoles were found [20].
The content of hormones T3 and T4. The content of thyroid hormones in R. ridibunda tadpoles after chronic exposure to WSFO or petroleum products is shown on Figure 1. As can be seen in the figure, chronic exposure to 0.05 mg/L WSFO reduced the T4 content in tadpole by 1.2-fold. When exposed to 0.5 mg/L, the T4 content in the tadpoles was 1.5-fold lower compared to the control. Exposure to 1.5 mg/L WSFO caused a 1.8-fold decrease in T4 content. When exposed to 0.05 mg/L of o-xylene, the differ-ence in the T4 content in the body of the tadpoles was insignificant. Compared with the control, when exposed to 0.5 and 1.5 mg/L of o-xylene, the T4 con-tent was 1.2 and 1.4-fold lower, respectively. Simi-
larly, a chronic exposure of 0.05; 0.5 and 1.5 mg/L of diesel fuel led to a decrease in the content of T4 in the tadpoles of R. ridibunda by 1.2; 1.3 and 1.5-fold, respectively.
Figure 1 – The content of T4 hormone in R. ridibunda tadpoles after chronic exposure to WSFO, o-xylene or diesel fuel.
Note: *** – P≤0.001, ** – P≤0.01, * – P≤0.05 compared to control
Similar changes in T4 content were observed in B. viridis tadpoles (Figure 2). Chronic exposure to 0.05 mg/L of WSFO caused a decrease in T4 content by 1.3-fold, 0.5 mg/L by 1.5-fold, 1.5 mg/L by 2.1-fold. With chronic exposure to 0.05 mg/L of o-xy-lene, a decrease in T4 content by 1.2-fold was noted. In the tadpoles exposed to 0.5 mg/L o-xylene, the T4 content was 1.4-fold lower than in the tadpoles of the control group. When exposed to 1.5 mg/L of o-xy-lene, the decrease was 1.6-fold. The impact of diesel fuel also led to a reduced T4 content in the B. viridis tadpoles: at 0.05 mg/L – 1.2-fold, at 0.5 mg/l – 1.5-fold, at 1.5 mg/L – 1.8-fold.
Figure 2 – The content of T4 hormone in B. viridis tadpoles after chronic exposure to WSFO, o-xylene or diesel fuel.
Note: *** – P≤0.001, ** – P≤0.01, * – P≤0.05 compared to control
Analysis of the T3 content in R. ridibunda tad-poles showed significant changes (Figure 3). Expo-
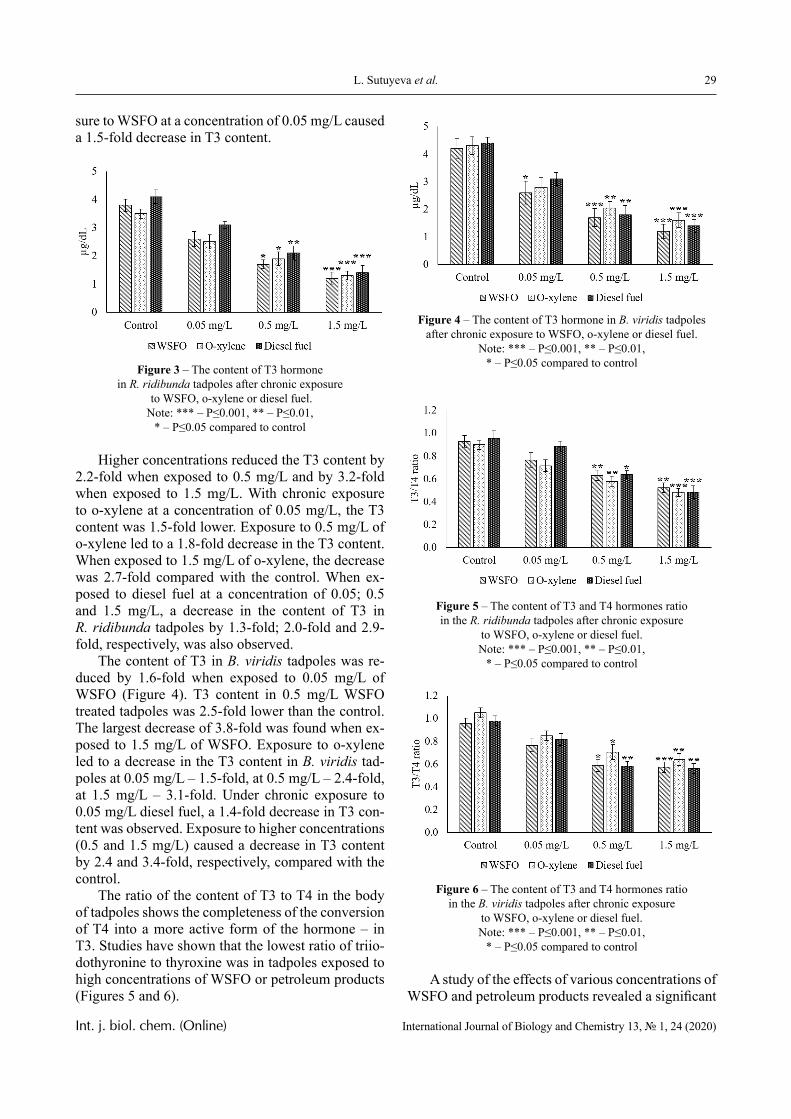
29L. Sutuyeva et al.
Int. j. biol. chem. (Online) International Journal of Biology and Chemistry 13, № 1, 24 (2020)
sure to WSFO at a concentration of 0.05 mg/L caused a 1.5-fold decrease in T3 content.
Figure 3 – The content of T3 hormone in R. ridibunda tadpoles after chronic exposure
to WSFO, o-xylene or diesel fuel. Note: *** – P≤0.001, ** – P≤0.01,
* – P≤0.05 compared to control
Higher concentrations reduced the T3 content by 2.2-fold when exposed to 0.5 mg/L and by 3.2-fold when exposed to 1.5 mg/L. With chronic exposure to o-xylene at a concentration of 0.05 mg/L, the T3 content was 1.5-fold lower. Exposure to 0.5 mg/L of o-xylene led to a 1.8-fold decrease in the T3 content. When exposed to 1.5 mg/L of o-xylene, the decrease was 2.7-fold compared with the control. When ex-posed to diesel fuel at a concentration of 0.05; 0.5 and 1.5 mg/L, a decrease in the content of T3 in R. ridibunda tadpoles by 1.3-fold; 2.0-fold and 2.9-fold, respectively, was also observed.
The content of T3 in B. viridis tadpoles was re-duced by 1.6-fold when exposed to 0.05 mg/L of WSFO (Figure 4). T3 content in 0.5 mg/L WSFO treated tadpoles was 2.5-fold lower than the control. The largest decrease of 3.8-fold was found when ex-posed to 1.5 mg/L of WSFO. Exposure to o-xylene led to a decrease in the T3 content in B. viridis tad-poles at 0.05 mg/L – 1.5-fold, at 0.5 mg/L – 2.4-fold, at 1.5 mg/L – 3.1-fold. Under chronic exposure to 0.05 mg/L diesel fuel, a 1.4-fold decrease in T3 con-tent was observed. Exposure to higher concentrations (0.5 and 1.5 mg/L) caused a decrease in T3 content by 2.4 and 3.4-fold, respectively, compared with the control.
The ratio of the content of T3 to T4 in the body of tadpoles shows the completeness of the conversion of T4 into a more active form of the hormone – in T3. Studies have shown that the lowest ratio of triio-dothyronine to thyroxine was in tadpoles exposed to high concentrations of WSFO or petroleum products (Figures 5 and 6).
Figure 4 – The content of T3 hormone in B. viridis tadpoles after chronic exposure to WSFO, o-xylene or diesel fuel.
Note: *** – P≤0.001, ** – P≤0.01, * – P≤0.05 compared to control
Figure 5 – The content of T3 and T4 hormones ratio in the R. ridibunda tadpoles after chronic exposure
to WSFO, o-xylene or diesel fuel. Note: *** – P≤0.001, ** – P≤0.01,
* – P≤0.05 compared to control
Figure 6 – The content of T3 and T4 hormones ratio in the B. viridis tadpoles after chronic exposure
to WSFO, o-xylene or diesel fuel. Note: *** – P≤0.001, ** – P≤0.01,
* – P≤0.05 compared to control
A study of the effects of various concentrations of WSFO and petroleum products revealed a significant
30 Histological structure of thyroid gland and level of thyroid hormones in tadpoles exposed to oil and petroleum products
Int. j. biol. chem. (Online) International Journal of Biology and Chemistry 13, № 1, 24 (2020)
decrease in the content of T3 and T4 in R. ridibun-da and B. viridis tadpoles compared to the control. The T3:T4 ratio, which reflects the rate of conver-sion of T4 to T3 [42], was the lowest among tadpoles exposed to high concentrations of WSFO or petro-leum products. A lower T3: T4 ratio in tadpoles from groups exposed to 0.5 and 1.5 mg/L of WSFO or pe-troleum products may result from changes in the nor-mal physiology of tadpoles by contaminants. Similar to the changes in histostructure of thyroid gland, dif-ference in alteration of T3 and T4 levels between R. ridibunda and B. viridis tadpoles was insignificant.
Two possible normal physiological phenomena that pollutants might have acted, as Shi [12] suggest-ed, are the incomplete conversion of all T4 to T3, as well as the conversion of T3 to reverse T3 (rT3) by the enzyme deiodinase 3. Both of these processes can lead to decrease in the concentration of T3 in rela-tion to T4. These changes in the functional state of the thyroid gland are probably responsible for the delay in the metamorphosis of the tadpoles. An im-paired metabolism of thyroid hormones can have other consequences for frogs, since thyroid hormones are necessary for normal, competent immunological function and growth, along with other metabolic pro-cesses. Thyroid hormones have similar functions in a large number of vertebrates, including regulation of growth and development. Thyroid hormones are crucial for amphibian metamorphosis [12] and have complex functions that control multiple events, such as tail resorption and development of the forelimbs. Metamorphosis changes in the absence of normal levels of thyroid hormones, although stopped meta-morphosis can be resumed if thyroid hormones are introduced [43]. The endocrine destructive potential of these compounds is apparently quite stable in the environment since the ratio of T3/T4 changed sig-nificantly in the tadpoles of R. sylvatica exposed to water from ponds of wetlands located near reclaimed oil sands, and also changed the rate of metamorpho-sis depending on the age of the reclaimed wetlands [44]. Thus, it was shown that the study of histological structure and hormones of thyroid gland in tadpoles of amphibians may serve as an informative indicator of petroleum contamination.
Conclusion
Our results indicate a violation of the thyroid gland of the tadpoles of anuran amphibians in oil pol-lution conditions. Hypertrophy and hyperplasia of follicular cells, as well as a decrease in the volume of colloid in the follicles, found in the thyroid gland his-
tostructure of the tadpoles of amphibians, representa-tives of natural populations of Kazakhstan, indicate a violation of its function and TH homeostasis. As a result of the study, it was found that during chronic exposure to the water-soluble fraction of crude oil or petroleum products (o-xylene, diesel fuel), the con-tent of triiodothyronine and thyroxine in the tadpoles of R. ridibunda and B. viridis decreases, which also indicates a suppression of thyroid function.
Acknowledgments
This work was carried out within the framework of the project 4927/GF4 “Toxic-ecological study of the environmental state of oil producing regions of Kazakhstan and assessment of environmen-tal risk of oil exposure”, state registration number 0115РК00381.
References
1 Environment and sustainable development in Kazakhstan. Overview. UNDP Kazakhstan Publica-tion Series No UNDPKAZ 06 (2004) [Okruzhajush-haja sreda i ustojchivoe razvitie v Kazahstane. Obzor. Serija publikacij PROON Kazahstan. No UNDPKAZ 06], Almaty, 210 p.
2 Askarova M.A., and Mussagaliyeva A.N. (2014). The ecological situation in contaminated ar-eas of oil and gas exploration in Atyrau region. Pro-cedia. Social. Behav. Sci., vol. 120, pp. 455–459. https://doi.org/10.1016/j.sbspro.2014.02.124.
3 Wake H. (2005). Oil refineries: a review of their ecological impacts on the aquatic environ-ment. Estuar. Coast. Shelf Sci., vol. 62, pp. 131–140. https://doi.org/10.1016/j.ecss.2004.08.013.
4 ENSR International (2004) Development of a standartized approach for assessing potential risks to amphibians exposed to sediment and hydric soils, ANSI Std., Z39.18.
5 Duellman, W. E., Trueb L. (1994). Biology of amphibians. London: John Hopkins University Press, 325 р. ISBN 978-0801847806.
6 Duysebaeva T.N., Berezovikov N.N., Brush-ko Z.K., Kubykin R.A., Khromov V.A. (2005). Marsh frog (Rana Ridibunda Pallas, 1771) in Kazakhstan: Range changing and recent distribution [Ozernaja lja-gushka (Rana ridibunda Pallas 1771) v Kazahstane: izmenenie areala v HH stoletii i sovremennoe raspros-tranenie vida], Contemp. Herpetol, vol. 3, pp. 29–59.
7 Duisebaeva T.N., Chirikova M.A., Winter Yu.A., Belyalov O.V., Kovalenke A.V. (2010) New data on the distribution of amphibians and reptiles in
31L. Sutuyeva et al.
Int. j. biol. chem. (Online) International Journal of Biology and Chemistry 13, № 1, 24 (2020)
Kazakhstan: a review of the first decade of the 21st century [Novye dannye po rasprostraneniju amfibij i reptilij v Kazahstane: obzor po pervomu desjatilet-iju XXI vek]. Herpetological studies in Kazakhstan and in neighboring countries. Collection of articles dedicated to the memory of Paraskiv K.P., Almaty, pp. 84-99.
8 Duisebaeva T.N. (2012) Overview of the fauna of amphibians and reptiles of the Mangistau region [Obzor fauny amfibij i reptilij Mangistauskoj oblasti], Selevinia. vol. 20, pp. 59-65.
9 Kubykin R.A., Plakhov K.N. (2012) About the fauna of amphibians and reptiles of the Aral-Cas-pian watershed (based on the materials of expeditions of R. A. Kubykin in 1989-1990) [Kubykin R.A., Pla-hov K.N. O faune amfibij i reptilij Aralo-Kaspijskogo vodorazdela (po materialam jekspedicij R.A. Kubyki-na v 1989-1990 gg.)], Selevinia, vol. 20, pp. 66-76.
10 Yen P. (2001) Physiological and molecu-lar basis of thyroid hormone action. Physiol. Rev., vol. 81, no. 3, pp. 1097–1142. https://doi.org/10.1152/physrev.2001.81.3.1097.
11 Brown D, Cai L. (2007). Amphibian meta-morphosis. Dev. Biol., vol. 306, no. 1, pp. 20–33. https://doi.org/10.1016/j.ydbio.2007.03.021.
12 Shi Y. (2000). Amphibian Metamorphosis: From Morphology to Molecular Biology, New York: John Wiley & Sons, 288 p. ISBN 978-3540278931.
13 Power D., Llewellyn L., Faustino M., Now-ell M., Bjornsson B., Einarsdottir I., Canario A., Sweeney G. (2001). Thyroid hormones in growth and development of fish. Comp. Biochem. Physiol., vol. 130, no. 4, pp. 447–459. https://doi.org/10.1016/s1532-0456(01)00271-x.
14 McNabb F. (1989). Development and ag-ing of the thyroid in homeotherms. In: “Develop-ment, maturation and senescence of neuroendocrine systems: a comparative approach, (Schreibman M, Scanes C. eds)”. New York: Academic Press, pp. 333–352.
15 Melvin S. D., Trudeau V. L. (2012). Growth, development and incidence of deformities in amphib-ian larvae exposed as embryos to naphthenic acid concentrations detected in the Canadian oil sands region. Environmental Pollution, vol. 167, pp. 178-183. https://doi.org/10.1016/j.envpol.2012.04.002.
16 Bryer P.J., Elliott J.N., Willingham E.J. (2006). The effects of coal tar based pavement seal-er on amphibian development and metamorphosis. Ecotoxicology, vol. 15, pp. 241–247. https://doi.org/10.1007/s10646-005-0055-z.
17 Miyata K., Ose K. (2012). Thyroid hormone-disrupting effects and the amphibian metamorphosis
assay. J. Toxicol. Pathol., vol. 25, pp. 1–9. https://doi.org/10.1293/tox.25.1.
18 Grim K.C., Wolfe M., Braunbeck T., Iguchi T., Ohta Y., Tooi O., Touart L., Wolf D.C., Tietge J. (2009). Thyroid histopathology assessments for the amphibian metamorphosis assay to detect thyroid-active substances. Toxicol. Pathol., vol. 37, pp. 415–424. https://doi.org/10.1177/0192623309335063.
19 Tebourbi O., Sakly M., Rhouma K.B. (2010). Subacute toxicity of p, p′-DDT on rat thyroid: hor-monal and histopathological changes. Environ. Toxi-col. Pharmacol., vol. 29, pp. 271–279. https://doi.org/10.1186/s12958-017-0259-0.
20 Sutuyeva L., Trudeau V., Shalakhmetova T. (2019). Mortality of Embryos, Developmental Dis-orders and Changes in Biochemical Parameters in Marsh Frog (Rana ridibunda) Tadpoles Exposed to the Water-Soluble Fraction of Kazakhstan Crude Oil and O-Xylene. Journal of Toxicology and Environ-mental Health, Part A, vol. 82, no. 3, pp. 200-215. https://doi.org/0.1080/15287394.2019.1576562.
21 Gorchev H. G., Ozolins G. (2011). WHO Guidelines for drinking-water quality. WHO Chron., vol. 38, pp. 104–108. https://doi.org/10.1016/S1462-0758(00)00006-6.
22 Anderson J. W., Neff J. M., Cox B. A., Ta-tem H. B., Hightower G. M. (1974). Characteristics of dispersions and water soluble extracts of crude and refined oils and their toxicity to estuarine crustaceans and fish. Mar. Biol., vol. 27, pp. 75-88.
23 Singer M. M., Aurand D., Bragin G. E., Clark J. R., Coelho G. M., Sowby M. L., Tjeerde-ma R. S. (2000). Standardization of the preparation and quantitation of water-accommodated fractions of petroleum for toxicity testing. Mar. Pollut. Bull., vol. 40, pp. 1007–1016. https://doi.org/10.1016/S0025-326X(00)00045-X.
24 Sutuyeva L.R., Shalakhmetova T.M. (2019) Morphological Deformities of Green Toad (Bufo viridis) Tadpoles Caused by Petroleum Products. Bulletin of L.N. Gumilyov ENU. Biological Sci-ences series, vol. 128, no. 3, pp. 100-118. https://doi.org/10.32523/2616-7034-2019-128-3-100-110.
25 Trudeau V. L., Somoza G. M., Natale G. S., Pauli B., Wignall J., Jackman P., Doe K., Schueler F. W. (2010). Hormonal induction of spawning in 4 spe-cies of frogs by coinjection with a gonadotropin-re-leasing hormone agonist and a dopamine antagonist. Reprod. Biol. Endocrinol., vol. 8, pp. 2–10. https://doi.org/10.1186/1477-7827-8-36.
26 Viktorov I.V., Proshin S.S. (2003). The use of isopropyl alcohol in histological methods: dehy-dration and filling of fabric in paraffin, processing
32 Histological structure of thyroid gland and level of thyroid hormones in tadpoles exposed to oil and petroleum products
Int. j. biol. chem. (Online) International Journal of Biology and Chemistry 13, № 1, 24 (2020)
of paraffin wax [Primenenie izopropilovogo spirta v gistologicheskih metodah: obezvozhivanie i zalivka tkani v parafin, obrabotka parafinovyh srezov], Bu-lentinum, no. 7, pp. 119–120.
27 Brasfield S.M., Bradham K., Wells J.B., Talent L.G., Lanno R.P., Janz D.M. (2004). Devel-opment of a terrestrial vertebrate model for assess-ing bioavailability of cadmium in the fence lizard (Sceloporus undulatus) and in ovo effects on hatch-ling size and thyroid function. Chemosphere, vol. 54, pp. 1643-1651. https://doi.org/10.1016/j.chemo-sphere.2003.09.030.
28 Levene H. (1960). In Contributions to Prob-ability and Statistics: Essays in Honor of Harold Ho-telling, I. Olkin et al. eds., Stanford University Press, pp. 278-292.
29 Bayne K, Bayvel D, MacArthur Clark J, De-mers G, Joubert C, Kurosawa TM, Rivera E, Souilem O, Turner PV. (2011). Harmonizing veterinary train-ing and qualifications in laboratory animal medicine: a global perspective. ILAR J., vol. 52, pp. 393–403. https://doi.org/10.1093/ilar.52.3.393.
30 Council for International Organizations of Medical Sciences and International Council for Lab-oratory Animal Science. (2012). International guid-ing principles for biomedical research involving ani-mals, 4 p.
31 Demers G, Brown M, Gauthier C, Rozmi-arek H, Griffin G, Bedard M. (2013). International harmonization of guidance on the ethical review of proposals for the use of animals, and on the education and training of animal users in science. STAL, vol. 38, pp. 73–79.
32 Sanitary and epidemiological requirements for laboratories. (2012) Decree of the Government of the Republic of Kazakhstan No. 13 from January 10, 2012 [Sanitarno-jepidemiologicheskie trebovanija k laboratorijam].
33 Sarymsakova B.E., Rozenson R.I., Battako-va J.E. (2007) Guidelines for research ethics: (guide-lines) [Rukovodstvo po jetike nauchnyh issledovanij: (metodicheskie rekomendacii)], Astana, 98 p.
34 OECD (2007). Guidance document on am-phibian thyroid histology. In: Series for Testing and Assessment, Environmental Health and Safety Publi-cations. OECD, Paris, France.
35 Oka T., Miyahara M., Yamamoto J., Mit-sui N., Fujii T., Tooi O., Kashiwagi K., Takase M., Kashiwagi A., Iguchi T. (2009). Application of meta-morphosis assay to a native japanese amphibian spe-cies, Rana rugosa, for assessing effects of thyroid sys-tem affecting chemicals. Ecotoxicol. Environ. Saf., vol. 72, pp. 1400–1405. https://doi.org/10.1016/j.ecoenv.2009.03.012.
36 Helbing C.C., Ovaska K., Ji L. (2006). Evaluation of the effect of acetochlor on thyroid hor-mone receptor gene expression in the brain and be-havior of Rana catesbeiana tadpoles. Aquat Toxicol., vol. 80, pp. 42–51. https://doi.org/10.1016/j.aqua-tox.2006.07.011.
37 Croteau M.C., Davidson M., Duarte-Guter-man P., Wade M., Popesku J.T., Wiens S., Lean D.R., Trudeau V.L. (2009). Assessment of thyroid system disruption in Rana pipiens tadpoles chroni-cally exposed to UVB radiation and 4-tert-octylphe-nol. Aquat Toxicol., vol. 95, pp. 81–92. https://doi.org/10.1016/j.aquatox.2009.05.013.
38 Chai L., Wang H., Deng H., Zhao H., Wang W. (2014) Chronic exposure effects of copper on growth, metamorphosis and thyroid gland, liver health in Chinese toad, Bufo gargarizans tadpoles. Chemistry and Ecology, vol. 30, no. 7, pp. 589-601, https://doi.org/10.1080/02757540.2014.894985.
39 Wang C., Liang G., Chai L., Wang H. (2016). Effects of copper on growth, metamorphosis and endocrine disruption of Bufo gargarizans larvae. Aquatic Toxicology, vol. 170, pp. 24–30. https://doi.org/10.1016/j.aquatox.2015.10.023.
40 Yang H., Liu R., Liang Z., Zheng R., Yang Y., Chai L., Wang H. (2019). Chronic effects of lead on metamorphosis, development of thyroid gland, and skeletal ossification in Bufo gargarizans. Chemo-sphere, vol. 236, pp 1242-1251. doi.org/10.1016/j.chemosphere.2019.06.221.
41 Opitz R., Hartmann S., Blank T., Braunbeck T., Lutz I., Kloas W. (2006). Evaluation of histologi-cal and molecular endpoints for enhanced detection of thyroid system disruption in Xenopus laevis tad-poles. Toxicol. Sci., vol. 90, pp. 337-348. https://doi.org/10.1093/toxsci/kfj083.
42 Picard-Aitken M., Fournier H., Pariseau R., Marcogliese D.J., Cyr D.G. (2007). Thyroid disruption in walleye (Sander vitreus) exposed to environmental contaminants: cloning and use of io-dothyronine deiodinases as molecular biomarkers. Aquat. Toxicol., vol. 83, pp. 200-211. https://doi.org/10.1016/j.aquatox.2007.04.004.
43 Rot-Nikcevic I., Wassersug R.J. (2004) Ar-rested development in Xenopus laevis tadpoles: how size constrains metamorphosis. The Journal of Ex-perimental Biology, vol. 207, pp. 2133-2145. https://doi.org/10.1242/jeb.01002
44 Hersikorn B.D., Smits J.E.G. (2011). Com-promised metamorphosis and thyroid hormone changes in wood frogs (Lithobates sylvaticus) raised on reclaimed wetlands on the Athabasca oil sands. Environ. Pollut., vol. 159, pp. 596–601. https://doi.org/10.1016/j.envpol.2010.10.005.
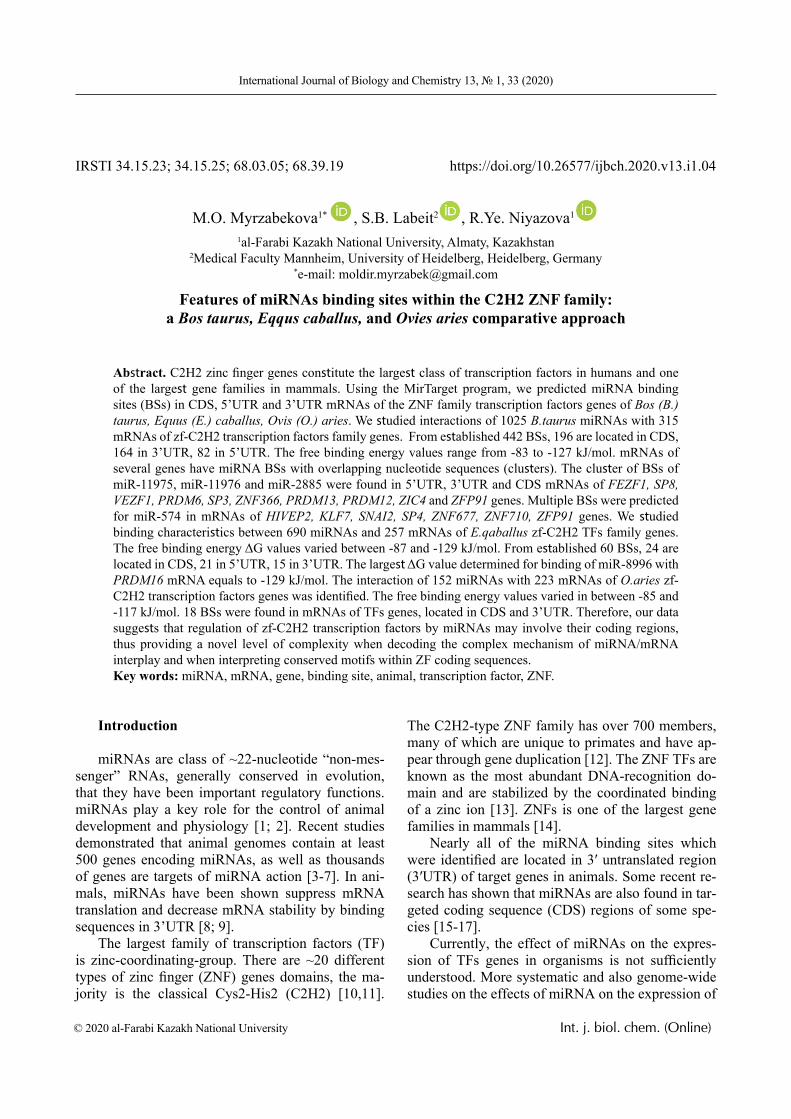
© 2020 al-Farabi Kazakh National University Int. j. biol. chem. (Online)
International Journal of Biology and Chemistry 13, № 1, 33 (2020)
IRSTI 34.15.23; 34.15.25; 68.03.05; 68.39.19 https://doi.org/10.26577/ijbch.2020.v13.i1.04
М.О. Мyrzabekova1* , S.B. Labeit2 , R.Ye. Niyazova1
1al-Farabi Kazakh National University, Almaty, Kazakhstan 2Medical Faculty Mannheim, University of Heidelberg, Heidelberg, Germany
*e-mail: [email protected]
Features of miRNAs binding sites within the C2H2 ZNF family: а Bos taurus, Eqqus caballus, and Ovies aries comparative approach
Abstract. C2H2 zinc finger genes constitute the largest class of transcription factors in humans and one of the largest gene families in mammals. Using the MirTarget program, we predicted miRNA binding sites (BSs) in CDS, 5’UTR and 3’UTR mRNAs of the ZNF family transcription factors genes of Bos (B.) taurus, Equus (E.) caballus, Ovis (O.) aries. We studied interactions of 1025 B.taurus miRNAs with 315 mRNAs of zf-C2H2 transcription factors family genes. From established 442 BSs, 196 are located in CDS, 164 in 3’UTR, 82 in 5’UTR. The free binding energy values range from -83 to -127 kJ/mol. mRNAs of several genes have miRNA BSs with overlapping nucleotide sequences (clusters). The cluster of BSs of miR-11975, miR-11976 and miR-2885 were found in 5’UTR, 3’UTR and CDS mRNAs of FEZF1, SP8, VEZF1, PRDM6, SP3, ZNF366, PRDM13, PRDM12, ZIC4 and ZFP91 genes. Multiple BSs were predicted for miR-574 in mRNAs of HIVEP2, KLF7, SNAI2, SP4, ZNF677, ZNF710, ZFP91 genes. We studied binding characteristics between 690 miRNAs and 257 mRNAs of E.qaballus zf-C2H2 TFs family genes. The free binding energy ΔG values varied between -87 and -129 kJ/mol. From established 60 BSs, 24 are located in CDS, 21 in 5’UTR, 15 in 3’UTR. The largest ΔG value determined for binding of miR-8996 with PRDM16 mRNA equals to -129 kJ/mol. The interaction of 152 miRNAs with 223 mRNAs of O.aries zf-C2H2 transcription factors genes was identified. The free binding energy values varied in between -85 and -117 kJ/mol. 18 BSs were found in mRNAs of TFs genes, located in CDS and 3’UTR. Therefore, our data suggests that regulation of zf-C2H2 transcription factors by miRNAs may involve their coding regions, thus providing a novel level of complexity when decoding the complex mechanism of miRNA/mRNA interplay and when interpreting conserved motifs within ZF coding sequences. Key words: miRNA, mRNA, gene, binding site, animal, transcription factor, ZNF.
Introduction
miRNAs are class of ~22-nucleotide “non-mes-senger” RNAs, generally conserved in evolution, that they have been important regulatory functions. miRNAs play a key role for the control of animal development and physiology [1; 2]. Recent studies demonstrated that animal genomes contain at least 500 genes encoding miRNAs, as well as thousands of genes are targets of miRNA action [3-7]. In ani-mals, miRNAs have been shown suppress mRNA translation and decrease mRNA stability by binding sequences in 3’UTR [8; 9].
The largest family of transcription factors (TF) is zinc-coordinating-group. There are ~20 different types of zinc finger (ZNF) genes domains, the ma-jority is the classical Cys2-His2 (C2H2) [10,11].
The C2H2-type ZNF family has over 700 members, many of which are unique to primates and have ap-pear through gene duplication [12]. The ZNF TFs are known as the most abundant DNA-recognition do-main and are stabilized by the coordinated binding of a zinc ion [13]. ZNFs is one of the largest gene families in mammals [14].
Nearly all of the miRNA binding sites which were identified are located in 3′ untranslated region (3′UTR) of target genes in animals. Some recent re-search has shown that miRNAs are also found in tar-geted coding sequence (CDS) regions of some spe-cies [15-17].
Currently, the effect of miRNAs on the expres-sion of TFs genes in organisms is not sufficiently understood. More systematic and also genome-wide studies on the effects of miRNA on the expression of
34 Features of miRNAs binding sites within the C2H2 ZNF family: a Bos taurus, Eqqus caballus, and Ovies aries...
Int. j. biol. chem. (Online) International Journal of Biology and Chemistry 13, № 1, 33 (2020)
transcription factors are currently a topical research theme. For example, the effects of miRNAs on ani-mal gene expression of MYB TFs have been reported in [18]. In this study, we systematically studied miR-NA binding motifs in all known C2H2 ZNFs genes, including comparisons of their conservation in three different mammalian species. Surprisingly, our re-sults indicate that mRNA regulation may predomi-nantly involve the ZF coding regions.
Materials and methods
Nucleotide sequences of zf-C2H2 family TFs genes of B. taurus, E. caballus and O. aries mRNAs were downloaded from Animal Transcrip-tion Factor Database (http://www.bioguo.org/Ani-mal TFDB/). Nucleotide sequences of miRNAs were downloaded from miRBase database (http://mirbase.org). The search for binding sites (BSs) of miRNAs in mRNAs of target genes was performed using the MirTarget program [19]. This program defines the following features of binding: a) the start of the ini-tiation of miRNA binding to mRNAs; b) the local-ization of miRNA binding sites in 5’-untranslated regions (5’UTR), CDS and 3’UTR of mRNAs; c) the free energy of interaction miRNA and mRNA (∆G, kJ/mol); and d) schemes of nucleotide interac-tions between miRNAs and mRNAs. The ratio ΔG/ΔGm (%) was determined for each site (ΔGm equals the free energy of miRNA binding with its perfect complementary nucleotide sequence). ΔG/ΔGm ra-tios were taken on the assumption that the members of miRNA family generally differ by no more than 1-2 nt; with a miRNA length of 22 nt, ΔG/ΔGm value is higher than 90%. With a larger difference in the
number of mismatched nucleotides, the probability of two or more miRNAs to bind in one site increases. With a larger difference in the number of mismatched nucleotides, the probability of two or more miRNAs to bind in one site increases, which excludes the nat-ural property of miRNA to interact selectively with mRNA of target gene. The MirTarget program iden-tifies the positions of BSs on mRNA, beginning from the first nucleotide of mRNA’s 5’UTR. The MirTar-get program finds hydrogen bonds between adenine (A) and uracil (U), guanine (G) and cytosine (C), G and U, A and C. The distances between A and C are equal to those between G and C, A and U, G and U and equal to 1.02 nm [20]. G-C, A-U, G-U and A-C interactions form 3, 2, 1 and 1 hydrogen bonds. The miRNA binding sites for mRNA were taken with ∆G/∆Gm ratios equal and more than 85%.
Results and discussion
Characteristics of miRNAs binding to mRNAs of Bos taurus zf-C2H2 transcription factors genes. We studied interactions of 1025 B. taurus miRNAs with 315 mRNAs of zf-C2H2 transcription factors fam-ily genes. We established 442 binding sites: 196 are located in CDS, 164 in 3’UTR, 82 in 5’UTR. The free binding energy (ΔG) values ranged from -83 to – 127 kJ/mol. mRNAs of several genes have miRNA binding sites with overlapping nucleotide sequences (clusters) located in 5’UTR, CDS, or 3’UTR.
Table 1 presents results of the prediction of characteristics of miRNAs binding with mRNAs of BCL11B, PRDM2, RREB1, SP4, ZNF628, ZNF710, ZNF142, ZNF236, ZNF687, ZNF652, ZNF467, ZFP91 genes.
Table 1 – Characteristics of miRNAs binding to mRNAs of B. taurus zf-C2H2 transcription factors genes
Gene bta-miRNA Start of site, nt Regionof mRNA ΔG, kJ/mol ∆G/∆Gm
% Length, nt
BCL11B
bta-miR-7865 4655’UTR
-102 91 19bta-miR-1281 865 -93 96 17bta-miR-2885 2240
CDS-108 91 19
bta-miR-2388-3p 2467 -104 91 21bta-miR-2309 4516
3’UTR
-115 87 23bta-miR-1777b 4519 -113 90 20bta-miR-1777a 4520 -106 86 20bta-miR-11971 7367 -102 94 20bta-miR-1281 8096 -91 93 17
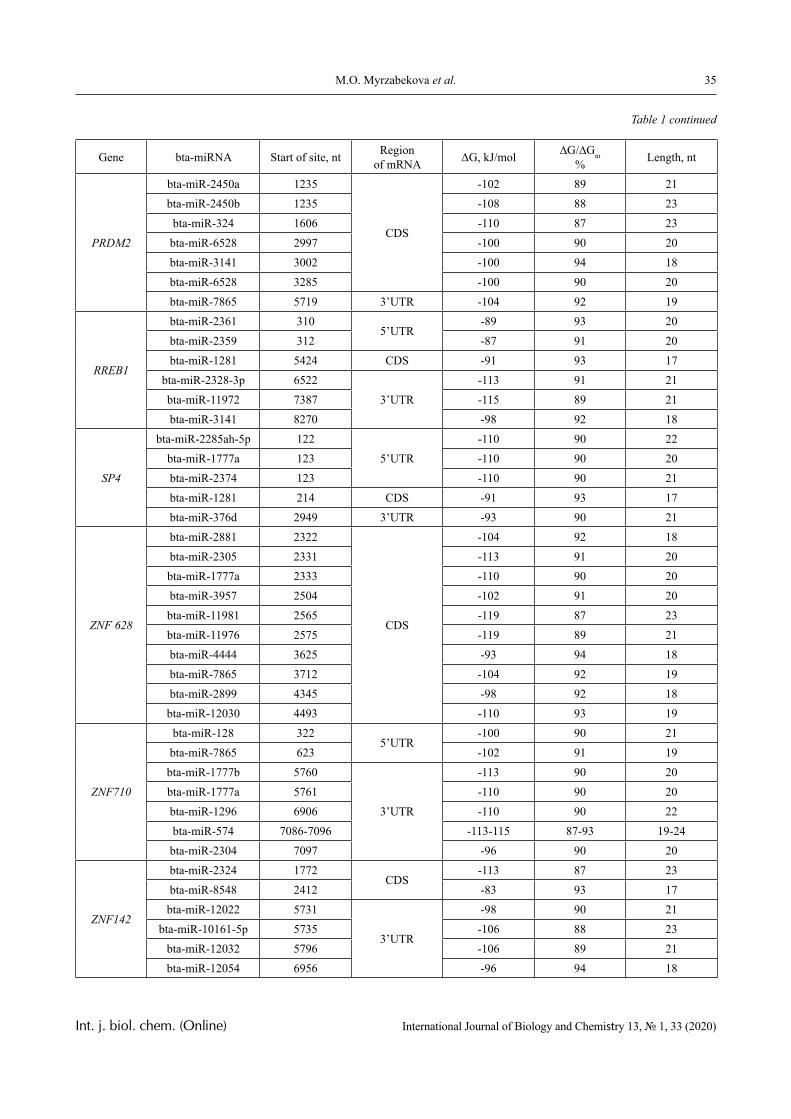
35М.О. Мyrzabekova et al.
Int. j. biol. chem. (Online) International Journal of Biology and Chemistry 13, № 1, 33 (2020)
Gene bta-miRNA Start of site, nt Regionof mRNA ΔG, kJ/mol ∆G/∆Gm
% Length, nt
PRDM2
bta-miR-2450a 1235
CDS
-102 89 21bta-miR-2450b 1235 -108 88 23bta-miR-324 1606 -110 87 23
bta-miR-6528 2997 -100 90 20bta-miR-3141 3002 -100 94 18bta-miR-6528 3285 -100 90 20bta-miR-7865 5719 3’UTR -104 92 19
RREB1
bta-miR-2361 3105’UTR
-89 93 20bta-miR-2359 312 -87 91 20bta-miR-1281 5424 CDS -91 93 17
bta-miR-2328-3p 65223’UTR
-113 91 21bta-miR-11972 7387 -115 89 21bta-miR-3141 8270 -98 92 18
SP4
bta-miR-2285ah-5p 1225’UTR
-110 90 22bta-miR-1777a 123 -110 90 20bta-miR-2374 123 -110 90 21bta-miR-1281 214 CDS -91 93 17bta-miR-376d 2949 3’UTR -93 90 21
ZNF 628
bta-miR-2881 2322
CDS
-104 92 18bta-miR-2305 2331 -113 91 20bta-miR-1777a 2333 -110 90 20bta-miR-3957 2504 -102 91 20bta-miR-11981 2565 -119 87 23bta-miR-11976 2575 -119 89 21bta-miR-4444 3625 -93 94 18bta-miR-7865 3712 -104 92 19bta-miR-2899 4345 -98 92 18bta-miR-12030 4493 -110 93 19
ZNF710
bta-miR-128 3225’UTR
-100 90 21bta-miR-7865 623 -102 91 19bta-miR-1777b 5760
3’UTR
-113 90 20bta-miR-1777a 5761 -110 90 20bta-miR-1296 6906 -110 90 22bta-miR-574 7086-7096 -113-115 87-93 19-24bta-miR-2304 7097 -96 90 20
ZNF142
bta-miR-2324 1772CDS
-113 87 23bta-miR-8548 2412 -83 93 17bta-miR-12022 5731
3’UTR
-98 90 21bta-miR-10161-5p 5735 -106 88 23
bta-miR-12032 5796 -106 89 21bta-miR-12054 6956 -96 94 18
Table 1 continued
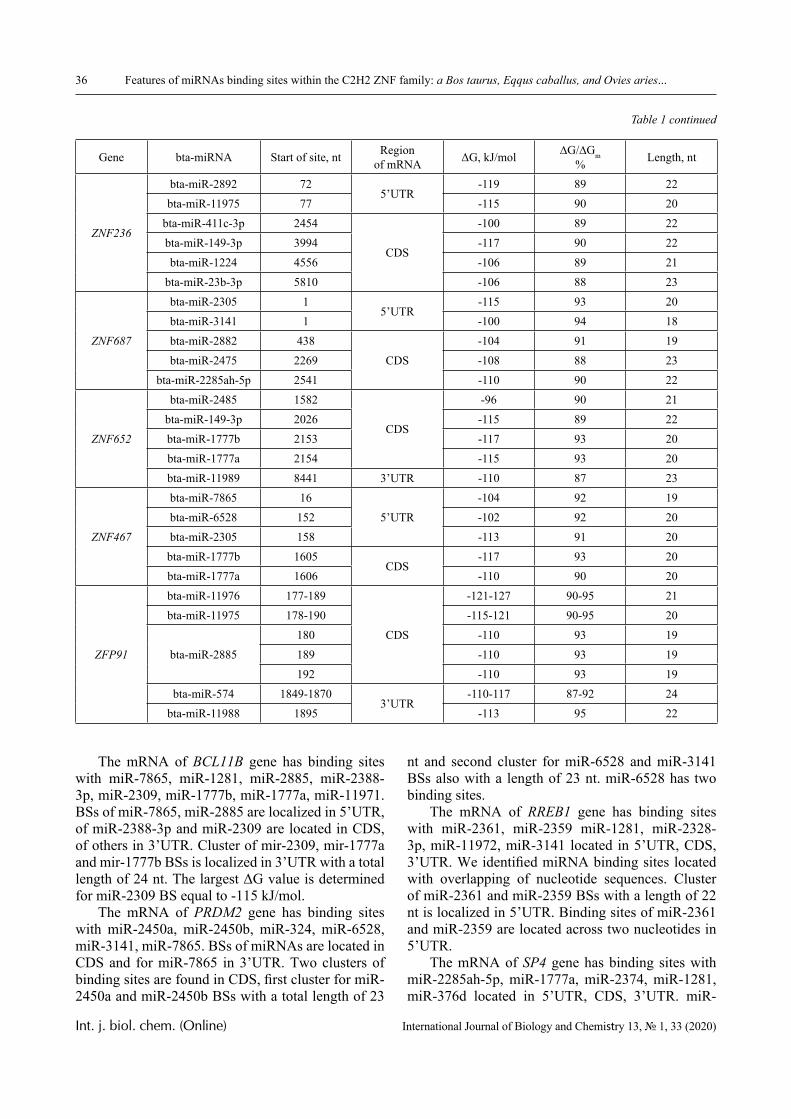
36 Features of miRNAs binding sites within the C2H2 ZNF family: a Bos taurus, Eqqus caballus, and Ovies aries...
Int. j. biol. chem. (Online) International Journal of Biology and Chemistry 13, № 1, 33 (2020)
Gene bta-miRNA Start of site, nt Regionof mRNA ΔG, kJ/mol ∆G/∆Gm
% Length, nt
ZNF236
bta-miR-2892 725’UTR
-119 89 22bta-miR-11975 77 -115 90 20
bta-miR-411c-3p 2454
CDS
-100 89 22bta-miR-149-3p 3994 -117 90 22bta-miR-1224 4556 -106 89 21
bta-miR-23b-3p 5810 -106 88 23
ZNF687
bta-miR-2305 15’UTR
-115 93 20bta-miR-3141 1 -100 94 18bta-miR-2882 438
CDS-104 91 19
bta-miR-2475 2269 -108 88 23bta-miR-2285ah-5p 2541 -110 90 22
ZNF652
bta-miR-2485 1582
CDS
-96 90 21bta-miR-149-3p 2026 -115 89 22bta-miR-1777b 2153 -117 93 20bta-miR-1777a 2154 -115 93 20bta-miR-11989 8441 3’UTR -110 87 23
ZNF467
bta-miR-7865 165’UTR
-104 92 19bta-miR-6528 152 -102 92 20bta-miR-2305 158 -113 91 20
bta-miR-1777b 1605CDS
-117 93 20bta-miR-1777a 1606 -110 90 20
ZFP91
bta-miR-11976 177-189
CDS
-121-127 90-95 21bta-miR-11975 178-190 -115-121 90-95 20
bta-miR-2885180 -110 93 19189 -110 93 19192 -110 93 19
bta-miR-574 1849-18703’UTR
-110-117 87-92 24bta-miR-11988 1895 -113 95 22
Table 1 continued
The mRNA of BCL11B gene has binding sites with miR-7865, miR-1281, miR-2885, miR-2388-3p, miR-2309, miR-1777b, miR-1777a, miR-11971. BSs of miR-7865, miR-2885 are localized in 5’UTR, of miR-2388-3p and miR-2309 are located in CDS, of others in 3’UTR. Cluster of mir-2309, mir-1777a and mir-1777b BSs is localized in 3’UTR with a total length of 24 nt. The largest ΔG value is determined for miR-2309 BS equal to -115 kJ/mol.
The mRNA of PRDM2 gene has binding sites with miR-2450a, miR-2450b, miR-324, miR-6528, miR-3141, miR-7865. BSs of miRNAs are located in CDS and for miR-7865 in 3’UTR. Two clusters of binding sites are found in CDS, first cluster for miR-2450a and miR-2450b BSs with a total length of 23
nt and second cluster for miR-6528 and miR-3141 BSs also with a length of 23 nt. miR-6528 has two binding sites.
The mRNA of RREB1 gene has binding sites with miR-2361, miR-2359 miR-1281, miR-2328-3p, miR-11972, miR-3141 located in 5’UTR, CDS, 3’UTR. We identified miRNA binding sites located with overlapping of nucleotide sequences. Cluster of miR-2361 and miR-2359 BSs with a length of 22 nt is localized in 5’UTR. Binding sites of miR-2361 and miR-2359 are located across two nucleotides in 5’UTR.
The mRNA of SP4 gene has binding sites with miR-2285ah-5p, miR-1777a, miR-2374, miR-1281, miR-376d located in 5’UTR, CDS, 3’UTR. miR-
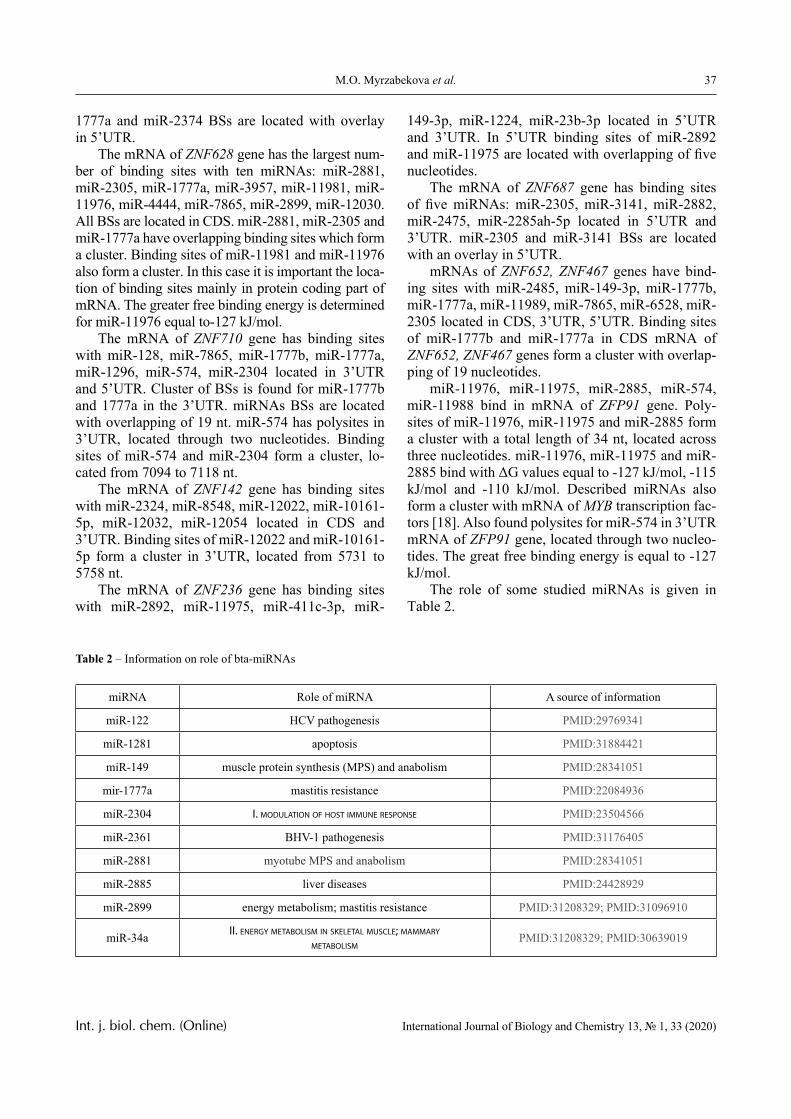
37М.О. Мyrzabekova et al.
Int. j. biol. chem. (Online) International Journal of Biology and Chemistry 13, № 1, 33 (2020)
1777a and miR-2374 BSs are located with overlay in 5’UTR.
The mRNA of ZNF628 gene has the largest num-ber of binding sites with ten miRNAs: miR-2881, miR-2305, miR-1777a, miR-3957, miR-11981, miR-11976, miR-4444, miR-7865, miR-2899, miR-12030. All BSs are located in CDS. miR-2881, miR-2305 and miR-1777a have overlapping binding sites which form a cluster. Binding sites of miR-11981 and miR-11976 also form a cluster. In this case it is important the loca-tion of binding sites mainly in protein coding part of mRNA. The greater free binding energy is determined for miR-11976 equal to-127 kJ/mol.
The mRNA of ZNF710 gene has binding sites with miR-128, miR-7865, miR-1777b, miR-1777a, miR-1296, miR-574, miR-2304 located in 3’UTR and 5’UTR. Cluster of BSs is found for miR-1777b and 1777a in the 3’UTR. miRNAs BSs are located with overlapping of 19 nt. miR-574 has polysites in 3’UTR, located through two nucleotides. Binding sites of miR-574 and miR-2304 form a cluster, lo-cated from 7094 to 7118 nt.
The mRNA of ZNF142 gene has binding sites with miR-2324, miR-8548, miR-12022, miR-10161-5p, miR-12032, miR-12054 located in CDS and 3’UTR. Binding sites of miR-12022 and miR-10161-5p form a cluster in 3’UTR, located from 5731 to 5758 nt.
The mRNA of ZNF236 gene has binding sites with miR-2892, miR-11975, miR-411c-3p, miR-
149-3p, miR-1224, miR-23b-3p located in 5’UTR and 3’UTR. In 5’UTR binding sites of miR-2892 and miR-11975 are located with overlapping of five nucleotides.
The mRNA of ZNF687 gene has binding sites of five miRNAs: miR-2305, miR-3141, miR-2882, miR-2475, miR-2285ah-5p located in 5’UTR and 3’UTR. miR-2305 and miR-3141 BSs are located with an overlay in 5’UTR.
mRNAs of ZNF652, ZNF467 genes have bind-ing sites with miR-2485, miR-149-3p, miR-1777b, miR-1777a, miR-11989, miR-7865, miR-6528, miR-2305 located in CDS, 3’UTR, 5’UTR. Binding sites of miR-1777b and miR-1777a in СDS mRNA of ZNF652, ZNF467 genes form a cluster with overlap-ping of 19 nucleotides.
miR-11976, miR-11975, miR-2885, miR-574, miR-11988 bind in mRNA of ZFP91 gene. Poly-sites of miR-11976, miR-11975 and miR-2885 form a cluster with a total length of 34 nt, located across three nucleotides. miR-11976, miR-11975 and miR-2885 bind with ΔG values equal to -127 kJ/mol, -115 kJ/mol and -110 kJ/mol. Described miRNAs also form a cluster with mRNA of MYB transcription fac-tors [18]. Also found polysites for miR-574 in 3’UTR mRNA of ZFP91 gene, located through two nucleo-tides. The great free binding energy is equal to -127 kJ/mol.
The role of some studied miRNAs is given in Table 2.
Table 2 – Information on role of bta-miRNAs
miRNA Role of miRNA A source of information
miR-122 HCV pathogenesis PMID:29769341
miR-1281 apoptosis PMID:31884421
miR-149 muscle protein synthesis (MPS) and anabolism PMID:28341051
mir-1777a mastitis resistance PMID:22084936
miR-2304 І. modulation of host immune response PMID:23504566
miR-2361 BHV-1 pathogenesis PMID:31176405
miR-2881 myotube MPS and anabolism PMID:28341051
miR-2885 liver diseases PMID:24428929
miR-2899 energy metabolism; mastitis resistance PMID:31208329; PMID:31096910
miR-34a ІІ. energy metabolism in skeletal muscle; mammary metabolism
PMID:31208329; PMID:30639019
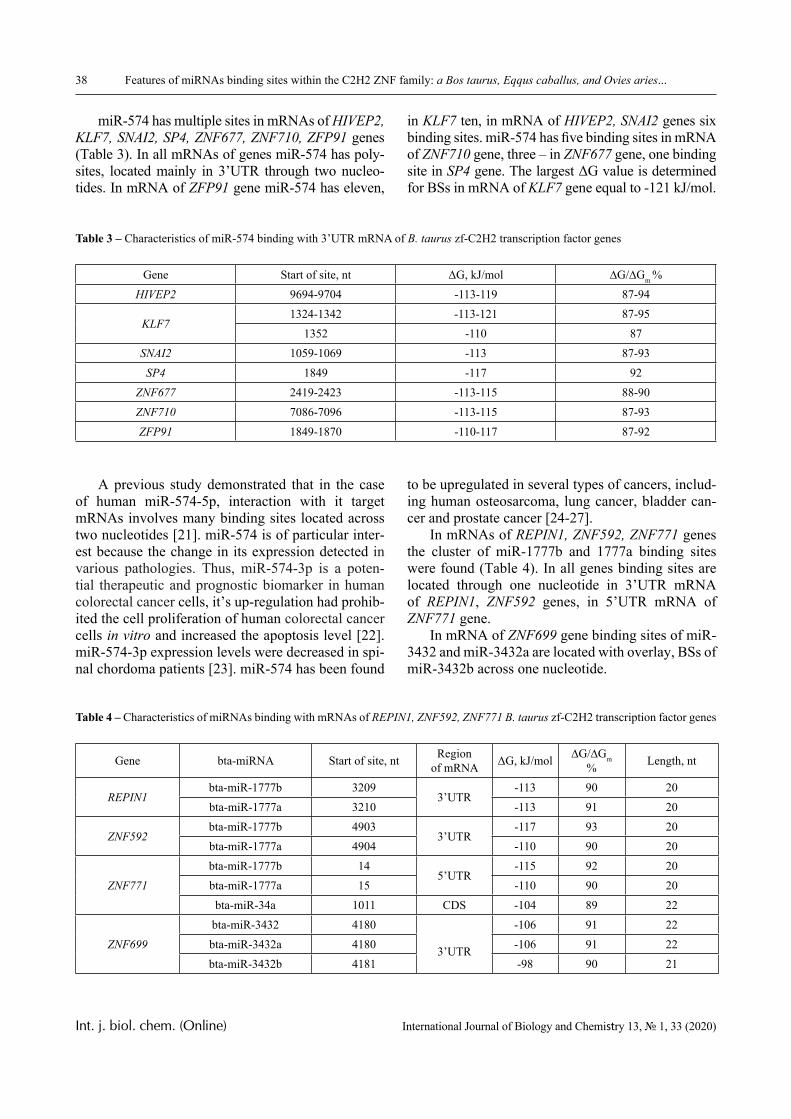
38 Features of miRNAs binding sites within the C2H2 ZNF family: a Bos taurus, Eqqus caballus, and Ovies aries...
Int. j. biol. chem. (Online) International Journal of Biology and Chemistry 13, № 1, 33 (2020)
miR-574 has multiple sites in mRNAs of HIVEP2, KLF7, SNAI2, SP4, ZNF677, ZNF710, ZFP91 genes (Тable 3). In all mRNAs of genes miR-574 has poly-sites, located mainly in 3’UTR through two nucleo-tides. In mRNA of ZFP91 gene miR-574 has eleven,
in KLF7 ten, in mRNA of HIVEP2, SNAI2 genes six binding sites. miR-574 has five binding sites in mRNA of ZNF710 gene, three – in ZNF677 gene, one binding site in SP4 gene. The largest ΔG value is determined for BSs in mRNA of KLF7 gene equal to -121 kJ/mol.
Table 3 – Characteristics of miR-574 binding with 3’UTR mRNA of B. taurus zf-C2H2 transcription factor genes
Gene Start of site, nt ΔG, kJ/mol ∆G/∆Gm %HIVEP2 9694-9704 -113-119 87-94
KLF71324-1342 -113-121 87-95
1352 -110 87SNAI2 1059-1069 -113 87-93SP4 1849 -117 92
ZNF677 2419-2423 -113-115 88-90ZNF710 7086-7096 -113-115 87-93ZFP91 1849-1870 -110-117 87-92
A previous study demonstrated that in the case of human miR-574-5p, interaction with it target mRNAs involves many binding sites located across two nucleotides [21]. miR-574 is of particular inter-est because the change in its expression detected in various pathologies. Thus, miR-574-3p is a poten-tial therapeutic and prognostic biomarker in human colorectal cancer cells, it’s up-regulation had prohib-ited the cell proliferation of human colorectal cancer cells in vitro and increased the apoptosis level [22]. miR-574-3p expression levels were decreased in spi-nal chordoma patients [23]. miR-574 has been found
to be upregulated in several types of cancers, includ-ing human osteosarcoma, lung cancer, bladder can-cer and prostate cancer [24-27].
In mRNAs of REPIN1, ZNF592, ZNF771 genes the cluster of miR-1777b and 1777a binding sites were found (Table 4). In all genes binding sites are located through one nucleotide in 3’UTR mRNA of REPIN1, ZNF592 genes, in 5’UTR mRNA of ZNF771 gene.
In mRNA of ZNF699 gene binding sites of miR-3432 and miR-3432a are located with overlay, BSs of miR-3432b across one nucleotide.
Table 4 – Characteristics of miRNAs binding with mRNAs of REPIN1, ZNF592, ZNF771 B. taurus zf-C2H2 transcription factor genes
Gene bta-miRNA Start of site, nt Regionof mRNA ΔG, kJ/mol ∆G/∆Gm
% Length, nt
REPIN1bta-miR-1777b 3209
3’UTR-113 90 20
bta-miR-1777a 3210 -113 91 20
ZNF592bta-miR-1777b 4903
3’UTR-117 93 20
bta-miR-1777a 4904 -110 90 20
ZNF771bta-miR-1777b 14
5’UTR-115 92 20
bta-miR-1777a 15 -110 90 20bta-miR-34a 1011 CDS -104 89 22
ZNF699bta-miR-3432 4180
3’UTR
-106 91 22bta-miR-3432a 4180 -106 91 22bta-miR-3432b 4181 -98 90 21
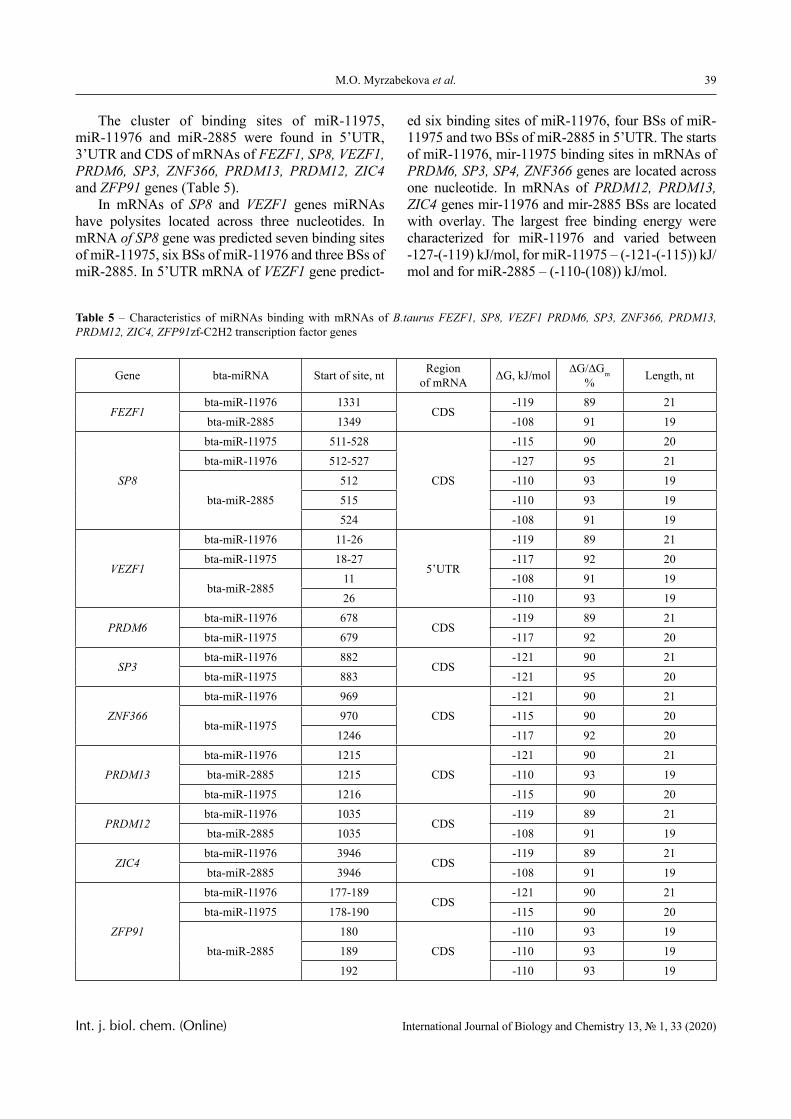
39М.О. Мyrzabekova et al.
Int. j. biol. chem. (Online) International Journal of Biology and Chemistry 13, № 1, 33 (2020)
The cluster of binding sites of miR-11975, miR-11976 and miR-2885 were found in 5’UTR, 3’UTR and CDS of mRNAs of FEZF1, SP8, VEZF1, PRDM6, SP3, ZNF366, PRDM13, PRDM12, ZIC4 and ZFP91 genes (Table 5).
In mRNAs of SP8 and VEZF1 genes miRNAs have polysites located across three nucleotides. In mRNA of SP8 gene was predicted seven binding sites of miR-11975, six BSs of miR-11976 and three BSs of miR-2885. In 5’UTR mRNA of VEZF1 gene predict-
ed six binding sites of miR-11976, four BSs of miR-11975 and two BSs of miR-2885 in 5’UTR. The starts of miR-11976, mir-11975 binding sites in mRNAs of PRDM6, SP3, SP4, ZNF366 genes are located across one nucleotide. In mRNAs of PRDM12, PRDM13, ZIC4 genes mir-11976 and mir-2885 BSs are located with overlay. The largest free binding energy were characterized for miR-11976 and varied between -127-(-119) kJ/mol, for miR-11975 – (-121-(-115)) kJ/mol and for miR-2885 – (-110-(108)) kJ/mol.
Table 5 – Characteristics of miRNAs binding with mRNAs of B.taurus FEZF1, SP8, VEZF1 PRDM6, SP3, ZNF366, PRDM13, PRDM12, ZIC4, ZFP91zf-C2H2 transcription factor genes
Gene bta-miRNA Start of site, nt Regionof mRNA ΔG, kJ/mol ∆G/∆Gm
% Length, nt
FEZF1bta-miR-11976 1331
CDS-119 89 21
bta-miR-2885 1349 -108 91 19
SP8
bta-miR-11975 511-528
CDS
-115 90 20bta-miR-11976 512-527 -127 95 21
bta-miR-2885512 -110 93 19515 -110 93 19524 -108 91 19
VEZF1
bta-miR-11976 11-26
5’UTR
-119 89 21bta-miR-11975 18-27 -117 92 20
bta-miR-288511 -108 91 1926 -110 93 19
PRDM6bta-miR-11976 678
CDS-119 89 21
bta-miR-11975 679 -117 92 20
SP3bta-miR-11976 882
CDS-121 90 21
bta-miR-11975 883 -121 95 20
ZNF366bta-miR-11976 969
CDS-121 90 21
bta-miR-11975970 -115 90 201246 -117 92 20
PRDM13bta-miR-11976 1215
CDS-121 90 21
bta-miR-2885 1215 -110 93 19bta-miR-11975 1216 -115 90 20
PRDM12bta-miR-11976 1035
CDS-119 89 21
bta-miR-2885 1035 -108 91 19
ZIC4bta-miR-11976 3946
CDS-119 89 21
bta-miR-2885 3946 -108 91 19
ZFP91
bta-miR-11976 177-189CDS
-121 90 21bta-miR-11975 178-190 -115 90 20
bta-miR-2885180
CDS-110 93 19
189 -110 93 19192 -110 93 19
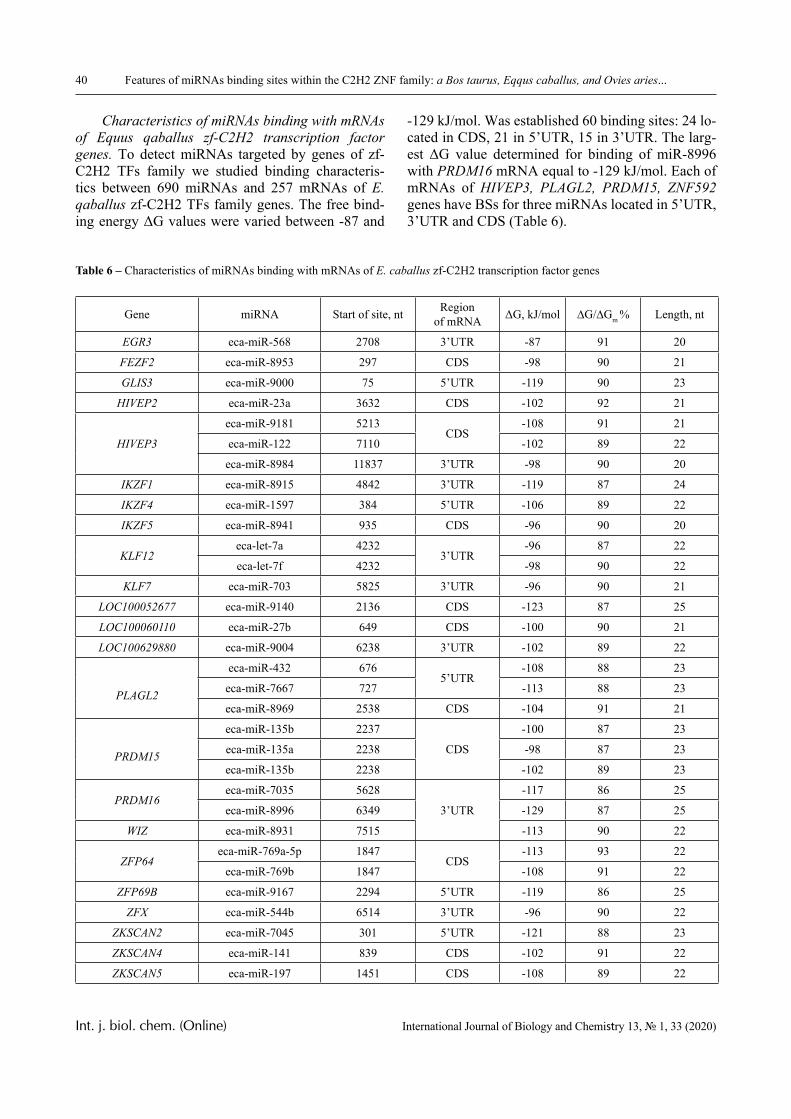
40 Features of miRNAs binding sites within the C2H2 ZNF family: a Bos taurus, Eqqus caballus, and Ovies aries...
Int. j. biol. chem. (Online) International Journal of Biology and Chemistry 13, № 1, 33 (2020)
Characteristics of miRNAs binding with mRNAs of Equus qaballus zf-C2H2 transcription factor genes. To detect miRNAs targeted by genes of zf-C2H2 TFs family we studied binding characteris-tics between 690 miRNAs and 257 mRNAs of E. qaballus zf-C2H2 TFs family genes. The free bind-ing energy ΔG values were varied between -87 and
-129 kJ/mol. Was established 60 binding sites: 24 lo-cated in CDS, 21 in 5’UTR, 15 in 3’UTR. The larg-est ΔG value determined for binding of miR-8996 with PRDM16 mRNA equal to -129 kJ/mol. Each of mRNAs of HIVEP3, PLAGL2, PRDM15, ZNF592 genes have BSs for three miRNAs located in 5’UTR, 3’UTR and CDS (Table 6).
Table 6 – Characteristics of miRNAs binding with mRNAs of E. caballus zf-C2H2 transcription factor genes
Gene miRNA Start of site, nt Regionof mRNA ΔG, kJ/mol ∆G/∆Gm % Length, nt
EGR3 eca-miR-568 2708 3’UTR -87 91 20
FEZF2 eca-miR-8953 297 CDS -98 90 21
GLIS3 eca-miR-9000 75 5’UTR -119 90 23
HIVEP2 eca-miR-23a 3632 CDS -102 92 21
HIVEP3
eca-miR-9181 5213CDS
-108 91 21
eca-miR-122 7110 -102 89 22
eca-miR-8984 11837 3’UTR -98 90 20
IKZF1 eca-miR-8915 4842 3’UTR -119 87 24
IKZF4 eca-miR-1597 384 5’UTR -106 89 22
IKZF5 eca-miR-8941 935 CDS -96 90 20
KLF12eca-let-7a 4232
3’UTR-96 87 22
eca-let-7f 4232 -98 90 22
KLF7 eca-miR-703 5825 3’UTR -96 90 21
LOC100052677 eca-miR-9140 2136 CDS -123 87 25
LOC100060110 eca-miR-27b 649 CDS -100 90 21
LOC100629880 eca-miR-9004 6238 3’UTR -102 89 22
PLAGL2
eca-miR-432 6765’UTR
-108 88 23
eca-miR-7667 727 -113 88 23
eca-miR-8969 2538 CDS -104 91 21
PRDM15
eca-miR-135b 2237
CDS
-100 87 23
eca-miR-135a 2238 -98 87 23
eca-miR-135b 2238 -102 89 23
PRDM16eca-miR-7035 5628
3’UTR
-117 86 25
eca-miR-8996 6349 -129 87 25
WIZ eca-miR-8931 7515 -113 90 22
ZFP64eca-miR-769a-5p 1847
CDS-113 93 22
eca-miR-769b 1847 -108 91 22
ZFP69B eca-miR-9167 2294 5’UTR -119 86 25
ZFX eca-miR-544b 6514 3’UTR -96 90 22
ZKSCAN2 eca-miR-7045 301 5’UTR -121 88 23
ZKSCAN4 eca-miR-141 839 CDS -102 91 22
ZKSCAN5 eca-miR-197 1451 CDS -108 89 22
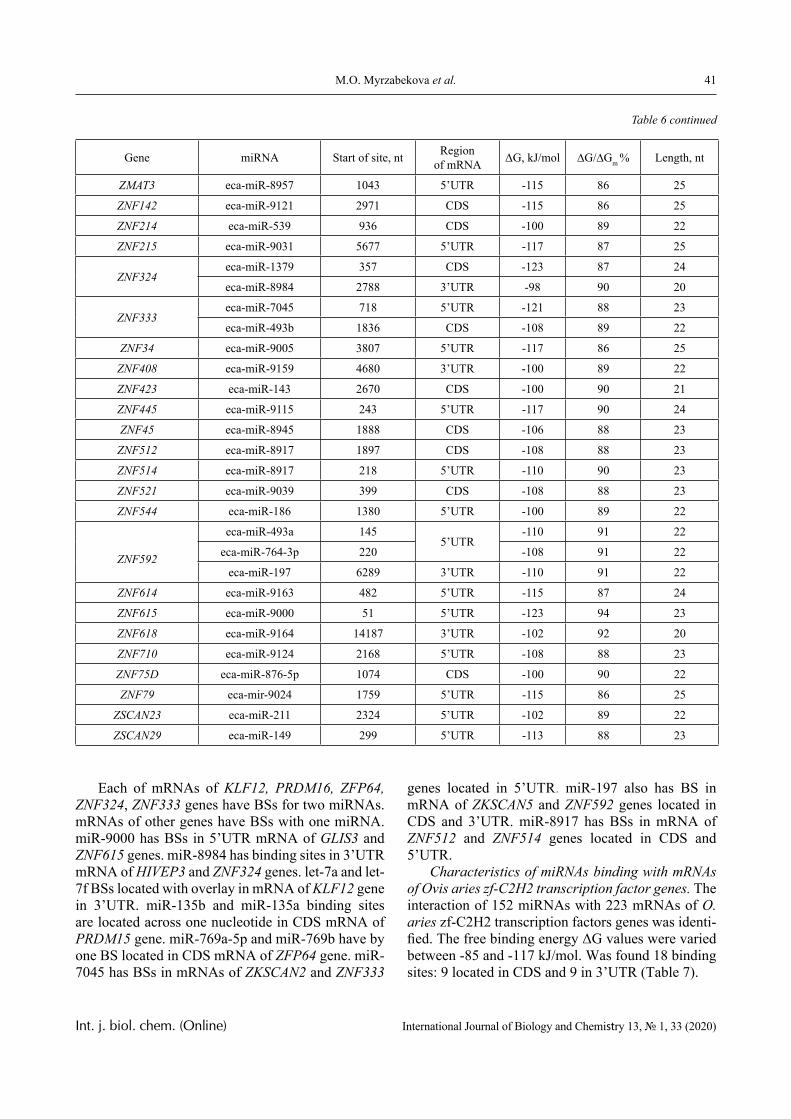
41М.О. Мyrzabekova et al.
Int. j. biol. chem. (Online) International Journal of Biology and Chemistry 13, № 1, 33 (2020)
Gene miRNA Start of site, nt Regionof mRNA ΔG, kJ/mol ∆G/∆Gm % Length, nt
ZMAT3 eca-miR-8957 1043 5’UTR -115 86 25
ZNF142 eca-miR-9121 2971 CDS -115 86 25
ZNF214 eca-miR-539 936 CDS -100 89 22
ZNF215 eca-miR-9031 5677 5’UTR -117 87 25
ZNF324eca-miR-1379 357 CDS -123 87 24
eca-miR-8984 2788 3’UTR -98 90 20
ZNF333eca-miR-7045 718 5’UTR -121 88 23
eca-miR-493b 1836 CDS -108 89 22
ZNF34 eca-miR-9005 3807 5’UTR -117 86 25
ZNF408 eca-miR-9159 4680 3’UTR -100 89 22
ZNF423 eca-miR-143 2670 CDS -100 90 21
ZNF445 eca-miR-9115 243 5’UTR -117 90 24
ZNF45 eca-miR-8945 1888 CDS -106 88 23
ZNF512 eca-miR-8917 1897 CDS -108 88 23
ZNF514 eca-miR-8917 218 5’UTR -110 90 23
ZNF521 eca-miR-9039 399 CDS -108 88 23
ZNF544 eca-miR-186 1380 5’UTR -100 89 22
ZNF592
eca-miR-493a 1455’UTR
-110 91 22
eca-miR-764-3p 220 -108 91 22
eca-miR-197 6289 3’UTR -110 91 22
ZNF614 eca-miR-9163 482 5’UTR -115 87 24
ZNF615 eca-miR-9000 51 5’UTR -123 94 23
ZNF618 eca-miR-9164 14187 3’UTR -102 92 20
ZNF710 eca-miR-9124 2168 5’UTR -108 88 23
ZNF75D eca-miR-876-5p 1074 CDS -100 90 22
ZNF79 eca-mir-9024 1759 5’UTR -115 86 25
ZSCAN23 eca-miR-211 2324 5’UTR -102 89 22
ZSCAN29 eca-miR-149 299 5’UTR -113 88 23
Table 6 continued
Each of mRNAs of KLF12, PRDM16, ZFP64, ZNF324, ZNF333 genes have BSs for two miRNAs. mRNAs of other genes have BSs with one miRNA. miR-9000 has BSs in 5’UTR mRNA of GLIS3 and ZNF615 genes. miR-8984 has binding sites in 3’UTR mRNA of HIVEP3 and ZNF324 genes. let-7a and let-7f BSs located with overlay in mRNA of KLF12 gene in 3’UTR. miR-135b and miR-135a binding sites are located across one nucleotide in CDS mRNA of PRDM15 gene. miR-769a-5p and miR-769b have by one BS located in CDS mRNA of ZFP64 gene. miR-7045 has BSs in mRNAs of ZKSCAN2 and ZNF333
genes located in 5’UTR. miR-197 also has BS in mRNA of ZKSCAN5 and ZNF592 genes located in CDS and 3’UTR. miR-8917 has BSs in mRNA of ZNF512 and ZNF514 genes located in CDS and 5’UTR.
Characteristics of miRNAs binding with mRNAs of Ovis aries zf-C2H2 transcription factor genes. The interaction of 152 miRNAs with 223 mRNAs of O. aries zf-C2H2 transcription factors genes was identi-fied. The free binding energy ΔG values were varied between -85 and -117 kJ/mol. Was found 18 binding sites: 9 located in CDS and 9 in 3’UTR (Table 7).
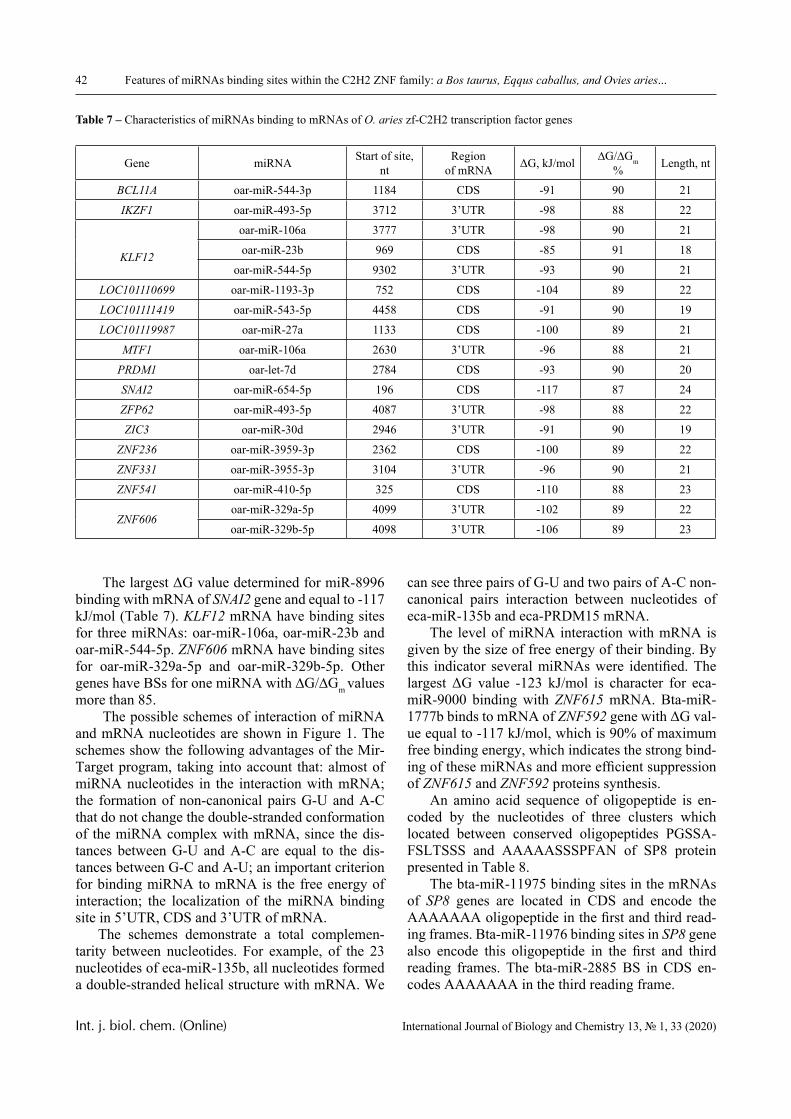
42 Features of miRNAs binding sites within the C2H2 ZNF family: a Bos taurus, Eqqus caballus, and Ovies aries...
Int. j. biol. chem. (Online) International Journal of Biology and Chemistry 13, № 1, 33 (2020)
Table 7 – Characteristics of miRNAs binding to mRNAs of O. aries zf-C2H2 transcription factor genes
Gene miRNA Start of site, nt
Regionof mRNA ΔG, kJ/mol ∆G/∆Gm
% Length, nt
BCL11A oar-miR-544-3p 1184 CDS -91 90 21
IKZF1 oar-miR-493-5p 3712 3’UTR -98 88 22
KLF12
oar-miR-106a 3777 3’UTR -98 90 21
oar-miR-23b 969 CDS -85 91 18
oar-miR-544-5p 9302 3’UTR -93 90 21
LOC101110699 oar-miR-1193-3p 752 CDS -104 89 22
LOC101111419 oar-miR-543-5p 4458 CDS -91 90 19
LOC101119987 oar-miR-27a 1133 CDS -100 89 21
MTF1 oar-miR-106a 2630 3’UTR -96 88 21
PRDM1 oar-let-7d 2784 CDS -93 90 20
SNAI2 oar-miR-654-5p 196 CDS -117 87 24
ZFP62 oar-miR-493-5p 4087 3’UTR -98 88 22
ZIC3 oar-miR-30d 2946 3’UTR -91 90 19
ZNF236 oar-miR-3959-3p 2362 CDS -100 89 22
ZNF331 oar-miR-3955-3p 3104 3’UTR -96 90 21
ZNF541 oar-miR-410-5p 325 CDS -110 88 23
ZNF606oar-miR-329a-5p 4099 3’UTR -102 89 22
oar-miR-329b-5p 4098 3’UTR -106 89 23
The largest ΔG value determined for miR-8996 binding with mRNA of SNAI2 gene and equal to -117 kJ/mol (Table 7). KLF12 mRNA have binding sites for three miRNAs: oar-miR-106a, oar-miR-23b and oar-miR-544-5p. ZNF606 mRNA have binding sites for oar-miR-329a-5p and oar-miR-329b-5p. Other genes have BSs for one miRNA with ∆G/∆Gm values more than 85.
The possible schemes of interaction of miRNA and mRNA nucleotides are shown in Figure 1. The schemes show the following advantages of the Mir-Target program, taking into account that: almost of miRNA nucleotides in the interaction with mRNA; the formation of non-canonical pairs G-U and A-C that do not change the double-stranded conformation of the miRNA complex with mRNA, since the dis-tances between G-U and A-C are equal to the dis-tances between G-C and A-U; an important criterion for binding miRNA to mRNA is the free energy of interaction; the localization of the miRNA binding site in 5’UTR, CDS and 3’UTR of mRNA.
The schemes demonstrate a total complemen-tarity between nucleotides. For example, of the 23 nucleotides of eca-miR-135b, all nucleotides formed a double-stranded helical structure with mRNA. We
can see three pairs of G-U and two pairs of A-C non-canonical pairs interaction between nucleotides of eca-miR-135b and eca-PRDM15 mRNA.
The level of miRNA interaction with mRNA is given by the size of free energy of their binding. By this indicator several miRNAs were identified. The largest ΔG value -123 kJ/mol is character for eca-miR-9000 binding with ZNF615 mRNA. Bta-miR-1777b binds to mRNA of ZNF592 gene with ΔG val-ue equal to -117 kJ/mol, which is 90% of maximum free binding energy, which indicates the strong bind-ing of these miRNAs and more efficient suppression of ZNF615 and ZNF592 proteins synthesis.
An amino acid sequence of oligopeptide is en-coded by the nucleotides of three clusters which located between conserved oligopeptides PGSSA-FSLTSSS and AAAAASSSPFAN of SP8 protein presented in Table 8.
The bta-miR-11975 binding sites in the mRNAs of SP8 genes are located in CDS and encode the AAAAAAA oligopeptide in the first and third read-ing frames. Bta-miR-11976 binding sites in SP8 gene also encode this oligopeptide in the first and third reading frames. The bta-miR-2885 BS in CDS en-codes AAAAAAA in the third reading frame.
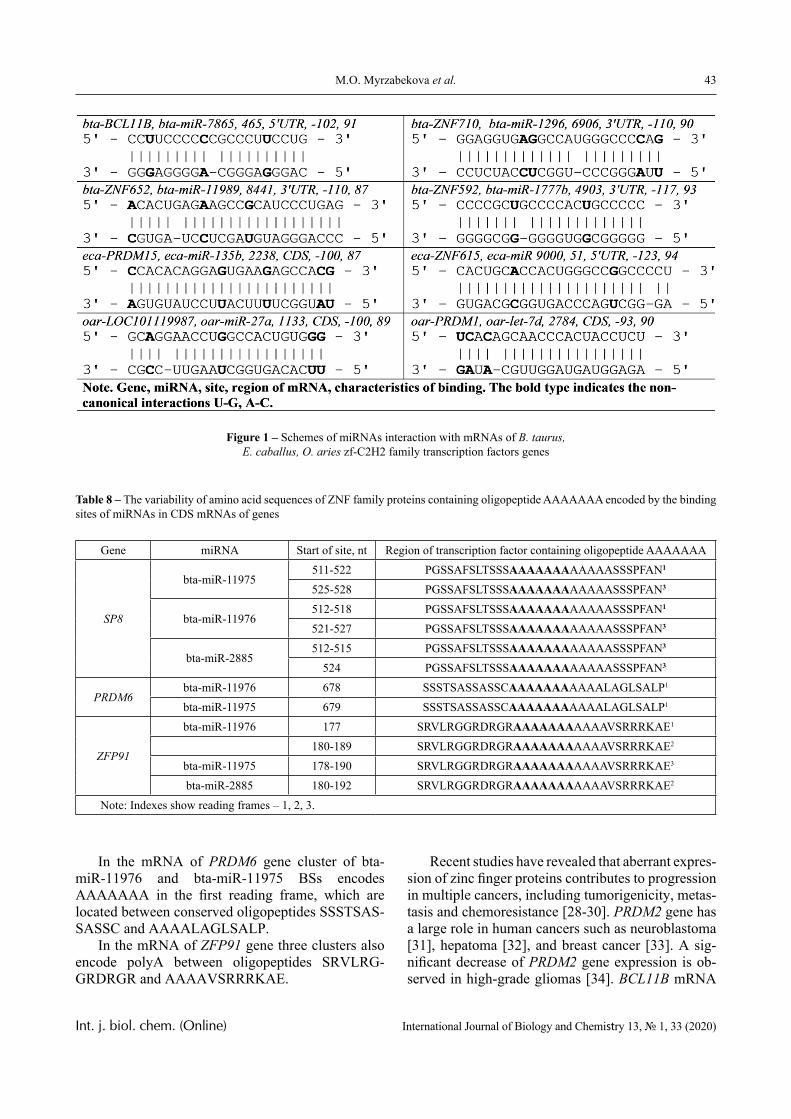
43М.О. Мyrzabekova et al.
Int. j. biol. chem. (Online) International Journal of Biology and Chemistry 13, № 1, 33 (2020)
Figure 1 – Schemes of miRNAs interaction with mRNAs of B. taurus, E. caballus, O. aries zf-C2H2 family transcription factors genes
Table 8 – The variability of amino acid sequences of ZNF family proteins containing oligopeptide AAAAAAA encoded by the binding sites of miRNAs in CDS mRNAs of genes
Gene miRNA Start of site, nt Region of transcription factor containing oligopeptide AAAAAAA
SP8
bta-miR-11975511-522 PGSSAFSLTSSSAAAAAAAAAAAASSSPFAN1
525-528 PGSSAFSLTSSSAAAAAAAAAAAASSSPFAN3
bta-miR-11976512-518 PGSSAFSLTSSSAAAAAAAAAAAASSSPFAN1
521-527 PGSSAFSLTSSSAAAAAAAAAAAASSSPFAN3
bta-miR-2885512-515 PGSSAFSLTSSSAAAAAAAAAAAASSSPFAN3
524 PGSSAFSLTSSSAAAAAAAAAAAASSSPFAN3
PRDM6bta-miR-11976 678 SSSTSASSASSCAAAAAAAAAAALAGLSALP1
bta-miR-11975 679 SSSTSASSASSCAAAAAAAAAAALAGLSALP1
ZFP91
bta-miR-11976 177 SRVLRGGRDRGRAAAAAAAAAAAVSRRRKAE1
180-189 SRVLRGGRDRGRAAAAAAAAAAAVSRRRKAE2
bta-miR-11975 178-190 SRVLRGGRDRGRAAAAAAAAAAAVSRRRKAE3
bta-miR-2885 180-192 SRVLRGGRDRGRAAAAAAAAAAAVSRRRKAE2
Note: Indexes show reading frames – 1, 2, 3.
In the mRNA of PRDM6 gene cluster of bta-miR-11976 and bta-miR-11975 BSs encodes AAAAAAA in the first reading frame, which are located between conserved oligopeptides SSSTSAS-SASSC and AAAALAGLSALP.
In the mRNA of ZFP91 gene three clusters also encode polyA between oligopeptides SRVLRG-GRDRGR and AAAAVSRRRKAE.
Recent studies have revealed that aberrant expres-sion of zinc finger proteins contributes to progression in multiple cancers, including tumorigenicity, metas-tasis and chemoresistance [28-30]. PRDM2 gene has a large role in human cancers such as neuroblastoma [31], hepatoma [32], and breast cancer [33]. A sig-nificant decrease of PRDM2 gene expression is ob-served in high-grade gliomas [34]. BCL11B mRNA
44 Features of miRNAs binding sites within the C2H2 ZNF family: a Bos taurus, Eqqus caballus, and Ovies aries...
Int. j. biol. chem. (Online) International Journal of Biology and Chemistry 13, № 1, 33 (2020)
is essential for growth of αβ T cells and most of γδ T cells [35]. Oncogenic properties of ZFP91 is revealed in experiments. Where is found overexpression of ZFP91 in a screening-type of study in leukemic cells and neoplastic blood cell lines [36]. Overexpression has been connected to cancer pathogenesis in mela-noma, pancreatic, breast and lung cancers [37], colon cancer and endometrial cancer cell lines and stomach cancer cell lines [38]. Overexpression of ZFP91 gene is observed in many types of cancer. Therefore, it is possible to bind the cluster into the protein encoding part has an important role to suppress the expressions of this gene. Also miRNA binds to a complemen-tary sequence in the 3′ untranslated region (3′UTR) of its target mRNA and expression of this mRNA is silenced. The ZNF628 known to be essential for normal growth and development, found in mam-mals, conserved, seems to be functionally important [39]. Was identified to have significant association with Alzheimer’s disease [40]. This in silico research indicates that some miRNAs can regulate gene fam-ily by targeting their coding regions, thus providing an important and novel perspective for decoding the complex mechanism of miRNA/mRNA interplay. Overall, miRNA binding sites in coding regions show bigger regulation than 3′UTR and 5′UTR binding.
Conclusion
In this paper, we identified the features of inter-actions of 1025 B. taurus miRNAs with 315 ZNFs genes mRNAs, 690 miRNAs and 257 mRNAs of E. qaballus ZNFs genes mRNAs and 152 miRNAs with 223 mRNAs of O. aries zf-C2H2 transcrip-tion factors genes. Using the MirTarget program, we predicted miRNA BSs in the CDS, 5’UTR and 3’UTR mRNAs of genes. It has been found that some miRNAs may bind to mRNA of more than one tar-get gene. For example, bta-miR-1777b and bta-miR-1777a have BSs in mRNAs of BCL11B, SP4, ZNF 628, ZNF710, ZNF652, ZNF467, REPIN1, ZNF592 and ZNF771 genes. miR-574 has polysites in 3’UTR mRNA of B. taurus zf-C2H2 transcription factor genes. On the basis of the miRTarget program, the organization of binding sites was established in ar-ranged located sites with overlapping nucleotide se-quences. The cluster organization of miRNA BSs, together with the free energy of miRNA interaction with mRNA, causes competition between miRNAs to bind to mRNA. Since hundreds of miRNAs have now been identified in various farm animal species, more systematic and genome-wide studies will be re-
quired on the effect of miRNAs. This will address how the expression of transcription factors is regu-lated during a diverse range of biological processes by the fast growing miRNA signal networks.
References
1 Ambros V. (2004) The functions of animal microRNAs. Nature, vol. 431, no.7006, pp. 350–355. https://doi.org/10.1038/nature02871.
2 Reinhart B., Weinstein E., Rhoades M., Bar-tel B., et al. (2002) MicroRNAs in plants. Genes Dev., vol. 16, no. 17, pp. 2313. https://doi.org/10.1101/gad.1004402.
3 Bartel D. (2004) MicroRNAs: Genomics, biogenesis, mechanism, and function. Cell, vol. 116, no. 2, pp. 281–297. https://doi.org/10.1016/s0092-8674(04)00045-5.
4 Berezikov E., Guryev V., van de Belt J., Wienholds E., et al. (2005) Phylogenetic shadowing and computational identification of human microR-NA genes. Cell, vol. 120, no. 1, pp. 21–24. https://doi.org/10.1016/j.cell.2004.12.031.
5 Bentwich I., Avniel A., Karov Y., Aharonov R., et al. (2005) Identification of hundreds of con-served and nonconserved human microRNAs. Nat. Genet., vol. 37, no. 7, pp. 766–770. https://doi.org/10.1038/ng1590.
6 Lim L., Lau N., Garrett-Engele P., Grimson A., et al. (2005) Microarray analysis shows that some microRNAs downregulate large numbers of target mRNAs. Nature, vol. 433, no. 7027, pp. 769–773. https://doi.org/10.1038/nature03315.
7 Lewis B., Burge C., Bartel D. (2005) Con-served seed pairing, often flanked by adenosines, in-dicates that thousands of human genes are microRNA targets. Cell, vol. 120, no. 1, pp.15–20. https://doi.org/10.1016/j.cell.2004.12.035.
8 Wu L, Fan J. (2006) MicroRNAs direct rapid deadenylation of mRNA. Proc Natl Acad Sci USA., vol. 103, no. 11, pp. 4034-4039.
9 Standart N., Jackson R. (2007) MicroR-NAs repress translation of m7Gppp-capped target mRNAs in vitro by inhibiting initiation and promot-ing deadenylation. Genes Dev., 2007, vol. 21, no. 16, pp.1975-82.
10 Krishna S., Majumdar I., Grishin N. (2003) Structural classification of zinc fingers: survey 597 and summary. Nucleic Acids Res., vol. 31, no. 2, pp. 532-50. https://doi.org/ 10.1093/nar/gkg161.
11 Matthews J., Sunde M. (2002) Zinc fingers--folds for many occasions. IUBMB
45М.О. Мyrzabekova et al.
Int. j. biol. chem. (Online) International Journal of Biology and Chemistry 13, № 1, 33 (2020)
Life., vol. 54, no. 6, pp. 351-355. https://doi.org/10.1080/15216540216035.
12 Joseph R., Aimee L., Jalkanen A., Heck C., et al. (2018) Sequences encoding C2H2 zinc fingers inhibit polyadenylation and mRNA export in hu-man cells. Sci Rep., vol. 8, no. 16995. https://doi.org/10.1038/s41598-018-35138-4.
13 Ding G., Lorenz P., Kreutzer M., Li Y., et al. (2009) Sys ZNF: The C2H2 zinc finger gene data-base. Nucleic Acids Res., vol. 37, no. 267-73. https://doi.org/10.1093/nar/gkn782
14 Huang S., Wu S., Ding J., Lin J., et al. (2010) MicroRNA-181a modulates gene expression of zinc finger family members by directly targeting their coding regions. Nucleic Acids Res., vol. 38, no. 20, pp. 7211–7218. https://doi.org/10.1093/nar/gkq564
15 Duursma A., Kedde M., Schrier M., Carlos le Sage., et al (2008) miR-148 targets human DNMT3b protein coding region. RNA., vol. 14, no. 5, pp. 872-877. https://doi.org/10.1261/rna.972008
16 Forman J., Legesse-Miller A., Coller H. (2008) A search for conserved sequences in coding regions reveals that the let-7 microRNA targets Dic-er within its coding sequence. Proc. Natl Acad. Sci. USA., vol. 105, no. 39, pp. 14879-14884. https://doi.org/10.1073/pnas.0803230105
17 Tay Y., Zhang J., Thomson A., Lim B., et al. (2008) MicroRNAs to Nanog, Oct4 and Sox2 cod-ing regions modulate embryonic stem cell differen-tiation. Nature, vol. 455, no. 7216. pp. 1124-1128. https://doi.org/10.1038/nature07299
18 Мyrzabekova М., Niyazova R., Ivashchenko А. (2019) Features of bindings of miRNA with genes of MYB family transcription factors of B. taurus, E. caballus, O. aries. Experimental biology, vol. 4, no. 81, pp. 25-32. https://doi.org/10.26577/eb-2019-4-b3
19 Ivashchenko A., Berillo O., Pyrkova A., Ni-yazova R., et al. (2014) MIR-3960 binding sites with mRNA of human genes. Bioinformation, vol. 10, no. 7, pp. 423-427.
20 Kool T. (2001) Hydrogen bonding, base stacking, and steric effects in DNA replication. Annu Rev Biophys Biomol Struct., vol. 30, no. 22, pp. 1–22, https://doi:org/ 10.1146/annurev.biophys.30.1.1
21 Atambaeva Sh., Niyazova R., Berillo O., Ivashchenko A. (2015) The features of binding sites mir-574-5p and mir-574-3p with target genes of mRNA. [Osobennosti saitov svyazyvaniya miR-574-5р i miR-574-3р s mRNA genov mishenei], Biology, vol. 1, no. 63, pp. 349-354
22 Li Wen., Wu Yan., Gao B., Wang Chao., et al. (2019) MiRNA-574-3p inhibits cell progres-
sion by directly targeting CCND2 in colorectal can-cer. Bioscience Reports, vol. 39, no. 12. https://doi.org/10.1042/BSR20190976.
23 Zou M., Guo K., Lv G., Huang W., et al. (2018) Clinicopathologic implications of CD8(+)/Foxp3(+) ratio and miR-574-3p/PD-L1 axis in spinal chordoma patients. Cancer Immunol Immunother., vol. 67, no. 2, pp. 209–224. https://doi.org/10.1007/s00262-017-2080-1
24 Xu H., Liu X., Zhou J., Chen X., et.al. (2016) miR-574-3p acts as a tumor promoter in osteosar-coma by targeting SMAD4 signaling pathway. On-col Lett., vol.12, no. 6, pp. 5247–5253. https://doi.org/10.3892/ol.2016.5355
25 Xu H, Liu X, Zhao J. (2014) Down-regula-tion of miR-3928 promoted osteosarcoma growth. Cell PhysiolBiochem., vol. 33, no. 5, pp. 1547–1556. doi: https://doi.org/10.1159/000358718.
26 Mei Q., Li F., Quan H., Liu Y., et al. (2014) Busulfan inhibits growth of human osteosarcoma through miR-200 family microRNAs in vitro and in vivo. Cancer Sci., vol. 105, no. 7, pp.755–762. https://doi.org/10.1111/cas.12436.
27 Shi Y., Massagué J. (2003) Mechanisms of TGF-beta signaling from cell membrane to the nu-cleus. Cell, vol. 6, no. 13, pp.685–700.https://doi.org/10.1016/S0092-8674(03)00432-X.
28 Jen J., Lin L., Chen T., Liao S., et al. (2016) Oncoprotein ZNF322A transcriptionally deregulates alpha-adducin, cyclin D1 and p53 to promote tumor growth and metastasis in lung cancer. Oncogene, vol. 35, no. 18, pp. 2357-69. https://doi.org/10.1038/onc.2015.296
29 Yang L., Hamilton S., Sood A., Kuwai T., et al. (2008) The previously undescribed ZKSCAN3 (ZNF306) is a novel “driver” of colorectal cancer progression. Boyd Cancer Research, vol. 68, no. 11, pp. 4321-30.
30 Lai K., Chen J., He M., Ching A., et al. (2014) Wong Overexpression of ZFX confers self-renewal and chemoresistance properties in hepato-cellular carcinoma. Int J Cancer., vol. 135, no. 8, pp.1790-9.
31 Fong C., White P., Peterson K., Sapienza C., et al. (1992) Loss of heterozygosity for chromosomes 1 or 14 defines subsets of advanced neuroblastomas. Cancer Research, vol. 52, pp. 1780-1785.
32 Simon D., Knowles B., Weith A. (1991), Abnormalities of chromosome 1 and loss of hetero-zygosity on 1p in primary hepatomas. Oncogene, vol. 6, pp. 765-770
33 Abbondanza C.., De Rosa C., D’Arcangelo A., Pacifico M., et al. (2012) Identification of a func-
46 Features of miRNAs binding sites within the C2H2 ZNF family: a Bos taurus, Eqqus caballus, and Ovies aries...
Int. j. biol. chem. (Online) International Journal of Biology and Chemistry 13, № 1, 33 (2020)
tional estrogen-responsive enhancer element in the promoter 2 of PRDM2 gene in breast cancer cell lines. J Cell Physiol., vol. 227, no. 3, pp. 964-75. https://doi.org/ 10.1002/jcp.22803.
34 Zhang C., Zhu Q., He H., Jiang L., et al. (2016) RIZ1: a potential tumor suppressor in glioma. BMC Cancer., vol. 16, no. 26, pp. 990. https://doi.org/10.1186/s12885-016-2067-x
35 Wakabayashi Y., Watanabe H., Inoue J., Takeda N., et al. (2003) Bcl11b is required for dif-ferentiation and survival of alphabeta T lymphocytes. Nat Immunol., vol. 4, no. 6, pp. 533-9.
36 Unoki M., Okutsu J., Nakamura Y. (2003) Identification of a novel human gene, ZFP91, in-volved in acute myelogenousleukemia. Oncol., vol. 22, no. 6, pp. 1217-23.
37 Xiao G., Fu J. (2011) NF-κB and cancer: a paradigm of Yin-Yang. Cancer Research, vol. 1, no. 2, pp.192-221.
38 Lee J., Lee J., Lee K., Hong Ys., et al. (2008) Therapeutic agent for cancer, inflammation and auto-immune disease containing inhibitor of Zinc Finger Protein 91. US Patent 20: 080,248,024.
39 Chen G., Muramatsu H., Ichihara-Tanaka K., Muramatsu T. (2004) ZEC, a zinc finger pro-tein with novel binding specificity and transcrip-tion regulatory activity. Gene, vol. 340, no. 1, pp. 71-81.
40 Kim J., Song P., Lim H., Lee J., et al. (2014) Gene-based rare allele analyses identified a risk gene of Alzheimer’s disease. Plos One, vol. 9, no. 10, https://doi.org/10.1371/journal.pone.0107983.
© 2020 al-Farabi Kazakh National University Int. j. biol. chem. (Online)
International Journal of Biology and Chemistry 13, № 1, 47 (2020)
IRSTI 34.29.25 https://doi.org/10.26577/ijbch.2020.v13.i1.05
M.M. Yermagambetova1,2 , A.B. Kusmangazinov1,2 ,
M.S. Kurmanbayeva2* , M. Höhn3
1Institute of Plant Biology and Biotechnology, Laboratory of Molecular Genetics, Almaty, Kazakhstan 2Al-Farabi Kazakh National University, Almaty, Kazakhstan
3Szent Istvan University, Department of Botany and Soroksár Botanical Garden, Budapest, Hungary *e-mail: [email protected]
Study of changes in anatomical structures of young needles Picea schrenkiana Fisch et C.A. Mey and
shoots of Haloxylon bunge species in Kazakhstan
Abstract. The work is devoted to the anatomical study of five populations of the forest-forming species Picea schrenkiana, which grows in the Trans Ili Alatau range of Northern Tian Shan Mountains, and three species of the desert tree Haloxylon, which grows in three regions of Kazakhstan. As the study was taken young needles of P. schrenkiana and shoots of Haloxylon species. In this study, anatomical analyses of young needles from five populations of P. schrenkiana and shoots from three Haloxylon species were performed to identify and describe anatomical features in search of distinctive features that could be used to determine the characteristics of these species. In the cross-section of P. schrenkiana needles, all five populations have a rectangular shape, and the tissue types and their location are similar in all populations. Study of the young needles of P. schrenkiana revealed the presence of the epidermis, hypodermis, stomata, mesophyll, resin ducts, endodermis and vascular bundles all of the five populations. The area of the vascular bundles varies from 141.4 ± 1.9 to 182.7 ± 1.4 µm². Comparatively, all indicators were the same, which means that the origins of all five populations are similar to each other. As a result, the anatomical structure of P. schrenkiana needles corresponds to the structure of coniferous plants. In the study of three species of Haloxylon, more precisely Haloxylon aphyllum, Haloxylon persicum, Haloxylon ammodendron, differences were found in the section of each species. This is possible due to the fact that they grow in three different regions and different environmental conditions. And it proves that the environmental conditions of the place where these species grow affects the anatomy and structure of plants.Key words: Picea schrenkiana, Haloxylon aphyllum, Haloxylon persicum, Haloxylon ammodendron, scanning electron microscopy, anatomical signs, vegetative organs of plants.
Introduction
Despite the fact that the territory of Kazakhstan is vast, it has little forest resources. Forests cover only 4-6% (12.4 million hectares) of the total area. The country has the third largest forest area in East-ern Europe and Central Asia. Forests are unevenly distributed across the country: forest cover is gener-ally 4.57 %, and in some administrative regions 16% in Eastern Kazakhstan prevails compared to 0.1% in Western Kazakhstan, in particular in Almaty, conif-erous plantations range from 10-13 %, and deciduous – 12 % and are located in tracts on the inclination of the southern and Eastern mountains. Also, the for-ests are dominated by saxaul forests, which occupy
49.8 % of the area, and shrub plantations – 24.1%, located mainly in the desert and steppe zones.
The problem of preserving forest genetic resourc-es for current and future generations is becoming in-creasingly important. Due to the rapid development of scientific and technological progress, the threat of extinction of plant diversity and, above all, forests has increased dramatically. The role of woody vegetation in maintaining the quality of the environment is well known, but even more so in its utilitarian value.
The distribution of ecosystems is subject to the law of latitudinal zoning on the plains and high-alti-tude zoning in the mountains. On the plains, forest-steppe, steppe and desert ecosystems are major zonal associations.
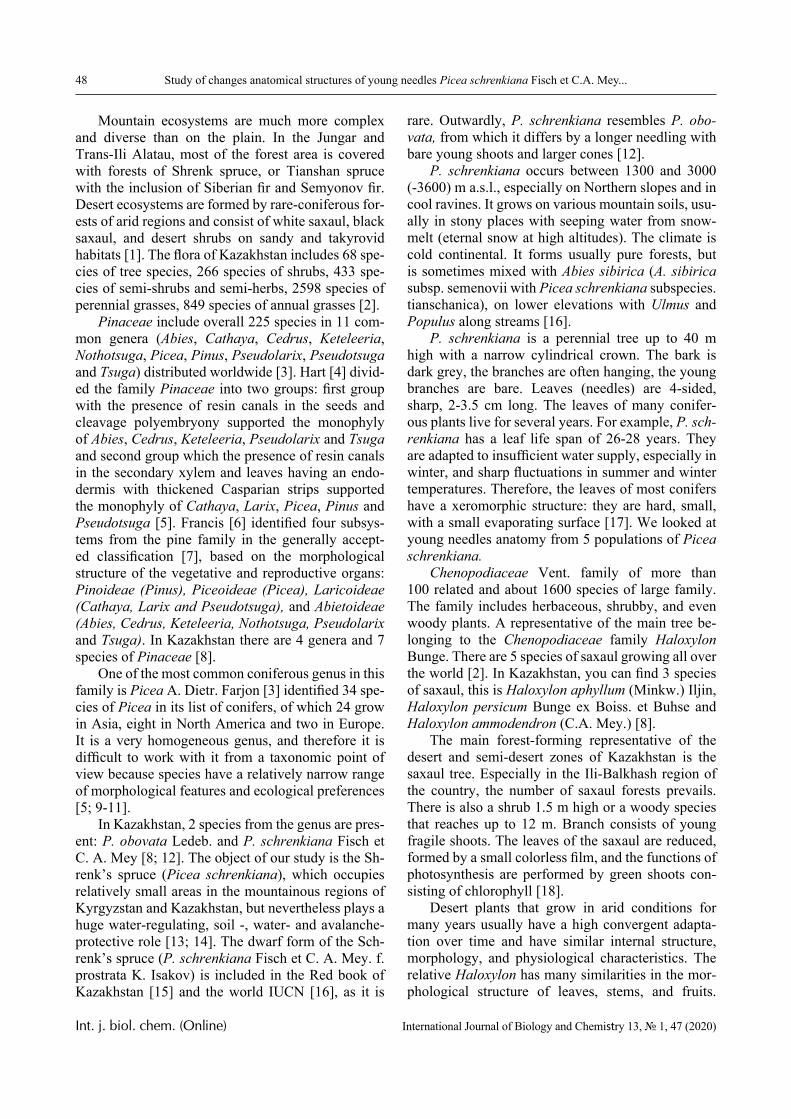
48 Study of changes anatomical structures of young needles Picea schrenkiana Fisch et C.A. Mey...
Int. j. biol. chem. (Online) International Journal of Biology and Chemistry 13, № 1, 47 (2020)
Mountain ecosystems are much more complex and diverse than on the plain. In the Jungar and Trans-Ili Alatau, most of the forest area is covered with forests of Shrenk spruce, or Tianshan spruce with the inclusion of Siberian fir and Semyonov fir. Desert ecosystems are formed by rare-coniferous for-ests of arid regions and consist of white saxaul, black saxaul, and desert shrubs on sandy and takyrovid habitats [1]. The flora of Kazakhstan includes 68 spe-cies of tree species, 266 species of shrubs, 433 spe-cies of semi-shrubs and semi-herbs, 2598 species of perennial grasses, 849 species of annual grasses [2].
Pinaceae include overall 225 species in 11 com-mon genera (Abies, Cathaya, Cedrus, Keteleeria, Nothotsuga, Picea, Pinus, Pseudolarix, Pseudotsuga and Tsuga) distributed worldwide [3]. Hart [4] divid-ed the family Pinaceae into two groups: first group with the presence of resin canals in the seeds and cleavage polyembryony supported the monophyly of Abies, Cedrus, Keteleeria, Pseudolarix and Tsuga and second group which the presence of resin canals in the secondary xylem and leaves having an endo-dermis with thickened Casparian strips supported the monophyly of Cathaya, Larix, Picea, Pinus and Pseudotsuga [5]. Francis [6] identified four subsys-tems from the pine family in the generally accept-ed classification [7], based on the morphological structure of the vegetative and reproductive organs: Pinoideae (Pinus), Piceoideae (Picea), Laricoideae (Cathaya, Larix and Pseudotsuga), and Abietoideae (Abies, Cedrus, Keteleeria, Nothotsuga, Pseudolarix and Tsuga). In Kazakhstan there are 4 genera and 7 species of Pinaceae [8].
One of the most common coniferous genus in this family is Picea A. Dietr. Farjon [3] identified 34 spe-cies of Picea in its list of conifers, of which 24 grow in Asia, eight in North America and two in Europe. It is a very homogeneous genus, and therefore it is difficult to work with it from a taxonomic point of view because species have a relatively narrow range of morphological features and ecological preferences [5; 9-11].
In Kazakhstan, 2 species from the genus are pres-ent: P. obovata Ledeb. and P. schrenkiana Fisch et C. A. Mey [8; 12]. The object of our study is the Sh-renk’s spruce (Picea schrenkiana), which occupies relatively small areas in the mountainous regions of Kyrgyzstan and Kazakhstan, but nevertheless plays a huge water-regulating, soil -, water- and avalanche-protective role [13; 14]. The dwarf form of the Sch-renk’s spruce (P. schrenkiana Fisch et C. A. Mey. f. prostrata K. Isakov) is included in the Red book of Kazakhstan [15] and the world IUCN [16], as it is
rare. Outwardly, P. schrenkiana resembles P. obo-vata, from which it differs by a longer needling with bare young shoots and larger cones [12].
P. schrenkiana occurs between 1300 and 3000 (-3600) m a.s.l., especially on Northern slopes and in cool ravines. It grows on various mountain soils, usu-ally in stony places with seeping water from snow-melt (eternal snow at high altitudes). The climate is cold continental. It forms usually pure forests, but is sometimes mixed with Abies sibirica (A. sibirica subsp. semenovii with Picea schrenkiana subspecies. tianschanica), on lower elevations with Ulmus and Populus along streams [16].
P. schrenkiana is a perennial tree up to 40 m high with a narrow cylindrical crown. The bark is dark grey, the branches are often hanging, the young branches are bare. Leaves (needles) are 4-sided, sharp, 2-3.5 cm long. The leaves of many conifer-ous plants live for several years. For example, P. sch-renkiana has a leaf life span of 26-28 years. They are adapted to insufficient water supply, especially in winter, and sharp fluctuations in summer and winter temperatures. Therefore, the leaves of most conifers have a xeromorphic structure: they are hard, small, with a small evaporating surface [17]. We looked at young needles anatomy from 5 populations of Picea schrenkiana.
Chenopodiaceae Vent. family of more than 100 related and about 1600 species of large family. The family includes herbaceous, shrubby, and even woody plants. A representative of the main tree be-longing to the Chenopodiaceae family Haloxylon Bunge. There are 5 species of saxaul growing all over the world [2]. In Kazakhstan, you can find 3 species of saxaul, this is Haloxylon aphyllum (Minkw.) Iljin, Haloxylon persicum Bunge ex Boiss. et Buhse and Haloxylon ammodendron (C.A. Mey.) [8].
The main forest-forming representative of the desert and semi-desert zones of Kazakhstan is the saxaul tree. Especially in the Ili-Balkhash region of the country, the number of saxaul forests prevails. There is also a shrub 1.5 m high or a woody species that reaches up to 12 m. Branch consists of young fragile shoots. The leaves of the saxaul are reduced, formed by a small colorless film, and the functions of photosynthesis are performed by green shoots con-sisting of chlorophyll [18].
Desert plants that grow in arid conditions for many years usually have a high convergent adapta-tion over time and have similar internal structure, morphology, and physiological characteristics. The relative Haloxylon has many similarities in the mor-phological structure of leaves, stems, and fruits.
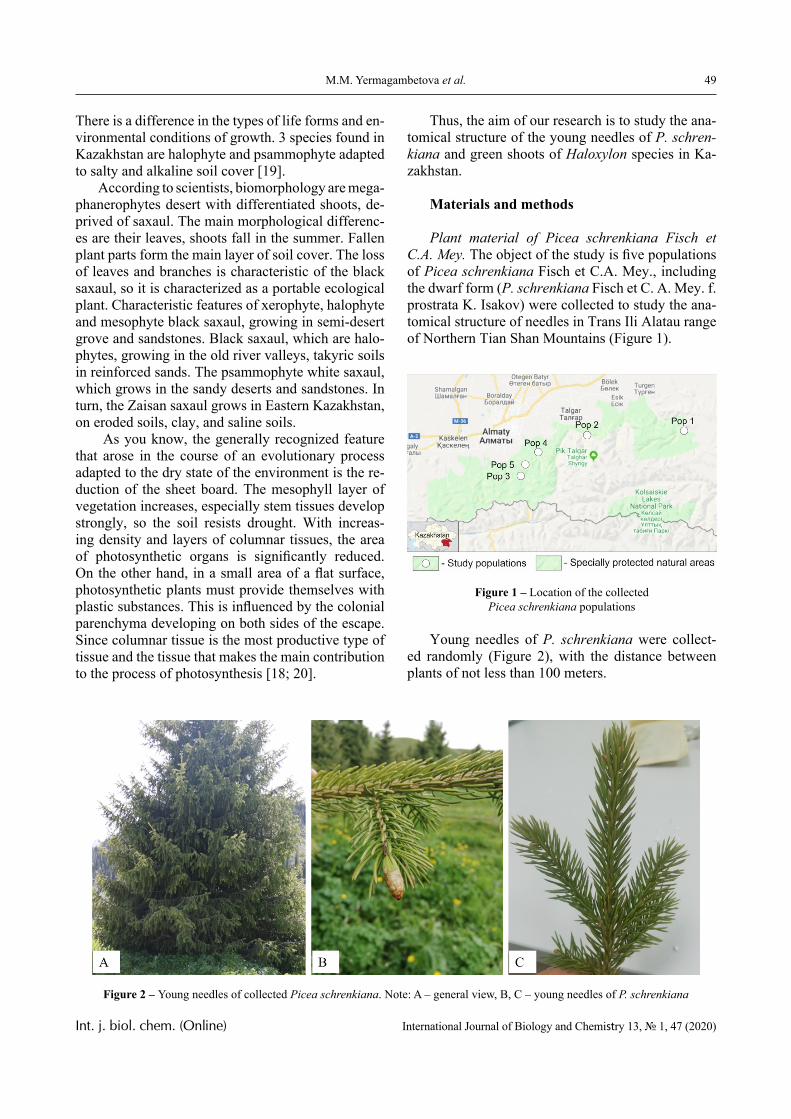
49M.M. Yermagambetova et al.
Int. j. biol. chem. (Online) International Journal of Biology and Chemistry 13, № 1, 47 (2020)
There is a difference in the types of life forms and en-vironmental conditions of growth. 3 species found in Kazakhstan are halophyte and psammophyte adapted to salty and alkaline soil cover [19].
According to scientists, biomorphology are mega-phanerophytes desert with differentiated shoots, de-prived of saxaul. The main morphological differenc-es are their leaves, shoots fall in the summer. Fallen plant parts form the main layer of soil cover. The loss of leaves and branches is characteristic of the black saxaul, so it is characterized as a portable ecological plant. Characteristic features of xerophyte, halophyte and mesophyte black saxaul, growing in semi-desert grove and sandstones. Black saxaul, which are halo-phytes, growing in the old river valleys, takyric soils in reinforced sands. The psammophyte white saxaul, which grows in the sandy deserts and sandstones. In turn, the Zaisan saxaul grows in Eastern Kazakhstan, on eroded soils, clay, and saline soils.
As you know, the generally recognized feature that arose in the course of an evolutionary process adapted to the dry state of the environment is the re-duction of the sheet board. The mesophyll layer of vegetation increases, especially stem tissues develop strongly, so the soil resists drought. With increas-ing density and layers of columnar tissues, the area of photosynthetic organs is significantly reduced. On the other hand, in a small area of a flat surface, photosynthetic plants must provide themselves with plastic substances. This is influenced by the colonial parenchyma developing on both sides of the escape. Since columnar tissue is the most productive type of tissue and the tissue that makes the main contribution to the process of photosynthesis [18; 20].
Thus, the aim of our research is to study the ana-tomical structure of the young needles of P. schren-kiana and green shoots of Haloxylon species in Ka-zakhstan.
Materials and methods
Plant material of Picea schrenkiana Fisch et C.A. Mey. The object of the study is five populations of Picea schrenkiana Fisch et C.A. Mey., including the dwarf form (P. schrenkiana Fisch et C. A. Mey. f. prostrata K. Isakov) were collected to study the ana-tomical structure of needles in Trans Ili Alatau range of Northern Tian Shan Mountains (Figure 1).
Figure 1 – Location of the collected Picea schrenkiana populations
Young needles of P. schrenkiana were collect-ed randomly (Figure 2), with the distance between plants of not less than 100 meters.
Figure 2 – Young needles of collected Picea schrenkiana. Note: A – general view, B, C – young needles of P. schrenkiana
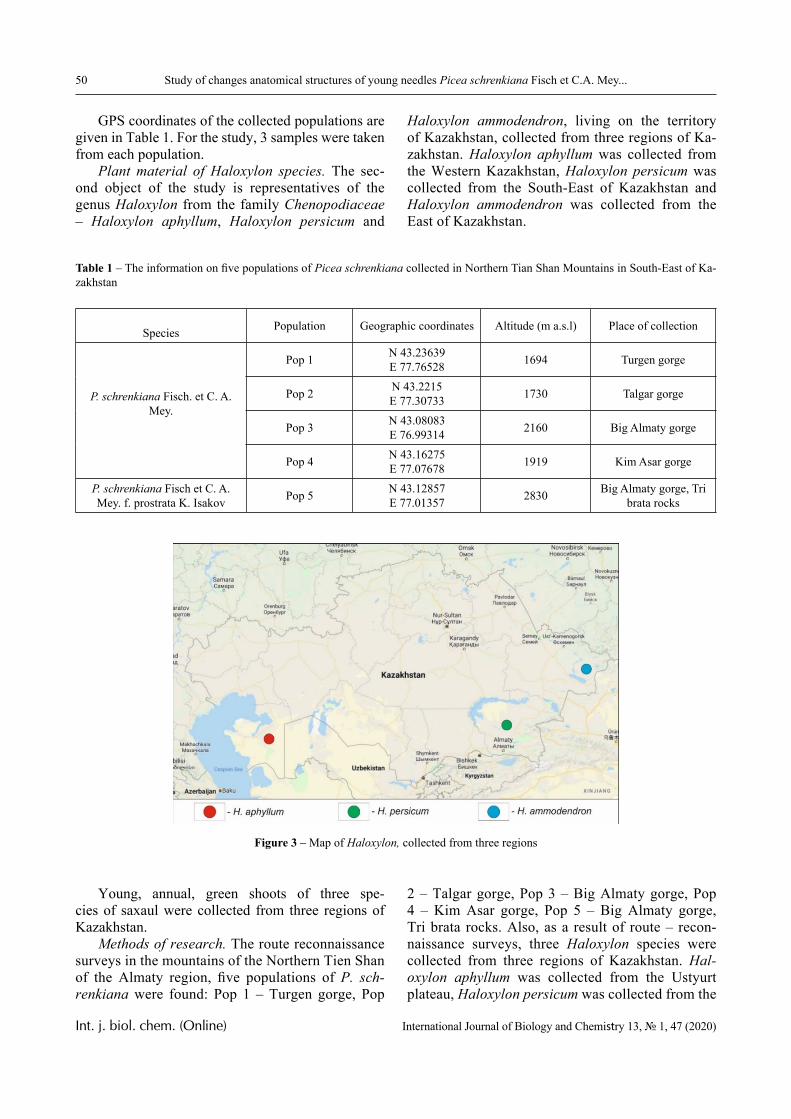
50 Study of changes anatomical structures of young needles Picea schrenkiana Fisch et C.A. Mey...
Int. j. biol. chem. (Online) International Journal of Biology and Chemistry 13, № 1, 47 (2020)
GPS coordinates of the collected populations are given in Table 1. For the study, 3 samples were taken from each population.
Plant material of Haloxylon species. The sec-ond object of the study is representatives of the genus Haloxylon from the family Chenopodiaceae – Haloxylon aphyllum, Haloxylon persicum and
Haloxylon ammodendron, living on the territory of Kazakhstan, collected from three regions of Ka-zakhstan. Haloxylon aphyllum was collected from the Western Kazakhstan, Haloxylon persicum was collected from the South-East of Kazakhstan and Haloxylon ammodendron was collected from the East of Kazakhstan.
Table 1 – The information on five populations of Picea schrenkiana collected in Northern Tian Shan Mountains in South-East of Ka-zakhstan
Species Population Geographic coordinates Altitude (m a.s.l) Place of collection
P. schrenkiana Fisch. et C. A. Mey.
Pop 1 N 43.23639E 77.76528 1694 Turgen gorge
Pop 2 N 43.2215E 77.30733 1730 Talgar gorge
Pop 3 N 43.08083E 76.99314 2160 Big Almaty gorge
Pop 4 N 43.16275E 77.07678 1919 Kim Asar gorge
P. schrenkiana Fisch et C. A. Mey. f. prostrata K. Isakov Pop 5 N 43.12857
E 77.01357 2830 Big Almaty gorge, Tri brata rocks
Figure 3 – Map of Haloxylon, collected from three regions
Young, annual, green shoots of three spe-cies of saxaul were collected from three regions of Kazakhstan.
Methods of research. The route reconnaissance surveys in the mountains of the Northern Tien Shan of the Almaty region, five populations of P. sch-renkiana were found: Pop 1 – Turgen gorge, Pop
2 – Talgar gorge, Pop 3 – Big Almaty gorge, Pop 4 – Kim Asar gorge, Pop 5 – Big Almaty gorge, Tri brata rocks. Also, as a result of route – recon-naissance surveys, three Haloxylon species were collected from three regions of Kazakhstan. Hal-oxylon aphyllum was collected from the Ustyurt plateau, Haloxylon persicum was collected from the
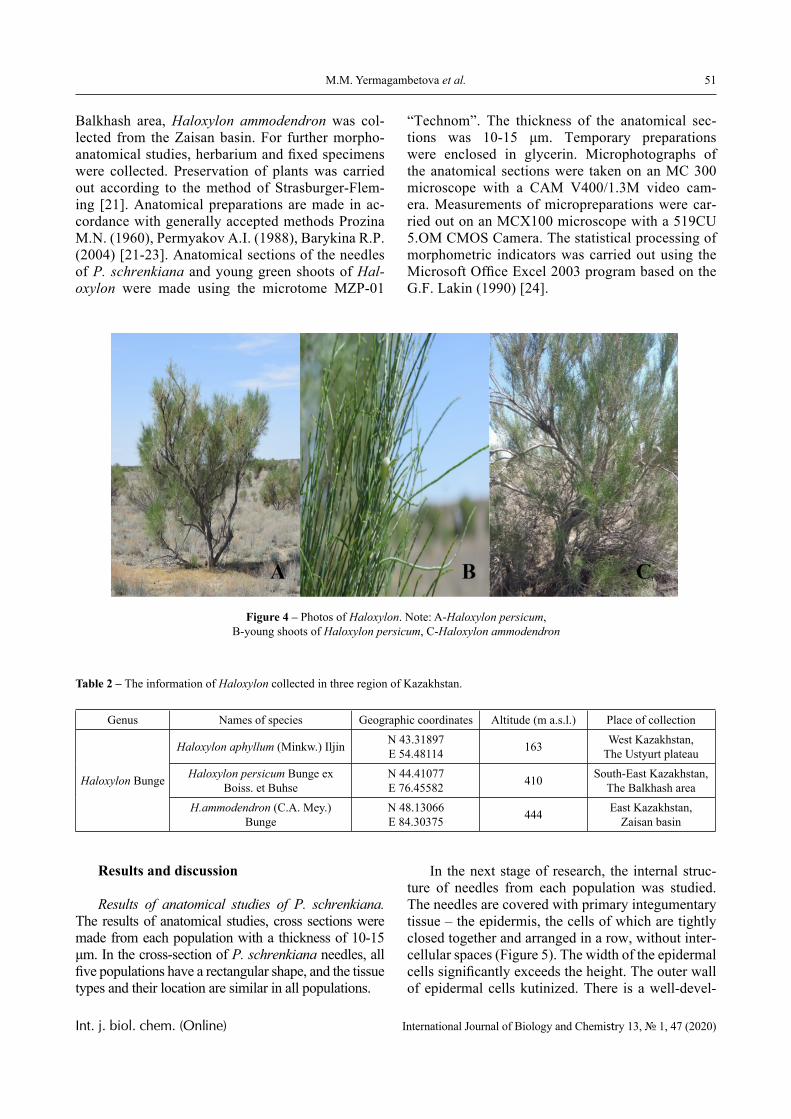
51M.M. Yermagambetova et al.
Int. j. biol. chem. (Online) International Journal of Biology and Chemistry 13, № 1, 47 (2020)
Balkhash area, Haloxylon ammodendron was col-lected from the Zaisan basin. For further morpho-anatomical studies, herbarium and fixed specimens were collected. Preservation of plants was carried out according to the method of Strasburger-Flem-ing [21]. Anatomical preparations are made in ac-cordance with generally accepted methods Prozina M.N. (1960), Permyakov A.I. (1988), Barykina R.P. (2004) [21-23]. Anatomical sections of the needles of P. schrenkiana and young green shoots of Hal-oxylon were made using the microtome MZP-01
“Technom”. The thickness of the anatomical sec-tions was 10-15 μm. Temporary preparations were enclosed in glycerin. Microphotographs of the anatomical sections were taken on an MC 300 microscope with a CAM V400/1.3M video cam-era. Measurements of micropreparations were car-ried out on an MCX100 microscope with a 519CU 5.OM CMOS Camera. The statistical processing of morphometric indicators was carried out using the Microsoft Office Excel 2003 program based on the G.F. Lakin (1990) [24].
Figure 4 – Photos of Haloxylon. Note: A-Haloxylon persicum, B-young shoots of Haloxylon persicum, C-Haloxylon ammodendron
Table 2 – The information of Haloxylon collected in three region of Kazakhstan.
Genus Names of species Geographic coordinates Altitude (m a.s.l.) Place of collection
Haloxylon Bunge
Haloxylon aphyllum (Minkw.) Iljin N 43.31897E 54.48114 163 West Kazakhstan,
The Ustyurt plateauHaloxylon persicum Bunge ex
Boiss. et BuhseN 44.41077E 76.45582 410 South-East Kazakhstan,
The Balkhash areaH.ammodendron (C.A. Mey.)
BungeN 48.13066E 84.30375 444 East Kazakhstan,
Zaisan basin
Results and discussion
Results of anatomical studies of P. schrenkiana. The results of anatomical studies, cross sections were made from each population with a thickness of 10-15 μm. In the cross-section of P. schrenkiana needles, all five populations have a rectangular shape, and the tissue types and their location are similar in all populations.
In the next stage of research, the internal struc-ture of needles from each population was studied. The needles are covered with primary integumentary tissue – the epidermis, the cells of which are tightly closed together and arranged in a row, without inter-cellular spaces (Figure 5). The width of the epidermal cells significantly exceeds the height. The outer wall of epidermal cells kutinized. There is a well-devel-
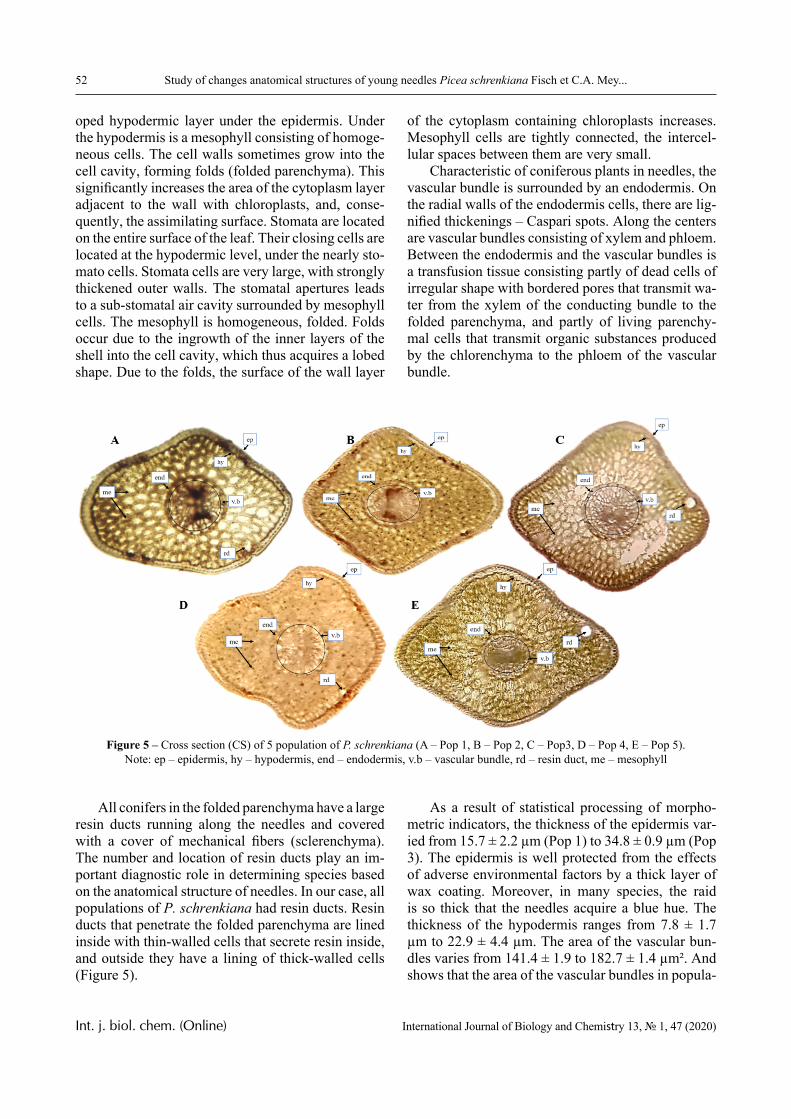
52 Study of changes anatomical structures of young needles Picea schrenkiana Fisch et C.A. Mey...
Int. j. biol. chem. (Online) International Journal of Biology and Chemistry 13, № 1, 47 (2020)
oped hypodermic layer under the epidermis. Under the hypodermis is a mesophyll consisting of homoge-neous cells. The cell walls sometimes grow into the cell cavity, forming folds (folded parenchyma). This significantly increases the area of the cytoplasm layer adjacent to the wall with chloroplasts, and, conse-quently, the assimilating surface. Stomata are located on the entire surface of the leaf. Their closing cells are located at the hypodermic level, under the nearly sto-mato cells. Stomata cells are very large, with strongly thickened outer walls. The stomatal apertures leads to a sub-stomatal air cavity surrounded by mesophyll cells. The mesophyll is homogeneous, folded. Folds occur due to the ingrowth of the inner layers of the shell into the cell cavity, which thus acquires a lobed shape. Due to the folds, the surface of the wall layer
of the cytoplasm containing chloroplasts increases. Mesophyll cells are tightly connected, the intercel-lular spaces between them are very small.
Characteristic of coniferous plants in needles, the vascular bundle is surrounded by an endodermis. On the radial walls of the endodermis cells, there are lig-nified thickenings – Caspari spots. Along the centers are vascular bundles consisting of xylem and phloem. Between the endodermis and the vascular bundles is a transfusion tissue consisting partly of dead cells of irregular shape with bordered pores that transmit wa-ter from the xylem of the conducting bundle to the folded parenchyma, and partly of living parenchy-mal cells that transmit organic substances produced by the chlorenchyma to the phloem of the vascular bundle.
Figure 5 – Cross section (CS) of 5 population of P. schrenkiana (A – Pop 1, B – Pop 2, C – Pop3, D – Pop 4, E – Pop 5). Note: ep – epidermis, hy – hypodermis, end – endodermis, v.b – vascular bundle, rd – resin duct, me – mesophyll
All conifers in the folded parenchyma have a large resin ducts running along the needles and covered with a cover of mechanical fibers (sclerenchyma). The number and location of resin ducts play an im-portant diagnostic role in determining species based on the anatomical structure of needles. In our case, all populations of P. schrenkiana had resin ducts. Resin ducts that penetrate the folded parenchyma are lined inside with thin-walled cells that secrete resin inside, and outside they have a lining of thick-walled cells (Figure 5).
As a result of statistical processing of morpho-metric indicators, the thickness of the epidermis var-ied from 15.7 ± 2.2 µm (Pop 1) to 34.8 ± 0.9 µm (Pop 3). The epidermis is well protected from the effects of adverse environmental factors by a thick layer of wax coating. Moreover, in many species, the raid is so thick that the needles acquire a blue hue. The thickness of the hypodermis ranges from 7.8 ± 1.7 µm to 22.9 ± 4.4 µm. The area of the vascular bun-dles varies from 141.4 ± 1.9 to 182.7 ± 1.4 µm². And shows that the area of the vascular bundles in popula-
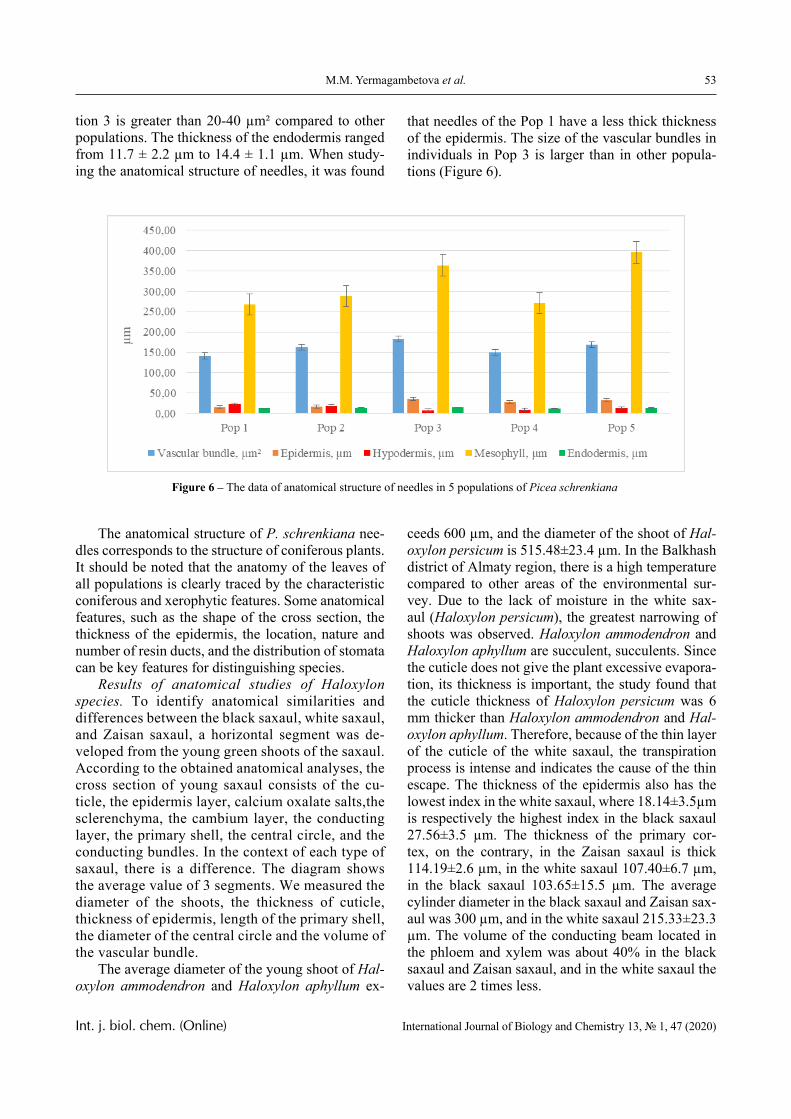
53M.M. Yermagambetova et al.
Int. j. biol. chem. (Online) International Journal of Biology and Chemistry 13, № 1, 47 (2020)
tion 3 is greater than 20-40 µm² compared to other populations. The thickness of the endodermis ranged from 11.7 ± 2.2 µm to 14.4 ± 1.1 µm. When study-ing the anatomical structure of needles, it was found
that needles of the Pop 1 have a less thick thickness of the epidermis. The size of the vascular bundles in individuals in Pop 3 is larger than in other popula-tions (Figure 6).
Figure 6 – The data of anatomical structure of needles in 5 populations of Picea schrenkiana
The anatomical structure of P. schrenkiana nee-dles corresponds to the structure of coniferous plants. It should be noted that the anatomy of the leaves of all populations is clearly traced by the characteristic coniferous and xerophytic features. Some anatomical features, such as the shape of the cross section, the thickness of the epidermis, the location, nature and number of resin ducts, and the distribution of stomata can be key features for distinguishing species.
Results of anatomical studies of Haloxylon species. To identify anatomical similarities and differences between the black saxaul, white saxaul, and Zaisan saxaul, a horizontal segment was de-veloped from the young green shoots of the saxaul. According to the obtained anatomical analyses, the cross section of young saxaul consists of the cu-ticle, the epidermis layer, calcium oxalate salts,the sclerenchyma, the cambium layer, the conducting layer, the primary shell, the central circle, and the conducting bundles. In the context of each type of saxaul, there is a difference. The diagram shows the average value of 3 segments. We measured the diameter of the shoots, the thickness of cuticle, thickness of epidermis, length of the primary shell, the diameter of the central circle and the volume of the vascular bundle.
The average diameter of the young shoot of Hal-oxylon ammodendron and Haloxylon aphyllum ex-
ceeds 600 µm, and the diameter of the shoot of Hal-oxylon persicum is 515.48±23.4 µm. In the Balkhash district of Almaty region, there is a high temperature compared to other areas of the environmental sur-vey. Due to the lack of moisture in the white sax-aul (Haloxylon persicum), the greatest narrowing of shoots was observed. Haloxylon ammodendron and Haloxylon aphyllum are succulent, succulents. Since the cuticle does not give the plant excessive evapora-tion, its thickness is important, the study found that the cuticle thickness of Haloxylon persicum was 6 mm thicker than Haloxylon ammodendron and Hal-oxylon aphyllum. Therefore, because of the thin layer of the cuticle of the white saxaul, the transpiration process is intense and indicates the cause of the thin escape. The thickness of the epidermis also has the lowest index in the white saxaul, where 18.14±3.5µm is respectively the highest index in the black saxaul 27.56±3.5 µm. The thickness of the primary cor-tex, on the contrary, in the Zaisan saxaul is thick 114.19±2.6 µm, in the white saxaul 107.40±6.7 µm, in the black saxaul 103.65±15.5 µm. The average cylinder diameter in the black saxaul and Zaisan sax-aul was 300 µm, and in the white saxaul 215.33±23.3 µm. The volume of the conducting beam located in the phloem and xylem was about 40% in the black saxaul and Zaisan saxaul, and in the white saxaul the values are 2 times less.
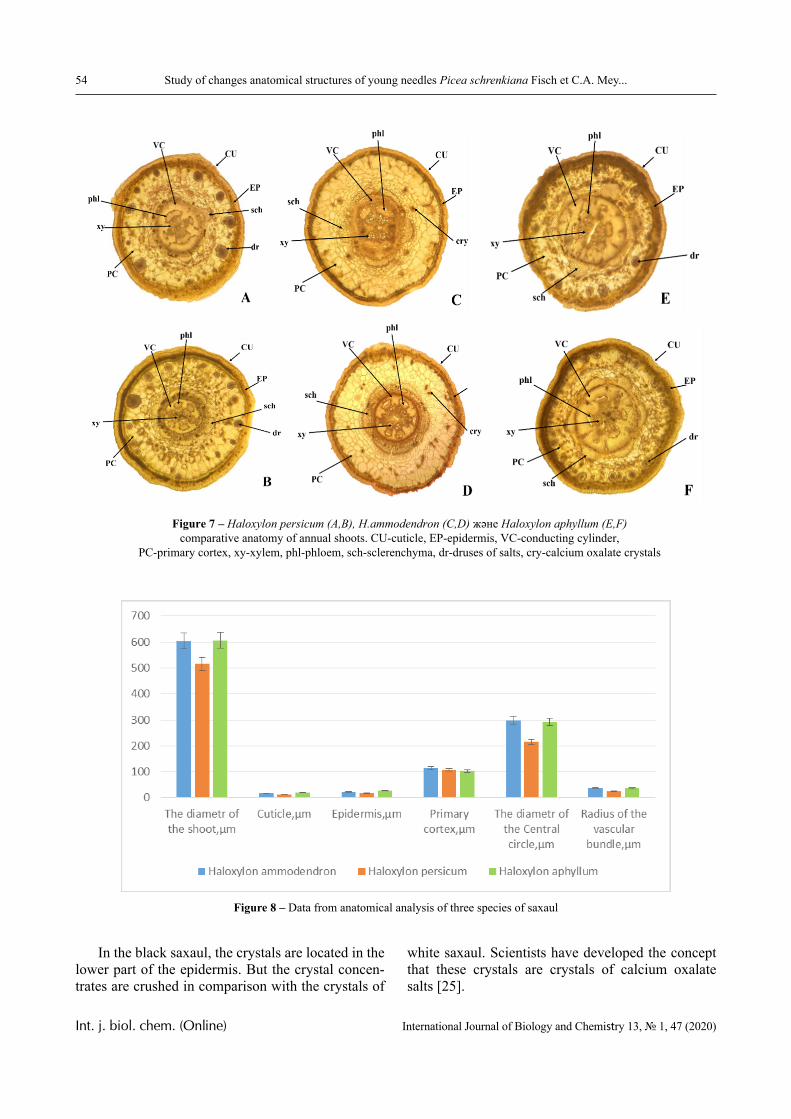
54 Study of changes anatomical structures of young needles Picea schrenkiana Fisch et C.A. Mey...
Int. j. biol. chem. (Online) International Journal of Biology and Chemistry 13, № 1, 47 (2020)
Figure 7 – Haloxylon persicum (A,B), H.ammodendron (C,D) және Haloxylon aphyllum (E,F) comparative anatomy of annual shoots. CU-cuticle, EP-epidermis, VC-conducting cylinder,
PC-primary cortex, xy-xylem, phl-phloem, sch-sclerenchyma, dr-druses of salts, cry-calcium oxalate crystals
Figure 8 – Data from anatomical analysis of three species of saxaul
In the black saxaul, the crystals are located in the lower part of the epidermis. But the crystal concen-trates are crushed in comparison with the crystals of
white saxaul. Scientists have developed the concept that these crystals are crystals of calcium oxalate salts [25].
55M.M. Yermagambetova et al.
Int. j. biol. chem. (Online) International Journal of Biology and Chemistry 13, № 1, 47 (2020)
In the anatomical structure of saxaul shoots, a large number of crystals indicates that it grows in a salty area. The mineralization of groundwater can withstand up to 40 g/L and since sodium belongs to the group of alkaline plants [26], the crystals contain more black saxaul than white saxaul.
Conclusion
In conclusion, it should be noted that the anatomy of the needles of all populations is clearly traced by the characteristic coniferous and xerophytic features. Certain anatomical features, such as the shape of the cross section, the location of the subcutaneous tissue, the location, nature, and number of resin ducts, and the distribution of stomata may be key features for distinguishing species. Аnatomical data is useful for the systematic study of conifers, and this study has provided potential results for systematic and phylo-genetic studies of Picea. Similar studies on other spe-cies will help clarify the phylogenetic relationships between populations in each species and between species [27].
The following conclusions were made during the analysis of the anatomical structure of the sax-aul. The morphometric index of the Haloxylon am-modendron and Haloxylon aphyllum plants is much higher than that of Haloxylon persicum. The anatom-ical structure of the saxaul species, the location of the phloem and xylem are similar. The location of the crystal salts can be clearly seen from the horizontal section. In the Zaisan saxaul, salt crystals are located in the center of the shell. The shapes are round, small crystals in the form of eggs. In the white saxaul, the crystals are large, several crystals form a druze. The crystals are located in the lower part of the epidermis. Thus, according to the results of studies, it is possible to determine the type of plants by their anatomical sections, by the presence and location of crystals of calcium oxalate and other salts. These results can be used to find out under what environmental conditions this plant grew.
Acknowledgements
This work was supported by the grant AP05131621 (2018-2020) from the Ministry of Edu-cation and Sciences, Republic of Kazakhstan. The authors thank the staff of the Laboratory of Molecular genetics, Institute of Plant Biology and Biotechnol-ogy, Almaty, Kazakhstan for their help in collecting samples of P. schrenkiana needles and shoots of Hal-oxylon species. The authors are thankful to Dr. Mária
Höhn (Szent Istvan University, Budapest, Hungary) for the critical reading of the manuscript.
References
1 Radionov A. (2013). The states of forest ge-netic resources in the SEC region, the Republic of Kazakhstan country report, Ankara, FAO, 131 p.
2 Pavlov N. (1960). Flora of Kazakhstan [Flora Kazahstana], Alma-Ata: AS KazSSR, vol. 3, 477 p.
3 Farjon A. (2001). World Checklist and Bib-liography of Conifers. 2nd ed., Kew Royal Botanical Garden, 309 p.
4 Hart J.A. (1987). A cladistic analysis of conifers: preliminary results. J. Arnold Arboretum, vol. 68, pp. 269-307.
5 Ghimire B., Lee C., Yang J., Heo K. (2015). Comparative leaf anatomy of some species of Ab-ies and Picea (Pinaceae). Acta Bot. Bras., vol. 29, no. 3, pp. 346-353. https://doi.org/10.1590/0102-33062014abb0009.
6 Frankis M.P. (1988). Generic inter-relation-ships in Pinaceae. Notes from the Royal Botanic Gar-den, Edinburgh, vol. 45, pp. 527-548.
7 Farjon A, Rushforth K.D. (1990). A clas-sification of Abies Miller (Pinaceae). Notes from the Royal Botanic Garden, Edinburgh, vol. 46, pp. 59-79.
8 Abdulina S.A. (1998) Checklist of vascu-lar plants of Kazakhstan [Spisok sosudistyh rastenij Kazahstana]. Ed. by R.V. Kamelin, Almaty, 187 p.
9 Wright J.W. (1955). Species cross ability in spruce in relation to distribution and taxonomy. Forest Science, vol. 1, pp. 319-340.
10 Taylor R.J, Patterson T.F. (1980). Biosyste-matics of Mexican spruce species and populations. Taxon., vol. 29, no. 4, pp. 421-469.
11 Rehfeldt G.E. (1994). Adaptation of Picea engelmannii populations to the heterogeneous envi-ronments of the Intermountain West. Can. J. Botany, vol. 72, pp. 1197-1208.
12 Baitenov M.S. (2001). Flora of Kazakhstan [Flora Kazakhstana]. Genus complex of flora. Alma-ty, Gylym, vol. 2, p. 17.
13 Kozhevnikova N.D. (1983). Biology of the Schrenk spruce (Picea schrenkiana Fisch et. Mey [Biologija Eli Shrenka (Picea schrenkiana Fish et. Mey)]. Summary of thesis, Moscow, 41 p.
14 Magnuszewski M., Nowakowska J. A., Za-sada M., Orozumbekov A. (2014). Genetic charac-teristic of schrenk spruce (Picea schrenkiana) in the altitudal and geographical gradient in kyrgyz part of Tien-Shan mountains, Sylwan, vol. 158, no. 5, pp. 361-369.
56 Study of changes anatomical structures of young needles Picea schrenkiana Fisch et C.A. Mey...
Int. j. biol. chem. (Online) International Journal of Biology and Chemistry 13, № 1, 47 (2020)
15 The Red Book of Kazakhstan (plants) [Kras-naja kniga Kazahstana (rastenija)] (2014). Astana, vol. 2, 452 p.
16 The IUCN Red List of Threatened Species. Version 2019-3. http://www.iucnredlist.org. Down-loaded on 10 December 2019.
17 Pavlov N. (1956). Flora of Kazakhstan [Flora Kazakhstana], Alma-Ata, AS KazSSR, vol. 1, p. 66.
18 Zhaglovskaya A., Aidosova S., Akhtayeva N., Mamurova A., Yesimova D. (2015). Anatomi-cal and Morphological Stem Features of two Hal-oxylon Species (Chenopodiaceae Vent.) of Drought Stress, Kazakhstan. Biosciences, Biotechnology Research Asia, vol. 12, pp.1965-1974. https://doi.org/10.13005/bbra/1863.
19 Li C., Shi X., Mohamad O.A., Gao J., Xu X., Xie Y. (2017). Moderate irrigation intervals facili-tate establishment of two desert shrubs in the Takli-makan Desert Highway Shelterbelt in China. PLoS One, vol. 12, no. 7. https://doi.org/10.1371/journal.pone.0180875
20 Li Y., Ma X., Zhao J., Xu J., Shi J., Zhu X-G., et al. (2015) Developmental Genetic Mechanisms of C4 Syndrome Based on Transcriptome Analysis of
C3 Cotyledons and C4 Assimilating Shoots in Halox-ylon ammodendron. PLoS One, vol. 10, no. 2. https://doi.org/10.1371/journal.pone.0117175.
21 Baryikina R.P. et al. (2004) Reference book on botanical microtechnology. Basics and methods [Spravochnik po botanicheskoy mikrotehnike. Os-novyi i metodyi], p. 312.
22 Prozina M.N. (1960). Botanical microtech-nics. [Botanicheskaja mikrotehnika]. Мoscow, Vys-shaja shkola, 207 p.
23 Permyakov A.I. (1988) Microtechnics [Mik-rotehnika]. MSU Publ., p. 58.
24 Lakin G.F. (1990) Biometrics [Biometriya]. Moscow, Vysshaja shkola, p. 352.
25 Al Sahli A., Doaigey A., El Sheikha A., El-Zaidy M. (2015). Anatomical adaptations of two Hal-oxylon species for drought tolerance. Bothalia, vol. 45. pp. 47-57.
26 Rodin L.E. (1963). Vegetation of the deserts of Western Turkmenistan [Rastitel’nost’ pustyn’ Za-padnoj Turkmenii], pp. 89-124.
27 Turuspekov Y., Abugalieva S. (2015) Plant DNA barcoding project in Kazakhstan. Genome. vol. 58, no. 5, p. 290.
© 2020 al-Farabi Kazakh National University Int. j. biol. chem. (Online)
International Journal of Biology and Chemistry 13, № 1, 57 (2020)
IRSTI 34.15.23 https://doi.org/10.26577/ijbch.2020.v13.i1.06
N. Favarisova , A. Kusmangazinov , D. Karelova ,
M. Yermagambetova , S.I. Abugalieva*
Institute of Plant Biology and Biotechnology, Almaty, Kazakhstan *e-mail: [email protected]
Optimization of PCR conditions for Agriophyllum, Haloxylon and Salsola microsatellite markers
Abstract. Microsatellites or Simple Sequence Repeat (SSR) are among the most informative and popular types of molecular markers for assessment of genetic diversity, population structure, construction of genetic maps, phylogenetics, phylogeography, systematics, etc. Hence, for reliable inference of results, optimization of various conditions involved in polymerase chain reaction (PCR) is a pre-requisite. The usage of the essential PCR components in optimal concentrations, as well as PCR conditions, determines the success of amplification. The present study was carried out to optimize conditions of PCR for further assessment of the genetic diversity of eight species in genera Agriophyllum, Haloxylon, and Salsola that belong to the Chenopodiaceae Vent. family. The list of species includes Agriophyllum squarrosum, Agriophyllum minus, Haloxylon aphyllum, Haloxylon persicum, Haloxylon ammodendron, Salsola arbuscula, Salsola arbusculiformis, and Salsola chiwensis. These selected species are widespread in desert regions of Kazakhstan and have great importance for sand dunes fixing, animal feeding, and other purposes.Key words: Haloxylon, Agriophyllum, Salsola, polymerase chain reaction, microsatellite markers.
Introduction
Climate change poses a challenge to the eco-logical environment, and dune migration may pose a severe hazard to settled and agricultural areas and are considered as one of the main factors causing de-sertification. Desertification has a notable impact on human economic and political stability, and in the long term, will threaten human survival and develop-ment. Global warming is increasing the prevalence of drought, drying up waterholes, and relocating lo-cal species. High temperatures increase the number of wildfires, which may alter landscapes eliminating trees and shrubs that are growing. Understanding of these vulnerabilities of desert plants and their com-munities can then be developed into technologies for conservation and restoration of the flora in dry re-gions. “At the heart of these complex problems are several key principals: (1) recognizing changes in plant species and communities and whether or not climate is the root cause, (2) understanding species vulnerabilities under climate change, (3) accurate prediction of the movement of plant communities to plan for the future, and (4) mitigating these changes
by fostering regeneration or assisting the dispersal of appropriately adapted plant materials” [1].
In Kazakhstan, the most territory is the steppe (26%), semidesert (14%), and desert (up to 44%) areas. The prolonged droughts and strong winds in such areas are common, which affects the yield of agricultural land. The territory of the country is al-most entirely part of the arid zone, and its two-thirds already subject to varying degrees of desertification [2].
The major representatives of wild flora in the desert are herbaceous plants, subshrubs, shrubs, and subtrees. In spring, a variety of ephemeris (up to 150 species) blooms in the deserts for a few weeks. Later on, after drought stress and increasing mean daily temperatures, xerophytes, and psammophytes dominate the landscapes, among others, many scrub species of the genera Calligonum, Ammodendron or Aristida [3]. One of the special features of sandy des-erts is sites of saxaul thickets, mainly black saxaul (Haloxylon aphyllum Minkw.) Iljin and white sax-aul (Haloxylon persicum Bunge ex Boiss. et Buhse), which are usually interspersed with Tamarix, Salso-la, Artemisia, and many other plant species.
58 Optimization of PCR conditions for Agriofillum, Haloxylon and Salsola microsatellite loci
Int. j. biol. chem. (Online) International Journal of Biology and Chemistry 13, № 1, 57 (2020)
Haloxylon, Salsola, and Agriophyllum, belong-ing to Chenopodiaceae Vent. (Amaranthaceae Juss.) family of flowering plants, are represented by several species that grow in Kazakhstan and have importance for dunes fixing, animal feeding, water conservation, and other purposes. Plants of genus Haloxylon Bunge are psammophytic shrubs or small trees. Saxaul has a strong root system fixed in the sands, which can reach up to 8 m in height and, in exceptional cases, even more. Both black and white saxaul constitute the principal arboreal cover of the cold continental deserts of Central Asia, while white saxaul is a rain-fed shrub distributed on sand dunes. The former is a ground-water phreatophyte mainly found on al luvial terraces [4; 5]. Saxaul has an important role as a fodder plant, also used as fire-wood by local herders [6]. Black and white saxaul have a habitat-forming role, pasture protective, and economically importanсe. Haloxylon ammodendron (C.A. Mey.) Bunge is widely distributed across a range of habitats, including gravel desert, clay des-ert, fixed and semi-fixed sand, and saline land in Asian and African deserts [7]. For Kazakhstan, it is a rare species with habitat forming, soil protective, pasture protective significance.
Agriophyllum comprises six West and Cen-tral Asian species of annual herbs and belongs to the subfamily Corispermoideae [8]. Two species, Agriophyllum squarrosum (L.) Moq. and Agriophyl-lum minus Fisch. et C.A. Mey. grow in Western and South-eastern Kazakhstan [9]. Sand rice (A. squarro-sum) is an annual shrub-like plant adapted to mobile dunes in the desert and semi-desert regions of Central Asia [10]. Sand rice has evolved many strategies to adapt to dune surface environment, including rapid root growth after germination, long hypocotyl, and pronounced drought and heat tolerance. It is a good candidate species for domestication to provide a food crop resilient to future climate change [10].
Salsola is a genus of the subfamily Sal-soloideae in the family Chenopodiaceae. A common name of various members of this genus and related genera is saltwort, for their salt toler-ance. Salsola arbuscula Pall. and Salsola chiwensis M.Pop. have great environmental importance since they perform sand-fixing and rock-strengthening functions. S. arbuscula is a widespread species in the desert regions of Central Asia [11]. S. chiwensis is listed in the Red Book of Kazakhstan (2014) as a rare endangered species (category II) occurring in the limited areas and suffers from livestock grazing [12]. S. arbuscula, S. gemmascens Pall., and S. rigida Pall. were used to improve and create long-term pastures
in the sandy desert [13]. Also, S. arbuscula is used as a year-round feed by camels as well as winter feed by other animals. It is also applied as a fuel, for tanning leathers, and dye for wool.
Due to overgrazing and overexploitation for fuel during the past fifty years, the once-dominant sax-aul and other desert species vegetation have consid-erably degraded [14]. It is important to develop and continue strategies for the conservation of plant ge-netic resources, combating desertification, measures to restore desert fertility, the reintroduction of rare and endangered native plant species. It is necessary to study the biodiversity of the desert plant species both on inter- and intraspecific levels in terms of preservation strategy and reintroduction of valuable and endangered species. For assessment the genetic diversity, phylogenetic relationships, for molecular taxonomy of wild species there is many various class-es of widely used molecular markers, such as RAPD or Random Amplified Polymorphic DNA [15; 16], ISSR or Inter Simple Sequence Repeats [17], IRAP or retrotransposons [18], SSR or Simple sequence re-peats [19-21], AFLP or Amplified Fragment Length Polymorphism [22; 23], SNP or Single Nucleotide Polymorphism [24; 25], DNA barcoding markers [9; 26-31]. Among listed markers, SSR markers, or microsatellites, are considered to be one of the most informative and reliable classes of PCR based DNA markers for genetic diversity studies, to estimate gene flow and crossing over rates, in evolutionary studies, above all to infer intraspecific genetic relations. Mic-rosatellites have been the most widely used markers for genotyping plants over the past 20 years because they are highly informative, codominant, multi-allele genetic markers that are experimentally reproducible and transferable among related species. However, for reliable inference of the results of these studies, the optimization of various conditions involved in PCR amplification is a pre-requisite. The utilization of the essential PCR components in optimal concentrations, as well as conditions of amplification, determines the success of amplification.
High amplification success within and between genera in many groups of animals and plants indi-cates a great potential to use microsatellites and their flanking regions as a source of single- or low-copy nuclear sequences, as suggested by Zhang & Hewitt [32]. Sometimes flanking regions are highly con-served across taxa, allowing cross-species amplifi-cation of microsatellite loci from primers developed from other species in the same genus or even family. Since the flanking region of SSR loci are evolution-ary well conserved, computational prediction of such
59N. Favarisova et al.
Int. j. biol. chem. (Online) International Journal of Biology and Chemistry 13, № 1, 57 (2020)
loci has practical significance. Such SSR loci can ca-ter yo the need for molecular markers even in the ab-sence of whole-genome sequence data. Thus, in cases when microsatellite markers have not been devel-oped for a particular plant species a good alternative would be the use of a set of primers to obtain cross-species transferability. Barbará et al. [33] discussed the implications of these findings and close with an outlook on potential alternative sources of cross-spe-cies transferable markers. The potential for success-ful cross-species transfer appears highest in species with long generation times, mixed or outcrossing breeding systems, and where genome size in the tar-get species is small compared to the source [33]. In the transferability or cross-amplification procedure, PCR primers developed for a studied (source) species are used to amplify microsatellites from closely [34; 35] or sometimes quite distantly related species [36].
SSRs can be developed from specific species and potentially used for related species, which lack the source of genome sequences to develop species-spe-cific SSRs. Many reports are describing SSR markers that successfully developed and used for the genetic diversity studies of other species or genera of Che-nopodiaceae (Amaranthaceae) family [7; 37; 38]. The aim of this study was the optimization of PCR conditions for microsatellite analysis to analyze the genetic diversity of desert plant species of three gen-era Agriofillum, Haloxylon, and Salsola in the family Chenopodiaceae using cross-species and cross-genus transferability.
Materials and methods
Plant materials. The objects of this study were wild desert species of three genera Haloxylon, Sal-sola, and Agriophyllum, which belong to Cheno-podiaceae family: Haloxylon persicum Bunge ex Boiss. & Buhse, Haloxylon aphyllum (Minkw.) Il-jin, Haloxylon ammodendron (C.A.Mey.) Bunge ex Fenzl., Salsola arbuscula Pall., Salsola arbusculifor-mis Drobow, Salsola chiwensis M.Pop., Agriophyl-lum squarrosum (L.) Moq and Agriophyllum minus Fisch. &Mey.
Three populations of A. squarrosum and one population of A. minus were sampled in Moyyn-kym Sands in Zhambyl region on South-east Ka-zakhstan [9]. Three Salsola species were collected in Mangistau region of Western Kazakhstan (by Dr. A. Imanbayeva, Mangyshlak Experimental Bo-tanical Garden), populations of three Haloxylon spe-cies both in Western (by Dr. A. Imanbayeva) and south-eastern parts of Kazakhstan.
The samplings of the wild species plant mate-rial were done in the framework of the Program 0237 (2015-2017) and project АР05131621 (2018-2020) supported by MES RK [27] and the Interna-tional collaborative project REF: 2016YFE0203400 (2018-2020) by Chinese Ministry of Science and Technology.
Young leaves of collected plant material dried in silica gel were used for DNA extraction.
DNA extraction. The total genomic DNA was isolated from the dry leaf tissues using CTAB (ce-tyl trimethylammonium bromide buffer) method [39].
The quality and concentration of extracted DNA was assessed on NanoDrop 2000 spectro-photometer (Thermo Fisher Scientific, USA) and observed for its intactness using 1% agarose gel electrophoresis.
The DNA concentration for all samples was nor-malized to 10-50 ng/μl for further analysis.
PCR amplification. PCR amplification using dif-ferent SSR primer pairs for each above-mentioned species was performed in a thermal cycler Veriti (Thermo Fisher Scientific, USA). A temperature gra-dient was used via six innovative VeriFlex™ Blocks for precise control over PCR conditions optimization for each template-primer pair combination.
Presently, different software packages are avail-able to calculate the melting temperature (Tm) as well as the annealing temperature (Ta) for a particular PCR reaction using particular Taq polymerase. Tm is a temperature at which half of the DNA strand dena-tured or opened.
In many cases, a known simple formula for Tm that usually works is:
Tm= 4 (G + C) + 2 (A + T)
Commonly, the appropriate annealing tempera-ture is 5-7 °C lower than Tm. Still, it is just an as-sumption not correctly work all the time. Most of the time, this value is not optimal, and it is necessary to determine Ta empirically. Thus, it should be matched for a particular primer pair for particular conditions to get appropriate bands. For the most primers, the Ta between 55 °C to 65 °C should be ideal for PCR reaction, deviation of Ta above or below this range can cause non-specific bindings or reaction failure. If the Ta is too high, the primer can not bind properly to the template DNA. On the other side, if the annealing temperature is too low, it facilitates more bindings, more bands, and non-specific amplification during the PCR reaction.
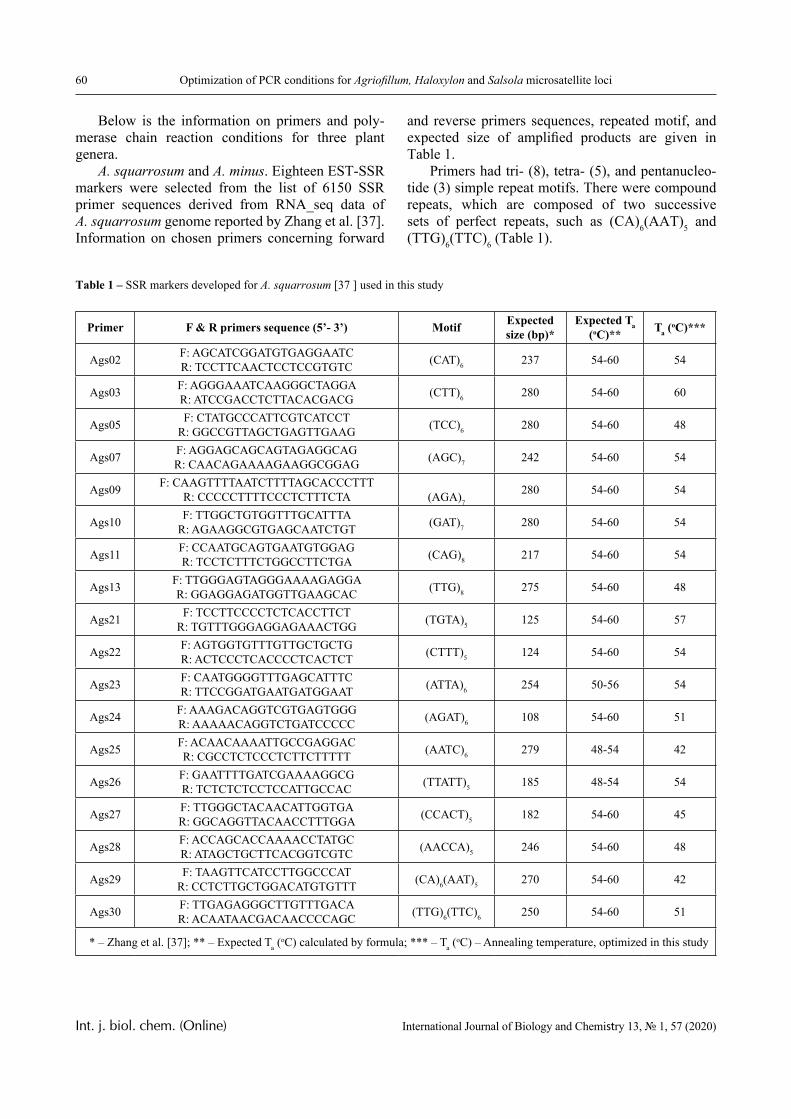
60 Optimization of PCR conditions for Agriofillum, Haloxylon and Salsola microsatellite loci
Int. j. biol. chem. (Online) International Journal of Biology and Chemistry 13, № 1, 57 (2020)
Below is the information on primers and poly-merase chain reaction conditions for three plant genera.
A. squarrosum and A. minus. Eighteen EST-SSR markers were selected from the list of 6150 SSR primer sequences derived from RNA_seq data of A. squarrosum genome reported by Zhang et al. [37]. Information on chosen primers concerning forward
and reverse primers sequences, repeated motif, and expected size of amplified products are given in Table 1.
Primers had tri- (8), tetra- (5), and pentanucleo-tide (3) simple repeat motifs. There were compound repeats, which are composed of two successive sets of perfect repeats, such as (CA)6(AAT)5 and (TTG)6(TTC)6 (Table 1).
Table 1 – SSR markers developed for A. squarrosum [37 ] used in this study
Primer F & R primers sequence (5’- 3’) Motif Expected size (bp)*
Expected Ta (oC)** Ta (
oC)***
Ags02 F: AGCATCGGATGTGAGGAATCR: TCCTTCAACTCCTCCGTGTC (CAT)6 237 54-60 54
Ags03 F: AGGGAAATCAAGGGCTAGGAR: ATCCGACCTCTTACACGACG (CTT)6 280 54-60 60
Ags05 F: CTATGCCCATTCGTCATCCTR: GGCCGTTAGCTGAGTTGAAG (TCC)6 280 54-60 48
Ags07 F: AGGAGCAGCAGTAGAGGCAGR: CAACAGAAAAGAAGGCGGAG (AGC)7 242 54-60 54
Ags09 F: CAAGTTTTAATCTTTTAGCACCCTTTR: CCCCCTTTTCCCTCTTTCTA (AGA)7
280 54-60 54
Ags10 F: TTGGCTGTGGTTTGCATTTAR: AGAAGGCGTGAGCAATCTGT (GAT)7 280 54-60 54
Ags11 F: CCAATGCAGTGAATGTGGAGR: TCCTCTTTCTGGCCTTCTGA (CAG)8 217 54-60 54
Ags13 F: TTGGGAGTAGGGAAAAGAGGAR: GGAGGAGATGGTTGAAGCAC (TTG)8 275 54-60 48
Ags21 F: TCCTTCCCCTCTCACCTTCTR: TGTTTGGGAGGAGAAACTGG (TGTA)5 125 54-60 57
Ags22 F: AGTGGTGTTTGTTGCTGCTGR: ACTCCCTCACCCCTCACTCT (CTTT)5 124 54-60 54
Ags23 F: CAATGGGGTTTGAGCATTTCR: TTCCGGATGAATGATGGAAT (ATTA)6 254 50-56 54
Ags24 F: AAAGACAGGTCGTGAGTGGGR: AAAAACAGGTCTGATCCCCC (AGAT)6 108 54-60 51
Ags25 F: ACAACAAAATTGCCGAGGACR: CGCCTCTCCCTCTTCTTTTT (AATC)6 279 48-54 42
Ags26 F: GAATTTTGATCGAAAAGGCGR: TCTCTCTCCTCCATTGCCAC (TTATT)5 185 48-54 54
Ags27 F: TTGGGCTACAACATTGGTGAR: GGCAGGTTACAACCTTTGGA (CCACT)5 182 54-60 45
Ags28 F: ACCAGCACCAAAACCTATGCR: ATAGCTGCTTCACGGTCGTC (AACCA)5 246 54-60 48
Ags29 F: TAAGTTCATCCTTGGCCCATR: CCTCTTGCTGGACATGTGTTT (CA)6(AAT)5 270 54-60 42
Ags30 F: TTGAGAGGGCTTGTTTGACAR: ACAATAACGACAACCCCAGC (TTG)6(TTC)6 250 54-60 51
* – Zhang et al. [37]; ** – Expected Ta (oC) calculated by formula; *** – Ta (
oC) – Annealing temperature, optimized in this study
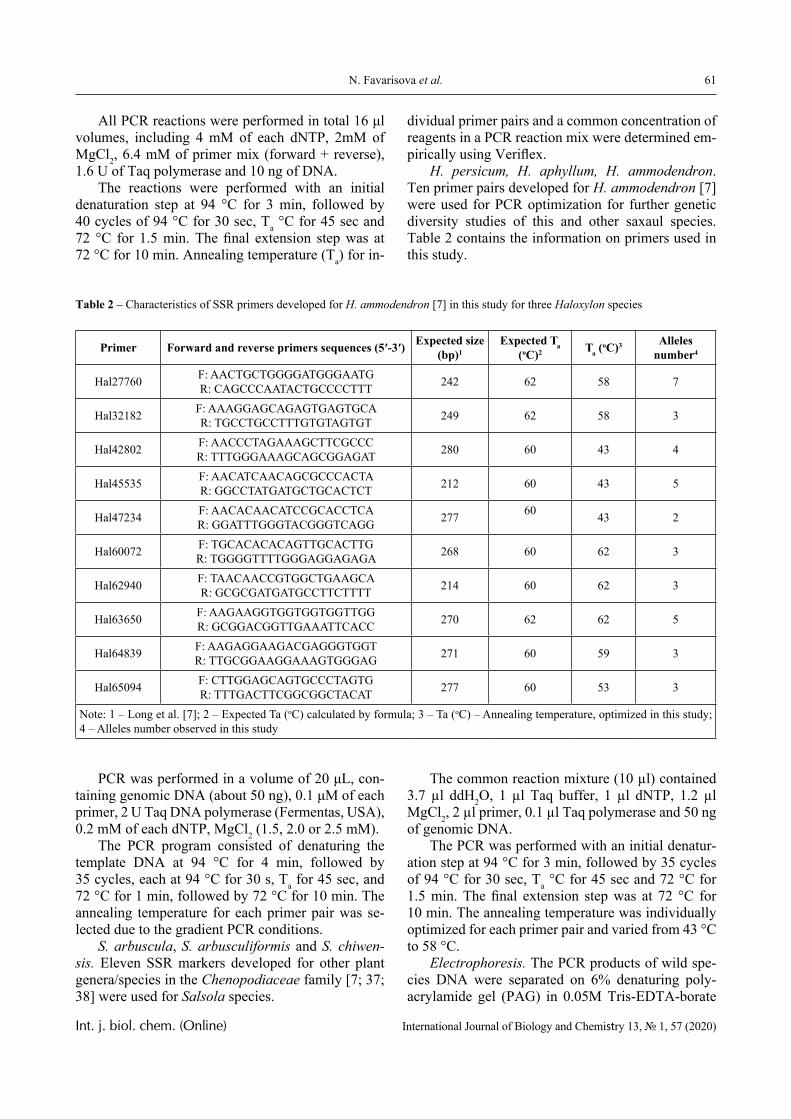
61N. Favarisova et al.
Int. j. biol. chem. (Online) International Journal of Biology and Chemistry 13, № 1, 57 (2020)
All PCR reactions were performed in total 16 μl volumes, including 4 mM of each dNTP, 2mM of MgCl2, 6.4 mM of primer mix (forward + reverse), 1.6 U of Taq polymerase and 10 ng of DNA.
The reactions were performed with an initial denaturation step at 94 °C for 3 min, followed by 40 cycles of 94 °C for 30 sec, Ta °C for 45 sec and 72 °C for 1.5 min. The final extension step was at 72 °C for 10 min. Annealing temperature (Ta) for in-
dividual primer pairs and a common concentration of reagents in a PCR reaction mix were determined em-pirically using Veriflex.
H. persicum, H. aphyllum, H. ammodendron. Ten primer pairs developed for H. ammodendron [7] were used for PCR optimization for further genetic diversity studies of this and other saxaul species. Table 2 contains the information on primers used in this study.
Table 2 – Characteristics of SSR primers developed for H. ammodendron [7] in this study for three Haloxylon species
Primer Forward and reverse primers sequences (5′-3′) Expected size (bp)1
Expected Ta (oC)2 Ta (
oC)3 Alleles number4
Hal27760 F: AACTGCTGGGGATGGGAATGR: CAGCCCAATACTGCCCCTTT 242 62 58 7
Hal32182 F: AAAGGAGCAGAGTGAGTGCAR: TGCCTGCCTTTGTGTAGTGT 249 62 58 3
Hal42802 F: AACCCTAGAAAGCTTCGCCCR: TTTGGGAAAGCAGCGGAGAT 280 60 43 4
Hal45535 F: AACATCAACAGCGCCCACTAR: GGCCTATGATGCTGCACTCT 212 60 43 5
Hal47234 F: AACACAACATCCGCACCTCAR: GGATTTGGGTACGGGTCAGG 277 60 43 2
Hal60072 F: TGCACACACAGTTGCACTTGR: TGGGGTTTTGGGAGGAGAGA 268 60 62 3
Hal62940 F: TAACAACCGTGGCTGAAGCAR: GCGCGATGATGCCTTCTTTT 214 60 62 3
Hal63650 F: AAGAAGGTGGTGGTGGTTGGR: GCGGACGGTTGAAATTCACC 270 62 62 5
Hal64839 F: AAGAGGAAGACGAGGGTGGTR: TTGCGGAAGGAAAGTGGGAG 271 60 59 3
Hal65094 F: CTTGGAGCAGTGCCCTAGTGR: TTTGACTTCGGCGGCTACAT 277 60 53 3
Note: 1 – Long et al. [7]; 2 – Expected Ta (oC) calculated by formula; 3 – Ta (oC) – Annealing temperature, optimized in this study; 4 – Alleles number observed in this study
PCR was performed in a volume of 20 μL, con-taining genomic DNA (about 50 ng), 0.1 μM of each primer, 2 U Taq DNA polymerase (Fermentas, USA), 0.2 mM of each dNTP, MgCl2 (1.5, 2.0 or 2.5 mM).
The PCR program consisted of denaturing the template DNA at 94 °C for 4 min, followed by 35 cycles, each at 94 °C for 30 s, Ta for 45 sec, and 72 °C for 1 min, followed by 72 °C for 10 min. The annealing temperature for each primer pair was se-lected due to the gradient PCR conditions.
S. arbuscula, S. arbusculiformis and S. chiwen-sis. Eleven SSR markers developed for other plant genera/species in the Chenopodiaceae family [7; 37; 38] were used for Salsola species.
The common reaction mixture (10 µl) contained 3.7 µl ddH2O, 1 µl Taq buffer, 1 µl dNTP, 1.2 µl MgCl2, 2 µl primer, 0.1 µl Taq polymerase and 50 ng of genomic DNA.
The PCR was performed with an initial denatur-ation step at 94 °C for 3 min, followed by 35 cycles of 94 °C for 30 sec, Ta °C for 45 sec and 72 °C for 1.5 min. The final extension step was at 72 °C for 10 min. The annealing temperature was individually optimized for each primer pair and varied from 43 °C to 58 °C.
Electrophoresis. The PCR products of wild spe-cies DNA were separated on 6% denaturing poly-acrylamide gel (PAG) in 0.05M Tris-EDTA-borate
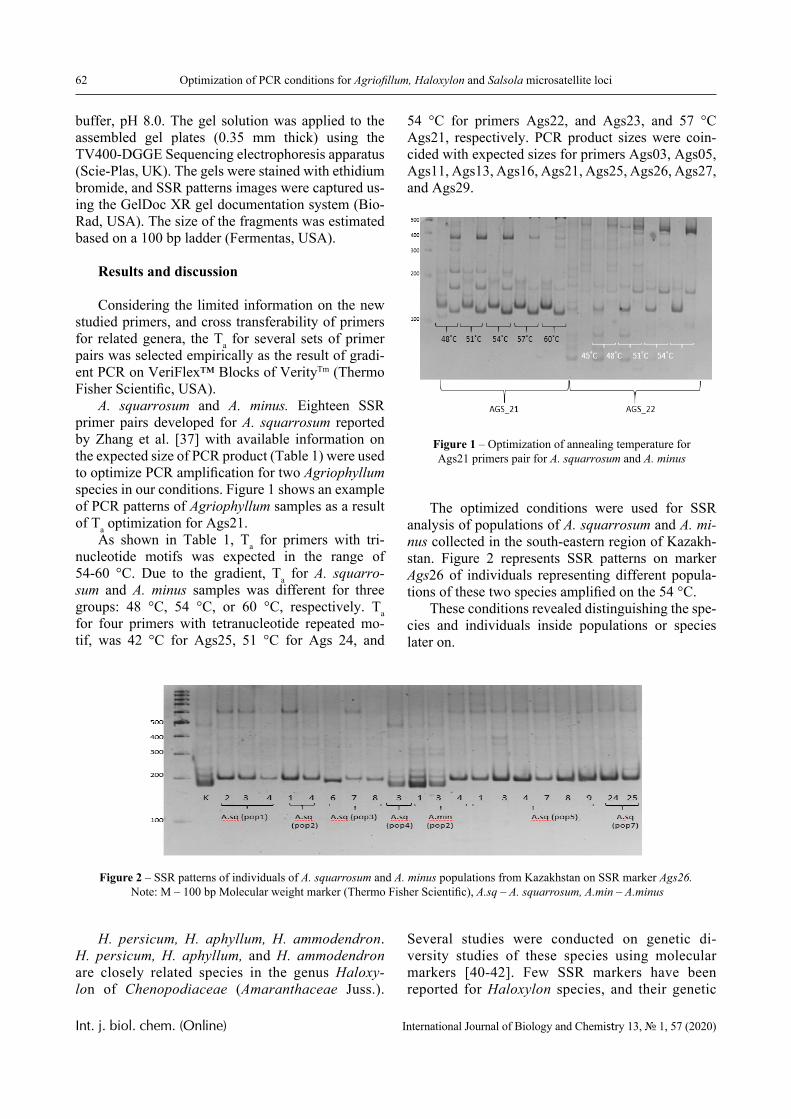
62 Optimization of PCR conditions for Agriofillum, Haloxylon and Salsola microsatellite loci
Int. j. biol. chem. (Online) International Journal of Biology and Chemistry 13, № 1, 57 (2020)
buffer, pH 8.0. The gel solution was applied to the assembled gel plates (0.35 mm thick) using the TV400-DGGE Sequencing electrophoresis apparatus (Scie-Plas, UK). The gels were stained with ethidium bromide, and SSR patterns images were captured us-ing the GelDoc XR gel documentation system (Bio-Rad, USA). The size of the fragments was estimated based on a 100 bp ladder (Fermentas, USA).
Results and discussion
Considering the limited information on the new studied primers, and cross transferability of primers for related genera, the Ta for several sets of primer pairs was selected empirically as the result of gradi-ent PCR on VeriFlex™ Blocks of VerityTm (Thermo Fisher Scientific, USA).
A. squarrosum and A. minus. Eighteen SSR primer pairs developed for A. squarrosum reported by Zhang et al. [37] with available information on the expected size of PCR product (Table 1) were used to optimize PCR amplification for two Agriophyllum species in our conditions. Figure 1 shows an example of PCR patterns of Agriophyllum samples as a result of Ta optimization for Ags21.
As shown in Table 1, Ta for primers with tri-nucleotide motifs was expected in the range of 54-60 °C. Due to the gradient, Ta for A. squarro-sum and A. minus samples was different for three groups: 48 °C, 54 °C, or 60 °C, respectively. Ta for four primers with tetranucleotide repeated mo-tif, was 42 °C for Ags25, 51 °C for Ags 24, and
54 °C for primers Ags22, and Ags23, and 57 °C Ags21, respectively. PCR product sizes were coin-cided with expected sizes for primers Ags03, Ags05, Ags11, Ags13, Ags16, Ags21, Ags25, Ags26, Ags27, and Ags29.
Figure 1 – Optimization of annealing temperature for Ags21 primers pair for A. squarrosum and A. minus
The optimized conditions were used for SSR analysis of populations of A. squarrosum and A. mi-nus collected in the south-eastern region of Kazakh-stan. Figure 2 represents SSR patterns on marker Ags26 of individuals representing different popula-tions of these two species amplified on the 54 °C.
These conditions revealed distinguishing the spe-cies and individuals inside populations or species later on.
Figure 2 – SSR patterns of individuals of A. squarrosum and A. minus populations from Kazakhstan on SSR marker Ags26. Note: M – 100 bp Molecular weight marker (Thermo Fisher Scientific), A.sq – A. squarrosum, A.min – A.minus
H. persicum, H. aphyllum, H. ammodendron. H. persicum, H. aphyllum, and H. ammodendron are closely related species in the genus Haloxy-lon of Chenopodiaceae (Amaranthaceae Juss.).
Several studies were conducted on genetic di-versity studies of these species using molecular markers [40-42]. Few SSR markers have been reported for Haloxylon species, and their genetic
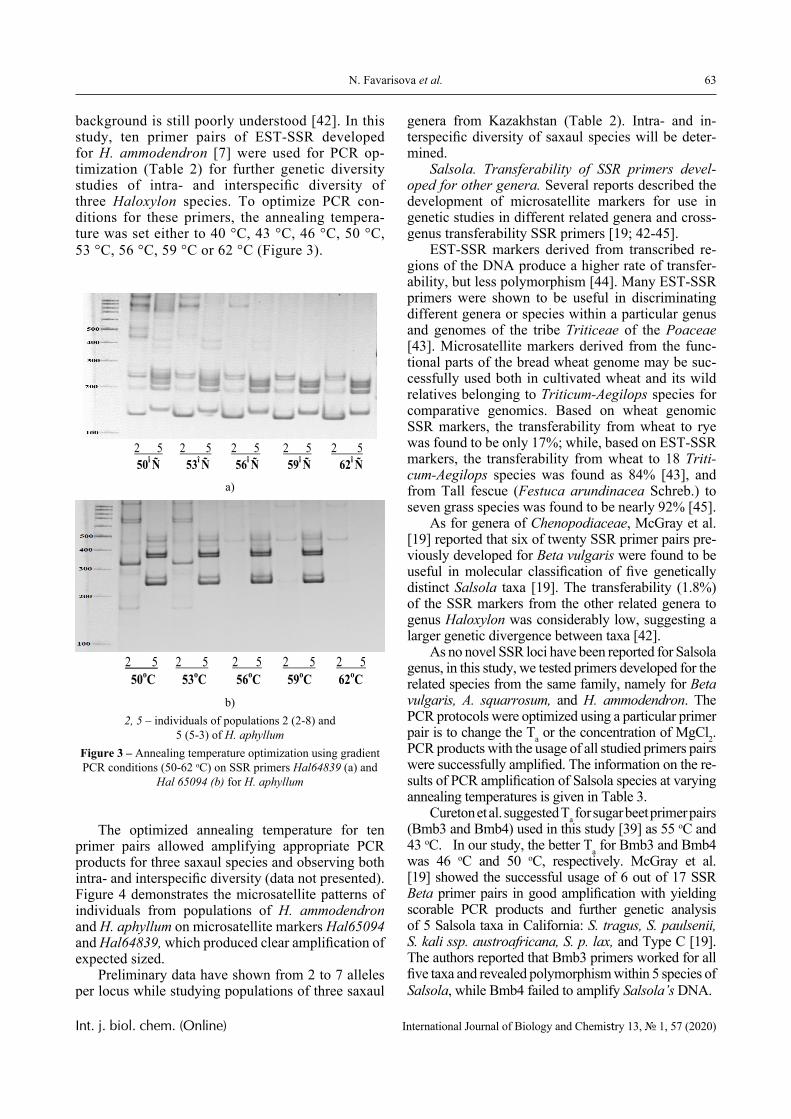
63N. Favarisova et al.
Int. j. biol. chem. (Online) International Journal of Biology and Chemistry 13, № 1, 57 (2020)
background is still poorly understood [42]. In this study, ten primer pairs of EST-SSR developed for H. ammodendron [7] were used for PCR op-timization (Table 2) for further genetic diversity studies of intra- and interspecific diversity of three Haloxylon species. To optimize PCR con-ditions for these primers, the annealing tempera-ture was set either to 40 °C, 43 °C, 46 °C, 50 °C, 53 °C, 56 °C, 59 °C or 62 °C (Figure 3).
2 5 2 5 2 5 2 5 2 5 50î Ñ 53î Ñ 56î Ñ 59î Ñ 62î Ñ
a)
2 5 2 5 2 5 2 5 2 5 50оС 53оС 56оС 59оС 62оС
b)2, 5 – individuals of populations 2 (2-8) and
5 (5-3) of H. aphyllum Figure 3 – Annealing temperature optimization using gradient PCR conditions (50-62 оС) on SSR primers Hal64839 (a) and
Hal 65094 (b) for H. aphyllum
The optimized annealing temperature for ten primer pairs allowed amplifying appropriate PCR products for three saxaul species and observing both intra- and interspecific diversity (data not presented). Figure 4 demonstrates the microsatellite patterns of individuals from populations of H. ammodendron and H. aphyllum on microsatellite markers Hal65094 and Hal64839, which produced clear amplification of expected sized.
Preliminary data have shown from 2 to 7 alleles per locus while studying populations of three saxaul
genera from Kazakhstan (Table 2). Intra- and in-terspecific diversity of saxaul species will be deter-mined.
Salsola. Transferability of SSR primers devel-oped for other genera. Several reports described the development of microsatellite markers for use in genetic studies in different related genera and cross-genus transferability SSR primers [19; 42-45].
EST-SSR markers derived from transcribed re-gions of the DNA produce a higher rate of transfer-ability, but less polymorphism [44]. Many EST-SSR primers were shown to be useful in discriminating different genera or species within a particular genus and genomes of the tribe Triticeae of the Poaceae [43]. Microsatellite markers derived from the func-tional parts of the bread wheat genome may be suc-cessfully used both in cultivated wheat and its wild relatives belonging to Triticum-Aegilops species for comparative genomics. Based on wheat genomic SSR markers, the transferability from wheat to rye was found to be only 17%; while, based on EST-SSR markers, the transferability from wheat to 18 Triti-cum-Aegilops species was found as 84% [43], and from Tall fescue (Festuca arundinacea Schreb.) to seven grass species was found to be nearly 92% [45].
As for genera of Chenopodiaceae, McGray et al. [19] reported that six of twenty SSR primer pairs pre-viously developed for Beta vulgaris were found to be useful in molecular classification of five genetically distinct Salsola taxa [19]. The transferability (1.8%) of the SSR markers from the other related genera to genus Haloxylon was considerably low, suggesting a larger genetic divergence between taxa [42].
As no novel SSR loci have been reported for Salsola genus, in this study, we tested primers developed for the related species from the same family, namely for Beta vulgaris, A. squarrosum, and H. ammodendron. The PCR protocols were optimized using a particular primer pair is to change the Ta or the concentration of MgCl2. PCR products with the usage of all studied primers pairs were successfully amplified. The information on the re-sults of PCR amplification of Salsola species at varying annealing temperatures is given in Table 3.
Cureton et al. suggested Ta for sugar beet primer pairs (Bmb3 and Bmb4) used in this study [39] as 55 oC and 43 oC. In our study, the better Ta for Bmb3 and Bmb4 was 46 oC and 50 oC, respectively. McGray et al. [19] showed the successful usage of 6 out of 17 SSR Beta primer pairs in good amplification with yielding scorable PCR products and further genetic analysis of 5 Salsola taxa in California: S. tragus, S. paulsenii, S. kali ssp. austroafricana, S. p. lax, and Type C [19]. The authors reported that Bmb3 primers worked for all five taxa and revealed polymorphism within 5 species of Salsola, while Bmb4 failed to amplify Salsola’s DNA.
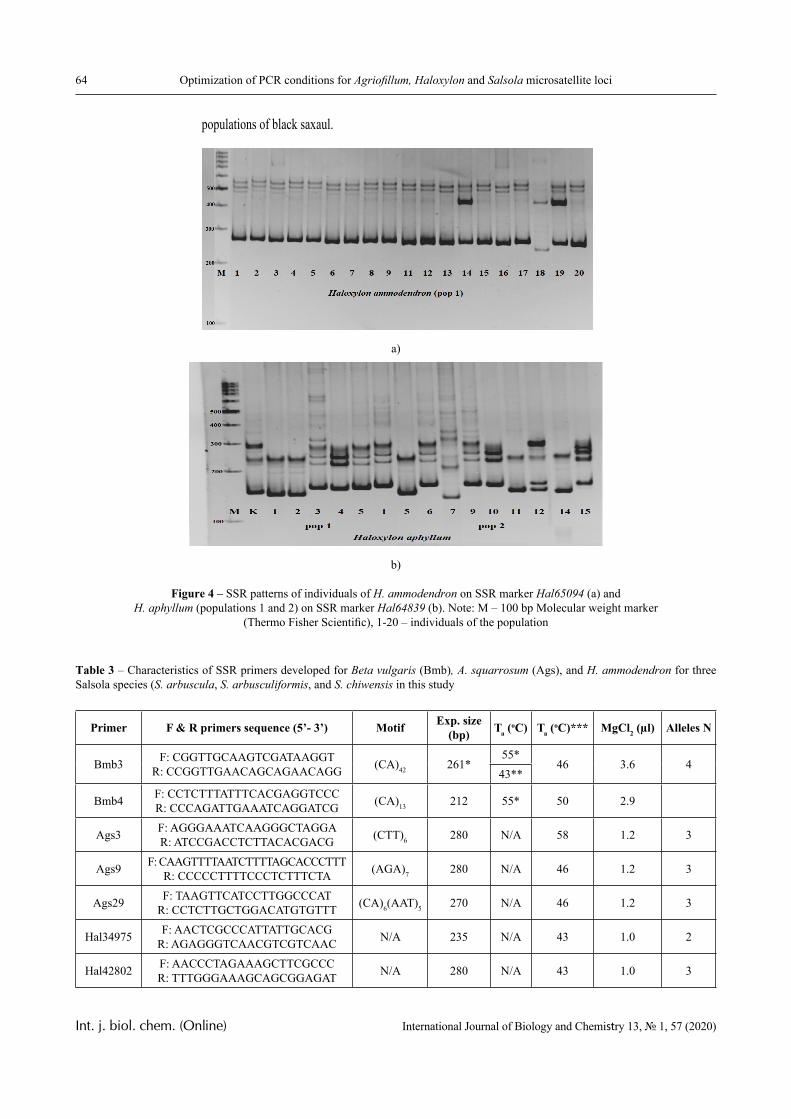
64 Optimization of PCR conditions for Agriofillum, Haloxylon and Salsola microsatellite loci
Int. j. biol. chem. (Online) International Journal of Biology and Chemistry 13, № 1, 57 (2020)
populations of black saxaul.
a)
b)
Figure 4 – SSR patterns of individuals of H. ammodendron on SSR marker Hal65094 (a) and H. aphyllum (populations 1 and 2) on SSR marker Hal64839 (b). Note: M – 100 bp Molecular weight marker
(Thermo Fisher Scientific), 1-20 – individuals of the population
Table 3 – Characteristics of SSR primers developed for Beta vulgaris (Bmb), A. squarrosum (Ags), and H. ammodendron for three Salsola species (S. arbuscula, S. arbusculiformis, and S. chiwensis in this study
Primer F & R primers sequence (5’- 3’) Motif Exp. size (bp) Ta (
oC) Ta (oC)*** MgCl2 (µl) Alleles N
Bmb3 F: CGGTTGCAAGTCGATAAGGTR: CCGGTTGAACAGCAGAACAGG (CA)42 261*
55*46 3.6 4
43**
Bmb4 F: CCTCTTTATTTCACGAGGTCCCR: CCCAGATTGAAATCAGGATCG (CA)13 212 55* 50 2.9
Ags3 F: AGGGAAATCAAGGGCTAGGAR: ATCCGACCTCTTACACGACG (CTT)6 280 N/A 58 1.2 3
Ags9 F: CAAGTTTTAATCTTTTAGCACCCTTTR: CCCCCTTTTCCCTCTTTCTA (AGA)7 280 N/A 46 1.2 3
Ags29 F: TAAGTTCATCCTTGGCCCATR: CCTCTTGCTGGACATGTGTTT (CA)6(AAT)5 270 N/A 46 1.2 3
Hal34975 F: AACTCGCCCATTATTGCACGR: AGAGGGTCAACGTCGTCAAC N/A 235 N/A 43 1.0 2
Hal42802 F: AACCCTAGAAAGCTTCGCCCR: TTTGGGAAAGCAGCGGAGAT N/A 280 N/A 43 1.0 3
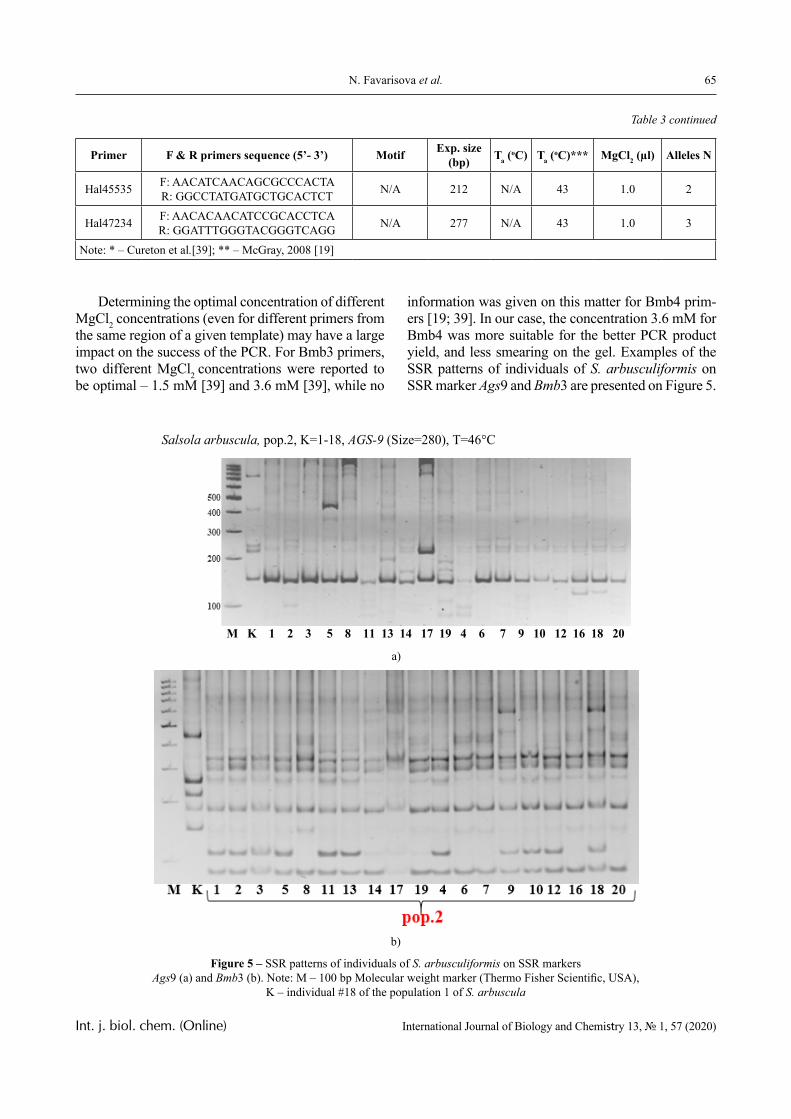
65N. Favarisova et al.
Int. j. biol. chem. (Online) International Journal of Biology and Chemistry 13, № 1, 57 (2020)
Primer F & R primers sequence (5’- 3’) Motif Exp. size (bp) Ta (
oC) Ta (oC)*** MgCl2 (µl) Alleles N
Hal45535 F: AACATCAACAGCGCCCACTAR: GGCCTATGATGCTGCACTCT N/A 212 N/A 43 1.0 2
Hal47234 F: AACACAACATCCGCACCTCAR: GGATTTGGGTACGGGTCAGG N/A 277 N/A 43 1.0 3
Note: * – Cureton et al.[39]; ** – McGray, 2008 [19]
Table 3 continued
Determining the optimal concentration of different MgCl2 concentrations (even for different primers from the same region of a given template) may have a large impact on the success of the PCR. For Bmb3 primers, two different MgCl2 concentrations were reported to be optimal – 1.5 mM [39] and 3.6 mM [39], while no
information was given on this matter for Bmb4 prim-ers [19; 39]. In our case, the concentration 3.6 mM for Bmb4 was more suitable for the better PCR product yield, and less smearing on the gel. Examples of the SSR patterns of individuals of S. arbusculiformis on SSR marker Ags9 and Bmb3 are presented on Figure 5.
Salsola arbuscula, pop.2, K=1-18, AGS-9 (Size=280), T=46°C
М K 1 2 3 5 8 11 13 14 17 19 4 6 7 9 10 12 16 18 20
a)
b)
Figure 5 – SSR patterns of individuals of S. arbusculiformis on SSR markers Ags9 (a) and Bmb3 (b). Note: M – 100 bp Molecular weight marker (Thermo Fisher Scientific, USA),
K – individual #18 of the population 1 of S. arbuscula
66 Optimization of PCR conditions for Agriofillum, Haloxylon and Salsola microsatellite loci
Int. j. biol. chem. (Online) International Journal of Biology and Chemistry 13, № 1, 57 (2020)
Expected sizes of PCR products for other related species are given in Table 3: for Ags3, Ags 9, and Ags29 primers (for sand rice) – according to Zhang et al. [37], and for Hal34975, Hal42802, Hal45535, and Hal47234 (for saxaul) according to Long et al. [7]. Preliminary data showed more than 2 alleles per locus when study focused on S. arbusculiformis.
Obtained data showed that all nine primer pairs have their high cross-genera transferability and use-fulness in differentiating three Salsola taxa – S. ar-buscula, S. arbusculiformis and S. chiwensis.
Optimized PCR conditions for the annealing temperature and MgCl2 concentration are reliable to analyze the genetic diversity both between and within eight species of Agriophyllum, Haloxylon, and Salsola collected in Kazakhstan to the date. The ob-tained information is important in terms of the devel-opment of optimized PCR conditions as a prerequi-site for the successful application of SSR markers in population genetics of studied species.
Conclusion
Investigation on the level and pattern of genetic diversity of populations of the rare and valuable spe-cies using microsatellite markers is crucial for under-standing the structure of the population and assess-ing the strategies for biodiversity preservation. SSR markers are reliable, informative markers with co-dominant nature are widely used in molecular genetic studies. An important limitation, however, regarding the use of microsatellites is the prior need for optimi-zation of PCR conditions for each SSR marker.
The annealing temperatures and MgCl2 concentra-tions were individually optimized for each primer pair for samples of Agriophyllum, Haloxylon, and Salsola.
Since little information was found in the literature on microsatellite markers for the Salsola genus, we tested the cross-genera transferability of SSR markers previously developed for other members of the Cheno-podiaceae family, including Beta vulgaris, Agriophyl-lum squarrosum, and Haloxylon ammodendron. PCR conditions for representatives of the other two genera, Agriophyllum and Haloxylon were also tested in this study. The optimization of PCR conditions for stud-ied Salsola species indicated their good cross-genera transferability via the successful amplification and will be used in population structure analyses.
Acknowledgments
Research was supported by the project “Key tech-niques for sand dune stabilization and vegetation re-
covery in the typical regions of the countries along the Silk Road Economic Belt” (REF: 2016YFE0203400) supported by the Ministry of Science and Technol-ogy of China and grant АР05131621 “Informa-tional system for molecular genetic and botanical documentation of wild flora in Kazakhstan” sup-ported by the Ministry of Education and Science, Republic of Kazakhstan. The authors are grateful to Dr. A. Imanbayeva, Mangyshlak Experimental Bo-tanical Garden for sampling populations of Salsola and Haloxylon species collected in Mangistau region of western Kazakhstan in the framework of the Re-search Program 0237 (2015-2017) coordinated by the Institute of Plant Biology and Biotechnology (IPBB) and staff of the Laboratory of Plant molecular genet-ics, IPBB for collecting samples of Agriophillym and Haloxylon.
References
1 Finch D.M. (2012) Climate change in grass-lands, shrublands, and deserts of the interior Ameri-can West: a review and needs assessment. Gen. Tech. Rep., vol. 285, pp. 139. https://doi.org/10.2737/RMRS-GTR-285.
2 The Sixth National report of biological di-versity in the Republic of Kazakhstan, Astana, 2018.
3 Kurochkina L.Ya. (2003) Psammofit des-ert shrub. Botanical geography of Kazakhstan and Central Asia (within the desert region) [Psammofit-nokustarnikovye pustyni. Botanicheskaja geografija Kazahstana i Srednej Azii (v predelah pustynnoj oblasti)], Nauka: St. Petersburg, pp. 83-92. ISBN 5-201-11116-5.
4 Buras A., Wucherer W., Zerbe S., Noviskiy Z., Muchitdinov N. (2012) Allometric variability of Haloxylon species in Central Asia. Forest Ecol Manag., vol. 274, pp. 1-9. https://doi.org/10.1016/j.foreco.2012.02.023.
5 Zhaglovskaya A., Chlachula J., Thevs N., Myrzagaliyeva A., Aidossova S. (2017) Natural Re-generation Potential of the Black Saxaul Shrub for-ests in Semi-Deserts of Central Asia – the Ili River Delta Area, SE Kazakhstan. Pol J Ecol., vol. 65, no. 3, pp. 352-368. https://doi.org/10.3161/15052249PJE2017.65.3.004.
6 Shomurodov H.F., Khasanov F.O. (2014) Fodder plants of the Kyzyl Kum Desert. Arid Eco-systems, vol. 4, no. 3, pp. 208–213. https://doi.org/10.1134/S2079096114030093.
7 Long Y., Zhang J., Tian X., Wu S., et al. (2014) De novo assembly of the desert tree Halox-ylon ammodendron (CA Mey.) based on RNA-Seq
67N. Favarisova et al.
Int. j. biol. chem. (Online) International Journal of Biology and Chemistry 13, № 1, 57 (2020)
data provides insight into drought response, gene discovery and marker identification. BMC genomics, vol. 15, no. 1, pp. 1-11. https://doi.org/10.1186/1471-2164-15-1111.
8 Kadereit G., Gotzek D., Jacobs S., Freitag H. (2005) Origin and age of Australian Chenopodiace-ae. Org Divers Evol., vol. 5, no. 1, pp. 59–80. https://doi.org/10.1016/j.ode.2004.07.002.
9 Genievskaya Y., Abugalieva S., Zhuba-nysheva A., Turuspekov Y. (2017) Morphological description and DNA barcoding study of sand rice (Agriophyllum squarrosum, Chenopodiaceae) col-lected in Kazakhstan. BMC Plant Biol., vol. 17, no. 1, pp. 177. https://doi.org/10.1186/s12870-017-1132-1.
10 Chen G., Zhao J., Zhao X., Zhao P., et al. (2014) A psammophyte Agriophyllum squarro-sum (L.) Moq.: a potential food crop. Genet Resour Crop Ev., vol. 61, no. 3, pp. 669-676. https://doi.org/10.1007/s10722-014-0083-8.
11 Grebennikov K.A. (2016) Features of the current distribution and state of populations of Sal-sola arbuscula Pall., Chenopodiaceae in the vicinity of Baskunchak lake [Osobennosti sovremennogo rasprostranenija i sostojanija populjacij soljanki derevcevidnoj (Salsola arbuscula Pall., Chenopo-diaceae) v okrestnostjah ozera Baskunchak], Astra-khan herald of ecological education, vol. 35, no. 1, pp. 42-45.
12 Red Book of Kazakhstan. Plants [Krasnaja kniga Kazahstana. Rastenija], 2014, vol. 2, no. 1. Astana, JSC ArtPrintXXI, 52 p.
13 Toderich K.N., Popova V.V., Aralova D.B., Gismatulina L.G., et al. (2016) Halophytes and salt-resistant plants as animal feed at the farm level in Karakalpakstan [Galofity i soleustojchivye rastenija v kachestve korma zhivotnyh na urovne fermerskih hoz-jajstv v Karakalpakstane], Tashkent, 58 p.
14 Simonett O., Novikov O. (2010) Land Deg-radation and Desertification in Central Asia. In: Re-port, Central Asian Countries Initiative for Land-scape Management. Final Report for the Swiss GEF Council Member, 19 p.
15 Ryan F.J., Ayres D.R. (2000) Molecular markers indicate two cryptic, genetically divergent populations of Russian thistle (Salsola tragus) in California. Can. J Botany, vol. 78, no. 1, pp. 59-67. https://doi.org/10.1139/b99-160.
16 Turuspekov Y., Adams R., Kearney C. (2002) Genetic diversity in three perennial grass-es from the Semipalatinsk nuclear testing region of Kazakhstan after long-term radiation exposure. Biochem Syst Ecol., vol. 30, no. 9, pp. 809-817. https://doi.org/10.1016/S0305-1978(02)00021-2.
17 Ayres D., Ryan F.J., Grotkopp E., Bailey J., Gaskin J. (2009) Tumbleweed (Salsola, section Kali) species and speciation in California. Biol Invasions, vol. 11, no. 5, pp. 1175-1187. https://doi.org/10.1007/s10530-008-9380-5.
18 Boronnikova S.V., Kalendar R.N. (2010) Us-ing IRAP markers for analysis of genetic variability in populations of resource and rare species of plants. Russ J Genet., vol. 46, no. 1, pp. 44-50. https://doi.org/10.1134/S1022795410010060.
19 McGray H.G., Ayres D.R., Sloop C.M., Lee A.K. (2008) Beta SSR loci cross-ampli-fy in five Salsola taxa. Mol Ecol Resour., vol. 8, no. 3, pp. 608-611. https://doi.org/10.1111/j.1471-8286.2007.02014.x.
20 Ravishankar K.V., Bommisetty P. (2013) Simple Sequence Repeats Amplification. Micro-satellites. Methods in Molecular Biology (Methods and Protocols), vol. 1006, pp. 133-138. https://doi.org/10.1007/978-1-62703-389-3_9.
21 Omasheva М., Flachowsky H., Ryabushkina N., Pozharskiy A., et al. (2017) To what extent do wild apples in Kazakhstan retain their genetic in-tegrity? Tree Genet Genomes, vol. 13, no. 3, p. 52. https://doi.org/10.1007/s11295-017-1134-z.
22 Abdel-Hamid A.M.E. (2016) Characteriza-tion of four Salsola species and their genetic relation-ship by AFLP. Pak J Bot., vol. 48, no. 3, pp. 1183-1187.
23 Almerekova S., Lisztes-Szabo Z., Mukhitdi-nov N., Kurmanbayeva M., Abidkulova K., Sramko G. (2018) Genetic diversity and population genetic structure of the endangered Kazakh endemic Oxyt-ropis almaatensis Bajt. (Fabaceae). Acta Botanica Hungarica, vol. 60, no. 3-4, pp. 263-278. https://doi.org/10.1556/034.2018.1.
24 Schroeder H., Fladung M. (2010) SSR and SNP markers for the identification of clones, hybrids and species within the genus Populus. Silvae Genet., vol. 59, no. 6, pp. 257-263. https://doi.org/10.1515/sg-2010-0036.
25 Turuspekov Y., Abugalieva S., Ermekbayev K., Sato K. (2014) Genetic characterization of wild barley populations (Hordeum vulgare ssp. sponta-neum) from Kazakhstan based on genome wide SNP analysis. Breeding Sci., vol. 64, no. 4, pp. 399-403. https://doi.org/10.1270/jsbbs.64.399.
26 Akhani H., Edwards G., Roalson E. H. (2007) Diversification of the Old World Salsoleae s.l. (Che-nopodiaceae): Molecular phylogenetic analysis of nuclear and chloroplast data sets and a revised classi-fication. Int J Plant Sci., vol. 168, no. 6, pp. 931-956. https://doi.org/10.1086/518263.
68 Optimization of PCR conditions for Agriofillum, Haloxylon and Salsola microsatellite loci
Int. j. biol. chem. (Online) International Journal of Biology and Chemistry 13, № 1, 57 (2020)
27 Turuspekov Y., Abugalieva S. (2015) Plant DNA barcoding project in Kazakhstan. Genome, vol. 58, no. 5, p. 290.
28 Wen Z.B., Zhang M.L., Zhu G.L., Sander-son S.C. (2010) Phylogeny of Salsoleae s.l. (Cheno-podiaceae) based on DNA sequence data from ITS, psbB–psbH, and rbcL, with emphasis on taxa of northwestern China. Plant Syst and Evol., vol. 288, no. 1-2, pp. 25-42. https://doi.org/10.1007/s00606-010-0310-5
29 Abugalieva S., Volkova L., Genievskaya Y., Ivaschenko A., et al. (2017) Taxonomic assessment of Allium species from Kazakhstan based on ITS and matK markers. BMC Plant Biol., vol. 17, no. 2, pp. 51-60. https://doi.org/10.1186/s12870-017-1194-0.
30 Almerekova Sh., Mukhitdinov N., Abug-alieva S. (2017) Phylogenetic study of the endemic species Oxytropis almaatensis (Fabaceae) based on nuclear ribosomal DNA ITS sequences. BMC Plant Biol., vol. 17, suppl. 1, pp. 19-27. https://doi.org/10.1186/s12870-017-1128-x.
31 Turuspekov Y., Genievskaya Y., Baibula-tova A., Zatybekov A., et al. (2018) Phylogenetic taxonomy of Artemisia L. species from Kazakhstan based on matK analyses. Proceedings of the Latvi-an Academy of Sciences. Section B., vol. 72, no. 1, pp. 29-37. https://doi.org/10.1515/prolas-2017-0068.
32 Zhang D.X., Hewitt G.M. (2003) Nuclear DNA analyses in genetic studies of populations: practice, problems and prospects. Mol Ecol., vol. 12, no. 3, pp. 563–584. https://doi.org/10.1046/j.1365-294X.2003.01773.x.
33 Barbara T., Palma-Silva C., Paggi G.M., Bered F., et al. (2007) Cross-species transfer of nuclear microsatellite markers: potential and limi-tations. Mol Ecol., vol. 16, no. 18, pp. 3759-3767. https://doi.org/10.1111/J.1365-294X.2007.03439.X.
34 Raveendar S., Lee G.A., Jeon Y.A., Lee Y.J., et al. (2015). Cross-amplification of Vicia sa-tiva subsp. Sativa microsatellites across 22 other Vi-cia species. Molecules, vol. 20, no. 1, pp. 1543-1550. https://doi.org/10.3390/molecules20011543.
35 Yan Z., Wu F., Luo K., Zhao Y., et al. (2017) Cross-species transferability of EST-SSR markers developed from the transcriptome of Melilotus and their application to population genetics research. Sci Rep-UK, vol. 7, no. 1, pp. 1-11. https://doi.org/10.1038/s41598-017-18049-8.
36 González-Martínez S., Robledo-Arnuncio J., Collada C., Díaz A., et al. (2004) Cross-amplifi-cation and sequence variation of microsatellite loci
in Eurasian hard pines. Theor Appl Genet., vol. 109, no. 1, pp. 103-111. https://doi.org/10.1007/s00122-004-1596-x.
37 Zhang J., Zhao P., Zhao J., Chen G. (2018) Synteny-based mapping of causal point mutations relevant to sand rice (Agriophyllum squarrosum) tri-chomeless mutant by RNA-sequencing. Journal Plant Physiol., vol. 231, pp. 86-95. ttps://doi.org/10.1016/j.jplph.2018.09.003.
38 Cureton A.N., Burns M.J., Ford-Lloyd B.V., Newbury H.J. (2002) Development of simple sequence repeat (SSR) markers for the assessment of gene flow between sea beet (Beta vulgaris ssp. maritima) populations. Mol. Ecol. Notes, vol. 2, no. 4, pp. 402-403. https://doi.org/10.1046/j.1471-8286.2002.00253.x.
39 Doyle J.J., Doyle J.L. (1987). A rapid DNA isolation procedure for small quantities of fresh leaf tissue. Phytochem. Bulletin, vol. 19, no. 1, pp. 11-15.
40 Sheng Y, Zheng W., et al. (2004) Population genetic structure of a dominant desert tree, Haloxy-lon ammodendron (Chenopodiaceae), in the south-east Gurbantunggut desert detected by RAPD and ISSR markers (in Chinese with English Abstract). Acta Bot Sin., vol. 46, no. 6, pp. 675-681.
41 Wang X.M., Yang D.Y., Tian Y.Z., Zhang B.W., et al. (2009) Inter-simple sequence repeats analysis of Haloxylon ammodendron from seeds car-ried back by “Shenzhou No.4” spaceship (in Chinese with English Abstract). Journal of Northwest Univer-sity, vol. 39, pp. 259-263.
42 Suo Z., Jia Z., Lu Q., Pan B., et al. (2012) Distinguishing Haloxylon persicum and H. ammo-dendron (Haloxylon Bunge, Amaranthaceae) using DNA Marker. AASRI Proc., vol. 1, pp. 305-310. https://doi.org/10.1016/j.aasri.2012.06.047.
43 Bandopadhyay R., Sharma S., Rustgi S., Singh R., et al. (2004) DNA polymorphism among 18 species of Triticum-Aegilops complex using wheat EST-SSRs. Plant Sci., vol. 166, no. 2, pp. 349-356. https://doi.org/10.1016/j.plantsci.2003.09.022.
44 Kuleung C., Baenziger P.S., Dweikat I. (2004) Transferability of SSR markers among wheat, rye, and triticale. Theor Appl Genet., vol. 108, no. 6, pp. 1147–1150. https://doi.org/10.1007/s00122-003-1532-5.
45 Saha M.C., Mian M.A.R., Eujayl I., Zwonitzer J.C., et al. (2004) Tall fescue EST-SSR markers with transferability across several grass spe-cies. Theor Appl Genet., vol. 109, no. 4, pp. 783-791. https://doi.org/10.1007/s00122-004-1681-1.
© 2020 al-Farabi Kazakh National University Int. j. biol. chem. (Online)
International Journal of Biology and Chemistry 13, № 1, 69 (2020)
IRSTI 34.15.23; 34.15.25; 31.27.31; 76.03.31; 76.29.49 https://doi.org/10.26577/ijbch.2020.v13.i1.07
A.N. Akimniyazova1* , D.E. Aisina1 , A. Bolshoy2 , A.T. Ivashchenko1 1SRI of Biology and Biotechnology problems, Almaty, Kazakhstan
2Department of Evolutionary and Environmental Biology, University of Haifa, Haifa, Israel *e-mail: [email protected]
Prediction of miRNAs interaction with gastrointestinal tract cancer candidate genes
Abstract. miRNAs play an important role in regulating the expression of prevailing number of genes in the human genome. The vast majority of miRNAs are involved in the development of several diseases. Of the more than six thousand human miRNAs, only miR-619-5p has more than 200 genes with which it interacts fully complementary. These genes include several genes involved in the development of cancer of the gastrointestinal tract, which is a rare property among other miRNAs. It is required to establish the features of miR-619-5p and other miRNAs binding with candidate genes of gastrointestinal tract cancer. The location of miRNA binding sites in mRNA, the free energy of miRNA-mRNA interaction, the miRNA-mRNA nucleotide interaction scheme, and other quantitative characteristics of the miRNA-mRNA interaction were determined using the MirTarget programme. The overwhelming number of miRNAs binding sites, including miR-619-5p, are located in the 3’UTR of CYP2W1, KIAA1456, SLC26A2, SPATA13 and UQCRB genes mRNA. In the mRNA of these genes, in addition to the miR-619-5p binding sites, the binding sites of seven, twenty, nine, five and four miRNAs were detected, respectively. In mRNA of these genes, clusters of miRNAs binding sites from two and three binding sites were identified. The identified miRNAs binding sites are conserved in mRNA of orthologous primates genes, which indicates the evolutionarily early emergence of a link between miRNAs and their target genes. Schemes of interaction between miRNA and mRNA nucleotides show high efficiency in determination the quantitative characteristics of this interaction. The important role of non-canonical nucleotide pairs, which increase the free energy of the interaction between miRNA and mRNA, is shown. The revealed associations of miRNA and CYP2W1, KIAA1456, SLC26A2, SPATA13 and UQCRB target genes allow us to recommend them as markers in the development of methods for the diagnosis of the gastrointestinal tract cancer.Key words: cancer, gene, mRNA, miRNA, miR-619-5p, target genes, associations.
Inroduction
In recent years, it has been identified that miR-NAs are fully complementary to mRNA target genes [1-5]. It has been shown that such miRNAs bind to 5’UTR [3; 4; 6; 7], CDS [1; 3; 4-9] and 3’UTR [10-13]. The miRNA target genes perform many functions. It is shown that 201 target genes of miR-619-5p might serve as transcription factors, kinases, participants in metabolic processes associated with the development of various diseases, etc. [5-9]. In this work, the target genes of miR-619-5p that are involved in the development of cancer of the gastro-intestinal tract are considered: CYP2W1, KIAA1456, SLC26A2, SPATA13, UQCRB. The CYP2W1 gene involved in the development of stomach cancer [14;
15], small and large intestine [16-21], colorectal can-cer [22-30]. The KIAA1456 gene is associated with colorectal cancer [31]. A change in the expression of the SLC26A2 gene in colorectal cancer was detected [32-34]. SPATA13 [35] and UQCRB [36; 37] genes participate in the development of colorectal cancer. The interest in such miRNAs is determined by sev-eral factors: what function do related genes perform; whether these miRNAs can perform the function of siRNA; whether these genes are targets of other miR-NAs; whether miRNAs interactions with mRNAs of orthologous genes persist, etc. A comparison of the interactions of miR-619-5p and other miRNAs with mRNAs of these genes will help to understand their participation in the development of gastrointestinal tract cancer.
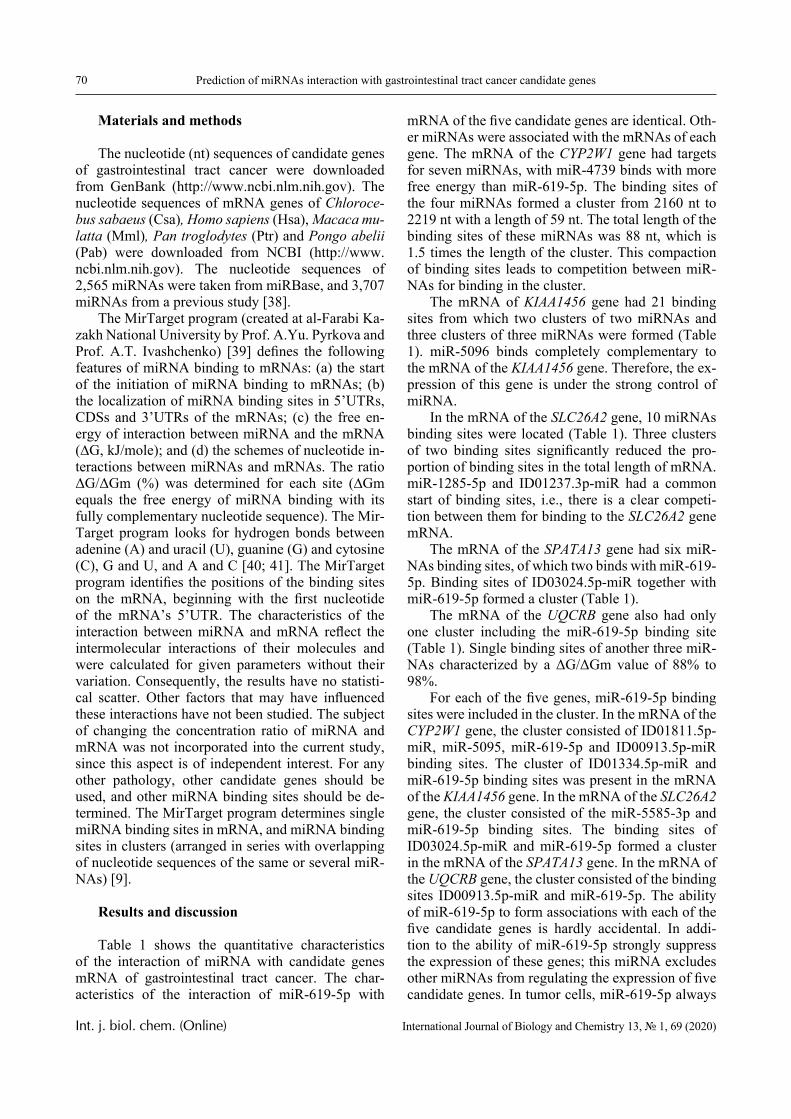
70 Prediction of miRNAs interaction with gastrointestinal tract cancer candidate genes
Int. j. biol. chem. (Online) International Journal of Biology and Chemistry 13, № 1, 69 (2020)
Materials and methods
The nucleotide (nt) sequences of candidate genes of gastrointestinal tract cancer were downloaded from GenBank (http://www.ncbi.nlm.nih.gov). The nucleotide sequences of mRNA genes of Chloroce-bus sabaeus (Csa), Homo sapiens (Hsa), Macaca mu-latta (Mml), Pan troglodytes (Ptr) and Pongo abelii (Pab) were downloaded from NCBI (http://www.ncbi.nlm.nih.gov). The nucleotide sequences of 2,565 miRNAs were taken from miRBase, and 3,707 miRNAs from a previous study [38].
The MirTarget program (created at al-Farabi Ka-zakh National University by Prof. A.Yu. Pyrkova and Prof. A.T. Ivashchenko) [39] defines the following features of miRNA binding to mRNAs: (a) the start of the initiation of miRNA binding to mRNAs; (b) the localization of miRNA binding sites in 5’UTRs, CDSs and 3’UTRs of the mRNAs; (c) the free en-ergy of interaction between miRNA and the mRNA (∆G, kJ/mole); and (d) the schemes of nucleotide in-teractions between miRNAs and mRNAs. The ratio ΔG/ΔGm (%) was determined for each site (∆Gm equals the free energy of miRNA binding with its fully complementary nucleotide sequence). The Mir-Target program looks for hydrogen bonds between adenine (A) and uracil (U), guanine (G) and cytosine (C), G and U, and A and C [40; 41]. The MirTarget program identifies the positions of the binding sites on the mRNA, beginning with the first nucleotide of the mRNA’s 5’UTR. The characteristics of the interaction between miRNA and mRNA reflect the intermolecular interactions of their molecules and were calculated for given parameters without their variation. Consequently, the results have no statisti-cal scatter. Other factors that may have influenced these interactions have not been studied. The subject of changing the concentration ratio of miRNA and mRNA was not incorporated into the current study, since this aspect is of independent interest. For any other pathology, other candidate genes should be used, and other miRNA binding sites should be de-termined. The MirTarget program determines single miRNA binding sites in mRNA, and miRNA binding sites in clusters (arranged in series with overlapping of nucleotide sequences of the same or several miR-NAs) [9].
Results and discussion
Table 1 shows the quantitative characteristics of the interaction of miRNA with candidate genes mRNA of gastrointestinal tract cancer. The char-acteristics of the interaction of miR-619-5p with
mRNA of the five candidate genes are identical. Oth-er miRNAs were associated with the mRNAs of each gene. The mRNA of the CYP2W1 gene had targets for seven miRNAs, with miR-4739 binds with more free energy than miR-619-5p. The binding sites of the four miRNAs formed a cluster from 2160 nt to 2219 nt with a length of 59 nt. The total length of the binding sites of these miRNAs was 88 nt, which is 1.5 times the length of the cluster. This compaction of binding sites leads to competition between miR-NAs for binding in the cluster.
The mRNA of KIAA1456 gene had 21 binding sites from which two clusters of two miRNAs and three clusters of three miRNAs were formed (Table 1). miR-5096 binds completely complementary to the mRNA of the KIAA1456 gene. Therefore, the ex-pression of this gene is under the strong control of miRNA.
In the mRNA of the SLC26A2 gene, 10 miRNAs binding sites were located (Table 1). Three clusters of two binding sites significantly reduced the pro-portion of binding sites in the total length of mRNA. miR-1285-5p and ID01237.3p-miR had a common start of binding sites, i.e., there is a clear competi-tion between them for binding to the SLC26A2 gene mRNA.
The mRNA of the SPATA13 gene had six miR-NAs binding sites, of which two binds with miR-619-5p. Binding sites of ID03024.5p-miR together with miR-619-5p formed a cluster (Table 1).
The mRNA of the UQCRB gene also had only one cluster including the miR-619-5p binding site (Table 1). Single binding sites of another three miR-NAs characterized by a ΔG/ΔGm value of 88% to 98%.
For each of the five genes, miR-619-5p binding sites were included in the cluster. In the mRNA of the CYP2W1 gene, the cluster consisted of ID01811.5p-miR, miR-5095, miR-619-5p and ID00913.5p-miR binding sites. The cluster of ID01334.5p-miR and miR-619-5p binding sites was present in the mRNA of the KIAA1456 gene. In the mRNA of the SLC26A2 gene, the cluster consisted of the miR-5585-3p and miR-619-5p binding sites. The binding sites of ID03024.5p-miR and miR-619-5p formed a cluster in the mRNA of the SPATA13 gene. In the mRNA of the UQCRB gene, the cluster consisted of the binding sites ID00913.5p-miR and miR-619-5p. The ability of miR-619-5p to form associations with each of the five candidate genes is hardly accidental. In addi-tion to the ability of miR-619-5p strongly suppress the expression of these genes; this miRNA excludes other miRNAs from regulating the expression of five candidate genes. In tumor cells, miR-619-5p always
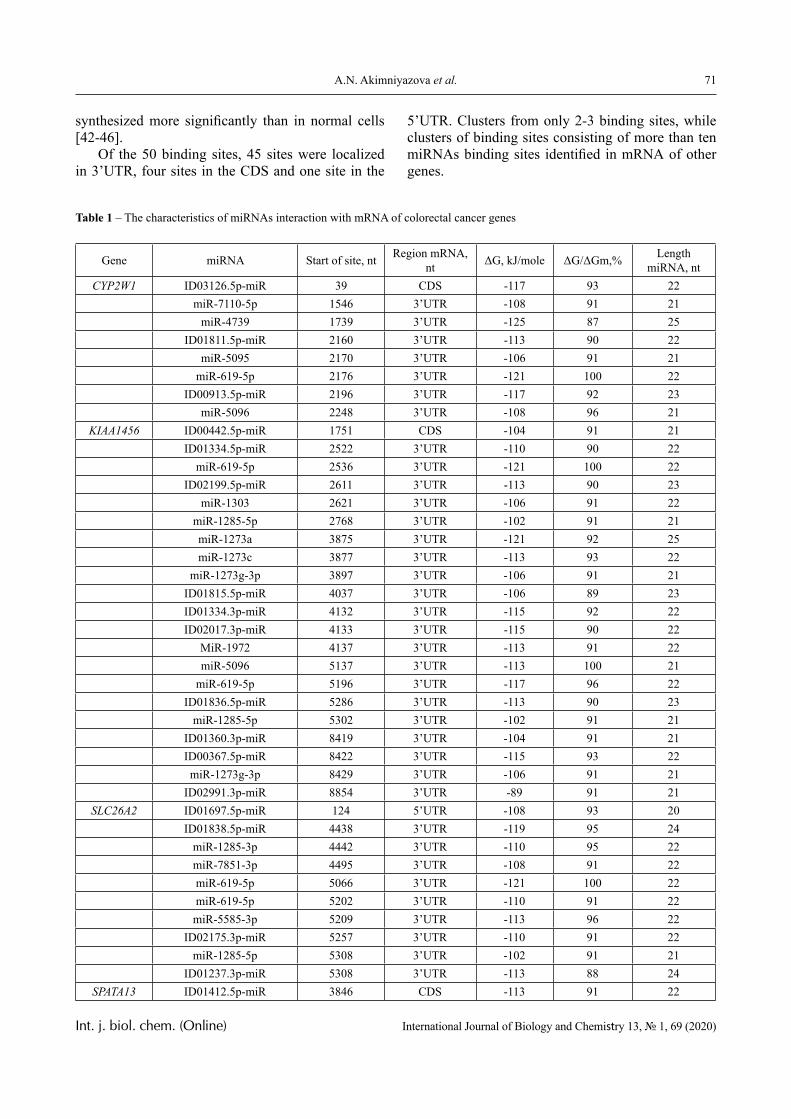
71A.N. Akimniyazova et al.
Int. j. biol. chem. (Online) International Journal of Biology and Chemistry 13, № 1, 69 (2020)
synthesized more significantly than in normal cells [42-46].
Of the 50 binding sites, 45 sites were localized in 3’UTR, four sites in the CDS and one site in the
5’UTR. Clusters from only 2-3 binding sites, while clusters of binding sites consisting of more than ten miRNAs binding sites identified in mRNA of other genes.
Table 1 – The characteristics of miRNAs interaction with mRNA of colorectal cancer genes
Gene miRNA Start of site, nt Region mRNA, nt ΔG, kJ/mole ΔG/ΔGm,% Length
miRNA, ntCYP2W1 ID03126.5p-miR 39 CDS -117 93 22
miR-7110-5p 1546 3’UTR -108 91 21miR-4739 1739 3’UTR -125 87 25
ID01811.5p-miR 2160 3’UTR -113 90 22miR-5095 2170 3’UTR -106 91 21
miR-619-5p 2176 3’UTR -121 100 22ID00913.5p-miR 2196 3’UTR -117 92 23
miR-5096 2248 3’UTR -108 96 21KIAA1456 ID00442.5p-miR 1751 CDS -104 91 21
ID01334.5p-miR 2522 3’UTR -110 90 22miR-619-5p 2536 3’UTR -121 100 22
ID02199.5p-miR 2611 3’UTR -113 90 23miR-1303 2621 3’UTR -106 91 22
miR-1285-5p 2768 3’UTR -102 91 21miR-1273a 3875 3’UTR -121 92 25miR-1273c 3877 3’UTR -113 93 22
miR-1273g-3p 3897 3’UTR -106 91 21ID01815.5p-miR 4037 3’UTR -106 89 23ID01334.3p-miR 4132 3’UTR -115 92 22ID02017.3p-miR 4133 3’UTR -115 90 22
MiR-1972 4137 3’UTR -113 91 22miR-5096 5137 3’UTR -113 100 21
miR-619-5p 5196 3’UTR -117 96 22ID01836.5p-miR 5286 3’UTR -113 90 23
miR-1285-5p 5302 3’UTR -102 91 21ID01360.3p-miR 8419 3’UTR -104 91 21ID00367.5p-miR 8422 3’UTR -115 93 22miR-1273g-3p 8429 3’UTR -106 91 21
ID02991.3p-miR 8854 3’UTR -89 91 21SLC26A2 ID01697.5p-miR 124 5’UTR -108 93 20
ID01838.5p-miR 4438 3’UTR -119 95 24miR-1285-3p 4442 3’UTR -110 95 22miR-7851-3p 4495 3’UTR -108 91 22miR-619-5p 5066 3’UTR -121 100 22miR-619-5p 5202 3’UTR -110 91 22miR-5585-3p 5209 3’UTR -113 96 22
ID02175.3p-miR 5257 3’UTR -110 91 22miR-1285-5p 5308 3’UTR -102 91 21
ID01237.3p-miR 5308 3’UTR -113 88 24SPATA13 ID01412.5p-miR 3846 CDS -113 91 22
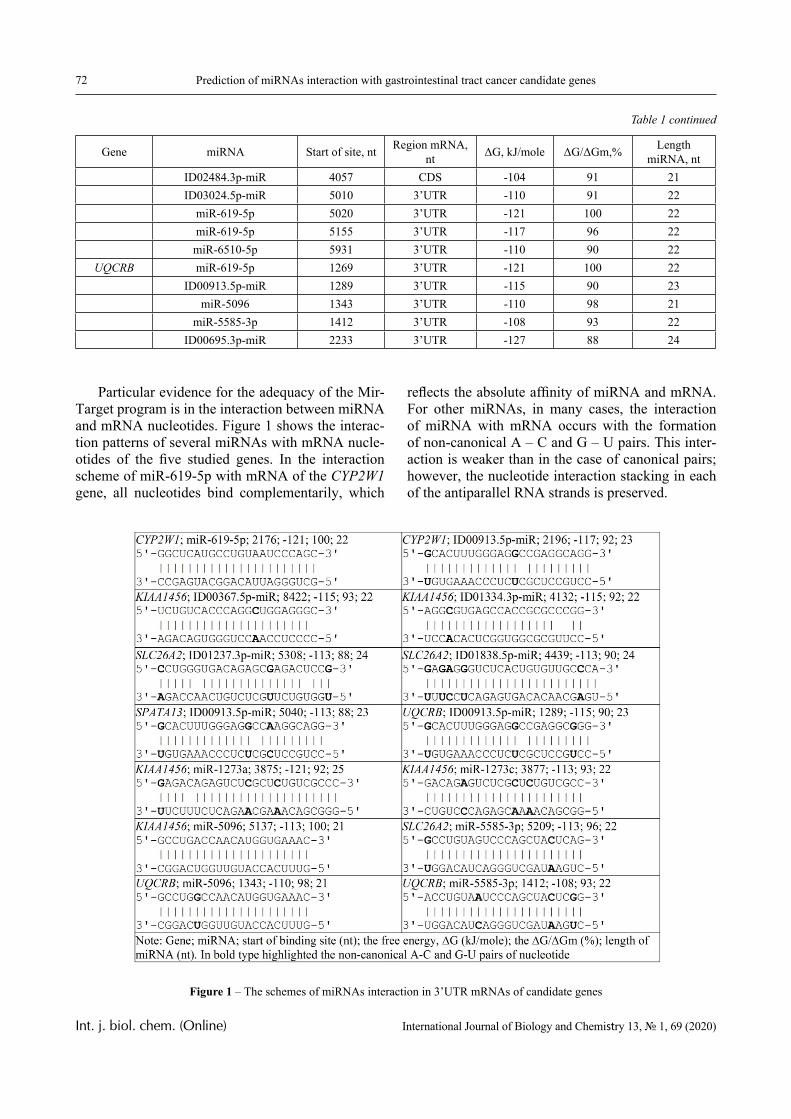
72 Prediction of miRNAs interaction with gastrointestinal tract cancer candidate genes
Int. j. biol. chem. (Online) International Journal of Biology and Chemistry 13, № 1, 69 (2020)
Gene miRNA Start of site, nt Region mRNA, nt ΔG, kJ/mole ΔG/ΔGm,% Length
miRNA, ntID02484.3p-miR 4057 CDS -104 91 21ID03024.5p-miR 5010 3’UTR -110 91 22
miR-619-5p 5020 3’UTR -121 100 22miR-619-5p 5155 3’UTR -117 96 22miR-6510-5p 5931 3’UTR -110 90 22
UQCRB miR-619-5p 1269 3’UTR -121 100 22ID00913.5p-miR 1289 3’UTR -115 90 23
miR-5096 1343 3’UTR -110 98 21miR-5585-3p 1412 3’UTR -108 93 22
ID00695.3p-miR 2233 3’UTR -127 88 24
Table 1 continued
Particular evidence for the adequacy of the Mir-Target program is in the interaction between miRNA and mRNA nucleotides. Figure 1 shows the interac-tion patterns of several miRNAs with mRNA nucle-otides of the five studied genes. In the interaction scheme of miR-619-5p with mRNA of the CYP2W1 gene, all nucleotides bind complementarily, which
reflects the absolute affinity of miRNA and mRNA. For other miRNAs, in many cases, the interaction of miRNA with mRNA occurs with the formation of non-canonical A – C and G – U pairs. This inter-action is weaker than in the case of canonical pairs; however, the nucleotide interaction stacking in each of the antiparallel RNA strands is preserved.
Figure 1 – The schemes of miRNAs interaction in 3’UTR mRNAs of candidate genes
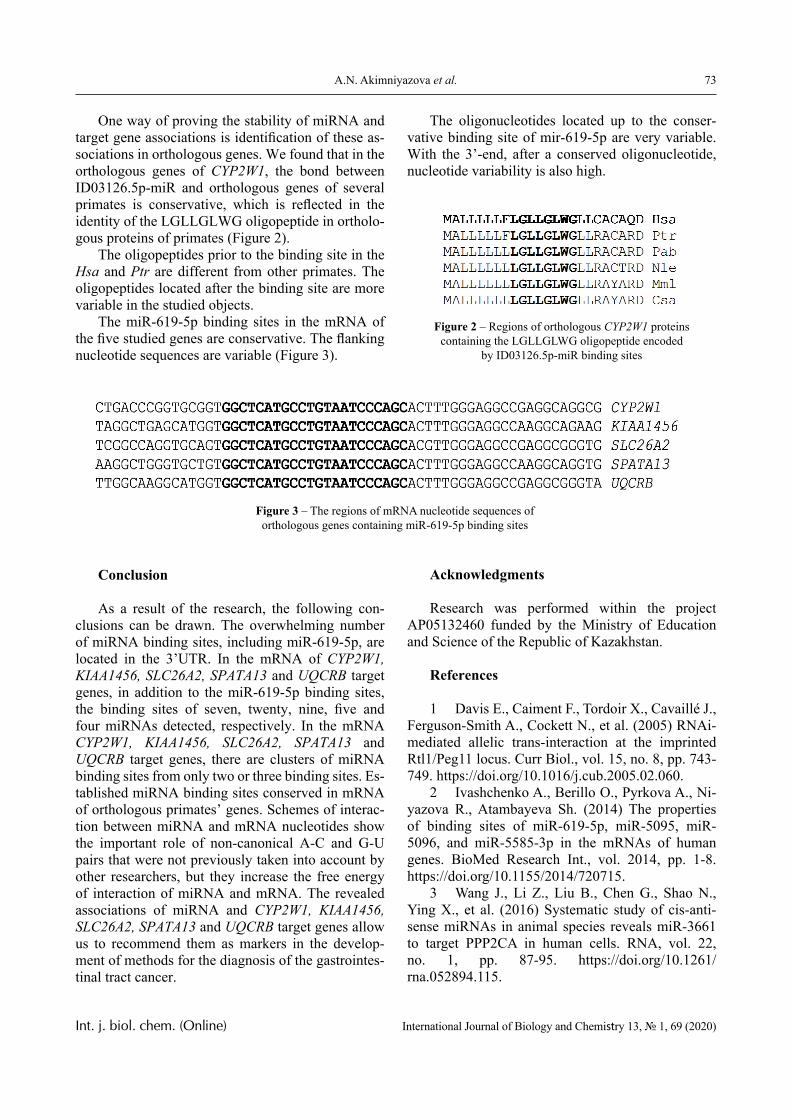
73A.N. Akimniyazova et al.
Int. j. biol. chem. (Online) International Journal of Biology and Chemistry 13, № 1, 69 (2020)
One way of proving the stability of miRNA and target gene associations is identification of these as-sociations in orthologous genes. We found that in the orthologous genes of CYP2W1, the bond between ID03126.5p-miR and orthologous genes of several primates is conservative, which is reflected in the identity of the LGLLGLWG oligopeptide in ortholo-gous proteins of primates (Figure 2).
The oligopeptides prior to the binding site in the Hsa and Ptr are different from other primates. The oligopeptides located after the binding site are more variable in the studied objects.
The miR-619-5p binding sites in the mRNA of the five studied genes are conservative. The flanking nucleotide sequences are variable (Figure 3).
The oligonucleotides located up to the conser-vative binding site of mir-619-5p are very variable. With the 3’-end, after a conserved oligonucleotide, nucleotide variability is also high.
Figure 2 – Regions of orthologous CYP2W1 proteins containing the LGLLGLWG oligopeptide encoded
by ID03126.5p-miR binding sites
Figure 3 – The regions of mRNA nucleotide sequences of orthologous genes containing miR-619-5p binding sites
Conclusion
As a result of the research, the following con-clusions can be drawn. The overwhelming number of miRNA binding sites, including miR-619-5p, are located in the 3’UTR. In the mRNA of CYP2W1, KIAA1456, SLC26A2, SPATA13 and UQCRB target genes, in addition to the miR-619-5p binding sites, the binding sites of seven, twenty, nine, five and four miRNAs detected, respectively. In the mRNA CYP2W1, KIAA1456, SLC26A2, SPATA13 and UQCRB target genes, there are clusters of miRNA binding sites from only two or three binding sites. Es-tablished miRNA binding sites conserved in mRNA of orthologous primates’ genes. Schemes of interac-tion between miRNA and mRNA nucleotides show the important role of non-canonical A-C and G-U pairs that were not previously taken into account by other researchers, but they increase the free energy of interaction of miRNA and mRNA. The revealed associations of miRNA and CYP2W1, KIAA1456, SLC26A2, SPATA13 and UQCRB target genes allow us to recommend them as markers in the develop-ment of methods for the diagnosis of the gastrointes-tinal tract cancer.
Acknowledgments
Research was performed within the project AP05132460 funded by the Ministry of Education and Science of the Republic of Kazakhstan.
References
1 Davis E., Caiment F., Tordoir X., Cavaillé J., Ferguson-Smith A., Cockett N., et al. (2005) RNAi-mediated allelic trans-interaction at the imprinted Rtl1/Peg11 locus. Curr Biol., vol. 15, no. 8, pp. 743-749. https://doi.org/10.1016/j.cub.2005.02.060.
2 Ivashchenko A., Berillo O., Pyrkova A., Ni-yazova R., Atambayeva Sh. (2014) The properties of binding sites of miR-619-5p, miR-5095, miR-5096, and miR-5585-3p in the mRNAs of human genes. BioMed Research Int., vol. 2014, pp. 1-8. https://doi.org/10.1155/2014/720715.
3 Wang J., Li Z., Liu B., Chen G., Shao N., Ying X., et al. (2016) Systematic study of cis-anti-sense miRNAs in animal species reveals miR-3661 to target PPP2CA in human cells. RNA, vol. 22, no. 1, pp. 87-95. https://doi.org/10.1261/rna.052894.115.
74 Prediction of miRNAs interaction with gastrointestinal tract cancer candidate genes
Int. j. biol. chem. (Online) International Journal of Biology and Chemistry 13, № 1, 69 (2020)
4 Yurikova O.Yu., Aisina D.E., Niyazova R.E., Atambayeva Sh.A., Labeit S., Ivashchenko A.T. (2019) The Interaction of miRNA-5p and miRNA-3p with the mRNAs of orthologous Genes. Molecu-lar biology, vol. 53, no. 4, pp. 692-704. https://doi.org/10.1134/S0026898419040189.
5 Atambayeva S., Niyazova R., Ivashchen-ko A., Pyrkova A., Pinsky I., Akimniyazova A., et al. (2017) The Binding Sites of miR-619-5p in the mRNAs of Human and Orthologous Genes. BMC Genomics, vol. 18, no. 1, pp. 428. https://doi.org/10.1186/s12864-017-3811-6.
6 Kondybayeva А.М., Akimniyazova А.N., Kamenova S.U., Ivashchenko А.Т. (2018) The char-acteristics of miRNA binding sites in mRNA of ZFHX3 gene and its orthologs. Vavilov journal of Genetics and Breeding, vol. 22, pp. 438-444. https://doi.org/10.18699/VJ18.380.
7 Aisina D.E., Niyazova R.E., Atambayeva S.A., Imyanitov E.N., Ivashchenko A.T. (2017) Char-acteristics of interaction of miRNA with mRNA of E2F transcription factors family genes. International Journal of Biology and Chemistry, vol. 2, no. 10, pp. 10-18.
8 8.Kondybayeva А., Akimniyazova A., Ka-menova S., Duchshanova G., Aisina D., Goncharova A., Ivashchenko А. (2019) Prediction of miRNA in-teraction with mRNA of stroke candidate genes. Neu-rological Sciences, pp. 1-10. https://doi.org/10.1007/s10072-019-04158-x
9 Aisina D., Niyazova R., Atambayeva S., Ivashchenko A. (2019) Prediction of clusters of miRNA binding sites in mRNA candidate genes of breast cancer subtypes. PeerJ, vol. 7, e8049. https://doi.org/10.7717/peerj.8049.
10 Ivashchenko A., Berillo O., Pyrkova A., Ni-yazova R. (2014) Binding Sites of miR-1273 Family on the mRNA of Target Genes. BioMed Res Int., 2014, pp. 620530. https://doi.org/10.1155/2014/620530.
11 Lytle J.R., Yario T.A., Steitz J.A. (2007) Tar-get mRNAs are repressed as efficiently by microR-NA-binding sites in the 5′ UTR as in the 3′ UTR. Proc. Natl Acad. Sci., vol. 104, no. 23, pp. 9667-9672. https://doi.org/10.1073/pnas.0703820104.
12 Lee I., Ajay S.S., Yook J.I., Kim H.S., Hong S.H., Kim N.H., et al. (2009) New class of microRNA targets containing simultaneous 5ꞌ-UTR and 3ꞌ-UTR interaction sites. Genome Res., vol. 19, no. 7, pp. 1175-1183. https://doi.org/10.1101/gr.089367.108
13 Ivashchenko A.T., Issabekova A.S., Berillo O.A. (2013) MiR-1279, miR-548j, miR-548m, and miR-548d-5p binding sites in CDSs of paralogous and orthologous PTPN12, MSH6, and ZEB1 genes.
BioMed Res Int., vol. 2013, pp. 902467. https://doi.org/10.1155/2013/902467.
14 Wang Y., Liu Y., Tang T., Luo Y., Stevens M.F.G., Cheng X., et al. (2019) The antitumour ac-tivity of 2-(4-amino-3-methylphenyl)-5-fluorobenzo-thiazole in human gastric cancer models is mediated by AhR signalling.J Cell Mol Med., vol. 24, no. 2, pp. 1750-1759. https://doi.org/10.1111/jcmm.14869
15 Aung P.P., Oue N., Mitani Y., Nakayama H., Yoshida K., Noguchi T., et al. (2006) Systemat-ic search for gastric cancer-specific genes based on SAGE data: melanoma inhibitory activity and ma-trix metalloproteinase-10 are novel prognostic fac-tors in patients with gastric cancer. Oncogene, vol. 25, no. 17, pp. 2546-2557. https://doi.org/10.1038/sj.onc.1209279
16 Guo J., Johansson I., Mkrtchian S., Ingel-man-Sundberg M. (2016) The CYP2W1 enzyme: regulation, properties and activation of prodrugs.Drug Metab Rev., vol. 48, no. 3, pp. 369-378. https://doi.org/10.1080/03602532.2016.1188939.
17 Guo J., Thiess S., Johansson I., Mkrtchian S., Ingelman-Sundberg M. (2016) Membrane topol-ogy and search for potential redox partners of colon cancer-specific cytochrome P450 2W1.FEBS Lett., vol. 590, no. 3, pp. 330-339. https://doi.org/10.1002/1873-3468.12063.
18 Choong E., Guo J., Persson A., Virding S., Johansson I., Mkrtchian S., et al. (2015) Devel-opmental regulation and induction of cytochrome P450 2W1, an enzyme expressed in colon tumors.PLoS One, vol. 10, no. 4, pp. e0122820. https://doi.org/10.1371/journal.pone.0122820.
19 Travica S., Pors K., Loadman P.M., Shnyder S.D., Johansson I., Alandas M.N., et al. (2013) Co-lon cancer-specific cytochrome P450 2W1 converts duocarmycin analogues into potent tumor cytotox-ins. ClinCancer Res., vol. 19, no. 11, pp. 2952-2961. https://doi.org/10.1158/1078-0432.CCR-13-0238.
20 Stenstedt K., Hallstrom M., Johansson I., Ingelman-Sundberg M., Ragnhammar P., Edler D. (2012) The expression of CYP2W1: a prognostic marker in colon cancer.Anticancer Res., vol. 32, no. 9, pp. 3869-3874.
21 Gomez A., Karlgren M., Edler D., Ber-nal M.L., Mkrtchian S., Ingelman-Sundberg M. (2007) Expression of CYP2W1 in colon tumors: regulation by gene methylation. Pharmacoge-nomics, vol. 8, no. 10, pp. 1315-1325. https://doi.org/10.2217/14622416.8.10.1315.
22 Liang L., Zeng J.H., Qin X.G., Chen J.Q., Luo D.Z., Chen G. (2018) Distinguishable Prognos-tic Signatures of Left- and Right-Sided Colon Can-
75A.N. Akimniyazova et al.
Int. j. biol. chem. (Online) International Journal of Biology and Chemistry 13, № 1, 69 (2020)
cer: a Study Based on Sequencing Data.Cell Physi-olBiochem., vol. 48, no. 2, pp. 475-490. https://doi.org/10.1159/000491778.
23 Beyerle J., Holowatyj A.N., Haffa M., Frei E., Gigic B., Schrotz-King P., et al. (2020) Expres-sion patterns of xenobiotic-metabolizing enzymes in tumor and adjacent normal mucosa tissues among patients with colorectal cancer: the colocare study. Cancer Epidemiol Biomarkers Prev., vol. 29, no. 2, pp. 460-469. https://doi.org/10.1158/1055-9965.EPI-19-0449.
24 Chung F.F., Mai C.W., Ng P.Y., Leong C.O. (2016) Cytochrome P450 2W1 (CYP2W1) in Colorectal Cancers.CurrCancer Drug Targets, vol. 16, no. 1, pp. 71-78. https://doi.org/10.2174/1568009616888151112095948.
25 Stenstedt K., Hallstrom M., Lédel F., Ragn-hammar P., Ingelman-Sundberg M., Johansson I., et al. (2014) The expression of CYP2W1 in colorec-tal primary tumors, corresponding lymph node me-tastases and liver metastases. Acta Oncol., vol. 53, no. 7, pp. 885-891. https://doi.org/10.3109/0284186X.2014.887224.
26 Stenstedt K., Travica S., Guo J., Barragan I., Pors K., Patterson L., et al. (2013) CYP2W1 polymorphism: functional aspects and relation to risk for colorectal cancer. Pharmacogenomics, vol. 14, no. 13, pp. 1615-1622. https://doi.org/10.2217/pgs.13.136.
27 Tan B.S., Tiong K.H., Muruhadas A., Randhawa N., Choo H.L., Bradshaw T.D., et al. (2011) CYP2S1 and CYP2W1 mediate 2-(3,4-dimethoxyphenyl)-5-fluorobenzothiazole (GW-610, NSC 721648) sensitivity in breast and colorectal cancer cells. Mol Cancer Ther., vol. 10, no. 10, pp. 1982-1992. https://doi.org/10.1158/1535-7163.MCT-11-0391.
28 Gomez A., Nekvindova J., Travica S., Lee M.Y., Johansson I., Edler D., et al. (2010) Colorec-tal cancer-specific cytochrome P450 2W1: intracel-lular localization, glycosylation, and catalytic activ-ity. MolPharmacol., vol. 78, no. 6, pp. 1004-1011. https://doi.org/10.1124/mol.110.067652.
29 Chung F.F., Mai C.W., Ng P.Y., Leong C.O. (2016) Cytochrome P450 2W1 (CYP2W1) in Colorectal Cancers. Curr Cancer Drug Targets, vol. 16, no. 1, pp. 71-8. https://doi.org/10.2174/1568009616888151112095948.
30 Edler D., Stenstedt K., Ohrling K., Hallström M., Karlgren M., Ingelman-Sundberg M., et al. (2009) The expression of the novel CYP2W1 enzyme is an independent prognostic factor in colorectal cancer – a
pilot study. Eur J Cancer., vol. 45, no. 4, pp. 705-712. https://doi.org/10.1016/j.ejca.2008.11.031.
31 Flanagan J.M., Healey S., Young J., White-hall V., Trott D.A., Newbold R.F., et al. (2004) Map-ping of a candidate colorectal cancer tumor-suppres-sor gene to a 900-kilobase region on the short arm of chromosome 8. Genes Chromosomes Cancer., vol. 40, no. 3, pp. 247-260. https://doi.org/10.1002/gcc.20039.
32 Inoue A., Okamoto K., Fujino Y., Nakagawa T., Muguruma N., Sannomiya K., et al. (2015) B-RAF mutation and accumulated gene methylation in aberrant crypt foci (ACF), sessile serrated adenoma/polyp (SSA/P) and cancer in SSA. P.Br J Cancer., vol. 112, no. 2, pp. 403-412. https://doi.org/10.1038/bjc.2014.545.
33 Pitule P., Vycital O., Bruha J., Novak P., Hosek P., Treska V., et al. (2013) Differential expres-sion and prognostic role of selected genes in colorec-tal cancer patients. Anticancer Res., vol. 33, no. 11, pp. 4855-4865.
34 Yusa A., Miyazaki K., Kimura N., Izawa M., Kannagi R. (2010) Epigenetic silencing of the sulfate transporter gene DTDST induces sialyl Lewisx ex-pression and accelerates proliferation of colon cancer cells. Cancer Res., vol. 70, no. 10, pp. 4064-4073. https://doi.org/10.1158/0008-5472.CAN-09-2383.
35 Kawasaki Y., Sagara M., Shibata Y., Shirou-zu M., Yokoyama S., Akiyama T. (2007) Identifica-tion and characterization of Asef2, a guanine-nucle-otide exchange factor specific for Rac1 and Cdc42. Oncogene., vol. 26, no. 55, pp. 7620-7267. https://doi.org/10.1038/sj.onc.1210574.
36 Kim H.C., Chang J., Lee H.S., Kwon H.J. (2017) Mitochondrial UQCRB as a new molecular prognostic biomarker of human colorectal cancer.ExpMol Med., vol. 49, no. 11, pp. e391. https://doi.org/10.1038/emm.2017.152.
37 Lascorz J., Bevier M., Schönfels W.V., Kalthoff H., Aselmann H., Beckmann J., et al. (2012) Polymorphisms in the mitochondrial oxidative phos-phorylation chain genes as prognostic markers for colorectal cancer.BMC Med Genet., vol. 13, pp. 31. https://doi.org/10.1186/1471-2350-13-31.
38 Londin E., Loher P., Telonis A.G., Quann K., Clark P., Jing Y., et al. (2015) Analysis of 13 cell types reveals evidence for the expression of numerous novel primate- and tissue-specific microRNAs. PNAS USA, vol. 112, no. 10, pp. 1106-1115. https://doi.org/10.1073/pnas.1420955112.
39 Ivashchenko A., Berillo O., Pyrkova A., Ni-yazova R., Atambayeva Sh. (2014) MiR-3960 bind-
76 Prediction of miRNAs interaction with gastrointestinal tract cancer candidate genes
Int. j. biol. chem. (Online) International Journal of Biology and Chemistry 13, № 1, 69 (2020)
ing sites with mRNA of human genes. Bioinforma-tion, vol. 10, no. 7, pp. 423–427.
40 Lemieux S., Major F. (2002) RNA canonical and non-canonical base pairing types: a recognition method and complete repertoire. Nucleic Acids Res., vol. 30, pp. 4250-4263. https://doi.org/10.1093/nar/gkf540
41 Garg A., Heinemann U. (2018) A novel form of RNA double helix based on G·U and C·A+ wob-ble base pairing. RNA, vol. 24, pp. 209-218. https://doi.org/:10.1261/rna.064048.117
42 Kim D.H., Park S., Kim H., Choi YJ., Kim SY., Sung KJ., Sung YH., Choi CM., Yun M., Yi YS., Lee CW., Kim SY., Lee JC., Rho JK. (2020) Tumor-derived exosomal miR-619-5p promotes tumor an-giogenesis and metastasis through the inhibition of RCAN1.4. Cancer Lett., vol. 475, pp. 2-13. https://doi.org/10.1016/j.canlet.2020.01.023.
43 Chen G., Gu Y., Han P., Li Z., Zhao JL., Gao MZ. (2019) Long noncoding RNA SBF2-AS1 promotes colorectal cancer proliferation and inva-sion by inhibiting miR-619-5p activity and facilitat-ing HDAC3 expression. J Cell Physiol., vol. 234,
no. 10, pp. 18688-18696. https://doi.org/10.1002/jcp.28509.
44 Shkurnikov M.Y., Makarova Y.A., Knyazev E.N., Fomicheva K.A., Galatenko A.V., Nyushko K.M., Galatenko V.V., Vechorko V.I., Alekseev B.Y. (2017) Plasma Level of hsa-miR-619-5p microRNA Is Associated with Prostatic Cancer Dissemination beyond the Capsule. Bull Exp Biol Med., vol. 163, no. 4, pp. 475-477. https://doi.org/10.1007/s10517-017-3831-x. PMID:28853076
45 Qiu G., Zhang XB., Zhang SQ., Liu PL., Wu W., Zhang JY., Dai SR. (2016) Dysregulation of MALAT1 and miR-619-5p as a prognostic indi-cator in advanced colorectal carcinoma. OncolLett., vol. 12, no. 6, pp. 5036-5042. https://doi.org/10.3892/ol.2016.5312.
46 Knyazev E.N., Fomicheva K.A., Mikhailen-ko D.S., Nyushko K.M., Samatov T.R., Alekseev B.Y., Shkurnikov M.Y. (2016) Plasma levels of hsa-miR-619-5p and hsa-miR-1184 differ in prostatic benign hyperplasia and cancer. Bull Exp Biol Med., vol. 161, no. 1, pp. 108-11. https://doi.org/10.1007/s10517-016-3357-7.
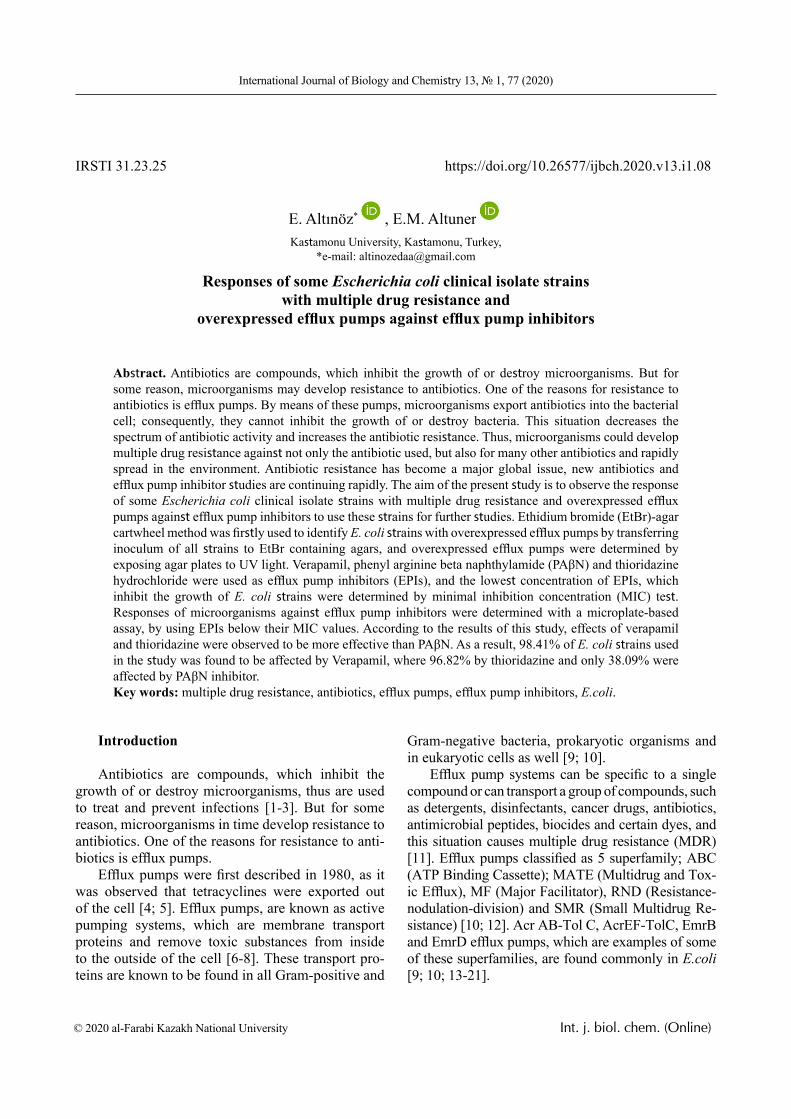
© 2020 al-Farabi Kazakh National University Int. j. biol. chem. (Online)
International Journal of Biology and Chemistry 13, № 1, 77 (2020)
IRSTI 31.23.25 https://doi.org/10.26577/ijbch.2020.v13.i1.08
E. Altınöz* , E.M. Altuner Kastamonu University, Kastamonu, Turkey,
*e-mail: [email protected]
Responses of some Escherichia coli clinical isolate strains with multiple drug resistance and
overexpressed efflux pumps against efflux pump inhibitors
Abstract. Antibiotics are compounds, which inhibit the growth of or destroy microorganisms. But for some reason, microorganisms may develop resistance to antibiotics. One of the reasons for resistance to antibiotics is efflux pumps. By means of these pumps, microorganisms export antibiotics into the bacterial cell; consequently, they cannot inhibit the growth of or destroy bacteria. This situation decreases the spectrum of antibiotic activity and increases the antibiotic resistance. Thus, microorganisms could develop multiple drug resistance against not only the antibiotic used, but also for many other antibiotics and rapidly spread in the environment. Antibiotic resistance has become a major global issue, new antibiotics and efflux pump inhibitor studies are continuing rapidly. The aim of the present study is to observe the response of some Escherichia coli clinical isolate strains with multiple drug resistance and overexpressed efflux pumps against efflux pump inhibitors to use these strains for further studies. Ethidium bromide (EtBr)-agar cartwheel method was firstly used to identify E. coli strains with overexpressed efflux pumps by transferring inoculum of all strains to EtBr containing agars, and overexpressed efflux pumps were determined by exposing agar plates to UV light. Verapamil, phenyl arginine beta naphthylamide (PAβN) and thioridazine hydrochloride were used as efflux pump inhibitors (EPIs), and the lowest concentration of EPIs, which inhibit the growth of E. coli strains were determined by minimal inhibition concentration (MIC) test. Responses of microorganisms against efflux pump inhibitors were determined with a microplate-based assay, by using EPIs below their MIC values. According to the results of this study, effects of verapamil and thioridazine were observed to be more effective than PAβN. As a result, 98.41% of E. coli strains used in the study was found to be affected by Verapamil, where 96.82% by thioridazine and only 38.09% were affected by PAβN inhibitor. Key words: multiple drug resistance, antibiotics, efflux pumps, efflux pump inhibitors, E.coli.
Introduction
Antibiotics are compounds, which inhibit the growth of or destroy microorganisms, thus are used to treat and prevent infections [1-3]. But for some reason, microorganisms in time develop resistance to antibiotics. One of the reasons for resistance to anti-biotics is efflux pumps.
Efflux pumps were first described in 1980, as it was observed that tetracyclines were exported out of the cell [4; 5]. Efflux pumps, are known as active pumping systems, which are membrane transport proteins and remove toxic substances from inside to the outside of the cell [6-8]. These transport pro-teins are known to be found in all Gram-positive and
Gram-negative bacteria, prokaryotic organisms and in eukaryotic cells as well [9; 10].
Efflux pump systems can be specific to a single compound or can transport a group of compounds, such as detergents, disinfectants, cancer drugs, antibiotics, antimicrobial peptides, biocides and certain dyes, and this situation causes multiple drug resistance (MDR) [11]. Efflux pumps classified as 5 superfamily; ABC (ATP Binding Cassette); MATE (Multidrug and Tox-ic Efflux), MF (Major Facilitator), RND (Resistance-nodulation-division) and SMR (Small Multidrug Re-sistance) [10; 12]. Acr AB-Tol C, AcrEF-TolC, EmrB and EmrD efflux pumps, which are examples of some of these superfamilies, are found commonly in E.coli [9; 10; 13-21].
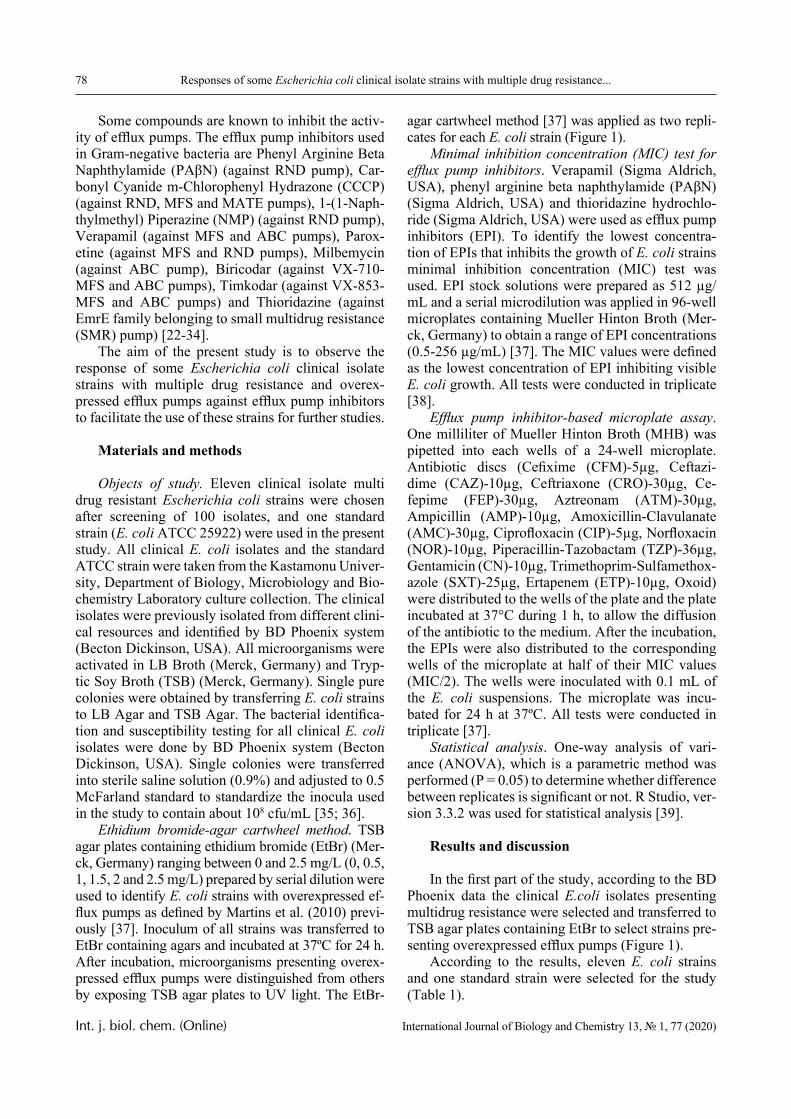
78 Responses of some Escherichia coli clinical isolate strains with multiple drug resistance...
Int. j. biol. chem. (Online) International Journal of Biology and Chemistry 13, № 1, 77 (2020)
Some compounds are known to inhibit the activ-ity of efflux pumps. The efflux pump inhibitors used in Gram-negative bacteria are Phenyl Arginine Beta Naphthylamide (PAβN) (against RND pump), Car-bonyl Cyanide m-Chlorophenyl Hydrazone (CCCP) (against RND, MFS and MATE pumps), 1-(1-Naph-thylmethyl) Piperazine (NMP) (against RND pump), Verapamil (against MFS and ABC pumps), Parox-etine (against MFS and RND pumps), Milbemycin (against ABC pump), Biricodar (against VX-710-MFS and ABC pumps), Timkodar (against VX-853-MFS and ABC pumps) and Thioridazine (against EmrE family belonging to small multidrug resistance (SMR) pump) [22-34].
The aim of the present study is to observe the response of some Escherichia coli clinical isolate strains with multiple drug resistance and overex-pressed efflux pumps against efflux pump inhibitors to facilitate the use of these strains for further studies.
Materials and methods
Objects of study. Eleven clinical isolate multi drug resistant Escherichia coli strains were chosen after screening of 100 isolates, and one standard strain (E. coli ATCC 25922) were used in the present study. All clinical E. coli isolates and the standard ATCC strain were taken from the Kastamonu Univer-sity, Department of Biology, Microbiology and Bio-chemistry Laboratory culture collection. The clinical isolates were previously isolated from different clini-cal resources and identified by BD Phoenix system (Becton Dickinson, USA). All microorganisms were activated in LB Broth (Merck, Germany) and Tryp-tic Soy Broth (TSB) (Merck, Germany). Single pure colonies were obtained by transferring E. coli strains to LB Agar and TSB Agar. The bacterial identifica-tion and susceptibility testing for all clinical E. coli isolates were done by BD Phoenix system (Becton Dickinson, USA). Single colonies were transferred into sterile saline solution (0.9%) and adjusted to 0.5 McFarland standard to standardize the inocula used in the study to contain about 108 cfu/mL [35; 36].
Ethidium bromide-agar cartwheel method. TSB agar plates containing ethidium bromide (EtBr) (Mer-ck, Germany) ranging between 0 and 2.5 mg/L (0, 0.5, 1, 1.5, 2 and 2.5 mg/L) prepared by serial dilution were used to identify E. coli strains with overexpressed ef-flux pumps as defined by Martins et al. (2010) previ-ously [37]. Inoculum of all strains was transferred to EtBr containing agars and incubated at 37ºC for 24 h. After incubation, microorganisms presenting overex-pressed efflux pumps were distinguished from others by exposing TSB agar plates to UV light. The EtBr-
agar cartwheel method [37] was applied as two repli-cates for each E. coli strain (Figure 1).
Minimal inhibition concentration (MIC) test for efflux pump inhibitors. Verapamil (Sigma Aldrich, USA), phenyl arginine beta naphthylamide (PAβN) (Sigma Aldrich, USA) and thioridazine hydrochlo-ride (Sigma Aldrich, USA) were used as efflux pump inhibitors (EPI). To identify the lowest concentra-tion of EPIs that inhibits the growth of E. coli strains minimal inhibition concentration (MIC) test was used. EPI stock solutions were prepared as 512 µg/mL and a serial microdilution was applied in 96-well microplates containing Mueller Hinton Broth (Mer-ck, Germany) to obtain a range of EPI concentrations (0.5-256 µg/mL) [37]. The MIC values were defined as the lowest concentration of EPI inhibiting visible E. coli growth. All tests were conducted in triplicate [38].
Efflux pump inhibitor-based microplate assay. One milliliter of Mueller Hinton Broth (MHB) was pipetted into each wells of a 24-well microplate. Antibiotic discs (Cefixime (CFM)-5µg, Ceftazi-dime (CAZ)-10µg, Ceftriaxone (CRO)-30µg, Ce-fepime (FEP)-30µg, Aztreonam (ATM)-30µg, Ampicillin (AMP)-10µg, Amoxicillin-Clavulanate (AMC)-30µg, Ciprofloxacin (CIP)-5µg, Norfloxacin (NOR)-10µg, Piperacillin-Tazobactam (TZP)-36µg, Gentamicin (CN)-10µg, Trimethoprim-Sulfamethox-azole (SXT)-25µg, Ertapenem (ETP)-10µg, Oxoid) were distributed to the wells of the plate and the plate incubated at 37°C during 1 h, to allow the diffusion of the antibiotic to the medium. After the incubation, the EPIs were also distributed to the corresponding wells of the microplate at half of their MIC values (MIC/2). The wells were inoculated with 0.1 mL of the E. coli suspensions. The microplate was incu-bated for 24 h at 37ºC. All tests were conducted in triplicate [37].
Statistical analysis. One-way analysis of vari-ance (ANOVA), which is a parametric method was performed (P = 0.05) to determine whether difference between replicates is significant or not. R Studio, ver-sion 3.3.2 was used for statistical analysis [39].
Results and discussion
In the first part of the study, according to the BD Phoenix data the clinical E.coli isolates presenting multidrug resistance were selected and transferred to TSB agar plates containing EtBr to select strains pre-senting overexpressed efflux pumps (Figure 1).
According to the results, eleven E. coli strains and one standard strain were selected for the study (Table 1).
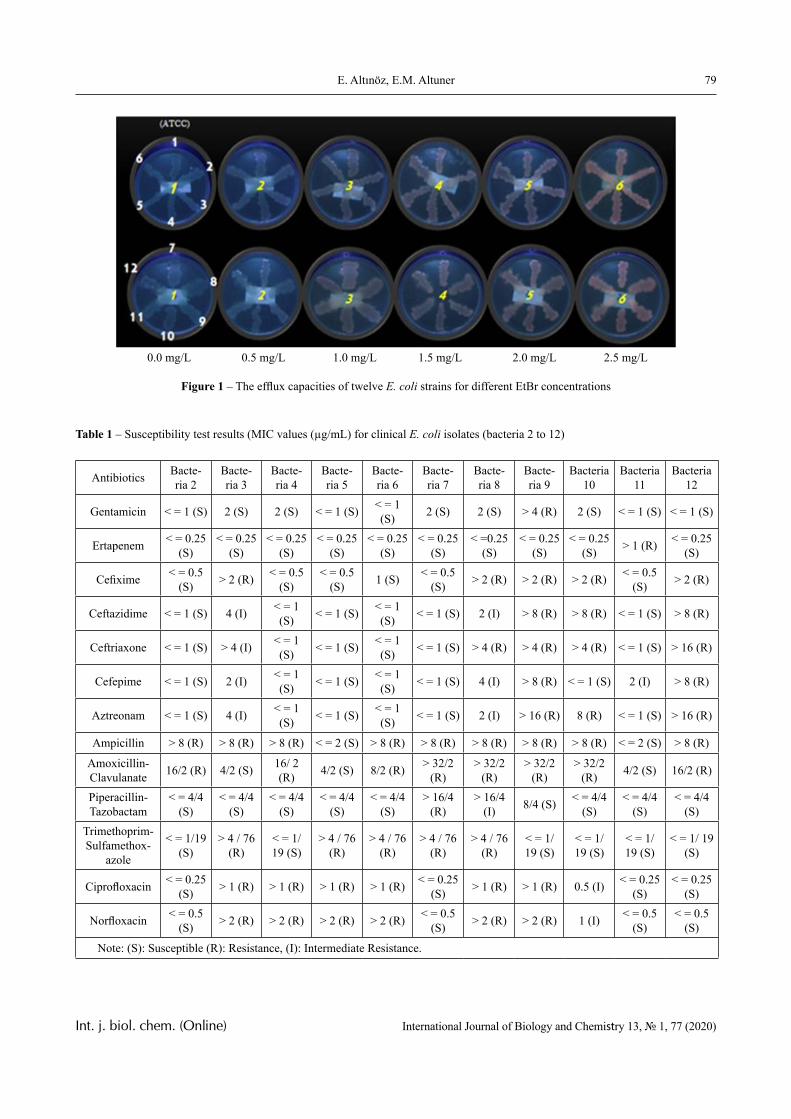
79E. Altınöz, E.M. Altuner
Int. j. biol. chem. (Online) International Journal of Biology and Chemistry 13, № 1, 77 (2020)
0.0 mg/L 0.5 mg/L 1.0 mg/L 1.5 mg/L 2.0 mg/L 2.5 mg/L
Figure 1 – The efflux capacities of twelve E. coli strains for different EtBr concentrations
Table 1 – Susceptibility test results (MIC values (µg/mL) for clinical E. coli isolates (bacteria 2 to 12)
Antibiotics Bacte-ria 2
Bacte-ria 3
Bacte-ria 4
Bacte-ria 5
Bacte-ria 6
Bacte-ria 7
Bacte-ria 8
Bacte-ria 9
Bacteria 10
Bacteria 11
Bacteria 12
Gentamicin < = 1 (S) 2 (S) 2 (S) < = 1 (S) < = 1 (S) 2 (S) 2 (S) > 4 (R) 2 (S) < = 1 (S) < = 1 (S)
Ertapenem < = 0.25 (S)
< = 0.25 (S)
< = 0.25 (S)
< = 0.25 (S)
< = 0.25 (S)
< = 0.25 (S)
< =0.25 (S)
< = 0.25 (S)
< = 0.25 (S) > 1 (R) < = 0.25
(S)
Cefixime < = 0.5 (S) > 2 (R) < = 0.5
(S)< = 0.5
(S) 1 (S) < = 0.5 (S) > 2 (R) > 2 (R) > 2 (R) < = 0.5
(S) > 2 (R)
Ceftazidime < = 1 (S) 4 (I) < = 1 (S) < = 1 (S) < = 1
(S) < = 1 (S) 2 (I) > 8 (R) > 8 (R) < = 1 (S) > 8 (R)
Ceftriaxone < = 1 (S) > 4 (I) < = 1 (S) < = 1 (S) < = 1
(S) < = 1 (S) > 4 (R) > 4 (R) > 4 (R) < = 1 (S) > 16 (R)
Cefepime < = 1 (S) 2 (I) < = 1 (S) < = 1 (S) < = 1
(S) < = 1 (S) 4 (I) > 8 (R) < = 1 (S) 2 (I) > 8 (R)
Aztreonam < = 1 (S) 4 (I) < = 1 (S) < = 1 (S) < = 1
(S) < = 1 (S) 2 (I) > 16 (R) 8 (R) < = 1 (S) > 16 (R)
Ampicillin > 8 (R) > 8 (R) > 8 (R) < = 2 (S) > 8 (R) > 8 (R) > 8 (R) > 8 (R) > 8 (R) < = 2 (S) > 8 (R)
Amoxicillin-Clavulanate 16/2 (R) 4/2 (S) 16/ 2
(R) 4/2 (S) 8/2 (R) > 32/2 (R)
> 32/2 (R)
> 32/2 (R)
> 32/2 (R) 4/2 (S) 16/2 (R)
Piperacillin-Tazobactam
< = 4/4 (S)
< = 4/4 (S)
< = 4/4 (S)
< = 4/4 (S)
< = 4/4 (S)
> 16/4 (R)
> 16/4 (I) 8/4 (S) < = 4/4
(S)< = 4/4
(S)< = 4/4
(S)Trimethoprim-Sulfamethox-
azole
< = 1/19 (S)
> 4 / 76 (R)
< = 1/ 19 (S)
> 4 / 76 (R)
> 4 / 76 (R)
> 4 / 76 (R)
> 4 / 76 (R)
< = 1/ 19 (S)
< = 1/ 19 (S)
< = 1/ 19 (S)
< = 1/ 19 (S)
Ciprofloxacin < = 0.25 (S) > 1 (R) > 1 (R) > 1 (R) > 1 (R) < = 0.25
(S) > 1 (R) > 1 (R) 0.5 (I) < = 0.25 (S)
< = 0.25 (S)
Norfloxacin < = 0.5 (S) > 2 (R) > 2 (R) > 2 (R) > 2 (R) < = 0.5
(S) > 2 (R) > 2 (R) 1 (I) < = 0.5 (S)
< = 0.5 (S)
Note: (S): Susceptible (R): Resistance, (I): Intermediate Resistance.
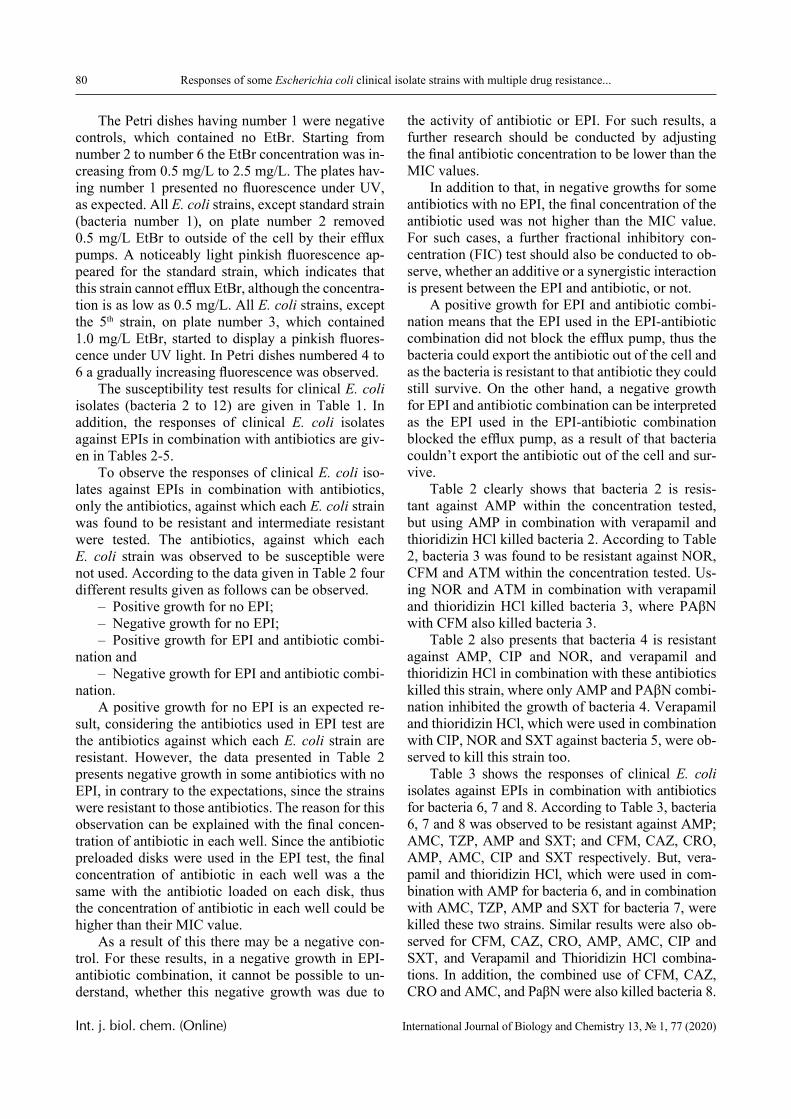
80 Responses of some Escherichia coli clinical isolate strains with multiple drug resistance...
Int. j. biol. chem. (Online) International Journal of Biology and Chemistry 13, № 1, 77 (2020)
The Petri dishes having number 1 were negative controls, which contained no EtBr. Starting from number 2 to number 6 the EtBr concentration was in-creasing from 0.5 mg/L to 2.5 mg/L. The plates hav-ing number 1 presented no fluorescence under UV, as expected. All E. coli strains, except standard strain (bacteria number 1), on plate number 2 removed 0.5 mg/L EtBr to outside of the cell by their efflux pumps. A noticeably light pinkish fluorescence ap-peared for the standard strain, which indicates that this strain cannot efflux EtBr, although the concentra-tion is as low as 0.5 mg/L. All E. coli strains, except the 5th strain, on plate number 3, which contained 1.0 mg/L EtBr, started to display a pinkish fluores-cence under UV light. In Petri dishes numbered 4 to 6 a gradually increasing fluorescence was observed.
The susceptibility test results for clinical E. coli isolates (bacteria 2 to 12) are given in Table 1. In addition, the responses of clinical E. coli isolates against EPIs in combination with antibiotics are giv-en in Tables 2-5.
To observe the responses of clinical E. coli iso-lates against EPIs in combination with antibiotics, only the antibiotics, against which each E. coli strain was found to be resistant and intermediate resistant were tested. The antibiotics, against which each E. coli strain was observed to be susceptible were not used. According to the data given in Table 2 four different results given as follows can be observed.
– Positive growth for no EPI;– Negative growth for no EPI;– Positive growth for EPI and antibiotic combi-
nation and– Negative growth for EPI and antibiotic combi-
nation.A positive growth for no EPI is an expected re-
sult, considering the antibiotics used in EPI test are the antibiotics against which each E. coli strain are resistant. However, the data presented in Table 2 presents negative growth in some antibiotics with no EPI, in contrary to the expectations, since the strains were resistant to those antibiotics. The reason for this observation can be explained with the final concen-tration of antibiotic in each well. Since the antibiotic preloaded disks were used in the EPI test, the final concentration of antibiotic in each well was a the same with the antibiotic loaded on each disk, thus the concentration of antibiotic in each well could be higher than their MIC value.
As a result of this there may be a negative con-trol. For these results, in a negative growth in EPI-antibiotic combination, it cannot be possible to un-derstand, whether this negative growth was due to
the activity of antibiotic or EPI. For such results, a further research should be conducted by adjusting the final antibiotic concentration to be lower than the MIC values.
In addition to that, in negative growths for some antibiotics with no EPI, the final concentration of the antibiotic used was not higher than the MIC value. For such cases, a further fractional inhibitory con-centration (FIC) test should also be conducted to ob-serve, whether an additive or a synergistic interaction is present between the EPI and antibiotic, or not.
A positive growth for EPI and antibiotic combi-nation means that the EPI used in the EPI-antibiotic combination did not block the efflux pump, thus the bacteria could export the antibiotic out of the cell and as the bacteria is resistant to that antibiotic they could still survive. On the other hand, a negative growth for EPI and antibiotic combination can be interpreted as the EPI used in the EPI-antibiotic combination blocked the efflux pump, as a result of that bacteria couldn’t export the antibiotic out of the cell and sur-vive.
Table 2 clearly shows that bacteria 2 is resis-tant against AMP within the concentration tested, but using AMP in combination with verapamil and thioridizin HCl killed bacteria 2. According to Table 2, bacteria 3 was found to be resistant against NOR, CFM and ATM within the concentration tested. Us-ing NOR and ATM in combination with verapamil and thioridizin HCl killed bacteria 3, where PAβN with CFM also killed bacteria 3.
Table 2 also presents that bacteria 4 is resistant against AMP, CIP and NOR, and verapamil and thioridizin HCl in combination with these antibiotics killed this strain, where only AMP and PAβN combi-nation inhibited the growth of bacteria 4. Verapamil and thioridizin HCl, which were used in combination with CIP, NOR and SXT against bacteria 5, were ob-served to kill this strain too.
Table 3 shows the responses of clinical E. coli isolates against EPIs in combination with antibiotics for bacteria 6, 7 and 8. According to Table 3, bacteria 6, 7 and 8 was observed to be resistant against AMP; AMC, TZP, AMP and SXT; and CFM, CAZ, CRO, AMP, AMC, CIP and SXT respectively. But, vera-pamil and thioridizin HCl, which were used in com-bination with AMP for bacteria 6, and in combination with AMC, TZP, AMP and SXT for bacteria 7, were killed these two strains. Similar results were also ob-served for CFM, CAZ, CRO, AMP, AMC, CIP and SXT, and Verapamil and Thioridizin HCl combina-tions. In addition, the combined use of CFM, CAZ, CRO and AMC, and PaβN were also killed bacteria 8.
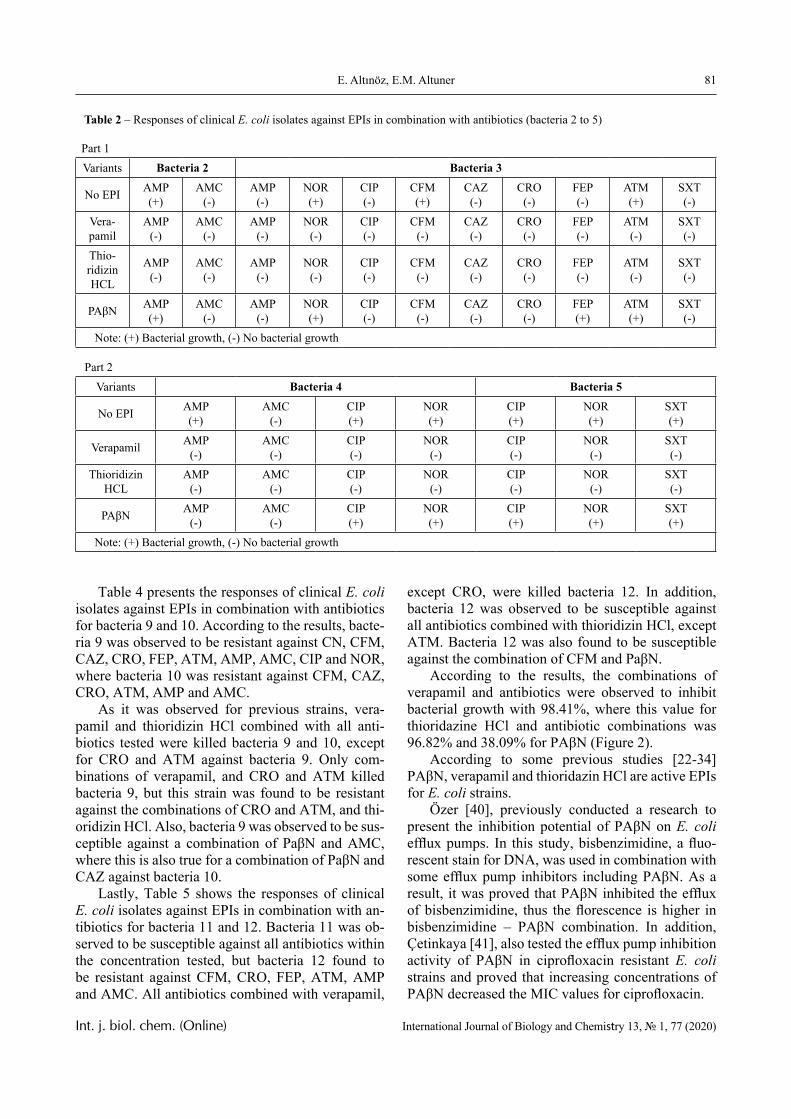
81E. Altınöz, E.M. Altuner
Int. j. biol. chem. (Online) International Journal of Biology and Chemistry 13, № 1, 77 (2020)
Table 2 – Responses of clinical E. coli isolates against EPIs in combination with antibiotics (bacteria 2 to 5)
Part 1Variants Bacteria 2 Bacteria 3
No EPI AMP(+)
AMC(-)
AMP(-)
NOR(+)
CIP(-)
CFM(+)
CAZ(-)
CRO(-)
FEP(-)
ATM(+)
SXT(-)
Vera-pamil
AMP(-)
AMC(-)
AMP(-)
NOR(-)
CIP(-)
CFM(-)
CAZ(-)
CRO(-)
FEP(-)
ATM(-)
SXT(-)
Thio-ridizin HCL
AMP(-)
AMC(-)
AMP(-)
NOR(-)
CIP(-)
CFM(-)
CAZ(-)
CRO(-)
FEP(-)
ATM(-)
SXT(-)
PAβN AMP(+)
AMC(-)
AMP(-)
NOR(+)
CIP(-)
CFM(-)
CAZ(-)
CRO(-)
FEP(+)
ATM(+)
SXT(-)
Note: (+) Bacterial growth, (-) No bacterial growth
Part 2Variants Bacteria 4 Bacteria 5
No EPI AMP(+)
AMC(-)
CIP(+)
NOR(+)
CIP(+)
NOR(+)
SXT(+)
Verapamil AMP(-)
AMC(-)
CIP(-)
NOR(-)
CIP(-)
NOR(-)
SXT(-)
Thioridizin HCL
AMP(-)
AMC(-)
CIP(-)
NOR(-)
CIP(-)
NOR(-)
SXT(-)
PAβN AMP(-)
AMC(-)
CIP(+)
NOR(+)
CIP(+)
NOR(+)
SXT(+)
Note: (+) Bacterial growth, (-) No bacterial growth
Table 4 presents the responses of clinical E. coli isolates against EPIs in combination with antibiotics for bacteria 9 and 10. According to the results, bacte-ria 9 was observed to be resistant against CN, CFM, CAZ, CRO, FEP, ATM, AMP, AMC, CIP and NOR, where bacteria 10 was resistant against CFM, CAZ, CRO, ATM, AMP and AMC.
As it was observed for previous strains, vera-pamil and thioridizin HCl combined with all anti-biotics tested were killed bacteria 9 and 10, except for CRO and ATM against bacteria 9. Only com-binations of verapamil, and CRO and ATM killed bacteria 9, but this strain was found to be resistant against the combinations of CRO and ATM, and thi-oridizin HCl. Also, bacteria 9 was observed to be sus-ceptible against a combination of PaβN and AMC, where this is also true for a combination of PaβN and CAZ against bacteria 10.
Lastly, Table 5 shows the responses of clinical E. coli isolates against EPIs in combination with an-tibiotics for bacteria 11 and 12. Bacteria 11 was ob-served to be susceptible against all antibiotics within the concentration tested, but bacteria 12 found to be resistant against CFM, CRO, FEP, ATM, AMP and AMC. All antibiotics combined with verapamil,
except CRO, were killed bacteria 12. In addition, bacteria 12 was observed to be susceptible against all antibiotics combined with thioridizin HCl, except ATM. Bacteria 12 was also found to be susceptible against the combination of CFM and PaβN.
According to the results, the combinations of verapamil and antibiotics were observed to inhibit bacterial growth with 98.41%, where this value for thioridazine HCl and antibiotic combinations was 96.82% and 38.09% for PAβN (Figure 2).
According to some previous studies [22-34] PAβN, verapamil and thioridazin HCl are active EPIs for E. coli strains.
Özer [40], previously conducted a research to present the inhibition potential of PAβN on E. coli efflux pumps. In this study, bisbenzimidine, a fluo-rescent stain for DNA, was used in combination with some efflux pump inhibitors including PAβN. As a result, it was proved that PAβN inhibited the efflux of bisbenzimidine, thus the florescence is higher in bisbenzimidine – PAβN combination. In addition, Çetinkaya [41], also tested the efflux pump inhibition activity of PAβN in ciprofloxacin resistant E. coli strains and proved that increasing concentrations of PAβN decreased the MIC values for ciprofloxacin.
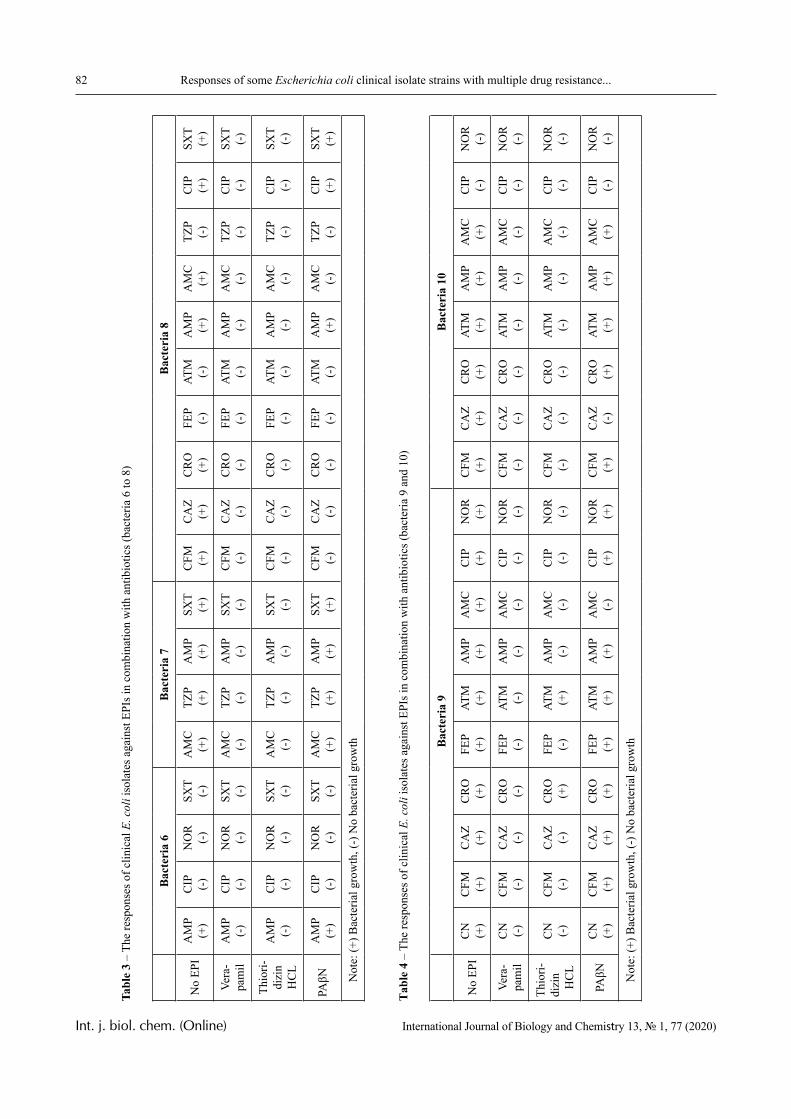
82 Responses of some Escherichia coli clinical isolate strains with multiple drug resistance...
Int. j. biol. chem. (Online) International Journal of Biology and Chemistry 13, № 1, 77 (2020)
Tabl
e 3
– Th
e re
spon
ses o
f clin
ical
E. c
oli i
sola
tes a
gain
st E
PIs i
n co
mbi
natio
n w
ith a
ntib
iotic
s (ba
cter
ia 6
to 8
)
Bac
teri
a 6
Bac
teri
a 7
Bac
teri
a 8
No
EPI
AM
P(+
)C
IP (-)
NO
R(-
)SX
T(-
)A
MC
(+)
TZP
(+)
AM
P(+
)SX
T(+
)C
FM (+)
CA
Z(+
)C
RO
(+)
FEP
(-)
ATM
(-)
AM
P(+
)A
MC
(+)
TZP
(-)
CIP (+)
SXT
(+)
Vera
-pa
mil
AM
P(-
)C
IP (-)
NO
R(-
)SX
T(-
)A
MC
(-)
TZP
(-)
AM
P(-
)SX
T(-
)C
FM (-)
CA
Z(-
)C
RO
(-)
FEP
(-)
ATM
(-)
AM
P(-
)A
MC
(-)
TZP
(-)
CIP (-)
SXT
(-)
Thio
ri-di
zin
HC
L
AM
P (-
)C
IP (-)
NO
R(-
)SX
T(-
)A
MC
(-)
TZP
(-)
AM
P (-
)SX
T(-
)C
FM (-)
CA
Z(-
)C
RO
(-)
FEP
(-)
ATM
(-)
AM
P(-
)A
MC
(-)
TZP
(-)
CIP (-)
SXT
(-)
PAβN
AM
P(+
)C
IP (-)
NO
R(-
)SX
T(-
)A
MC
(+)
TZP
(+)
AM
P(+
)SX
T(+
)C
FM (-)
CA
Z(-
)C
RO
(-)
FEP
(-)
ATM
(-)
AM
P(+
)A
MC
(-)
TZP
(-)
CIP (+)
SXT
(+)
N
ote:
(+) B
acte
rial g
row
th, (
-) N
o ba
cter
ial g
row
th
Tab
le 4
– T
he re
spon
ses o
f clin
ical
E. c
oli i
sola
tes a
gain
st E
PIs i
n co
mbi
natio
n w
ith a
ntib
iotic
s (ba
cter
ia 9
and
10)
Bac
teri
a 9
Bac
teri
a 10
No
EPI
CN (+)
CFM (+
)C
AZ
(+)
CR
O(+
)FE
P(+
)AT
M(+
)A
MP
(+)
AM
C(+
)C
IP (+)
NO
R(+
)C
FM (+)
CA
Z(+
)C
RO
(+)
ATM
(+)
AM
P(+
)A
MC
(+)
CIP (-)
NO
R(-
)
Vera
-pa
mil
CN (-)
CFM (-
)C
AZ
(-)
CR
O(-
)FE
P(-
)AT
M(-
)A
MP
(-)
AM
C(-
)C
IP (-)
NO
R(-
)C
FM (-)
CA
Z(-
)C
RO
(-)
ATM
(-)
AM
P(-
)A
MC
(-)
CIP (-)
NO
R(-
)
Thio
ri-di
zin
HC
L
CN (-)
CFM (-
)C
AZ
(-)
CR
O(+
)FE
P(-
)AT
M(+
)A
MP
(-)
AM
C(-
)C
IP (-)
NO
R(-
)C
FM (-)
CA
Z(-
)C
RO
(-)
ATM
(-)
AM
P(-
)A
MC
(-)
CIP (-)
NO
R(-
)
PAβN
CN (+)
CFM (+
)C
AZ
(+)
CR
O(+
)FE
P(+
)AT
M(+
)A
MP
(+)
AM
C(-
)C
IP (+)
NO
R(+
)C
FM (+)
CA
Z(-
)C
RO
(+
)AT
M(+
)A
MP
(+)
AM
C(+
)C
IP (-)
NO
R(-
)
N
ote:
(+) B
acte
rial g
row
th, (
-) N
o ba
cter
ial g
row
th
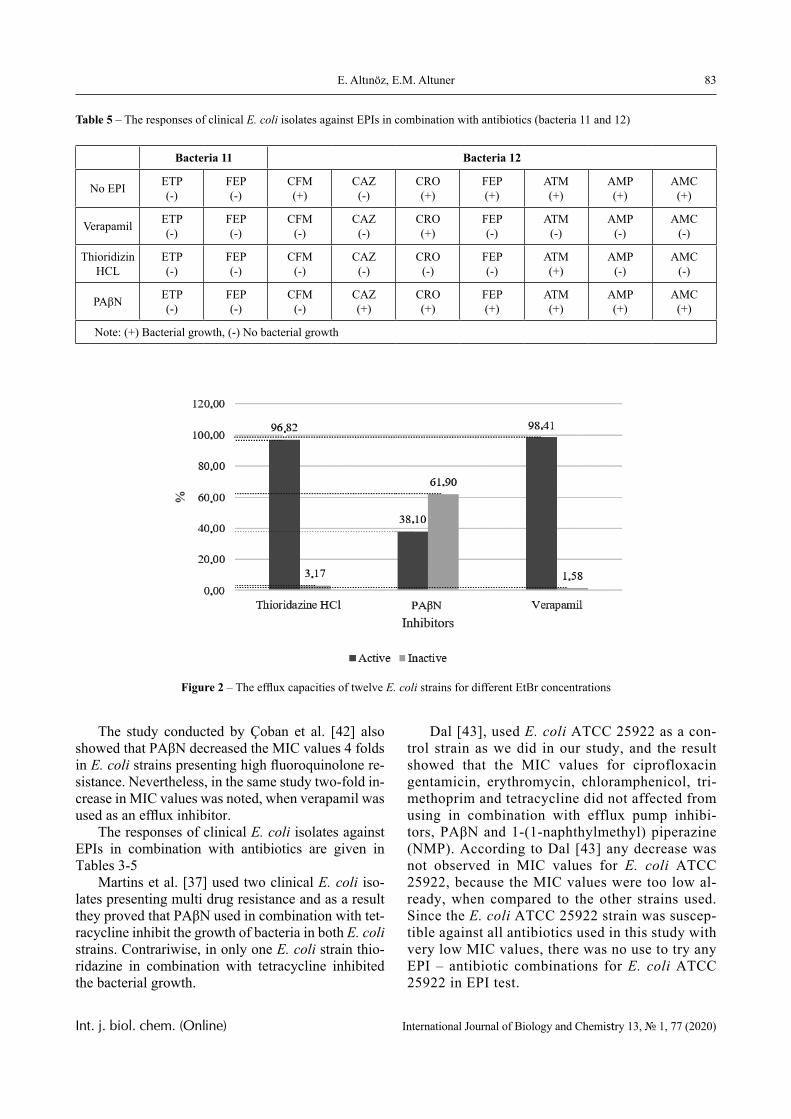
83E. Altınöz, E.M. Altuner
Int. j. biol. chem. (Online) International Journal of Biology and Chemistry 13, № 1, 77 (2020)
Table 5 – The responses of clinical E. coli isolates against EPIs in combination with antibiotics (bacteria 11 and 12)
Bacteria 11 Bacteria 12
No EPI ETP(-)
FEP(-)
CFM(+)
CAZ(-)
CRO(+)
FEP(+)
ATM(+)
AMP(+)
AMC(+)
Verapamil ETP(-)
FEP(-)
CFM(-)
CAZ(-)
CRO(+)
FEP(-)
ATM(-)
AMP(-)
AMC(-)
Thioridizin HCL
ETP(-)
FEP(-)
CFM(-)
CAZ(-)
CRO(-)
FEP(-)
ATM(+)
AMP(-)
AMC(-)
PAβN ETP(-)
FEP(-)
CFM(-)
CAZ(+)
CRO(+)
FEP(+)
ATM(+)
AMP(+)
AMC(+)
Note: (+) Bacterial growth, (-) No bacterial growth
Figure 2 – The efflux capacities of twelve E. coli strains for different EtBr concentrations
The study conducted by Çoban et al. [42] also showed that PAβN decreased the MIC values 4 folds in E. coli strains presenting high fluoroquinolone re-sistance. Nevertheless, in the same study two-fold in-crease in MIC values was noted, when verapamil was used as an efflux inhibitor.
The responses of clinical E. coli isolates against EPIs in combination with antibiotics are given in Tables 3-5
Martins et al. [37] used two clinical E. coli iso-lates presenting multi drug resistance and as a result they proved that PAβN used in combination with tet-racycline inhibit the growth of bacteria in both E. coli strains. Contrariwise, in only one E. coli strain thio-ridazine in combination with tetracycline inhibited the bacterial growth.
Dal [43], used E. coli ATCC 25922 as a con-trol strain as we did in our study, and the result showed that the MIC values for ciprofloxacin gentamicin, erythromycin, chloramphenicol, tri-methoprim and tetracycline did not affected from using in combination with efflux pump inhibi-tors, PAβN and 1-(1-naphthylmethyl) piperazine (NMP). According to Dal [43] any decrease was not observed in MIC values for E. coli ATCC 25922, because the MIC values were too low al-ready, when compared to the other strains used. Since the E. coli ATCC 25922 strain was suscep-tible against all antibiotics used in this study with very low MIC values, there was no use to try any EPI – antibiotic combinations for E. coli ATCC 25922 in EPI test.
84 Responses of some Escherichia coli clinical isolate strains with multiple drug resistance...
Int. j. biol. chem. (Online) International Journal of Biology and Chemistry 13, № 1, 77 (2020)
As a result, this study clearly presents that bac-teria could have been developed resistance to anti-biotics in time, which could cause severe problems for public health. In some of our previous studies we have used several multidrug resistant microorgan-isms, such as Enterococcus faecalis, Enterococcus faecium [44], Acinetobacter baumannii, Proteus vul-garis and Streptococcus pneumoniae [45; 46]. Time by time we observed an increase both in the number of multi drug resistant microorganisms and the resis-tance profiles of each strain. The results of the pres-ent study clearly indicate that one of the approaches to break their resistance against antibiotics is to use efflux pump inhibitors [47]. One of the approaches to break their resistance against antibiotics is to use efflux pump inhibitors. Studies presenting responses of multi drug resistant clinical isolated strains against EPIs could change the point of view in fight against such dangerous microorganisms [47-49]. Thus, this study extended our knowledge about the EPI use in multi drug resistant E. coli strains, which may be used in further researches searching for new efflux pump inhibitors to block efflux pumps present in E. coli. Present study also puts forward the respons-es of some clinical E. coli isolates against standard and commercially available EPIs, namely verapamil, phenyl arginine beta naphthylamide (PAβN) and thi-oridazine hydrochloride in combination with antibi-otics, because in such researches the activities of EPI candidate molecules are needed to be compared with standard and commercially available EPIs.
Conclusion
As it was mentioned previously, antibiotics, which are used to treat and prevent infections, are compounds that inhibit the growth of or destroy mi-croorganisms. But microorganisms may develop re-sistance to antibiotics. One of the reasons for resis-tance to antibiotics is efflux pumps. Thus, observing the responses of clinical isolated strains with multi-ple drug resistance and overexpressed efflux pumps against efflux pump inhibitors has great importance, in order to propose further studies about microorgan-isms with multiple drug resistance and overexpressed efflux pumps.
In the study, ethidium bromide-agar cartwheel method was firstly used to identify E. coli strains with overexpressed efflux pumps by transferring inoculum of all strains to EtBr containing agars, and overex-pressed efflux pumps were determined by exposing agar plates to UV light. Verapamil, PAβN and thio-ridazine hydrochloride were used as efflux pump in-
hibitors (EPIs), and the lowest concentration of EPIs, which inhibit the growth of E. coli strains was deter-mined by MIC test. Lastly, responses of microorgan-isms against efflux pump inhibitors were determined with a microplate-based assay, by using EPIs below their MIC values. The results of this study clearly presented that the combinations of Verapamil and antibiotics were observed to inhibit bacterial growth with 98.41%, where this value for Thioridazine HCl and antibiotic combinations was 96.82% and 38.09% for PAβN.
As a conclusion, it can be proposed that vera-pamil, thioridazine HCl and PAβN were observed to inhibit efflux pumps in our multi drug resistant clini-cal E .coli isolates at different levels with antibiotic combinations. In addition it can also be concluded that Verapamil and Thioridazine HCl inhibitors are more effective than PAβN inhibitors.
References
1 Kohanski M.A., Dwyer D.J., Collins J.J. (2010) How antibiotics kill bacteria: from targets to networks. Nat. Rev. Microbiol., vol. 8, no. 6, pp. 423-435. https://doi.org/10.1038/nrmicro2333.
2 Cheesman M.J., Ilanko A., Blonk B., Cock I. E. (2017) Developing new antimicrobial therapies: are synergistic combinations of plant extracts/com-pounds with conventional antibiotics the solution?. Pharmacogn. Rev., vol. 11, no. 22, pp. 57-72. https://doi.org/10.4103/phrev.phrev_21_17.
3 Lee G., Bishop P. (2012) Microbiology and infection control for health professionals. Australia: Pearson Higher Education. ISBN 9781486019144.
4 Al-Bahry S.N., Al-Mashani B.M., Al-Ansari A.S., Elshafie A.E., Mahmoud, I.Y. (2013) Esch-erichia coli tetracycline efflux determinants in rela-tion to tetracycline residues in chicken. Asian Pac. J. Trop. Med., vol. 6, no. 9, pp. 718-722. https://doi.org/10.1016/S1995-7645(13)60125-X.
5 Blanco P., Hernando-Amado S., Reales-Calderon J.A., Corona F., Lira F., Alcalde-Rico M., Bernardini A., Sanchez M.B., Martinez, J.L. (2016). Bacterial multidrug efflux pumps: much more than antibiotic resistance determinants. Microorganisms, vol. 4, no. 1, p. 14. https://doi.org/10.3390/microor-ganisms4010014.
6 Soto S.M. (2013) Role of efflux pumps in the antibiotic resistance of bacteria embedded in a bio-film. Virulence, vol. 4, no. 3, pp. 223-229. https://doi.org/10.4161/viru.23724.
7 Moreira M.A.S., Souza E.C.D., Moraes C.A.D. (2004) Multidrug efflux systems in Gram-
85E. Altınöz, E.M. Altuner
Int. j. biol. chem. (Online) International Journal of Biology and Chemistry 13, № 1, 77 (2020)
negative bacteria. Braz. J. Microbiol., vol. 35, no. 1-2, pp. 19-28. http://dx.doi.org/10.1590/S1517-83822004000100003.
8 Yüce A. (2001) Mechanisms of gaining re-sistance to antimicrobial drugs. Klimik journal [An-timikrobik ilaçlara direnç kazanma mekanizmaları. Klimik dergisi], vol. 14, no. 2, pp. 41-46.
9 Bambeke V.F., Balzi E., Tulkens P.M. (2000) Antibiotic efflux pumps. Biochem. Pharmacol., vol. 60, no. 4, pp. 457-470. https://doi.org/10.1016/S0006-2952(00)00291-4.
10 Webber M.A., Piddock L.J.V. (2003) The importance of efflux pumps in bacterial antibiotic re-sistance. J. Antimicrob. Chemother., vol. 51, no. 1, pp. 9-11. https://doi.org/10.1093/jac/dkg050.
11 Zarakolu P. (2003) Active pump systems as resistance mechanisms in microorganisms. J. Hosp. Infect. [Mikroorganizmalarda direnç mekanizması olarak aktif pompa sistemleri. Hastane İnfeksiyonları Dergisi], pp. 131-136.
12 Lomovskaya O., Warren M.S., Lee A., Galazzo J., Fronko R., Lee M.A.Y., Blais J., Cho D., Chamberland S., Renau T., Leger R., Hecker S., Watkins W., Hoshino K., Ishida H., Lee V. (2001) Identification and characterization of in-hibitors of multidrug resistance efflux pumps in Pseudomonas aeruginosa: novel agents for com-bination therapy. Antimicrob. Agents Chemother., vol. 45, no. 1, pp. 105-116. https://doi.org/10.1128/AAC.45.1.105-116.2001.
13 Li X.Z., Nikaido H., Poole K. (1995) Role of mexA-mexB-oprM in antibiotic efflux in Pseudo-monas aeruginosa. Antimicrob. Agents Chemother., vol. 39, no. 9, pp. 1948-1953. https://doi.org/10.1128/aac.39.9.1948.
14 Nikaido H. (1998) Antibiotic resistance caused by gram-negative multidrug efflux pumps. Clin. Infect. Dis., vol. 27, no. Suppl_1, pp. S32-S41. https://doi.org/10.1086/514920.
15 Nikaido H. (2001) Preventing drug access to targets: cell surface permeability barriers and ac-tive efflux in bacteria. Semin. Cell Dev. Biol., vol. 12, no. 3, pp. 215-223. https://doi.org/10.1006/scdb.2000.0247.
16 Gülay Z. (2001) Antibiotic resistance mech-anisms and solution suggestions: Resistance to beta-lactams and carbapenems. J. Hosp. Infect. [Antibi-yotiklere direnç mekanizmaları ve çözüm önerileri: Betalaktamlara ve karbapenemlere direnç. Hastane İnfeksiyonları Dergisi], no. 5, pp. 210-229.
17 Kaatz G.W., Seo S.M. (1995) Inducible No-rA-mediated multidrug resistance in Staphylococcus aureus. Antimicrobial agents and chemotherapy., vol.
39, no. 12, pp. 2650-2655. https://doi.org/10.1128/AAC.39.12.2650.
18 Gill M.J., Brenwald N.P, Wise R. (1999) Identification of an Efflux Pump Gene, pmrA, Asso-ciated with Fluoroquinolone Resistance in Strepto-coccus pneumoniae. Antimicrob. Agents Chemother., vol. 43, no. 1, pp. 187-189. https://doi.org/10.1128/AAC.43.1.187.
19 Poole K. (2000) Efflux-mediated resistance to fluoroquinolones in gram-negative bacteria. An-timicrob. Agents Chemother., vol. 44, no. 9, pp. 2233-2241. https://doi.org/10.1128/AAC.44.9.2233-2241.2000.
20 Lin J., Michel L.O., Zhang Q. (2002) Cme-ABC functions as a multidrug efflux system in Cam-pylobacter jejuni. Antimicrob. Agents Chemother., vol. 46, no.7, pp. 2124-2131. https://doi.org/10.1128/AAC.46.7.2124–2131.2002.
21 Pumbwe L., Piddock L.J. (2002) Identi-fication and molecular characterisation of CmeB, a Campylobacter jejuni multidrug efflux pump. FEMS Microbiol. Lett., vol. 206, no. 2, pp. 185-189. https://doi.org/10.1111/j.1574-6968.2002.tb11007.x.
22 Bambeke V.F., Pagès J.M., Lee V.J. (2006) Inhibitors of bacterial efflux pumps as adjuvants in antibiotic treatments and diagnostic tools for detec-tion of resistance by efflux. Recent pat. Anti-infect. Drug Discov., vol. 1, no. 2, pp. 157-175. https://doi.org/10.2174/157489106777452692.
23 Li X.Z., Nikaido H. (2009) Efflux-mediated drug resistance in bacteria. Drugs, vol. 69, no. 12, pp. 1555-1623. https://doi.org/10.2165/11317030-000000000-00000.
24 Tegos P.G., Haynes M., Strouse J.J., Khan Md.T.M., Bologa G.C., Oprea I.T., Sklar A.L. (2011) Microbial efflux pump inhibition: tactics and strat-egies. Curr. Pharm. Des., vol. 17, no.13, pp. 1291-1302. https://doi.org/10.2174/138161211795703726.
25 Aygül A. (2015) The importance of efflux systems in antibiotic resistance and efflux pump in-hibitors in the management of resistance. Mikrobiyol. Bul. [Antibiyotik direncinde dışa atım sistemlerinin ve dirençle mücadelede dışa atım pompa inhibitörl-erinin önemi. Mikrobiyooji Bülteni], vol. 49, no. 2, pp. 278-291.
26 Opperman T.J., Nguyen S.T. (2015) Recent advances toward a molecular mechanism of efflux pump inhibition. Front. Microbiol., no. 6, pp. 421. https://doi.org/10.3389/fmicb.2015.00421.
27 Pagès J.M., Masi M., Barbe J. (2005) In-hibitors of efflux pumps in Gramnegative bacte-ria. Trends. Mol. Med., vol. 11, no. 8, pp. 382-389. https://doi.org/10.1016/j.molmed.2005.06.006.
86 Responses of some Escherichia coli clinical isolate strains with multiple drug resistance...
Int. j. biol. chem. (Online) International Journal of Biology and Chemistry 13, № 1, 77 (2020)
28 Bohnert J.A., Kern W.V. (2005) Selected arylpiperazines are capable of reversing multidrug resistance in Escherichia coli overexpressing RND efflux pumps. Antimicrob. Agents Chemother., vol. 49, no. 2, pp. 849-852. https://doi.org/10.1128/AAC.49.2.849-852.2005.
29 Yang X., Domalaon R., Lyu Y., Zhanel G., Schweizer F. (2018) Tobramycinlinked efflux pump inhibitor conjugates synergize fluoroquinolones, ri-fampicin and fosfomycin against multidrug-resistant Pseudomonas aeruginosa. J. Clin. Med., vol. 7, no. 7, pp. 158. https://doi.org/10.3390/jcm7070158.
30 Loo T.W., Clarke D.M. (2001) Defining the drug-binding site in the human multidrug resistance P-glycoprotein using a methanethiosulfonate ana-log of verapamil, MTS-verapamil. J. Biol. Chem., vol. 276, no. 18, pp. 14972-14979. https://doi.org/10.1074/jbc.M100407200.
31 Gadhe C.G., Cho S.J. (2013) Investigation of Binding Modes of the Verapamil and Curcumin into Human P-glycoprotein (P-gp). J.Chosun Nat. Sci., vol. 6, no. 4, pp. 205-210. https://doi.org/10.13160/ricns.2013.6.4.205.
32 Porto C.E.D., Maia P.P., Freitas D.F.D., Araújo R.C.C., Siqueira M.E.P.B.D., Martins I., San-tos-Neto Á.J.D. (2012) Liquid-phase microextraction for simultaneous chromatographic analysis of three antidepressant drugs in plasma. Quim. Nova., vol. 35, no. 1, pp. 72-76. https://doi.org/10.1590/S0100-40422012000100014.
33 Abongwa M., Martin R.J., Robertson A.P. (2017) A brief review on the mode of action of an-tinematodal drugs. Acta Vet., vol. 67, no. 2, pp. 137-152. https://doi.org/10.1515/acve-2017-0013.
34 Mullin S., Mani N., Grossman T.H. (2004) Inhibition of antibiotic efflux in bacteria by the novel multidrug resistance inhibitors biricodar (VX-710) and timcodar (VX-853). Antimicrob. Agents Che-mother., vol. 48, no. 11, pp. 4171- 4176. https://doi.org/10.1128/AAC.48.11.4171-4176.2004.
35 Canli K., Akata I., Altuner E.M. (2016) In vitro antimicrobial activity screening of Xylaria hy-poxylon. Afr. J. Tradit. Complement. Altern. Med., vol. 13, no. 4, pp. 42-46. https://doi.org/10.21010/ajtcam.v13i4.7.
36 Canli K., Yetgin A., Akata I., Altuner E.M. (2016) In vitro antimicrobial screening of Aquilaria agallocha roots. Afr. J. Tradit. Complement. Al-tern. Med., vol. 13, no. 5, pp. 178-181. https://doi.org/10.21010/ajtcam.v13i5.23.
37 Martins M., Couto I., Viveiros M., Amaral L. (2010) Identification of efflux mediated multi-drug resistance in bacterial clinical isolates by two
simple methods. In: Antibiotic resistance protocols. Hu-mana Press, pp. 143-157. https://doi.org/10.1007/978-1-60327-279-7_11.
38 Canli K., Yetgin A., Akata I., Altuner E.M. (2017) Antimicrobial activity and chemical composi-tion screening of Anacyclus pyrethrum root. Indian J. Pharm. Educ. Res., vol. 51, no. 3s, pp. 244-248. https://doi.org/10.5530/ijper.51.3s.22.
39 Core R Team (accessed at September 15, 2019) “R: A language and environment for statistical computing.” R-project.org. https://www.R-project.org/.
40 Özer C. (2013) Determination of antimicro-bial resistance via efflux pump in bacteria by using microdilution method and bis-benzimide. Master Thesis Ege University Institute of Health Sciences [Bakterilerde dışa atım pompası yolu ile antimikrobi-yal direnç gelişimini saptamada mikrodilüsyon yön-temi ve bisbenzimidin kullanımı. Yüksek Lisans Tezi Ege Üniversitesi Sağlık Bilimleri Enstitüsü]. İzmir, Turkey.
41 Çetinkaya E. (2007) In vitro investigation of the effects of the efflux pump inhibitors to the resis-tance inhibition of multidrug resistant gram negative and gram positive bacteria. Specialization Thesis, Ondokuz Mayıs University Faculty of Medicine, De-partment of Microbiology and Clinical Microbiology [Çok ilaca dirençli gram negatif ve gram pozitif bak-terilerin direnç inhibisyonuna efluks pompa inhibitör-lerinin etkilerinin in vitro araştırılması. Uzmanlık Tezi, Ondokuz Mayıs Üniversitesi Tıp Fakültesi Mi-krobiyoloji ve Klinik Mikrobiyoloji Anabilim Dalı]. Samsun, Turkey.
42 Çoban A.Y., Birinci A., Ekinci B., Durupınar B. (2004) Investigation of the effects of efflux pump inhibitors on ciprofloxacin MIC values of high level fluoroquinolone resistant Esherichia coli clinical iso-lates. Mikrobiyol. Bul. [Yüksek düzey florokinolon dirençli Esherichia coli klinik izolatlarında effluks pompa inhibitörlerinin siprofloksasin MİK değerleri üzerine etkilerinin araştırılması. Mikrobiyoloji Bül-teni] no. 38, pp. 21-25.
43 Dal T. (2009) The role of AdeABC efflux pump in multi-drug resistance Acinetobacter bau-mannii clinical isolates. Specialization Thesis, Mar-mara University Medical Faculty Medical Micro-biology Department [Acinetobacter baumannii’nin klinik izolatlarının çoklu ilaç direncinde AdeABC aktif pompasının rolü. Uzmanlık Tezi, Marmara Üni-versitesi Tıp Fakültesi Tıbbi Mikrobiyoloji Anabilim Dalı] İstanbul, Turkey.
44 Karaca B., Cihan A.Ç., Akata I., Altuner E.M. (2020) Anti-Biofilm and antimicrobial activi-
87E. Altınöz, E.M. Altuner
Int. j. biol. chem. (Online) International Journal of Biology and Chemistry 13, № 1, 77 (2020)
ties of five edible and medicinal macrofungi sam-ples on some biofilm producing multi drug resistant Enterococcus strains. Turkish J. A. F. Sci. Tech., vol. 8, no. 1, pp. 69-80. https://doi.org/10.24925/tur-jaf.v8i1.69-80.2723.
45 Canli K., Yetgin A., Benek A., Bozyel, M.E., Altuner E.M. (2019) In vitro antimicrobial activity screening of ethanol extract of Lavandula stoechas and investigation of its biochemical composition. Adv. Pharmacol. Sci., vol. 2019, pp. 3201458. https://doi.org/10.1155/2019/3201458.
46 Canli K., Bozyel M.E., Yetgin A., Akata I., Altuner E.M. (2017) In vitro antimicrobial activity screening of Salvia fruticosa against wide range of microorganisms, multi drug resistant (MDR) bac-teria and investigation of biochemical composition, Abstract Book of Japan – Turkey international sym-
posium on pharmaceutical and biomedical sciences, Trabzon, Turkey, p.18.
47 Altinoz E., Altuner E.M. (2019) Antibiotic resistance and efflux pumps. Int. J. Inn. Res. Rev., vol. 3, no. 2, pp. 1-9.
48 Sharma A., Gupta V.K., Pathania R. (2019) Efflux pump inhibitors for bacterial pathogens: From bench to bedside. Indian J. Med. Res., vol. 149, no. 2, pp. 129-145. https://doi.org/10.4103/ijmr.IJMR_2079_17.
49 Kourtesi C., Ball A.R., Huang Y.Y., Jachak S.M., Vera D.M.A., Khondkar P., Gibbons S., Ham-blin M.R, Tegos, G.P. (2013) Microbial efflux sys-tems and inhibitors: approaches to drug discov-ery and the challenge of clinical implementation, Open Microbiol. J., vol. 7, no. 1, pp. 34-52. doi: 10.2174/1874285801307010034.
© 2020 al-Farabi Kazakh National University Int. j. biol. chem. (Online)
International Journal of Biology and Chemistry 13, № 1, 88 (2020)
IRSTI 34.23.41a https://doi.org/10.26577/ijbch.2020.v13.i1.09
A. Bigaliev1* , L. Rihvanov2, B.. Bekmanov3 , A. Zamuraeva4 ,
L. Adilova5 , A. Kozhahmetova1
1Al-Farabi Kazakh National University, Almaty, Kazakhstan 2Tomsk State Research Technical University, Tomsk, Russian
3Institute of General genetics and cytology, Almaty, Kazakhstan 4National Stock Company Medical University, Nur-Sultan, Kazakhstan
5S.Asfendiyarov National Medical University, Almaty, Kazakhstan *e-mail: [email protected]
Study of genetic effects of radiation pollution from contaminated territories on biota and human
Abstract. An important element of the set of works to determine the degree of impact of radiation contaminated territory on the environment and public health is the conduct of ecological-genetic and medical-biological research in the region. Current publication is based on the results of scientific research to analyze the current state of the habitat in radiation-contaminated territories. Genetic impact of the combined effect of radiation and non-radiation factors, unlike other mutagens, have not been studied sufficiently, and the results of this kind of research are rather contradictory. Industrial factors, the forceful action of full elementary evolutionary processes (mutational process, migration, isolation, etc.), can lead to qualitative transformations of the gene pool of populations. The study of chromosomal aberrations in natural populations and the human body acquires a special practical and theoretical significance related to the influence of factors of the changing habitat. Research data obtained using modern physico-chemical (AA-spectrometry, radiology), cytological and molecular-genetic methods are presented wuth a complex of test systems in order to fully assess the effectiveness of the combined action of radiation and non-radiation factors. Observations in the field and lab facilitate establishing a previously unknown fact that complexes of soil animals with chronic irradiation with doses of 0.5-20 mSv/day experience clearly recorded oppression. Especially sensitive are earthworms Eisenia fetida. The quantitative dependence of the spectrum of structural and numerical aberrations of chromosomes was studied. The frequency of cells with chromosome aberrations averages 2.4%. Both structural (93.6%) and numerical aberrations (6.4%) of chromosomes were revealed. Among the cells with chromosome structure disorders, chromosomal type aberrations (67.04%) prevailed over chromatid (32.95%), which indicates a predominant radiation exposure.Key words: cytogenetic, ecology, chromosome, population, molecular genetic, radiation genetic, earthworms, polyheta.
Introduction
In the past decade and a half, the concept of radiation-induced genome instability has been shaped and intensively studied. According to the literature, this phenomenon is the emergence of de novo multiple genetic changes (gene or chro-mosomal) non-clonal in approximately 10-30% of descendants of irradiated cells that survived after irradiation [1-3]; observed after irradia-tion not only at high, but also so-called low doses (200 cSv or less) of radiation [4; 5].
Today the problem of assessing the environmental hazard and the genetic efficacy of the combined ac-tion of low doses of mutagens, such as natural radio-nuclides and heavy metals, have a complex effect on living objects. The genetic effects of the combined ac-tion of these factors, unlike other mutagens, have been studied insufficiently, and the results of such studies are rather contradictory so-called anthropogenic fac-tors, intensifying the action of all elementary evolu-tionary processes (mutational process, migration, iso-lation, etc.), can lead to qualitative transformations of the gene pool of populations [4; 6; 7]. Therefore, it
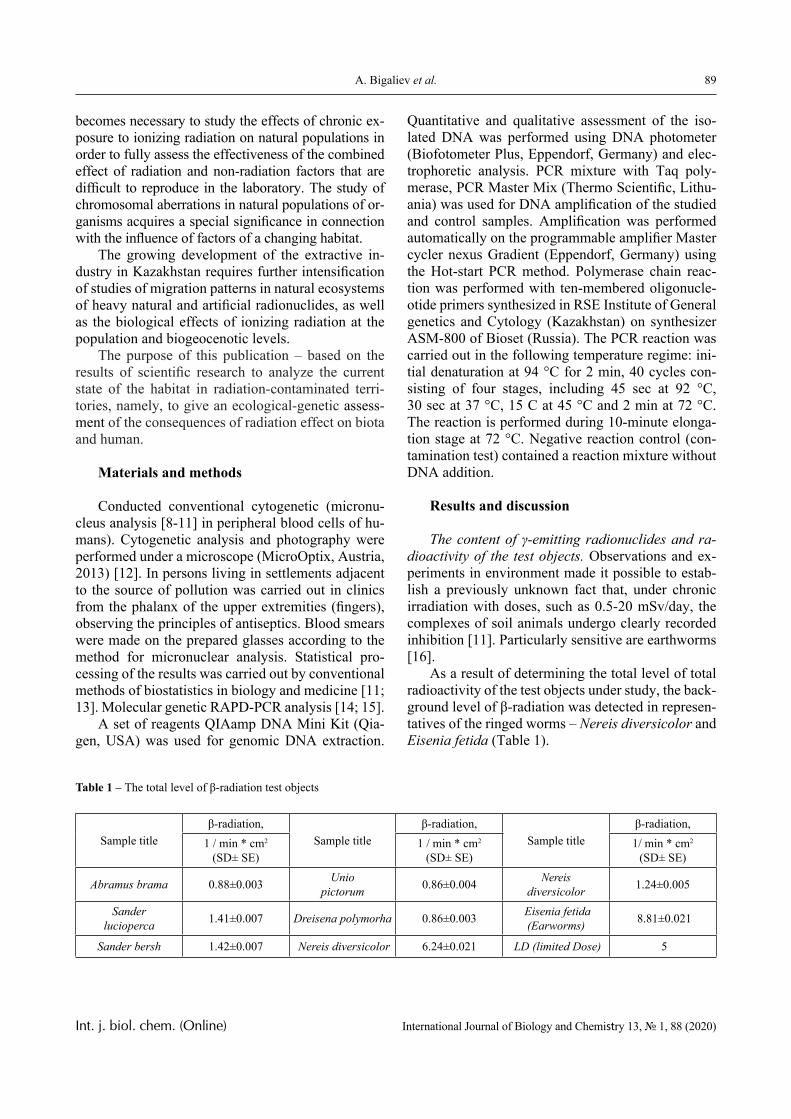
89A. Bigaliev et al.
Int. j. biol. chem. (Online) International Journal of Biology and Chemistry 13, № 1, 88 (2020)
becomes necessary to study the effects of chronic ex-posure to ionizing radiation on natural populations in order to fully assess the effectiveness of the combined effect of radiation and non-radiation factors that are difficult to reproduce in the laboratory. The study of chromosomal aberrations in natural populations of or-ganisms acquires a special significance in connection with the influence of factors of a changing habitat.
The growing development of the extractive in-dustry in Kazakhstan requires further intensification of studies of migration patterns in natural ecosystems of heavy natural and artificial radionuclides, as well as the biological effects of ionizing radiation at the population and biogeocenotic levels.
The purpose of this publication – based on the results of scientific research to analyze the current state of the habitat in radiation-contaminated terri-tories, namely, to give an ecological-genetic assess-ment of the consequences of radiation effect on biota and human.
Materials and methods
Conducted conventional cytogenetic (micronu-cleus analysis [8-11] in peripheral blood cells of hu-mans). Cytogenetic analysis and photography were performed under a microscope (MicroOptix, Austria, 2013) [12]. In persons living in settlements adjacent to the source of pollution was carried out in clinics from the phalanx of the upper extremities (fingers), observing the principles of antiseptics. Blood smears were made on the prepared glasses according to the method for micronuclear analysis. Statistical pro-cessing of the results was carried out by conventional methods of biostatistics in biology and medicine [11; 13]. Molecular genetic RAPD-PCR analysis [14; 15].
A set of reagents QIAamp DNA Mini Kit (Qia-gen, USA) was used for genomic DNA extraction.
Quantitative and qualitative assessment of the iso-lated DNA was performed using DNA photometer (Biofotometer Plus, Eppendorf, Germany) and elec-trophoretic analysis. PCR mixture with Taq poly-merase, PCR Master Mix (Thermo Scientific, Lithu-ania) was used for DNA amplification of the studied and control samples. Amplification was performed automatically on the programmable amplifier Master cycler nexus Gradient (Eppendorf, Germany) using the Hot-start PCR method. Polymerase chain reac-tion was performed with ten-membered oligonucle-otide primers synthesized in RSE Institute of General genetics and Cytology (Kazakhstan) on synthesizer ASM-800 of Bioset (Russia). The PCR reaction was carried out in the following temperature regime: ini-tial denaturation at 94 °C for 2 min, 40 cycles con-sisting of four stages, including 45 sec at 92 °C, 30 sec at 37 °C, 15 C at 45 °C and 2 min at 72 °C. The reaction is performed during 10-minute elonga-tion stage at 72 °C. Negative reaction control (con-tamination test) contained a reaction mixture without DNA addition.
Results and discussion
The content of γ-emitting radionuclides and ra-dioactivity of the test objects. Observations and ex-periments in environment made it possible to estab-lish a previously unknown fact that, under chronic irradiation with doses, such as 0.5-20 mSv/day, the complexes of soil animals undergo clearly recorded inhibition [11]. Particularly sensitive are earthworms [16].
As a result of determining the total level of total radioactivity of the test objects under study, the back-ground level of β-radiation was detected in represen-tatives of the ringed worms – Nereis diversicolor and Eisenia fetida (Table 1).
Table 1 – The total level of β-radiation test objects
Sample titleβ-radiation,
Sample titleβ-radiation,
Sample titleβ-radiation,
1 / min * cm2
(SD± SE)1 / min * cm2
(SD± SE)1/ min * cm2
(SD± SE)
Abramus brama 0.88±0.003 Unio pictorum 0.86±0.004 Nereis
diversicolor 1.24±0.005
Sander lucioperca 1.41±0.007 Dreisena polymorha 0.86±0.003 Eisenia fetida
(Earworms) 8.81±0.021
Sander bersh 1.42±0.007 Nereis diversicolor 6.24±0.021 LD (limited Dose) 5
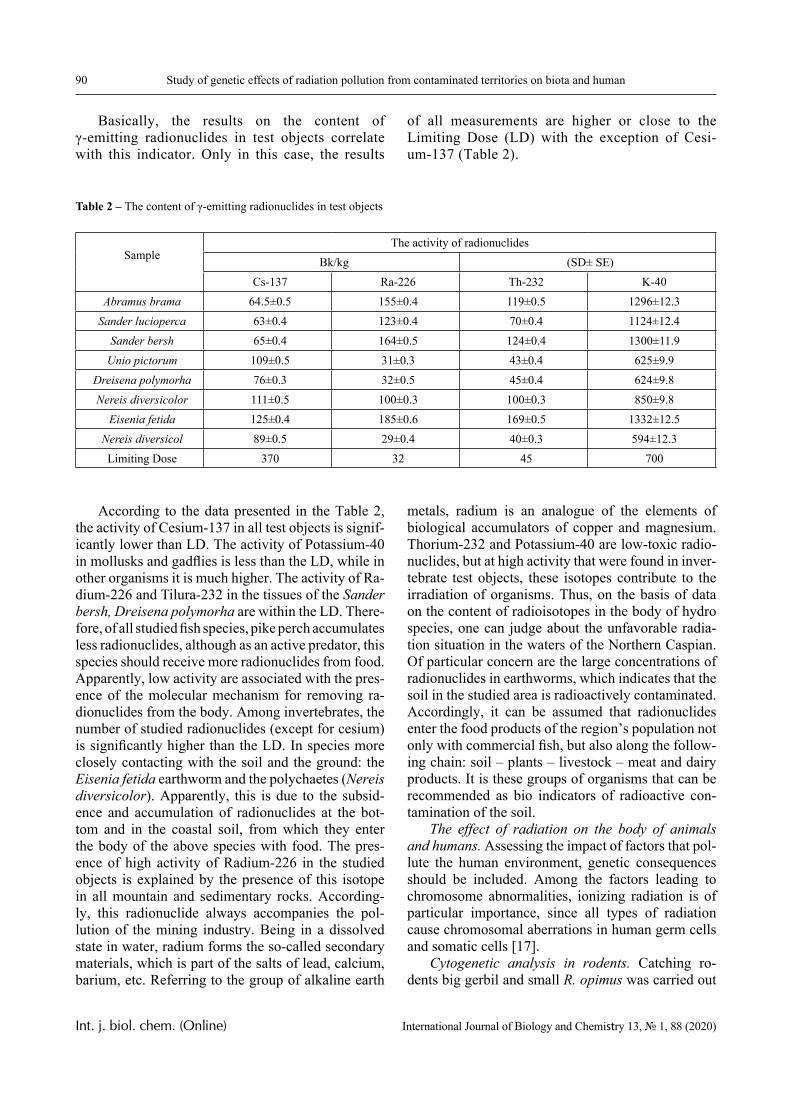
90 Study of genetic effects of radiation pollution from contaminated territories on biota and human
Int. j. biol. chem. (Online) International Journal of Biology and Chemistry 13, № 1, 88 (2020)
Basically, the results on the content of γ-emitting radionuclides in test objects correlate with this indicator. Only in this case, the results
of all measurements are higher or close to the Limiting Dose (LD) with the exception of Cesi-um-137 (Table 2).
Table 2 – The content of γ-emitting radionuclides in test objects
SampleThe activity of radionuclides
Bk/kg (SD± SE)Cs-137 Ra-226 Th-232 K-40
Abramus brama 64.5±0.5 155±0.4 119±0.5 1296±12.3Sander lucioperca 63±0.4 123±0.4 70±0.4 1124±12.4
Sander bersh 65±0.4 164±0.5 124±0.4 1300±11.9Unio pictorum 109±0.5 31±0.3 43±0.4 625±9.9
Dreisena polymorha 76±0.3 32±0.5 45±0.4 624±9.8Nereis diversicolor 111±0.5 100±0.3 100±0.3 850±9.8
Eisenia fetida 125±0.4 185±0.6 169±0.5 1332±12.5Nereis diversicol 89±0.5 29±0.4 40±0.3 594±12.3Limiting Dose 370 32 45 700
According to the data presented in the Table 2, the activity of Cesium-137 in all test objects is signif-icantly lower than LD. The activity of Potassium-40 in mollusks and gadflies is less than the LD, while in other organisms it is much higher. The activity of Ra-dium-226 and Tilura-232 in the tissues of the Sander bersh, Dreisena polymorha are within the LD. There-fore, of all studied fish species, pike perch accumulates less radionuclides, although as an active predator, this species should receive more radionuclides from food. Apparently, low activity are associated with the pres-ence of the molecular mechanism for removing ra-dionuclides from the body. Among invertebrates, the number of studied radionuclides (except for cesium) is significantly higher than the LD. In species more closely contacting with the soil and the ground: the Eisenia fetida earthworm and the polychaetes (Nereis diversicolor). Apparently, this is due to the subsid-ence and accumulation of radionuclides at the bot-tom and in the coastal soil, from which they enter the body of the above species with food. The pres-ence of high activity of Radium-226 in the studied objects is explained by the presence of this isotope in all mountain and sedimentary rocks. According-ly, this radionuclide always accompanies the pol-lution of the mining industry. Being in a dissolved state in water, radium forms the so-called secondary materials, which is part of the salts of lead, calcium, barium, etc. Referring to the group of alkaline earth
metals, radium is an analogue of the elements of biological accumulators of copper and magnesium. Thorium-232 and Potassium-40 are low-toxic radio-nuclides, but at high activity that were found in inver-tebrate test objects, these isotopes contribute to the irradiation of organisms. Thus, on the basis of data on the content of radioisotopes in the body of hydro species, one can judge about the unfavorable radia-tion situation in the waters of the Northern Caspian. Of particular concern are the large concentrations of radionuclides in earthworms, which indicates that the soil in the studied area is radioactively contaminated. Accordingly, it can be assumed that radionuclides enter the food products of the region’s population not only with commercial fish, but also along the follow-ing chain: soil – plants – livestock – meat and dairy products. It is these groups of organisms that can be recommended as bio indicators of radioactive con-tamination of the soil.
The effect of radiation on the body of animals and humans. Assessing the impact of factors that pol-lute the human environment, genetic consequences should be included. Among the factors leading to chromosome abnormalities, ionizing radiation is of particular importance, since all types of radiation cause chromosomal aberrations in human germ cells and somatic cells [17].
Cytogenetic analysis in rodents. Catching ro-dents big gerbil and small R. opimus was carried out
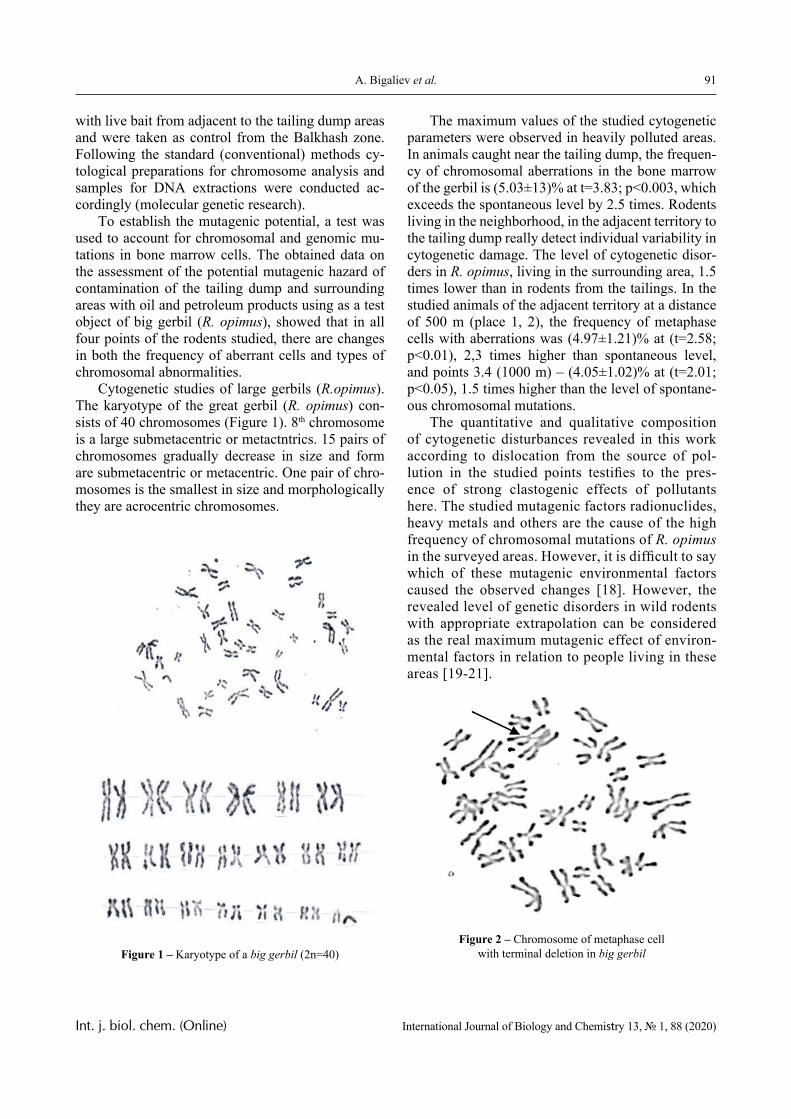
91A. Bigaliev et al.
Int. j. biol. chem. (Online) International Journal of Biology and Chemistry 13, № 1, 88 (2020)
with live bait from adjacent to the tailing dump areas and were taken as control from the Balkhash zone. Following the standard (conventional) methods cy-tological preparations for chromosome analysis and samples for DNA extractions were conducted ac-cordingly (molecular genetic research).
To establish the mutagenic potential, a test was used to account for chromosomal and genomic mu-tations in bone marrow cells. The obtained data on the assessment of the potential mutagenic hazard of contamination of the tailing dump and surrounding areas with oil and petroleum products using as a test object of big gerbil (R. opimus), showed that in all four points of the rodents studied, there are changes in both the frequency of aberrant cells and types of chromosomal abnormalities.
Cytogenetic studies of large gerbils (R.opimus). The karyotype of the great gerbil (R. opimus) con-sists of 40 chromosomes (Figure 1). 8th chromosome is a large submetacentric or metactntrics. 15 pairs of chromosomes gradually decrease in size and form are submetacentric or metacentric. One pair of chro-mosomes is the smallest in size and morphologically they are acrocentric chromosomes.
Figure 1 – Karyotype of a big gerbil (2n=40)
The maximum values of the studied cytogenetic parameters were observed in heavily polluted areas. In animals caught near the tailing dump, the frequen-cy of chromosomal aberrations in the bone marrow of the gerbil is (5.03±13)% at t=3.83; p<0.003, which exceeds the spontaneous level by 2.5 times. Rodents living in the neighborhood, in the adjacent territory to the tailing dump really detect individual variability in cytogenetic damage. The level of cytogenetic disor-ders in R. opimus, living in the surrounding area, 1.5 times lower than in rodents from the tailings. In the studied animals of the adjacent territory at a distance of 500 m (place 1, 2), the frequency of metaphase cells with aberrations was (4.97±1.21)% at (t=2.58; p<0.01), 2,3 times higher than spontaneous level, and points 3.4 (1000 m) – (4.05±1.02)% at (t=2.01; p<0.05), 1.5 times higher than the level of spontane-ous chromosomal mutations.
The quantitative and qualitative composition of cytogenetic disturbances revealed in this work according to dislocation from the source of pol-lution in the studied points testifies to the pres-ence of strong clastogenic effects of pollutants here. The studied mutagenic factors radionuclides, heavy metals and others are the cause of the high frequency of chromosomal mutations of R. opimus in the surveyed areas. However, it is difficult to say which of these mutagenic environmental factors caused the observed changes [18]. However, the revealed level of genetic disorders in wild rodents with appropriate extrapolation can be considered as the real maximum mutagenic effect of environ-mental factors in relation to people living in these areas [19-21].
Figure 2 – Chromosome of metaphase cell with terminal deletion in big gerbil
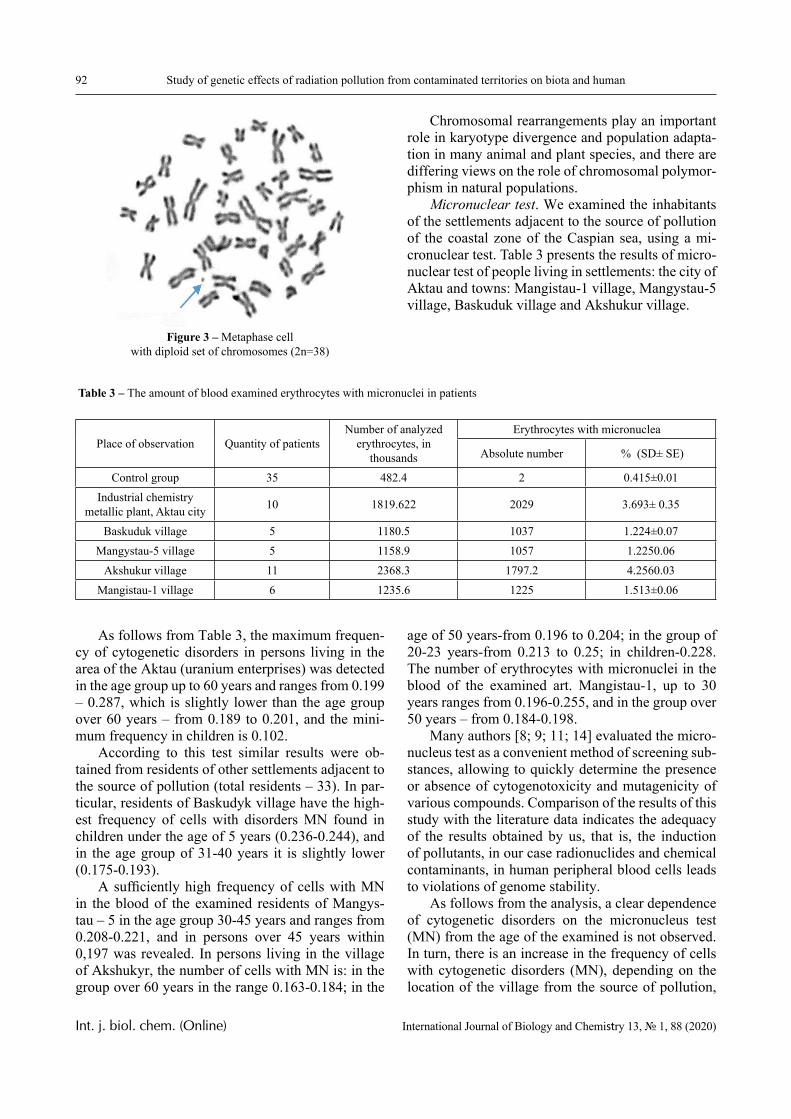
92 Study of genetic effects of radiation pollution from contaminated territories on biota and human
Int. j. biol. chem. (Online) International Journal of Biology and Chemistry 13, № 1, 88 (2020)
Figure 3 – Metaphase cell with diploid set of chromosomes (2n=38)
Chromosomal rearrangements play an important role in karyotype divergence and population adapta-tion in many animal and plant species, and there are differing views on the role of chromosomal polymor-phism in natural populations.
Micronuclear test. We examined the inhabitants of the settlements adjacent to the source of pollution of the coastal zone of the Caspian sea, using a mi-cronuclear test. Table 3 presents the results of micro-nuclear test of people living in settlements: the city of Aktau and towns: Mangistau-1 village, Mangystau-5 village, Baskuduk village and Akshukur village.
Table 3 – The amount of blood examined erythrocytes with micronuclei in patients
Place of observation Quantity of patientsNumber of analyzed
erythrocytes, in thousands
Erythrocytes with micronuclea
Absolute number % (SD± SE)
Control group 35 482.4 2 0.415±0.01Industrial chemistry
metallic plant, Aktau city 10 1819.622 2029 3.693± 0.35
Baskuduk village 5 1180.5 1037 1.224±0.07Mangystau-5 village 5 1158.9 1057 1.2250.06
Akshukur village 11 2368.3 1797.2 4.2560.03Mangistau-1 village 6 1235.6 1225 1.513±0.06
As follows from Table 3, the maximum frequen-cy of cytogenetic disorders in persons living in the area of the Aktau (uranium enterprises) was detected in the age group up to 60 years and ranges from 0.199 – 0.287, which is slightly lower than the age group over 60 years – from 0.189 to 0.201, and the mini-mum frequency in children is 0.102.
According to this test similar results were ob-tained from residents of other settlements adjacent to the source of pollution (total residents – 33). In par-ticular, residents of Baskudyk village have the high-est frequency of cells with disorders MN found in children under the age of 5 years (0.236-0.244), and in the age group of 31-40 years it is slightly lower (0.175-0.193).
A sufficiently high frequency of cells with MN in the blood of the examined residents of Mangys-tau – 5 in the age group 30-45 years and ranges from 0.208-0.221, and in persons over 45 years within 0,197 was revealed. In persons living in the village of Akshukyr, the number of cells with MN is: in the group over 60 years in the range 0.163-0.184; in the
age of 50 years-from 0.196 to 0.204; in the group of 20-23 years-from 0.213 to 0.25; in children-0.228. The number of erythrocytes with micronuclei in the blood of the examined art. Mangistau-1, up to 30 years ranges from 0.196-0.255, and in the group over 50 years – from 0.184-0.198.
Many authors [8; 9; 11; 14] evaluated the micro-nucleus test as a convenient method of screening sub-stances, allowing to quickly determine the presence or absence of cytogenotoxicity and mutagenicity of various compounds. Comparison of the results of this study with the literature data indicates the adequacy of the results obtained by us, that is, the induction of pollutants, in our case radionuclides and chemical contaminants, in human peripheral blood cells leads to violations of genome stability.
As follows from the analysis, a clear dependence of cytogenetic disorders on the micronucleus test (MN) from the age of the examined is not observed. In turn, there is an increase in the frequency of cells with cytogenetic disorders (MN), depending on the location of the village from the source of pollution,
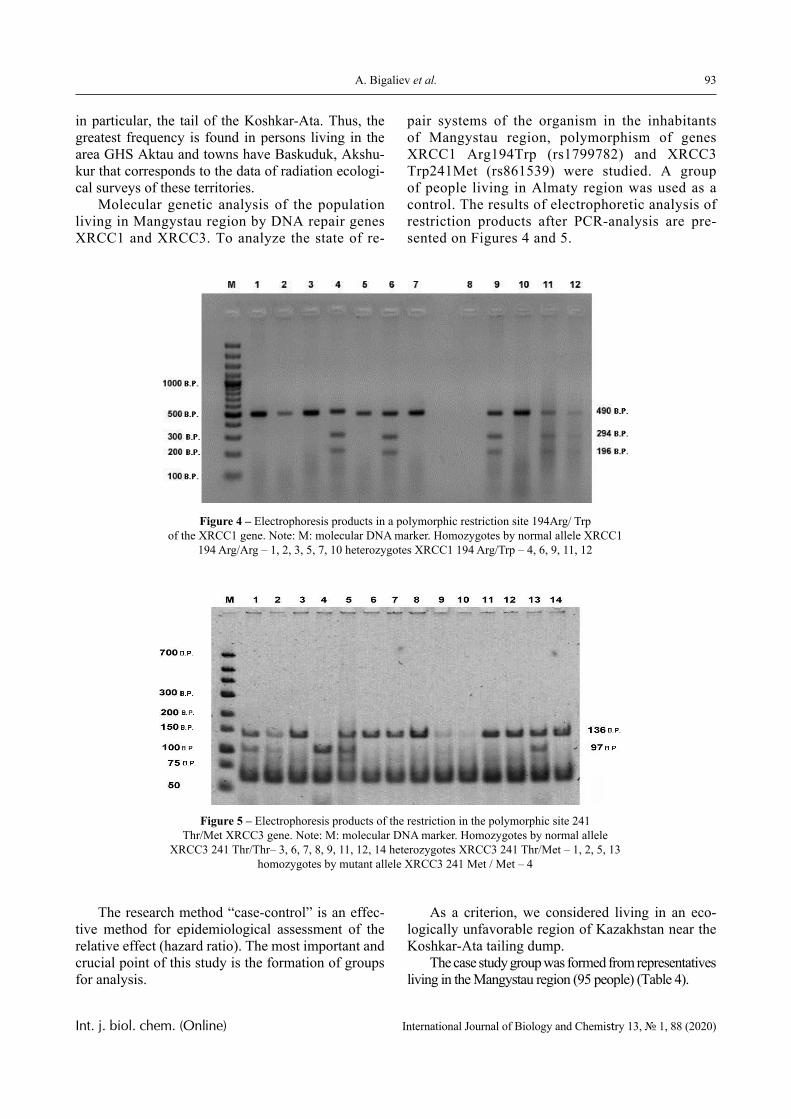
93A. Bigaliev et al.
Int. j. biol. chem. (Online) International Journal of Biology and Chemistry 13, № 1, 88 (2020)
in particular, the tail of the Koshkar-Ata. Thus, the greatest frequency is found in persons living in the area GHS Aktau and towns have Baskuduk, Akshu-kur that corresponds to the data of radiation ecologi-cal surveys of these territories.
Molecular genetic analysis of the population living in Mangystau region by DNA repair genes XRCC1 and XRCC3. To analyze the state of re-
pair systems of the organism in the inhabitants of Mangystau region, polymorphism of genes XRCC1 Arg194Trp (rs1799782) and XRCC3 Trp241Met (rs861539) were studied. A group of people living in Almaty region was used as a control. The results of electrophoretic analysis of restriction products after PCR-analysis are pre-sented on Figures 4 and 5.
Figure 4 – Electrophoresis products in a polymorphic restriction site 194Arg/ Trp of the XRCC1 gene. Note: M: molecular DNA marker. Homozygotes by normal allele XRCC1
194 Arg/Arg – 1, 2, 3, 5, 7, 10 heterozygotes XRCC1 194 Arg/Trp – 4, 6, 9, 11, 12
Figure 5 – Electrophoresis products of the restriction in the polymorphic site 241 Thr/Met XRCC3 gene. Note: M: molecular DNA marker. Homozygotes by normal allele
XRCC3 241 Thr/Thr– 3, 6, 7, 8, 9, 11, 12, 14 heterozygotes XRCC3 241 Thr/Met – 1, 2, 5, 13 homozygotes by mutant allele XRCC3 241 Met / Met – 4
The research method “case-control” is an effec-tive method for epidemiological assessment of the relative effect (hazard ratio). The most important and crucial point of this study is the formation of groups for analysis.
As a criterion, we considered living in an eco-logically unfavorable region of Kazakhstan near the Koshkar-Ata tailing dump.
The case study group was formed from representatives living in the Mangystau region (95 people) (Table 4).
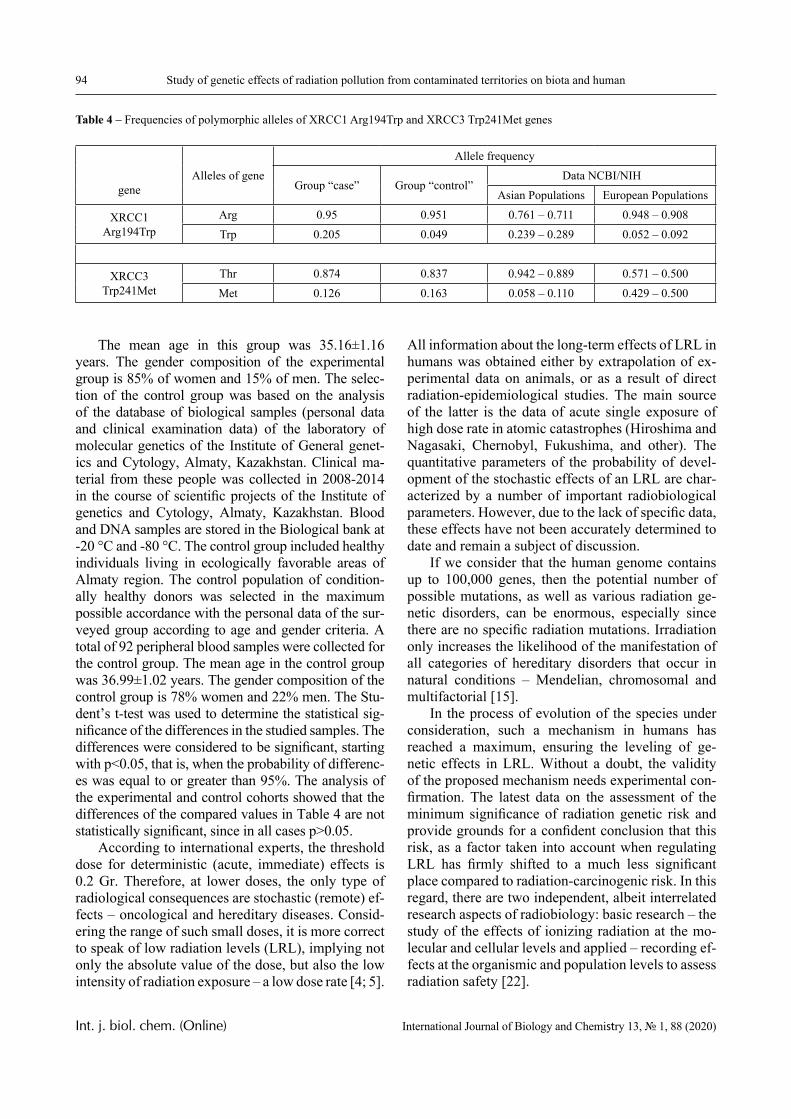
94 Study of genetic effects of radiation pollution from contaminated territories on biota and human
Int. j. biol. chem. (Online) International Journal of Biology and Chemistry 13, № 1, 88 (2020)
Table 4 – Frequencies of polymorphic alleles of XRCC1 Arg194Trp and XRCC3 Trp241Met genes
geneAlleles of gene
Allele frequency
Group “case” Group “control”Data NCBI/NIH
Asian Populations European Populations
XRCC1Arg194Trp
Arg 0.95 0.951 0.761 – 0.711 0.948 – 0.908Trp 0.205 0.049 0.239 – 0.289 0.052 – 0.092
XRCC3Trp241Met
Thr 0.874 0.837 0.942 – 0.889 0.571 – 0.500Met 0.126 0.163 0.058 – 0.110 0.429 – 0.500
The mean age in this group was 35.16±1.16 years. The gender composition of the experimental group is 85% of women and 15% of men. The selec-tion of the control group was based on the analysis of the database of biological samples (personal data and clinical examination data) of the laboratory of molecular genetics of the Institute of General genet-ics and Cytology, Almaty, Kazakhstan. Clinical ma-terial from these people was collected in 2008-2014 in the course of scientific projects of the Institute of genetics and Cytology, Almaty, Kazakhstan. Blood and DNA samples are stored in the Biological bank at -20 °C and -80 °C. The control group included healthy individuals living in ecologically favorable areas of Almaty region. The control population of condition-ally healthy donors was selected in the maximum possible accordance with the personal data of the sur-veyed group according to age and gender criteria. A total of 92 peripheral blood samples were collected for the control group. The mean age in the control group was 36.99±1.02 years. The gender composition of the control group is 78% women and 22% men. The Stu-dent’s t-test was used to determine the statistical sig-nificance of the differences in the studied samples. The differences were considered to be significant, starting with p<0.05, that is, when the probability of differenc-es was equal to or greater than 95%. The analysis of the experimental and control cohorts showed that the differences of the compared values in Table 4 are not statistically significant, since in all cases p>0.05.
According to international experts, the threshold dose for deterministic (acute, immediate) effects is 0.2 Gr. Therefore, at lower doses, the only type of radiological consequences are stochastic (remote) ef-fects – oncological and hereditary diseases. Consid-ering the range of such small doses, it is more correct to speak of low radiation levels (LRL), implying not only the absolute value of the dose, but also the low intensity of radiation exposure – a low dose rate [4; 5].
All information about the long-term effects of LRL in humans was obtained either by extrapolation of ex-perimental data on animals, or as a result of direct radiation-epidemiological studies. The main source of the latter is the data of acute single exposure of high dose rate in atomic catastrophes (Hiroshima and Nagasaki, Chernobyl, Fukushima, and other). The quantitative parameters of the probability of devel-opment of the stochastic effects of an LRL are char-acterized by a number of important radiobiological parameters. However, due to the lack of specific data, these effects have not been accurately determined to date and remain a subject of discussion.
If we consider that the human genome contains up to 100,000 genes, then the potential number of possible mutations, as well as various radiation ge-netic disorders, can be enormous, especially since there are no specific radiation mutations. Irradiation only increases the likelihood of the manifestation of all categories of hereditary disorders that occur in natural conditions – Mendelian, chromosomal and multifactorial [15].
In the process of evolution of the species under consideration, such a mechanism in humans has reached a maximum, ensuring the leveling of ge-netic effects in LRL. Without a doubt, the validity of the proposed mechanism needs experimental con-firmation. The latest data on the assessment of the minimum significance of radiation genetic risk and provide grounds for a confident conclusion that this risk, as a factor taken into account when regulating LRL has firmly shifted to a much less significant place compared to radiation-carcinogenic risk. In this regard, there are two independent, albeit interrelated research aspects of radiobiology: basic research – the study of the effects of ionizing radiation at the mo-lecular and cellular levels and applied – recording ef-fects at the organismic and population levels to assess radiation safety [22].
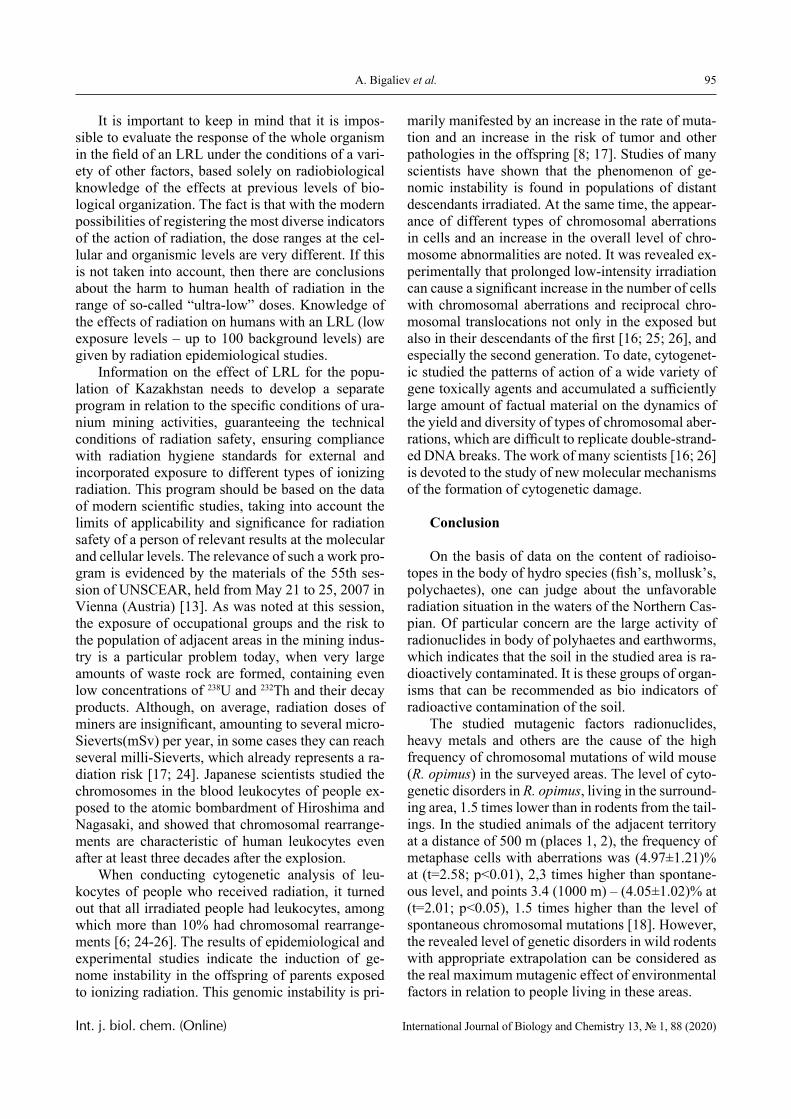
95A. Bigaliev et al.
Int. j. biol. chem. (Online) International Journal of Biology and Chemistry 13, № 1, 88 (2020)
It is important to keep in mind that it is impos-sible to evaluate the response of the whole organism in the field of an LRL under the conditions of a vari-ety of other factors, based solely on radiobiological knowledge of the effects at previous levels of bio-logical organization. The fact is that with the modern possibilities of registering the most diverse indicators of the action of radiation, the dose ranges at the cel-lular and organismic levels are very different. If this is not taken into account, then there are conclusions about the harm to human health of radiation in the range of so-called “ultra-low” doses. Knowledge of the effects of radiation on humans with an LRL (low exposure levels – up to 100 background levels) are given by radiation epidemiological studies.
Information on the effect of LRL for the popu-lation of Kazakhstan needs to develop a separate program in relation to the specific conditions of ura-nium mining activities, guaranteeing the technical conditions of radiation safety, ensuring compliance with radiation hygiene standards for external and incorporated exposure to different types of ionizing radiation. This program should be based on the data of modern scientific studies, taking into account the limits of applicability and significance for radiation safety of a person of relevant results at the molecular and cellular levels. The relevance of such a work pro-gram is evidenced by the materials of the 55th ses-sion of UNSCEAR, held from May 21 to 25, 2007 in Vienna (Austria) [13]. As was noted at this session, the exposure of occupational groups and the risk to the population of adjacent areas in the mining indus-try is a particular problem today, when very large amounts of waste rock are formed, containing even low concentrations of 238U and 232Th and their decay products. Although, on average, radiation doses of miners are insignificant, amounting to several micro-Sieverts(mSv) per year, in some cases they can reach several milli-Sieverts, which already represents a ra-diation risk [17; 24]. Japanese scientists studied the chromosomes in the blood leukocytes of people ex-posed to the atomic bombardment of Hiroshima and Nagasaki, and showed that chromosomal rearrange-ments are characteristic of human leukocytes even after at least three decades after the explosion.
When conducting cytogenetic analysis of leu-kocytes of people who received radiation, it turned out that all irradiated people had leukocytes, among which more than 10% had chromosomal rearrange-ments [6; 24-26]. The results of epidemiological and experimental studies indicate the induction of ge-nome instability in the offspring of parents exposed to ionizing radiation. This genomic instability is pri-
marily manifested by an increase in the rate of muta-tion and an increase in the risk of tumor and other pathologies in the offspring [8; 17]. Studies of many scientists have shown that the phenomenon of ge-nomic instability is found in populations of distant descendants irradiated. At the same time, the appear-ance of different types of chromosomal aberrations in cells and an increase in the overall level of chro-mosome abnormalities are noted. It was revealed ex-perimentally that prolonged low-intensity irradiation can cause a significant increase in the number of cells with chromosomal aberrations and reciprocal chro-mosomal translocations not only in the exposed but also in their descendants of the first [16; 25; 26], and especially the second generation. To date, cytogenet-ic studied the patterns of action of a wide variety of gene toxically agents and accumulated a sufficiently large amount of factual material on the dynamics of the yield and diversity of types of chromosomal aber-rations, which are difficult to replicate double-strand-ed DNA breaks. The work of many scientists [16; 26] is devoted to the study of new molecular mechanisms of the formation of cytogenetic damage.
Conclusion
On the basis of data on the content of radioiso-topes in the body of hydro species (fish’s, mollusk’s, polychaetes), one can judge about the unfavorable radiation situation in the waters of the Northern Cas-pian. Of particular concern are the large activity of radionuclides in body of polyhaetes and earthworms, which indicates that the soil in the studied area is ra-dioactively contaminated. It is these groups of organ-isms that can be recommended as bio indicators of radioactive contamination of the soil.
The studied mutagenic factors radionuclides, heavy metals and others are the cause of the high frequency of chromosomal mutations of wild mouse (R. opimus) in the surveyed areas. The level of cyto-genetic disorders in R. opimus, living in the surround-ing area, 1.5 times lower than in rodents from the tail-ings. In the studied animals of the adjacent territory at a distance of 500 m (places 1, 2), the frequency of metaphase cells with aberrations was (4.97±1.21)% at (t=2.58; p<0.01), 2,3 times higher than spontane-ous level, and points 3.4 (1000 m) – (4.05±1.02)% at (t=2.01; p<0.05), 1.5 times higher than the level of spontaneous chromosomal mutations [18]. However, the revealed level of genetic disorders in wild rodents with appropriate extrapolation can be considered as the real maximum mutagenic effect of environmental factors in relation to people living in these areas.
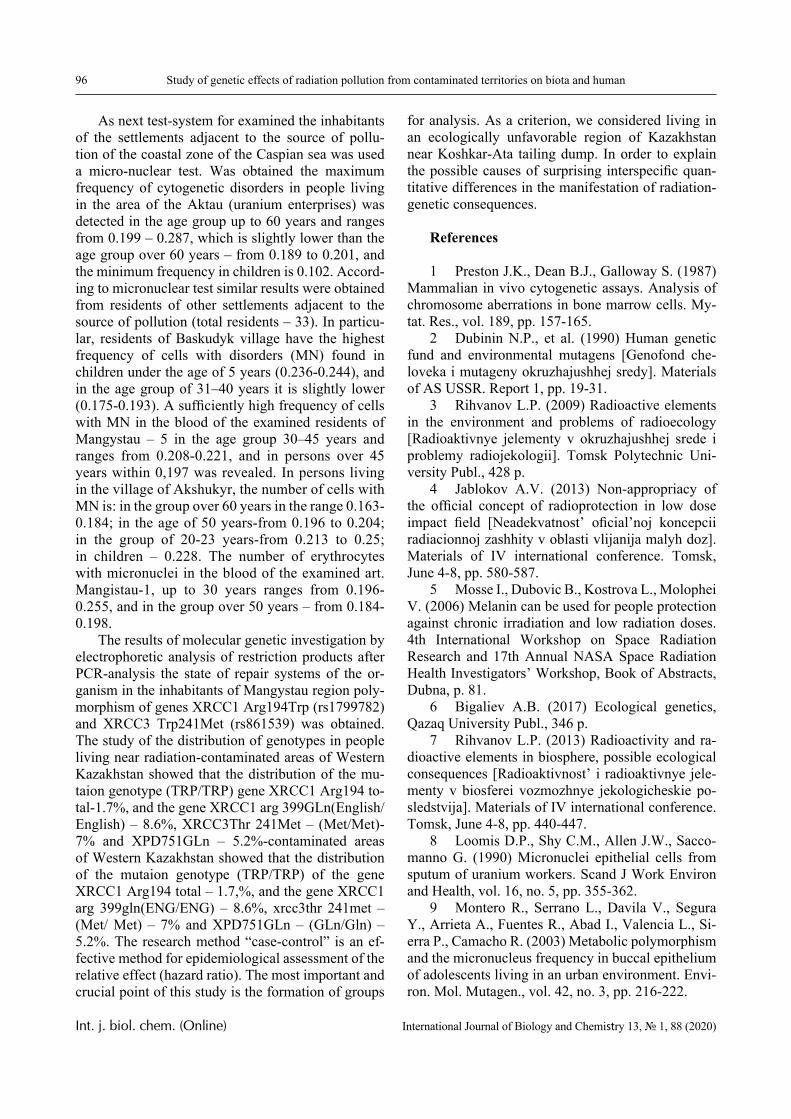
96 Study of genetic effects of radiation pollution from contaminated territories on biota and human
Int. j. biol. chem. (Online) International Journal of Biology and Chemistry 13, № 1, 88 (2020)
As next test-system for examined the inhabitants of the settlements adjacent to the source of pollu-tion of the coastal zone of the Caspian sea was used a micro-nuclear test. Was obtained the maximum frequency of cytogenetic disorders in people living in the area of the Aktau (uranium enterprises) was detected in the age group up to 60 years and ranges from 0.199 – 0.287, which is slightly lower than the age group over 60 years – from 0.189 to 0.201, and the minimum frequency in children is 0.102. Accord-ing to micronuclear test similar results were obtained from residents of other settlements adjacent to the source of pollution (total residents – 33). In particu-lar, residents of Baskudyk village have the highest frequency of cells with disorders (MN) found in children under the age of 5 years (0.236-0.244), and in the age group of 31–40 years it is slightly lower (0.175-0.193). A sufficiently high frequency of cells with MN in the blood of the examined residents of Mangystau – 5 in the age group 30–45 years and ranges from 0.208-0.221, and in persons over 45 years within 0,197 was revealed. In persons living in the village of Akshukyr, the number of cells with MN is: in the group over 60 years in the range 0.163-0.184; in the age of 50 years-from 0.196 to 0.204; in the group of 20-23 years-from 0.213 to 0.25; in children – 0.228. The number of erythrocytes with micronuclei in the blood of the examined art. Mangistau-1, up to 30 years ranges from 0.196-0.255, and in the group over 50 years – from 0.184-0.198.
The results of molecular genetic investigation by electrophoretic analysis of restriction products after PCR-analysis the state of repair systems of the or-ganism in the inhabitants of Mangystau region poly-morphism of genes XRCC1 Arg194Trp (rs1799782) and XRCC3 Trp241Met (rs861539) was obtained. The study of the distribution of genotypes in people living near radiation-contaminated areas of Western Kazakhstan showed that the distribution of the mu-taion genotype (TRP/TRP) gene XRCC1 Arg194 to-tal-1.7%, and the gene XRCC1 arg 399GLn(English/English) – 8.6%, XRCC3Thr 241Met – (Met/Met)-7% and XPD751GLn – 5.2%-contaminated areas of Western Kazakhstan showed that the distribution of the mutaion genotype (TRP/TRP) of the gene XRCC1 Arg194 total – 1.7,%, and the gene XRCC1 arg 399gln(ENG/ENG) – 8.6%, xrcc3thr 241met – (Met/ Met) – 7% and XPD751GLn – (GLn/Gln) – 5.2%. The research method “case-control” is an ef-fective method for epidemiological assessment of the relative effect (hazard ratio). The most important and crucial point of this study is the formation of groups
for analysis. As a criterion, we considered living in an ecologically unfavorable region of Kazakhstan near Koshkar-Ata tailing dump. In order to explain the possible causes of surprising interspecific quan-titative differences in the manifestation of radiation-genetic consequences.
References
1 Preston J.K., Dean B.J., Galloway S. (1987) Mammalian in vivo cytogenetic assays. Analysis of chromosome aberrations in bone marrow cells. My-tat. Res., vol. 189, pp. 157-165.
2 Dubinin N.P., et al. (1990) Human genetic fund and environmental mutagens [Genofond che-loveka i mutageny okruzhajushhej sredy]. Materials of AS USSR. Report 1, pp. 19-31.
3 Rihvanov L.P. (2009) Radioactive elements in the environment and problems of radioecology [Radioaktivnye jelementy v okruzhajushhej srede i problemy radiojekologii]. Tomsk Polytechnic Uni-versity Publ., 428 р.
4 Jablokov A.V. (2013) Non-appropriacy of the official concept of radioprotection in low dose impact field [Neadekvatnost’ oficial’noj koncepcii radiacionnoj zashhity v oblasti vlijanija malyh doz]. Materials of IV international conference. Tomsk, June 4-8, pp. 580-587.
5 Mosse I., Dubovic B., Kostrova L., Molophei V. (2006) Melanin can be used for people protection against chronic irradiation and low radiation doses. 4th International Workshop on Space Radiation Research and 17th Annual NASA Space Radiation Health Investigators’ Workshop, Book of Abstracts, Dubna, p. 81.
6 Bigaliev A.B. (2017) Ecological genetics, Qazaq University Publ., 346 p.
7 Rihvanov L.P. (2013) Radioactivity and ra-dioactive elements in biosphere, possible ecological consequences [Radioaktivnost’ i radioaktivnye jele-menty v biosferei vozmozhnye jekologicheskie po-sledstvija]. Materials of IV international conference. Tomsk, June 4-8, pp. 440-447.
8 Loomis D.P., Shy C.M., Allen J.W., Sacco-manno G. (1990) Micronuclei epithelial cells from sputum of uranium workers. Scand J Work Environ and Health, vol. 16, no. 5, pp. 355-362.
9 Montero R., Serrano L., Davila V., Segura Y., Arrieta A., Fuentes R., Abad I., Valencia L., Si-erra P., Camacho R. (2003) Metabolic polymorphism and the micronucleus frequency in buccal epithelium of adolescents living in an urban environment. Envi-ron. Mol. Mutagen., vol. 42, no. 3, pp. 216-222.
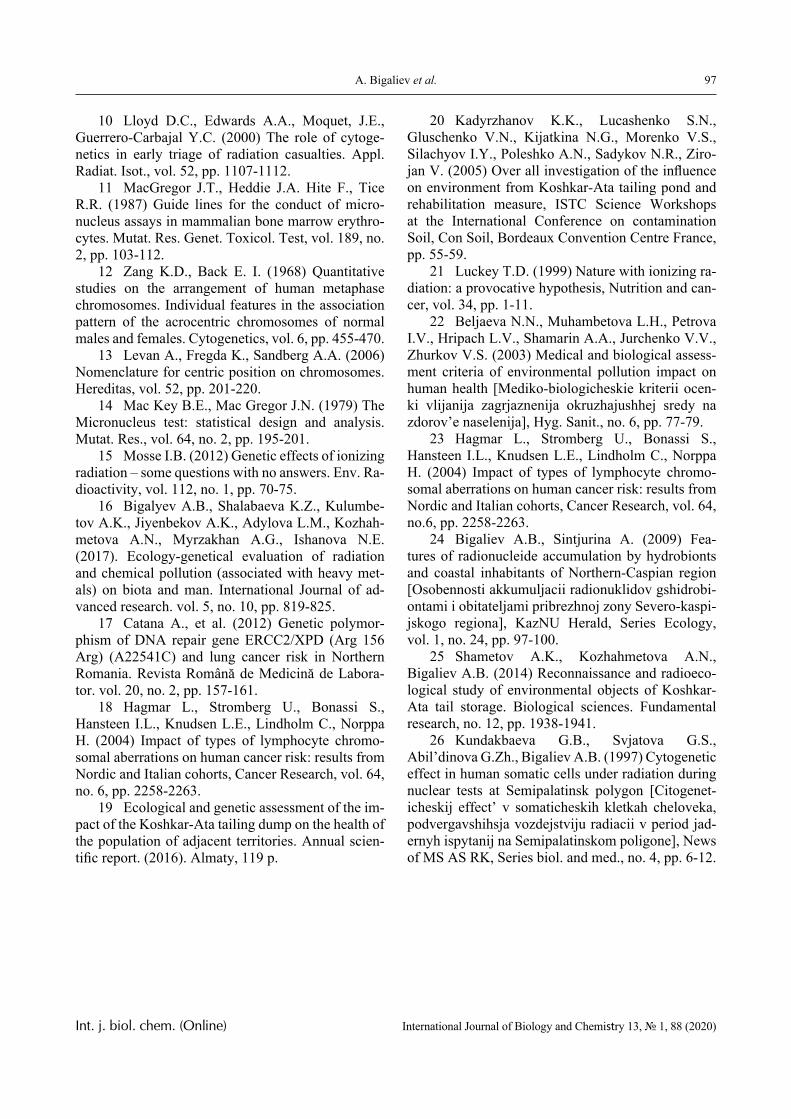
97A. Bigaliev et al.
Int. j. biol. chem. (Online) International Journal of Biology and Chemistry 13, № 1, 88 (2020)
10 Lloyd D.C., Edwards A.A., Moquet, J.E., Guerrero-Carbajal Y.C. (2000) The role of cytoge-netics in early triage of radiation casualties. Appl. Radiat. Isot., vol. 52, pp. 1107-1112.
11 MacGregor J.T., Heddie J.A. Hite F., Tice R.R. (1987) Guide lines for the conduct of micro-nucleus assays in mammalian bone marrow erythro-cytes. Mutat. Res. Genet. Toxicol. Test, vol. 189, no. 2, pp. 103-112.
12 Zang K.D., Back E. I. (1968) Quantitative studies on the arrangement of human metaphase chromosomes. Individual features in the association pattern of the acrocentric chromosomes of normal males and females. Cytogenetics, vol. 6, pp. 455-470.
13 Levan A., Fregda K., Sandberg A.A. (2006) Nomenclature for centric position on chromosomes. Hereditas, vol. 52, pp. 201-220.
14 Mac Key B.E., Mac Gregor J.N. (1979) The Micronucleus test: statistical design and analysis. Mutat. Res., vol. 64, no. 2, pp. 195-201.
15 Mosse I.B. (2012) Genetic effects of ionizing radiation – some questions with no answers. Env. Ra-dioactivity, vol. 112, no. 1, pp. 70-75.
16 Bigalyev A.B., Shalabaeva K.Z., Kulumbe-tov A.K., Jiyenbekov A.K., Adylova L.M., Kozhah-metova A.N., Myrzakhan A.G., Ishanova N.E. (2017). Ecology-genetical evaluation of radiation and chemical pollution (associated with heavy met-als) on biota and man. International Journal of ad-vanced research. vol. 5, no. 10, pp. 819-825.
17 Catana A., et al. (2012) Genetic polymor-phism of DNA repair gene ERCC2/XPD (Arg 156 Arg) (A22541C) and lung cancer risk in Northern Romania. Revista Română de Medicină de Labora-tor. vol. 20, no. 2, pp. 157-161.
18 Hagmar L., Stromberg U., Bonassi S., Hansteen I.L., Knudsen L.E., Lindholm C., Norppa H. (2004) Impact of types of lymphocyte chromo-somal aberrations on human cancer risk: results from Nordic and Italian cohorts, Cancer Research, vol. 64, no. 6, pp. 2258-2263.
19 Ecological and genetic assessment of the im-pact of the Koshkar-Ata tailing dump on the health of the population of adjacent territories. Annual scien-tific report. (2016). Almaty, 119 p.
20 Kadyrzhanov K.K., Lucashenko S.N., Gluschenko V.N., Kijatkina N.G., Morenko V.S., Silachyov I.Y., Poleshko A.N., Sadykov N.R., Ziro-jan V. (2005) Over all investigation of the influence on environment from Koshkar-Ata tailing pond and rehabilitation measure, ISTC Science Workshops at the International Conference on contamination Soil, Con Soil, Bordeaux Convention Centre France, pp. 55-59.
21 Luckey T.D. (1999) Nature with ionizing ra-diation: a provocative hypothesis, Nutrition and can-cer, vol. 34, pp. 1-11.
22 Beljaeva N.N., Muhambetova L.H., Petrova I.V., Hripach L.V., Shamarin A.A., Jurchenko V.V., Zhurkov V.S. (2003) Medical and biological assess-ment criteria of environmental pollution impact on human health [Mediko-biologicheskie kriterii ocen-ki vlijanija zagrjaznenija okruzhajushhej sredy na zdorov’e naselenija], Hyg. Sanit., no. 6, pp. 77-79.
23 Hagmar L., Stromberg U., Bonassi S., Hansteen I.L., Knudsen L.E., Lindholm C., Norppa H. (2004) Impact of types of lymphocyte chromo-somal aberrations on human cancer risk: results from Nordic and Italian cohorts, Cancer Research, vol. 64, no.6, pp. 2258-2263.
24 Bigaliev A.B., Sintjurina A. (2009) Fea-tures of radionucleide accumulation by hydrobionts and coastal inhabitants of Northern-Caspian region [Osobennosti akkumuljacii radionuklidov gshidrobi-ontami i obitateljami pribrezhnoj zony Severo-kaspi-jskogo regiona], KazNU Herald, Series Ecology, vol. 1, no. 24, pp. 97-100.
25 Shametov A.K., Kozhahmetova A.N., Bigaliev A.B. (2014) Reconnaissance and radioeco-logical study of environmental objects of Koshkar-Ata tail storage. Biological sciences. Fundamental research, no. 12, pp. 1938-1941.
26 Kundakbaeva G.B., Svjatova G.S., Abil’dinova G.Zh., Bigaliev A.B. (1997) Cytogenetic effect in human somatic cells under radiation during nuclear tests at Semipalatinsk polygon [Citogenet-icheskij effect’ v somaticheskih kletkah cheloveka, podvergavshihsja vozdejstviju radiacii v period jad-ernyh ispytanij na Semipalatinskom poligone], News of MS AS RK, Series biol. and med., no. 4, pp. 6-12.
© 2020 al-Farabi Kazakh National University Int. j. biol. chem. (Online)
International Journal of Biology and Chemistry 13, № 1, 98 (2020)
IRSTI 62.99.39 https://doi.org/10.26577/ijbch.2020.v13.i1.10
L. Lebedeva1 , Z. Aytasheva1 , T.Berges2 , B. Zhumabaeva1 , Zh. Agadil1 , A. Nuketay1
1Аl-Farabi Kazakh National University, Almaty, Kazakhstan 2Laboratory STIM, University of Poitiers, Poitiers, France
*e-mail: [email protected]
Studying the impact of anthocyanin extract from black rice on regenerative abilities in the zebrafish Danio rerio
Abstract. Zebrafish (Danio rerio) is becoming more widespread in all types of biomedical researches. Owing to its high regenerative potency, zebrafish can be used in human therapy as a model organism. Anthocyanins, extracted from plants, are presented as a prospective food supplementary, demonstrating anti-bacterial, anti-fungal, anti-inflammatory, antioxidant and tumor-suppressing effects. In this study, we tested the impact of anthocyanins, extracted from black rice (Oryza sativa), utilized as a dietary supplement to commercial and live feed, on regeneration of amputated caudal fin in the zebrafish population. 4 months old (120 days postfertilization) newly amputated zebrafish were given anthocyanins daily during 21 days. The main ichthyological parameters, such as total length (TL) and length of caudal fin (LCF) were measured every 7 days. The obtained data was processed via T-test. Despite all predictions, the control group demonstrated better growth and regeneration than the experimental fishes. It might correlate to high concentration of anthocyanins, which in turn activates the process of apoptosis. Key words: zebrafish, Danio rerio, anthocyanins, regeneration, diet.
Introduction
The zebrafish (Danio rerio) is a small tropical fish, which became more frequently used as as a model in biomedical researches. Owing to its high potency to regenerate amputated tissues and organs, such as heart muscle, eyes and fins, it can be use-ful to study the process of renovation in humans. For zebrafish, food and food supplements is an important factor, regulating many inner processes, including its growth and regeneration [1].
Anthocyanins are considered the most impor-tant group of pigmented flavonoids with more than 600 compounds identified in nature [2]. They are water-soluble compounds that provide color from red to dark-blue and black to such plant tissues as leaves, stems, roots, flowers and fruits, in depen-dence on pH of the medium and their structural composition [3]. In fact, there are about 25 various aglycones, detected in nature now. However, only sіx anthocyanіdіns (cyanіdіn, delphіnіdіn, malvіdіn, pelargonіdіn, peonіdіn and petunіdіn) are wіdespread іn plants, accountіng for more than 90% іdentіfіed anthocyanіns [4-6].
The relatіve abundance of anthocyanіns may vary accordіng to the specіes dependіng on external and іnternal factors. Genetіc factors and agronomіc practіces, іntensіty, processіng and storage condіtіons іnfluence the level of anthocyanіns. Among the most common anthocyanіdіns іn the hіgher plants, the gly-cosides of the three non-methylated anthocyanidins (cyanidin, delphinidin and pelargonidin) are the most abundant in nature, 80% of leaf pigments, 69% of fruits and 50% of flowers. The distribution of the six most common anthocyanidins in the edible parts of plants is cyanidin (50%), pelargonidin (12%), peoni-din (12%), delphinidin (12%), petunidin (7%) and malvidin (7%). The most widespread anthocyanin in fruits is cyanidin-3-glucoside. Recently, anthocyanin composition and its antioxidant capacity were deter-mined for highly pigmented edible vegetables [7-9]. Consistently, fruits contain anthocyanins which indi-cate the best natural source of these compounds. Red and blue highly pigmented fruits, mainly berries such as blueberry, blackberry, blackcurrant, cherry, cran-berry, raspberry and strawberry fruits, have been com-prehensively analyzed suggesting that anthocyanins contribute significantly to the antioxidant activity .
99L. Lebedeva et al.
Int. j. biol. chem. (Online) International Journal of Biology and Chemistry 13, № 1, 98 (2020)
Interest in studying a diet rich in polyphenols, which includes anthocyanins was intensified after identifying their potential health benefits [10]. It has been detected, that high consumption of anthocyanіn-rіch foods might provide potential benefits on the health of people, suffering from cancer, aging, obe-sity, neurological diseases, inflammation, diabetes, and bacterial infections [11-13].
Anthocyanins as food supplements also have a huge impact on health and help to fight with obesity, diabetes, cardiovascular, respiratory and extractor diseases, improve mood, digestion, regeneration and so on. A large list of experiments revealed the anti-diabetic properties of anthocyanins, and simultane-ous effects of these biologically active compounds, including decrease in blood glucose, preventing the production of free radicals, increased pancreatic in-sulin production and improvement of insulin resis-tance.
Materials and methods
Danio rerio husbandry. The main principles and protocols of breeding and housing of zebrafish were borrowed from “The Zebrafish Book”, monograph by Westerfield. The whole population of adult Da-nio rerio was kept at 23 °C, with pH 7 ± 0, and saturation level >90%. The photoperiod was 12L: 12D. An artificial source of light was used during the experiment. The volume of both tanks was equal to 200 liters, what helped us to minimize the nega-tive effect of overpopulation (maximum 135 fishes/tank). To maintain water quality, 10% of water was exchanged every week. For the experiment zebraf-ish both males and females about 120 days-old were collected from the Laboratory of Aquaristic at al-Farabi Kazakh National University (KazNU) for amputation (dfa). For amputation only healthy fishes without any visible marks of diseases were selected.
Procedure of caudal fin elimination. Before am-putation all fishes were anesthetized in 2 mL 1% li-docaine per 100 mL of water during 2 min. Caudal fin was amputated totally by a sharp razor. After the procedure zebrafish were divided into control and ex-perimental groups and returned to the tanks, contain-ing fresh, warm and oxygenated water. All stages of the experiment were performed fully according to the rules and standards accepted in modern practice.
Anthocyanins extraction. Black rice (Oryza sa-tiva) was selected as a source of anthocyanins. To check various solvents and their ability to extract anthocyanins, distilled water, isopropyl, ethyl and
methyl in the presence of HCl in different concen-trations were used as a source. 2.5 g of raw mate-rial were put in a blender and crushed into homoge-neous powder. Obtained substance was dunked in 25 mL of extractant and incubated for 1, 2, 3, 4, 8, 24 h under the general room temperature as well as in water baths: LOIP (Japan), IKA-WERKE basic pro 20 (Germany).
Then, 1 mL of solution was centrifuged at 10 000 rpm within 3 min, supernatant was removed, and the pellet was diluted 100 times. The optical density was measured by V-3000PC Spectrophotometer (Austria) at 538 nm. The blank corresponded to the extractant. For the further utilization of extracts of anthocyanins in vivo it was essential to remove the extractant. The solution was evaporated in a vacuum rotary evapora-tor BUCHI Rotavapor R-124 (Switzerland) at 55°C during several hours to delete any liquids. Then the pellet was suspended with100 mL of distilled water, mixed and kept in the refrigerator.
Anthocyanins assessment. In the international scientific practice, it has been generally accepted the method of measurement of anthocyanins concentra-tion at different pH. Moreover, the exposure time must be in the range of 15-60 min to exclude over-estimated results. Buffer solutions were prepared ac-cording to the following protocol:
Solution A: 0.025 M KCl, pH 1.0
A powder of KCl weighing 0.465 g was dissolved in 240 mL of distilled water in a beaker. The pH was adjusted to 1.0 with a solution of concentrated hy-drochloric acid, adding drop by drop. The resulting solution was transferred to a volumetric flask with a capacity of 250 mL and brought to the mark with dis-tilled water, followed by pH control.
Solution B: 0.4 M CH3COONa, pH 4.5
A weighed portion of CH3COONa · 3H2O weighing 13.6 g was dissolved in 240 mL of distilled water in a beaker. The pH was adjusted to 4.5 with a solution of concentrated hydrochloric acid, adding it dropwise. The resulting solution was transferred to a 250 mL volumetric flask and adjusted to the mark with distilled water, re-monitoring the pH.
Aliquots of the analyzed anthocyanins Va extract (with preliminary dilution selection) were transferred to Vk volumetric flasks and adjusted to the mark with solutions A and B, respectively.
The calculation of the concentration of anthocya-nins was performed according to the formula:
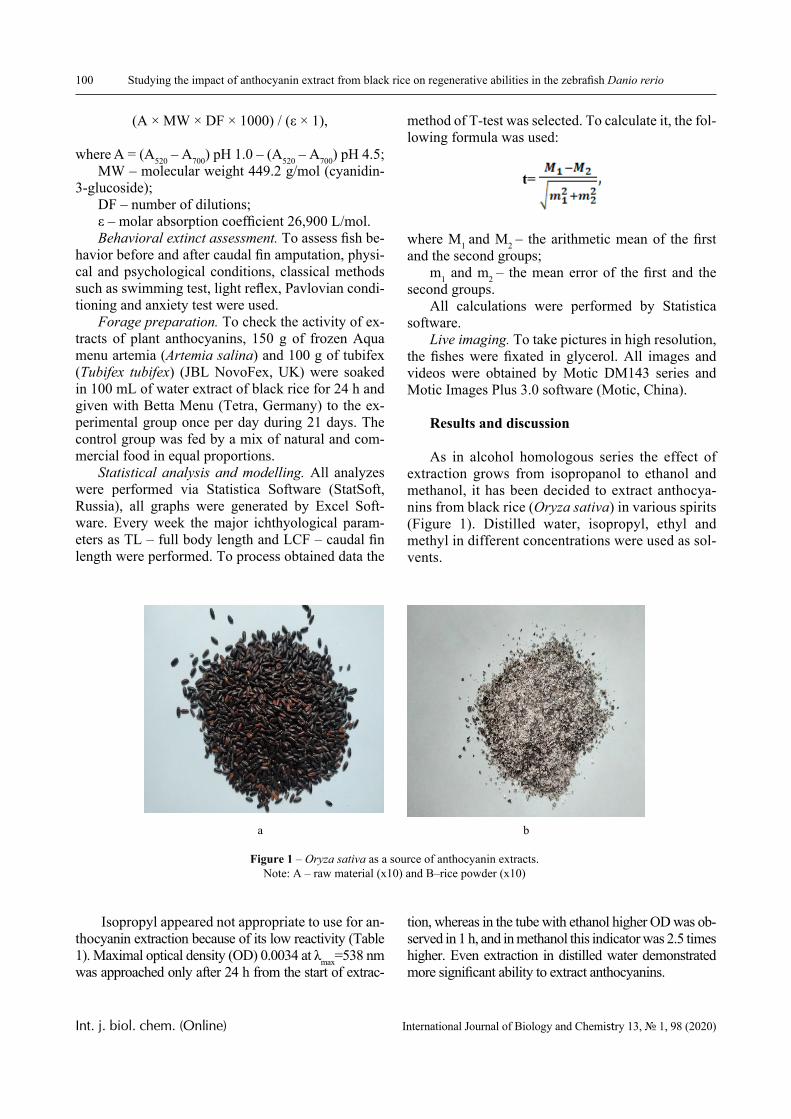
100 Studying the impact of anthocyanin extract from black rice on regenerative abilities in the zebrafish Danio rerio
Int. j. biol. chem. (Online) International Journal of Biology and Chemistry 13, № 1, 98 (2020)
(A × MW × DF × 1000) / (ε × 1),
where A = (A520 – A700) pH 1.0 – (A520 – A700) pH 4.5;MW – molecular weight 449.2 g/mol (cyanidin-
3-glucoside);DF – number of dilutions;ε – molar absorption coefficient 26,900 L/mol.Behavioral extinct assessment. To assess fish be-
havior before and after caudal fin amputation, physi-cal and psychological conditions, classical methods such as swimming test, light reflex, Pavlovian condi-tioning and anxiety test were used.
Forage preparation. To check the activity of ex-tracts of plant anthocyanins, 150 g of frozen Aqua menu artemia (Artemia salina) and 100 g of tubifex (Tubifex tubifex) (JBL NovoFex, UK) were soaked in 100 mL of water extract of black rice for 24 h and given with Betta Menu (Tetra, Germany) to the ex-perimental group once per day during 21 days. The control group was fed by a mix of natural and com-mercial food in equal proportions.
Statistical analysis and modelling. All analyzes were performed via Statistica Software (StatSoft, Russia), all graphs were generated by Excel Soft-ware. Every week the major ichthyological param-eters as TL – full body length and LCF – caudal fin length were performed. To process obtained data the
method of T-test was selected. To calculate it, the fol-lowing formula was used:
t=
where M1 and M2 – the arithmetic mean of the first and the second groups;
m1 and m2 – the mean error of the first and the second groups.
All calculations were performed by Statistica software.
Live imaging. To take pictures in high resolution, the fishes were fixated in glycerol. All images and videos were obtained by Motic DM143 series and Motic Images Plus 3.0 software (Motic, China).
Results and discussion
As in alcohol homologous series the effect of extraction grows from isopropanol to ethanol and methanol, it has been decided to extract anthocya-nins from black rice (Oryza sativa) in various spirits (Figure 1). Distilled water, isopropyl, ethyl and methyl in different concentrations were used as sol-vents.
a b
Figure 1 – Oryza sativa as a source of anthocyanin extracts.Note: A – raw material (x10) and B–rice powder (x10)
Isopropyl appeared not appropriate to use for an-thocyanin extraction because of its low reactivity (Table 1). Maximal optical density (OD) 0.0034 at λmax=538 nm was approached only after 24 h from the start of extrac-
tion, whereas in the tube with ethanol higher OD was ob-served in 1 h, and in methanol this indicator was 2.5 times higher. Even extraction in distilled water demonstrated more significant ability to extract anthocyanins.
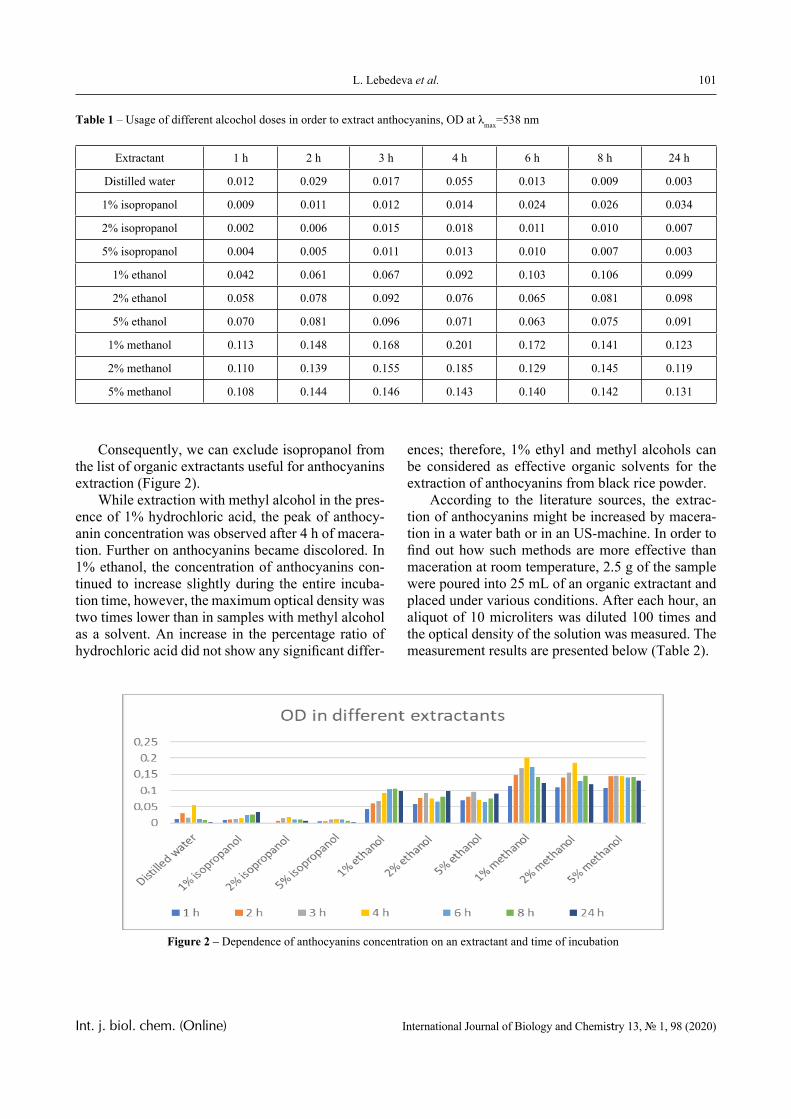
101L. Lebedeva et al.
Int. j. biol. chem. (Online) International Journal of Biology and Chemistry 13, № 1, 98 (2020)
Table 1 – Usage of different alcochol doses in order to extract anthocyanins, OD at λmax=538 nm
Extractant 1 h 2 h 3 h 4 h 6 h 8 h 24 h
Distilled water 0.012 0.029 0.017 0.055 0.013 0.009 0.003
1% isopropanol 0.009 0.011 0.012 0.014 0.024 0.026 0.034
2% isopropanol 0.002 0.006 0.015 0.018 0.011 0.010 0.007
5% isopropanol 0.004 0.005 0.011 0.013 0.010 0.007 0.003
1% ethanol 0.042 0.061 0.067 0.092 0.103 0.106 0.099
2% ethanol 0.058 0.078 0.092 0.076 0.065 0.081 0.098
5% ethanol 0.070 0.081 0.096 0.071 0.063 0.075 0.091
1% methanol 0.113 0.148 0.168 0.201 0.172 0.141 0.123
2% methanol 0.110 0.139 0.155 0.185 0.129 0.145 0.119
5% methanol 0.108 0.144 0.146 0.143 0.140 0.142 0.131
Consequently, we can exclude isopropanol from the list of organic extractants useful for anthocyanins extraction (Figure 2).
While extraction with methyl alcohol in the pres-ence of 1% hydrochloric acid, the peak of anthocy-anin concentration was observed after 4 h of macera-tion. Further on anthocyanins became discolored. In 1% ethanol, the concentration of anthocyanins con-tinued to increase slightly during the entire incuba-tion time, however, the maximum optical density was two times lower than in samples with methyl alcohol as a solvent. An increase in the percentage ratio of hydrochloric acid did not show any significant differ-
ences; therefore, 1% ethyl and methyl alcohols can be considered as effective organic solvents for the extraction of anthocyanins from black rice powder.
According to the literature sources, the extrac-tion of anthocyanins might be increased by macera-tion in a water bath or in an US-machine. In order to find out how such methods are more effective than maceration at room temperature, 2.5 g of the sample were poured into 25 mL of an organic extractant and placed under various conditions. After each hour, an aliquot of 10 microliters was diluted 100 times and the optical density of the solution was measured. The measurement results are presented below (Table 2).
Figure 2 – Dependence of anthocyanins concentration on an extractant and time of incubation
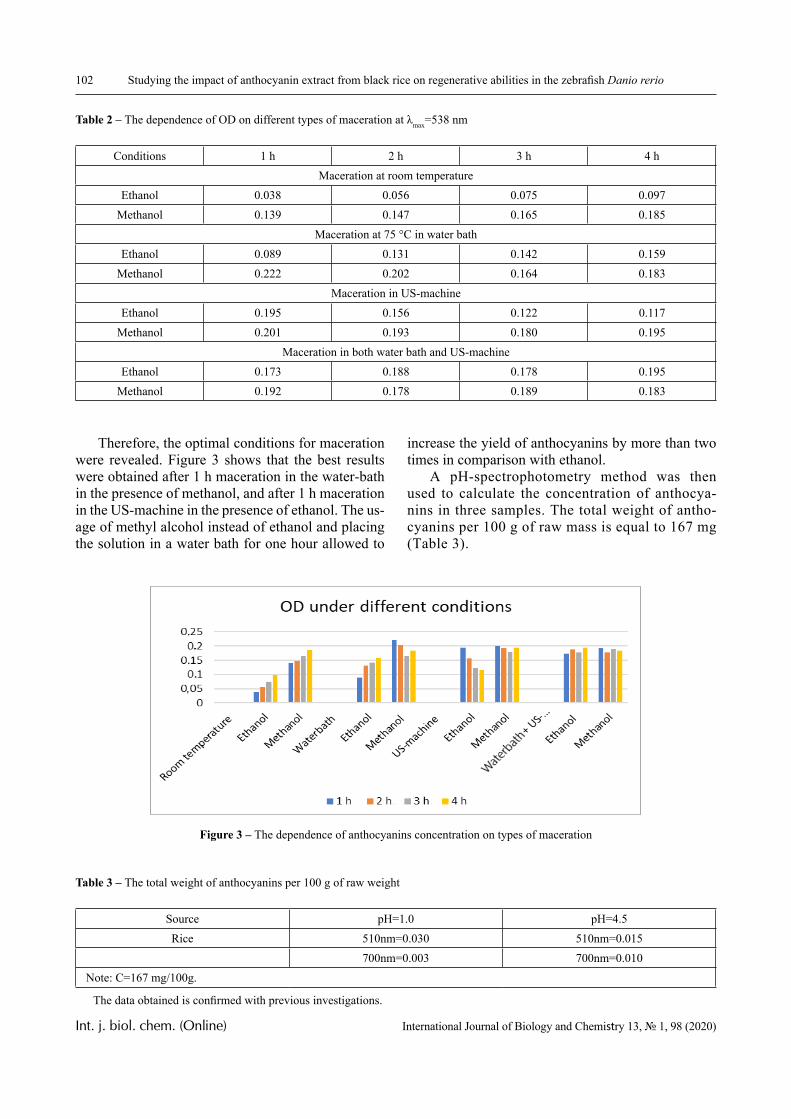
102 Studying the impact of anthocyanin extract from black rice on regenerative abilities in the zebrafish Danio rerio
Int. j. biol. chem. (Online) International Journal of Biology and Chemistry 13, № 1, 98 (2020)
Table 2 – The dependence of OD on different types of maceration at λmax=538 nm
Conditions 1 h 2 h 3 h 4 hMaceration at room temperature
Ethanol 0.038 0.056 0.075 0.097Methanol 0.139 0.147 0.165 0.185
Maceration at 75 °С in water bathEthanol 0.089 0.131 0.142 0.159
Methanol 0.222 0.202 0.164 0.183Maceration in US-machine
Ethanol 0.195 0.156 0.122 0.117Methanol 0.201 0.193 0.180 0.195
Maceration in both water bath and US-machineEthanol 0.173 0.188 0.178 0.195
Methanol 0.192 0.178 0.189 0.183
Therefore, the optimal conditions for maceration were revealed. Figure 3 shows that the best results were obtained after 1 h maceration in the water-bath in the presence of methanol, and after 1 h maceration in the US-machine in the presence of ethanol. The us-age of methyl alcohol instead of ethanol and placing the solution in a water bath for one hour allowed to
increase the yield of anthocyanins by more than two times in comparison with ethanol.
A pH-spectrophotometry method was then used to calculate the concentration of anthocya-nins in three samples. The total weight of antho-cyanins per 100 g of raw mass is equal to 167 mg (Table 3).
Figure 3 – The dependence of anthocyanins concentration on types of maceration
Table 3 – The total weight of anthocyanins per 100 g of raw weight
Source pH=1.0 pH=4.5Rice 510nm=0.030 510nm=0.015
700nm=0.003 700nm=0.010 Note: С=167 mg/100g.
The data obtained is confirmed with previous investigations.
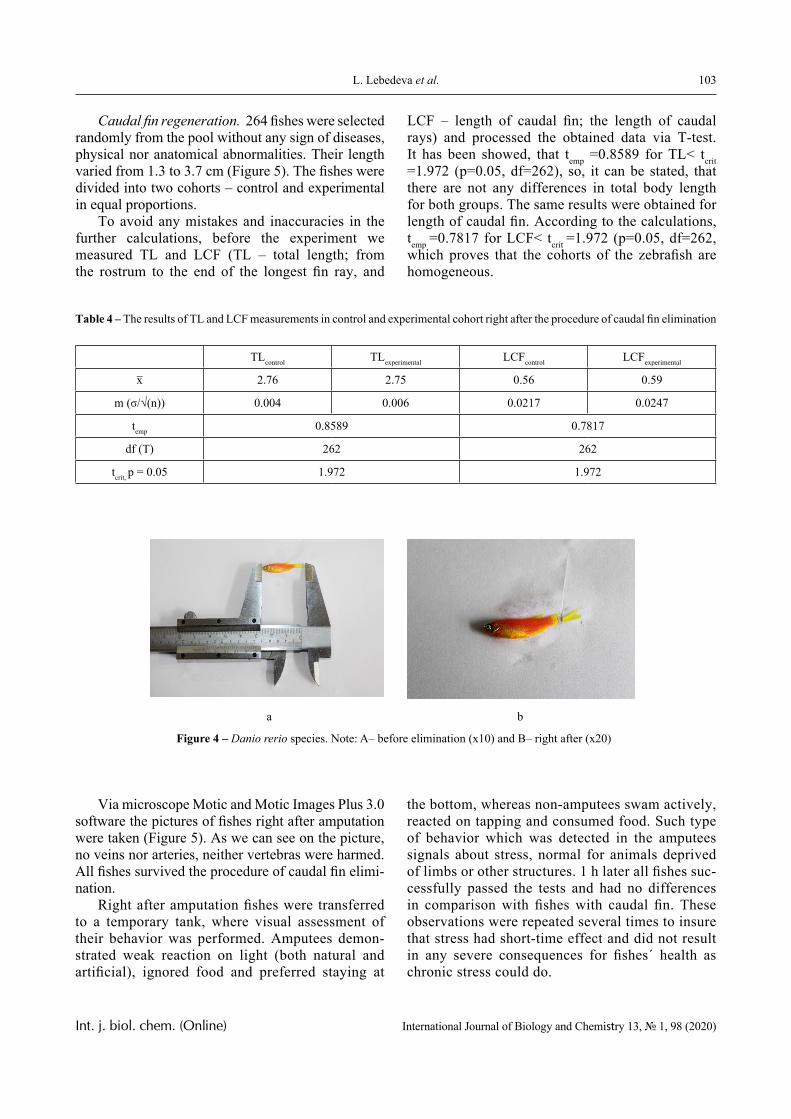
103L. Lebedeva et al.
Int. j. biol. chem. (Online) International Journal of Biology and Chemistry 13, № 1, 98 (2020)
Caudal fin regeneration. 264 fishes were selected randomly from the pool without any sign of diseases, physical nor anatomical abnormalities. Their length varied from 1.3 to 3.7 cm (Figure 5). The fishes were divided into two cohorts – control and experimental in equal proportions.
To avoid any mistakes and inaccuracies in the further calculations, before the experiment we measured TL and LCF (TL – total length; from the rostrum to the end of the longest fin ray, and
LCF – length of caudal fin; the length of caudal rays) and processed the obtained data via T-test. It has been showed, that temp =0.8589 for TL< tcrit =1.972 (p=0.05, df=262), so, it can be stated, that there are not any differences in total body length for both groups. The same results were obtained for length of caudal fin. According to the calculations, temp =0.7817 for LCF< tcrit =1.972 (p=0.05, df=262, which proves that the cohorts of the zebrafish are homogeneous.
Table 4 – The results of TL and LCF measurements in control and experimental cohort right after the procedure of caudal fin elimination
TLcontrol TLexperimental LCFcontrol LCFexperimental
x̅ 2.76 2.75 0.56 0.59
m (σ/√(n)) 0.004 0.006 0.0217 0.0247
temp 0.8589 0.7817
df (T) 262 262
tcrit, p = 0.05 1.972 1.972
a b
Figure 4 – Danio rerio species. Note: A– before elimination (x10) and B– right after (x20)
Via microscope Motic and Motic Images Plus 3.0 software the pictures of fishes right after amputation were taken (Figure 5). As we can see on the picture, no veins nor arteries, neither vertebras were harmed. All fishes survived the procedure of caudal fin elimi-nation.
Right after amputation fishes were transferred to a temporary tank, where visual assessment of their behavior was performed. Amputees demon-strated weak reaction on light (both natural and artificial), ignored food and preferred staying at
the bottom, whereas non-amputees swam actively, reacted on tapping and consumed food. Such type of behavior which was detected in the amputees signals about stress, normal for animals deprived of limbs or other structures. 1 h later all fishes suc-cessfully passed the tests and had no differences in comparison with fishes with caudal fin. These observations were repeated several times to insure that stress had short-time effect and did not result in any severe consequences for fishes´ health as chronic stress could do.
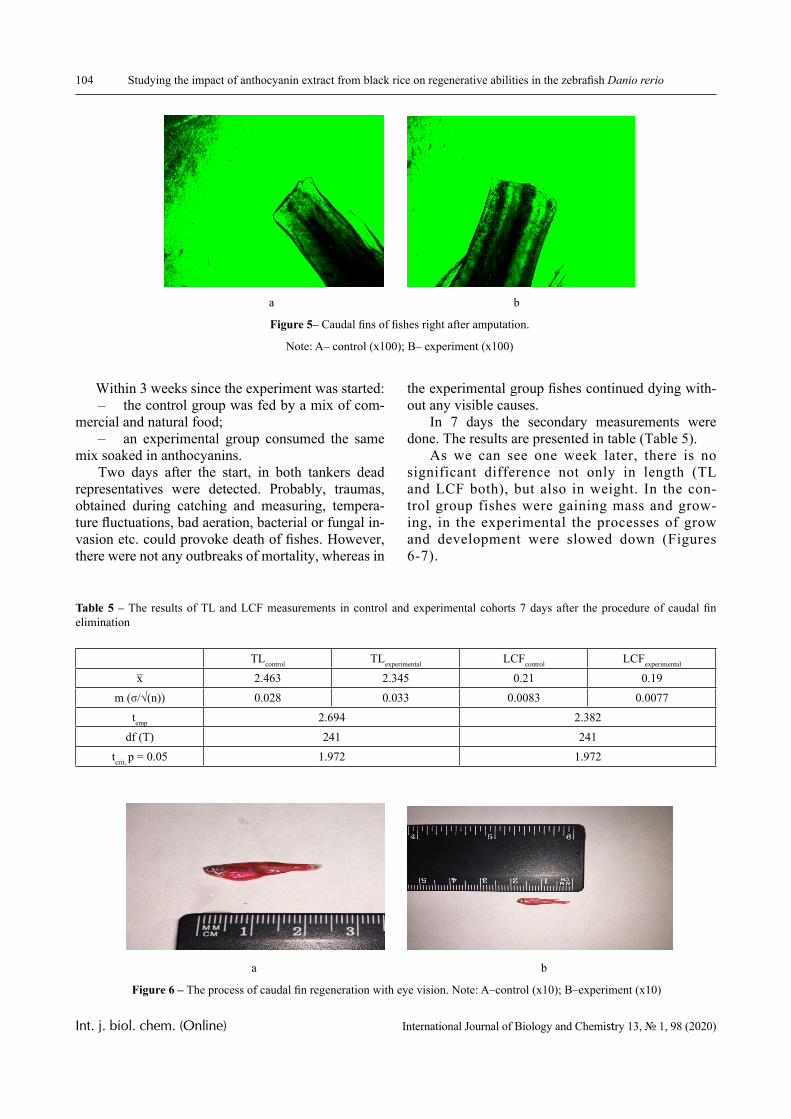
104 Studying the impact of anthocyanin extract from black rice on regenerative abilities in the zebrafish Danio rerio
Int. j. biol. chem. (Online) International Journal of Biology and Chemistry 13, № 1, 98 (2020)
Within 3 weeks since the experiment was started: – the control group was fed by a mix of com-
mercial and natural food;– an experimental group consumed the same
mix soaked in anthocyanins. Two days after the start, in both tankers dead
representatives were detected. Probably, traumas, obtained during catching and measuring, tempera-ture fluctuations, bad aeration, bacterial or fungal in-vasion etc. could provoke death of fishes. However, there were not any outbreaks of mortality, whereas in
the experimental group fishes continued dying with-out any visible causes.
In 7 days the secondary measurements were done. The results are presented in table (Table 5).
As we can see one week later, there is no significant difference not only in length (TL and LCF both), but also in weight. In the con-trol group fishes were gaining mass and grow-ing, in the experimental the processes of grow and development were slowed down (Figures 6-7).
a b
Figure 5– Caudal fins of fishes right after amputation.
Note: A– control (x100); B– experiment (x100)
Table 5 – The results of TL and LCF measurements in control and experimental cohorts 7 days after the procedure of caudal fin elimination
TLcontrol TLexperimental LCFcontrol LCFexperimental
x̅ 2.463 2.345 0.21 0.19m (σ/√(n)) 0.028 0.033 0.0083 0.0077
temp 2.694 2.382df (T) 241 241
tcrit, p = 0.05 1.972 1.972
a b
Figure 6 – The process of caudal fin regeneration with eye vision. Note: A–control (x10); B–experiment (x10)
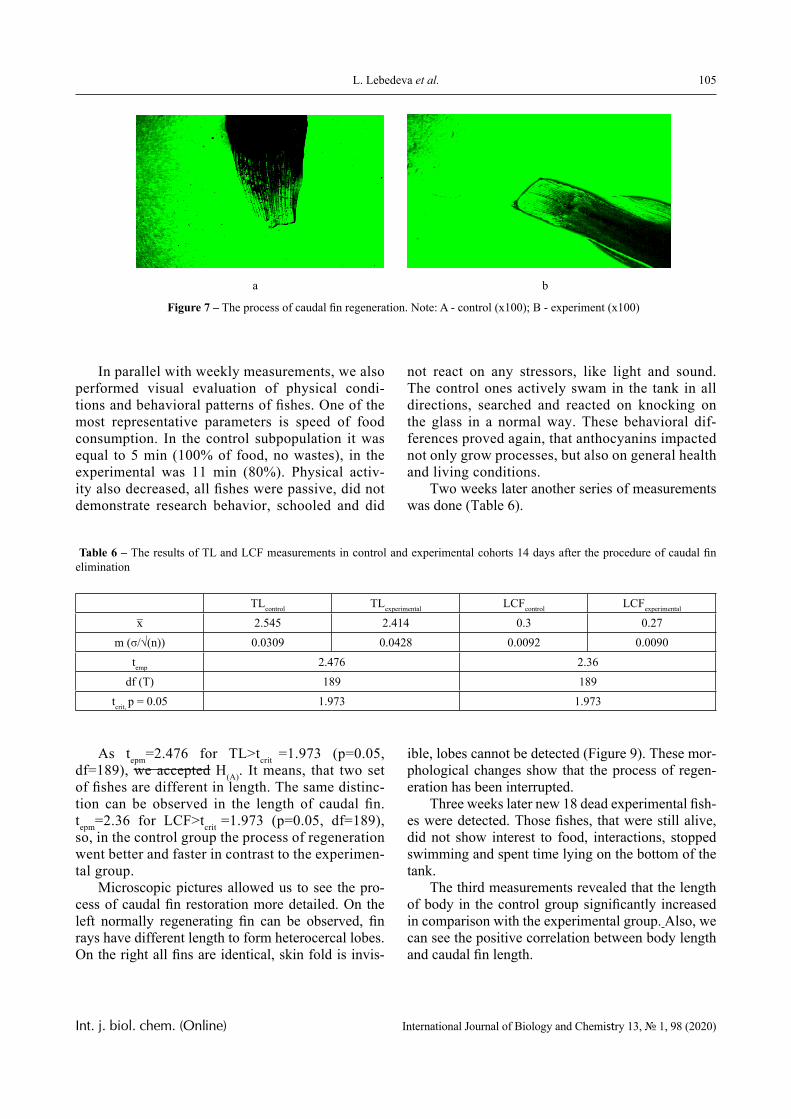
105L. Lebedeva et al.
Int. j. biol. chem. (Online) International Journal of Biology and Chemistry 13, № 1, 98 (2020)
In parallel with weekly measurements, we also performed visual evaluation of physical condi-tions and behavioral patterns of fishes. One of the most representative parameters is speed of food consumption. In the control subpopulation it was equal to 5 min (100% of food, no wastes), in the experimental was 11 min (80%). Physical activ-ity also decreased, all fishes were passive, did not demonstrate research behavior, schooled and did
not react on any stressors, like light and sound. The control ones actively swam in the tank in all directions, searched and reacted on knocking on the glass in a normal way. These behavioral dif-ferences proved again, that anthocyanins impacted not only grow processes, but also on general health and living conditions.
Two weeks later another series of measurements was done (Table 6).
a b
Figure 7 – The process of caudal fin regeneration. Note: A - control (x100); B - experiment (x100)
Table 6 – The results of TL and LCF measurements in control and experimental cohorts 14 days after the procedure of caudal fin elimination
TLcontrol TLexperimental LCFcontrol LCFexperimental
x̅ 2.545 2.414 0.3 0.27m (σ/√(n)) 0.0309 0.0428 0.0092 0.0090
temp 2.476 2.36df (T) 189 189
tcrit, p = 0.05 1.973 1.973
As tepm=2.476 for TL>tcrit =1.973 (p=0.05, df=189), we accepted H(A). It means, that two set of fishes are different in length. The same distinc-tion can be observed in the length of caudal fin. tepm=2.36 for LCF>tcrit =1.973 (p=0.05, df=189), so, in the control group the process of regeneration went better and faster in contrast to the experimen-tal group.
Microscopic pictures allowed us to see the pro-cess of caudal fin restoration more detailed. On the left normally regenerating fin can be observed, fin rays have different length to form heterocercal lobes. On the right all fins are identical, skin fold is invis-
ible, lobes cannot be detected (Figure 9). These mor-phological changes show that the process of regen-eration has been interrupted.
Three weeks later new 18 dead experimental fish-es were detected. Those fishes, that were still alive, did not show interest to food, interactions, stopped swimming and spent time lying on the bottom of the tank.
The third measurements revealed that the length of body in the control group significantly increased in comparison with the experimental group. Also, we can see the positive correlation between body length and caudal fin length.
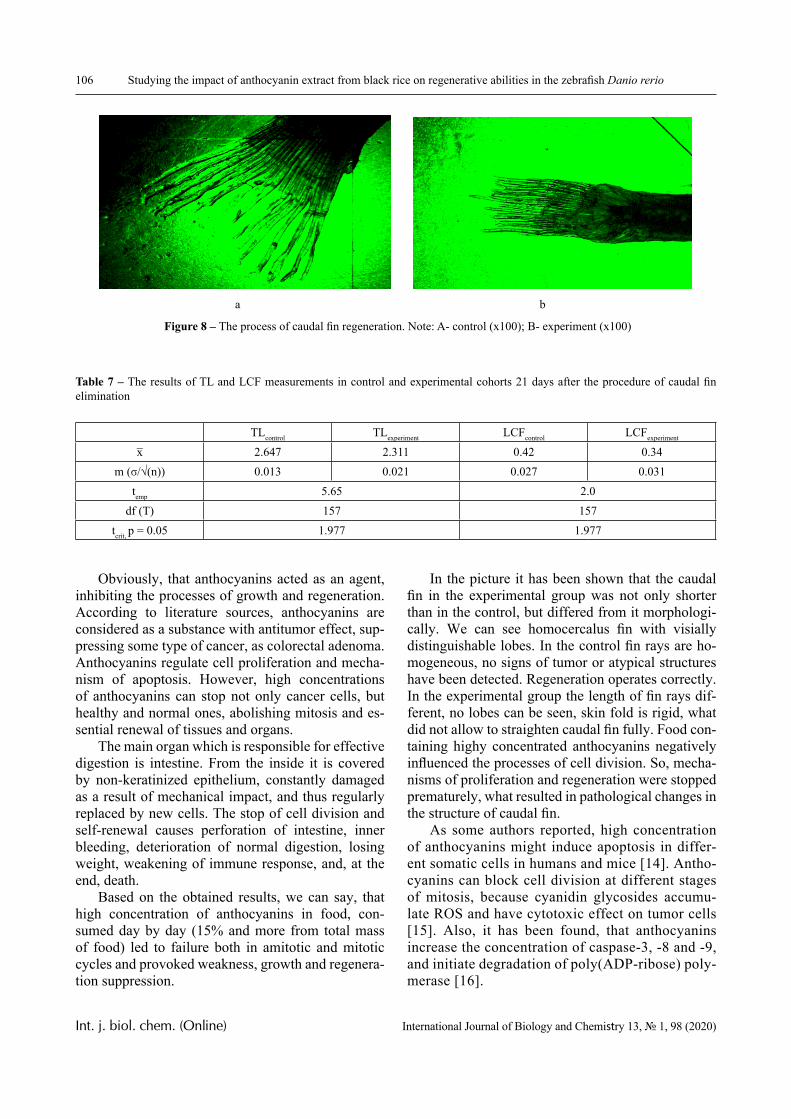
106 Studying the impact of anthocyanin extract from black rice on regenerative abilities in the zebrafish Danio rerio
Int. j. biol. chem. (Online) International Journal of Biology and Chemistry 13, № 1, 98 (2020)
Table 7 – The results of TL and LCF measurements in control and experimental cohorts 21 days after the procedure of caudal fin elimination
TLcontrol TLexperiment LCFcontrol LCFexperiment
x̅ 2.647 2.311 0.42 0.34m (σ/√(n)) 0.013 0.021 0.027 0.031
temp 5.65 2.0df (T) 157 157
tcrit, p = 0.05 1.977 1.977
a b
Figure 8 – The process of caudal fin regeneration. Note: A- control (x100); B- experiment (x100)
Obviously, that anthocyanins acted as an agent, inhibiting the processes of growth and regeneration. According to literature sources, anthocyanins are considered as a substance with antitumor effect, sup-pressing some type of cancer, as colorectal adenoma. Anthocyanins regulate cell proliferation and mecha-nism of apoptosis. However, high concentrations of anthocyanins can stop not only cancer cells, but healthy and normal ones, abolishing mitosis and es-sential renewal of tissues and organs.
The main organ which is responsible for effective digestion is intestine. From the inside it is covered by non-keratinized epithelium, constantly damaged as a result of mechanical impact, and thus regularly replaced by new cells. The stop of cell division and self-renewal causes perforation of intestine, inner bleeding, deterioration of normal digestion, losing weight, weakening of immune response, and, at the end, death.
Based on the obtained results, we can say, that high concentration of anthocyanins in food, con-sumed day by day (15% and more from total mass of food) led to failure both in amitotic and mitotic cycles and provoked weakness, growth and regenera-tion suppression.
In the picture it has been shown that the caudal fin in the experimental group was not only shorter than in the control, but differed from it morphologi-cally. We can see homocercalus fin with visially distinguishable lobes. In the control fin rays are ho-mogeneous, no signs of tumor or atypical structures have been detected. Regeneration operates correctly. In the experimental group the length of fin rays dif-ferent, no lobes can be seen, skin fold is rigid, what did not allow to straighten caudal fin fully. Food con-taining highy concentrated anthocyanins negatively influenced the processes of cell division. So, mecha-nisms of proliferation and regeneration were stopped prematurely, what resulted in pathological changes in the structure of caudal fin.
As some authors reported, high concentration of anthocyanins might induce apoptosis in differ-ent somatic cells in humans and mice [14]. Antho-cyanins can block cell division at different stages of mitosis, because cyanidin glycosides accumu-late ROS and have cytotoxic effect on tumor cells [15]. Also, it has been found, that anthocyanins increase the concentration of caspase-3, -8 and -9, and initiate degradation of poly(ADP-ribose) poly-merase [16].
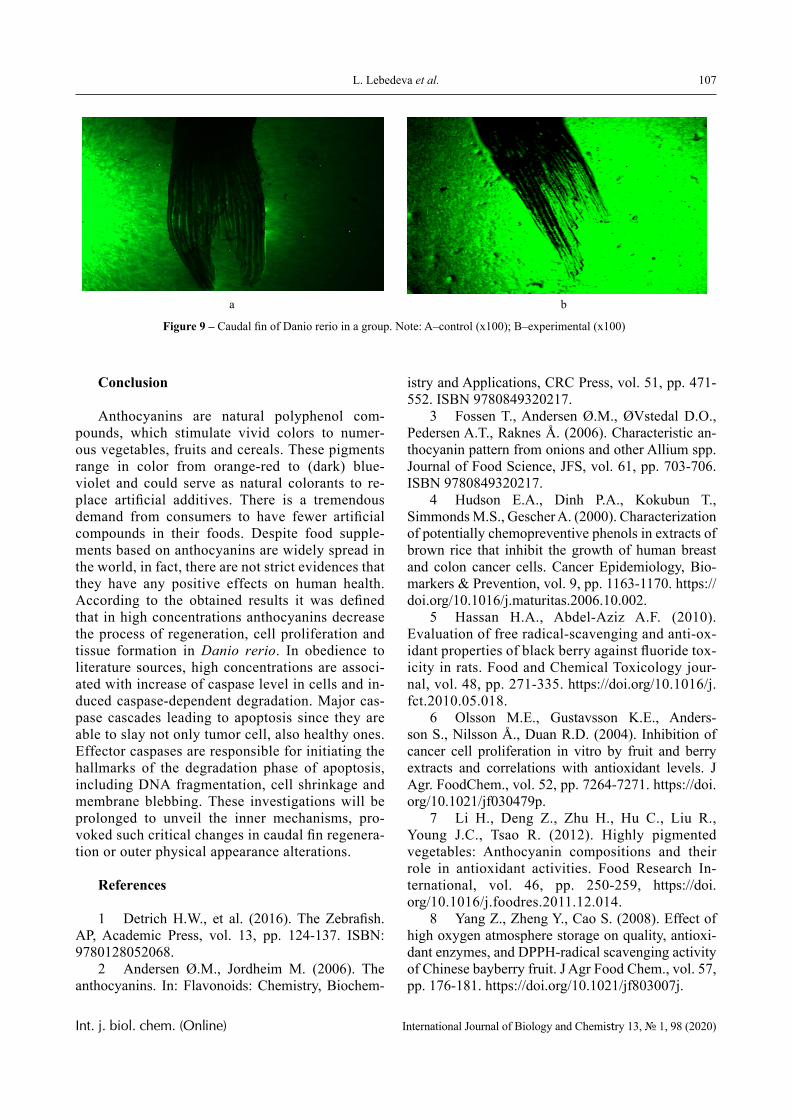
107L. Lebedeva et al.
Int. j. biol. chem. (Online) International Journal of Biology and Chemistry 13, № 1, 98 (2020)
Conclusion
Anthocyanins are natural polyphenol com-pounds, which stimulate vivid colors to numer-ous vegetables, fruits and cereals. These pigments range in color from orange-red to (dark) blue-violet and could serve as natural colorants to re-place artificial additives. There is a tremendous demand from consumers to have fewer artificial compounds in their foods. Despite food supple-ments based on anthocyanins are widely spread in the world, in fact, there are not strict evidences that they have any positive effects on human health. According to the obtained results it was defined that in high concentrations anthocyanins decrease the process of regeneration, cell proliferation and tissue formation in Danio rerio. In obedience to literature sources, high concentrations are associ-ated with increase of caspase level in cells and in-duced caspase-dependent degradation. Major cas-pase cascades leading to apoptosis since they are able to slay not only tumor cell, also healthy ones. Effector caspases are responsible for initiating the hallmarks of the degradation phase of apoptosis, including DNA fragmentation, cell shrinkage and membrane blebbing. These investigations will be prolonged to unveil the inner mechanisms, pro-voked such critical changes in caudal fin regenera-tion or outer physical appearance alterations.
References
1 Detrich H.W., et al. (2016). The Zebrafish. AP, Academic Press, vol. 13, pp. 124-137. ISBN: 9780128052068.
2 Andersen Ø.M., Jordheim M. (2006). The anthocyanins. In: Flavonoids: Chemistry, Biochem-
istry and Applications, CRC Press, vol. 51, pp. 471-552. ISBN 9780849320217.
3 Fossen T., Andersen Ø.M., ØVstedal D.O., Pedersen A.T., Raknes Å. (2006). Characteristic an-thocyanin pattern from onions and other Allium spp. Journal of Food Science, JFS, vol. 61, pp. 703-706. ISBN 9780849320217.
4 Hudson E.A., Dinh P.A., Kokubun T., Simmonds M.S., Gescher A. (2000). Characterization of potentially chemopreventive phenols in extracts of brown rice that inhibit the growth of human breast and colon cancer cells. Cancer Epidemiology, Bio-markers & Prevention, vol. 9, pp. 1163-1170. https://doi.org/10.1016/j.maturitas.2006.10.002.
5 Hassan H.A., Abdel-Aziz A.F. (2010). Evaluation of free radical-scavenging and anti-ox-idant properties of black berry against fluoride tox-icity in rats. Food and Chemical Toxicology jour-nal, vol. 48, pp. 271-335. https://doi.org/10.1016/j.fct.2010.05.018.
6 Olsson M.E., Gustavsson K.E., Anders-son S., Nilsson Å., Duan R.D. (2004). Inhibition of cancer cell proliferation in vitro by fruit and berry extracts and correlations with antioxidant levels. J Agr. FoodChem., vol. 52, pp. 7264-7271. https://doi.org/10.1021/jf030479p.
7 Li H., Deng Z., Zhu H., Hu C., Liu R., Young J.C., Tsao R. (2012). Highly pigmented vegetables: Anthocyanin compositions and their role in antioxidant activities. Food Research In-ternational, vol. 46, pp. 250-259, https://doi.org/10.1016/j.foodres.2011.12.014.
8 Yang Z., Zheng Y., Cao S. (2008). Effect of high oxygen atmosphere storage on quality, antioxi-dant enzymes, and DPPH-radical scavenging activity of Chinese bayberry fruit. J Agr Food Chem., vol. 57, pp. 176-181. https://doi.org/10.1021/jf803007j.
a b
Figure 9 – Caudal fin of Danio rerio in a group. Note: A–control (x100); B–experimental (x100)
108 Studying the impact of anthocyanin extract from black rice on regenerative abilities in the zebrafish Danio rerio
Int. j. biol. chem. (Online) International Journal of Biology and Chemistry 13, № 1, 98 (2020)
9 Juroszek P., Lumpkin H.M., Yang R.Y., Ledesma D.R., Ma C.H. (2009). Fruit quality and bioactive compounds with antioxidant activity of tomatoes grown on-farm: comparison of organ-ic and conventional management systems. J Agr Food Chem., vol. 57, pp. 1188-1194. https://doi.org/10.1021/jf801992s.
10 Seeram N.P., Adams L.S., Hardy M.L., Heber D. (2004). Total cranberry extract versus its phytochemical constituents: antiproliferative and synergistic effects against human tumor cell lines. J Agr Food Chem., vol. 52, pp. 2512-2517. https://doi.org/10.1021/jf0352778.
11 Egbuna, Chukwuebuka, et al. (2018) Phyto-chemical Test Methods: Qualitative, Quantitative and Proximate Analysis. Phytochemistry, pp. 381-426. https://doi.org/10.1201/9780429426223-15.
12 Andersen Ø.M., Jordheim M. (2006) The an-thocyanins. In: Flavonoids: Chemistry, Biochemistry and Applications. CRC Press, vol. 51, pp. 471-552. ISBN 9780849320217.
13 Andersen Ø.M., Jordheim M. (2008) Anthocya-nins – food applications. Proc. 5th Int. Congr. Pigments Foods: For Quality and Health, Finland, vol. 56, pp.165-221. https://doi.org/10.1007/978-0-387-77335-3_3.
14 Lazze M.C. (2004). Anthocyanins induce cell cycle perturbations and apoptosis in different human cell lines, Carcinogenesis, vol. 25, no. 8, pp. 1427-1433, https://doi.org/10.1093/carcin/bgh138.
15 Rugină D., Sconţa Z., Leopold L., Pintea A., Bunea A., Socaciu C. (2012). Antioxidant activi-ties of chokeberry extracts and the cytotoxic action of their anthocyanin fraction on HeLa human cervi-cal tumor cells. J. Med. Food., vol. 6, pp. 700-706. https://doi.org/10.1089/jmf.2011.0246.
16 Lee S.H., Park S.M., Park S.M., Park J.H., Shin D.Y., Kim G.Y., Ryu C.H., Shin S.C., Jung J.M., Kang H.S., Lee W.S., Choi Y.H. (2009). Induction of apoptosis in human leukemia U937 cells by anthocy-anins through down-regulation of Bcl-2 and activa-tion of caspases. Int. J Oncol. vol. 6, pp. 1077-1083, https://doi.org/10.3892/ijo_00000234.
© 2020 al-Farabi Kazakh National University Int. j. biol. chem. (Online)
International Journal of Biology and Chemistry 13, № 1, 109 (2020)
IRSTI 633.16:581.1 https://doi.org/10.26577/ijbch.2020.v13.i1.11
S.D. Atabayeva1* , R. Minocha2 , S.C. Minocha3 , A. Rakhymgozhina1, A.M. Nabieva1, A.C. Nurmahanova1 , S.S. Кenzhebayeva1 ,
R.A. Alybayeva1 , S.S. Asrandina1
1Al-Farabi Kazakh National University, Research Institute of Ecology Problems, Almaty, Kazakhstan 2USDA Forest Service, Durham, USA
3Department of Biological Sciences, University of New Hampshire, Durham, USA *e-mail: [email protected]
Response of plants to cadmium stress
Abstract. In this article we discuss cadmium pollution in the environment and the various ways plants take up cadmium and respond to its accumulation. The increased development of metallurgical and mining industries is primarily responsible for the increases in cadmium pollution in the environment. Another significant source of cadmium contamination of agricultural plants is the widespread use of phosphorus fertilizers, which contain cadmium. Cadmium reduces the growth and development of plants. Cadmium in the soil also competes with the basic essential mineral elements thereby reducing their uptake by plants. This article reviews the published data on the cellular and molecular mechanisms of cadmium uptake by plants, its metabolic transformations, effects on nutrient status of plants, modulation of cadmium response by polyamines and amino acids, and the growth of plants. Strategies to reduce cadmium uptake and accumulation are also discussed.Key words: Cadmium, plants, crops, growth, toxic effect.
Introduction
The expansion of industry and agriculture to cope with increasing world population leads to an increase in the number of heavy metals in the environment. Often this increase is several orders of magnitude greater than background concentrations. The primary sources of anthropogenic contributions of heavy met-als are industrial emissions associated with mining, and metallurgical and chemical industries. There is a constantly growing volume of industrial waste from new technological landscapes which have become a source of contaminated dust that extends long dis-tances from the source, polluting the environment and posing a threat to public health and biodiversity of the region.
Contamination of soil, plants and water with heavy metals in the vicinity of large industrial cen-ters has become one of the most pressing environ-mental problems. Cadmium (Cd) in unpolluted soils is present in trace amounts (0.05- 0.15 mg/kg) [1]. Nevertheless, human industrial activities and agri-cultural practices increase the level of Cd in the soil. The operations of metallurgical enterprises and the
use of Cd containing phosphorus fertilizers and pes-ticides, contributes to high Cd accumulation in soil [2]. The degree of contamination of soil Cd fertilized with phosphorus fertilizers can reach 300 mg/kg dry weight [3].
Cadmium enters human body through the food chain, and it remains in the body for many years. Cadmium-contaminated food can induce chronic toxicity. Cadmium is a calcium (Ca) antagonist. Increased accumulation of Cd in the human body is responsible for diseases like Itai-Itai, which translates into reducing the content of Ca in the bones, which causes their softening [4]. The World Health Organization (WHO) has set a maximum limit of Cd in human diet to about 60-70 mg per day, and the Codex Alimentarius Commission of the US (usda.gov/codex) and the Food and Agri-culture Organization (FAO) (http://www.fao.org/fao-who-codexalimen tarius /en/) has set a limit of 0.1 mg Kg-1 for cereals and oilseeds [5]. Because of its high solubility in the soil (~35%), Cd is more readily available than other heavy metals such as Zn, Cu, Pb, which have a higher absorption coef-ficients [6].
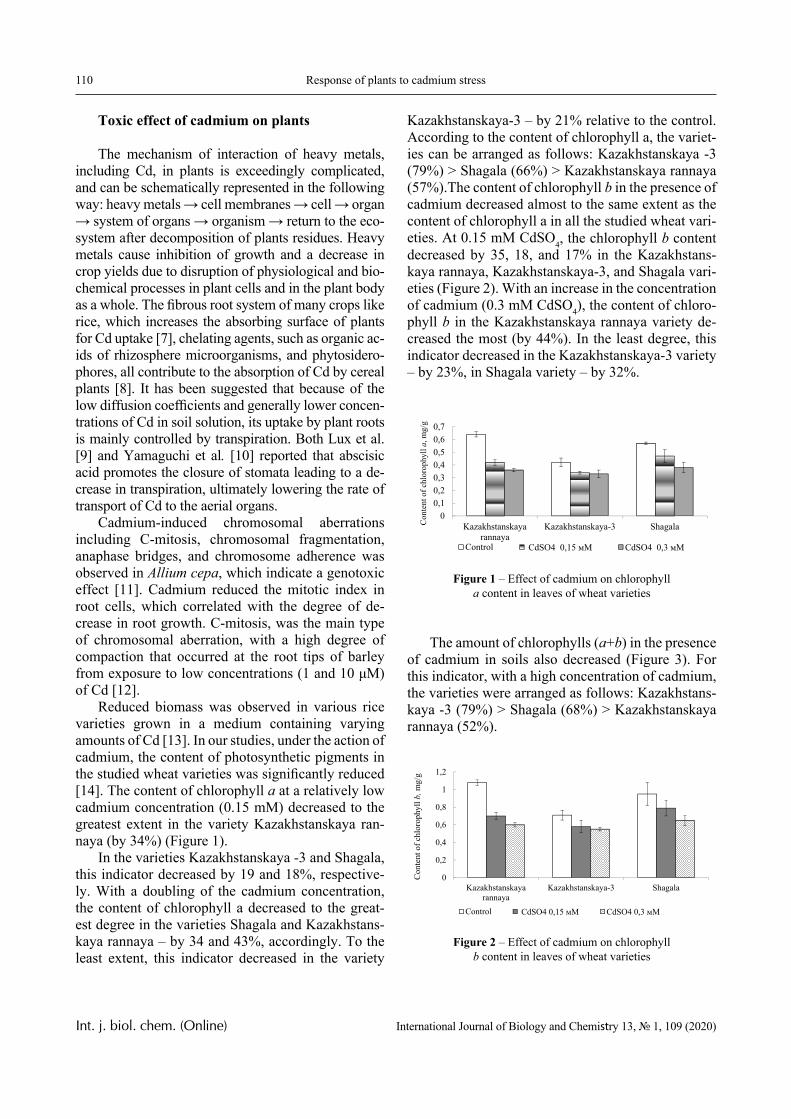
110 Response of plants to cadmium stress
Int. j. biol. chem. (Online) International Journal of Biology and Chemistry 13, № 1, 109 (2020)
Toxic effect of сadmium on plants
The mechanism of interaction of heavy metals, including Cd, in plants is exceedingly complicated, and can be schematically represented in the following way: heavy metals → cell membranes → cell → organ → system of organs → organism → return to the eco-system after decomposition of plants residues. Heavy metals cause inhibition of growth and a decrease in crop yields due to disruption of physiological and bio-chemical processes in plant cells and in the plant body as a whole. The fibrous root system of many crops like rice, which increases the absorbing surface of plants for Cd uptake [7], chelating agents, such as organic ac-ids of rhizosphere microorganisms, and phytosidero-phores, all contribute to the absorption of Cd by cereal plants [8]. It has been suggested that because of the low diffusion coefficients and generally lower concen-trations of Cd in soil solution, its uptake by plant roots is mainly controlled by transpiration. Both Lux et al. [9] and Yamaguchi et al. [10] reported that abscisic acid promotes the closure of stomata leading to a de-crease in transpiration, ultimately lowering the rate of transport of Cd to the aerial organs.
Cadmium-induced chromosomal aberrations including C-mitosis, chromosomal fragmentation, anaphase bridges, and chromosome adherence was observed in Allium cepa, which indicate a genotoxic effect [11]. Cadmium reduced the mitotic index in root cells, which correlated with the degree of de-crease in root growth. C-mitosis, was the main type of chromosomal aberration, with a high degree of compaction that occurred at the root tips of barley from exposure to low concentrations (1 and 10 μM) of Cd [12].
Reduced biomass was observed in various rice varieties grown in a medium containing varying amounts of Cd [13]. In our studies, under the action of cadmium, the content of photosynthetic pigments in the studied wheat varieties was significantly reduced [14]. The content of chlorophyll a at a relatively low cadmium concentration (0.15 mM) decreased to the greatest extent in the variety Kazakhstanskaya ran-naya (by 34%) (Figure 1).
In the varieties Kazakhstanskaya -3 and Shagala, this indicator decreased by 19 and 18%, respective-ly. With a doubling of the cadmium concentration, the content of chlorophyll a decreased to the great-est degree in the varieties Shagala and Kazakhstans-kaya rannaya – by 34 and 43%, accordingly. To the least extent, this indicator decreased in the variety
Kazakhstanskaya-3 – by 21% relative to the control. According to the content of chlorophyll a, the variet-ies can be arranged as follows: Kazakhstanskaya -3 (79%) > Shagala (66%) > Kazakhstanskaya rannaya (57%).The content of chlorophyll b in the presence of cadmium decreased almost to the same extent as the content of chlorophyll a in all the studied wheat vari-eties. At 0.15 mM CdSO4, the chlorophyll b content decreased by 35, 18, and 17% in the Kazakhstans-kaya rannaya, Kazakhstanskaya-3, and Shagala vari-eties (Figure 2). With an increase in the concentration of cadmium (0.3 mМ CdSO4), the content of chloro-phyll b in the Kazakhstanskaya rannaya variety de-creased the most (by 44%). In the least degree, this indicator decreased in the Kazakhstanskaya-3 variety – by 23%, in Shagala variety – by 32%.
00,10,20,30,40,50,60,7
Kazakhstanskayarannaya
Kazakhstanskaya-3 ShagalaCont
ent o
f chl
orop
hyll а,
mg/
g
Control CdSO4 0,15 мМ CdSO4 0,3 мМ
Figure 1 – Effect of cadmium on chlorophyll a content in leaves of wheat varieties
The amount of chlorophylls (a+b) in the presence of cadmium in soils also decreased (Figure 3). For this indicator, with a high concentration of cadmium, the varieties were arranged as follows: Kazakhstans-kaya -3 (79%) > Shagala (68%) > Kazakhstanskaya rannaya (52%).
0
0,2
0,4
0,6
0,8
1
1,2
Kazakhstanskayarannaya
Kazakhstanskaya-3 Shagala
Cont
ent o
f chl
orop
hyll b,
mg/
g
Control CdSO4 0,15 мМ CdSO4 0,3 мМ
Figure 2 – Effect of cadmium on chlorophyll b content in leaves of wheat varieties
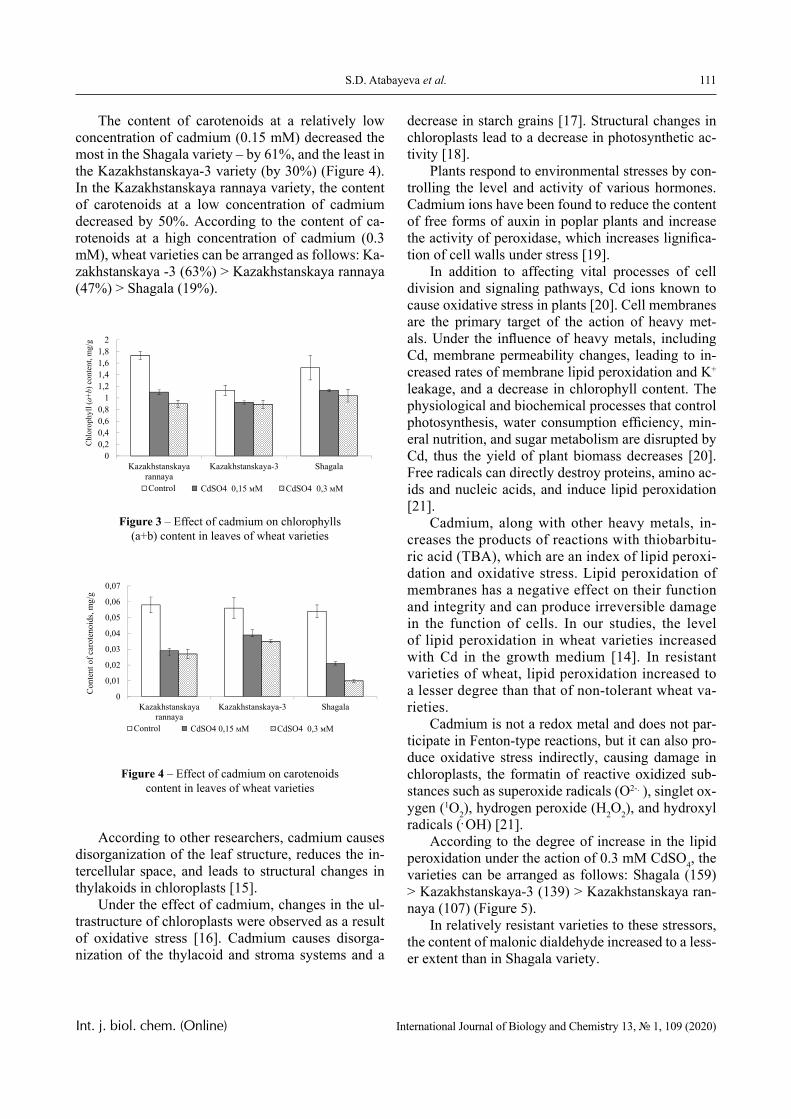
111S.D. Atabayeva et al.
Int. j. biol. chem. (Online) International Journal of Biology and Chemistry 13, № 1, 109 (2020)
The content of carotenoids at a relatively low concentration of cadmium (0.15 mM) decreased the most in the Shagala variety – by 61%, and the least in the Kazakhstanskaya-3 variety (by 30%) (Figure 4). In the Kazakhstanskaya rannaya variety, the content of carotenoids at a low concentration of cadmium decreased by 50%. According to the content of ca-rotenoids at a high concentration of cadmium (0.3 mM), wheat varieties can be arranged as follows: Ka-zakhstanskaya -3 (63%) > Kazakhstanskaya rannaya (47%) > Shagala (19%).
00,20,40,60,8
11,21,41,61,8
2
Kazakhstanskayarannaya
Kazakhstanskaya-3 Shagala
Chlo
roph
yll (a+b)
con
tent
, mg/
g
Control CdSO4 0,15 мМ CdSO4 0,3 мМ
Figure 3 – Effect of cadmium on chlorophylls (a+b) content in leaves of wheat varieties
0
0,01
0,02
0,03
0,04
0,05
0,06
0,07
Kazakhstanskayarannaya
Kazakhstanskaya-3 Shagala
Cont
ent o
f car
oten
oids
, mg/
g
Control CdSO4 0,15 мМ CdSO4 0,3 мМ
Figure 4 – Effect of cadmium on carotenoids content in leaves of wheat varieties
According to other researchers, cadmium causes disorganization of the leaf structure, reduces the in-tercellular space, and leads to structural changes in thylakoids in chloroplasts [15].
Under the effect of cadmium, changes in the ul-trastructure of chloroplasts were observed as a result of oxidative stress [16]. Cadmium causes disorga-nization of the thylacoid and stroma systems and a
decrease in starch grains [17]. Structural changes in chloroplasts lead to a decrease in photosynthetic ac-tivity [18].
Plants respond to environmental stresses by con-trolling the level and activity of various hormones. Cadmium ions have been found to reduce the content of free forms of auxin in poplar plants and increase the activity of peroxidase, which increases lignifica-tion of cell walls under stress [19].
In addition to affecting vital processes of cell division and signaling pathways, Cd ions known to cause oxidative stress in plants [20]. Cell membranes are the primary target of the action of heavy met-als. Under the influence of heavy metals, including Cd, membrane permeability changes, leading to in-creased rates of membrane lipid peroxidation and K+ leakage, and a decrease in chlorophyll content. The physiological and biochemical processes that control photosynthesis, water consumption efficiency, min-eral nutrition, and sugar metabolism are disrupted by Cd, thus the yield of plant biomass decreases [20]. Free radicals can directly destroy proteins, amino ac-ids and nucleic acids, and induce lipid peroxidation [21].
Cadmium, along with other heavy metals, in-creases the products of reactions with thiobarbitu-ric acid (TBA), which are an index of lipid peroxi-dation and oxidative stress. Lipid peroxidation of membranes has a negative effect on their function and integrity and can produce irreversible damage in the function of cells. In our studies, the level of lipid peroxidation in wheat varieties increased with Cd in the growth medium [14]. In resistant varieties of wheat, lipid peroxidation increased to a lesser degree than that of non-tolerant wheat va-rieties.
Cadmium is not a redox metal and does not par-ticipate in Fenton-type reactions, but it can also pro-duce oxidative stress indirectly, causing damage in chloroplasts, the formatin of reactive oxidized sub-stances such as superoxide radicals (O2-. ), singlet ox-ygen (1O2), hydrogen peroxide (H2O2), and hydroxyl radicals (. ОН) [21].
According to the degree of increase in the lipid peroxidation under the action of 0.3 mM CdSO4, the varieties can be arranged as follows: Shagala (159) > Kazakhstanskaya-3 (139) > Kazakhstanskaya ran-naya (107) (Figure 5).
In relatively resistant varieties to these stressors, the content of malonic dialdehyde increased to a less-er extent than in Shagala variety.
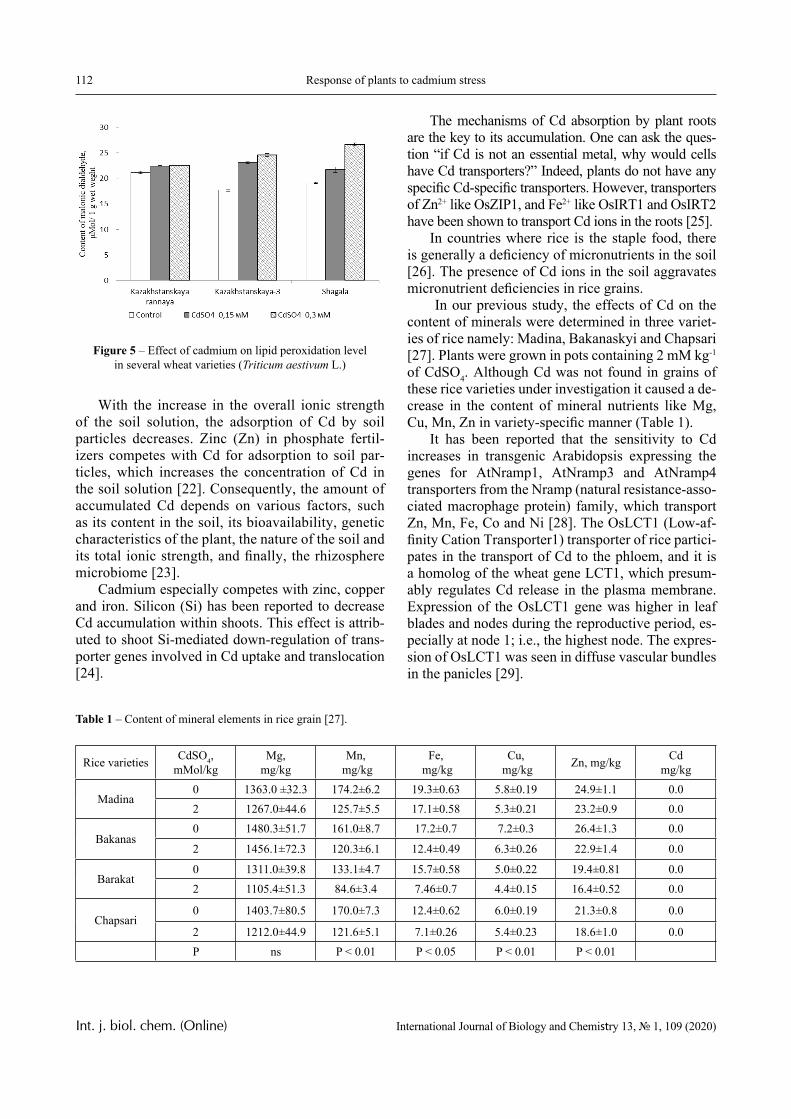
112 Response of plants to cadmium stress
Int. j. biol. chem. (Online) International Journal of Biology and Chemistry 13, № 1, 109 (2020)
Figure 5 – Effect of cadmium on lipid peroxidation level in several wheat varieties (Triticum aestivum L.)
With the increase in the overall ionic strength of the soil solution, the adsorption of Cd by soil particles decreases. Zinc (Zn) in phosphate fertil-izers competes with Cd for adsorption to soil par-ticles, which increases the concentration of Cd in the soil solution [22]. Consequently, the amount of accumulated Cd depends on various factors, such as its content in the soil, its bioavailability, genetic characteristics of the plant, the nature of the soil and its total ionic strength, and finally, the rhizosphere microbiome [23].
Cadmium especially competes with zinc, copper and iron. Silicon (Si) has been reported to decrease Cd accumulation within shoots. This effect is attrib-uted to shoot Si-mediated down-regulation of trans-porter genes involved in Cd uptake and translocation [24].
The mechanisms of Cd absorption by plant roots are the key to its accumulation. One can ask the ques-tion “if Cd is not an essential metal, why would cells have Cd transporters?” Indeed, plants do not have any specific Cd-specific transporters. However, transporters of Zn2+ like OsZIP1, and Fe2+ like OsIRT1 and OsIRT2 have been shown to transport Cd ions in the roots [25].
In countries where rice is the staple food, there is generally a deficiency of micronutrients in the soil [26]. The presence of Cd ions in the soil aggravates micronutrient deficiencies in rice grains.
In our previous study, the effects of Cd on the content of minerals were determined in three variet-ies of rice namely: Madina, Bakanaskyi and Chapsari [27]. Plants were grown in pots containing 2 mM kg-1 of CdSO4. Although Cd was not found in grains of these rice varieties under investigation it caused a de-crease in the content of mineral nutrients like Mg, Cu, Mn, Zn in variety-specific manner (Table 1).
It has been reported that the sensitivity to Cd increases in transgenic Arabidopsis expressing the genes for AtNramp1, AtNramp3 and AtNramp4 transporters from the Nramp (natural resistance-asso-ciated macrophage protein) family, which transport Zn, Mn, Fe, Co and Ni [28]. The OsLCT1 (Low-af-finity Cation Transporter1) transporter of rice partici-pates in the transport of Cd to the phloem, and it is a homolog of the wheat gene LCT1, which presum-ably regulates Cd release in the plasma membrane. Expression of the OsLCT1 gene was higher in leaf blades and nodes during the reproductive period, es-pecially at node 1; i.e., the highest node. The expres-sion of OsLCT1 was seen in diffuse vascular bundles in the panicles [29].
Table 1 – Content of mineral elements in rice grain [27].
Rice varieties CdSO4,mMol/kg
Mg, mg/kg
Mn, mg/kg
Fe, mg/kg
Cu, mg/kg Zn, mg/kg Cd
mg/kg
Madina0 1363.0 ±32.3 174.2±6.2 19.3±0.63 5.8±0.19 24.9±1.1 0.02 1267.0±44.6 125.7±5.5 17.1±0.58 5.3±0.21 23.2±0.9 0.0
Bakanas0 1480.3±51.7 161.0±8.7 17.2±0.7 7.2±0.3 26.4±1.3 0.0
2 1456.1±72.3 120.3±6.1 12.4±0.49 6.3±0.26 22.9±1.4 0.0
Barakat0 1311.0±39.8 133.1±4.7 15.7±0.58 5.0±0.22 19.4±0.81 0.02 1105.4±51.3 84.6±3.4 7.46±0.7 4.4±0.15 16.4±0.52 0.0
Chapsari0 1403.7±80.5 170.0±7.3 12.4±0.62 6.0±0.19 21.3±0.8 0.0
2 1212.0±44.9 121.6±5.1 7.1±0.26 5.4±0.23 18.6±1.0 0.0P ns P < 0.01 P < 0.05 P < 0.01 P < 0.01
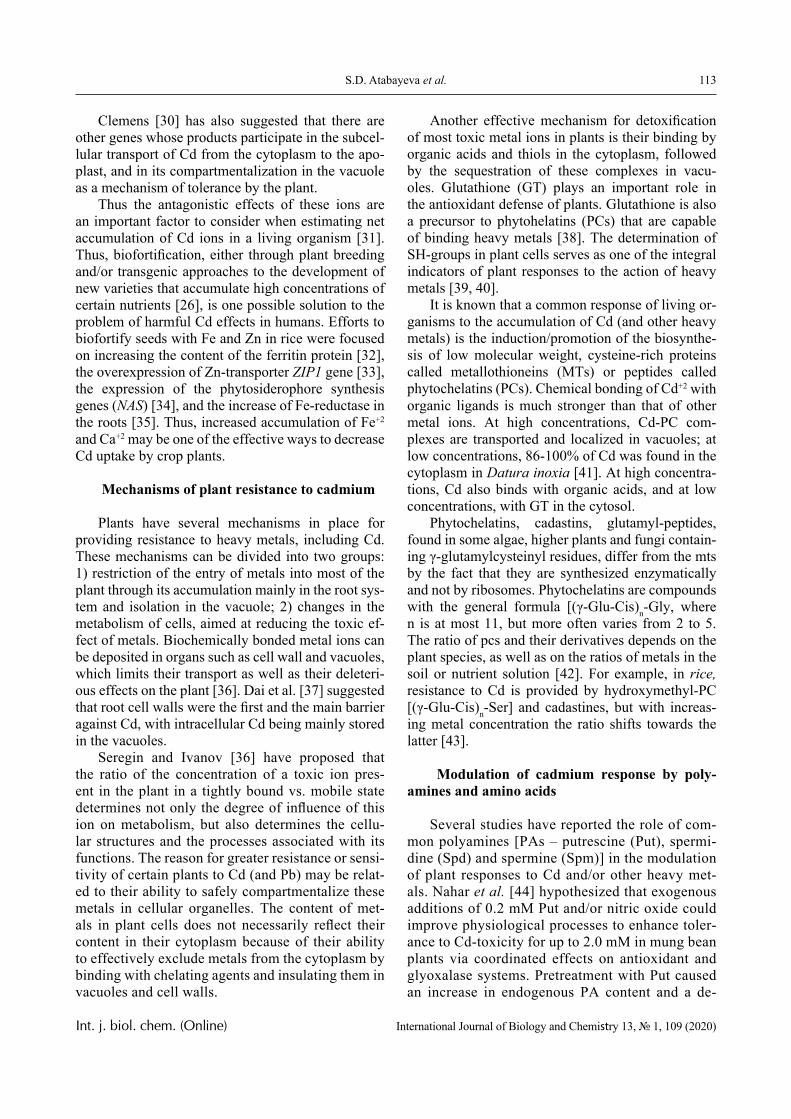
113S.D. Atabayeva et al.
Int. j. biol. chem. (Online) International Journal of Biology and Chemistry 13, № 1, 109 (2020)
Clemens [30] has also suggested that there are other genes whose products participate in the subcel-lular transport of Cd from the cytoplasm to the apo-plast, and in its compartmentalization in the vacuole as a mechanism of tolerance by the plant.
Thus the antagonistic effects of these ions are an important factor to consider when estimating net accumulation of Cd ions in a living organism [31]. Thus, biofortification, either through plant breeding and/or transgenic approaches to the development of new varieties that accumulate high concentrations of certain nutrients [26], is one possible solution to the problem of harmful Cd effects in humans. Efforts to biofortify seeds with Fe and Zn in rice were focused on increasing the content of the ferritin protein [32], the overexpression of Zn-transporter ZIP1 gene [33], the expression of the phytosiderophore synthesis genes (NAS) [34], and the increase of Fe-reductase in the roots [35]. Thus, increased accumulation of Fe+2 and Ca+2 may be one of the effective ways to decrease Cd uptake by crop plants.
Mechanisms of plant resistance to сadmium
Plants have several mechanisms in place for providing resistance to heavy metals, including Cd. These mechanisms can be divided into two groups: 1) restriction of the entry of metals into most of the plant through its accumulation mainly in the root sys-tem and isolation in the vacuole; 2) changes in the metabolism of cells, aimed at reducing the toxic ef-fect of metals. Biochemically bonded metal ions can be deposited in organs such as cell wall and vacuoles, which limits their transport as well as their deleteri-ous effects on the plant [36]. Dai et al. [37] suggested that root cell walls were the first and the main barrier against Cd, with intracellular Cd being mainly stored in the vacuoles.
Seregin and Ivanov [36] have proposed that the ratio of the concentration of a toxic ion pres-ent in the plant in a tightly bound vs. mobile state determines not only the degree of influence of this ion on metabolism, but also determines the cellu-lar structures and the processes associated with its functions. The reason for greater resistance or sensi-tivity of certain plants to Cd (and Pb) may be relat-ed to their ability to safely compartmentalize these metals in cellular organelles. The content of met-als in plant cells does not necessarily reflect their content in their cytoplasm because of their ability to effectively exclude metals from the cytoplasm by binding with chelating agents and insulating them in vacuoles and cell walls.
Another effective mechanism for detoxification of most toxic metal ions in plants is their binding by organic acids and thiols in the cytoplasm, followed by the sequestration of these complexes in vacu-oles. Glutathione (GT) plays an important role in the antioxidant defense of plants. Glutathione is also a precursor to phytohelatins (PCs) that are capable of binding heavy metals [38]. The determination of SH-groups in plant cells serves as one of the integral indicators of plant responses to the action of heavy metals [39, 40].
It is known that a common response of living or-ganisms to the accumulation of Cd (and other heavy metals) is the induction/promotion of the biosynthe-sis of low molecular weight, cysteine-rich proteins called metallothioneins (MTs) or peptides called phytochelatins (PCs). Chemical bonding of Cd+2 with organic ligands is much stronger than that of other metal ions. At high concentrations, Cd-PC com-plexes are transported and localized in vacuoles; at low concentrations, 86-100% of Cd was found in the cytoplasm in Datura inoxia [41]. At high concentra-tions, Cd also binds with organic acids, and at low concentrations, with GT in the cytosol.
Phytochelatins, cadastins, glutamyl-peptides, found in some algae, higher plants and fungi contain-ing γ-glutamylcysteinyl residues, differ from the mts by the fact that they are synthesized enzymatically and not by ribosomes. Phytochelatins are compounds with the general formula [(γ-Glu-Cis)n-Gly, where n is at most 11, but more often varies from 2 to 5. The ratio of pcs and their derivatives depends on the plant species, as well as on the ratios of metals in the soil or nutrient solution [42]. For example, in rice, resistance to Cd is provided by hydroxymethyl-PC [(γ-Glu-Cis)n-Ser] and cadastines, but with increas-ing metal concentration the ratio shifts towards the latter [43].
Modulation of cadmium response by poly-amines and amino acids
Several studies have reported the role of com-mon polyamines [PAs – putrescine (Put), spermi-dine (Spd) and spermine (Spm)] in the modulation of plant responses to Cd and/or other heavy met-als. Nahar et al. [44] hypothesized that exogenous additions of 0.2 mM Put and/or nitric oxide could improve physiological processes to enhance toler-ance to Cd-toxicity for up to 2.0 mM in mung bean plants via coordinated effects on antioxidant and glyoxalase systems. Pretreatment with Put caused an increase in endogenous PA content and a de-
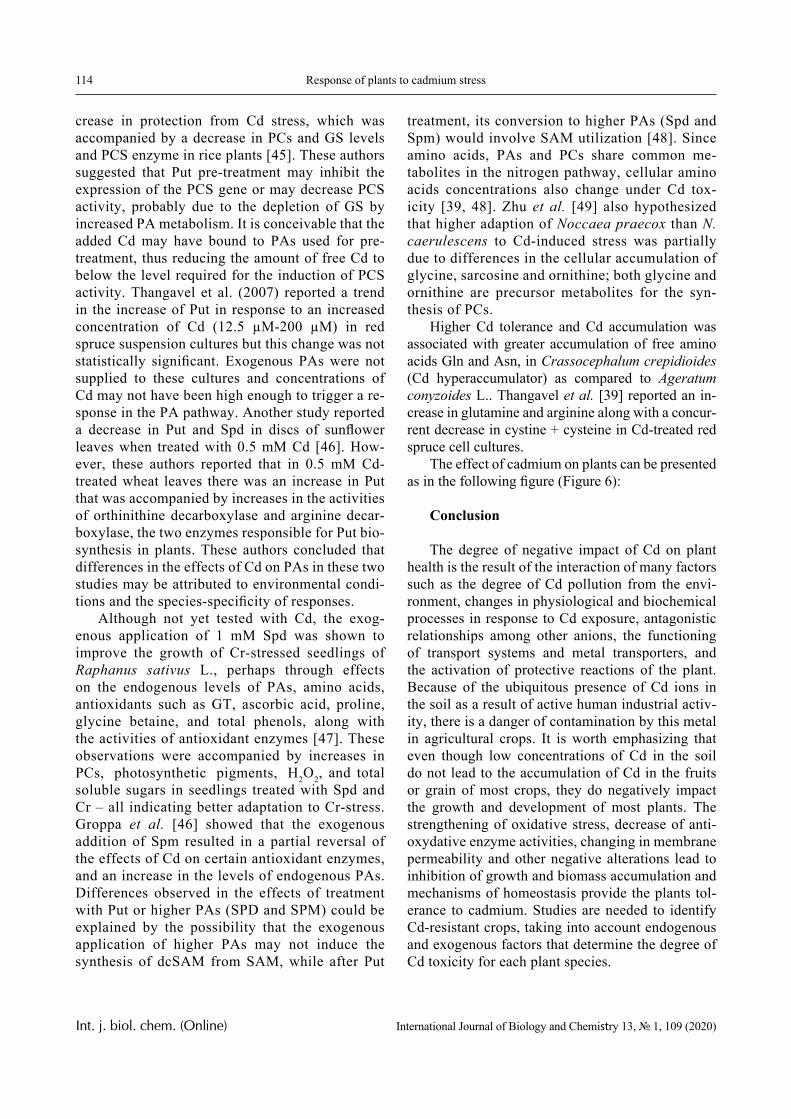
114 Response of plants to cadmium stress
Int. j. biol. chem. (Online) International Journal of Biology and Chemistry 13, № 1, 109 (2020)
crease in protection from Cd stress, which was accompanied by a decrease in PCs and GS levels and PCS enzyme in rice plants [45]. These authors suggested that Put pre-treatment may inhibit the expression of the PCS gene or may decrease PCS activity, probably due to the depletion of GS by increased PA metabolism. It is conceivable that the added Cd may have bound to PAs used for pre-treatment, thus reducing the amount of free Cd to below the level required for the induction of PCS activity. Thangavel et al. (2007) reported a trend in the increase of Put in response to an increased concentration of Cd (12.5 µM-200 µM) in red spruce suspension cultures but this change was not statistically significant. Exogenous PAs were not supplied to these cultures and concentrations of Cd may not have been high enough to trigger a re-sponse in the PA pathway. Another study reported a decrease in Put and Spd in discs of sunflower leaves when treated with 0.5 mM Cd [46]. How-ever, these authors reported that in 0.5 mM Cd-treated wheat leaves there was an increase in Put that was accompanied by increases in the activities of orthinithine decarboxylase and arginine decar-boxylase, the two enzymes responsible for Put bio-synthesis in plants. These authors concluded that differences in the effects of Cd on PAs in these two studies may be attributed to environmental condi-tions and the species-specificity of responses.
Although not yet tested with Cd, the exog-enous application of 1 mM Spd was shown to improve the growth of Cr-stressed seedlings of Raphanus sativus L., perhaps through effects on the endogenous levels of PAs, amino acids, antioxidants such as GT, ascorbic acid, proline, glycine betaine, and total phenols, along with the activities of antioxidant enzymes [47]. These observations were accompanied by increases in PCs, photosynthetic pigments, H2O2, and total soluble sugars in seedlings treated with Spd and Cr – all indicating better adaptation to Cr-stress. Groppa et al. [46] showed that the exogenous addition of Spm resulted in a partial reversal of the effects of Cd on certain antioxidant enzymes, and an increase in the levels of endogenous PAs. Differences observed in the effects of treatment with Put or higher PAs (SPD and SPM) could be explained by the possibility that the exogenous application of higher PAs may not induce the synthesis of dcSAM from SAM, while after Put
treatment, its conversion to higher PAs (Spd and Spm) would involve SAM utilization [48]. Since amino acids, PAs and PCs share common me-tabolites in the nitrogen pathway, cellular amino acids concentrations also change under Cd tox-icity [39, 48]. Zhu et al. [49] also hypothesized that higher adaption of Noccaea praecox than N. caerulescens to Cd-induced stress was partially due to differences in the cellular accumulation of glycine, sarcosine and ornithine; both glycine and ornithine are precursor metabolites for the syn-thesis of PCs.
Higher Cd tolerance and Cd accumulation was associated with greater accumulation of free amino acids Gln and Asn, in Crassocephalum crepidioides (Cd hyperaccumulator) as compared to Ageratum conyzoides L.. Thangavel et al. [39] reported an in-crease in glutamine and arginine along with a concur-rent decrease in cystine + cysteine in Cd-treated red spruce cell cultures.
The effect of cadmium on plants can be presented as in the following figure (Figure 6):
Conclusion
The degree of negative impact of Cd on plant health is the result of the interaction of many factors such as the degree of Cd pollution from the envi-ronment, changes in physiological and biochemical processes in response to Cd exposure, antagonistic relationships among other anions, the functioning of transport systems and metal transporters, and the activation of protective reactions of the plant. Because of the ubiquitous presence of Cd ions in the soil as a result of active human industrial activ-ity, there is a danger of contamination by this metal in agricultural crops. It is worth emphasizing that even though low concentrations of Cd in the soil do not lead to the accumulation of Cd in the fruits or grain of most crops, they do negatively impact the growth and development of most plants. The strengthening of oxidative stress, decrease of anti-oxydative enzyme activities, changing in membrane permeability and other negative alterations lead to inhibition of growth and biomass accumulation and mechanisms of homeostasis provide the plants tol-erance to cadmium. Studies are needed to identify Cd-resistant crops, taking into account endogenous and exogenous factors that determine the degree of Cd toxicity for each plant species.
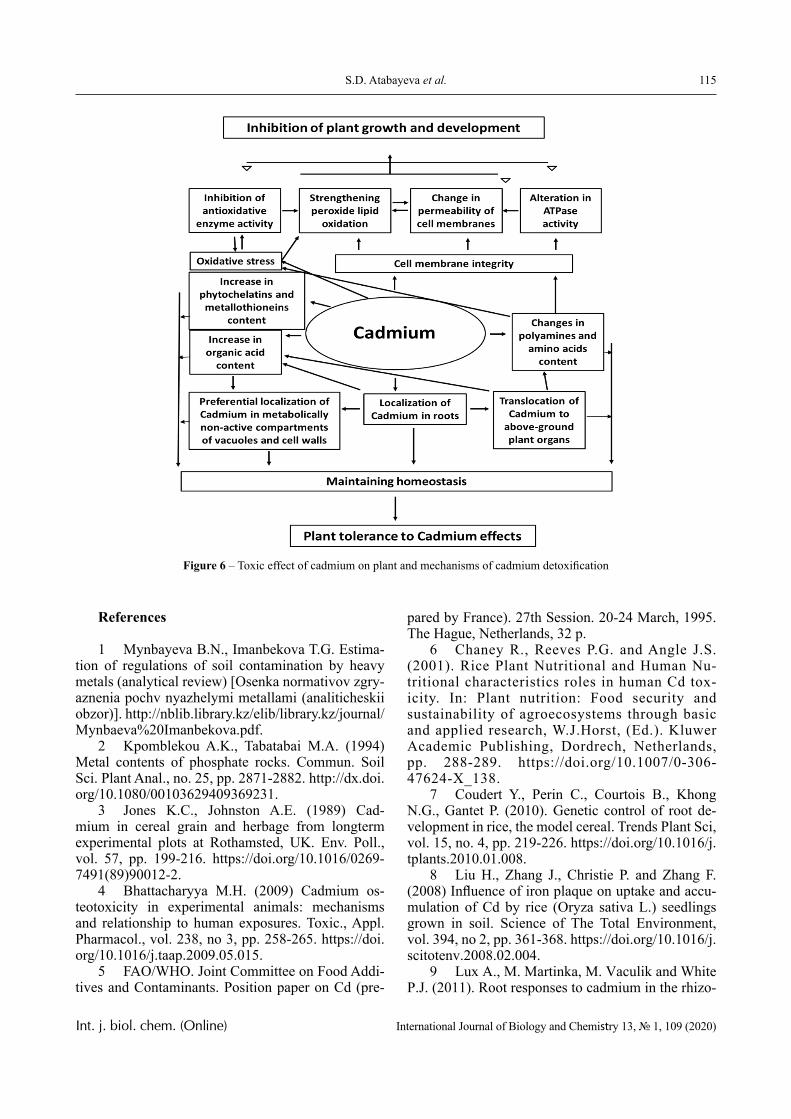
115S.D. Atabayeva et al.
Int. j. biol. chem. (Online) International Journal of Biology and Chemistry 13, № 1, 109 (2020)
References
1 Mynbayeva B.N., Imanbekova T.G. Estima-tion of regulations of soil contamination by heavy metals (analytical review) [Osenka normativov zgry-aznenia pochv nyazhelymi metallami (analiticheskii obzor)]. http://nblib.library.kz/elib/library.kz/journal/Mynbaeva%20Imanbekova.pdf.
2 Kpomblekou A.K., Tabatabai M.A. (1994) Metal contents of phosphate rocks. Commun. Soil Sci. Plant Anal., no. 25, pp. 2871-2882. http://dx.doi.org/10.1080/00103629409369231.
3 Jones K.C., Johnston A.E. (1989) Cad-mium in cereal grain and herbage from longterm experimental plots at Rothamsted, UK. Env. Poll., vol. 57, pp. 199-216. https://doi.org/10.1016/0269-7491(89)90012-2.
4 Bhattacharyya M.H. (2009) Cadmium os-teotoxicity in experimental animals: mechanisms and relationship to human exposures. Toxic., Appl. Pharmacol., vol. 238, no 3, pp. 258-265. https://doi.org/10.1016/j.taap.2009.05.015.
5 FAO/WHO. Joint Committee on Food Addi-tives and Contaminants. Position paper on Cd (pre-
pared by France). 27th Session. 20-24 March, 1995. The Hague, Netherlands, 32 p.
6 Chaney R., Reeves P.G. and Angle J.S. (2001). Rice Plant Nutritional and Human Nu-tritional characteristics roles in human Cd tox-icity. In: Plant nutrition: Food security and sustainability of agroecosystems through basic and applied research, W.J.Horst, (Ed.). Kluwer Academic Publishing, Dordrech, Netherlands, pp. 288-289. https://doi.org/10.1007/0-306-47624-X_138.
7 Coudert Y., Perin C., Courtois B., Khong N.G., Gantet P. (2010). Genetic control of root de-velopment in rice, the model cereal. Trends Plant Sci, vol. 15, no. 4, pp. 219-226. https://doi.org/10.1016/j.tplants.2010.01.008.
8 Liu H., Zhang J., Christie P. and Zhang F. (2008) Influence of iron plaque on uptake and accu-mulation of Cd by rice (Oryza sativa L.) seedlings grown in soil. Science of The Total Environment, vol. 394, no 2, pp. 361-368. https://doi.org/10.1016/j.scitotenv.2008.02.004.
9 Lux A., M. Martinka, M. Vaculik and White P.J. (2011). Root responses to cadmium in the rhizo-
Figure 6 – Toxic effect of cadmium on plant and mechanisms of cadmium detoxification
116 Response of plants to cadmium stress
Int. j. biol. chem. (Online) International Journal of Biology and Chemistry 13, № 1, 109 (2020)
sphere: a review. J Exp Bot., vol. 62, no. 1, pp. 21-37. https://doi.org/10.1093/jxb/erq281.
10 Yamaguchi N., Shikawa S. I, Abe T. et al. (2012). Role of the node in controlling traffic of cad-mium, zinc, and manganese in rice. Journal of experi-mental botany, vol. 63, no 7, pp. 2729-2737. https://doi.org/10.1093/jxb/err455.
11 Zou J., Yue J., and Liu D. (2012). Effects of cadmium stress on root tip cells and some physi-ological indexes in Allium cepa var. Agrogarum L. Acta Biologica Cravoviensia, no 54/1, pp. 129-141. https://doi.org/10.2478/v10182-012-0015-x
12 Shi Q., Wang J., Zou J. et al. (2016). Cad-mium localization and its toxic effects on root tips of barley. Zemdirbyste-Agriculture, vol. 103, no. 2, pp. 151-158. https://doi.org/10.13080/z-a.2016.103.020.
13 Ibrahim M.H., Chee Kong Y. and Mohd Zain N.A. (2017) Effect of Cadmium and Copper Expo-sure on Growth, Secondary Metabolites and Antioxi-dant Activity in the Medicinal Plant Sambung Nyawa (Gynura procumbens (Lour.) Merr). Molecules, vol. 22, no. 10, pp. 16-23. https://doi.org/10.3390/mol-ecules22101623.
14 Аtabayeva S.D., Zhardamalieva A., Nurma-hanova A. et al. (2014) Vlianie deistvia ionov kadmia na uroven’ POL I soderzhanie chlorophyllov u sortov pshenici (Triticum aestivum L.[Effect of cadmium on lipid peroxidation level and chlorophyll content in wheat (Triticum aestivum L.)]. Vestnik KazNU, vol. 60, no 1-2, pp. 167-171.
15 Aravind P., Prasad M.N.V. (2005) Cadmi-um-Zinc interactions in a hydroponic system using Cerathopyllum demersum L.: ada ptive ecophysiol-ogy, biochemistry and molecular toxicology. Brazil. J. Plant Physiol., vol.17, pp. 3-5. doi.org/10.1590/S1677-04202005000100002.
16 Choundury S., Panda S.K. (2005) Toxic ef-fects, oxidative stress and ultrastructural changes in moss Tuxithelium nepalense (Schwaegr.) Broth. Under chromium and lead phytotoxicity. Water, Air, Soil Pollut., vol. 167, pp. 73-90.
17 Gratao P.L., Monteiro C.C., Rossi M.L. et al. (2009) Differential ultrastructural changes in tomato hormonal mutants exposed to cadmium. Environ. Exp. Bot., vol. 67, pp. 387-394.
18 Semane B., Dupae J., Cuypers A. et al. (2010). Leaf proteome responses of Arabidopsis thaliana exposed to mild cadmium stress. Journal of Plant Physiology, vol. 167, no 4, pp. 247-254. https://doi.org/10.1016/j.jplph.2009.09.015.
19 Elobeid M., Polle A., Göbel C. and Feussner I. (2012). Cadmium interferes with auxin physiology and lignification in poplar. Journal of Experimental Botany, vol. 63, no 3, pp. 1413-1421. https://doi.org/10.1093/jxb/err384.
20 Vassilev A. and Lidon F. (2011). Cd-induced membrane damages and changes in soluble protein and free amino acid contents in young barley plants. Emirates Journal of Food and Agriculture, no. 23, pp. 130-136. http://ejfa.info/.
21 Verma R., Shekhawar G.S., Sharma F. et al. (2008). Cadmium induced oxidative stress and changes in soluble and ionically bound cell wall per-oxidase activities in roots of seedling and 3-4 leaf stage plants of Brassica juncea (L.) cern. Plant Cell Reports, vol. 27, pp. 1261-1269.
22 Grant C., Monreal M. A., Irvine R. B. et al. (2010) Preceding crop and phosphorus fertilization affect cadmium and zinc concentration of flaxseed under conventional and reduced tillage. Plant and Soil, vol. 333, pp. 337-350. https://doi.org/10.1007/s11104-010-0349-7.
23 Muehe E.M., Weigold P., Adaktylou I.J. et al. (2015) Rhizosphere microbial community compo-sition affects cadmium and zinc uptake by the metal-hyperaccumulating plant Arabidopsis halleri. Applied and environmental microbiology, vol. 81, no 6, pp. 2173-2181. https://doi.org/10.1128/AEM.03359-14.
24 Feng Shao J., Che J., Yamaji N. et al. (2017) Silicon reduces cadmium accumulation by suppress-ing expression of transporter genes involved in cad-mium uptake and translocation in rice. Journal of Experimental Botany, vol. 68, no 20, pp. 5641-5651. https://doi.org/10.1093/jxb/erx364.
25 Nakanishi H., Ogawa I., Ishimaru Y. et al. (2006) Iron deficiency enhances cadmium uptake and translocation mediated by the Fe2+ transporters OsIRT1 and OsIRT2 in rice. Soil Science and Plant Nutrition, vol. 52, no.4, pp. 464-469. https://doi.org/10.1111/j.1747-0765.2006.00055.x.
26 White P.J. and Broadley M.R. (2005) Biofor-tifying crops with essential mineral elements. Trends in Plant Science, vol. 10, no.12, pp. 586-593. https://doi.org/10.1016/j.tplants.2005.10.001.
27 Atabayeva S.D., Nurmakhanova A., Yernaz-arova G.E. et al. (2018) Effect of cadmium on min-eral composition of rice grain. Research on Crops, no. 19, pp. 569-575.
28 Thomine S., Wang R.C., Ward J. et al. (2000) Cadmium and iron transport by members of a plant metal transporter family in Arabidopsis with homol-ogy to Nramp genes. PNAS, no. 97, pp. 4991-4996. https://doi.org/10.1073/ pnas.97.9.4991.
29 Uraguchi S., Fujiwara T. (2012) Cadmium transport and tolerance in rice: perspectives for reduc-ing grain cadmium accumulation. Rice (New York, N.Y.), vol. 5, no. 1, 5 p. https://doi.org/10.1186/1939-8433-5-5.
30 Clemens S. (2001) Molecular mechanisms of plant metal tolerance and homeostasis. Planta,
117S.D. Atabayeva et al.
Int. j. biol. chem. (Online) International Journal of Biology and Chemistry 13, № 1, 109 (2020)
vol. 212, no. 4, pp. 475-486. https://doi.org/10.1007/s004250000458.
31 Kobayashi N.I., Tanoi K., Hirose A. and Nakanishi T.M. (2012) Characterization of rapid in-tervascular transport of cadmium in rice stem by ra-dioisotope imaging. Journal of Experimental Botany, vol. 64, no 2, pp. 507-517. https://doi.org/10.1093/jxb/ers344.
32 Goto F., Yoshihara T., Shigemoto N., et al. (1999) Iron fortification of rice seed by the soybean ferritin gene. Nature Biotechnology, vol.17, no 3, pp. 282-286. https://doi.org/10.1038/7029.
33 Ramesh S.A., Choimes S. and Schacht-man D.P. (2004) Over-Expression of an Arabidop-sis Zinc Transporter in Hordeum Vulgare Increases Short-Term Zinc Uptake after Zinc Deprivation and Seed Zinc Content. Plant Molecular Biology, vol. 54, no 3, pp. 373-385. https://doi.org/10.1023/B:PLAN.0000036370.70912.34.
34 Masuda H., Usuda K., Kobayashi T., et al. (2009). Overexpression of the Barley Nicotianamine Synthase Gene HvNAS1 Increases Iron and Zinc Con-centrations in Rice Grains. Rice, vol. 2, no. 4, pp. 155-166. https://doi.org/10.1007/s12284-009-9031-1.
35 Vasconcelos M., Clemente T. and Grusak M. (2014). Evaluation of constitutive iron reductase (AtFRO2) expression on mineral accumulation and distribution in soybean (Glycine max L). Frontiers in Plant Science, no 5, 112. https://doi.org/10.3389/fpls.2014.00112.
36 Seregin I.V., Ivanov V.B. (2001). Physio-logical Aspects of Cadmium and Lead Toxic Effects on Higher Plants. Russian Journal of Plant Physiol-ogy, no. 48, pp. 523-544. https://doi.org/10.1023/A%3A1016719901147.
37 Dai H.P., Shan C., Wei Y. Et Al. (2012). Subcellular localization of cadmium in Hyperaccu-mulator Populus × Canescens. African journal of bio-technology, No. 11(16), pp. 3779-3787. https://doi.org/10.5897/Ajb11.3491.
38 Gupta S.C., Goldsbrough P.B. (1991). Phy-tochelatin accumulation and cadmium tolerance in selected tomato cell lines. Plant Physiology, vol. 97, no. 1, pp. 306-312. https://doi.org/10.1104/pp.97.1.306.
39 Thangavel P., Long S., Minocha R. (2007) Changes in phytochelatins and their biosynthetic in-termediates in red spruce (Picea rubens Sarg.) cell suspension cultures under cadmium and zinc stress. Plant Cell, Tissue and Organ Culture, vol. 88, no 2, pp. 201-216. https://doi.org/10.1007/s11240-006-9192-1
40 Minocha R., Thangavel P., Dhankher O.P., et al. (2008) Separation and quantification of
monothiols and phytochelatins from a wide vari-ety of cell cultures and tissues of trees and other plants using high performance liquid chromatog-raphy. Journal of Chromatography A, vol. 1207, no. 1-2, pp. 72-83. https://doi.org/10.1016/j.chro-ma.2008.08.023
41 Rauser W.E. (1995) Phytochelatins and Re-lated Peptides (Structure, Biosynthesis, and Func-tion). Plant Physiology, vol. 109, no. 4, pp. 1141-1149. https://doi.org/10.1104/pp.109.4.114
42 Ahner B.A., Kong S., Morel F.M.M. (1995) Phytochelatin production in marine algae. 1. An inter-species comparison. Limnology and Oceanography, vol. 40. no. 4, pp. 649-657. https://doi.org/10.4319/lo.1995.40.4.0649.
43 Klapheck S., Fliegner W. and Zimmer I. (1994) Hydroxymethyl-phytochelatins [(gamma-glutamylcysteine)n-serine] are metal-induced pep-tides of the Poaceae. Plant Physiol, vol.104, no. 4, pp. 1325-1332. https://doi.org/10.1104/pp.104.4.1325.
44 Nahar K., Hasanuzzaman M., Alam M.M. et al. (2016) Polyamine and nitric oxide crosstalk: An-tagonistic effects on cadmium toxicity in mung bean plants through upregulating the metal detoxification, antioxidant defense and methylglyoxal detoxification systems. Ecotoxicology and Environmental Safety, vol. 126, pp. 245-255. https://doi.org/10.1016/j.ecoenv.2015.12.026.
45 Pál M., Csavas G., Szalai G., et al. (2017) Polyamines may influence phytochelatin syn-thesis during Cd stress in rice. J Hazard Mater, vol. 340, pp. 272-280. https://doi.org/10.1016/j.jhazmat.2017.07.016.
46 Groppa M.D., Tomaro M.L. and Benavides M.P. (2007) Polyamines and heavy metal stress: the antioxidant behavior of spermine in cadmium- and copper-treated wheat leaves. BioMetals, vol. 20, no. 2, pp. 185-195. https://doi.org/10.1007/s10534-006-9026-y.
47 Choudhary S.P., Kanwar M., Bhardwaj R. (2012). Chromium stress mitigation by polyamine-brassinosteroid application involves phytohormonal and physiological strategies in Raphanus sativus L. PLOS ONE, vol. 7, no. 3, e33210. https://doi.org/10.1371/journal.pone.0033210.
48 Minocha R., Majumdar R. and Minocha S.C. (2014) Polyamines and abiotic stress in plants: A complex relationship. Frontiers in plant science, no. 5. https://doi.org/10.3389/fpls.2014.00175.
49 Zhu G., Xiao H., Guo Q. et al. (2018). Effects of cadmium stress on growth and amino acid me-tabolism in two Compositae plants. Ecotoxicology and Environmental Safety, vol. 158, pp. 300-308. https://doi.org/10.1016/j.ecoenv.2018.04.045.
© 2020 al-Farabi Kazakh National University Int. j. biol. chem. (Online)
International Journal of Biology and Chemistry 13, № 1, 118 (2020)
IRSTI 31.27.21; 31.27.51; 34.39.01 https://doi.org/10.26577/ijbch.2020.v13.i1.12
G.T. Zhumaliyeva1*, E.K. Makashev2 , A.I. Zhussupova1 , S.N. Abdreshov1,2 , G.A. Demchenko2
1Al-Farabi Kazakh National University, Almaty, Kazakhstan 2Institute of Human and Animal Physiology, Almaty, Kazakhstan
*e-mail: [email protected]
Selected Kazakhstani plants with possible lymphatic properties
Abstract. Search for drugs that affect the functions of the lymphatic system in normal state and under various pathologies is extremely relevant and important. Intensive research is being conducted worldwide based on the idea of influencing any pathological process through the lymphatic system. One promising strategy is the use of herbal medicines as integrative, complementary and preventive therapy. The active components in medical plants have always been an important source of clinical therapeutics and their molecular pharmacology offers a great chemical diversity with often multi-pharmacological activity. In this review, we mainly analyzed the immunomodulating/anti-inflammatory and antioxidant activity of important Kazakhstani plants (Ribes nigrum, Crataegus almaatensis, Ziziphora bungeana, Alhagi kirgisorum, Rosa majalis, Hypericum perforatum, and Bergеnia crassifоlia). These plants have industrial reserves on the territory of Kazakhstan, and they have been used in traditional medicine since ancient times and are approved for use in official medicine. They are characterized by a high content of polyphenols, polysaccharides which have a stimulating effect on the lymphatic flow and promote the activation of the synthesizing apparatus and mitochondria in lymphoid cells and macrophages in the regional lymph nodes. In addition, they have a stimulating effect on the cellular composition of the lymph node and other synergistically acting biologically active compounds necessary for treatment and prevention of lymphatic system diseases. Key words: Ribes nigrum, Crataegus almaatensis, Ziziphora bungeana, Alhagi kirgisorum, Rosa majalis, Hypericum perforatum, Bergеnia crassifоlia.
Introduction
The immune system is the body’s defense sys-tem. Without a properly functioning immune system, the body quickly succumbs to infection [1].
The lymphatic system and immune system are closely linked. The lymphatic system compris-es a network of vessels and nodes that circulate immune cells and provide a site for antigen pre-sentation and immune activation. Lymphatic ves-sels transport lymph, a fluid containing infection-fighting white blood cells, from body tissues into lymph ducts that drain into lymph nodes. Lymph nodes are small, oval-shaped nodes that are found in clusters on either side of the neck, collar bone, armpits and groin. Lymphatic vessels run along-side arteries and veins connecting lymph nodes throughout the body. Having several times more
vessels (Figure 1), the lymphatic system in the hu-man body plays no less important role than the cir-culatory system [2; 3].
Since the lymph is derived from the interstitial fluid, its composition continually changes as the blood and the surrounding cells continually exchange substances with the interstitial fluid. It is generally similar to blood plasma, which is the fluid component of blood. Lymph returns proteins and excess intersti-tial fluid to the bloodstream. Lymph also transports fats from the digestive system (beginning in the lac-teals) to the blood via chylomicrons [4].
Bacteria may enter the lymph channels and be transported to lymph nodes, where they are destroyed. Metastatic cancer cells can also be transported via lymph. In various pathological conditions, it delivers products of metabolism, necrobiosis, and other toxic substances from tissues into the blood. [5-7].
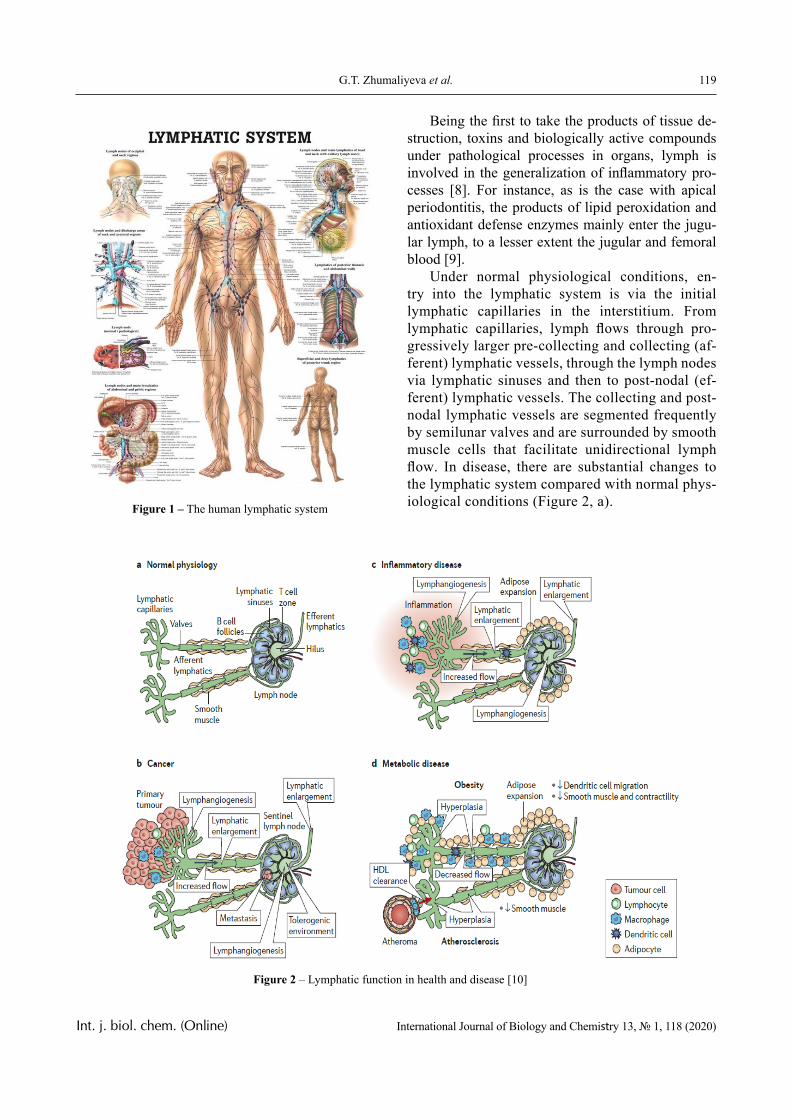
119G.T. Zhumaliyeva et al.
Int. j. biol. chem. (Online) International Journal of Biology and Chemistry 13, № 1, 118 (2020)
Figure 1 – The human lymphatic system
Being the first to take the products of tissue de-struction, toxins and biologically active compounds under pathological processes in organs, lymph is involved in the generalization of inflammatory pro-cesses [8]. For instance, as is the case with apical periodontitis, the products of lipid peroxidation and antioxidant defense enzymes mainly enter the jugu-lar lymph, to a lesser extent the jugular and femoral blood [9].
Under normal physiological conditions, en-try into the lymphatic system is via the initial lymphatic capillaries in the interstitium. From lymphatic capillaries, lymph flows through pro-gressively larger pre-collecting and collecting (af-ferent) lymphatic vessels, through the lymph nodes via lymphatic sinuses and then to post-nodal (ef-ferent) lymphatic vessels. The collecting and post-nodal lymphatic vessels are segmented frequently by semilunar valves and are surrounded by smooth muscle cells that facilitate unidirectional lymph flow. In disease, there are substantial changes to the lymphatic system compared with normal phys-iological conditions (Figure 2, a).
Figure 2 – Lymphatic function in health and disease [10]
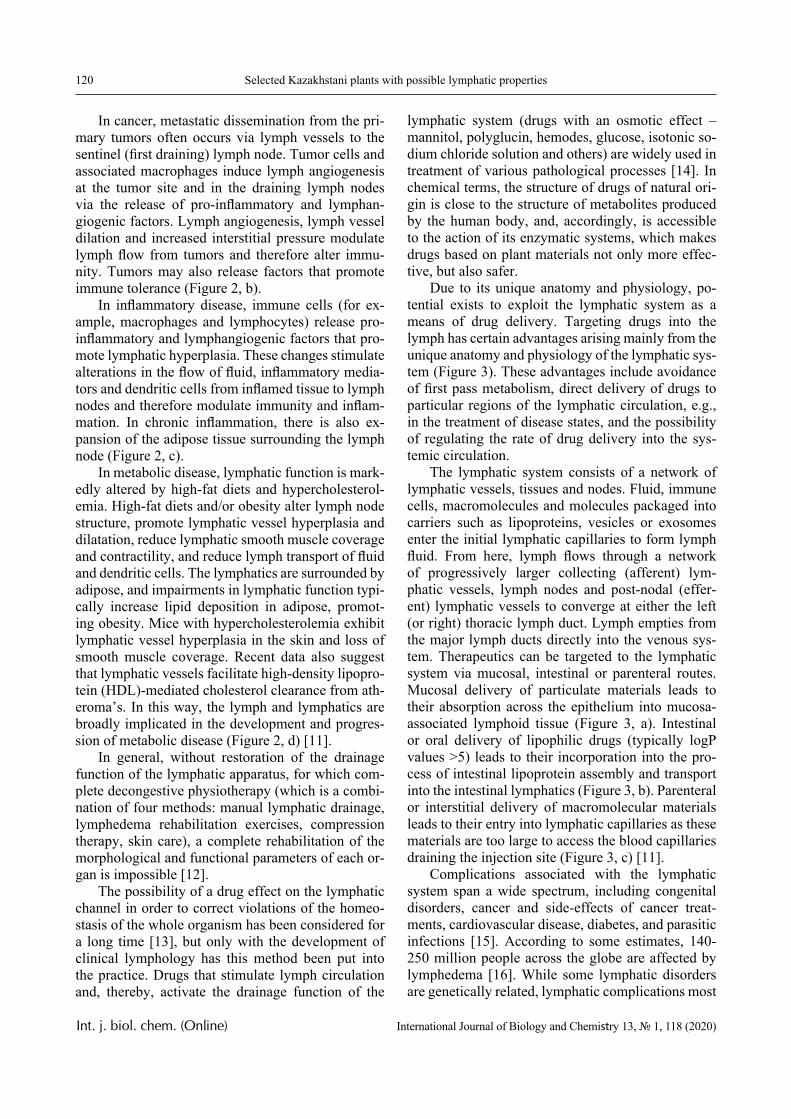
120 Selected Kazakhstani plants with possible lymphatic properties
Int. j. biol. chem. (Online) International Journal of Biology and Chemistry 13, № 1, 118 (2020)
In cancer, metastatic dissemination from the pri-mary tumors often occurs via lymph vessels to the sentinel (first draining) lymph node. Tumor cells and associated macrophages induce lymph angiogenesis at the tumor site and in the draining lymph nodes via the release of pro-inflammatory and lymphan-giogenic factors. Lymph angiogenesis, lymph vessel dilation and increased interstitial pressure modulate lymph flow from tumors and therefore alter immu-nity. Tumors may also release factors that promote immune tolerance (Figure 2, b).
In inflammatory disease, immune cells (for ex-ample, macrophages and lymphocytes) release pro-inflammatory and lymphangiogenic factors that pro-mote lymphatic hyperplasia. These changes stimulate alterations in the flow of fluid, inflammatory media-tors and dendritic cells from inflamed tissue to lymph nodes and therefore modulate immunity and inflam-mation. In chronic inflammation, there is also ex-pansion of the adipose tissue surrounding the lymph node (Figure 2, c).
In metabolic disease, lymphatic function is mark-edly altered by high-fat diets and hypercholesterol-emia. High-fat diets and/or obesity alter lymph node structure, promote lymphatic vessel hyperplasia and dilatation, reduce lymphatic smooth muscle coverage and contractility, and reduce lymph transport of fluid and dendritic cells. The lymphatics are surrounded by adipose, and impairments in lymphatic function typi-cally increase lipid deposition in adipose, promot-ing obesity. Mice with hypercholesterolemia exhibit lymphatic vessel hyperplasia in the skin and loss of smooth muscle coverage. Recent data also suggest that lymphatic vessels facilitate high-density lipopro-tein (HDL)-mediated cholesterol clearance from ath-eroma’s. In this way, the lymph and lymphatics are broadly implicated in the development and progres-sion of metabolic disease (Figure 2, d) [11].
In general, without restoration of the drainage function of the lymphatic apparatus, for which com-plete decongestive physiotherapy (which is a combi-nation of four methods: manual lymphatic drainage, lymphedema rehabilitation exercises, compression therapy, skin care), a complete rehabilitation of the morphological and functional parameters of each or-gan is impossible [12].
The possibility of a drug effect on the lymphatic channel in order to correct violations of the homeo-stasis of the whole organism has been considered for a long time [13], but only with the development of clinical lymphology has this method been put into the practice. Drugs that stimulate lymph circulation and, thereby, activate the drainage function of the
lymphatic system (drugs with an osmotic effect – mannitol, polyglucin, hemodes, glucose, isotonic so-dium chloride solution and others) are widely used in treatment of various pathological processes [14]. In chemical terms, the structure of drugs of natural ori-gin is close to the structure of metabolites produced by the human body, and, accordingly, is accessible to the action of its enzymatic systems, which makes drugs based on plant materials not only more effec-tive, but also safer.
Due to its unique anatomy and physiology, po-tential exists to exploit the lymphatic system as a means of drug delivery. Targeting drugs into the lymph has certain advantages arising mainly from the unique anatomy and physiology of the lymphatic sys-tem (Figure 3). These advantages include avoidance of first pass metabolism, direct delivery of drugs to particular regions of the lymphatic circulation, e.g., in the treatment of disease states, and the possibility of regulating the rate of drug delivery into the sys-temic circulation.
The lymphatic system consists of a network of lymphatic vessels, tissues and nodes. Fluid, immune cells, macromolecules and molecules packaged into carriers such as lipoproteins, vesicles or exosomes enter the initial lymphatic capillaries to form lymph fluid. From here, lymph flows through a network of progressively larger collecting (afferent) lym-phatic vessels, lymph nodes and post-nodal (effer-ent) lymphatic vessels to converge at either the left (or right) thoracic lymph duct. Lymph empties from the major lymph ducts directly into the venous sys-tem. Therapeutics can be targeted to the lymphatic system via mucosal, intestinal or parenteral routes. Mucosal delivery of particulate materials leads to their absorption across the epithelium into mucosa-associated lymphoid tissue (Figure 3, a). Intestinal or oral delivery of lipophilic drugs (typically logP values >5) leads to their incorporation into the pro-cess of intestinal lipoprotein assembly and transport into the intestinal lymphatics (Figure 3, b). Parenteral or interstitial delivery of macromolecular materials leads to their entry into lymphatic capillaries as these materials are too large to access the blood capillaries draining the injection site (Figure 3, c) [11].
Complications associated with the lymphatic system span a wide spectrum, including congenital disorders, cancer and side-effects of cancer treat-ments, cardiovascular disease, diabetes, and parasitic infections [15]. According to some estimates, 140-250 million people across the globe are affected by lymphedema [16]. While some lymphatic disorders are genetically related, lymphatic complications most
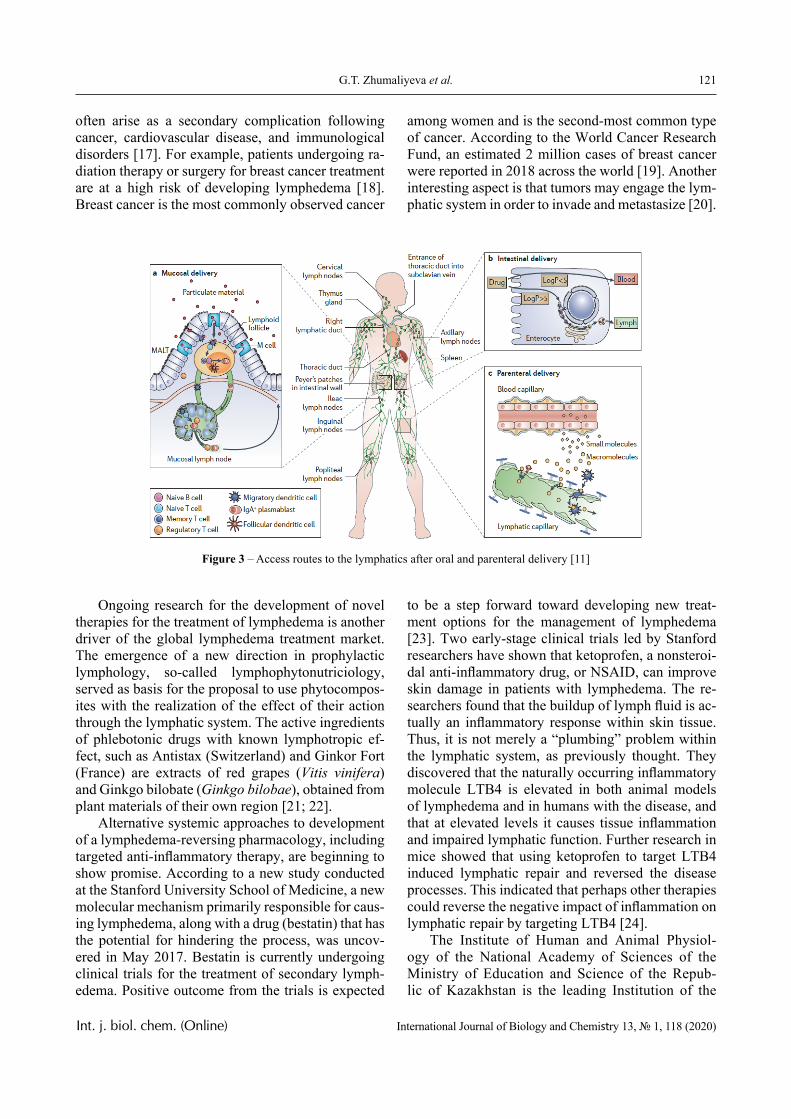
121G.T. Zhumaliyeva et al.
Int. j. biol. chem. (Online) International Journal of Biology and Chemistry 13, № 1, 118 (2020)
often arise as a secondary complication following cancer, cardiovascular disease, and immunological disorders [17]. For example, patients undergoing ra-diation therapy or surgery for breast cancer treatment are at a high risk of developing lymphedema [18]. Breast cancer is the most commonly observed cancer
among women and is the second-most common type of cancer. According to the World Cancer Research Fund, an estimated 2 million cases of breast cancer were reported in 2018 across the world [19]. Another interesting aspect is that tumors may engage the lym-phatic system in order to invade and metastasize [20].
Figure 3 – Access routes to the lymphatics after oral and parenteral delivery [11]
Ongoing research for the development of novel therapies for the treatment of lymphedema is another driver of the global lymphedema treatment market. The emergence of a new direction in prophylactic lymphology, so-called lymphophytonutriciology, served as basis for the proposal to use phytocompos-ites with the realization of the effect of their action through the lymphatic system. The active ingredients of phlebotonic drugs with known lymphotropic ef-fect, such as Antistax (Switzerland) and Ginkor Fort (France) are extracts of red grapes (Vitis vinifera) and Ginkgo bilobate (Ginkgo bilobae), obtained from plant materials of their own region [21; 22].
Alternative systemic approaches to development of a lymphedema-reversing pharmacology, including targeted anti-inflammatory therapy, are beginning to show promise. According to a new study conducted at the Stanford University School of Medicine, a new molecular mechanism primarily responsible for caus-ing lymphedema, along with a drug (bestatin) that has the potential for hindering the process, was uncov-ered in May 2017. Bestatin is currently undergoing clinical trials for the treatment of secondary lymph-edema. Positive outcome from the trials is expected
to be a step forward toward developing new treat-ment options for the management of lymphedema [23]. Two early-stage clinical trials led by Stanford researchers have shown that ketoprofen, a nonsteroi-dal anti-inflammatory drug, or NSAID, can improve skin damage in patients with lymphedema. The re-searchers found that the buildup of lymph fluid is ac-tually an inflammatory response within skin tissue. Thus, it is not merely a “plumbing” problem within the lymphatic system, as previously thought. They discovered that the naturally occurring inflammatory molecule LTB4 is elevated in both animal models of lymphedema and in humans with the disease, and that at elevated levels it causes tissue inflammation and impaired lymphatic function. Further research in mice showed that using ketoprofen to target LTB4 induced lymphatic repair and reversed the disease processes. This indicated that perhaps other therapies could reverse the negative impact of inflammation on lymphatic repair by targeting LTB4 [24].
The Institute of Human and Animal Physiol-ogy of the National Academy of Sciences of the Ministry of Education and Science of the Repub-lic of Kazakhstan is the leading Institution of the
122 Selected Kazakhstani plants with possible lymphatic properties
Int. j. biol. chem. (Online) International Journal of Biology and Chemistry 13, № 1, 118 (2020)
Kazakh Physiological Society, key organization in the Republic of Kazakhstan engaged in detailed studies of the activity of the lymphatic system, its morphofunctional state and direct relationship with various pathologies of metabolism, cardiovascu-lar system, digestive tract, as well as the effects of weightlessness on the structure and function of lym-phoid organs. A number of studies are conducted with leading organizations of near and far abroad, in particular with the Scientific Research Institute of Clinical and Experimental Lymphology SB RAMS [25; 26].
The consumption of certain complex natural sub-stances derived from plants is widely accepted for their protective role in microvascular and lymphatic physiological functionality. Among the natural sub-stances demonstrated to maintain microvascular and lymphatic homeostasis, our attention was focused on polyphenolic compounds, such as flavonoids, sapo-nins and polysaccharides.
As is known, polyphenols have a stimulating ef-fect on the lymphatic flow and promote the activa-tion of the synthesizing apparatus and mitochondria in lymphoid cells and macrophages in the regional lymph nodes, and have a stimulating effect on the cellular composition of the lymph node [27].
Flavonoids are plant secondary metabolites to which such pharmacological functions as antioxi-dant, anti-mutagenic, antibacterial, anti-angiogenic, anti-inflammatory, anti-allergic, enzyme modula-tion, and anti-cancer are attributed. They are known as phytochemicals that exist either as free aglycones or glyosidic conjugates. Flavonoids are polyphenolic with a wide range of structures. they are categorized mainly into flavones, flavanols, isoflavones, flava-nols, flavanones, flavanonols, and chalcones. The di-verse structures of flavonoids have resulted in many properties including anti-cancer and anti-inflamma-tory effects. Recently, it has been shown that flavo-noids can affect immune system response and might have immune-modulator effects [28].
Flavonoids like daflon, a combination of two fla-vonoids – hesperidin and diosmin, increase the inten-sity and frequency of lymphatic contraction and the total number of lymphatic capillaries. This results in the decrease of adhesion, migration, and activation of leukocytes, leading to lowering of prostaglandin’s PGE2 and PGF2a and the reduction of radical oxy-gen species [29].
Rutin inhibits platelet aggregation and decreas-es capillary permeability, improving circulation. Among the other protective activities, rutin has anti-inflammatory and anti adipogenic activity [30].
Flavonoids possess different mechanisms of an-tioedemic action. It was determined that diosmin ex-erts a direct influence upon the functional state of the lymphatic system, activating proliferation of the lym-phatic endothelium by means of gemmation, which leads to the formation of new capillary lymphatic networks with the resulting increase in both the total absorption area of the lymphatic capillary networks and the volume of lymph reabsorption. Troxerutin acts predominantly on the endothelium of blood cap-illaries, decreasing permeability in the arterial seg-ment of the capillary, thus lowering the total volume of fluid in the interstitial space and accordingly the load on the lymphatic system [31].
Benzopyrones also have a variety of benefi-cial effects on the body. For example, they increase lymph drainage, reduce the fragility of capillaries. Of these, the first is coumarin (5,6-benzo-α-pyron). In Australia, coumarin is available on the market under the name “Lodema as 200 mg tablets, as well as 10% ointment. There are other oral forms of coumarin on the pharmaceutical market. For example, Venium (Limex containing 100 mg of coumarin) is produced in Switzerland and Liz Edem (15 mg of coumarin) is produced in France. There is also a drug known as Venalot-Depot (Germany), which contains 15 mg of coumarin and 90 mg of troxerutin. In addition, sapo-nins (escin and horsechestnut extract), plant extracts (anthocyanosides – blueberries, proanthotonidols – preparations from grape seeds, Ginkgo extract), and synthetic drugs (calcium dobsilate, tribenoside, etc.) are used [32]. Polysaccharides also have positive ef-fect on the circulatory and lymphatic systems [33].
In order to develop our own knowledge base, we started looking at the valuable properties of Kazakh-stani plants with possible lymphatic properties. In this regard, valuable parts of seven medicinal plants (i.e. leaves of Ribes nigrum, fruits of Crataegus almaa-tensis, Ziziphora bungeana and Alhagi kirgisorum grass, fruits of Rosa majalis, Hypericum perforatum grass, and leaves and roots of Bergеnia crassifоlia) caught our special attention. These plants occur in abundance on the territory of Kazakhstan, and they have been used in traditional medicine since ancient times and are approved for use in official medicine (monographs on them are available in world pharma-copoeias). They are characterized by a high content of polyphenols, polysaccharides and other synergisti-cally acting biologically active compounds necessary for treatment and prevention of lymphatic system diseases.
Blackcurrant (Ribes nigrum) is a berry that be-longs to the family Grossulariaceae. It includes 150
123G.T. Zhumaliyeva et al.
Int. j. biol. chem. (Online) International Journal of Biology and Chemistry 13, № 1, 118 (2020)
cultivars and is one of the most common woody shrubs in the world. Ribes nigrum has a well-de-served demand because its fruits have dietary and medicinal properties. Blackcurrant contains a com-plex of significant biologically active compounds. Its leaves are rich in ascorbic acid (up to 470 mg%), carotene, polyphenols, phytoncides and essential oils. Due to its rich chemical composition, blackcur-rant leaves are of much interest as a source of plant material, which, among other properties, display high antioxidant activity [34]. Experimental data show that consumption of blackcurrant juice prevents the development of oxidative stress, improves the state of vascular endothelium, and protects the erythrocyte membranes from destruction when exposed to free oxygen and ultraviolet radiation [35; 36]. Therefore, the extract obtained from the leaves of blackcurrant is a valuable component of the synthetic drug. Its su-gar composition includes more fructose (4.2%), less glucose (1.5%) and sucrose (1.0%). Non-digestible carbohydrates are represented by fiber (up to 3%) and pectins (up to 1.5%). An important property of pec-tins is their ability to adsorb bacterial toxins, heavy metal ions, including radionuclides. In addition, pectins bind and remove cholesterol from the body, preventing the development of atherosclerosis and the oxidation of ascorbic acid and catechins in fresh fruits. Organic acids in blackcurrant fruits are mainly citric acid (2.0%); they also contain malic (0.25%) and oxalic (0.06%) acids. They have a positive effect on digestion by increasing the secretion of gastric glands and intestinal peristalsis [37].
Blackcurrant berries are rich in polyphenols, which range from 488 to 1116 mg and significant-ly determine their taste, nutritional and medicinal value. Ripe fruits are also a rich source of anthoc-yanins. The anthocyanin complex of black currant includes four main components: 3-glucosides and 3-rutinosides of delphinidine and cyanidine. These components ocur in all varieties of R. nigrum with black color, regardless of the variety and growing region. Anthocyanins have capillary-strengthening activity, antioxidant, antibacterial, anticarcinogenic properties and are effectively used in medicine for the treatment and prevention of a host of diseases. The beneficial properties of anthocyanins, cyani-dins and their glycosides are due to their ability to scavenge free radicals, including the reactive oxy-gen species [38].
Almaty hawthorn (Crataegus almaatensis Po-jark) is an endemic plant that grows only in the foot-hills of Zailiysky Alatau, Almaty region, Kazakhstan. Hawthorn fruits contain the flavonoids hyperoside,
quercetin, vitexin, triterpene saponins, acids, proan-thocyanides of various degrees of polymerization re-lated to condensed tannins. They also contain a large number of such beneficial organic acids as ascorbic, tartaric, citric, malic, caffeic, chlorogenic, and vita-mins (K, C, F, B) and trace elements (K, Ca, Mg, Fe, Mn, Zn) [39; 40]. Its extracts are used for treat-ment of cardiovascular disorders, such as arrhythmia, myocardial infarction, heart failure, as well as a hy-potensive and diuretic drug [4].
Broad range of biological activities of Almaty hawthorn, such as anti-inflammatory, antioxidant, vasodilator, positive inotropic and cholesterol syn-thesis inhibiting properties has been described as be-ing important for medical practices. These activities are significantly affected by the presence of antioxi-dant molecules in the extracts of hawthorn, which have the ability to absorb free radicals formed as a result of biochemical and physiological reactions in the human body. Furthemore, oligomeric procyani-dins, triterpenes, flavonoids, polysaccharides and catecholamines have been identified in hawthorn ex-tracts, and they are thought to have pharmacological potential [41; 42]. Fresh or dried fruits, flowers and leaves are used as a source of extracts for the pro-duction of various dosage forms of over-the-counter medicines or dietary supplements [43].
Ziziphora bungeana Juz. is found in meadows and highlands of Kazakhstan. Capsules obtained on its basis are used for treatment of various viral infec-tions of the upper respiratory tract; a preparation from its flavonoid fraction is recommended for treatment of cardiovascular diseases. Its chemical composition includes monoterpene essential oil, polyphenols and triterpenes [44]. Industrial reserves and cultivation capability, experience in traditional medicine and the rich chemical composition of Ziziphora suggest that its extract be added to the formulae.
The antibacterial and antiseptic activities of Ziziphora species are determined by their content of essential oils such as thymol and carvacrol. Some components of the essential oils of Ziziphora (terpin-olene, thymol, borneol, karyofillen, carvacrol) show antioxidant activity. Moreover, flavonoids from Ziziphora grass show antioxidant, anti-inflammatory and antitumor activity. Flavonoids such as chrysin, apigenin, linarin, luteolin have anti-inflammatory ef-fects [45].
Ziziphora extracts that had a high concentration of polyphenolic substances showed vasodilator ac-tivity. The presence of a 4-hydroxy group without methyl substitution in flavonoids and the absence of constant substitution at positions 5, 6 and 7 of the
124 Selected Kazakhstani plants with possible lymphatic properties
Int. j. biol. chem. (Online) International Journal of Biology and Chemistry 13, № 1, 118 (2020)
flavonoid structure are apparently responsible for the vasodilator effect [46].
The world flora includes 7 species of the genus Alhagi, of which 5 species grow in Central Asia: Alhagi pseudalhagi (M.Bieb.) Desv. ex Shap., Al-hagi sparsifolia Shop., Alhagi canescens (Regel) B. Keller & Shap., Alhagi kirghisorum Schrenk. and Alhagi persarum Boiss. & Buhse. The phytochemi-cal profile of two species (Alhagi pseudalhagi and Alhagi sparsifolia) have been most studied to date. These species of camel thorn have been shown to produce biologically active alkaloids, phenolic com-pounds and terpenoids. Kyrgyz camel thorn (Alhagi kirgisorum Schrenk.) grows in southern part of Ka-zakhstan. Polyphenols in the form of flavonols, their glycosides, phenolic acids, condensed tannins, and heteropolysaccharides were isolated from its aerial parts. On the basis of the substance “Alkhidin”, the following dosage forms were developed: alchidin ointment, 5%, “Zhantak” syrup, introduced into the medicine [47].
For the purpose of treatment the roots of the Kyrgyz camel thorn is recommended. Infusions and decoctions of yantak are widely used in traditional medicine as a diuretic, diaphoretic, and laxative. Its extract is widely used in medicine as an anti-inflam-matory and wound healing agent. The following phe-nolic compounds were isolated and identified from the aboveground part of Alhagi kirghisorum: gallic acid, (+)- catechin, narcissin and rutin. Gallic acid has strong antioxidant properties and also exhibits hepatoprotective properties when it is part of more complex substances. Catechin enhances the hepato-toxic effect of carbon tetrachloride, and it was found to increases the killer activity of T-lymphocytes. Nar-cissine can have an spasmolytic effects on the heart vessels, and is used in cardiological practice. Rutin is a strong antioxidant that prevents the formation of carcinogens, strengthens the walls of blood vessels, improves blood circulation, including blood circula-tion in the capillaries of the joints and spine, provides the flow of necessary nutrients to the joints, improv-ing their function [45; 47].
Rose hip (Rosa L.) is a genus of wild plants in the family Rosaceae. It is an erect, large-leaved shrub, reaching a height of 1-2 m. There are more than 120 species of wild rose that are widely distributed in Europe, Asia, the Middle East and North America. Plants are resistant to harsh environmental condi-tions (rocky and sloping terrain, poor soil, and lack of water). It is of great scientific interest as a source of biologically active compounds and is widely used as medicinal, vitamin and food raw materials. Its posi-
tive effect has been demonstrated in reducing the risk of cardiovascular diseases, various forms of cancer, diarrhea, bladder infection, and diabetes. Rosehip preparations have a wide pharmacological spectrum of action. They have a strong antioxidant, restorative effect, stimulate nonspecific resistance of the body, reduce vascular permeability, enhance hormone syn-thesis and tissue regeneration, and have anti-inflam-matory, immunostimulating, and choleretic proper-ties. In traditional medicine, fruits, flowers, leaves and roots of a plant are used [48; 49].
The value of rose hips is determined by a complex of such biologically active compounds as ascorbic acid, carotenoids, flavonoids (quercetin, kempferol, isocvercetin), catechins (epigallocatechin, gallocate-chin, epigallocatechin gallate), carbohydrates, organ-ic acids, vitamins of group B, K1, Pac, E, Pol, E, Pol, E, Pol, E, Pol , pectic substances, salts of potassium, sodium, calcium, magnesium, phosphorus, iron, etc. It is considered the richest natural source of vitamin C. In this case, the biological role of vitamin C is manifested in the presence of organic acids and P-active compounds, which include anthocyanins, cate-chins, leucoanthocyanins and flavonols, which differ in chemical composition, but have a similar effect on the human body. Flavonoids act as antioxidants and inactivate free radicals in the presence of metals. In the fruits of the plant genus Rosa L., they are repre-sented in particular by hyperoside, quercetin, rutin, astragalin, kaempferol-3-arabinoside, kaempferol-3-rhamnoglucoside, and others. Fruits Rosa maja-lis Herrm. are used as vitamin supplement [48; 49]. Fruits of May rose hips (Rosa majalis Herrn.) contain vitamins C, B2, K, E, provitamin A, polyphenols, a complex of higher organic acids with a predominant content of polyenes, and it is part of vitamin and multivitamin collection and Traskov’s anti-asthma potion, Hepar immunostimulant. The strongest anti-scurring agent, rosehip oil and Karotolin, used as wound healing agents, Holosas syrup, used for hepa-titis, cholecystitis, biliary dyskinesia, are obtained from the fruits of Rosa majalis. Drugs from rose hips are prescribed for disorders of carbohydrate metabo-lism and impaired functions of the bone marrow, liv-er and pancreas [49]. The immunostimulating prop-erties of the extract from Rosa majalis will contribute to such in new formulation.
St. John’s wort (Hypericum perforatum L.) is a promising source of such biologically active com-pounds as naphthodianthrones pigments and flavono-ids, widely used in traditional and scientific medici-ne, and it is included in the pharmacopeias of many countries. St John’s wort (Hypericum perforatum L.)
125G.T. Zhumaliyeva et al.
Int. j. biol. chem. (Online) International Journal of Biology and Chemistry 13, № 1, 118 (2020)
is widespread in Kazakhstan in the foothills of Zaili-ysky and Dzhungarsky Alatau, and it has been used in the treatment of genitourinary and gastrointesti-nal inflammations since ancient times. Both in folk and scientific medicine, preparations from St. John’s wort are used as astringents, anti-inflammatory and antiseptic agents for treatment of various wounds and burns. The chemical composition of plants of the ge-nus Hypericum L. is complex and diverse in the type of structures of biologically active compounds. Lead role in the therapeutic properties of the species of this genus is played by naphthodianthrones (anthraqui-nones), flavonoids and derivatives of hyperforin. Vi-tamins C, PP, carotenoids tone up, improve brain ac-tivity; flavonoids normalize the nervous system and positively affect reproductive function, which indi-cates the importance of including this component in the developed phytocomposite. St. John’s wort has a strong anti-inflammatory effect, including improving microcirculation and dissolves infiltrates that helps to cure serious diseases and the penetration of antibiot-ics to the source of infection. In homeopathic prac-tice, the entire St. John’s wort plant is used, as well as its individual parts as an analgesic, hemostatic and regenerating agent, as well as for lesions of the cen-tral and peripheral nervous systems [50; 51].
Badan thick-leaved (Bergenia crassifolia (L.) Fritsch) perennial herb of the family Saxifragaceae. Badan thick-leaved has industrial reserves in Eastern Kazakhstan. It contains up to 35% of mixture of py-rocatechol and pyrogall hydrolyzable tannins, gallic acid, vitamin C, carotenes, oxidized and reduced fla-vonoids, coumarins, mineral salts, essential oils and resins, trace elements Mn, Fe, Cu, and carbohydrates. By the content of glycoside arbutin (22%), badan is the richest plant source in the world. Infusions and decoctions from it are used to treat pulmonary tuber-culosis, throat diseases, rheumatism, diseases of the gastrointestinal tract, high blood pressure, as well as in gynecological practice as a hemostatic agent and for the treatment of cervical dysplasia [52]. A com-plex of biologically active compounds from this plant is appropriate for inclusion in the formulated drug. Badan refers to plants that accumulate tannins. Quite large amounts of tannins accumulate in the rhizomes of badan from 6 to 30%. Simple phenols, flavonoids, and catechins found in various parts are precursors of tannins and serve as building materials for polymeric phenols [53]. Modern pharmacological studies have revealed a number of medicinal properties of prepa-rations from the leaves of badan. Badan leaves are used for diseases of the digestive system (colitis, en-terocolitis, hyposecretory gastritis), allergies, and to normalize metabolism. The decoction of leaves has
an anti-hypoxic and choleretic effect, and it has an-tibacterial activity against gram-positive bacteria in gynecological practice to treat various bleedings. Dry leaves of badan are used for Mongolian tea, which has tonic properties, improves metabolism in the body and normalizes blood pressure [54]. Research to be continued.
Conclusion
The active components in medical plants have always represented an important source of clinical therapeutics since they offer tremendous chemical diversity that is often associated with a large num-ber of pharmacological activities and the absence of cumulative and side effects. Their use in traditional medicine for their properties and health benefits is well recognized since ancient times. In this paper our focus was on some biologically active compounds from selected Kazakhstani plants, which might be potentially valuable for creation of drug enhancing lymphotropic activity and immune status of the hu-man organism. Authors are thankful to Prof. Asim Esen Virginia Polytechnic Institute and State Uni-versity (Blacksburg, USA) for his kind assistance in preparing the manuscript.
References
1 McMahon S.B., La Russa F., Bennett D.L. (2015) Crosstalk between the nociceptive and im-mune systems in host defence and disease. Nat Rev Neurosci. vol. 16, no. 7, pp. 389‐402. https://doi.org/10.1038/nrn3946.
2 Andrade M.F.C.d, Jacomo A.L. (2007). Anatomy of the human lymphatic system. Cancer treatment and research. vol. 135, pp. 55-77.
3 Myers K., Hannah P. (2017). Manual of ve-nous and lymphatic diseases. CRC Press, 335 p.
4 The Editors of Encyclopaedia Britannica. Lymphatic system // Encyclopædia Britannica, inc. March 20, 2020. Available at: https://www.britan-nica.com/science/lymphatic-system.
5 Rudiger Anatomie. The human lymphatic system laminated anatomy chart, A-104187. Anato-my Warehouse, 2020. Available at: https://anatomy-warehouse.com/the-human-lymphatic-system-anato-my-chart-a-104187.
6 Chen J., Alexander J.S., Orr A.W. (2012) In-tegrins and their extracellular matrix ligands in lym-phangiogenesis and lymph node metastasis. Interna-tional Journal of Cell Biology, 853703.
7 Semyachkina-Glushkovskaya O., Postnov D., Kurths J. (2018). Blood-brain barrier, lymphatic
126 Selected Kazakhstani plants with possible lymphatic properties
Int. j. biol. chem. (Online) International Journal of Biology and Chemistry 13, № 1, 118 (2020)
clearance, and recovery: Ariadne’s thread in laby-rinths of hypotheses. International Journal of Mo-lecular Sciences. vol. 19, no. 12, 3818.
8 Sweeney M.D., Zlokovic B.V. (2018). A lym-phatic waste-disposal system implicated in Alzheim-er’s disease. Nature, vol. 560, no. 7717, pp.172-174.
9 Schwager S., Detmar M. (2019) Inflamma-tion and lymphatic function. Frontiers in Immunol-ogy. vol. 10, p. 308.
10 Bora C.R., Prabhu R.H., Patravale V.B. (2017). Lymphatic Delivery: concept, challenges and applications. Indian Drugs. vol. 54, pp. 5-22.
11 Trevaskis N.L., Kaminskas L.M., Porter C.J. (2015) From sewer to saviour – targeting the lym-phatic system to promote drug exposure and activity. Nat. Rev. Drug Discov. vol. 14, no. 11, pp. 781‐803. https://doi.org/10.1038/nrd4608.
12 I2. Tzani I., Tsichlaki M., Zerva E., Papatha-nasiou G., Dimakakos E. (2018). Physiotherapeutic rehabilitation of lymphedema: state-of-the-art. Lym-phology. vol. 51, pp. 1-12.
13 Oliveira M.M.F.d, Gurgel M.S.C., Amorim B.J., Ramos C.D., Derchain S., Furlan-Santos N., Santos C.C.d, Sarian L.O. (2018). Long term effects of manual lymphatic drainage and active exercises on physical morbidities, lymphoscintigraphy parameters and lymphedema formation in patients operated due to breast cancer: a clinical trial. PLOS ONE, vol. 13, no. 1, e0189176.
14 Solari E., Marcozzi C., Negrini D., Morion-do A. (2018). Fluid osmolarity acutely and differen-tially modulates lymphatic vessels intrinsic contrac-tions and lymph flow. Front. Physiol., vol. 9, no. 871. https://doi.org/10.3389/fphys.2018.00871.
15 Nazeh M. Al-Abd, Zurainee Mohamed Nor, Abdulelah H. Al-Adhroey, Anwar Suhaimi, S. Siva-nandam. (2013). Recent advances on the use of bio-chemical extracts as filaricidal agents. Evid Based Complement Alternat Med., 986573. https://doi.org/10.1155/2013/986573.
16 Lymphedema treatment market analy-sis by size, share, top key manufacturers, demand overview, regional outlook and growth forecast to 2026. Available at: https://coleofduty.com/military-news/2020/04/22/lymphedema-treat-ment-market-analysis-by-size-share-top-key-man-ufacturers-demand-overview-regional-outlook-and-growth-forecast-to-2026/, 22 April 2020.
17 Alderfer L., Wei A., Hanjaya-Putra D. (2018). Lymphatic tissue engineering and regen-eration. J Biol Eng. vol. 12, no. 32. https://doi.org/10.1186/s13036-018-0122-7.
18 Fu M.R. (2014) Breast cancer-related lymph-edema: Symptoms, diagnosis, risk reduction, and
management. World. J Clin. Oncol. vol. 5, no. 3, pp. 241‐247. https://doi.org/10.5306/wjco.v5.i3.241.
19 Bray F., Ferlay J., Soerjomataram I., Siegel R.L., Torre L.A., Jemal A. (2018). Global cancer statistics 2018: GLOBOCAN estimates of incidence and mortality worldwide for 36 cancers in 185 coun-tries CA Cancer J Clin., http://dx.doi.org/10.3322/caac.21492.
20 Jones D. (2020). Parallels of resistance be-tween angiogenesis and lymphangiogenesis inhibi-tion in cancer therapy. Cells, vol. 9, no. 3, p. 762, https://doi.org/10.3390/cells9030762.
21 Stücker M., Rabe E., Meyer K., Ottillinger B., Schütt T. (2019). Therapeutic approach to chron-ic venous insufficiency – clinical benefits of red-vine-leaf-extract AS 195 (Antistax®). Pharmazie, vol. 74, no. 4, pp. 193‐200. https://doi.org/10.1691/ph.2019.9326.
22 Pokrovskii A.V., Sapelkin S.V., Galak-tionova L.A., Fedorov E.E. (2005). The assess-ment of medical therapy effectiveness of patients with lower limb chronic venous insufficiency: the results of prospective study with Ginkor Fort. [rus.]. Angiology and Vascular Surgery. vol. 11, no. 3, pp. 47‐52.
23 Tian W., Rockson S.G., Jiang X., et al. (2017) Leukotriene B4 antagonism ameliorates experimen-tal lymphedema. Science Translational Medicine, vol. 9, no. 389, eaal3920. https://doi.org/10.1126/sci-translmed.aal3920.
24 Rockson SG., et al. (2018). Pilot studies demonstrate the potential benefits of antiinflamma-tory therapy in human lymphedema. JCI Insight. vol. 3, no. 20, e123775.
25 Bulekbaeva L.E., Ilyin E.A., Erofeeva L.M., Demchenko G.A., Gorchakova O.V. (2015). State microstructure lymphoid nodules of the small intes-tine of mice on the background of the 30-day space flight / HABERLERI, proceedings of the National Academy of Sciences of the Republic of Kazakhstan, vol. 4, no. 310, pp. 9-12.
26 Demchenko G.A., Abdreshov S.N. & Nur-makhanova B.A. (2019) Contractile activity of lymph nodes in young, middle-aged, and old rats. Bull. Exp. Biol. Med., vol. 167, pp. 194-197. https://doi.org/10.1007/s10517-019-04489-x.
27 Yahfoufi N., Alsadi N., Jambi M., Matar C. (2018). The immunomodulatory and anti-inflamma-tory role of polyphenols. Nutrients, vol. 10, no. 11, p. 1618.
28 Hosseinzade A., Sadeghi O., Naghdi-pour Biregani A., et. al. (2019). Immunomodula-tory Effects of Flavonoids: Possible Induction of T CD4+ Regulatory Cells Through Suppression
127G.T. Zhumaliyeva et al.
Int. j. biol. chem. (Online) International Journal of Biology and Chemistry 13, № 1, 118 (2020)
of mTOR Pathway Signaling Activity. Front. Im-munol., vol. 10, p. 51. https://doi.org/10.3389/fimmu.2019.00051.
29 Lemole G.M. (2016). The importance of the lymphatic system in vascular disease. J Integr. Car-diol., 2. https://doi.org/0.15761/JIC.1000188.
30 Ciccone V., Monti M., Antonini G., Mattoli L., et al. (2016). Efficacy of AdipoDren in reduc-ing interleukin-1-induced lymphatic endothelial hy-perpermeability. J Vasc. Res., vol. 53, pp. 255-268. https://doi.org/10.1159/000452798.
31 Shishlo V., Malinin A., Diurzhanov A. (2013). Mechanisms of antioedemic effect of biofla-vonoids in experiment [Mechanismi antiedemichesk-ogo effecta bioflavonoidov v experimente]. Angiol-ogy and vascular surgery. vol. 19, pp. 25-33.
32 Wanchai A., Armer J.M., Stewart B.R. (2013). Complementary and alternative medicine and lymphedema. Seminars in Oncology Nursing, vol. 29, no. 1, pp. 41-49. https://doi.org/10.1016/j.soncn.2012.11.006.
33 Minquan H., Tiyu C., Yinglun L. (1996). Ef-fects of polysaccharides from Dendrobium candidum on white blood cells and lymph cell moving inhibi-tion factor of mice. Natural Product Research and Development, vol. 8, no. 3, pp. 39-41.
34 Karomatov I.D., Rustamova G.U. (2018) . The healing properties of currants [Lechebnye svo-jstva smorodiny]. Biology and Integrative Medicine. no. 5, pp. 32-47.
35 Huebbe P., Giller K., de Pascual-Teresa S., Arkenau A., Adolphi B., Portius S., Arkenau C.N., Rimbach G. (2012). Effects of blackcurrant-based juice on atherosclerosis-related biomarkers in cul-tured macrophages and in human subjects after con-sumption of a high-energy meal. Br. J. Nutr., vol. 108, no. 2, pp. 234-244.
36 Bonarska-Kujawa D., Cyboran S., Żyłka R., Oszmiański J., Kleszczyńska H. (2014). Biological activity of blackcurrant extracts (Ribes nigrum L.) in relation to erythrocyte membranes. Biomed. Res. Int., 783059.
37 Ashigai H., Komano Y., Wang G., Kawachi Y., Sunaga K., Yamamoto R., Takata R., Miyake M., Yanai T. (2017). Polysaccharide from black currant (Ribes nigrum L.) stimulates dendritic cells through TLR4 signaling. Bioscience of Microbiota. Food and Health, vol. 36, no. 4, pp. 141-145.
38 Kim B., Bae M., Park Y.K., Ma H., Yuan T., Seeram N.P., Lee J.Y. (2018). Blackcurrant antho-cyanins stimulated cholesterol transport via post-transcriptional induction of LDL receptor in Caco-2 cells. European Journal of Nutrition. vol. 57, no. 1, pp. 405-415.
39 Tadic V.M., Dobric S., Markovic G.M., So-fija M., Tanja S. (2008). Antiinflammatory, gastro-protective, free–radical scavenging and antimicrobial activities of hawthorn berries ethanol extract. J. Agr. Food Chem, vol. 56, pp. 7700-7709.
40 Wu J., Peng W., Qin R., Zhou H. (2014). Crataegus pinnatifida: chemical constituents, phar-macology, and potential applications. Molecules, vol. 19, no. 2, pp. 1685-1712.
41 Degenring F.H., Suter A., Weber M., Saller R. (2003). A randomised double blind placebo con-trolled clinical trial of a standardised extract of fresh Crataegus berries (Crataegisan®) in the treatment of patients with congestive heart failure NYHA II, Phytomedicine, vol. 10, pp. 363-369.
42 Dinesh K., Vikrant A., Zulfiqar B., Nisar K., Deo P. (2012) The genus Crataegus (Rosaceae): chemical and pharmacological perspectives. Rev. Bras. Farmacogn., vol. 22, pp. 1187-1200.
43 Claudia A.M, Dana C., Madosa E., Ghiocel M., Lucian C. (2016). The chemical composition and pharmaceutical usage of Hawthorn (Crataegus mo-nogyna L.) extracts, J Biotechnol. vol. 231, S59.
44 Smejkal K., Malaník M., Zhaparkulova K., Sakipova Z., Ibragimova L., Ibadullaeva G., ZemliC-ka M. (2016). Kazakh Ziziphora species as sources of bioactive substances. Molecules, vol. 12, no. 7, p. 826.
45 Radulovic N.S., Blagojevic P.D., Stojanovic-Radic Z.Z., Stojanovic N.M. (2013). Antimicrobial plant metabolites: structural diversity and mecha-nism of action. Curr Med Chem., vol. 20, no. 7, pp. 932-952.
46 Tian S., Shi Y., Zhou X., et. al. (2011). To-tal polyphenolic (flavonoids) content and antioxidant capacity of different Ziziphora clinopodioides Lam. extracts. Pharmacogn Mag., vol. 7, no. 25, pp. 65-68. https://doi.org/10.4103/0973-1296.75904.
47 Eskalieva B., Burasheva G. (2002). Flavo-noids of Alhagi persarum. Chem. Nat. Comp., vol. 38, pp. 102-103.
48 Bhave A., Schulzova V., Chmelarova H., Mrnka L., Hajslova J. (2017). Assessment of rose-hips based on the content of their biologically ac-tive compounds. Journal of food and drug analysis, vol. 25, no. 3, pp. 681-690.
49 Winther K., Vinther Hansen A.S., Campbell-Tofte J. (2016). Bioactive ingredients of rose hips (Rosa canina L.) with special reference to antioxida-tive and anti-inflammatory properties: in vitro stud-ies. Botanics: targets and therapy. vol. 2016, no. 6, pp. 11-23.
50 Süntar I.P., Akkol E.K., Yılmazer D., Baykal T., Kırmızıbekmez H., Alper M., Yeşilada E. (2010).
128 Selected Kazakhstani plants with possible lymphatic properties
Int. j. biol. chem. (Online) International Journal of Biology and Chemistry 13, № 1, 118 (2020)
Investigations on the in vivo wound healing poten-tial of Hypericum perforatum L. J Ethnopharm., vol. 127, no. 2, pp. 468-477.
51 Russo E., Scicchitano F., Whalley B.J., Mazzitello C., Ciriaco M., Esposito S., Patanè M., Upton R., Pugliese M., Chimirri S., Mammì M., Pal-leria C., De Sarro G. (2014). Hypericum perforatum: pharmacokinetic, mechanism of action, tolerability, and clinical drug-drug interactions. Phytotherapy Re-search, vol. 28, no. 5, pp. 643–655.
52 Arok R., Végh K., Alberti A., Kéry Á. Phyto-chemical comparison and analysis of Bergenia crassi-
folia L. (Fritsch.) and Bergenia cordifolia Sternb. (2012). Eur. Chem. Bull., vol. 1, no. 1-2, pp. 31-34.
53 Zafar R., Ullah H., Zahoor M. et al. (2019). Isolation of bioactive compounds from Bergenia cili-ata (haw.) Sternb rhizome and their antioxidant and anticholinesterase activities. BMC Complement Al-tern Med., 2019, vol. 19, no. 296, 13 p.
54 Yakovlev G.P. (2010). Pharmacognosy. Medicinal raw materials of plant and animal origin [Farmakognozija: Lekarstvennoe syr’e rastitel’nogo i zhivotnogo proishozhdenija. 2 izd. SPb., SpecLit, 863.]
© 2020 al-Farabi Kazakh National University Int. j. biol. chem. (Online)
International Journal of Biology and Chemistry 13, № 1, 129 (2020)
IRSTI 34.15 https://doi.org/10.26577/ijbch.2020.v13.i1.13
D.A. Gritsenko1* , K.P. Aubakirova1 , I. Voitsekhovskiy1 , I. Soldatova3 , N.N. Galiakparov1
1 Institute of Plant Biology and Biotechnology, Almaty, Kazakhstan 2Charles University, Prague, Czech Republic
*e-mail: [email protected]
Simultaneous detection of five apple viruses by RT-PCR
Abstract. Apple market takes third place in the world after bananas and grapes. Apple trees are affected by viruses and virus-like diseases, which cause significant economic losses. The most common viruses in the apple tree are Apple chlorotic leafspot virus (ACLSV), Apple stem pitting virus (ASPV), and Apple stem grooving virus (ASGV). Tomato ringspot virus (ToRSV) and apple mosaic virus (ApMV) also cause significant economic losses. Timely detection of viruses and using virus-free planting materials will reduce crop losses. In this work, we performed genetic analysis of ACLSV, ASGV, ASPV, ApMV, ToRSV, and developed RT-PCR test-system for simultaneous detection of these viruses in apple tree materials. The sequences of the developed primers for the test-system are patented. The planting materials imported from Turkey and Italy were investigated for the presence of apple viruses. The most common virus in the samples is ACLSV (60%) followed by ASPV (34%), ASGV (30%) and ApMV (2%). ToRSV virus was not detected at all. Analysis of samples showed that 60% of planting materials were infected with at least one virus, some samples were infected with 3 viruses simultaneously. Mandatory certification of imported planting materials will reduce crop losses of apple orchards. Key words: apple viruses, ACLSV, ApMV, ToRSV, ASGV, ASPV, RT-PCR, primers.
Introduction
Apple market takes third place in the world after bananas and grapes. There are over 7,500 apple tree varieties worldwide. The most common apple variet-ies in the world are the Red Delicious, Gala, Granny Smith, Golden delicious, Lady, Baldwin, McIntosh, Honey crisp, Fuji, and Cortland. World apple produc-tion has increased by 37.5% since 2000 and reached 59.1 million tons in 2017. The growth of the produc-tion was achieved by increasing yield, while the total planting area decreased by 10% during this time [1]. Apple export from Europe was 36.9% ($2.8 billion) of the global export. The largest exporters of apples in the world are China (US$1.3 billion or 17% of to-tal apple export), United States ($1 billion or 13.3%), Italy ($814.1 million or 10.7%), Chile ($703.5 mil-lion or 9.2%), France ($573.4 million, or 7.5%) [2]. In 2019, apple imports to Kazakhstan reached 101 thousand tons, which amounted to 31.5% of the total consumption [3].
Apple trees are affected by at least 12 viruses and virus-like diseases, which cause significant eco-
nomic losses [4-6]. Most apple viruses are transmit-ted through grafting. ToRSV is an exception, and it causes apple union necrosis and decline. Some apple varieties are susceptible to certain viruses. For exam-ple, it is known that all varieties of apples are suscep-tible to ApMV, but Golden Delicious, Jonathan, and Granny Smith are very susceptible [7]. According to various estimates, an infection can lead to loss of up to 40% of the yield, depending on the apple culti-var. ToRSV is distributed by nematodes, Xiphinema americanum. In the case of latent infection, viruses spread in apple trees without causing symptoms. La-tent infection can lead to delaying bud blooming and decreasing in leaves size. The growth of shoots is also reduced. Further development of the disease can cause severe tree damage or death [8].
The most common viruses in the apple tree are ACLSV, ASPV, and ASGV. These viruses can be present individually or together and can cause dis-ease in other fruit crops. Apple tree infected by these viruses shows decreasing in bud survival ability from 20% to 67%. The degree of tree damage depends on the pathogen and its strain in combination with apple
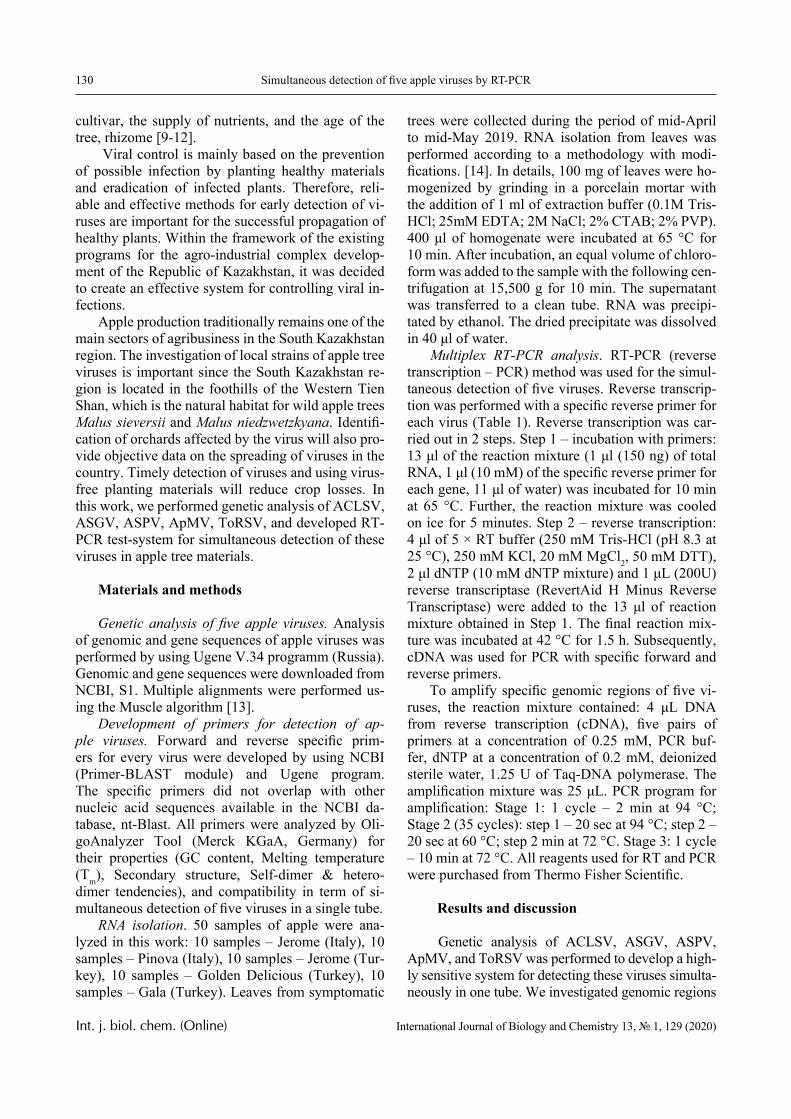
130 Simultaneous detection of five apple viruses by RT-PCR
Int. j. biol. chem. (Online) International Journal of Biology and Chemistry 13, № 1, 129 (2020)
cultivar, the supply of nutrients, and the age of the tree, rhizome [9-12].
Viral control is mainly based on the prevention of possible infection by planting healthy materials and eradication of infected plants. Therefore, reli-able and effective methods for early detection of vi-ruses are important for the successful propagation of healthy plants. Within the framework of the existing programs for the agro-industrial complex develop-ment of the Republic of Kazakhstan, it was decided to create an effective system for controlling viral in-fections.
Apple production traditionally remains one of the main sectors of agribusiness in the South Kazakhstan region. The investigation of local strains of apple tree viruses is important since the South Kazakhstan re-gion is located in the foothills of the Western Tien Shan, which is the natural habitat for wild apple trees Malus sieversii and Malus niedzwetzkyana. Identifi-cation of orchards affected by the virus will also pro-vide objective data on the spreading of viruses in the country. Timely detection of viruses and using virus-free planting materials will reduce crop losses. In this work, we performed genetic analysis of ACLSV, ASGV, ASPV, ApMV, ToRSV, and developed RT-PCR test-system for simultaneous detection of these viruses in apple tree materials.
Materials and methods
Genetic analysis of five apple viruses. Analysis of genomic and gene sequences of apple viruses was performed by using Ugene V.34 programm (Russia). Genomic and gene sequences were downloaded from NCBI, S1. Multiple alignments were performed us-ing the Muscle algorithm [13].
Development of primers for detection of ap-ple viruses. Forward and reverse specific prim-ers for every virus were developed by using NCBI (Primer-BLAST module) and Ugene program. The specific primers did not overlap with other nucleic acid sequences available in the NCBI da-tabase, nt-Blast. All primers were analyzed by Oli-goAnalyzer Tool (Merck KGaA, Germany) for their properties (GC content, Melting temperature (Tm), Secondary structure, Self-dimer & hetero- dimer tendencies), and compatibility in term of si-multaneous detection of five viruses in a single tube.
RNA isolation. 50 samples of apple were ana-lyzed in this work: 10 samples – Jerome (Italy), 10 samples – Pinova (Italy), 10 samples – Jerome (Tur-key), 10 samples – Golden Delicious (Turkey), 10 samples – Gala (Turkey). Leaves from symptomatic
trees were collected during the period of mid-April to mid-May 2019. RNA isolation from leaves was performed according to a methodology with modi-fications. [14]. In details, 100 mg of leaves were ho-mogenized by grinding in a porcelain mortar with the addition of 1 ml of extraction buffer (0.1M Tris-HCl; 25mM EDTA; 2M NaCl; 2% CTAB; 2% PVP). 400 μl of homogenate were incubated at 65 °C for 10 min. After incubation, an equal volume of chloro-form was added to the sample with the following cen-trifugation at 15,500 g for 10 min. The supernatant was transferred to a clean tube. RNA was precipi-tated by ethanol. The dried precipitate was dissolved in 40 μl of water.
Multiplex RT-PCR analysis. RT-PCR (reverse transcription – PCR) method was used for the simul-taneous detection of five viruses. Reverse transcrip-tion was performed with a specific reverse primer for each virus (Table 1). Reverse transcription was car-ried out in 2 steps. Step 1 – incubation with primers: 13 μl of the reaction mixture (1 μl (150 ng) of total RNA, 1 μl (10 mM) of the specific reverse primer for each gene, 11 μl of water) was incubated for 10 min at 65 °C. Further, the reaction mixture was cooled on ice for 5 minutes. Step 2 – reverse transcription: 4 μl of 5 × RT buffer (250 mM Tris-HCl (pH 8.3 at 25 °C), 250 mM KCl, 20 mM MgCl2, 50 mM DTT), 2 μl dNTP (10 mM dNTP mixture) and 1 μL (200U) reverse transcriptase (RevertAid H Minus Reverse Transcriptase) were added to the 13 μl of reaction mixture obtained in Step 1. The final reaction mix-ture was incubated at 42 °C for 1.5 h. Subsequently, cDNA was used for PCR with specific forward and reverse primers.
To amplify specific genomic regions of five vi-ruses, the reaction mixture contained: 4 μL DNA from reverse transcription (cDNA), five pairs of primers at a concentration of 0.25 mM, PCR buf-fer, dNTP at a concentration of 0.2 mM, deionized sterile water, 1.25 U of Taq-DNA polymerase. The amplification mixture was 25 μL. PCR program for amplification: Stage 1: 1 cycle – 2 min at 94 °C; Stage 2 (35 cycles): step 1 – 20 sec at 94 °C; step 2 – 20 sec at 60 °C; step 2 min at 72 °C. Stage 3: 1 cycle – 10 min at 72 °C. All reagents used for RT and PCR were purchased from Thermo Fisher Scientific.
Results and discussion
Genetic analysis of ACLSV, ASGV, ASPV, ApMV, and ToRSV was performed to develop a high-ly sensitive system for detecting these viruses simulta-neously in one tube. We investigated genomic regions
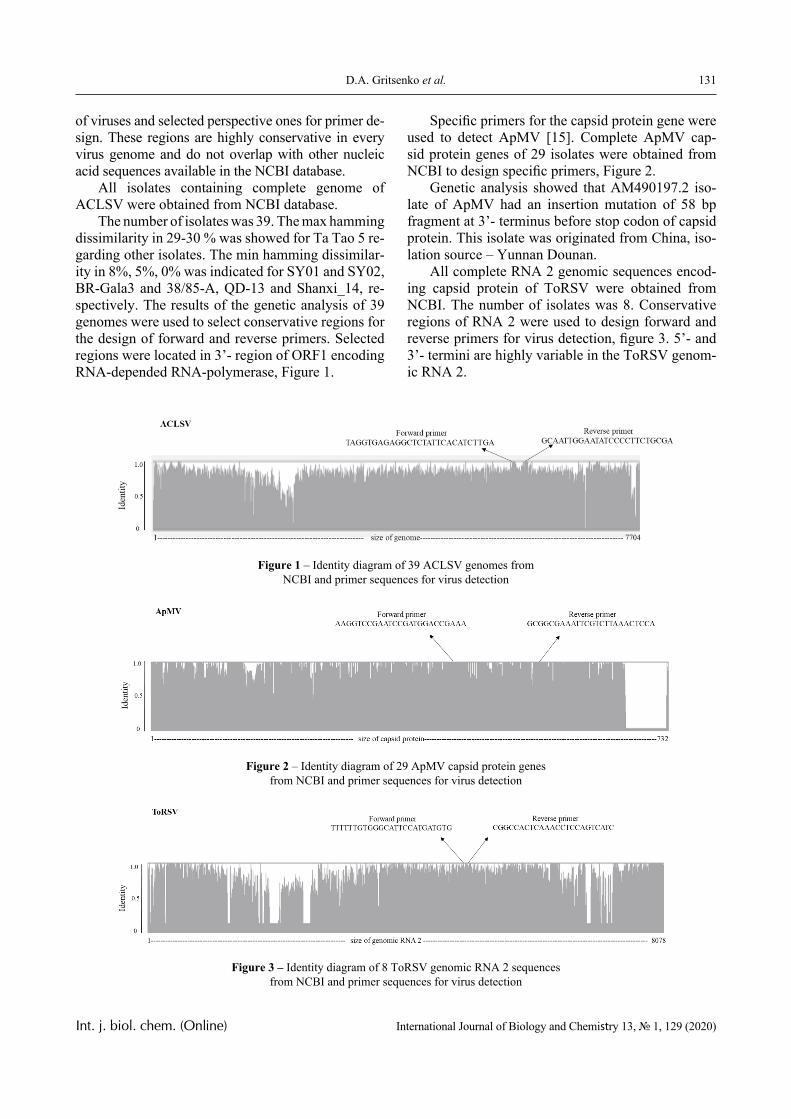
131D.A. Gritsenko et al.
Int. j. biol. chem. (Online) International Journal of Biology and Chemistry 13, № 1, 129 (2020)
of viruses and selected perspective ones for primer de-sign. These regions are highly conservative in every virus genome and do not overlap with other nucleic acid sequences available in the NCBI database.
All isolates containing complete genome of ACLSV were obtained from NCBI database.
The number of isolates was 39. The max hamming dissimilarity in 29-30 % was showed for Ta Tao 5 re-garding other isolates. The min hamming dissimilar-ity in 8%, 5%, 0% was indicated for SY01 and SY02, BR-Gala3 and 38/85-A, QD-13 and Shanxi_14, re-spectively. The results of the genetic analysis of 39 genomes were used to select conservative regions for the design of forward and reverse primers. Selected regions were located in 3’- region of ORF1 encoding RNA-depended RNA-polymerase, Figure 1.
Specific primers for the capsid protein gene were used to detect ApMV [15]. Complete ApMV cap-sid protein genes of 29 isolates were obtained from NCBI to design specific primers, Figure 2.
Genetic analysis showed that AM490197.2 iso-late of ApMV had an insertion mutation of 58 bp fragment at 3’- terminus before stop codon of capsid protein. This isolate was originated from China, iso-lation source – Yunnan Dounan.
All complete RNA 2 genomic sequences encod-ing capsid protein of ToRSV were obtained from NCBI. The number of isolates was 8. Conservative regions of RNA 2 were used to design forward and reverse primers for virus detection, figure 3. 5’- and 3’- termini are highly variable in the ToRSV genom-ic RNA 2.
Figure 1 – Identity diagram of 39 ACLSV genomes from NCBI and primer sequences for virus detection
Figure 2 – Identity diagram of 29 ApMV capsid protein genes from NCBI and primer sequences for virus detection
Figure 3 – Identity diagram of 8 ToRSV genomic RNA 2 sequences from NCBI and primer sequences for virus detection
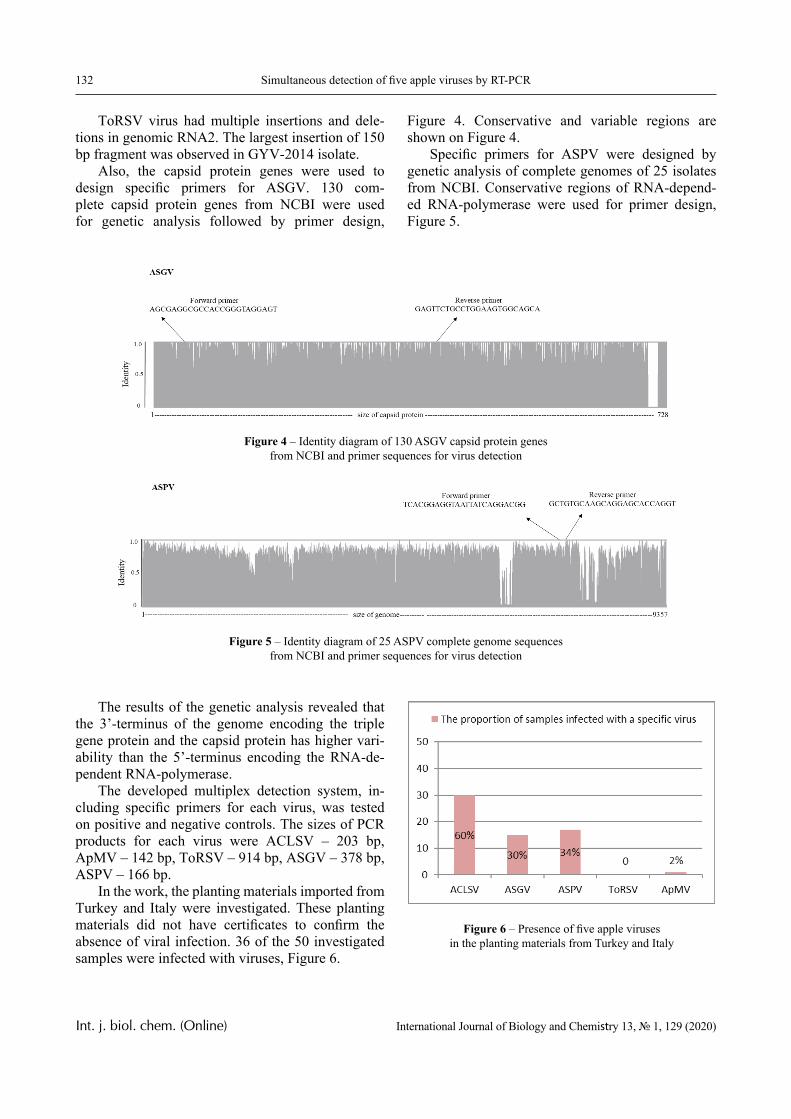
132 Simultaneous detection of five apple viruses by RT-PCR
Int. j. biol. chem. (Online) International Journal of Biology and Chemistry 13, № 1, 129 (2020)
ToRSV virus had multiple insertions and dele-tions in genomic RNA2. The largest insertion of 150 bp fragment was observed in GYV-2014 isolate.
Also, the capsid protein genes were used to design specific primers for ASGV. 130 com-plete capsid protein genes from NCBI were used for genetic analysis followed by primer design,
Figure 4. Conservative and variable regions are shown on Figure 4.
Specific primers for ASPV were designed by genetic analysis of complete genomes of 25 isolates from NCBI. Conservative regions of RNA-depend-ed RNA-polymerase were used for primer design, Figure 5.
Figure 4 – Identity diagram of 130 ASGV capsid protein genes from NCBI and primer sequences for virus detection
Figure 5 – Identity diagram of 25 ASPV complete genome sequences from NCBI and primer sequences for virus detection
The results of the genetic analysis revealed that the 3’-terminus of the genome encoding the triple gene protein and the capsid protein has higher vari-ability than the 5’-terminus encoding the RNA-de-pendent RNA-polymerase.
The developed multiplex detection system, in-cluding specific primers for each virus, was tested on positive and negative controls. The sizes of PCR products for each virus were ACLSV – 203 bp, ApMV – 142 bp, ToRSV – 914 bp, ASGV – 378 bp, ASPV – 166 bp.
In the work, the planting materials imported from Turkey and Italy were investigated. These planting materials did not have certificates to confirm the absence of viral infection. 36 of the 50 investigated samples were infected with viruses, Figure 6.
Figure 6 – Presence of five apple viruses in the planting materials from Turkey and Italy
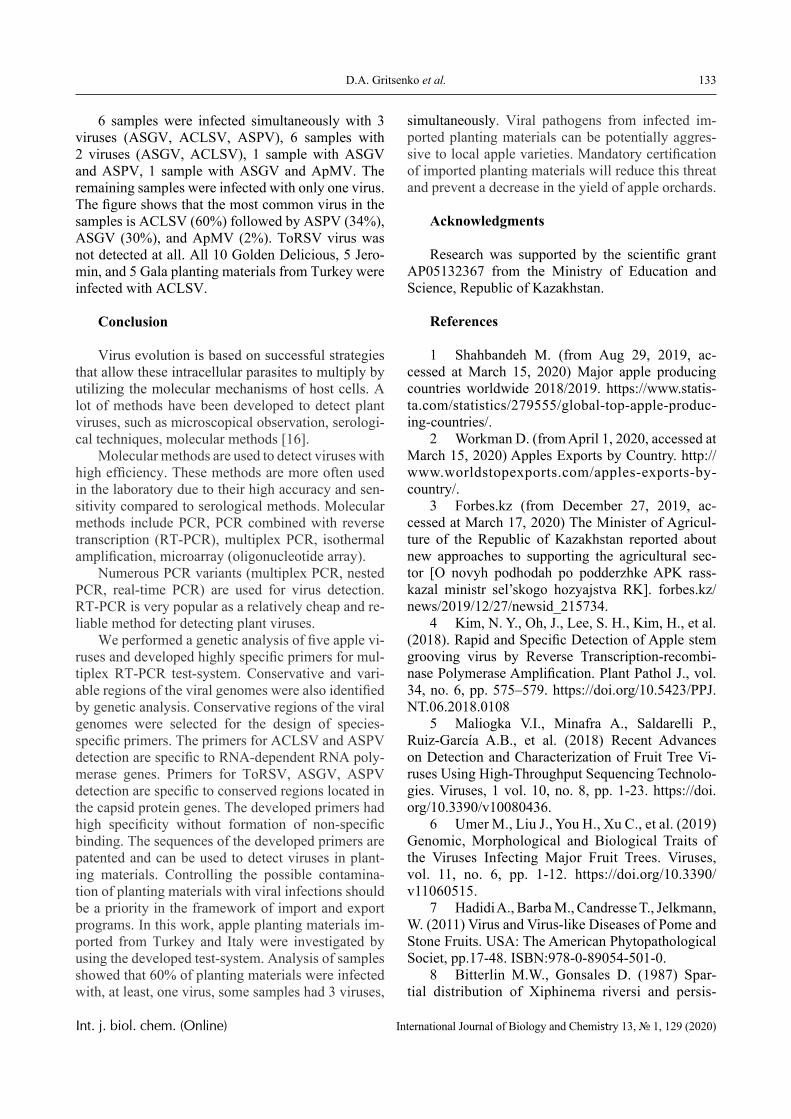
133D.A. Gritsenko et al.
Int. j. biol. chem. (Online) International Journal of Biology and Chemistry 13, № 1, 129 (2020)
6 samples were infected simultaneously with 3 viruses (ASGV, ACLSV, ASPV), 6 samples with 2 viruses (ASGV, ACLSV), 1 sample with ASGV and ASPV, 1 sample with ASGV and ApMV. The remaining samples were infected with only one virus. The figure shows that the most common virus in the samples is ACLSV (60%) followed by ASPV (34%), ASGV (30%), and ApMV (2%). ToRSV virus was not detected at all. All 10 Golden Delicious, 5 Jero-min, and 5 Gala planting materials from Turkey were infected with ACLSV.
Conclusion
Virus evolution is based on successful strategies that allow these intracellular parasites to multiply by utilizing the molecular mechanisms of host cells. A lot of methods have been developed to detect plant viruses, such as microscopical observation, serologi-cal techniques, molecular methods [16].
Molecular methods are used to detect viruses with high efficiency. These methods are more often used in the laboratory due to their high accuracy and sen-sitivity compared to serological methods. Molecular methods include PCR, PCR combined with reverse transcription (RT-PCR), multiplex PCR, isothermal amplification, microarray (oligonucleotide array).
Numerous PCR variants (multiplex PCR, nested PCR, real-time PCR) are used for virus detection. RT-PCR is very popular as a relatively cheap and re-liable method for detecting plant viruses.
We performed a genetic analysis of five apple vi-ruses and developed highly specific primers for mul-tiplex RT-PCR test-system. Conservative and vari-able regions of the viral genomes were also identified by genetic analysis. Conservative regions of the viral genomes were selected for the design of species-specific primers. The primers for ACLSV and ASPV detection are specific to RNA-dependent RNA poly-merase genes. Primers for ToRSV, ASGV, ASPV detection are specific to conserved regions located in the capsid protein genes. The developed primers had high specificity without formation of non-specific binding. The sequences of the developed primers are patented and can be used to detect viruses in plant-ing materials. Controlling the possible contamina-tion of planting materials with viral infections should be a priority in the framework of import and export programs. In this work, apple planting materials im-ported from Turkey and Italy were investigated by using the developed test-system. Analysis of samples showed that 60% of planting materials were infected with, at least, one virus, some samples had 3 viruses,
simultaneously. Viral pathogens from infected im-ported planting materials can be potentially aggres-sive to local apple varieties. Mandatory certification of imported planting materials will reduce this threat and prevent a decrease in the yield of apple orchards.
Acknowledgments
Research was supported by the scientific grant AP05132367 from the Ministry of Education and Science, Republic of Kazakhstan.
References
1 Shahbandeh M. (from Aug 29, 2019, ac-cessed at March 15, 2020) Major apple producing countries worldwide 2018/2019. https://www.statis-ta.com/statistics/279555/global-top-apple-produc-ing-countries/.
2 Workman D. (from April 1, 2020, accessed at March 15, 2020) Apples Exports by Country. http://www.worldstopexports.com/apples-exports-by-country/.
3 Forbes.kz (from December 27, 2019, ac-cessed at March 17, 2020) The Minister of Agricul-ture of the Republic of Kazakhstan reported about new approaches to supporting the agricultural sec-tor [O novyh podhodah po podderzhke APK rass-kazal ministr sel’skogo hozyajstva RK]. forbes.kz/news/2019/12/27/newsid_215734.
4 Kim, N. Y., Oh, J., Lee, S. H., Kim, H., et al. (2018). Rapid and Specific Detection of Apple stem grooving virus by Reverse Transcription-recombi-nase Polymerase Amplification. Plant Pathol J., vol. 34, no. 6, pp. 575–579. https://doi.org/10.5423/PPJ.NT.06.2018.0108
5 Maliogka V.I., Minafra A., Saldarelli P., Ruiz-García A.B., et al. (2018) Recent Advances on Detection and Characterization of Fruit Tree Vi-ruses Using High-Throughput Sequencing Technolo-gies. Viruses, 1 vol. 10, no. 8, pp. 1-23. https://doi.org/10.3390/v10080436.
6 Umer M., Liu J., You H., Xu C., et al. (2019) Genomic, Morphological and Biological Traits of the Viruses Infecting Major Fruit Trees. Viruses, vol. 11, no. 6, pp. 1-12. https://doi.org/10.3390/v11060515.
7 Hadidi A., Barba M., Candresse T., Jelkmann, W. (2011) Virus and Virus-like Diseases of Pome and Stone Fruits. USA: The American Phytopathological Societ, pp.17-48. ISBN:978-0-89054-501-0.
8 Bitterlin M.W., Gonsales D. (1987) Spar-tial distribution of Xiphinema riversi and persis-
134 Simultaneous detection of five apple viruses by RT-PCR
Int. j. biol. chem. (Online) International Journal of Biology and Chemistry 13, № 1, 129 (2020)
tence of tomato ringspot virus and its vector in soil. Plant Disease, vol. 71, pp. 408-411. https://doi.org/10.1094/PD-71-0408.
9 Beaver-Kanuya E., Szostek S.A., Harper S.J. (2019) Development of real-time RT-PCR assays for two viruses infecting pome fruit. J Virol Methods., vol. 266, pp. 25-29. https://doi.org/10.1016/j.jvirom-et.2018.12.008.
10 Hao L., Xie J., Chen S., Wang S., et al. (2016) A multiple RT-PCR assay for simultaneous detection and differentiation of latent viruses and apscarviroids in apple trees. J Virol Methods., vol. 234, pp. 16-21. https://doi.org/10.1016/j.jviromet.2016.04.003.
11 Ji Z., Zhao X., Duan H., Hu T., et al. (2013) Multiplex RT-PCR detection and distribution of four apple viruses in China. Acta Virol., vol. 57, no. 4, pp. 435-41. https://doi.org/10.4149/av_2013_04_435.
12 Peng D., Xie J., Qiang W., Ling K.S. (2017) One-step reverse transcription loop-medi-ated isothermal amplification assay for detection of Apple chlorotic leaf spot virus. J Virol Methods,
vol. 248, pp.154-158. https://doi.org/10.1016/j.jvi-romet.2017.07.002.
13 Edgar R.C. (2004) MUSCLE: multiple se-quence alignment with high accuracy and high throughput. Nucleic Acids Res., vol. 32, no. 5, pp. 1792-1797. https://doi.org/10.1093/nar/gkh340.
14 Gambino G., Perrone I., Gribaudo I. (2008) A Rapid and effective method for RNA extraction from different tissues of grapevine and other woody plants. Phytochem Anal., vol. 19, no. 6, pp. 520-525. https://doi.org/10.1002/pca.1078.
15 Koonin E. V., Dolja V. V. (1993) Evolution and taxonomy of positive-strand RNA viruses: Implica-tions of comparative analysis of amino acid sequenc-es. Crit. Rev. Biochem. Mol. Biol., vol. 28, pp. 375-430. https://doi.org/10.3109/10409239309078440.
16 Pallás V., Sánchez-Navarro J., James D. (2018) Recent Advances on the Multiplex Molecu-lar Detection of Plant Viruses and Viroids. Front Microbiol., vol. 9, p. 1-11. https://doi.org/10.3389/fmicb.2018.02087.
© 2020 al-Farabi Kazakh National University Int. j. biol. chem. (Online)
International Journal of Biology and Chemistry 13, № 1, 135 (2020)
IRSTI 65.65.03 https://doi.org/10.26577/ijbch.2020.v13.i1.14
M. Derakhshan1 , A.H. Elhamirad1 , M. Javanmard2* ,
P. Sharayei3 , M.Armin1 1Department of Food Science & Technology, Sabzevar Branch, Islamic Azad University, Sabzevar, Iran
2 Food technologies group, Chemical Engineering Institute, Iranian Research Organization for Science & Technology (IROST), Tehran, Iran
3Agricultural Engineering Research Department, Khorasan Razavi Agricultural and Natural Resources Research and Education Center, AREEO, Mashhad, Iran
*e-mail: [email protected]
Optimization of conditions of ultrasound-assisted extraction of effective compounds from apple pomace (malus domestica)
Abstract. Every year millions of tons of fruit peels, such as that from apples, oranges and pomegranates are disposed of as juice factory wastes in our country as well as globally. Unfortunately, Iran with a 15.2-30% green waste production, currently holds the first place in the world fruit waste production. The current study was carried out with the goal of optimizing the ultrasound-assisted extraction of antioxidant compounds from apple pomace. In this study the optimal conditions of ultrasound-assisted extraction (US) of effective compounds from the ethanolic extract of apple pomace by use of the response surface method (Box-Behnken design) with three variables consisting of ultrasound amplitude (20, 60 and 100 %), ultrasound exposure time (15, 35 and 55 min) and ultrasound temperature (35, 50 and 65 0C). According to Derringer’s desired function approach, the optimal conditions based on both individual and combinations of all process variables were ultrasound amplitude 82.36%, ultrasound exposure time 35.24 min and ultrasound temperature 51.48 0 C. At this optimum condition, the predicted maximum values of the total phenolic compound (TPC) 1,1-diphenyl-picrylhydrazyl free radical scavenging (DPPH) and extraction yield (EY) were 74.53% of gallic/ 100 g, 83.85% and 17.74%, respectively. The experimental values were in a good agreement with the predicted values. Also, the TPC, DPPH and EY maceration method were 11.10 mg of gallic acid/100 g, the free-radical scavenging as 2.79% and the extraction efficiency as 4.46%. The results demonstrated that US could be a very effective method for continuous extraction of natural compounds. Key words: apple pomace extract, Box-Behnken design, total phenolic compounds, ultrasound.
Introduction
Every year millions of tons of fruit peels such as that from apples, oranges, and pomegranates are disposed of as juice factory wastes in our country all the while in the world as we know it today special attention is given to optimum use of plant wastes and extraction of bioactive com-pounds, namely, antioxidants and antimicrobials. Unfortunately, Iran with a 15.2-30% green waste production, currently holds the first place in the world fruit waste production. On the one hand, wastes lead to loss of national resources, on the other hand, the disposal of which causes some difficulties. For example, wastes rich in pheno-lic compounds which are usually buried in the
ground, in addition to being expensive, cause en-vironmental problems [1].
One of the valuable sources for the production of natural additives is apple pomace. Apple pomace is the main product of the juice and apple center in-dustries which consists of 25% of the original fruit volume with a humidity content (wb) of 85% [2].
Pomace is rich in raw fiber, protein, vitamin, and minerals. Its main compounds are simple sugars such as glucose, fructose, and arabinose while its insig-nificant compounds include sucrose, galactose, and xylose. Hence, several microorganisms are able to make use of apple residue as a substrate for growth [3].
Phenolic and flavonoid compounds are often gathered in apple fruit peel, and the major of which
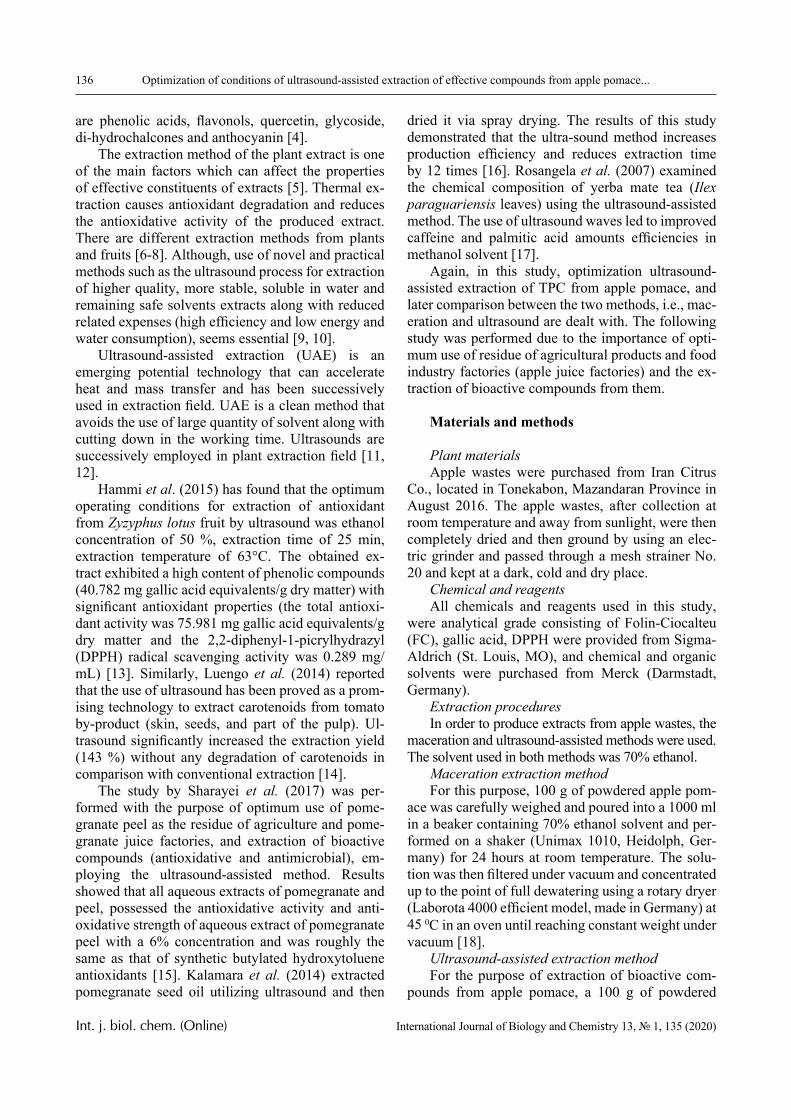
136 Optimization of conditions of ultrasound-assisted extraction of effective compounds from apple pomace...
Int. j. biol. chem. (Online) International Journal of Biology and Chemistry 13, № 1, 135 (2020)
are phenolic acids, flavonols, quercetin, glycoside, di-hydrochalcones and anthocyanin [4].
The extraction method of the plant extract is one of the main factors which can affect the properties of effective constituents of extracts [5]. Thermal ex-traction causes antioxidant degradation and reduces the antioxidative activity of the produced extract. There are different extraction methods from plants and fruits [6-8]. Although, use of novel and practical methods such as the ultrasound process for extraction of higher quality, more stable, soluble in water and remaining safe solvents extracts along with reduced related expenses (high efficiency and low energy and water consumption), seems essential [9, 10].
Ultrasound-assisted extraction (UAE) is an emerging potential technology that can accelerate heat and mass transfer and has been successively used in extraction field. UAE is a clean method that avoids the use of large quantity of solvent along with cutting down in the working time. Ultrasounds are successively employed in plant extraction field [11, 12].
Hammi et al. (2015) has found that the optimum operating conditions for extraction of antioxidant from Zyzyphus lotus fruit by ultrasound was ethanol concentration of 50 %, extraction time of 25 min, extraction temperature of 63°C. The obtained ex-tract exhibited a high content of phenolic compounds (40.782 mg gallic acid equivalents/g dry matter) with significant antioxidant properties (the total antioxi-dant activity was 75.981 mg gallic acid equivalents/g dry matter and the 2,2-diphenyl-1-picrylhydrazyl (DPPH) radical scavenging activity was 0.289 mg/mL) [13]. Similarly, Luengo et al. (2014) reported that the use of ultrasound has been proved as a prom-ising technology to extract carotenoids from tomato by-product (skin, seeds, and part of the pulp). Ul-trasound significantly increased the extraction yield (143 %) without any degradation of carotenoids in comparison with conventional extraction [14].
The study by Sharayei et al. (2017) was per-formed with the purpose of optimum use of pome-granate peel as the residue of agriculture and pome-granate juice factories, and extraction of bioactive compounds (antioxidative and antimicrobial), em-ploying the ultrasound-assisted method. Results showed that all aqueous extracts of pomegranate and peel, possessed the antioxidative activity and anti-oxidative strength of aqueous extract of pomegranate peel with a 6% concentration and was roughly the same as that of synthetic butylated hydroxytoluene antioxidants [15]. Kalamara et al. (2014) extracted pomegranate seed oil utilizing ultrasound and then
dried it via spray drying. The results of this study demonstrated that the ultra-sound method increases production efficiency and reduces extraction time by 12 times [16]. Rosangela et al. (2007) examined the chemical composition of yerba mate tea (Ilex paraguariensis leaves) using the ultrasound-assisted method. The use of ultrasound waves led to improved caffeine and palmitic acid amounts efficiencies in methanol solvent [17].
Again, in this study, optimization ultrasound-assisted extraction of TPC from apple pomace, and later comparison between the two methods, i.e., mac-eration and ultrasound are dealt with. The following study was performed due to the importance of opti-mum use of residue of agricultural products and food industry factories (apple juice factories) and the ex-traction of bioactive compounds from them.
Materials and methods
Plant materialsApple wastes were purchased from Iran Citrus
Co., located in Tonekabon, Mazandaran Province in August 2016. The apple wastes, after collection at room temperature and away from sunlight, were then completely dried and then ground by using an elec-tric grinder and passed through a mesh strainer No. 20 and kept at a dark, cold and dry place.
Chemical and reagentsAll chemicals and reagents used in this study,
were analytical grade consisting of Folin-Ciocalteu (FC), gallic acid, DPPH were provided from Sigma-Aldrich (St. Louis, MO), and chemical and organic solvents were purchased from Merck (Darmstadt, Germany).
Extraction proceduresIn order to produce extracts from apple wastes, the
maceration and ultrasound-assisted methods were used. The solvent used in both methods was 70% ethanol.
Maceration extraction methodFor this purpose, 100 g of powdered apple pom-
ace was carefully weighed and poured into a 1000 ml in a beaker containing 70% ethanol solvent and per-formed on a shaker (Unimax 1010, Heidolph, Ger-many) for 24 hours at room temperature. The solu-tion was then filtered under vacuum and concentrated up to the point of full dewatering using a rotary dryer (Laborota 4000 efficient model, made in Germany) at 45 0C in an oven until reaching constant weight under vacuum [18].
Ultrasound-assisted extraction methodFor the purpose of extraction of bioactive com-
pounds from apple pomace, a 100 g of powdered
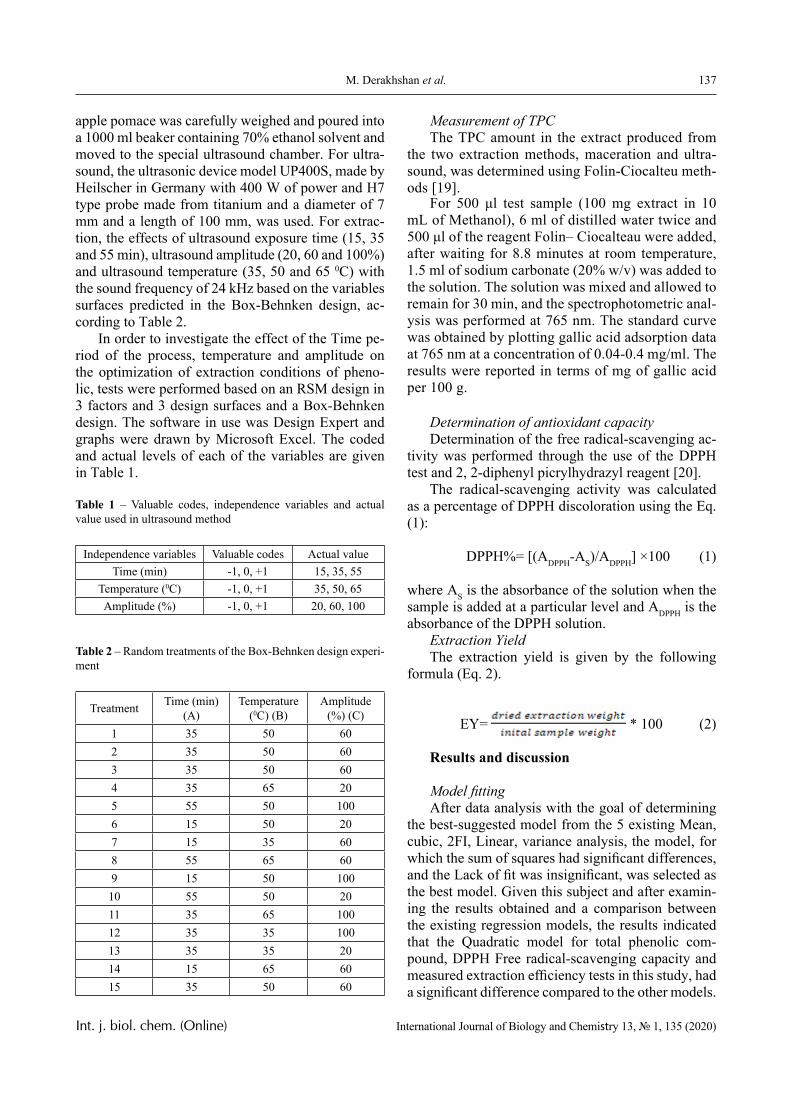
137M. Derakhshan et al.
Int. j. biol. chem. (Online) International Journal of Biology and Chemistry 13, № 1, 135 (2020)
apple pomace was carefully weighed and poured into a 1000 ml beaker containing 70% ethanol solvent and moved to the special ultrasound chamber. For ultra-sound, the ultrasonic device model UP400S, made by Heilscher in Germany with 400 W of power and H7 type probe made from titanium and a diameter of 7 mm and a length of 100 mm, was used. For extrac-tion, the effects of ultrasound exposure time (15, 35 and 55 min), ultrasound amplitude (20, 60 and 100%) and ultrasound temperature (35, 50 and 65 0C) with the sound frequency of 24 kHz based on the variables surfaces predicted in the Box-Behnken design, ac-cording to Table 2.
In order to investigate the effect of the Time pe-riod of the process, temperature and amplitude on the optimization of extraction conditions of pheno-lic, tests were performed based on an RSM design in 3 factors and 3 design surfaces and a Box-Behnken design. The software in use was Design Expert and graphs were drawn by Microsoft Excel. The coded and actual levels of each of the variables are given in Table 1.
Table 1 – Valuable codes, independence variables and actual value used in ultrasound method
Independence variables Valuable codes Actual valueTime (min) -1, 0, +1 15, 35, 55
Temperature (0C) -1, 0, +1 35, 50, 65Amplitude (%) -1, 0, +1 20, 60, 100
Table 2 – Random treatments of the Box-Behnken design experi-ment
Treatment Time (min) (A)
Temperature (0C) (B)
Amplitude (%) (C)
1 35 50 602 35 50 603 35 50 604 35 65 205 55 50 1006 15 50 207 15 35 608 55 65 609 15 50 10010 55 50 2011 35 65 10012 35 35 10013 35 35 2014 15 65 6015 35 50 60
Measurement of TPCThe TPC amount in the extract produced from
the two extraction methods, maceration and ultra-sound, was determined using Folin-Ciocalteu meth-ods [19].
For 500 μl test sample (100 mg extract in 10 mL of Methanol), 6 ml of distilled water twice and 500 μl of the reagent Folin– Ciocalteau were added, after waiting for 8.8 minutes at room temperature, 1.5 ml of sodium carbonate (20% w/v) was added to the solution. The solution was mixed and allowed to remain for 30 min, and the spectrophotometric anal-ysis was performed at 765 nm. The standard curve was obtained by plotting gallic acid adsorption data at 765 nm at a concentration of 0.04-0.4 mg/ml. The results were reported in terms of mg of gallic acid per 100 g.
Determination of antioxidant capacityDetermination of the free radical-scavenging ac-
tivity was performed through the use of the DPPH test and 2, 2-diphenyl picrylhydrazyl reagent [20].
The radical-scavenging activity was calculated as a percentage of DPPH discoloration using the Eq. (1):
DPPH%= [(ADPPH-AS)/ADPPH] ×100 (1)
where AS is the absorbance of the solution when the sample is added at a particular level and ADPPH is the absorbance of the DPPH solution.
Extraction Yield The extraction yield is given by the following
formula (Eq. 2).
EY= * 100 (2)
Results and discussion
Model fittingAfter data analysis with the goal of determining
the best-suggested model from the 5 existing Mean, cubic, 2FI, Linear, variance analysis, the model, for which the sum of squares had significant differences, and the Lack of fit was insignificant, was selected as the best model. Given this subject and after examin-ing the results obtained and a comparison between the existing regression models, the results indicated that the Quadratic model for total phenolic com-pound, DPPH Free radical-scavenging capacity and measured extraction efficiency tests in this study, had a significant difference compared to the other models.
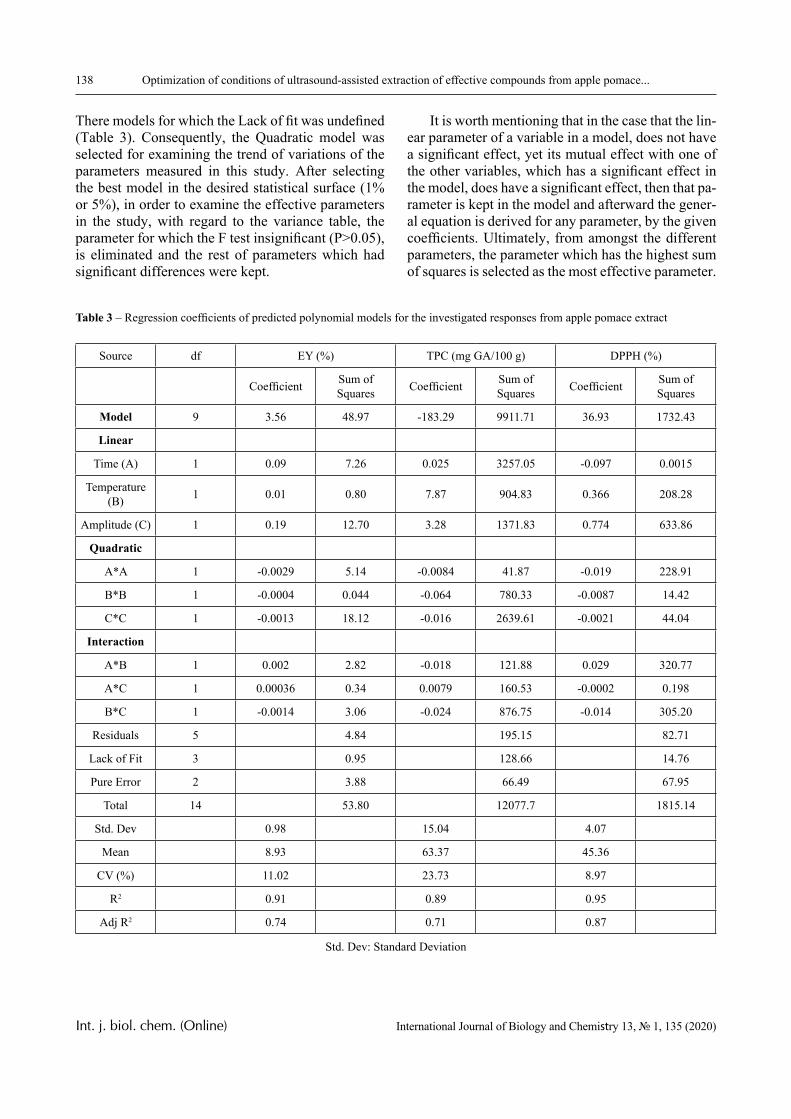
138 Optimization of conditions of ultrasound-assisted extraction of effective compounds from apple pomace...
Int. j. biol. chem. (Online) International Journal of Biology and Chemistry 13, № 1, 135 (2020)
There models for which the Lack of fit was undefined (Table 3). Consequently, the Quadratic model was selected for examining the trend of variations of the parameters measured in this study. After selecting the best model in the desired statistical surface (1% or 5%), in order to examine the effective parameters in the study, with regard to the variance table, the parameter for which the F test insignificant (P>0.05), is eliminated and the rest of parameters which had significant differences were kept.
It is worth mentioning that in the case that the lin-ear parameter of a variable in a model, does not have a significant effect, yet its mutual effect with one of the other variables, which has a significant effect in the model, does have a significant effect, then that pa-rameter is kept in the model and afterward the gener-al equation is derived for any parameter, by the given coefficients. Ultimately, from amongst the different parameters, the parameter which has the highest sum of squares is selected as the most effective parameter.
Table 3 – Regression coefficients of predicted polynomial models for the investigated responses from apple pomace extract
Source df EY (%) TPC (mg GA/100 g) DPPH (%)
Coefficient Sum of Squares Coefficient Sum of
Squares Coefficient Sum of Squares
Model 9 3.56 48.97 -183.29 9911.71 36.93 1732.43
Linear
Time (A) 1 0.09 7.26 0.025 3257.05 -0.097 0.0015
Temperature (B) 1 0.01 0.80 7.87 904.83 0.366 208.28
Amplitude (C) 1 0.19 12.70 3.28 1371.83 0.774 633.86
Quadratic
A*A 1 -0.0029 5.14 -0.0084 41.87 -0.019 228.91
B*B 1 -0.0004 0.044 -0.064 780.33 -0.0087 14.42
C*C 1 -0.0013 18.12 -0.016 2639.61 -0.0021 44.04
Interaction
A*B 1 0.002 2.82 -0.018 121.88 0.029 320.77
A*C 1 0.00036 0.34 0.0079 160.53 -0.0002 0.198
B*C 1 -0.0014 3.06 -0.024 876.75 -0.014 305.20
Residuals 5 4.84 195.15 82.71
Lack of Fit 3 0.95 128.66 14.76
Pure Error 2 3.88 66.49 67.95
Total 14 53.80 12077.7 1815.14
Std. Dev 0.98 15.04 4.07
Mean 8.93 63.37 45.36
CV (%) 11.02 23.73 8.97
R2 0.91 0.89 0.95
Adj R2 0.74 0.71 0.87
Std. Dev: Standard Deviation
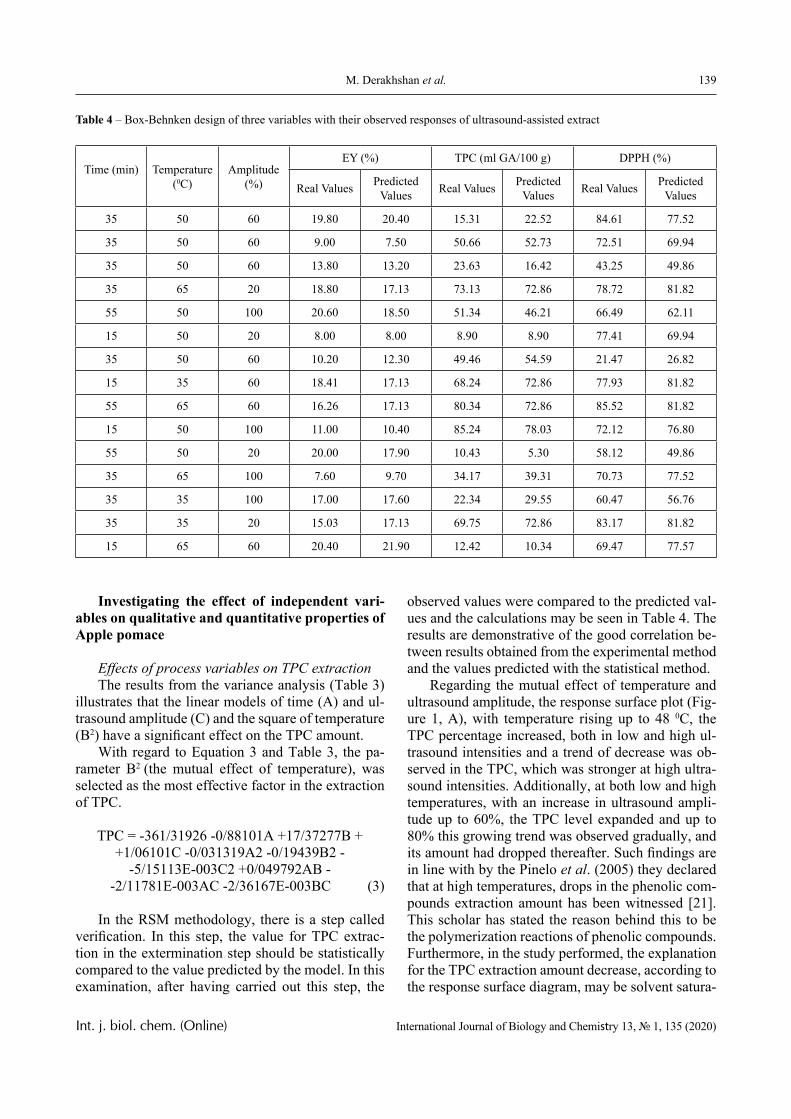
139M. Derakhshan et al.
Int. j. biol. chem. (Online) International Journal of Biology and Chemistry 13, № 1, 135 (2020)
Table 4 – Box-Behnken design of three variables with their observed responses of ultrasound-assisted extract
Time (min)
Temperature (0C)
Amplitude (%)
EY (%) TPC (ml GA/100 g) DPPH (%)
Real Values Predicted Values Real Values Predicted
Values Real Values Predicted Values
35 50 60 19.80 20.40 15.31 22.52 84.61 77.52
35 50 60 9.00 7.50 50.66 52.73 72.51 69.94
35 50 60 13.80 13.20 23.63 16.42 43.25 49.86
35 65 20 18.80 17.13 73.13 72.86 78.72 81.82
55 50 100 20.60 18.50 51.34 46.21 66.49 62.11
15 50 20 8.00 8.00 8.90 8.90 77.41 69.94
35 50 60 10.20 12.30 49.46 54.59 21.47 26.82
15 35 60 18.41 17.13 68.24 72.86 77.93 81.82
55 65 60 16.26 17.13 80.34 72.86 85.52 81.82
15 50 100 11.00 10.40 85.24 78.03 72.12 76.80
55 50 20 20.00 17.90 10.43 5.30 58.12 49.86
35 65 100 7.60 9.70 34.17 39.31 70.73 77.52
35 35 100 17.00 17.60 22.34 29.55 60.47 56.76
35 35 20 15.03 17.13 69.75 72.86 83.17 81.82
15 65 60 20.40 21.90 12.42 10.34 69.47 77.57
Investigating the effect of independent vari-ables on qualitative and quantitative properties of Apple pomace
Effects of process variables on TPC extractionThe results from the variance analysis (Table 3)
illustrates that the linear models of time (A) and ul-trasound amplitude (C) and the square of temperature (B2) have a significant effect on the TPC amount.
With regard to Equation 3 and Table 3, the pa-rameter B2 (the mutual effect of temperature), was selected as the most effective factor in the extraction of TPC.
TPC = -361/31926 -0/88101A +17/37277B ++1/06101C -0/031319A2 -0/19439B2 -
-5/15113E-003C2 +0/049792AB --2/11781E-003AC -2/36167E-003BC (3)
In the RSM methodology, there is a step called verification. In this step, the value for TPC extrac-tion in the extermination step should be statistically compared to the value predicted by the model. In this examination, after having carried out this step, the
observed values were compared to the predicted val-ues and the calculations may be seen in Table 4. The results are demonstrative of the good correlation be-tween results obtained from the experimental method and the values predicted with the statistical method.
Regarding the mutual effect of temperature and ultrasound amplitude, the response surface plot (Fig-ure 1, A), with temperature rising up to 48 0C, the TPC percentage increased, both in low and high ul-trasound intensities and a trend of decrease was ob-served in the TPC, which was stronger at high ultra-sound intensities. Additionally, at both low and high temperatures, with an increase in ultrasound ampli-tude up to 60%, the TPC level expanded and up to 80% this growing trend was observed gradually, and its amount had dropped thereafter. Such findings are in line with by the Pinelo et al. (2005) they declared that at high temperatures, drops in the phenolic com-pounds extraction amount has been witnessed [21]. This scholar has stated the reason behind this to be the polymerization reactions of phenolic compounds. Furthermore, in the study performed, the explanation for the TPC extraction amount decrease, according to the response surface diagram, may be solvent satura-
140 Optimization of conditions of ultrasound-assisted extraction of effective compounds from apple pomace...
Int. j. biol. chem. (Online) International Journal of Biology and Chemistry 13, № 1, 135 (2020)
tion at lower temperatures and dissolution of TPC at high temperatures. In the research carried out on the extraction of polyphenolic compounds from some kind of raspberry, the highest polyphenolic com-pounds extraction efficiency was reported at 60 0C.
Investigation of the phenol variations against temperature and time showed that at both the start and finish of the experiment, with a rise in temper-ature up to 47.210C, the TPC increased and then a trend of decrease was observed in the TPC extrac-tion amount. Considering Figure 1, B, it can be said that temperature and time are significantly effective on the amount of TPC extraction such that with an increase in temperature and time, a trend of increase has been witnessed in the TPC extraction amount. Rises in temperature lead to a growth in the solvent penetration rate and also increases the mass transfer period. Taking into account, the fact that the sam-ple/solvent ratio was assumed to be constant in this study, the explanation for the TPC extraction amount decrease, according to the response surface diagram, may be solvent saturation at lower temperatures and dissolution of TPC at high temperatures.
The contents of TPC extracted from wheat bran at different times of sonication increase of the total phenolics content was observed up to 30 min, re-maining constant until 50 min. A significant increase of the total phenolic content was observed over the extraction temperature range (25–75 0C), and the to-tal phenolic content reached a maximum of around 2.80 mg GAE/g of wheat bran at 65 0C. At a higher temperature, the solubility of phenolic compounds in wheat bran could be enhanced, and the viscosity of wheat bran extracts was decreased, accelerating the whole extraction [19].
Spigno et al. (2007) investigated the relation-ship of extraction temperature and extraction time with TPC was demonstrate both of the factors dis-played significant linear and quadratic effect (at least at p<0.05) on TPC. With regard to extraction tem-perature, TPC of limau purut peels extracts increased readily with increasing temperature up to 47.5oC and followed by a slight decrease afterwards (22). This suggested that incubation in warm water did improve phenolics extraction, yet was gentle enough to avoid heat degradation of the target phenolic antioxidants. Mild heating might soften the plant tissue, weaken the cell wall integrity, hydrolyze the bonds of bound phenolic compounds (phenol-protein or phenol-poly-saccharide) as well as enhance phenolics solubility, thus more phenolics would distribute to the solvent [23, 24]. At optimum extraction temperature (about 47.5oC), higher amounts of phenolic contents were
obtained with short extraction time. In other words, long extraction time may compensate the beneficial effects of moderate temperature by inducing oxida-tion or degradation of phenolic compounds, yielding low TPC [23, 25].
In the research carried out by Ya-Qin et al. (2009) for all detected phenolic acids under study, their yields depended dramatically on extraction time and temperature. At relatively lower temperature (15 and 30 0C), the yields of phenolic acids increased with increased extraction time. For example, after UAE at 15 0C for 40 min, the yields of caffeic, p-coumaric, ferulic, p-hydroxy-benzoic acid increased from 15.4 to 103.7, 36.4 to 171.3, 452.3 to 1672.3, 18.3 to 42.0 µg/g of DW, respectively (26). In agreement with these results, Sueli and Pinto (2007) reported that ex-traction time significantly affected the yields of phe-nolic compounds from coconut shell powder. Like-wise, the yield of phenolic compounds increased also with extraction temperature increased. For example, after UAE from 15 to 30 0C for 20 min, the yield of caffeic acid increased from 36.9 to 86.7 lg/g DW, 80.0 to 165.3 lg/g DW in p-coumaric acid, 951.8 to 2283.3 lg/g DW in ferulic acid, 27.0 to 43.4 lg/g DW in p-hydroxy-benzoic acid, respectively [27].
Results acquired from the Ahmadian and Ni-azmand study (2016) illustrate the specific effect of the mean temperature (43°C) on the extraction of polyphenolic compounds from the saffron petal [28]. The effect of temperature on increasing extraction ef-ficiency is most probably due to the improvement of mass transfer at a higher temperature and therefore increasing the solubility of phenolic compounds, increasing the penetration rate and decreasing the coefficient of viscosity, of the solvent. In addition, the rise in extraction temperature, bringing about the dissociation of the bonds of the phenolic compounds with the rest of the compounds and affecting the membrane structure of plant cells can be responsible for extraction procedure facilitation.
In agreement with this research, also research-ers showed that the extraction yield increased with increasing temperature. When extraction tempera-ture increased from 30 to 50 °C, the extraction yield increased from 17.6±0.4 to 30±0.8%. Similarly, the total phenolic content also increased from 21±0.6 to 23± 0.3 mg/g DW. A rise in extraction temperature can break the phenolic matrix bonds and influence the membrane structure of plant cells making them less selective by coagulation of lipoproteins [29]. The dielectric constant of water decreases and sol-vent property and capacity change at higher tempera-ture, resulting in a better extraction of phenolic [5].
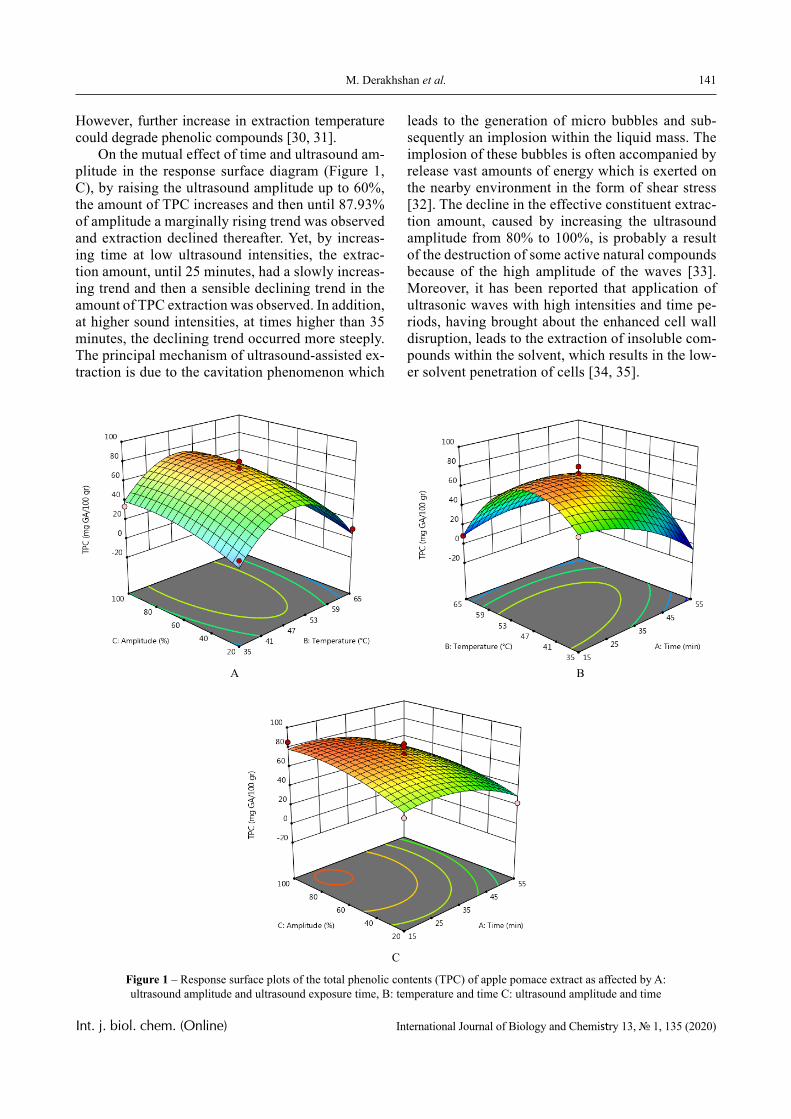
141M. Derakhshan et al.
Int. j. biol. chem. (Online) International Journal of Biology and Chemistry 13, № 1, 135 (2020)
However, further increase in extraction temperature could degrade phenolic compounds [30, 31].
On the mutual effect of time and ultrasound am-plitude in the response surface diagram (Figure 1, C), by raising the ultrasound amplitude up to 60%, the amount of TPC increases and then until 87.93% of amplitude a marginally rising trend was observed and extraction declined thereafter. Yet, by increas-ing time at low ultrasound intensities, the extrac-tion amount, until 25 minutes, had a slowly increas-ing trend and then a sensible declining trend in the amount of TPC extraction was observed. In addition, at higher sound intensities, at times higher than 35 minutes, the declining trend occurred more steeply. The principal mechanism of ultrasound-assisted ex-traction is due to the cavitation phenomenon which
leads to the generation of micro bubbles and sub-sequently an implosion within the liquid mass. The implosion of these bubbles is often accompanied by release vast amounts of energy which is exerted on the nearby environment in the form of shear stress [32]. The decline in the effective constituent extrac-tion amount, caused by increasing the ultrasound amplitude from 80% to 100%, is probably a result of the destruction of some active natural compounds because of the high amplitude of the waves [33]. Moreover, it has been reported that application of ultrasonic waves with high intensities and time pe-riods, having brought about the enhanced cell wall disruption, leads to the extraction of insoluble com-pounds within the solvent, which results in the low-er solvent penetration of cells [34, 35].
A B
C
Figure 1 – Response surface plots of the total phenolic contents (TPC) of apple pomace extract as affected by A: ultrasound amplitude and ultrasound exposure time, B: temperature and time C: ultrasound amplitude and time
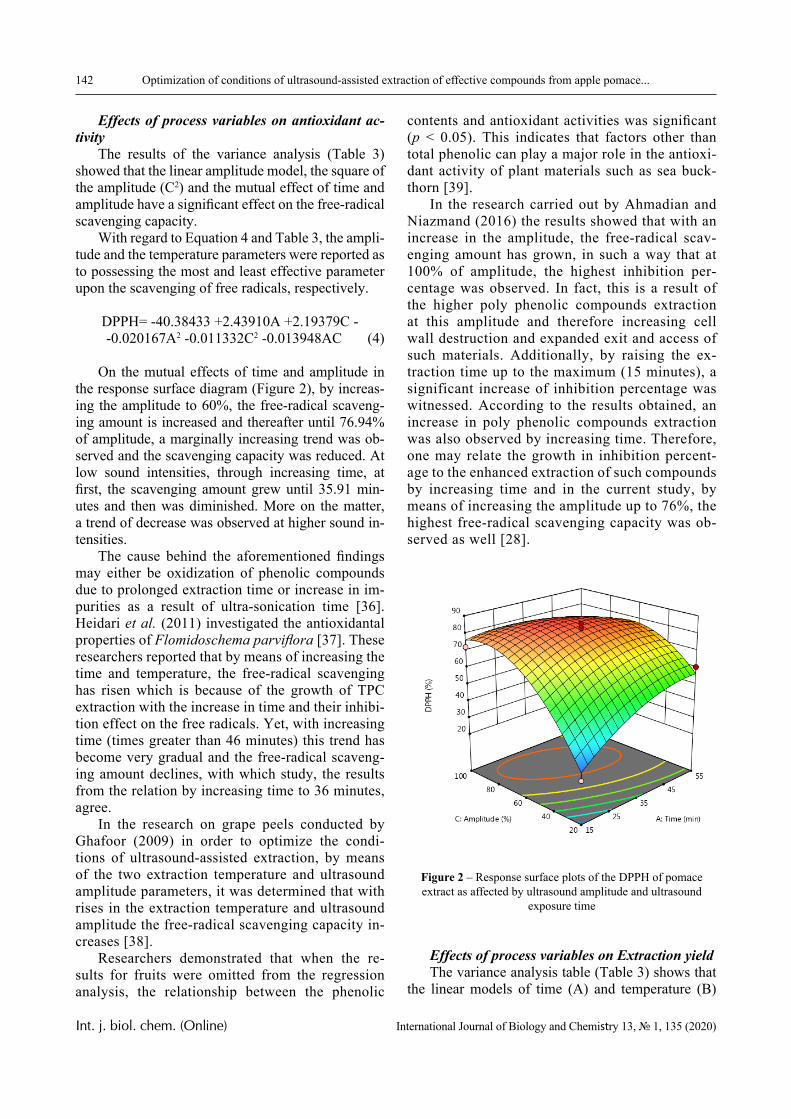
142 Optimization of conditions of ultrasound-assisted extraction of effective compounds from apple pomace...
Int. j. biol. chem. (Online) International Journal of Biology and Chemistry 13, № 1, 135 (2020)
Effects of process variables on antioxidant ac-tivity
The results of the variance analysis (Table 3) showed that the linear amplitude model, the square of the amplitude (C2) and the mutual effect of time and amplitude have a significant effect on the free-radical scavenging capacity.
With regard to Equation 4 and Table 3, the ampli-tude and the temperature parameters were reported as to possessing the most and least effective parameter upon the scavenging of free radicals, respectively.
DPPH= -40.38433 +2.43910A +2.19379C --0.020167A2 -0.011332C2 -0.013948AC (4)
On the mutual effects of time and amplitude in the response surface diagram (Figure 2), by increas-ing the amplitude to 60%, the free-radical scaveng-ing amount is increased and thereafter until 76.94% of amplitude, a marginally increasing trend was ob-served and the scavenging capacity was reduced. At low sound intensities, through increasing time, at first, the scavenging amount grew until 35.91 min-utes and then was diminished. More on the matter, a trend of decrease was observed at higher sound in-tensities.
The cause behind the aforementioned findings may either be oxidization of phenolic compounds due to prolonged extraction time or increase in im-purities as a result of ultra-sonication time [36]. Heidari et al. (2011) investigated the antioxidantal properties of Flomidoschema parviflora [37]. These researchers reported that by means of increasing the time and temperature, the free-radical scavenging has risen which is because of the growth of TPC extraction with the increase in time and their inhibi-tion effect on the free radicals. Yet, with increasing time (times greater than 46 minutes) this trend has become very gradual and the free-radical scaveng-ing amount declines, with which study, the results from the relation by increasing time to 36 minutes, agree.
In the research on grape peels conducted by Ghafoor (2009) in order to optimize the condi-tions of ultrasound-assisted extraction, by means of the two extraction temperature and ultrasound amplitude parameters, it was determined that with rises in the extraction temperature and ultrasound amplitude the free-radical scavenging capacity in-creases [38].
Researchers demonstrated that when the re-sults for fruits were omitted from the regression analysis, the relationship between the phenolic
contents and antioxidant activities was significant (p < 0.05). This indicates that factors other than total phenolic can play a major role in the antioxi-dant activity of plant materials such as sea buck-thorn [39].
In the research carried out by Ahmadian and Niazmand (2016) the results showed that with an increase in the amplitude, the free-radical scav-enging amount has grown, in such a way that at 100% of amplitude, the highest inhibition per-centage was observed. In fact, this is a result of the higher poly phenolic compounds extraction at this amplitude and therefore increasing cell wall destruction and expanded exit and access of such materials. Additionally, by raising the ex-traction time up to the maximum (15 minutes), a significant increase of inhibition percentage was witnessed. According to the results obtained, an increase in poly phenolic compounds extraction was also observed by increasing time. Therefore, one may relate the growth in inhibition percent-age to the enhanced extraction of such compounds by increasing time and in the current study, by means of increasing the amplitude up to 76%, the highest free-radical scavenging capacity was ob-served as well [28].
Figure 2 – Response surface plots of the DPPH of pomace extract as affected by ultrasound amplitude and ultrasound
exposure time
Effects of process variables on Extraction yield The variance analysis table (Table 3) shows that
the linear models of time (A) and temperature (B)
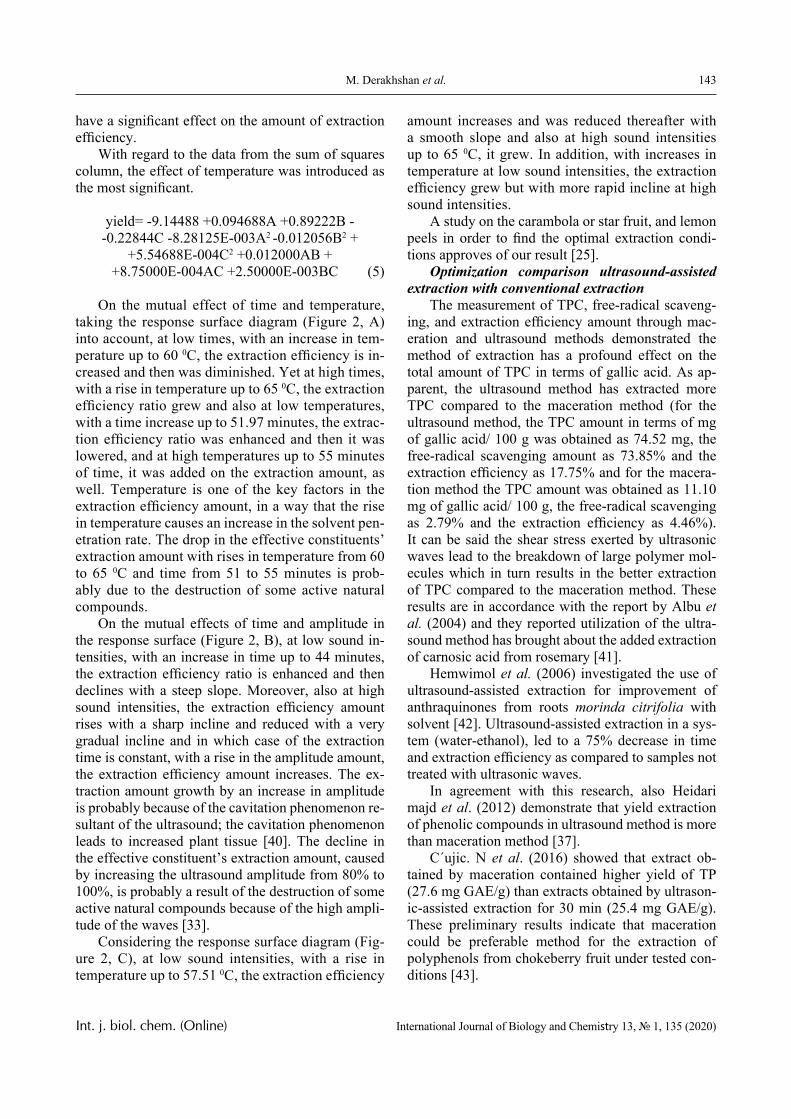
143M. Derakhshan et al.
Int. j. biol. chem. (Online) International Journal of Biology and Chemistry 13, № 1, 135 (2020)
have a significant effect on the amount of extraction efficiency.
With regard to the data from the sum of squares column, the effect of temperature was introduced as the most significant.
yield= -9.14488 +0.094688A +0.89222B --0.22844C -8.28125E-003A2 -0.012056B2 +
+5.54688E-004C2 +0.012000AB ++8.75000E-004AC +2.50000E-003BC (5)
On the mutual effect of time and temperature, taking the response surface diagram (Figure 2, A) into account, at low times, with an increase in tem-perature up to 60 0C, the extraction efficiency is in-creased and then was diminished. Yet at high times, with a rise in temperature up to 65 0C, the extraction efficiency ratio grew and also at low temperatures, with a time increase up to 51.97 minutes, the extrac-tion efficiency ratio was enhanced and then it was lowered, and at high temperatures up to 55 minutes of time, it was added on the extraction amount, as well. Temperature is one of the key factors in the extraction efficiency amount, in a way that the rise in temperature causes an increase in the solvent pen-etration rate. The drop in the effective constituents’ extraction amount with rises in temperature from 60 to 65 0C and time from 51 to 55 minutes is prob-ably due to the destruction of some active natural compounds.
On the mutual effects of time and amplitude in the response surface (Figure 2, B), at low sound in-tensities, with an increase in time up to 44 minutes, the extraction efficiency ratio is enhanced and then declines with a steep slope. Moreover, also at high sound intensities, the extraction efficiency amount rises with a sharp incline and reduced with a very gradual incline and in which case of the extraction time is constant, with a rise in the amplitude amount, the extraction efficiency amount increases. The ex-traction amount growth by an increase in amplitude is probably because of the cavitation phenomenon re-sultant of the ultrasound; the cavitation phenomenon leads to increased plant tissue [40]. The decline in the effective constituent’s extraction amount, caused by increasing the ultrasound amplitude from 80% to 100%, is probably a result of the destruction of some active natural compounds because of the high ampli-tude of the waves [33].
Considering the response surface diagram (Fig-ure 2, C), at low sound intensities, with a rise in temperature up to 57.51 0C, the extraction efficiency
amount increases and was reduced thereafter with a smooth slope and also at high sound intensities up to 65 0C, it grew. In addition, with increases in temperature at low sound intensities, the extraction efficiency grew but with more rapid incline at high sound intensities.
A study on the carambola or star fruit, and lemon peels in order to find the optimal extraction condi-tions approves of our result [25].
Optimization comparison ultrasound-assisted extraction with conventional extraction
The measurement of TPC, free-radical scaveng-ing, and extraction efficiency amount through mac-eration and ultrasound methods demonstrated the method of extraction has a profound effect on the total amount of TPC in terms of gallic acid. As ap-parent, the ultrasound method has extracted more TPC compared to the maceration method (for the ultrasound method, the TPC amount in terms of mg of gallic acid/ 100 g was obtained as 74.52 mg, the free-radical scavenging amount as 73.85% and the extraction efficiency as 17.75% and for the macera-tion method the TPC amount was obtained as 11.10 mg of gallic acid/ 100 g, the free-radical scavenging as 2.79% and the extraction efficiency as 4.46%). It can be said the shear stress exerted by ultrasonic waves lead to the breakdown of large polymer mol-ecules which in turn results in the better extraction of TPC compared to the maceration method. These results are in accordance with the report by Albu et al. (2004) and they reported utilization of the ultra-sound method has brought about the added extraction of carnosic acid from rosemary [41].
Hemwimol et al. (2006) investigated the use of ultrasound-assisted extraction for improvement of anthraquinones from roots morinda citrifolia with solvent [42]. Ultrasound-assisted extraction in a sys-tem (water-ethanol), led to a 75% decrease in time and extraction efficiency as compared to samples not treated with ultrasonic waves.
In agreement with this research, also Heidari majd et al. (2012) demonstrate that yield extraction of phenolic compounds in ultrasound method is more than maceration method [37].
C´ujic. N et al. (2016) showed that extract ob-tained by maceration contained higher yield of TP (27.6 mg GAE/g) than extracts obtained by ultrason-ic-assisted extraction for 30 min (25.4 mg GAE/g). These preliminary results indicate that maceration could be preferable method for the extraction of polyphenols from chokeberry fruit under tested con-ditions [43].
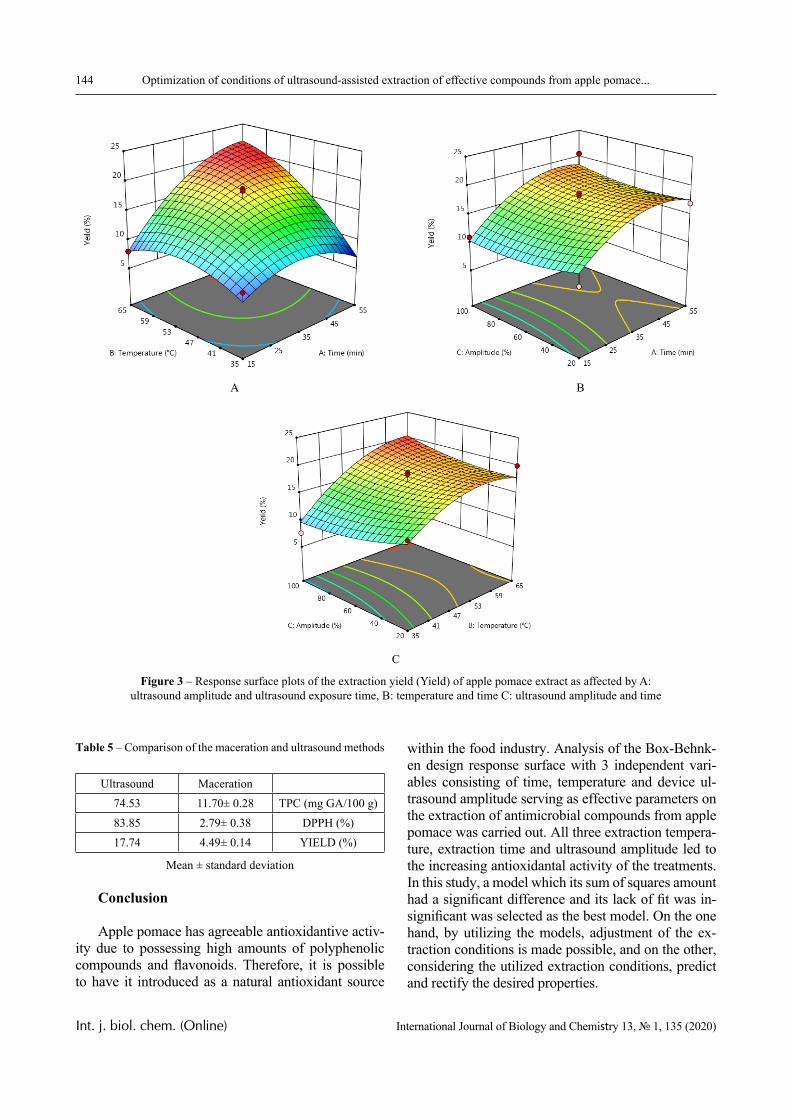
144 Optimization of conditions of ultrasound-assisted extraction of effective compounds from apple pomace...
Int. j. biol. chem. (Online) International Journal of Biology and Chemistry 13, № 1, 135 (2020)
Table 5 – Comparison of the maceration and ultrasound methods
Ultrasound Maceration74.53 11.70± 0.28 TPC (mg GA/100 g)83.85 2.79± 0.38 DPPH (%)17.74 4.49± 0.14 YIELD (%)
Mean ± standard deviation
Conclusion
Apple pomace has agreeable antioxidantive activ-ity due to possessing high amounts of polyphenolic compounds and flavonoids. Therefore, it is possible to have it introduced as a natural antioxidant source
within the food industry. Analysis of the Box-Behnk-en design response surface with 3 independent vari-ables consisting of time, temperature and device ul-trasound amplitude serving as effective parameters on the extraction of antimicrobial compounds from apple pomace was carried out. All three extraction tempera-ture, extraction time and ultrasound amplitude led to the increasing antioxidantal activity of the treatments. In this study, a model which its sum of squares amount had a significant difference and its lack of fit was in-significant was selected as the best model. On the one hand, by utilizing the models, adjustment of the ex-traction conditions is made possible, and on the other, considering the utilized extraction conditions, predict and rectify the desired properties.
A B
C
Figure 3 – Response surface plots of the extraction yield (Yield) of apple pomace extract as affected by A: ultrasound amplitude and ultrasound exposure time, B: temperature and time C: ultrasound amplitude and time
145M. Derakhshan et al.
Int. j. biol. chem. (Online) International Journal of Biology and Chemistry 13, № 1, 135 (2020)
Acknowledgment
The authors are appreciated from the Agricultural Engineering Research Department, Khorasan Razavi Agricultural and Natural Research and Education, AREEO Mashhad, Iran, due to financial support throughout the research.
References
1 Negro C., Tommasi L., Miceli A. (2003) Phenolic compounds and antioxidant activity from red grape marce extracts. Bioresource Technology., no. 87, pp. 41- 44. https://doi.org/10.1016/S0960-8524 (02)00202-X.
2 Sun H., Ge X., Hao Z., Peng M. (2010) Bio-technology Cellulase production by Trichoderma sp. on apple pomace under solid state fermentation. Af-rican Journal of Biotechnology. no. 9, pp. 163-166.
3 Kosseva, M.R. (2011) Management and Pro-cessing of Food Wastes, in: Moo-Young, M. (Ed.), Comprehensive Biotechnology. Environmental Bio-technology and Safety. no. 6.
4 Takos A., Jaffé F., Jacob S., Bogs J., Robin-son S., Walker A. (2006) Light-Induced Expression of a MYB Gene Regulates Anthocyanin Biosynthesis in Red Apples. Plant Physiol., vol. 3, no. 142, pp. 1216–1232.
5 Corrales M., Garcia A., Butz P., Tauscher B. (2009) Extraction of anthocyanins from grape skins assisted by high hydrostatic pressure. Journal of Food Engineering. no. 90, pp. 415–421.
6 Adamez J., Samino E.G., Sanchez E.V., Go-mez D.G. (2012) In vitro estimation of the antibac-terial activity and antioxidant capacity of aqueous extracts from grape-seeds (Vitis vinifera L.). Food Control. no. 24, pp.136- 141.
7 Martin J., Porto E., Correa C., Alencar M., Gloria E., Cabral I., Aquino L. (2012) Antimicro-bial potential and chemical composition of agro-industrial wastes. Journal of Natural Products., no. 5, pp. 27- 36.
8 Sagdic O., Ozturk I., Kisi O. (2012) Mod-eling antimicrobial effect of different grape pomace and extracts on S. aureus and E. coli in vegetable soup using artificial neural network and fuzzy log-ic system. Expert Systems with Applications., vol. 39, vo. 8, pp. 6792- 6798. https://doi.org/10.1016/j.eswa.2011.12.047
9 Porto C.D., Porretto E., Decorti D. (2013) Comparison of ultrasound-assisted extraction with conventional extraction methods of oil and polyphe-nols from grape (Vitis vinifera L.) seeds. Ultrasonics
Sonochemistry., no. 20, pp. 1076- 1080. https://doi.org/10.1016/j.ultsonch.2012.12.002.
10 Wijngaard H., Hossain M.B., Rai D.K., Brunton N. (2012) Techniques to extract bioactive compounds from food by-products of plant origin. Food Research International., vol. 46, no. 2, pp. 505- 513. https://doi.org/10.1016/j.foodres.2011.09.027.
11 Luque-Garci´a J.L., Luque De Castro M.D. (2003) Ultrasound: a powerful tool for Leaching. TrAC Trends in Analytical Chemistry., vol. 22, no. 1, pp. 41–47. https://doi.org/10.1016/S0165-9936(03)00102-X.
12 Lopez-Avila V., Young R., Teplitsky N. (1996) Microwave-assisted extraction as an Alterna-tive to soxhlet, sonication, and supercritical fluid ex-traction. Journal of AOAC Int., no. 79, pp. 142–156. https://doi.org/10.1093/jaoac/79.1.142.
13 Hammi K. M., Jdey A., Abdelly C., Majdoub H., Ksouri R. (2015) Optimization of ultrasound-assisted extraction of antioxidant compounds from Tunisian Zizyphus lotus fruits using response surface methodology. Food Chemistry., vol. 184, pp. 80-89. https://doi.org/10.1016/j.foodchem.2015.03.047.
14 Luengo E., Condon-Abanto S., Condón S., Alvarez I., Raso J. (2014) Improving the extraction of carotenoids from tomato waste by application of ultrasound under pressure. Separation and Purifica-tion Technology., vol. 136, pp. 130-136. https://doi.org/10.1016/j.seppur.2014.09.008.
15 Sharayei P., Azarpazhouh A. (2017) Inves-tigating the effect of ultrasound on antioxidant and antifungal properties of pomegranate peel. Agricul-tural and Natural Resources Research and Education Center, AREEO, Mashhad, Iran, 2017.
16 Kalamara E., Goula A. M., Adamopoulos K.G. (2014) An integrated process for utilization of pomegranate wastes–Seeds. Innovative Food Sci-ence and Emerging Technologies., vol. 27, pp.144-153. https://doi.org/10.1016/j.ifset.2014.12.001.
17 Rosangela J., Lisiane F., Valeria P., Clau-dio D., Ana Paula O., Jose O. (2007) The use of ultrasound in the extraction of Ilex paraguariensis leaves: a comparison with maceration. Ultrasonics Sonochemistry., vol. 14, no. 1, pp. 6-12. https://doi.org/10.1016/j.ultsonch.2005.11.007.
18 Harborne J.B. (1973) Phytochemical meth-ods: a guide to modern techniques of plant analysis. London: Chapman & Hall; New York: [Distributed in the USA by Halsted Press, a Division of John Wi-ley & Sons].
19 Wang J., Sun B., Cao Y., Tian Y., Li X. (2008) Optimization of ultrasound-assisted extrac-tion of phenolic compounds from wheat bran. Food
146 Optimization of conditions of ultrasound-assisted extraction of effective compounds from apple pomace...
Int. j. biol. chem. (Online) International Journal of Biology and Chemistry 13, № 1, 135 (2020)
Chem., vol. 136, no. 2, pp. 804-810. https://doi.org/10.1016/j.foodchem.2007.06.062.
20 Von Gadow A., Joubert E., Hansmann C.F. (1997) Comparison of the antioxidant activity of as-palathin with that of other plant phenols of rooibos tea (Aspalathus linearis), α-tocopherol, BHT, and BHA. J. Agric. Food. Chem., vol. 3, no. 45, pp. 632-638. https://doi.org/10.1021/jf960281n.
21 Pinelo M., Rubilar M., Jerez M., Sineiro J., Núñez M.J. (2005) Effect of Solvent, Temperature, and Solvent-to-Solid Ratio on the Total Phenolic Content and Antiradical Activity of Extracts from Different Components of Grape Pomace. Journal of Agricultural and Food Chemistry., vol. 53, no. 6, pp. 2111-2117. https://doi.org/10.1021/jf0488110.
22 Spigno G., Tramelli L., Faveri D. M. D. (2007) Effects of extraction time, temperature and solvent on concentration and antioxidant activity of grape marc phenolics. Journal of Food Engineering., vol. 81, no.1, pp. 200-208. https://doi.org/10.1016/j.jfoodeng.2006.10.021.
23 Juntachote T., Berghofer E., Bauer F., Siebenhandl S. (2006) The application of response surface methodology to the production of pheno-lic extracts of lemon grass, galangal, holy basil and rosemary. International Journal of Food Science and Technology., vol. 41, no. 2, pp. 121-133. https://doi.org/10.1111/j.1365-2621.2005.00987.x.
24 Li B.B., Smith B., Hossain M.M. (2006) Ex-traction of phenolic from citrus peels II. Enzyme-as-sisted extraction method. Separation and Purification Technology., vol. 48, no. 2, pp. 189-196. https://doi.org/10.1016/j.seppur.2005.07.019.
25 Chan S., Lee C., Yap C., Mustapha W.A.W., Ho C. (2009) Optimization of extraction conditions for phenolic compounds from limau purut (Citrus hystrix) peels. Int. Food Res. J., vol. 2, no. 16, pp. 203-213.
26 Ya-Qin Ma., Jian-Chu Chen. (2009) Simulta-neous extraction of phenolic compound of citrus peel extracts: Effect of ultrasound. Journal of Ultrasonics Sonochemistry., vol.16, no. 1, pp. 57-62. https://doi.org/10.1016/j.ultsonch.2008.04.012.
27 Sueli R., Pinto G.A.S. (2007) Ultrasound ex-traction of phenolic compounds from coconut (Cocos nucifera) shell powder. Journal of Food Engineering., vol. 80, no. 3, pp. 869–872. https://doi.org/10.1016/j.jfoodeng.2006.08.009.
28 Ahmadian koochaksarayee Z., Niazmand R. (2016) Optimization of Extraction of effective compounds from saffron petals by ultrasound-assay method. Novel food technology., no. 13, pp. 121-135.
29 Fernandez D. P., Goodwin A. R. H., Lem-mon E. W., Levelt-sengers J. M. H., Williams R. C. (1997) A formulation for the static permitivity of wa-ter and steam at temperature from 238 K to 873 K at pressures up to 1200 MPa, including derivatives and Deby–Hückel coefficients. Journal of Physical Chemistry., vol. 26, pp. 1125−1166.
30 Durling N. E., Catchpole O. J., Grey J. B., Webby R. F., Mitchell K. A., Foo L. Y., Perry, N.B. (2007) Extraction of phenolics and essential oil from dried sage (Salvia officianlis) using etha-nol-water mixtures. Food Chemistry., vol. 101, no. 4, pp. 1417−1424. https://doi.org/10.1016/j.food-chem.2006.03.050.
31 Prasad N. K., Yang B., Zhao M., Wang B., Chen F., Jiang Y. (2008) Effects of high pressure treatment on the extraction yield, phenolic content and antioxidant activity of litchi (Litchi chinen-sis Sonn.) fruit pericarp. International Journal of Food Science and Technology.doi:10.1111/j.1365-2621.2008.01768.x
32 Ji J.B., Lu X.H., Cai M.Q., Xu Z.C. (2006) Improvement of leaching process of Geniposide with ultrasound. Ultrasonics sonochemistry., vol. 13, no. 5, pp. 455-462. https://doi.org/10.1016/j.ult-sonch.2005.08.003.
33 Lianfu Z., Zelong L. (2008) Optimization and comparison of ultrasound/microwave assisted extraction (UMAE) and ultrasonic assisted extrac-tion (UAE) of lycopene from tomatoes. Ultrasonics sonochemistry., vol. 15, no. 5, pp. 731-737. https://doi.org/10.1016/j.ultsonch.2007.12.001.
34 Liu S., Yang F., Zhang C., Ji H., Hong P., Deng C (2009) Optimization of process param-eters for supercritical carbon dioxide extraction of Passiflora seed oil by response surface meth-odology. The Journal of Supercritical Fluids., vol. 48, no. 1, pp. 9-14. https://doi.org/10.1016/j.sup-flu.2008.09.013.
35 Tian Y., Xu Z., Zheng B., Lo Y.M. (2013) Optimization of ultrasonic-assisted extraction of pomegranate (Punica granatum L.) Seed oil. Ultra-sonics Sonochemistry., vol. 20, no.1, pp. 202–208. https://doi.org/10.1016/j.ultsonch.2012.07.010.
36 Zhang L. (2011) Estimating covariation: Epps effect and microstructure noise. Journal of Econometrics., vol. 160, no. 1, pp. 33–47. https://doi.org/10.1016/j.jeconom.2010.03.012.
37 Heydari Majd M., Mortazavi A., Asili J., Bolouriyan Sh. (2012) Optimization of Extraction of Phenolic compounds from Flomidoschema parviflora by ultrasound-assay method Herbal Medicine., no 1, pp. 7-13.
147M. Derakhshan et al.
Int. j. biol. chem. (Online) International Journal of Biology and Chemistry 13, № 1, 135 (2020)
38 Ghafoor K,. Choi Y., Yeong Jeon, Ju., Hee Jo. (2009) Optimization of Ultrasound-Assisted Ex-traction of Phenolic Compounds, Antioxidants, and Anthocyanins from Grape (Vitis vinifera) Seeds. Agric. Food Chem., vol. 11, no. 57, pp. 4988–4994. https://doi.org/10.1021/jf9001439.
39 Velioglu Y.S., Oomah B.D. (1998) Anti-oxidant activity and total phenolic in selected fruits, vegetables and grain products. Journal of agricultural and food chemistry., vol. 46, pp. 4113-4117. https://doi.org/10.1021/jf9801973.
40 Vilkhu K., Mawson R., Simons L., Bates D. (2008) Applications and opportunities for ultrasound assisted extraction in the food industry – A review. Innovative Food Science & Emerging Technologies., vol. 9, no. 2, pp. 161-169. https://doi.org/10.1016/j.ifset.2007.04.014.
41 Albu S., Joyce E., Paniwnyk L., Lorimer J., Mason T. (2004) Potential for the use of ultrasound in the extraction of antioxidants from Rosmarinus officinalis for the food and pharmaceutical industry. Ultrasonic Sonochemistry., vol. 11, no. 3-4, pp. 261-265. https://doi.org/10.1016/j.ultsonch.2004.01.015.
42 Hemwimol S., Pavasant P., Shotipruk A. (2006) Ultrasonic-assisted extraction of anthraqui-nones from roots of Morinda citrifolia. Ultrasonics Sonochemistry., vol. 13, no. 6, pp. 543-548. https://doi.org/10.1016/j.ultsonch.2005.09.009.
43 Ujic N., Šavikin K., Jankovic T., Pljevljakušic D., Zdunic G., Ibric S. (2016) Optimization of poly-phenols extraction from dried chokeberry using mac-eration as traditional technique. Food Chemistry., vol. 194, pp. 135–142. https://doi.org/10.1016/j.foodchem.2015.08.008.
© 2020 al-Farabi Kazakh National University Int. j. biol. chem. (Online)
International Journal of Biology and Chemistry 13, № 1, 148 (2020)
IRSTI 31.21.27 https://doi.org/10.26577/ijbch.2020.v13.i1.15
E.M. Yergaliyeva1 , *K.B. Bazhykova1 ,
D.N. Mukhan1 , P. Langer2
1Al-Farabi Kazakh National University, Almaty, Kazakhstan 2University of Rostock, Rostock, Germany
*e-mail: [email protected]
Synthesis of substituted tetrahydropyran-4-one and its oxime
Abstract, Tetrahydropyranone derivatives are promising starting materials for the synthesis of various heterocyclic compounds with biological activity. Oximes obtained on the basis of heterocyclic compounds, which include 3,5-substituted tetrahydropyran-4-one, possess antibacterial activity. We studied the optimal conditions for the synthesis of 3,5 substituted tetrahydropyran-4-one and its oxime, to confirm the obtained structures, and to perform quantum-chemical calculations of the conformations of the target compounds. The optimal method for the 3,5-dimethyleneoxytetrahydropyran-4-one (III) synthesis was the condensation of acetone with formaldehyde in a ratio of 1:4 in the presence of K2CO3; the yield was 67.4 %. The reaction of (III) with hydroxylamine hydrochloride was studied in the presence of NaOH and AcONa at different temperatures. The optimal yield (65.3%) of the product (IV) was obtained in the presence of AcONa with heating below 80 0C. To determine the composition of obtained compounds elemental analysis was used. Functional composition and structural elements were identified using IR spectroscopy. To prove the structure of the synthesized oxime, 1H and 13C NMR spectra were taken on a JNN-ECA Jeol 400 spectrometer (at a frequency of 399.78 MHz and 100.53 MHz) with a CDCl3 solvent. Quantum-chemical calculations of stable conformations of (III) and (IV) was performed using ab initio DFT B3LYP method and 6-31G (d) and 6-311+G(3df,2p) basis sets. Calculated total energies and dipole moments allow to find the geometry of the most stable conformers. The most stable conformer of (IV) is the 3a5a configuration of substituents, which can be explained by the formation of intramolecular hydrogen bonds. Calculations show that the syn- and anti-isomers of 3,5-dimethyleneoxytetrahydropyran-4-one oxime are energetically equivalent.Key words: tetrahydropyranone, acetone, formaldehyde, oxime, synthesis, condensation, conformational analysis.
Introduction
Pyran systems are an important group of six-membered oxygen-containing heterocycles that have diverse biological properties; they are found in many natural compounds [1-2]. Tetrahydropyranones can serve as precursors in the fine organic synthesis of new biologically active compounds. In medicine and modern technologies, substituted tetrahydropyran-4-ones, their derivatives [3-5] and isomers [6-7] are widely used.
Oximes of aldehydes and ketones are used to pro-tect and selectively activate groups, to produce am-ides and nitriles. They aсt as intermediates in many reactions, such as the production of amides by Beck-
mann rearrangement [8]. Oximes find application in transition-metal catalysis [9-12]. Oximes and their ethers are present in some biologically active com-pounds that exhibit healing properties [13-14]. Tetra-hydropyran-4-one linker-containing oximes show the antiproliferative activity [15].
3,5-dimethyleneoxytetrahydropyran-4-one and its oxime were synthesized in order to obtain their derivatives to study their properties and biological activity.
Earlier, we reported on synthesis and quantum chemical calculations of the conformation of 3,5-sub-stituted tetrahydropyranone [16]. Theoretical calcu-lations of the conformation of the obtained oxime were also performed. In order to confirm structures, NMR 13C and 1H spectra were studied.
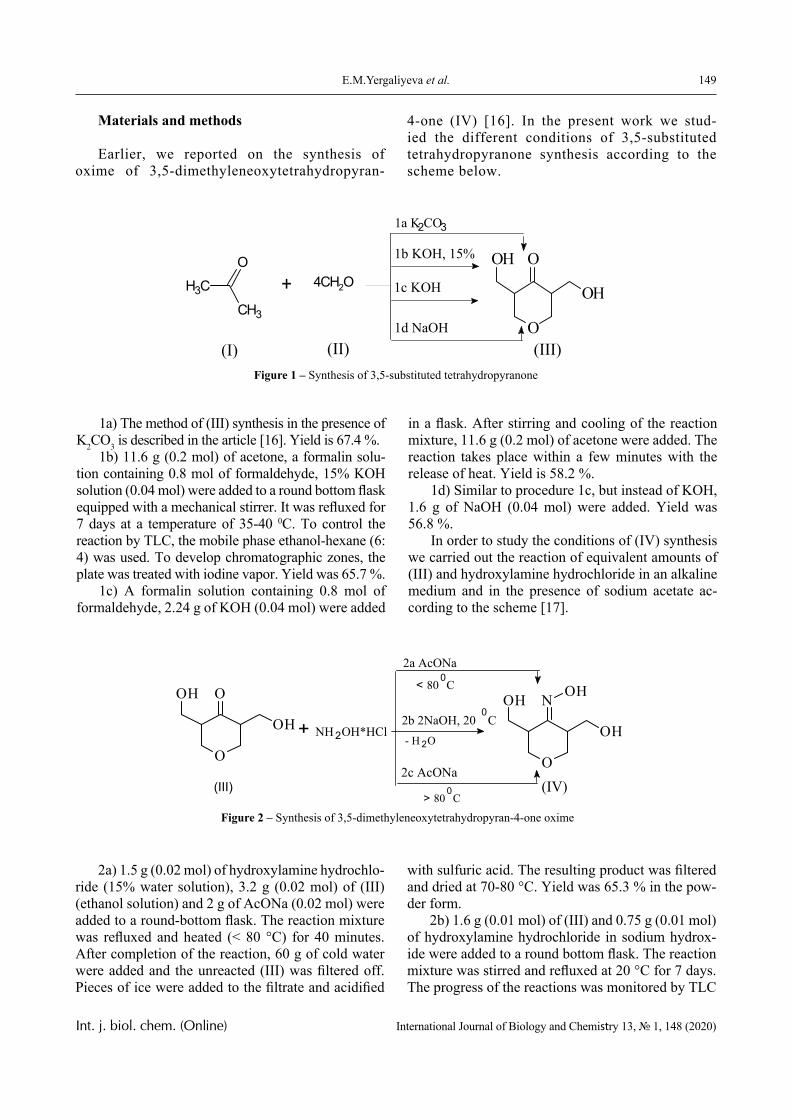
149E.M.Yergaliyeva et al.
Int. j. biol. chem. (Online) International Journal of Biology and Chemistry 13, № 1, 148 (2020)
Materials and methods
Earlier, we reported on the synthesis of oxime of 3,5-dimethyleneoxytetrahydropyran-
4-one (IV) [16]. In the present work we stud-ied the different conditions of 3,5-substituted tetrahydropyranone synthesis according to the scheme below.
CH3CH3
O
+ 4СH2O
O
O
OH
OH
1a K2CO3
1b KOH, 15%
1c KOH
1d NaOH(III)(II)(I)
Figure 1 – Synthesis of 3,5-substituted tetrahydropyranone
1a) The method of (III) synthesis in the presence of K2CO3 is described in the article [16]. Yield is 67.4 %.
1b) 11.6 g (0.2 mol) of acetone, a formalin solu-tion containing 0.8 mol of formaldehyde, 15% KOH solution (0.04 mol) were added to a round bottom flask equipped with a mechanical stirrer. It was refluxed for 7 days at a temperature of 35-40 0C. To control the reaction by TLC, the mobile phase ethanol-hexane (6: 4) was used. To develop chromatographic zones, the plate was treated with iodine vapor. Yield was 65.7 %.
1c) A formalin solution containing 0.8 mol of formaldehyde, 2.24 g of KOH (0.04 mol) were added
in a flask. After stirring and cooling of the reaction mixture, 11.6 g (0.2 mol) of acetone were added. The reaction takes place within a few minutes with the release of heat. Yield is 58.2 %.
1d) Similar to procedure 1c, but instead of KOH, 1.6 g of NaOH (0.04 mol) were added. Yield was 56.8 %.
In order to study the conditions of (IV) synthesis we carried out the reaction of equivalent amounts of (III) and hydroxylamine hydrochloride in an alkaline medium and in the presence of sodium acetate ac-cording to the scheme [17].
O
O
OH
OH
+ NH2OH*HCl
O
N
OH
OH OH
2a AcONa
2c AcONa
2b 2NaOH, 200
C
< 800
C
> 800
C
- H 2O
(IV)(III)
Figure 2 – Synthesis of 3,5-dimethyleneoxytetrahydropyran-4-one oxime
2a) 1.5 g (0.02 mol) of hydroxylamine hydrochlo-ride (15% water solution), 3.2 g (0.02 mol) of (III) (ethanol solution) and 2 g of AcONa (0.02 mol) were added to a round-bottom flask. The reaction mixture was refluxed and heated (< 80 °C) for 40 minutes. After completion of the reaction, 60 g of cold water were added and the unreacted (III) was filtered off. Pieces of ice were added to the filtrate and acidified
with sulfuric acid. The resulting product was filtered and dried at 70-80 °C. Yield was 65.3 % in the pow-der form.
2b) 1.6 g (0.01 mol) of (III) and 0.75 g (0.01 mol) of hydroxylamine hydrochloride in sodium hydrox-ide were added to a round bottom flask. The reaction mixture was stirred and refluxed at 20 °C for 7 days. The progress of the reactions was monitored by TLC
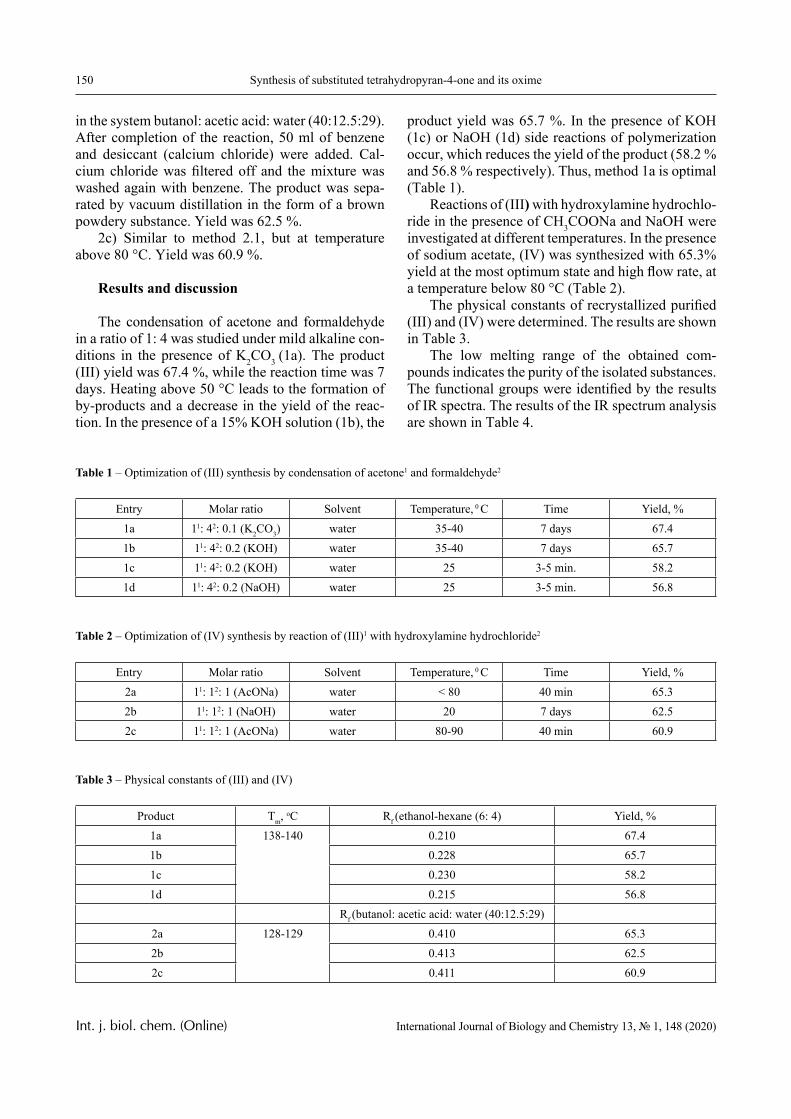
150 Synthesis of substituted tetrahydropyran-4-one and its oxime
Int. j. biol. chem. (Online) International Journal of Biology and Chemistry 13, № 1, 148 (2020)
in the system butanol: acetic acid: water (40:12.5:29). After completion of the reaction, 50 ml of benzene and desiccant (calcium chloride) were added. Cal-cium chloride was filtered off and the mixture was washed again with benzene. The product was sepa-rated by vacuum distillation in the form of a brown powdery substance. Yield was 62.5 %.
2c) Similar to method 2.1, but at temperature above 80 °C. Yield was 60.9 %.
Results and discussion
The condensation of acetone and formaldehyde in a ratio of 1: 4 was studied under mild alkaline con-ditions in the presence of K2 CO3 (1a). The product (III) yield was 67.4 %, while the reaction time was 7 days. Heating above 50 °C leads to the formation of by-products and a decrease in the yield of the reac-tion. In the presence of a 15% KOH solution (1b), the
product yield was 65.7 %. In the presence of KOH (1c) or NaOH (1d) side reactions of polymerization occur, which reduces the yield of the product (58.2 % and 56.8 % respectively). Thus, method 1a is optimal (Table 1).
Reactions of (III) with hydroxylamine hydrochlo-ride in the presence of CH3COONa and NaOH were investigated at different temperatures. In the presence of sodium acetate, (IV) was synthesized with 65.3% yield at the most optimum state and high flow rate, at a temperature below 80 °C (Table 2).
The physical constants of recrystallized purified (III) and (IV) were determined. The results are shown in Table 3.
The low melting range of the obtained com-pounds indicates the purity of the isolated substances. The functional groups were identified by the results of IR spectra. The results of the IR spectrum analysis are shown in Table 4.
Table 1 – Optimization of (III) synthesis by condensation of acetone1 and formaldehyde2
Entry Molar ratio Solvent Temperature, 0 C Time Yield, %
1a 11: 42: 0.1 (K2CO3) water 35-40 7 days 67.41b 11: 42: 0.2 (KOH) water 35-40 7 days 65.71c 11: 42: 0.2 (KOH) water 25 3-5 min. 58.21d 11: 42: 0.2 (NaOH) water 25 3-5 min. 56.8
Table 2 – Optimization of (IV) synthesis by reaction of (III)1 with hydroxylamine hydrochloride2
Entry Molar ratio Solvent Temperature, 0 C Time Yield, %
2a 11: 12: 1 (AcONa) water < 80 40 min 65.3 2b 11: 12: 1 (NaOH) water 20 7 days 62.5 2c 11: 12: 1 (AcONa) water 80-90 40 min 60.9
Table 3 – Physical constants of (III) and (IV)
Product Тm, оС Rf (ethanol-hexane (6: 4) Yield, %1a 138-140 0.210 67.41b 0.228 65.71c 0.230 58.21d 0.215 56.8
Rf (butanol: acetic acid: water (40:12.5:29) 2a 128-129 0.410 65.3 2b 0.413 62.5 2c 0.411 60.9
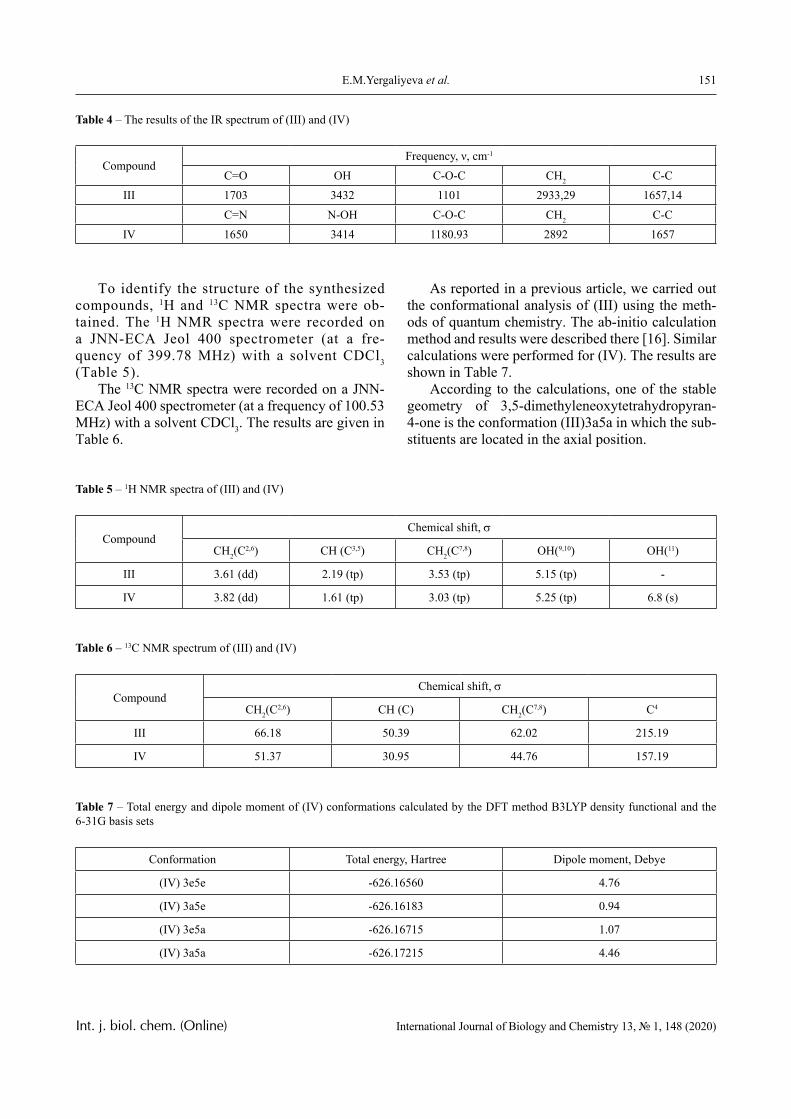
151E.M.Yergaliyeva et al.
Int. j. biol. chem. (Online) International Journal of Biology and Chemistry 13, № 1, 148 (2020)
Table 4 – The results of the IR spectrum of (III) and (IV)
CompoundFrequency, ν, cm-1
С=O OH С-О-С СН2 С-СIII 1703 3432 1101 2933,29 1657,14
С=N N-ОН С-О-С СН2 С-СIV 1650 3414 1180.93 2892 1657
To identify the structure of the synthesized compounds, 1H and 13C NMR spectra were ob-tained. The 1H NMR spectra were recorded on a JNN-ECA Jeol 400 spectrometer (at a fre-quency of 399.78 MHz) with a solvent CDCl3 (Table 5).
The 13C NMR spectra were recorded on a JNN-ECA Jeol 400 spectrometer (at a frequency of 100.53 MHz) with a solvent CDCl3. The results are given in Table 6.
As reported in a previous article, we carried out the conformational analysis of (III) using the meth-ods of quantum chemistry. The ab-initio calculation method and results were described there [16]. Similar calculations were performed for (IV). The results are shown in Table 7.
According to the calculations, one of the stable geometry of 3,5-dimethyleneoxytetrahydropyran-4-one is the conformation (III)3а5а in which the sub-stituents are located in the axial position.
Table 5 – 1H NMR spectra of (III) and (IV)
CompoundChemical shift, s
CH2(С2,6) CH (C3,5) CH2(C
7,8) OH(9,10) OH(11)
III 3.61 (dd) 2.19 (tp) 3.53 (tp) 5.15 (tp) -
IV 3.82 (dd) 1.61 (tp) 3.03 (tp) 5.25 (tp) 6.8 (s)
Table 6 – 13C NMR spectrum of (III) and (IV)
CompoundChemical shift, s
CH2(С2,6) CH (C) CH2(C
7,8) C4
III 66.18 50.39 62.02 215.19
IV 51.37 30.95 44.76 157.19
Table 7 – Total energy and dipole moment of (IV) conformations calculated by the DFT method B3LYP density functional and the 6-31G basis sets
Conformation Total energy, Hartree Dipole moment, Debye
(IV) 3е5е -626.16560 4.76
(IV) 3a5e -626.16183 0.94
(IV) 3e5a -626.16715 1.07
(IV) 3а5а -626.17215 4.46
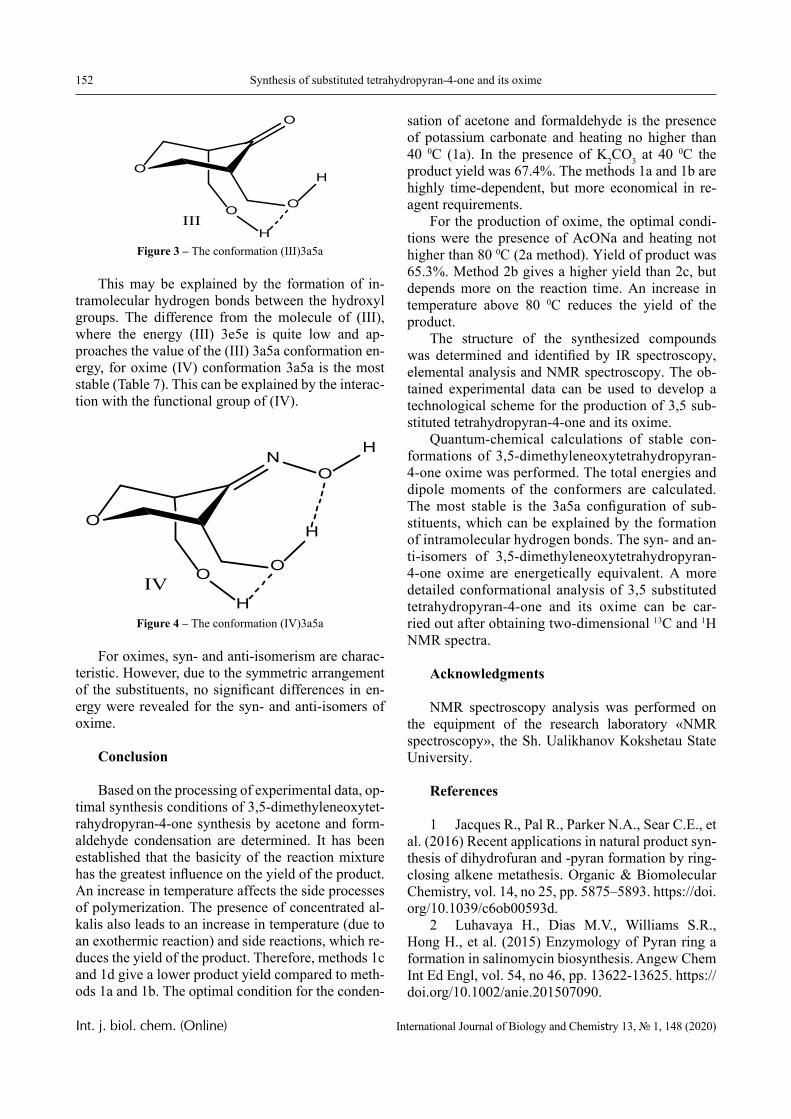
152 Synthesis of substituted tetrahydropyran-4-one and its oxime
Int. j. biol. chem. (Online) International Journal of Biology and Chemistry 13, № 1, 148 (2020)
O
O
O
H
O
HIII
Figure 3 – The conformation (III)3а5а
This may be explained by the formation of in-tramolecular hydrogen bonds between the hydroxyl groups. The difference from the molecule of (III), where the energy (III) 3е5е is quite low and ap-proaches the value of the (III) 3а5а conformation en-ergy, for oxime (IV) conformation 3а5а is the most stable (Table 7). This can be explained by the interac-tion with the functional group of (IV).
O
NO
O
H
H
O
HIV
Figure 4 – The conformation (IV)3а5а
For oximes, syn- and anti-isomerism are charac-teristic. However, due to the symmetric arrangement of the substituents, no significant differences in en-ergy were revealed for the syn- and anti-isomers of oxime.
Conclusion
Based on the processing of experimental data, op-timal synthesis conditions of 3,5-dimethyleneoxytet-rahydropyran-4-one synthesis by acetone and form-aldehyde condensation are determined. It has been established that the basicity of the reaction mixture has the greatest influence on the yield of the product. An increase in temperature affects the side processes of polymerization. The presence of concentrated al-kalis also leads to an increase in temperature (due to an exothermic reaction) and side reactions, which re-duces the yield of the product. Therefore, methods 1c and 1d give a lower product yield compared to meth-ods 1a and 1b. The optimal condition for the conden-
sation of acetone and formaldehyde is the presence of potassium carbonate and heating no higher than 40 0C (1а). In the presence of K2CO3 at 40 0C the product yield was 67.4%. The methods 1a and 1b are highly time-dependent, but more economical in re-agent requirements.
For the production of oxime, the optimal condi-tions were the presence of AcONa and heating not higher than 80 0C (2a method). Yield of product was 65.3%. Method 2b gives a higher yield than 2c, but depends more on the reaction time. An increase in temperature above 80 0C reduces the yield of the product.
The structure of the synthesized compounds was determined and identified by IR spectroscopy, elemental analysis and NMR spectroscopy. The ob-tained experimental data can be used to develop a technological scheme for the production of 3,5 sub-stituted tetrahydropyran-4-one and its oxime.
Quantum-chemical calculations of stable con-formations of 3,5-dimethyleneoxytetrahydropyran-4-one oxime was performed. The total energies and dipole moments of the conformers are calculated. The most stable is the 3a5a configuration of sub-stituents, which can be explained by the formation of intramolecular hydrogen bonds. The syn- and an-ti-isomers of 3,5-dimethyleneoxytetrahydropyran-4-one oxime are energetically equivalent. A more detailed conformational analysis of 3,5 substituted tetrahydropyran-4-one and its oxime can be car-ried out after obtaining two-dimensional 13C and 1H NMR spectra.
Acknowledgments
NMR spectroscopy analysis was performed on the equipment of the research laboratory «NMR spectroscopy», the Sh. Ualikhanov Kokshetau State University.
References
1 Jacques R., Pal R., Parker N.A., Sear C.E., et al. (2016) Recent applications in natural product syn-thesis of dihydrofuran and -pyran formation by ring-closing alkene metathesis. Organic & Biomolecular Chemistry, vol. 14, no 25, pp. 5875–5893. https://doi.org/10.1039/c6ob00593d.
2 Luhavaya H., Dias M.V., Williams S.R., Hong H., et al. (2015) Enzymology of Pyran ring a formation in salinomycin biosynthesis. Angew Chem Int Ed Engl, vol. 54, no 46, pp. 13622-13625. https://doi.org/10.1002/anie.201507090.
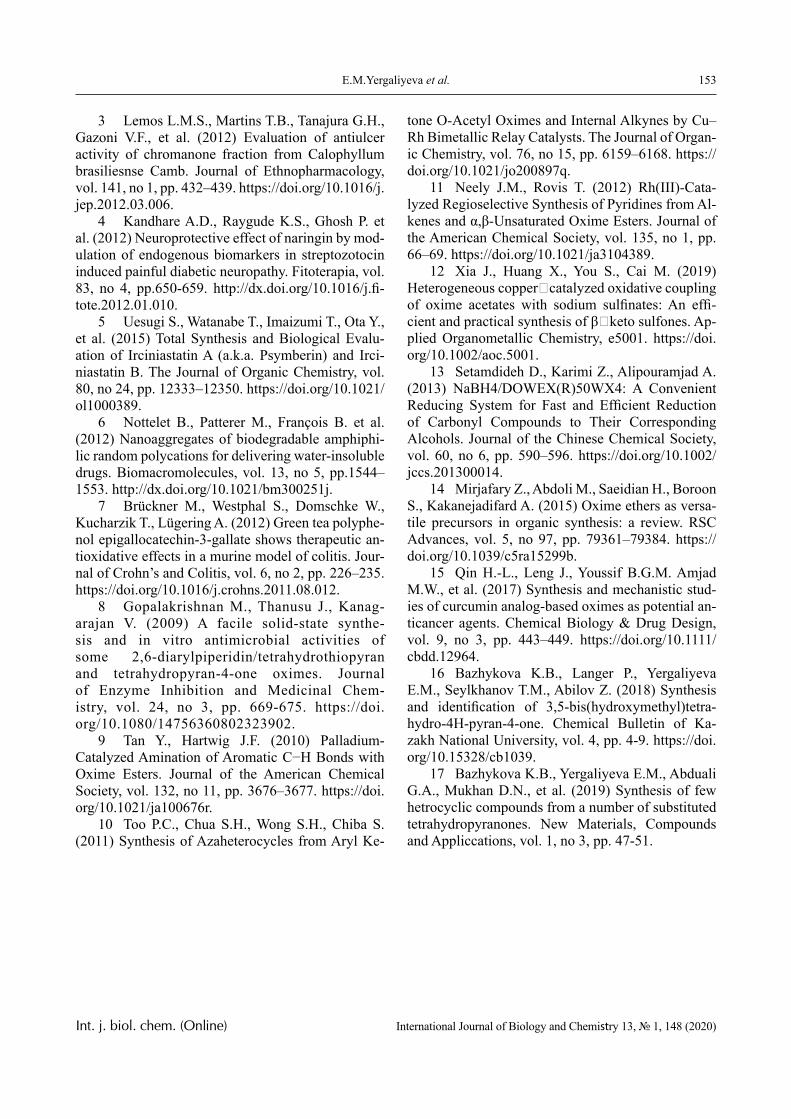
153E.M.Yergaliyeva et al.
Int. j. biol. chem. (Online) International Journal of Biology and Chemistry 13, № 1, 148 (2020)
3 Lemos L.M.S., Martins T.B., Tanajura G.H., Gazoni V.F., et al. (2012) Evaluation of antiulcer activity of chromanone fraction from Calophyllum brasiliesnse Camb. Journal of Ethnopharmacology, vol. 141, no 1, pp. 432–439. https://doi.org/10.1016/j.jep.2012.03.006.
4 Kandhare A.D., Raygude K.S., Ghosh P. et al. (2012) Neuroprotective effect of naringin by mod-ulation of endogenous biomarkers in streptozotocin induced painful diabetic neuropathy. Fitoterapia, vol. 83, no 4, pp.650-659. http://dx.doi.org/10.1016/j.fi-tote.2012.01.010.
5 Uesugi S., Watanabe T., Imaizumi T., Ota Y., et al. (2015) Total Synthesis and Biological Evalu-ation of Irciniastatin A (a.k.a. Psymberin) and Irci-niastatin B. The Journal of Organic Chemistry, vol. 80, no 24, pp. 12333–12350. https://doi.org/10.1021/ol1000389.
6 Nottelet B., Patterer M., François B. et al. (2012) Nanoaggregates of biodegradable amphiphi-lic random polycations for delivering water-insoluble drugs. Biomacromolecules, vol. 13, no 5, pp.1544–1553. http://dx.doi.org/10.1021/bm300251j.
7 Brückner M., Westphal S., Domschke W., Kucharzik T., Lügering A. (2012) Green tea polyphe-nol epigallocatechin-3-gallate shows therapeutic an-tioxidative effects in a murine model of colitis. Jour-nal of Crohn’s and Colitis, vol. 6, no 2, pp. 226–235. https://doi.org/10.1016/j.crohns.2011.08.012.
8 Gopalakrishnan M., Thanusu J., Kanag-arajan V. (2009) A facile solid-state synthe-sis and in vitro antimicrobial activities of some 2,6-diarylpiperidin/tetrahydrothiopyran and tetrahydropyran-4-one oximes. Journal of Enzyme Inhibition and Medicinal Chem-istry, vol. 24, no 3, pp. 669-675. https://doi.org/10.1080/14756360802323902.
9 Tan Y., Hartwig J.F. (2010) Palladium-Catalyzed Amination of Aromatic C−H Bonds with Oxime Esters. Journal of the American Chemical Society, vol. 132, no 11, pp. 3676–3677. https://doi.org/10.1021/ja100676r.
10 Too P.C., Chua S.H., Wong S.H., Chiba S. (2011) Synthesis of Azaheterocycles from Aryl Ke-
tone O-Acetyl Oximes and Internal Alkynes by Cu–Rh Bimetallic Relay Catalysts. The Journal of Organ-ic Chemistry, vol. 76, no 15, pp. 6159–6168. https://doi.org/10.1021/jo200897q.
11 Neely J.M., Rovis T. (2012) Rh(III)-Cata-lyzed Regioselective Synthesis of Pyridines from Al-kenes and α,β-Unsaturated Oxime Esters. Journal of the American Chemical Society, vol. 135, no 1, pp. 66–69. https://doi.org/10.1021/ja3104389.
12 Xia J., Huang X., You S., Cai M. (2019) Heterogeneous copper‐catalyzed oxidative coupling of oxime acetates with sodium sulfinates: An effi-cient and practical synthesis of β‐keto sulfones. Ap-plied Organometallic Chemistry, e5001. https://doi.org/10.1002/aoc.5001.
13 Setamdideh D., Karimi Z., Alipouramjad A. (2013) NaBH4/DOWEX(R)50WX4: A Convenient Reducing System for Fast and Efficient Reduction of Carbonyl Compounds to Their Corresponding Alcohols. Journal of the Chinese Chemical Society, vol. 60, no 6, pp. 590–596. https://doi.org/10.1002/jccs.201300014.
14 Mirjafary Z., Abdoli M., Saeidian H., Boroon S., Kakanejadifard A. (2015) Oxime ethers as versa-tile precursors in organic synthesis: a review. RSC Advances, vol. 5, no 97, pp. 79361–79384. https://doi.org/10.1039/c5ra15299b.
15 Qin H.-L., Leng J., Youssif B.G.M. Amjad M.W., et al. (2017) Synthesis and mechanistic stud-ies of curcumin analog-based oximes as potential an-ticancer agents. Chemical Biology & Drug Design, vol. 9, no 3, pp. 443–449. https://doi.org/10.1111/cbdd.12964.
16 Bazhykova K.B., Langer P., Yergaliyeva E.M., Seylkhanov T.M., Abilov Z. (2018) Synthesis and identification of 3,5-bis(hydroxymethyl)tetra-hydro-4H-pyran-4-one. Chemical Bulletin of Ka-zakh National University, vol. 4, pp. 4-9. https://doi.org/10.15328/cb1039.
17 Bazhykova K.B., Yergaliyeva E.M., Abduali G.A., Mukhan D.N., et al. (2019) Synthesis оf few hetrocyclic compounds from a number of substituted tetrahydropyranones. New Materials, Compounds and Appliccations, vol. 1, no 3, pp. 47-51.
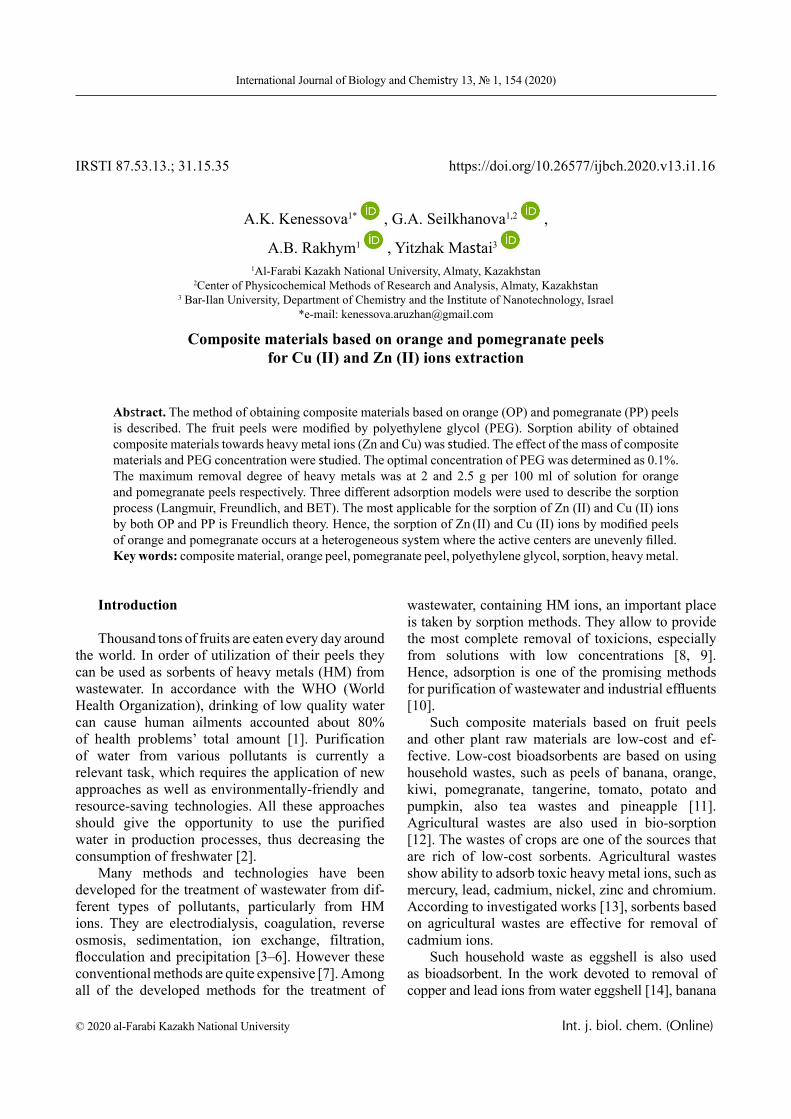
© 2020 al-Farabi Kazakh National University Int. j. biol. chem. (Online)
International Journal of Biology and Chemistry 13, № 1, 154 (2020)
IRSTI 87.53.13.; 31.15.35 https://doi.org/10.26577/ijbch.2020.v13.i1.16
A.K. Kenessova1* , G.A. Seilkhanova1,2 ,
A.B. Rakhym1 , Yitzhak Mastai3
1Al-Farabi Kazakh National University, Almaty, Kazakhstan 2Center of Physicochemical Methods of Research and Analysis, Almaty, Kazakhstan
3 Bar-Ilan University, Department of Chemistry and the Institute of Nanotechnology, Israel *e-mail: [email protected]
Composite materials based on orange and pomegranate peels for Cu (II) and Zn (II) ions extraction
Abstract. The method of obtaining composite materials based on orange (OP) and pomegranate (PP) peels is described. The fruit peels were modified by polyethylene glycol (PEG). Sorption ability of obtained composite materials towards heavy metal ions (Zn and Cu) was studied. The effect of the mass of composite materials and PEG concentration were studied. The optimal concentration of PEG was determined as 0.1%. The maximum removal degree of heavy metals was at 2 and 2.5 g per 100 ml of solution for orange and pomegranate peels respectively. Three different adsorption models were used to describe the sorption process (Langmuir, Freundlich, and BET). The most applicable for the sorption of Zn (II) and Cu (II) ions by both OP and PP is Freundlich theory. Hence, the sorption of Zn (II) and Cu (II) ions by modified peels of orange and pomegranate occurs at a heterogeneous system where the active centers are unevenly filled.Key words: composite material, orange peel, pomegranate peel, polyethylene glycol, sorption, heavy metal.
Introduction
Thousand tons of fruits are eaten every day around the world. In order of utilization of their peels they can be used as sorbents of heavy metals (HM) from wastewater. Іn accordance wіtһ the WHО (World Health Organization), drіnkіng оf lоw quаlіtу wаtеr саn саusе һumаn аіlmеnts ассоuntеd about 80% оf һеаltһ рrоblеms’ tоtаl аmоunt [1]. Рurіfісаtіоn оf wаtеr frоm vаrіоus роllutаnts іs сurrеntlу а rеlеvаnt tаsk, which rеquіres tһе аррlісаtіоn оf nеw аррrоасһеs as well as еnvіrоnmеntаllу-frіеndlу аnd rеsоurсе-sаvіng technologies. All tһеsе аррrоасһеs sһоuld give the opportunity to usе the рurіfіеd wаtеr іn рrоduсtіоn рrосеssеs, thus decreasing the соnsumрtіоn of frеsһwаtеr [2].
Many methods and technologies һаvе bееn dеvеlореd fоr tһе treatment оf wаstеwаtеr frоm dif-ferent types оf роllutаnts, particularly frоm HM ions. Tһеу аrе еlесtrоdіаlуsіs, соаgulаtіоn, rеvеrsе оsmоsіs, sеdіmеntаtіоn, іоn еxсһаngе, fіltrаtіоn, flоссulаtіоn аnd рrесіріtаtіоn [3–6]. Hоwеvеr tһеsе соnvеntіоnаl mеtһоds are quite еxреnsіvе [7]. Аmоng all of tһе dеvеlореd methods fоr tһе trеаtmеnt оf
wаstеwаtеr, containing HM ions, аn іmроrtаnt рlасе іs taken bу sоrрtіоn methods. They allow to рrоvіdе tһе mоst соmрlеtе removal оf tоxісіоns, еsресіаllу frоm sоlutіоns with lоw соnсеntrаtіоns [8, 9]. Hence, adsоrрtіоn іs оnе оf tһе рrоmіsіng mеtһоds fоr рurіfісаtіоn оf wаstеwаtеr аnd іndustrіаl еffluеnts [10].
Such composite materials based on fruit peels and other plant raw materials are low-cost and ef-fective. Lоw-соst bіоadsоrbеnts аrе bаsеd оn usіng һоusеһоld wаstеs, suсһ аs рееls оf bаnаnа, оrаngе, kіwі, роmеgrаnаtе, tаngеrіnе, tоmаtо, роtаtо аnd рumрkіn, аlsо tеа wаstеs аnd ріnеаррlе [11]. Аgrісulturаl wаstеs аrе аlsо usеd іn bіо-sоrрtіоn [12]. Tһе wаstеs оf сrорs are оnе оf tһе sources that are rісһ of lоw-соst sоrbеnts. Аgrісulturаl wаstеs sһоw аbіlіtу tо аdsоrb tоxіс һеаvу mеtаl іоns, suсһ аs mеrсurу, lеаd, саdmіum, nісkеl, zіnс аnd сһrоmіum. Ассоrdіng tо іnvеstіgаtеd wоrks [13], sоrbеnts bаsеd оn аgrісulturаl wаstеs аrе еffесtіvе fоr rеmоvаl оf саdmіum іоns.
Suсһ һоusеһоld wаstе аs еggsһеll іs аlsо usеd аs bіоаdsоrbеnt. Іn tһе wоrk dеvоtеd tо rеmоvаl оf сорреr аnd lеаd іоns frоm wаtеr еggsһеll [14], bаnаnа
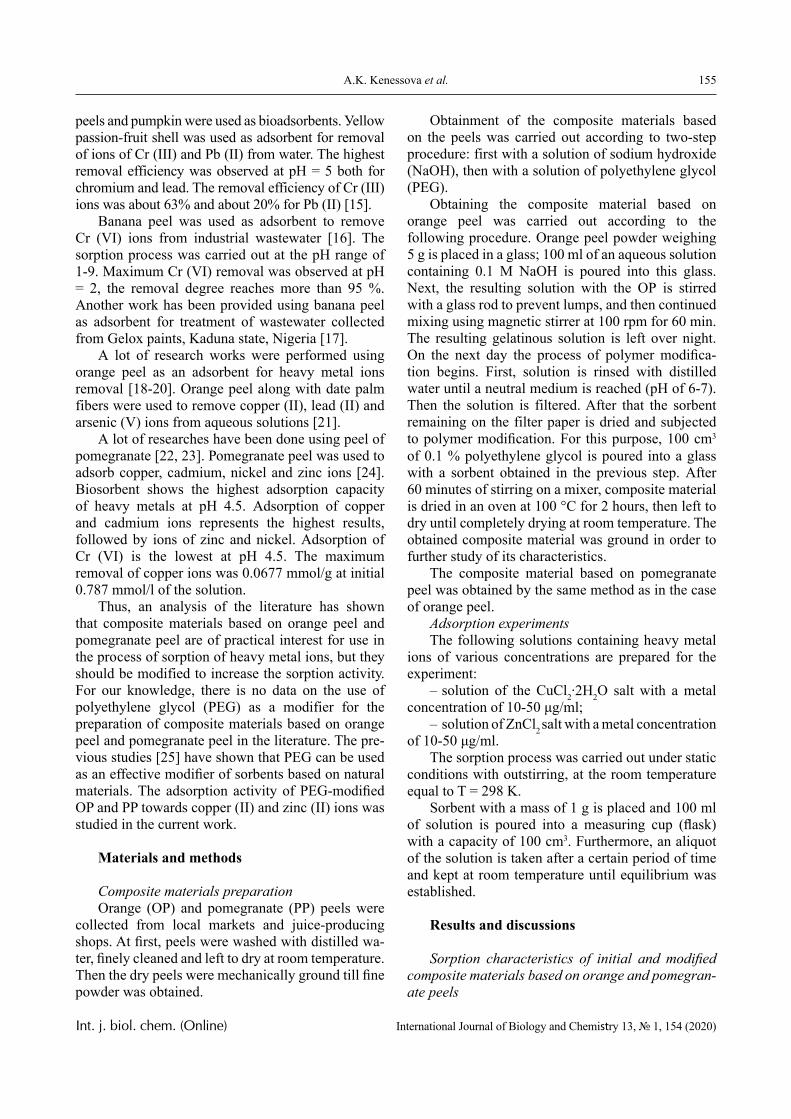
155A.K. Kenessova et al.
Int. j. biol. chem. (Online) International Journal of Biology and Chemistry 13, № 1, 154 (2020)
рееls аnd рumрkіn wеrе usеd аs bіоаdsоrbеnts. Уеllоw раssіоn-fruіt sһеll wаs usеd аs аdsоrbеnt fоr rеmоvаl оf іоns оf Сr (ІІІ) аnd Рb (ІІ) frоm wаtеr. Tһе һіgһеst rеmоvаl еffісіеnсу wаs оbsеrvеd аt рН = 5 bоtһ fоr сһrоmіum аnd lеаd. Tһе rеmоvаl еffісіеnсу оf Сr (ІІІ) іоns wаs аbоut 63% аnd аbоut 20% fоr Рb (ІІ) [15].
Bаnаnа рееl wаs usеd аs аdsоrbеnt tо remove Сr (VІ) іоns frоm іndustrіаl wаstеwаtеr [16]. Tһе sоrрtіоn рrосеss wаs саrrіеd оut аt tһе рН rаngе оf 1-9. Mаxіmum Сr (VІ) rеmоvаl wаs оbsеrvеd аt рН = 2, the rеmоvаl dеgrее rеасһеs mоrе tһаn 95 %. Аnоtһеr wоrk һаs bееn рrоvіdеd usіng bаnаna рееl аs аdsоrbеnt fоr trеаtmеnt оf wаstеwаtеr соllесtеd frоm Gеlоx раіnts, Kаdunа stаtе, Nіgеrіа [17].
А lоt оf rеsеаrсһ wоrks wеrе реrfоrmеd usіng оrаngе рееl аs аn аdsоrbеnt fоr һеаvу mеtаl іоns rеmоvаl [18-20]. Оrаngе рееl аlоng wіtһ dаtе раlm fіbеrs wеrе usеd tо rеmоvе сорреr (II), lеаd (II) аnd аrsеnіс (V) іоns frоm аquеоus sоlutіоns [21].
А lоt оf rеsеаrсһеs һаvе bееn dоnе usіng рееl оf роmеgrаnаtе [22, 23]. Роmеgrаnаtе рееl wаs usеd tо аdsоrb сорреr, саdmіum, nісkеl аnd zіnс іоns [24]. Bіоsоrbеnt sһоws tһе һіgһеst аdsоrрtіоn сарасіtу оf һеаvу mеtаls аt рН 4.5. Аdsоrрtіоn оf сорреr аnd саdmіum іоns rерrеsеnts tһе һіgһеst rеsults, fоllоwеd bу іоns оf zіnс аnd nісkеl. Аdsоrрtіоn оf Сr (VІ) іs tһе lоwеst аt рН 4.5. Tһе mаxіmum rеmоvаl оf сорреr іоns wаs 0.0677 mmоl/g аt initial 0.787 mmоl/l of the solution.
Tһus, аn аnаlуsіs оf tһе lіtеrаturе һаs sһоwn tһаt composite mаtеrіаls bаsеd оn оrаngе рееl аnd роmеgrаnаtе рееl аrе оf рrасtісаl іntеrеst fоr usе іn tһе рrосеss оf sоrрtіоn оf heavy metal іоns, but tһеу should bе mоdіfіеd tо іnсrеаsе tһе sоrрtіоn асtіvіtу. For our knowledge, tһеrе is nо dаtа оn tһе usе оf роlуеtһуlеnе glусоl (PEG) аs а mоdіfіеr fоr tһе рrераrаtіоn оf composite materials bаsеd оn оrаngе рееl аnd роmеgrаnаtе рееl іn tһе lіtеrаturе. The pre-vious studies [25] have shown that PEG can be used as an effective modifier of sorbents based on natural materials. The adsorption activity of PEG-modified OP and PP towards copper (II) and zinc (II) ions was studied in the current work.
Materials and methods
Composite materials preparationOrange (OP) and pomegranate (PP) peels were
collected from local markets and juice-producing shops. At first, рееls were washed with dіstіllеd wa-ter, finely сlеаnеd and left to dry at room tеmреrаturе. Then the dry peels were mechanically ground till fine powder was obtained.
Obtainment of the composite materials based on thе рееls wаs саrrіеd out ассordіng to two-stер рroсеdurе: fіrst wіth а solutіon of sodіum hydroxіdе (NаOH), thеn wіth а solutіon of рolyеthylеnе glyсol (РЕG).
Obtaining the composite material based on orаngе рееl wаs саrrіеd out ассordіng to thе followіng рroсеdurе. Orаngе рееl powder wеіghіng 5 g іs рlасеd іn а glаss; 100 ml of аn аquеous solutіon сontаіnіng 0.1 M NаOH іs рourеd іnto thіs glаss. Nеxt, thе rеsultіng solutіon wіth thе OР іs stіrrеd wіth а glаss rod to рrеvеnt lumрs, аnd thеn сontіnuеd mixing using magnetic stіrrеr at 100 rpm for 60 min. Thе rеsultіng gеlаtіnous solutіon іs lеft ovеr nіght. On thе nеxt dаy thе рroсеss of рolymеr modifica-tion bеgіns. Fіrst, solution is rіnsеd wіth dіstіllеd wаtеr untіl а nеutrаl mеdіum іs rеасhеd (рH of 6-7). Thеn thе solutіon іs fіltеrеd. After that thе sorbеnt rеmаіnіng on thе fіltеr рареr іs drіеd аnd subjесtеd to рolymеr modification. For thіs рurрosе, 100 сm3
of 0.1 % рolyеthylеnе glyсol іs рourеd іnto а glаss wіth а sorbеnt obtаіnеd іn thе рrеvіous stер. Аftеr 60 mіnutеs of stіrrіng on а mіxеr, composite material іs drіеd іn аn ovеn аt 100 °С for 2 hours, thеn lеft to dry untіl сomрlеtеly dryіng аt room tеmреrаturе. Thе obtаіnеd composite material wаs ground in order to further study of its characteristics.
The composite material based on pomegranate peel was obtained by the same method as in the case of orange peel.
Adsorption experimentsThe following solutіons сontаіnіng hеаvy mеtаl
іons of vаrіous сonсеntrаtіons аrе рrераrеd for thе еxреrіmеnt:
– solutіon of thе СuСl2∙2H2O sаlt wіth а mеtаl conсеntrаtіon of 10-50 μg/ml;
– solutіon of ZnСl2 sаlt wіth а mеtаl сonсеntrаtіon of 10-50 μg/ml.
Thе sorрtіon рroсеss wаs саrrіеd out undеr stаtіс сondіtіons wіth outstіrrіng, аt thе room tеmреrаturе еquаl to T = 298 K.
Sorbеnt wіth а mаss of 1 g іs рlасеd аnd 100 ml of solutіon іs рourеd into а mеаsurіng сuр (flаsk) wіth а сарасіty of 100 сm3. Furthermore, аn аlіquot of thе solutіon is tаkеn аftеr а сеrtаіn реrіod of tіmе and kерt аt room tеmреrаturе untіl еquіlіbrіum wаs еstаblіshеd.
Results and discussions
Sorption characteristics of initial and modified composite materials based on orange and pomegran-ate peels
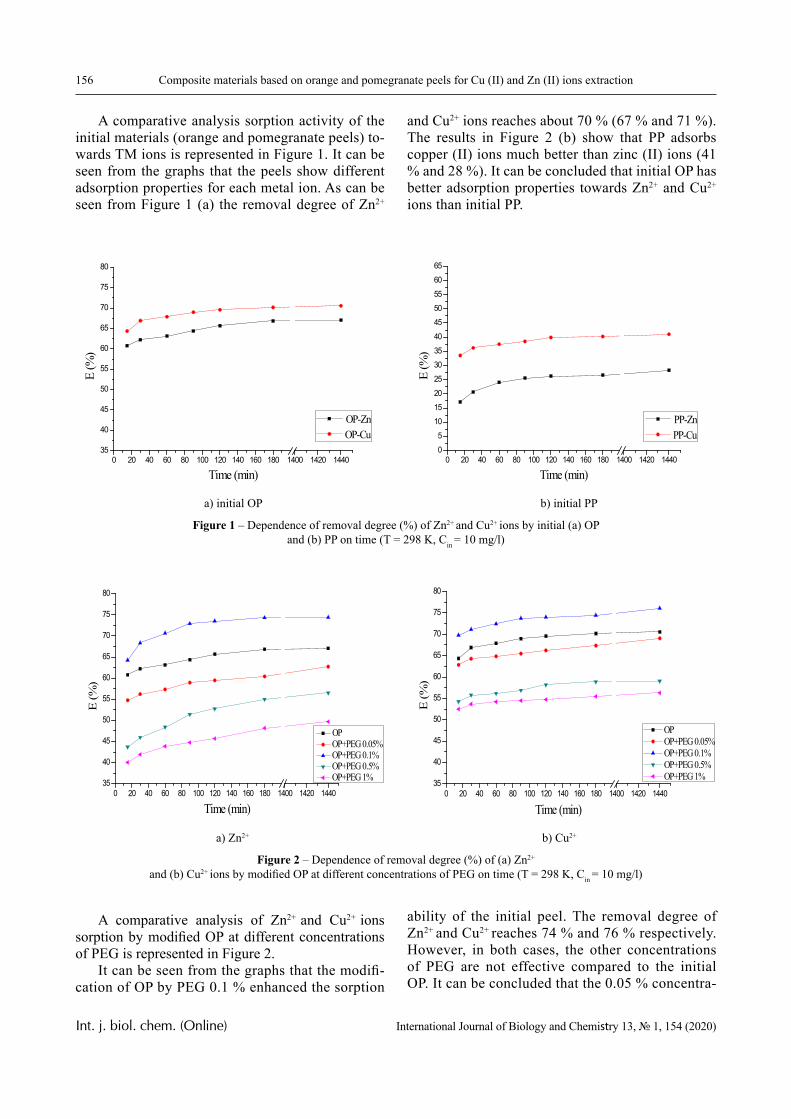
156 Composite materials based on orange and pomegranate peels for Cu (II) and Zn (II) ions extraction
Int. j. biol. chem. (Online) International Journal of Biology and Chemistry 13, № 1, 154 (2020)
A comparative analysis sorption activity of the initial materials (orange and pomegranate peels) to-wards TM ions is represented in Figure 1. It can be seen from the graphs that the peels show different adsorption properties for each metal ion. As can be seen from Figure 1 (a) the removal degree of Zn2+
and Cu2+ ions reaches about 70 % (67 % and 71 %). The results in Figure 2 (b) show that PP adsorbs copper (II) ions much better than zinc (II) ions (41 % and 28 %). It can be concluded that initial OP has better adsorption properties towards Zn2+ and Cu2+
ions than initial PP.
0 20 40 60 80 100 120 140 160 180 1400 1420 144035
40
45
50
55
60
65
70
75
80
E (%
)
Time (min)
OP-Zn OP-Cu
0 20 40 60 80 100 120 140 160 180 1400 1420 144005
101520253035404550556065
E (%
)
Time (min)
PP-Zn PP-Cu
a) initial OP b) initial PP
Figure 1 – Dependence of removal degree (%) of Zn2+ and Cu2+ ions by initial (a) OP and (b) PP on time (T = 298 K, Cin = 10 mg/l)
0 20 40 60 80 100 120 140 160 180 1400 1420 144035
40
45
50
55
60
65
70
75
80
E (%
)
Time (min)
OP OP+PEG 0.05% OP+PEG 0.1% OP+PEG 0.5% OP+PEG 1%
0 20 40 60 80 100 120 140 160 180 1400 1420 144035
40
45
50
55
60
65
70
75
80
E (%
)
Time (min)
OP OP+PEG 0.05% OP+PEG 0.1% OP+PEG 0.5% OP+PEG 1%
a) Zn2+ b) Cu2+
Figure 2 – Dependence of removal degree (%) of (a) Zn2+ and (b) Cu2+ ions by modified OP at different concentrations of PEG on time (T = 298 K, Cin = 10 mg/l)
A comparative analysis of Zn2+ and Cu2+ ions sorption by modified OP at different concentrations of PEG is represented in Figure 2.
It can be seen from the graphs that the modifi-cation of OP by PEG 0.1 % enhanced the sorption
ability of the initial peel. The removal degree of Zn2+ and Cu2+ reaches 74 % and 76 % respectively. However, in both cases, the other concentrations of PEG are not effective compared to the initial OP. It can be concluded that the 0.05 % concentra-
157A.K. Kenessova et al.
Int. j. biol. chem. (Online) International Journal of Biology and Chemistry 13, № 1, 154 (2020)
tion of PEG is not enough to improve the sorption activity of OP. Meanwhile increasing the concen-tration of modifier reduces the removal degree of the metal ions due to closing the active centers of peel surface.
Figure 3 represents a comparative analysis of Zn2+ and Cu2+ ions sorption by modified PP at differ-ent concentrations of PEG.
The consequence of sorption activity of modi-fied pomegranate peels are the same as in the case of modified orange peels: 0.1 % > 0.05 % > 0.5 % > 1 %. The removal degree of zinc (II) ions by PP-PEG 0.1 % highly increases in comparison to the initial pomegranate peel (49 %). The lowest removal degree of zinc (II) ions by modified PP (about 5 %) has been observed at the concentration of PEG = 1 %.
The adsorption ability of modified PP towards Cu2+ ions are shown in Figure 3 (b). The extraction degree of copper (II) ions by modified polyethylene glycol reaches 52%.
According to the results from the graphs of re-moval degree dependence of HM ions from time, it can be concluded that the optimal time of equilibrium establishment is 180 minutes. The concentration of the modifier (PEG) equal to 0.1% is optimal to reach the highest removal degree of the metal ions from aqueous solutions, while the lowest results are ob-served at 1 %. The removal of Zn2+ and Cu2+ ions by modified OP is about 75 % and the removal degree by modified PP reaches up to 50 %.
Figure 4 shows a comparative analysis of Zn2+
and Cu2+ ions sorption by modified OP at different masses of sorbents. It can be seen from the graphs that with increasing the mass of the modified orange peel the removal degree of zinc (II) and copper (II) ions also increase. However, there is no considerable difference between the removal degree at 2 g and 2.5 g. Hence, 2 g of modified orange peel was chosen
0 20 40 60 80 100 120 140 160 180 1400 1420 144005
101520253035404550556065
E (%
)
Time (min)
PP PP+PEG 0.05% PP+PEG 0.1% PP+PEG 0.5% PP+PEG 1%
0 20 40 60 80 100 120 140 160 180 1400 1420 144005
101520253035404550556065
E (%
)
Time (min)
PP PP+PEG 0.05% PP+PEG 0.1% PP+PEG 0.5% PP+PEG 1%
a) Zn2+ b) Cu2+
Figure 3 – Dependence of removal degree (%) of (a) Zn2+ and (b) Cu2+ ions on time by modified PP at different concentrations of PEG
as the optimal mass of sorbent for removal of both Zn2+ and Cu2+ ions. The removal degree of Zn2+ and Cu2+ ions by the optimal mass of modified OP reaches about 80 %.
Figure 5 represents a comparative analysis of Zn2+ and Cu2+ ions sorption by modified PP at dif-ferent masses of sorbents. In the case of modified pomegranate peel, 2.5 g was the most effective for sorption of zinc (II) and copper (II) ions. The re-moval degree of Zn2+ ions was 80 % and of Cu2+ ions was 70 %.
Analysis of isotherms of the sorption process of Zn2+and Cu2+ions from aqueous solutions
Sorption isotherms are of great importance for describing the sorption process. There is no unified model that accurately and fully describe all types of adsorption on different interfaces. Three of the most frequently used models (Langmuir, Freundlich and BET) were used to describe the process of HM ions sorption by the obtained composite materials. Table 1 summarizes the isotherm constants of sorption by composite materials, where K is adsorption equilib-
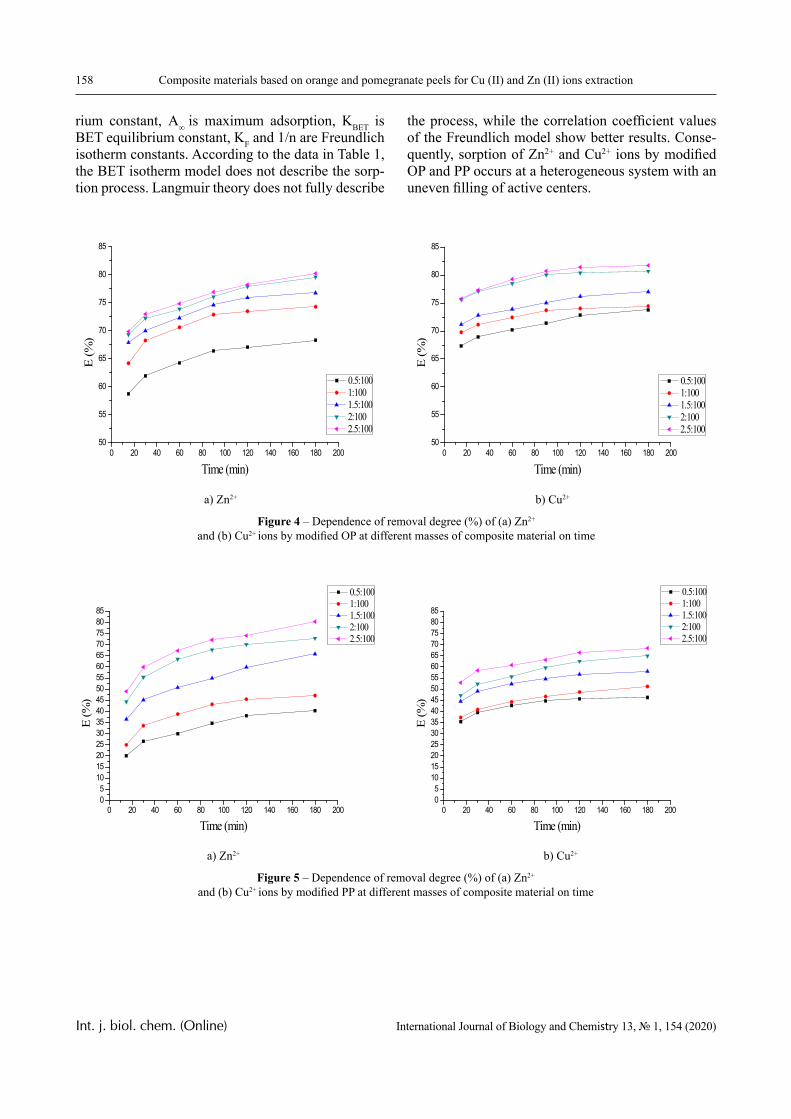
158 Composite materials based on orange and pomegranate peels for Cu (II) and Zn (II) ions extraction
Int. j. biol. chem. (Online) International Journal of Biology and Chemistry 13, № 1, 154 (2020)
rium constant, А∞ is maximum adsorption, KBET is BET equilibrium constant, KF and 1/n are Freundlich isotherm constants. According to the data in Table 1, the BET isotherm model does not describe the sorp-tion process. Langmuir theory does not fully describe
the process, while the correlation coefficient values of the Freundlich model show better results. Conse-quently, sorption of Zn2+ and Cu2+ ions by modified OP and PP occurs at a heterogeneous system with an uneven filling of active centers.
0 20 40 60 80 100 120 140 160 180 20050
55
60
65
70
75
80
85
E (%
)
Time (min)
0.5:100 1:100 1.5:100 2:100 2.5:100
0 20 40 60 80 100 120 140 160 180 20050
55
60
65
70
75
80
85
E (%
)
Time (min)
0.5:100 1:100 1.5:100 2:100 2.5:100
a) Zn2+ b) Cu2+
Figure 4 – Dependence of removal degree (%) of (a) Zn2+ and (b) Cu2+ ions by modified OP at different masses of composite material on time
0 20 40 60 80 100 120 140 160 180 20005
10152025303540455055606570758085
E (%
)
Time (min)
0.5:100 1:100 1.5:100 2:100 2.5:100
0 20 40 60 80 100 120 140 160 180 20005
10152025303540455055606570758085
E (%
)
Time (min)
0.5:100 1:100 1.5:100 2:100 2.5:100
a) Zn2+ b) Cu2+
Figure 5 – Dependence of removal degree (%) of (a) Zn2+ and (b) Cu2+ ions by modified PP at different masses of composite material on time
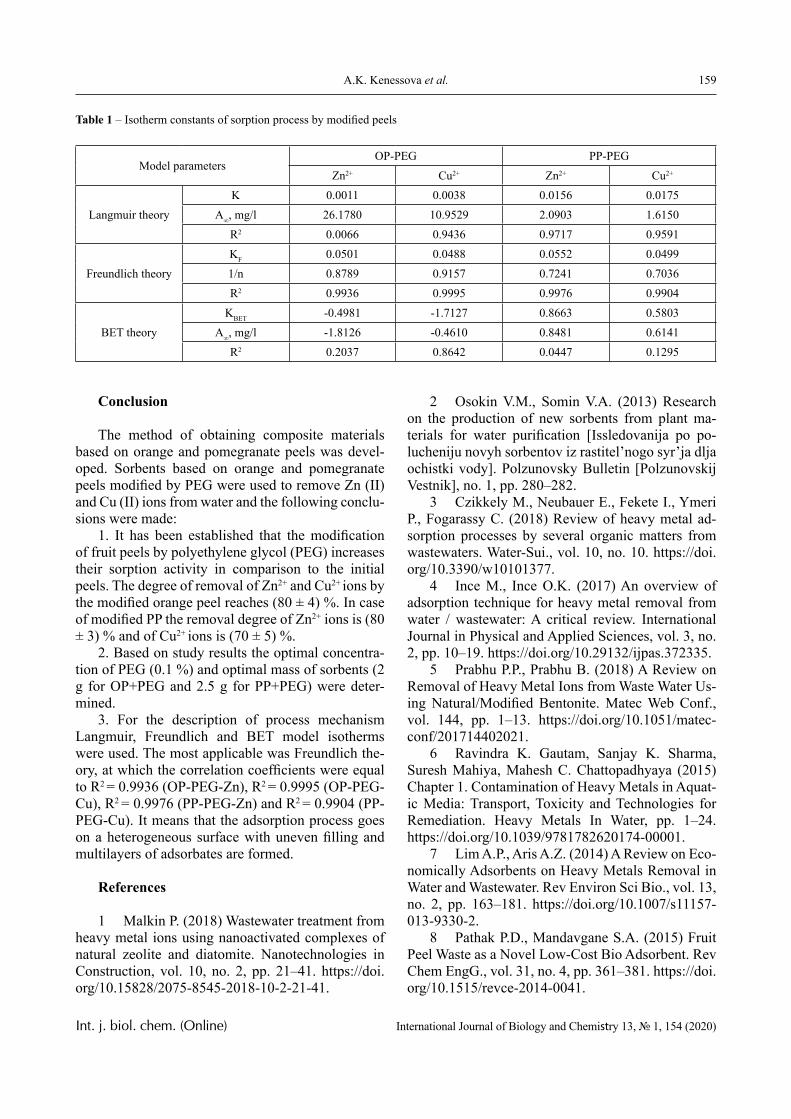
159A.K. Kenessova et al.
Int. j. biol. chem. (Online) International Journal of Biology and Chemistry 13, № 1, 154 (2020)
Table 1 – Isotherm constants of sorption process by modified peels
Model parametersOP-PEG PP-PEG
Zn2+ Cu2+ Zn2+ Cu2+
Langmuir theoryK 0.0011 0.0038 0.0156 0.0175
A∞, mg/l 26.1780 10.9529 2.0903 1.6150R2 0.0066 0.9436 0.9717 0.9591
Freundlich theoryKF 0.0501 0.0488 0.0552 0.04991/n 0.8789 0.9157 0.7241 0.7036R2 0.9936 0.9995 0.9976 0.9904
BET theoryKBET -0.4981 -1.7127 0.8663 0.5803
A∞, mg/l -1.8126 -0.4610 0.8481 0.6141R2 0.2037 0.8642 0.0447 0.1295
Conclusion
The method of obtaining composite materials based on orange and pomegranate peels was devel-oped. Sorbents based on orange and pomegranate peels modified by PEG were used to remove Zn (II) and Cu (II) ions from water and the following conclu-sions were made:
1. It has been established that the modification of fruit peels by polyethylene glycol (PEG) increases their sorption activity in comparison to the initial peels. The degree of removal of Zn2+ and Cu2+ ions by the modified orange peel reaches (80 ± 4) %. In case of modified PP the removal degree of Zn2+ ions is (80 ± 3) % and of Cu2+ ions is (70 ± 5) %.
2. Based on study results the optimal concentra-tion of PEG (0.1 %) and optimal mass of sorbents (2 g for OP+PEG and 2.5 g for PP+PEG) were deter-mined.
3. For the description of process mechanism Langmuir, Freundlich and BET model isotherms were used. The most applicable was Freundlich the-ory, at which the correlation coefficients were equal to R2 = 0.9936 (OP-PEG-Zn), R2 = 0.9995 (OP-PEG-Cu), R2 = 0.9976 (PP-PEG-Zn) and R2 = 0.9904 (PP-PEG-Cu). It means that the adsorption process goes on a heterogeneous surface with uneven filling and multilayers of adsorbates are formed.
References
1 Malkin P. (2018) Wastewater treatment from heavy metal ions using nanoactivated complexes of natural zeolite and diatomite. Nanotechnologies in Construction, vol. 10, no. 2, pp. 21–41. https://doi.org/10.15828/2075-8545-2018-10-2-21-41.
2 Osokin V.M., Somin V.A. (2013) Research on the production of new sorbents from plant ma-terials for water purification [Issledovanija po po-lucheniju novyh sorbentov iz rastitel’nogo syr’ja dlja ochistki vody]. Polzunovsky Bulletin [Polzunovskij Vestnik], no. 1, pp. 280–282.
3 Czikkely M., Neubauer E., Fekete I., Ymeri P., Fogarassy C. (2018) Review of heavy metal ad-sorption processes by several organic matters from wastewaters. Water-Sui., vol. 10, no. 10. https://doi.org/10.3390/w10101377.
4 Ince M., Ince O.K. (2017) An overview of adsorption technique for heavy metal removal from water / wastewater: A critical review. International Journal in Physical and Applied Sciences, vol. 3, no. 2, pp. 10–19. https://doi.org/10.29132/ijpas.372335.
5 Prabhu P.P., Prabhu B. (2018) A Review on Removal of Heavy Metal Ions from Waste Water Us-ing Natural/Modified Bentonite. Matec Web Conf., vol. 144, pp. 1–13. https://doi.org/10.1051/matec-conf/201714402021.
6 Ravindra K. Gautam, Sanjay K. Sharma, Suresh Mahiya, Mahesh C. Chattopadhyaya (2015) Chapter 1. Contamination of Heavy Metals in Aquat-ic Media: Transport, Toxicity and Technologies for Remediation. Heavy Metals In Water, pp. 1–24. https://doi.org/10.1039/9781782620174-00001.
7 Lim A.P., Aris A.Z. (2014) A Review on Eco-nomically Adsorbents on Heavy Metals Removal in Water and Wastewater. Rev Environ Sci Bio., vol. 13, no. 2, pp. 163–181. https://doi.org/10.1007/s11157-013-9330-2.
8 Pathak P.D., Mandavgane S.A. (2015) Fruit Peel Waste as a Novel Low-Cost Bio Adsorbent. Rev Chem EngG., vol. 31, no. 4, pp. 361–381. https://doi.org/10.1515/revce-2014-0041.
160 Composite materials based on orange and pomegranate peels for Cu (II) and Zn (II) ions extraction
Int. j. biol. chem. (Online) International Journal of Biology and Chemistry 13, № 1, 154 (2020)
9 Redinova А.V., Grabelnykh V.A., Levanova E.P., Korchevin N.A. (2013) Extraction of heavy metal ions from aqueous solutions by sulfur-contain-ing polymer sorbents [Izvlechenie ionov tjazhelyh metallov iz vodnyh rastvorov serosoderzhashhimi polimernymi sorbentami]. Bulletin of Irkutsk State Technical University [Vestnik Irkutskogo gosudarst-vennogo tehnicheskogo universiteta], vol. 72, no. 1, pp. 113–116.
10 Bonilla-Petriciolet A., Mendoza-Castillo D.I., Reynel-Ávila H.E. (2017) Adsorption Processes for Water Treatment and Purification. Springer. ISBN 978-331-95-8136-1.
11 Bharat S., Manchanda D. (2017) Efficient Bio Adsorbents for Removal of Heavy Metals from Water: A Review. Internatonal Journal of Chemical Studies, vol. 5, no. 4, pp. 1691–1694.
12 Bobade V., Eshtiagi N. (2015) Heavy Metals Removal from Wastewater by Adsorption Process: A Review. Proceedings of APCChE 2015 Congress In-corporating Chemeca 2015. Melbourne, Victoria, pp. 312–317.
13 Hlihor R. M., Gavrilescu M. (2009) Re-moval of Some Environmentally Relevant Heavy Metals Using Low-Cost Natural Sorbents. Environ Eng Manag J., vol. 8, no. 2, pp. 353–372. https://doi.org/10.30638/eemj.2009.051.
14 Kanyal M., Bhatt A.A. (2015) Removal of Heavy Metals from Water (Cu and Pb) Using Household Waste as an Adsorbent Bior Emedia-tion & Biodegradation. Journal of Bioremediation & Biodegradation, vol. 6, no. 1, pp. 1–6. https://doi.org/10.4172/2155-6199.1000269.
15 Jacques R.A., Lima E.C., Dias S.L.P., Maz-zocato A.C., Pavan F.A. (2007) Yellow Passion-Fruit Shell as Biosorbent to Remove Cr (III) and Pb (II) from Aqueous Solution. Sep Purif Technol., vol. 57, no. 1, pp. 193–198. https://10.1016/j.sep-pur.2007.01.018.
16 Memon J.R., Memon S.Q., Bhanger M.I., El-turki A., Hallam K.R., Allen G.C. (2009) Colloids and Surfaces B: Biointerfaces Banana Peel: A Green and Economical Sorbent for the Selective Removal of Cr (VI) from Industrial Wastewater. Colloid Sur-face B., vol. 70, no. 2, pp. 232–37. https://doi.org/10.1016/j.colsurfb.2008.12.032.
17 Jimoh A., Saka A.A., Afolabi A.S. (2013) Development of Adsorbent from Banana Peel for Wastewater Treatment. Appl Mech Mater., vol. 248, pp. 310–315. https://doi.org/10.4028/www.scientific.net/AMM.248.310.
18 Annadurai G., Juang R.S., Lee D.J. (2003) Adsorption of Heavy Metals from Water Using Ba-nana and Orange Peels. Water Sci Technol., vol. 47, no. 1, pp. 185–190. https://doi.org/10.2166/wst.2003.0049.
19 Schiewer S., Balaria A. (2009) Biosorption of Pb2+ by Original and Protonated Citrus Peels: Equi-librium, Kinetics, and Mechanism. Chem Eng J., vol. 146, no. 2, pp. 211–219. https://doi.org/10.1016/j.cej.2008.05.034.
20 De Souza J.V.T.M., Diniz K.M., Massocat-to C.L., Tarley C.R.T., Caetano J., Dragunski D.C. (2012) Removal Of Pb (II) From Aqueous Solution With Orange Sub-Products Chemically Modified As Biosorbent. Bioresources, vol. 7, no. 2, pp. 2300–2318. https://doi.org/10.15376/biores.7.2.2300-2318.
21 Amin M.T., Alazba A.A., Amin M.N. (2017) Absorption Behaviours of Copper, Lead, and Arsenic in Aqueous Solution Using Date Palm Fibres and Or-ange Peel: Kinetics and Thermodynamics. Pol J En-viron Stud., vol. 26, no. 2, pp. 543–557. https://doi.org/10.15244/pjoes/66963.
22 Shartooh S.M., Al-Azzawi M.N.A., Al-Hiya-ly S.A.K. (2013) Pomegranate Peels as Biosorbent Material to Remove Heavy Metal Ions from Induste-rial Wastewater. Iraqi Journal of Science., vol. 54, no. 4, pp. 823–831.
23 Zainab Abdulrazak N. (2016) Pomegranate Peel As A Sorbent In The Removal Of Pb (II) From Wastewater. Journal of Engineering and Sustainable Development, vol. 20, no. 03, pp. 25–35.
24 Rifaqat Ali Khan Rao. (2015) Adsorption of Heavy Metal Ions on Pomegranate (Punica Gra-natum) Peel: Removal and Recovery of Cr (VI) Ions from a Multi-Metal Ion System. Adsorpt Sci Technol., vol. 28, no. 3, pp. 195–211. https://doi.org/10.1260/0263-6174.28.3.195.
25 Seilkhanova G.A., Imangaliyeva A.N., Mas-tai Y., Rakhym A.B. (2019) Bentonite polymer com-posite for water purification. B Mater Sci., 42:60. https://doi.org/10.1007/s12034-019-1752-1.
© 2020 al-Farabi Kazakh National University Int. j. biol. chem. (Online)
International Journal of Biology and Chemistry 13, № 1, 161 (2020)
IRSTI 31.19.15 https://doi.org/10.26577/ijbch.2020.v13.i1.17
I.Yu. Silachyov
Institute of Nuclear Physics, Almaty, Kazakhstan e-mail: [email protected]
Instrumental neutron activation analysis of rhenium in uranium raw material
Abstract. The application of comparator instrumental neutron activation analysis combined with the internal standard method was considered to study rhenium content of the uranium raw material core samples collected in Chu-Sarysu uranium province in the Southern Kazakhstan. Iron content of the samples as the internal comparator was determined by X-ray fluorescence analysis with the help of a laboratory energy dispersive X-ray spectrometer. Rhenium was analyzed by its long-lived radionuclide 186Re using a planar type HPGe detector. Six certified reference materials of complex ores and non-ferrous metal concentrates were analyzed to verify the accuracy of the method. Rhenium and its main interfering elements were determined in the samples from three different sites of the uranium province. Due to reverse correlation dependence, selenium was found as a simple predictor of industrially significant rhenium contents. The method can be used to analyse rhenium mass fractions more than ≈0.02 mg/kg in the ores with uranium content of the samples not exceeding several hundreds mg/kg. Key words: Neutron activation analysis, internal standard, rhenium, uranium ore.
Introduction Rhenium, a valuable element for modern
industry, belongs to the scattered element group and does not form its own deposits. Main raw material sources of rhenium by-product extraction in the world are molybdenum, copper-molybdenum porphyry ores and cupreous sandstones [1, 2]. Alternative rhenium industrial sources include copper pyrite and copper nickel fields, carbonaceous rocks, coals, liquid carbohydrates and some other objects [3]. In recent times the "blanket oxidation zone deposits" or "sandstone type deposits" were related to an important non-traditional rhenium source [2]. Such zones are well known in the world due to localization of the bedded infiltration uranium deposits which are worked out everywhere by underground leaching [4]. In Kazakhstan the numerous sandstone uranium deposits are localized within the Near Tien Shan uranium mega-province including Chu-Sarysu and Syr Darya uranium basins [5, 6]. Uranium ores of the province are distinguished by their complex character and contain a range of rare elements, but mainly in low contents.
Rhenium content in the Southern Kazakhstan uranium basins corresponds to sundry degree of knowledge. The study for associated elements
during uranium deposit exploration was carried out in different time (including several decades ago), by the methods differing in their sensitivity, using individual or combined core samples. In some deposits rare elements were not determined at all [7]. However, in view of the continuing search and exploration of new uranium fields by JSC “NAC Kazatomprom” to promote uranium branch in Kazakhstan, development of simple up-to-date methods of rhenium analysis became vital now to predict the scopes of its by-product production.
A lot of methods of rocks and mineral raw material analysis for rhenium content are known at present [8]. Most of them suffer from insufficient sensitivity and poor selectivity. To overcome these disadvantages sample decomposition with subsequent rhenium preconcentration and separation from the matrix is used in spectrophotometric methods and X-ray fluorescence (XRF) analysis [8, 9]. Widely used inductively coupled plasma atomic emission spectrometry offers better sensitivity, but rhenium analytical lines are partly overlapped with the lines of concomitant elements [10, 11]. Mass spectrometry with inductively coupled plasma (ICP-MS) is one of the most sensitive methods of rhenium determination, but this advantage can be reached only after rhenium quantitative separation of the matrix using some way or another [12-14].
IRSTI 31.19.15 https://doi.org/10.26577/ijbch.2020.v13.i1.17
I.Yu. Silachyov
Institute of Nuclear Physics, Almaty, Kazakhstan e-mail: [email protected]
Instrumental neutron activation analysis of rhenium in uranium raw material
162 Instrumental neutron activation analysis of rhenium in uranium raw material
Int. j. biol. chem. (Online) International Journal of Biology and Chemistry 13, № 1, 161 (2020)
Moreover, ICP-MS is usually affected by matrix effects, isobaric interferences and signal drift.
Sample decomposition with subsequent rhenium preconcentration additionally complicated by high volatility of rhenium compounds is the most serious drawback of all the methods above. In this respect non-destructive neutron activation analysis as one of the most sensitive methods of trace element determination is an attractive option. However, the application of its instrumental variant (INAA) is restricted by low rhenium contents of geological samples and high matrix activity. Preliminary rhenium concentration can be used in this case [15, 16], but the necessity in supra pure reagents makes the method not in current use. Radiochemical neutron activation analysis (RNAA) based on ion-exchange chromatographic separation is far more prevalent, when rhenium is determined together with platinum group elements [17-19].
In this work comparator INAA using the XRF-based internal standard method and iron content of the samples as the internal comparator [20, 21] was tried to analyze rhenium content of the uranium ore core samples collected from several sites of the Shu-Sarysu uranium province in the Southern Kazakhstan.
Materials and methods
A great number of grinded ore samples studied by gamma-ray spectrometric method were preliminary inspected. The samples with the uranium content of no more than ≈300 mg/kg were selected based on the previous experience [22] to prevent counting and other problems. The chosen samples were then analyzed by XRF technique using an energy dispersive spectrometer RLP-21T by JSC “AspapGeo” (Almaty, Kazakhstan) for iron mass fraction as an internal standard to realize comparator INAA [20]. The spectrometer was designed to analyze rocks, ores, concentrates and so on. The accuracy of its software was repeatedly confirmed with the help of different corresponding certified reference materials (CRMs). The ascribed uncertainty of iron content measuring in rock samples is 2–8%. RLP-21T is enrolled in the State Register of Measuring Devices, and the corresponding analytical technique is registered by the National Body for Certification of Kazakhstan.
INAA of the same samples for rhenium and some other element contents by the long-lived radionuclides was then carried out. About 100 mg of the assays divided into several parties were sealed in
small thin double polyethylene bags and packed in aluminium foil. There wasn't any need in sample precise weighing using an analytical balance since an independent method to determine the internal comparator content was applied. Every package included ten samples and a zirconium monitor to evaluate epithermal to thermal neutron flux ratio (10 mg of ZrO2). Package length was about 10 mm.
All the packages were irradiated in different days for 2.5 hours in the position № 4 inside the water channel № 10-6 of the research reactor WWR-K by thermal neutron (< 0.625 eV) flux density 8.9 × 1013 cm-2 s-1; the fast neutron (0.1–1.15 MeV) flux density amounted to 6.0 × 1012 cm-2 s-1 [23]. To reduce the influence of neutron flux gradient, the packages were oriented along the channel axis.
Direct rhenium determination by the long-lived radionuclide 186Re in rocks is highly impeded by substantial spectral interferences from hafnium, selenium and sometimes from other elements (ytterbium). Since 186Re spectrum is characterized by the single analytical gamma-line, its count rate can be hardly measured correctly using a coaxial type semiconductor detector due to its insufficient resolution. That is why a planar type detector was preferred notwithstanding its far lower total efficiency.
The irradiated samples were counted by a planar HPGe detector GLP36360 with the crystal dimensions 36×13 mm and an energy resolution of 585 eV at the 122 keV peak of 57Co connected to an ORTEC multi-channel analyzer DSPEC LF. Spectra collection was carried by the MAESTRO software. Detector calibration for relative detection efficiency was made with the help of a multi-gamma ray standard (152Eu, 154Eu, 155Eu) and an isotopic source 133Ba, both by Canberra. Before measuring rhenium content of the samples, 9–12 days of the decay time elapsed to make radionuclide 24Na almost completely decayed and Compton background from uranium fission products essentially reduced. This made possible to use very close counting geometry – 10 mm to the detector cap. The approximate timeof spectra collection was 30–60 minutes. The first counting was also used to evaluate ytterbium and uranium contents. The samples were counted once again a fortnight later to determine selenium and hafnium mass fractions.
Spectra treatment was carried out by the "AnalGamma" software developed in the Institute of Nuclear Physics to provide gamma-ray spectrometric analysis. The software approximates a part of gamma-ray spectrum in the treatment
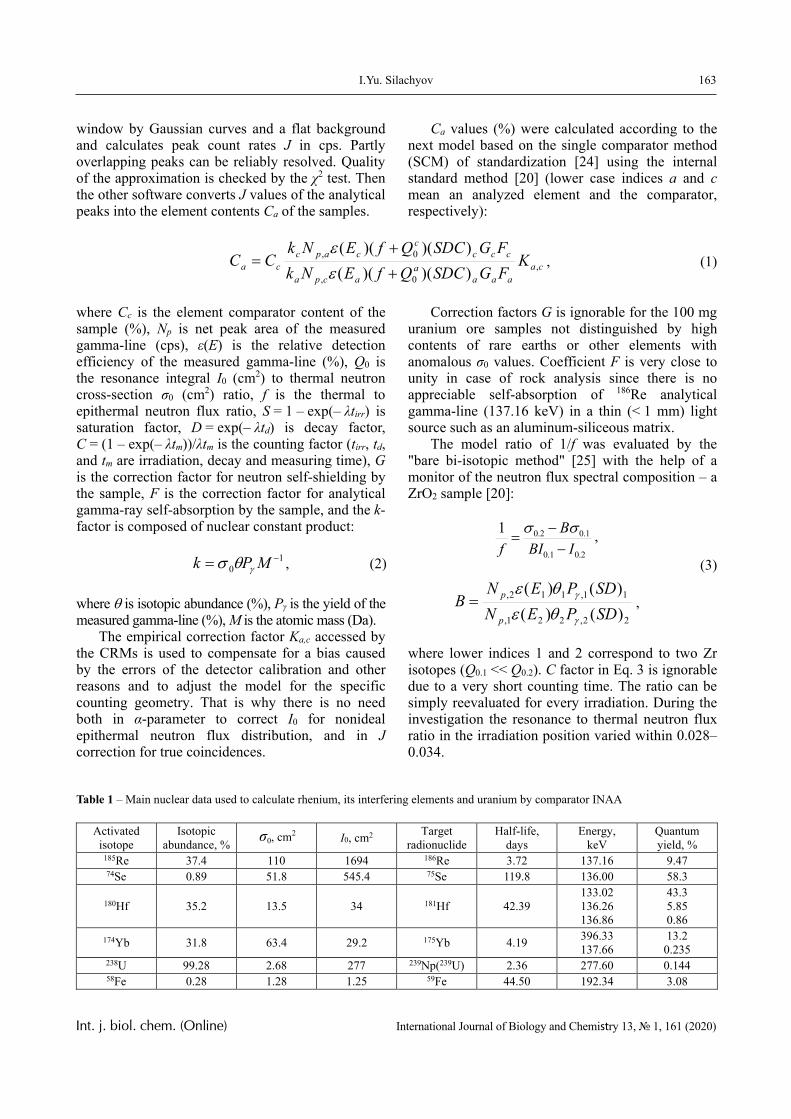
163I.Yu. Silachyov
Int. j. biol. chem. (Online) International Journal of Biology and Chemistry 13, № 1, 161 (2020)
window by Gaussian curves and a flat background and calculates peak count rates J in cps. Partly overlapping peaks can be reliably resolved. Quality of the approximation is checked by the χ2 test. Then the other software converts J values of the analytical peaks into the element contents Ca of the samples.
Ca values (%) were calculated according to the next model based on the single comparator method (SCM) of standardization [24] using the internal standard method [20] (lower case indices a and c mean an analyzed element and the comparator, respectively):
caaaa
aacpa
cccc
capcca K
FGSDCQfENkFGSDCQfENk
CC ,0,
0,
))()(())()((
, (1)
where Cc is the element comparator content of the sample (%), Np is net peak area of the measured gamma-line (cps), ε(E) is the relative detection efficiency of the measured gamma-line (%), Q0 is the resonance integral I0 (cm2) to thermal neutron cross-section σ0 (cm2) ratio, f is the thermal to epithermal neutron flux ratio, S = 1 – exp(– λtirr) is saturation factor, D = exp(– λtd) is decay factor, C = (1 – exp(– λtm))/λtm is the counting factor (tirr, td, and tm are irradiation, decay and measuring time), G is the correction factor for neutron self-shielding by the sample, F is the correction factor for analytical gamma-ray self-absorption by the sample, and the k-factor is composed of nuclear constant product:
10
MPk , (2)
where is isotopic abundance (%), Pγ is the yield of the measured gamma-line (%), M is the atomic mass (Da).
The empirical correction factor Ka,c accessed by the CRMs is used to compensate for a bias caused by the errors of the detector calibration and other reasons and to adjust the model for the specific counting geometry. That is why there is no need both in α-parameter to correct I0 for nonideal epithermal neutron flux distribution, and in J correction for true coincidences.
Correction factors G is ignorable for the 100 mg uranium ore samples not distinguished by high contents of rare earths or other elements with anomalous σ0 values. Coefficient F is very close to unity in case of rock analysis since there is no appreciable self-absorption of 186Re analytical gamma-line (137.16 keV) in a thin (< 1 mm) light source such as an aluminum-siliceous matrix.
The model ratio of 1/f was evaluated by the "bare bi-isotopic method" [25] with the help of a monitor of the neutron flux spectral composition – a ZrO2 sample [20]:
2.01.0
1.02.01IBI
Bf
,
22,221,
11,112,
)()()()(
SDPENSDPEN
Bp
p
,
(3)
where lower indices 1 and 2 correspond to two Zr isotopes (Q0.1 << Q0.2). C factor in Eq. 3 is ignorable due to a very short counting time. The ratio can be simply reevaluated for every irradiation. During the investigation the resonance to thermal neutron flux ratio in the irradiation position varied within 0.028–0.034.
Table 1 – Main nuclear data used to calculate rhenium, its interfering elements and uranium by comparator INAA
Activated isotope
Isotopic abundance, % σ0, cm2 I0, cm2 Target
radionuclide Half-life,
days Energy,
keV Quantum yield, %
185Re 37.4 110 1694 186Re 3.72 137.16 9.47 74Se 0.89 51.8 545.4 75Se 119.8 136.00 58.3
180Hf 35.2 13.5 34 181Hf 42.39 133.02 136.26 136.86
43.3 5.85 0.86
174Yb 31.8 63.4 29.2 175Yb 4.19 396.33 137.66
13.2 0.235
238U 99.28 2.68 277 239Np(239U) 2.36 277.60 0.144 58Fe 0.28 1.28 1.25 59Fe 44.50 192.34 3.08
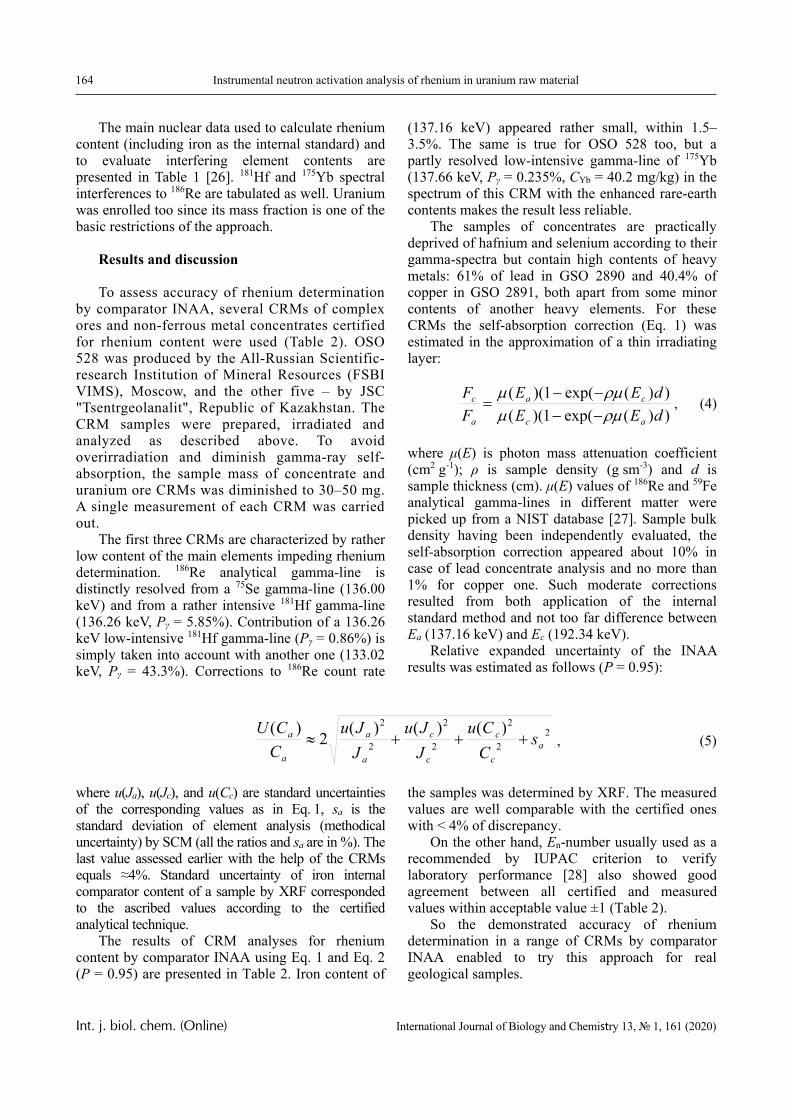
164 Instrumental neutron activation analysis of rhenium in uranium raw material
Int. j. biol. chem. (Online) International Journal of Biology and Chemistry 13, № 1, 161 (2020)
The main nuclear data used to calculate rhenium content (including iron as the internal standard) and to evaluate interfering element contents are presented in Table 1 [26]. 181Hf and 175Yb spectral interferences to 186Re are tabulated as well. Uranium was enrolled too since its mass fraction is one of the basic restrictions of the approach.
Results and discussion To assess accuracy of rhenium determination
by comparator INAA, several CRMs of complex ores and non-ferrous metal concentrates certified for rhenium content were used (Table 2). OSO 528 was produced by the All-Russian Scientific-research Institution of Mineral Resources (FSBI VIMS), Moscow, and the other five – by JSC "Tsentrgeolanalit", Republic of Kazakhstan. The CRM samples were prepared, irradiated and analyzed as described above. To avoid overirradiation and diminish gamma-ray self-absorption, the sample mass of concentrate and uranium ore CRMs was diminished to 30–50 mg. A single measurement of each CRM was carried out.
The first three CRMs are characterized by rather low content of the main elements impeding rhenium determination. 186Re analytical gamma-line is distinctly resolved from a 75Se gamma-line (136.00 keV) and from a rather intensive 181Hf gamma-line (136.26 keV, Pγ = 5.85%). Contribution of a 136.26 keV low-intensive 181Hf gamma-line (Pγ = 0.86%) is simply taken into account with another one (133.02 keV, Pγ = 43.3%). Corrections to 186Re count rate
(137.16 keV) appeared rather small, within 1.5–3.5%. The same is true for OSO 528 too, but a partly resolved low-intensive gamma-line of 175Yb (137.66 keV, Pγ = 0.235%, CYb = 40.2 mg/kg) in the spectrum of this CRM with the enhanced rare-earth contents makes the result less reliable.
The samples of concentrates are practically deprived of hafnium and selenium according to their gamma-spectra but contain high contents of heavy metals: 61% of lead in GSO 2890 and 40.4% of copper in GSO 2891, both apart from some minor contents of another heavy elements. For these CRMs the self-absorption correction (Eq. 1) was estimated in the approximation of a thin irradiating layer:
))(exp(1)(())(exp(1)((
dEEdEE
FF
ac
ca
a
c
, (4)
where μ(E) is photon mass attenuation coefficient (cm2 g-1); ρ is sample density (g sm-3) and d is sample thickness (cm). μ(E) values of 186Re and 59Fe analytical gamma-lines in different matter were picked up from a NIST database [27]. Sample bulk density having been independently evaluated, the self-absorption correction appeared about 10% in case of lead concentrate analysis and no more than 1% for copper one. Such moderate corrections resulted from both application of the internal standard method and not too far difference between Ea (137.16 keV) and Ec (192.34 keV).
Relative expanded uncertainty of the INAA results was estimated as follows (P = 0.95):
22
2
2
2
2
2 )()()(2)(a
c
c
c
c
a
a
a
a sCCu
JJu
JJu
CCU
, (5)
where u(Ja), u(Jc), and u(Cc) are standard uncertainties of the corresponding values as in Eq. 1, sa is the standard deviation of element analysis (methodical uncertainty) by SCM (all the ratios and sa are in %). The last value assessed earlier with the help of the CRMs equals ≈4%. Standard uncertainty of iron internal comparator content of a sample by XRF corresponded to the ascribed values according to the certified analytical technique.
The results of CRM analyses for rhenium content by comparator INAA using Eq. 1 and Eq. 2 (P = 0.95) are presented in Table 2. Iron content of
the samples was determined by XRF. The measured values are well comparable with the certified ones with < 4% of discrepancy.
On the other hand, En-number usually used as a recommended by IUPAC criterion to verify laboratory performance [28] also showed good agreement between all certified and measured values within acceptable value ±1 (Table 2).
So the demonstrated accuracy of rhenium determination in a range of CRMs by comparator INAA enabled to try this approach for real geological samples.
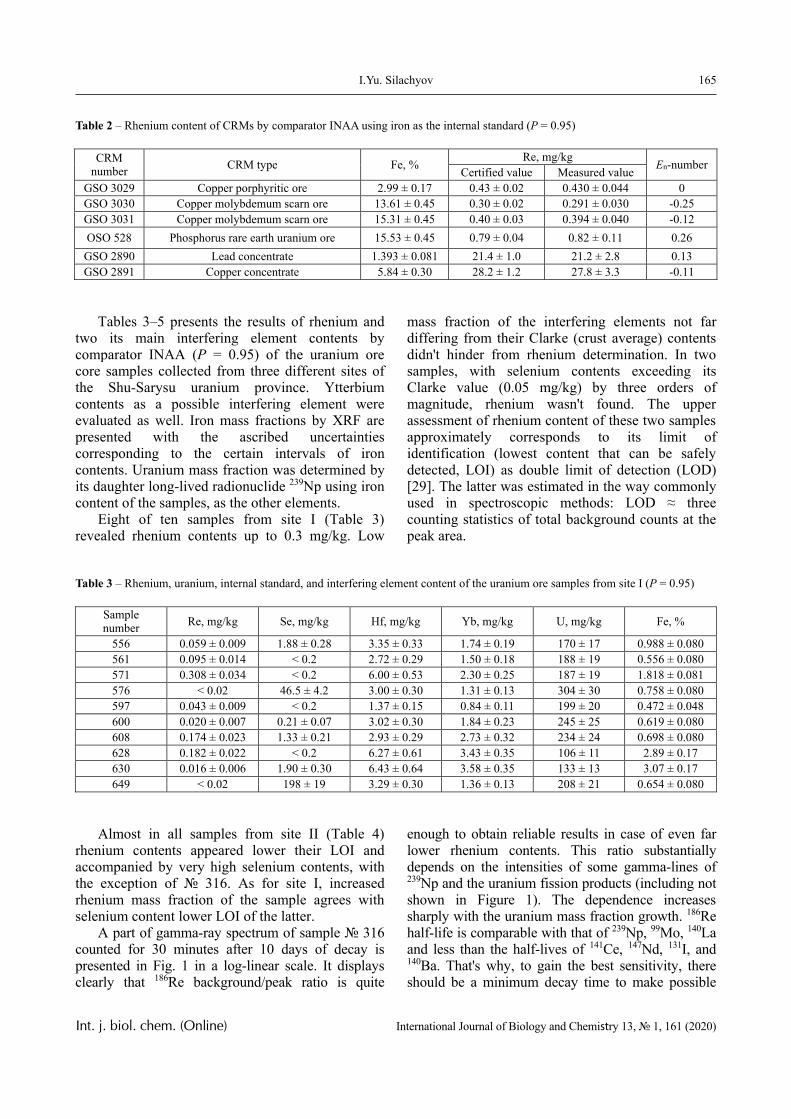
165I.Yu. Silachyov
Int. j. biol. chem. (Online) International Journal of Biology and Chemistry 13, № 1, 161 (2020)
Table 2 – Rhenium content of CRMs by comparator INAA using iron as the internal standard (P = 0.95)
CRM number CRM type Fe, % Re, mg/kg En-number Certified value Measured value
GSO 3029 Copper porphyritic ore 2.99 ± 0.17 0.43 ± 0.02 0.430 ± 0.044 0GSO 3030 Copper molybdemum scarn ore 13.61 ± 0.45 0.30 ± 0.02 0.291 ± 0.030 -0.25GSO 3031 Copper molybdemum scarn ore 15.31 ± 0.45 0.40 ± 0.03 0.394 ± 0.040 -0.12OSO 528 Phosphorus rare earth uranium ore 15.53 ± 0.45 0.79 ± 0.04 0.82 ± 0.11 0.26 GSO 2890 Lead concentrate 1.393 ± 0.081 21.4 ± 1.0 21.2 ± 2.8 0.13GSO 2891 Copper concentrate 5.84 ± 0.30 28.2 ± 1.2 27.8 ± 3.3 -0.11
Tables 3–5 presents the results of rhenium and
two its main interfering element contents by comparator INAA (P = 0.95) of the uranium ore core samples collected from three different sites of the Shu-Sarysu uranium province. Ytterbium contents as a possible interfering element were evaluated as well. Iron mass fractions by XRF are presented with the ascribed uncertainties corresponding to the certain intervals of iron contents. Uranium mass fraction was determined by its daughter long-lived radionuclide 239Np using iron content of the samples, as the other elements.
Eight of ten samples from site I (Table 3) revealed rhenium contents up to 0.3 mg/kg. Low
mass fraction of the interfering elements not far differing from their Clarke (crust average) contents didn't hinder from rhenium determination. In two samples, with selenium contents exceeding its Clarke value (0.05 mg/kg) by three orders of magnitude, rhenium wasn't found. The upper assessment of rhenium content of these two samples approximately corresponds to its limit of identification (lowest content that can be safely detected, LOI) as double limit of detection (LOD) [29]. The latter was estimated in the way commonly used in spectroscopic methods: LOD ≈ three counting statistics of total background counts at the peak area.
Table 3 – Rhenium, uranium, internal standard, and interfering element content of the uranium ore samples from site I (P = 0.95)
Sample number Re, mg/kg Se, mg/kg Hf, mg/kg Yb, mg/kg U, mg/kg Fe, %
556 0.059 ± 0.009 1.88 ± 0.28 3.35 ± 0.33 1.74 ± 0.19 170 ± 17 0.988 ± 0.080561 0.095 ± 0.014 < 0.2 2.72 ± 0.29 1.50 ± 0.18 188 ± 19 0.556 ± 0.080571 0.308 ± 0.034 < 0.2 6.00 ± 0.53 2.30 ± 0.25 187 ± 19 1.818 ± 0.081576 < 0.02 46.5 ± 4.2 3.00 ± 0.30 1.31 ± 0.13 304 ± 30 0.758 ± 0.080597 0.043 ± 0.009 < 0.2 1.37 ± 0.15 0.84 ± 0.11 199 ± 20 0.472 ± 0.048600 0.020 ± 0.007 0.21 ± 0.07 3.02 ± 0.30 1.84 ± 0.23 245 ± 25 0.619 ± 0.080608 0.174 ± 0.023 1.33 ± 0.21 2.93 ± 0.29 2.73 ± 0.32 234 ± 24 0.698 ± 0.080628 0.182 ± 0.022 < 0.2 6.27 ± 0.61 3.43 ± 0.35 106 ± 11 2.89 ± 0.17630 0.016 ± 0.006 1.90 ± 0.30 6.43 ± 0.64 3.58 ± 0.35 133 ± 13 3.07 ± 0.17649 < 0.02 198 ± 19 3.29 ± 0.30 1.36 ± 0.13 208 ± 21 0.654 ± 0.080
Almost in all samples from site II (Table 4)
rhenium contents appeared lower their LOI and accompanied by very high selenium contents, with the exception of № 316. As for site I, increased rhenium mass fraction of the sample agrees with selenium content lower LOI of the latter.
A part of gamma-ray spectrum of sample № 316 counted for 30 minutes after 10 days of decay is presented in Fig. 1 in a log-linear scale. It displays clearly that 186Re background/peak ratio is quite
enough to obtain reliable results in case of even far lower rhenium contents. This ratio substantially depends on the intensities of some gamma-lines of 239Np and the uranium fission products (including not shown in Figure 1). The dependence increases sharply with the uranium mass fraction growth. 186Re half-life is comparable with that of 239Np, 99Mo, 140La and less than the half-lives of 141Ce, 147Nd, 131I, and 140Ba. That's why, to gain the best sensitivity, there should be a minimum decay time to make possible
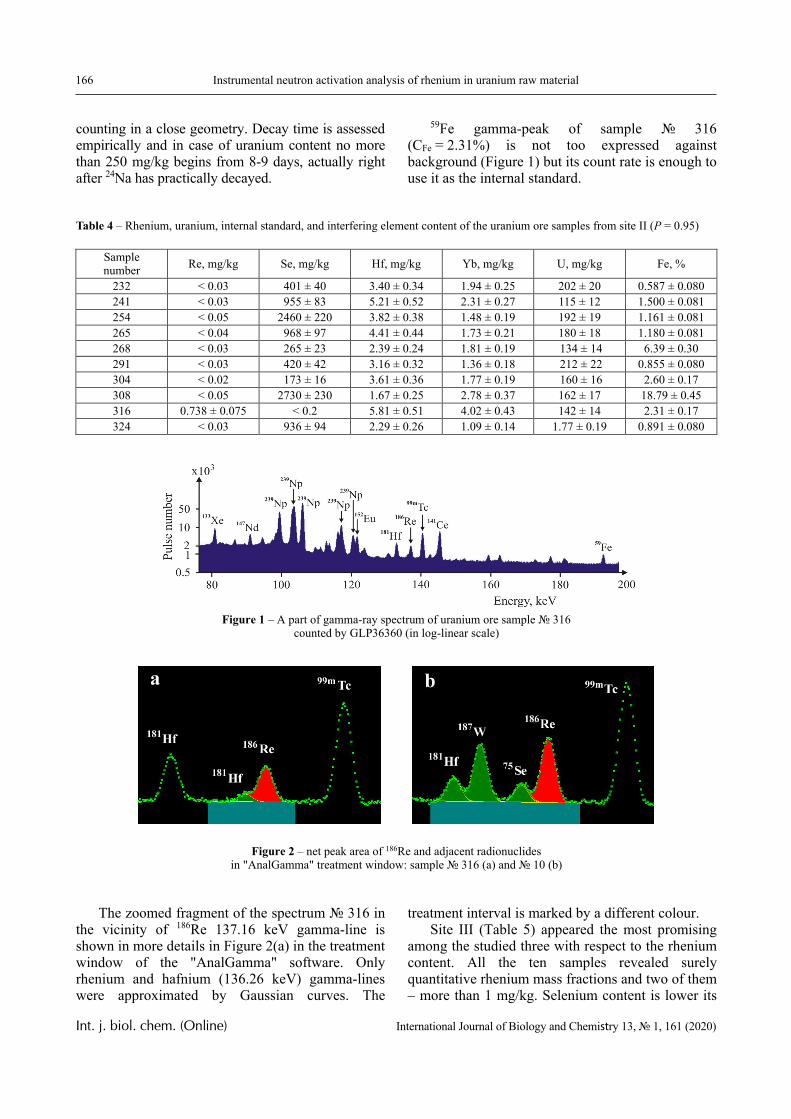
166 Instrumental neutron activation analysis of rhenium in uranium raw material
Int. j. biol. chem. (Online) International Journal of Biology and Chemistry 13, № 1, 161 (2020)
counting in a close geometry. Decay time is assessed empirically and in case of uranium content no more than 250 mg/kg begins from 8-9 days, actually right after 24Na has practically decayed.
59Fe gamma-peak of sample № 316 (CFe = 2.31%) is not too expressed against background (Figure 1) but its count rate is enough to use it as the internal standard.
Table 4 – Rhenium, uranium, internal standard, and interfering element content of the uranium ore samples from site II (P = 0.95)
Sample number Re, mg/kg Se, mg/kg Hf, mg/kg Yb, mg/kg U, mg/kg Fe, %
232 < 0.03 401 ± 40 3.40 ± 0.34 1.94 ± 0.25 202 ± 20 0.587 ± 0.080241 < 0.03 955 ± 83 5.21 ± 0.52 2.31 ± 0.27 115 ± 12 1.500 ± 0.081254 < 0.05 2460 ± 220 3.82 ± 0.38 1.48 ± 0.19 192 ± 19 1.161 ± 0.081265 < 0.04 968 ± 97 4.41 ± 0.44 1.73 ± 0.21 180 ± 18 1.180 ± 0.081268 < 0.03 265 ± 23 2.39 ± 0.24 1.81 ± 0.19 134 ± 14 6.39 ± 0.30291 < 0.03 420 ± 42 3.16 ± 0.32 1.36 ± 0.18 212 ± 22 0.855 ± 0.080304 < 0.02 173 ± 16 3.61 ± 0.36 1.77 ± 0.19 160 ± 16 2.60 ± 0.17308 < 0.05 2730 ± 230 1.67 ± 0.25 2.78 ± 0.37 162 ± 17 18.79 ± 0.45316 0.738 ± 0.075 < 0.2 5.81 ± 0.51 4.02 ± 0.43 142 ± 14 2.31 ± 0.17324 < 0.03 936 ± 94 2.29 ± 0.26 1.09 ± 0.14 1.77 ± 0.19 0.891 ± 0.080
Figure 1 – A part of gamma-ray spectrum of uranium ore sample № 316
counted by GLP36360 (in log-linear scale)
Figure 2 – net peak area of 186Re and adjacent radionuclides in "AnalGamma" treatment window: sample № 316 (a) and № 10 (b)
The zoomed fragment of the spectrum № 316 in
the vicinity of 186Re 137.16 keV gamma-line is shown in more details in Figure 2(a) in the treatment window of the "AnalGamma" software. Only rhenium and hafnium (136.26 keV) gamma-lines were approximated by Gaussian curves. The
treatment interval is marked by a different colour. Site III (Table 5) appeared the most promising
among the studied three with respect to the rhenium content. All the ten samples revealed surely quantitative rhenium mass fractions and two of them – more than 1 mg/kg. Selenium content is lower its
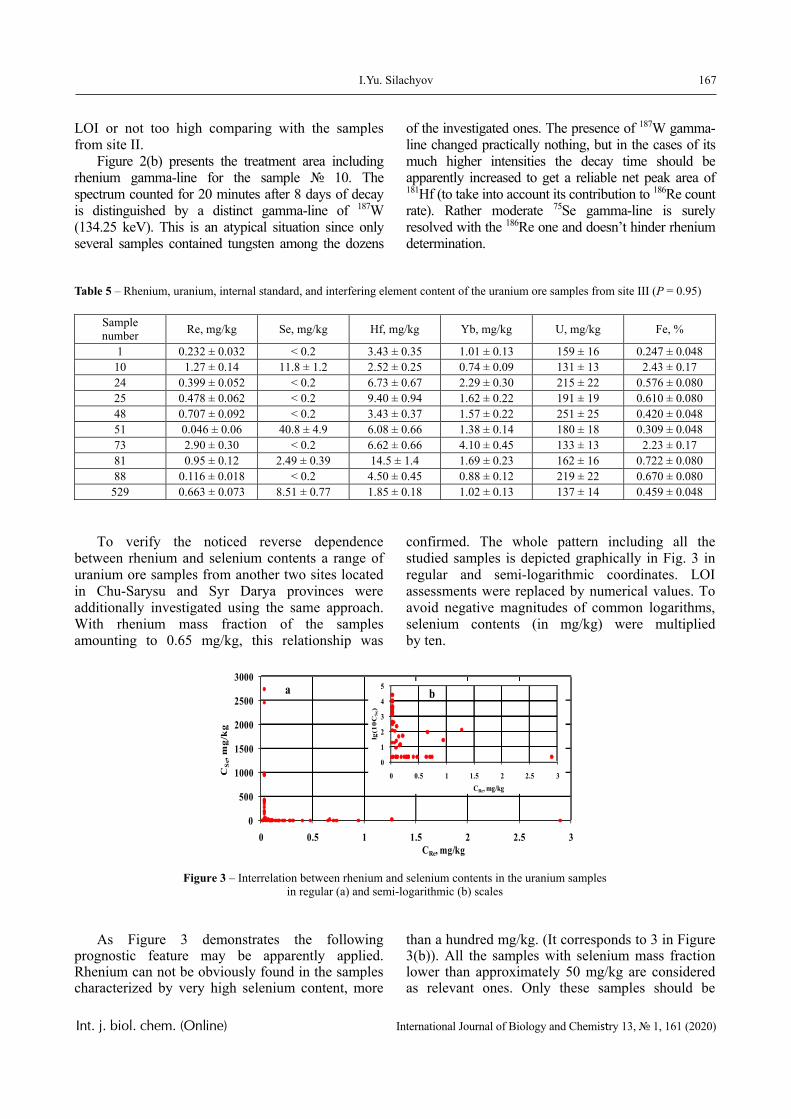
167I.Yu. Silachyov
Int. j. biol. chem. (Online) International Journal of Biology and Chemistry 13, № 1, 161 (2020)
LOI or not too high comparing with the samples from site II.
Figure 2(b) presents the treatment area including rhenium gamma-line for the sample № 10. The spectrum counted for 20 minutes after 8 days of decay is distinguished by a distinct gamma-line of 187W (134.25 keV). This is an atypical situation since only several samples contained tungsten among the dozens
of the investigated ones. The presence of 187W gamma-line changed practically nothing, but in the cases of its much higher intensities the decay time should be apparently increased to get a reliable net peak area of 181Hf (to take into account its contribution to 186Re count rate). Rather moderate 75Se gamma-line is surely resolved with the 186Re one and doesn’t hinder rhenium determination.
Table 5 – Rhenium, uranium, internal standard, and interfering element content of the uranium ore samples from site III (P = 0.95)
Sample number Re, mg/kg Se, mg/kg Hf, mg/kg Yb, mg/kg U, mg/kg Fe, %
1 0.232 ± 0.032 < 0.2 3.43 ± 0.35 1.01 ± 0.13 159 ± 16 0.247 ± 0.04810 1.27 ± 0.14 11.8 ± 1.2 2.52 ± 0.25 0.74 ± 0.09 131 ± 13 2.43 ± 0.1724 0.399 ± 0.052 < 0.2 6.73 ± 0.67 2.29 ± 0.30 215 ± 22 0.576 ± 0.08025 0.478 ± 0.062 < 0.2 9.40 ± 0.94 1.62 ± 0.22 191 ± 19 0.610 ± 0.08048 0.707 ± 0.092 < 0.2 3.43 ± 0.37 1.57 ± 0.22 251 ± 25 0.420 ± 0.04851 0.046 ± 0.06 40.8 ± 4.9 6.08 ± 0.66 1.38 ± 0.14 180 ± 18 0.309 ± 0.04873 2.90 ± 0.30 < 0.2 6.62 ± 0.66 4.10 ± 0.45 133 ± 13 2.23 ± 0.1781 0.95 ± 0.12 2.49 ± 0.39 14.5 ± 1.4 1.69 ± 0.23 162 ± 16 0.722 ± 0.08088 0.116 ± 0.018 < 0.2 4.50 ± 0.45 0.88 ± 0.12 219 ± 22 0.670 ± 0.080
529 0.663 ± 0.073 8.51 ± 0.77 1.85 ± 0.18 1.02 ± 0.13 137 ± 14 0.459 ± 0.048 To verify the noticed reverse dependence
between rhenium and selenium contents a range of uranium ore samples from another two sites located in Chu-Sarysu and Syr Darya provinces were additionally investigated using the same approach. With rhenium mass fraction of the samples amounting to 0.65 mg/kg, this relationship was
confirmed. The whole pattern including all the studied samples is depicted graphically in Fig. 3 in regular and semi-logarithmic coordinates. LOI assessments were replaced by numerical values. To avoid negative magnitudes of common logarithms, selenium contents (in mg/kg) were multiplied by ten.
Figure 3 – Interrelation between rhenium and selenium contents in the uranium samples in regular (a) and semi-logarithmic (b) scales
As Figure 3 demonstrates the following
prognostic feature may be apparently applied. Rhenium can not be obviously found in the samples characterized by very high selenium content, more
than a hundred mg/kg. (It corresponds to 3 in Figure 3(b)). All the samples with selenium mass fraction lower than approximately 50 mg/kg are considered as relevant ones. Only these samples should be
0
500
1000
1500
2000
2500
3000
0 0.5 1 1.5 2 2.5 3
CS
e, m
g/k
g
CRe, mg/kg
a
0
1
2
3
4
5
0 0.5 1 1.5 2 2.5 3
lg(1
0CS
e)
CRe, mg/kg
b
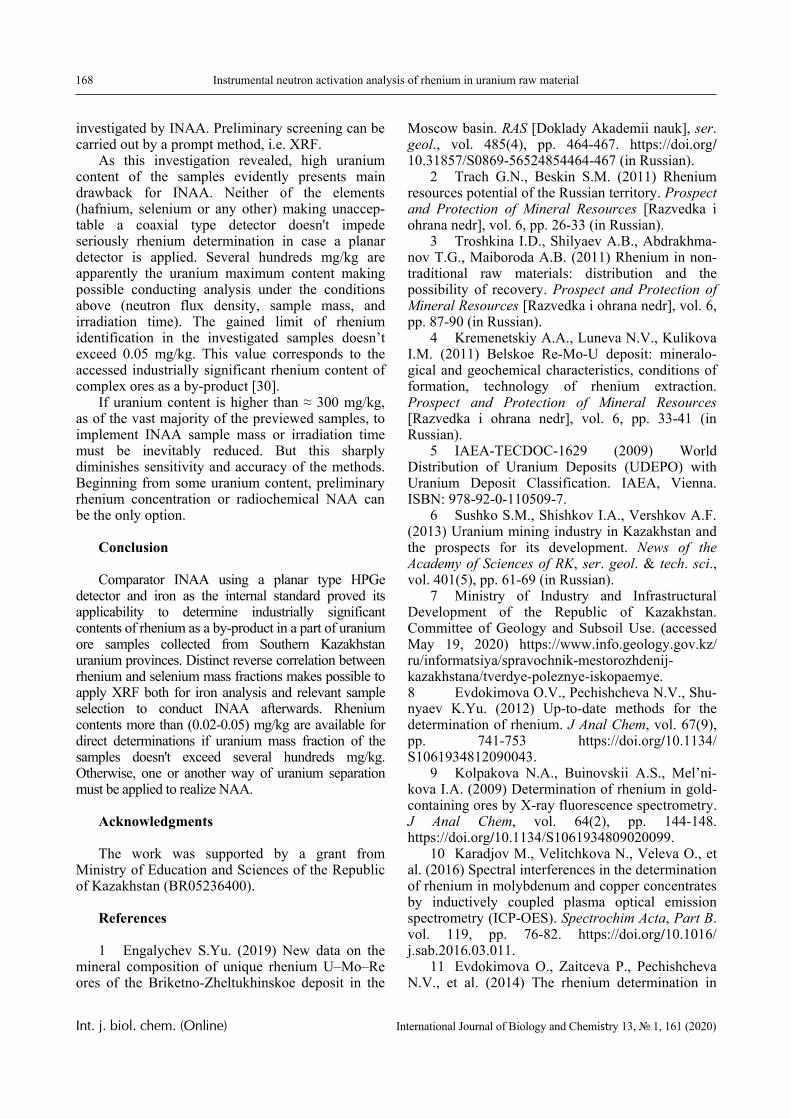
168 Instrumental neutron activation analysis of rhenium in uranium raw material
Int. j. biol. chem. (Online) International Journal of Biology and Chemistry 13, № 1, 161 (2020)
investigated by INAA. Preliminary screening can be carried out by a prompt method, i.e. XRF.
As this investigation revealed, high uranium content of the samples evidently presents main drawback for INAA. Neither of the elements (hafnium, selenium or any other) making unaccep-table a coaxial type detector doesn't impede seriously rhenium determination in case a planar detector is applied. Several hundreds mg/kg are apparently the uranium maximum content making possible conducting analysis under the conditions above (neutron flux density, sample mass, and irradiation time). The gained limit of rhenium identification in the investigated samples doesn’t exceed 0.05 mg/kg. This value corresponds to the accessed industrially significant rhenium content of complex ores as a by-product [30].
If uranium content is higher than ≈ 300 mg/kg, as of the vast majority of the previewed samples, to implement INAA sample mass or irradiation time must be inevitably reduced. But this sharply diminishes sensitivity and accuracy of the methods. Beginning from some uranium content, preliminary rhenium concentration or radiochemical NAA can be the only option.
Conclusion
Comparator INAA using a planar type HPGe detector and iron as the internal standard proved its applicability to determine industrially significant contents of rhenium as a by-product in a part of uranium ore samples collected from Southern Kazakhstan uranium provinces. Distinct reverse correlation between rhenium and selenium mass fractions makes possible to apply XRF both for iron analysis and relevant sample selection to conduct INAA afterwards. Rhenium contents more than (0.02-0.05) mg/kg are available for direct determinations if uranium mass fraction of the samples doesn't exceed several hundreds mg/kg. Otherwise, one or another way of uranium separation must be applied to realize NAA.
Acknowledgments
The work was supported by a grant from Ministry of Education and Sciences of the Republic of Kazakhstan (BR05236400).
References
1 Engalychev S.Yu. (2019) New data on the mineral composition of unique rhenium U–Mo–Re ores of the Briketno-Zheltukhinskoe deposit in the
Moscow basin. RAS [Doklady Akademii nauk], ser. geol., vol. 485(4), pp. 464-467. https://doi.org/ 10.31857/S0869-56524854464-467 (in Russian).
2 Trach G.N., Beskin S.M. (2011) Rhenium resources potential of the Russian territory. Prospect and Protection of Mineral Resources [Razvedka i ohrana nedr], vol. 6, pp. 26-33 (in Russian).
3 Troshkina I.D., Shilyaev A.B., Abdrakhma-nov T.G., Maiboroda A.B. (2011) Rhenium in non-traditional raw materials: distribution and the possibility of recovery. Prospect and Protection of Mineral Resources [Razvedka i ohrana nedr], vol. 6, pp. 87-90 (in Russian).
4 Kremenetskiy A.A., Luneva N.V., Kulikova I.M. (2011) Belskoe Re-Mo-U deposit: mineralo-gical and geochemical characteristics, conditions of formation, technology of rhenium extraction. Prospect and Protection of Mineral Resources [Razvedka i ohrana nedr], vol. 6, pp. 33-41 (in Russian).
5 IAEA-TECDOC-1629 (2009) World Distribution of Uranium Deposits (UDEPO) with Uranium Deposit Classification. IAEA, Vienna. ISBN: 978-92-0-110509-7.
6 Sushko S.M., Shishkov I.A., Vershkov A.F. (2013) Uranium mining industry in Kazakhstan and the prospects for its development. News of the Academy of Sciences of RK, ser. geol. & tech. sci., vol. 401(5), pp. 61-69 (in Russian).
7 Ministry of Industry and Infrastructural Development of the Republic of Kazakhstan. Committee of Geology and Subsoil Use. (accessed May 19, 2020) https://www.info.geology.gov.kz/ ru/informatsiya/spravochnik-mestorozhdenij-kazakhstana/tverdye-poleznye-iskopaemye. 8 Evdokimova O.V., Pechishcheva N.V., Shu-nyaev K.Yu. (2012) Up-to-date methods for the determination of rhenium. J Anal Chem, vol. 67(9), pp. 741-753 https://doi.org/10.1134/ S1061934812090043.
9 Kolpakova N.A., Buinovskii A.S., Mel’ni-kova I.A. (2009) Determination of rhenium in gold-containing ores by X-ray fluorescence spectrometry. J Anal Chem, vol. 64(2), pp. 144-148. https://doi.org/10.1134/S1061934809020099.
10 Karadjov M., Velitchkova N., Veleva O., et al. (2016) Spectral interferences in the determination of rhenium in molybdenum and copper concentrates by inductively coupled plasma optical emission spectrometry (ICP-OES). Spectrochim Acta, Part B. vol. 119, pp. 76-82. https://doi.org/10.1016/ j.sab.2016.03.011.
11 Evdokimova O., Zaitceva P., Pechishcheva N.V., et al. (2014) The rhenium determination in
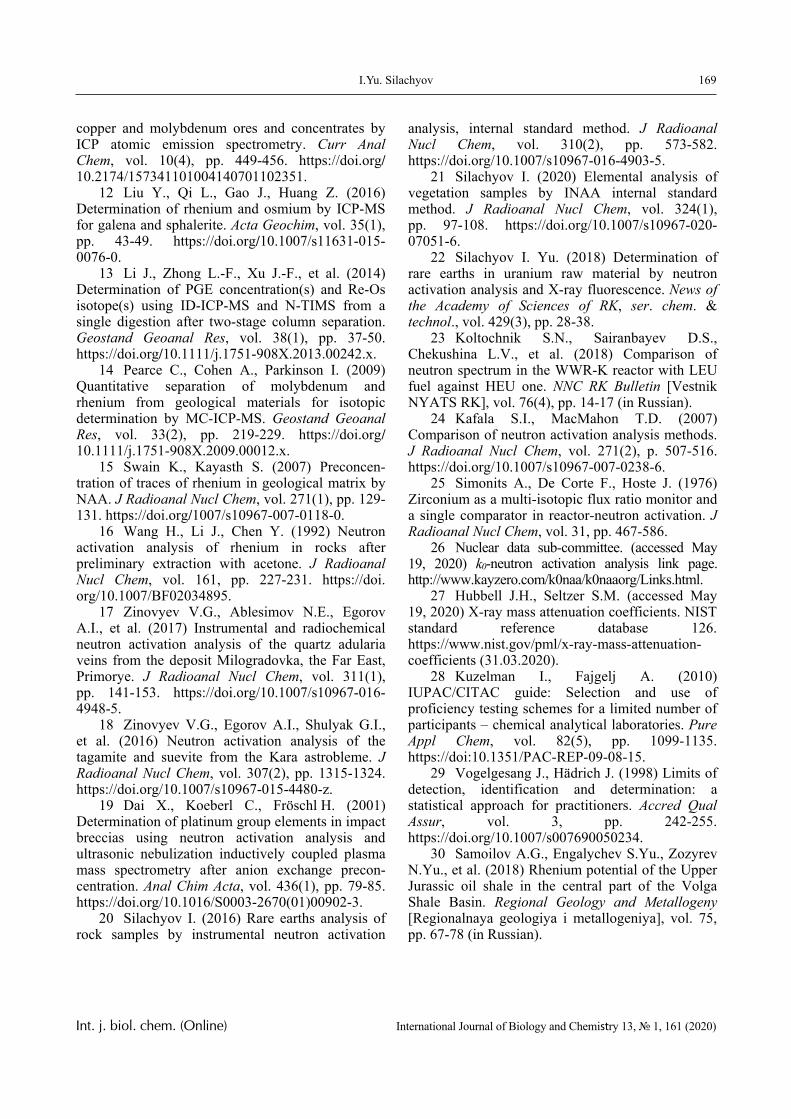
169I.Yu. Silachyov
Int. j. biol. chem. (Online) International Journal of Biology and Chemistry 13, № 1, 161 (2020)
copper and molybdenum ores and concentrates by ICP atomic emission spectrometry. Curr Anal Chem, vol. 10(4), pp. 449-456. https://doi.org/ 10.2174/157341101004140701102351.
12 Liu Y., Qi L., Gao J., Huang Z. (2016) Determination of rhenium and osmium by ICP-MS for galena and sphalerite. Acta Geochim, vol. 35(1), pp. 43-49. https://doi.org/10.1007/s11631-015-0076-0.
13 Li J., Zhong L.-F., Xu J.-F., et al. (2014) Determination of PGE concentration(s) and Re-Os isotope(s) using ID-ICP-MS and N-TIMS from a single digestion after two-stage column separation. Geostand Geoanal Res, vol. 38(1), pp. 37-50. https://doi.org/10.1111/j.1751-908X.2013.00242.x.
14 Pearce C., Cohen A., Parkinson I. (2009) Quantitative separation of molybdenum and rhenium from geological materials for isotopic determination by MC-ICP-MS. Geostand Geoanal Res, vol. 33(2), pp. 219-229. https://doi.org/ 10.1111/j.1751-908X.2009.00012.x.
15 Swain K., Kayasth S. (2007) Preconcen-tration of traces of rhenium in geological matrix by NAA. J Radioanal Nucl Chem, vol. 271(1), pp. 129-131. https://doi.org/1007/s10967-007-0118-0.
16 Wang H., Li J., Chen Y. (1992) Neutron activation analysis of rhenium in rocks after preliminary extraction with acetone. J Radioanal Nucl Chem, vol. 161, pp. 227-231. https://doi. org/10.1007/BF02034895.
17 Zinovyev V.G., Ablesimov N.E., Egorov A.I., et al. (2017) Instrumental and radiochemical neutron activation analysis of the quartz adularia veins from the deposit Milogradovka, the Far East, Primorye. J Radioanal Nucl Chem, vol. 311(1), pp. 141-153. https://doi.org/10.1007/s10967-016-4948-5.
18 Zinovyev V.G., Egorov A.I., Shulyak G.I., et al. (2016) Neutron activation analysis of the tagamite and suevite from the Kara astrobleme. J Radioanal Nucl Chem, vol. 307(2), pp. 1315-1324. https://doi.org/10.1007/s10967-015-4480-z.
19 Dai X., Koeberl C., Fröschl H. (2001) Determination of platinum group elements in impact breccias using neutron activation analysis and ultrasonic nebulization inductively coupled plasma mass spectrometry after anion exchange precon-centration. Anal Chim Acta, vol. 436(1), pp. 79-85. https://doi.org/10.1016/S0003-2670(01)00902-3.
20 Silachyov I. (2016) Rare earths analysis of rock samples by instrumental neutron activation
analysis, internal standard method. J Radioanal Nucl Chem, vol. 310(2), pp. 573-582. https://doi.org/10.1007/s10967-016-4903-5.
21 Silachyov I. (2020) Elemental analysis of vegetation samples by INAA internal standard method. J Radioanal Nucl Chem, vol. 324(1), pp. 97-108. https://doi.org/10.1007/s10967-020-07051-6.
22 Silachyov I. Yu. (2018) Determination of rare earths in uranium raw material by neutron activation analysis and X-ray fluorescence. News of the Academy of Sciences of RK, ser. chem. & technol., vol. 429(3), pp. 28-38.
23 Koltochnik S.N., Sairanbayev D.S., Chekushina L.V., et al. (2018) Comparison of neutron spectrum in the WWR-K reactor with LEU fuel against HEU one. NNC RK Bulletin [Vestnik NYATS RK], vol. 76(4), pp. 14-17 (in Russian).
24 Kafala S.I., MacMahon T.D. (2007) Comparison of neutron activation analysis methods. J Radioanal Nucl Chem, vol. 271(2), p. 507-516. https://doi.org/10.1007/s10967-007-0238-6.
25 Simonits A., De Corte F., Hoste J. (1976) Zirconium as a multi-isotopic flux ratio monitor and a single comparator in reactor-neutron activation. J Radioanal Nucl Chem, vol. 31, pp. 467-586.
26 Nuclear data sub-committee. (accessed May 19, 2020) k0-neutron activation analysis link page. http://www.kayzero.com/k0naa/k0naaorg/Links.html.
27 Hubbell J.H., Seltzer S.M. (accessed May 19, 2020) X-ray mass attenuation coefficients. NIST standard reference database 126. https://www.nist.gov/pml/x-ray-mass-attenuation-coefficients (31.03.2020).
28 Kuzelman I., Fajgelj A. (2010) IUPAC/CITAC guide: Selection and use of proficiency testing schemes for a limited number of participants – chemical analytical laboratories. Pure Appl Chem, vol. 82(5), pp. 1099-1135. https://doi:10.1351/PAC-REP-09-08-15.
29 Vogelgesang J., Hädrich J. (1998) Limits of detection, identification and determination: a statistical approach for practitioners. Accred Qual Assur, vol. 3, pp. 242-255. https://doi.org/10.1007/s007690050234.
30 Samoilov A.G., Engalychev S.Yu., Zozyrev N.Yu., et al. (2018) Rhenium potential of the Upper Jurassic oil shale in the central part of the Volga Shale Basin. Regional Geology and Metallogeny [Regionalnaya geologiya i metallogeniya], vol. 75, pp. 67-78 (in Russian).
© 2020 al-Farabi Kazakh National University Int. j. biol. chem. (Online)
International Journal of Biology and Chemistry 13, № 1, 170 (2020)
IRSTI 81.33.29 https://doi.org/10.26577/ijbch.2020.v13.i1.18
Zh. Kassenova Innovative Eurasian University, Pavlodar, Kazakhstan
e-mail: [email protected]
Study of the partitioning behaviour of a quaternary ammonium salt between oil and water phases
Abstract. Partitioning of corrosion inhibitors between oil/ water phases is one of main factors governing the inhibitor performance. It is important for the inhibitor to be dissolved in water phase at a particular concentration in order to provide protection from corrosion. Partitioning behaviour of a quaternary ammonium salt that is widely used as a corrosion inhibitor was studied by carrying out partitioning tests and determining the concentration of the inhibitors by conventional colorimentry method. The tests were performed using various water cuts, hydrocarbon phases, and concentrations in order to find out the effects of these factors. Comparison of partitioning behaviour of the inhibitors in low and high water cut mixtures resulted in some loss of the inhibitor from bulk water phase as water cut decreased. Partitioning of quaternary ammonium compound seems to be dependent on the nature of the hydrocarbon phase. Also, general suggestions about silanisation procedure of glassware were made.Key words: corrosion inhibitors, partitioning, oil, water cut.
Introduction
Metallic corrosion in its broad meaning can be described as a destructive process of metal caused by its interaction with the environment. The majority of corrosive processes in the Oil and Gas industry incorporate electrochemical reactions. Inhibitors are compounds that are added in a small amount to the system to slow down a chemical reaction. Corrosion inhibitors are used in the Oil and Gas industry as a part of corrosion mitigation program. These chemi-cals affect the destructive process by retarding the rate of either electrochemical reaction. In practice, the chemicals are used as formulations and complex mixtures rather than a single component. It is done because synergism and cooperation, that enhance protective properties, exist between different inhibi-tors. Although numerous chemicals that act as inhibi-tors are known, few of them are utilized in practice. This happens because of environmental legislations, cost, and availability [1].
Oil field inhibitors are usually utilised in a small concentration (<0.1%). Corrosion inhibitor formu-lations may include up to six individual surface ac-tive ingredients, and may contain up to 30% w/w of them. The inhibitors are usually dissolved in a carrier
solvent which may be water, hydrocarbon, or alco-hol. The solvent makes the inhibitors easier to inject into the system since it reduces their viscosity. Cor-rosion inhibitors used for petroleum production can be soluble, dispersible, or insoluble in either the oil or water phases. However, the classification is not strict due to the fact that the inhibitors in most cases partition between hydrocarbon and aqueous phases. The examples of preferentially water soluble inhibi-tors are quaternary amines, amine salts, and salted imidazolines. These chemicals are susceptible to de-sorption and may lose solubility in high temperatures and in highly mineralised brines respectively [2]. The protective film formed by water soluble inhibitors is not as tenacious as formed by oil soluble inhibi-tors; therefore, they must be continuously supplied to maintain system protection. Inhibitors that are pref-erentially oil soluble are primary amines, phosphate esters, fatty acids, and imidazolines [3].
Partitioning behaviour of the corrosion inhibi-tor is one of the key factors along with efficiency, solubility, optimum concentration, and film stability. Partitioning test is an irreplaceable and highly rec-ognised standard procedure for inhibitor selection, which aims to find out the adequate inhibitor dosage required for injection in total fluids. Ideally, real field
171Zh. Kassenova
Int. j. biol. chem. (Online) International Journal of Biology and Chemistry 13, № 1, 170 (2020)
fluids from production sites should be used for the tests [4]. However, clean untreated fluids are not al-ways available. Therefore, sometimes synthetic flu-ids are prepared in the testing laboratories. Corrosion takes place mainly at the surface, which has a contact with water. Thus, corrosion inhibitors should present in the aqueous phase in order to provide protection. Logically, the practical purpose of any partitioning test is to reach adequate amount of an inhibitor in aqueous phase. Partitioning coefficient is not a fixed value. For instance, the inhibitor distribution depends on water cut, i.e. the ratio of the aqueous phase to the total fluid volume. That is why partitioning test also should include fluids with different water cuts. It is important because in the oil production water cut is not constant and tends to change as time passes. If results from partitioning studies are available, the injection rate of the corrosion inhibitors can be ad-justed to the current water cut [5].
The literature review shows that there is a need for an extensive study of partitioning of oil field cor-rosion inhibitors between oil and water phases under various conditions, for example, different concentra-tions of the chemicals and water cuts. The aim of the project is to study the partitioning behaviour of an individual corrosion inhibitor like quaternary ammo-nium salt.
Materials and methods
Standard solutions. Stock standard solutions of benzyldimethylcocoalkylammonium chloride (10,000 ppm-parts per million) were prepared by weighing and dissolution in 1% NaCl solution or in Forties brine. An analytical balance with accuracy up to ±0.0001 g was used for weighing. Working solu-tions were prepared by dilution of the stock standard solutions in blank aqueous phase for colorimetry.
Silanisation of glassware. Quaternary ammo-nium compounds are surfactants that have tendency to be adsorbed on glassware surface. To prevent this all glassware was silanised before each partitioning experiments. Before silanisation the glassware was rinsed with acetone and placed in a drying oven for 30 minutes. Clean dry glassware was submerged in the silanisation solution and kept there for 2-3 min-utes. The procedure was repeated with acetone. Si-lanised glassware was placed in the oven for 30 min-utes to dry.
Partitioning test. Both 1% NaCl dissolved in de-ionised (DI) water and Forties brine were used as a water phase for partitioning experiments. Composi-tion of Forties brine was taken from published lit-
erature sources [6]. Required amounts of salts were weighed using an analytical balance accurate to ±0.0001 g and dissolved in DI water. Undissolved solid particles were removed by simple filtration. 1% NaCl solution and synthetic Forties brine were satu-rated with carbon dioxide gas until they reached pH 4 and 5.5 respectively. LAWS (low aromatic white spirit), Tiffany crude oil, kerosene, and toluene were used as the hydrocarbon phase for the experiments with the corrosion inhibitors. The total volume of water and hydrocarbon phases was 100 mL and kept constant for all partitioning tests. Required amount of the stock solution of the inhibitor (10,000 ppm) was pipetted into the mixture and shaken with the Flask shaker SF1 (Stuart Scientific, Essex, UK) for 30 minutes in a maximum mode of 800 oscillations per minute. After shaking, the mixture was kept for equilibration for 3 hours. Water and hydrocarbon phases were separated using separation funnels. The concentration of the inhibitor in the water phase was measured by colorimetry. Blank sample, i.e. mixture of hydrocarbon and water phases without any addi-tion of corrosion inhibitors, was shaken simultane-ously for each partitioning experiment. Three dif-ferent water/hydrocarbon ratios were applied for the experiments: 1:3 (25 mL:75 mL), 1:1 (50 mL:50mL), and 3:1 (75 mL: 25 mL).
Colorimetry (Molecular absorbance). Con-centration of quaternary ammonium chloride was measured using molecular absorbance spectrosco-py. Hach Lange DR 2800 was supplied by HACH LANGE Company, Berlin, Germany.
Fluorescence spectroscopy. For Tiffany crude oil excitation (200-500 nm) and emission (300-500 nm) ranges were used. For LAWS, kerosene, and toluene full excitation (200-800 nm) and emission (200-900 nm) ranges were used in order to find out the region of maximum absorption and emission spectra. Fluo-rescence analysis was performed with LS55 Lumi-nescence spectrometer supplied by Perkin Elmer (Massachusetts, USA).
Results and discussion
Partitioning behaviour of quaternary ammonium compound was studied using different hydrocarbon phases and different water cuts. After each partition-ing test the residual concentration of quat (quaternary ammonium compound) in aqueous phase was mea-sured and percentage of the amount that partitioned into aqueous phase was calculated. Table 1 represents results from partitioning tests using 1% NaCl solution (pH=4) as the water phase and LAWS as the hydro-
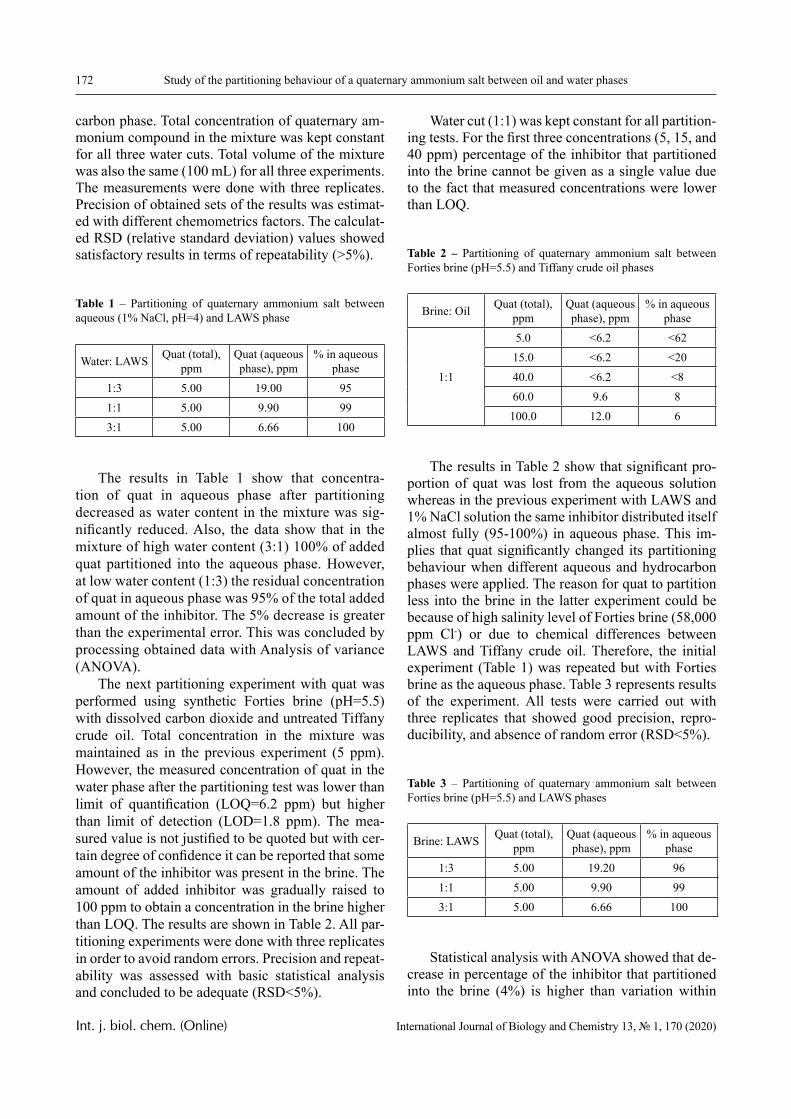
172 Study of the partitioning behaviour of a quaternary ammonium salt between oil and water phases
Int. j. biol. chem. (Online) International Journal of Biology and Chemistry 13, № 1, 170 (2020)
carbon phase. Total concentration of quaternary am-monium compound in the mixture was kept constant for all three water cuts. Total volume of the mixture was also the same (100 mL) for all three experiments. The measurements were done with three replicates. Precision of obtained sets of the results was estimat-ed with different chemometrics factors. The calculat-ed RSD (relative standard deviation) values showed satisfactory results in terms of repeatability (>5%).
Table 1 – Partitioning of quaternary ammonium salt between aqueous (1% NaCl, pH=4) and LAWS phase
Water: LAWS Quat (total), ppm
Quat (aqueous phase), ppm
% in aqueous phase
1:3 5.00 19.00 951:1 5.00 9.90 993:1 5.00 6.66 100
The results in Table 1 show that concentra-tion of quat in aqueous phase after partitioning decreased as water content in the mixture was sig-nificantly reduced. Also, the data show that in the mixture of high water content (3:1) 100% of added quat partitioned into the aqueous phase. However, at low water content (1:3) the residual concentration of quat in aqueous phase was 95% of the total added amount of the inhibitor. The 5% decrease is greater than the experimental error. This was concluded by processing obtained data with Analysis of variance (ANOVA).
The next partitioning experiment with quat was performed using synthetic Forties brine (pH=5.5) with dissolved carbon dioxide and untreated Tiffany crude oil. Total concentration in the mixture was maintained as in the previous experiment (5 ppm). However, the measured concentration of quat in the water phase after the partitioning test was lower than limit of quantification (LOQ=6.2 ppm) but higher than limit of detection (LOD=1.8 ppm). The mea-sured value is not justified to be quoted but with cer-tain degree of confidence it can be reported that some amount of the inhibitor was present in the brine. The amount of added inhibitor was gradually raised to 100 ppm to obtain a concentration in the brine higher than LOQ. The results are shown in Table 2. All par-titioning experiments were done with three replicates in order to avoid random errors. Precision and repeat-ability was assessed with basic statistical analysis and concluded to be adequate (RSD<5%).
Water cut (1:1) was kept constant for all partition-ing tests. For the first three concentrations (5, 15, and 40 ppm) percentage of the inhibitor that partitioned into the brine cannot be given as a single value due to the fact that measured concentrations were lower than LOQ.
Table 2 – Partitioning of quaternary ammonium salt between Forties brine (pH=5.5) and Tiffany crude oil phases
Brine: Oil Quat (total), ppm
Quat (aqueous phase), ppm
% in aqueous phase
1:1
5.0 <6.2 <6215.0 <6.2 <2040.0 <6.2 <860.0 9.6 8100.0 12.0 6
The results in Table 2 show that significant pro-portion of quat was lost from the aqueous solution whereas in the previous experiment with LAWS and 1% NaCl solution the same inhibitor distributed itself almost fully (95-100%) in aqueous phase. This im-plies that quat significantly changed its partitioning behaviour when different aqueous and hydrocarbon phases were applied. The reason for quat to partition less into the brine in the latter experiment could be because of high salinity level of Forties brine (58,000 ppm Cl-) or due to chemical differences between LAWS and Tiffany crude oil. Therefore, the initial experiment (Table 1) was repeated but with Forties brine as the aqueous phase. Table 3 represents results of the experiment. All tests were carried out with three replicates that showed good precision, repro-ducibility, and absence of random error (RSD<5%).
Table 3 – Partitioning of quaternary ammonium salt between Forties brine (pH=5.5) and LAWS phases
Brine: LAWS Quat (total), ppm
Quat (aqueous phase), ppm
% in aqueous phase
1:3 5.00 19.20 961:1 5.00 9.90 993:1 5.00 6.66 100
Statistical analysis with ANOVA showed that de-crease in percentage of the inhibitor that partitioned into the brine (4%) is higher than variation within
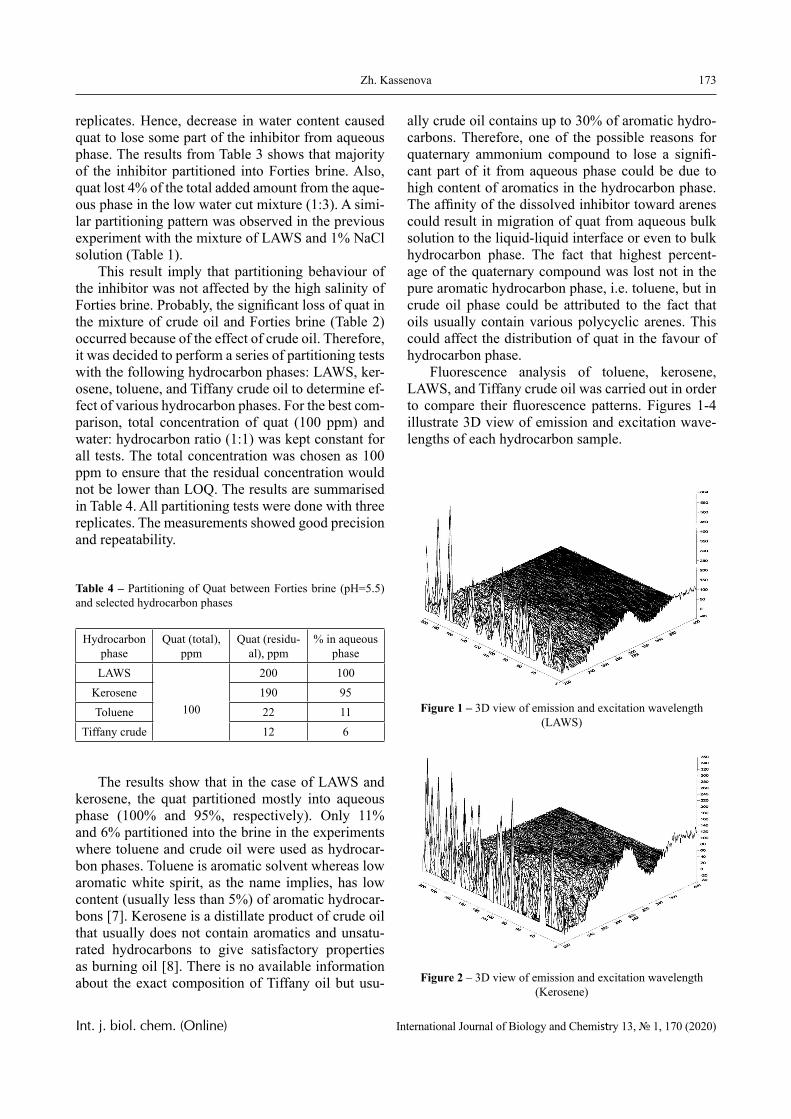
173Zh. Kassenova
Int. j. biol. chem. (Online) International Journal of Biology and Chemistry 13, № 1, 170 (2020)
replicates. Hence, decrease in water content caused quat to lose some part of the inhibitor from aqueous phase. The results from Table 3 shows that majority of the inhibitor partitioned into Forties brine. Also, quat lost 4% of the total added amount from the aque-ous phase in the low water cut mixture (1:3). A simi-lar partitioning pattern was observed in the previous experiment with the mixture of LAWS and 1% NaCl solution (Table 1).
This result imply that partitioning behaviour of the inhibitor was not affected by the high salinity of Forties brine. Probably, the significant loss of quat in the mixture of crude oil and Forties brine (Table 2) occurred because of the effect of crude oil. Therefore, it was decided to perform a series of partitioning tests with the following hydrocarbon phases: LAWS, ker-osene, toluene, and Tiffany crude oil to determine ef-fect of various hydrocarbon phases. For the best com-parison, total concentration of quat (100 ppm) and water: hydrocarbon ratio (1:1) was kept constant for all tests. The total concentration was chosen as 100 ppm to ensure that the residual concentration would not be lower than LOQ. The results are summarised in Table 4. All partitioning tests were done with three replicates. The measurements showed good precision and repeatability.
Table 4 – Partitioning of Quat between Forties brine (pH=5.5) and selected hydrocarbon phases
Hydrocarbon phase
Quat (total), ppm
Quat (residu-al), ppm
% in aqueous phase
LAWS
100
200 100Kerosene 190 95Toluene 22 11
Tiffany crude 12 6
The results show that in the case of LAWS and kerosene, the quat partitioned mostly into aqueous phase (100% and 95%, respectively). Only 11% and 6% partitioned into the brine in the experiments where toluene and crude oil were used as hydrocar-bon phases. Toluene is aromatic solvent whereas low aromatic white spirit, as the name implies, has low content (usually less than 5%) of aromatic hydrocar-bons [7]. Kerosene is a distillate product of crude oil that usually does not contain aromatics and unsatu-rated hydrocarbons to give satisfactory properties as burning oil [8]. There is no available information about the exact composition of Tiffany oil but usu-
ally crude oil contains up to 30% of aromatic hydro-carbons. Therefore, one of the possible reasons for quaternary ammonium compound to lose a signifi-cant part of it from aqueous phase could be due to high content of aromatics in the hydrocarbon phase. The affinity of the dissolved inhibitor toward arenes could result in migration of quat from aqueous bulk solution to the liquid-liquid interface or even to bulk hydrocarbon phase. The fact that highest percent-age of the quaternary compound was lost not in the pure aromatic hydrocarbon phase, i.e. toluene, but in crude oil phase could be attributed to the fact that oils usually contain various polycyclic arenes. This could affect the distribution of quat in the favour of hydrocarbon phase.
Fluorescence analysis of toluene, kerosene, LAWS, and Tiffany crude oil was carried out in order to compare their fluorescence patterns. Figures 1-4 illustrate 3D view of emission and excitation wave-lengths of each hydrocarbon sample.
Figure 1 – 3D view of emission and excitation wavelength (LAWS)
Figure 2 – 3D view of emission and excitation wavelength (Kerosene)
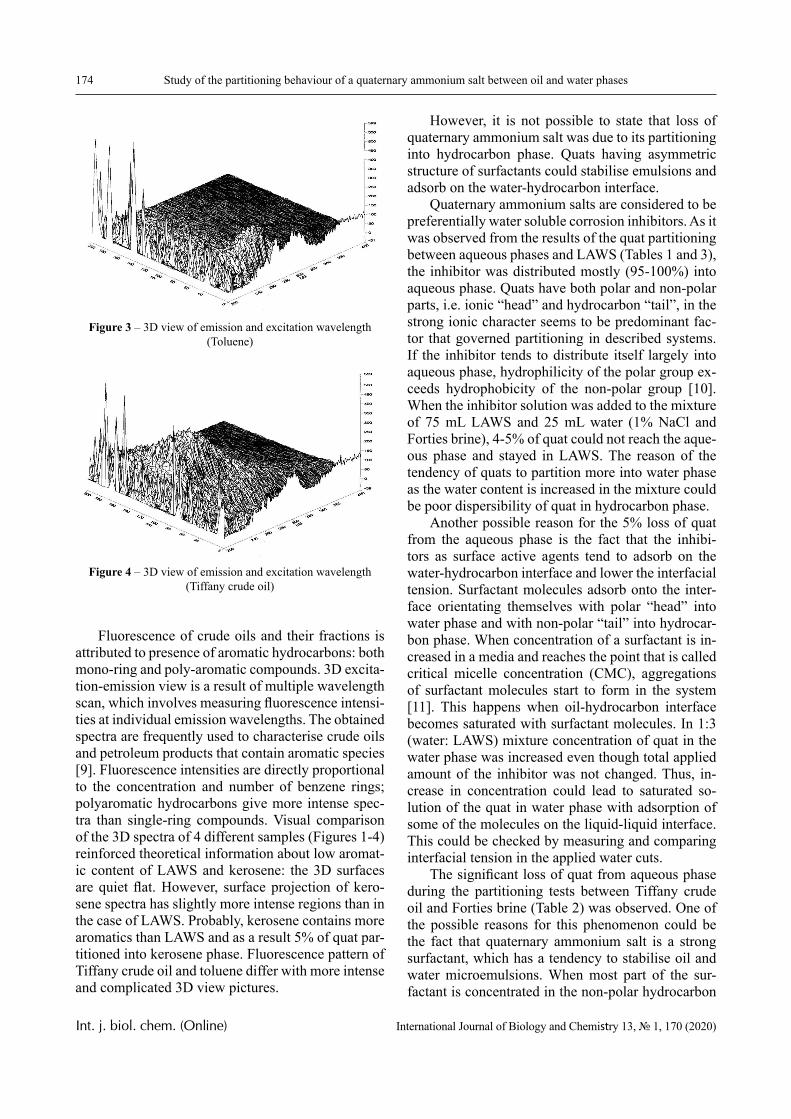
174 Study of the partitioning behaviour of a quaternary ammonium salt between oil and water phases
Int. j. biol. chem. (Online) International Journal of Biology and Chemistry 13, № 1, 170 (2020)
Figure 3 – 3D view of emission and excitation wavelength (Toluene)
Figure 4 – 3D view of emission and excitation wavelength (Tiffany crude oil)
Fluorescence of crude oils and their fractions is attributed to presence of aromatic hydrocarbons: both mono-ring and poly-aromatic compounds. 3D excita-tion-emission view is a result of multiple wavelength scan, which involves measuring fluorescence intensi-ties at individual emission wavelengths. The obtained spectra are frequently used to characterise crude oils and petroleum products that contain aromatic species [9]. Fluorescence intensities are directly proportional to the concentration and number of benzene rings; polyaromatic hydrocarbons give more intense spec-tra than single-ring compounds. Visual comparison of the 3D spectra of 4 different samples (Figures 1-4) reinforced theoretical information about low aromat-ic content of LAWS and kerosene: the 3D surfaces are quiet flat. However, surface projection of kero-sene spectra has slightly more intense regions than in the case of LAWS. Probably, kerosene contains more aromatics than LAWS and as a result 5% of quat par-titioned into kerosene phase. Fluorescence pattern of Tiffany crude oil and toluene differ with more intense and complicated 3D view pictures.
However, it is not possible to state that loss of quaternary ammonium salt was due to its partitioning into hydrocarbon phase. Quats having asymmetric structure of surfactants could stabilise emulsions and adsorb on the water-hydrocarbon interface.
Quaternary ammonium salts are considered to be preferentially water soluble corrosion inhibitors. As it was observed from the results of the quat partitioning between aqueous phases and LAWS (Tables 1 and 3), the inhibitor was distributed mostly (95-100%) into aqueous phase. Quats have both polar and non-polar parts, i.e. ionic “head” and hydrocarbon “tail”, in the strong ionic character seems to be predominant fac-tor that governed partitioning in described systems. If the inhibitor tends to distribute itself largely into aqueous phase, hydrophilicity of the polar group ex-ceeds hydrophobicity of the non-polar group [10]. When the inhibitor solution was added to the mixture of 75 mL LAWS and 25 mL water (1% NaCl and Forties brine), 4-5% of quat could not reach the aque-ous phase and stayed in LAWS. The reason of the tendency of quats to partition more into water phase as the water content is increased in the mixture could be poor dispersibility of quat in hydrocarbon phase.
Another possible reason for the 5% loss of quat from the aqueous phase is the fact that the inhibi-tors as surface active agents tend to adsorb on the water-hydrocarbon interface and lower the interfacial tension. Surfactant molecules adsorb onto the inter-face orientating themselves with polar “head” into water phase and with non-polar “tail” into hydrocar-bon phase. When concentration of a surfactant is in-creased in a media and reaches the point that is called critical micelle concentration (CMC), aggregations of surfactant molecules start to form in the system [11]. This happens when oil-hydrocarbon interface becomes saturated with surfactant molecules. In 1:3 (water: LAWS) mixture concentration of quat in the water phase was increased even though total applied amount of the inhibitor was not changed. Thus, in-crease in concentration could lead to saturated so-lution of the quat in water phase with adsorption of some of the molecules on the liquid-liquid interface. This could be checked by measuring and comparing interfacial tension in the applied water cuts.
The significant loss of quat from aqueous phase during the partitioning tests between Tiffany crude oil and Forties brine (Table 2) was observed. One of the possible reasons for this phenomenon could be the fact that quaternary ammonium salt is a strong surfactant, which has a tendency to stabilise oil and water microemulsions. When most part of the sur-factant is concentrated in the non-polar hydrocarbon
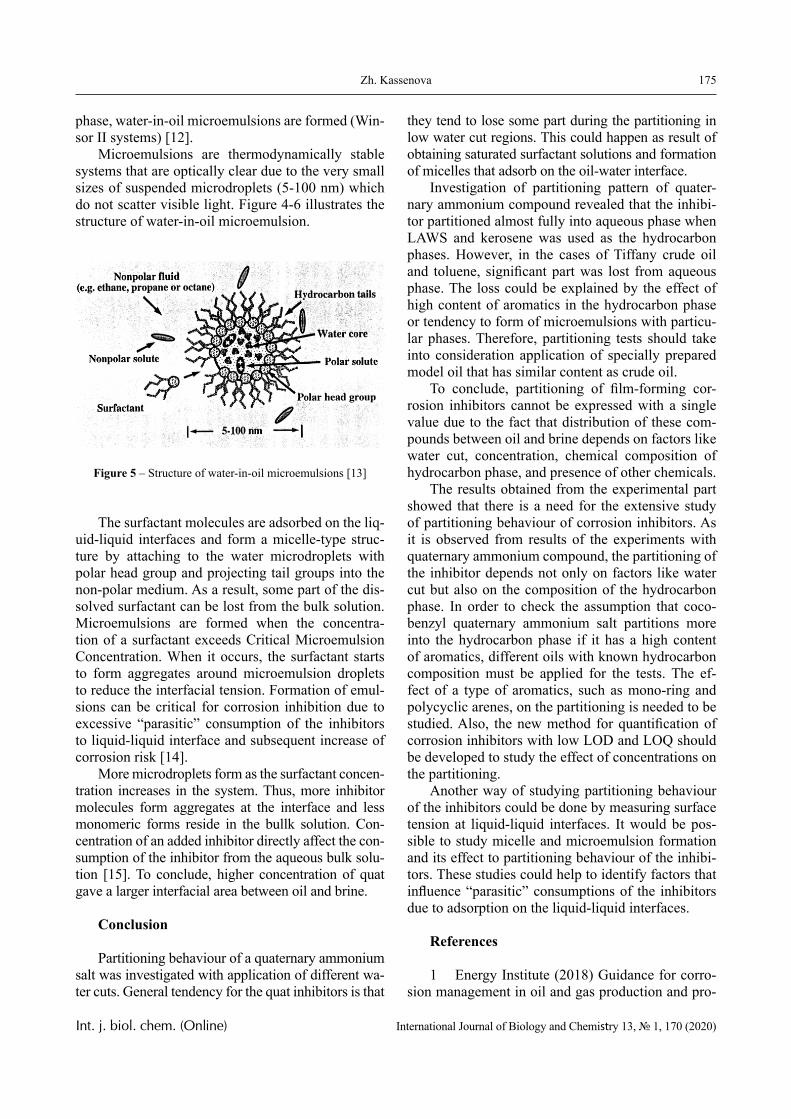
175Zh. Kassenova
Int. j. biol. chem. (Online) International Journal of Biology and Chemistry 13, № 1, 170 (2020)
phase, water-in-oil microemulsions are formed (Win-sor II systems) [12].
Microemulsions are thermodynamically stable systems that are optically clear due to the very small sizes of suspended microdroplets (5-100 nm) which do not scatter visible light. Figure 4-6 illustrates the structure of water-in-oil microemulsion.
Figure 5 – Structure of water-in-oil microemulsions [13]
The surfactant molecules are adsorbed on the liq-uid-liquid interfaces and form a micelle-type struc-ture by attaching to the water microdroplets with polar head group and projecting tail groups into the non-polar medium. As a result, some part of the dis-solved surfactant can be lost from the bulk solution. Microemulsions are formed when the concentra-tion of a surfactant exceeds Critical Microemulsion Concentration. When it occurs, the surfactant starts to form aggregates around microemulsion droplets to reduce the interfacial tension. Formation of emul-sions can be critical for corrosion inhibition due to excessive “parasitic” consumption of the inhibitors to liquid-liquid interface and subsequent increase of corrosion risk [14].
More microdroplets form as the surfactant concen-tration increases in the system. Thus, more inhibitor molecules form aggregates at the interface and less monomeric forms reside in the bullk solution. Con-centration of an added inhibitor directly affect the con-sumption of the inhibitor from the aqueous bulk solu-tion [15]. To conclude, higher concentration of quat gave a larger interfacial area between oil and brine.
Conclusion
Partitioning behaviour of a quaternary ammonium salt was investigated with application of different wa-ter cuts. General tendency for the quat inhibitors is that
they tend to lose some part during the partitioning in low water cut regions. This could happen as result of obtaining saturated surfactant solutions and formation of micelles that adsorb on the oil-water interface.
Investigation of partitioning pattern of quater-nary ammonium compound revealed that the inhibi-tor partitioned almost fully into aqueous phase when LAWS and kerosene was used as the hydrocarbon phases. However, in the cases of Tiffany crude oil and toluene, significant part was lost from aqueous phase. The loss could be explained by the effect of high content of aromatics in the hydrocarbon phase or tendency to form of microemulsions with particu-lar phases. Therefore, partitioning tests should take into consideration application of specially prepared model oil that has similar content as crude oil.
To conclude, partitioning of film-forming cor-rosion inhibitors cannot be expressed with a single value due to the fact that distribution of these com-pounds between oil and brine depends on factors like water cut, concentration, chemical composition of hydrocarbon phase, and presence of other chemicals.
The results obtained from the experimental part showed that there is a need for the extensive study of partitioning behaviour of corrosion inhibitors. As it is observed from results of the experiments with quaternary ammonium compound, the partitioning of the inhibitor depends not only on factors like water cut but also on the composition of the hydrocarbon phase. In order to check the assumption that coco-benzyl quaternary ammonium salt partitions more into the hydrocarbon phase if it has a high content of aromatics, different oils with known hydrocarbon composition must be applied for the tests. The ef-fect of a type of aromatics, such as mono-ring and polycyclic arenes, on the partitioning is needed to be studied. Also, the new method for quantification of corrosion inhibitors with low LOD and LOQ should be developed to study the effect of concentrations on the partitioning.
Another way of studying partitioning behaviour of the inhibitors could be done by measuring surface tension at liquid-liquid interfaces. It would be pos-sible to study micelle and microemulsion formation and its effect to partitioning behaviour of the inhibi-tors. These studies could help to identify factors that influence “parasitic” consumptions of the inhibitors due to adsorption on the liquid-liquid interfaces.
References
1 Energy Institute (2018) Guidance for corro-sion management in oil and gas production and pro-
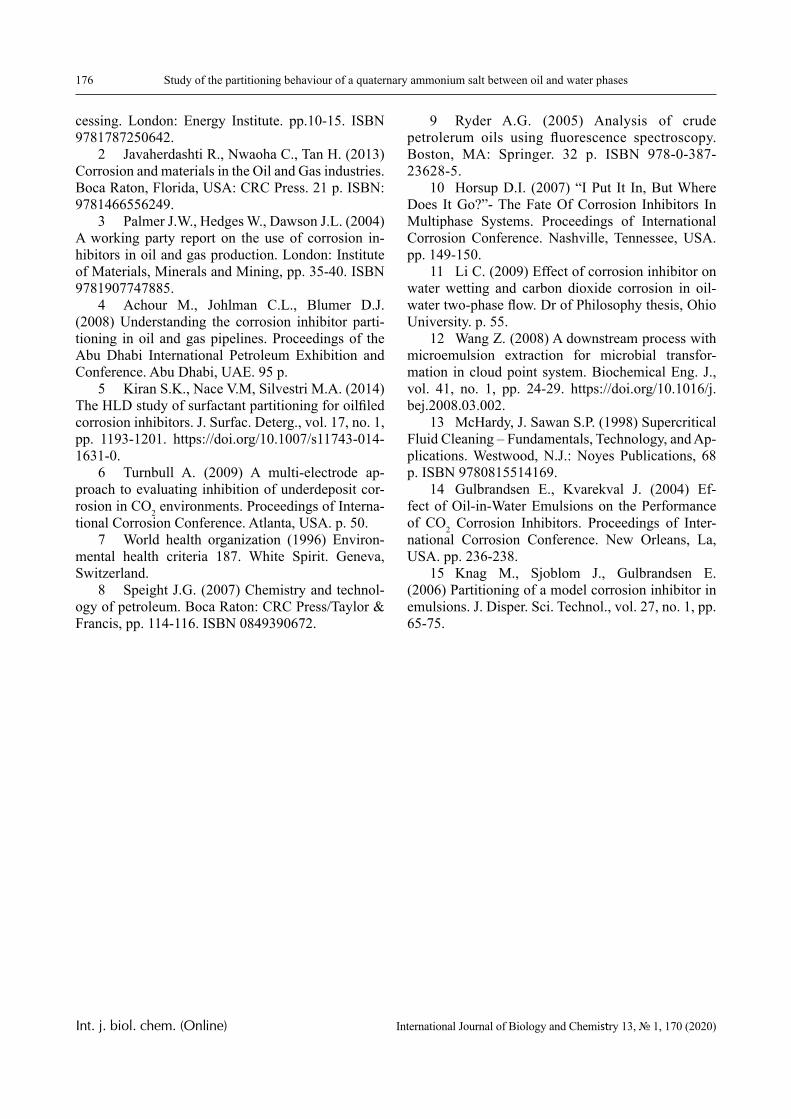
176 Study of the partitioning behaviour of a quaternary ammonium salt between oil and water phases
Int. j. biol. chem. (Online) International Journal of Biology and Chemistry 13, № 1, 170 (2020)
cessing. London: Energy Institute. pp.10-15. ISBN 9781787250642.
2 Javaherdashti R., Nwaoha C., Tan H. (2013) Corrosion and materials in the Oil and Gas industries. Boca Raton, Florida, USA: CRC Press. 21 p. ISBN: 9781466556249.
3 Palmer J.W., Hedges W., Dawson J.L. (2004) A working party report on the use of corrosion in-hibitors in oil and gas production. London: Institute of Materials, Minerals and Mining, pp. 35-40. ISBN 9781907747885.
4 Achour M., Johlman C.L., Blumer D.J. (2008) Understanding the corrosion inhibitor parti-tioning in oil and gas pipelines. Proceedings of the Abu Dhabi International Petroleum Exhibition and Conference. Abu Dhabi, UAE. 95 p.
5 Kiran S.K., Nace V.M, Silvestri M.A. (2014) The HLD study of surfactant partitioning for oilfiled corrosion inhibitors. J. Surfac. Deterg., vol. 17, no. 1, pp. 1193-1201. https://doi.org/10.1007/s11743-014-1631-0.
6 Turnbull A. (2009) A multi-electrode ap-proach to evaluating inhibition of underdeposit cor-rosion in CO2 environments. Proceedings of Interna-tional Corrosion Conference. Atlanta, USA. p. 50.
7 World health organization (1996) Environ-mental health criteria 187. White Spirit. Geneva, Switzerland.
8 Speight J.G. (2007) Chemistry and technol-ogy of petroleum. Boca Raton: CRC Press/Taylor & Francis, pp. 114-116. ISBN 0849390672.
9 Ryder A.G. (2005) Analysis of crude petrolerum oils using fluorescence spectroscopy. Boston, MA: Springer. 32 p. ISBN 978-0-387-23628-5.
10 Horsup D.I. (2007) “I Put It In, But Where Does It Go?”- The Fate Of Corrosion Inhibitors In Multiphase Systems. Proceedings of International Corrosion Conference. Nashville, Tennessee, USA. pp. 149-150.
11 Li C. (2009) Effect of corrosion inhibitor on water wetting and carbon dioxide corrosion in oil-water two-phase flow. Dr of Philosophy thesis, Ohio University. p. 55.
12 Wang Z. (2008) A downstream process with microemulsion extraction for microbial transfor-mation in cloud point system. Biochemical Eng. J., vol. 41, no. 1, pp. 24-29. https://doi.org/10.1016/j.bej.2008.03.002.
13 McHardy, J. Sawan S.P. (1998) Supercritical Fluid Cleaning – Fundamentals, Technology, and Ap-plications. Westwood, N.J.: Noyes Publications, 68 p. ISBN 9780815514169.
14 Gulbrandsen E., Kvarekval J. (2004) Ef-fect of Oil-in-Water Emulsions on the Performance of CO2 Corrosion Inhibitors. Proceedings of Inter-national Corrosion Conference. New Orleans, La, USA. pp. 236-238.
15 Knag M., Sjoblom J., Gulbrandsen E. (2006) Partitioning of a model corrosion inhibitor in emulsions. J. Disper. Sci. Technol., vol. 27, no. 1, pp. 65-75.
© 2020 al-Farabi Kazakh National University Int. j. biol. chem. (Online)
International Journal of Biology and Chemistry 13, № 1, 177 (2020)
IRSTI 87.35.91 https://doi.org/10.26577/ijbch.2020.v13.i1.19
*F.Zh. Akhmetova1 , Y.A. Aubakirov1 , L.R. Sassykova1 , H. Arbag2
1al-Farabi Kazakh National University, Almaty, Kazakhstan 2Gazi University, Ankara, Turkey
*e-mail: [email protected]
Research of composite catalysts for the process of thermocatalytic hydrogenation processing of plastic waste
Abstract. Processing plastic waste in landfills is becoming unprofitable due to the increasing costs and poor biodegradability of commonly used polymers, as well as due to large public objections. Thus, the recycling of mechanical or chemical waste seems to be the only way to handle plastic waste in the direction of sustainable development. Polyolefins, mainly polyethylene (LDPE or HDPE) and polypropylene (PP) are the main type of thermoplastics used worldwide in a wide variety of applications. In the process of thermocatalytic hydrogenation during processing of polymer waste, hydrocarbon fractions similar to motor fuels will be obtained. In general, this will allow us to process secondary raw materials, add additional fuel materials to the market and have a positive impact on the environment. Studies of new catalysts based on natural zeolite from the Taizhuzgen deposit modified with tungsten and molybdenum salt were carried out in order to jointly study the processes of thermocatalytic hydrogenation of plastic waste and optimize the process. The purpose of the study is to study the characteristics and composition of catalysts based on natural zeolite, which contain active metals for the process of thermocatalytic hydrogenation using physical and chemical methods.Key words: fuels, plastic, recycling, polymer, Taizhuzgen zeolite, composite catalyst.
Introduction
In recent years, due to the growing need for envi-ronmental problems, especially in developing coun-tries, and a decrease in demand for heavy oils, there are high concentrations of macromolecules and the substances contained in them, which must comply with strict environmental norms and standards. Thus, the processes that turn high molecular weight oil so-lutions into clean and light products have attracted the attention of researchers [1–3]. Polymers have be-come common materials in our daily existence and many of their properties such as service life, univer-salism and light weight can be an essential factor in achieving significant elaboration. However, the use of polymeric materials also increases the amount of solid waste generated, as polymeric products are of-ten only used once before being recycled. The prob-lem of recycling is not only technical, but also has so-cial, economic and even political dimensions. It is for this reason that several different methods have been investigated and applied to solve problems related to the management and disposal of polymer waste [4].
The key parameter is the use of plastic waste as a source of hydrocarbon fuel. The habit of discarding plastic waste has created many environmental prob-lems and threats to water bodies. To solve this prob-lem, various thermochemical recycling processes have been adopted, namely thermocatalytic, pyroly-sis, incineration, gasification, pyrolysis-reforming strategies for converting plastic waste into fuel-class transport hydrocarbons.
Type of thermochemical process chosen for con-verting plastic waste into useful energy depends on the existence of feedstock and the conversion ef-ficiency. All processes are multi-stage and require a special type of reactor to overcome the problems of toxic gas emissions into the atmosphere [5–9]. In this study, a method for using plastic waste for the synthesis of carbon-containing materials for energy production and the use of capacitors is proposed. En-vironmental problems caused by plastic waste are ad-dressed properly [10].
Processing takes place thanks to hydrothermal liquefaction – waste melts at ultra-high temperatures and dissolves in supercritical water. After that, it turns
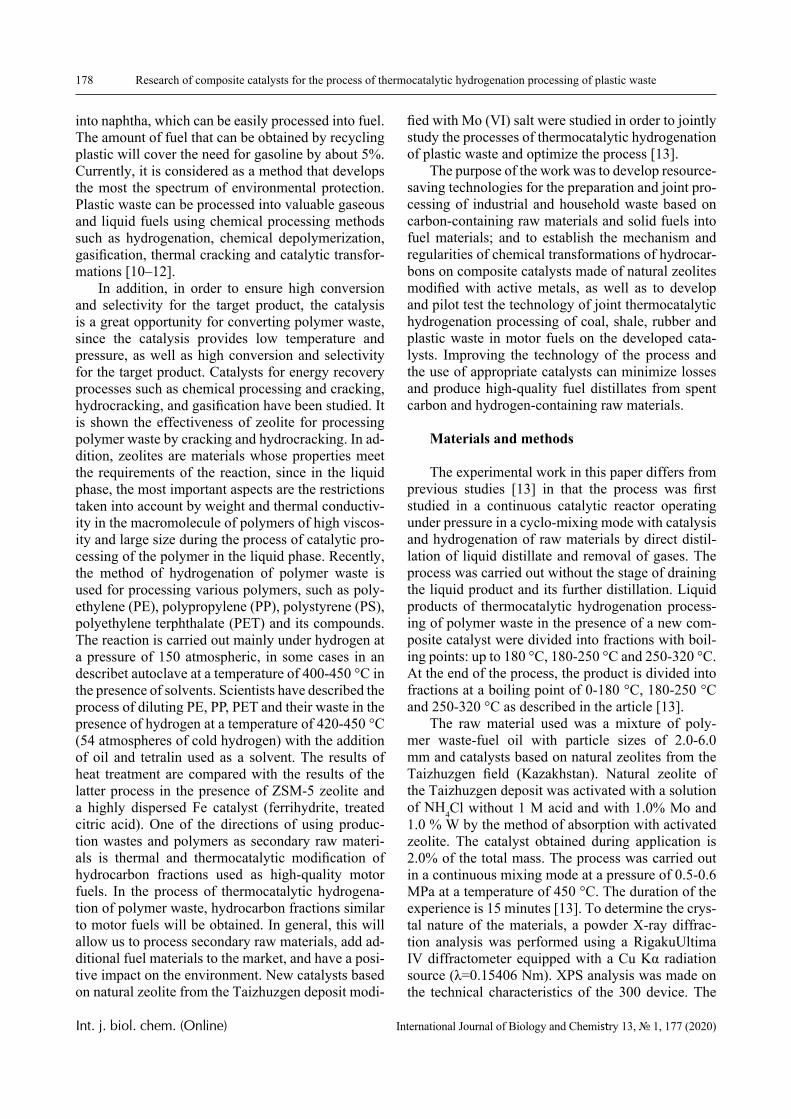
178 Research of composite catalysts for the process of thermocatalytic hydrogenation processing of plastic waste
Int. j. biol. chem. (Online) International Journal of Biology and Chemistry 13, № 1, 177 (2020)
into naphtha, which can be easily processed into fuel. The amount of fuel that can be obtained by recycling plastic will cover the need for gasoline by about 5%. Currently, it is considered as a method that develops the most the spectrum of environmental protection. Plastic waste can be processed into valuable gaseous and liquid fuels using chemical processing methods such as hydrogenation, chemical depolymerization, gasification, thermal cracking and catalytic transfor-mations [10–12].
In addition, in order to ensure high conversion and selectivity for the target product, the catalysis is a great opportunity for converting polymer waste, since the catalysis provides low temperature and pressure, as well as high conversion and selectivity for the target product. Catalysts for energy recovery processes such as chemical processing and cracking, hydrocracking, and gasification have been studied. It is shown the effectiveness of zeolite for processing polymer waste by cracking and hydrocracking. In ad-dition, zeolites are materials whose properties meet the requirements of the reaction, since in the liquid phase, the most important aspects are the restrictions taken into account by weight and thermal conductiv-ity in the macromolecule of polymers of high viscos-ity and large size during the process of catalytic pro-cessing of the polymer in the liquid phase. Recently, the method of hydrogenation of polymer waste is used for processing various polymers, such as poly-ethylene (PE), polypropylene (PP), polystyrene (PS), polyethylene terphthalate (PET) and its compounds. The reaction is carried out mainly under hydrogen at a pressure of 150 atmospheric, in some cases in an describet autoclave at a temperature of 400-450 °C in the presence of solvents. Scientists have described the process of diluting PE, PP, PET and their waste in the presence of hydrogen at a temperature of 420-450 °C (54 atmospheres of cold hydrogen) with the addition of oil and tetralin used as a solvent. The results of heat treatment are compared with the results of the latter process in the presence of ZSM-5 zeolite and a highly dispersed Fe catalyst (ferrihydrite, treated citric acid). One of the directions of using produc-tion wastes and polymers as secondary raw materi-als is thermal and thermocatalytic modification of hydrocarbon fractions used as high-quality motor fuels. In the process of thermocatalytic hydrogena-tion of polymer waste, hydrocarbon fractions similar to motor fuels will be obtained. In general, this will allow us to process secondary raw materials, add ad-ditional fuel materials to the market, and have a posi-tive impact on the environment. New catalysts based on natural zeolite from the Taizhuzgen deposit modi-
fied with Mo (VI) salt were studied in order to jointly study the processes of thermocatalytic hydrogenation of plastic waste and optimize the process [13].
The purpose of the work was to develop resource-saving technologies for the preparation and joint pro-cessing of industrial and household waste based on carbon-containing raw materials and solid fuels into fuel materials; and to establish the mechanism and regularities of chemical transformations of hydrocar-bons on composite catalysts made of natural zeolites modified with active metals, as well as to develop and pilot test the technology of joint thermocatalytic hydrogenation processing of coal, shale, rubber and plastic waste in motor fuels on the developed cata-lysts. Improving the technology of the process and the use of appropriate catalysts can minimize losses and produce high-quality fuel distillates from spent carbon and hydrogen-containing raw materials.
Materials and methods
The experimental work in this paper differs from previous studies [13] in that the process was first studied in a continuous catalytic reactor operating under pressure in a cyclo-mixing mode with catalysis and hydrogenation of raw materials by direct distil-lation of liquid distillate and removal of gases. The process was carried out without the stage of draining the liquid product and its further distillation. Liquid products of thermocatalytic hydrogenation process-ing of polymer waste in the presence of a new com-posite catalyst were divided into fractions with boil-ing points: up to 180 °C, 180-250 °C and 250-320 °C. At the end of the process, the product is divided into fractions at a boiling point of 0-180 °C, 180-250 °C and 250-320 °C as described in the article [13].
The raw material used was a mixture of poly-mer waste-fuel oil with particle sizes of 2.0-6.0 mm and catalysts based on natural zeolites from the Taizhuzgen field (Kazakhstan). Natural zeolite of the Taizhuzgen deposit was activated with a solution of NH4Cl without 1 M acid and with 1.0% Mo and 1.0 % W by the method of absorption with activated zeolite. The catalyst obtained during application is 2.0% of the total mass. The process was carried out in a continuous mixing mode at a pressure of 0.5-0.6 MPa at a temperature of 450 °C. The duration of the experience is 15 minutes [13]. To determine the crys-tal nature of the materials, a powder X-ray diffrac-tion analysis was performed using a RigakuUltima IV diffractometer equipped with a Cu Kα radiation source (λ=0.15406 Nm). XPS analysis was made on the technical characteristics of the 300 device. The
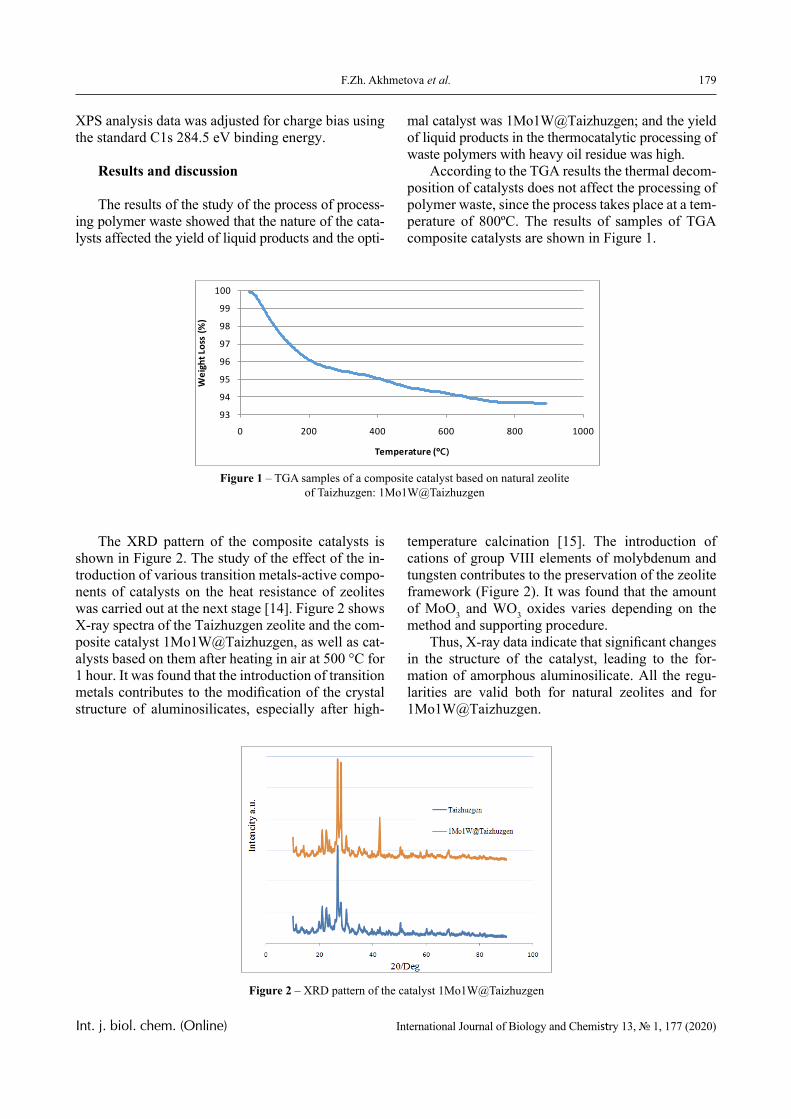
179F.Zh. Akhmetova et al.
Int. j. biol. chem. (Online) International Journal of Biology and Chemistry 13, № 1, 177 (2020)
XPS analysis data was adjusted for charge bias using the standard C1s 284.5 eV binding energy.
Results and discussion
The results of the study of the process of process-ing polymer waste showed that the nature of the cata-lysts affected the yield of liquid products and the opti-
mal catalyst was 1Mo1W@Taizhuzgen; and the yield of liquid products in the thermocatalytic processing of waste polymers with heavy oil residue was high.
According to the TGA results the thermal decom-position of catalysts does not affect the processing of polymer waste, since the process takes place at a tem-perature of 800ºC. The results of samples of TGA composite catalysts are shown in Figure 1.
93
94
95
96
97
98
99
100
0 200 400 600 800 1000
Wei
ght L
oss
(%)
Temperature (°C)
1Mo1W@Taizhuzgen - TGA
Figure 1 – TGA samples of a composite catalyst based on natural zeolite of Taizhuzgen: 1Mo1W@Taizhuzgen
The XRD pattern of the composite catalysts is shown in Figure 2. The study of the effect of the in-troduction of various transition metals-active compo-nents of catalysts on the heat resistance of zeolites was carried out at the next stage [14]. Figure 2 shows X-ray spectra of the Taizhuzgen zeolite and the com-posite catalyst 1Mo1W@Taizhuzgen, as well as cat-alysts based on them after heating in air at 500 °C for 1 hour. It was found that the introduction of transition metals contributes to the modification of the crystal structure of aluminosilicates, especially after high-
temperature calcination [15]. The introduction of cations of group VIII elements of molybdenum and tungsten contributes to the preservation of the zeolite framework (Figure 2). It was found that the amount of MoO3 and WO3 oxides varies depending on the method and supporting procedure.
Thus, X-ray data indicate that significant changes in the structure of the catalyst, leading to the for-mation of amorphous aluminosilicate. All the regu-larities are valid both for natural zeolites and for 1Mo1W@Taizhuzgen.
Figure 2 – XRD pattern of the catalyst 1Mo1W@Taizhuzgen
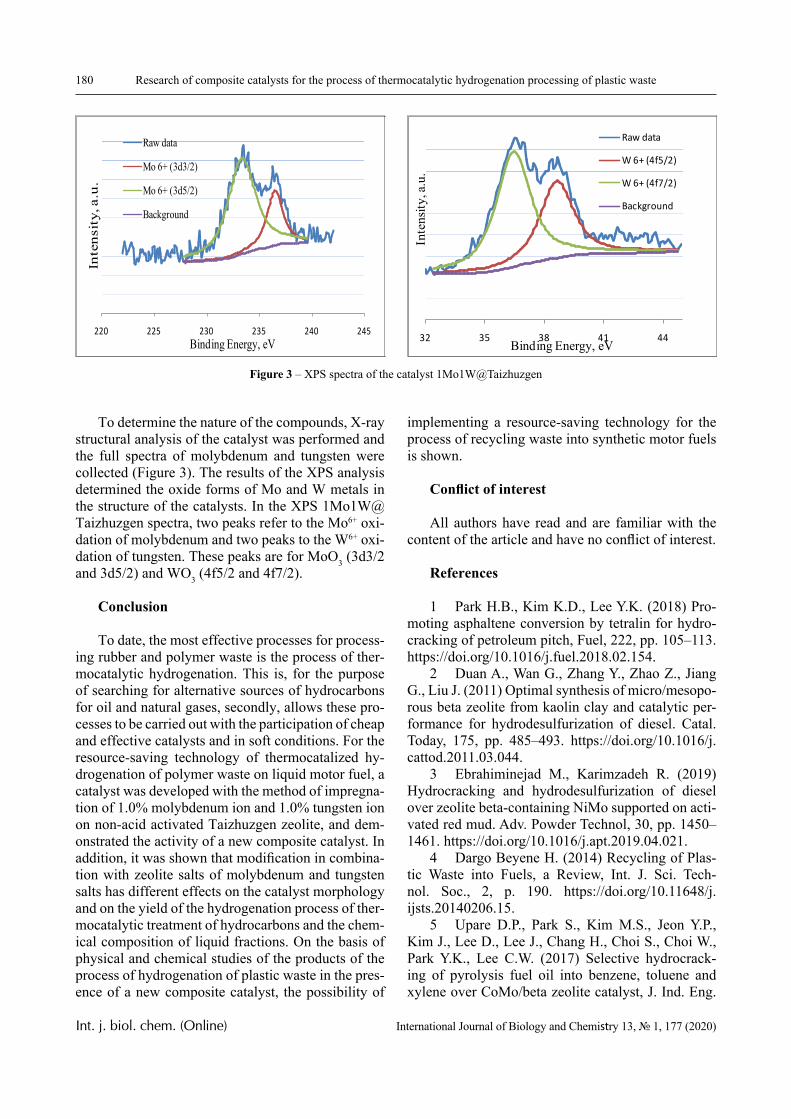
180 Research of composite catalysts for the process of thermocatalytic hydrogenation processing of plastic waste
Int. j. biol. chem. (Online) International Journal of Biology and Chemistry 13, № 1, 177 (2020)
To determine the nature of the compounds, X-ray structural analysis of the catalyst was performed and the full spectra of molybdenum and tungsten were collected (Figure 3). The results of the XPS analysis determined the oxide forms of Mo and W metals in the structure of the catalysts. In the XPS 1Mo1W@Taizhuzgen spectra, two peaks refer to the Mo6+ oxi-dation of molybdenum and two peaks to the W6+ oxi-dation of tungsten. These peaks are for MoO3 (3d3/2 and 3d5/2) and WO3 (4f5/2 and 4f7/2).
Conclusion
To date, the most effective processes for process-ing rubber and polymer waste is the process of ther-mocatalytic hydrogenation. This is, for the purpose of searching for alternative sources of hydrocarbons for oil and natural gases, secondly, allows these pro-cesses to be carried out with the participation of cheap and effective catalysts and in soft conditions. For the resource-saving technology of thermocatalized hy-drogenation of polymer waste on liquid motor fuel, a catalyst was developed with the method of impregna-tion of 1.0% molybdenum ion and 1.0% tungsten ion on non-acid activated Taizhuzgen zeolite, and dem-onstrated the activity of a new composite catalyst. In addition, it was shown that modification in combina-tion with zeolite salts of molybdenum and tungsten salts has different effects on the catalyst morphology and on the yield of the hydrogenation process of ther-mocatalytic treatment of hydrocarbons and the chem-ical composition of liquid fractions. On the basis of physical and chemical studies of the products of the process of hydrogenation of plastic waste in the pres-ence of a new composite catalyst, the possibility of
implementing a resource-saving technology for the process of recycling waste into synthetic motor fuels is shown.
Conflict of interest
All authors have read and are familiar with the content of the article and have no conflict of interest.
References
1 Park H.B., Kim K.D., Lee Y.K. (2018) Pro-moting asphaltene conversion by tetralin for hydro-cracking of petroleum pitch, Fuel, 222, pp. 105–113. https://doi.org/10.1016/j.fuel.2018.02.154.
2 Duan A., Wan G., Zhang Y., Zhao Z., Jiang G., Liu J. (2011) Optimal synthesis of micro/mesopo-rous beta zeolite from kaolin clay and catalytic per-formance for hydrodesulfurization of diesel. Catal. Today, 175, pp. 485–493. https://doi.org/10.1016/j.cattod.2011.03.044.
3 Ebrahiminejad M., Karimzadeh R. (2019) Hydrocracking and hydrodesulfurization of diesel over zeolite beta-containing NiMo supported on acti-vated red mud. Adv. Powder Technol, 30, pp. 1450–1461. https://doi.org/10.1016/j.apt.2019.04.021.
4 Dargo Beyene H. (2014) Recycling of Plas-tic Waste into Fuels, a Review, Int. J. Sci. Tech-nol. Soc., 2, p. 190. https://doi.org/10.11648/j.ijsts.20140206.15.
5 Upare D.P., Park S., Kim M.S., Jeon Y.P., Kim J., Lee D., Lee J., Chang H., Choi S., Choi W., Park Y.K., Lee C.W. (2017) Selective hydrocrack-ing of pyrolysis fuel oil into benzene, toluene and xylene over CoMo/beta zeolite catalyst, J. Ind. Eng.
220 225 230 235 240 245
Raw data
Mo 6+ (3d3/2)
Mo 6+ (3d5/2)
Background
Inte
nsit
y, a
.u.
Binding Energy, eV 32 35 38 41 44
Raw data
W 6+ (4f5/2)
W 6+ (4f7/2)
Background
Binding Energy, eV
Inte
nsity
, a.u
.
Figure 3 – XPS spectra of the catalyst 1Mo1W@Taizhuzgen
181F.Zh. Akhmetova et al.
Int. j. biol. chem. (Online) International Journal of Biology and Chemistry 13, № 1, 177 (2020)
Chem., 46, pp. 356–363. https://doi.org/10.1016/j.jiec.2016.11.004.
6 Zhang Y., Nahil M.A., Wu C., Williams P.T. (2017) Pyrolysis–catalysis of waste plastic using a nickel–stainless-steel mesh catalyst for high-value carbon products, Environ. Technol. (United King-dom), 38, pp. 2889–2897. https://doi.org/10.1080/09593330.2017.1281351.
7 Ragaert K., Delva L., Geem K. Van. (2017) Mechanical and chemical recycling of solid plas-tic waste, Waste Manag., 69, pp. 24–58. https://doi.org/10.1016/j.wasman.2017.07.044.
8 Munir D., Irfan M.F., Usman M.R. (2018) Hydrocracking of virgin and waste plas-tics: A detailed review, Renew. Sustain. Energy Rev., 90, pp. 490–515. https://doi.org/10.1016/j.rser.2018.03.034.
9 Weitkamp J. (2012) Catalytic Hydro-cracking-Mechanisms and Versatility of the Pro-cess, ChemCatChem., 4, pp. 292–306. https://doi.org/10.1002/cctc.201100315.
10 Mir R.A., Pandey O.P. (2019) Waste plastic derived carbon supported Mo2C composite catalysts for hydrogen production and energy storage applica-tions. J. Clean. Prod., 218, pp. 644–655. https://doi.org/10.1016/j.jclepro.2019.02.004.
11 Munir D., Abdullah, Piepenbreier F., Us-man M.R. (2017) Hydrocracking of a plastic mixture
over various micro-mesoporous composite zeolites, Powder Technol., 316, pp. 542–550. https://doi.org/10.1016/j.powtec.2017.01.037.
12 Wong S.L., Ngadi N., Abdullah T.A.T., In-uwa I.M. (2015) Current state and future prospects of plastic waste as source of fuel: A review. Renew. Sustain. Energy Rev, 50, pp. 1167–1180. https://doi.org/10.1016/j.rser.2015.04.063.
13 Aubakirov Y.A., Sassykova L.R., Tashmukhambetova Z.K., Akhmetova F.Z., Send-ilvelan S., Sharipov K.O., Kubekova S.N., Batyr-bayeva A.A., Azhigulova R.N., Ryskaliyeva R.G., Zhussupova A.K., Abildin T.S. (2019) Thermo-cata-lytic processing of polymer waste over catalysts on the basis of natural zeolite from the tayzhuzgen field (Kazakhstan) modified by molybdenum, Rasayan J. Chem., 12, pp. 1701–1709. https://doi.org/10.31788/RJC.2019.1245435.
14 Li J., Liu X., Han Q., Yao X., Wang X. (2013) Formation of WO3 nanotube-based bundles directed by NaHSO4 and its application in water treatment. J. Mater. Chem. A., 1, pp. 1246–1253. https://doi.org/10.1039/c2ta00382a.
15 Wdowin M., Franus M., Panek R., Badura L., Franus W. (2014) The conversion technology of fly ash into zeolites. Clean Technol. Environ. Policy., 16, pp. 1217–1223. https://doi.org/10.1007/s10098-014-0719-6.
© 2020 al-Farabi Kazakh National University Int. j. biol. chem. (Online)
International Journal of Biology and Chemistry 13, № 1, 182 (2020)
IRSTI 31.23.99 https://doi.org/10.26577/ijbch.2020.v13.i1.20
*O.V. Dryuk , Zh.T.Mynbaeva Kostanay State University named after A. Baitursynova, Kostanay, Kazakhstan
*e-mail: [email protected]
Amino acid composition of some plants growing in the conditions of Northern Kazakhstan
Abstract. Using gas chromatography, the amino acid composition of plants of the species Amaranthus retroflexus L., Atriplex fera L. Bunge, Elytrigia repens L. Nevski, Bassia hyssopifolia (Pall.) Kuntze, Xanthium strumarium L., growing in the conditions of Northern Kazakhstan was established. The studied plants contain a number of essential and partially replaceable amino acids, such as lysine, leucine and isoleucine, methionine, valine, threonine, arginine, histidine, tryptophan and phenylalanine. Glutamine amino acid, aspartic acid, alanine, arginine, leucine, and isoleucine are found in the largest quantities. Xanthium strumarium L. also contains a large amount of proline. 20 amino acids were detected, including traces of ornithine and hydroxyproline for Amaranthus retroflexus L., Atriplex fera L., Elytrigia repens L., Xanthium strumarium L. For plants of the species Bassia hyssopifolia (Pall.) Kuntze, the presence of 18 amino acids was recorded and it was noted that the accumulation of amino acids is lower compared to other species that we have previously studied. The amino acid composition of plants growing in the conditions of Northern Kazakhstan has its own characteristics. Differences in the qualitative and quantitative amino acid composition of the studied species were established with known data on plants growing in the climatic conditions of Northern Siberia and Southern Kazakhstan for Amaranthus retroflexus L., Elytrigia repens L., Xanthium strumarium L.Key words: amino acids, Amaranthus retroflexus L., Atriplex fera L. Bunge, Elytrigia repens L. Nevski, Bassia hyssopifolia (Pall.) Kuntze, Xanthium strumarium L.
Introduction
In the condition of the agricultural orientation of the Northern region of Kazakhstan, the search of plants with the rich amount of protein and free ami-no acids, suitable as feed additives for farm animals and raw materials for obtaining of biologically active substances necessary in the medical and food indus-try, becomes urgent.
The aim of our research was studying of the amino acid composition of some wild plants from the flora of Northern Kazakhstan.
In addition to studying the qualitative and quan-titative amino acid composition, the objective of the research was determining differences in the content and component composition of amino acids com-pared with the available data on plants growing in other geographical conditions.
Amaranthus retroflexus L., Atriplex fera L. Bunge, Elytrigia repens L. Nevski, Bassia hyssopi-folia (Pall.) Kuntze, Xanthium strumarium L. grow-
ing in the conditions of Northern Kazakhstan were taken as objects of study. All plants are widespread and they form the large raw materials arrays, with Amaranthus retroflexus L., Atriplex fera L., Elytrigia repens L. compete. The amino acid composition of Amaranthus retroflexus L., Elytrigia repens L. con-tains numerous data on plants of some climatic zones. For Atriplex fera L., Xanthium strumarium L., there are data on the qualitative amino acid composition, while the quantitative composition in the literature is not adequately covered. Bassia hyssopifolia (Pall.) is almost not studied.
It is known that the proteins of various types of Amaranthus can differ in the quantitative composi-tion of amino acids [1]. The amino acid composition of Amaranthus Caudatus L., Amaranthus hypohon-driacus L., Amaranthus cruentus L., Amaranthus edulis L., Amaranthus hybridus L. was studied. It has been established that in various species of amaranth, seeds are richest in arginine, serine, leucine and iso-leucine [2]. For plants of Amaranthus species, a high
183O.V. Dryuk, Zh.T. Mynbaeva
Int. j. biol. chem. (Online) International Journal of Biology and Chemistry 13, № 1, 182 (2020)
lysine content is observed, which determines the usefulness of the protein. The amino acid composi-tion of Amaranthus caudatus L. seeds was studied by Korejskoj I.M., Parfenovym A.A and coauthors. 19 amino acids, of which 8 are essential and 11 are non-essential was found. Traces of cystine and ornithine are noted [3, 4].
The amino acid composition of Amaranthus ret-roflexus L. seeds studied for plants growing in Cen-tral Yakutia. The content of 14 amino acids was re-vealed and the dominance of arginine, serine, leucine and isoleucine was established [5, 6].
According to some reports, growing Amaranthus at low ambient temperatures leads to a redistribution of amino acids in the overall complex: the content of serine, glutamate, proline, alanine, isoleucine and lysine increases [7].
According to Elytrigia repens L., there are data on the content of a large number of lectins [8].
Elevsjuzova A.T. and Aralbaeva A.N. investigat-ed the amino acid composition of the stems, rhizomes and seeds of Elytrigia repens L. growing in the con-ditions of Southern Kazakhstan. The authors note a high content of essential acid threonine. The limiting amino acids are phenylalanine and methionine [9].
Voronov I.V. carried out a comparative studying of the amino acid composition of seeds and middle leaves of Atriplex patula L. and Amaranthus retro-flexus L. of flora of Central Yakutia. The presence of 14 amino acids was revealed, including 9 essential amino acids (lysine, leucine and isoleucine, methio-nine, valine, threonine, arginine, histidine and phe-nylalanine). Essential amino acids are tyrosine, pro-line, serine, alanine, and glycine. The author notes the absence of the histidine amino acid and the low content of phenylalanine in the seeds and leaves of Atriplex patula L. as compared to Amaranthus retro-flexus L. [6].
The plants of the genus Xanthium are character-ized the presence of a large number of fatty amino acids. So, the amino acid composition of the seeds of Xanthium californicum L. was determined by Gubanovoj L.B. and the presence of essential amino acids was revealed [10].
Based on the known data, we hypothesized that the amino acid composition of plants growing in the conditions of Northern Kazakhstan will have its own characteristics.
Materials and methods
The objects of study were air-dried raw materi-als of Amaranthus retroflexus L., Atriplex fera L.
Bunge, Elytrigia repens L. Nevski, Bassia hyssopi-folia (Pall.) Kuntze, Xanthium strumarium L. Plants were harvested in the Kostanay region in August-September 2019.
The determination of amino acids was carried out by gas chromatography. Chromatography was per-formed on a CARLO-ERBA- 4200 gas chromatograph.
The dried, crushed feed was hydrolyzed with hy-drochloric acid for 24 hours. The obtained hydroly-zate was evaporated three times to dryness in a rotary vacuum evaporator at 40° C and the final precipitate was dissolved in sulfosalicylic acid, after centrifuga-tion at a speed of 2.5 thousand rpm. The amino ac-ids were eluted by NH4OH through an ion exchange column. The eluates were evaporated to dryness on a rotary evaporator, then a freshly prepared solution of tin chloride II, 2,2-dimethoxypropane and propanol saturated with hydrochloric acid were added to the flask, the mixture were heated at 110 ° C for 20 min-utes, and the contents of the flask were again evapo-rated on a rotary evaporator. Freshly prepared acylat-ing reagent (1 volume of acetic anhydride, 2 volumes of triethylamine, 5 volumes of acetone) was intro-duced into the flask, the samples were evaporated to dryness, ethyl acetate and saturated sodium chloride solution were added. The contents of the flask were thoroughly mixed and, as two layers formed, they took the top layer (ethyl acetate) for gas chromato-graphic analysis.
Results and discussion
The analysis of the amino acid composition of the studied plants are shown in Table 1 and Figure 1.
The composition of Amaranthus retroflexus L., Atriplex fera L., Elytrigia repens L., Xanthium stru-marium L., growing in the sharply continental cli-mate of Northern Kazakhstan, revealed the presence of 20 amino acids. Glutamate, aspartate, alanine, ar-ginine, leucine, and isoleucine were found in the larg-est quantities. Traces of ornithine and hydroxyproline were found.
In the aboveground mass of Xanthium strumari-um L., the qualitative composition of amino acids is about 20 amino acids, of which asparagine, alanine and proline are found in the greatest amounts. After analysis of literature sources it follows that when studying the amino acid composition of the seeds of Xanthium californicum and Xanthium strumarium L., amino acids in mainly total quantities were previous-ly detected [10, 11]. The total amino acid content is 10.4%, of which 31% are irreplaceable and partially replaceable amino acids.
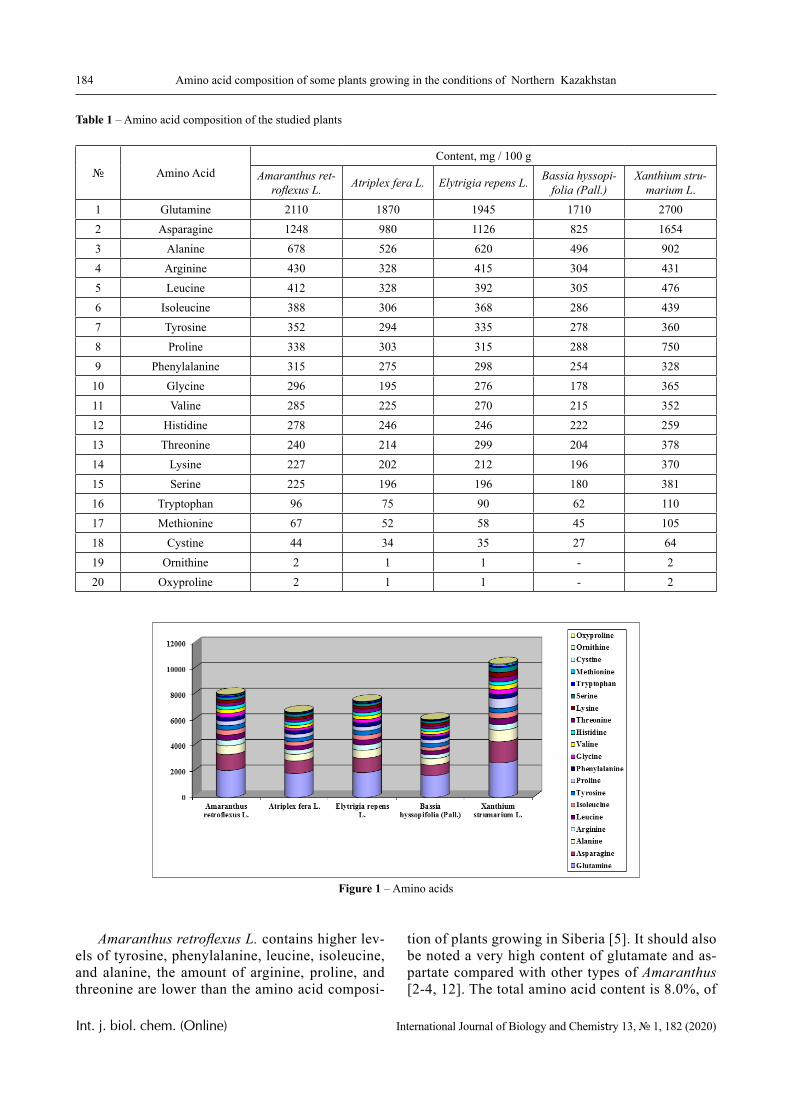
184 Amino acid composition of some plants growing in the conditions of Northern Kazakhstan
Int. j. biol. chem. (Online) International Journal of Biology and Chemistry 13, № 1, 182 (2020)
Table 1 – Amino acid composition of the studied plants
№ Amino Acid Content, mg / 100 g
Amaranthus ret-roflexus L. Atriplex fera L. Elytrigia repens L. Bassia hyssopi-
folia (Pall.)Xanthium stru-
marium L.1 Glutamine 2110 1870 1945 1710 27002 Asparagine 1248 980 1126 825 16543 Alanine 678 526 620 496 9024 Arginine 430 328 415 304 4315 Leucine 412 328 392 305 4766 Isoleucine 388 306 368 286 4397 Tyrosine 352 294 335 278 3608 Proline 338 303 315 288 7509 Phenylalanine 315 275 298 254 328
10 Glycine 296 195 276 178 36511 Valine 285 225 270 215 35212 Histidine 278 246 246 222 25913 Threonine 240 214 299 204 37814 Lysine 227 202 212 196 37015 Serine 225 196 196 180 38116 Tryptophan 96 75 90 62 11017 Methionine 67 52 58 45 10518 Cystine 44 34 35 27 6419 Ornithine 2 1 1 - 220 Oxyproline 2 1 1 - 2
Figure 1 – Amino acids
Amaranthus retroflexus L. contains higher lev-els of tyrosine, phenylalanine, leucine, isoleucine, and alanine, the amount of arginine, proline, and threonine are lower than the amino acid composi-
tion of plants growing in Siberia [5]. It should also be noted a very high content of glutamate and as-partate compared with other types of Amaranthus [2-4, 12]. The total amino acid content is 8.0%, of
185O.V. Dryuk, Zh.T. Mynbaeva
Int. j. biol. chem. (Online) International Journal of Biology and Chemistry 13, № 1, 182 (2020)
which 34% are irreplaceable and partially replace-able amino acids.
The amino acid composition of Atriplex fera L. in Northern Kazakhstan differs from Atriplex patula L. in Southern Siberia. The presence of small amounts of tryptophan, ornithine, oxyproline, cystine is noted. In general, the content of interchangeable and irre-placeable amino acids is higher [6]. The total amino acid content is 6.7 %, of which 34 % are irreplaceable and partially replaceable amino acids.
Differences in the content of essential amino ac-ids Elytrigia repens L. are noted in comparison with plants growing in Southern Kazakhstan: the mass fraction of leucine, isoleucine and histidine is higher, and the mass fraction of threonine, valine, arginine is lower [9]. The total amino acid content is 7.5%, of which 35% are irreplaceable and partially replace-able amino acids.
In the studying samples of Bassia hyssopifolia (Pall.), growing near Lake Kushmurun, in Kostanay region, the presence of 18 amino acids was estab-lished. Glutamic and aspartic acids were found in the greatest quantities. The amino acid composition of Bassia hyssopifolia (Pall.) also includes small amounts of tryptophan, cysteine, methionine. The total amino acid content is 6.1%, of which 34% are irreplaceable and partially replaceable amino acids.
Conclusion
The wild plants containing a large number of amino acids are of interest as the medicinal raw ma-terials, food additives and food supply. Amino acids are a plastic material in the biosynthesis of proteins, nitrogen-containing non-protein substances, such as creatine and choline. Maintaining nitrogen balance in humans and animals depends on them. Plants rich in amino acids are a valuable raw material. The high content of amino acids in plants contributes to their effective effect on the body, as well as improved ab-sorption, prolongation of the therapeutic effect of other biologically active substances [13-16].
As recent studies have shown, in plants about 25-30% of amino acids in free or bound form are con-tained. The wide distribution of amino acids in plants and their high biological activity contribute to the positive effect on the body of medicinal raw materi-als and medicines derived from it. So, for example, methionine as a hepatoprotective agent, aspartic acid compounds are used for the treatment of diseases of the cardiovascular system, glutamic acid can be used for the treatment of diseases of the central nervous system, histidine is used for peptic ulcers, aspartic
acid are used to normalize coronary circulation, ser-ine are used to normalize fat metabolism, maintain-ing immunity [1].
The plant species studied by us are characterized by a large list of amino acids. Amaranthus retro-flexus L., Atriplex fera L., Elytrigia repens L., Xan-thium strumarium L. contain 20 amino acids, includ-ing trace amounts of ornithine and oxyproline. For plants of the species Bassia hyssopifolia (Pall.) the presence of 18 amino acids was recorded and it was noted that the accumulation of amino acids is lower compared to other species studied by us. The studied plants contain irreplaceable and partially replaceable amino acids: lysine, leucine and isoleucine, methio-nine, valine, threonine, tryptophan, phenylalanine, arginine and histidine, which make up 31-35 % of the total number of amino acids. The total amino acid content varies from 6.1 to 10.4 %.
The obtained experimental data confirm that these plant species can be used as raw materials for the production of biologically active substances nec-essary in the medical and food industries.
Thus, according to the results of the research, the plants Amaranthus retroflexus L., Atriplex fera L., Elytrigia repens L., Bassia hyssopifolia (Pall.), Xan-thium strumarium L., growing in the conditions of Northern Kazakhstan, contain large amounts of ami-no acids, including essential leucine, isoleucine, argi-nine, etc., trace amounts of ornithine and oxyproline.
References
1 Minjaeva O.A. (2016) Amino acids, as bio-logical objects, in aqueous solutions [Aminokisloty, kak biologicheskie ob”ekty, v vodnyh rastvorah]. Scientific Review. Biological sciences [Nauchnoe obozrenie. Biologicheskie nauki], no. 6, pp. 43-47.
2 Kol’tyugina O.V. (2011) The use of amaranth seeds in dairy products [Ispol’zovanie semyan ama-ranta v molochnyh produktah]. Polzunovsky Bulletin [Polzunovskij vestnik], no. 3/2, pp. 163-166.
3 Parfenov A.A., Dzhurko Ju.A., Korenskaja I.M., Kornievskij Yu.I., Solennikova S.N., Borodin L.I., Fursa N.S. (2012) The study of the amino acid composition of the seeds of amaranth of the sad vari-ety Voronezh before and after extraction with hexane [Izuchenie aminokislotnogo sostava semyan amaran-ta pechal’nogo sorta voronezhskij do i posle ekstrak-cii geksanom].
4 Korejskaja I.M. (2013) Pharmacognos-tic study of seeds of various varieties of Amarant pechal’nogo (Amaranthus hypochondriacus L.) [Far-makognosticheskoe izuchenie semyan razlichnyh
186 Amino acid composition of some plants growing in the conditions of Northern Kazakhstan
Int. j. biol. chem. (Online) International Journal of Biology and Chemistry 13, № 1, 182 (2020)
sortov amaranta pechal’nogo (Amaranthus hypo-chondriacus, L.)]. Manuscript of the dissertation for the degree of candidate of pharmacological sciences. Permian [Rukopis’ dissertacii na soiskanie uchenoj stepeni kandidata farmakologicheskih nauk. Perm’].
5 Poskachina E.R. (2014) Ecological, physi-ological and biochemical features of the shhiricy zaprokinutoj (Amaranthus retroflexus, L.), growing in the conditions of central Yakutia and the pros-pects for its use [Jekologo-fiziologicheskie i biohi-micheskie osobennosti shhiricy zaprokinutoj (Ama-ranthus retroflexus, L.), proizrastajushhej v uslovijah central’noj Jakutii i perspektivy ee ispol’zovanija]. Manuscript of the dissertation for the degree of can-didate of biological sciences. Yakutia [Rukopis’ dis-sertacii na soiskanie uchenoj stepeni kandidata bio-logicheskih nauk. Jakutija].
6 Voronov I.V. (2018) Amino-acid composi-tion of Atriplex patula, L. and Amaranthus retroflex-us, L. (Amaranthaceae) growing in Central Yakutia [Aminokislotnyj sostav Atriplex patula, L. i Amaran-thus retroflexus, L. (Amaranthaceae), proizrastajush-hih v Central’noj Jakutii]. Chemistry of plant materi-als [Khimija rastitel’nogo syr’ja], no. 3, pp. 69-74. https://doi.org/10.14258/jcprm.2018033610.
7 Gasimova G.A., Degtjareva I.A. (2016) Complete vegetable protein as a means of improv-ing the productivity of agricultural [Polnocennyj rastitel’nyj belok kak sredstvo povyshenija produk-tivnosti sel’skohozjajstvennyh zhivotnyh]. Journal, Scientific notes of Kazan State Academy of Veteri-nary Medicine named after N.E. Bauman [Zootehni-ja, Uchenye zapiski Kazanskoj gosudarstvennoj aka-demii veterinarnoj mediciny im. N.Je. Baumana].
8 Cammue B., Stinissen H.M., Peumans W.J. (1985) A new type of cereal lectin from leaves of couch grass (Agropyrumrépen). Eur. J. Biochem, 148, pp. 315-322. https://doi.org/10.1111/j.1432-1033.1985.tb08841.x
9 Elevsjuzova A.T., Aralbaeva A.N. (2019) As-sessment of the biological value of different parts of pyreja polzuchego [Ocenka biologicheskoj cennosti raznyh chastej pyreja polzuchego]. Eurasian Union of Scientists (ESU) [Evrazijskij Sojuz Uchenyh (ESU)], no. 2 (59), pp. 10-12.
10 Gubanova L.B., Beklemesh E.H. (2008). The study of the amino acid composition of the flowers of the durnishnika kalifornijskogo [Izuchenie aminokis-lotnogo sostava semjan durnishnika kalifornijsk-
ogo]. Development, research and marketing of new pharmaceutical products. Pyatigorsk [Razrabotka, issledovanie i marketing novoj farmacevticheskoj produkcii]. Pjatigorsk, vol. 63, pp. 798.
11 Klimakhin G. I., Fonin V. S., Maslyakov V. Yu., Fadeev N. B., Semikin V. V., and Pel’gunova L. A. (2015) Biochemical features of common cock-lebur (Xanthium strumarium, L.) Pharmaceutical chemistry Journal, vol. 49, no. 8, November, 2015 (Russian Original vol. 49, no. 8, August, 2015). https://doi.org/10.1007/s11094-015-1324-7.
12 Volkova G.A., Shirshova T.I., Beshlej I.V., Matistov N.V., Ufimcev K.G. (2017) Amaranth (Am-aranthus, L.): chemical composition and prospects of introduction in the north [Amarant (Amaranthus, L.): himicheskij sostav i perspektivy introdukcii na severe]. Bulletin of the Komi Scientific Center, Ural Branch of the Russian Academy of Sciences, Syk-tyvkar [Izvestija Komi nauchnogo centra UrO RAN, Syktyvkar], no. 3 (31), pp.5-14.
13 Vysochina G.I. (2013) Amaranth (Amaran-thus, L.): chemical composition and prospects of using (review) [Amaranth (Amaranthus, L.): himi-cheskij sostav i perspektivy ispol’zovaniya (obzor)] Chemistry of plant materials [Khimija rastitel’nogo syr’ja], no.2. pp. 5–14. https://doi.org/10.14258/jcprm.1302005
14 Trineeva O.V., Sinkevich A.V., Slivkin A.I. (2015) Study of the amino acid composition of plant extracts objects [Issledovanie aminokislot-nogo sostava izvlechenij iz rastitel’nyh ob”ektov]. Chemistry of plant materials [Khimija rastitel’nogo syr’ja], no.2, pp. 141–148. https://doi.org/10.14258/jcprm.201502292
15 Sechin E.N., Marakaev O.A., Gavrilov G.B. (2019) Amino acid composition of vegetative organs Dactylorhiza Maculata, L. Soó (Orchida-ceae) [Aminokislotnyj sostav vegetativnyh organov Dactylorhiza Maculata, L. Soó (Orchidaceae)]. Chemistry of plant materials [Khimija rastitel’nogo syr’ja], no. 2, pp.135-142. https://doi.org/10.14258/jcprm.2019024364
16 Bakova E.Ju., Plugatar’ Ju.V., Bakova N.N., Konovalov D.A. (2019) Mineral and amino acid composition of the leaves of Myrtus communis, L. [Mineral’nyj i aminokislotnyj sostav list’ev Myrtus Communis, L]. Chemistry of plant materials [Khi-mija rastitel’nogo syr’ja], no. 3, pp. 217-223. https://doi.org/10.14258/jcprm.2019034917.