international journal - ijhsci
TRANSCRIPT

IIInnnttteeerrrnnnaaatttiiiooonnnaaalll JJJooouuurrrnnnaaalll oonn
HHHaaannndddsss---ooonnn SSSccciiieeennnccceee
Editor in-chief: Manuel F. M. Costa
IJHSCI
Volume 1, Number 2, December 2008 ISSN 1646-8937
Published by the HANDS-ON SCIENCE NETWORK
…towards a better Science Education…
Instructions to Authors for A4: 21.0x29.7 cm
IJHSCI
Author(s) Name(s) Author Affiliation(s) with full Address(es)
E-mail(s)
Abstract. These instructions give you guidelines for preparing papers for the “International Journal on Hands-on Science” and HSCI’ conferences or workshops proceedings books.
Use this document as a template for Microsoft Word 6.0 or later. Define all symbols used in the abstract. Do not cite references in the abstract.
The abstract is to be in fully-justified italicized text, at the top of the left-hand column as it is here, below the author information. Use the word “Abstract.” in 12-point Times, boldface type, left positioned, initially capitalized, followed by the abstract in 11-point, single-spaced type, up to 100 words long.
Leave one blank line after the abstract, then begin the keywords. Use the word "Keywords." in 12-point Times, boldface type, left positioned, initially capitalized, followed by up to ten keywords in 11-point, separated by comma, as below.
Leave one blank line after the keywords, and then before begin the main text. Keywords. Times New Roman, 11 pt. About four, alphabetical order, key words or phrases, separated by commas. 1. Introduction
This is an example of papers for the “International Journal on Hands-on Science” and HSCI’ conferences or workshops. These guidelines include complete description of the paper style including formatting, fonts, spacing, and related information for producing your proceedings manuscripts. Please follow them carefully and if you have any questions, send it via e-mail to [email protected] or [email protected]. 2. Paper organization and formatting
All papers should be written in English. Other languages can be accepted (and welcomed) as in the case of IJHSCI, International Journal on Hands-on Science, www.aect.pt/hsci/ij.html, or for some conferences, as stated on their websites, (in any case a translation of the title and of the abstract in English should be provided). There are no size/length limitations. However six pages long is considered to be a suitable length (letters to the editor should be limited to 3 pages at most). The manuscript should be arranged in the following order: - Main title - Author(s), affiliation(s), full and e-mail addresses - Abstract - Keywords - Main text - Footnotes - Acknowledgements - References
All printed material, including text and figures, must be kept within a print area of 16 cm (6.3") wide by 24.7 (9.7") high. Do not write or print anything outside the print area. Paper size is A4: 21x29.7 cm (8.3x11.7"). Margins (top, bottom, left, right) are 2.5 cm (1"). If paper size is Letter: 21.6x27.9 cm (8.5x11"), margins are: left and right 2.8 cm (1.1"), and top and bottom 1.6 cm (0.63"). All text must be in a two-column format. Columns are to be 7.7 cm (3") wide, with a 0.6 cm (0.24") space between them. Text must be fully justified. Indent each paragraph by 0.5 cm (0.2"). 3. Main title
The main title (on the first page) should begin 2.5 cm (1") from the top edge of the page, centered, and in Times 14-point, boldface type. Capitalize the first letter of nouns, pronouns, verbs, adjectives, and adverbs; do not capitalize articles, coordinate conjunctions, or prepositions (unless the title begins with such a word). Leave a blank line after the title. 4. Author name(s) and affiliation(s)
Author names and affiliations are to be centered beneath the title and printed in Times 12-point, non-boldface type. For multiple authors, affiliations are centered below each author name, italicized, not bold. Include also e-mail addresses. Follow the author information by two blank lines before main text. 5. Type-style and fonts
Wherever Times is specified, Times Roman, or Times New Roman may be used. If neither is available on your word processor, please use the font closest in appearance to Times that you have access to. Please avoid using bit-mapped fonts if possible. True-Type 1 fonts are preferred. 6. First-order headings (may extend to the next line)
For example, “1. Introduction”, should be Times 12-point boldface, initially capitalized, flush left, with one blank line before, and one blank line after. Use a period (“.”) after the heading number, not a colon. For long headings use a hanging indent aligning the text to the right of the heading number as shown above. 6.1. Second-order headings
As in this heading, they should be Times 11-point boldface, initially capitalized, flush left, with one blank line before, and one after. Use a hanging indent for long headings. 6.1.1. Third-order headings
Third-order headings, as in this paragraph, are discouraged. However, if you must use them, use 11-point Times, boldface, initially capitalized, flush left, with one blank line before, and one after. Use a hanging indent for long headings.
7. Main text
Type your main text in 11-point Times, single-spaced. Do not use double-spacing. All paragraphs should be indented 0.5 cm (0.2"). Be sure your text is fully justified—that is, flush left and flush right. Please do not place any additional blank lines between paragraphs. 7.1. Figures
All figures are to be included within the text. Figure captions are to be below the figures, in 9-point Helvetica (or a similar sans-serif font), boldface. Initially capitalize only the first word of each figure caption. Figures are to be numbered consecutively with Arabic numerals throughout the paper, for example: “Figure 1. Database contexts”, and are referred to in the text as Fig. 1, Fig 2, etc. 7.1.1. Illustrations, photographs and graphs
Illustrations, photographs and graphs are considered as figures. All graphics should be centered. Your artwork must be in place in the article (preferably printed as part of the text rather than pasted up). If you are using photographs and are able to have halftones made at a print shop, use a 100- or 110-line screen. Supply the best quality photographs and illustrations possible (for files larger than 10Mb please contact the editors first. Penciled lines and very fine lines do not reproduce well. Remember, the quality of the book cannot be better than the originals provided.
Figure 1. Helvetica or Arial, 9 points, boldface
High resolution color photos or pictures are welcomed. However it will be printed b/w in the printed version of the journal and of the conferences/workshops proceedings. Videos or computer simulation can be included for the electronics (online) version of the Journal. 7.2. Tables
All tables are to be included within the text. Table titles are to be above the tables, in 9-point Helvetica (or a similar sans-serif font), boldface. Initially capitalize only the first word of each table title. Tables are to be numbered consecutively with Arabic numerals throughout the paper, for example: “Table 1. Input data.” and are referred to in the text as Table 1, Table 2, etc. Column headings should be as brief as possible. 7.3. Equations
Equations should be numbered serially on the right-hand side by Arabic numerals in parentheses, and referred to in the text by citing the equation number.
7.4. Footnotes
Use footnotes sparingly (or not at all!) and place them at the bottom of the column on the page on which they are referenced. Use Times 8-point type, single-spaced. To help your readers, avoid using footnotes altogether and include necessary peripheral observations in the text (within parentheses, if you prefer, as in this sentence). 8. Acknowledgements
Acknowledgements, if necessary, should appear in a separate paragraph preceding the references. 9. References
List and number all bibliographical references, sorted in order of appearance in the main text, in 11-point Times, single-spaced, with a hanging indent, at the end of your paper. When referenced in the text, enclose the citation number in square brackets, for example [1]. Use the style of the references shown below for: authored book [4], edited book [1], journal article [2], paper in conference proceedings [3], web resource [5] (please don’t forget to indicate date of access in square brackets). [1] Barghaf V., Poursni R., editors; Information Technology for Pseudo-Knowledge
Management. Paris: ETCr Publishing; 1998. [2] Hkang JR, Ceiw W, Inger BD, Lea FR. Graphs in Computer Simulations. LIAM Journal on
Computer; 18(2): 244-57, 1999. [3] Divjak S. Instructions to Authors. In: Proceedings of the International Conference on Hands
on Science. Divjak S, editor. 2004 Jul 5-9; Ljubljana, Slovenia. Ljubljana; University of Ljubljana; p. 5-15; 2004.
[4] The Knowledge Creating. Tinaka I, Tagchi H. Berlin University Press; 1895. [5] Schulzrinne H, Casner SL, Frederick R, Jacobson V. RTP: A Transport Protocol for Real-
Time Applications. Internet Engineering Task Force; 2001. http://www.ietf.org/internet-drafts/ draft-ietf-avt-rtp-new-10.txt [10/31/2001]
IJHSCI, Volume 1, Number 2, December 2008
International Journal on Hands-on Science ISSN (print version): 1646-8937
ISSN (on-line version): 1646-8945
Educating for Science and through Science
The International Journal on Hands-on Science is a high quality reference open access journal in the area of Science Education in all levels and contexts, subjects and perspectives.
The Journal is open to contributions in all fields of Science and Education but also from all pedagogical approaches and perspectives. We advocate, however, an active investigative learning with an extended use of hands-on experimental work in the classroom and in non-formal and informal contexts.
The main language of the journal is English. However submissions will be welcomed in other languages: French, Portuguese, Spanish, Greek, Italian, Russian, Polish, Hindi, Romanian, Czech, Turkish, others to be added. A translation of the abstracts to English is appreciated or will be provided by the editors for all papers.
Only quality full-papers, and short communication or letters to the editors (in English only) will be published. All submission will be expert peer-reviewed. The reviewing process runs in two stages:
⋅ the manuscript is first read in order to locate and remove everything that may identify the authors (names and affiliation, self citations, references,…) – when a self-reference is removed the cited text will be provided to the expert referees –;
⋅ finally the manuscript, removed of all authors’ identification, will be reviewed by two referees experts in the field.
Editor in-chief: Manuel Filipe Pereira da Cunha Martins Costa Universidade do Minho, Departamento de Física, Campus de Gualtar, 4710-057 Braga, Portugal
Associate editors: Panagiotis Michaelides, University of Crete, Greece José Benito Vazquez-Dorrio, University of Vigo, Spain Sasa Divjak, University of Ljubljana, Slovenia Costas Constantinou, University of Cyprus, Cyprus Dan Sporea, INPFLR, Romania Iryna Berezovska, Ternopoly University, Ukraine Klaus Klein, University of Cologne, Germany Raquel Reis, Open University, Portugal Mikiya Muramatsu, University of São Paulo, Brazil Eva Ramon-Gallegos, National Polytechnic Institute of Mexico, Mexico Manoj Patairiya, National Council for Science and Technology Communication, India Manuel Pereira dos Santos, University of Évora, Portugal Josef Trna, University of Brno, Czech Republic Armando Dias Tavares Jr., Federal University of Rio de Janeiro, Brazil Radu Chisleag, Technical University of Bucharest, Romania Clementina Timus, INPFLR, Romania Mustafa Erol, University of Bozok, Turkey Andre Koch Torres de Assis, University of Campinas, Brazil Nilgün Erentay, Middle East Technical University,Turkey Roger Ferlet, Universite Pierre & Marie Curie, France Hans Fibi, Pädagogische Hochschule Wien, Austria Paulo Cezar Arantes, INMETRO, Brazil Senen Lanceros-Mendez,Universidade do Minho, Portugal
©The Hands-on Science Network
IJHSCI, Volume 1, Number 2, December 2008
Copyright © 2008 HSCI ISSN (print version): 1646-8937 ISSN (on-line version): 1646-8945 Published by the Hands-on Science Network Printed by: Copissaurio Repro – Centro Imp. Unip. Lda. Campus de Gualtar, Reprografia
Complexo II, 4710-057 Braga, Portugal Number of copies: 200 First printing December 2008 Distributed worldwide by The Hands-on Science Network, www.hsci.info, [email protected]
Address: Associação Hands-on Science Network (NIPC 508050561) Rua 1º de Maio, 2 - 2º 4730-734 Vila Verde Portugal
On-line edition available at http://ijhsci.aect.pt/
Please use the following format to cite material from this journal: Author (s). Title of Paper. Int. J. Hands-on Science; vol. volume(number): pp. page numbers, year. All rights reserved. Permission to use is granted if appropriate reference to this source is made, the use is for educational purposes and no fees or other income is charged.
IJHSCI, Volume 1, Number 2, December 2008
INDEX
Editorial Manuel F. M. Costa vi Science Education Laboratories in Turkey: Difficulties and Proposals (paper in Turkish) Türkiye’de Fen Bilgisi Laboratuvarları: Zorluklar ve Öneriler Uğur Böyüka and Mustafa Erol
1 Reception of Students at the Museum of Sciences. A Look under the Perspective of Extended Scientific and Technological Literacy M. Rocha and N.M. Dias Garcia
7
“Espaços da Ciência” of the CECIERJ Foundation V. Cascon, F. S. Amaral, V. F. Guimarães, P. C. B. Arantes and M. S. Dahmouche
19
Informal Learning at School. Science Fairs in Basic Schools Zita Esteves, Andreia Cabral and Manuel F. M. Costa 23 Itinerant Museum of History Chemistry. The Soap Juliana Mesquita Contarini and Walter Ruggeri Waldman 28 Metals Are Reductive But Some Are More Than Others Sara Raquel Oliveira Guedes and José Manuel Pereira da Silva 35 Respiration and photosynthesis in context: Experiments demonstrating the Julia Jentsch, Helga Theurer and Horst Bannwarth 39 Students’ Awareness of Endangered Species and Threatened. Environments: A comparative case-study Mehmet Erdoğan, Nilgün Erentay, Martha Barss and Ancuta Nechita 46 GAIA’ Science Center. Itinerant Planetarium and Observatory (paper in Portuguese) Centro de Ciências GAIA. Planetário e Observatório itinerante Peter Leroy 54 Astronomy Classes as Resource for the Inclusion of Visual Handicap Students (paper in Portuguese) Aulas de Astronomia como Recurso de Inclusâo de Deficientes Visuais Maria Auxiliadora Delgado Machado and Maria da Conceição Barbosa Lima 58 An Interactive Experiment – “Atomística” (paper in Portuguese) Atomística - Uma Experiência Interativa Ana Maria C. Grisa, Maria Alice R. Pacheco, Odoaldo I. Rochefort and Valquíria Villas Boas 62 Partitive Mixing of Colours Interactive Device Ricardo Veiga, Raquel Correia and João Sena Esteves 70 Computer-Controlled Model Railroad Nino Pereira, Hélder Castro, João Sepúlveda and João Sena Esteves 76 Solar-recharged UPS as a low cost AC power supply. for Electronics and Environmental Education. J. Diz-Bugarín and M. Rodríguez-Paz 80 Some Simple Experiments in Optics Using a Photo-Resistor A. Dias Tavares and M. Muramatsu 84 Consequences of a Quadratic Law of the Lever A.K.T. Assis and F.M.M. Ravanelli 89 Mobile Phones in the Classroom Sasa Divjak 92 Magical Numbers May Govern the Optimum Size of Curriculum Classes I.R. Chisleag-Losada and R. Chisleag
95
IJHSCI, Volume 1, Number 2, December 2008
Editorial
English is the language used by the vast majority of international journals. Although it is also the main language used here, recognising the merit and quality of works publish all over the world in other languages, we decided to make the International Journal on Hands-on Science multilingual encouraging the sharing of knowledge experiences and ideas in the largest range of languages possible. In this second issue of our journal four interesting papers in Turkish and Portuguese are included. Today’s situation and the positive development perspectives on science education labs in Turkey are discussed in Böyüka and Erol’ paper. Grisa and co-workers present simple experiments aimed to introduce basic and secondary students to the basics of quantum mechanics and atomic’ physics. Also in Portuguese (Brazilian’ spelling) Machado and Lima suggests the use of astronomy classes on the inclusion of visually handicapped students, and Leroy reports on GAIA’, the Minas Gerais’ science center, astronomy modules (a topic that will be especially in focus next year!). Both these papers resulted from communications presented at the 2008’ annual conference of the Hands-on Science Network. The HSCI2008 international conference transcurred very successfully at the Brazilian historical town of Olinda, October 13 to 17, with over 300 active participants and around 150 interesting and varied communications. The main topic of this year conference was informal science education and the relation with education in formal contexts. In this subject Rocha and Garcia discuss the importance of students’ guidance in visits to science museums, Cascon and co-authors present the network of science centers “Espaços da Ciência” of Rio de Janeiro state in Brazil, Esteves and co-authors present the experience of organizing a science fair in a basic school, and Contarini and Waldman share with us an interesting experience with a hands-on itinerant chemistry museum. Erdogan and co-workers report on a multinational project that intends to assess and increase students’ awareness of endangered species and environmental threats. Seven other meaningful papers present, on different science’ topics, several hands-on experiments and experimental activities with interesting innovative approaches. Divjak reports on the problems and potential of the use of mobile phones in the classroom for science and technology teaching. Chisleag-Losada and Chisleag present a very interesting work, and of significant transversal importance, about magical numbers on the management of education. Assis and Ravanelli present on their paper an interesting discussion on Archimedes’ historical demonstration of law of the lever. On Archimedes remarkable work on gravity and mechanics, Prof. Andre Koch Torres Assis of the University of Campinas in Brazil, published recently a book “Archimedes, the Center of Gravity, and the First Law of Mechanics” (Apeiron, Montreal, 2008, 187 pages, published in English and Portuguese and freely available at http://www.ifi.unicamp.br/~assis/Archimedes.pdf) with a detailed careful and complete exploration of the subject. Including very interesting ideas and experiments it is an excellent work material both to researchers, teachers but also students that will surely enjoy and profit from a very pleasant reading.
“The book describes the main events in the life of Archimedes and the content of his works. It goes on to discuss a large number of experiments relating to the equilibrium of suspended bodies under the influence of Earth’s gravitational force. All experiments are clearly described and performed with simple, inexpensive materials. These experiments lead to a clear conceptual definition of the center of gravity of material bodies and illustrate practical procedures for locating it precisely. The conditions of stable, neutral, and unstable equilibrium are analyzed. Many equilibrium toys and games are described and explained. Historical aspects of the concept are presented, together with the theoretical values of center of gravity obtained by Archimedes. The book also explains how to build and calibrate precise balances and levers. Several experiments are performed leading to a mathematical definition of the center of gravity and the first law of mechanics, also called the law of the lever. Consequences of this law and different explanations of it are described at the end of the book, together with an exhaustive analysis of the works of Euclid and Archimedes.”
Manuel Filipe Pereira da Cunha Martins Costa (Editor-in-Chief)
vi
International Journal on Hands-on Science [ISSN (print): 1646-8937; (online): 1646-8945] Received July 20, 2008; Accepted October 11, 2008. Volume 1, Number 2, December 2008.
The Hands-on Science Network’ 2008 ____________________________________________________________________________________________________________________
1
Science Education Laboratories in Turkey: Difficulties and Proposals
Türkiye’de Fen Bilgisi Laboratuvarları: Zorluklar ve Öneriler
Uğur Böyüka,*, Mustafa Erolb
a Erciyes University, Education Faculty, Dept. of Primary Education, 38039, Kayseri - Turkey b Bozok University, Faculty of Arts and Science, Dept. of Physics, 66200, Yozgat - Turkey
*[email protected], [email protected]
Abstract. Students can confront with many difficulties when learning complex scientific concepts. The experimental activities conducted to help students overcome these difficulties enable them to learn scientific concepts, theories and laws. In Turkey, especially in rural areas, the lack of laboratory facilities and the lack of opportunities for teachers to get professional education in experimental studies are the major factors that cause fail in the provision of experimental activities at the elementary and secondary schools. Therefore, there is a need to establish central laboratories which allows teachers to get professional education. These laboratories allows both teachers and students get the information whenever they want and enable them to get lifelong learning. Keywords. Science education, vocational education, central laboratory, Turkey’ education Özet. Fen eğitimindeki karmaşık kavramların, öğrenciler tarafından anlaşılmasının sağlanmasında birçok zorluklarla karşılaşılmaktadır. Bu zorlukların üstesinden gelebilmek için yapılan deneysel aktiviteler öğrencilere kavramları, teorileri ve yasaları öğrenmede oldukça yarar sağlar. Türkiye’de özellikle kırsal kesimde laboratuvar şartlarının iyi olmaması ve öğretmenlerdeki mesleki eğitim eksiklikleri ilköğretim ve ortaöğretimde deneysel uygulamaların yetersiz kalmasına neden olmaktadır. Bu kapsamda sürekli mesleki eğitim verebilecek merkezi laboratuvarlara ihtiyaç duyulmaktadır. Bu laboratuvarlar sayesinde gerek öğretmenler gerekse öğrenciler bilgiye istedikleri zaman ulaşabilecek ve hayatboyu öğrenme olgusu kazanacaklardır. Anahtar Kelimeler. Fen eğitimi, mesleki eğitim, merkez laboratuvar, Türkiye
1. Giriş
Fen bilimlerinin ve ona dayalı olarak üretilen teknolojilerin toplumların gelişmesine sağladığı katkılar sayılamayacak kadar çoktur. Bu nedenle fen öğretiminin önemi her geçen gün artmaktadır. Günümüzde gelişmiş ülkeler, gelecekte güçlü ve söz sahibi olmanın ancak fen alanında uzman insanlar yetiştirerek mümkün olabileceği düşüncesiyle fen öğretimine büyük önem vermektedirler [1]. Çocukların feni öğrenmesi dünyayı tanımalarına ve karşılaştıkları problemlere çeşitli çözüm yolları bulmalarına yardımcı olmaktadır. Özellikle küçük yaştaki çocuklara fen eğitimi verilirken, onlara rehberlik edilmeli, keşfederek ve eğlenerek öğrenmeleri sağlanmalı, endişeleri ve korkuları en aza indirilmelidir. Ancak bu sayede çocuklar fenden zevk alabilirler [2-3].
Fen bilimlerini diğer bilimlerden ayıran önemli özellikler; öncelikle deneye, gözleme, keşfe önem vererek öğrencinin soru sorma, araştırma yapma becerisini geliştirme, hipotez kurabilme ve ortaya çıkan sonuçları yorumlayabilme olanağı sağlamasıdır [4-5]. Daunt’a göre [6] öğrencilerin öğrenmesinde en fazla kullanılan araçlar sözcüklerdir, fakat sözcükler öğrencilerin zihinlerinde somut olarak canlanamamaktadır. Bu nedenle öğretmen, ne kadar fazla duyu organına hitap ederse öğrenme de o oranda artacaktır. Araç-gereçlerin olabildiği kadar çok kullanımı, eğitimde soyut bilgi ve kavramların somuta dönüşmesini sağlayacaktır.
Bilim ve teknolojinin baş döndürücü bir hızla geliştiği günümüzde fen bilgisi eğitimi çok farklı teknik ve yöntemlerle gerçekleştirilmektedir. Bu yöntemler içerisinde önemli olanlardan bir tanesi de laboratuvar yöntemidir [7]. Laboratuvar yöntemi; fen bilimleri ile ilgili temel bilgileri içeren deneylerin bizzat öğrenciler tarafından yapılarak öğrenilmesini amaçlamaktadır. Aynı
I International Journal on Hands-on Science [ISSN (print): 1646-8937; (online): 1646-8945] Received July 20, 2008; Accepted October 11, 2008. Volume 1, Number 2, December 2008.
The Hands-on Science Network’ 2008 ____________________________________________________________________________________________________________________
2
zamanda, bu yöntemin öğrencilerde; akıl yürütme, eleştirel düşünme, ilmi bakış açısı kazandırma ve problem çözme yeteneklerini geliştirme başta olmak üzere pek çok olumlu etki yaptığı bilinmektedir. Bu yüzden laboratuvar uygulamaları, fen eğitiminin ayrılmaz bir parçası ve odak noktasıdır [8]. 2. Türkiye’de fen bilgisi laboratuvar eğitimi ve karşılaşılan zorluklar
Türkiye’de Millî Eğitim Bakanlığı tarafından hazırlanan fen programlarında, laboratuvar kullanımına amaçlar bazında özel önem verilmektedir. Fakat hem ilköğretim hem de orta öğretimde görev yapan öğretmenlerin ders uygulamalarında laboratuvar kullanımına çok fazla dikkat etmedikleri ortaya çıkmıştır [9]. Özellikle fen bilgisi eğitiminde laboratuvarların, bir konu veya kavramın öğrenciye öğretilmesinde en etkili yöntemlerin başında geldiği düşünüldüğünde olayın ciddiyeti ortaya çıkmaktadır. Fen öğretiminde laboratuvar yönteminin kullanılmasının; (1) öğrencilerin fen eğitim-öğretim sürecine aktif katılmalarını, (2) içinde kendi düşünce ve çabalarının yer aldığı araştırmalara katılmalarını, (3) kişisel gözlemlerle merak ettikleri konular hakkında yeni fikirler elde etmelerini, (4) kavramlar arası ilişkiler kurabilmelerini, (5) bilimsel gerçeklere ulaşma yollarını öğrenmelerini, (6) öğrendikleri teorik bilgileri pratikte kullanabilmelerini, (7) somut öğrenme deneyimleri kazanmalarını ve (8) fen derslerine karşı olumlu tutumlar geliştirmelerini sağlayabildiği belirtilmektedir [9-10]. Dolayısıyla tüm okullarda fen laboratuvarlarının kurulması ve kullanılmasının büyük önem taşıdığı bir gerçektir.
Türkiye’de Fen öğretiminde laboratuvar kullanımının önemi anlaşılmasına karşın uygulamalar noktasında bir çok eksikliklerle karşılaşılmaktadır. Bu eksiklikleri kapatabilmek amacıyla Milli Eğitim Bakanlığı (MEB) tarafından müfredat değişikliklerine gidilmiştir. Türkiye’de ilköğretim alanında 1965 yılından sonra yapılan en köklü değişiklik 2004 yılındaki pilot uygulamalarla başlayan program değişiklikleridir [11]. Yeni müfredata göre ilköğretim ve ortaöğretimde ezberciliğin terk edilmesi ve Avrupa standartlarında bir eğitim hedeflenmiştir. Öğrencilerin kendilerini ifade edebilme kabiliyetlerinin gelişmesi ön plana çıkarılmış ve anlatımdaki başarılarının öğrencinin karnesine de yansıtılması
planlanmıştır. Öğrencilerin ilgisi ‘Deneyelim Görelim’, ‘Gözlem Yapalım’ gibi öğrenci merkezli aktivitelerle zenginleştirilmiştir. Fakat bu değişikliklerin tam anlamıyla hedeflerine ulaştığı ve problemleri tamamen çözdüğü söylenemez.
Ekonomik Kalkınma ve İşbirliği Örgütü (OECD) tarafından ülkelerin eğitim kalitelerini değerlendirmek amacıyla üç yılda bir Uluslararası Öğrenci Değerlendirme Programı (PISA) araştırması yapılmaktadır. Bu araştırma sonuçlarına göre Türkiye’deki öğrencilerin fen bilimleri alanlarındaki bilgi ve becerilerinin geliştirilemediği çok açıktır. 2003 yılında fen bilimleri alanında 40 ülke arasında 434 puanla 35’nci olabilen Türkiye, son olarak 2006 yılında 57 ülkede 15 yaş grubundaki yirmi milyon öğrenciyi temsil eden 400 bin öğrenci üzerinde yapılan araştırma sonucuna göre de 57 ülke arasında ancak 44’ncü sırada yer alabilmiştir [12].
2.1. Laboratuvarların Yetersizliği Türkiye’de kalabalık genç nüfusa hitap
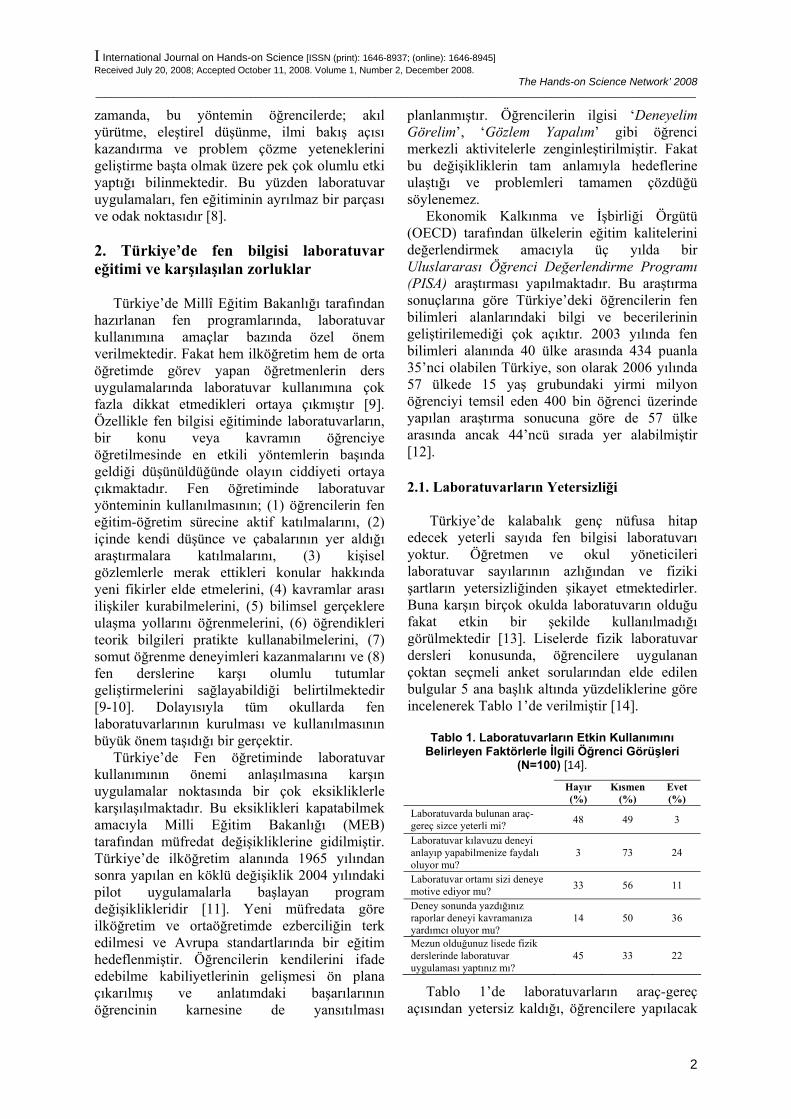
edecek yeterli sayıda fen bilgisi laboratuvarı yoktur. Öğretmen ve okul yöneticileri laboratuvar sayılarının azlığından ve fiziki şartların yetersizliğinden şikayet etmektedirler. Buna karşın birçok okulda laboratuvarın olduğu fakat etkin bir şekilde kullanılmadığı görülmektedir [13]. Liselerde fizik laboratuvar dersleri konusunda, öğrencilere uygulanan çoktan seçmeli anket sorularından elde edilen bulgular 5 ana başlık altında yüzdeliklerine göre incelenerek Tablo 1’de verilmiştir [14].
Tablo 1. Laboratuvarların Etkin Kullanımını Belirleyen Faktörlerle İlgili Öğrenci Görüşleri
(N=100) [14].
Hayır (%)
Kısmen (%)
Evet (%)
Laboratuvarda bulunan araç-gereç sizce yeterli mi? 48 49 3
Laboratuvar kılavuzu deneyi anlayıp yapabilmenize faydalı oluyor mu?
3 73 24
Laboratuvar ortamı sizi deneye motive ediyor mu? 33 56 11
Deney sonunda yazdığınız raporlar deneyi kavramanıza yardımcı oluyor mu?
14 50 36
Mezun olduğunuz lisede fizik derslerinde laboratuvar uygulaması yaptınız mı?
45 33 22
Tablo 1’de laboratuvarların araç-gereç açısından yetersiz kaldığı, öğrencilere yapılacak
I International Journal on Hands-on Science [ISSN (print): 1646-8937; (online): 1646-8945] Received July 20, 2008; Accepted October 11, 2008. Volume 1, Number 2, December 2008.
The Hands-on Science Network’ 2008 ____________________________________________________________________________________________________________________
3
deneyler noktasında rehberlik eden laboratuvar kılavuzlarının iyi hazırlanamadığı ve birçok öğrencinin fen derslerinde laboratuvar uygulaması yapmadan mezun oldukları görülmektedir.
2.2. Öğretmenlerdeki Tedirginlik ve İsteksizlik
Mevcut laboratuvarlarda öğretmenler
tarafından uygulamalar yapılmayışının bir başka nedeni de öğretmenlerin deney yapmaya karşı duydukları tedirginliktir. Öğretmenler deney için hazırlık yapma, deney düzeneğini kurma ve işleniş noktasında isteksiz davranmaktadırlar. Bu isteksizlik öğretmenin kendi eğitiminde bu davranışları kazanamamasından, konu ve deneylere hakim olmamasından ve laboratuvar malzemelerinin kırılıp, bozulmasından endişe edip sorumluluk almaktan çekinmesinden kaynaklanmaktadır. 2.3. Öğretmenlerin Mesleki Eğitim Eksikliği
Türkiye’de ilk ve orta öğretim kurumlarında
çalışan öğretmenlerin laboratuvarların amaç ve uygulamaları hakkında yeterli mesleki eğitim almadıkları ve bu nedenle kendilerini yeterli görmedikleri, okullardaki araç-gereç yetersizliği gibi sorunlardan dolayı laboratuvar çalışmalarını etkin bir şekilde yürütemedikleri bilinmektedir [15-16]. Ayrıca, öğretmenlerin çoğunun laboratuvar araç-gereçlerini iyi tanımadıkları, ne amaçla ve nasıl kullanacaklarını bilmediklerini ortaya koyan çalışmalar da vardır [9,17].
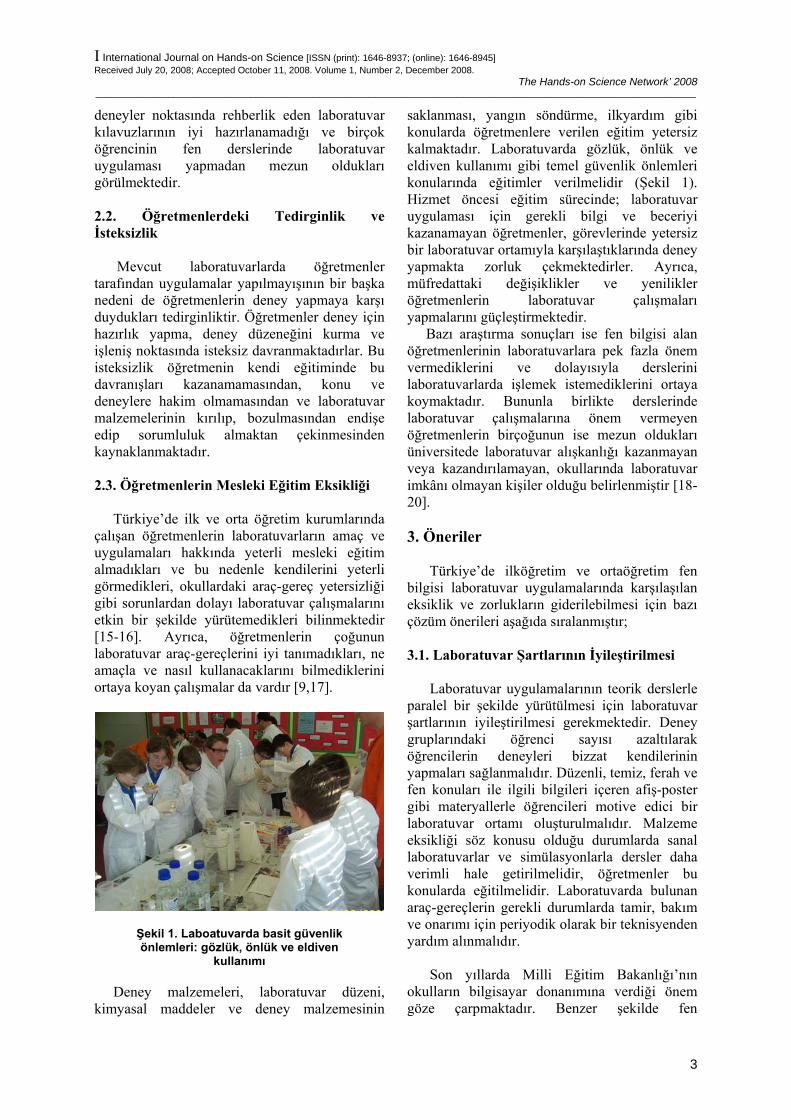
Şekil 1. Laboatuvarda basit güvenlik önlemleri: gözlük, önlük ve eldiven
kullanımı
Deney malzemeleri, laboratuvar düzeni, kimyasal maddeler ve deney malzemesinin
saklanması, yangın söndürme, ilkyardım gibi konularda öğretmenlere verilen eğitim yetersiz kalmaktadır. Laboratuvarda gözlük, önlük ve eldiven kullanımı gibi temel güvenlik önlemleri konularında eğitimler verilmelidir (Şekil 1). Hizmet öncesi eğitim sürecinde; laboratuvar uygulaması için gerekli bilgi ve beceriyi kazanamayan öğretmenler, görevlerinde yetersiz bir laboratuvar ortamıyla karşılaştıklarında deney yapmakta zorluk çekmektedirler. Ayrıca, müfredattaki değişiklikler ve yenilikler öğretmenlerin laboratuvar çalışmaları yapmalarını güçleştirmektedir.
Bazı araştırma sonuçları ise fen bilgisi alan öğretmenlerinin laboratuvarlara pek fazla önem vermediklerini ve dolayısıyla derslerini laboratuvarlarda işlemek istemediklerini ortaya koymaktadır. Bununla birlikte derslerinde laboratuvar çalışmalarına önem vermeyen öğretmenlerin birçoğunun ise mezun oldukları üniversitede laboratuvar alışkanlığı kazanmayan veya kazandırılamayan, okullarında laboratuvar imkânı olmayan kişiler olduğu belirlenmiştir [18-20]. 3. Öneriler
Türkiye’de ilköğretim ve ortaöğretim fen bilgisi laboratuvar uygulamalarında karşılaşılan eksiklik ve zorlukların giderilebilmesi için bazı çözüm önerileri aşağıda sıralanmıştır; 3.1. Laboratuvar Şartlarının İyileştirilmesi
Laboratuvar uygulamalarının teorik derslerle
paralel bir şekilde yürütülmesi için laboratuvar şartlarının iyileştirilmesi gerekmektedir. Deney gruplarındaki öğrenci sayısı azaltılarak öğrencilerin deneyleri bizzat kendilerinin yapmaları sağlanmalıdır. Düzenli, temiz, ferah ve fen konuları ile ilgili bilgileri içeren afiş-poster gibi materyallerle öğrencileri motive edici bir laboratuvar ortamı oluşturulmalıdır. Malzeme eksikliği söz konusu olduğu durumlarda sanal laboratuvarlar ve simülasyonlarla dersler daha verimli hale getirilmelidir, öğretmenler bu konularda eğitilmelidir. Laboratuvarda bulunan araç-gereçlerin gerekli durumlarda tamir, bakım ve onarımı için periyodik olarak bir teknisyenden yardım alınmalıdır.
Son yıllarda Milli Eğitim Bakanlığı’nın
okulların bilgisayar donanımına verdiği önem göze çarpmaktadır. Benzer şekilde fen
I International Journal on Hands-on Science [ISSN (print): 1646-8937; (online): 1646-8945] Received July 20, 2008; Accepted October 11, 2008. Volume 1, Number 2, December 2008.
The Hands-on Science Network’ 2008 ____________________________________________________________________________________________________________________
4
laboratuvarlarında da bir kampanya dâhilinde iyileştirmeler yapılması oldukça önemli ve gereklidir.
3.2. Merkezi Laboratuvarlar Kurulması
Özellikle kırsal kesimde görev yapan
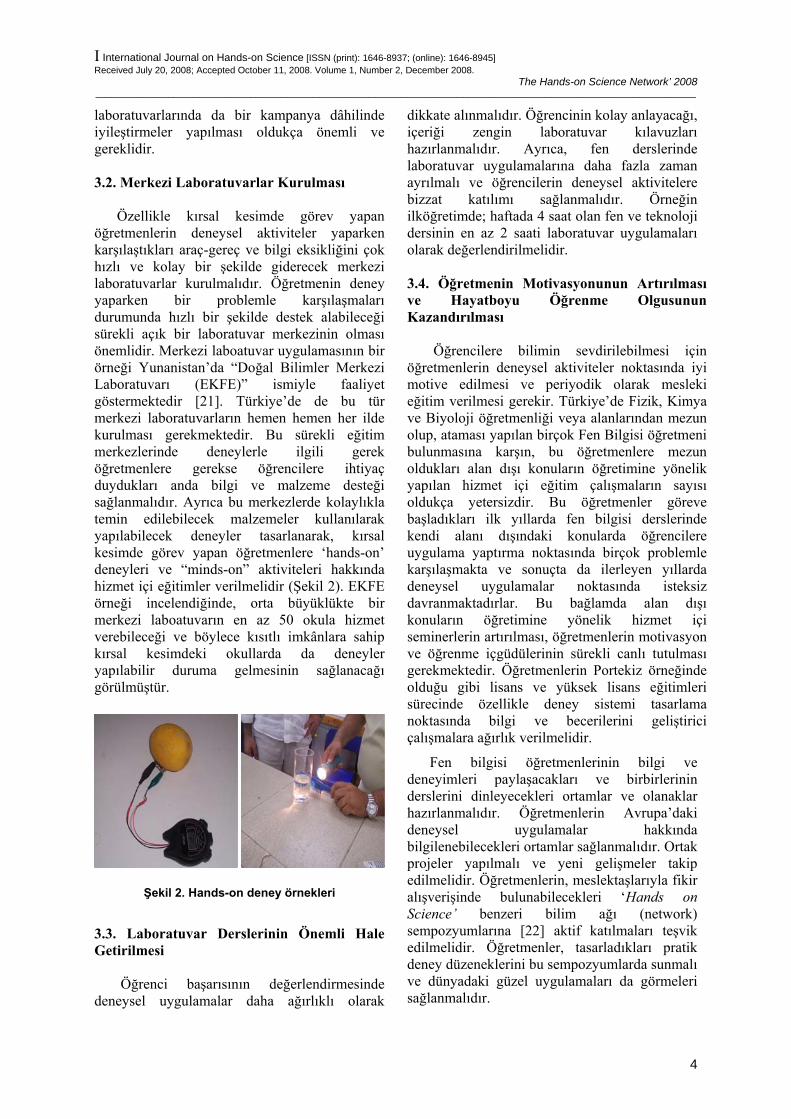
öğretmenlerin deneysel aktiviteler yaparken karşılaştıkları araç-gereç ve bilgi eksikliğini çok hızlı ve kolay bir şekilde giderecek merkezi laboratuvarlar kurulmalıdır. Öğretmenin deney yaparken bir problemle karşılaşmaları durumunda hızlı bir şekilde destek alabileceği sürekli açık bir laboratuvar merkezinin olması önemlidir. Merkezi laboatuvar uygulamasının bir örneği Yunanistan’da “Doğal Bilimler Merkezi Laboratuvarı (EKFE)” ismiyle faaliyet göstermektedir [21]. Türkiye’de de bu tür merkezi laboratuvarların hemen hemen her ilde kurulması gerekmektedir. Bu sürekli eğitim merkezlerinde deneylerle ilgili gerek öğretmenlere gerekse öğrencilere ihtiyaç duydukları anda bilgi ve malzeme desteği sağlanmalıdır. Ayrıca bu merkezlerde kolaylıkla temin edilebilecek malzemeler kullanılarak yapılabilecek deneyler tasarlanarak, kırsal kesimde görev yapan öğretmenlere ‘hands-on’ deneyleri ve “minds-on” aktiviteleri hakkında hizmet içi eğitimler verilmelidir (Şekil 2). EKFE örneği incelendiğinde, orta büyüklükte bir merkezi laboatuvarın en az 50 okula hizmet verebileceği ve böylece kısıtlı imkânlara sahip kırsal kesimdeki okullarda da deneyler yapılabilir duruma gelmesinin sağlanacağı görülmüştür.
Şekil 2. Hands-on deney örnekleri
3.3. Laboratuvar Derslerinin Önemli Hale Getirilmesi
Öğrenci başarısının değerlendirmesinde
deneysel uygulamalar daha ağırlıklı olarak
dikkate alınmalıdır. Öğrencinin kolay anlayacağı, içeriği zengin laboratuvar kılavuzları hazırlanmalıdır. Ayrıca, fen derslerinde laboratuvar uygulamalarına daha fazla zaman ayrılmalı ve öğrencilerin deneysel aktivitelere bizzat katılımı sağlanmalıdır. Örneğin ilköğretimde; haftada 4 saat olan fen ve teknoloji dersinin en az 2 saati laboratuvar uygulamaları olarak değerlendirilmelidir. 3.4. Öğretmenin Motivasyonunun Artırılması ve Hayatboyu Öğrenme Olgusunun Kazandırılması
Öğrencilere bilimin sevdirilebilmesi için
öğretmenlerin deneysel aktiviteler noktasında iyi motive edilmesi ve periyodik olarak mesleki eğitim verilmesi gerekir. Türkiye’de Fizik, Kimya ve Biyoloji öğretmenliği veya alanlarından mezun olup, ataması yapılan birçok Fen Bilgisi öğretmeni bulunmasına karşın, bu öğretmenlere mezun oldukları alan dışı konuların öğretimine yönelik yapılan hizmet içi eğitim çalışmaların sayısı oldukça yetersizdir. Bu öğretmenler göreve başladıkları ilk yıllarda fen bilgisi derslerinde kendi alanı dışındaki konularda öğrencilere uygulama yaptırma noktasında birçok problemle karşılaşmakta ve sonuçta da ilerleyen yıllarda deneysel uygulamalar noktasında isteksiz davranmaktadırlar. Bu bağlamda alan dışı konuların öğretimine yönelik hizmet içi seminerlerin artırılması, öğretmenlerin motivasyon ve öğrenme içgüdülerinin sürekli canlı tutulması gerekmektedir. Öğretmenlerin Portekiz örneğinde olduğu gibi lisans ve yüksek lisans eğitimleri sürecinde özellikle deney sistemi tasarlama noktasında bilgi ve becerilerini geliştirici çalışmalara ağırlık verilmelidir.
Fen bilgisi öğretmenlerinin bilgi ve deneyimleri paylaşacakları ve birbirlerinin derslerini dinleyecekleri ortamlar ve olanaklar hazırlanmalıdır. Öğretmenlerin Avrupa’daki deneysel uygulamalar hakkında bilgilenebilecekleri ortamlar sağlanmalıdır. Ortak projeler yapılmalı ve yeni gelişmeler takip edilmelidir. Öğretmenlerin, meslektaşlarıyla fikir alışverişinde bulunabilecekleri ‘Hands on Science’ benzeri bilim ağı (network) sempozyumlarına [22] aktif katılmaları teşvik edilmelidir. Öğretmenler, tasarladıkları pratik deney düzeneklerini bu sempozyumlarda sunmalı ve dünyadaki güzel uygulamaları da görmeleri sağlanmalıdır.
I International Journal on Hands-on Science [ISSN (print): 1646-8937; (online): 1646-8945] Received July 20, 2008; Accepted October 11, 2008. Volume 1, Number 2, December 2008.
The Hands-on Science Network’ 2008 ____________________________________________________________________________________________________________________
5
3.5. Bilim Merkezi Gezileri, Teknik
Geziler ve Bilim Günleri Organizasyonları Bilim Merkezleri öğrencilerin eğlenerek
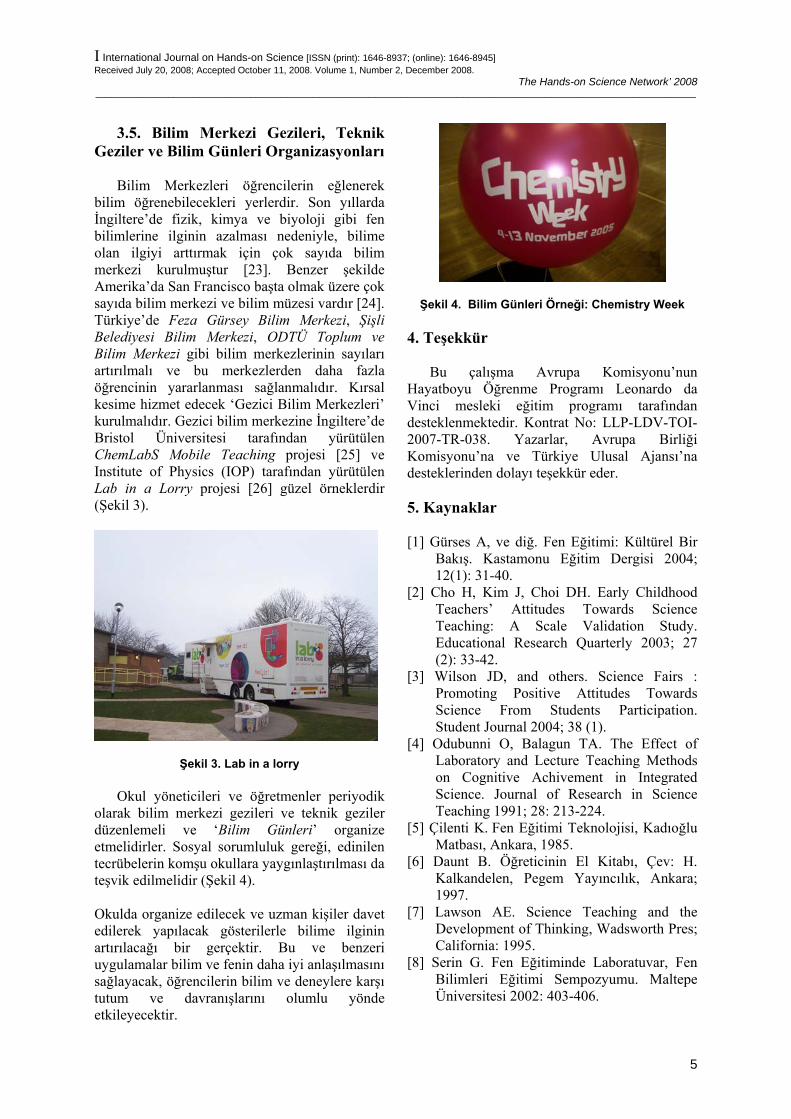
bilim öğrenebilecekleri yerlerdir. Son yıllarda İngiltere’de fizik, kimya ve biyoloji gibi fen bilimlerine ilginin azalması nedeniyle, bilime olan ilgiyi arttırmak için çok sayıda bilim merkezi kurulmuştur [23]. Benzer şekilde Amerika’da San Francisco başta olmak üzere çok sayıda bilim merkezi ve bilim müzesi vardır [24]. Türkiye’de Feza Gürsey Bilim Merkezi, Şişli Belediyesi Bilim Merkezi, ODTÜ Toplum ve Bilim Merkezi gibi bilim merkezlerinin sayıları artırılmalı ve bu merkezlerden daha fazla öğrencinin yararlanması sağlanmalıdır. Kırsal kesime hizmet edecek ‘Gezici Bilim Merkezleri’ kurulmalıdır. Gezici bilim merkezine İngiltere’de Bristol Üniversitesi tarafından yürütülen ChemLabS Mobile Teaching projesi [25] ve Institute of Physics (IOP) tarafından yürütülen Lab in a Lorry projesi [26] güzel örneklerdir (Şekil 3).
Şekil 3. Lab in a lorry
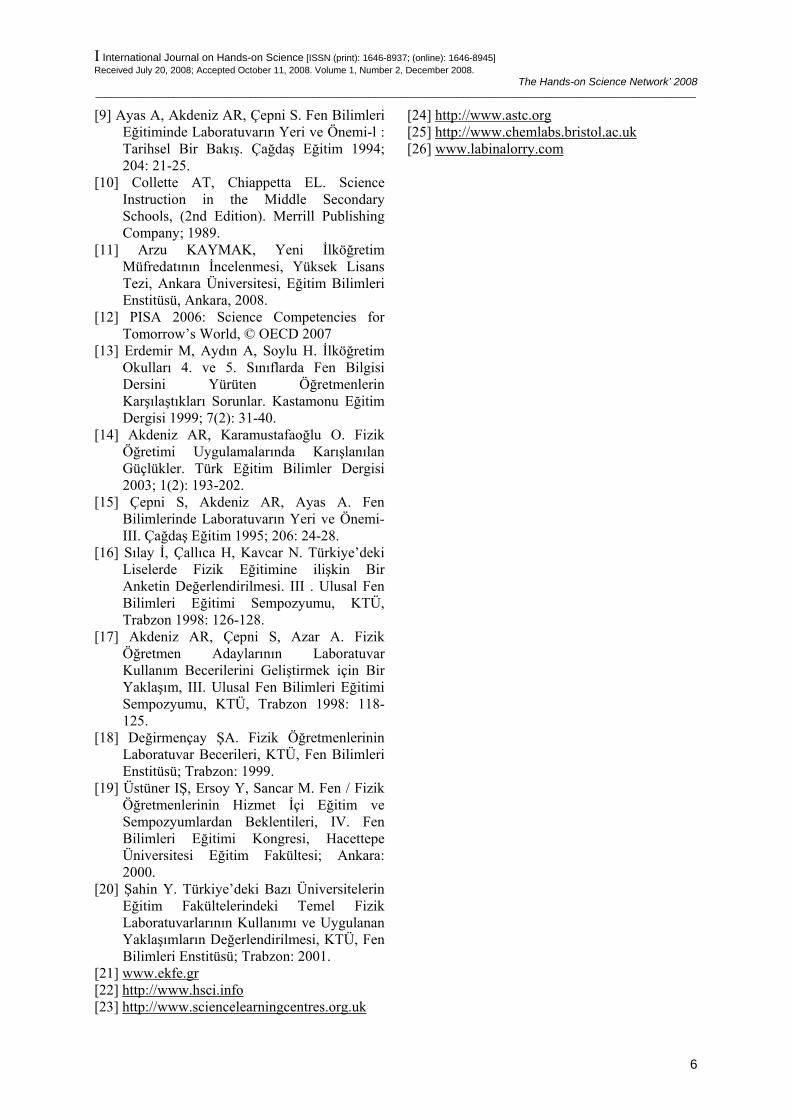
Okul yöneticileri ve öğretmenler periyodik olarak bilim merkezi gezileri ve teknik geziler düzenlemeli ve ‘Bilim Günleri’ organize etmelidirler. Sosyal sorumluluk gereği, edinilen tecrübelerin komşu okullara yaygınlaştırılması da teşvik edilmelidir (Şekil 4).
Okulda organize edilecek ve uzman kişiler davet edilerek yapılacak gösterilerle bilime ilginin artırılacağı bir gerçektir. Bu ve benzeri uygulamalar bilim ve fenin daha iyi anlaşılmasını sağlayacak, öğrencilerin bilim ve deneylere karşı tutum ve davranışlarını olumlu yönde etkileyecektir.
Şekil 4. Bilim Günleri Örneği: Chemistry Week
4. Teşekkür
Bu çalışma Avrupa Komisyonu’nun Hayatboyu Öğrenme Programı Leonardo da Vinci mesleki eğitim programı tarafından desteklenmektedir. Kontrat No: LLP-LDV-TOI-2007-TR-038. Yazarlar, Avrupa Birliği Komisyonu’na ve Türkiye Ulusal Ajansı’na desteklerinden dolayı teşekkür eder. 5. Kaynaklar [1] Gürses A, ve diğ. Fen Eğitimi: Kültürel Bir
Bakış. Kastamonu Eğitim Dergisi 2004; 12(1): 31-40.
[2] Cho H, Kim J, Choi DH. Early Childhood Teachers’ Attitudes Towards Science Teaching: A Scale Validation Study. Educational Research Quarterly 2003; 27 (2): 33-42.
[3] Wilson JD, and others. Science Fairs : Promoting Positive Attitudes Towards Science From Students Participation. Student Journal 2004; 38 (1).
[4] Odubunni O, Balagun TA. The Effect of Laboratory and Lecture Teaching Methods on Cognitive Achivement in Integrated Science. Journal of Research in Science Teaching 1991; 28: 213-224.
[5] Çilenti K. Fen Eğitimi Teknolojisi, Kadıoğlu Matbası, Ankara, 1985.
[6] Daunt B. Öğreticinin El Kitabı, Çev: H. Kalkandelen, Pegem Yayıncılık, Ankara; 1997.
[7] Lawson AE. Science Teaching and the Development of Thinking, Wadsworth Pres; California: 1995.
[8] Serin G. Fen Eğitiminde Laboratuvar, Fen Bilimleri Eğitimi Sempozyumu. Maltepe Üniversitesi 2002: 403-406.
I International Journal on Hands-on Science [ISSN (print): 1646-8937; (online): 1646-8945] Received July 20, 2008; Accepted October 11, 2008. Volume 1, Number 2, December 2008.
The Hands-on Science Network’ 2008 ____________________________________________________________________________________________________________________
6
[9] Ayas A, Akdeniz AR, Çepni S. Fen Bilimleri Eğitiminde Laboratuvarın Yeri ve Önemi-l : Tarihsel Bir Bakış. Çağdaş Eğitim 1994; 204: 21-25.
[10] Collette AT, Chiappetta EL. Science Instruction in the Middle Secondary Schools, (2nd Edition). Merrill Publishing Company; 1989.
[11] Arzu KAYMAK, Yeni İlköğretim Müfredatının İncelenmesi, Yüksek Lisans Tezi, Ankara Üniversitesi, Eğitim Bilimleri Enstitüsü, Ankara, 2008.
[12] PISA 2006: Science Competencies for Tomorrow’s World, © OECD 2007
[13] Erdemir M, Aydın A, Soylu H. İlköğretim Okulları 4. ve 5. Sınıflarda Fen Bilgisi Dersini Yürüten Öğretmenlerin Karşılaştıkları Sorunlar. Kastamonu Eğitim Dergisi 1999; 7(2): 31-40.
[14] Akdeniz AR, Karamustafaoğlu O. Fizik Öğretimi Uygulamalarında Karışlanılan Güçlükler. Türk Eğitim Bilimler Dergisi 2003; 1(2): 193-202.
[15] Çepni S, Akdeniz AR, Ayas A. Fen Bilimlerinde Laboratuvarın Yeri ve Önemi-III. Çağdaş Eğitim 1995; 206: 24-28.
[16] Sılay İ, Çallıca H, Kavcar N. Türkiye’deki Liselerde Fizik Eğitimine ilişkin Bir Anketin Değerlendirilmesi. III . Ulusal Fen Bilimleri Eğitimi Sempozyumu, KTÜ, Trabzon 1998: 126-128.
[17] Akdeniz AR, Çepni S, Azar A. Fizik Öğretmen Adaylarının Laboratuvar Kullanım Becerilerini Geliştirmek için Bir Yaklaşım, III. Ulusal Fen Bilimleri Eğitimi Sempozyumu, KTÜ, Trabzon 1998: 118-125.
[18] Değirmençay ŞA. Fizik Öğretmenlerinin Laboratuvar Becerileri, KTÜ, Fen Bilimleri Enstitüsü; Trabzon: 1999.
[19] Üstüner IŞ, Ersoy Y, Sancar M. Fen / Fizik Öğretmenlerinin Hizmet İçi Eğitim ve Sempozyumlardan Beklentileri, IV. Fen Bilimleri Eğitimi Kongresi, Hacettepe Üniversitesi Eğitim Fakültesi; Ankara: 2000.
[20] Şahin Y. Türkiye’deki Bazı Üniversitelerin Eğitim Fakültelerindeki Temel Fizik Laboratuvarlarının Kullanımı ve Uygulanan Yaklaşımların Değerlendirilmesi, KTÜ, Fen Bilimleri Enstitüsü; Trabzon: 2001.
[21] www.ekfe.gr [22] http://www.hsci.info [23] http://www.sciencelearningcentres.org.uk
[24] http://www.astc.org [25] http://www.chemlabs.bristol.ac.uk [26] www.labinalorry.com
International Journal on Hands-on Science [ISSN (print): 1646-8937; (online): 1646-8945] Received October 27, 2008; Accepted November 28, 2008. Volume 1, Number 2, December 2008.
The Hands-on Science Network’ 2008 ____________________________________________________________________________________________________________________
7
Reception of Students at the Museum of Sciences A look under the perspective of Extended Scientific and Technological
Literacy
Marcos Rocha Secretaria de Estado da Educação do Paraná (SEED)
Nilson Marcos Dias Garcia Universidade Tecnológica Federal do Paraná (UTFPR)
Abstract. This work reports part of a research that analyses a program of school service developed by the Science Museum team, Newton Freire Maia Park (PNFM), a institution maintained by the Department of Education of the State of Parana (SEED), that is working for the dissemination, popularization and spread of the science and technology. The program, entitled " Small Scientists - Great Citizens"(PCGC), is designed to assist the first grades students from elementary public schools, using the methodology that involves the School, the Centre of Science, the students and their teachers. Supported on one of the authors' professional experience who acted as general coordinator of the Program from 2004 to 2007, the study was developed through a qualitative research whose data were obtained by the participation of the professionals of education who visit the museum under the guidance of PCGC. As well as the monitors who are the professionals of the PNFM, involved in the program. The theoretical context was upheld by the concept of scientific enlarged literacy of informal and learning education in Museums, and in Science and Technology Centers. It stands out still in the theoretical context, the discussion around how the knowledge produced by science is interpreted into museum's knowledge in the interior of the Science Museum, and the importance of considering, in such discussions, the students' alternative conceptions in spite of the phenomena reproduced in the Science Museum, under one sociointeractionist view. The results of the investigation indicated that the discussion and preparation of the visit with the teachers in the schools, the reception of the students in the Science Museum and the posterior
development, in schools activities after the visiting, demonstrated these as being differential actions that incorporated a methodology which approximate the school's practice from the museum's. The analyses also showed the necessity of deepen the PCGC's discussion of practice, in order to intensify the dialogue among students, teachers and monitors, in the sense to establishes a more spatial reflection about the concepts of science and technology experienced in the museum PNFM towards a Scientific and Technological Enlarged Literacy (ACT).
Keywords: Science, Scientific Literacy, Science Museum. 1. Introduction
Nowadays, according to Cazelli et al [3] and Marandino [14], the investigation about the exhibitions of cultural and educational activities in the Science Museums has been intensified, revealing the results that point toward the museums and science centers as active learning environments.
These results converge more and more to the idea of Museums as being spaces for knowledge production and the use of methodologies specifically applied to this context. It is causing a certain preoccupation of several professionals of Education and Museology concerning what kind of education and learning consolidate in these spaces.
The object investigation of this work approaches one of these methodologies, prepared and applied in a Science Museum in Curitiba, known as Newton Freire Maia Park (PNFM), that resulted a work of dissertation for Master's
International Journal on Hands-on Science [ISSN (print): 1646-8937; (online): 1646-8945] Received October 27, 2008; Accepted November 28, 2008. Volume 1, Number 2, December 2008.
The Hands-on Science Network’ 2008 ____________________________________________________________________________________________________________________
8
Degree under the title “Small Scientists-Great Citizens: considerations on one school service Program in the Science Museum”. This work was presented in 2007 in the Post Graduation Program in Technology (PPGTE) of Federal University of Technology – Paraná (UTFPR) in Curitiba, Brazil.
Among other inquired questions, the research investigates how the teachers of the first grade's students in elementary schools accompany them through a guidance visiting to the Science Museum, realize the relation between the school and museum's environment, under the theoretical optic of the Scientific Enlarged Literacy (ACT).
2. Formal and Informal Education
According to Gaspar [9], the process that
occurs primarily at school is due to Education. It is divided in courses with levels, degrees, programs, curriculums and diploma, showing itself up in general, with the outstanding characteristic of school curriculum organization for each discipline.
The production of school's knowledge, linked and controlled by Educational Policy, historically directed and orientated for reproduction and control's intentions, is being brought into effect through the discipline organization of the school curriculum used in the formal education. Macedo and Lopes [13] comment that the attempt of school curriculum organization with no adoption attitude of the division of the knowledge in discipline does the criticism to this curriculum. This is based on the arguments that the division in discipline would not be able to integrate the knowledge, allowing a global understanding of it or producing higher approximation of the day by day students' knowing, making the significant knowledge learning difficult.
The same authors recognize that the attempts of school curriculum organization not by discipline, as in the case of the transversal curriculum, do not present actions able to substitute the discipline's hegemonic idea. However, they argue that this hegemony does not stop the production of different mechanisms of integration by creation of the integrated disciplines, or else by articulation of the isolated ones.
Meantime, Gaspar [9] states that, even in the civilizations considered as culturally advanced, the day by day life always demanded much more
than the knowledge formally presented in the school discipline.
So, the informal education is analyzed by the author in a context where the curriculum, the place or the evaluation are not being put as presuppositions of the education. In informal education, the essential interaction process is the socio cultural, in which the subjects, in many occasions, do not have consciousness of their participation in the educative process. Teaching and learning, in the informal education, take place spontaneously and, almost all initiatives aimed to an institutionalized informal education are quite welcoming. However, these initiatives bring some doubts and concerns, unbelief and restrictions, mainly related to the Science's learning. For him,
“It is not difficult to understand the reason of such unbelief and restrictions, just observe accurately the children's visiting to a scientific dissemination centre. They run from one side to another, stop for a moment here and there, laugh, shout, frightened themselves, feel annoying, enchanted, in an incessant activity and almost always disarranged. Even when they are followed by their parents, teachers or in supervisors visits, they tend to disperse themselves a lot, because there are so much stimulus, even though where there are some kinds of logic or pedagogic order to the presentations, that is not frequent.” [9].
The informal education in the Science
Museum presents interesting features. Programs of school service in the Science Museum involve several actors; teachers, officials, mediators, and so on. Such actors try to act in the mediation process between the scientific, the museum and the school knowledge.
In the analysis of the pedagogic mediation as a (re)construction process of knowledge, Alice Lopes [12] considers on the transformation process of scientific knowledge, in something substantially different from the science of reference.
So, in the context of the referred school reception programs, the scientific school knowledge and the scientific museum's, will be mediated in a work of social interaction that valorizes the previous knowledge of the students.
International Journal on Hands-on Science [ISSN (print): 1646-8937; (online): 1646-8945] Received October 27, 2008; Accepted November 28, 2008. Volume 1, Number 2, December 2008.
The Hands-on Science Network’ 2008 ____________________________________________________________________________________________________________________
9
3. What is the objective of the (formal or informal) scientific education?
The modernization of the society and redefinition of time and social space operated by the phenomenon of the globalization, impose new educational demands that, according to Cazelli and Franco [2] bring repercussions as in the interface of the education with the work's world, as with the practice of citizenship.
The last advances in science and in technology lead up to the context a world population that needs one understanding of the science and technology of a huge range, in order to interpret facts of daily life itself.
In this context, as said Gouvêa and Loyally [10], the defense of the theory of scientific and technological literacy has a tendency to become strength from some decades till now. This defense has already existed in the agenda of discussions and decisions of several countries, mainly in those ones which detain the hegemony in the world's scientific production, but only in mid 90's was presented in Brazil.
Etymologically, the term being literate, or stop being an illiterate, can show some possible interpretations, but they usually lead to a reasoning acquisition of reading and writing process. Chassot [4] refers to the term as to acquire the technology of reading and writing and to be involved in social reading and writing practices. So, when the individual acquires these processes that the author calls the writing and reading's technology, ascends to a social condition in that the opportunities will be multiplied. This social, cultural, economic and politics condition can be designed by the term 'literacy', as Magda Soares [17] comments:
“Etymologically, the word literacy comes from Latin littera (letter), with the suffix - cy, that denotes quality, condition, state, fact of being (...) i.e. literacy is the state or condition that assumes the one who learns to read and write. The idea implicit in this concept is that the writing brings social, cultural, politics, economical, cognitive and linguistic consequences, for the social group it is introduced or for the individual who learns to use it.”
The scientific and technological literacy, if
compared to this state of "literate", it takes the meaning of acquisition of the linguistic structures
referring to the science and the technology. That means, the state or condition the citizen uses to understand the scientific and technological language; this state facilitated by the acquisition of the technology of reading and writing, but not of straight dependence of this acquisition.
According to Durant [5], it is possible to discuss three approaches for the understanding of the scientific literacy. The first one concerns to a citizen being familiarized with the contents of science, in the sense of the quantity of understood scientific concepts idea in which it would reach limits besides the formal education in science. It would be a factual knowledge with the objective the individual being consciousness and doing interpretation of the events motivated by the current science.
The second approach is related to how the science works in its method and the scientific process. So, the scientific education that follows this approach defends a pedagogy of learning science by practicing the scientific method, aiming at the understanding not only of the basic principles, but also the processes they were established.
The same author reveals the preoccupation of formal and not formal pedagogy regarding the resolution of problems by adopting a scientific attitude. This one aims at a range of disinterested curiosity, open mind, objectivity and the habit of doing judgment basis on facts. The hypotheses formulation and its submission to critical tests in the controlled experimentation would be a form of experience science and by this way, seek for its understanding.
These two approaches, according to Durant, are unsuitable for the objective to understand the science's current questions, which involve in great scale, processes of construction of new knowledge, for:
“Frequently, the new knowledge is uncertain, many times controversial. In other words, the scientific experts can be undecided about things; they can even disagree each other on questions of proofs or interpretations. In this case, the public can be helped by a certain quantity of factual basic knowledge; but, this knowledge in itself is probably insufficient to understand what is happening. Because what is happening is the appearance of a new knowledge; and, to understand that, people have to know something about the gestation or the embryology of science.”
International Journal on Hands-on Science [ISSN (print): 1646-8937; (online): 1646-8945] Received October 27, 2008; Accepted November 28, 2008. Volume 1, Number 2, December 2008.
The Hands-on Science Network’ 2008 ____________________________________________________________________________________________________________________
10
As for the scientific method and the scientific attitude treated in the second approach, the author emphasizes that, a scientist hardly follows the linearity that generally is attributed to the scientific method, and, neither, it is given him a “scientific attitude” as a gift on his birth. In fact, the author aware us of a science that follows the scientific method's linearity and appropriates itself of justifications and affirmations based on scientific attitude, it has a small chance to be considered as true science, assuming much more the form of pseudo science.
The third approach suggested by Durant [5] is a scientific literacy that looks for knowing how science “really works”, exceeding the frontiers of its understanding as purely knowledge and an idealized process. So, knowing how science works really applies the acceptance of a scientific community's existence, who are liable to certain rules, participating in generally limited discussions, and who constantly evaluate their pairs according to their own party political ideals of this community.
It means to say that, the popularization of scientific knowledge is an adequacy process of a language used by scientific community with the objective of public intelligibility. It happens that, the preparation of this language is of extreme complexity, so the mission to turn the complex into intelligible, will always be a difficult mission. The consequences of an incomplete translation can assume as truth myths, for instance, that the scientists, individually, discover the scientific laws. One scientific literacy approach that proposes a science's view as historical and collective construction never will be able to affirm such mistake, since a scientist will never be able to come to conclusions or discoveries by himself, without the interference, analysis, approval and contributions in his research.
Another aspect treated in the third approach of Durant [5] is the fallibility of the science, always present in real context of the scientific research process and, however, it is very often absent in the common sense of people who are not part of the scientific community. So, there is an atmosphere of almost supernatural credibility in the scientists, who would produce an incontestable knowledge in the idealized vision. Once again, the myth of infallibility is present on the external context to the scientific community. A scientific literacy that intends to build a relation between the non specialists and this
community, in order to supply the consciousness of the scientific process, must be considerate the mentioned facts emphasized above by Durant [5].
4. ACT – An enlarged referential system
Fourez [6], quoted by Auler and Delizoicov [1], referring to ACT, it uses the expressions “limited sense” and “enlarged sense”. So, the authors sign two perspectives for the understanding of “scientific and technological literacy”: the reductionist and the enlarged one.
In a reductionist perspective, the public would be treated with the starting presupposition of ignorance, regarding the scientific and technological questions, transferring the responsibility for not understanding these questions to the public and not to the science. A science considered neuter and devoid of values, the only and privileged, in that the scientific knowledge is translated as infallible and without contradictions. So, in the reductionist perspective, we have a great approximation with the two first approaches described by Durant (2005) [5] that includes the quantitative and factual knowledge and the understanding of scientific method, discussed previously.
The formal or informal Science teaching, while making use of a reductionist and inebriant speech, can be easily adopted in inadvertent form and even naive by educators and institutions who, in many occasions, search for an educative, progressive, emancipatory and democratic process. It can get them on a different direction, according to Auler and Delizoicov [1], for whom
“More and more, the idea of democratization of Science and Technology consolidates itself as a pre-requisite for the practice of citizenship, of democracy (...) We lift the hypothesis of which, while claiming the spread, and popularization of knowledge, facts, information, scientific concepts, with honest justification of its needful for the democracy's practice, it is possible to contribute, in fact, for the reducing of the plenty exercise of democracy, reinforcing technocratic postulations.”
In an enlarged perspective, the same authors
emphasize the search for a real comprehension among the science, technology and society's interaction, in a world criticism reading where the demystification of constructed myths in this

International Journal on Hands-on Science [ISSN (print): 1646-8937; (online): 1646-8945] Received October 27, 2008; Accepted November 28, 2008. Volume 1, Number 2, December 2008.
The Hands-on Science Network’ 2008 ____________________________________________________________________________________________________________________
11
relation must have a fundamental importance in the educative role.
The ACT under this 'enlarged' point of view is pretty closer to that Paulo Freire's referential point, stated about the surpassing mythological vision, where education has a relation with the "critical knowledge of reality". Freire (1992) affirms that it is necessary to practice the control on the technology and put it to the human beings' service. The ACT understood under the enlarged perspective, considers the concept of technology in a sense of denying the technocracy's vision of technological determinism.
The objective of an appropriate scientific and technological literacy, that finds problems and challenges, is to interact socially, politically and culturally in the world we live in. The perspective of the enlarged ACT, reveals us the necessary rupture with the myths' reference to the science and the technology, and the display of these myths in the formal and non-formal educative processes, for what we could reflect about them.
The enlarged ACT proposes to be necessary to emphasizes in educative processes, the social, economical, cultural aspects and those ones of the world of work, inseparable of the technical aspects that influences the researches in science and technology. As proposed by Lima Filho [11], when he says that it is also necessary to consider that education is just one of the social relations involved in this complex and, on this way, it has limitations. Thus, the production and property relations also have influence over the available information and how the knowledge is produced, resulting in an ideological speech about science and technology.
Fourez [7] calls as ideological speech, a practice that is known by itself as a representation of the world, but in fact, has more a legitimate character than a descriptive one. The author affirms that the science, in spite of used in many opportunities as reinforcement to legitimate the ideological speech, is an important instrument to do the criticism to the propositions of this speech.
The ideological speech presented in "translation" processes of science concepts for an intelligible knowledge not always (or hardly ever) it is revealed to a citizen. For Fourez [7],
“the scientific translations of one ideological focus, remain ideological as therefore the used point of view (i.e., the
discipline source or the paradigm), originated itself in a well determined context."
In this sense, the author points out two possibilities of ideological speech. The first one, is designated as “ideological speech of first degree”, and it appears insofar as one has the consciousness of the historical character, that means, ideological character of the speech. The limits of this speech are assumed in a condition of not ignorance of the ideology inserted in the same one, where the basis concepts are built and there is a consciousness of the decisions that implicate all the scientific practice.
The second possibility, designated as “ideological speech of second degree”, acquires non-historical characteristics and notions with eternal objective and character, where the most part of signs of construction are suppressed. It presents as natural options that, in fact, are particular, in manipulated process of representation of eternal science, with objective and neuter answers.
The scientific dissemination, under a second degree speech perspective, generally assigns to the scientific knowledge, an unequivocal power. Alice Lopes [12], in agreement with Fourez [7], show us that the access to the scientific knowledge is translated in access to a certain dose of power, that reinforces the instrumental reason, acts in a coercively way on non-scientific knowing, builds a speech able to illegitimate them and, in this way, it contributes to the reproduction of the social relations existent in the capitalist society.
But there is also a power in the positive sense that can supply arguments for an against-hegemonic action of groups in tune to popular interests. For Alice Lopes [12],
“(...) the dominant and hegemonic knowledge, is not always sustained in a scientific knowledge, but it is in a common sense that sometimes sustains itself in the pseudo-scientific rationality. So, the scientific knowledge's domain is fundamental to help the destruction of dominant speech, of a great deal of his ideological mechanisms that linger in function of the general ignorance of scientific notions.”
The scientific spread must be attentive to the
ideological speeches it will do once in agreement
International Journal on Hands-on Science [ISSN (print): 1646-8937; (online): 1646-8945] Received October 27, 2008; Accepted November 28, 2008. Volume 1, Number 2, December 2008.
The Hands-on Science Network’ 2008 ____________________________________________________________________________________________________________________
12
with Fourez [7] and Alice Lopes [12], science is useful only when, somehow or other, it reaches the everyday life, masking the distance between ideological global representation and the scientific individual concept that interpret it. In this way, the ACT must consider the scientific speech as ideological, at least in first degree.
The instruments of scientific spread, like the Science Museums, must be attentive so that, inadvertently, do not assume an ideological speech opposing to their own convictions. These institutions can assume a social emancipatory's role to undone the scientific ideological speech and the valorization of the scientific knowledge as form of popular and democratic power.
5. Museum of Science - School Partnership
The program “Small Scientists - Great Citizens” (PCGC), is destined to assist students of the initial series of elementary education, in using a methodology that involves the School, Science Centre, the students and their teachers. It has been developed by the Science Museum's team in Newton Freire Maia Park (PNFM). This institution has been maintained by the Department of Education of the State of Paraná (SEED), responsible for the diffusion, popularization and dissemination of science and technology.
The PCGC's organization has as the basic principle, the participation of all teachers of the involved schools who want to make part of it. In summary, the process begins with the contact of the school with the PCGC's management and its interest in visiting the Museum. The teachers are orientated to begin the discussion of this visiting, in school itself, choosing a subject they would like seeing developed in the visit to the Museum.
When the subject is defined, the team of the PNFM/PCGC prepares the requested presentation while the teachers prepare the students' visiting. After the preparation period, as of the school as the museum, the students are received by the team that orientates the visit in accordance to the subject previously chosen. As the process is completed, the students go back to school to participate in a discussion and do tasks about the subject.
Following this presupposition, the dialogue between the teacher and the team is first act to be contemplated in the methodological process project's implementation. From this dialogue it must result the conclusions about: the subject to
be developed, how to discuss it, what resources of the museum collection must be used for it, which are the critical aspects in the subject and the date of the students' visiting to the Science Museum.
The chosen subject can be the school's demand of the students themselves or a pedagogic work's demand effectuated in the classroom. As soon as the subject is defined, a service's project is written based on the school's bibliography and in the spaces of Museum that will be in more accordance. A period of inquiry in the classroom and school work is essential for a good use of the proposed subject. This period must be seen as instigation to the object of study, where the student is provoked to asking questions. Many questions can be answered in the research's phase, but it is interesting to emphasize the surprising beneficial character in relation to the PNFM's visiting. When the student's doubt is solved in the visit to the Exploratory, originated in school work, it values this work and the visit itself. (ROCHA, et al).[16]
The assistance's team of the PCGC program considers of extreme importance the primary dialogue with all the teachers who want to participate the visiting with their students. In this sense, the activities are preceded by an exhibition about the complete program scheduled previously the visiting and realized exclusively with all the teachers interested in to schedule the visit to the museum. In these meetings, the team presents their methodology, they quote examples of previous assistance, and they talk to these professionals of education about the concepts of science and technology and discuss the possible subjects to be chosen.
All the teachers also receive a guidance about the Science Museum's collection, with the objective to be in contact with this before the students, as well as, they are invited to stimulate the students, a prior inquiry about the proposed subject, turning it attractive for them, and bringing this to discussion. However, it must be done without the necessary deepen avoiding to exhaust the curiosity of the students.
The access to essential information, for example, the available texts in the PCGC / PNFM1 sites that describe this methodology, the scientific production of the team related to the research of this program, examples of projects, and other important information to the teachers. 1 http://www.parquenewtonfreiremaia.pr.gov.br
International Journal on Hands-on Science [ISSN (print): 1646-8937; (online): 1646-8945] Received October 27, 2008; Accepted November 28, 2008. Volume 1, Number 2, December 2008.
The Hands-on Science Network’ 2008 ____________________________________________________________________________________________________________________
13
After this dialogue, the teachers will schedule by electronic mail. This procedure has as presupposition that the subject to be developed in the visit has already been previously defined. Through the electronic mail, the teachers, the school, or the Department of Education, send the school project with the proposed subject. So, the team gets up to date with the activities already done in school context and which are the questions that the students are producing about it, as well as some aspects of the reality of the interested schools.
After receiving this material, the team will meet to organize the student’s reception procedure, preparing their own assistance project. This project will contain an itinerary inside the Museum's space. As well as this procedure, this project will prepare a previous speech beginning with the students' questions.
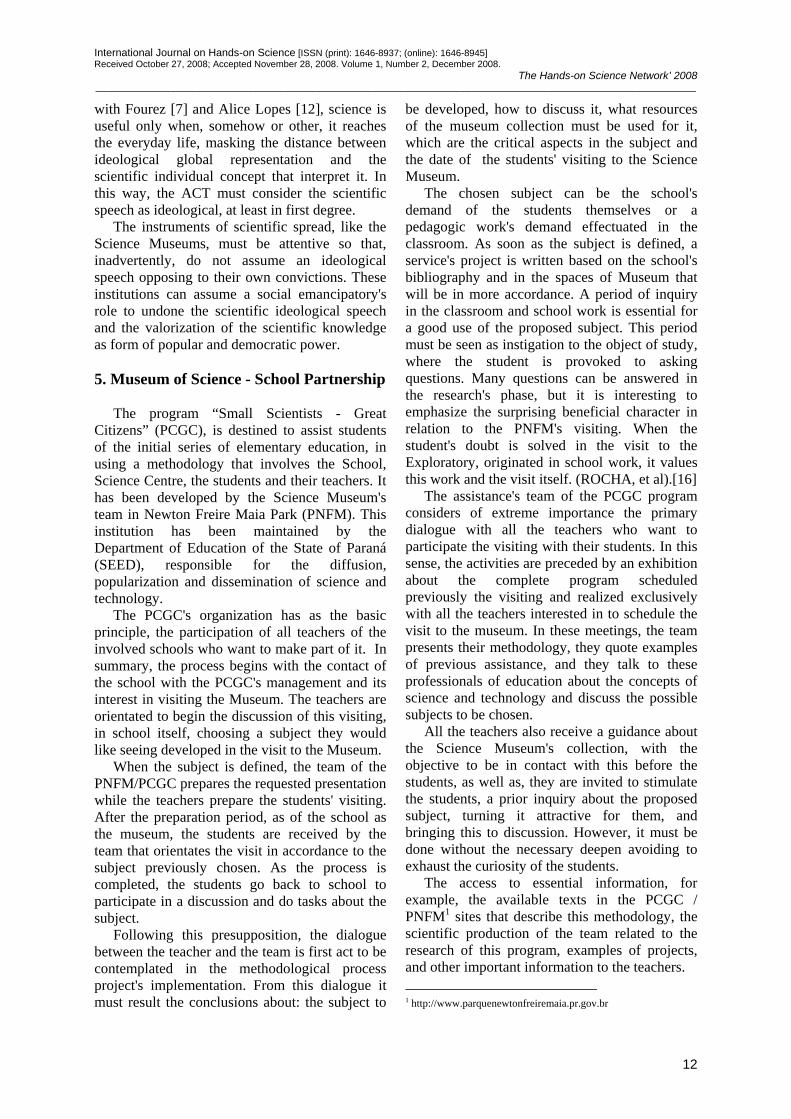
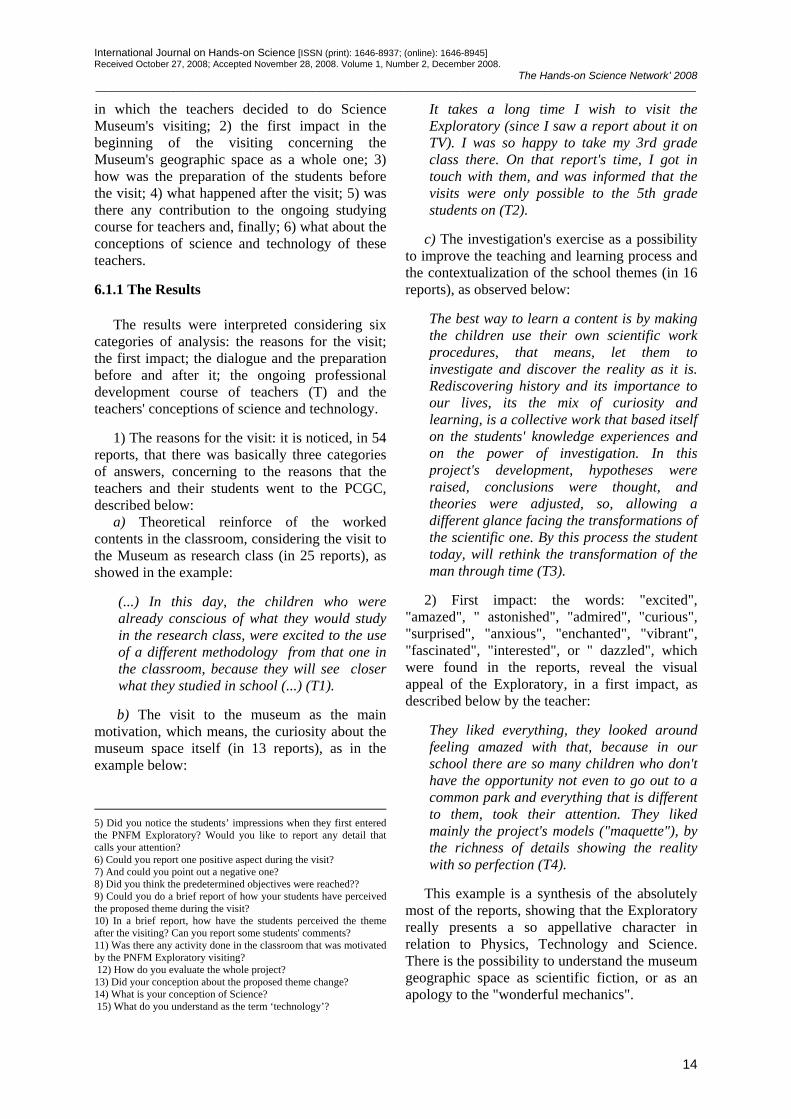
Figure 1 – PCGC
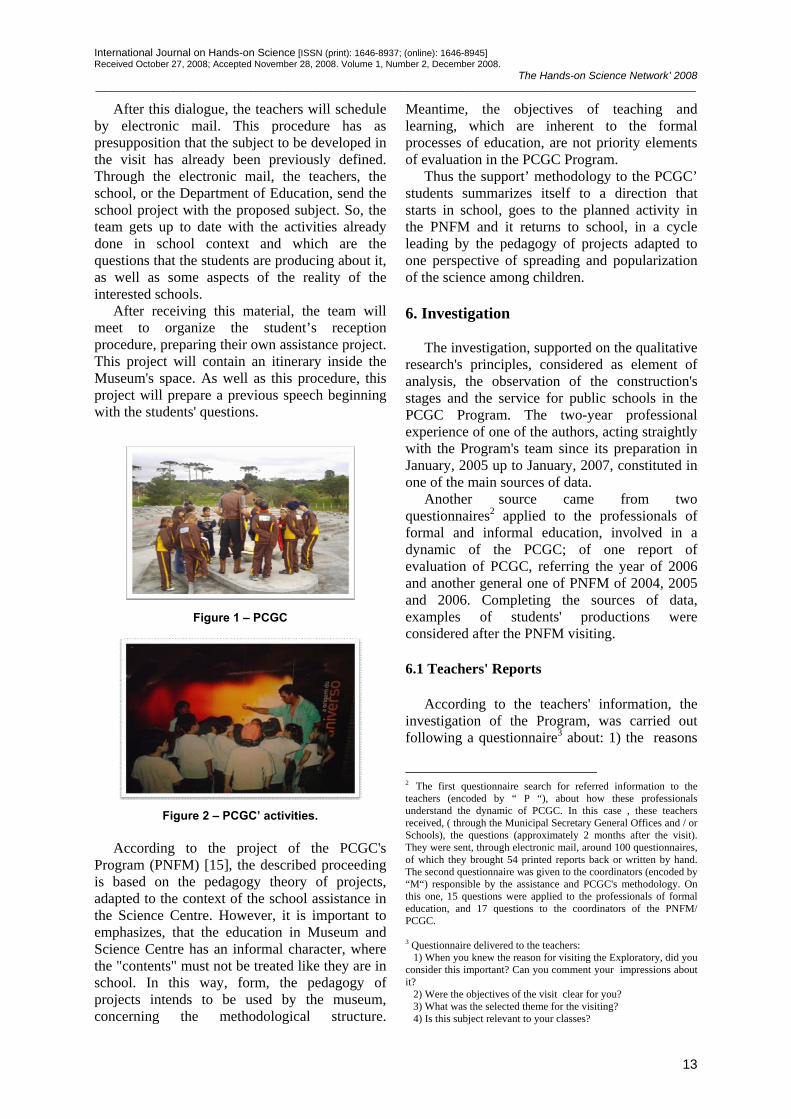
Figure 2 – PCGC’ activities.
According to the project of the PCGC's
Program (PNFM) [15], the described proceeding is based on the pedagogy theory of projects, adapted to the context of the school assistance in the Science Centre. However, it is important to emphasizes, that the education in Museum and Science Centre has an informal character, where the "contents" must not be treated like they are in school. In this way, form, the pedagogy of projects intends to be used by the museum, concerning the methodological structure.
Meantime, the objectives of teaching and learning, which are inherent to the formal processes of education, are not priority elements of evaluation in the PCGC Program.
Thus the support’ methodology to the PCGC’ students summarizes itself to a direction that starts in school, goes to the planned activity in the PNFM and it returns to school, in a cycle leading by the pedagogy of projects adapted to one perspective of spreading and popularization of the science among children. 6. Investigation
The investigation, supported on the qualitative research's principles, considered as element of analysis, the observation of the construction's stages and the service for public schools in the PCGC Program. The two-year professional experience of one of the authors, acting straightly with the Program's team since its preparation in January, 2005 up to January, 2007, constituted in one of the main sources of data.
Another source came from two questionnaires2 applied to the professionals of formal and informal education, involved in a dynamic of the PCGC; of one report of evaluation of PCGC, referring the year of 2006 and another general one of PNFM of 2004, 2005 and 2006. Completing the sources of data, examples of students' productions were considered after the PNFM visiting.
6.1 Teachers' Reports
According to the teachers' information, the
investigation of the Program, was carried out following a questionnaire3 about: 1) the reasons
2 The first questionnaire search for referred information to the teachers (encoded by “ P “), about how these professionals understand the dynamic of PCGC. In this case , these teachers received, ( through the Municipal Secretary General Offices and / or Schools), the questions (approximately 2 months after the visit). They were sent, through electronic mail, around 100 questionnaires, of which they brought 54 printed reports back or written by hand. The second questionnaire was given to the coordinators (encoded by “M“) responsible by the assistance and PCGC's methodology. On this one, 15 questions were applied to the professionals of formal education, and 17 questions to the coordinators of the PNFM/ PCGC. 3 Questionnaire delivered to the teachers: 1) When you knew the reason for visiting the Exploratory, did you consider this important? Can you comment your impressions about it? 2) Were the objectives of the visit clear for you? 3) What was the selected theme for the visiting? 4) Is this subject relevant to your classes?
International Journal on Hands-on Science [ISSN (print): 1646-8937; (online): 1646-8945] Received October 27, 2008; Accepted November 28, 2008. Volume 1, Number 2, December 2008.
The Hands-on Science Network’ 2008 ____________________________________________________________________________________________________________________
14
in which the teachers decided to do Science Museum's visiting; 2) the first impact in the beginning of the visiting concerning the Museum's geographic space as a whole one; 3) how was the preparation of the students before the visit; 4) what happened after the visit; 5) was there any contribution to the ongoing studying course for teachers and, finally; 6) what about the conceptions of science and technology of these teachers. 6.1.1 The Results
The results were interpreted considering six categories of analysis: the reasons for the visit; the first impact; the dialogue and the preparation before and after it; the ongoing professional development course of teachers (T) and the teachers' conceptions of science and technology.
1) The reasons for the visit: it is noticed, in 54
reports, that there was basically three categories of answers, concerning to the reasons that the teachers and their students went to the PCGC, described below:
a) Theoretical reinforce of the worked contents in the classroom, considering the visit to the Museum as research class (in 25 reports), as showed in the example:
(...) In this day, the children who were already conscious of what they would study in the research class, were excited to the use of a different methodology from that one in the classroom, because they will see closer what they studied in school (...) (T1).
b) The visit to the museum as the main motivation, which means, the curiosity about the museum space itself (in 13 reports), as in the example below:
5) Did you notice the students’ impressions when they first entered the PNFM Exploratory? Would you like to report any detail that calls your attention? 6) Could you report one positive aspect during the visit? 7) And could you point out a negative one? 8) Did you think the predetermined objectives were reached?? 9) Could you do a brief report of how your students have perceived the proposed theme during the visit? 10) In a brief report, how have the students perceived the theme after the visiting? Can you report some students' comments? 11) Was there any activity done in the classroom that was motivated by the PNFM Exploratory visiting? 12) How do you evaluate the whole project? 13) Did your conception about the proposed theme change? 14) What is your conception of Science? 15) What do you understand as the term ‘technology’?
It takes a long time I wish to visit the Exploratory (since I saw a report about it on TV). I was so happy to take my 3rd grade class there. On that report's time, I got in touch with them, and was informed that the visits were only possible to the 5th grade students on (T2).
c) The investigation's exercise as a possibility to improve the teaching and learning process and the contextualization of the school themes (in 16 reports), as observed below:
The best way to learn a content is by making the children use their own scientific work procedures, that means, let them to investigate and discover the reality as it is. Rediscovering history and its importance to our lives, its the mix of curiosity and learning, is a collective work that based itself on the students' knowledge experiences and on the power of investigation. In this project's development, hypotheses were raised, conclusions were thought, and theories were adjusted, so, allowing a different glance facing the transformations of the scientific one. By this process the student today, will rethink the transformation of the man through time (T3).
2) First impact: the words: "excited",
"amazed", " astonished", "admired", "curious", "surprised", "anxious", "enchanted", "vibrant", "fascinated", "interested", or " dazzled", which were found in the reports, reveal the visual appeal of the Exploratory, in a first impact, as described below by the teacher:
They liked everything, they looked around feeling amazed with that, because in our school there are so many children who don't have the opportunity not even to go out to a common park and everything that is different to them, took their attention. They liked mainly the project's models ("maquette"), by the richness of details showing the reality with so perfection (T4).
This example is a synthesis of the absolutely
most of the reports, showing that the Exploratory really presents a so appellative character in relation to Physics, Technology and Science. There is the possibility to understand the museum geographic space as scientific fiction, or as an apology to the "wonderful mechanics".
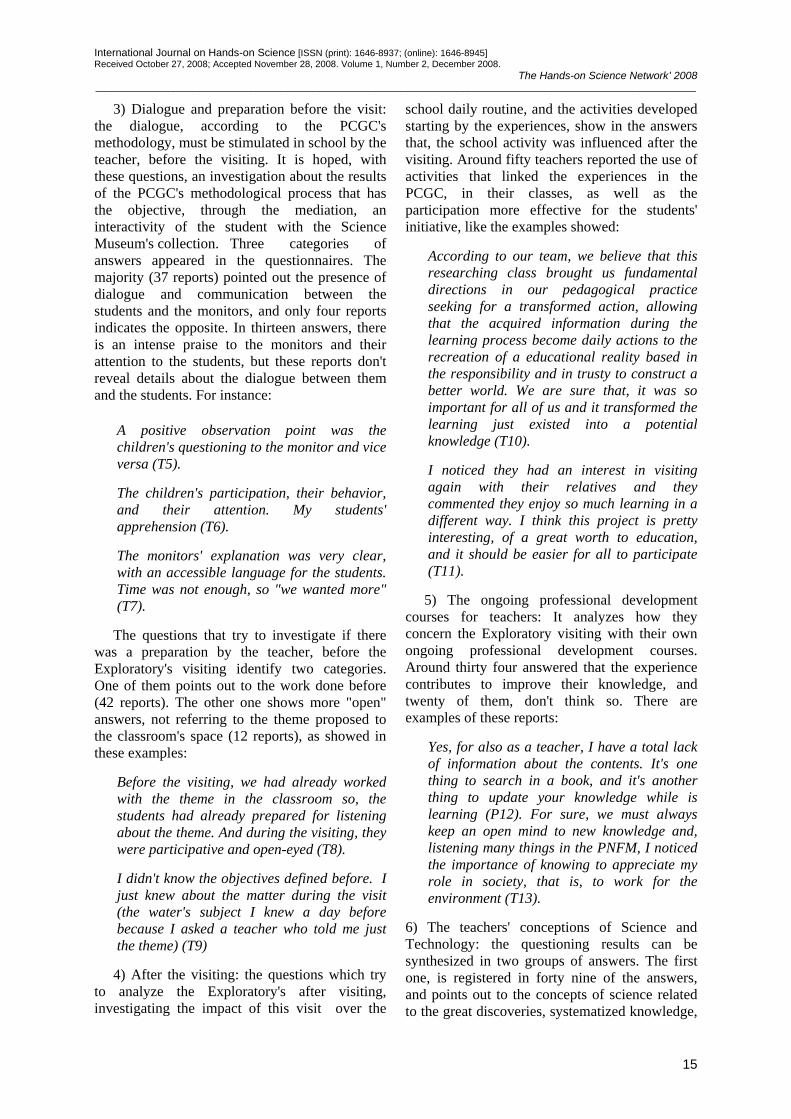
International Journal on Hands-on Science [ISSN (print): 1646-8937; (online): 1646-8945] Received October 27, 2008; Accepted November 28, 2008. Volume 1, Number 2, December 2008.
The Hands-on Science Network’ 2008 ____________________________________________________________________________________________________________________
15
3) Dialogue and preparation before the visit: the dialogue, according to the PCGC's methodology, must be stimulated in school by the teacher, before the visiting. It is hoped, with these questions, an investigation about the results of the PCGC's methodological process that has the objective, through the mediation, an interactivity of the student with the Science Museum's collection. Three categories of answers appeared in the questionnaires. The majority (37 reports) pointed out the presence of dialogue and communication between the students and the monitors, and only four reports indicates the opposite. In thirteen answers, there is an intense praise to the monitors and their attention to the students, but these reports don't reveal details about the dialogue between them and the students. For instance:
A positive observation point was the children's questioning to the monitor and vice versa (T5). The children's participation, their behavior, and their attention. My students' apprehension (T6). The monitors' explanation was very clear, with an accessible language for the students. Time was not enough, so "we wanted more" (T7).
The questions that try to investigate if there
was a preparation by the teacher, before the Exploratory's visiting identify two categories. One of them points out to the work done before (42 reports). The other one shows more "open" answers, not referring to the theme proposed to the classroom's space (12 reports), as showed in these examples:
Before the visiting, we had already worked with the theme in the classroom so, the students had already prepared for listening about the theme. And during the visiting, they were participative and open-eyed (T8). I didn't know the objectives defined before. I just knew about the matter during the visit (the water's subject I knew a day before because I asked a teacher who told me just the theme) (T9)
4) After the visiting: the questions which try to analyze the Exploratory's after visiting, investigating the impact of this visit over the
school daily routine, and the activities developed starting by the experiences, show in the answers that, the school activity was influenced after the visiting. Around fifty teachers reported the use of activities that linked the experiences in the PCGC, in their classes, as well as the participation more effective for the students' initiative, like the examples showed:
According to our team, we believe that this researching class brought us fundamental directions in our pedagogical practice seeking for a transformed action, allowing that the acquired information during the learning process become daily actions to the recreation of a educational reality based in the responsibility and in trusty to construct a better world. We are sure that, it was so important for all of us and it transformed the learning just existed into a potential knowledge (T10). I noticed they had an interest in visiting again with their relatives and they commented they enjoy so much learning in a different way. I think this project is pretty interesting, of a great worth to education, and it should be easier for all to participate (T11).
5) The ongoing professional development courses for teachers: It analyzes how they concern the Exploratory visiting with their own ongoing professional development courses. Around thirty four answered that the experience contributes to improve their knowledge, and twenty of them, don't think so. There are examples of these reports:
Yes, for also as a teacher, I have a total lack of information about the contents. It's one thing to search in a book, and it's another thing to update your knowledge while is learning (P12). For sure, we must always keep an open mind to new knowledge and, listening many things in the PNFM, I noticed the importance of knowing to appreciate my role in society, that is, to work for the environment (T13).
6) The teachers' conceptions of Science and Technology: the questioning results can be synthesized in two groups of answers. The first one, is registered in forty nine of the answers, and points out to the concepts of science related to the great discoveries, systematized knowledge,
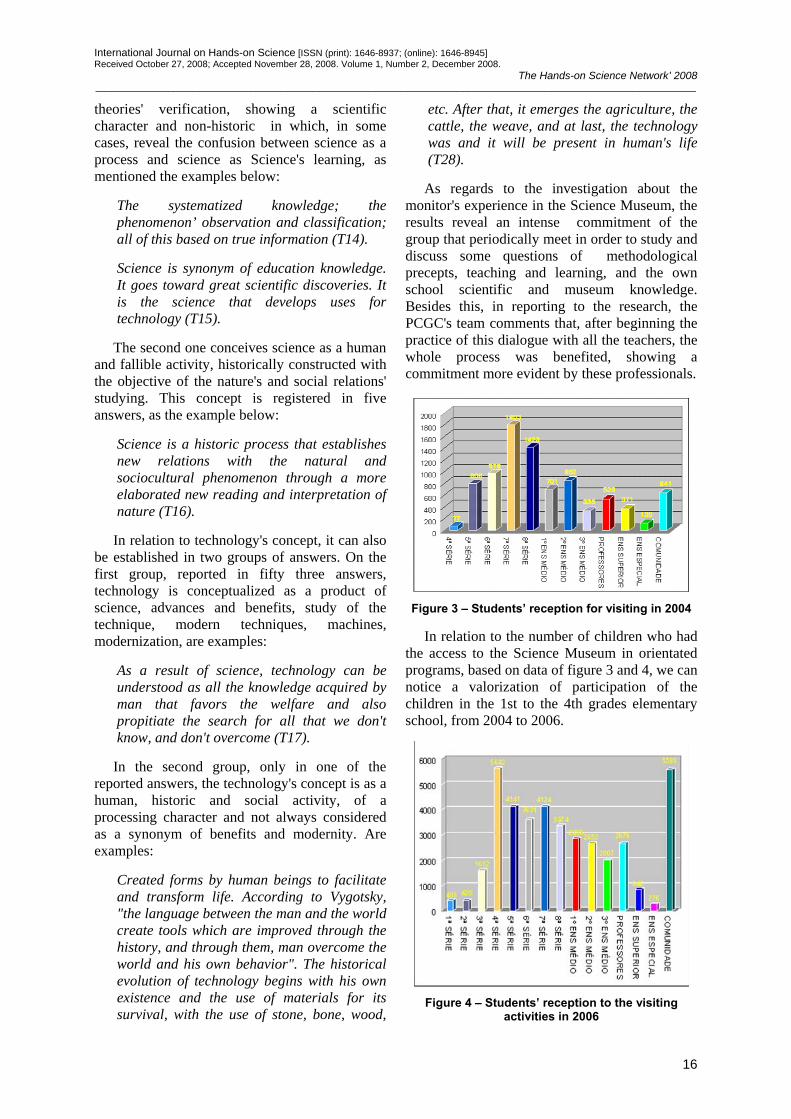
International Journal on Hands-on Science [ISSN (print): 1646-8937; (online): 1646-8945] Received October 27, 2008; Accepted November 28, 2008. Volume 1, Number 2, December 2008.
The Hands-on Science Network’ 2008 ____________________________________________________________________________________________________________________
16
theories' verification, showing a scientific character and non-historic in which, in some cases, reveal the confusion between science as a process and science as Science's learning, as mentioned the examples below:
The systematized knowledge; the phenomenon’ observation and classification; all of this based on true information (T14). Science is synonym of education knowledge. It goes toward great scientific discoveries. It is the science that develops uses for technology (T15).
The second one conceives science as a human and fallible activity, historically constructed with the objective of the nature's and social relations' studying. This concept is registered in five answers, as the example below:
Science is a historic process that establishes new relations with the natural and sociocultural phenomenon through a more elaborated new reading and interpretation of nature (T16).
In relation to technology's concept, it can also
be established in two groups of answers. On the first group, reported in fifty three answers, technology is conceptualized as a product of science, advances and benefits, study of the technique, modern techniques, machines, modernization, are examples:
As a result of science, technology can be understood as all the knowledge acquired by man that favors the welfare and also propitiate the search for all that we don't know, and don't overcome (T17).
In the second group, only in one of the reported answers, the technology's concept is as a human, historic and social activity, of a processing character and not always considered as a synonym of benefits and modernity. Are examples:
Created forms by human beings to facilitate and transform life. According to Vygotsky, "the language between the man and the world create tools which are improved through the history, and through them, man overcome the world and his own behavior". The historical evolution of technology begins with his own existence and the use of materials for its survival, with the use of stone, bone, wood,
etc. After that, it emerges the agriculture, the cattle, the weave, and at last, the technology was and it will be present in human's life (T28).
As regards to the investigation about the monitor's experience in the Science Museum, the results reveal an intense commitment of the group that periodically meet in order to study and discuss some questions of methodological precepts, teaching and learning, and the own school scientific and museum knowledge. Besides this, in reporting to the research, the PCGC's team comments that, after beginning the practice of this dialogue with all the teachers, the whole process was benefited, showing a commitment more evident by these professionals.
Figure 3 – Students’ reception for visiting in 2004
In relation to the number of children who had
the access to the Science Museum in orientated programs, based on data of figure 3 and 4, we can notice a valorization of participation of the children in the 1st to the 4th grades elementary school, from 2004 to 2006.
Figure 4 – Students’ reception to the visiting
activities in 2006
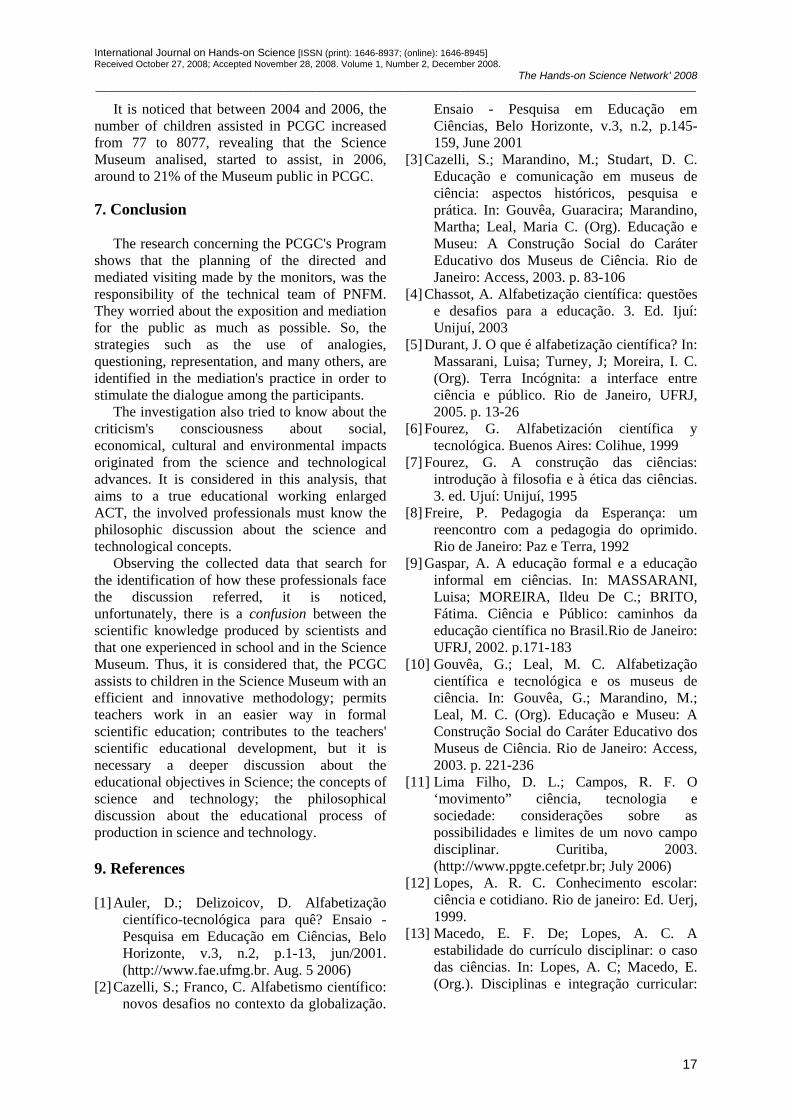
International Journal on Hands-on Science [ISSN (print): 1646-8937; (online): 1646-8945] Received October 27, 2008; Accepted November 28, 2008. Volume 1, Number 2, December 2008.
The Hands-on Science Network’ 2008 ____________________________________________________________________________________________________________________
17
It is noticed that between 2004 and 2006, the number of children assisted in PCGC increased from 77 to 8077, revealing that the Science Museum analised, started to assist, in 2006, around to 21% of the Museum public in PCGC.
7. Conclusion
The research concerning the PCGC's Program
shows that the planning of the directed and mediated visiting made by the monitors, was the responsibility of the technical team of PNFM. They worried about the exposition and mediation for the public as much as possible. So, the strategies such as the use of analogies, questioning, representation, and many others, are identified in the mediation's practice in order to stimulate the dialogue among the participants.
The investigation also tried to know about the criticism's consciousness about social, economical, cultural and environmental impacts originated from the science and technological advances. It is considered in this analysis, that aims to a true educational working enlarged ACT, the involved professionals must know the philosophic discussion about the science and technological concepts.
Observing the collected data that search for the identification of how these professionals face the discussion referred, it is noticed, unfortunately, there is a confusion between the scientific knowledge produced by scientists and that one experienced in school and in the Science Museum. Thus, it is considered that, the PCGC assists to children in the Science Museum with an efficient and innovative methodology; permits teachers work in an easier way in formal scientific education; contributes to the teachers' scientific educational development, but it is necessary a deeper discussion about the educational objectives in Science; the concepts of science and technology; the philosophical discussion about the educational process of production in science and technology. 9. References [1] Auler, D.; Delizoicov, D. Alfabetização
científico-tecnológica para quê? Ensaio - Pesquisa em Educação em Ciências, Belo Horizonte, v.3, n.2, p.1-13, jun/2001. (http://www.fae.ufmg.br. Aug. 5 2006)
[2] Cazelli, S.; Franco, C. Alfabetismo científico: novos desafios no contexto da globalização.
Ensaio - Pesquisa em Educação em Ciências, Belo Horizonte, v.3, n.2, p.145-159, June 2001
[3] Cazelli, S.; Marandino, M.; Studart, D. C. Educação e comunicação em museus de ciência: aspectos históricos, pesquisa e prática. In: Gouvêa, Guaracira; Marandino, Martha; Leal, Maria C. (Org). Educação e Museu: A Construção Social do Caráter Educativo dos Museus de Ciência. Rio de Janeiro: Access, 2003. p. 83-106
[4] Chassot, A. Alfabetização científica: questões e desafios para a educação. 3. Ed. Ijuí: Unijuí, 2003
[5] Durant, J. O que é alfabetização científica? In: Massarani, Luisa; Turney, J; Moreira, I. C. (Org). Terra Incógnita: a interface entre ciência e público. Rio de Janeiro, UFRJ, 2005. p. 13-26
[6] Fourez, G. Alfabetización científica y tecnológica. Buenos Aires: Colihue, 1999
[7] Fourez, G. A construção das ciências: introdução à filosofia e à ética das ciências. 3. ed. Ujuí: Unijuí, 1995
[8] Freire, P. Pedagogia da Esperança: um reencontro com a pedagogia do oprimido. Rio de Janeiro: Paz e Terra, 1992
[9] Gaspar, A. A educação formal e a educação informal em ciências. In: MASSARANI, Luisa; MOREIRA, Ildeu De C.; BRITO, Fátima. Ciência e Público: caminhos da educação científica no Brasil.Rio de Janeiro: UFRJ, 2002. p.171-183
[10] Gouvêa, G.; Leal, M. C. Alfabetização científica e tecnológica e os museus de ciência. In: Gouvêa, G.; Marandino, M.; Leal, M. C. (Org). Educação e Museu: A Construção Social do Caráter Educativo dos Museus de Ciência. Rio de Janeiro: Access, 2003. p. 221-236
[11] Lima Filho, D. L.; Campos, R. F. O ‘movimento” ciência, tecnologia e sociedade: considerações sobre as possibilidades e limites de um novo campo disciplinar. Curitiba, 2003. (http://www.ppgte.cefetpr.br; July 2006)
[12] Lopes, A. R. C. Conhecimento escolar: ciência e cotidiano. Rio de janeiro: Ed. Uerj, 1999.
[13] Macedo, E. F. De; Lopes, A. C. A estabilidade do currículo disciplinar: o caso das ciências. In: Lopes, A. C; Macedo, E. (Org.). Disciplinas e integração curricular:

International Journal on Hands-on Science [ISSN (print): 1646-8937; (online): 1646-8945] Received October 27, 2008; Accepted November 28, 2008. Volume 1, Number 2, December 2008.
The Hands-on Science Network’ 2008 ____________________________________________________________________________________________________________________
18
história e políticas. 1. ed. Rio de Janeiro: DP&A, 2002, v. 1, p. 73-94
[14] Marandino, M. Perspectivas da pesquisa educacional em museus de ciências. In: Santos, F. M. T.; Greca, I. M. (org). A pesquisa em ensino de ciências no Brasil e suas Metodologias.Ijuí: Ed. Unijuí, 2007. p. 89-122
[15] Paraná. Secretaria de Estado da Educação. Parque Newton Freire Maia. Projeto de Atendimento a Estudantes de 1 a 4 séries.Curitiba: SEED, 2006
[16] Rocha, M. et al. Pequenos cientistas – grandes cidadãos: considerações a respeito de um trabalho interdisciplinar de alfabetização científica destinado a alunos de 1ª a 4ª séries em um centro de ciências. In: VI Educere (Anais). Curitiba: Pontifícia Universidade Católica do Paraná, 2006
[17] Soares, M. Letramento: um tema em três géneros. Belo Horizonte: Autêntica, 2001
Further References:
Allen, S. Designs for Learning: Studying Science Museum Exhibits that Do more than Entertain, Sci. Educ. 88: 17-33, 2004. Anderson, D.; Lucas, Kb And Ginns, I.S. Theoretical Perspectives on Learning in an Informal Setting, J. Res. Sci. Teach. 40: 177-199, 2003. Falcao, D.; Colinvaux, S. and Krapas, S. A Model-based Approach to Science Exhibition Evaluation: A Case Study in a Brazilian Astronomy Museum, Int. J. Sci. Educ., 26: 951-978, 2004. Falk, J. The Director´s Cut: Toward an Improved Understanding of Learning from Museums, Sci. Educ., 88: 83 - 96, 2004. Henderlong, J. and Paris, S.G. Children´s Motivation to Explore Partially Completed Exhibits in Hands-on Museums, Cont. Educ. Psy. 21: 111-118, 1996. Kelly, J. Rethinking the Elementary Science Methods Course: A Case for Content, Pedagogy and Informal Science Education, Int. J. Sci. Educ., 22: 755-777, 2000. Pedretti, E. G. Perspectives on Learning though Research on Critical Issues-Based Science Center Exhibitions, Sci. Educ., 34 - 47- 96, 2004. Rennie, L. J. and Stocklmayer, S. M. The Communication of Science and Technology: Past, Present and Future Agendas, Int. J. Sci. Educ., 25: 759-773, 2003.

International Journal on Hands-on Science [ISSN (print): 1646-8937; (online): 1646-8945] Received October 27, 2008; Accepted November 18, 2008. Volume 1, Number 2, December 2008.
The Hands-on Science Network’ 2008 ____________________________________________________________________________________________________________________
19
“Espaços da Ciência” of the CECIERJ Foundation
V. Cascon, F. S. Amaral, V. F. Guimarães, P. C. B. Arantes, M. S. Dahmouche
Fundação CECIERJ – Rua Visconde de Niterói, 1364. Rio de Janeiro/RJ Brazil 20943-001
[email protected] Abstract. In the frames of “Espaços da Ciência” program, Science Centers and Planetariums have been built in different small towns of the Rio de Janeiro State. This innovative project, unique in Brazil, intends to promote the diffusion and popularization of science and technology for the general public, but is primarily aimed to students and teachers of the local and regional schools. These Science Centers contribute also to improve science teaching by offering their facilities to the regional schools. These Science Centers in the hinterland are important for the local populations that usually don’t have access to social events of scientific and cultural nature.
Keywords. Diffusion and popularization of science, hands-on experiments, science centers, scientific education. 1. Introduction
“Espaços da Ciência” is one of the programs
developed by the Sector of Scientific Divulgation of the CECIERJ Foundation [1], a public agency of the State of Rio De Janeiro. The CECIERJ is a development of the CECIGUA - Center of Sciences of the Guanabara, established in 1965. The Centers of Science (CECIs) had been created in different states of Brazil in the decade of 1960. The CECIs had as its objective the capacitating of teachers, the production and the distribution of text-books and laboratory materials for the schools of its respective states, and the improvement of education in science [2].
The existence, nowadays, of more than 100 centers and museums of science in Brazil reflects the concern of educational and research institutions on the education in science and formation of teachers.
The museums of science are characterized by its approach: of first generation are those that present expositions of collections (as museums of natural history), second generation the ones
that have as approach the scientific advance and the development of industry - some with apparatus of the type press buttons to obtain one single answer (push-button interaction), and third generation the ones that present scientific phenomena and concepts through the interaction of the public with the exhibits (hands-on interaction) [3].
A more recent approach is aimed to a multidiscipline view of science museums, in which the scientific culture is understood as part of the general culture and therefore needs social, historical and cultural elements to acquire meaning. In this new way of interactivity with the public, general and regional elements must be considered —as the process of globalization, the professional specialization, the emergence of new educational approaches and practices, the increasing urbanization and the degradation of the environment [4].
The initial approach of the “Espaços da Ciência” (Science Centers) program of CECIERJ Foundation was based in the interactive museums of science, of third generation, in which predominate the philosophy of “learning-by-making” and the absence of the exposition of historical objects.
2. “Espaços da Ciência” of the CECIERJ
Foundation
In the “Espaços da Ciência” program, Science Centers and Planetariums have been built in the Rio de Janeiro State hinterland. This is an innovative project, without similar in Brazil. The first, the “Espaço da Ciência de Campos dos Goytacazes”, was opened in 1999, closed in 2003, and a new science center was opened in 2006 at São João da Barra, a neighbor county. Furthermore, Science Centers were open in Três Rios and Paracambi towns, where Planetariums were also established in 2002.
The planning of these science centers is made by a partnership of the town hall representatives

International Journal on Hands-on Science [ISSN (print): 1646-8937; (online): 1646-8945] Received October 27, 2008; Accepted November 18, 2008. Volume 1, Number 2, December 2008.
The Hands-on Science Network’ 2008 ____________________________________________________________________________________________________________________
20
with the staff of the CECIERJ, represented by the general coordinator (Vera Cascon) and the technical supervisor (Francisco Amaral) of the “Espaços da Ciência” program.
This program intends to promote the diffusion and popularization of science and technology for the general population, but is primarily aimed to the students and teachers of the regional schools.
In these Centers, interactive expositions are presented for the public, with hands-on experiments acquired, designed and build by the CECIERJ staff, and shared by partner institutions [5]. These Science Centers contribute also to improve science teaching by offering their facilities to the regional schools. In this way, the teachers can develop research and pedagogic activities with their students. This project also intends to develop cultural activities in these centers, increasing thus the interaction with the regional population. In this sense, they are a social instrument for the knowledge, development strategies and citizen conscience. 2.1. “Espaço da Ciência” of Três Rios
The “Espaço da Ciência” of the Três Rios
town was the first new science center to be installed, in April 2002, using the old station of load train as the exhibition room and building a Planetarium beside it. In the partnership with the local town hall, the “Espaço” belongs to the Culture Coordination.
Nowadays, the “Espaço” of Três Rios presents several logical/mathematical games, about 33 interactive experiments of physics (14 of them shared by the Casa da Ciência/UFRJ) and a sector of microscopy. It is open Monday to Friday: 9 a.m. – 5 p.m. In the majority, the visitors are students and teachers of the regional schools. Besides these, several students of formation of teachers colleges visit the science center as an activity of their academic formation.
The local director is a county teacher. Of the 6 mediators, 2 of them have secondary education formation and the others 4 are graduate students.
In the permanent exhibition, this science center presents hands-on experiments that represent macroscopic phenomena of physics, mainly on mechanics, optics and electricity, establishing a correlation with the day by day of the visitors. In mathematics, there are games to stimulate the logic thought. The microscopy sector shows the presence of pathologic organisms in dirty water and the micro-fauna in
nature, as a way to wake up the public conscience for the necessity of preservation of the sources of water and for the conservation of the environment.
In the evaluation of the public frequency, a trend of reduction of the interest of the public for the permanent collection of these spaces was perceived. To avoid this, we are trying a renewal of the exhibitions, turning these spaces more attractive for the general public.
In June 2007, the temporary exposition “Os Sentidos da Vida” (Life Senses), shared by Museu da Vida/COC/Fiocruz, was presented in Três Rios science center. Before this exposition, new members of the staff had been selected and enabled to play their role as mediators between science and visitors (Fig. 1).
The selected mediators are graduate students of Biology and of Physics Teacher’s Licentiate of Distance Higher Education of the CEDERJ/ CECIERJ Foundation.
Figure 1. The mediator (left) and the visitors of the Três Rios science center
The answer of the general public, mainly of
primary and secondary school, was very positive: in June 2007 the influx of visitors was greater that the registered in all the year of 2006.
After this, others temporary expositions were showed in the “Espaço”, with partners like the ISE/FAETEC – Superior Institute of Education.
The “Espaço da Ciência” participates on existing town events with the goal to promote its interaction with the local community and the scientific diffusion. In all of these events, in public squares, the hands-on experiments are the most interesting activities for the general public.
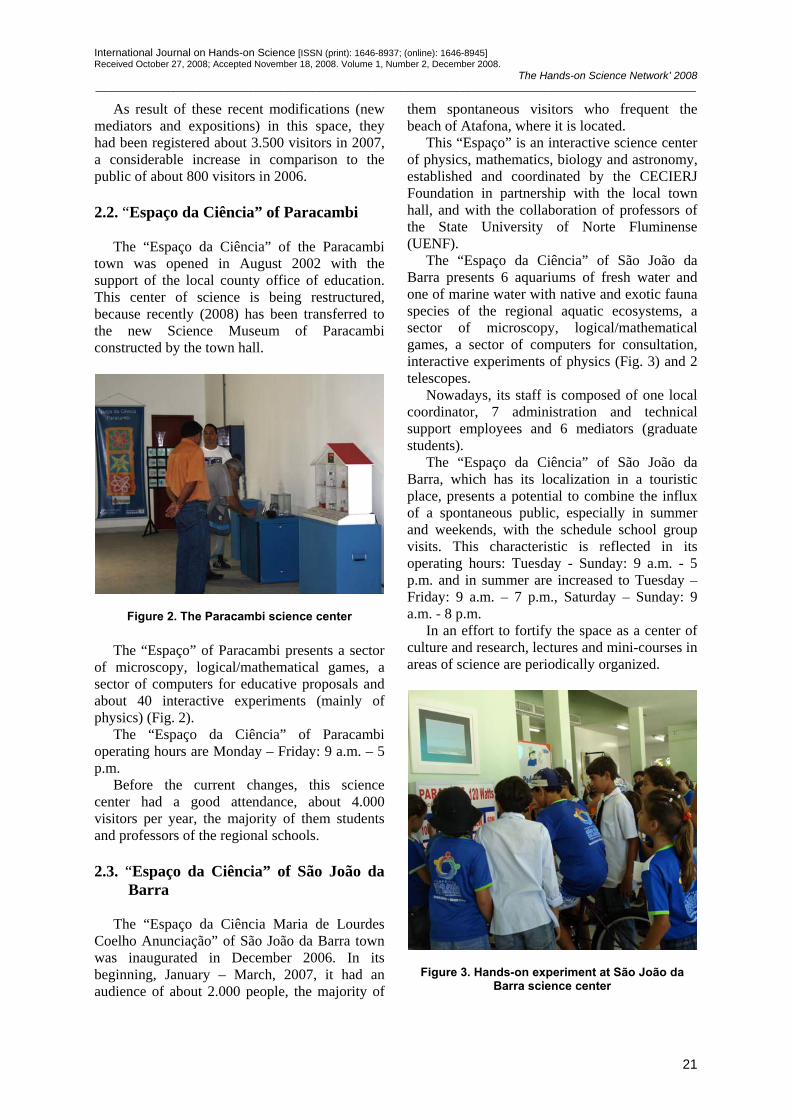
International Journal on Hands-on Science [ISSN (print): 1646-8937; (online): 1646-8945] Received October 27, 2008; Accepted November 18, 2008. Volume 1, Number 2, December 2008.
The Hands-on Science Network’ 2008 ____________________________________________________________________________________________________________________
21
As result of these recent modifications (new mediators and expositions) in this space, they had been registered about 3.500 visitors in 2007, a considerable increase in comparison to the public of about 800 visitors in 2006.
2.2. “Espaço da Ciência” of Paracambi
The “Espaço da Ciência” of the Paracambi
town was opened in August 2002 with the support of the local county office of education. This center of science is being restructured, because recently (2008) has been transferred to the new Science Museum of Paracambi constructed by the town hall.
Figure 2. The Paracambi science center The “Espaço” of Paracambi presents a sector
of microscopy, logical/mathematical games, a sector of computers for educative proposals and about 40 interactive experiments (mainly of physics) (Fig. 2).
The “Espaço da Ciência” of Paracambi operating hours are Monday – Friday: 9 a.m. – 5 p.m.
Before the current changes, this science center had a good attendance, about 4.000 visitors per year, the majority of them students and professors of the regional schools.
2.3. “Espaço da Ciência” of São João da
Barra
The “Espaço da Ciência Maria de Lourdes Coelho Anunciação” of São João da Barra town was inaugurated in December 2006. In its beginning, January – March, 2007, it had an audience of about 2.000 people, the majority of
them spontaneous visitors who frequent the beach of Atafona, where it is located.
This “Espaço” is an interactive science center of physics, mathematics, biology and astronomy, established and coordinated by the CECIERJ Foundation in partnership with the local town hall, and with the collaboration of professors of the State University of Norte Fluminense (UENF).
The “Espaço da Ciência” of São João da Barra presents 6 aquariums of fresh water and one of marine water with native and exotic fauna species of the regional aquatic ecosystems, a sector of microscopy, logical/mathematical games, a sector of computers for consultation, interactive experiments of physics (Fig. 3) and 2 telescopes.
Nowadays, its staff is composed of one local coordinator, 7 administration and technical support employees and 6 mediators (graduate students).
The “Espaço da Ciência” of São João da Barra, which has its localization in a touristic place, presents a potential to combine the influx of a spontaneous public, especially in summer and weekends, with the schedule school group visits. This characteristic is reflected in its operating hours: Tuesday - Sunday: 9 a.m. - 5 p.m. and in summer are increased to Tuesday – Friday: 9 a.m. – 7 p.m., Saturday – Sunday: 9 a.m. - 8 p.m.
In an effort to fortify the space as a center of culture and research, lectures and mini-courses in areas of science are periodically organized.
Figure 3. Hands-on experiment at São João da Barra science center
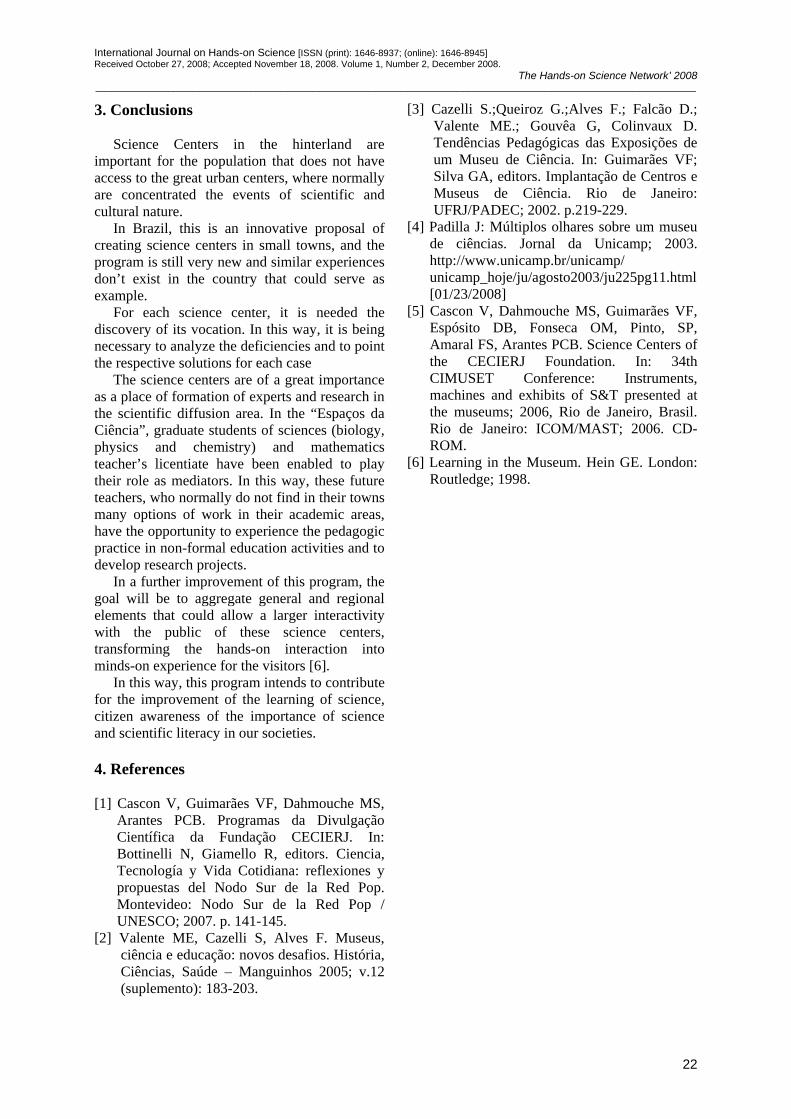
International Journal on Hands-on Science [ISSN (print): 1646-8937; (online): 1646-8945] Received October 27, 2008; Accepted November 18, 2008. Volume 1, Number 2, December 2008.
The Hands-on Science Network’ 2008 ____________________________________________________________________________________________________________________
22
3. Conclusions
Science Centers in the hinterland are important for the population that does not have access to the great urban centers, where normally are concentrated the events of scientific and cultural nature.
In Brazil, this is an innovative proposal of creating science centers in small towns, and the program is still very new and similar experiences don’t exist in the country that could serve as example.
For each science center, it is needed the discovery of its vocation. In this way, it is being necessary to analyze the deficiencies and to point the respective solutions for each case
The science centers are of a great importance as a place of formation of experts and research in the scientific diffusion area. In the “Espaços da Ciência”, graduate students of sciences (biology, physics and chemistry) and mathematics teacher’s licentiate have been enabled to play their role as mediators. In this way, these future teachers, who normally do not find in their towns many options of work in their academic areas, have the opportunity to experience the pedagogic practice in non-formal education activities and to develop research projects.
In a further improvement of this program, the goal will be to aggregate general and regional elements that could allow a larger interactivity with the public of these science centers, transforming the hands-on interaction into minds-on experience for the visitors [6].
In this way, this program intends to contribute for the improvement of the learning of science, citizen awareness of the importance of science and scientific literacy in our societies. 4. References [1] Cascon V, Guimarães VF, Dahmouche MS,
Arantes PCB. Programas da Divulgação Científica da Fundação CECIERJ. In: Bottinelli N, Giamello R, editors. Ciencia, Tecnología y Vida Cotidiana: reflexiones y propuestas del Nodo Sur de la Red Pop. Montevideo: Nodo Sur de la Red Pop / UNESCO; 2007. p. 141-145.
[2] Valente ME, Cazelli S, Alves F. Museus, ciência e educação: novos desafios. História, Ciências, Saúde – Manguinhos 2005; v.12 (suplemento): 183-203.
[3] Cazelli S.;Queiroz G.;Alves F.; Falcão D.; Valente ME.; Gouvêa G, Colinvaux D. Tendências Pedagógicas das Exposições de um Museu de Ciência. In: Guimarães VF; Silva GA, editors. Implantação de Centros e Museus de Ciência. Rio de Janeiro: UFRJ/PADEC; 2002. p.219-229.
[4] Padilla J: Múltiplos olhares sobre um museu de ciências. Jornal da Unicamp; 2003. http://www.unicamp.br/unicamp/ unicamp_hoje/ju/agosto2003/ju225pg11.html [01/23/2008]
[5] Cascon V, Dahmouche MS, Guimarães VF, Espósito DB, Fonseca OM, Pinto, SP, Amaral FS, Arantes PCB. Science Centers of the CECIERJ Foundation. In: 34th CIMUSET Conference: Instruments, machines and exhibits of S&T presented at the museums; 2006, Rio de Janeiro, Brasil. Rio de Janeiro: ICOM/MAST; 2006. CD-ROM.
[6] Learning in the Museum. Hein GE. London: Routledge; 1998.
International Journal on Hands-on Science [ISSN (print): 1646-8937; (online): 1646-8945] Received July 20, 2008; Accepted October 10, 2008. Volume 1, Number 2, December 2008.
The Hands-on Science Network’ 2008 ____________________________________________________________________________________________________________________
23
Informal Learning at School. Science Fairs in Basic Schools
Zita Esteves1, Andreia Cabral1, Manuel F. M. Costa2
1Externato Maria Auxiliadora Avenida S. João Bosco, 365, 4900-896 Viana do Castelo, Portugal
[email protected], [email protected] 2Departamento de Física, Universidade do Minho
Campus de Gualtar, 4710-057 Braga, Portugal [email protected]
Abstract. The work herein reports on the implementation of science fairs in a systematic way in basic schools. In particular we will present the second edition of the annual Science Fair at basic school Externato Maria Auxiliadora, in Viana do Castelo, Portugal, focusing on the evolution advised by the evaluation of the previous edition of the science fair. We will stress that it was intended to give continuity to the research project on science fairs of the previous year improving, based on past conclusions, some aspects like: the age group of the participants was enlarged to ages 10 to 15; there was a major effort to engage parents and the whole school community in the process and in the development/construction of the projects to the science fair; to the teachers involved in the project was assigned an increased set of weekly hours to give support to the works realization. The participation of the students was not mandatory and it had no weight in the student’s formal evaluation.
The results suggested that the whole school benefited from the enlargement of the age group of the participants in the event, from the involvement of parents and from the systematic involvement of schoolteachers.. We concluded again that the Science Fair contributed effectively to an increase of the student’s interest on scientific subjects. Keywords. Basic Schools, Informal learning, Science Fairs. 1. Introduction
Science Fairs are generally classified as cultural and pedagogical activities that involves all school communities, allowing public presentation of the scientific projects [1] developed by the students, the dialogue, the
sharing and discussion of knowledge among students teachers and, hopefully, parents and the community. Work methodologies are developed, research performed, and the creativity of students but also teachers and visitors during the exposition, is explored [2,3]. Science fairs stimulate the construction of the scientific knowledge along the years, the exchange of ideas, work habits and knowledge [4].
However, the success of this kind of event didn’t depend only on the effort of students but it is also necessary that they feel the support given by their teachers and parents. The help given by professionals of the scientific area in study might be very important during the development of the project and the preparation of the presentation [4]. However is important that this kind of support begins at home. Therefore, parents should be notified about the realization of the science fair as early as possible [5] and enrolled actively.
A good organization of the science fair is also necessary to make it a success. Therefore organizers should select the appropriate space for the number of participants and visitants that they expect [6], select dates and opening hours carefully [7] and make available materials and services if necessary [6]. If parents are notified sooner, certainly they don’t mind to help in the organization, helping the organizing teachers [5,7] and so leave them with more time to support students with benefits also in terms of security and working rules [4].
2. Development of the project
On previous year project, the first science fair organized at school Externato Maria Auxiliadora limited the participation to students with ages between 12 and 15 years old (7th to 9th grades) and the scientific areas involved on projects were
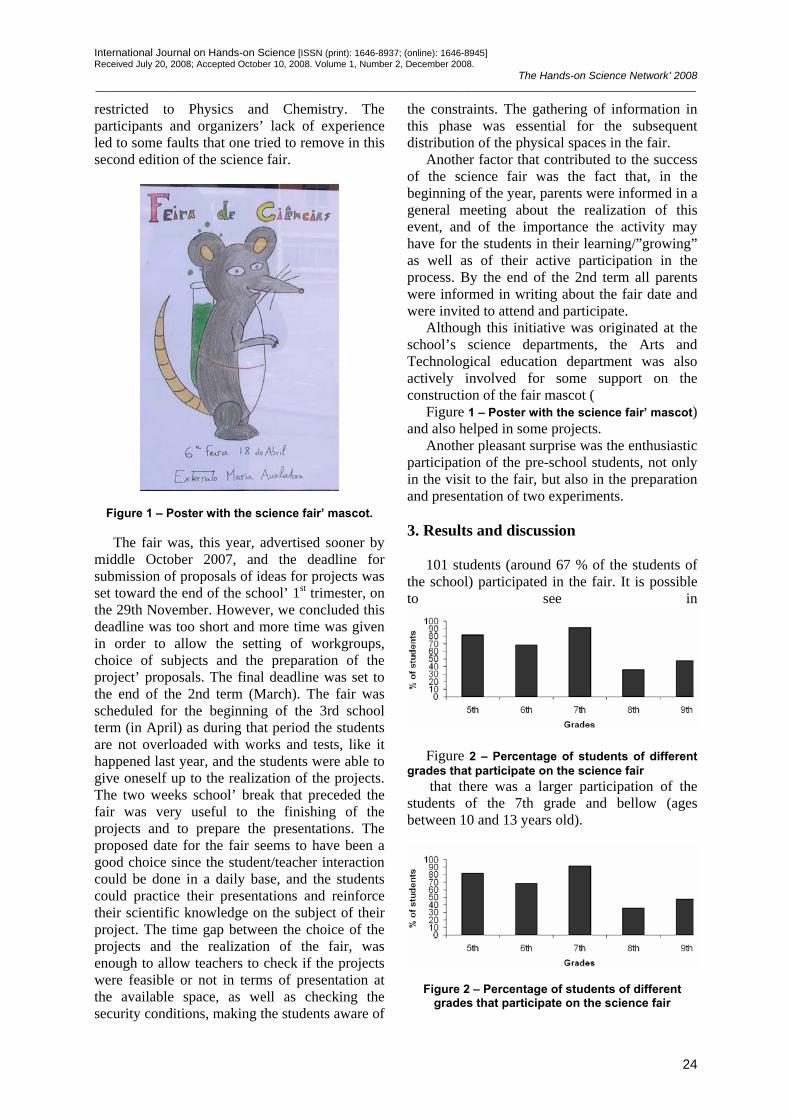
International Journal on Hands-on Science [ISSN (print): 1646-8937; (online): 1646-8945] Received July 20, 2008; Accepted October 10, 2008. Volume 1, Number 2, December 2008.
The Hands-on Science Network’ 2008 ____________________________________________________________________________________________________________________
24
restricted to Physics and Chemistry. The participants and organizers’ lack of experience led to some faults that one tried to remove in this second edition of the science fair.
Figure 1 – Poster with the science fair’ mascot.
The fair was, this year, advertised sooner by middle October 2007, and the deadline for submission of proposals of ideas for projects was set toward the end of the school’ 1st trimester, on the 29th November. However, we concluded this deadline was too short and more time was given in order to allow the setting of workgroups, choice of subjects and the preparation of the project’ proposals. The final deadline was set to the end of the 2nd term (March). The fair was scheduled for the beginning of the 3rd school term (in April) as during that period the students are not overloaded with works and tests, like it happened last year, and the students were able to give oneself up to the realization of the projects. The two weeks school’ break that preceded the fair was very useful to the finishing of the projects and to prepare the presentations. The proposed date for the fair seems to have been a good choice since the student/teacher interaction could be done in a daily base, and the students could practice their presentations and reinforce their scientific knowledge on the subject of their project. The time gap between the choice of the projects and the realization of the fair, was enough to allow teachers to check if the projects were feasible or not in terms of presentation at the available space, as well as checking the security conditions, making the students aware of
the constraints. The gathering of information in this phase was essential for the subsequent distribution of the physical spaces in the fair.
Another factor that contributed to the success of the science fair was the fact that, in the beginning of the year, parents were informed in a general meeting about the realization of this event, and of the importance the activity may have for the students in their learning/”growing” as well as of their active participation in the process. By the end of the 2nd term all parents were informed in writing about the fair date and were invited to attend and participate.
Although this initiative was originated at the school’s science departments, the Arts and Technological education department was also actively involved for some support on the construction of the fair mascot (
Figure 1 – Poster with the science fair’ mascot) and also helped in some projects.
Another pleasant surprise was the enthusiastic participation of the pre-school students, not only in the visit to the fair, but also in the preparation and presentation of two experiments.
3. Results and discussion
101 students (around 67 % of the students of the school) participated in the fair. It is possible to see in
Figure 2 – Percentage of students of different
grades that participate on the science fair that there was a larger participation of the
students of the 7th grade and bellow (ages between 10 and 13 years old).
Figure 2 – Percentage of students of different grades that participate on the science fair

International Journal on Hands-on Science [ISSN (print): 1646-8937; (online): 1646-8945] Received July 20, 2008; Accepted October 10, 2008. Volume 1, Number 2, December 2008.
The Hands-on Science Network’ 2008 ____________________________________________________________________________________________________________________
25
The enthusiasm and great level of
involvement of the new-coming students (last year fair only students from 7th to 9th grades participated) was obvious. It was remarkable the participation of more than 80 % of the students of the 5th year, for whom this activity was completely new and that have a still limited contact with science subjects. We may conclude that it seems to be a good age to initiate them into projects of this extent. The enthusiasm in the participation in the process is very important. However it is of great importance the constant surveillance of the evolution of the students’ participation in this type of events across the year (and in the subsequent years), creating work habits in the preparation and development of scientific projects, making sustainable this increased interest in science.
One important aspect that we take into account is the fact that some elder students deliver their projects after the deadline or that disregarded the standards of security imposed. In some cases this lead to the non acceptation of some projects, as a way to emphasize the importance of responsibility, including in what concerns deadlines and security rules. This imposition also led to an improvement of the final products in comparison to last years’ fair.
Also important is the continuity of previous year projects, which is recommended in the literature [4]. Two of last year’ projects were further developed and presented by the same groups this year. As the planned improvements were not only aesthetic but scientific and clearly justified the works were accepted as proposed. In fact it was clear the care and effort taken by these and all other students in order to prepare better projects than last year fair’ ones.
Figure 3 – Distribution of the projects between the
science fields
On Figure 3 – Distribution of the projects between the science fields
, it is possible to see that the distribution of students by subject was homogeneous. These projects were classified in the respective areas take into account the theoretical basis. Among the 32 projects presented, 12 were approached in the Physics perspective, 12 of the Chemistry and 8 in the broader classification of Natural Sciences. This last area was a novelty regarding the previous year, when there were only projects of the areas of physics and chemistry. It seems that this difference can be related to two quite obvious reasons: the biggest involvement and support given by the teachers of natural sciences discipline, and the participation of students from 5th and 6th grades (authors of 5 from 8 projects on this natural sciences group). It is important to stress that, in spite of the homogeneity described previously, the students treated the subjects under rather varied perspectives, i.e., related to the environment, technology, everyday phenomenon explanation, ... A wide variety of resources was used to improve the quality of presentations that appeared in different formats: from common posters and dossiers, to reports, powerpoint presentations, …
In terms of the number of students' which constituted each work group (Figure 4 – Distribution of students per group), it was verified that around 47 % of the projects were developed in groups of 4 students. On larger groups was found no major disparity in what concerns students’ knowledge, and it can even be considered beneficial in someway since the students could take turns in the presentations, allowing them to visit other stands and see, and discuss, other projects.
Figure 4 – Distribution of students per group
Taking in account the projects development stage, the presentation clearness and the creativity, the jury had chosen five winning
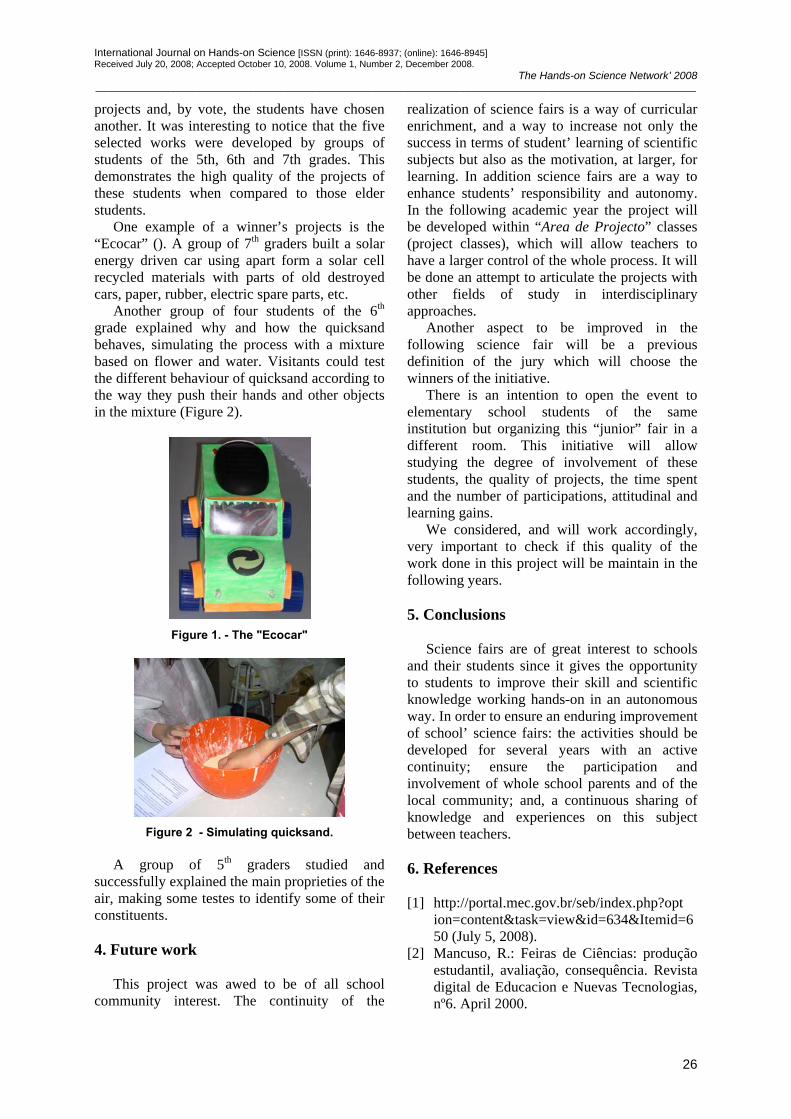
International Journal on Hands-on Science [ISSN (print): 1646-8937; (online): 1646-8945] Received July 20, 2008; Accepted October 10, 2008. Volume 1, Number 2, December 2008.
The Hands-on Science Network’ 2008 ____________________________________________________________________________________________________________________
26
projects and, by vote, the students have chosen another. It was interesting to notice that the five selected works were developed by groups of students of the 5th, 6th and 7th grades. This demonstrates the high quality of the projects of these students when compared to those elder students.
One example of a winner’s projects is the “Ecocar” (). A group of 7th graders built a solar energy driven car using apart form a solar cell recycled materials with parts of old destroyed cars, paper, rubber, electric spare parts, etc.
Another group of four students of the 6th grade explained why and how the quicksand behaves, simulating the process with a mixture based on flower and water. Visitants could test the different behaviour of quicksand according to the way they push their hands and other objects in the mixture (Figure 2).
Figure 1. - The "Ecocar"
Figure 2 - Simulating quicksand.
A group of 5th graders studied and
successfully explained the main proprieties of the air, making some testes to identify some of their constituents.
4. Future work
This project was awed to be of all school community interest. The continuity of the
realization of science fairs is a way of curricular enrichment, and a way to increase not only the success in terms of student’ learning of scientific subjects but also as the motivation, at larger, for learning. In addition science fairs are a way to enhance students’ responsibility and autonomy. In the following academic year the project will be developed within “Area de Projecto” classes (project classes), which will allow teachers to have a larger control of the whole process. It will be done an attempt to articulate the projects with other fields of study in interdisciplinary approaches.
Another aspect to be improved in the following science fair will be a previous definition of the jury which will choose the winners of the initiative.
There is an intention to open the event to elementary school students of the same institution but organizing this “junior” fair in a different room. This initiative will allow studying the degree of involvement of these students, the quality of projects, the time spent and the number of participations, attitudinal and learning gains.
We considered, and will work accordingly, very important to check if this quality of the work done in this project will be maintain in the following years. 5. Conclusions
Science fairs are of great interest to schools
and their students since it gives the opportunity to students to improve their skill and scientific knowledge working hands-on in an autonomous way. In order to ensure an enduring improvement of school’ science fairs: the activities should be developed for several years with an active continuity; ensure the participation and involvement of whole school parents and of the local community; and, a continuous sharing of knowledge and experiences on this subject between teachers.
6. References [1] http://portal.mec.gov.br/seb/index.php?opt
ion=content&task=view&id=634&Itemid=650 (July 5, 2008).
[2] Mancuso, R.: Feiras de Ciências: produção estudantil, avaliação, consequência. Revista digital de Educacion e Nuevas Tecnologias, nº6. April 2000.

International Journal on Hands-on Science [ISSN (print): 1646-8937; (online): 1646-8945] Received July 20, 2008; Accepted October 10, 2008. Volume 1, Number 2, December 2008.
The Hands-on Science Network’ 2008 ____________________________________________________________________________________________________________________
27
[3] Abernathy, T, e Vineyard, R. Academic Competitions in science: what are the rewards for students? The Clearing house. Volume 74. p. 269-276 (2000).
[4] www.feiradeciencias.com.br (July 5, 2008). [5] Sumrall, W. Nontradicional characteristics
of a successful science fair project. Science Scope. p 20-25. March 2004.
[6] Rose, J., Smith, A., Um, K., Demetrikopoulos, M. Reverse your science fair with educational partnerships. Science Scope. p. 16-19. March. 2004.
[7] Science Fair Plus: Reinventing an Old Favorite, K8. NSTA press. (2003).
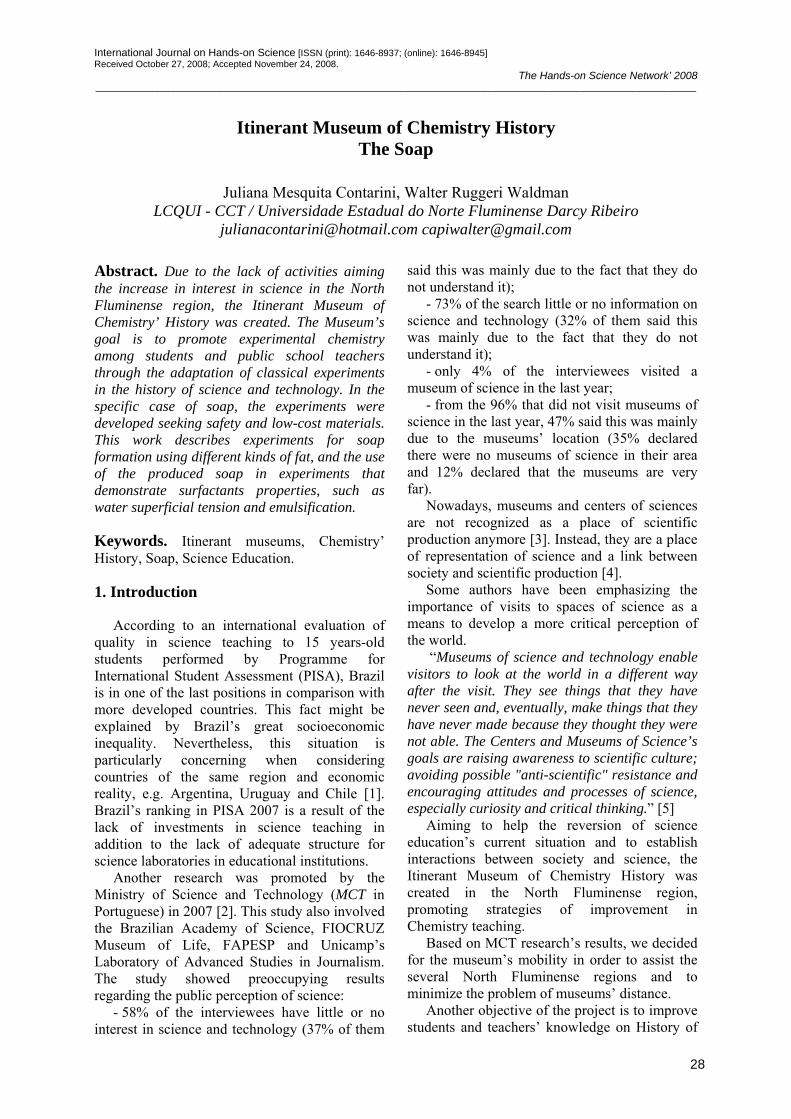
International Journal on Hands-on Science [ISSN (print): 1646-8937; (online): 1646-8945] Received October 27, 2008; Accepted November 24, 2008.
The Hands-on Science Network’ 2008 ____________________________________________________________________________________________________________________
28
Itinerant Museum of Chemistry History The Soap
Juliana Mesquita Contarini, Walter Ruggeri Waldman LCQUI - CCT / Universidade Estadual do Norte Fluminense Darcy Ribeiro
[email protected] [email protected]
Abstract. Due to the lack of activities aiming the increase in interest in science in the North Fluminense region, the Itinerant Museum of Chemistry’ History was created. The Museum’s goal is to promote experimental chemistry among students and public school teachers through the adaptation of classical experiments in the history of science and technology. In the specific case of soap, the experiments were developed seeking safety and low-cost materials. This work describes experiments for soap formation using different kinds of fat, and the use of the produced soap in experiments that demonstrate surfactants properties, such as water superficial tension and emulsification.
Keywords. Itinerant museums, Chemistry’ History, Soap, Science Education.
1. Introduction
According to an international evaluation of quality in science teaching to 15 years-old students performed by Programme for International Student Assessment (PISA), Brazil is in one of the last positions in comparison with more developed countries. This fact might be explained by Brazil’s great socioeconomic inequality. Nevertheless, this situation is particularly concerning when considering countries of the same region and economic reality, e.g. Argentina, Uruguay and Chile [1]. Brazil’s ranking in PISA 2007 is a result of the lack of investments in science teaching in addition to the lack of adequate structure for science laboratories in educational institutions.
Another research was promoted by the Ministry of Science and Technology (MCT in Portuguese) in 2007 [2]. This study also involved the Brazilian Academy of Science, FIOCRUZ Museum of Life, FAPESP and Unicamp’s Laboratory of Advanced Studies in Journalism. The study showed preoccupying results regarding the public perception of science:
- 58% of the interviewees have little or no interest in science and technology (37% of them
said this was mainly due to the fact that they do not understand it);
- 73% of the search little or no information on science and technology (32% of them said this was mainly due to the fact that they do not understand it);
- only 4% of the interviewees visited a museum of science in the last year;
- from the 96% that did not visit museums of science in the last year, 47% said this was mainly due to the museums’ location (35% declared there were no museums of science in their area and 12% declared that the museums are very far).
Nowadays, museums and centers of sciences are not recognized as a place of scientific production anymore [3]. Instead, they are a place of representation of science and a link between society and scientific production [4].
Some authors have been emphasizing the importance of visits to spaces of science as a means to develop a more critical perception of the world.
“Museums of science and technology enable visitors to look at the world in a different way after the visit. They see things that they have never seen and, eventually, make things that they have never made because they thought they were not able. The Centers and Museums of Science’s goals are raising awareness to scientific culture; avoiding possible "anti-scientific" resistance and encouraging attitudes and processes of science, especially curiosity and critical thinking.” [5]
Aiming to help the reversion of science education’s current situation and to establish interactions between society and science, the Itinerant Museum of Chemistry History was created in the North Fluminense region, promoting strategies of improvement in Chemistry teaching.
Based on MCT research’s results, we decided for the museum’s mobility in order to assist the several North Fluminense regions and to minimize the problem of museums’ distance.
Another objective of the project is to improve students and teachers’ knowledge on History of

International Journal on Hands-on Science [ISSN (print): 1646-8937; (online): 1646-8945] Received October 27, 2008; Accepted November 24, 2008.
The Hands-on Science Network’ 2008 ____________________________________________________________________________________________________________________
29
Sciences by developing specific activities on the topic. The activities for teachers will be trainings that are being implemented at the Regional Coordination of Education of North Fluminense Region. The training’s aim is the actual application of Science History in the teaching of sciences. The activities for students will be presentations of experiments related to the History of Chemistry, focusing on technologies that are part of students’ everyday life. Some research has been made on this area, namely the application of History of Science when teaching Electrochemistry topics (e.g. pile) presented positive results favoring the learning and increasing students’ interest during classes [6].The Itinerant Museum of Chemistry History nowadays works with four topics that are related to classic experiments in the History of Science and Technology. These topics are part of students’ everyday life and offer the possibility of approaching current Chemistry topics in high school. The topics are: candle, beer, soap and food conservation. The four topics were presented in Scientiarum Historia - 1st Congress of History of Sciences and Techniques and Epistemology.
1.1 Soap
In this study, the topic soap will be developed with experiments based on its history. The preparation of experiments will require materials such as ashes and soda. Support texts will be made to explain the chemistry involved. These texts will be used by students and by high school teachers who do not hold a Bachelor degree in Chemistry (in Brazil, only 13% of public school Chemistry teachers have Bachelor’s degree in Chemistry) [7].
Soap is a common topic in Chemistry lectures as it is approached several times in high school’s curriculum, i.e. organic chemistry, carbon chain’s nature, saponification reactions and intermolecular interactions.
In this article, experiments will be developed in order to help discussions regarding water superficial tension, formation of surfactant monolayer on water’s surface and emulsion agents.
1.1.1. Soap in health
Soap has a simple production process, which has happened since ancient times. It is worth to remark that changes in soap production
contributed to human being’s evolution in a direct way. Today it is practically impossible to imagine life without soap or similar products. When somebody from a tropical country does not take a shower one day, it is easily noticed by our sense of smell. It is important to remind that that bad smell that we feel is human being’s characteristic smell (that we hide with perfumes of soap and of deodorant that we use everyday).
Baths as hygiene practice and health of the body only happened in the 19th century, when science identified a series of diseases [8].
1.1.2. Reactions
In the most primitive way of making soap, the basic reagents were animal fat (for instance, ox tallow) and plant ashes. In animal fat there are several glicerides that, in alkaline environment, can be decomposed in glicerol and soap. The abundant alkaline environment in antiquity was found in plant ashes, i.e. the sodium and potassium carbonates.
Figure 1 illustrates a saponification reaction.
HO CH2
CHHO
CH2HO
R C
O
O CH2
CHOC
CH2
O
R
OC
O
R
+ 3 NaOH +
R C
OO- Na+
O- Na+C
O
R
O- Na+C
O
R
H2O
∆
GlicerinaSoda cáustica
Glicerídeo Sabão Figure 1: Representation of saponification reaction.
The alkaline hydrolisis of glicerides is called saponification reaction. Depending on the alkali used in this production, different types of soaps are obtained. When the reaction involves sodium hydroxide, or sodium carbonate, harder soaps are produced. If the reaction involves potassium hydroxide or potassium carbonate, the resulting soap is softer.
1.1.3. Soap chemical structure and properties
Soap has two different characteristics in their molecular structure: great apolar hydrocarbonic groups and a polar extremity (Figure 2).
H3C CH2 CH2 CH2 CH2 CH2 CH2 CH2 CO-Na+
O
Figure 2: Representation of a soap molecule.
The polar extremity can interact with water (also polar) and the hydrocarbonic chain interacts with the fat (also apolar).

International Journal on Hands-on Science [ISSN (print): 1646-8937; (online): 1646-8945] Received October 27, 2008; Accepted November 24, 2008.
The Hands-on Science Network’ 2008 ____________________________________________________________________________________________________________________
30
1.1.4. Soap as a cleaning agent
Water surface behaves as an elastic film. This property of liquids is called superficial tension, and it happens due to the attracting forces among the internal molecules of a liquid and the molecules of the surface. Soap reduces the water’s superficial tension, which is why soap is called a surfactant agent.
Soap has the property of concentrating oil particles in micelles, i.e. microscopic droplets of fat involved by soap molecules. Micelles are self-organized systems of soap molecules, or surfactants, and they have the following shape (Figure 3).
Figure 3: Representation of a micelle system.
In a micellar structure, the apolar part of soap
molecules is guided to the interior of the micelle (interacting with the fat), and the polar part is guided outside the micelle, interacting with water, as shown on Figure 3.
The micelles stay dispersed in water generating an oil emulsion. This happens because their coagulation is avoided by electronic repulsion.
2. Potash
The delay in industrial and scientific development in Brazil during colonial period was mainly due to D. Maria I, who prohibited manufacture activities in the colony in 1785. In 1808, the Portuguese royalty migrated to Brazil and finally some actions to stimulate technology, labor education and, consequently, scientific thought were undertaken.
In the 18th century, during the period when modern Chemistry appeared, Frei Jose Mariano de Conceição Veloso translated some books about industrial activities to Portuguese. Veloso was devoted to Botany, leading the first botanical expedition (1779-1790) through the interior of Rio de Janeiro state, being considered one of the main names of science and technology of the Portuguese empire in the end of the 18th century
and beginning of the 19th century. Veloso wrote books that helped the beginning industry, agriculture and natural history in Brazil. Veloso also described around four hundred new species of Brazilian plants.
In Brazil, one of the first written registrations related to soap was a book written by Veloso in 1798. The book’s main subject was large-scale production of potash, one of the main ingredients of soap. The book “Alographia dos álcalis fixos vegetais ou potassa, mineral ou soda e dos seus nitratos, segundo as melhores memórias estrangeiras, Que se tem escripto a este assunto parte primeira” described the species of Brazilian plants which are rich in potassium.
Veloso had the assignment of promoting potash industry in Brazil. Potash was very significant for the beginning industry because it was used in the production of several products, such as fabrics, glass, paper, sugar, medicines and dyes. On Veloso’s book, there are illustrations indicating plans for the construction of potash factories, that, when in operation, would yield profits for Portugal. The book also gives instructions to those who decided to set up potash factories in Brazil.
Until half of the 19th century, potash and soda were obtained from combustion of certain types of plants. After that, the practice disappeared with the exploration of Stassfurt’s mineral deposits in Germany in 1861. With Leblanc’s process, industrial production of sodium carbonate in the beginning of the 19th century [9].
3. Experiments
3.1. Soap preparation varying the fat type
Soap preparation was tested with varying types of fat, which showed that several different products can be obtained depending on the type of fat used as a reagent.
The different fat types were obtained in different ways. Some were bought in trades, such as ox tallow from slaughterhouses and soy oil from supermarkets. Others were extracted during the preparation of meals, such as chicken fat, obtained by separating the skin from the fat during its cleaning, and rib fat, obtained after the rib cooking.
To guarantee that all fats were in the same conditions, the reaction began with warm fat so that all of them were in liquid state (at room temperature, rib fat and ox tallow are in the solid

International Journal on Hands-on Science [ISSN (print): 1646-8937; (online): 1646-8945] Received October 27, 2008; Accepted November 24, 2008.
The Hands-on Science Network’ 2008 ____________________________________________________________________________________________________________________
31
state). In a beaker, twenty milliliters of warm fat were added. Afterwards, five grams of soda (bought at a construction store) were added. The mixture was slowly stirred for thirty minutes in a heating plate, at 100 °C. After the soap cooling, three different products were obtained (Figure 4).
Figure 4: Soap made from several kinds of fat. A) ox
tallow; B) soy oil; C) chicken fat and D) ox rib fat. The resulting soap presented different
properties. The order of hardness was (from the hardest to the least hard): ox tallow, rib fat, chicken fat and soy oil. This practice demonstrates that the various kinds of fat’s different properties (i.e. insaturation level, glycerin concentration and chain size) influence the final product’s physical properties. It is also possible to obtain soaps with intermediate characteristics, mixing different fat types.
Figure 5: Samples of soap foam from different kinds of soap, just shaken. From left to right: ox tallow, soy oil,
ox rib fat and chicken fat.
Figure 6: Samples of soap foam from different kinds of soap, one hour after the shaking. From left to right: ox
tallow, soy oil, ox rib fat and chicken fat.
With the aim of characterizing the foaming capacity of each piece of soap obtained, we made a quantitative comparison with water in test tubes. 0,1 grams of different pieces of soap were mixed in 5 ml of water. The resulting foam formed on the different pieces of soap is shown on Figure 5.
It is possible to observe that there is no significant difference in the amount of foam on different soap types. After one hour of rest, different stabilities of foam were observed (Figure 6). The foam from soy oil soap is less stable than the others.
This kind of practice, where reagent can be varied using materials from everyday life (i.e. the several fat types and different types of vegetable oils) and where the different products obtained are predictable and verifiable, stimulates the raising of students’ scientific curiosity.
3.2. Influence of water hardness in efficiency of the soap
This experiment was developed to approach the influence of metallic cations, namely calcium and magnesium in soap’s action. Different samples containing hard water and soap were analyzed, observing the variation in the amount of foam in function of Ca2+ concentration.
Water’s hardness is defined in function of calcium and magnesium concentration. Hard water prevents foam formation when soap is used [10]. Water hardness is a regional factor, because the calcium and magnesium ions concentration depends on the type of rock, e.g. calcareous rocks [11].
This kind of effect occurs because Ca2+ and Mg2+ ions interact with soap’s carboxilate, generating an insoluble substance before foam
A B
C D

International Journal on Hands-on Science [ISSN (print): 1646-8937; (online): 1646-8945] Received October 27, 2008; Accepted November 24, 2008.
The Hands-on Science Network’ 2008 ____________________________________________________________________________________________________________________
32
formation. A common problem involving hard water is the formation of insoluble deposits in water pipes and kettles [10].
In the hard water experiment, whitewash (used in constructions), plastic bottles, commercial detergent and coffee filter were used. Thirty grams of whitewash were added to 500 milliliters of water. This mixture was stirred and left to rest, decanting. In order to remove suspended impurities, the mixture was filtered twice using paper filter. The saturated and filtered solution was diluted several times in the following way: 250 mL of saturated solution was mixed with the same amount of water, diluting the solution’s concentration in 50%. 250 mL of this solution was separated for the experiment and the other 250 mL were diluted again in 250 mL of water. This procedure was repeated 7 times, producing solutions with concentrations of around 0,8% of the original solution (Table 1).
Table 1: Solutions used in the hard water experiment.
All solutions have 20 drops of detergent. Solutions Ca2+ concentrations
1 Saturated solution 2 50,0% of saturated solution 3 25,0% of saturated solution 4 12,5% of saturated solution 5 6,3% of saturated solution 6 3,2% of saturated solution 7 1,6% of saturated solution 8 0,8% of saturated solution 9 Water
3.2.2. Results and Discussion
By reducing the concentration of whitewash, an increase in the foam column was observed, as illustrated on Figure 7.
Figure 7: Picture of solutions 1, 2, 7, 8 and 9
immediately after agitation.
Four hours after agitation, two facts could be observed: 1) all foam formations are stable and 2) less foam is generated in function of Ca2+ concentration (Figure 8).
Figure 8: Picture of the solutions 1, 2, 7, 8 and 9 six hours after the agitation.
The metallic ions responsible for water hardness react with soap, precipitating the carboxilates that consume the soap (Figure 9).
Ca2+ + 2 CH3(CH2)16COO- → Ca(C18H35O2)2(s) Figure 9: Representation of the formation of Ca(HCO3)2.
3.3 Lava Lamp
A mixture of water and oil was used in a proportion of 1:3 (water:oil). An effervescent pill was added to generate an ascending effect and thus, the visual effect is similar to a lava lamp. A double of this system was made and, having the two bottles in front of students, we added soap to the aqueous environment in only one of the two bottles. The result illustrates, with interesting visual appeal, the influence of detergent in emulsion formation.
The materials utilized in the experiment were kitchen oil, potassium permanganate, 600mL plastic bottles, effervescent antacid, water and a syringe adapted with a hose. The solution contains a tip of spatula of KMnO4 in 200 milliliters of water. It is important to remark that permanganate is only used in this experiment due to its appealing color. Another colored substance could be used, if more easily available.
One hundred milliliters of the permanganate solution was added in each bottle. Afterwards, 300 milliliters of oil were added to each. In one of the bottles, some millimeters of a solution of detergent (15 ml in 85 ml of water), was added in aqueous phase with a syringe coupled to a fine hose (A).
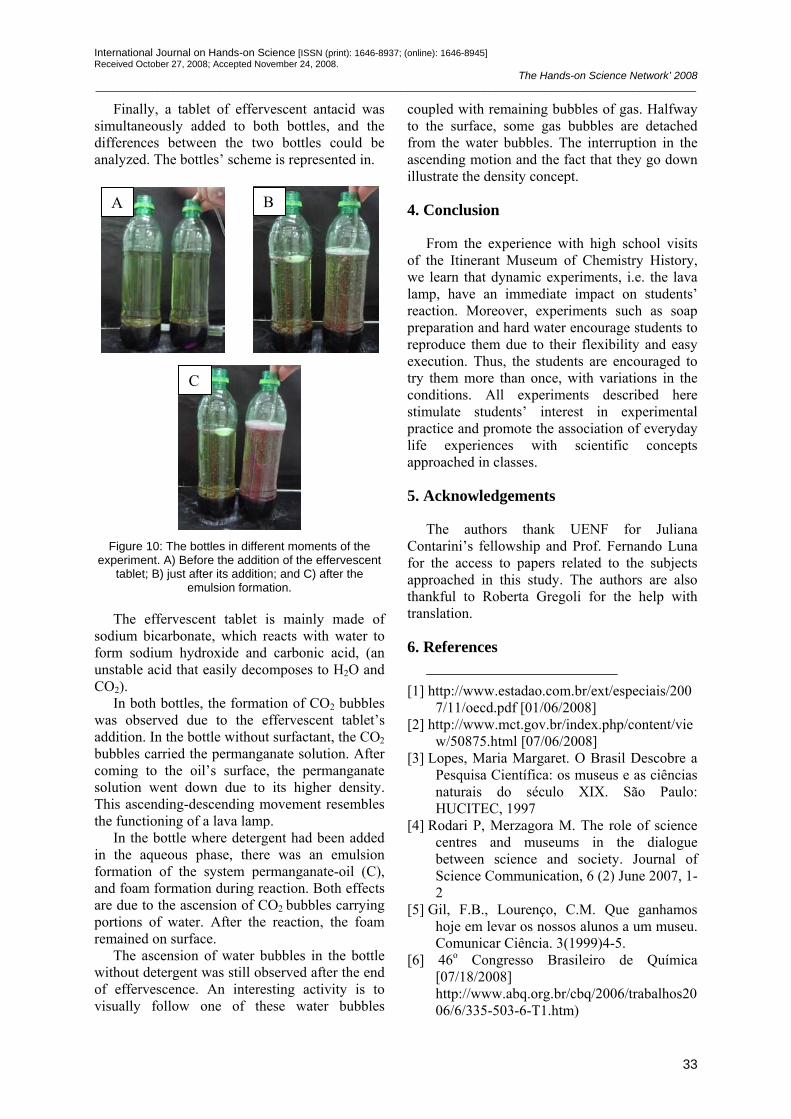
International Journal on Hands-on Science [ISSN (print): 1646-8937; (online): 1646-8945] Received October 27, 2008; Accepted November 24, 2008.
The Hands-on Science Network’ 2008 ____________________________________________________________________________________________________________________
33
Finally, a tablet of effervescent antacid was simultaneously added to both bottles, and the differences between the two bottles could be analyzed. The bottles’ scheme is represented in.
Figure 10: The bottles in different moments of the
experiment. A) Before the addition of the effervescent tablet; B) just after its addition; and C) after the
emulsion formation.
The effervescent tablet is mainly made of sodium bicarbonate, which reacts with water to form sodium hydroxide and carbonic acid, (an unstable acid that easily decomposes to H2O and CO2).
In both bottles, the formation of CO2 bubbles was observed due to the effervescent tablet’s addition. In the bottle without surfactant, the CO2 bubbles carried the permanganate solution. After coming to the oil’s surface, the permanganate solution went down due to its higher density. This ascending-descending movement resembles the functioning of a lava lamp.
In the bottle where detergent had been added in the aqueous phase, there was an emulsion formation of the system permanganate-oil (C), and foam formation during reaction. Both effects are due to the ascension of CO2 bubbles carrying portions of water. After the reaction, the foam remained on surface.
The ascension of water bubbles in the bottle without detergent was still observed after the end of effervescence. An interesting activity is to visually follow one of these water bubbles
coupled with remaining bubbles of gas. Halfway to the surface, some gas bubbles are detached from the water bubbles. The interruption in the ascending motion and the fact that they go down illustrate the density concept.
4. Conclusion
From the experience with high school visits of the Itinerant Museum of Chemistry History, we learn that dynamic experiments, i.e. the lava lamp, have an immediate impact on students’ reaction. Moreover, experiments such as soap preparation and hard water encourage students to reproduce them due to their flexibility and easy execution. Thus, the students are encouraged to try them more than once, with variations in the conditions. All experiments described here stimulate students’ interest in experimental practice and promote the association of everyday life experiences with scientific concepts approached in classes.
5. Acknowledgements
The authors thank UENF for Juliana Contarini’s fellowship and Prof. Fernando Luna for the access to papers related to the subjects approached in this study. The authors are also thankful to Roberta Gregoli for the help with translation.
6. References
[1] http://www.estadao.com.br/ext/especiais/2007/11/oecd.pdf [01/06/2008]
[2] http://www.mct.gov.br/index.php/content/view/50875.html [07/06/2008]
[3] Lopes, Maria Margaret. O Brasil Descobre a Pesquisa Científica: os museus e as ciências naturais do século XIX. São Paulo: HUCITEC, 1997
[4] Rodari P, Merzagora M. The role of science centres and museums in the dialogue between science and society. Journal of Science Communication, 6 (2) June 2007, 1-2
[5] Gil, F.B., Lourenço, C.M. Que ganhamos hoje em levar os nossos alunos a um museu. Comunicar Ciência. 3(1999)4-5.
[6] 46o Congresso Brasileiro de Química [07/18/2008] http://www.abq.org.br/cbq/2006/trabalhos2006/6/335-503-6-T1.htm)
A B
C
International Journal on Hands-on Science [ISSN (print): 1646-8937; (online): 1646-8945] Received October 27, 2008; Accepted November 24, 2008.
The Hands-on Science Network’ 2008 ____________________________________________________________________________________________________________________
34
[7] Ruiz A.I., Ramos M.N., Hingel M. Escassez
de Professores no Ensino Médio: Soluções Emergenciais e Estruturais. [06/07/2008] http://portal.mec.gov.br/cne/arquivos/pdf/escassez1.pdf
[8] Le Couteur, Penny, Burreson J. Os botões de Napoleão: as 17 moléculas que mudaram a história; translated by Maria Luiza X. de A. Borges. Editora Jorge Zahar. Rio de Janeiro: 2006. Cap. 1.
[9] Luna F. The production of Potash from plants in colonial Brazil as described in Fray Conceição Veloso’s Alographia dos Alkalis… Química Nova, accepted for publication.
[10] Lee JD. Quimica Inorgânica não tão Concisa, Editora Edgard Blücher translated from 5th Edition, chapter 1.
[11] Mol GS, Barbosa AB, Silva RR. Água Dura em Sabão mole. Química Nova na Escola 1995. 1995;2:32-33
International Journal on Hands-on Science [ISSN (print): 1646-8937; (online): 1646-8945] Received September 10, 2008; Accepted November 19, 2008. Volume 1, Number 2, December 2008.
The Hands-on Science Network’ 2008 ____________________________________________________________________________________________________________________
35
Metals Are Reductive But Some Are More Than Others
Sara Raquel Oliveira Guedes, José Manuel Pereira da Silva
Colégio Internato dos Carvalhos Rua do Padrão 83 – 4415 Pedroso, Portugal
[email protected] , [email protected]
Abstract. One of the first insights given to the students when they learn the reactions of oxidation-reduction is that metals are reductive. Apart from this important aspect of the chemical characteristics of metals, it is important to highlight that some are more reductive than others. The idea of an electrochemical potential of a chemical, and, in this case a metal, is used as a sign of how difficult it will be for this metal to undergo an oxidation when it is in contact with its peers. This experiment intends to prove that when two different metals are in contact through an electrolytic conductor, they produce an electro driven force which is attributed to the difference of the electrochemical potential existing among the present species. Due to this fact, and to prove the existing theories on this issue, and still in order to be able to compare results, an experimental work was carried on. By using some manual dexterity, very simple equipment was used and it allowed a successful experiment.
Keywords. Corrosion, Electrochemical, Experiments, Teaching. 1. Introduction
When consulting the standard reduction potential table, the students observe the existence of values of negative and positive potential which leads them to conclude on the spontaneity of the reactions that occur when different metals get in contact via an electrolyte [1].
In this experiment the students can verify the change of signal when they move the voltmeter forceps that were used to do the readings. This fact allows us to infer in which direction the redox reaction occurs [2].
Also, from this experiment, the need to establish conditions and choose an element to be used as a standard electrode emerged [3].
2. Methodology We can describe the methodology used based
on the tasks that were followed in every step: ⋅ Bibliographic research on the table of the
standard potentials of reduction; ⋅ Preparation of materials – mop stripes; ⋅ Preparation of the auxiliary equipment –
acrylic boards; ⋅ Preparation of the metals studied; ⋅ Preparation of ionic solutions of the metal
elements involved with the concentration 1 mol.dm-3; ⋅ Preparation of a saturated solution of
potassium nitrate. These experiments were carried on so as to
allow, with the results obtained, the building of the tables presented on item 4 of this work.
Also, a table with the values of pattern potential of reduction for the same chemical species studied was similarly built.
By comparing the experimental results with the pattern values that are internationally acknowledged, the students analyzed the reproducibility of the potential of the metals under study so that they could conclude on the pedagogical/didactical value of the experimental work.
3. The Equipment
Two 330 x 170 x 5-mm acrylic boards (Plexiglas – PMMA) were used. They were holed with a Ø = 5mm screw so that, later, fixing screws can be introduced, according to figure 1.
Figure 1. Acrylic board
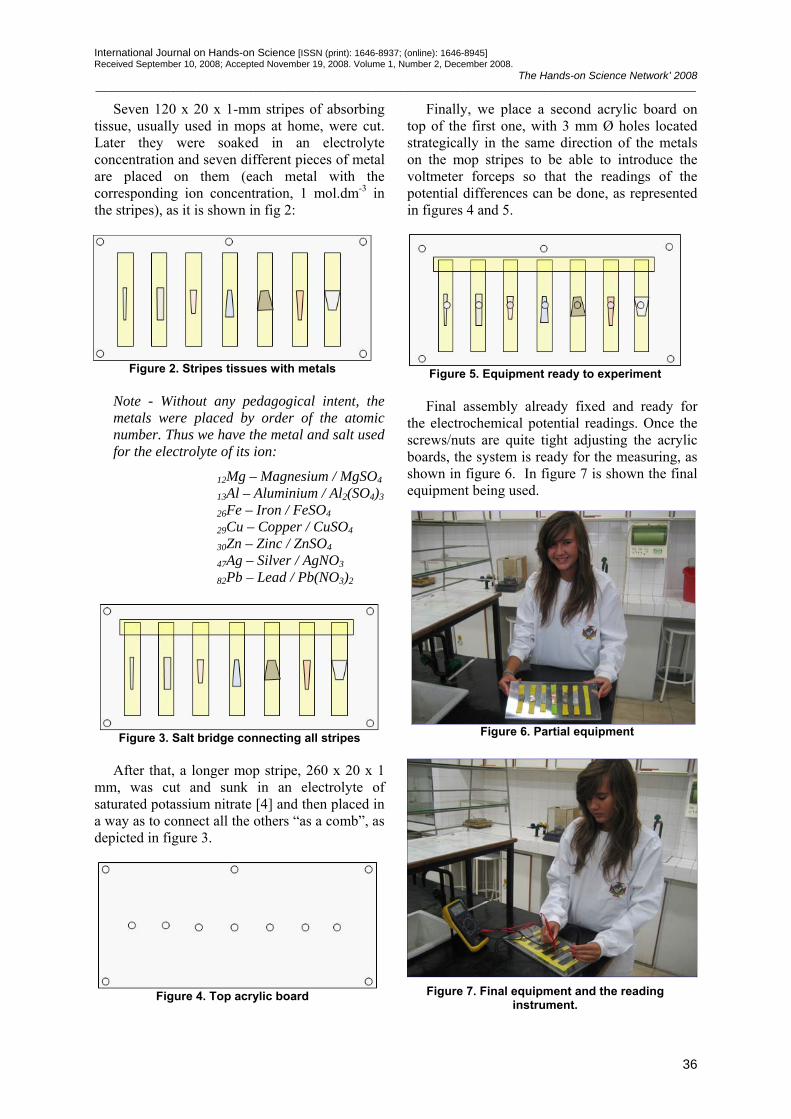
International Journal on Hands-on Science [ISSN (print): 1646-8937; (online): 1646-8945] Received September 10, 2008; Accepted November 19, 2008. Volume 1, Number 2, December 2008.
The Hands-on Science Network’ 2008 ____________________________________________________________________________________________________________________
36
Seven 120 x 20 x 1-mm stripes of absorbing tissue, usually used in mops at home, were cut. Later they were soaked in an electrolyte concentration and seven different pieces of metal are placed on them (each metal with the corresponding ion concentration, 1 mol.dm-3 in the stripes), as it is shown in fig 2:
Figure 2. Stripes tissues with metals
Note - Without any pedagogical intent, the metals were placed by order of the atomic number. Thus we have the metal and salt used for the electrolyte of its ion:
12Mg – Magnesium / MgSO4 13Al – Aluminium / Al2(SO4)3
26Fe – Iron / FeSO4 29Cu – Copper / CuSO4 30Zn – Zinc / ZnSO4 47Ag – Silver / AgNO3 82Pb – Lead / Pb(NO3)2
After that, a longer mop stripe, 260 x 20 x 1
mm, was cut and sunk in an electrolyte of saturated potassium nitrate [4] and then placed in a way as to connect all the others “as a comb”, as depicted in figure 3.
Figure 4. Top acrylic board
Finally, we place a second acrylic board on top of the first one, with 3 mm Ø holes located strategically in the same direction of the metals on the mop stripes to be able to introduce the voltmeter forceps so that the readings of the potential differences can be done, as represented in figures 4 and 5.
Figure 5. Equipment ready to experiment
Final assembly already fixed and ready for the electrochemical potential readings. Once the screws/nuts are quite tight adjusting the acrylic boards, the system is ready for the measuring, as shown in figure 6. In figure 7 is shown the final equipment being used.
Figure 6. Partial equipment
Figure 7. Final equipment and the reading
instrument.
Figure 3. Salt bridge connecting all stripes
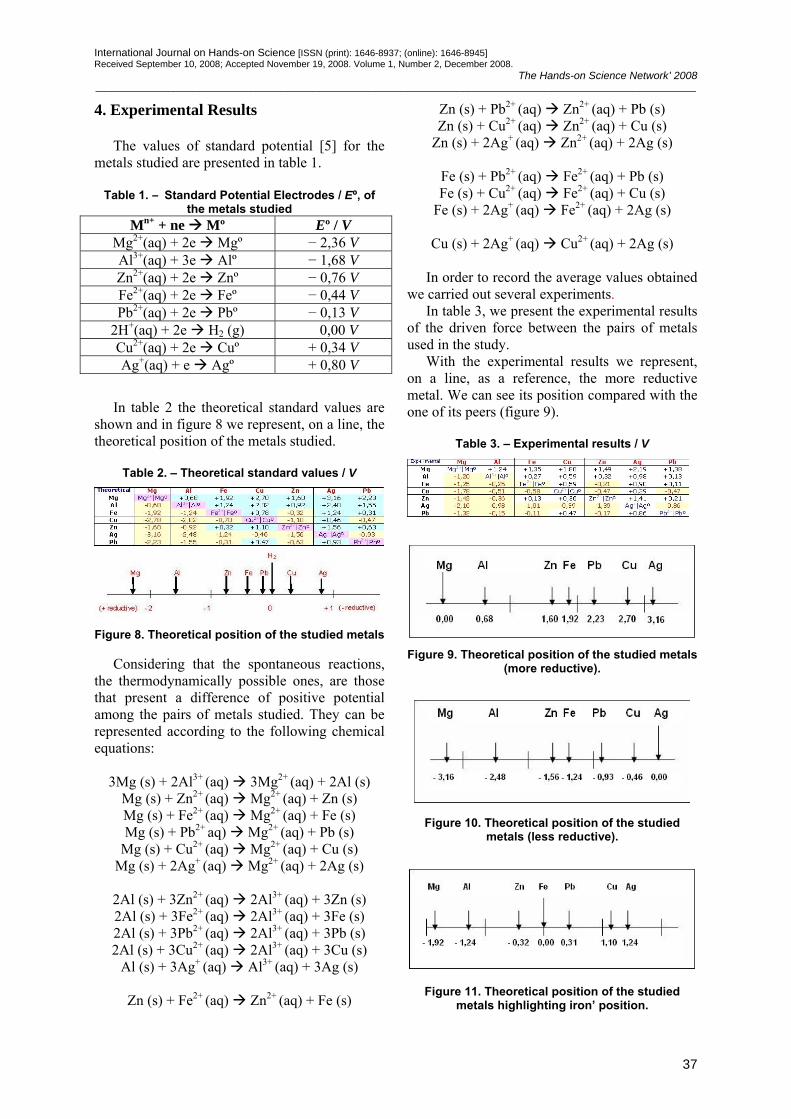
International Journal on Hands-on Science [ISSN (print): 1646-8937; (online): 1646-8945] Received September 10, 2008; Accepted November 19, 2008. Volume 1, Number 2, December 2008.
The Hands-on Science Network’ 2008 ____________________________________________________________________________________________________________________
37
4. Experimental Results
The values of standard potential [5] for the metals studied are presented in table 1.
Table 1. – Standard Potential Electrodes / Eº, of the metals studied
Mn+ + ne Mº Eº / V Mg2+(aq) + 2e Mgº − 2,36 V Al3+(aq) + 3e Alº − 1,68 V Zn2+(aq) + 2e Znº − 0,76 V Fe2+(aq) + 2e Feº − 0,44 V Pb2+(aq) + 2e Pbº − 0,13 V
2H+(aq) + 2e H2 (g) 0,00 V Cu2+(aq) + 2e Cuº + 0,34 V Ag+(aq) + e Agº + 0,80 V
In table 2 the theoretical standard values are shown and in figure 8 we represent, on a line, the theoretical position of the metals studied.
Table 2. – Theoretical standard values / V
Figure 8. Theoretical position of the studied metals
Considering that the spontaneous reactions,
the thermodynamically possible ones, are those that present a difference of positive potential among the pairs of metals studied. They can be represented according to the following chemical equations:
3Mg (s) + 2Al3+ (aq) 3Mg2+ (aq) + 2Al (s)
Mg (s) + Zn2+ (aq) Mg2+ (aq) + Zn (s) Mg (s) + Fe2+ (aq) Mg2+ (aq) + Fe (s) Mg (s) + Pb2+ aq) Mg2+ (aq) + Pb (s)
Mg (s) + Cu2+ (aq) Mg2+ (aq) + Cu (s) Mg (s) + 2Ag+ (aq) Mg2+ (aq) + 2Ag (s)
2Al (s) + 3Zn2+ (aq) 2Al3+ (aq) + 3Zn (s) 2Al (s) + 3Fe2+ (aq) 2Al3+ (aq) + 3Fe (s) 2Al (s) + 3Pb2+ (aq) 2Al3+ (aq) + 3Pb (s) 2Al (s) + 3Cu2+ (aq) 2Al3+ (aq) + 3Cu (s)
Al (s) + 3Ag+ (aq) Al3+ (aq) + 3Ag (s)
Zn (s) + Fe2+ (aq) Zn2+ (aq) + Fe (s)
Zn (s) + Pb2+ (aq) Zn2+ (aq) + Pb (s) Zn (s) + Cu2+ (aq) Zn2+ (aq) + Cu (s)
Zn (s) + 2Ag+ (aq) Zn2+ (aq) + 2Ag (s)
Fe (s) + Pb2+ (aq) Fe2+ (aq) + Pb (s) Fe (s) + Cu2+ (aq) Fe2+ (aq) + Cu (s)
Fe (s) + 2Ag+ (aq) Fe2+ (aq) + 2Ag (s)
Cu (s) + 2Ag+ (aq) Cu2+ (aq) + 2Ag (s) In order to record the average values obtained
we carried out several experiments. In table 3, we present the experimental results
of the driven force between the pairs of metals used in the study.
With the experimental results we represent, on a line, as a reference, the more reductive metal. We can see its position compared with the one of its peers (figure 9).
Table 3. – Experimental results / V
Figure 9. Theoretical position of the studied metals
(more reductive).
Figure 10. Theoretical position of the studied metals (less reductive).
Figure 11. Theoretical position of the studied metals highlighting iron’ position.
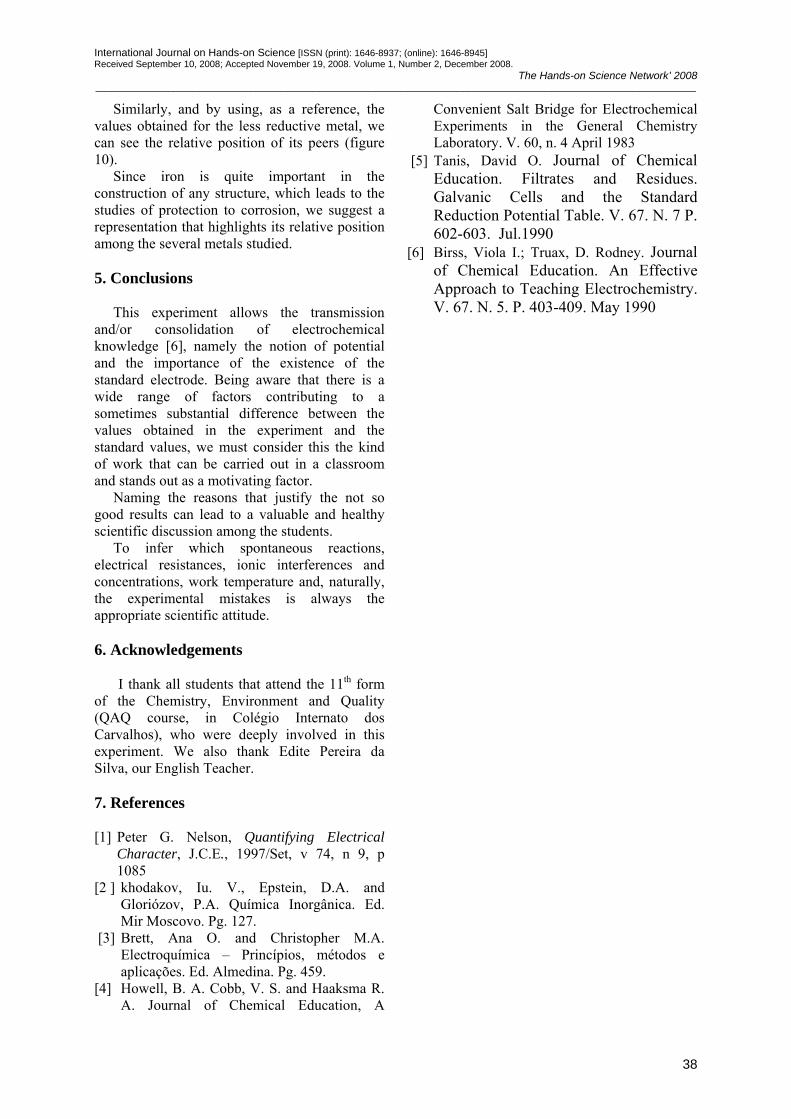
International Journal on Hands-on Science [ISSN (print): 1646-8937; (online): 1646-8945] Received September 10, 2008; Accepted November 19, 2008. Volume 1, Number 2, December 2008.
The Hands-on Science Network’ 2008 ____________________________________________________________________________________________________________________
38
Similarly, and by using, as a reference, the values obtained for the less reductive metal, we can see the relative position of its peers (figure 10).
Since iron is quite important in the construction of any structure, which leads to the studies of protection to corrosion, we suggest a representation that highlights its relative position among the several metals studied. 5. Conclusions
This experiment allows the transmission and/or consolidation of electrochemical knowledge [6], namely the notion of potential and the importance of the existence of the standard electrode. Being aware that there is a wide range of factors contributing to a sometimes substantial difference between the values obtained in the experiment and the standard values, we must consider this the kind of work that can be carried out in a classroom and stands out as a motivating factor.
Naming the reasons that justify the not so good results can lead to a valuable and healthy scientific discussion among the students.
To infer which spontaneous reactions, electrical resistances, ionic interferences and concentrations, work temperature and, naturally, the experimental mistakes is always the appropriate scientific attitude.
6. Acknowledgements
I thank all students that attend the 11th form
of the Chemistry, Environment and Quality (QAQ course, in Colégio Internato dos Carvalhos), who were deeply involved in this experiment. We also thank Edite Pereira da Silva, our English Teacher. 7. References [1] Peter G. Nelson, Quantifying Electrical
Character, J.C.E., 1997/Set, v 74, n 9, p 1085
[2 ] khodakov, Iu. V., Epstein, D.A. and Gloriózov, P.A. Química Inorgânica. Ed. Mir Moscovo. Pg. 127.
[3] Brett, Ana O. and Christopher M.A. Electroquímica – Princípios, métodos e aplicações. Ed. Almedina. Pg. 459.
[4] Howell, B. A. Cobb, V. S. and Haaksma R. A. Journal of Chemical Education, A
Convenient Salt Bridge for Electrochemical Experiments in the General Chemistry Laboratory. V. 60, n. 4 April 1983
[5] Tanis, David O. Journal of Chemical Education. Filtrates and Residues. Galvanic Cells and the Standard Reduction Potential Table. V. 67. N. 7 P. 602-603. Jul.1990
[6] Birss, Viola I.; Truax, D. Rodney. Journal of Chemical Education. An Effective Approach to Teaching Electrochemistry. V. 67. N. 5. P. 403-409. May 1990
International Journal on Hands-on Science [ISSN (print): 1646-8937; (online): 1646-8945] Received October 10, 2008; Accepted October 29, 2008.
The Hands-on Science Network’ 2008 ____________________________________________________________________________________________________________________
39
Respiration and photosynthesis in context: Experiments demonstrating the relationship between the two physiological processes
Julia Jentsch, Helga Theurer and Horst Bannwarth
University of Cologne, Institute for Biology and Didactics
Gronewaldstr.2, 50931 Köln (Cologne), Germany [email protected]
Abstract. The fact that plants are living organisms will be shown to children by simple experiments with the indicator bromthymol blue, which changes the colour from blue to yellow within one hour during respiration. Additionally to the use of indicators the fact that respiration and photosynthesis are opposite physiological processes can be demonstrated by an experiment measuring the electric potential between the respiration of peas and the photosynthesis of aquatic plants (Elodea canadensis) connected together with a voltmeter. The oxygen consumption during respiration develops a minus (-) pole and the oxygen production during photosynthesis a plus (+) pole. Keywords. Indicators, measurement of the electric potential, photosynthesis, respiration 1. Introduction
The most important metabolic processes in living organisms are respiration and photosynthesis [1]. Both are interconnected in many ways (Fig. 2). In a single plant cell, in lichens (Fig. 10), in plant galls (Fig. 11), in natural habitats and in ecosystems they are united in complex biological systems. At school photosynthesis and respiration often are taught separately. But on the other hand they belong together and one should not forget that they are correlated. The emergence concept of modern biology means that the whole, intact and complete system is more than the sum of the parts. From these considerations one may conclude that photosynthesis and respiration should be introduced in context [2]. This may be done in schools with the classic Priestley-experiment, but the problem is, that this experiment cannot be carried out in schools because one should not let die animals by this way (Fig. 9).
On the other hand animals are able to dissimilate and plants to assimilate in different separate organisms in natural habitats. In addition photosynthesis and respiration are opposite physiological pathways separated in isolated compartments like chloroplasts and mitochondria and maintain a metabolic equilibrium in a steady state in a plant cell. Chloroplasts and mitochondria have common features according to the endosymbiotic theory of evolution. They are surrounded by a double membrane layer and are able to synthesize ATP using a proton gradient after accumulation of protons between these two membranes according the concept of Peter Mitchell (Fig. 7). Halobacteria similarly transport protons outside the outer cell membrane comparable to chloroplasts and mitochondria. This outer membrane corresponds to the inner membrane of chloroplasts and mitochondria (Fig. 8).
We will present here an experiment showing the decrease of the pH - value in the surrounding medium when halobacteria are exposed to light. The acidification is due to the light driven proton transport from inside to outside.
Both physiological processes, photosynthesis and respiration, are not visible and only in the rarest cases detectable by our senses. The physiology knows however informative and elucidating experiments, which permit it to make important aspects of such life procedures visible.
Since photosynthesis and respiration both are opposite physiological pathways their effects may be compensated in some situations. In this case one cannot expect to detect any change of an indicator colour in the surrounding medium of a water plant. Alternatively photosynthesis and respiration can easily be studied together in a combination of a photosynthesizing O2 producing system with an O2 consuming system (Fig. 6) by a simple experiment measuring the electric potential between both [3].

International Journal on Hands-on Science [ISSN (print): 1646-8937; (online): 1646-8945] Received October 10, 2008; Accepted October 29, 2008.
The Hands-on Science Network’ 2008 ____________________________________________________________________________________________________________________
40
2. Methodology In general results may be obtained by
experimenting, by observing, comparing and combining. First, some experimental approaches will be presented and later on in the following further expanding aspects will be included into the considerations in order to elucidate the importance and advantage of the view of seeing photosynthesis and respiration in context.
2.1.1 Respiration of organisms: Basic process of life
Questions: How can one show that something
lives? Is for instance life in branch pieces of shrubs in the winter time (Fig. 1)? Do plant roots live (Fig. 5)?
Material: 2 measuring cylinders 250 mL - Erlenmeyer flasks, 50 mL and 250 mL - Short test tubes – Drinking straw.
Chemicals: 1 L of saturated gypsum (calcium sulphate CaSO4) solution coloured with bromthymol blue (0.1% in 20% ethanol) or phenolphthalein (1% in ethanol): Adjust the pH value with a diluted caustic soda solution, c(NaOH) = 0,01 mol L–1 in such a way that the colour change takes place immediately from yellow to blue or from red to colourless with minimal acid addition. Therefore solutions should be added drop by drop.
Test objects: Roots of the wild flower plants from gardens, tufts of grass, Petty Spurge (Euphorbia peplus) or Annual Mercury (Mercurialis annua). The plants are loosened with root with the help of a small grave shovel carefully from the ground and washed off afterwards with tap water. - Finger-long grey, brown or red branch pieces (Fig.1) of Black Elder (Sambucus nigra), Red Dogwood (Cornus sanguinea) with crust pores (“lenticells”) as well as green branch pieces of Golden Bell (Forsythia spp.), Jews Mantle (Kerria japonica), Blackberry (Rubus fruticosus) or Rose (Rosa spp.) without crust pores (“lenticells”).
All branch pieces were well washed off with tap-water before the experiment.
Procedure: The plants are given with the roots to the measuring cylinders filled with test solution. The branch pieces are also placed in test tubes with test solution. A measuring cylinder with test solution without plant served as control. One also can place recognizably dead branch pieces or roots into the solutions for
comparison. The results with the branch pieces are noted in a table (Table 1), in that the colour of the branches, the occurrence of crust pores or “lenticells” and the time until to the colour change is registered. Subsequently, one can give the comparison solutions in Erlenmeyer flasks and blow with the help of a drinking straw carefully to exhaust bubbles into the solutions.
2.1.2 Respiration and photosynthesis: A cycle as in nature
Question: Respiration and photosynthesis are
the most important physiological life processes in nature. They are opposite physiological pathways, so that they can be joined to a cycle (Fig. 2). Thus oxidants (O2) are consumed by respiration and set free again by photosynthesis. The opposite direction of both processes may be demonstrated by indicator changes or with the help of a potential measurement in the following experiment. How may be demonstrated in a model experiment based on the consumption and formation of oxidizing agents (oxygen O2) that respiration and photosynthesis are included in a natural cycle (Fig. 6)?
Material: Voltmeter - Measuring clips (alligator clips) with cables - U-bend with porous glass -frit - Graphite electrodes - Lamp (200-250 Watts).
Chemicals: Sulphate - rich mineral water. Test objects: For respiration: germinated
seeds, e.g. peas (Pisum sativum) in mineral water or alternatively yeast suspension (Saccharomyces cerevisiae) in glucose solution (1%). For photosynthesis: Aquatic plant, e.g. Canadian Waterweed (Elodea spp.) in mineral water.
Procedure: Respiration is prepared in the left part of the U-bend, photosynthesis in the right part. Connect the voltmeter and note the voltage levels. After 10 min the photosynthesis is started by exposition with the light of a lamp. 2.1.3 Sun and life: light driven proton transport by halobacteria
Question: Life needs necessarily energy of the
sun. This energy is first taken up by plants. The primary step is the transformation of light energy into electric energy in certain biomembranes, which contain photoreceptors (e.g. chlorophyll). The moved electrons provide the operating proton pumps with energy. By this light-driven proton transport H+-ions are transported outward

International Journal on Hands-on Science [ISSN (print): 1646-8937; (online): 1646-8945] Received October 10, 2008; Accepted October 29, 2008.
The Hands-on Science Network’ 2008 ____________________________________________________________________________________________________________________
41
into the surrounding medium. The resulting proton gradient at the external membranes is used to synthesize ATP (chemiosmosis). How can the light driven proton export in the external medium be experimentally demonstrated?
Material: pH value measuring instrument with electrode for automatic recording (e.g. Cassy system, pH box No. 524035, Leybold,Hürth,Germany) - 250 mL Erlenmeyer flasks – graduate measuring pipette 5 and 10 mL.
Chemicals: 1L saline solution, c(NaCl) = 4 mol L–1.
Test objects: Suspension culture of halobacteria (Halobacterium halobium) in 4 mol L–1 solution of common salt NaCl or alternatively suspension culture of blue bacteria (blue-green “algae “, cyanobacteria) in tap - water. Procurement reference: One may get Halobacteria from journeys to salt lakes (e.g. Dead Sea), but also from research institutes.
Procedure: As much material is given with a pipette from the halobacteria stock culture to an Erlenmeyer flask filled with saline solution that straight all light is absorbed. The cells from halobacteria are illuminated with a lamp. The pH value is measured in the medium by an electrode connected with an instrument for graphical registration. The measured values are noted and the measuring curve is projected to the wall (Fig. 8). 3. Results 3.1 Experiments 3.1.1 Respiration of organisms: Basic process of life
Observation: Within 1 hour, often already
after approximately 20 minutes, it may be observed a clear colour change of blue to yellow with bromthymol blue and of red to colourless with phenolphthalein in direct proximity of the roots or the branch pieces. With the green branches (Jews Mantle, Rose or Blackberry) the colour change takes place later than with branches with “lenticells”. The colour change is substantially faster, if one gives breathing air with a drinking straw to the solutions.
Explanation: In all cases acid is excreted over the surface by the living plant parts. To a large extent this is due to carbonic acid or carbon dioxide, which is set free by the respiration. Additionally in the calcium sulphate solutions
Ca2+ -ions were exchanged against H+ - ions. Thus the colour change takes place more rapidly in solutions with calcium sulphate salt (Fig. 5).The green branches produce fewer carbon dioxide CO2 quantities than the other branches with crust pores. Partially photosynthesis may compensate the respiration effect. The crust pores (“lenticells”) are to be interpreted as structures in connection with the respiration and the gas exchange (structure function relationships in biology). As respiration and ion exchange are physiological processes, these experiments are suitable for the demonstration of life phenomena. The experiment with the exhausted air bubbles points out the comparison of human respiration with the respiration of plants and underlines the importance of the respiration for all organisms including humans.
3.1.2 Respiration and photosynthesis: A cycle as in nature
Observation: An electric potential is to be
determined between both sides, which increases due to the living processes of the participating organisms during the experiment. When photosynthesis is started a clearly stronger increase of the measured electric potential is observed.
Explanation: The oxygen on both sides is differently used by the respiration. Therefore the output potential begins to change. When photosynthesis is started oxygen is produced, so that on the side of the photosynthesis a positive pole develops. In the respiration part the oxygen dissolved in the water is consumed. This may be the onset of fermentation and perhaps even of the production of reducing agents (H2S, NH3). Thus a negative pole forms. The changes of the potential are therefore direct consequences of physiological events. They are based on physiological processes such as oxygen consumption and oxygen production (Fig. 6).
3.1.3 Sun and life: light driven proton transport by halobacteria
Observation: It is recognizable from the
course of the curve that the pH value drops slightly during illumination within 1 hour.
Explanation: Under the effect of the light electrons are moved (see solar - pocket calculators). With the kinetic energy of the electrons protons from the cells of the
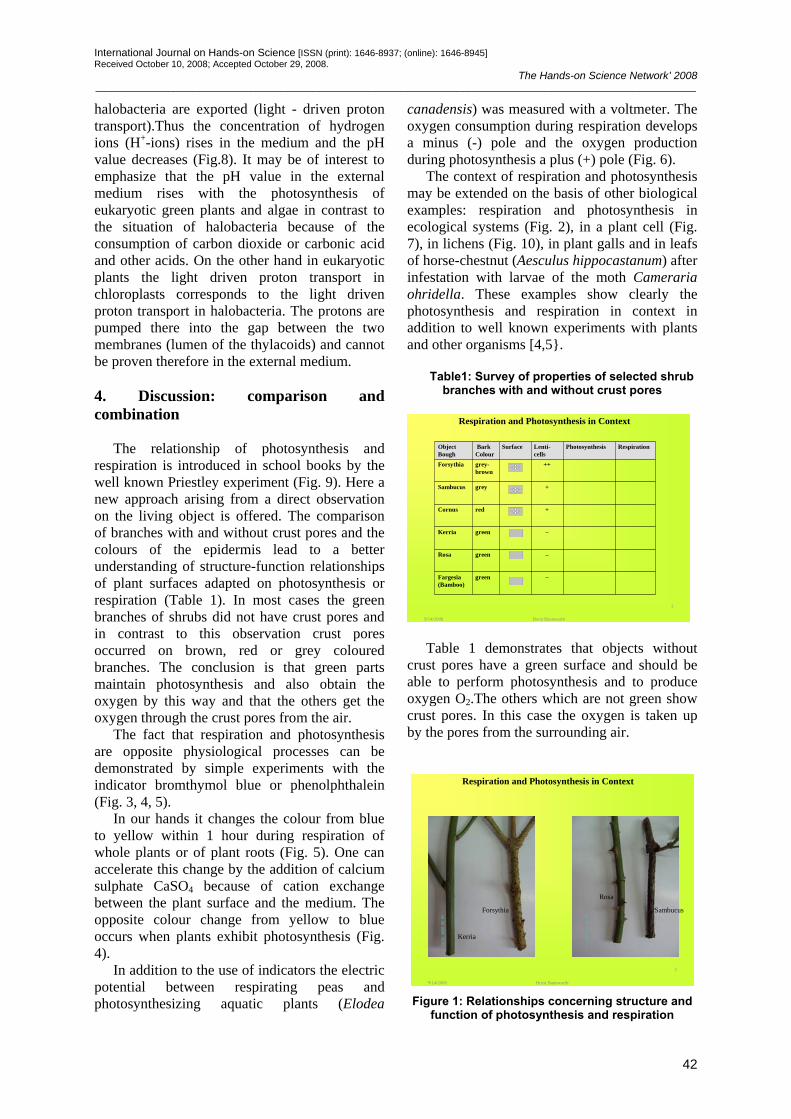
International Journal on Hands-on Science [ISSN (print): 1646-8937; (online): 1646-8945] Received October 10, 2008; Accepted October 29, 2008.
The Hands-on Science Network’ 2008 ____________________________________________________________________________________________________________________
42
halobacteria are exported (light - driven proton transport).Thus the concentration of hydrogen ions (H+-ions) rises in the medium and the pH value decreases (Fig.8). It may be of interest to emphasize that the pH value in the external medium rises with the photosynthesis of eukaryotic green plants and algae in contrast to the situation of halobacteria because of the consumption of carbon dioxide or carbonic acid and other acids. On the other hand in eukaryotic plants the light driven proton transport in chloroplasts corresponds to the light driven proton transport in halobacteria. The protons are pumped there into the gap between the two membranes (lumen of the thylacoids) and cannot be proven therefore in the external medium.
4. Discussion: comparison and combination
The relationship of photosynthesis and
respiration is introduced in school books by the well known Priestley experiment (Fig. 9). Here a new approach arising from a direct observation on the living object is offered. The comparison of branches with and without crust pores and the colours of the epidermis lead to a better understanding of structure-function relationships of plant surfaces adapted on photosynthesis or respiration (Table 1). In most cases the green branches of shrubs did not have crust pores and in contrast to this observation crust pores occurred on brown, red or grey coloured branches. The conclusion is that green parts maintain photosynthesis and also obtain the oxygen by this way and that the others get the oxygen through the crust pores from the air.
The fact that respiration and photosynthesis are opposite physiological processes can be demonstrated by simple experiments with the indicator bromthymol blue or phenolphthalein (Fig. 3, 4, 5).
In our hands it changes the colour from blue to yellow within 1 hour during respiration of whole plants or of plant roots (Fig. 5). One can accelerate this change by the addition of calcium sulphate CaSO4 because of cation exchange between the plant surface and the medium. The opposite colour change from yellow to blue occurs when plants exhibit photosynthesis (Fig. 4).
In addition to the use of indicators the electric potential between respirating peas and photosynthesizing aquatic plants (Elodea
canadensis) was measured with a voltmeter. The oxygen consumption during respiration develops a minus (-) pole and the oxygen production during photosynthesis a plus (+) pole (Fig. 6).
The context of respiration and photosynthesis may be extended on the basis of other biological examples: respiration and photosynthesis in ecological systems (Fig. 2), in a plant cell (Fig. 7), in lichens (Fig. 10), in plant galls and in leafs of horse-chestnut (Aesculus hippocastanum) after infestation with larvae of the moth Cameraria ohridella. These examples show clearly the photosynthesis and respiration in context in addition to well known experiments with plants and other organisms [4,5}.
Table1: Survey of properties of selected shrub
branches with and without crust pores
Respiration and Photosynthesis in Context
ObjectBough
Bark Colour
Surface Lenti-cells
Photosynthesis Respiration
Forsythia grey-brown
++
Sambucus grey +
Cornus red +
Kerria green –
Rosa green –
Fargesia(Bamboo)
green –
9/14/2008
3
Horst Bannwarth Table 1 demonstrates that objects without
crust pores have a green surface and should be able to perform photosynthesis and to produce oxygen O2.The others which are not green show crust pores. In this case the oxygen is taken up by the pores from the surrounding air.
Respiration and Photosynthesis in Context
Kerria
Forsythia Sambucus
Rosa
9/14/2008
2
Horst Bannwarth Figure 1: Relationships concerning structure and
function of photosynthesis and respiration
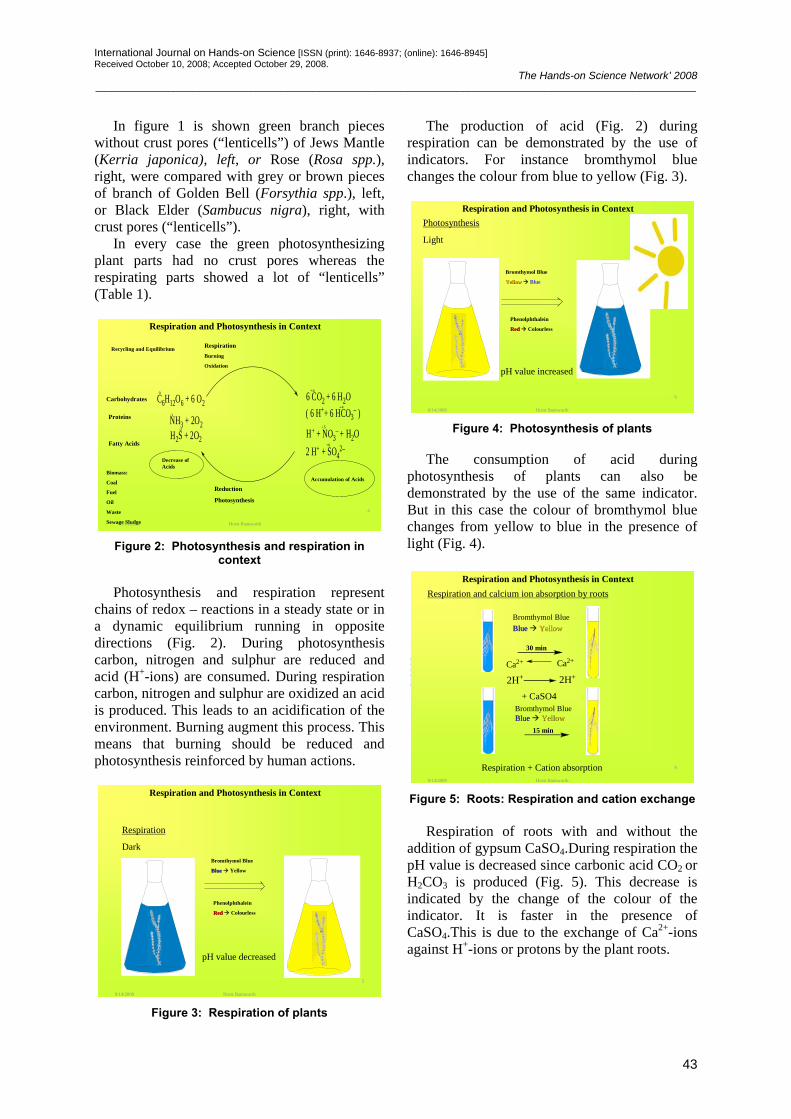
International Journal on Hands-on Science [ISSN (print): 1646-8937; (online): 1646-8945] Received October 10, 2008; Accepted October 29, 2008.
The Hands-on Science Network’ 2008 ____________________________________________________________________________________________________________________
43
In figure 1 is shown green branch pieces
without crust pores (“lenticells”) of Jews Mantle (Kerria japonica), left, or Rose (Rosa spp.), right, were compared with grey or brown pieces of branch of Golden Bell (Forsythia spp.), left, or Black Elder (Sambucus nigra), right, with crust pores (“lenticells”).
In every case the green photosynthesizing plant parts had no crust pores whereas the respirating parts showed a lot of “lenticells” (Table 1).
Respiration and Photosynthesis in Context
Recycling and Equilibrium
Carbohydrates
Proteins
Fatty Acids
Decrease of Acids
Biomass:
Coal
Fuel
Oil
Waste
Sewage Sludge
Respiration Burning
Oxidation
Reduction
Photosynthesis
C6H12O6 + 6 O2 6 CO2 + 6 H2O( 6 H++ 6 HCO3
– )NH3 + 2O2H2S + 2O2 H+ + NO3
– + H2O2 H+ + SO4
2–
0
-2
+4
+5
+6
Accumulation of Acids
+4
-3
9/14/2008
4
Horst Bannwarth Figure 2: Photosynthesis and respiration in
context
Photosynthesis and respiration represent chains of redox – reactions in a steady state or in a dynamic equilibrium running in opposite directions (Fig. 2). During photosynthesis carbon, nitrogen and sulphur are reduced and acid (H+-ions) are consumed. During respiration carbon, nitrogen and sulphur are oxidized an acid is produced. This leads to an acidification of the environment. Burning augment this process. This means that burning should be reduced and photosynthesis reinforced by human actions.
Respiration and Photosynthesis in Context
Respiration
Dark
pH value decreased
Bromthymol Blue
BlueBlue Yellow
Phenolphthalein
RedRed Colourless
9/14/2008
5
Horst Bannwarth Figure 3: Respiration of plants
The production of acid (Fig. 2) during
respiration can be demonstrated by the use of indicators. For instance bromthymol blue changes the colour from blue to yellow (Fig. 3).
Respiration and Photosynthesis in ContextPhotosynthesis
Light
Bromthymol Blue
YellowYellow Blue
Phenolphthalein
RedRed Colourless
pH value increased
9/14/2008
6
Horst Bannwarth Figure 4: Photosynthesis of plants
The consumption of acid during
photosynthesis of plants can also be demonstrated by the use of the same indicator. But in this case the colour of bromthymol blue changes from yellow to blue in the presence of light (Fig. 4).
Respiration and Photosynthesis in ContextRespiration and calcium ion absorption by roots
Bromthymol BlueBlueBlue YellowYellow
30 min
Ca2+ Ca2+
+ CaSO4Bromthymol BlueBlueBlue YellowYellow
15 min
Respiration + Cation absorption
2H+ 2H+
9/14/2008
8
Horst Bannwarth Figure 5: Roots: Respiration and cation exchange
Respiration of roots with and without the
addition of gypsum CaSO4.During respiration the pH value is decreased since carbonic acid CO2 or H2CO3 is produced (Fig. 5). This decrease is indicated by the change of the colour of the indicator. It is faster in the presence of CaSO4.This is due to the exchange of Ca2+-ions against H+-ions or protons by the plant roots.
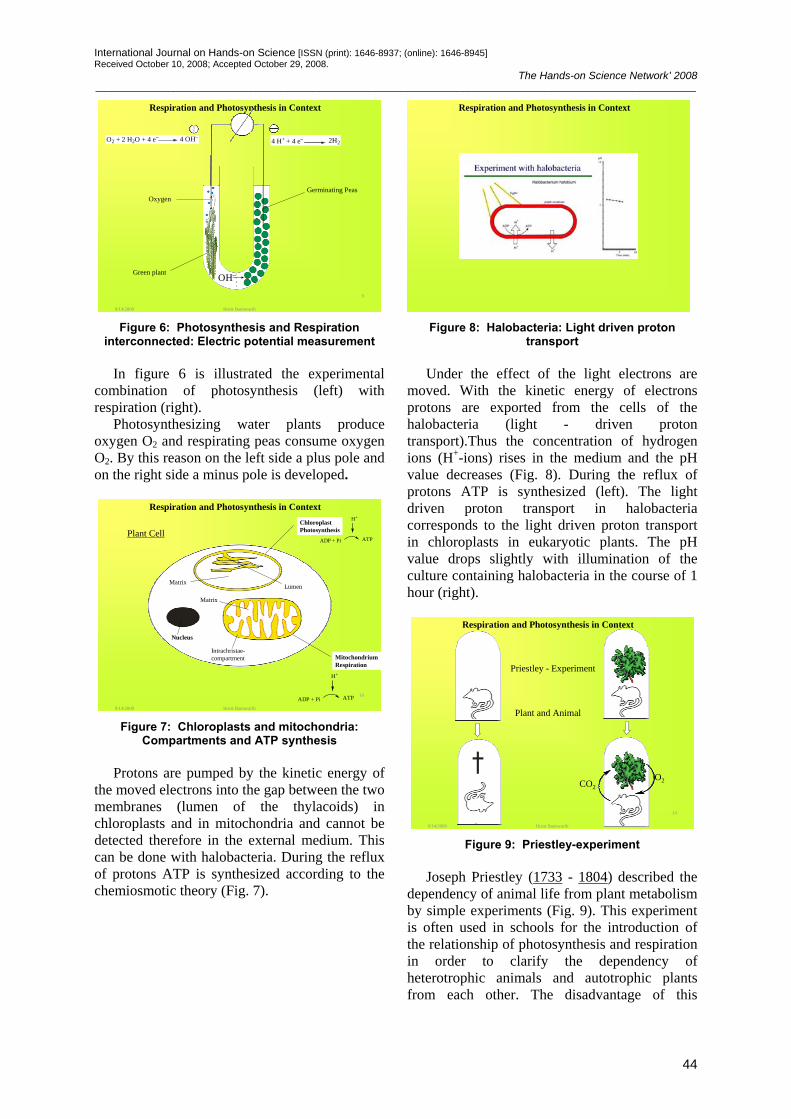
International Journal on Hands-on Science [ISSN (print): 1646-8937; (online): 1646-8945] Received October 10, 2008; Accepted October 29, 2008.
The Hands-on Science Network’ 2008 ____________________________________________________________________________________________________________________
44
Respiration and Photosynthesis in Context
Oxygen
Green plant
Germinating Peas
O2 + 2 H2O + 4 e– 4 OH–4 H+ + 4 e– 2H2
OH–
9/14/2008
9
Horst Bannwarth Figure 6: Photosynthesis and Respiration
interconnected: Electric potential measurement In figure 6 is illustrated the experimental
combination of photosynthesis (left) with respiration (right).
Photosynthesizing water plants produce oxygen O2 and respirating peas consume oxygen O2. By this reason on the left side a plus pole and on the right side a minus pole is developed.
Respiration and Photosynthesis in Context
ADP + Pi ATP
H+
ADP + Pi ATP
H+
Nucleus
LumenMatrix
ChloroplastPhotosynthesis
Mitochondrium Respiration
Plant Cell
Intrachristae-compartment
Matrix
9/14/2008
10
Horst Bannwarth Figure 7: Chloroplasts and mitochondria:
Compartments and ATP synthesis Protons are pumped by the kinetic energy of
the moved electrons into the gap between the two membranes (lumen of the thylacoids) in chloroplasts and in mitochondria and cannot be detected therefore in the external medium. This can be done with halobacteria. During the reflux of protons ATP is synthesized according to the chemiosmotic theory (Fig. 7).
Respiration and Photosynthesis in Context
Figure 8: Halobacteria: Light driven proton
transport Under the effect of the light electrons are
moved. With the kinetic energy of electrons protons are exported from the cells of the halobacteria (light - driven proton transport).Thus the concentration of hydrogen ions (H+-ions) rises in the medium and the pH value decreases (Fig. 8). During the reflux of protons ATP is synthesized (left). The light driven proton transport in halobacteria corresponds to the light driven proton transport in chloroplasts in eukaryotic plants. The pH value drops slightly with illumination of the culture containing halobacteria in the course of 1 hour (right).
Respiration and Photosynthesis in Context
Priestley - Experiment
Plant and Animal
9/14/2008
14
Horst Bannwarth
CO2O2
Figure 9: Priestley-experiment
Joseph Priestley (1733 - 1804) described the
dependency of animal life from plant metabolism by simple experiments (Fig. 9). This experiment is often used in schools for the introduction of the relationship of photosynthesis and respiration in order to clarify the dependency of heterotrophic animals and autotrophic plants from each other. The disadvantage of this
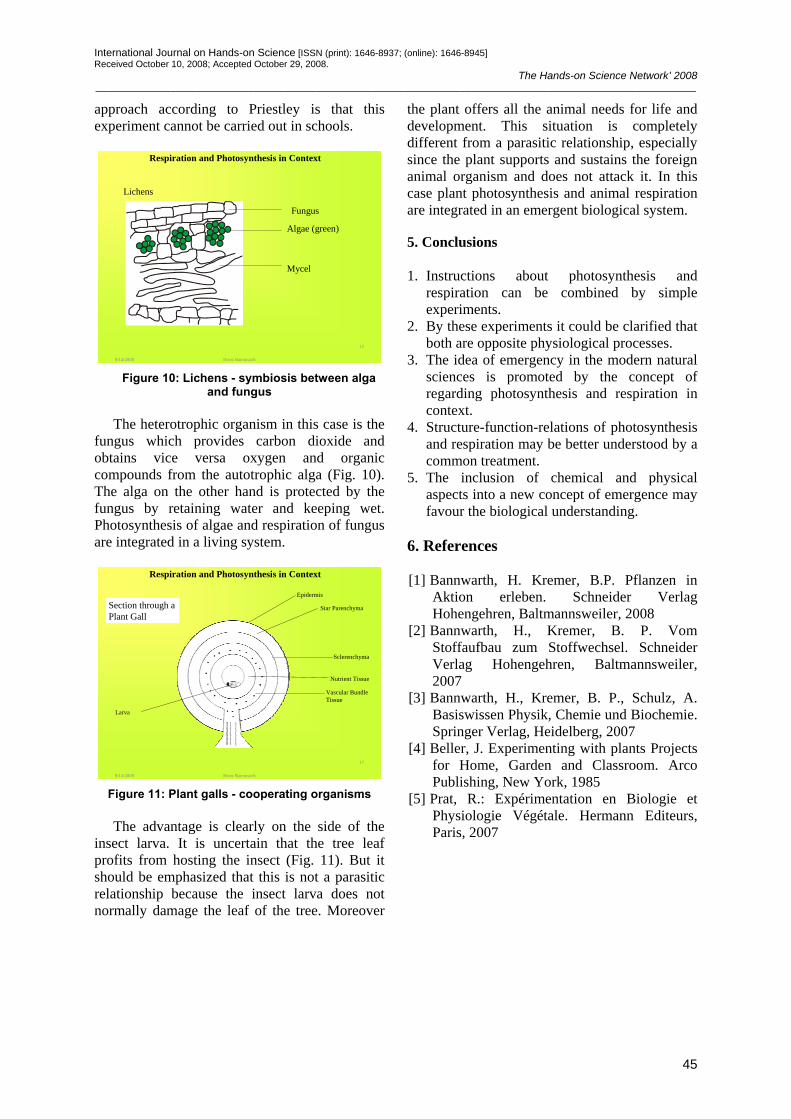
International Journal on Hands-on Science [ISSN (print): 1646-8937; (online): 1646-8945] Received October 10, 2008; Accepted October 29, 2008.
The Hands-on Science Network’ 2008 ____________________________________________________________________________________________________________________
45
approach according to Priestley is that this experiment cannot be carried out in schools.
Respiration and Photosynthesis in Context
9/14/2008
15
Horst Bannwarth
Lichens
Fungus
Algae (green)
Mycel
Figure 10: Lichens - symbiosis between alga
and fungus The heterotrophic organism in this case is the
fungus which provides carbon dioxide and obtains vice versa oxygen and organic compounds from the autotrophic alga (Fig. 10). The alga on the other hand is protected by the fungus by retaining water and keeping wet. Photosynthesis of algae and respiration of fungus are integrated in a living system.
Respiration and Photosynthesis in Context
Epidermis
Star Parenchyma
Sclerenchyma
Nutrient Tissue
Vascular BundleTissue
Larva
Section through a Plant Gall
9/14/2008
17
Horst Bannwarth Figure 11: Plant galls - cooperating organisms The advantage is clearly on the side of the
insect larva. It is uncertain that the tree leaf profits from hosting the insect (Fig. 11). But it should be emphasized that this is not a parasitic relationship because the insect larva does not normally damage the leaf of the tree. Moreover
the plant offers all the animal needs for life and development. This situation is completely different from a parasitic relationship, especially since the plant supports and sustains the foreign animal organism and does not attack it. In this case plant photosynthesis and animal respiration are integrated in an emergent biological system. 5. Conclusions 1. Instructions about photosynthesis and
respiration can be combined by simple experiments.
2. By these experiments it could be clarified that both are opposite physiological processes.
3. The idea of emergency in the modern natural sciences is promoted by the concept of regarding photosynthesis and respiration in context.
4. Structure-function-relations of photosynthesis and respiration may be better understood by a common treatment.
5. The inclusion of chemical and physical aspects into a new concept of emergence may favour the biological understanding.
6. References [1] Bannwarth, H. Kremer, B.P. Pflanzen in
Aktion erleben. Schneider Verlag Hohengehren, Baltmannsweiler, 2008
[2] Bannwarth, H., Kremer, B. P. Vom Stoffaufbau zum Stoffwechsel. Schneider Verlag Hohengehren, Baltmannsweiler, 2007
[3] Bannwarth, H., Kremer, B. P., Schulz, A. Basiswissen Physik, Chemie und Biochemie. Springer Verlag, Heidelberg, 2007
[4] Beller, J. Experimenting with plants Projects for Home, Garden and Classroom. Arco Publishing, New York, 1985
[5] Prat, R.: Expérimentation en Biologie et Physiologie Végétale. Hermann Editeurs, Paris, 2007

International Journal on Hands-on Science [ISSN (print): 1646-8937; (online): 1646-8945] Received July 28, 2008; Accepted December 9, 2008. Volume 1, Number 2, December 2008.
The Hands-on Science Network’ 2008 ____________________________________________________________________________________________________________________
46
Students’ Awareness of Endangered Species and Threatened
Environments: A comparative case-study
Mehmet Erdoğan Akdeniz University, Antalya, Turkey
Nilgün Erentay METU, Foundation School, Ankara, Turkey
Martha Barss Roland Park County School, Washington, USA
Ancuta Nechita School Number 5, Satu Mare, Romania
Abstract. The purpose of this comparative-case study is to investigate children’s awareness of endangered species and threatened environments in four countries. 5th – 7th grade students in four schools, each from Turkey (n=16), Bulgaria (n=40), Romania (n=22), and USA (n=11) constituted the sample of the study. Each group of students under the guidance of their teacher was asked to select one endangered specie and threatened environment (e.g. lake) in their neighbourhood. During the study, the students went on field trips which complemented indoor discussions during club time. Student achievement was measured with five different data collection instruments each of which pertains to knowledge, skills, attitude, and behaviour. The findings indicate that students developed a global awareness from these experiences, which resulted in motivation to develop action strategies for protecting the endangered species. Student conceptions were divided into three groups; egocentric, guardianship and eco-centric.
Keywords. environmental awareness, endangered species and threatened environment.
1. Introduction
Nature studies with the children have long been reported in the literature to increase
students’ awareness of ecological processes (e.g. food chain, water cycles…etc) in the natural environment. These studies also help the children understand the language of the nature. Studies in the literature report that there are lots of ways of developing one’s environmental knowledge and awareness such as media, family and the schools (within and out-of-school). Field trips (Neal, 1994) and case studies (Matthews & Riley, 1995), as cited in Yerkes & Haras [4], community inventory projects, community action projects are mentioned in the literature as school activities [5]. Further, school garden activities can be added to this list. As claimed by Bryjegard, 2001 [4], school gardens are excellent places for introducing the concept of environmental awareness to the students. Another way of introducing environmental issues to students is to infuse studies about the environment into a traditional course offering (Wagner, 1997). In addition to these methods, outdoor activities (field trips, …, etc) provide teachers and the students with opportunities [4] to study environmental issues first hand, and this approach has been effective in helping students develop an awareness of the environment [6,5].
1.1. Purpose of the study The purpose of the study was to investigate
children’s concern for and awareness of
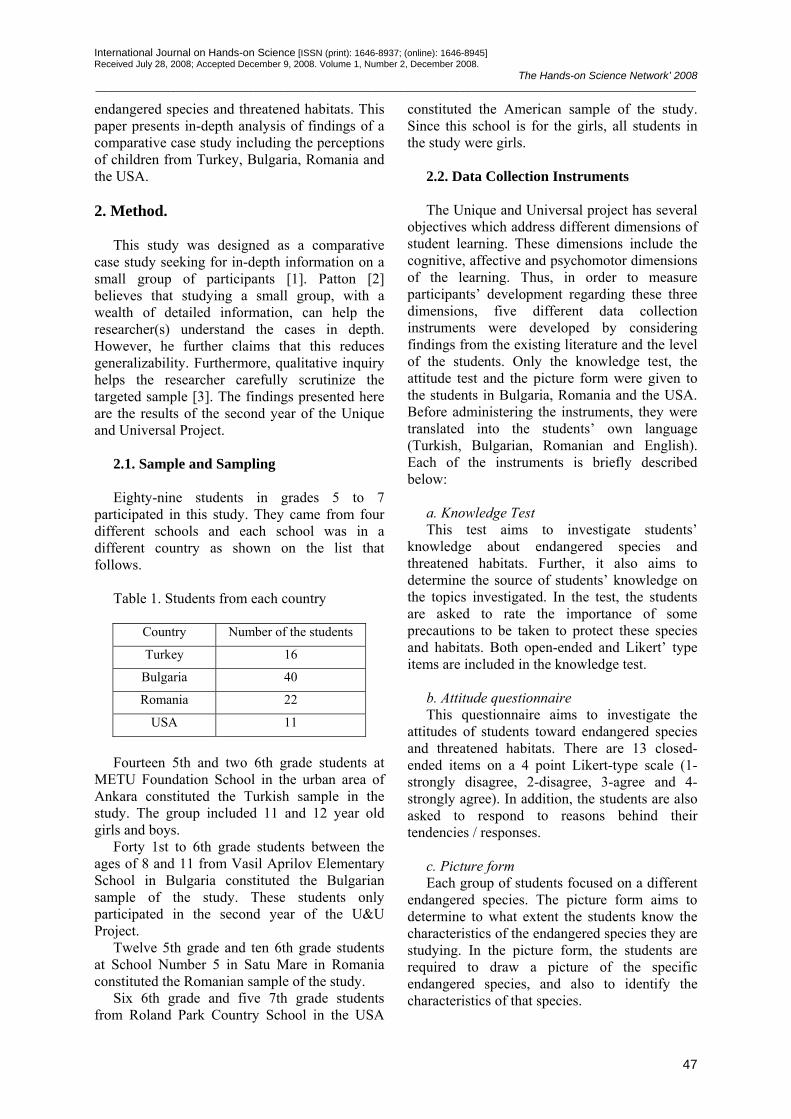
International Journal on Hands-on Science [ISSN (print): 1646-8937; (online): 1646-8945] Received July 28, 2008; Accepted December 9, 2008. Volume 1, Number 2, December 2008.
The Hands-on Science Network’ 2008 ____________________________________________________________________________________________________________________
47
endangered species and threatened habitats. This paper presents in-depth analysis of findings of a comparative case study including the perceptions of children from Turkey, Bulgaria, Romania and the USA.
2. Method.
This study was designed as a comparative
case study seeking for in-depth information on a small group of participants [1]. Patton [2] believes that studying a small group, with a wealth of detailed information, can help the researcher(s) understand the cases in depth. However, he further claims that this reduces generalizability. Furthermore, qualitative inquiry helps the researcher carefully scrutinize the targeted sample [3]. The findings presented here are the results of the second year of the Unique and Universal Project.
2.1. Sample and Sampling Eighty-nine students in grades 5 to 7
participated in this study. They came from four different schools and each school was in a different country as shown on the list that follows.
Table 1. Students from each country
Country Number of the students
Turkey 16
Bulgaria 40
Romania 22
USA 11
Fourteen 5th and two 6th grade students at
METU Foundation School in the urban area of Ankara constituted the Turkish sample in the study. The group included 11 and 12 year old girls and boys.
Forty 1st to 6th grade students between the ages of 8 and 11 from Vasil Aprilov Elementary School in Bulgaria constituted the Bulgarian sample of the study. These students only participated in the second year of the U&U Project.
Twelve 5th grade and ten 6th grade students at School Number 5 in Satu Mare in Romania constituted the Romanian sample of the study.
Six 6th grade and five 7th grade students from Roland Park Country School in the USA
constituted the American sample of the study. Since this school is for the girls, all students in the study were girls.
2.2. Data Collection Instruments The Unique and Universal project has several
objectives which address different dimensions of student learning. These dimensions include the cognitive, affective and psychomotor dimensions of the learning. Thus, in order to measure participants’ development regarding these three dimensions, five different data collection instruments were developed by considering findings from the existing literature and the level of the students. Only the knowledge test, the attitude test and the picture form were given to the students in Bulgaria, Romania and the USA. Before administering the instruments, they were translated into the students’ own language (Turkish, Bulgarian, Romanian and English). Each of the instruments is briefly described below:
a. Knowledge Test This test aims to investigate students’
knowledge about endangered species and threatened habitats. Further, it also aims to determine the source of students’ knowledge on the topics investigated. In the test, the students are asked to rate the importance of some precautions to be taken to protect these species and habitats. Both open-ended and Likert’ type items are included in the knowledge test.
b. Attitude questionnaire This questionnaire aims to investigate the
attitudes of students toward endangered species and threatened habitats. There are 13 closed-ended items on a 4 point Likert-type scale (1-strongly disagree, 2-disagree, 3-agree and 4-strongly agree). In addition, the students are also asked to respond to reasons behind their tendencies / responses.
c. Picture form Each group of students focused on a different
endangered species. The picture form aims to determine to what extent the students know the characteristics of the endangered species they are studying. In the picture form, the students are required to draw a picture of the specific endangered species, and also to identify the characteristics of that species.
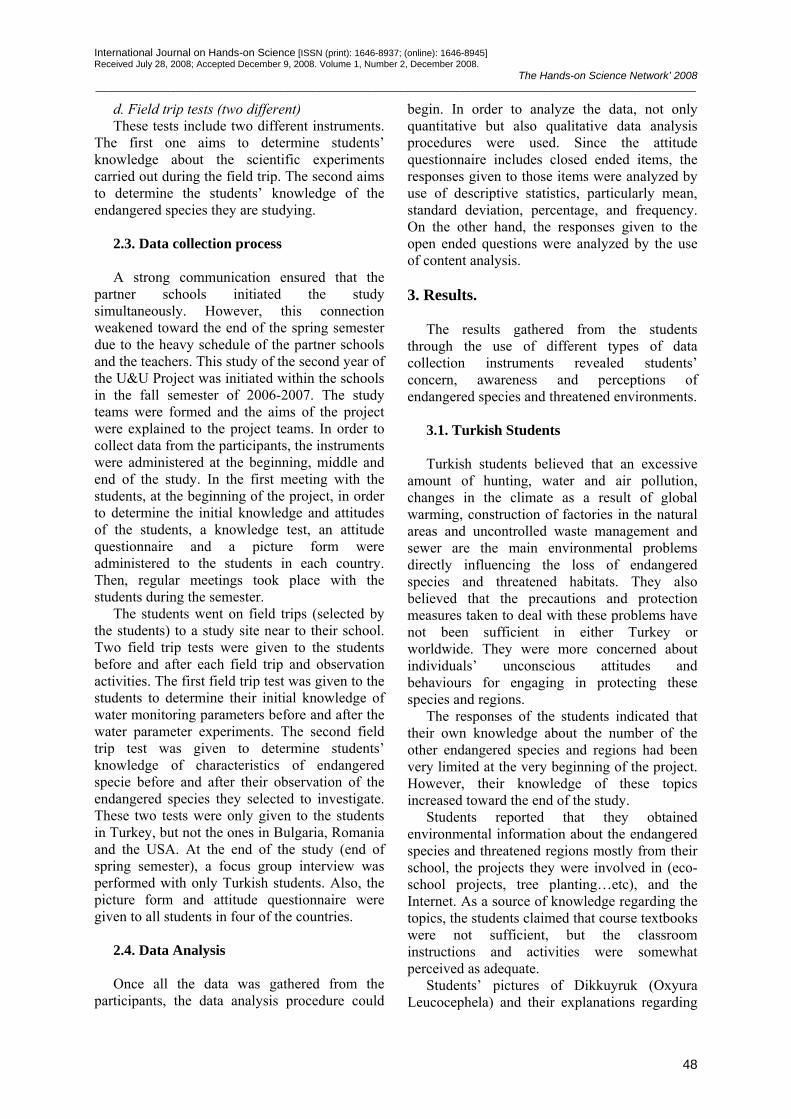
International Journal on Hands-on Science [ISSN (print): 1646-8937; (online): 1646-8945] Received July 28, 2008; Accepted December 9, 2008. Volume 1, Number 2, December 2008.
The Hands-on Science Network’ 2008 ____________________________________________________________________________________________________________________
48
d. Field trip tests (two different) These tests include two different instruments.
The first one aims to determine students’ knowledge about the scientific experiments carried out during the field trip. The second aims to determine the students’ knowledge of the endangered species they are studying.
2.3. Data collection process A strong communication ensured that the
partner schools initiated the study simultaneously. However, this connection weakened toward the end of the spring semester due to the heavy schedule of the partner schools and the teachers. This study of the second year of the U&U Project was initiated within the schools in the fall semester of 2006-2007. The study teams were formed and the aims of the project were explained to the project teams. In order to collect data from the participants, the instruments were administered at the beginning, middle and end of the study. In the first meeting with the students, at the beginning of the project, in order to determine the initial knowledge and attitudes of the students, a knowledge test, an attitude questionnaire and a picture form were administered to the students in each country. Then, regular meetings took place with the students during the semester.
The students went on field trips (selected by the students) to a study site near to their school. Two field trip tests were given to the students before and after each field trip and observation activities. The first field trip test was given to the students to determine their initial knowledge of water monitoring parameters before and after the water parameter experiments. The second field trip test was given to determine students’ knowledge of characteristics of endangered specie before and after their observation of the endangered species they selected to investigate. These two tests were only given to the students in Turkey, but not the ones in Bulgaria, Romania and the USA. At the end of the study (end of spring semester), a focus group interview was performed with only Turkish students. Also, the picture form and attitude questionnaire were given to all students in four of the countries.
2.4. Data Analysis Once all the data was gathered from the
participants, the data analysis procedure could
begin. In order to analyze the data, not only quantitative but also qualitative data analysis procedures were used. Since the attitude questionnaire includes closed ended items, the responses given to those items were analyzed by use of descriptive statistics, particularly mean, standard deviation, percentage, and frequency. On the other hand, the responses given to the open ended questions were analyzed by the use of content analysis.
3. Results.
The results gathered from the students through the use of different types of data collection instruments revealed students’ concern, awareness and perceptions of endangered species and threatened environments.
3.1. Turkish Students Turkish students believed that an excessive
amount of hunting, water and air pollution, changes in the climate as a result of global warming, construction of factories in the natural areas and uncontrolled waste management and sewer are the main environmental problems directly influencing the loss of endangered species and threatened habitats. They also believed that the precautions and protection measures taken to deal with these problems have not been sufficient in either Turkey or worldwide. They were more concerned about individuals’ unconscious attitudes and behaviours for engaging in protecting these species and regions.
The responses of the students indicated that their own knowledge about the number of the other endangered species and regions had been very limited at the very beginning of the project. However, their knowledge of these topics increased toward the end of the study.
Students reported that they obtained environmental information about the endangered species and threatened regions mostly from their school, the projects they were involved in (eco-school projects, tree planting…etc), and the Internet. As a source of knowledge regarding the topics, the students claimed that course textbooks were not sufficient, but the classroom instructions and activities were somewhat perceived as adequate.
Students’ pictures of Dikkuyruk (Oxyura Leucocephela) and their explanations regarding
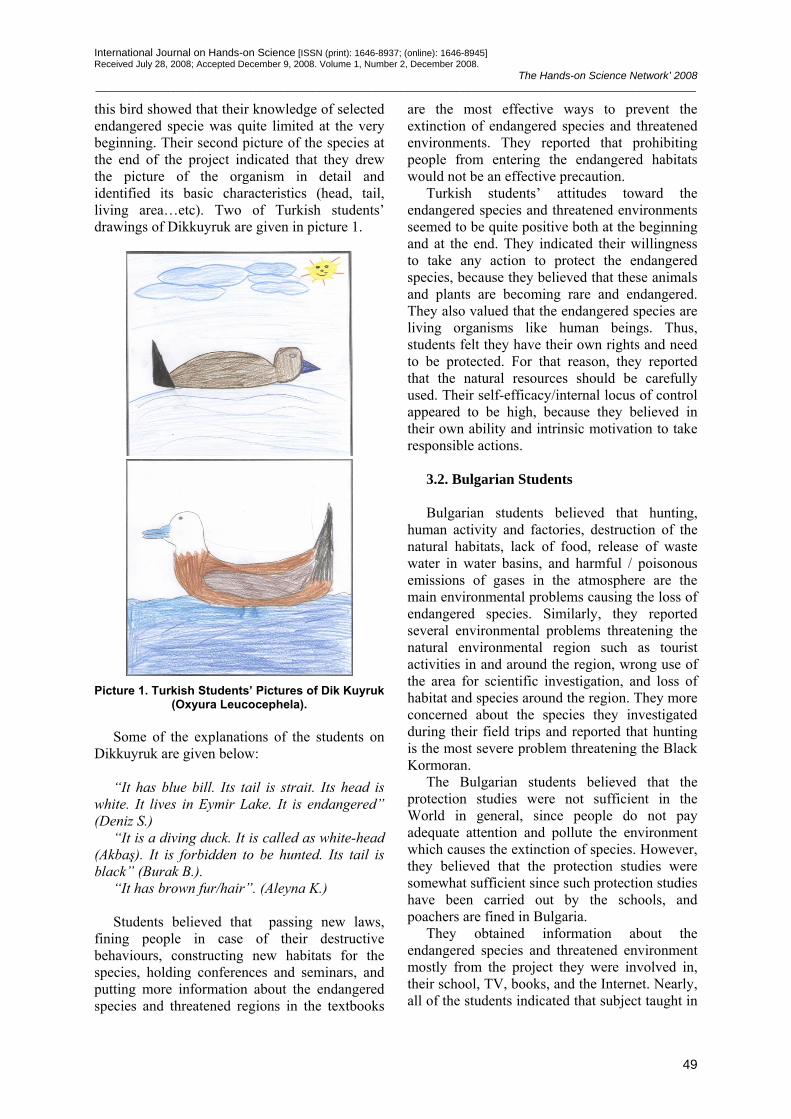
International Journal on Hands-on Science [ISSN (print): 1646-8937; (online): 1646-8945] Received July 28, 2008; Accepted December 9, 2008. Volume 1, Number 2, December 2008.
The Hands-on Science Network’ 2008 ____________________________________________________________________________________________________________________
49
this bird showed that their knowledge of selected endangered specie was quite limited at the very beginning. Their second picture of the species at the end of the project indicated that they drew the picture of the organism in detail and identified its basic characteristics (head, tail, living area…etc). Two of Turkish students’ drawings of Dikkuyruk are given in picture 1.
Picture 1. Turkish Students’ Pictures of Dik Kuyruk
(Oxyura Leucocephela).
Some of the explanations of the students on Dikkuyruk are given below:
“It has blue bill. Its tail is strait. Its head is
white. It lives in Eymir Lake. It is endangered” (Deniz S.)
“It is a diving duck. It is called as white-head (Akbaş). It is forbidden to be hunted. Its tail is black” (Burak B.).
“It has brown fur/hair”. (Aleyna K.) Students believed that passing new laws,
fining people in case of their destructive behaviours, constructing new habitats for the species, holding conferences and seminars, and putting more information about the endangered species and threatened regions in the textbooks
are the most effective ways to prevent the extinction of endangered species and threatened environments. They reported that prohibiting people from entering the endangered habitats would not be an effective precaution.
Turkish students’ attitudes toward the endangered species and threatened environments seemed to be quite positive both at the beginning and at the end. They indicated their willingness to take any action to protect the endangered species, because they believed that these animals and plants are becoming rare and endangered. They also valued that the endangered species are living organisms like human beings. Thus, students felt they have their own rights and need to be protected. For that reason, they reported that the natural resources should be carefully used. Their self-efficacy/internal locus of control appeared to be high, because they believed in their own ability and intrinsic motivation to take responsible actions.
3.2. Bulgarian Students Bulgarian students believed that hunting,
human activity and factories, destruction of the natural habitats, lack of food, release of waste water in water basins, and harmful / poisonous emissions of gases in the atmosphere are the main environmental problems causing the loss of endangered species. Similarly, they reported several environmental problems threatening the natural environmental region such as tourist activities in and around the region, wrong use of the area for scientific investigation, and loss of habitat and species around the region. They more concerned about the species they investigated during their field trips and reported that hunting is the most severe problem threatening the Black Kormoran.
The Bulgarian students believed that the protection studies were not sufficient in the World in general, since people do not pay adequate attention and pollute the environment which causes the extinction of species. However, they believed that the protection studies were somewhat sufficient since such protection studies have been carried out by the schools, and poachers are fined in Bulgaria.
They obtained information about the endangered species and threatened environment mostly from the project they were involved in, their school, TV, books, and the Internet. Nearly, all of the students indicated that subject taught in
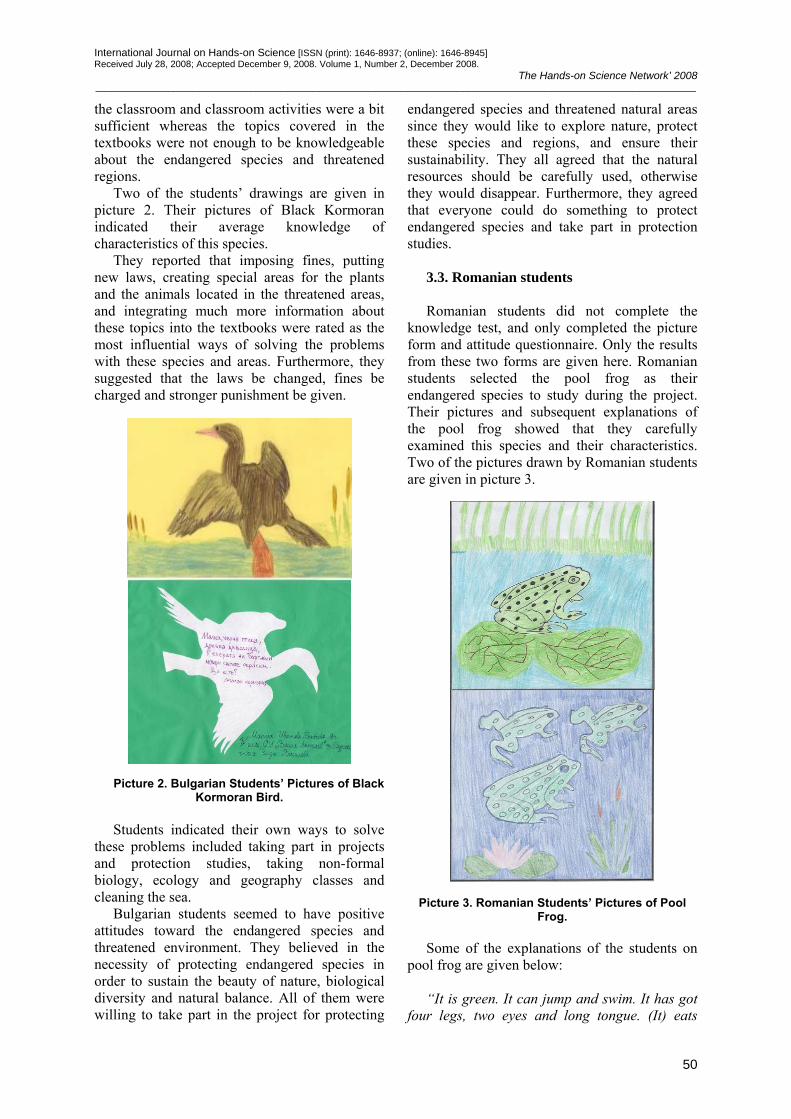
International Journal on Hands-on Science [ISSN (print): 1646-8937; (online): 1646-8945] Received July 28, 2008; Accepted December 9, 2008. Volume 1, Number 2, December 2008.
The Hands-on Science Network’ 2008 ____________________________________________________________________________________________________________________
50
the classroom and classroom activities were a bit sufficient whereas the topics covered in the textbooks were not enough to be knowledgeable about the endangered species and threatened regions.
Two of the students’ drawings are given in picture 2. Their pictures of Black Kormoran indicated their average knowledge of characteristics of this species.
They reported that imposing fines, putting new laws, creating special areas for the plants and the animals located in the threatened areas, and integrating much more information about these topics into the textbooks were rated as the most influential ways of solving the problems with these species and areas. Furthermore, they suggested that the laws be changed, fines be charged and stronger punishment be given.
Picture 2. Bulgarian Students’ Pictures of Black Kormoran Bird.
Students indicated their own ways to solve
these problems included taking part in projects and protection studies, taking non-formal biology, ecology and geography classes and cleaning the sea.
Bulgarian students seemed to have positive attitudes toward the endangered species and threatened environment. They believed in the necessity of protecting endangered species in order to sustain the beauty of nature, biological diversity and natural balance. All of them were willing to take part in the project for protecting
endangered species and threatened natural areas since they would like to explore nature, protect these species and regions, and ensure their sustainability. They all agreed that the natural resources should be carefully used, otherwise they would disappear. Furthermore, they agreed that everyone could do something to protect endangered species and take part in protection studies.
3.3. Romanian students Romanian students did not complete the
knowledge test, and only completed the picture form and attitude questionnaire. Only the results from these two forms are given here. Romanian students selected the pool frog as their endangered species to study during the project. Their pictures and subsequent explanations of the pool frog showed that they carefully examined this species and their characteristics. Two of the pictures drawn by Romanian students are given in picture 3.
Picture 3. Romanian Students’ Pictures of Pool
Frog.
Some of the explanations of the students on pool frog are given below:
“It is green. It can jump and swim. It has got
four legs, two eyes and long tongue. (It) eats
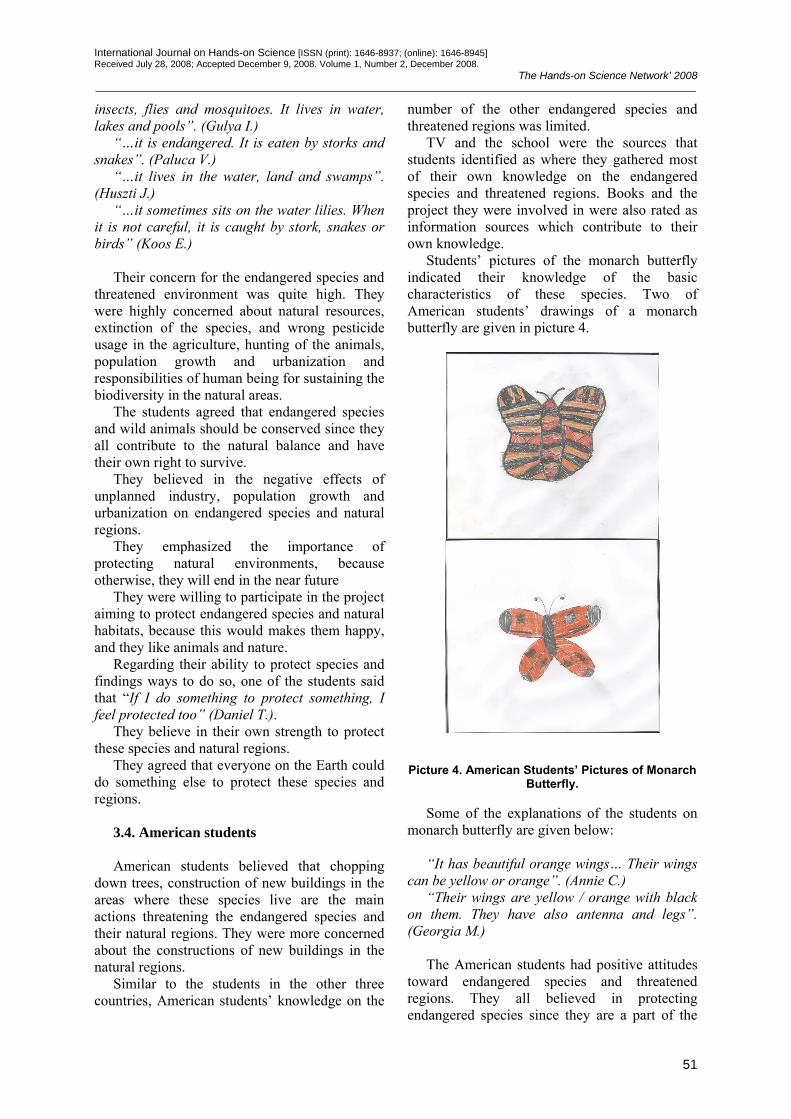
International Journal on Hands-on Science [ISSN (print): 1646-8937; (online): 1646-8945] Received July 28, 2008; Accepted December 9, 2008. Volume 1, Number 2, December 2008.
The Hands-on Science Network’ 2008 ____________________________________________________________________________________________________________________
51
insects, flies and mosquitoes. It lives in water, lakes and pools”. (Gulya I.)
“…it is endangered. It is eaten by storks and snakes”. (Paluca V.)
“…it lives in the water, land and swamps”. (Huszti J.)
“…it sometimes sits on the water lilies. When it is not careful, it is caught by stork, snakes or birds” (Koos E.)
Their concern for the endangered species and
threatened environment was quite high. They were highly concerned about natural resources, extinction of the species, and wrong pesticide usage in the agriculture, hunting of the animals, population growth and urbanization and responsibilities of human being for sustaining the biodiversity in the natural areas.
The students agreed that endangered species and wild animals should be conserved since they all contribute to the natural balance and have their own right to survive.
They believed in the negative effects of unplanned industry, population growth and urbanization on endangered species and natural regions.
They emphasized the importance of protecting natural environments, because otherwise, they will end in the near future
They were willing to participate in the project aiming to protect endangered species and natural habitats, because this would makes them happy, and they like animals and nature.
Regarding their ability to protect species and findings ways to do so, one of the students said that “If I do something to protect something, I feel protected too” (Daniel T.).
They believe in their own strength to protect these species and natural regions.
They agreed that everyone on the Earth could do something else to protect these species and regions.
3.4. American students American students believed that chopping
down trees, construction of new buildings in the areas where these species live are the main actions threatening the endangered species and their natural regions. They were more concerned about the constructions of new buildings in the natural regions.
Similar to the students in the other three countries, American students’ knowledge on the
number of the other endangered species and threatened regions was limited.
TV and the school were the sources that students identified as where they gathered most of their own knowledge on the endangered species and threatened regions. Books and the project they were involved in were also rated as information sources which contribute to their own knowledge.
Students’ pictures of the monarch butterfly indicated their knowledge of the basic characteristics of these species. Two of American students’ drawings of a monarch butterfly are given in picture 4.
Picture 4. American Students’ Pictures of Monarch
Butterfly. Some of the explanations of the students on
monarch butterfly are given below: “It has beautiful orange wings… Their wings
can be yellow or orange”. (Annie C.) “Their wings are yellow / orange with black
on them. They have also antenna and legs”. (Georgia M.)
The American students had positive attitudes
toward endangered species and threatened regions. They all believed in protecting endangered species since they are a part of the

International Journal on Hands-on Science [ISSN (print): 1646-8937; (online): 1646-8945] Received July 28, 2008; Accepted December 9, 2008. Volume 1, Number 2, December 2008.
The Hands-on Science Network’ 2008 ____________________________________________________________________________________________________________________
52
ecosystem. They also reported that endangered animals should not be hunted because they are limited, they may be extinct in near future and they also have rights to survive like human beings and other organisms. They were against using pesticides in agriculture since uncontrolled pesticide usage may harm species and the environment. They believed in the destructive roles of unplanned industry, and uncontrolled population growth and urbanization. They were against people constructing new buildings in the natural habitats since this would destroy the homes of many animals. They believed in their own abilities to protect endangered species and threatened environments and were willing to participate in a project aiming to protect these species and environments. One of the students said that “I am a girl who has a huge voice. And can tell people what to do” (Caroline W.). The students agreed that every individual needs to do something to protect endangered species because that way the Earth can be improved for the benefit of all living things.
4. Summary and Conclusions
This comparative case-study was carried out
with eighty-nine 5th – 7th grade students in four schools from Turkey, Bulgaria, Romania, and the USA. Within the study, students’ knowledge, attitudes, skills and behaviours were assessed by making use of more than one data collection instrument. Since most of the data gathered were qualitative in nature, the data were subjected to content analysis. During the project, qualitative data rather than quantitative ones were gathered because it was believed that qualitative data could provide in-depth understanding about students’ awareness of endangered species and threatened environments (regions).
As far as students’ responses to the knowledge test and their pictures were concerned, it can be concluded that students’ identified basic characteristics of the species they investigated. Furthermore, they reported their knowledge of problems threatening the species and biodiversity in the natural areas. However, their knowledge of other endangered species was limited. The number of the species they reported was quite limited.
The major sources that students obtained information about endangered species and natural regions from were their own schools (teachers and classroom instruction), the Unique
and Universal Project in which they were involved and the Internet. TV and books were more highly rated by the Bulgarian and American students. However, these two were rated lower by Turkish students. Family, friends and NGOs was not highly rated as information sources by the students. Nearly all of the students reported that classroom instructions and activities were seen as useful sources of information, but textbooks were not seen as including sufficient information about endangered species and natural regions.
The students have positive attitudes toward protecting endangered species and natural regions. They believe in the importance of protection studies to help us know how to sustain the biodiversity in the natural ecosystem. They are against using pesticides in agriculture for increasing the yield. They were against unplanned industry, population growth and urbanization, since they believe that unplanned development can harm the species and can destroy animals’ homes and food sources in natural areas. They emphasize the importance of using natural resources cautiously since the resources are becoming less each day. They believe in their own ability to engage in action and take part in projects aiming to find ways to protect these species and natural regions. They suggest other people also do something to preserve the species and natural regions.
Passing new laws to protect the endangered species and natural regions, giving fines to the people who harm the biodiversity in the natural region, and taking the endangered species in the protected / special areas are seen by the students as most effective solutions to protect these species and natural regions. They do not believe that not allowing people to enter these regions is an effective solution. The results of the study revealed the importance of field trips for developing students’ awareness of biodiversity in the natural region and ecosystem. Further, the present study shows that if teachers guide effectively during the field trips, students could develop their own solutions to the problems threatening the biodiversity in the natural regions. The study also shows that field trips to natural regions could develop students’ knowledge on the diversity of the species within the selected region and understanding the interaction among the organisms in the natural processes. Their attitudes could also be developed though effective field trips. For all

International Journal on Hands-on Science [ISSN (print): 1646-8937; (online): 1646-8945] Received July 28, 2008; Accepted December 9, 2008. Volume 1, Number 2, December 2008.
The Hands-on Science Network’ 2008 ____________________________________________________________________________________________________________________
53
these reasons, field trips and outdoor studies should be considered as extra-curricular activities and also integrated into the school curriculum. American students did not go to the field trips; instead they used schoolyard for outdoor activities. Their activities further point out that a prototype natural habitat can be created in the schoolyards and then these places can be used as instructional purposes.
5. References
[1] Leedy, P.D., & Ormrod, J.E. Practical
research: Planning and design (8th ed.). New Jersey: Merrill & Prentice Hall. (2005)
[2] Patton, M.Q. How to use qualitative methods in evaluation. In Newbury Park: CA. Sage (1987).
[3] Patton, M.Q. Qualitative evaluation and research methods (2nd ed.). Newbury Park: CA. Sage (1990).
[4] Yerkes, R., & Haras, K. Outdoor Education and Environmental Responsibility. (ED414 112, ERIC Document reproduction service) (1997).
[5] Howe, R., & Disinger, J. Teaching Environmental Education Using Out-Of-School Settings and Mass Media. ERIC/SMEAC Environmental Education Digest No. 1. Washington, DC: Office of Educational Research and Improvement (ERIC Document Reproduction Service No. ED 320 759) (1988).
[6] Palmberg, I.E., & Kuru, J. Outdoor Activities as a Basis for Environmental Responsibility. Journal of Environmental Education, 31 (4), 32-37 (2000).

International Journal on Hands-on Science [ISSN (print): 1646-8937; (online): 1646-8945] Received October 24, 2008; Accepted December 12, 2008. Volume 1, Number 2, December 2008.
The Hands-on Science Network’ 2008 ____________________________________________________________________________________________________________________
54
GAIA’ Science Center. Itinerant Planetarium and Observatory
Centro de Ciências GAIA. Planetário e Observatório itinerante
Peter Leroy
Grupo de Astronomia e Astrofísica. Departamento de Física e Química, Pontifícia Universidade Católica de Minas Gerais, Av. D. Jose Gaspar 500. Belo Horizonte MG, Brasil
Abstract. In this paper we will report on a 2007’ project of popularization of science and technology supported by Fapemig. It consisted in the construction and use of a mobile center of sciences, a planetarium and itinerant observatory. The project has duration of two years and its main objective is to spread general scientific culture using for this the education of Astronomy. In its first phase, (2008) the itinerant museum has visited schools of Belo Horizonte and its metropolitan region. In the next year, it will include schools of the whole state, including the most devoid regions. This itinerant center has a different approach. It does not teach only Astronomy, but uses Astronomy to create a systemic vision of the Earth, of our place in the Universe, to talk about the climate and climatic alterations, natural and made by the man, to argue about the idea of a living planet that needs care and preservation. Through Astronomy, give lessons of environmental quality, of sustainability, of the necessity of change and care with the planet. This center of sciences aims to form people compromised with the science and the conscience of a new world. Science goes to the school is the motto of the project. This allows working the social exclusion, reaching schools and communities of all the state. In this work we tell the experiences of the first year of the project and delineate activities and challenges for the year of 2009. We believe that the itinerant center will be able to become a reference for the high school and basic level education, taking care of students and teachers. For the teachers, Astronomy recycling courses and specific subjects of sciences will be offered, supplying formation deficiencies and improving the difficulties that appear with didactic books.
Keywords. Astronomy, itinerant museums, environmental quality, sustainability, climate changes.
Resumo. Nesta comunicação relataremos um projeto de popularização de ciência e tecnologia apoio pelo Fapemig. O projecto consistiu na construção e no uso de um centro móvel de ciências, de um planetarium e obervatório itinerante. O projeto teve uma duração de dois anos e seu objetivo principal foi dissiminar a cultura científica em geral usando para tal a instrução em astronomia. Numa primeira fase, (2008) o museu itinerant visitou escolas de Belo Horizonte e sua região metropolitana. No ano seguinte, incluirá escolas do estado inteiro, incluindo as regiões as mais periféricas. Este centro itinerante tem uma aproximação diferente. Não ensina somente a astronomia, mas usa a astronomia para criar uma visão sistémica da terra, de nosso lugar no universo, falar sobre o clima e as alterações climáticas, do mundo natural e do feito pelo homem, para discutir a idéia de um planeta vivo que necessita cuidado e preservação. Com a astronomia, dá lições da qualidade ambiental, de sustentbilidade e do cuidado para com o planeta. A exclusão social é também trabalhada. Para além das escolas de Belo Horizontee escolas e comunidades de todo o estado estão envolvidas. Neste artigo apresentamos as experiências do primeiro ano do projeto e delineamos atividades e desafios para o ano de 2009. A ciência vai à escola é o motto do projeto. Nós acreditamos que o centro itinerante se transformará numa referência para a instrução básica e secundária, atuando quer junto dos estudantes quer dos professores. Cursos e ações deformação são oferecidos aos professores para colmatar deficiências de formação em astromonia e nos restantes topicos que o centro aborda. Palavras Chave. Astronomia, Museus itinerantes, sustentabilidade, alterações climáticas.
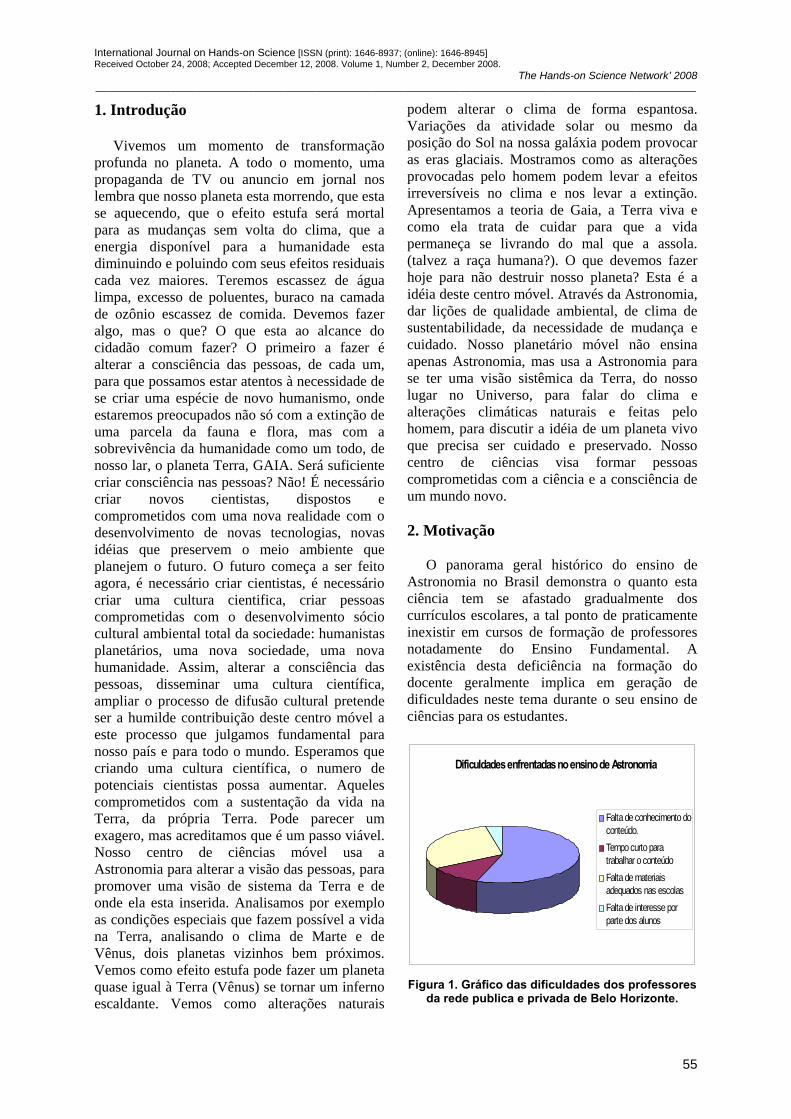
International Journal on Hands-on Science [ISSN (print): 1646-8937; (online): 1646-8945] Received October 24, 2008; Accepted December 12, 2008. Volume 1, Number 2, December 2008.
The Hands-on Science Network’ 2008 ____________________________________________________________________________________________________________________
55
1. Introdução
Vivemos um momento de transformação profunda no planeta. A todo o momento, uma propaganda de TV ou anuncio em jornal nos lembra que nosso planeta esta morrendo, que esta se aquecendo, que o efeito estufa será mortal para as mudanças sem volta do clima, que a energia disponível para a humanidade esta diminuindo e poluindo com seus efeitos residuais cada vez maiores. Teremos escassez de água limpa, excesso de poluentes, buraco na camada de ozônio escassez de comida. Devemos fazer algo, mas o que? O que esta ao alcance do cidadão comum fazer? O primeiro a fazer é alterar a consciência das pessoas, de cada um, para que possamos estar atentos à necessidade de se criar uma espécie de novo humanismo, onde estaremos preocupados não só com a extinção de uma parcela da fauna e flora, mas com a sobrevivência da humanidade como um todo, de nosso lar, o planeta Terra, GAIA. Será suficiente criar consciência nas pessoas? Não! É necessário criar novos cientistas, dispostos e comprometidos com uma nova realidade com o desenvolvimento de novas tecnologias, novas idéias que preservem o meio ambiente que planejem o futuro. O futuro começa a ser feito agora, é necessário criar cientistas, é necessário criar uma cultura cientifica, criar pessoas comprometidas com o desenvolvimento sócio cultural ambiental total da sociedade: humanistas planetários, uma nova sociedade, uma nova humanidade. Assim, alterar a consciência das pessoas, disseminar uma cultura científica, ampliar o processo de difusão cultural pretende ser a humilde contribuição deste centro móvel a este processo que julgamos fundamental para nosso país e para todo o mundo. Esperamos que criando uma cultura científica, o numero de potenciais cientistas possa aumentar. Aqueles comprometidos com a sustentação da vida na Terra, da própria Terra. Pode parecer um exagero, mas acreditamos que é um passo viável. Nosso centro de ciências móvel usa a Astronomia para alterar a visão das pessoas, para promover uma visão de sistema da Terra e de onde ela esta inserida. Analisamos por exemplo as condições especiais que fazem possível a vida na Terra, analisando o clima de Marte e de Vênus, dois planetas vizinhos bem próximos. Vemos como efeito estufa pode fazer um planeta quase igual à Terra (Vênus) se tornar um inferno escaldante. Vemos como alterações naturais
podem alterar o clima de forma espantosa. Variações da atividade solar ou mesmo da posição do Sol na nossa galáxia podem provocar as eras glaciais. Mostramos como as alterações provocadas pelo homem podem levar a efeitos irreversíveis no clima e nos levar a extinção. Apresentamos a teoria de Gaia, a Terra viva e como ela trata de cuidar para que a vida permaneça se livrando do mal que a assola. (talvez a raça humana?). O que devemos fazer hoje para não destruir nosso planeta? Esta é a idéia deste centro móvel. Através da Astronomia, dar lições de qualidade ambiental, de clima de sustentabilidade, da necessidade de mudança e cuidado. Nosso planetário móvel não ensina apenas Astronomia, mas usa a Astronomia para se ter uma visão sistêmica da Terra, do nosso lugar no Universo, para falar do clima e alterações climáticas naturais e feitas pelo homem, para discutir a idéia de um planeta vivo que precisa ser cuidado e preservado. Nosso centro de ciências visa formar pessoas comprometidas com a ciência e a consciência de um mundo novo. 2. Motivação
O panorama geral histórico do ensino de Astronomia no Brasil demonstra o quanto esta ciência tem se afastado gradualmente dos currículos escolares, a tal ponto de praticamente inexistir em cursos de formação de professores notadamente do Ensino Fundamental. A existência desta deficiência na formação do docente geralmente implica em geração de dificuldades neste tema durante o seu ensino de ciências para os estudantes.
Dificuldades enfrentadas no ensino de Astronomia
Falta de conhecimento doconteúdo.Tempo curto paratrabalhar o conteúdoFalta de materiaisadequados nas escolasFalta de interesse porparte dos alunos
Figura 1. Gráfico das dificuldades dos professores
da rede publica e privada de Belo Horizonte.
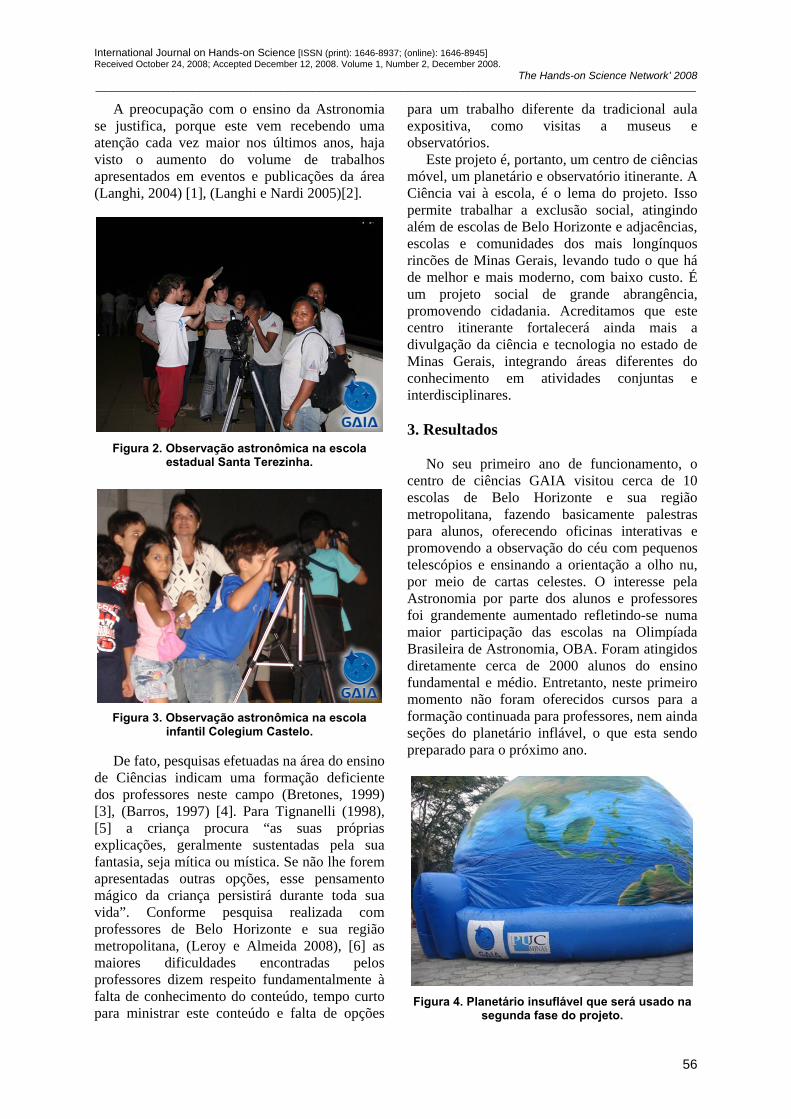
International Journal on Hands-on Science [ISSN (print): 1646-8937; (online): 1646-8945] Received October 24, 2008; Accepted December 12, 2008. Volume 1, Number 2, December 2008.
The Hands-on Science Network’ 2008 ____________________________________________________________________________________________________________________
56
A preocupação com o ensino da Astronomia se justifica, porque este vem recebendo uma atenção cada vez maior nos últimos anos, haja visto o aumento do volume de trabalhos apresentados em eventos e publicações da área (Langhi, 2004) [1], (Langhi e Nardi 2005)[2].
Figura 2. Observação astronômica na escola
estadual Santa Terezinha.
Figura 3. Observação astronômica na escola
infantil Colegium Castelo.
De fato, pesquisas efetuadas na área do ensino de Ciências indicam uma formação deficiente dos professores neste campo (Bretones, 1999) [3], (Barros, 1997) [4]. Para Tignanelli (1998), [5] a criança procura “as suas próprias explicações, geralmente sustentadas pela sua fantasia, seja mítica ou mística. Se não lhe forem apresentadas outras opções, esse pensamento mágico da criança persistirá durante toda sua vida”. Conforme pesquisa realizada com professores de Belo Horizonte e sua região metropolitana, (Leroy e Almeida 2008), [6] as maiores dificuldades encontradas pelos professores dizem respeito fundamentalmente à falta de conhecimento do conteúdo, tempo curto para ministrar este conteúdo e falta de opções
para um trabalho diferente da tradicional aula expositiva, como visitas a museus e observatórios.
Este projeto é, portanto, um centro de ciências móvel, um planetário e observatório itinerante. A Ciência vai à escola, é o lema do projeto. Isso permite trabalhar a exclusão social, atingindo além de escolas de Belo Horizonte e adjacências, escolas e comunidades dos mais longínquos rincões de Minas Gerais, levando tudo o que há de melhor e mais moderno, com baixo custo. É um projeto social de grande abrangência, promovendo cidadania. Acreditamos que este centro itinerante fortalecerá ainda mais a divulgação da ciência e tecnologia no estado de Minas Gerais, integrando áreas diferentes do conhecimento em atividades conjuntas e interdisciplinares. 3. Resultados
No seu primeiro ano de funcionamento, o centro de ciências GAIA visitou cerca de 10 escolas de Belo Horizonte e sua região metropolitana, fazendo basicamente palestras para alunos, oferecendo oficinas interativas e promovendo a observação do céu com pequenos telescópios e ensinando a orientação a olho nu, por meio de cartas celestes. O interesse pela Astronomia por parte dos alunos e professores foi grandemente aumentado refletindo-se numa maior participação das escolas na Olimpíada Brasileira de Astronomia, OBA. Foram atingidos diretamente cerca de 2000 alunos do ensino fundamental e médio. Entretanto, neste primeiro momento não foram oferecidos cursos para a formação continuada para professores, nem ainda seções do planetário inflável, o que esta sendo preparado para o próximo ano.
Figura 4. Planetário insuflável que será usado na
segunda fase do projeto.
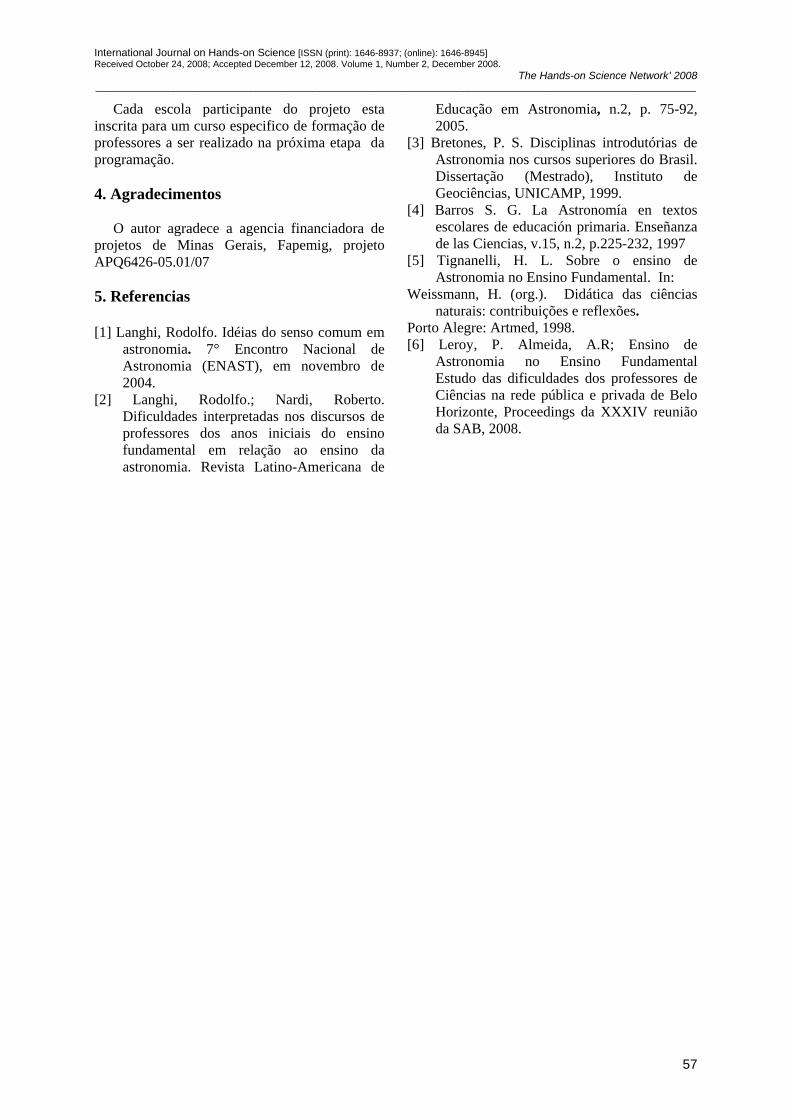
International Journal on Hands-on Science [ISSN (print): 1646-8937; (online): 1646-8945] Received October 24, 2008; Accepted December 12, 2008. Volume 1, Number 2, December 2008.
The Hands-on Science Network’ 2008 ____________________________________________________________________________________________________________________
57
Cada escola participante do projeto esta inscrita para um curso especifico de formação de professores a ser realizado na próxima etapa da programação. 4. Agradecimentos
O autor agradece a agencia financiadora de projetos de Minas Gerais, Fapemig, projeto APQ6426-05.01/07 5. Referencias [1] Langhi, Rodolfo. Idéias do senso comum em
astronomia. 7° Encontro Nacional de Astronomia (ENAST), em novembro de 2004.
[2] Langhi, Rodolfo.; Nardi, Roberto. Dificuldades interpretadas nos discursos de professores dos anos iniciais do ensino fundamental em relação ao ensino da astronomia. Revista Latino-Americana de
Educação em Astronomia, n.2, p. 75-92, 2005.
[3] Bretones, P. S. Disciplinas introdutórias de Astronomia nos cursos superiores do Brasil. Dissertação (Mestrado), Instituto de Geociências, UNICAMP, 1999.
[4] Barros S. G. La Astronomía en textos escolares de educación primaria. Enseñanza de las Ciencias, v.15, n.2, p.225-232, 1997
[5] Tignanelli, H. L. Sobre o ensino de Astronomia no Ensino Fundamental. In:
Weissmann, H. (org.). Didática das ciências naturais: contribuições e reflexões.
Porto Alegre: Artmed, 1998. [6] Leroy, P. Almeida, A.R; Ensino de
Astronomia no Ensino Fundamental Estudo das dificuldades dos professores de Ciências na rede pública e privada de Belo Horizonte, Proceedings da XXXIV reunião da SAB, 2008.
International Journal on Hands-on Science [ISSN (print): 1646-8937; (online): 1646-8945] Received October 17, 2008; Accepted December 9, 2008. Volume 1, Number 2, December 2008.
The Hands-on Science Network’ 2008 ____________________________________________________________________________________________________________________
58
Astronomy Classes as Resource for the Inclusion of Visual Handicap
Students
Aulas de Astronomia como Recurso de Inclusão de Alunos com Deficiência Visual
Maria Auxiliadora Delgado Machado e Maria da Conceição Barbosa Lima
Universidade do Estado do Rio de Janeiro Instituto de Física Armando Dias Tavares
Rua São Francisco Xavier, 524 – Maracanã – Rio de Janeiro - RJ [email protected]
Abstract. Hands-on activities are important tools to the self development and inclusion of blind students. In this communication we present a series of experiments aimed to assist the professor in the task of providing the better possible understanding on some concepts and pertinent phenomena on Astronomy’ education, to this kind of population. In the end all activities will lead to the construction by the students them selves of 3D models of described images. On of the innovative characteristic of such experiments is that the activities and performed by both the students with good vision and the ones with visual handicap including completely blind pupils, thus further promoting inclusion in the classroom. Keywords. Astronomy’ education, Visual handicap, Hands-on experiments, Inclusion. Resumo. Apresentamos uma série de atividades desenvolvidas com o objetivo de auxiliar o professor nas aulas de Ciências, ou mesmo de Física, no sentido de promover um melhor entendimento de questões interdisciplinares presentes no conteúdo de Astronomia. Neste trabalho reportamos as possibilidades em torno do tema formação de eclipses lunares e solares. O conjunto de atividades sugeridas envolve desde a discussão de diversos conceitos matemáticos e físicos envolvidos neste fenômeno que são trabalhados através de oficinas pedagógicas em sala de aula. A culminância das atividades é a execução, pelos próprios alunos, de figuras em relevo que reproduzem esquemas visuais bi-dimensionais. Isto implica em uma característica bastante inovadora no
âmbito da inclusão dos deficientes visuais, pois ao invés de entrarem em contato com uma figura pronta, eles participam diretamente do processo de confecção, o que possibilita estarem mais atentos aos conceitos inerentes ao problema. As atividades propostas são inclusivas, possibilitando o entendimento do conteúdo pela turma, vidente e não-videntes, e promovendo valores como solidariedade, paciência e convivência com as diferenças. Palavras chave. Ensino de Astronomia, Deficientes Visuais, Experiências hands-on, Inclusão 1. Introdução
O ensino de astronomia durante a vida
escolar da criança contribui para a formação de um jovem questionador, motivado para a compreensão de modelos físicos de alguns elementos pertencentes ao mundo a sua volta. No entanto o conteúdo de astronomia envolve conceitos cuja compreensão demanda diferentes níveis de abstração, localizando tais conceitos na faixa do abstrato, principalmente por envolverem fenômenos que não podem ser repetidamente executados em um laboratório até serem plenamente compreendidos. Para apresentar e estudar estes fenômenos são utilizados esquemas bi-dimensionais (desenhos, fotos) ou tri-dimensionais (maquetes), que nem sempre são simples, mesmo para os professores responsáveis pela apresentação desse conteúdo (na maioria professores das disciplinas de ciências ou geografia), que a despeito de sua formação, não são treinados para esse tipo de aula. Estas
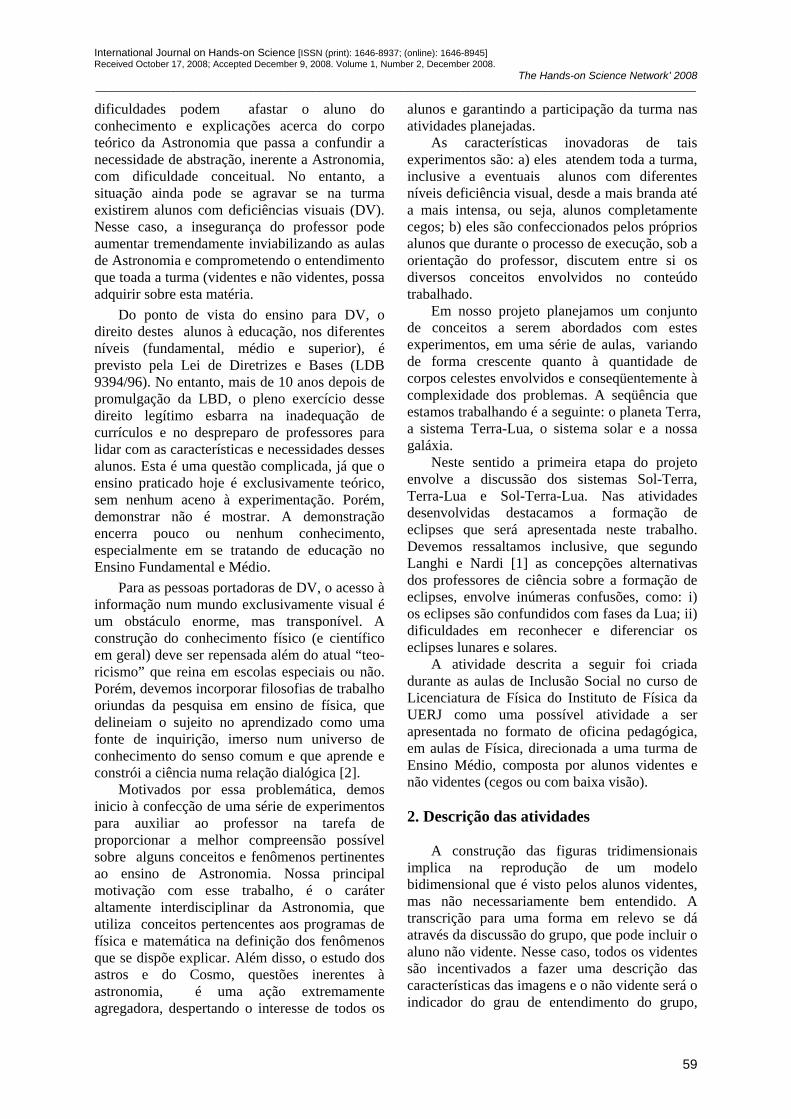
International Journal on Hands-on Science [ISSN (print): 1646-8937; (online): 1646-8945] Received October 17, 2008; Accepted December 9, 2008. Volume 1, Number 2, December 2008.
The Hands-on Science Network’ 2008 ____________________________________________________________________________________________________________________
59
dificuldades podem afastar o aluno do conhecimento e explicações acerca do corpo teórico da Astronomia que passa a confundir a necessidade de abstração, inerente a Astronomia, com dificuldade conceitual. No entanto, a situação ainda pode se agravar se na turma existirem alunos com deficiências visuais (DV). Nesse caso, a insegurança do professor pode aumentar tremendamente inviabilizando as aulas de Astronomia e comprometendo o entendimento que toada a turma (videntes e não videntes, possa adquirir sobre esta matéria.
Do ponto de vista do ensino para DV, o direito destes alunos à educação, nos diferentes níveis (fundamental, médio e superior), é previsto pela Lei de Diretrizes e Bases (LDB 9394/96). No entanto, mais de 10 anos depois de promulgação da LBD, o pleno exercício desse direito legítimo esbarra na inadequação de currículos e no despreparo de professores para lidar com as características e necessidades desses alunos. Esta é uma questão complicada, já que o ensino praticado hoje é exclusivamente teórico, sem nenhum aceno à experimentação. Porém, demonstrar não é mostrar. A demonstração encerra pouco ou nenhum conhecimento, especialmente em se tratando de educação no Ensino Fundamental e Médio.
Para as pessoas portadoras de DV, o acesso à informação num mundo exclusivamente visual é um obstáculo enorme, mas transponível. A construção do conhecimento físico (e científico em geral) deve ser repensada além do atual “teo-ricismo” que reina em escolas especiais ou não. Porém, devemos incorporar filosofias de trabalho oriundas da pesquisa em ensino de física, que delineiam o sujeito no aprendizado como uma fonte de inquirição, imerso num universo de conhecimento do senso comum e que aprende e constrói a ciência numa relação dialógica [2].
Motivados por essa problemática, demos inicio à confecção de uma série de experimentos para auxiliar ao professor na tarefa de proporcionar a melhor compreensão possível sobre alguns conceitos e fenômenos pertinentes ao ensino de Astronomia. Nossa principal motivação com esse trabalho, é o caráter altamente interdisciplinar da Astronomia, que utiliza conceitos pertencentes aos programas de física e matemática na definição dos fenômenos que se dispõe explicar. Além disso, o estudo dos astros e do Cosmo, questões inerentes à astronomia, é uma ação extremamente agregadora, despertando o interesse de todos os
alunos e garantindo a participação da turma nas atividades planejadas.
As características inovadoras de tais experimentos são: a) eles atendem toda a turma, inclusive a eventuais alunos com diferentes níveis deficiência visual, desde a mais branda até a mais intensa, ou seja, alunos completamente cegos; b) eles são confeccionados pelos próprios alunos que durante o processo de execução, sob a orientação do professor, discutem entre si os diversos conceitos envolvidos no conteúdo trabalhado.
Em nosso projeto planejamos um conjunto de conceitos a serem abordados com estes experimentos, em uma série de aulas, variando de forma crescente quanto à quantidade de corpos celestes envolvidos e conseqüentemente à complexidade dos problemas. A seqüência que estamos trabalhando é a seguinte: o planeta Terra, a sistema Terra-Lua, o sistema solar e a nossa galáxia.
Neste sentido a primeira etapa do projeto envolve a discussão dos sistemas Sol-Terra, Terra-Lua e Sol-Terra-Lua. Nas atividades desenvolvidas destacamos a formação de eclipses que será apresentada neste trabalho. Devemos ressaltamos inclusive, que segundo Langhi e Nardi [1] as concepções alternativas dos professores de ciência sobre a formação de eclipses, envolve inúmeras confusões, como: i) os eclipses são confundidos com fases da Lua; ii) dificuldades em reconhecer e diferenciar os eclipses lunares e solares.
A atividade descrita a seguir foi criada durante as aulas de Inclusão Social no curso de Licenciatura de Física do Instituto de Física da UERJ como uma possível atividade a ser apresentada no formato de oficina pedagógica, em aulas de Física, direcionada a uma turma de Ensino Médio, composta por alunos videntes e não videntes (cegos ou com baixa visão). 2. Descrição das atividades
A construção das figuras tridimensionais implica na reprodução de um modelo bidimensional que é visto pelos alunos videntes, mas não necessariamente bem entendido. A transcrição para uma forma em relevo se dá através da discussão do grupo, que pode incluir o aluno não vidente. Nesse caso, todos os videntes são incentivados a fazer uma descrição das características das imagens e o não vidente será o indicador do grau de entendimento do grupo,

International Journal on Hands-on Science [ISSN (print): 1646-8937; (online): 1646-8945] Received October 17, 2008; Accepted December 9, 2008. Volume 1, Number 2, December 2008.
The Hands-on Science Network’ 2008 ____________________________________________________________________________________________________________________
60
pois a ele caberá a principal tarefa de manipular e dispor os materiais para construção da figura. Dessa forma a construção das figuras promove a interação de toda a turma tende a despertar sentimentos como solidariedade, paciência e respeito não só entre videntes e não videntes, mas também entre os próprios alunos videntes. No entanto, de forma a reforçar a apropriação dos alunos do conteúdo estudado e dos conceitos físicos e matemáticos envolvidos, sugerimos algumas atividades que podem ser feitas na forma de oficinas antes da execução da figuras.
. 2.1. Conceitos físicos e matemáticos estudados na execução das figuras
Os conceitos envolvidos no estudo dos eclipses são basicamente os seguintes:
• Sombras – emissão de luz • Planos – pontos, retas, planos e
inclinação • Movimento orbital • Atração gravitacional
O conceito de sombra é estudado, em uma
primeira oficina, através da incidência de uma fonte incidindo em um anteparo e o aluno é levado a explorar essa sombra, desenhada com material de relevo. Ele primeiro estuda o contorno as sombra e depois ele a preenche com “geleca”, para fixar bem a sensação de sombra a falta de luz e consequentemente a uma temperatura mais baixa.
Uma segunda oficina é sugerida para reforçar a noção de ponto, reta e plano, ou seja, os princípios básicos da geometria plana que são trabalhados com bolas de isopor que representando os pontos. Através de duas bolas (dois pontos) fazemos passar um arame e definimos reta finita. Com pedaços de arames transpassando as bolas, discutimos a definição de que por um ponto passam infinitas retas. Em seguida exploramos a moção de planos: plano do chão, paredes, da superfície da mesa. E passamos para os planos imaginários. Isso é feito fazendo passar uma placa pelo centro da bola de isopor. Com as mesmas placas introduzimos a noção de planos inclinados. São construídos diversas estruturas com planos inclinados entre si com diversos valores de ângulos, entre eles a inclinação da eclíptica (23°) e do plano Terra-Lua (5°) em relação ao plano do Equador.
Uma terceira oficina, talvez a mais importante para a compreensão do conteúdo incluído na formação de eclipses, diz respeito às concepções teóricas dos alunos sobre órbitas. Rebatemos algumas idéias como: “...dois planetas em uma mesma órbita” “...caminho do astro – astros vagando aleatoriamente”
Esses conceitos são fixados através de atividades em grupo. Um aluno no centro, girando em torno de si mesmo, com uma fita na cintura, em cuja outra extremidade está um outro aluno que sente fisicamente que não pode sair da sua órbita.
2.2. As figuras
As figuras reproduzidas foram retiradas do
livro, Astronomia e Astrofísica de Oliveira e Saraiva [3]. No desenvolvimento dessa atividade os sentido do tato e da visão são igualmente privilegiados de forma eu não só o aluno não vidente se beneficie com a oficina. Na verdade, os alunos são também incentivados a reproduzir o esquema de cores da figura, permitindo que o aluno vidente se beneficie igualmente da atividade. A figuras reproduzidas são apresentados nas figuras 1 e 2, representando os eclipses lunar e solar, respectivamente.
Figura 1. Esquema bi-dimensional de um eclipse lunar
Figura 2. Esquema bi-dimensional de um eclipse solar
International Journal on Hands-on Science [ISSN (print): 1646-8937; (online): 1646-8945] Received October 17, 2008; Accepted December 9, 2008. Volume 1, Number 2, December 2008.
The Hands-on Science Network’ 2008 ____________________________________________________________________________________________________________________
61
2.3. Material utilizado
A escolha do material utilizado priorizou a simplicidade, o baixo custo e, sobretudo a segurança no manuseio dos alunos em classe. O Sol, a Terra e a Lua são representadas por metades de bolas de isopor, de diferentes tamanhos, característica que deve ser explorada pelos alunos com DV e pintadas em cores vivas para ressaltar o sentido da visão nos alunos videntes. Algumas características devem ser bem ressaltadas, como as regiões de sombra e penumbra, que são contornadas por palitos longos e preenchidas com materiais ibem distintos. A região de penumbra é preenchida com um material rugoso, como papel camurça ou uma folha de lixa fina de madeira. Enquanto a região de sombra deve ser bem caracterizada, principalmente para os alunos com DV, pela questão da temperatura mais baixa, em função da ausência de luz. Como já foi mencionado, um ótimo material para isso é a “geleca”, artefato muito comum às crianças, pois além do fácil manuseio, passa uma sensação de “gelado”. 3. Conclusão A avaliação dos resultados deve ser feita através de questionários cujas repostas são discutidas em turma com a supervisão do professor. O objetivo na etapa de avaliação é verificar quais concepções alternativas foram esclarecidas e quais conceitos ainda precisam ser mais trabalhados. Nossa sugestão é que essa etapa ocorra em uma aula de outra disciplina, como matemática ou geografia, onde os fundamentaos vistos nas atividades realizadas podem ser associados a outros problemas. Por exemplo, a questão das órbitas pode ser explorada pelo professor de química em uma aula sobre modelo atômico.
O mais importante porém é desfazer o papel de que o aluno com DV é um problema para a turma e/ou para o professor e inseri-lo no contexto da turma como mais um elemento capaz de contribuir para a construção do saber de todo o grupo. 4. Referências [1] Langhi R e Nardi R. Dificuldades
interpretadas nos discursos de professores dos anos iniciais do ensino fundamental em relação ao ensino de Astronomia. Revista
Latino Americana de Educação em Astronomia – RELEA, n.2 p.75-92.
[2] The Knowledge Creating. Tinaka I, Tagchi H. Berlin University Press; 1895.
[3] Oliveira K, Saraiva MF. Astronomia e Astrofísica; 2004. http://astro.if.ufrgs.br/
International Journal on Hands-on Science [ISSN (print): 1646-8937; (online): 1646-8945] Received October 22, 2008; Accepted December 16, 2008. Volume 1, Number 2, December 2008.
The Hands-on Science Network’ 2008 ____________________________________________________________________________________________________________________
62
An Interactive Experiment – “Atomística”
Atomística - Uma Experiência Interativa
Ana Maria Coulon Grisa, Maria Alice Reis Pacheco, Odoaldo Ivo Rochefort, Valquíria Villas Boas
Universidade de Caxias do Sul Rua Francisco Getúlio Vargas, 1130, CEP 95070-560, Caxias do Sul – RS [email protected], [email protected], [email protected], [email protected]
Abstract. The present paper reports on a project that has been developed by the Chemistry Institute of Caxias do Sul University. The project “Engineer of the Future” was developed with high-school students and teachers. A series of experiments were selected in order to allow low cost simplicity and easy implementation. It illustrates the importance of experimentation in the teaching of chemistry and proposes suggestions on how to improve interdisciplinary study and hands-on experiments to illustrate and understand quantum jumps. The relevance of the application of these interactive activities in the teaching/learning process was verified been proved that it contributes significantly to the students' effective learning. Keywords. Chemistry’ teaching, Hands-on, Interdisciplinarity, Quantum jumps. Sumário. Este artigo relata um projeto que vem sendo desenvolvido pelo Instituto do Química da Universidadede de Caxias do Sul. O projeto “Engenheiro do futuro” foi desenvolvido com estudantes e professores do ensino secundário. Um conjunto de experiências foram selecionadas a fim permitir uma implementação fácil, simples e de custo baixo. Ilustra-se a importância da experimentação no ensino da química e propõe-se sugestões em como melhorar o estudo interdisciplinar e com recurso a experiências hands-on para ilustrar e compreender os “saltos quânticos”. A relevância da aplicação destas atividades interativas no processo de ensino/aprendizado foi verificada comprovando-se que contribui de facto para a aprendizagem efectiva dos estudantes. Keywords. Ensino química, Hands-on, Interdisciplinaridade, Saltos quânticos.
1. Introdução
Muito se avançou nas bases epistemológicas do ensino de ciências. Mas o que se observa nas salas de aula é que quase nada é aplicado. Entre o saber e o fazer há um precipício muito grande. Muito dessa realidade se deve a falta de idéias por parte dos professores para abordar os assuntos contidos nos planos de ensino dos cursos de ciências. Passa ainda, pelo entusiasmo em ministrar as aulas e encontrar apoio da direção no que se refere a contemplar na grade de horários um espaço para atividades experimentais. Estas atividades sempre exigem um pré-preparo e, depois de realizadas deve ser feito a limpeza e organização do espaço utilizado. Não há a figura do bolsista ou do laboratorista.
Então, resolvemos propor algumas atividades onde fosse possível aplicar atividades interativas interdisciplinares, e onde os alunos fossem os agentes do seu processo de ensino-aprendizagem. E, mais ainda, onde o professor também tivesse oportunidade de ter seus próprios momentos de aprendizagem.
É fato que todos nós fizemos uma graduação, seja ela, química, física, matemática, entre outras. Portanto, nos ensinaram a ver um fato sob apenas um ponto de vista. No entanto, na modernidade, somos chamados a dar conta de mais de um ponto de vista. A necessidade de tratar de maneira diferenciada os temas está presente até mesmo na legislação.
Temos plena certeza de que o assunto que apresentaremos não se esgota por si só; que haverá outras maneiras de abordar os mesmos temas. Mas, não queremos nos privar de dar uma contribuição mais concreta ao ensino interdisciplinar de ciências.
Diante da dificuldade que muitos educadores demonstram quando estão exercendo a sua
International Journal on Hands-on Science [ISSN (print): 1646-8937; (online): 1646-8945] Received October 22, 2008; Accepted December 16, 2008. Volume 1, Number 2, December 2008.
The Hands-on Science Network’ 2008 ____________________________________________________________________________________________________________________
63
prática pedagógica, elaboramos um projeto com o objetivo maior de oportunizar aos professores de ensino médio e profissionalizante de ciências, de melhorar suas condições de ensino-aprendizagem, através do desenvolvimento de novas metodologias, utilizando uma abordagem interdisciplinar, experimental e recursos da informática.
Temas significativos, dentro das propostas dos parâmetros curriculares nacionais, são desenvolvidos confrontando as dúvidas, as formas de percepção, experiências do dia-a-dia, envolvendo a área das Ciências da Natureza e suas tecnologias em ambientes de aprendizagem utilizando experimentos e inovações científicas.
O projeto possui bolsistas de iniciação científica e bolsista trabalho, vinculados aos cursos de licenciatura, o que ajuda a formar pessoal com experiência na área de ensino em ciências, servindo não apenas como capacitador profissional, mas também como uma ferramenta de ensino em diversas disciplinas.
Participam deste projeto os Centros Acadêmicos com cursos consolidados de Licenciatura em Matemática, Biologia, Química e Informática. São eles os Centros de Ciências Exatas e Tecnologia (CCET) e de Ciências Biológicas e da Saúde (CCBS), através dos Departamentos de Física e Química (DEFQ), Matemática e Estatística (DEME), Informática (DEIN) e Ciências Biológicas (DCBI), o Museu da Universidade de Caxias do Sul e as escolas co-executoras. São elas: o Centro Tecnológico Universidade de Caxias do Sul e a Escola Estadual Técnica Caxias de Sul, sediadas na cidade de Caxias do Sul, e a Escola Estadual de Ensino Médio Danton Corrêa da Silva, da cidade de Canela.
O processo de ensino-aprendizagem é sempre um processo de constante transformação sendo por isso constituído por uma série de etapas que tem por objetivos a construção do conhecimento e o desenvolvimento de competências e habilidades nos alunos.
Saviani (2000), afirma que o caminho para o conhecimento passa por dentro da cotidianidade do aluno e na sua cultura; mais que ensinar e aprender um conhecimento, é preciso concretizá-lo no dia-a-dia, questionando, respondendo e avaliando, num trabalho desenvolvido por grupos de indivíduos que constroem o seu mundo e o fazem por si mesmos [1].
A educação em ciências não pode mais priorizar apenas o verbalismo do professor, a
exposição de conteúdos e o cumprimento de um programa, paradigma presente entre os educadores atuais. Cada vez mais, enfatizam-se o papel de espaços de educação não formal, como os museus de ciência e tecnologia, para a construção de significados científicos nos atores da educação, alunos, professores e toda a comunidade escolar.
Neste período da história da educação do nosso país precisamos mais do que nunca, formar cidadãos, conforme muito bem preconiza os Parâmetros Curriculares Nacionais (PCN’s). E tendo em vista uma nova visão de cidadão devemos criar estratégias diferenciadas para que possamos desenvolver as habilidades que se fazem necessárias para o cidadão do século XXI. Cidadão este que deverá ser capaz de resolver problemas que se apresentem no seu cotidiano, que saiba trabalhar em equipe e que possam se adaptar rapidamente as mudanças que ocorrem no seu meio.
Aprender a aprender, criar, empreender e gerenciar informações, é algumas das habilidades almejadas na formação de cidadãos capazes de produzir resultados de valor para a sociedade contemporânea.
É de fundamental importância mudar o enfoque dado ao processo de ensino-aprendizagem em nossas escolas. Por isso, as atividades propostas deverão contemplar situações e vivências para a solução de questões cotidianas.
Quando pensamos em elaborar situações para a resolução de problemas e para desenvolver a criatividade nos indivíduos podemos nos inspirar em uma citação do sociólogo suíço Perrenoud (1999) que diz: “O importante não é fazer como se cada um houvesse aprendido, mas permitir o cada um aprender” [2].
Não podemos esquecer que esse aprender deve ser acordo com a realidade e no ritmo de cada indivíduo, com suas contribuições e dificuldades. Daí surgiu toda uma conduta de valorização dos saberes que os alunos trazem consigo para dentro da Escola.
Um primeiro passo nesta direção seria a relevância que devemos dar ao desenvolvimento de algumas competências, que sejam relevantes em relação aos objetivos propostos aos alunos.
Para Perrenoud (1999) “competência é a capacidade de atuar eficazmente sobre uma determinada situação, apoiada em conhecimentos, mas sem limitar-se a eles”. O autor ainda afirma que “de acordo com esta
International Journal on Hands-on Science [ISSN (print): 1646-8937; (online): 1646-8945] Received October 22, 2008; Accepted December 16, 2008. Volume 1, Number 2, December 2008.
The Hands-on Science Network’ 2008 ____________________________________________________________________________________________________________________
64
noção, para que o indivíduo possa enfrentar uma situação, faz-se necessário que o mesmo mobilize, além do conhecimento, vários outros recursos cognitivos complementares, como acontece, por exemplo, no ato de leitura. Portanto, não basta ter o conhecimento necessário e adequado para lidar com as situações, é imprescindível que o indivíduo saiba mobilizá-lo e utilizá-lo de maneira apropriada para que ele possa ser usado em função ou em benefício dos processos cognitivos ou operações mentais exigidas por tais situações, que se repetem e/ou se renovam ao longo da vida e que possibilitam a construção de novas competências” [3].
Antonio Nóvoa (2001) afirma que “a formação é algo que pertence ao próprio sujeito e se inscreve num processo de ser (nossas vidas e experiências, nosso passado, etc.) e num processo de ir sendo (nossos projetos, nossa idéia de futuro). Paulo Freire explica-nos que ela nunca se dá por mera acumulação. É uma conquista feita com muitas ajudas: dos mestres, dos livros, das aulas, dos computadores. Mas depende sempre de um trabalho pessoal. Ninguém forma ninguém. Cada um forma-se a si próprio” [4].
A interdisciplinaridade tornou-se um elemento obrigatório na discussão que envolva aspectos metodológicos do ensino das ciências, visando uma formação ampla e integral do educador. É necessária uma preparação do educador de ensino médio condizente, que forneça um arcabouço teórico-prático que favoreça uma ampla e clara visão do contexto interdisciplinar em ciências. Desta forma, o papel da interdisciplinaridade no contexto do ensino médio e profissionalizante, devido à sua natureza dinâmica, deve ser permanentemente discutido.
Entende-se que o papel do professor vai muito além de ensinar conteúdos. Sua função compreende proporcionar momentos de reflexão e de crítica sobre esses e a realidade, estimularem o debate e provocar o engajamento dos alunos e, assim, encaminhá-los para serem autores de um conhecimento libertador. Para tal, o discurso do professor deve conduzi-los à atitude de transformar o conhecimento em ação [5].
Para se chegar a essa transformação faz-se necessário trabalhar (ou interagir) com as diversas áreas do conhecimento. É necessário se fazer uma ponte entre um conhecimento e outro desfocando o aspecto exclusivista de uma
matéria. Temos que romper na educação a idéia de cada um no seu quadrado.
É necessária uma preparação do educador de ensino médio condizente com os princípios que norteiam uma metodologia que inter-relacione as diversas disciplinas de um currículo escolar.
A interdisciplinaridade suscita diferentes interpretações e, em todas elas está implícita uma mudança de atitude em busca de uma unidade de pensamento.
Segundo Fazenda (Barros, 2006), uma prática interdisciplinar firma-se na ação, na qual se estabelece o diálogo entre as disciplinas e entre os sujeitos das ações, num trabalho cooperativo e reflexivo em que alunos e professores – sujeitos de sua própria ação (ator e autor do processo) – dispõem-se à investigação, à descoberta e à construção coletiva de conhecimento, compartilhando idéias, ações e reflexões [6].
Esse processo, por certo, desenvolve a capacidade do aluno de expressar-se mediante as múltiplas linguagens e as novas tecnologias, posicionar-se diante da informação e interagir, de forma crítica e ativa, com o meio físico e social, caracterizando o que se afirma sobre essa prática: trata–se de um processo de aprender a aprender [5].
Segundo Fazenda (1994), a interdisciplinaridade se consolida na ousadia da busca que é sempre perguntar, portanto, pesquisa constante. “No projeto interdisciplinar não se ensina, nem se aprende: vive-se, exerce-se” [7]. Para tanto, pontua que: fazer pesquisa significa, numa perspectiva interdisciplinar, a busca da construção coletiva de um novo conhecimento
[8]. Os alunos precisam estabelecer relações entre
as informações para poderem gerir seu próprio conhecimento. O que interessa são as operações que o aprendiz possa realizar a partir destas informações, as coordenações, as inferências possíveis, os argumentos, as demonstrações. Pois, para construir conhecimento, é preciso reestruturar as significações anteriores, produzindo boas diferenciações e integrando ao sistema as novas significações. Esta integração é o resultado da atividade de diferentes sistemas lógicos do sujeito, que interagem entre si e com os objetos a assimilar ou com os problemas a resolver.
“Finalmente, o conhecimento novo é um produto de atividade intencional, de interatividade cognitiva, de interação entre os parceiros pensantes, de trocas afetivas, de
International Journal on Hands-on Science [ISSN (print): 1646-8937; (online): 1646-8945] Received October 22, 2008; Accepted December 16, 2008. Volume 1, Number 2, December 2008.
The Hands-on Science Network’ 2008 ____________________________________________________________________________________________________________________
65
investimento, de interesse e valores” [9]. Espera-se assim que os participantes
percebam a vantagem de aprender e ensinar por meio de situações e/ou temas que dão mais significado aos conceitos e às idéias. Espera-se, ainda, que os professores fiquem encorajados a criarem outras metodologias de ensino em ciências, com base nas discussões e ilustrações propiciadas pelas atividades programadas no decorrer dos encontros.
Não podemos esquecer que os nossos alunos são diferentes, únicos, então trazem saberes diferente; vamos, pois valorizá-los. É com essa perspectiva que idealizamos a atividade descrita a seguir, ou seja, tentamos desenvolver e valorizar o trabalho e as peculiaridades de cada aluno, mas não esquecendo que a sua contribuição é, e sempre será muito importante para o crescimento do grupo o qual está inserido.
Aprender a aprender, criar, empreender e gerenciar informações, é algumas das habilidades almejadas na formação de cidadãos capazes de produzir resultados de valor para a sociedade contemporânea. Desta forma serão criados, tanto para alunos quanto para professores do ensino médio e profissionalizante, diversos cursos e oficinas interdisciplinares para a capacitação destas habilidades e outras habilidades também. Trabalharemos interdisciplinarmente com temas nucleadores, interagindo com as áreas propostas pelos parâmetros curriculares nacionais (PCNs).
A proposta metodológica deste projeto considerará a experiência do professor e os conhecimentos prévios que ele possui. Discutiremos temas relevantes para o grupo participante.
Nos ambientes de aprendizagem interativos e interdisciplinares, inicialmente, os professores-discentes irão interagir com materiais lúdicos, objetos potencialmente significativos, geradores de discussões em nível teórico prático e interdisciplinar. E, posteriormente, aplicarão a mesma oficina (ou uma adaptação da mesma) junto aos seus alunos.
A experimentação prioriza o contato dos alunos com os fenômenos químicos, possibilitando a criação de modelos que tenham sentido para eles, a partir de suas próprias observações, lógicas e linguagens.
A utilização do dia-a-dia no ensino de Química, em primeira instância visa despertar o interesse dos alunos, com o argumento de que este seja um facilitador da aprendizagem, seguido da interpretação do que acontece em seu
cotidiano, finalizando na compreensão do mundo como um todo.
A falta de oportunidade que os estudantes que freqüentam o ensino médio de escolas públicas têm, de estar em contato com laboratórios de Química, ou mesmo com experimentos em sala de aula, pode ser uma conseqüência da realização do ensino distanciado da vida dos alunos, não permitindo o afloramento de uma importante habilidade nos alunos, o caráter investigativo, dificultando, portanto, a aprendizagem desta disciplina. Apesar da grande maioria das escolas terem algum espaço para uso como laboratório. A inclusão da experimentação no ensino de Química, mesmo que de forma simples, é de suma importância, pois, além de demonstrar fenômenos palpáveis e de significados concretos, pode propiciar ao estudante analisar estes fenômenos de forma investigativa [10].
A caracterização do papel investigativo na experimentação é um dos fatores que a faz tão importante no processo de ensino-aprendizagem, possibilitando ao aluno o desenvolvimento de habilidades como a observação, a elaboração e tese de hipóteses, construção de conjecturas, organização de idéias, argumentação, raciocínio e o senso crítico, dentre outros. Os objetivos específicos do ENGEFUT são: - elaborar uma atividade interativa, relacionada aos saltos quânticos; - construir um kit com material de baixo custo para o desenvolvimento da atividade proposta em sala de aula; - criar um espaço de pesquisa e extensão abordando temas relacionados ao ensino de ciências; - discutir com as escolas co-executoras temas de interesse, cursos e espaço para construção de material e desenvolvimento de metodologias inovadoras; - definir temas nucleadores para serem explorados interdisciplinarmente interagindo com as áreas propostas pelos PCN’s; - elaborar e aplicar materiais didáticos instrumentais para as escolas de ensino médio e profissionalizante partindo dos temas nucleadores; - manter um repositório de informações educacionais interdisciplinares acessíveis aos professores de ensino médio e profissionalizante; - desenvolver oficina didático-pedagógica na escola para professores de ensino médio e profissionalizante;
International Journal on Hands-on Science [ISSN (print): 1646-8937; (online): 1646-8945] Received October 22, 2008; Accepted December 16, 2008. Volume 1, Number 2, December 2008.
The Hands-on Science Network’ 2008 ____________________________________________________________________________________________________________________
66
- acompanhar os professores-discentes na implementação das oficinas para os seus alunos; -avaliar os resultados obtidos junto aos professores de ensino médio e profissionalizante.
Os professores-discentes participantes poderão utilizar a Internet, como uma de fonte de informação para elaboração de novos ambientes, propiciando uma aprendizagem ativa e significativa para os alunos e professores, num processo de educação continuada. Possibilitando a atualização e capacitação dos docentes associados ao uso de novas tecnologias de informação e comunicação.
2. Metodologia Utilizada
Três turmas de 1ª série do ensino médio na
disciplina de Química, de duas escolas distintas, foram submetidas à metodologia de aprendizagem ativa através da realização do experimento de saltos quânticos. O material utilizado no desenvolvimento do experimento consta de um conjunto experimental, de um roteiro escrito além de material de apoio. Este experimento foi projetado para ser utilizado em caráter interdisciplinar e em qualquer ambiente de aprendizagem.
As duas escolas, nas quais foi aplicada a nova metodologia, apresentam realidades bastante diferentes no que diz respeito aos ambientes de aprendizagem e aos recursos tecnológicos disponíveis. Através de questionário, foram coletadas informações junto aos alunos quanto: ao uso e a posse de computadores; o acesso à internet; comunicação via: celular, torpedos, MSN, chat rooms; e a prática com jogos eletrônicos.
A população de uma das escolas está em constante contato com diferentes tecnologias, tanto na escola quanto em casa, enquanto que a da outra o contato é bem menor.
Os materiais utilizados para a realização da oficina de saltos quânticos foram: colheres de metal, potes de vidro transparente, caixas de fósforos, álcool etílico, diversos sais inorgânicos (como por exemplo: BaCl2, NaCl, SrCl2, KCl)
Em primeiro lugar foram esclarecidos aos alunos os objetivos do projeto, a finalidade e o processo de desenvolvimento da atividade.
Em seguida foi distribuído o material para desenvolvimento da atividade descrita abaixo.
A oficina foi desenvolvida com os alunos no ambiente da sala de aula contendo o roteiro abaixo.
3. Roteiro para o aprendizado da “Ciência dos Saltos Quânticos”
3.1. Reconhecimento do material
1. Primeiramente você vai se familiarizar com o
material que utilizaremos para realizar nosso experimento. Observe e anote as características principais dos materiais e reagentes que compõem este kit.
3.2. A Química dos saltos quânticos
Agora que você se familiarizou com o material a ser utilizado, vamos executar o experimento.
IMPORTANTE: Cuidado ao realizar os experimentos, não esqueça que o álcool é inflamável!
1. Com a espátula de plástico nº 1 adicione 2 porções da substância nº1 na colher de metal nº1. A seguir adicione duas gotas de álcool sobre a substância contida na colher de metal e realize a combustão. Observe e anote o que ocorre. 2. Com a espátula de plástico nº 2 adicione 2 porções da substância nº2 na colher de metal nº2. A seguir adicione duas gotas de álcool sobre a substância contida na colher de metal e realize a combustão. Observe e anote o que ocorre. 3. Com a espátula de plástico nº 3 adicione 2 porções da substância nº3 na colher de metal nº3. A seguir adicione duas gotas de álcool sobre a substância contida na colher de metal e realize a combustão. Observe e anote o que ocorre. 4. Com o auxílio das espátulas de plástico nº 1 e nº2 adicione 1 porção da substância nº1 e 1 porção da substância nº2 na colher de metal nº4. A seguir adicione duas gotas de álcool sobre a substância contida na colher de metal e realize a combustão. O que foi que você observou? Anote suas observações. 5. Com o auxílio das espátulas de plástico nº 1, nº2 e nº3 adicione 1 porção da substância nº1, 1 porção da substância nº2 e 1 porção da substância nº3 na colher de metal nº5. A seguir adicione duas gotas de álcool sobre a substância contida na colher de metal e realize a combustão. O que foi que você observou? Anote suas observações. 6. Com esta última etapa do experimento, justifique o porquê dos cuidados em não misturar as colheres. 7. Quais as cores que você percebeu ao queimar
International Journal on Hands-on Science [ISSN (print): 1646-8937; (online): 1646-8945] Received October 22, 2008; Accepted December 16, 2008. Volume 1, Number 2, December 2008.
The Hands-on Science Network’ 2008 ____________________________________________________________________________________________________________________
67
as diferentes substâncias? Anote suas “descobertas” na segunda coluna da Tabela 1.
Tabela 1 – Resultados experimentais
Substância Cor
Observada
Elemento
Químico
λ ν
1
2
3
1+ 2
1+ 2 +3
8. Baseando-se na Tabela 2, que apresenta as cores emitidas pelos elementos sob ação de uma fonte de energia, determine os tipos de elementos químicos metálicos presentes nas substâncias dos recipientes no1, 2 e 3, e finalize o preenchimento da tabela acima. Tabela 2 – Tabela de cores emitidas pelos diferentes
elementos sob ação de uma fonte de energia.
Elemento Cor Lítio Vermelho carmim Sódio Amarelo Potássio Violeta Cálcio Laranja Estrôncio Vermelho Bário Verde Cobre Azul Chumbo Azul-claro
3.3. A Física dos saltos Quânticos 1. Consulte a figura com a descrição do espectro eletromagnético, disponível em lâmina. As cores obtidas no experimento (vide Tabela 1) estão presentes no espectro eletromagnético? 2. Consultando o espectro eletromagnético determine aproximadamente uma faixa de comprimento (λ) para cada uma das cores obtidas no experimento. Anote seus resultados na tabela 1. 3. Baseando-se novamente no espectro solar, qual a faixa de freqüências de cada uma das cores obtidas no experimento? Preencha-as na Tabela 1. 3.3.1. Notação exponencial
Observe que para todas as cores, o produto do
comprimento de onda (λ, em metros) pela freqüência (ν, em hertz) deve ser constante. Por exemplo, a cor amarelada tem comprimento de onda.
λ ≈ 550 nm = 550 x 10-9 m = 5,5 x 10⁻⁷ m e freqüência ν ≈ 5,4 x 10¹⁴ Hz = 5,4 x 10¹⁴ 1/s de modo que: λ ν = 5,5 x 10-7m x 5,4 x 1014 1/s λ ν = 5,5 x 5,4 x 10-7 x 1014 m/s λ ν = 29,7 x 10⁻⁷+14 m/s λ ν = 29,7 x 10⁷ m/s λ ν = 2,97 x 10⁸ m/s
Observe que essa constante tem unidades de velocidade. Que constante é esta? 3.4. Formalizando o que você aprendeu sobre
saltos quânticos
Através de observações cuidadosas de fenômenos físicos e químicos, cientistas desenvolvem modelos ou teorias para explicar suas observações. Estes modelos também podem ser usados para prever um comportamento físico ou químico.
A partir das observações da atividade que você acabou de realizar, responda às questões: 1. Baseado nos modelos atômicos existentes, qual identifica a emissão de cores das diversas substâncias estudadas? 2. O que estas cores têm a ver com os saltos quânticos? 3. Ampliando um pouco mais o seu conhecimento sobre saltos quânticos tente relacionar este fenômeno que ocorre a nível atômico com fenômenos conhecidos da natureza e do seu dia-a-dia. Uma dica: “Você já observou um vaga-lume?” Você saberia explicar um fato semelhante que ocorre na natureza? Qual?
Se você tem dúvida agora é a hora de ir a busca de novos conhecimentos, vamos lá, vá para a biblioteca ou internet. Uma dica, esse fenômeno ocorre com uns animais de hábitos noturnos. Mas não vamos ficar apenas na noite, vamos buscar relacionar este processo de cores também com o dia.
Busque explicar um fenômeno que ocorre sempre de dia, aliás, muito bonito, em que essas cores estão presentes.
Foi desenvolvido um kit (Figura 1) para empréstimo ou uso em sala de aula que além de explorar o aspecto dos saltos quânticos também
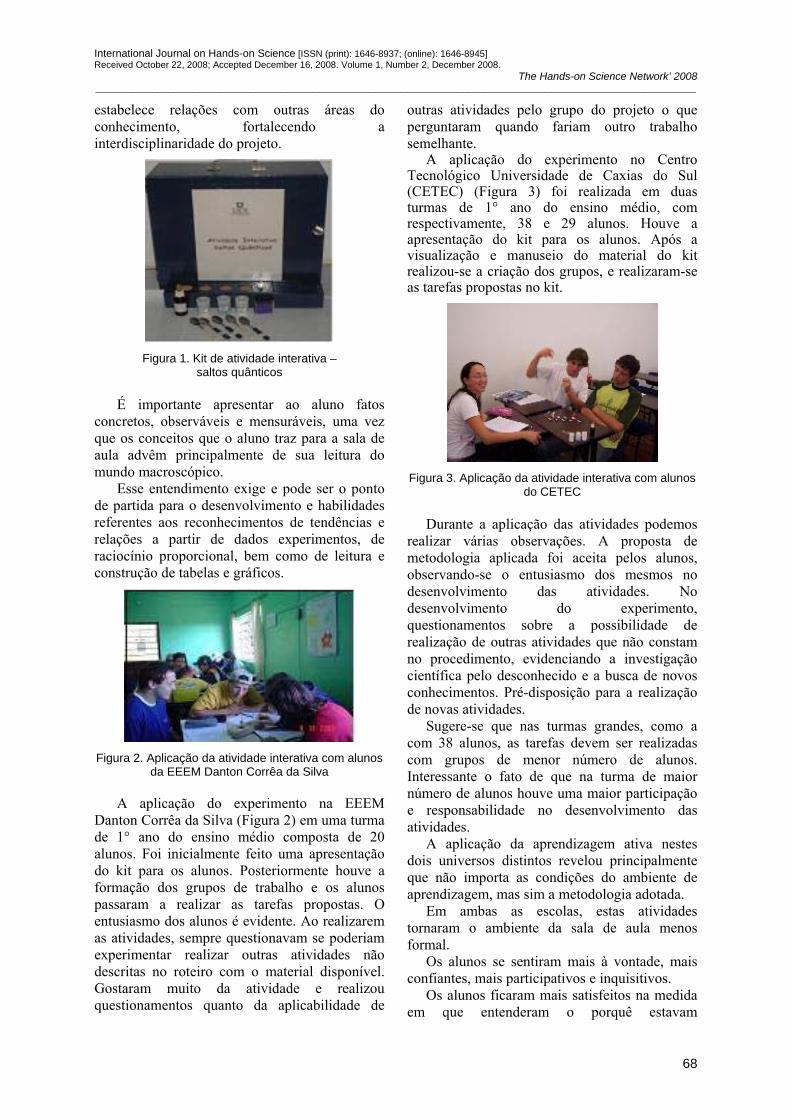
International Journal on Hands-on Science [ISSN (print): 1646-8937; (online): 1646-8945] Received October 22, 2008; Accepted December 16, 2008. Volume 1, Number 2, December 2008.
The Hands-on Science Network’ 2008 ____________________________________________________________________________________________________________________
68
estabelece relações com outras áreas do conhecimento, fortalecendo a interdisciplinaridade do projeto.
Figura 1. Kit de atividade interativa –
saltos quânticos
É importante apresentar ao aluno fatos concretos, observáveis e mensuráveis, uma vez que os conceitos que o aluno traz para a sala de aula advêm principalmente de sua leitura do mundo macroscópico.
Esse entendimento exige e pode ser o ponto de partida para o desenvolvimento e habilidades referentes aos reconhecimentos de tendências e relações a partir de dados experimentos, de raciocínio proporcional, bem como de leitura e construção de tabelas e gráficos.
Figura 2. Aplicação da atividade interativa com alunos
da EEEM Danton Corrêa da Silva A aplicação do experimento na EEEM
Danton Corrêa da Silva (Figura 2) em uma turma de 1° ano do ensino médio composta de 20 alunos. Foi inicialmente feito uma apresentação do kit para os alunos. Posteriormente houve a formação dos grupos de trabalho e os alunos passaram a realizar as tarefas propostas. O entusiasmo dos alunos é evidente. Ao realizarem as atividades, sempre questionavam se poderiam experimentar realizar outras atividades não descritas no roteiro com o material disponível. Gostaram muito da atividade e realizou questionamentos quanto da aplicabilidade de
outras atividades pelo grupo do projeto o que perguntaram quando fariam outro trabalho semelhante.
A aplicação do experimento no Centro Tecnológico Universidade de Caxias do Sul (CETEC) (Figura 3) foi realizada em duas turmas de 1° ano do ensino médio, com respectivamente, 38 e 29 alunos. Houve a apresentação do kit para os alunos. Após a visualização e manuseio do material do kit realizou-se a criação dos grupos, e realizaram-se as tarefas propostas no kit.
Figura 3. Aplicação da atividade interativa com alunos
do CETEC
Durante a aplicação das atividades podemos realizar várias observações. A proposta de metodologia aplicada foi aceita pelos alunos, observando-se o entusiasmo dos mesmos no desenvolvimento das atividades. No desenvolvimento do experimento, questionamentos sobre a possibilidade de realização de outras atividades que não constam no procedimento, evidenciando a investigação científica pelo desconhecido e a busca de novos conhecimentos. Pré-disposição para a realização de novas atividades.
Sugere-se que nas turmas grandes, como a com 38 alunos, as tarefas devem ser realizadas com grupos de menor número de alunos. Interessante o fato de que na turma de maior número de alunos houve uma maior participação e responsabilidade no desenvolvimento das atividades.
A aplicação da aprendizagem ativa nestes dois universos distintos revelou principalmente que não importa as condições do ambiente de aprendizagem, mas sim a metodologia adotada.
Em ambas as escolas, estas atividades tornaram o ambiente da sala de aula menos formal.
Os alunos se sentiram mais à vontade, mais confiantes, mais participativos e inquisitivos.
Os alunos ficaram mais satisfeitos na medida em que entenderam o porquê estavam
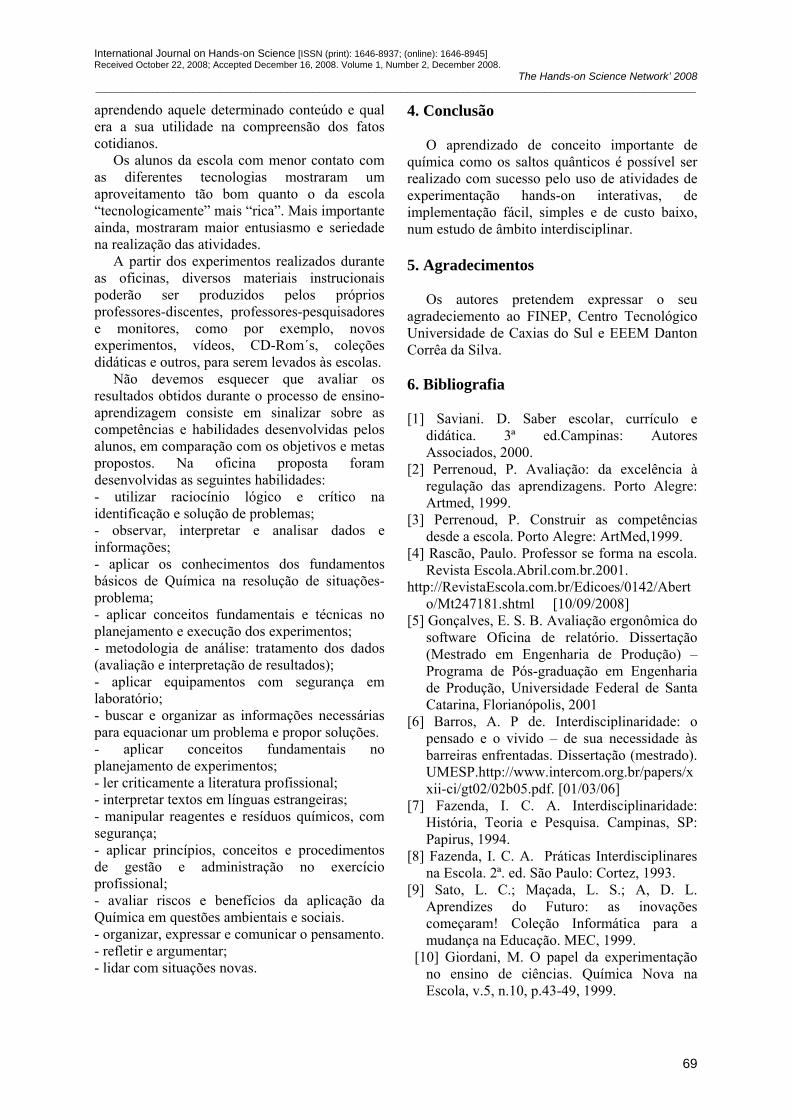
International Journal on Hands-on Science [ISSN (print): 1646-8937; (online): 1646-8945] Received October 22, 2008; Accepted December 16, 2008. Volume 1, Number 2, December 2008.
The Hands-on Science Network’ 2008 ____________________________________________________________________________________________________________________
69
aprendendo aquele determinado conteúdo e qual era a sua utilidade na compreensão dos fatos cotidianos.
Os alunos da escola com menor contato com as diferentes tecnologias mostraram um aproveitamento tão bom quanto o da escola “tecnologicamente” mais “rica”. Mais importante ainda, mostraram maior entusiasmo e seriedade na realização das atividades.
A partir dos experimentos realizados durante as oficinas, diversos materiais instrucionais poderão ser produzidos pelos próprios professores-discentes, professores-pesquisadores e monitores, como por exemplo, novos experimentos, vídeos, CD-Rom´s, coleções didáticas e outros, para serem levados às escolas.
Não devemos esquecer que avaliar os resultados obtidos durante o processo de ensino-aprendizagem consiste em sinalizar sobre as competências e habilidades desenvolvidas pelos alunos, em comparação com os objetivos e metas propostos. Na oficina proposta foram desenvolvidas as seguintes habilidades: - utilizar raciocínio lógico e crítico na identificação e solução de problemas; - observar, interpretar e analisar dados e informações; - aplicar os conhecimentos dos fundamentos básicos de Química na resolução de situações-problema; - aplicar conceitos fundamentais e técnicas no planejamento e execução dos experimentos; - metodologia de análise: tratamento dos dados (avaliação e interpretação de resultados); - aplicar equipamentos com segurança em laboratório; - buscar e organizar as informações necessárias para equacionar um problema e propor soluções. - aplicar conceitos fundamentais no planejamento de experimentos; - ler criticamente a literatura profissional; - interpretar textos em línguas estrangeiras; - manipular reagentes e resíduos químicos, com segurança; - aplicar princípios, conceitos e procedimentos de gestão e administração no exercício profissional; - avaliar riscos e benefícios da aplicação da Química em questões ambientais e sociais. - organizar, expressar e comunicar o pensamento. - refletir e argumentar; - lidar com situações novas.
4. Conclusão
O aprendizado de conceito importante de química como os saltos quânticos é possível ser realizado com sucesso pelo uso de atividades de experimentação hands-on interativas, de implementação fácil, simples e de custo baixo, num estudo de âmbito interdisciplinar. 5. Agradecimentos
Os autores pretendem expressar o seu agradeciemento ao FINEP, Centro Tecnológico Universidade de Caxias do Sul e EEEM Danton Corrêa da Silva.
6. Bibliografia
[1] Saviani. D. Saber escolar, currículo e
didática. 3ª ed.Campinas: Autores Associados, 2000.
[2] Perrenoud, P. Avaliação: da excelência à regulação das aprendizagens. Porto Alegre: Artmed, 1999.
[3] Perrenoud, P. Construir as competências desde a escola. Porto Alegre: ArtMed,1999.
[4] Rascão, Paulo. Professor se forma na escola. Revista Escola.Abril.com.br.2001.
http://RevistaEscola.com.br/Edicoes/0142/Aberto/Mt247181.shtml [10/09/2008]
[5] Gonçalves, E. S. B. Avaliação ergonômica do software Oficina de relatório. Dissertação (Mestrado em Engenharia de Produção) – Programa de Pós-graduação em Engenharia de Produção, Universidade Federal de Santa Catarina, Florianópolis, 2001
[6] Barros, A. P de. Interdisciplinaridade: o pensado e o vivido – de sua necessidade às barreiras enfrentadas. Dissertação (mestrado). UMESP.http://www.intercom.org.br/papers/xxii-ci/gt02/02b05.pdf. [01/03/06]
[7] Fazenda, I. C. A. Interdisciplinaridade: História, Teoria e Pesquisa. Campinas, SP: Papirus, 1994.
[8] Fazenda, I. C. A. Práticas Interdisciplinares na Escola. 2ª. ed. São Paulo: Cortez, 1993.
[9] Sato, L. C.; Maçada, L. S.; A, D. L. Aprendizes do Futuro: as inovações começaram! Coleção Informática para a mudança na Educação. MEC, 1999.
[10] Giordani, M. O papel da experimentação no ensino de ciências. Química Nova na Escola, v.5, n.10, p.43-49, 1999.
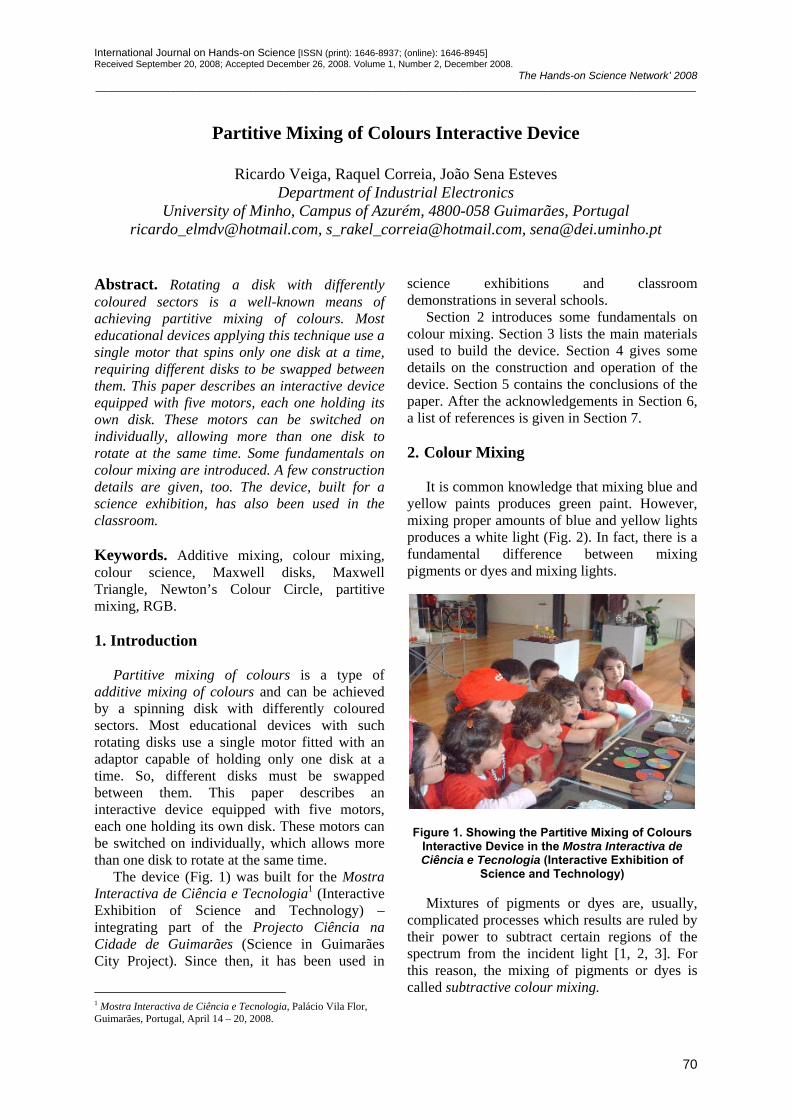
International Journal on Hands-on Science [ISSN (print): 1646-8937; (online): 1646-8945] Received September 20, 2008; Accepted December 26, 2008. Volume 1, Number 2, December 2008.
The Hands-on Science Network’ 2008 ____________________________________________________________________________________________________________________
70
Partitive Mixing of Colours Interactive Device
Ricardo Veiga, Raquel Correia, João Sena Esteves
Department of Industrial Electronics University of Minho, Campus of Azurém, 4800-058 Guimarães, Portugal
[email protected], [email protected], [email protected]
Abstract. Rotating a disk with differently coloured sectors is a well-known means of achieving partitive mixing of colours. Most educational devices applying this technique use a single motor that spins only one disk at a time, requiring different disks to be swapped between them. This paper describes an interactive device equipped with five motors, each one holding its own disk. These motors can be switched on individually, allowing more than one disk to rotate at the same time. Some fundamentals on colour mixing are introduced. A few construction details are given, too. The device, built for a science exhibition, has also been used in the classroom. Keywords. Additive mixing, colour mixing, colour science, Maxwell disks, Maxwell Triangle, Newton’s Colour Circle, partitive mixing, RGB. 1. Introduction
Partitive mixing of colours is a type of additive mixing of colours and can be achieved by a spinning disk with differently coloured sectors. Most educational devices with such rotating disks use a single motor fitted with an adaptor capable of holding only one disk at a time. So, different disks must be swapped between them. This paper describes an interactive device equipped with five motors, each one holding its own disk. These motors can be switched on individually, which allows more than one disk to rotate at the same time.
The device (Fig. 1) was built for the Mostra Interactiva de Ciência e Tecnologia1 (Interactive Exhibition of Science and Technology) – integrating part of the Projecto Ciência na Cidade de Guimarães (Science in Guimarães City Project). Since then, it has been used in
1 Mostra Interactiva de Ciência e Tecnologia, Palácio Vila Flor, Guimarães, Portugal, April 14 – 20, 2008.
science exhibitions and classroom demonstrations in several schools.
Section 2 introduces some fundamentals on colour mixing. Section 3 lists the main materials used to build the device. Section 4 gives some details on the construction and operation of the device. Section 5 contains the conclusions of the paper. After the acknowledgements in Section 6, a list of references is given in Section 7.
2. Colour Mixing
It is common knowledge that mixing blue and yellow paints produces green paint. However, mixing proper amounts of blue and yellow lights produces a white light (Fig. 2). In fact, there is a fundamental difference between mixing pigments or dyes and mixing lights.
Figure 1. Showing the Partitive Mixing of Colours
Interactive Device in the Mostra Interactiva de Ciência e Tecnologia (Interactive Exhibition of
Science and Technology)
Mixtures of pigments or dyes are, usually, complicated processes which results are ruled by their power to subtract certain regions of the spectrum from the incident light [1, 2, 3]. For this reason, the mixing of pigments or dyes is called subtractive colour mixing.

International Journal on Hands-on Science [ISSN (print): 1646-8937; (online): 1646-8945] Received September 20, 2008; Accepted December 26, 2008. Volume 1, Number 2, December 2008.
The Hands-on Science Network’ 2008 ____________________________________________________________________________________________________________________
71
The wavelengths of two or more coloured lights seen together are added. So, the mixing of coloured lights is called additive colour mixing [1, 2, 3].
Additive mixing of different quantities of red, green and blue colours produces a wide range of colours, which can be displayed inside an RGB Maxwell Triangle (Fig. 3).
B YW
Figure 2. Mixing proper amounts of blue (B) and yellow (Y) lights produces a white (W) light
Line segments r, g and b are perpendicular to GB, BR and RG sides of the equilateral triangle, respectively. The lengths of these line segments represent the quantities of red, green and blue required to produce the colour displayed at the intersection of the segments.
Figure 3. The Maxwell Triangle
Cyan, magenta, yellow and white colours can
be produced by the following additive mixtures (Fig. 4):
• Mixing balanced green and blue lights produces a cyan light;
• Mixing balanced blue and red lights produces a magenta light;
• Mixing balanced red and green lights produces a yellow light;
• Mixing balanced red, green and blue lights produces a white light.
Red, green and blue are additive primary
colours. Each of these colours cannot be produced by any additive mixture of the other two. Cyan, magenta and yellow are secondary colours, produced by mixtures of two primary colours. White is a tertiary colour, since it is produced by a mixture of all three primary colours. The positions of these seven colours on the Maxwell Triangle are shown on Fig. 5.
2.1. Partitive mixing with coloured disks
Isaac Newton separated white daylight into a
sequence of coloured lights divided into seven colour regions, called Spectrum, and proposed a diagram such that a rectangular spectrum is bent into a cylinder and then viewed in cross-section [4]. This diagram [5] is known as Newton’s Colour Circle (Fig. 6).
RB
C YWM
G
Figure 4. Obtaining cyan (C), magenta (M), yellow (Y) and white (W) lights from mixtures of red (R),
green (G) and blue (B) lights The proof that all the spectral colours could
be recombined to form white light is also due to Newton [4]. One approach to accomplish this recombination consists of rapidly rotating a disk containing sectors with the colours existing on Newton’s Colour Circle. The device described in this paper has a disk with 7 colours in 14 sectors. It would also be expectable to obtain white by rotating a disk with balanced red, green and blue
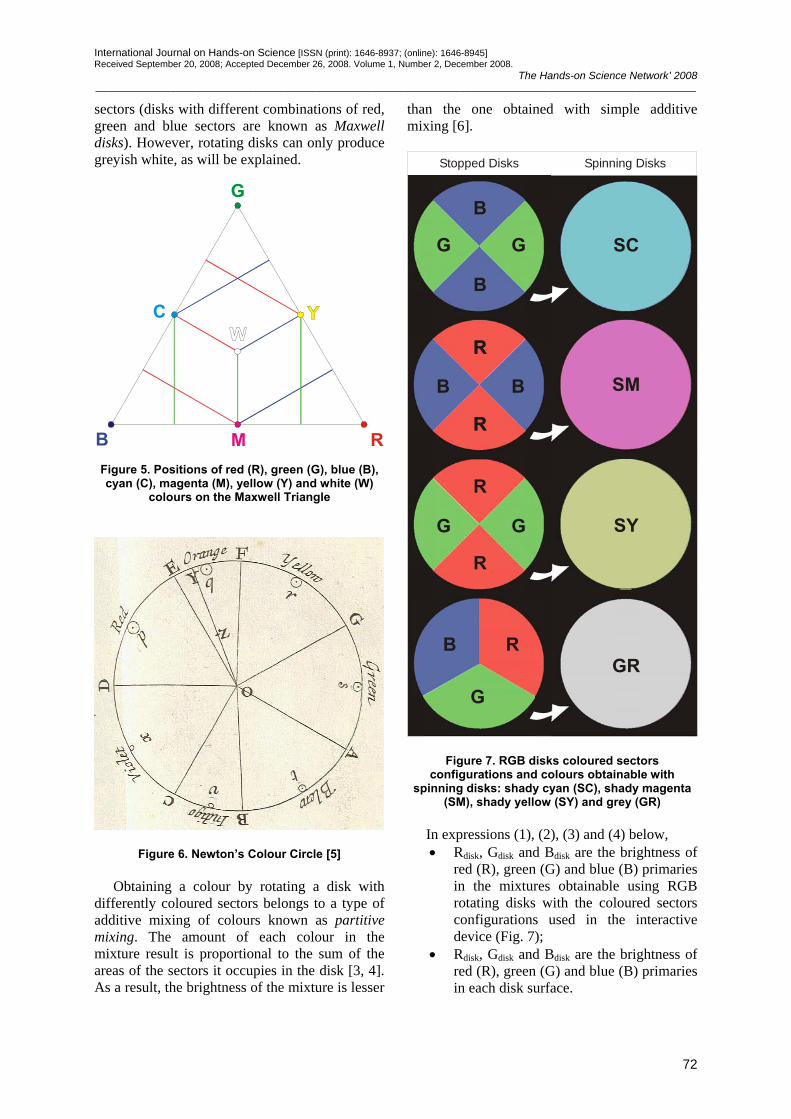
International Journal on Hands-on Science [ISSN (print): 1646-8937; (online): 1646-8945] Received September 20, 2008; Accepted December 26, 2008. Volume 1, Number 2, December 2008.
The Hands-on Science Network’ 2008 ____________________________________________________________________________________________________________________
72
sectors (disks with different combinations of red, green and blue sectors are known as Maxwell disks). However, rotating disks can only produce greyish white, as will be explained.
G
RB
C
M Figure 5. Positions of red (R), green (G), blue (B), cyan (C), magenta (M), yellow (Y) and white (W)
colours on the Maxwell Triangle
Figure 6. Newton’s Colour Circle [5]
Obtaining a colour by rotating a disk with differently coloured sectors belongs to a type of additive mixing of colours known as partitive mixing. The amount of each colour in the mixture result is proportional to the sum of the areas of the sectors it occupies in the disk [3, 4]. As a result, the brightness of the mixture is lesser
than the one obtained with simple additive mixing [6].
R
G
B
GG
BB
GG
R
R
B
B
R
R
R
R
SC
SM
SY
GR
Stopped Disks Spinning Disks
Figure 7. RGB disks coloured sectors configurations and colours obtainable with
spinning disks: shady cyan (SC), shady magenta (SM), shady yellow (SY) and grey (GR)
In expressions (1), (2), (3) and (4) below, • Rdisk, Gdisk and Bdisk are the brightness of
red (R), green (G) and blue (B) primaries in the mixtures obtainable using RGB rotating disks with the coloured sectors configurations used in the interactive device (Fig. 7);
• Rdisk, Gdisk and Bdisk are the brightness of red (R), green (G) and blue (B) primaries in each disk surface.

International Journal on Hands-on Science [ISSN (print): 1646-8937; (online): 1646-8945] Received September 20, 2008; Accepted December 26, 2008. Volume 1, Number 2, December 2008.
The Hands-on Science Network’ 2008 ____________________________________________________________________________________________________________________
73
⎪⎪⎩
⎪⎪⎨
⎧
=+=
=+=
diskdiskdiskmixture
diskdiskdiskmixture
B21B
41B
41B
G21G
41G
41G
diskGB (1)
⎪⎪⎩
⎪⎪⎨
⎧
=+=
=+=
diskdiskdiskmixture
diskdiskdiskmixture
B21B
41B
41B
R21R
41R
41R
diskRB (2)
⎪⎪⎩
⎪⎪⎨
⎧
=+=
=+=
diskdiskdiskmixture
diskdiskdiskmixture
G21G
41G
41G
R21R
41R
41R
diskRG (3)
⎪⎪⎪
⎩
⎪⎪⎪
⎨
⎧
=
=
=
diskmixture
diskmixture
diskmixture
B31B
G31G
R31R
diskRGB (4)
The brightness of the mixture produced by the tricolour RGB disk is only 1/3 of the brightness obtainable with simple additive mixing of its red, green and blue primaries. Moreover, disks use paints and not light sources. Since mixing paints is a “subtraction process due to absorption and scattering, the surface becomes less reflective and can give grayish shades only” [4].
3. Materials used to build the device
The main materials used to build the device were the following:
• 4 metallic disks with RGB sectors (diameter: 10cm) (Fig. 8 and Fig. 9);
• 1 metallic disk with 7 colours in 14 sectors (diameter: 9,7cm) (Fig. 8 and Fig. 9);
• 5 inox push buttons (Fig. 10); • 5 permanent magnet 3V DC motors (Fig.
11); • 5 brass adapters (Fig. 12); • 1 Bonfil wooden sketch box with 39cm x
31cm x 7,5cm (Fig. 13); • 1 DC socket (Fig. 14); • 1 HQ non-regulated 500mA power supply
(3V output selected), ref. P.SUP.02-HQ;
• 1 plywood board with 28,5cm x 36,8cm x 1cm.
Other materials include black paint, glue and
electric wire.
4. Some details on the device construction and operation
The device has five metallic disks with
coloured sectors (Fig. 8). These disks were already described in Section 3. They are activated independently from each other and can rotate all at the same time (Fig. 9).
Figure 8. The device has five metallic disks with coloured sectors
Figure 9. All disks can rotate at the same time
Each disk is set to rotate by pressing a specific push button (Fig. 10), which switches on the DC motor (Fig. 11) attached to the disk. A brass adapter (Fig. 12) was used to attach each disk to its motor.
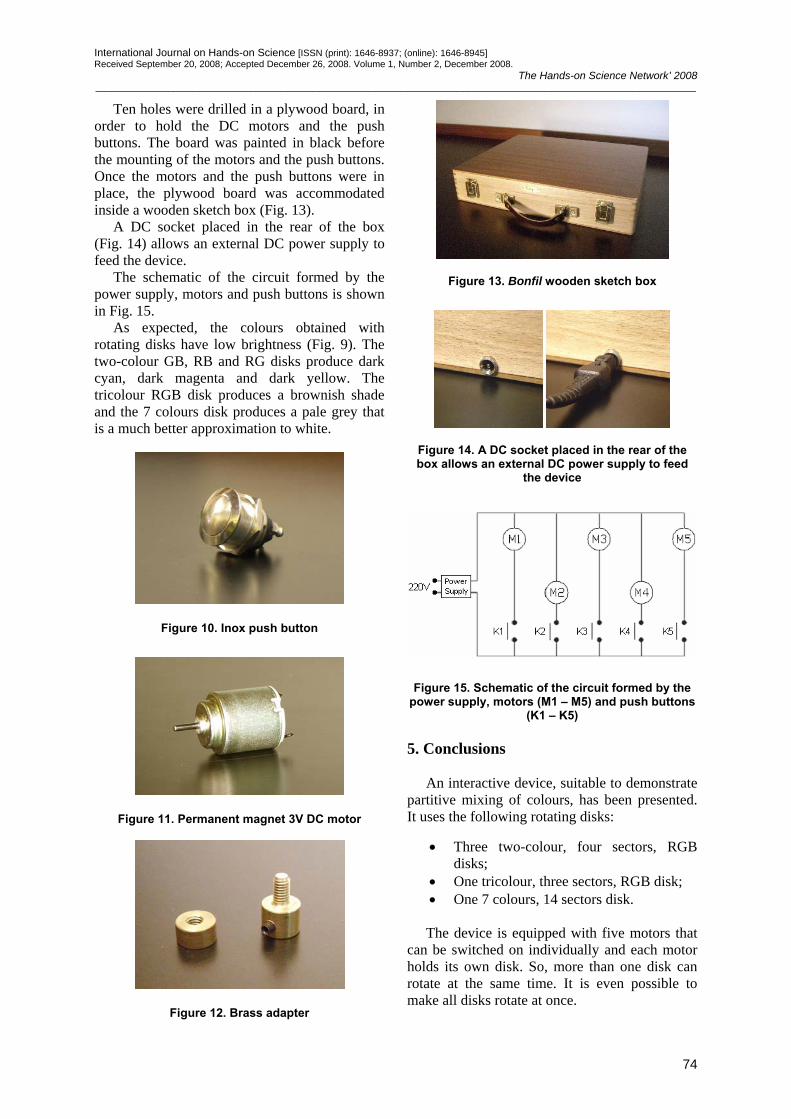
International Journal on Hands-on Science [ISSN (print): 1646-8937; (online): 1646-8945] Received September 20, 2008; Accepted December 26, 2008. Volume 1, Number 2, December 2008.
The Hands-on Science Network’ 2008 ____________________________________________________________________________________________________________________
74
Ten holes were drilled in a plywood board, in order to hold the DC motors and the push buttons. The board was painted in black before the mounting of the motors and the push buttons. Once the motors and the push buttons were in place, the plywood board was accommodated inside a wooden sketch box (Fig. 13).
A DC socket placed in the rear of the box (Fig. 14) allows an external DC power supply to feed the device.
The schematic of the circuit formed by the power supply, motors and push buttons is shown in Fig. 15.
As expected, the colours obtained with rotating disks have low brightness (Fig. 9). The two-colour GB, RB and RG disks produce dark cyan, dark magenta and dark yellow. The tricolour RGB disk produces a brownish shade and the 7 colours disk produces a pale grey that is a much better approximation to white.
Figure 10. Inox push button
Figure 11. Permanent magnet 3V DC motor
Figure 12. Brass adapter
Figure 13. Bonfil wooden sketch box
Figure 14. A DC socket placed in the rear of the box allows an external DC power supply to feed
the device
Figure 15. Schematic of the circuit formed by the power supply, motors (M1 – M5) and push buttons
(K1 – K5)
5. Conclusions
An interactive device, suitable to demonstrate partitive mixing of colours, has been presented. It uses the following rotating disks:
• Three two-colour, four sectors, RGB
disks; • One tricolour, three sectors, RGB disk; • One 7 colours, 14 sectors disk.
The device is equipped with five motors that
can be switched on individually and each motor holds its own disk. So, more than one disk can rotate at the same time. It is even possible to make all disks rotate at once.
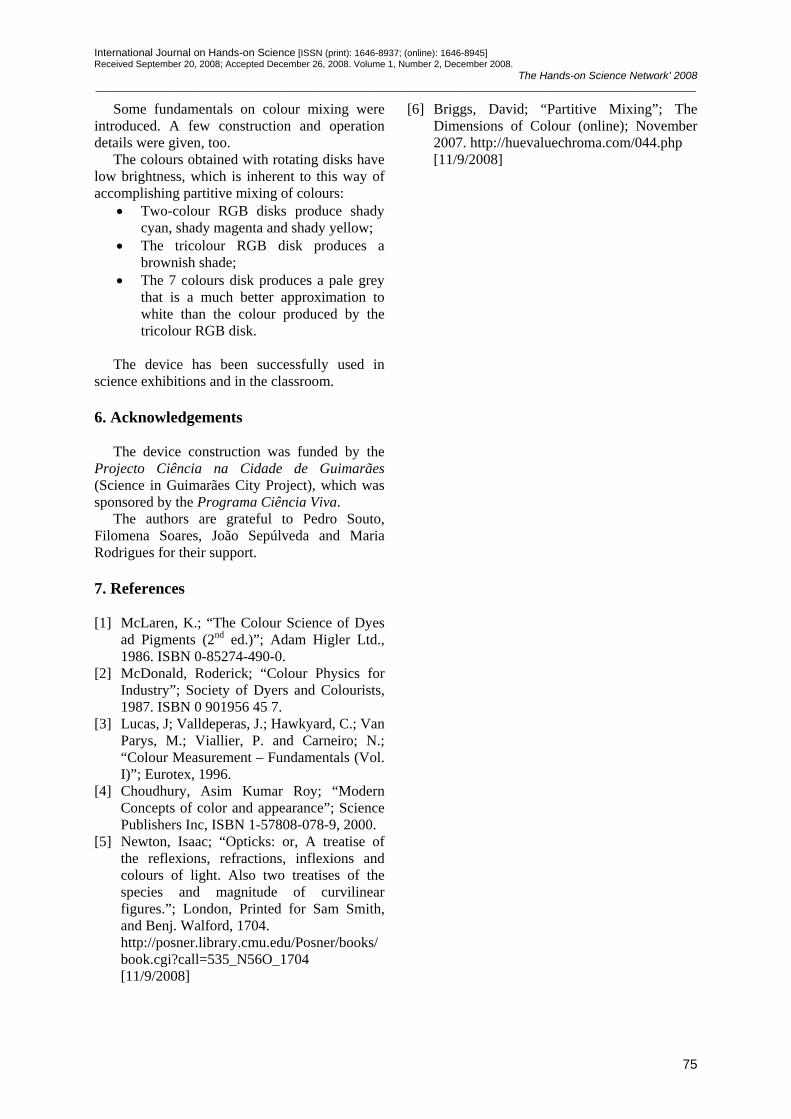
International Journal on Hands-on Science [ISSN (print): 1646-8937; (online): 1646-8945] Received September 20, 2008; Accepted December 26, 2008. Volume 1, Number 2, December 2008.
The Hands-on Science Network’ 2008 ____________________________________________________________________________________________________________________
75
Some fundamentals on colour mixing were introduced. A few construction and operation details were given, too.
The colours obtained with rotating disks have low brightness, which is inherent to this way of accomplishing partitive mixing of colours:
• Two-colour RGB disks produce shady cyan, shady magenta and shady yellow;
• The tricolour RGB disk produces a brownish shade;
• The 7 colours disk produces a pale grey that is a much better approximation to white than the colour produced by the tricolour RGB disk.
The device has been successfully used in
science exhibitions and in the classroom. 6. Acknowledgements
The device construction was funded by the Projecto Ciência na Cidade de Guimarães (Science in Guimarães City Project), which was sponsored by the Programa Ciência Viva.
The authors are grateful to Pedro Souto, Filomena Soares, João Sepúlveda and Maria Rodrigues for their support. 7. References [1] McLaren, K.; “The Colour Science of Dyes
ad Pigments (2nd ed.)”; Adam Higler Ltd., 1986. ISBN 0-85274-490-0.
[2] McDonald, Roderick; “Colour Physics for Industry”; Society of Dyers and Colourists, 1987. ISBN 0 901956 45 7.
[3] Lucas, J; Valldeperas, J.; Hawkyard, C.; Van Parys, M.; Viallier, P. and Carneiro; N.; “Colour Measurement – Fundamentals (Vol. I)”; Eurotex, 1996.
[4] Choudhury, Asim Kumar Roy; “Modern Concepts of color and appearance”; Science Publishers Inc, ISBN 1-57808-078-9, 2000.
[5] Newton, Isaac; “Opticks: or, A treatise of the reflexions, refractions, inflexions and colours of light. Also two treatises of the species and magnitude of curvilinear figures.”; London, Printed for Sam Smith, and Benj. Walford, 1704. http://posner.library.cmu.edu/Posner/books/book.cgi?call=535_N56O_1704 [11/9/2008]
[6] Briggs, David; “Partitive Mixing”; The Dimensions of Colour (online); November 2007. http://huevaluechroma.com/044.php [11/9/2008]
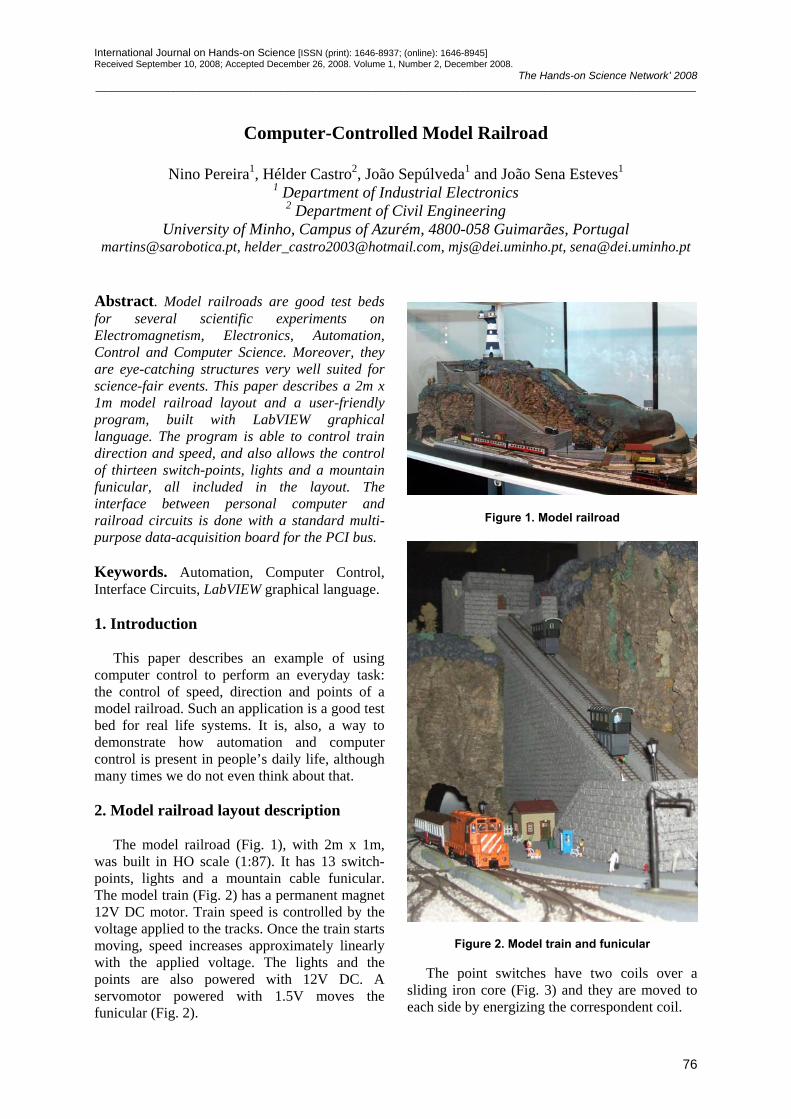
International Journal on Hands-on Science [ISSN (print): 1646-8937; (online): 1646-8945] Received September 10, 2008; Accepted December 26, 2008. Volume 1, Number 2, December 2008.
The Hands-on Science Network’ 2008 ____________________________________________________________________________________________________________________
76
Computer-Controlled Model Railroad
Nino Pereira1, Hélder Castro2, João Sepúlveda1 and João Sena Esteves1
1 Department of Industrial Electronics 2 Department of Civil Engineering
University of Minho, Campus of Azurém, 4800-058 Guimarães, Portugal [email protected], [email protected], [email protected], [email protected]
Abstract. Model railroads are good test beds for several scientific experiments on Electromagnetism, Electronics, Automation, Control and Computer Science. Moreover, they are eye-catching structures very well suited for science-fair events. This paper describes a 2m x 1m model railroad layout and a user-friendly program, built with LabVIEW graphical language. The program is able to control train direction and speed, and also allows the control of thirteen switch-points, lights and a mountain funicular, all included in the layout. The interface between personal computer and railroad circuits is done with a standard multi-purpose data-acquisition board for the PCI bus. Keywords. Automation, Computer Control, Interface Circuits, LabVIEW graphical language. 1. Introduction
This paper describes an example of using computer control to perform an everyday task: the control of speed, direction and points of a model railroad. Such an application is a good test bed for real life systems. It is, also, a way to demonstrate how automation and computer control is present in people’s daily life, although many times we do not even think about that. 2. Model railroad layout description
The model railroad (Fig. 1), with 2m x 1m, was built in HO scale (1:87). It has 13 switch-points, lights and a mountain cable funicular. The model train (Fig. 2) has a permanent magnet 12V DC motor. Train speed is controlled by the voltage applied to the tracks. Once the train starts moving, speed increases approximately linearly with the applied voltage. The lights and the points are also powered with 12V DC. A servomotor powered with 1.5V moves the funicular (Fig. 2).
Figure 1. Model railroad
Figure 2. Model train and funicular
The point switches have two coils over a sliding iron core (Fig. 3) and they are moved to each side by energizing the correspondent coil.
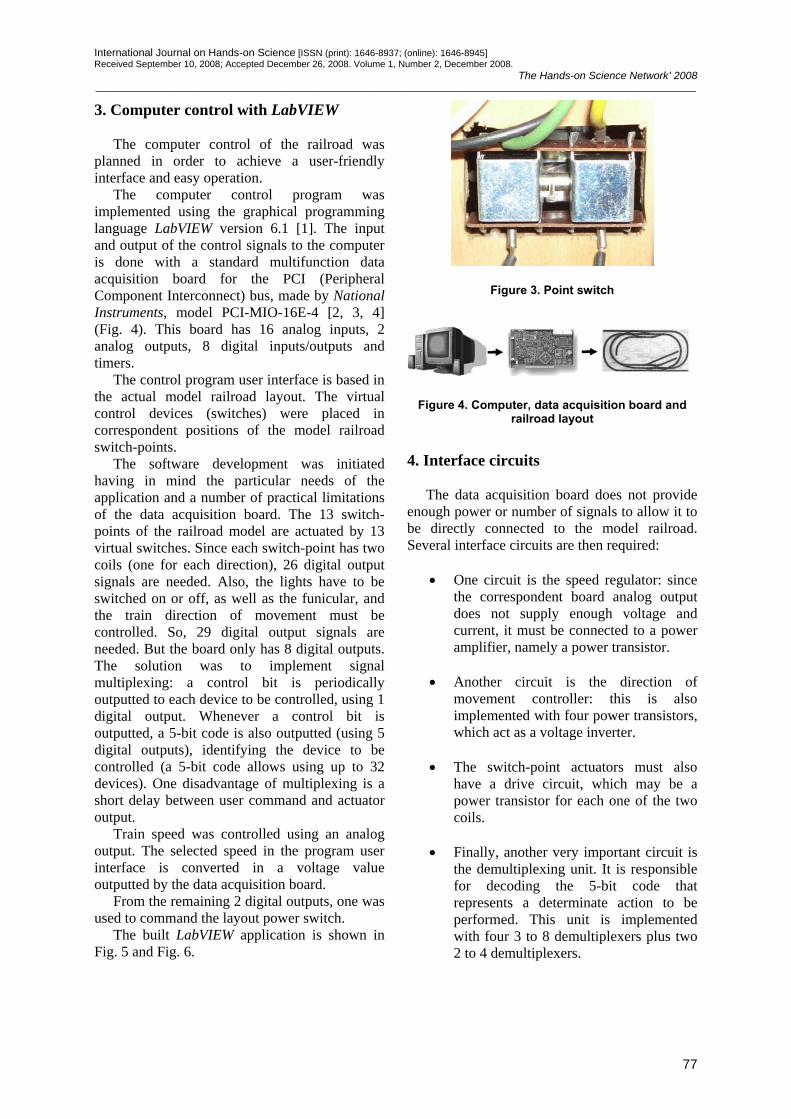
International Journal on Hands-on Science [ISSN (print): 1646-8937; (online): 1646-8945] Received September 10, 2008; Accepted December 26, 2008. Volume 1, Number 2, December 2008.
The Hands-on Science Network’ 2008 ____________________________________________________________________________________________________________________
77
3. Computer control with LabVIEW
The computer control of the railroad was planned in order to achieve a user-friendly interface and easy operation.
The computer control program was implemented using the graphical programming language LabVIEW version 6.1 [1]. The input and output of the control signals to the computer is done with a standard multifunction data acquisition board for the PCI (Peripheral Component Interconnect) bus, made by National Instruments, model PCI-MIO-16E-4 [2, 3, 4] (Fig. 4). This board has 16 analog inputs, 2 analog outputs, 8 digital inputs/outputs and timers.
The control program user interface is based in the actual model railroad layout. The virtual control devices (switches) were placed in correspondent positions of the model railroad switch-points.
The software development was initiated having in mind the particular needs of the application and a number of practical limitations of the data acquisition board. The 13 switch-points of the railroad model are actuated by 13 virtual switches. Since each switch-point has two coils (one for each direction), 26 digital output signals are needed. Also, the lights have to be switched on or off, as well as the funicular, and the train direction of movement must be controlled. So, 29 digital output signals are needed. But the board only has 8 digital outputs. The solution was to implement signal multiplexing: a control bit is periodically outputted to each device to be controlled, using 1 digital output. Whenever a control bit is outputted, a 5-bit code is also outputted (using 5 digital outputs), identifying the device to be controlled (a 5-bit code allows using up to 32 devices). One disadvantage of multiplexing is a short delay between user command and actuator output.
Train speed was controlled using an analog output. The selected speed in the program user interface is converted in a voltage value outputted by the data acquisition board.
From the remaining 2 digital outputs, one was used to command the layout power switch.
The built LabVIEW application is shown in Fig. 5 and Fig. 6.
Figure 3. Point switch
Figure 4. Computer, data acquisition board and railroad layout
4. Interface circuits
The data acquisition board does not provide enough power or number of signals to allow it to be directly connected to the model railroad. Several interface circuits are then required:
• One circuit is the speed regulator: since
the correspondent board analog output does not supply enough voltage and current, it must be connected to a power amplifier, namely a power transistor.
• Another circuit is the direction of
movement controller: this is also implemented with four power transistors, which act as a voltage inverter.
• The switch-point actuators must also
have a drive circuit, which may be a power transistor for each one of the two coils.
• Finally, another very important circuit is
the demultiplexing unit. It is responsible for decoding the 5-bit code that represents a determinate action to be performed. This unit is implemented with four 3 to 8 demultiplexers plus two 2 to 4 demultiplexers.
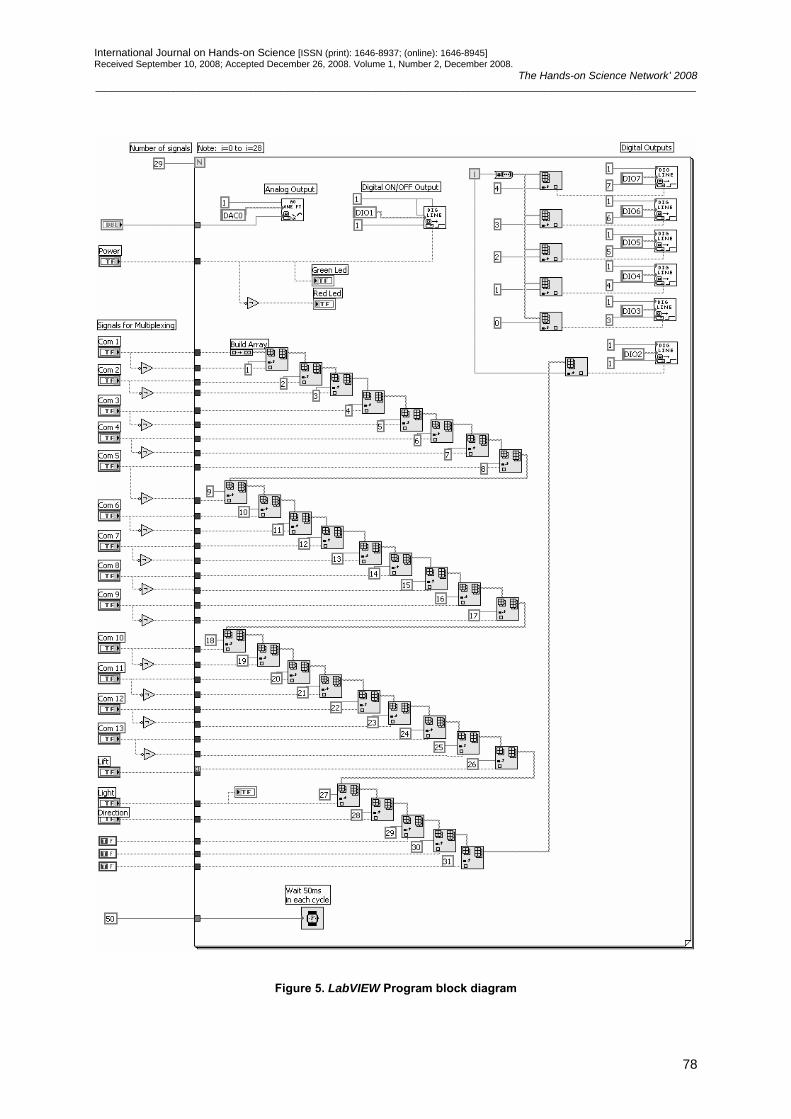
International Journal on Hands-on Science [ISSN (print): 1646-8937; (online): 1646-8945] Received September 10, 2008; Accepted December 26, 2008. Volume 1, Number 2, December 2008.
The Hands-on Science Network’ 2008 ____________________________________________________________________________________________________________________
78
Figure 5. LabVIEW Program block diagram
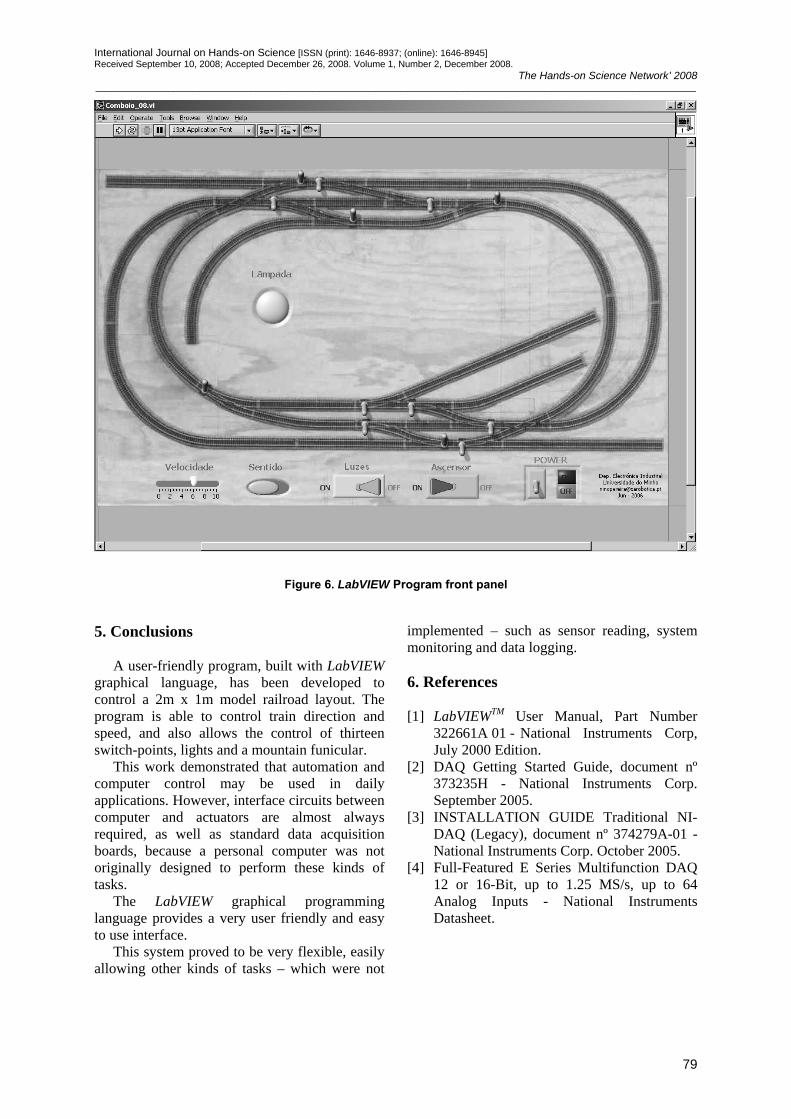
International Journal on Hands-on Science [ISSN (print): 1646-8937; (online): 1646-8945] Received September 10, 2008; Accepted December 26, 2008. Volume 1, Number 2, December 2008.
The Hands-on Science Network’ 2008 ____________________________________________________________________________________________________________________
79
Figure 6. LabVIEW Program front panel
5. Conclusions
A user-friendly program, built with LabVIEW graphical language, has been developed to control a 2m x 1m model railroad layout. The program is able to control train direction and speed, and also allows the control of thirteen switch-points, lights and a mountain funicular.
This work demonstrated that automation and computer control may be used in daily applications. However, interface circuits between computer and actuators are almost always required, as well as standard data acquisition boards, because a personal computer was not originally designed to perform these kinds of tasks.
The LabVIEW graphical programming language provides a very user friendly and easy to use interface.
This system proved to be very flexible, easily allowing other kinds of tasks – which were not
implemented – such as sensor reading, system monitoring and data logging.
6. References [1] LabVIEWTM User Manual, Part Number
322661A 01 - National Instruments Corp, July 2000 Edition.
[2] DAQ Getting Started Guide, document nº 373235H - National Instruments Corp. September 2005.
[3] INSTALLATION GUIDE Traditional NI-DAQ (Legacy), document nº 374279A-01 - National Instruments Corp. October 2005.
[4] Full-Featured E Series Multifunction DAQ 12 or 16-Bit, up to 1.25 MS/s, up to 64 Analog Inputs - National Instruments Datasheet.
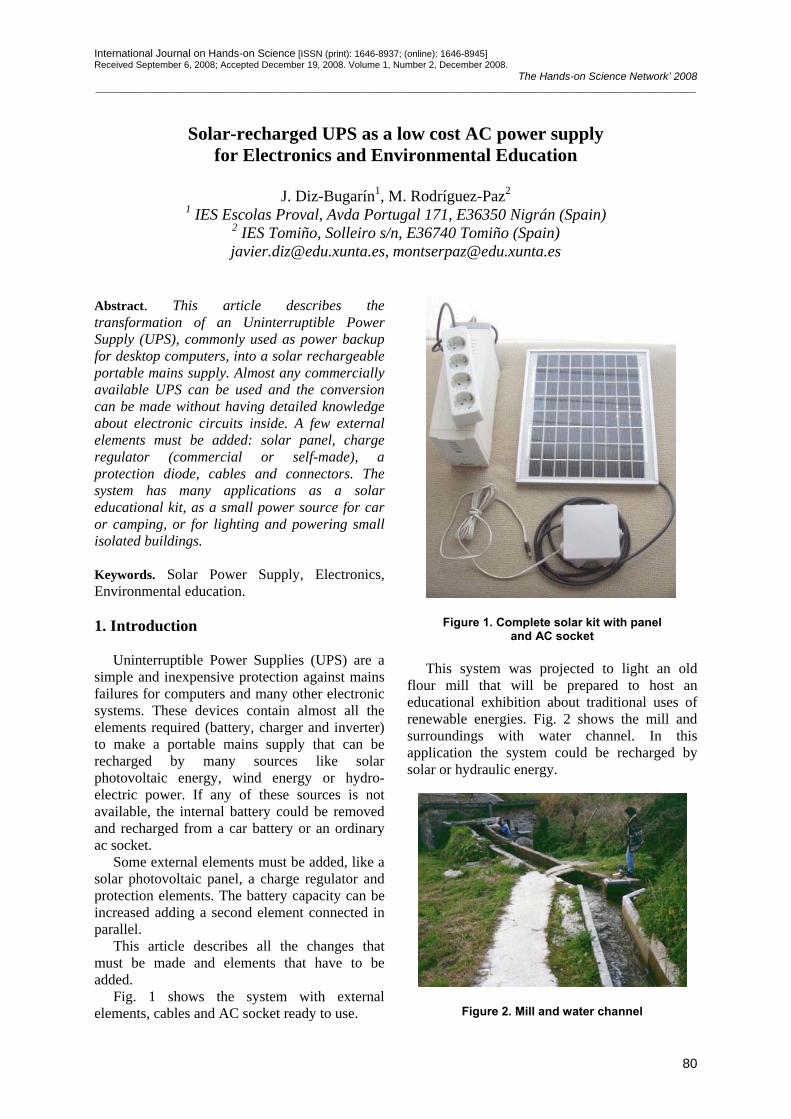
International Journal on Hands-on Science [ISSN (print): 1646-8937; (online): 1646-8945] Received September 6, 2008; Accepted December 19, 2008. Volume 1, Number 2, December 2008.
The Hands-on Science Network’ 2008 ____________________________________________________________________________________________________________________
80
Solar-recharged UPS as a low cost AC power supply
for Electronics and Environmental Education
J. Diz-Bugarín1, M. Rodríguez-Paz2
1 IES Escolas Proval, Avda Portugal 171, E36350 Nigrán (Spain) 2 IES Tomiño, Solleiro s/n, E36740 Tomiño (Spain) [email protected], [email protected]
Abstract. This article describes the transformation of an Uninterruptible Power Supply (UPS), commonly used as power backup for desktop computers, into a solar rechargeable portable mains supply. Almost any commercially available UPS can be used and the conversion can be made without having detailed knowledge about electronic circuits inside. A few external elements must be added: solar panel, charge regulator (commercial or self-made), a protection diode, cables and connectors. The system has many applications as a solar educational kit, as a small power source for car or camping, or for lighting and powering small isolated buildings. Keywords. Solar Power Supply, Electronics, Environmental education. 1. Introduction
Uninterruptible Power Supplies (UPS) are a simple and inexpensive protection against mains failures for computers and many other electronic systems. These devices contain almost all the elements required (battery, charger and inverter) to make a portable mains supply that can be recharged by many sources like solar photovoltaic energy, wind energy or hydro-electric power. If any of these sources is not available, the internal battery could be removed and recharged from a car battery or an ordinary ac socket.
Some external elements must be added, like a solar photovoltaic panel, a charge regulator and protection elements. The battery capacity can be increased adding a second element connected in parallel.
This article describes all the changes that must be made and elements that have to be added.
Fig. 1 shows the system with external elements, cables and AC socket ready to use.
Figure 1. Complete solar kit with panel and AC socket
This system was projected to light an old
flour mill that will be prepared to host an educational exhibition about traditional uses of renewable energies. Fig. 2 shows the mill and surroundings with water channel. In this application the system could be recharged by solar or hydraulic energy.
Figure 2. Mill and water channel
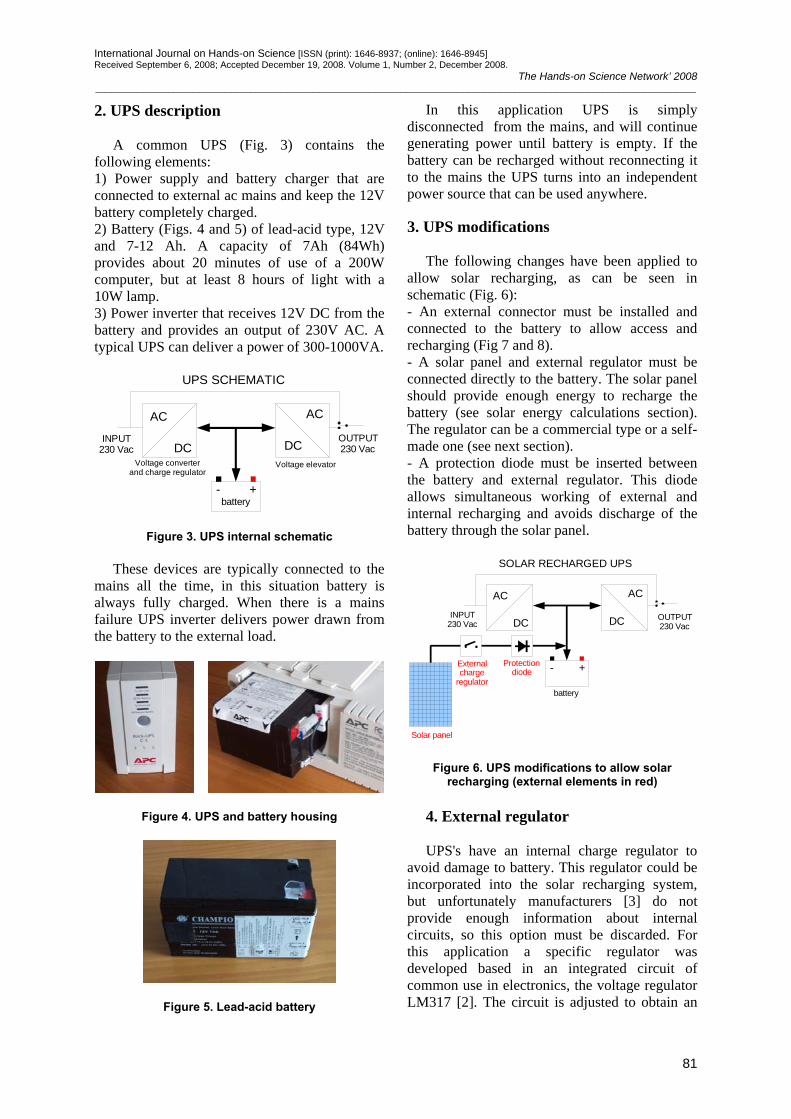
International Journal on Hands-on Science [ISSN (print): 1646-8937; (online): 1646-8945] Received September 6, 2008; Accepted December 19, 2008. Volume 1, Number 2, December 2008.
The Hands-on Science Network’ 2008 ____________________________________________________________________________________________________________________
81
2. UPS description
A common UPS (Fig. 3) contains the following elements: 1) Power supply and battery charger that are connected to external ac mains and keep the 12V battery completely charged. 2) Battery (Figs. 4 and 5) of lead-acid type, 12V and 7-12 Ah. A capacity of 7Ah (84Wh) provides about 20 minutes of use of a 200W computer, but at least 8 hours of light with a 10W lamp. 3) Power inverter that receives 12V DC from the battery and provides an output of 230V AC. A typical UPS can deliver a power of 300-1000VA.
AC
DC
- +battery
UPS SCHEMATIC
AC
DCVoltage converter
and charge regulatorVoltage elevator
INPUT230 Vac
OUTPUT230 Vac
Figure 3. UPS internal schematic These devices are typically connected to the
mains all the time, in this situation battery is always fully charged. When there is a mains failure UPS inverter delivers power drawn from the battery to the external load.
Figure 4. UPS and battery housing
Figure 5. Lead-acid battery
In this application UPS is simply disconnected from the mains, and will continue generating power until battery is empty. If the battery can be recharged without reconnecting it to the mains the UPS turns into an independent power source that can be used anywhere.
3. UPS modifications
The following changes have been applied to allow solar recharging, as can be seen in schematic (Fig. 6): - An external connector must be installed and connected to the battery to allow access and recharging (Fig 7 and 8). - A solar panel and external regulator must be connected directly to the battery. The solar panel should provide enough energy to recharge the battery (see solar energy calculations section). The regulator can be a commercial type or a self-made one (see next section). - A protection diode must be inserted between the battery and external regulator. This diode allows simultaneous working of external and internal recharging and avoids discharge of the battery through the solar panel.
- +
battery
SOLAR RECHARGED UPS
Protectiondiode
Externalcharge
regulator
Solar panel
AC
DCINPUT
230 Vac
AC
DC OUTPUT230 Vac
Figure 6. UPS modifications to allow solar recharging (external elements in red)
4. External regulator
UPS's have an internal charge regulator to
avoid damage to battery. This regulator could be incorporated into the solar recharging system, but unfortunately manufacturers [3] do not provide enough information about internal circuits, so this option must be discarded. For this application a specific regulator was developed based in an integrated circuit of common use in electronics, the voltage regulator LM317 [2]. The circuit is adjusted to obtain an
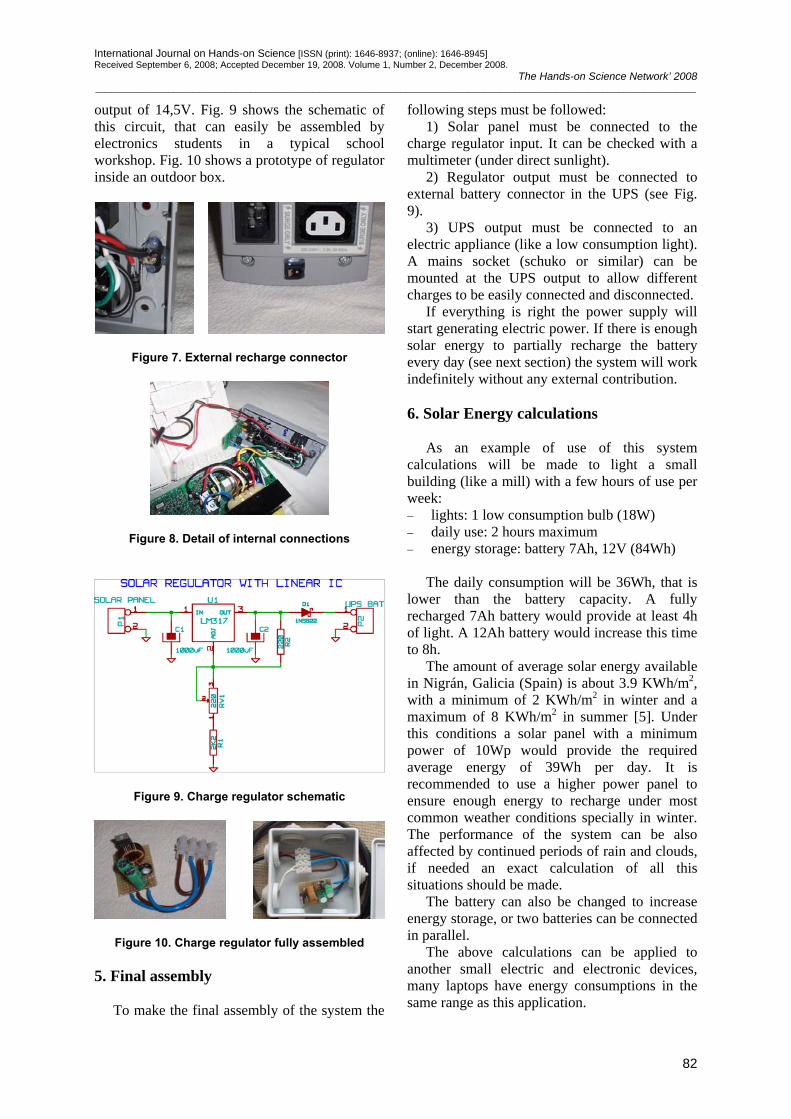
International Journal on Hands-on Science [ISSN (print): 1646-8937; (online): 1646-8945] Received September 6, 2008; Accepted December 19, 2008. Volume 1, Number 2, December 2008.
The Hands-on Science Network’ 2008 ____________________________________________________________________________________________________________________
82
output of 14,5V. Fig. 9 shows the schematic of this circuit, that can easily be assembled by electronics students in a typical school workshop. Fig. 10 shows a prototype of regulator inside an outdoor box.
Figure 7. External recharge connector
Figure 8. Detail of internal connections
Figure 9. Charge regulator schematic
Figure 10. Charge regulator fully assembled 5. Final assembly
To make the final assembly of the system the
following steps must be followed: 1) Solar panel must be connected to the
charge regulator input. It can be checked with a multimeter (under direct sunlight).
2) Regulator output must be connected to external battery connector in the UPS (see Fig. 9).
3) UPS output must be connected to an electric appliance (like a low consumption light). A mains socket (schuko or similar) can be mounted at the UPS output to allow different charges to be easily connected and disconnected.
If everything is right the power supply will start generating electric power. If there is enough solar energy to partially recharge the battery every day (see next section) the system will work indefinitely without any external contribution.
6. Solar Energy calculations
As an example of use of this system calculations will be made to light a small building (like a mill) with a few hours of use per week: − lights: 1 low consumption bulb (18W) − daily use: 2 hours maximum − energy storage: battery 7Ah, 12V (84Wh)
The daily consumption will be 36Wh, that is
lower than the battery capacity. A fully recharged 7Ah battery would provide at least 4h of light. A 12Ah battery would increase this time to 8h.
The amount of average solar energy available in Nigrán, Galicia (Spain) is about 3.9 KWh/m2, with a minimum of 2 KWh/m2 in winter and a maximum of 8 KWh/m2 in summer [5]. Under this conditions a solar panel with a minimum power of 10Wp would provide the required average energy of 39Wh per day. It is recommended to use a higher power panel to ensure enough energy to recharge under most common weather conditions specially in winter. The performance of the system can be also affected by continued periods of rain and clouds, if needed an exact calculation of all this situations should be made.
The battery can also be changed to increase energy storage, or two batteries can be connected in parallel.
The above calculations can be applied to another small electric and electronic devices, many laptops have energy consumptions in the same range as this application.
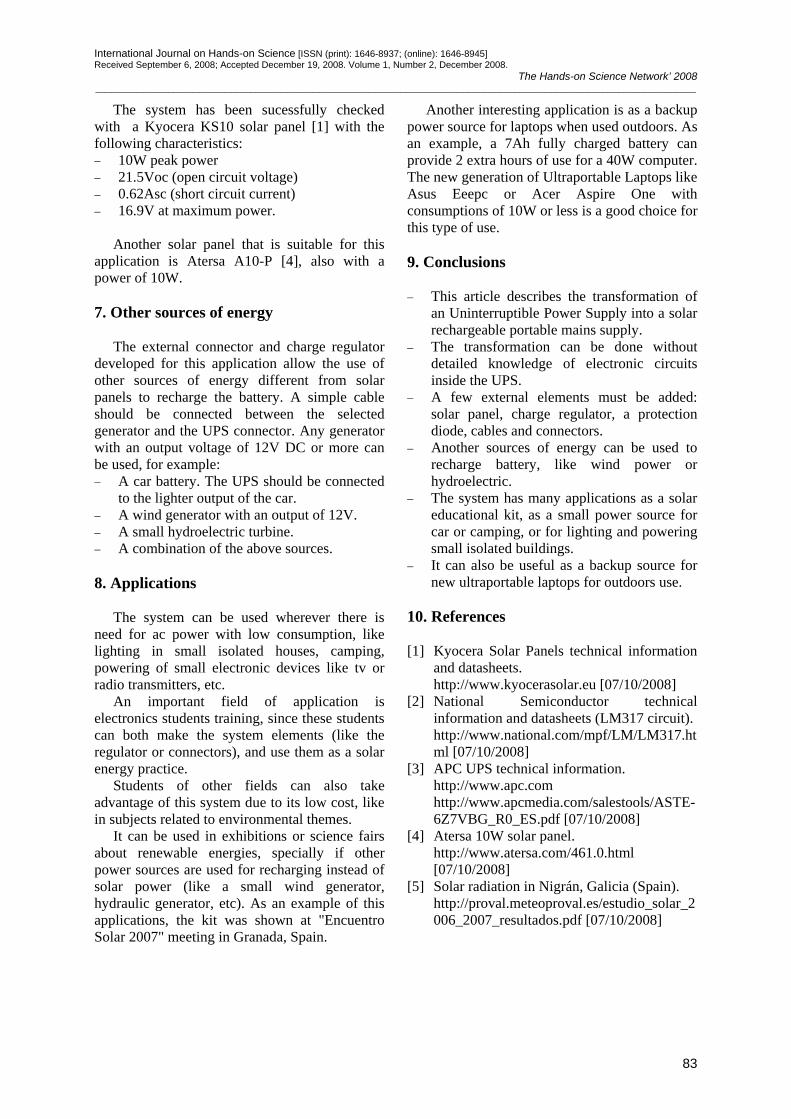
International Journal on Hands-on Science [ISSN (print): 1646-8937; (online): 1646-8945] Received September 6, 2008; Accepted December 19, 2008. Volume 1, Number 2, December 2008.
The Hands-on Science Network’ 2008 ____________________________________________________________________________________________________________________
83
The system has been sucessfully checked with a Kyocera KS10 solar panel [1] with the following characteristics: − 10W peak power − 21.5Voc (open circuit voltage) − 0.62Asc (short circuit current) − 16.9V at maximum power.
Another solar panel that is suitable for this
application is Atersa A10-P [4], also with a power of 10W.
7. Other sources of energy
The external connector and charge regulator developed for this application allow the use of other sources of energy different from solar panels to recharge the battery. A simple cable should be connected between the selected generator and the UPS connector. Any generator with an output voltage of 12V DC or more can be used, for example: − A car battery. The UPS should be connected
to the lighter output of the car. − A wind generator with an output of 12V. − A small hydroelectric turbine. − A combination of the above sources.
8. Applications
The system can be used wherever there is need for ac power with low consumption, like lighting in small isolated houses, camping, powering of small electronic devices like tv or radio transmitters, etc.
An important field of application is electronics students training, since these students can both make the system elements (like the regulator or connectors), and use them as a solar energy practice.
Students of other fields can also take advantage of this system due to its low cost, like in subjects related to environmental themes.
It can be used in exhibitions or science fairs about renewable energies, specially if other power sources are used for recharging instead of solar power (like a small wind generator, hydraulic generator, etc). As an example of this applications, the kit was shown at "Encuentro Solar 2007" meeting in Granada, Spain.
Another interesting application is as a backup power source for laptops when used outdoors. As an example, a 7Ah fully charged battery can provide 2 extra hours of use for a 40W computer. The new generation of Ultraportable Laptops like Asus Eeepc or Acer Aspire One with consumptions of 10W or less is a good choice for this type of use.
9. Conclusions
− This article describes the transformation of
an Uninterruptible Power Supply into a solar rechargeable portable mains supply.
− The transformation can be done without detailed knowledge of electronic circuits inside the UPS.
− A few external elements must be added: solar panel, charge regulator, a protection diode, cables and connectors.
− Another sources of energy can be used to recharge battery, like wind power or hydroelectric.
− The system has many applications as a solar educational kit, as a small power source for car or camping, or for lighting and powering small isolated buildings.
− It can also be useful as a backup source for new ultraportable laptops for outdoors use.
10. References [1] Kyocera Solar Panels technical information
and datasheets. http://www.kyocerasolar.eu [07/10/2008]
[2] National Semiconductor technical information and datasheets (LM317 circuit). http://www.national.com/mpf/LM/LM317.html [07/10/2008]
[3] APC UPS technical information. http://www.apc.com http://www.apcmedia.com/salestools/ASTE-6Z7VBG_R0_ES.pdf [07/10/2008]
[4] Atersa 10W solar panel. http://www.atersa.com/461.0.html [07/10/2008]
[5] Solar radiation in Nigrán, Galicia (Spain). http://proval.meteoproval.es/estudio_solar_2006_2007_resultados.pdf [07/10/2008]
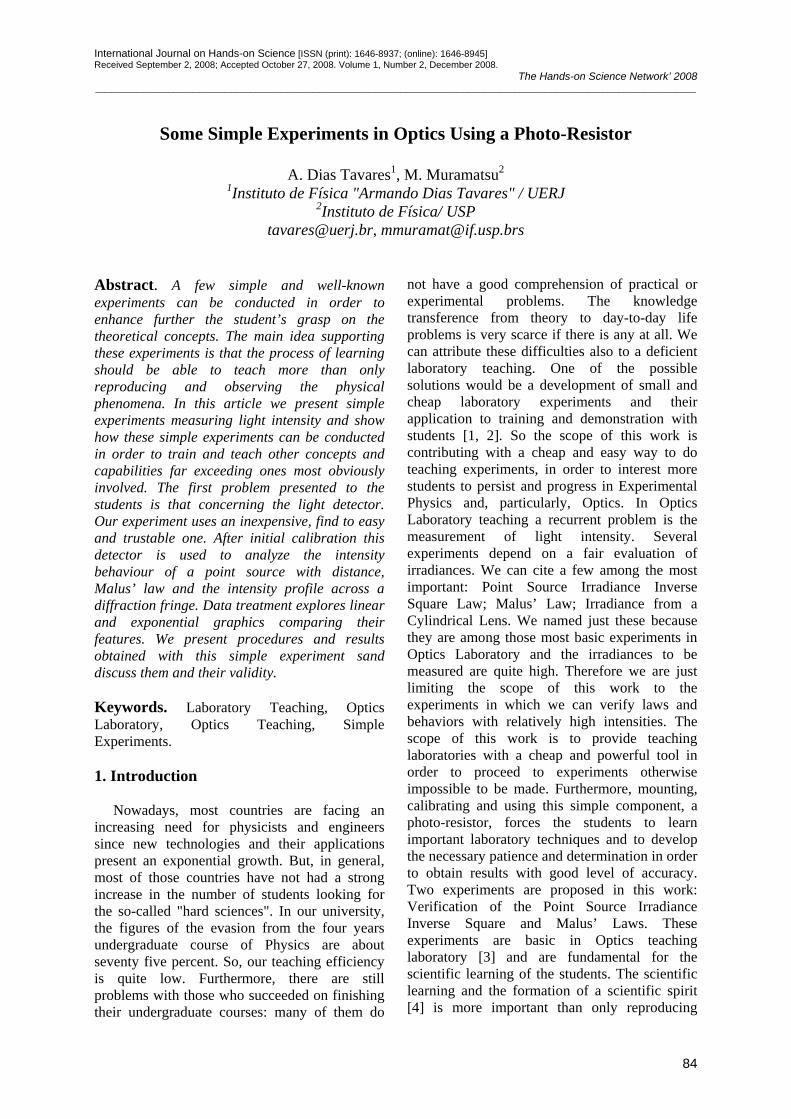
International Journal on Hands-on Science [ISSN (print): 1646-8937; (online): 1646-8945] Received September 2, 2008; Accepted October 27, 2008. Volume 1, Number 2, December 2008.
The Hands-on Science Network’ 2008 ____________________________________________________________________________________________________________________
84
Some Simple Experiments in Optics Using a Photo-Resistor
A. Dias Tavares1, M. Muramatsu2
1Instituto de Física "Armando Dias Tavares" / UERJ 2Instituto de Física/ USP
[email protected], [email protected]
Abstract. A few simple and well-known experiments can be conducted in order to enhance further the student’s grasp on the theoretical concepts. The main idea supporting these experiments is that the process of learning should be able to teach more than only reproducing and observing the physical phenomena. In this article we present simple experiments measuring light intensity and show how these simple experiments can be conducted in order to train and teach other concepts and capabilities far exceeding ones most obviously involved. The first problem presented to the students is that concerning the light detector. Our experiment uses an inexpensive, find to easy and trustable one. After initial calibration this detector is used to analyze the intensity behaviour of a point source with distance, Malus’ law and the intensity profile across a diffraction fringe. Data treatment explores linear and exponential graphics comparing their features. We present procedures and results obtained with this simple experiment sand discuss them and their validity. Keywords. Laboratory Teaching, Optics Laboratory, Optics Teaching, Simple Experiments. 1. Introduction
Nowadays, most countries are facing an increasing need for physicists and engineers since new technologies and their applications present an exponential growth. But, in general, most of those countries have not had a strong increase in the number of students looking for the so-called "hard sciences". In our university, the figures of the evasion from the four years undergraduate course of Physics are about seventy five percent. So, our teaching efficiency is quite low. Furthermore, there are still problems with those who succeeded on finishing their undergraduate courses: many of them do
not have a good comprehension of practical or experimental problems. The knowledge transference from theory to day-to-day life problems is very scarce if there is any at all. We can attribute these difficulties also to a deficient laboratory teaching. One of the possible solutions would be a development of small and cheap laboratory experiments and their application to training and demonstration with students [1, 2]. So the scope of this work is contributing with a cheap and easy way to do teaching experiments, in order to interest more students to persist and progress in Experimental Physics and, particularly, Optics. In Optics Laboratory teaching a recurrent problem is the measurement of light intensity. Several experiments depend on a fair evaluation of irradiances. We can cite a few among the most important: Point Source Irradiance Inverse Square Law; Malus’ Law; Irradiance from a Cylindrical Lens. We named just these because they are among those most basic experiments in Optics Laboratory and the irradiances to be measured are quite high. Therefore we are just limiting the scope of this work to the experiments in which we can verify laws and behaviors with relatively high intensities. The scope of this work is to provide teaching laboratories with a cheap and powerful tool in order to proceed to experiments otherwise impossible to be made. Furthermore, mounting, calibrating and using this simple component, a photo-resistor, forces the students to learn important laboratory techniques and to develop the necessary patience and determination in order to obtain results with good level of accuracy. Two experiments are proposed in this work: Verification of the Point Source Irradiance Inverse Square and Malus’ Laws. These experiments are basic in Optics teaching laboratory [3] and are fundamental for the scientific learning of the students. The scientific learning and the formation of a scientific spirit [4] is more important than only reproducing
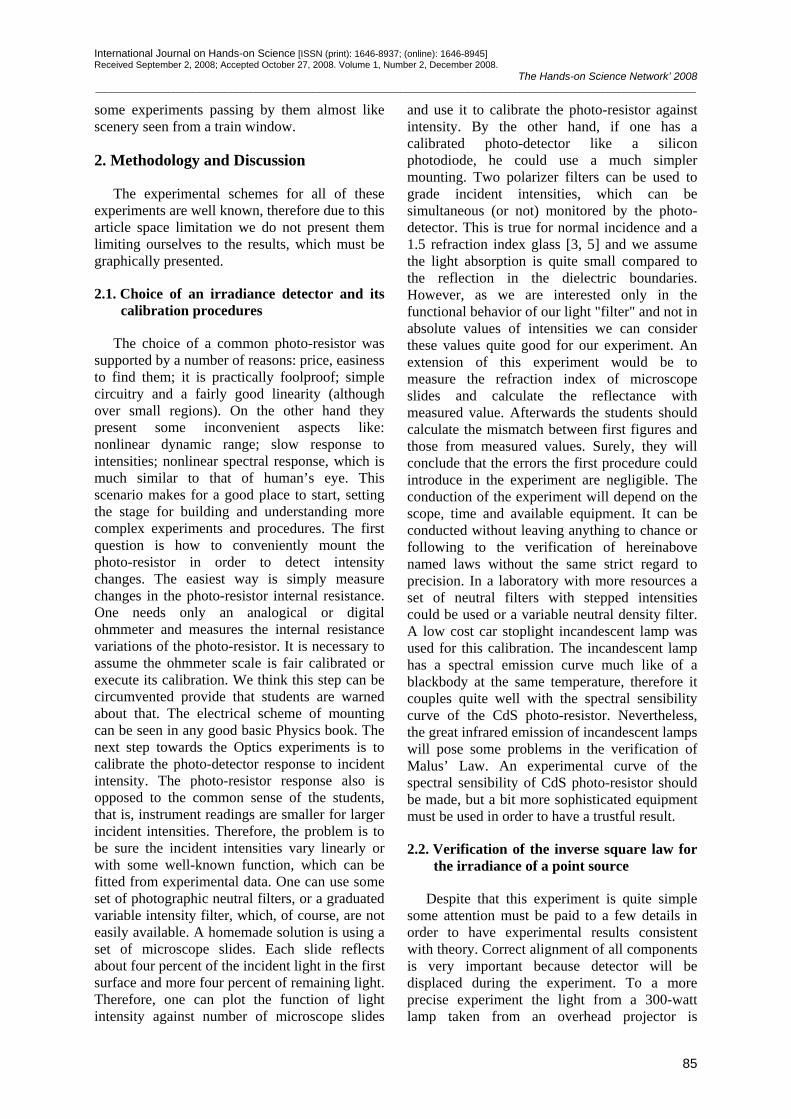
International Journal on Hands-on Science [ISSN (print): 1646-8937; (online): 1646-8945] Received September 2, 2008; Accepted October 27, 2008. Volume 1, Number 2, December 2008.
The Hands-on Science Network’ 2008 ____________________________________________________________________________________________________________________
85
some experiments passing by them almost like scenery seen from a train window.
2. Methodology and Discussion
The experimental schemes for all of these experiments are well known, therefore due to this article space limitation we do not present them limiting ourselves to the results, which must be graphically presented.
2.1. Choice of an irradiance detector and its calibration procedures
The choice of a common photo-resistor was supported by a number of reasons: price, easiness to find them; it is practically foolproof; simple circuitry and a fairly good linearity (although over small regions). On the other hand they present some inconvenient aspects like: nonlinear dynamic range; slow response to intensities; nonlinear spectral response, which is much similar to that of human’s eye. This scenario makes for a good place to start, setting the stage for building and understanding more complex experiments and procedures. The first question is how to conveniently mount the photo-resistor in order to detect intensity changes. The easiest way is simply measure changes in the photo-resistor internal resistance. One needs only an analogical or digital ohmmeter and measures the internal resistance variations of the photo-resistor. It is necessary to assume the ohmmeter scale is fair calibrated or execute its calibration. We think this step can be circumvented provide that students are warned about that. The electrical scheme of mounting can be seen in any good basic Physics book. The next step towards the Optics experiments is to calibrate the photo-detector response to incident intensity. The photo-resistor response also is opposed to the common sense of the students, that is, instrument readings are smaller for larger incident intensities. Therefore, the problem is to be sure the incident intensities vary linearly or with some well-known function, which can be fitted from experimental data. One can use some set of photographic neutral filters, or a graduated variable intensity filter, which, of course, are not easily available. A homemade solution is using a set of microscope slides. Each slide reflects about four percent of the incident light in the first surface and more four percent of remaining light. Therefore, one can plot the function of light intensity against number of microscope slides
and use it to calibrate the photo-resistor against intensity. By the other hand, if one has a calibrated photo-detector like a silicon photodiode, he could use a much simpler mounting. Two polarizer filters can be used to grade incident intensities, which can be simultaneous (or not) monitored by the photo-detector. This is true for normal incidence and a 1.5 refraction index glass [3, 5] and we assume the light absorption is quite small compared to the reflection in the dielectric boundaries. However, as we are interested only in the functional behavior of our light "filter" and not in absolute values of intensities we can consider these values quite good for our experiment. An extension of this experiment would be to measure the refraction index of microscope slides and calculate the reflectance with measured value. Afterwards the students should calculate the mismatch between first figures and those from measured values. Surely, they will conclude that the errors the first procedure could introduce in the experiment are negligible. The conduction of the experiment will depend on the scope, time and available equipment. It can be conducted without leaving anything to chance or following to the verification of hereinabove named laws without the same strict regard to precision. In a laboratory with more resources a set of neutral filters with stepped intensities could be used or a variable neutral density filter. A low cost car stoplight incandescent lamp was used for this calibration. The incandescent lamp has a spectral emission curve much like of a blackbody at the same temperature, therefore it couples quite well with the spectral sensibility curve of the CdS photo-resistor. Nevertheless, the great infrared emission of incandescent lamps will pose some problems in the verification of Malus’ Law. An experimental curve of the spectral sensibility of CdS photo-resistor should be made, but a bit more sophisticated equipment must be used in order to have a trustful result.
2.2. Verification of the inverse square law for the irradiance of a point source
Despite that this experiment is quite simple some attention must be paid to a few details in order to have experimental results consistent with theory. Correct alignment of all components is very important because detector will be displaced during the experiment. To a more precise experiment the light from a 300-watt lamp taken from an overhead projector is
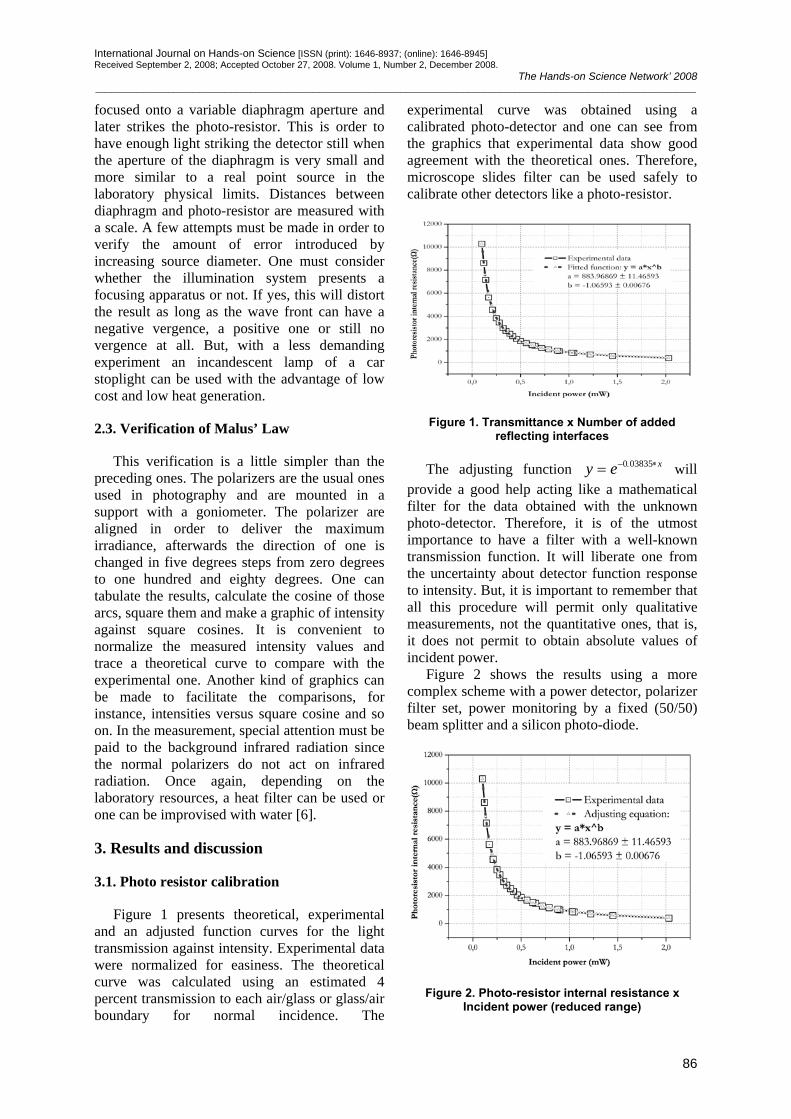
International Journal on Hands-on Science [ISSN (print): 1646-8937; (online): 1646-8945] Received September 2, 2008; Accepted October 27, 2008. Volume 1, Number 2, December 2008.
The Hands-on Science Network’ 2008 ____________________________________________________________________________________________________________________
86
focused onto a variable diaphragm aperture and later strikes the photo-resistor. This is order to have enough light striking the detector still when the aperture of the diaphragm is very small and more similar to a real point source in the laboratory physical limits. Distances between diaphragm and photo-resistor are measured with a scale. A few attempts must be made in order to verify the amount of error introduced by increasing source diameter. One must consider whether the illumination system presents a focusing apparatus or not. If yes, this will distort the result as long as the wave front can have a negative vergence, a positive one or still no vergence at all. But, with a less demanding experiment an incandescent lamp of a car stoplight can be used with the advantage of low cost and low heat generation.
2.3. Verification of Malus’ Law
This verification is a little simpler than the preceding ones. The polarizers are the usual ones used in photography and are mounted in a support with a goniometer. The polarizer are aligned in order to deliver the maximum irradiance, afterwards the direction of one is changed in five degrees steps from zero degrees to one hundred and eighty degrees. One can tabulate the results, calculate the cosine of those arcs, square them and make a graphic of intensity against square cosines. It is convenient to normalize the measured intensity values and trace a theoretical curve to compare with the experimental one. Another kind of graphics can be made to facilitate the comparisons, for instance, intensities versus square cosine and so on. In the measurement, special attention must be paid to the background infrared radiation since the normal polarizers do not act on infrared radiation. Once again, depending on the laboratory resources, a heat filter can be used or one can be improvised with water [6].
3. Results and discussion
3.1. Photo resistor calibration
Figure 1 presents theoretical, experimental and an adjusted function curves for the light transmission against intensity. Experimental data were normalized for easiness. The theoretical curve was calculated using an estimated 4 percent transmission to each air/glass or glass/air boundary for normal incidence. The
experimental curve was obtained using a calibrated photo-detector and one can see from the graphics that experimental data show good agreement with the theoretical ones. Therefore, microscope slides filter can be used safely to calibrate other detectors like a photo-resistor.
Figure 1. Transmittance x Number of added reflecting interfaces
The adjusting function 0 03835 xy e− . ∗= will
provide a good help acting like a mathematical filter for the data obtained with the unknown photo-detector. Therefore, it is of the utmost importance to have a filter with a well-known transmission function. It will liberate one from the uncertainty about detector function response to intensity. But, it is important to remember that all this procedure will permit only qualitative measurements, not the quantitative ones, that is, it does not permit to obtain absolute values of incident power.
Figure 2 shows the results using a more complex scheme with a power detector, polarizer filter set, power monitoring by a fixed (50/50) beam splitter and a silicon photo-diode.
Figure 2. Photo-resistor internal resistance x Incident power (reduced range)
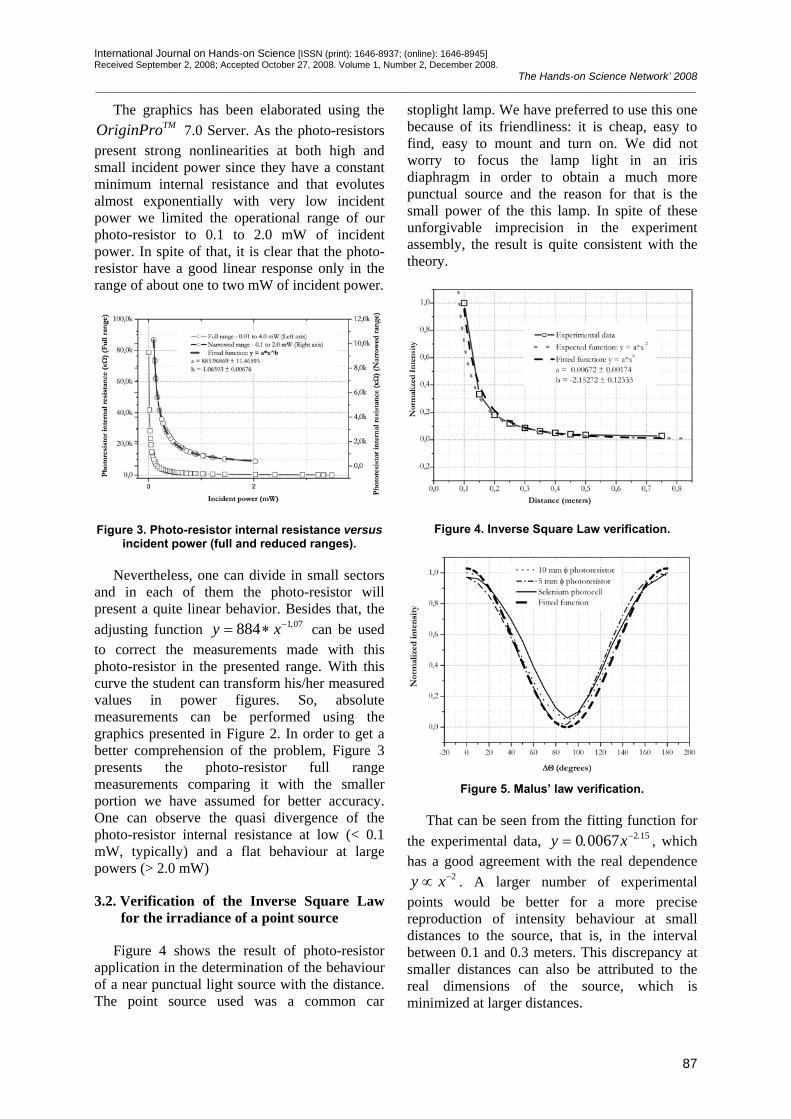
International Journal on Hands-on Science [ISSN (print): 1646-8937; (online): 1646-8945] Received September 2, 2008; Accepted October 27, 2008. Volume 1, Number 2, December 2008.
The Hands-on Science Network’ 2008 ____________________________________________________________________________________________________________________
87
The graphics has been elaborated using the TMOriginPro 7.0 Server. As the photo-resistors
present strong nonlinearities at both high and small incident power since they have a constant minimum internal resistance and that evolutes almost exponentially with very low incident power we limited the operational range of our photo-resistor to 0.1 to 2.0 mW of incident power. In spite of that, it is clear that the photo-resistor have a good linear response only in the range of about one to two mW of incident power.
Figure 3. Photo-resistor internal resistance versus incident power (full and reduced ranges).
Nevertheless, one can divide in small sectors and in each of them the photo-resistor will present a quite linear behavior. Besides that, the adjusting function 1 07884y x− ,= ∗ can be used to correct the measurements made with this photo-resistor in the presented range. With this curve the student can transform his/her measured values in power figures. So, absolute measurements can be performed using the graphics presented in Figure 2. In order to get a better comprehension of the problem, Figure 3 presents the photo-resistor full range measurements comparing it with the smaller portion we have assumed for better accuracy. One can observe the quasi divergence of the photo-resistor internal resistance at low (< 0.1 mW, typically) and a flat behaviour at large powers (> 2.0 mW)
3.2. Verification of the Inverse Square Law for the irradiance of a point source
Figure 4 shows the result of photo-resistor application in the determination of the behaviour of a near punctual light source with the distance. The point source used was a common car
stoplight lamp. We have preferred to use this one because of its friendliness: it is cheap, easy to find, easy to mount and turn on. We did not worry to focus the lamp light in an iris diaphragm in order to obtain a much more punctual source and the reason for that is the small power of the this lamp. In spite of these unforgivable imprecision in the experiment assembly, the result is quite consistent with the theory.
Figure 4. Inverse Square Law verification.
Figure 5. Malus’ law verification.
That can be seen from the fitting function for the experimental data, 2 150 0067y x− .= . , which has a good agreement with the real dependence
2y x−∝ . A larger number of experimental points would be better for a more precise reproduction of intensity behaviour at small distances to the source, that is, in the interval between 0.1 and 0.3 meters. This discrepancy at smaller distances can also be attributed to the real dimensions of the source, which is minimized at larger distances.
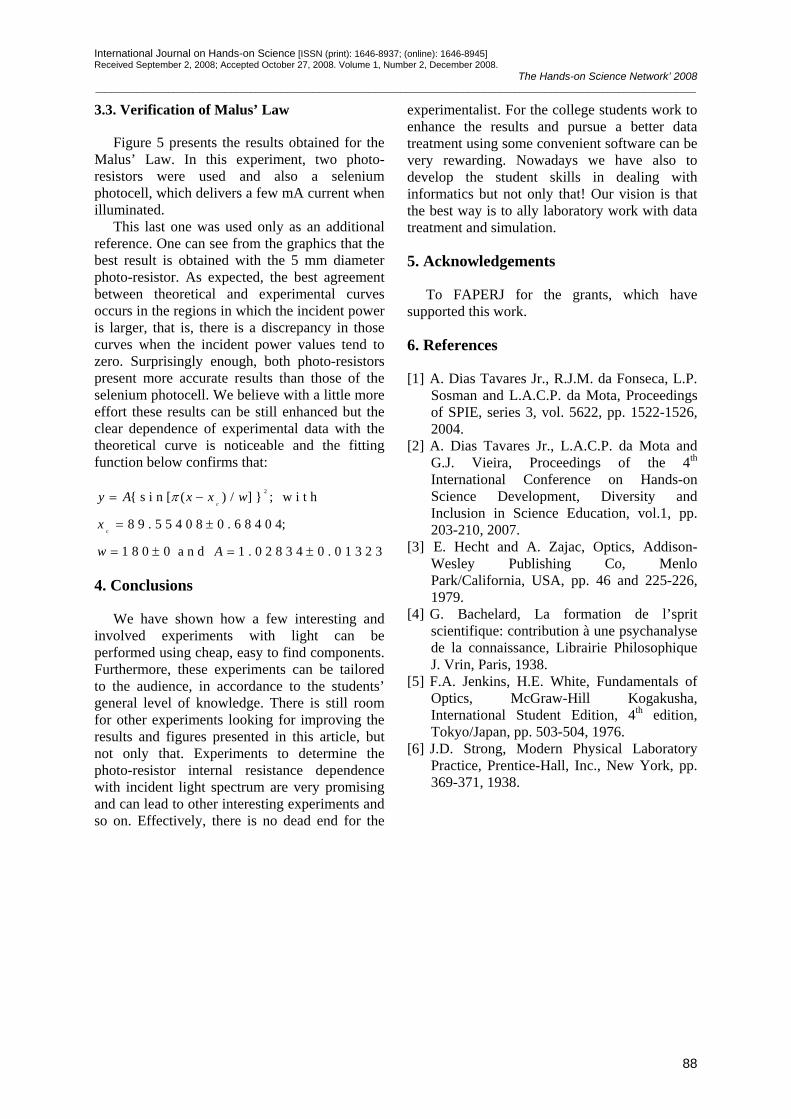
International Journal on Hands-on Science [ISSN (print): 1646-8937; (online): 1646-8945] Received September 2, 2008; Accepted October 27, 2008. Volume 1, Number 2, December 2008.
The Hands-on Science Network’ 2008 ____________________________________________________________________________________________________________________
88
3.3. Verification of Malus’ Law
Figure 5 presents the results obtained for the Malus’ Law. In this experiment, two photo-resistors were used and also a selenium photocell, which delivers a few mA current when illuminated.
This last one was used only as an additional reference. One can see from the graphics that the best result is obtained with the 5 mm diameter photo-resistor. As expected, the best agreement between theoretical and experimental curves occurs in the regions in which the incident power is larger, that is, there is a discrepancy in those curves when the incident power values tend to zero. Surprisingly enough, both photo-resistors present more accurate results than those of the selenium photocell. We believe with a little more effort these results can be still enhanced but the clear dependence of experimental data with the theoretical curve is noticeable and the fitting function below confirms that:
2{ s i n [ ( ) / ] } ; w i t h
8 9 . 5 5 4 0 8 0 . 6 8 4 0 4;
1 8 0 0 a n d 1 . 0 2 8 3 4 0 . 0 1 3 2 3
c
c
y A x x w
x
w A
π= −
= ±
= ± = ±
4. Conclusions
We have shown how a few interesting and involved experiments with light can be performed using cheap, easy to find components. Furthermore, these experiments can be tailored to the audience, in accordance to the students’ general level of knowledge. There is still room for other experiments looking for improving the results and figures presented in this article, but not only that. Experiments to determine the photo-resistor internal resistance dependence with incident light spectrum are very promising and can lead to other interesting experiments and so on. Effectively, there is no dead end for the
experimentalist. For the college students work to enhance the results and pursue a better data treatment using some convenient software can be very rewarding. Nowadays we have also to develop the student skills in dealing with informatics but not only that! Our vision is that the best way is to ally laboratory work with data treatment and simulation.
5. Acknowledgements
To FAPERJ for the grants, which have supported this work.
6. References
[1] A. Dias Tavares Jr., R.J.M. da Fonseca, L.P. Sosman and L.A.C.P. da Mota, Proceedings of SPIE, series 3, vol. 5622, pp. 1522-1526, 2004.
[2] A. Dias Tavares Jr., L.A.C.P. da Mota and G.J. Vieira, Proceedings of the 4th International Conference on Hands-on Science Development, Diversity and Inclusion in Science Education, vol.1, pp. 203-210, 2007.
[3] E. Hecht and A. Zajac, Optics, Addison-Wesley Publishing Co, Menlo Park/California, USA, pp. 46 and 225-226, 1979.
[4] G. Bachelard, La formation de l’sprit scientifique: contribution à une psychanalyse de la connaissance, Librairie Philosophique J. Vrin, Paris, 1938.
[5] F.A. Jenkins, H.E. White, Fundamentals of Optics, McGraw-Hill Kogakusha, International Student Edition, 4th edition, Tokyo/Japan, pp. 503-504, 1976.
[6] J.D. Strong, Modern Physical Laboratory Practice, Prentice-Hall, Inc., New York, pp. 369-371, 1938.
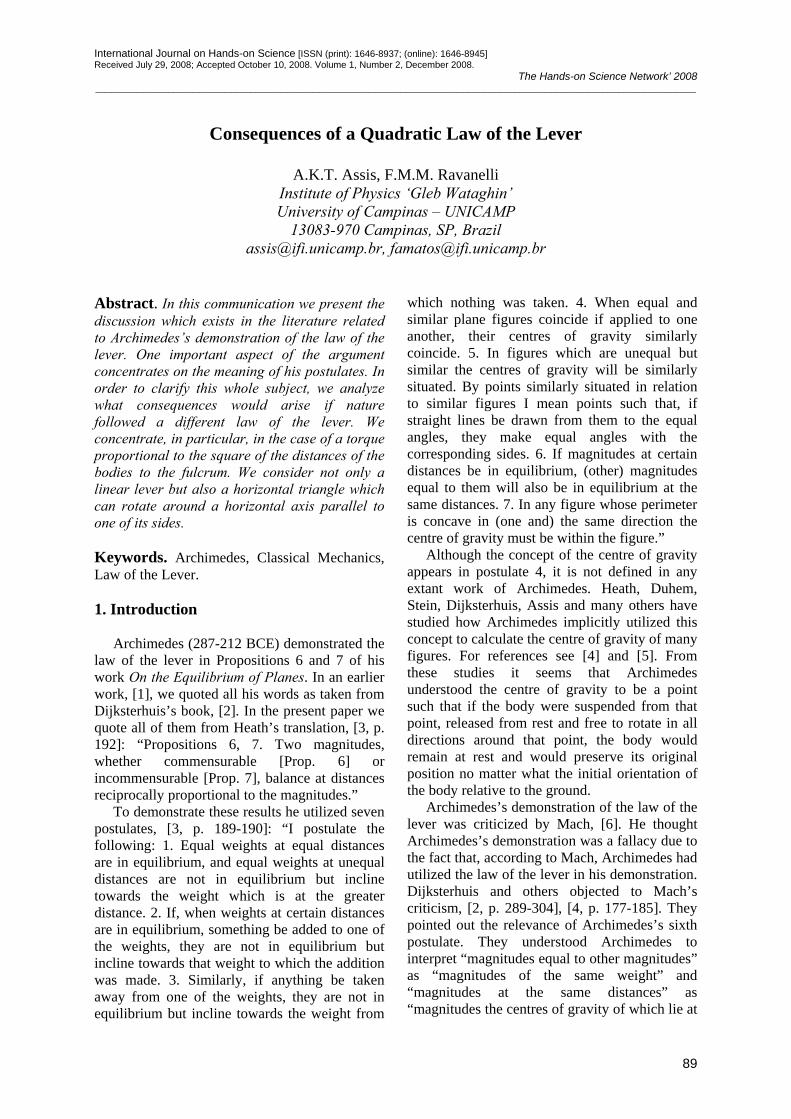
International Journal on Hands-on Science [ISSN (print): 1646-8937; (online): 1646-8945] Received July 29, 2008; Accepted October 10, 2008. Volume 1, Number 2, December 2008.
The Hands-on Science Network’ 2008 ____________________________________________________________________________________________________________________
89
Consequences of a Quadratic Law of the Lever
A.K.T. Assis, F.M.M. Ravanelli
Institute of Physics ‘Gleb Wataghin’ University of Campinas – UNICAMP
13083-970 Campinas, SP, Brazil [email protected], [email protected]
Abstract. In this communication we present the discussion which exists in the literature related to Archimedes’s demonstration of the law of the lever. One important aspect of the argument concentrates on the meaning of his postulates. In order to clarify this whole subject, we analyze what consequences would arise if nature followed a different law of the lever. We concentrate, in particular, in the case of a torque proportional to the square of the distances of the bodies to the fulcrum. We consider not only a linear lever but also a horizontal triangle which can rotate around a horizontal axis parallel to one of its sides. Keywords. Archimedes, Classical Mechanics, Law of the Lever. 1. Introduction
Archimedes (287-212 BCE) demonstrated the law of the lever in Propositions 6 and 7 of his work On the Equilibrium of Planes. In an earlier work, [1], we quoted all his words as taken from Dijksterhuis’s book, [2]. In the present paper we quote all of them from Heath’s translation, [3, p. 192]: “Propositions 6, 7. Two magnitudes, whether commensurable [Prop. 6] or incommensurable [Prop. 7], balance at distances reciprocally proportional to the magnitudes.”
To demonstrate these results he utilized seven postulates, [3, p. 189-190]: “I postulate the following: 1. Equal weights at equal distances are in equilibrium, and equal weights at unequal distances are not in equilibrium but incline towards the weight which is at the greater distance. 2. If, when weights at certain distances are in equilibrium, something be added to one of the weights, they are not in equilibrium but incline towards that weight to which the addition was made. 3. Similarly, if anything be taken away from one of the weights, they are not in equilibrium but incline towards the weight from
which nothing was taken. 4. When equal and similar plane figures coincide if applied to one another, their centres of gravity similarly coincide. 5. In figures which are unequal but similar the centres of gravity will be similarly situated. By points similarly situated in relation to similar figures I mean points such that, if straight lines be drawn from them to the equal angles, they make equal angles with the corresponding sides. 6. If magnitudes at certain distances be in equilibrium, (other) magnitudes equal to them will also be in equilibrium at the same distances. 7. In any figure whose perimeter is concave in (one and) the same direction the centre of gravity must be within the figure.”
Although the concept of the centre of gravity appears in postulate 4, it is not defined in any extant work of Archimedes. Heath, Duhem, Stein, Dijksterhuis, Assis and many others have studied how Archimedes implicitly utilized this concept to calculate the centre of gravity of many figures. For references see [4] and [5]. From these studies it seems that Archimedes understood the centre of gravity to be a point such that if the body were suspended from that point, released from rest and free to rotate in all directions around that point, the body would remain at rest and would preserve its original position no matter what the initial orientation of the body relative to the ground.
Archimedes’s demonstration of the law of the lever was criticized by Mach, [6]. He thought Archimedes’s demonstration was a fallacy due to the fact that, according to Mach, Archimedes had utilized the law of the lever in his demonstration. Dijksterhuis and others objected to Mach’s criticism, [2, p. 289-304], [4, p. 177-185]. They pointed out the relevance of Archimedes’s sixth postulate. They understood Archimedes to interpret “magnitudes equal to other magnitudes” as “magnitudes of the same weight” and “magnitudes at the same distances” as “magnitudes the centres of gravity of which lie at
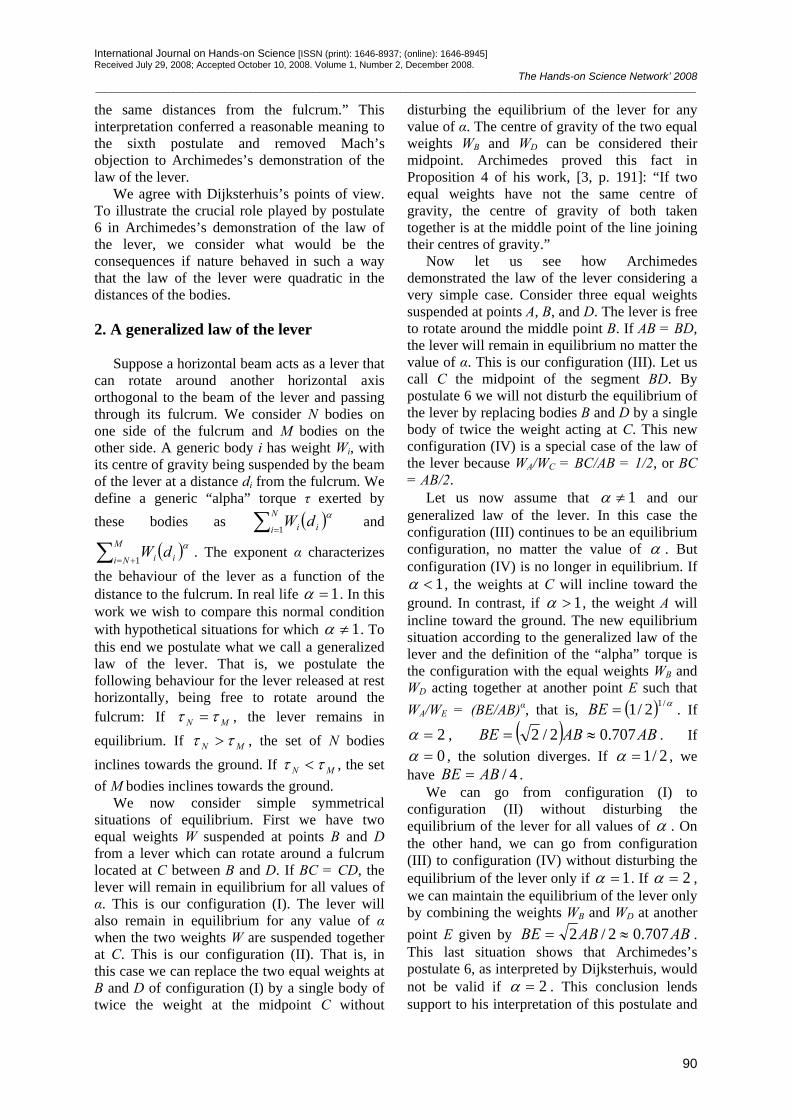
International Journal on Hands-on Science [ISSN (print): 1646-8937; (online): 1646-8945] Received July 29, 2008; Accepted October 10, 2008. Volume 1, Number 2, December 2008.
The Hands-on Science Network’ 2008 ____________________________________________________________________________________________________________________
90
the same distances from the fulcrum.” This interpretation conferred a reasonable meaning to the sixth postulate and removed Mach’s objection to Archimedes’s demonstration of the law of the lever.
We agree with Dijksterhuis’s points of view. To illustrate the crucial role played by postulate 6 in Archimedes’s demonstration of the law of the lever, we consider what would be the consequences if nature behaved in such a way that the law of the lever were quadratic in the distances of the bodies. 2. A generalized law of the lever
Suppose a horizontal beam acts as a lever that can rotate around another horizontal axis orthogonal to the beam of the lever and passing through its fulcrum. We consider N bodies on one side of the fulcrum and M bodies on the other side. A generic body i has weight Wi, with its centre of gravity being suspended by the beam of the lever at a distance di from the fulcrum. We define a generic “alpha” torque τ exerted by these bodies as ( )∑ =
N
i ii dW1
α and
( )∑ +=
M
Ni ii dW1
α . The exponent α characterizes
the behaviour of the lever as a function of the distance to the fulcrum. In real life 1=α . In this work we wish to compare this normal condition with hypothetical situations for which 1≠α . To this end we postulate what we call a generalized law of the lever. That is, we postulate the following behaviour for the lever released at rest horizontally, being free to rotate around the fulcrum: If MN ττ = , the lever remains in equilibrium. If MN ττ > , the set of N bodies inclines towards the ground. If MN ττ < , the set of M bodies inclines towards the ground.
We now consider simple symmetrical situations of equilibrium. First we have two equal weights W suspended at points B and D from a lever which can rotate around a fulcrum located at C between B and D. If BC = CD, the lever will remain in equilibrium for all values of α. This is our configuration (I). The lever will also remain in equilibrium for any value of α when the two weights W are suspended together at C. This is our configuration (II). That is, in this case we can replace the two equal weights at B and D of configuration (I) by a single body of twice the weight at the midpoint C without
disturbing the equilibrium of the lever for any value of α. The centre of gravity of the two equal weights WB and WD can be considered their midpoint. Archimedes proved this fact in Proposition 4 of his work, [3, p. 191]: “If two equal weights have not the same centre of gravity, the centre of gravity of both taken together is at the middle point of the line joining their centres of gravity.”
Now let us see how Archimedes demonstrated the law of the lever considering a very simple case. Consider three equal weights suspended at points A, B, and D. The lever is free to rotate around the middle point B. If AB = BD, the lever will remain in equilibrium no matter the value of α. This is our configuration (III). Let us call C the midpoint of the segment BD. By postulate 6 we will not disturb the equilibrium of the lever by replacing bodies B and D by a single body of twice the weight acting at C. This new configuration (IV) is a special case of the law of the lever because WA/WC = BC/AB = 1/2, or BC = AB/2.
Let us now assume that 1≠α and our generalized law of the lever. In this case the configuration (III) continues to be an equilibrium configuration, no matter the value of α . But configuration (IV) is no longer in equilibrium. If
1<α , the weights at C will incline toward the ground. In contrast, if 1>α , the weight A will incline toward the ground. The new equilibrium situation according to the generalized law of the lever and the definition of the “alpha” torque is the configuration with the equal weights WB and WD acting together at another point E such that WA/WE = (BE/AB)α, that is, ( ) α/12/1=BE . If
2=α , ( ) ABABBE 707.02/2 ≈= . If 0=α , the solution diverges. If 2/1=α , we
have 4/ABBE = . We can go from configuration (I) to
configuration (II) without disturbing the equilibrium of the lever for all values of α . On the other hand, we can go from configuration (III) to configuration (IV) without disturbing the equilibrium of the lever only if 1=α . If 2=α , we can maintain the equilibrium of the lever only by combining the weights WB and WD at another point E given by ABABBE 707.02/2 ≈= . This last situation shows that Archimedes’s postulate 6, as interpreted by Dijksterhuis, would not be valid if 2=α . This conclusion lends support to his interpretation of this postulate and

International Journal on Hands-on Science [ISSN (print): 1646-8937; (online): 1646-8945] Received July 29, 2008; Accepted October 10, 2008. Volume 1, Number 2, December 2008.
The Hands-on Science Network’ 2008 ____________________________________________________________________________________________________________________
91
to the fact that this postulate was essential in order to allow Archimedes to demonstrate the law of the lever. 3. Equilibrium of a Triangle
Archimedes also demonstrated how to locate the centre of gravity of a triangle, [3, p. 198 and 201]: “Proposition 13. In any triangle the centre of gravity lies on the straight line joining any angle to the middle point of the opposite side.” “Proposition 14. If follows at once from the last proposition that the centre of gravity of any triangle is at the intersection of the lines drawn from any two angles to the middle points of the opposite sides respectively.”
We now consider a generic horizontal triangle ABC with height H and base BC. This triangle can rotate freely around the horizontal axis DE which is fixed relative to the ground and is parallel to BC. We want to find the distance R between this axis and the side BC that will let the triangle be in equilibrium for a given value of α , with 0 < R < H.
Our generalized law of the lever implies that equilibrium will happen when the alpha torque exerted by one side of the axis, ∫ dWrα , is
equal to the alpha torque exerted by the other side of the axis, ∫ '' dWr α . Here r and r’ are the
distances between the rotation axis and the strips of weight dW and dW’ on either side of the axis.
After performing these integrals we obtain that equilibrium will happen when [1]:
0)1()2(2 =−−+−+ ααα kk . (1)
The constant k is defined by k = (H – R)/R. For α = 1 there are three solutions to this
equation, namely, 21 =k , 12 −=k and 13 −=k . Only the first solution is physically
reasonable, implying HHR 333.03/ ≈= . This is the usual solution of an axis passing through the centre of gravity of the triangle, which was Archimedes’s solution. To demonstrate this result he also utilized implicitly postulate 6.
For α = 0, there are two solutions to Eq. (1), namely, 414.2211 ≈+=k and
414.0212 −≈−=k . Only the first solution is physically reasonable, leading to
HHR 293.0414.3/ ≈≈ . This axis parallel to the side BC will not pass through the intersection of the medians. It will be closer to the base BC than the previous equilibrium axis for the case α = 1.
For α = 2, there are four solutions to Eq. (1), namely,
693.01 −≈k , ik 459.1546.02 −−≈ ik 459.1546.03 +−≈ and 784.14 ≈k
Only the fourth solution is compatible with the condition 0 < R < H. We are then led to
HHR 359.0784.2/ ≈≈ . This axis parallel to the side BC will not pass through the intersection of the medians. It will be closer to the vertex A than the equilibrium axis for the case α = 1.
This conclusion shows once more that postulate 6 is essential to demonstrate not only the usual law of the lever, but also to find the usual centre of gravity of a triangle. If nature behaved with a generalized power law with
1≠α , the results demonstrated by Archimedes would not remain valid. 4. Acknowledgements
One of the authors (FMdMR) thanks PIBIC/SAE/UNICAMP for an undergraduate research fellowship during which this work was completed. 5. References [1] Assis AKT, Ravanelli FMd. Consequences
of a generalized law of the lever. Accepted for publication in the American Journal of Physics, 2008.
[2] Dijksterhuis EJ. Archimedes. Princeton: Princeton University Press, 1987.
[3] Heath TL, Ed., The Works of Archimedes. New York: Dover; 2002.
[4] Assis AKT. Archimedes, the Center of Gravity, and the First Law of Mechanics. Montreal: Apeiron, 2008. Available at: www.ifi.unicamp.br/~assis.
[5] Assis AKT. Arquimedes, o Centro de Gravidade e a Lei da Alavanca. Montreal: Apeiron, 2008.
Available at: www.ifi.unicamp.br/~assis [6] Mach E. The Science of Mechanics, Open
Court, La Salle, 1960.

International Journal on Hands-on Science [ISSN (print): 1646-8937; (online): 1646-8945] Received August 25, 2008; Accepted October 9, 2008. Volume 1, Number 2, December 2008.
The Hands-on Science Network’ 2008 ____________________________________________________________________________________________________________________
92
Mobile Phones in the Classroom
Sasa Divjak University of Ljubljana - Slovenia
Abstract. In the work herein introductorily presented we explored the use of mobile phones as tools in educational processes. In particular the usage of such devices in the classroom is discussed. The basic driving idea of this work is that today practically everybody, including children, has and uses mobile phones, which are in fact small computers. The possibility of being programmed offers a new functionality. Bluetooth technology allows collaborative activities to be performed by a whole group or even classroom. The mobile phones can be used as responders giving the immediate feedback to the teacher. They can also be used as multiple remote controls that could be employed to control interactive computer simulations, including in group activities. Besides these positive opportunities the dark side of usage of these popular devices in the classroom is also discussed.
Keywords. Mobile Devices, Classroom Collaboration.
1. Introduction
The period from 2000 to 2010 is known as a “digital decade” which will be followed by the period of pervasive computing. One of the characteristics of these times is the increasing use of mobile devices, mostly phones which have more and more functionalities. They are in fact small computers with limited capabilities.
Figure 1. Mobile devices in the classroom
It is known that we can create and install small programs written in a restricted version of Java. Such programs are called MIDlets. They are usually developed on regular PC computers and copied to the mobile devices by wired or wireless connection. Considering the paradigm of mobile computing the question is raised how this technology can be used in the regular educational processes. In particular how the teaching and learning in the classroom can be affected.
Figure 2. Periodic table on mobile phone
2. Sample educational applications for mobile phones
It is more known that mobile phones have
extended functions like games and Internet browsing. There exist also some other applications which could be used also in education. For example we can have implemented vocabularies translating from one language to another. Of course the calculator can be useful in the classroom and assignment
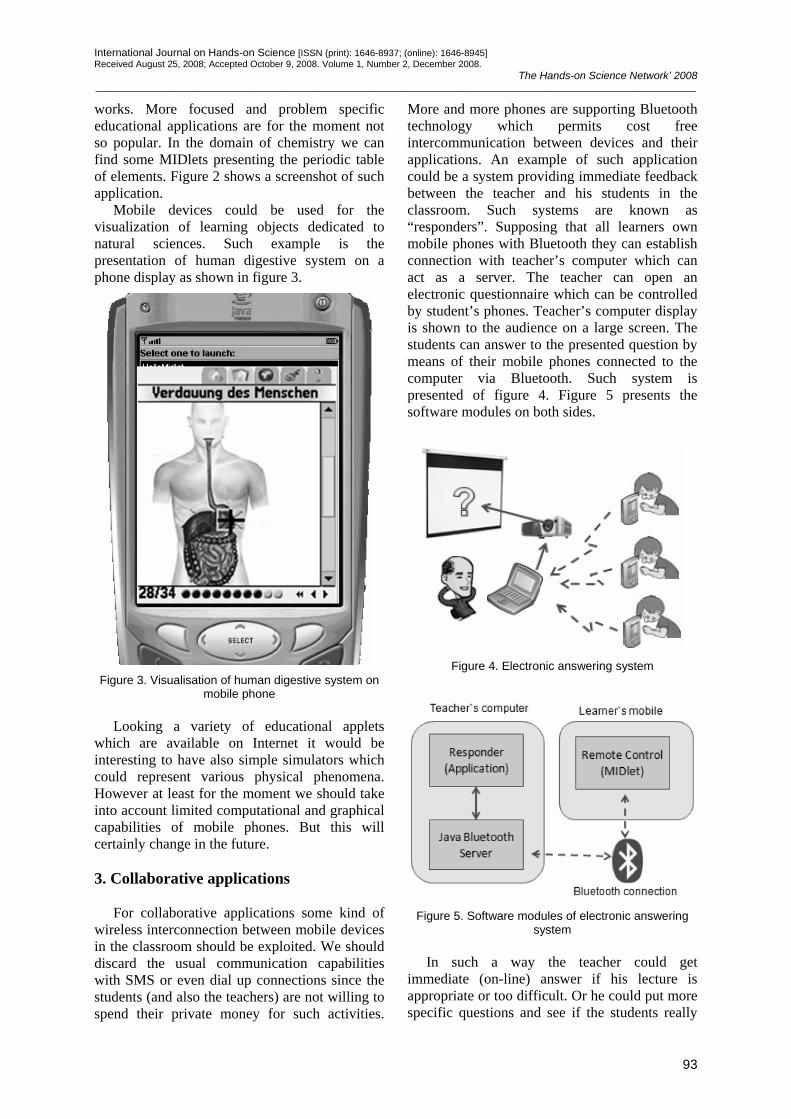
International Journal on Hands-on Science [ISSN (print): 1646-8937; (online): 1646-8945] Received August 25, 2008; Accepted October 9, 2008. Volume 1, Number 2, December 2008.
The Hands-on Science Network’ 2008 ____________________________________________________________________________________________________________________
93
works. More focused and problem specific educational applications are for the moment not so popular. In the domain of chemistry we can find some MIDlets presenting the periodic table of elements. Figure 2 shows a screenshot of such application.
Mobile devices could be used for the visualization of learning objects dedicated to natural sciences. Such example is the presentation of human digestive system on a phone display as shown in figure 3.
Figure 3. Visualisation of human digestive system on
mobile phone Looking a variety of educational applets
which are available on Internet it would be interesting to have also simple simulators which could represent various physical phenomena. However at least for the moment we should take into account limited computational and graphical capabilities of mobile phones. But this will certainly change in the future.
3. Collaborative applications
For collaborative applications some kind of
wireless interconnection between mobile devices in the classroom should be exploited. We should discard the usual communication capabilities with SMS or even dial up connections since the students (and also the teachers) are not willing to spend their private money for such activities.
More and more phones are supporting Bluetooth technology which permits cost free intercommunication between devices and their applications. An example of such application could be a system providing immediate feedback between the teacher and his students in the classroom. Such systems are known as “responders”. Supposing that all learners own mobile phones with Bluetooth they can establish connection with teacher’s computer which can act as a server. The teacher can open an electronic questionnaire which can be controlled by student’s phones. Teacher’s computer display is shown to the audience on a large screen. The students can answer to the presented question by means of their mobile phones connected to the computer via Bluetooth. Such system is presented of figure 4. Figure 5 presents the software modules on both sides.
Figure 4. Electronic answering system
Figure 5. Software modules of electronic answering
system In such a way the teacher could get
immediate (on-line) answer if his lecture is appropriate or too difficult. Or he could put more specific questions and see if the students really
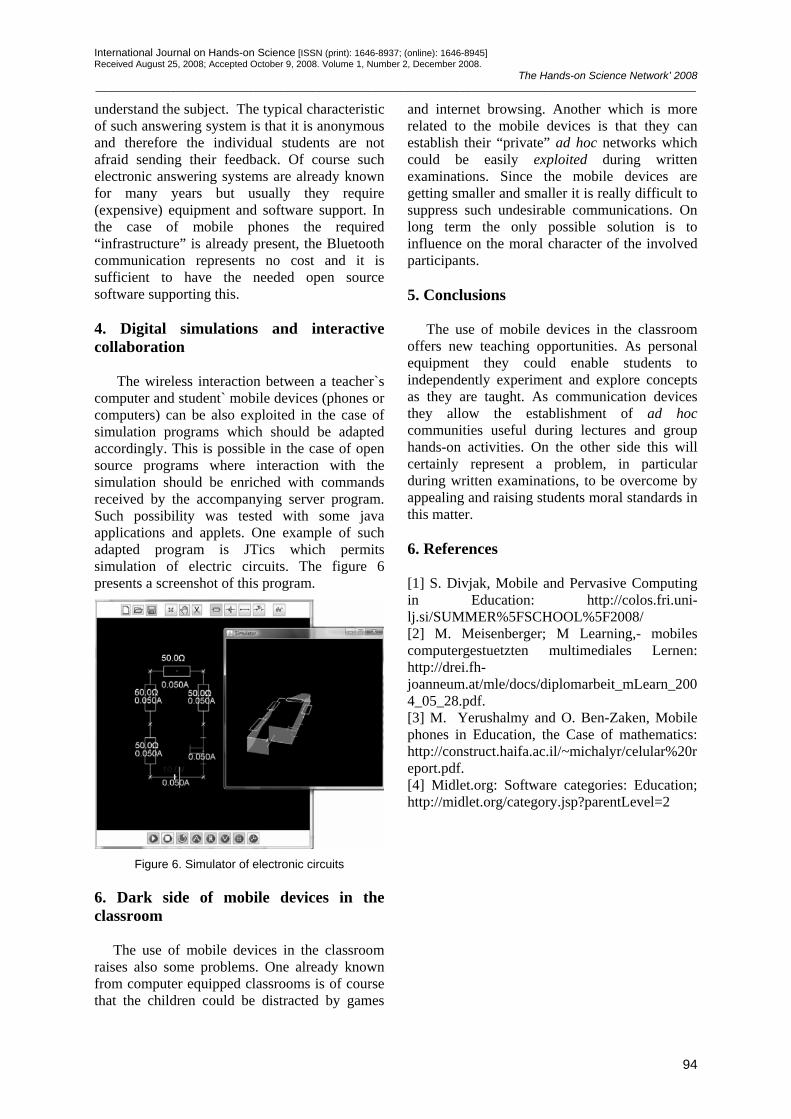
International Journal on Hands-on Science [ISSN (print): 1646-8937; (online): 1646-8945] Received August 25, 2008; Accepted October 9, 2008. Volume 1, Number 2, December 2008.
The Hands-on Science Network’ 2008 ____________________________________________________________________________________________________________________
94
understand the subject. The typical characteristic of such answering system is that it is anonymous and therefore the individual students are not afraid sending their feedback. Of course such electronic answering systems are already known for many years but usually they require (expensive) equipment and software support. In the case of mobile phones the required “infrastructure” is already present, the Bluetooth communication represents no cost and it is sufficient to have the needed open source software supporting this.
4. Digital simulations and interactive collaboration
The wireless interaction between a teacher`s
computer and student` mobile devices (phones or computers) can be also exploited in the case of simulation programs which should be adapted accordingly. This is possible in the case of open source programs where interaction with the simulation should be enriched with commands received by the accompanying server program. Such possibility was tested with some java applications and applets. One example of such adapted program is JTics which permits simulation of electric circuits. The figure 6 presents a screenshot of this program.
Figure 6. Simulator of electronic circuits
6. Dark side of mobile devices in the classroom
The use of mobile devices in the classroom
raises also some problems. One already known from computer equipped classrooms is of course that the children could be distracted by games
and internet browsing. Another which is more related to the mobile devices is that they can establish their “private” ad hoc networks which could be easily exploited during written examinations. Since the mobile devices are getting smaller and smaller it is really difficult to suppress such undesirable communications. On long term the only possible solution is to influence on the moral character of the involved participants.
5. Conclusions
The use of mobile devices in the classroom
offers new teaching opportunities. As personal equipment they could enable students to independently experiment and explore concepts as they are taught. As communication devices they allow the establishment of ad hoc communities useful during lectures and group hands-on activities. On the other side this will certainly represent a problem, in particular during written examinations, to be overcome by appealing and raising students moral standards in this matter.
6. References
[1] S. Divjak, Mobile and Pervasive Computing in Education: http://colos.fri.uni-lj.si/SUMMER%5FSCHOOL%5F2008/ [2] M. Meisenberger; M Learning,- mobiles computergestuetzten multimediales Lernen: http://drei.fh-joanneum.at/mle/docs/diplomarbeit_mLearn_2004_05_28.pdf. [3] M. Yerushalmy and O. Ben-Zaken, Mobile phones in Education, the Case of mathematics: http://construct.haifa.ac.il/~michalyr/celular%20report.pdf. [4] Midlet.org: Software categories: Education; http://midlet.org/category.jsp?parentLevel=2
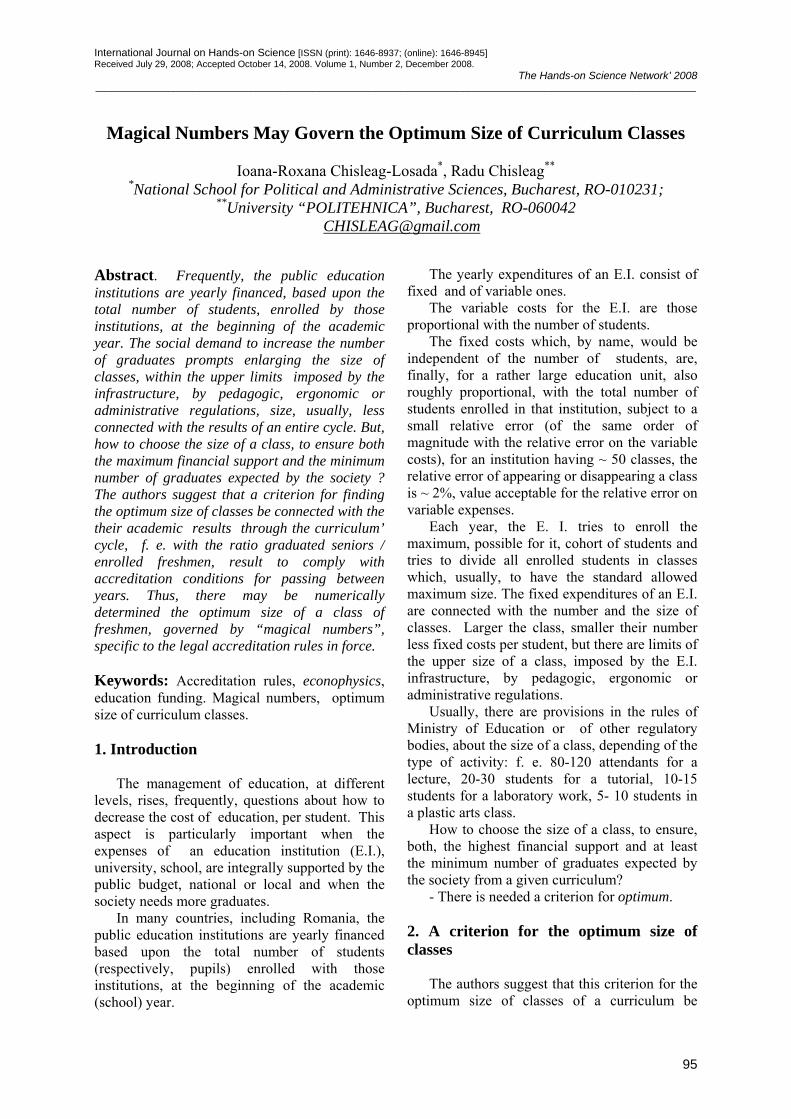
International Journal on Hands-on Science [ISSN (print): 1646-8937; (online): 1646-8945] Received July 29, 2008; Accepted October 14, 2008. Volume 1, Number 2, December 2008.
The Hands-on Science Network’ 2008 ____________________________________________________________________________________________________________________
95
Magical Numbers May Govern the Optimum Size of Curriculum Classes
Ioana-Roxana Chisleag-Losada*, Radu Chisleag**
*National School for Political and Administrative Sciences, Bucharest, RO-010231; **University “POLITEHNICA”, Bucharest, RO-060042
Abstract. Frequently, the public education institutions are yearly financed, based upon the total number of students, enrolled by those institutions, at the beginning of the academic year. The social demand to increase the number of graduates prompts enlarging the size of classes, within the upper limits imposed by the infrastructure, by pedagogic, ergonomic or administrative regulations, size, usually, less connected with the results of an entire cycle. But, how to choose the size of a class, to ensure both the maximum financial support and the minimum number of graduates expected by the society ? The authors suggest that a criterion for finding the optimum size of classes be connected with the their academic results through the curriculum’ cycle, f. e. with the ratio graduated seniors / enrolled freshmen, result to comply with accreditation conditions for passing between years. Thus, there may be numerically determined the optimum size of a class of freshmen, governed by “magical numbers”, specific to the legal accreditation rules in force. Keywords: Accreditation rules, econophysics, education funding. Magical numbers, optimum size of curriculum classes. 1. Introduction The management of education, at different levels, rises, frequently, questions about how to decrease the cost of education, per student. This aspect is particularly important when the expenses of an education institution (E.I.), university, school, are integrally supported by the public budget, national or local and when the society needs more graduates. In many countries, including Romania, the public education institutions are yearly financed based upon the total number of students (respectively, pupils) enrolled with those institutions, at the beginning of the academic (school) year.
The yearly expenditures of an E.I. consist of fixed and of variable ones. The variable costs for the E.I. are those proportional with the number of students. The fixed costs which, by name, would be independent of the number of students, are, finally, for a rather large education unit, also roughly proportional, with the total number of students enrolled in that institution, subject to a small relative error (of the same order of magnitude with the relative error on the variable costs), for an institution having ~ 50 classes, the relative error of appearing or disappearing a class is ~ 2%, value acceptable for the relative error on variable expenses. Each year, the E. I. tries to enroll the maximum, possible for it, cohort of students and tries to divide all enrolled students in classes which, usually, to have the standard allowed maximum size. The fixed expenditures of an E.I. are connected with the number and the size of classes. Larger the class, smaller their number less fixed costs per student, but there are limits of the upper size of a class, imposed by the E.I. infrastructure, by pedagogic, ergonomic or administrative regulations. Usually, there are provisions in the rules of Ministry of Education or of other regulatory bodies, about the size of a class, depending of the type of activity: f. e. 80-120 attendants for a lecture, 20-30 students for a tutorial, 10-15 students for a laboratory work, 5- 10 students in a plastic arts class. How to choose the size of a class, to ensure, both, the highest financial support and at least the minimum number of graduates expected by the society from a given curriculum? - There is needed a criterion for optimum. 2. A criterion for the optimum size of classes The authors suggest that this criterion for the optimum size of classes of a curriculum be
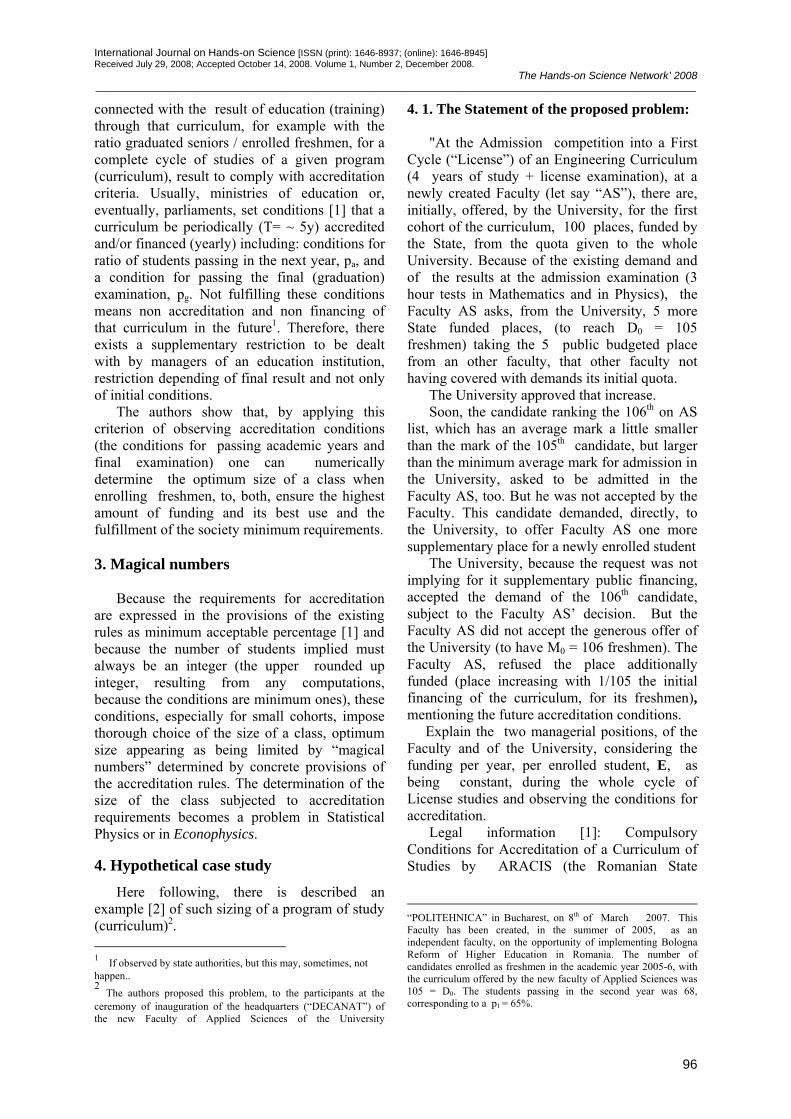
International Journal on Hands-on Science [ISSN (print): 1646-8937; (online): 1646-8945] Received July 29, 2008; Accepted October 14, 2008. Volume 1, Number 2, December 2008.
The Hands-on Science Network’ 2008 ____________________________________________________________________________________________________________________
96
connected with the result of education (training) through that curriculum, for example with the ratio graduated seniors / enrolled freshmen, for a complete cycle of studies of a given program (curriculum), result to comply with accreditation criteria. Usually, ministries of education or, eventually, parliaments, set conditions [1] that a curriculum be periodically (T= ~ 5y) accredited and/or financed (yearly) including: conditions for ratio of students passing in the next year, pa, and a condition for passing the final (graduation) examination, pg. Not fulfilling these conditions means non accreditation and non financing of that curriculum in the future1. Therefore, there exists a supplementary restriction to be dealt with by managers of an education institution, restriction depending of final result and not only of initial conditions. The authors show that, by applying this criterion of observing accreditation conditions (the conditions for passing academic years and final examination) one can numerically determine the optimum size of a class when enrolling freshmen, to, both, ensure the highest amount of funding and its best use and the fulfillment of the society minimum requirements. 3. Magical numbers Because the requirements for accreditation are expressed in the provisions of the existing rules as minimum acceptable percentage [1] and because the number of students implied must always be an integer (the upper rounded up integer, resulting from any computations, because the conditions are minimum ones), these conditions, especially for small cohorts, impose thorough choice of the size of a class, optimum size appearing as being limited by “magical numbers” determined by concrete provisions of the accreditation rules. The determination of the size of the class subjected to accreditation requirements becomes a problem in Statistical Physics or in Econophysics.
4. Hypothetical case study Here following, there is described an example [2] of such sizing of a program of study (curriculum)2. 1 If observed by state authorities, but this may, sometimes, not happen.. 2 The authors proposed this problem, to the participants at the ceremony of inauguration of the headquarters (“DECANAT”) of the new Faculty of Applied Sciences of the University
4. 1. The Statement of the proposed problem: "At the Admission competition into a First Cycle (“License”) of an Engineering Curriculum (4 years of study + license examination), at a newly created Faculty (let say “AS”), there are, initially, offered, by the University, for the first cohort of the curriculum, 100 places, funded by the State, from the quota given to the whole University. Because of the existing demand and of the results at the admission examination (3 hour tests in Mathematics and in Physics), the Faculty AS asks, from the University, 5 more State funded places, (to reach D0 = 105 freshmen) taking the 5 public budgeted place from an other faculty, that other faculty not having covered with demands its initial quota. The University approved that increase. Soon, the candidate ranking the 106th on AS list, which has an average mark a little smaller than the mark of the 105th candidate, but larger than the minimum average mark for admission in the University, asked to be admitted in the Faculty AS, too. But he was not accepted by the Faculty. This candidate demanded, directly, to the University, to offer Faculty AS one more supplementary place for a newly enrolled student The University, because the request was not implying for it supplementary public financing, accepted the demand of the 106th candidate, subject to the Faculty AS’ decision. But the Faculty AS did not accept the generous offer of the University (to have M0 = 106 freshmen). The Faculty AS, refused the place additionally funded (place increasing with 1/105 the initial financing of the curriculum, for its freshmen), mentioning the future accreditation conditions. Explain the two managerial positions, of the Faculty and of the University, considering the funding per year, per enrolled student, E, as being constant, during the whole cycle of License studies and observing the conditions for accreditation. Legal information [1]: Compulsory Conditions for Accreditation of a Curriculum of Studies by ARACIS (the Romanian State
“POLITEHNICA” in Bucharest, on 8th of March 2007. This Faculty has been created, in the summer of 2005, as an independent faculty, on the opportunity of implementing Bologna Reform of Higher Education in Romania. The number of candidates enrolled as freshmen in the academic year 2005-6, with the curriculum offered by the new faculty of Applied Sciences was 105 = D0. The students passing in the second year was 68, corresponding to a p1 = 65%.
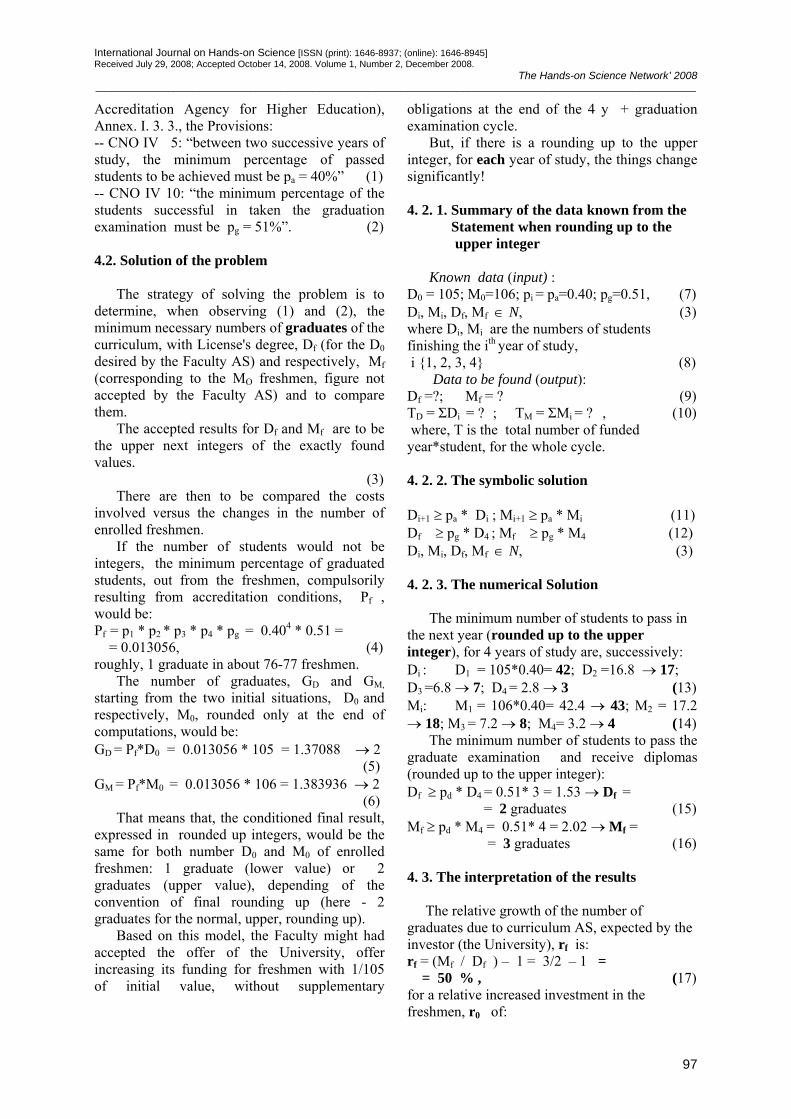
International Journal on Hands-on Science [ISSN (print): 1646-8937; (online): 1646-8945] Received July 29, 2008; Accepted October 14, 2008. Volume 1, Number 2, December 2008.
The Hands-on Science Network’ 2008 ____________________________________________________________________________________________________________________
97
Accreditation Agency for Higher Education), Annex. I. 3. 3., the Provisions: -- CNO IV 5: “between two successive years of study, the minimum percentage of passed students to be achieved must be pa = 40%” (1) -- CNO IV 10: “the minimum percentage of the students successful in taken the graduation examination must be pg = 51%”. (2) 4.2. Solution of the problem The strategy of solving the problem is to determine, when observing (1) and (2), the minimum necessary numbers of graduates of the curriculum, with License's degree, Df (for the D0 desired by the Faculty AS) and respectively, Mf (corresponding to the MO freshmen, figure not accepted by the Faculty AS) and to compare them. The accepted results for Df and Mf are to be the upper next integers of the exactly found values. (3) There are then to be compared the costs involved versus the changes in the number of enrolled freshmen. If the number of students would not be integers, the minimum percentage of graduated students, out from the freshmen, compulsorily resulting from accreditation conditions, Pf , would be: Pf = p1 * p2 * p3 * p4 * pg = 0.404 * 0.51 = = 0.013056, (4) roughly, 1 graduate in about 76-77 freshmen. The number of graduates, GD and GM, starting from the two initial situations, D0 and respectively, M0, rounded only at the end of computations, would be: GD = Pf*D0 = 0.013056 * 105 = 1.37088 → 2 (5) GM = Pf*M0 = 0.013056 * 106 = 1.383936 → 2 (6) That means that, the conditioned final result, expressed in rounded up integers, would be the same for both number D0 and M0 of enrolled freshmen: 1 graduate (lower value) or 2 graduates (upper value), depending of the convention of final rounding up (here - 2 graduates for the normal, upper, rounding up). Based on this model, the Faculty might had accepted the offer of the University, offer increasing its funding for freshmen with 1/105 of initial value, without supplementary
obligations at the end of the 4 y + graduation examination cycle. But, if there is a rounding up to the upper integer, for each year of study, the things change significantly! 4. 2. 1. Summary of the data known from the Statement when rounding up to the upper integer Known data (input) : D0 = 105; M0=106; pi = pa=0.40; pg=0.51, (7) Di, Mi, Df, Mf ∈ N, (3) where Di, Mi are the numbers of students finishing the ith year of study, i {1, 2, 3, 4} (8) Data to be found (output): Df =?; Mf = ? (9) TD = ΣDi = ? ; TM = ΣMi = ? , (10) where, T is the total number of funded year*student, for the whole cycle. 4. 2. 2. The symbolic solution Di+1 ≥ pa * Di ; Mi+1 ≥ pa * Mi (11) Df ≥ pg * D4 ; Mf ≥ pg * M4 (12) Di, Mi, Df, Mf ∈ N, (3) 4. 2. 3. The numerical Solution The minimum number of students to pass in the next year (rounded up to the upper integer), for 4 years of study are, successively: Di : D1 = 105*0.40= 42; D2 =16.8 → 17; D3 =6.8 → 7; D4 = 2.8 → 3 (13) Mi: M1 = 106*0.40= 42.4 → 43; M2 = 17.2 → 18; M3 = 7.2 → 8; M4= 3.2 → 4 (14) The minimum number of students to pass the graduate examination and receive diplomas (rounded up to the upper integer): Df ≥ pd * D4 = 0.51* 3 = 1.53 → Df = = 2 graduates (15) Mf ≥ pd * M4 = 0.51* 4 = 2.02 → Mf = = 3 graduates (16) 4. 3. The interpretation of the results The relative growth of the number of graduates due to curriculum AS, expected by the investor (the University), rf is: rf = (Mf / Df ) – 1 = 3/2 – 1 = = 50 % , (17) for a relative increased investment in the freshmen, r0 of:
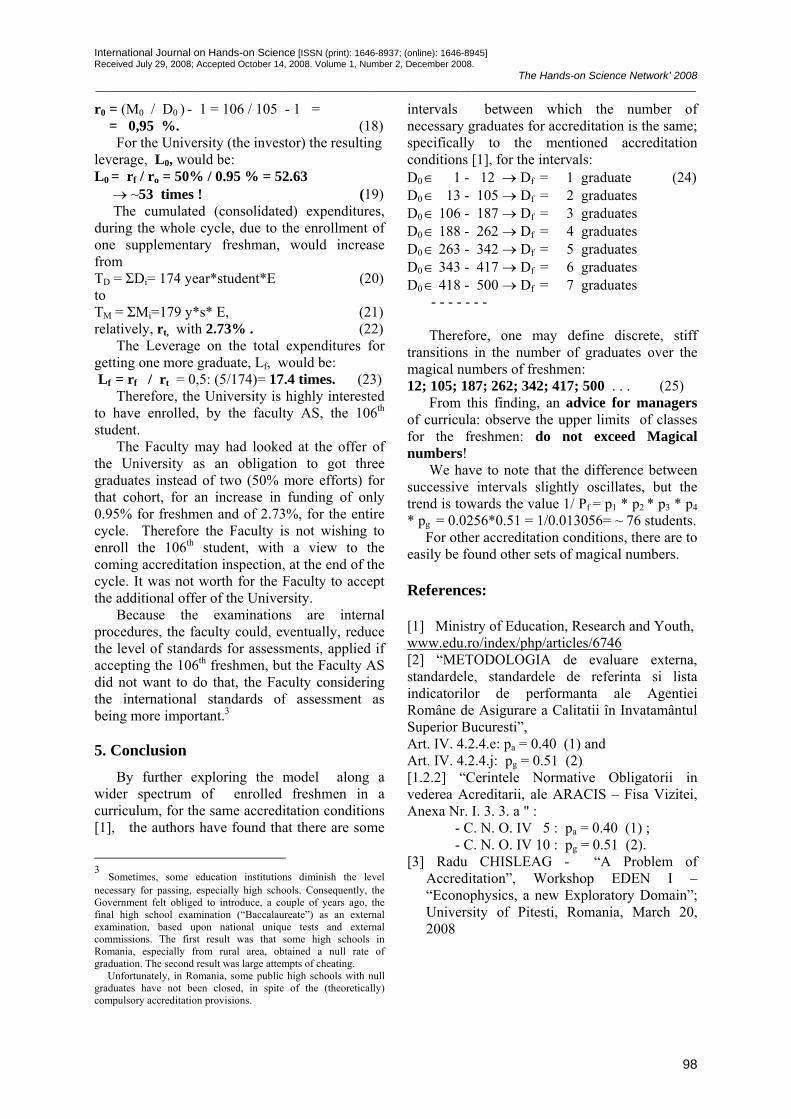
International Journal on Hands-on Science [ISSN (print): 1646-8937; (online): 1646-8945] Received July 29, 2008; Accepted October 14, 2008. Volume 1, Number 2, December 2008.
The Hands-on Science Network’ 2008 ____________________________________________________________________________________________________________________
98
r0 = (M0 / D0 ) - 1 = 106 / 105 - 1 = = 0,95 %. (18) For the University (the investor) the resulting leverage, L0, would be: L0 = rf / ro = 50% / 0.95 % = 52.63 → ~53 times ! (19)
The cumulated (consolidated) expenditures, during the whole cycle, due to the enrollment of one supplementary freshman, would increase from TD = ΣDi= 174 year*student*E (20) to TM = ΣMi=179 y*s* E, (21) relatively, rt, with 2.73% . (22) The Leverage on the total expenditures for getting one more graduate, Lf, would be: Lf = rf / rt = 0,5: (5/174)= 17.4 times. (23) Therefore, the University is highly interested to have enrolled, by the faculty AS, the 106th student. The Faculty may had looked at the offer of the University as an obligation to got three graduates instead of two (50% more efforts) for that cohort, for an increase in funding of only 0.95% for freshmen and of 2.73%, for the entire cycle. Therefore the Faculty is not wishing to enroll the 106th student, with a view to the coming accreditation inspection, at the end of the cycle. It was not worth for the Faculty to accept the additional offer of the University. Because the examinations are internal procedures, the faculty could, eventually, reduce the level of standards for assessments, applied if accepting the 106th freshmen, but the Faculty AS did not want to do that, the Faculty considering the international standards of assessment as being more important.3
5. Conclusion By further exploring the model along a wider spectrum of enrolled freshmen in a curriculum, for the same accreditation conditions [1], the authors have found that there are some
3 Sometimes, some education institutions diminish the level necessary for passing, especially high schools. Consequently, the Government felt obliged to introduce, a couple of years ago, the final high school examination (“Baccalaureate”) as an external examination, based upon national unique tests and external commissions. The first result was that some high schools in Romania, especially from rural area, obtained a null rate of graduation. The second result was large attempts of cheating. Unfortunately, in Romania, some public high schools with null graduates have not been closed, in spite of the (theoretically) compulsory accreditation provisions.
intervals between which the number of necessary graduates for accreditation is the same; specifically to the mentioned accreditation conditions [1], for the intervals: D0 ∈ 1 - 12 → Df = 1 graduate (24) D0 ∈ 13 - 105 → Df = 2 graduates D0 ∈ 106 - 187 → Df = 3 graduates D0 ∈ 188 - 262 → Df = 4 graduates D0 ∈ 263 - 342 → Df = 5 graduates D0 ∈ 343 - 417 → Df = 6 graduates D0 ∈ 418 - 500 → Df = 7 graduates
- - - - - - -
Therefore, one may define discrete, stiff transitions in the number of graduates over the magical numbers of freshmen: 12; 105; 187; 262; 342; 417; 500 . . . (25) From this finding, an advice for managers of curricula: observe the upper limits of classes for the freshmen: do not exceed Magical numbers! We have to note that the difference between successive intervals slightly oscillates, but the trend is towards the value 1/ Pf = p1 * p2 * p3 * p4 * pg = 0.0256*0.51 = 1/0.013056= ~ 76 students. For other accreditation conditions, there are to easily be found other sets of magical numbers. References: [1] Ministry of Education, Research and Youth, www.edu.ro/index/php/articles/6746 [2] “METODOLOGIA de evaluare externa, standardele, standardele de referinta si lista indicatorilor de performanta ale Agentiei Române de Asigurare a Calitatii în Invatamântul Superior Bucuresti”, Art. IV. 4.2.4.e: pa = 0.40 (1) and Art. IV. 4.2.4.j: pg = 0.51 (2) [1.2.2] “Cerintele Normative Obligatorii in vederea Acreditarii, ale ARACIS – Fisa Vizitei, Anexa Nr. I. 3. 3. a " : - C. N. O. IV 5 : pa = 0.40 (1) ; - C. N. O. IV 10 : pg = 0.51 (2). [3] Radu CHISLEAG - “A Problem of
Accreditation”, Workshop EDEN I – “Econophysics, a new Exploratory Domain”; University of Pitesti, Romania, March 20, 2008

The Hands-on Science Network is a non-profit international association legally registered in Portugal. With a broad open understanding of the meaning and importance of Science to the development of our societies, each individual and of the humankind, the main goal of the Network is the development and improvement of science education and scientific literacy by an extended use of investigative hands-on experiments based learning of Science and its applications.
Distributed worldwide by the Hands-on Science Network www.hsci.info