international journal conservation science
TRANSCRIPT

ISSN: 2067-533X
INTERNATIONAL JOURNAL
OF CONSERVATION SCIENCE
Volume 9, Issue 3, July-September 2018: 565-576
www.ijcs.uaic.ro
DISTRIBUTION PREDICTION MODEL OF AN OVER EXPLOITED MEDICINAL PLANT (PARIS POLYPHYLLA SMITH.)
IN NAGALAND, INDIA AND INTRODUCTION OF NEW CONCEPT MODEL (MOSAIC MODEL)
Chitta Ranjan DEB*, Zubenthung Phyobemo KIKON
Nagaland University, Department of Botany, Lumami 798627, Nagaland, India
Abstract Paris polyphylla Smith. is a perennial herb, over exploited for its medicinal value and other anthropogenic activities like traditional method of Slash and Burn’ (Jhuming) farming practice has reduced much of its habitat. As such the need to describe its potential habitats arises; this is achieved with Climate Suitability Modeling. The model was developed using 12 presence points. Temperature of coldest quarter and precipitation of warmest quarter act as an important determinant in the development of the model, these climatic variables correspond with the climatic conditions in the predicted areas which is necessary for post dehiscence maturation of seeds. Ground truthing work was being carried out to ascertain the highly predicted areas and plants were also introduced in areas predicted as suitable as well as in areas predicted as not suitable to confirm the usefulness of the model. The model also corresponds with an experiment on seed germination by temperature stratification. The study gives a different approach on validation of habitat modeling in addition with the statistical significance by observing plant response introduced in areas predicted suitable and unsuitable as well as matching plant physiology and the influences of the climatic variables on it. This work introduces a new concept modeling named ‘Mosaic Model’ for those species which are sensitive to different climatic conditions. In this concept model a big area can be fragmented into small areas depending on different climatic conditions. Model can be prepared for each area followed by stitching of these small models into one model (Mosaic model). This model would be able to predict the distribution of a species growing in diverse environmental condition. Keywords: Distribution prediction model; ENM; Mosaic model; Nagaland; Paris polyphylla; Conservation of threatened species; Threatened plant.
Introduction
With changing habitat scenario of biodiversity, the niche radius for many species is either rendered inhabitable or is conflicted with humans. Anthropogenic activities have destroyed the habitats of many important species, pushing them to the brink of extinction. This issue unless addressed adequately, will lead to loss of immense biological wealth for mankind. Nagaland is known for its tribal diversity with 16 major tribes and their rich culture and traditions, also has a distinct character both in terms of its social composition as well as in its developmental history. With growth and development coupled with the increase in population, plant species are in constant threat as old customary practices and traditions of conservation strategies are forgotten or lost with each new generation taking over [1]. Species distribution prediction has become a popular and important component of planning conservation strategies
*Corresponding author: [email protected]

C.R. DEB and Z.P. KIKON
INT J CONSERV SCI 9, 3, 2018: 565-576 566
in recent years, and for this purpose different algorithms and modeling techniques have been developed [1-2]. These models employ the associations between environmental variables and known species occurrence records to identify environmental conditions within which populations can be maintained and flourish. Paris polyphylla is a multipurpose medicinal herb is over-exploited due to its highly prized medicinal properties and reports of its illegal sale are high [3]. Paris polyphylla has found its application as antidote, analgesic, ethnopediatrics in diahhroea, medicine for antifebrile, alexipharmic, detumescent, demulsent, haemostatic, haemopathy and many more [3-4]. The propagation of the plant is difficult because of the high level of seed dormancy of more than 18 months as the seeds undergo secondary dormancy, requiring two winters and one summer in natural environments [5].
Mapping the possible potential distribution of any species for possible reintroduction is done with the help of Ecological Niche Modeling (ENM) which co-relates different climatic conditions of known areas where the species occur to predict their potential distribution. The sum total of all climatic factors of an area determines the behavior and survival of species. Species prevalence is determined by a set of physico-climatic factors and not by one factor alone [1, 6]. Through ENM a representation of the climatic factors of known occurrence areas in mathematical form are used to describe the potential suitable areas based on the data supplied in computer algorithm. Common strategy for estimating the actual or potential geographic distribution of a species is characterizing the climatic conditions that are suitable for the species and the identification of where these suitable environments are distributed in space. For example, if we are interested in modeling the distribution of a plant that is known to thrive in wet clay soils, then simply identifying locations with clay soils and high precipitation can generate an estimate of the species’ distribution. There are other possible reasons why the species may not actually occupy all predicted suitable sites (e.g. geographic barriers that limit dispersal, competition from other species). The present study was aimed to bring out the possible suitable areas of occurrence which were subjected to different validation process besides maintaining statistical significance, by observation of plant behavior introduced to both suitable and unsuitable areas as predicted by the model to establish its validity. The possibility of climatic threshold as a limiting factor in niche modeling can increase for those species which are highly sensitive to change in climatic conditions. Prediction of suitable sites over a large area do not always gives usable models when the occurrence points are low [7]. The present study aimed to develop a new distribution model for the conservation of species which are sensitive to climate change and distribution is restricted in small patches. For the study Paris polyphylla, an over-exploited medicinal plant was used as model within the geographical boundary of Nagaland, India.
Materials and Methods
Different modeling algorithms viz., DIVA GIS 7.5, ArcGIS 10.2.2 and MaxEnt 3.3.3e have been used in the present study to classify the probability of species’ presence (and ab-sence) as a function of a set of environmental variables. The present study employed MaxEnt algorithm to develop the model as Maxent software is based on the maximum-entropy approach for species habitat modeling. This software takes a set of layers or environmental variables (such as elevation, precipitation etc.), as well as a set of geo referenced occurrence locations as inputs, and produces a model of the range of the given species. The model for a species is determined from a set of environmental or climate layers for a set of grid cells in a landscape, together with a set of sample locations where the species has been observed. The model expresses the suitability of each grid cell as a function of the environmental variables at that grid cell. A high value of the function at a particular grid cell indicates that the grid cell is predicted to have suitable conditions for that species. The computed model is a probability distribution over all the grid cells. The distribution chosen is the one that has maximum entropy
DISTRIBUTIONPREDICTION MODEL OF MEDICINAL PLANT (PARIS POLYPHYLLA SMITH.)
http://www.ijcs.uaic.ro 567
subject to some constraints: it must have the same expectation for each feature (derived from the environmental layers) as the average over sample locations [8]. All other spatial analysis works like data conversion, importing/exporting, mapping and visualization was done in DIVA GIS and ArcGIS.
Input Data Climate Data: Different environmental variables have been used as input data in the
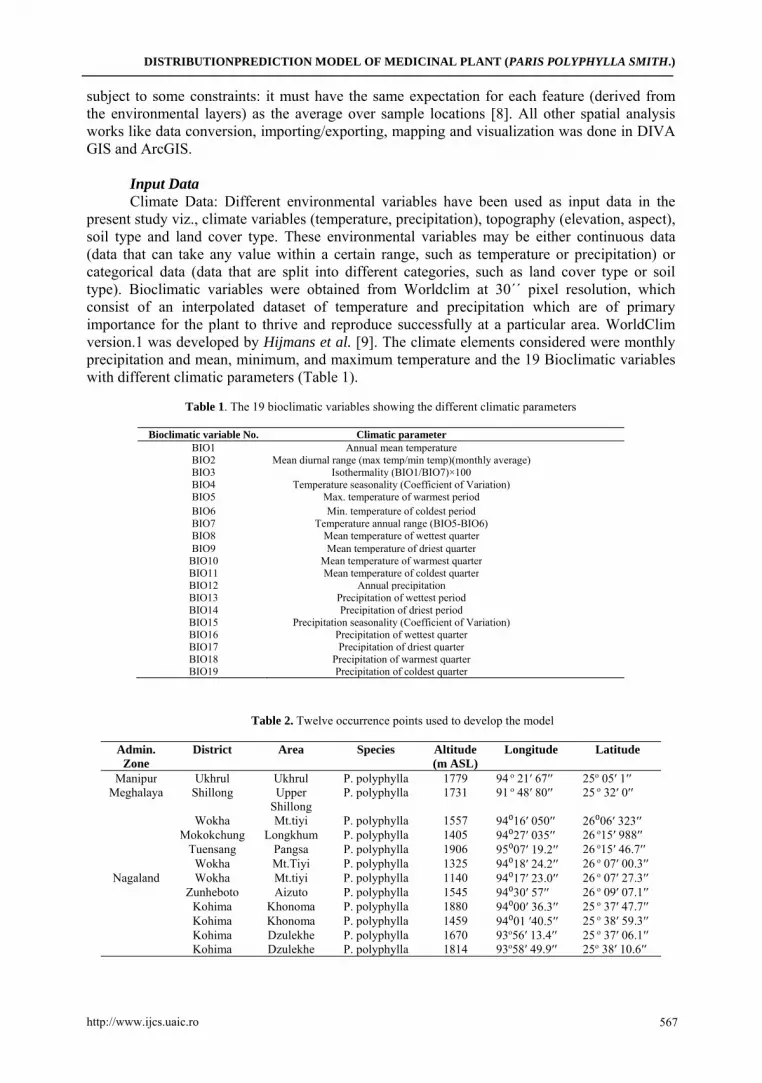
present study viz., climate variables (temperature, precipitation), topography (elevation, aspect), soil type and land cover type. These environmental variables may be either continuous data (data that can take any value within a certain range, such as temperature or precipitation) or categorical data (data that are split into different categories, such as land cover type or soil type). Bioclimatic variables were obtained from Worldclim at 30´´ pixel resolution, which consist of an interpolated dataset of temperature and precipitation which are of primary importance for the plant to thrive and reproduce successfully at a particular area. WorldClim version.1 was developed by Hijmans et al. [9]. The climate elements considered were monthly precipitation and mean, minimum, and maximum temperature and the 19 Bioclimatic variables with different climatic parameters (Table 1).
Table 1. The 19 bioclimatic variables showing the different climatic parameters
Bioclimatic variable No. Climatic parameter
BIO1 Annual mean temperatureBIO2 Mean diurnal range (max temp/min temp)(monthly average)BIO3 Isothermality (BIO1/BIO7)×100BIO4 Temperature seasonality (Coefficient of Variation)BIO5 Max. temperature of warmest period BIO6 Min. temperature of coldest periodBIO7 Temperature annual range (BIO5-BIO6)BIO8 Mean temperature of wettest quarter BIO9 Mean temperature of driest quarter
BIO10 Mean temperature of warmest quarterBIO11 Mean temperature of coldest quarterBIO12 Annual precipitationBIO13 Precipitation of wettest periodBIO14 Precipitation of driest periodBIO15 Precipitation seasonality (Coefficient of Variation)BIO16 Precipitation of wettest quarterBIO17 Precipitation of driest quarterBIO18 Precipitation of warmest quarterBIO19 Precipitation of coldest quarter
Table 2. Twelve occurrence points used to develop the model
Admin. Zone
District Area Species Altitude (m ASL)
Longitude Latitude
Manipur Ukhrul Ukhrul P. polyphylla 1779 94 o 21ʹ 67ʹʹ 25o 05ʹ 1ʹʹ Meghalaya Shillong Upper
ShillongP. polyphylla 1731 91 o 48ʹ 80ʹʹ 25 o 32ʹ 0ʹʹ
Nagaland
Wokha Mt.tiyi P. polyphylla 1557 94⁰16ʹ 050ʹʹ 26⁰06ʹ 323ʹʹ Mokokchung Longkhum P. polyphylla 1405 94⁰27ʹ 035ʹʹ 26 o15ʹ 988ʹʹ
Tuensang Pangsa P. polyphylla 1906 95⁰07ʹ 19.2ʹʹ 26 o15ʹ 46.7ʹʹ Wokha Mt.Tiyi P. polyphylla 1325 94⁰18ʹ 24.2ʹʹ 26 o 07ʹ 00.3ʹʹ Wokha Mt.tiyi P. polyphylla 1140 94⁰17ʹ 23.0ʹʹ 26 o 07ʹ 27.3ʹʹ
Zunheboto Aizuto P. polyphylla 1545 94⁰30ʹ 57ʹʹ 26 o 09ʹ 07.1ʹʹ Kohima Khonoma P. polyphylla 1880 94⁰00ʹ 36.3ʹʹ 25 o 37ʹ 47.7ʹʹ Kohima Khonoma P. polyphylla 1459 94⁰01 ʹ40.5ʹʹ 25 o 38ʹ 59.3ʹʹ Kohima Dzulekhe P. polyphylla 1670 93o56ʹ 13.4ʹʹ 25 o 37ʹ 06.1ʹʹ Kohima Dzulekhe P. polyphylla 1814 93o58ʹ 49.9ʹʹ 25o 38ʹ 10.6ʹʹ

C.R. DEB and Z.P. KIKON
INT J CONSERV SCI 9, 3, 2018: 565-576 568
Occurrence Data Twelve GPS points of the plant species (Table 2), geo-referenced during primary ground
surveys using GPS was used as occurrence points. All the occurrence points were subjected to quality test with respect to and their positional accuracy was ascertained through Google earth, duplicates were identified and removed thus maintaining only one point within 1×1km to avoid sampling bias which would otherwise favor the climatic of those sites where sampling is highly concentrated. The geo referenced points are converted to Decimal Degrees (DD) format using Microsoft Excel with a precision of four decimals from Degree Minute Seconds (DMS) format using the common formula - Decimal degrees = [(Degrees (°) + Minutes (′)/60 + Seconds (″)/3600)]×H, where H = 1 when the coordinate is in the Eastern (E) or Northern (N) Hemisphere H = -1 when the coordinate is in the Western (W) or Southern (S) Hemisphere.
As the number of presence points in below 20 (i.e., 12), 1.5× InterQuartile Range (1.5 IQR) method of identifying outliers is applied to check for outliers based on climate data developed from the environmental data obtained from Worldclim Website at 30´´. All climate data are cross checked for resolution accuracy and corrected to 30'' pixel resolution.
For MaxEnt, the coordinates were fed in longitude and latitude as MaxEnt can handle most coordinate systems provided that the Comma-Separated Value (.csv) file coordinates match the coordinate system of the spatial data layers.
Model Calibration All modeling works was carried out using MAXENT Version 3.3.3K as the present work
was based on presence points only and has low sample size and MAXENT can efficiently handle small sample size as [10]. All visualization was done in DIVA GIS 7.5.0, and all mapping works was carried out using ARC GIS 9.3. Two models were developed using Jacknifing method [7] which is also known as k-fold partitioning. In this method the data are split into k parts of roughly equal size (k > 2) and each part is used as a test set with the other k-1 sets used for model calibration. Thus, if we select k = 4 then four models will be calibrated and each model tested against the excluded test data. Validation statistics were then reported as the mean and range from the set of k tests following A.H. Fielding and J.F. Bell [11]. An extreme form of k-fold partitioning, with k equal to the number of occurrence localities, is recommended for use with very low sample sizes (e.g., < 20) [7] and known as ‘leave-one-out’ since each occurrence locality is excluded from model calibration during one partition. The first model was developed using all the 19 Bioclimatic variables whereas the second model was developed using only monthly temperature and precipitation data (Tables 3 and 4).
Table 3. Relative contributions of the environmental variables to the MAXENT Model-1 using
19 Bioclimatic variables
Variable Percent contribution Permutation importance Bio6 44.1 32.7Bio4 17.4 0.1Bio18 9.5 2.1Bio7 6.4 13.6Bio5 4.4 0.0Bio14 4.1 30.6Bio16 3.8 0.2Alt 3.4 0.8Bio13 3.3 0.2Bio12 1.3 0.0Bio17 0.8 10.3Bio19 0.6 7.1Bio8 0.4 1.1Bio3 0.2 1.0Bio10 0.1 0.0 Bio15 0.1 0.0

DISTRIBUTIONPREDICTION MODEL OF MEDICINAL PLANT (PARIS POLYPHYLLA SMITH.)
http://www.ijcs.uaic.ro 569
Table 4. Relative contributions of the environmental variables to the
MAXENT Model using only temperature and precipitation data (Model-2)
Variable Percent contribution
Permutation importance
tmin12 19.6 0.0tmin1 16.8 46.8prec12 16.4 13.5prec3 10.9 22.8prec9 9.7 0.0tmax7 8.1 0.0tmax1 6.2 3.1prec7 3.8 0.1prec8 1.2 0.5prec11 1.1 12.7prec6 1.0 0.1
Model validation and authentication For validating model robustness, 20 and 12 replicated model runs were executed for the
first and second prediction model with a threshold rule of 10 percentile training presence and employed cross validation technique for dividing the samples into replicate folds and using as test data all other parameters were kept at default. The Area Under Curve (AUC) was graded according to Thuiller et al. [12]. The distribution potential of the model was classified into very low, low, medium, high and very high. To authenticate the model intensive field surveys was carried out in the different prediction threshold areas the presence and absence of the target species was noted with respect to the prediction map developed.
Results and Discussion
Model 1 The model calibration of model 1 yielded a test AUC of 0.983 and AUC train of 0.99
with a standard deviation of 0.039 (Figure 1a). The AUC thus ranges from 0.5 for models that are no better than random to 1.0 for models with perfect predictive ability. The AUC test is derived from the Receiver Operating Characteristic (ROC) Curve. The ROC curve thus describes the relationship between the proportion of observed presences correctly predicted (sensitivity) and the proportion of observed absences incorrectly predicted (1-specificity). Thus, an AUC value of 0.7 means the probability is 0.7 that a record selected at random from the set of presences will have a predicted value greater than a record selected at random from the set of absences [13]. Table 3 showing estimates of relative contributions of the environmental variables to the MaxEnt model showed that Bio6 (Minimum Temperature of Coldest Month) contributed the maximum 44.1%) followed by Bio4 (Temperature seasonality, standard deviation × 100) and bio18 (precipitation of warmest quarter) contributing 17.4 and 9.5% respectively.
MaxEnt Jackknife test of variable importance (Figure 2a, Table 4) shows that Bio 4 (temperature seasonality) allows a reasonably good fit to the training data. The environmental variable with highest gain when used in isolation is Bio4, which therefore appears to have the most useful information by itself in the model. The environmental variable that decreases the gain the most when it is omitted is Bio6 (minimum temperature of coldest month), which therefore appears to have the most information that isn't present in the other variables. Again, same Jackknife test, using test gain instead of training gain also shows that Bio4 and bio6 as an important variable in test data gain, the test gain plot shows that a model made only with Bio12 (annual precipitation) and Bio13 (precipitation of wettest month) results in a negative test gain. The model thus is slightly below a null model (i.e., a uniform distribution) for predicting the

C.R. DEB and Z.P. KIKON
INT J CONSERV SCI 9, 3, 2018: 565-576 570
distribution of occurrences set aside for testing. This means the annual precipitation and precipitation of wettest month values are not the useful as predictor variables.
Fig.1. Distribution prediction map of Paris polyphylla (using 19 bioclimatic):
a. Model 1; b. Model 2
Fig. 2. Result for the Jackknife test of variable importance:
a. Model 1; b. Model 2
Jackknife test using AUC on test data (Figure 3), the AUC plot shows that bio4 (temperature seasonality) is the most effective single variable for predicting the distribution of the occurrence data that was left aside for testing, when the predictive performance is measured using AUC, though it was hardly used by the model built using all variables and the relative importance of Bio4 also increases in the test gain plot. These results shows that temperature variables are playing an important role for MaxEnt to obtain a good fit to the training data with the seasonal temperature variable defining better results on the set-aside test data (most useful variable as predictor).

DISTRIBUTIONPREDICTION MODEL OF MEDICINAL PLANT (PARIS POLYPHYLLA SMITH.)
http://www.ijcs.uaic.ro 571
Model 2 In the second model 12 presence points and the climate variable were used (monthly
temperature and precipitation data) to develop the model (Figure 1b). Calibration of model was done as in model 1 but model 2 resulted a better result among the other models. Twelve replicated runs resulted a test AUC of 0.974, AUC train of 0.99 and the standard deviation is 0.075.
Fig. 3. Jackknife test using AUC on test data (Model 1)
MaxEnt jackknife test of variable importance shows Tmin12 (temperature in the month of
December) giving a reasonably good fit to the training data (Figure 2b). The environmental variable with highest gain when used in isolation is Bio4, which therefore appears to have the most useful information by itself in the model. The environmental variable that decreases the gain the most when it is omitted is prec12 (precipitation in the month of December), which therefore appears to have the most information that is not present in the other variables.
Jackknife test using AUC plot reflects that the mean temperature in the month of January is the most effective single variable for predicting the distribution of the occurrence data that was left aside for testing, when the predictive performance is measured using AUC, though it was hardly used by the model built using all variables and the relative importance of Bio4 also increases in the test gain plot. The results from the second model also validates that temperature variables are playing an important role in the MaxEnt prediction model. In the present study it was found that out of the total 16579km2 area of Nagaland ca. 1626km2 falls under very high suitability threshold, 3369km2 under high category, 3468km2 under medium and low suitability and 8115km2 falls under very low suitability threshold.
Model validation and authentication Model quality was evaluated based on the prediction value of each of the occurrence
points along with the climatic conditions of the predicted area. Jackknifing method was used to develop the model and for validating model robustness, 12 replicated model runs was executed for the species with a threshold rule of 10 percentile training presence and employed cross validation technique where samples are divided into replicate folds and each fold used for test data. The model was able to predict suitable sites in the neighboring Northeastern states of India

C.R. DEB and Z.P. KIKON
INT J CONSERV SCI 9, 3, 2018: 565-576 572
and countries (Figure 4). The high suitability threshold was validated in Manipur, Meghalaya and Arunachal with secondary occurrence data, the model prediction in neighboring countries of Bhutan and Burma can also be supported by occurrence reports available from secondary sources. The model was able to predict suitable sites in neighboring states and countries.
Fig. 4. Distribution prediction map showing suitable sites predicted in neighboring states and countries
Primary ground truthing work was undertaken based on the prediction model to ascertain
model robustness and nine sites with high prediction threshold were surveyed, the detected occurrence points gives a prediction value of ~0.7/1 from stack created from the grid file of the model developed. Model established ~70% success prediction the model developed using only temperature and precipitation data. Further model was also able to correctly predict occurrence in Dzukou valley, an area not predicted by the model developed using the 19 bioclimatic variables. Both the models developed bring out important information on bio-climatic factors determining the survival and regeneration of the species. A total number 294 plant individual from 18 plant populations having 43 sub populations were inventoried and 19 of these sub populations were found in very high suitability prediction threshold, 15 in high, 7 sub populations in medium and 2 of the sub population in low prediction threshold. The occurrence of the species was found in patches, this could be due to absence of dispersal agents and no biological agents for this purpose. The area of occurrence was mostly undisturbed forest and well shaded by canopy cover of trees belonging to Schima wallichii; Quercus species; Juglans regia and Lithocarpus sprcies and two populations was found under bamboo forest. Some of the main associate species found in almost all the areas except Dzukou valley are Urtica species, Girardiana diversifolia, Smilax species, Curculigo species etc.
The two models result clearly identifies the variable which plays an important role for determining the survival and multiplication of the plant species. The two models were able to bring out significant result in identifying the natural temperature stratification controlling seed germination in nature that is comparable with L. Zhou et al. [14]. The significance of this minimum temperature in the month of December and January can be compared with the post dehiscence Paris polyphylla seeds. The two models stressed out the importance of cold climatic conditions and different seasonal temperature post dehiscence. In nature the areas which are able to provide these climatic requirements will be ideal locations for their conservation as well as reintroduction, significantly the prediction model developed was able to predict the areas having a climatic conditions described above.

DISTRIBUTIONPREDICTION MODEL OF MEDICINAL PLANT (PARIS POLYPHYLLA SMITH.)
http://www.ijcs.uaic.ro 573
Field introduction of plantlets The prediction model developed was subjected to trials by introducing plantlets to areas
predicted suitable and un-suitable areas to test model applicability. Three sites have been selected for testing the response of the plantlets based on the prediction model. The three sites include; Site-1: Koio Village - 94˚18´0.333´´E 26˚07´0.108´´N (predicted highly suitable), Site- 2: Wokha village - 94˚18´23.9´´ E 26˚06´59.5´´N (predicted highly suitable but disturbed), Site-3: Lumami- 94˚28´21.3´´E 26˚13´32.0´´N (predicted not suitable). In each Site 100 matured rhizomes were introduced and the growth and response of the plants were observed. The responses of the plantlets in each site with respect to positive response and flowering are noted. In site-1 and site-2 success percentage of the introduced plantlet was high with plantlets showing flowering and formation of seeds. However, site-3 which was predicted not suitable, most of the plantlets did not show any signs of positive response and only few plantlets showing positive response but could not reach adult stage.
Conservation planning and prioritizing areas for reintroduction The different populations have been observed in tropical, sub-tropical forest and
temperate forest under canopy cover, either under well stratified tree covers or bamboo forest. Biological impacts like logging, Jhuming and collection are some main factors that are bringing noticeable changes to the forest over a short period of time. Habitat range of the plant varies from a well shaded full canopy cover to partial cover with presence of a thick forest litter. High level of anthropogenic activities effects population dynamics and disturbs the fecundity of adult population. Effective studies on population dynamics and fecundity in nature could not be given an insight approach as the levels of biotic interference are too high and does not allow continues and regular studies of the population in question and viability of the meta-population is rendered almost negligible and efforts are on to design an alternate approach.
The spatially separated population occurs in forest types ranging from tropical, sub-tropical to temperate forest. This spatially separated population shares similarity in adaphic conditions like forest litter content, similarity in seasonal climatic variables like temperature and precipitation. These occurrence points all fall within a minimum winter temperature range 0-7ºC and a mild summer temperature ranging from 20-28ºC except for Dzukou which experiences below freezing point during winter months. The lower ranges of Japfu mountain forest belt having a high occurrence falls within very high prediction threshold offers sites for species conservation, ground truthing also revealed the existence of southern Angami village community forest, western Angami village community forest and some Chakesang village community forest (Figure 5a and b). Superimposing the prediction map to Google earth has shown special reserve areas falling within high prediction threshold viz. Pulie badze wildlife sanctuary, Khonoma nature conservation and Tragopan sanctuary, Dzukou valley, southern and western Angami village community reserve forest whose presence were validated through ground truthing. These forests will serve as excellent sites for in situ conservation and possible re-introduction for species recovery.
Concept of mosaic modeling The possibility of climatic threshold as a limiting factor in Niche modeling can increase
for those species which are highly sensitive to change in climatic conditions. Prediction of suitable sites over a large area do not always gives usable models when the occurrence points are low [7]. In such situation the total geographical area can be fragmented according to different climatic conditions. Models can be developed for each small area with different climatic conditions. Following model development, all the small models can be stitched together as shown in figure 6 which will generate a mosaic pattern of ENM named ‘Mosaic Model’ (Figure 6). This could serve well as a better model than encompassing a bigger area and this study shows the effectiveness of the model prepared using only 12 presence points over a small area.

C.R. DEB and Z.P. KIKON
INT J CONSERV SCI 9, 3, 2018: 565-576 574
Fig. 5. a. Google earth map Angami and Chakesang village community: a. areas validated (Numbered in Blue); b. levels of prediction and the validated areas
The present study also proves the effectiveness of prediction models developed using low occurrence points over a well defined area. As there is always the possibility of occurrence of the same species in a completely different set of climatic conditions, this could result in prediction of the threshold level between the two different sites having a completely different environmental condition as suitable as unsuitable area is included in the envelope and the model thus produced may result in over prediction thus will not be applicable. In such cases a concept of ‘Mosaic modeling’ where a particular area having different range of climatic threshold can be partitioned and models for each partition can be developed to reduce the influence of vast climatic differences within the area of interest on the model. For example, an area of interest (A) is divided into three parts (A1, A2, and A3) and prediction model for each of these areas is developed separately and the model thus obtained is stitched together as mosaic. In cases of donor and recipient approach to rehabilitation of species, the same species adapted in different climatic condition may not be suitable for reintroduction to a new area having different environmental set where earlier records of the species occurrence have been recorded. In this case, Dzukou valley having unique temperate climatic condition supports growth of the target species but the first model developed using the 19 bioclimatic variables fails to predict its occurrence and plants collected from Dzukou valley were unable to survive when introduced in new area predicted suitable and in areas where the same species are present. This conditioning of plant species over a particular environment set could be a hindrance to reintroduction programmes and thus the concept of mosaic prediction models could help to overcome such problems, this concept however calls for more future in-depth studies.
Fig. 6. Fragmentation of sites into mosaic for prediction models Mosaic model)

DISTRIBUTIONPREDICTION MODEL OF MEDICINAL PLANT (PARIS POLYPHYLLA SMITH.)
http://www.ijcs.uaic.ro 575
This study also explores the potential application of Niche models in conservation. The
target plant which is under high exploitation faces a threat of elimination from the natural habitat and this study provides a timely intervention for prioritization and conservation of the plant species in the high suitability areas. Introduction of plantlets in the selected sites also gives a good authentication of the ability of the model in determining the suitability areas with respect to the selected climatic conditions. During the course of the study some major factors causing a rapid decline in the population of the plant species were identified. Major portion of this factors are biotic, mostly anthropogenic. This includes very high illegal collection rate in all the areas surveyed due to the potential market value of rhizome. Due to its slow growth cultivation of the species was not considered as an attractive alternative by the local peoples thus plants are collected in wild and very fewer efforts are done to cultivate the plant species. Apart from illegal collection and trade another major factor posing high threat is Jhuming and forest fire as it destroys vast expanse of forested areas and along with the destruction of forest, the habitat as well as the plant species is destroyed, unplanned developmental works like construction of Agri-link roads in villages lacks expertise, thereby causing more destruction to habitats. Anthropogenic activities leading to loss of adult plants lowers the fecundity and thus low fecundity cannot be related to natural conditions alone. The levels of exploitation in terms of excessive collection cannot be studied in detail due to the unwillingness of dealers and local people to divulge information. Some natural factors like inability of flowers to produce seeds or failure of seeds to germinate is observed but these factors are overshadowed when compared with the magnitude of anthropogenic factors.
Conclusion
The work explores on the potential application of niche models to predict the occurrence of an economically important plant which have been highly exploited for its medicinal properties. During the present study MaxEnt was used to develop the climate suitability model as MaxEnt is a software specially designed to handle small sample size and presence only data. Two models were developed using two different sets of data and the model thus generated brings out interesting observation on the climatic parameters which are important determinants for the survival of the target plant. Model developed was validated through ground truthing which was able bring out new population not only in the study site but also in neighboring states and countries bordering the target study area. The present study also introduced a new concept model ‘Mosaic modeling’. Acknowledgement
Authors are thankful to Department of Biotechnology, Ministry of Science and Technology, Government of India, New Delhi for the financial assistance through the project grant to Prof. C. R. Deb. The facilities used from the DBT sponsored Institutional Biotech Hub and UGC-SAP (DRS-III) are duly acknowledged. Authors are thankful to villagers of Khonoma, Khezakheno, Jotsoma, Pangsa, Koio, Wokha village, Nagaland and all the field guides for their immense help during field study. References [1] C.R. Deb, N.S. Jamir, Z.P. Kikon, Distribution prediction model of a rare orchid species
(Vanda bicolor Griff.) using small sample size, American Journal of Plant Science, 8, 2017, pp. 1388-1398. doi: 10.4236/ajps.2017.86094.

C.R. DEB and Z.P. KIKON
INT J CONSERV SCI 9, 3, 2018: 565-576 576
[2] A. Guisan, W. Thuiller, Predicting species distribution: offering more than simple habitat models, Ecological Letter, 8, 2005, pp. 993-1009.
[3] C.R. Deb, S.L. Jamir, N.S. Jamir, Studies on vegetative and reproductive ecology of Paris polyphylla Smith: A vulnerable medicinal plant, American Journal of Plant Science, 6, (2015), pp. 2561-2568, DOI: http://dx.org/10.4236/ajps.2015.616258
[4] S.A. Shah, P.B. Mazumder, M.D. Choudhury, Medicinal properties of Paris polyphylla smith: A review, Journal of Herbal Medicine and Toxicology, 6(1), 2012, pp. 27-33.
[5] H. Li, The phylogeny of the genus Paris L., Acta Botanica Yunnanica, 6, 1984, pp. 351-362.
[6] J. Grinnell, Field tests of theories concerning distributional control, The American Naturalist, 51, 1917, pp. 115–128.
[7] R.G. Pearson, C.J. Raxworthy, M. Nakamura, A.T. Peterson, Predicting species distributions from small numbers of occurrence records: a test case using cryptic geckos in Madagascar, Journal of Biogeography, 34, 2007, pp. 102–117.
[8] S.J. Philips, R.P. Anderson, R.E. Schapire, Maximum entropy modeling of species geographic distributions, Ecological Modelling, 190, (2006), pp. 231-259.
[9] R.J. Hijmans, S.E. Cameron, J.L. Parra, P.G. Jones, A.Jarvis, Very high resolution interpolated climate surfaces for Global land areas, International Journal of Climatology, 25, 2005, pp. 1965–1978.
[10] S.J. Phillips, R.P. Anderson, R.E. Schapire, Maximum entropy modeling of species geographic distributions, Ecological Modelling, 190, 2006, pp. 231-259.
[11] A.H. Fieldings, J.F. Bell, A review of methods for the assessment of prediction errors in conservation presence: absence models, Environmental Conservation, 24(1), 1997, pp. 38-49.
[12] W. Thuiller, D. M. Richardson, P. Pysek, G. F. Midgley, G. O. Hughes, M. Rouget, Niche-based modelling as a tool for predicting the risk of alien plant invasions at a global scale, Global Change Biology, 11, 2005, pp. 2234–2250.
[13] J. Pearce, S. Ferrier, Evaluating the predictive performance of habitat models using logistic regression, Ecological Modelling, 133, 2000, pp. 225-245.
[14] L. Zhou, J. Wu, S. Wang, Low-temperature stratification strategies and growth regulators for rapid induction of Paris polyphylla var. yunnanensis seed germination, Plant Growth Regulation, 41, 2003, pp. 179-183.
______________________________________ Received: November 26, 2017 Accepted: August 25, 2018