mx-'-sea biology - international atomic energy agency
TRANSCRIPT
FEASIBILITY OF DISPOSAL OF HIGH-LEVEL RADIOACTIVE WAST
INTO THE SEABED
VOLUME 6
mx-'-SEA BIOLOGY, BIOLOGICAL PROCESSES
ANDRADIOBIOLOGY
IT RJ. HNTBUIH, I I HABGWI,
E&J.BOE,M.SDVn
NUCLEAR ENERGY AGENCY ORGANISATION FOR ECONOMIC CO-OPERATION AND DEVELOPMENT
ORDER FORM SPECIAL 30 % DISCOUNT
Use this order form to receive a 30 % discount when you purchase the entire set of the 8 volume series "Feasibility of Disposal of High-Level Radioactive Waste into the Seabed", published by the OECD Nuclear Energy Agency.
Please enter my order for ....set(s) at the special 30 % discounted price of FF994 £116.00 US$219 DM427
The volumes may also be purchased individually copy(ies) Volume 1 - OVERVIEW OF RESEARCH AND CONCLUSIONS
(66 88 09 1) ISBN 92-64-13164-7 FF90 U ^ . O O £11.00 DM39 . . . . copy(ies) Volume 2 - RADIOLOGICAL ASSESSMENT
(66 88 10 1) ISBN 92-64-13165-5 FF220 US; ' >.50 £26 00 DM95 . . . . copy(ies) Volume 3 - GEOSCIENCE CHARACTERIZATION STUDIES
(66 88 11 1) ISBN 92-64-13166-3 FF220 US$48.50 £26.00 DM95 copy(ies) Volume 4 - ENGINEERING
(66 88 12 1) ISBN 92-64-13167-1 FF170 US$37.50 £20.00 DM74 copy(ies) Volume 5 - DISPERSAL OF RADIONUCLIDES IN THE OCEANS: MODELS, DATA
SETS AND REGIONAL DESCRIPTIONS (66 88 13 1) ISBN 92-64-13168-X k FF280 US$62.00 £33.00 DM121
. . . . copy(ies) Volume 6 - DEEP-SEA BIOLOGY, RADIOLOGICAL PROCESSES AND RADIOBIOLOGY (66 88 14 1) ISBN 92-64-13169-8 FF150 US$33.00 £18.00 DM65
. . . . copy(ies) Volume 7 - REVIEW OF LABORATORY INVESTIGATIONS OF RADIONUCLIDES MIGRATION THROUGH DEEP-SEA SEDIMENTS (66 88 15 1) ISBN 92-64-13170-1 FF190 US$42.00 £22.50 DM82
. . . . copy(ies) Volume 8 - REVIEW OF PROCESSES NEAR A BURIED WASTE CANISTER (66 88 16 1) ISBN 92-64-13171-X FF100 US$22.00 £12.00 DM43
Total amount of purchase: FF £ US$ DM
• Individuals must enclose payment with their order. Libraries must attach a purchase order to this form.
• cheque • or money order D enclosed « send invoice; our purchase order is attached • charge my VISA card (Note: You will be charged the French franc price).
Number of card
Expiration date Signature
Send publications to: (Pteaseptmt)
Send this order form to : OECD Publication* Sanrlca, 2 m« Andre-Pascal, 75775 Pari* CEDEX 16, Franca. You may also order through one of the OECD Publications distributors listed on the inside back cover of this book, in which case you will be billed in local currency in keeping with usual practices.
Pursuant to article I of the Convention signed in Paris on 14th December, 1960, and which came into force on 30th September, 1961, the Organisation for Economic Co-operation and Development (OECD) shall promote policies designed:
- to achieve the highest sustainable economic growth and employment and a rising standard of living in Member countries, while maintaining financial stability, and thus to contribute to the development of the world economy;
- to contribute to sound economic expansion in Member as well as non-member countries in the process of economic development; and
- to contribute to the expansion of world trade on a multilateral, non-discriminatory basis in accordance with international obligations.
The original Member countries of the OECD are Austria, Belgium, Canada, Denmark, France, the Federal Republic of Germany, Greece, Iceland, Ireland, Italy, Luxembourg, the Netherlands, Norway, Portugal, Spain, Sweden, Switzerland, Turkey, :he United Kingdom and the United States. The following countries became Members subsequently through accession at the dates indicated hereafter: Japan (28th April, 1964), Finland (28th January, 1969), Australia (7th June, 1971) and New Zealand (29th May, 1973).
The Socialist Federal Republic of Yugoslavia takes part in some of the work of the OECD (agreement of 28th October, 1961).
The OECD Nuclear Energy Agency (NEA) was established in 1957 under the name of the OEEC European Nuclear Energy Agency. It received its present designation on 20th April, 1972, when Japan became its first non- European full Member. NEA membership today consists of all European Member countries of OECD as well as Australia, Canw a, Japan and the United States. The commission of the European Communities takes part in the v.nrk q the Agency.
The primary objective of NEA is to promote co-operation between the governments of iv participating countries in furthering the development of nuclear power as a safe, environmentally acceptable and economic energy source.
This is achieved by: - encouraging harmonisation of national, regulatory policies and practices, with particular
reference to the safety of nuclear installations, protection of man against ionising radiation and preservation of the environment, radioactive waste management, and nuclear third party liability and insurance;
- assessing the contribution of nuclear power to the overall energy supply by keeping under review the technical and economic aspects of nuclear power growth and forecasting demand and supply for the different phases of the nuclear fuel cycle;
- developing exchanges of scientific and technical information particularly through participation in common services;
- setting up international research and development programmes and joint undertakings.
In these and related tasks, NEA works in close collaboration with the International Atomic Energy Agency in Vienna, with which it has concluded a Co-operation Agreement, as well as with other international organisations in the nuclear field.
© OECD, 1988 Application for permission to reproduce or translate
all or part of this publication should be made to: Head of Publications Service, OECD
2, rue Andre-Pascal, 75775 PARIS CEDEX 16, France.
Spant fuel or high-level radioactive wast - is nov pro*'v ed Jr» i.iiry countri*>j *s a result of the generation of electi city by nuci< ir reactors. The loag ,; riods of time over which this type of *«-'te remain:, potentially hazardo .<? require a disposal method based on its inability to pre 'i">e long-t( -I? isolation. Burial beneath the ocean fl' T in geoloj, i ally stable stdime- \. formations has been studied because of i potential f..r lo.ig-tcrm isolation
S\nce 1977, countries conducting research c. ocean-floor bin .-I of high-levsl waste, often called sub-seabed or seabe disposal, hav. coJ:^T-zed and exchanged information in the framework of the . c,abed Working <.-cour> established v.r.der the Radioactive Waste Management Com.aKree of the CBCD Ni-lear Energy Agency. Members of the Group are: Belgium, ' iidda, France, -':> federal Republic of Germany, Italy, Japan, the Netherlands, Switzerland, Unit* . Kingdom, United States, and the Commission of the European Communities (CEC).
Tlie objective of the Seabed Working Group i? o provide scienti c and technical information to enable international and national authorities o assess the safety and engineering feasibility of seabei' disposal. As r: le of the participating countries intend to use seabed dispxil in the forest. ible future, the work of the Seabed Working Group should ei.~e.icially be seen t this rta^e as a scientitic contribution to the identification and asses; ant of potential methods for radioactive waste disposal.
An Executive Committee guided the overall direction and policy of • e Seabed Working Group in this research. Its members represented their respective national programmes, mad2 financial coramitnv.it:, and coordinated national positions in order to permit the Seabed Work'ng Group to pursue !• overall objectives. A large number of scientists have, contributed to the research which comprises the present body of knowledge reiatinp to seabed disposal of radioactive waste.
This volume is one of a series of eight volumes &- ;ssing seabed dis posal based on research carried out by the Seabei. Work ng -roup over the !--.. ten yecrc. Volume 1 provides an overview of the researJi end a summary of fh results. Volumes 2 to 8 consist of technical supplement viich provide a nor detailed description of radiological assessment, geosciei a characterization, engineering studies and the scientific basis upon which \e radiological assessment is built. Although legal, political, and institu'ional aspects a,e essential to possible future use of seabed disposal, they re not being considered in this series.
This report represents the views of the authors. Ii commits neither the Organisation nor the Governments of Member Countries.
- 3 -
S E R I E S T I T L E S
GENERAL TITLE FOR THE SERIES
Feasibility of Disposal of High-Level Radioactive Waste into the Seabed
SUMHARY REPORT
Volume 1: Overviev of Research and Conclusions
TECHNICAL REPORTS
Volume 2: Radiological Assessment
Volume 3: Geoscience Characterisation Studies
Volume 4: Engineering
Volume 5: Dispersal of Radionuclides in the Oceans: Models, Data Sets, and Regional Descriptions
Volume 6: Deep-Sea Biology, Biological Processes, and Radiobiolo
Volume 7: Review of Laboratory Investigations of Radionuclide Migration through Deep-Sea Sediments
Volume 8: Review of Processes near a Buried Waste Canister
The summary report, which provides an overview of the research and a summary of the results, is also available in French. The technical reports contain detailed descriptions of the studied areas and are published in English only.
D.R. Anderson (United States) and C.N. Murray (Commissici of the European Communities) played major roles in the Seabed Working Group. Their work as a team to provide overall managerial direction and coordination is acknowledged.
Also acknowledged is K.R. Hinga, the Series Editor, for his excellen contribution to the organisation and presentation of the reports.
4
AUTHOR'S PREFACE
This volume contains the summary of discussions and work carried out by
the Biological Task Group during the past twelve years. Throughout this
period, as the programme as a whole has developed, the ideas and objectives
have tended to change. This has been because of the varying demands of rela
ted task groups - primarily those of physical oceanography and radiological
assessment - together with the skills and influence of the different partici
pants who have attended each meeting. In addition to the authors, those
recorded as having attended one or more of the annual meetings since 1976 are
listed below. The initial task group leader was Dr A. A. Yayanos, who played
a major role in formulating its objectives and direction; since 1982 this
task has been carried out by Dr R. J. Pentreath.
The authors would like to express their thanks to all of those who have
contributed to the writing and production of this volume, for the inclusion o
their data and information, and for the helpful and critical comments which
have been received on the earlier drafts.
List of BTG attendees, 1976 to 1987
USA:
Canada:
UK:
France:
A. A. Yayanos, L. Gomez, R. R. Hessler, K. Hinga
B. Hargrave, P. Schwinghamer
R. J. Pentreath, M. Angel, A. L. Rice, M. J. Holden, H. S. J. Roe
Y. Belot, M. Sibuet
W. Feldt, D. Schnack, H. Thiel FRG:
Switzerland: L. HottInger
Japan: R. Ichlkawa, H. Ishikawa
Netherlands: A. W. van Weers, G. C. Cadee
Italy: G. Izzo
CEC: E. Schulte
- 5 -
EXECUTIVE SUMMARY
It has been shown that an understanding of biological processes in the
oceans is important to the assessment of the disposal of high-level radio
active wastes into the sea bed for a number of reasons. These include
the role played by living organisms in redistributing radionuclides in
the oceans, primarily via the production of particulate matter and by
bioturbatory processes,
the predominance of seafood pathways in transferring radionuclides to man
as a result of the accumulation of radionuclides by the marine fauna and
flora, and
the need to ensure an adequate level of protection of the marine environ
ment itself.
Various aspects of deep-sea ecology and marine radiobiology have been
reviewed and their relevance to radioactive waste disposal discussed. The
work of the Biological Task Group as a whole has been summarized, particularly
with regard to the biological description of selected sites, the means by
which radionuclides could result in human exposure via seafood pathways, and
the doses likely to be received by, and effects on, the deep-sea fauna.
It is concluded that:
1. no biological factors have been identified which would preclude the
option of disposal of high-level radioactive wastes into the deep sea,
2. the mass transport of radionuclides by biological processes is not sig
nificant in comparison with physical processes in transferring radionu-
lides from the deep sea into surface waters,
3. the principal role of biological processes is primarily that of retarding
the upward transport of radionuclides via the scavenging actions of
particulate materials in the water column,
6 -
Ti although no short-chain pathways from the deep sea to man have been iden
tified, preliminary modelling calculations have indicated that any dose
to man via such sustained pathways would probably be no greater than
those resulting from the consumption of seafood taken close to the sea
bed or in surface waters, and
5. that dose rates to the deep-sea fauna would be at or below background
levels of radiation and thus unlikely to be detrimental at a population
level.
These preliminary conclusions, however, require further comment. A few
biological mechanisms have been found whereby radionuclides could be transpor
ted from the sea bed to the upper layers of the ocean but, as far as is known,
the quantities are so extremely small that they would not alter the above
conclusions. Nevertheless, many of the biological data are based upon single,
or very few, observations and the level of modelling used - be it mass-
transfer, food chain-transfer, or dose to fauna - is a direct reflection of
the quantity of data available. Thus a limited amount of continued work
addressing these questions, particularly of model development and evaluation,
would ensure that the high level of confidence necessary to continue the
evaluation of this option in the future is achieved. All of this, however,
depends upon the necessary expertise still being available. It is therefore
highly desirable to ensure that such expertise will continue to exist within
the international framework.
- 7 -
TABLE OF CONTENTS
Pag
CHAPTER 1: INTRODUCTION 12
CHAPTER 2: BIOLOGICAL PROCESSES IN THE OCEANS 18
Introduction 18 Organisms in the water column 19 Benthic biology 28 Biological processes in the abyssal plains 29 The dynamics of the deep-sea fauna 35
CHAPTER 3: BIOLOGICAL DESCRIPTION OF SELECTED SITES 41 Introduction 41 Atlantic Ocean sites 42
Great Meteor East (GME) 42 Southern Nares Abyssal Plain (SNAP) 61 Hatteras Abyssal Plain 76
Pacific Ocean sites 77 MPG-1 77
CHAPTER 4: MARINE RADIOBIOLOGY 85 Introduction 85 Analyses of deep-sea fauna 86 Analyses of shallow-water fauna 90 Environmental and laboratory studies 94
CHAPTER 5: BIOLOGICAL CONCENTRATION FACTORS FOR RADIONUCLIDES 96 Introduction 96 CF values: derivation and factors affecting them 97 IAEA values 99
Fish 100 Crustaceans 101 Molluscs 102 Macro-algae 102 Plankton 103 Cephalopods 105 Mesopelagic fish 105
The SANDIA Reports 106
CHAPTER 6: THE ROLE OF BIOLOGICAL PROCESSES IN REDISTRIBUTING RADIONUCLIDES IN THE OCEANS 109 Introduction 109 Mass transfer of radionuclides up from the deep sea 109 The role of biologically-mediated particulate matter 113 Bioturbation 120
- 8 -
Pag
CHAPTER 7: BIOLOGICAL PATHWAYS OF THE TRANSFER OF RADIONUCLIDES BACK TO MAN 124 Introduction 124 Existing commercial 'deep-sea' pathways 125 The possibility of mid-water transport 130 Vertical transport from the sea bed 130 Transport close to the sea bed 134
CHAPTER 8: BIOLOGICAL TRANSFER FACTOR MODELLING 147 Introduction 147 Simple equilibrium food-chain models 148
CHAPTER 9: COLLECTIVE DOSE CONSIDERATIONS 156 Introduction 156 Quantitative estimates 158
CHAPTER 10: THE EFFECTS OF RADIATION ON THE DEEP-SEA FAUNA 160 Introduction 160 Dosimetric models 161
Gamma radiation 161 Beta radiation 164 Alpha radiation 166
The radiation background in the deep sea 167 The effects of radiation on aquatic organisms 171 The effects of irradiation on deep-sea bacteria 173 Dose rates estimated to arise from high-level waste disposal 175
CHAPTER 11: THE FEASIBILITY OF 'MONITORING' POSSIBLE BIOLOGICAL CHANGES AT A CHOSEN SITE 180 Introduction 180 Environmental influences on community composition .... 180 Estimating changes in faunal composition 183
CHAPTER 12: CONCLUSIONS AND RECOMMENDATIONS 187
REFERENCES 190
APPENDIX A TABLES OF CONCENTRATION FACTOR DATA
- 9 -
CONTENTS (Continued)
Figures
Page
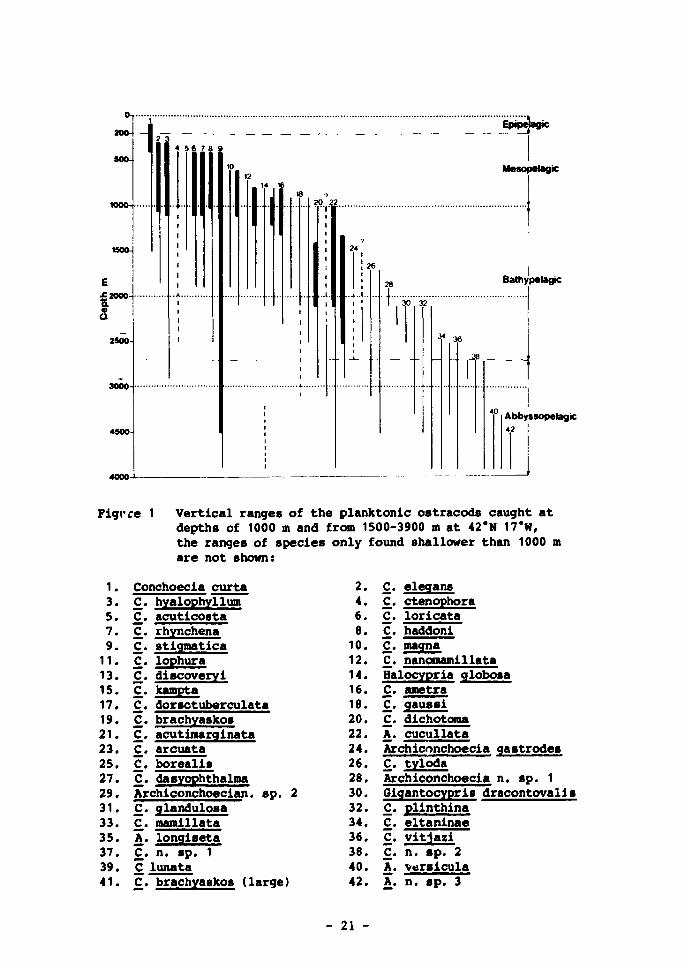
1 Vertical ranges of the planktonic ostracods caught at depths of 1 000 m and from 1 500-3 900 m at 42°N 17°W, the ranges of species only found shallower than 1000 m are not shown 21
2 Vertical ranges of three groups of micronektonic crustaceans at 42°N 17°W; Decapoda (18 species), Euphausiacea (11 species), and Mysidacea (17 species) from the surface to 3 900 m 22
3 Locations of candidate study areas in the Atlantic 43 4 Location of the North Pacific study areas. Candidate loca
tion Bl, CI and E2 are in tYe PAC1 region whereas candidate locations MPG1 and II are in the PACII region 44
5 GME: track charts of the IOS midwater sampling 49 6 Displacement volume/depth of plankton caught by the IOS RMT1
(size range 0.32 to 4.5 mm) 50 7 Displacement volume/depth of micronekton caught by the I0S
RMT8 (size range > 4.5 mm) 51 8 Dry weight/depth for plankton (0.32-4.5 ran) and micronekton
(> 4.5 mm). Day data used for depths less than 1500 m .... 53 9 Regression lines for biomass profiles at GME and elsewhere
in the Atlantic. P * plankton; M - micronekton. Separate regressions have been calculated for GME data above and below 1000 m 54
10 Dry weight/depth for near-bottom plankton (RMT1) and micronekton (RMT8) 57
11 GME: track charts of the benthic sampling 59 12 .Vertical profiles of primary production, suspended chloro
phyll £ and specific production near 23°20'N and 64°0.7*W in the Nares Abyssal Plain. Profiles drawn through the mean of four measurements at each depth taken over four consecutive days (22-26 November 1985) during cruise EN-137-II (Endeavor, Brookhaven National Laboratory, USA). Horizontal lines represent ranges of values observed. (Unpublished data from G. Rowe, Brookhaven National Laboratory) 63
13 Vertical distribution of zooplankton biomass (displacement volume) and phaeopigment concentration over the upper 500 m at a site in the Nares Abyssal Plain. Nested oblique net: hauls (1-m rings, 149 um mesh with flow meters) were used to sample depth stratum samples. Horizontal lines indicate ranges of values observed. (Unpublished data from S. Smith and P. Lane, Brookhaven National Laboratory) 64
14 Size distribution, spectrum and range of biomass in different size classes of benthic organisms collected in box cores and by epibenthic sled tows in the area 22°43'N to 25°23'N and 61°31'W to 63°3'W of the Nares Abyssal Plain. Methods for estimating biovolume of various organism size categories and data described in Schwinghamer (1985) 68
- 10 -
CONTENTS (Continued)
Figures (Continued)
Pag
15 Transect of four stations a.ross the central and eastern North Pacific 83
16 Concentrations, mean and range, of 210Po (Bq kg-* wet) in the muscle tissues of deep-sea fish in relation to depth of capture 87
17 Concentrations, mean and range, of 210Po (Bq kg-1 wet) in the livers of deep-sea fish in relation to depth of capture 88
18 Concentrations, mean and range, of 210Po (Bq kg-1 wet) in gonad tissue of deep-sea fish in relation to depth of capture 89
19 Vertical profile of megabenthic biomass expressed as grammes ash-free dry weight per m observed in the Porcupine Seabight region during the IOS benthic programme 136
20 Vertical distribution of benthopelagic fish biomass expressed as kilogrammes wet weight per 1000 m observed in the Porcupine Seabight region during the IOS deep-trawling survey using a semi-balloon otter trawl 137
21 The vertical ranges of the 95 species f benthopelagic fishes captured during the IOS deep-trawling survey of the Porcupine Seabight region 138-139
22 The vertical ranges of Asteroidea (starfish) taken during the IOS benthic programme in the Porcupine Seabight 140-141
23 The vertical ranges of Holothuroidea (sea cucumbers) taken during the IOS benthic programme in the Porcupine Seabight 142-143
24 Absorbed dose fraction for gamma radiation in different sizes of organisms 163
25 Absorbed dose fraction for beta radiation in different sizes of organism • 165
- 11 -
1: INTRODUCTION
The biological sciences have, from the very beginning of the Seabed Work
ing Group programme, had a vital role to play in assessing the feasibility of
disposing of high-level radioactive wastes into the deep oceans. There are
a number of reasons for this. In the first instance, biological processes
play a significant role in determining the distribution of radionuclides in
the oceans in space and time. This may be the result of direct action - such
as the physical disturbance of settled sediments - or indirectly as the result
of producing particulate materials, in the water column, which scavenge radio
nuclides and remove them to the sea bed. Indeed biological processes may even
transform the chemical state, and thus the behaviour, of some radionuclides.
More important, however, is the fact that biological processes - in the shape
of biological food-chain pathways - provide the principal means by which man
is likely to be exposed to radionuclides which have been released into the
oceans, regardless of depth. It is therefore important to have sufficient
information on the relationship between ambient concentrations of radionuc
lides and potential seafood materials in order to make assessments of dose to
the human population.
Another subject of prime concern is that of protection of the marine
environment itself. The deep sea is an immense and little-known ecosystem,
replete with highly specialized and unique fauna. Thus although a disposal
site would only involve a very small area of the sea bed, and the site would
be selected largely for its geotechnlcal properties, it is nevertheless essen
tial to characterize it in terms of its biology. This is primarily to ascer
tain the extent to which the area is representative of the region as a whole,
to evaluate the possibility of direct biological pathways from the deep sea to
man, and - at this stage - to serve as a base-line study for any future
investigations. Equally important is the need to make an estimate of the dose
rates likely to be received by the deep-sea fauna, and an evaluation of the
potential impact which enhanced levels of radiation could have upon them. Al1
of thesg subjects have been addressed by the Biological Task Group (BTG)
throughout the twelve-year programme.
The work of the group has centred around two areas of contemporary marin
science: deep-sea biology and marine radiobiology, both of which have their
- 12 -
own highly specialized fields of discipline and associated terminology. They
are also subjects in which new information is rapidly being acquired. There
have been many advances in recent years within the subject of marine biology
which have radically altered our understanding of the deep sea. In particu
lar, the science has in general moved from one of a primarily descriptive
nature to one which attempts tc unravel the many processes which are occur
ring. This has been possible as a result of technological advances which have
been developed throughout the world. The studies which have been made through
the BTG have therefore to be seen against a background of continuing deep-sea
biological research which has been taking place in many laboratories that have-
not been directly involved in the programme. Much of the effort has of neces
sity been directed towards providing ideas, information, and data for model
ling. The results of these studies have been summarized within the BTG
reports of the Annual Meetings, and in national reports such as those of the
SANDIA series in the USA, 10S and DOE series in the UK, and the IFREMER series,
in France. Much of the data has already been published in the open
literature.
The US biological work has been recently summarized by Gomez et_ al.
(1986) in SAND85-1037. It has consisted primarily of studies on benthic bio
logy, on the fauna of certain areas within the Pacific basin, on the metabo
lism of the deep-sea fauna, and on deep-sea biophysics; the majority of this
work has been undertaken at the Scrinns Institution of Oceanography, La Jolla,
California. The UK biology programme has been concerned with site investiga
tions at Great Meteor East (GME) in the Atlantic Ocean (Roe, 1985; Roe et_
al., 1986, 1987), with general ecological and process studies (Hargreaves et
al., 1984; Angel, 1985; Booty, 1985), and with more specific studies on the
reproductive biology of echinoderms (e.g. Tyler, 1987). The French, too, have
concentrated on Atlantic sites and a general report on deep-sea biology based
primarily on the last decade of observations has been prepared by Sibuet and
Juniper (1986). The Canadian studies have provided detailed biological infor
mation for another Atlantic site, the Southern Nares Abyssal Plain (SNAP). By
and large, all of the biological work has served to emphasize the compara
tively low level of knowledge of deep-sea biology as a whole, and the continu
ing need for further studies; nevertheless, sufficient data are available to
compare the biological aspects with the other components of the programme.
- 13 -
Equally Important has been information on the interaction of radionuc-
lides with the marine fauna, a subject loosely described as marine radiobio-
logy. This encompasses two separate aspects: the extent to which marine
organisms accumulate radionuclides within their tissues, and the possible
effect exposure to radionuclides may have upon them. Again these are areas of
study which are pursued in many national programmes but some studies have been
specifically addressed as a result of the SWG programme. It is also an area
which relates to comparative shallow water studies, because the major poten
tial pathways for radionuclide transfer to man arise not from the deep itself
but from areas in which intensive commercial fishing takes place. The UK has
a large research programme on marine radioecology, primarily related to coas
tal water discharges, and data arising from it have been used extensively
within the BTG. Similarly, data from the French radioecology programme have
been used, together with studies made at the laboratory at S. Teresa, Italy,
and the environmental studies carried out in the Atlantic Ocean by the Federal
Republic of Germany in relation to the sea dumping of low-level waste.
In fact the work of the biology task group has been much assisted by
parallel activities within the NEA concerning the disposal of low-level pack
aged wastes in the deep sea. In recent years the NEA has maintained a
Co-ordinated Research and Environmental Surveillance Programme (CRESP) in
relation to the NE Atlantic Ocean low-level waste dump site. This is a rather
specific area of interest, but from the biological point of view the two pro
grammes have had a number of subjects of similar interest and both have
addressed essentially the same questions. A number of BTG members have in
fact participated in both programmes and much of the data bases generated
(e.g. Feldt ejt jd., 1985; van der Loeff and Lavaleye, 1986) have been appli
cable to both programmes, the major difference being that of the biological
descriptions of the sites. The NEA has already produced three substantial
documents relating to low-level dumping (NEA, 1983, 1985, 1986) and It has
therefore appeared to be sensible to draw unon these documents, as appro
priate, in the writing of this volume. Other activities have also been
carried out in parallel which are of relevance. The IAEA, in its revision of
the Definition and Recommendations concerning radioactive wastes for the pur
poses of the Convention on the Prevention of Marine Pollution by Dumping of
Wastes and other Matter (the 'London Dumping Convention') has initiated a
number of pertinent exercises (IAEA, 1986a). One of these (IAEA, 1986b) was a
- 14 -
report carried out by the Joint Group of Experts on the Scientific Aspects of
Marine Pollution (GESAMP) and this, too, has served to provide information
relevant to the BIG. The other principal sources of information are the
reports published by the Sandia National Laboratories in the USA and by the
Institute of Oceanographic Sciences in the UK.
The report has been structured such as to provide an overall evaluation
of the results of the biological studies and to put them into perspective
against the general background of information exchange and discussion which
has taken place. Not all of the data or ideas which have been discussed can
be adequately summarized, and some may well have been overlooked or superseded
by more recent developments. As the programme has developed, the ideas and
objectives have tended to change, both as a result of the different partici
pants who have attended each meeting and because of the demands of related
task groups - primarily those of physical oceanography and radiological
assessment. Virtually all of these have been beneficial and resulted in a
wider understanding and appreciation of the many issues involved.
In order to put the biological work in perspective, Chapter 2 attempts to
review briefly our current understanding of the biology of the open oceans as
a whole, and of the deep sea in particular. This is followed, in Chapter 3,
by a more detailed account of the descriptions of the biology of selected
sites in both the Atlantic and Pacific Oceans, based primarily on studies
specially carried out within the SWG programme. Then, in order to relate the
marine biological work to that of the central theme of the programme - radio
active waste disposal - Chapter 4 introduces some of the marine Radiobiologi
cal work which has been undertaken and discussed within the BTG.
Information on the accumulation of radionuclides by the marine fauna and
flora is central to any estimation of the role which living organisms play in
redistributing them within the oceans, providing pathways for human exposure,
or estimating any possible impact on the fauna itself. The most elementary
way in which such accumulation can be represented is in the form of concentra
tion factor data. This in itself is no easy task, in view of the large range
of radionuclides considered and the enormous variety of living organisms found
in the seas. Because of the importance of such data, two large reviews and
compilations of available information have been carried out. These are
- 15 -
discussed in Chapter 5. One of them, by the IAEA, concerned all elements and
all faunal groups; this provided the data base for the SWG assessment calcu
lations. The other review was commissioned by SANDIA; this was far more
detailed, included other aspects such as biological half-lives, but was limi
ted to the more important radionuclides.
Throughout the history of the SWG programme one of the discussion points
which has re-surfaced on a number of occasions hat been the relative
importance of biological processes in transporting radionuclides up from the
deep sea so that not only are the radionuclides re-distributed but that they
provide a short-circuit pathway leading to ' aman exposure. There are, in
fact, two separate aspects to this question: one concerns the role of biolo
gical processes in affecting the mass distribution of radionuclides in the
oceans, and the other concerns the possibility of a relatively small fraction
of the total quantity of radionuclides - but at relatively high concentrations
in certain foodstuffs - resulting in an intake of these nuclides by a particu
lar group of people. The first of these questions is discussed in Chapter 6.
It was soon obvious that physical processes predominate in the mass transport
of radionuclides away from the sea bed to surface waters, and that the princi
pal role of living organisms is to retard this process by producing particu
late materials in the water column which scavenge and remove radionuclides to
the sea bed. In addition, at the surface of the sea bed, the physical action
of living fauna serves to alter the rates at which radionuclides are transpor
ted across the interface between bottom sediments and the overlying water.
Detailed reviews were made of particle formation rates and settling veloci
ties, and of bioturbation rates, so that these data could be used in the
physical oceanographic models.
With regard to the possible short-circuiting of radionuclides from the
deep sea to man, this subject is discussed in Chapter 7 along with all of the
other aspects of the pathways of transfer which result in human exposure from
the consumption of seafood. It is concluded that the vast majority of sea
foods are taken in depths of less than 200 m and that none of the commercially
taken species is known to have food-chain links which extend to depths in
excess of 4 000 m. The principal pathways would thus be the consumption of
such seafoods, together with the possibility of the limited consumption of
certain fish caught at depths of about 4 000 m. Nevertheless, the possibilit
- 16 -
that othsr direct food-chain links from tht deep sea t- Man may exi*st tcv, or
in the future, cannot be overlooked. This problem has se^n approached £r<-m a
theoretical point of view, and some relatively simple nods 1ling has been
undertaken in Chapter 8 in order to draw comparisons v~'*i the base-case ca cu-
lations. It appears that dose rates to individuals of Lhu order of 10~9 t<
10" mSv a" could possibly result, which - : well be_)w .he 1 mSv a-1 1CR'
limit re.ommended for members of the public, and lower thai, the doses est ma
ted from the base-case calculations.
In addition to assessing the dose, and thus risk, to i"dividual members
of the public, it is also necessary to calculate the collective dose. This,
in turn, requires an estimate of the total quantities of seafoods in different
sea areas for consumption. A brief description of the data base provided is
given in Chapter 9.
With regard to environmental protection, Chapter 10 reviews the means by
which the dose rates to deep-sea fauna have been calculated, both from the
natural background and from the expected ambient concentrations of radionuc
lides resulting from waste disposal. A brief summary is also given of what is
currently known about the effects of radiation on aquatic fauna, and of the
work carried out within the SWG programme to extend this information to
deep-sea fauna by performing experiments on bacteria taken at depth and main
tained under pressure and at low temperature. In fact the dose rates expected
from waste disposal are at, or below, the normal background range In the deep
sea and thus no direct adverse effects to deep-sea animal populations would be
expected. There may well be other forms of disturbance, however, and it would
in any case be sensible to carry out pre-operational and post-operational
surveys. The feasibility of such 'monitoring' or surveillance operations to
study significant biological changes at a given s^te are discussed in
Chapter 11.
Finally, in a brief concluding chapter, the various aspects of the work
are drawn together. It is stressed that the biological sciences have an
Important role to play in any assessments of radioactive waste disposal in the
deep sea, and that any future programme should make adequate allowance for a
concomitant and integral biological contribution.
17 -
2: BIOLOGICAL PROCESSES IN THE OCEANS
Introduction
Marine organisms are not uniformly distributed throughout the oceans;
both their diversity and abundance varies in space and with time. In the open
ocern, away from the continental shelves, the maximum depth to which sunlight
penetrates at a sufficient intensity for photosynthetic processes to occur is
about 150 to 200 m. This upper layer of the ocean is therefore termed the
photic, or ipipelagic, zone. The limit of solar light penetration in the
clearest ocean waters is about 1 000 m and this underlying - mesopelagic -
zone contains its own representative fauna of organisms which migrate upwards
to feed in the epipelagic zone, plus a large range of predators.
Selow 1 000 m, in the bathypelagic zone, the biomass is much depleted,
consisting largely of organisms which are coprophagous - feeding on the faecal
pellets arising rrom the overlying waters - and of carnivores. The density of
the biomass in the water column continues to decrease with increasing depth
and becomes very low indeed below 2 500 m. It increases again, however, in
the body of water overlying the sea bed. The fauna of the sea bed itself is
collectively termed the benthos, and tha water overlying it is termed the
benthopelagic zone.
The faunal composition of the benthopelagic zone varies with the depth of
overlying water. On the upper continental slopes, to a depth of some 1 000 m,
the benthopelagic fauna mixes with that of the mesopelagic to some extent, and
benthopelagic fish are most abundant in the 200 to 2 000 m depth zone.
Macrourid (rat-tail) fish are prominent member} of this slope fauna, both in
numbers and in species. Below 2 000 m, however, away from the continental
slopes, the biomass of both the benthopelagic and benthic fauna become
increasingly depleted.
Fish species, both pelagic and benthopelagic, display discrete limits of
vertical distribution and it is generally observed that the younger fish
occupy the more shallow waters within any one species' range. Little is know
about the life histories of deep-sea fish but some inferences can be drawn
from the morphology of adult fish and their eggs. Many teleost (bony) fish
- 18 -
produce buoyant eggs; eels, notacanths and halosaurs have leptocephalus
larval stages which live near the surface. It therefore appears that as these
fish mature into adults they move into Jeeper waters. This is not the case
for all families of fish; the ophidicids, for example, have benthic larvae
and often retain their eggs to develop inside the adult. Similarly the
cartilagenous fish (rays, sharks and chimaeras) produce eggs which develop at
depth and some of these species, too, are 'live-bearers'. Slope dwelling
macrourids have buoyant eggs, but these also have a sculptured surface which
retards their rate of ascent and may act to ensure development near the bottom
(Robertson, 1981). The free eggs of abyssal macrourids are unknown.
Organisms in the water column
Early data on the distribution of planktonic organisms in the open ocean
were reviewed by Vinogradov (1968), but these were poor with regard to hori
zontal zonation because the majority of samples had been taken with vertically
hauled nets. More recent data have considerably improved the understanding of
zonational patterns, from which it appears that an exponential rate of decline
in biomass with depth is similar in various regions of the north-east
Atlantic. In general the standing crops of both plankton and micronekton
decrease by two orders of magnitude between the mesopelagic zone and depths of
about 4 000 m. Some evidence has been obtained by Angel and Baker (1982) to
suggest that zonation may exist in the bathypelagic zone, because changes in
the faunal composition of ostracods appear to be related to the abundance of
number of micronekton groups. These groups consist largely of detritovores o
carnivores. Another feature of the mid-ocean water column is that the abun
dance of fish declines very rapidly at depths below about 2 500 to i 000 m an
only increases again in water lyir.g 100 m or so above the sea bed.
It has also been pointed out by Wishner (1980a, b) that there is an
increase in the planktonic biomass near the sea bed. From studies of the
continental slope region to the south-west of Ireland it has been suggested
that the biomass begins to increase at about 100 m above the sea bed, and
doubles at 10 m above the bottom (Angel, 1983a).
- 19 -
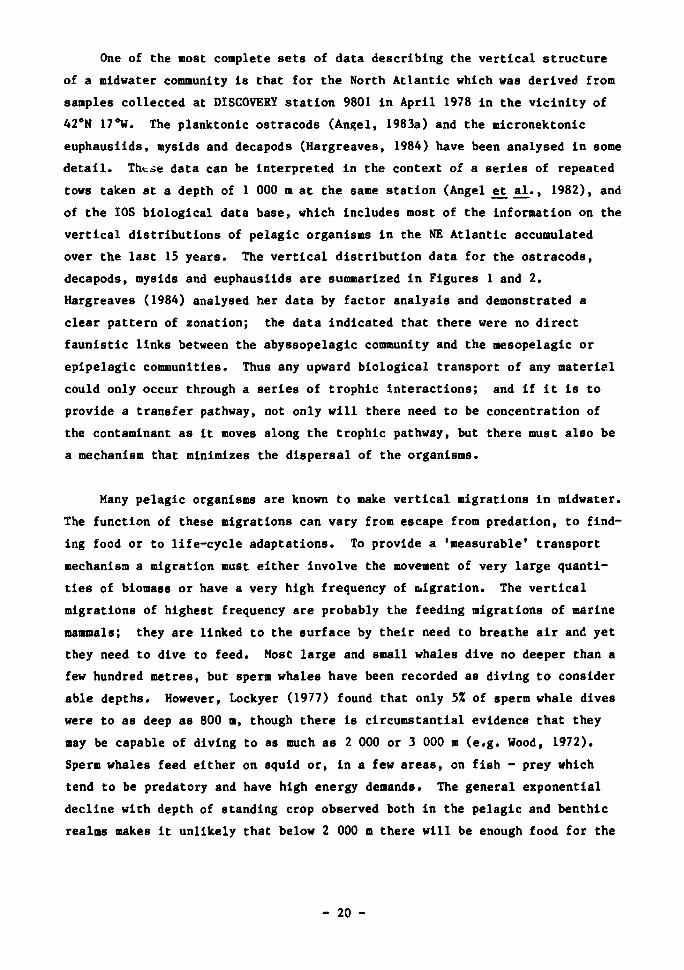
One of the most complete sets of data describing the vertical structure
of a midwater community is that for the North Atlantic which was derived from
samples collected at DISCOVERY station 9801 in April 1978 in the vicinity of
42°N 17°W. The planktonic ostracods (Angel, 1983a) and the micronektonic
euphausiids, mysids and decapods (Hargreaves, 1984) have been analysed in some
detail. Thtse data can be interpreted in the context of a series of repeated
tows taken at a depth of 1 000 m at the same station (Angel et al., 1982), and
of the IOS biological data base, which includes most of the information on the
vertical distributions of pelagic organisms in the NE Atlantic accumulated
over the last 15 years. The vertical distribution data for the ostracods,
decapods, mysids and euphausiids are summarized in Figures 1 and 2.
Hargreaves (1984) analysed her data by factor analysis and demonstrated a
clear pattern of zonation; the data indicated that there were no direct
faunistic links between the abyssopelagic community and the mesopelagic or
epipelagic communities. Thus any upward biological transport of any materiel
could only occur through a series of trophic interactions; and if it is to
provide a transfer pathway, not only will there need to be concentration of
the contaminant as it moves along the trophic pathway, but there must also be
a mechanism that minimizes the dispersal of the organisms.
Many pelagic organisms are known to make vertical migrations in midwater.
The function of these migrations can vary from escape from predation, to find
ing food or to life-cycle adaptations. To provide a 'measurable' transport
mechanism a migration must either involve the movement of very large quanti
ties of biomass or have a very high frequency of migration. The vertical
migrations of highest frequency are probably the feeding migrations of marine
mammals; they are linked to the surface by their need to breathe air and yet
they need to dive to feed. Most large and small whales dive no deeper than a
few hundred metres, but sperm whales have been recorded as diving to consider
able depths. However, Lockyer (1977) found that only 5% of sperm whale dives
were to as deep as 800 m, though there is circumstantial evidence that they
may be capable of diving to as much as 2 000 or 3 000 m (e.g. Wood, 1972).
Sperm whales feed either on squid or, in a few areas, on fish - prey which
tend to be predatory and have high energy demands. The general exponential
decline with depth of standing crop observed both in the pelagic and benthic
realms makes it unlikely that below 2 000 m there will be enough food for the
- 20 -
0-
200-1
500
1000-1
1500-
4-2000-
2500-
3000-
4500-
4000-
1 Jpip^agic
4 5 6 7
Mesopelagic
16
I ' 20. 22
. j . . . I .
Balhypelagic
.-¥
Abbyssop«lagic
Pigrre 1 Vertical ranges of the planktonic ostracods caught at depths of 1000 m and from 1500-3900 n at 42*N 17"W, the ranges of species only found shallower than 1000 m are not shown:
1. 3. 5. 7. 9. 11. 13. 15. 17. 19. 21. 23. 25. 27. 29. 31. 33. 35. 37. 39. 41.
Conchoecia curta C. hyalophyllum C. acuticosta C. rhynchena C. stigmatica C. lophura C. discoveryi C. kampta C. dorsotuberculata C. brachyaskos C. acutimarginata C. arcuata C. borealis C. dasyophthalma Archiconchoecian. sp. 2 C. glandulosa C. mamillata A. longiseta C. n. sp. 1 C lunata C. brachyaskos (large)
2. 4. 6. 8. 10. 12. 14. 16. 18. 20. 22. 24. 26. 28. 30. 32. 34. 36. 38. 40. 42.
C. elegans C. ctenophora C. loricata C. haddoni C_. magna C. nanomamillata Halocypria globosa C. ametra C. gaussi C. dichotoma A. cucullata Archiconchoecia gastrodes C. tyloda Archiconchoecia n. sp. 1 Gigantocypris dracontovalls C. plinthina C. eltaninae C. vitjazi £. n. sp. 2 A. versicula k. n. sp. 3
- 21 -

o -
5 0 0 - -
1000--
DECAPODA
SA
SS GT SR AP QV
: P S !APe HGr
Depth (m)
Day or
Night
1500--
! HGI I ! SJ
Tiih' 2OO0--
250O--
3000--
3500--
400O
i i
MN
EUPHAUSIACEA
.EK,
r*if iNMi
,TM
NA
BA !TA TC
MYSIDACEA
E EU ES • • EG , * p
R M T 8 Ho* iooOOmJ
? >20 10- 20 1 - 10
: ' • > ? contaiTimBtion
BM GZ
!GG
!SB
BS
I'AB
LF
MP
BB EAs
Bl EA
BA i
iBAt
Vertical ranges of three groups of micronektonic crustaceans at 42*N 17*W; Decapoda (18 species), Buphausiacea (11 species), and Mysidacea (17 species) from the surface to 3900 ro.
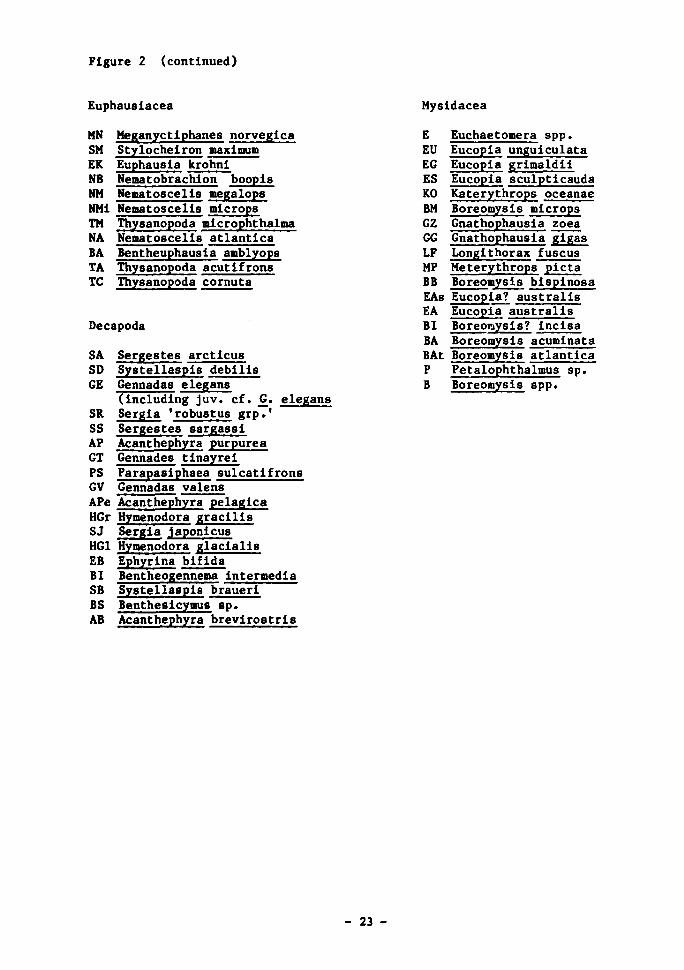
Figure 2 (continued)
Euphausiacea Mysidacea
MN Meganyctiphanes norvegica SM Stylocheiron maximum EK Euphausia krohni NB Nematobrachion boopis NM Nemato8celis megalops NMi Nematoscelis microps
Thysanopoda microphthalma Nematoscelis atlantica
TM NA BA TA TC
Bentheuphausla amblyops Thysanopoda acutifrons Thysanopoda cornuta
Decapoda
Sergestes arctlcus Systellaspi8 debills Gennadas elegans (including juv. cf. jJ. elegans Sergia 'robustus grp.' Sergestes sargassi Acanthephyra purpurea Gennades tinayrei Parapasiphaea sulcatifrons Gennadas valens
SA SD GE
SR SS AP GT PS GV APe Acanthephyra pelagica HGr Hymenodora gracilis SJ Sergia japonicus HG1 Hymenodora glacialls EB Ephyrlna bifida BI Bentheogennema intermedia SB Systellaspis brauerl BS Benthesicymus sp. AB Acanthephyra brevirostris
E Euchaetomera spp. EU Eucopia unguiculata EG Eucopia grimaldii ES Eucopia sculpticauda KO Katerythrops oceanae BM Boreomysis microps GZ Gnathophausia zoea GG Gnathophausia gigas LF Longithorax fuscus MP Meterythrops picta BB Boreomysis bispinosa EAs Eucopia? australis EA Eucopia australis BI Boreoraysis? incisa BA Boreomysis acuminata BAt Boreomysis atlantica P Petalophthalmus sp. B Boreomysis spp.
- 23 -
sperm whale's prey to be sufficiently abundant for it to be metabolically
worthwhile for the whale to regularly dive to such depths.
A striking phenomenon in many oceanic regions is the regular movement of
midwater organisms from deep daytime depths up into the surface layers at
night. A number of theories have been put forward to explain these diel
migrations, as summarized by Longhurst (1976), none of which is adequate to
explain them all. The theory that is held to be most acceptable at present is
that the downward migration is to avoid the danger of visual predation at
shallow, well-lit, depths by day. Studies in relation to a major oceanic
front off the Azores have suggested that 1 200 m was the lower limit for diel
vertical migration by the majority of micronekton but one fish, Ceratoscopelus
warmingi, was migrating up from daytime depths of at least 1 600 m into the
surface 100 m at night. At another position further north (42°N 17°W), Angel
et al. (1982) showed that at a depth of 1 000 m only a single fish species,
the myctophid Notoscopelus elongatus kroyeri, out of 192 micronektonic and
planktonic species examined, showed the cyclic variability in abundance con
sistent with it performing diel vertical migration. Thus the lower limit for
most such migration in plankton is at about 800 m, and in micronekton it is at
about 1 000-1 200 m, or occasionally 1 600 m.
The quantities of biomass moving during these migration cycles have
rarely been estimated. The data from the five DISCOVERY stations off the
Azores have been analysed to provide such flux estimates (Table I). No
attempt was made to try to calculate the errors of these estimates but, on the
basis of repeat samples taken elsewhere, they are not thought to exceed
25-50%. The region studied near the Azores is a typical poorly productive
mid-oceanic region. The estimates of vertical flux are likely to be exceeded
in more productive areas, but evidence available in the literature and collec
ted by 10S implies that the vertical range of the flux is most unlikely to be
greater. If this is confirmed, then fluxes resulting from diel vertical
migration by plankton will be restricted to the top 800 m of the water column,
and that from nekton to the top 1 000-1 500 m.
In regions in which the production cycle is markedly pulsed, many orga
nisms undertake quite extensive vertical migrations, spending the seasons of
low productivity at relatively great depths, often in a state of diapause
- 24 -
(e.g. Miller et al., 1984). Diapause is comparable to the state of hiberna
tion or aestivation in terrestrial organisms, and is characterized by the
organisms reducing their metabolic activity. It is often accompanied by the
laying down of substantial quantities of lipid, both as an energy reserve and
possibly as a mechanism helping the organism to maintain neutral buoyancy.
The organisms cease to feed and the gut regresses. Diapause usually occurs at
a specific stage in the life cycle; egg or late-stage larval stages are most
common. For example, the species of copepod which dominates plankton communi
ties in northern waters around the UK, Calanus finmarchicus, overwinters as
the fifth copepodite stage at depths down to 2 000 m. The descent into deep
water occurs in the autumn and the. ascent occurs soon after the onset of the
spring bloou.. The copepodites immediately mature after the ascent and start
to breed.
In the Pacific Ocean the life-history characteristics of the main grazer
are ouch more finely tuned to the cycle of productivity. The Pacific species
also appear able to enter and break diapause with much greater facility and
two or even three times during an individual's life time (Miller et al.,
1984). One consequence of this 'finer tuning' is that the grazing pressure o
the herbivores prevents the spring surge of production appearing as a bloom
and results in a substantial increase in phytoplankton biomass, a phenomenon
which is characteristic of the spring in the temperate waters of the north
east Atlantic Ocean.
The function of seasonal vertical migrations seems to be for the orga
nisms to find cooler conditions, where their metabolic expenditure is less,
and safer conditions, where predation pressures are not so Intense. The
migrations probably optimize the efficiency with which energy is used and
stored in conditions of variable production.
The biomass flux associated with these seasonal migrations has rarely
been estimated. Scattered evidence in the literature suggests that all of it
occurs within the top 2 000 m of the water column. Also, because a large
proportion of the migrants do not feed at depth (i.e. they are in a state of
diapause), much of the uptake of any contaminants at depth will not be via
food but by direct absorption from the ambient sea water.
- 25 -
A final consideration is that of migration within the water column in
relation to the life cycle of particular species (Booty, 1985). Many midwater
species undergo such Changes in their vertical ranges during their life
cycles, and these migrations are termed ontogenetic (e.g. Miller et al.,
1984). In species with annual life cycles, these ontogenetic migrations will
be indistinguishable from seasonal migrations. The usual pattern is for the
young, smaller, stages to occupy shallower depths where there is greater
availability of food but where the predation pressures tend to be greater.
Merely the fact that they are smaller in size gives young stages an element of
protection against detection by visually-hunting predators. As they grow and
mature they become more visible, so if they are still to avoid detection they
must continue to descend deeper into the water column to stay below the depth
to which enough daylight penetrates for them to be per.-eived visually. This
descent may be either a slow gradual sinking of the distributional range, or a
quite rapid descent accompanied by a dramatic metamorphosis, as is seen in a
number of bentho-pelagic fishes such as the ceratioid anglers.
Any upward flux of materials associated with ontogenetic migrations will
probably be via reproductive products or early stage larvae. It will depend
on the duration of the life cycle, the life history strategy of the organism,
and the amount of metabolic investment in reproduction. The duration of life
cycles tends to increase with decreasing water temperatures and increasing
depths; associated with this is a low investment in reproduction until the
final stage of maturation is reached. Childress and Price (1978) examined the
life history characteristics of the bathypelagic mysid Gnathophausia ingens
and found that it has a low rate of oxygen consumption, a long development
time (7 years), a large size at maturity and, rather unexpectedly, a single
brood of 150-350 larvae, whereas many other deep-sea organisms tend to produce
very small broods (1-2) iceroparously (i.e. repeated successive broods).
Most of these characteristics are energy conserving and help to optimize the
efficiency with which the energy invested in reproduction is utilized. Even
so, the proportion of ingested food invested in reproduction is likely to be
far less than 502 of that invested in the growth and metabolism needed to
maintain the standing crop of adult organisms in those species which undertake
ontogenetic migrations. These ontogenetic migrations may provide quite a
large upward flux at shallow depths, but from depths greater than 2 000 m the
flux is likely to be relatively trivial because of (a) the low standing crop
- 2o -
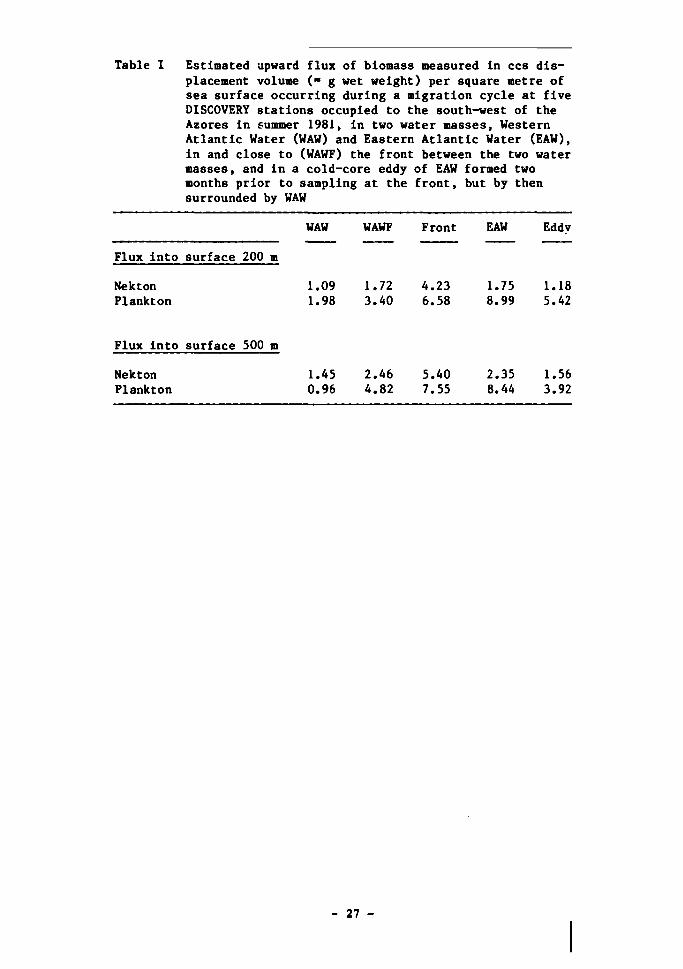
Table 1 Estimated upward flux of biomass measured in ccs displacement volume (» g wet weight) per square metre of sea surface occurring during a migration cycle at five DISCOVERY stations occupied to the south-west of the Azores in summer 1981, in two water masses, Western Atlantic Water (WAW) and Eastern Atlantic Water (EAW), in and close to (WAWF) the front between the two water masses, and in a cold-core eddy of EAW formed two months prior to sampling at the front, but by then surrounded by WAW
WAW WAWF Front EAW Eddv
Flux into surface 200 m
Nekton 1.09 1.72 4.23 1.75 1.18 Plankton 1.98 3.40 6.58 8.99 5.42
Flux into surface 500 m
Nekton Plankton
1.45 0.96
2.46 4.82
5.40 7.55
2.35 8.44
1.56 3.92
- 27 -
at such depths, (b) the relatively few species that are known to perform
extensive migrations, and (c) the small proportion of the population that is
mature and breeding within the water column. The possibility of contaminants
being transported from the sea floor up into the water column by the direct
movement of swimming benthic forms, such as some amphipods and holothurians,
is discussed in further detail in Chapter 7.
Benthic biology
As to be expected, the density of benthic fauna also decreases in the
oceans with increasing depth. One estimate puts the total biomass of the
world's oceans at 9 x 10¹² kg, with approximately 6 x 10¹² kg being found in
the benthos, of which 5 x 10¹² kg is distributed on the continental shelves;
only 5 x 10 1 0 kg occupies depths greater than 3 km (Menzies et al., 1973).
Naturally, there are exceptions to such generalizations, in particular with
regard to the effects on biomass of the distance of the area from the shore,
and the effects of trenches and other topographic anomalies, as discussed in
Rowe (1983). The benthos, as a community, contains a great variety of faunal
types which can be subdivided in various ways. It is a common practice to
refer to those animals living in the sea bed as infauna, of which an important
component in the deep sea is the meiofauna, consisting of very small forms
such as nematodes. The fauna living on the sediment, the epifauna, may live
permanently on the sea bed or spend part of their lives in the overlying water
column. Considerable vertical excursions above the sea bed are known to be
made by invertebrates such as amphipods and holothurians as well as by
benthic-feeding fish. They also exhibit a wide range of feeding types, from
detritovores and suspension feeders to carnivores.
A particular interest throughout the NEA-SWG study has been the biology
of the deep-sea floor, and attempts have been made to keep abreast of the
parallel studies which were being made in different countries. Before review
ing the data relating to specific sites, therefore, it is useful to consider
the principal features of the biology of the abyssal plain, together with
studies which have been specifically funded via the SWG programme to consider
specific aspects of it. The benthic ecology of the deep-sea environment has
- 28 -
recently been reviewed by Sibuet and Juniper (1986), from which much of the
following information has been derived.
Biological processes in the abyssal plains
The deep sea floor represents the largest and most poorly known biologi
cal region on Earth. Below 2 000 m it includes passive and active continental
margins, tectonically active ridges, abyssal plains and hills. The geological
instability of areas other than abyssal plains precludes their consideration
as sites for high-level radioactive waste disposal, and the recent discovery
of highly productive chemosynthesis-based biological communities in the zones
of crustal plate boundaries would also preclude their consideration. It
should also be noted that, although the 'true' abyssal plain lies principally
at depths of 4 000-6 000 m, many studies are necessarily conducted at shal
lower depth, and the results of such studies are often included in discussions
of processes in deeper waters. There is reasonable cause to believe that such
extrapolations are generally valid, because depths of 1 500-2 000 m are
usually sufficiently removed from coastal influences to be representative of
seafloor life on the abyssal plains.
The most striking feature of abyssal plains is their physical homo
geneity. With the exception of scattered seamounts and plateaus, the
sediment-covered plains are monotonously flat, with little heterogeneity at
horizontal scales of tens of metres to tens, or even hundreds, of kilometres.
At scales of a few metres or less there are appreciable variations in the sea-
floor relief. Glacially-transported rocks, up to 1 m in diameter, are not
uncommon on the ocean bottom at higher latitudes in both the Northern and
Southern hemispheres. The substrate in general consists of fine-grained
laterally-transported sediment: skeletal and organic remains of oceanic
plankton, continental erosion products, wind-borne particles, and particles
formed abiotlcally in the water column. The organic content varies (maximum
21), depending on the source of the sediment.
Primary production of organic matter occurs almost exclusively in the
upper few hundred metres of the water column. From this zone, organic remains
sink to abyssal depths where they are the sole energy source for biological
- 29 -
productivity, with the exception of the very limited areas of chemo'syntKesTs-
based productivity around hydrothermal vents. The productivity of the abyssal
benthos is thus strictly determined by organic matter input originating in the
overlying waters, and its measurement has become a major area of research in
the past ten years. The most common approach has been to use sediment traps
moored near the sea floor to study the rate of organic matter sedimentation
and the composition of sedimenting material. Particles arriving on the sea
floor range in size from several mm down to a few urn in diameter (Rowe and
Gardner, 1979; Gowing and Silver, 1985). Among the dominant large particles
are foraminiferan tests, radiolarian skeletons, pteropod shells, diatom frus-
tules, zooplankton faecal pellets and amorphous aggregates of mucus material
collectively known as 'marine snow' (Honjo et al., 1984). Smaller-size par
ticles include olive green 'cells', which are amorphous pigmented bodies that
are thought to be the breakdown products of phytoplankton cells (Silver and
Alldredge, 1981), and recently-identified 'minipellets', which are faecal
pellets probably produced by protozoa and small invertebrates. The mass flux
in sediment traps tends to be dominated by large, fast-sinking particles, such
as faecal pellets, which are transported down from overlying waters to the
deep sea floor with minimal loss in mass due to dissolution and mineralization
(Honjo, 1980).
Another source of organic input to the abyssal sea floor is the fall of
metazoan carcasses. Remains of fish, marine mammals and large invertebrates
which die in the water column quickly sink to the se& floor (Rowe and
Staresinic, 1979). Studies with baited cameras have shown that such food-
falls are rapidly consumed by scavenging fish and invertebrates (Smith,
1985a). The quantitative importance of food-falls in relation to the influx
of particulate organic matter is difficult to estimate however, and sightings
of carcasses on the deep-sea floor are rare.
The rate at which organic matter sediments to the abyssal sea floor is
influenced by three major factors: depth, the productivity of the overlying
waters, and the proximity to continental margins. More productive surface
waters naturally export greater amounts of organic material to deeper waters,
but the amount of organic matter arriving at the ocean bottom decreases with
depth as a result of mineralization during the descent through the water
column (Hargrave, 1985a). The importance of this effect appears to diminish
- 30 -
with increasing depth, however, because more labile components are lost, and
sinking organic matter becomes more refractory (Muller and Suess, 1979;
Reimers and Suess, 1983; Suess and Muller, 1980; Gardner et al., 1983).
Horizontal transport by ocean currents would also be expected to redistribute
sinking particles, a mechanism often proposed to explain differences between
the amount of organic material collected in sediment traps and the influx thai:
might be predicted from measured productivity in overlying waters; although
such differences may also be attributable to sampling problems associated with
sediment traps because water transport is primarily horizontal.
Until fairly recently it was thought that the slow sinking rate of orga
nic particles would buffer the effect of seasonal variation in primary produc
tivity at the surface, so that organic matter influx to the deep sea remained
relatively constant all year round. But there is now a growing body of evi
dence to indicate a much closer coupling of surface productivity and organic
matter sedimentation on the deep sea floor. Deuser and Ross (1980), Deuser
et al. (1981) and Honjo (1982) have all reported fluctuations in deep-water
sediment trap data that corresponded to variations in surface primary produc
tion in the Sargasso Sea and Panama Basin. The rate of sedimentation varied
by a factor of three or more throughout the year. Preliminary data from Gt
Meteor East (GME) suggest a similar seasonal variation at this site. Direct
evidence for the seasonal deposition of organic material on the sea bed has
also come from time-lapse photographic studies by Billet et al. (1983) and
Lampitt (1985). Their work in the North-East Atlantic Ocean reveals coupling
between the spring bloom of surface production and the arrival of large
amounts of flocculent 'phytodetritus' on the sea floor down to depths of
4 400 m. These observations indicate that the abyssal benthic environment may
be subject to dramatic changes in the availability of organic matter over
short periods of time.
Bacteria are ubiquitous in deep-sea sediments and overlying waters, as
they are elsewhere in the biosphere. Experiments often show bacterial acti
vity to be much greater in deep-sea sediment samples incubated under normal
atmospheric pressure than in parallel incubations at ^n situ hydrostatic pres
sure (Jannasch and Taylor, 1984). Such experimental results have led to con
clusions that deep-sea conditions, particularly pressure, are strongly
inhibitory to microbial life and that bacteria are extremely inefficient in
- 31 -
the In situ recycling of organic matter in the deep sea. This may, in part,
be due to technical difficulties in sampling and studying metabolism and
growth of microbial populations with unknown requirements for n situ pressure
and temperature conditions, and it may also be due to the possible localiza
tion of bacterial activity in limited, difficult to study, microhabitats. New
evidence of the existence of a rapid biochemical transformation of organic
matter in the superficial sediment with higher response in situ than at 1 atm.
reinforced the need for more in situ experimentation (Cahet and Sibuet, 1986)
for a better understanding of bacterial activity* Our understanding of deep
bacteria has been considerably increased as a result of work carried out by
Sibuet and Yayanos, as contributions to the NEA SWG programme.
The unequivocal demonstration of the existence of barophylic bacteria is
a fairly recent event. These bacteria, whose growth and metabolic rates are
greater under deep-sea hydrostatic pressures than at atmospheric pressure,
were first isolated from an amphipod trapped at 10 474 m depth in the Mariana
Trench (Yayanos et al., 1981). An isolate obtained from this culture was
obligately barophylic, and thus unable to grow at pressures less than those
found at abyssal and hadal depths. No growth at all was observed at even
346 bars, a pressure equivalent to a water depth of 2 416 m (Yayanos et al.,
1981), while maximum growth was obtained at 690 bars. Since this finding, a
growing interest and improved technical procedures have resulted in the
isolation of barophylic organisms from a variety of deep-sea habitats: the
guts of benthic invertebrates, amphipods (Schwarz et al., 1976; Deming et
al., 1981) and holothurians (Deming et al., 1981); and in samples of deep-sea
sediments and sinking particulates (Deming and Colwell, 1985; Deming, 1985).
While pure culture work has revealed that barophylic organisms are Indeed
present in the deep-sea environment, their overall importance within the
microbial community has yet to be clearly demonstrated. Because bacterial
culture procedures are highly selective, attempts to evaluate the barophylic
component of microbial communities have usually involved incubation of
freshly-collected samples and measurement of total microbial respiration,
substrate incorporation, or cell divisions under i_n situ and atmospheric pres
sures. Greater microbial activity at atmospheric pressure is interpreted as
the dominance of barotolerant bacteria in the samples, whereas greater acti
vity under deep-sea conditions is indicative of the dominance of barophylic
bacteria (Deming and Colwell, 1985). Evidence to date is contradictory,
- 32 -
revealing at best that proportions of barotolerant and barophylic bacteria may
vary substantially in natural deep-sea populations (Deming and Colwell, 1985;
Wirsen and Jannasch, 1986).
There are very few data on the general distribution of bacterial biomass
in the deep-sea benthic environment. Cell count data of Rowe and Deming
(1985) reveal bacteria to be most abundant in superficial sediments, with
numbers decreasing by about one order of magnitude in the top 10 cm of
sediment. (Additional data are given in Table VIII of this report.) A fine
scale study by Craven et al. (1986) showed that the superficial concentration
of bacterial biomass occurred as a very thin layer, with sharp changes in
biomass (ATP concentration) occurring within the upper 5 mm of sediment. The
guts of deep-sea animals are often cited as possible favourable habitats for
bacteria; the concentration of organic matter in animal guts is apparently
more suitable for bacterial growth than the sediments (Sibuet e* a_l., 1982).
Indeed, animal guts have been the major source of pressure-adapted bacteria in
deep-sea samples, as already discussed. Qualitative differences between the
gut flora of an echinoderm and the bacterial flora of adjacent sediment have
been demonstrated by Bensoussan et al. (1984). The quantitative significance
of gut flora in the total deep-sea microbial population is virtually impos
sible to estimate because numbers can apparently vary greatly, even with the
state of digestion of food within the guts (Ralijaona e_£ _al_., 1983). Never
theless, in addition to the superficial sediment layer, deep-sea animal guts
as on land - appear to be a habitat where bacteria are particularly abundant
and active.
For primarily practical purposes, the benthic fauna is usually divided
into several size categories which correspond to size groups selected by
various sampling and sample-processing procedures: nanobiota, 2-50 urn dia
meter (protozoa, yeasts); meiofauna, between 40-500 \im (nematodes, foramini-
fera, harpacticoid copepods); macrofauna, retained when sediment is sieved
through 500 um mesh sieves (polychaetes, isopods, small bivalves, arthropods);
and the megafauna, several centimetres in size and visible in seafloor photo
graphs (echinoderms, corals, sponges, crustaceans, fishes, cephalopoda). The
distribution of biomass in various size classes of benthic organisms can be
depicted as a spectrum - as in Figure 14 of this report. The megafauna are
perhaps the best known group in terms of species identification, feeding
- 33 -
habits, and in some cases life histories, but because of their sparse distri
bution and frequent mobility they are the most difficult group to sample
quantitatively. The smaller size groups, which are more numerous in a given
area than the megafauna, are easier to sample quantitatively in box cores, but
qualitative knowledge of these organisms tends to diminish with body size.
One of the most discussed findings of recent deep-sea research is the
revelation of the unusually high species diversity of the benthic fauna
(Hessler and Sanders, 1967; Sanders and Hessler, 1969; Grassle and Sanders,
1973); Wolff, 1977). The diversity of macrofaunal and megafaunal organisms
has been shown to increase with depth below the continental shelf (Hessler and
Sanders, 1967; Sanders, 1968), reaching a peak near 2 000-3 000 m depth that,
for some groups, is comparable to the diversity found in tropical intertidal
sediment communities (Sanders, 1968, 1969). Sanders has suggested that the
long-term stability of the deep-sea environment is the principal factor which
permits this tremendous adaptive radiation. Because there is little physical
heterogeneity of habitat for animals of large body size in deep-sea sediments,
however, other ecological mechanisms have been proposed which would maintain
species diversity: competition, predation, and the role of biogenic micro-
environments have been the main points of discussion and debate (Dayton and
Hessler, 1972; Hessler and Jumars, 1974). A high species diversity may
actually be a phenomenon unique to bathyal depths: after reaching a peak near
2 000-3 000 m, macrofaunal and megafaunal diversity appear to decrease
markedly on descending to the abyssal plain (Sibuet, 1977; Haedrich et al.,
1980; Rex, 1981). Haedrich et_ a_l. (1980) propose that bathyal fauna are more
diverse than in the deeper abyss because of a comparative lack of long-term
stability and a greater heterogeneity of habitat. Compared with the abyssal
plain, the topography of the region at the base of the continental slope and
at the top of the rise is highly variable. This region is also subject to
variability in topographically-influenced currents, and to large events such
as turbidity flows which may contribute to environmental stability. Haedrich
et al. (1980) cite several works which argue that environmental disturbance
can lead to high species diversity rather than prevent its occurrence. This
diversity question will continue to stimulate study and debate, but in the
meantime it is important to point out that the macrofauna of the abyssal plain
appear to be much less diverse than that found at bathyal depths, and that
'disturbance' may have very different effects on the benthic community
- 34 -
structure in these two environments. Such effects will be discussed further
in Chapters 10 and 11.
The dynamics of the deep-sea fauna
Food-web relationships in the deep sea are poorly known. There appear to
be two major pathways by which organic matter is incorporated into the abyssal
benthic food web: the consumption of particulate organic matter by deposit
and suspension feeders of all faunal size categories, and the consumption of
carcasses and large organic debris by mobile megafauna. The second of these
has already been mentioned, and it is of interest that predatory and scaven
ging fish species appear to be excessively abundant in relation to their
potential prey. This apparent imbalance led to the recognition of the impor
tance of carcass falls as a food source for predatory/scavenging megafauna
(Rowe and Staresinic, 1979) although such food falls are rare (Stockton and
Oelaca, 1982). Our knowledge of deep-sea trophic relationships is inadequate
to resolve this anomaly - if indeed there is one.
The abyssal benthos appears to have a basic energetic relationship with
its ultimate food source - the primary productivity of surface waters - that
is similar to that of other ecosystems. Several studies have shown the abun
dance of one or more faunal groups to vary directly with surface productivity
or organic matter input (Sibuet ££<*1.«» 1984; Sibuet, 1985). In a recent
synthesis of data obtained during the past 12 years of French studies at seven
deep-sea sites In the Atlantic, Sibuet and Juniper (1986) show that meiofaunal
and macrofaunal abundances vary directly with organic matter input - as calcu
lated from the burial rate of organic carbon. Abundance of the two major
groups of megafauna (deposit feeders and predators), analysed separately, each
vary exponentially with carbon input. Meiofaunal and macrofaunal abundances
showed a linear relationship with each other and an exponential relationship
with megafaunal abundance. These data reveal that abyssal benthic meiofaunal,
tiacrofaunal, and megafaunal abundances have a constant relationship with each
other, and with food input between sampling sites. Although there may be two
distinct pathways for organic matter input into abyssal benthic food webs,
sedimenting particles and falling carcasses both originate from organic matter
produced by photosynthesis in overlying waters.
- 35 -
Organic material consumed by organisms is converted to growth and repro-
ductive products. It is difficult to discuss growth rates separately from
patterns of growth and reproduction because all are integral elements of the
growth strategy of a species. The growth rate before and after sexual
maturity, the size and age at which sexual maturity is attained, and reproduc
tive cycles are all key features of a species' adaptation to its environment.
The apparent stability of abyssal environments may result in a low risk of
mortality for adult or larval populations. The few data available indicate
that most deep-sea species show a trend toward so-called 'K-selected' growth
and reproductive strategies, where the scarce food energy is devoted more to
growth and less to reproduction than in species from less stable environments
('r-selected') which mature quickly and produce large numbers of larvae, often
in coincidence with seasonal environmental cycles (Rex, 1981). The K-selected
species tend to be long-lived, reach sexual maturity later, and produce few
numbers of large larvae all year round.
Although environmental stability may allow deep-sea species to devote
much of their energy to growth, the meagre food supply and cold temperatures
act severely to limit growth rates. The extent to which this is generally
true is difficult to judge, because estimates of growth rates among deep-sea
species are very scarce and difficult to determine. Few populations at single
locations have been sampled regularly enough to allow sufficient analysis of
size structure to permit even an inference of age composition, or to reveal
temporal patterns by which larvae are recruited. Turekian et al. (1975) used 228Ra concentrations in the shell of a bivalve (Tindaria calllstlformlc) to
estimate generation time (50 years) and life span (100 years); but the con
fidence limits of this estimate are very wide (SD - 76 years) and the approach
has not been extensively employed since their study. Rannou (1976) attempted
to age a bathyal macrourid fish by reading apparent 'annual' rings in otoliths
(ear stones). He concluded that the fish had a long biological cycle: slow
growth, many distinct reproductive periods, and a population composed of many
size/age classes. The most complete study of reproductive patterns In abyssal
organisms revealed 9 of 11 species to reproduce continuously and recruit lar
vae throughout the year (Rokop, 1974). Although the findings of these three
studies are more or less in keeping with what one would expect of K-selected
organisms, generalization is still difficult.
- 36 -
There is a growing body of evidence for reproductive periodicity among
three very different groups of deep- sea organisms: isopod crustaceans
(George and Menzies, 1968), echinoderms (Schoener, 1968; Tyler et al., 1982)
and a macrourid fish (Rannou, 1975), possibly due to a periodic input of orga
nic matter to the sea floor. More recently, studies of organic matter sedi
mentation have indeed confirmed that there can be large and more or less pre
dictable seasonal pulses in food input to the deep sea floor. In the case of
the macrourid fish (Cataetyx laticeps), Rannou (1975), drawing from observa
tions of vertical migration in other macrourid fishes, suggested that periodic
migrations may result in distinct phases of reproduction and growth. The
viviparous species he examined had only a single generation of larvae in its
genital tract and had recognizable growth rings in its otoliths. He suggested
that the fish may pass a 'trophic phase' in shallower waters, where food is
more plentiful, followed by a reproductive phase at greater depths. Observa
tions of otolith growth rings in several fish species collected from depths
down to 4 700 m were also reported. Vertical migration in deep-water fishes,
some of which are fished commercially during their 'trophic phase' at depths
of 1 000-1 200 m, is of obvious interest to the study of biological mechanisms
for the upward transport of contaminants from the deep sea floor, as will be
discussed further in Chapter 7.
The existence of evidence for both periodic and non-periodic growth and
reproductive pattern in deep-sea species again makes it difficult to genera
lize. Slow growth rates are likely to be the rule, although small organisms
capable of rapidly exploiting seasonal influxes of organic matter may have
relatively shorter generation times. The existence of growth and reproductive
periodicity, if resulting from seasonal variations in food supply, may prove
to depend on other aspects of a species' life history. Mobile species which
periodically migrate to shallower, more food-rich, waters are most likely to
show feeding-related growth and reproductive periods. Those benthic species
capable of directly exploiting periodic food enrichments are more likely to
show periodicity than bottom-dwelling predators and scavengers. Where
periodic increases in food availability are not regular enough to influence
the adult life cycle, organisms may adopt another strategy to maximize
resource exploitation. The production of long-lived lecithotrophic larvae may
allow exploitation of ep: oodes of food enrichment through prolongation of the
larval stage until food enrichment is encountered. At that point in time - or
- 37 -
space - the larva is assured of a favourable food supply for its critical
late-larval and post-larval growth phases. Rex et al. (1979) discuss the pos
sibility of this phenomenon in an abyssal snail, where reproduction appears to
be continuous but the size-frequency structures of populations indicate an
episodic recruitment of larvae. Similar observations have been made by Gage
and Tyler (1982) on ophiuroid populations at depths of 2 200 m.
Why growth and reproductive periodicity are present in some deep-sea
species and not in others remains to be clearly understood. Limited data
indicate that some species adapt adult life cycles to this periodicity and
others may possibly exploit periodic increases in food availability during
larval stages. Further study on true abyssal and stenobathic species is
needed to reveal if these are alternative strategies, either of which can be
found in most abyssal species, or if there are indeed many species unaffected
by periodicity in food supply.
The utilization of supplied organic matter appears to be very intensive
at the sediment/water interface. Several studies have shown that < 10-152 of
the settling organic matter is buried into sub-surface sediments, the greater
portion being incorporated into biomass or mineralized by the biota (Sibuet e_t
al.t 1984; Khripounoff and Rowe, 1985). Because biomass production and
organic matter transformations are the major mechanism for incorporation and
transfer of environmental contaminants in marine food webs, it is important to
locate and quantify major zones of biological activity and to identify the.
organisms or groups of organisms involved.
The most recent approach to this problem has been the quantitative esti
mation of carbon budgets for deep-sea sites, using sediment trap data and in
situ measurements of respiration made by a variety of autonomous free-
vehicles, bell jars and respirometers. Oxygen consumption by enclosed sedi
ment or faunal samples can be used to calculate organic carbon mineralization
(C02 production) for comparison with the import of organic carbon as measured
by sediment traps. Thus Smith (1978) has shown that in situ benthic communit
respiration decreases by three orders of magnitude along a transect between A
and 5 200 m depth, and at the deeper stations benthic community respiration
accounted for 15-29% of the estimated organic carbon flux to the sea floor.
He proposed that respiration by benthopelagic and macro-epibenthic animals,
- 38 -
not included in his respiration chambers, may account for the remaining con
sumption. Similar respiration devices have been used to demonstrate seasonal
fluctuations in deep-sea benthic community respiration. Smith and Baldwin
(1984a) report almost one order of magnitude difference in sediment community
oxygen consumption at two deep-sea stations between early summer and late
autumn and winter. Although seasonal patterns in organic matter sedimentation
at these sites are not known, this is the first Indication of a periodicity in
physiological activity at these depths and it suggests the existence of a
pronounced seasonal cycle of activity that may be coupled to fluctuations in
organic matter input.
Another approach to measuring sediment oxygen consumption is the use of
micro-electrodes to determine the vertical distribution of dissolved oxygen in
sediment pore waters (Smith and Baldwin, 1983). Resulting profiles allow
zones of greatest oxygen consumption to be identified. Reimers and Smith
(1986) and Reimers et al. (1986) have recently used this approach to confirm
the importance of the upper 10-15 mm of sediment as the zone of most intense
biological activity.
Smith has also used respirometers to measure oxygen consumed by various
deep-sea fish (Smith, 1978; Smith and Laver, 1981), echinoderms (Smith, 1983)
and swimming crustaceans (Smith, 1982; Smith and Baldwin, 1982). For the
present, these measurements are yielding useful data on size/weight relation
ships with respiration for species and groups of organisms; but poor know
ledge of the distribution and abundance of these megafaunal organisms hampers
incorporation of such data into community respiration budgets.
While respiration and oxygen profile data are revealing spatial and tem
poral patterns of total biological activity in deep-sea sediments, a major
outstanding question is that of the pathways by which organic matter enters
and flows through the benthic ecosystem. The recent review of Sibuet and
Juniper (1986) for deep-sea locations in the Atlantic Ocean indicates that
standing stocks of major biological size groups are in constant balance, even
while total community biomass and carbon input vary. The correspondence
between these size groups and trophic levels is limited, because all feeding
types can be found in most size groups. Nevertheless, there appears to be an
important energetically-related regularity in the abundance of these size
- 39 -
groups that can be useful in accounting lor organic matter and contaminant
transfers and standing stocks within the benthic ecosystem. The revelation of
trophic pathways within and between size groups will add a further dimension
to this approach.
The role of bacteria in the entry of organic matter into the benthic
ecosystem is still rather speculative. Analogy to other ben'vhic ecosystems
would suggest a major role in the initial decomposition of sedimented organic
material; present difficulties in quantifying sediment microbial activity,
as previously discussed, do not allow confirmation that this is also the
case in the deep sea. One possible explanation for this problem is that
quantitatively-important microbial activity is confined to micro-environments
where various mechanisms allow the scarce organic matter to be concentrated:
as in animal guts and burrows, tubes that trap organic matter (Aller and
Aller, 1986), and in the superficial film at the sediment/water interface.
Direct evidence for this is incomplete, but the question of energy entry into
the deep-sea ecosystem is sufficiently important that this possibility
deserves serious study.
- 40 -
3: BIOLOGICAL DESCRIPTION OF SELECTED SITES
Introduction
There are no pre-set criteria with regard to the suitability of any par
ticular site from the biological point of view, except that it would clearly
be undesirable to disturb unduly an area of unique biological interest, or to
choose a site which had biological characteristics which would indicate above
average transport of radionuclides back to man. A number of sites have been
studied in systematic detail whereas at others the studies have been concen
trated more on process-related aspects, or on specific faunal groups; but at
no one site was a complete suite of biological investigations carried out.
Two sites which have received particularly detailed study are Great Meteor
East (GME) and the southern Nares Abyssal Plain (SNAP), both in the north
Atlantic Ocean (Figure 3). Other studies have been made at selected sites in
the Pacific Ocean (Figure 4).
The distributions of most oceanic animals are influenced by hydrography
over large areas and by patchiness on a more local scale. Faunistic differen
ces across hydrographic frontal or transition zones may therefore be distinct
in terms of the presence or absence of species, or may be more gradual in
terms of changing abundances. Both differences result in changes in community
structure. Epipelagic organisms tend to be most restricted by hydrographic
boundaries, and mesopelagic and epipelagic communities are inextricably linked
by vertical migrations - which may be daily, seasonal or ontogenetic. Conse
quently hydrographic effects are also evident in mesopelaglc distributions,
but their intensity decreases with depth so that bathypelagic animals tend to
be cosmopolitan. It should be borne in mind, however, that most oceanic zoo
geography has been done on epipelagic or shallow-living animals and there is a
progressive dec! i.ne in information with increasing depth.
- 41 -
Atlantic Ocean sites
Great Meteor East (CME)
An Initial review of the known biological characteristics of the GME site
was made by Roe (1985). It was concluded that the zoogeographic studies most
relevant to the site were those of Backus et al. (1977), who analysed the
distributions of myctuphid fish between 800 m and the surface, and those
resulting from IOS latitudinal transects (Angel and Fasham, 1975; Fasham and
Angel, 1975; Badcock and Merrett, 1977; Fasham and Foxton, 1979), the longi
tudinal transect across 32°N (Pugh, 1975; Angel, 1979a; James, 1983) and the
data resulting from the Azores Front cruises (Gould, 1985; Fasham et al.,
1985).
GME is situated within the North Atlantic Subtropical region of Backus et
al. (1977). They described this region as bounded to the north (about 35°N)
by the North Atlantic Temperate region and to the south (about 18°N) by the
Atlantic Tropical region. The southern boundary of Backus et al. (1977) was
based upon the changeover between northern and southern Atlantic central water
masses. Fasham and Angel (1975) and Fasham and Foxton (1979) found a boundary
below a depth of about 500 m at about 18°N but concluded that this was due to
the northern limit of the Antarctic Intermediate water.
Longitudinally Backus e£ jilt's (1977) region extends from the west
African coast to the Caribbean, but a distinct upwelling fauna exists off
Mauritania which probably extends further north up the African coast (Angel,
1979b). The GME area was thought to be influenced by Mediterranean water
between about 750-1 300 m (Badcock and Merrett, 1976; Saunders, 1983) but
Fasham and Angel (1975) were unable to find specific fauna associations with
this. The GME site was thus thought of as being enclosed by hydrographic
and/or faunistic boundaries of which the closest were those marking the east
wards limit of western Atlantic water and the southern limit of eastern
Atlantic water.
These preliminary assessments were followed up by detailed field study by
staff of the Institute of Oceanographic Sciences on board RRS DISCOVERY, from
27 June to 21 July 1985. Sampling took place in and around a 10 km square
- 42 -
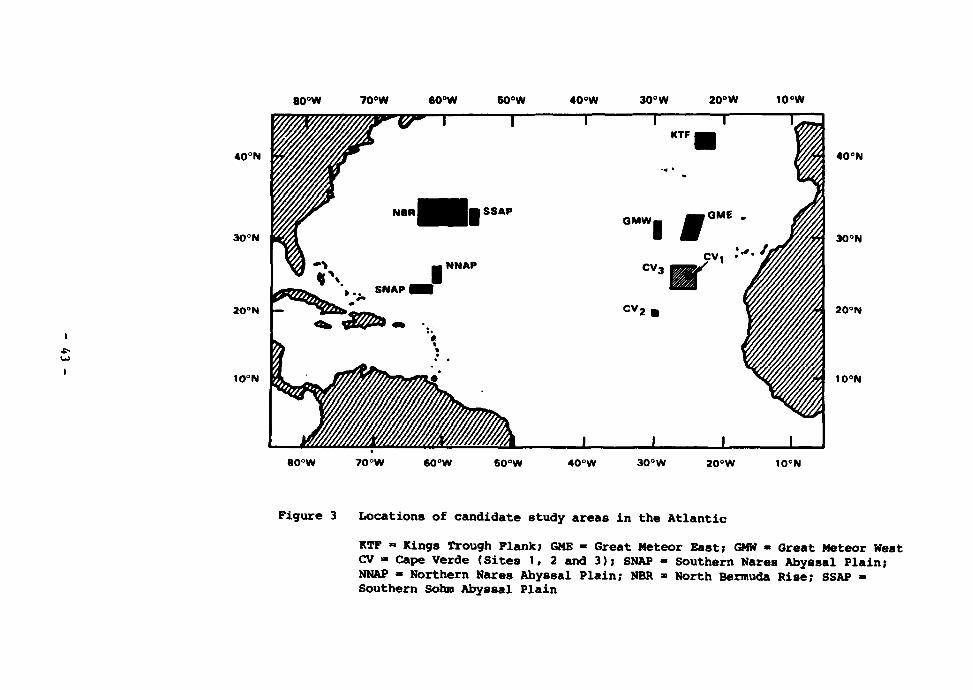
80°W 70°W 60°W 50°W 40°W 30° W 20° W 10°W
40°N
30°N
20°N —
10°N
40°N
30°N
20°N
10°N
80°W 70°W 60°W 50°W 40°W 30°W 20°W 10°N
Figure 3 Locations of candidate study areas in the Atlantic
KTF = Kings Trough Flank; GME - Great Meteor East; GMW - Great Meteor West CV - Cape Verde (Sites 1, 2 and 3); SNAP - Southern Nares Abyssal Plain; NNAP - Northern Nares Abyssal Plain; NBR • North Bermuda Rise; SSAP » Southern Sohm Abyssal Plain
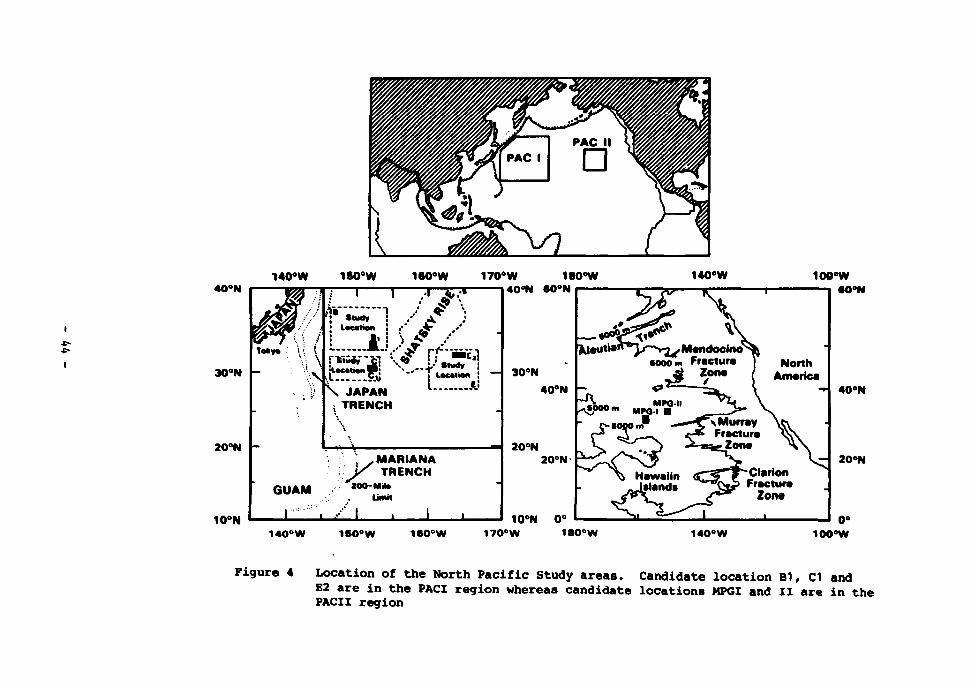
40°N 140°W 1S0°W
m 1
30°N
20°N -
Tokyo . \ :.
w
160°W 170°W 180°W 40°N 60°N
140°W
location
U ; VtSoV - H •location V j
\ JAPAN TRENCH
• " ^ r
V Study i location !
t JU
10' a : .MARIANA
l\JS TRENCH GUAM aoo-.M*,•
Unit
• • ' I
30°N 40°N
•ooom Frocturo
3 9""
— 20°N 20°N
2?
Murray Fracture
Zona
10°N 0° 1400W 1S0°W 160°W 170°W 180°W
ioe°w •0°N
North America
Clarion Fractura
Zona
•
40°N
20°N
140°W 0°
100°W
Figure 4 location of the North Pacific Study areas. Candidate location B1, C1 and E2 are in the PACI region whereas candidate locations MPGI and II are in the PACII region
centred at 31°17'N 25°24,W. In addition, shallow CTD casts with chlorophyll a_
and nutrient observations were made on passage, plus XRT transects at a number
of stations. The results of this study were published by Roe et al. (1986,
1987).
On the initial leg out to the GME site a series of vertical profiles of
temperature, salinity, chlorophyll _a and nutrients were made. A marked change
was observed in the vertical distribution of chlorophyll a_ on crossing the
front at 33°5'N. North of the front, the Deep Chlorophyll Maximum (DCM) was
at a depth of between 28 and 70 m (mean - 50 m, s.dev. • 17 n) and had a
magnitude between 0.6 and 1.2 mg m~3 chlorophyll £ (mean « 0.68, s.dev. •
0.19), whereas to the south of the front the DCM was at a depth between 88 and
105 m (mean » 98, s.dev. = 9.7) and had a magnitude between 0.38 and 0.52 mg
m - 3 chlorophyll £ (mean * 0.46, s.dev. « 0.07). A similar reduction in the
magnitude of the DCM on passing southwards across the front has been observed
farther west in the Azores Front (Fasham et al., 1985) and is considered to be
a permanent feature of the phytoplankton chlorophyll distribution.
Shallow CTD dips to 300 m were made on eleven occasions on the first leg
of the cruise which provided vertical distributions of temperature, salinity,
density, chlorophyll a, concentrations and underwater irradiance. There was a
very shallow mixed layer of approximately 6 m, below which the seasonal
thermocline extended down to around 100 m. The DCM was at a depth of 95 m
with a magnitude of 0.47 mg m chlorophyll a. Good underwater irradiance
profiles were obtained on six occasions and the mean depth of the 1% light
level was 87 m with a standard deviation of 4 m. There was a significant
difference at the 1% level between the depth of the IX light level and the
depth of the DCM. Some nutrient samples were taken and showed the usual
structure of high values at depth (5.5 to 6.0 uM of nitrate/nitrite at 300 m),
decreasing through a 'nutricline' to values of less than 1 uM nitrate/nitrite
within the DCM and in the surface 100 m.
Four experiments were run at the GME site to estimate the daily rate of
carbon fixation due to phytoplankton photosynthesis. The method used was the ll,C technique (Steeman Nielsen, 1951, 1952) in which known amounts of
radioactively-labelled sodium bicarbonate (^CO^) are added to seawater
samples containing natural phytoplankton communities. From the measurements
- 45 -
of specific production (P ) and irradiance (I) a non-linear regression techni
que was used to estimate the parameters in the production-irradiance curve
derived by Piatt £t £l. (1981). The full details are given in the 10S report
(Roe et al., 1986). Total daily production rates were calculated using pro
files of chlorophyll a_ concentrations; the depth of euphotic zone (Z ) was
taken to be the depth above which the total net daily production was positive
(~ 87 m). With the exception of station 1126#59 the estimates of daily pro
duction (Table II) are very similar, giving some confidence in the mean value
of 227 mg C day . However, it is worth remembering the many assumptions
implicit in this method of calculating daily production, viz: (1) the
production-irradiance curve parameters measured for a sample at single depth
are assumed to apply to the total population; (2) vertical mixing is ignored;
(3) diel changes in the production-irradiance parameters are not considered;
and (4) the phytoplankton population is assumed to be in equilibrium.
Discrete depth samples (Figure 5) were taken throughout the water column
with the IOS opening/closing multiple rectangular midwater trawl (RMT 1+8M -
Roe and Shale, 1979; Roe £££!_•» 1980). One hundred metre depth layers were
fished by both day and night between the surface and a depth of 1 500 m (the 0
to 100 m depth layer was also subdivided into 0-25, 25-50 and 50-100 m
layers). Four hundred metre depth layers were fished between 1 500 m and the
bottom (ca. 5 440 m), irrespective of the time of day or night. Close to the
sea bed a near-bottom echo-sounder (NBES) was used in conjunction with the RMT
1+8M (Roe and Darlington, 1985). Three repeat hauls were made with this sys
tem, fishing between 90 and 10 m above the bottom.
The relationship between the various mid-water biomass measurements were
examined by subjecting the data to major axis regression (Yorke, 1966; Hull,
1985). The slopes of the regression lines using log10 transformed values were
calculated and the significance of the difference in slope between the various
lines tested.
The initial analyses of these results has indicated the following. Most
of the biomass of both plankton and micronekton is contained within the top
1 500 m of the water column (Figures 6, 7). Accumulative percentages
(Table III) show that > 80% of the total planktonic biomass and > 95% of the
total micronekton occurred between 100-0 m. Overall diel changes in biomass
- 46 -
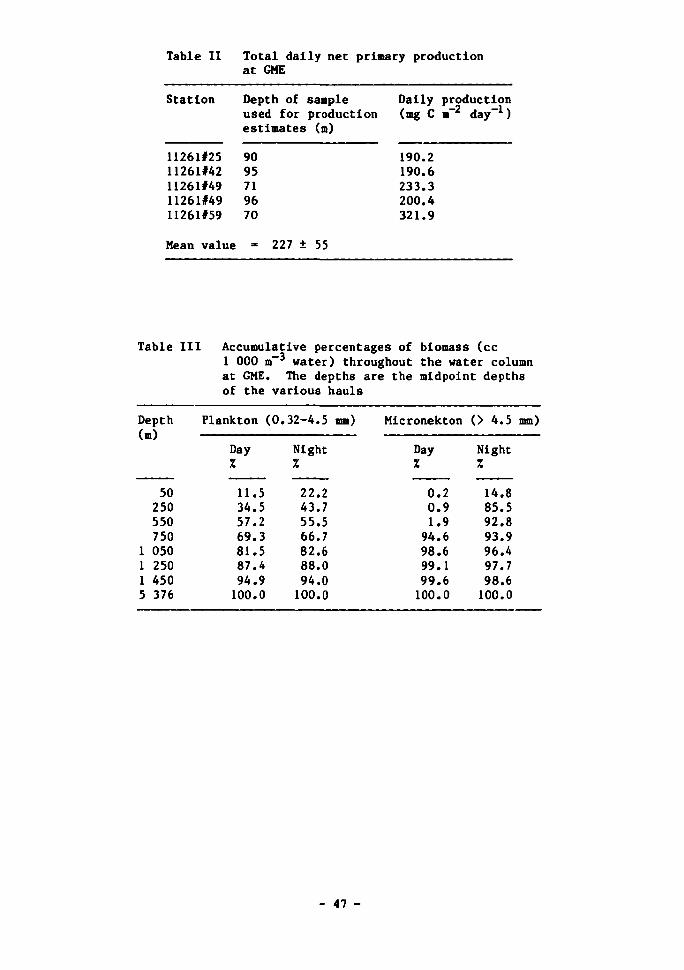
Table II Total dally net primary production at GME
Station Depth of sample Dally production used for production (mg C m~2 day ) estimates (m)
11261#25 90 190.2 11261#42 95 190.6 11261#49 71 233.3 11261149 96 200.4 11261#59 70 321.9
Mean value * 227 ± 55
Table III Accumulative percentages of blomass (cc 1 000 m water) throughout the water column at GME. The depths are the midpoint depths of the various hauls
Depth Plankton (0.32-4.5 mm) Mlcronekton (> 4.5 mm (m)
50 250 550 750
1 050 1 250 1 450 5 376
Day Night % %
11.5 34.5 57.2 69.3 81.5 87.4 94.9
100.0
22.2 43.7 55.5 66.7 82.6 88.0 94.0
100.0
Day %
Night %
0.2 0.9 1.9 94.6 98.6 99.1 99.6 100.0
14.8 85.5 92.8 93.9 96.4 97.7 98.6 100.0
- 47 -
were confined to the top 1 000 n for plankton and the upper 1 500 m for micro-
nekton. The micronektonic biomass within the top 1 000 m was dominated by
massive swarms of the tunicate Pyrosoma. Pyrosoma occurred in very large
numbers between 700-900 m by day and migrated up to the surface at night -
when they were abundant between 200-0 m with a residual population between
500-600 m.
Various regression coefficients for planktonic biomass are shown in
Table IV. Volume and wet weight (WW) data were available throughout the water
column, dry weight (DW) was measured between 0-1 500 m and on the three dupli
cate samples taken between 3 900-5 100 m. There was no significant difference
between the volume/WW regressions for different size groups or for depths
above and below 1 500 m. Similarly there was no significant difference in the
Vol/DW and WW/0W regressions between size groups; the deep dry weight data
fit well with those obtained between 0-1 500 m. Consequently single regres
sions for total plankton (0.32-4.5 mm) have been used, and these single
regressions applied throughout the water column.
The volume of micronekton (excluding Pyrosoma) has been converted to dry
weight using the plankton regression. Pyrosona were excluded because they are
gelatinous and the volume/dry weight relationship will certainly be lower than
that of the crustaceans and fish which make up the bulk of the remaining
catches; they also occurred in only 2 day and 3 night hauls, all above
1 000 m.
Profiles of dry weight against depth are shown in Figure 8. Daytime data
have been used for the hauls above 1 500 m. The similarity between the plank
ton and micronekton profiles below 1 700 m is striking. The total biomass is
extremely low. The total dry weight of plankton beneath one square metre of
sea surface is 1.52 g (day) and 1.25 g (night); of micronekton it is 0.61 g
(day) and 0.52 g (night). The total pelagic biomass at GME therefore amounts
to about 2 g beneath each m2 of sea surface. These figures do not include
phytoplankton or zooplankton smaller than 0.32 mm, neither do they include
Pyrosoma nor any large pelagic animals.
There is an exponential decrease in biomass with depth for both plankton
and micronekton. Linear regression coefficients for biomass as a function of
- 48 -
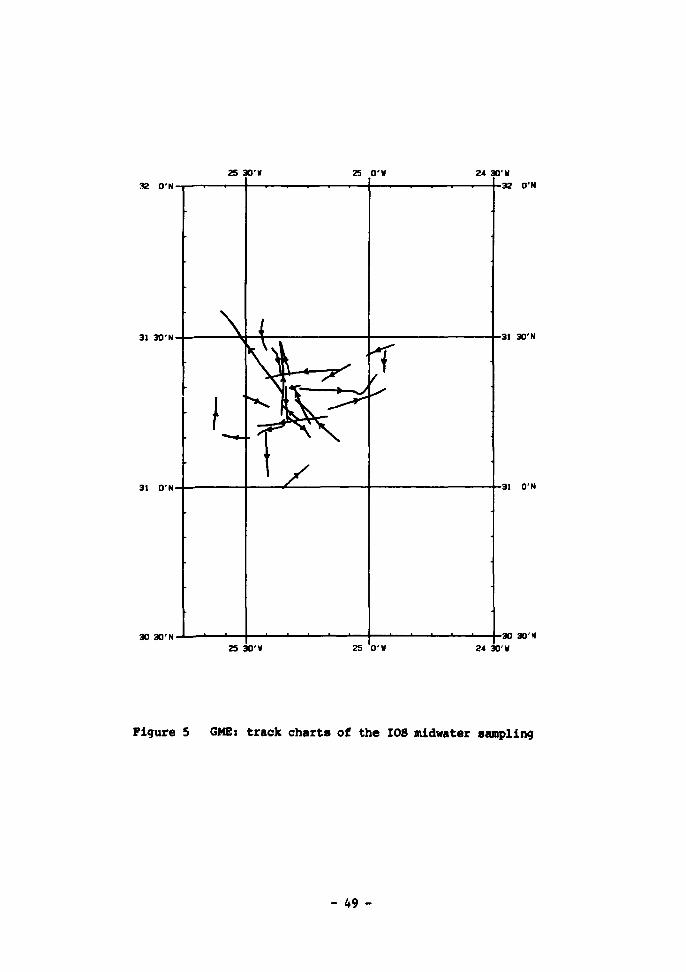
25 30'M
32 O'N
31 30'N
31 O'N
30 30'N 25 30'» 25 O'W 24 30'¥
Figure 5 GME: track charts of the IOS midwater sampling
- 49 -
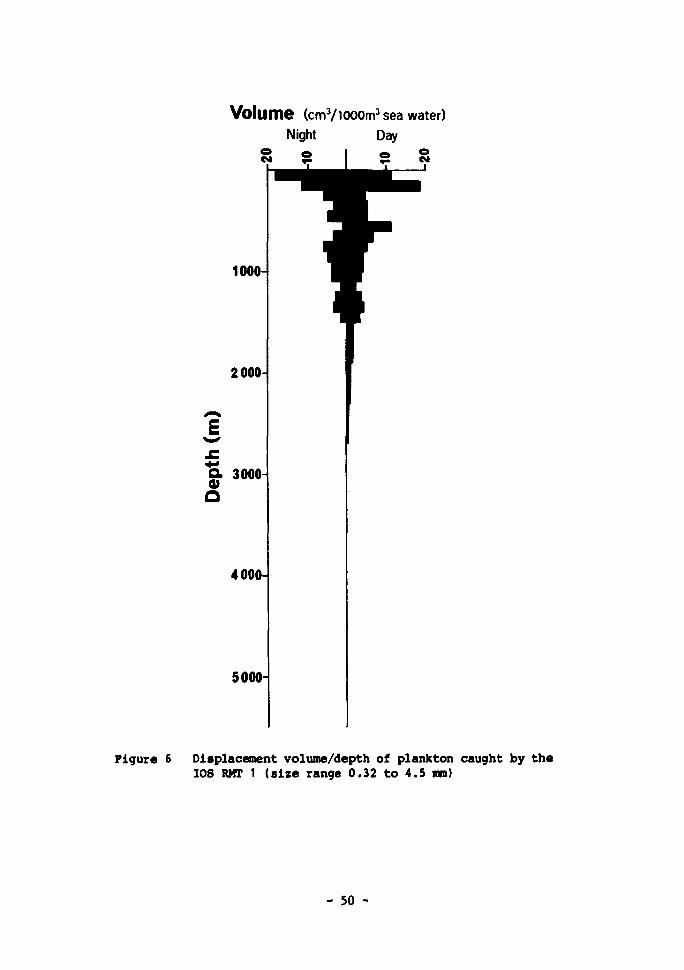
Volume (cmViooom3 sea water)
Night Day
2000-
E
a 3000-
4000-
5000-
Figure 6 Displacement volume/depth of plankton caught by the IOS RMT 1 (size range 0.32 to 4.5 mm)
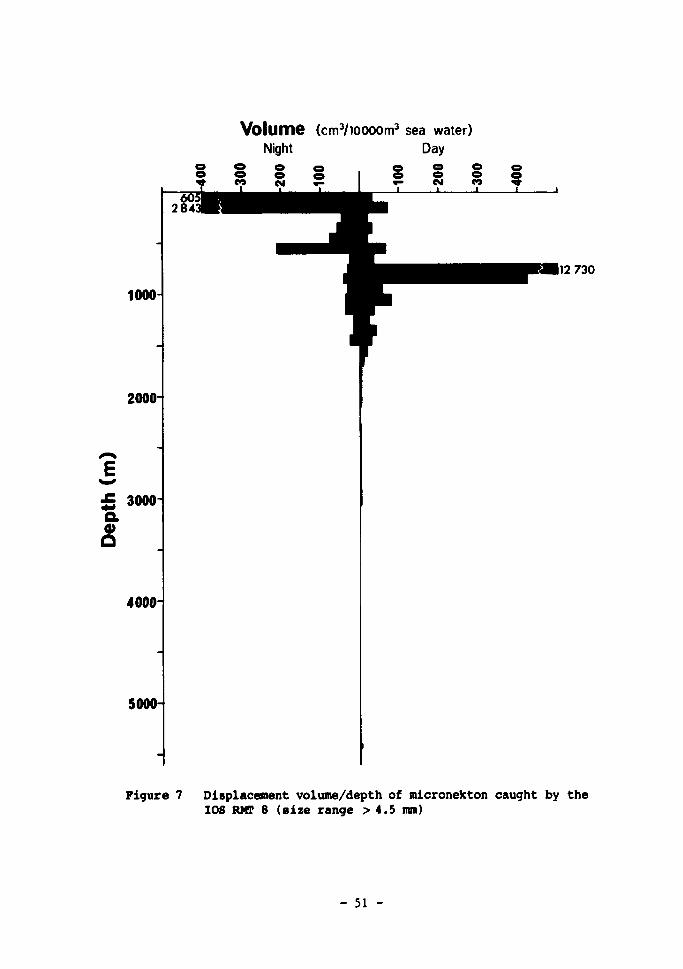
V o l u m e (cmVioooom3 sea water) Night Day
1000
12 730
2000-
£ 3000
o. Q
4000-
5000-
Figure 7 Displacement volume/depth of mlcronekton caught by the IOS RMF 8 (size range > 4.5 mm)
- 51 -
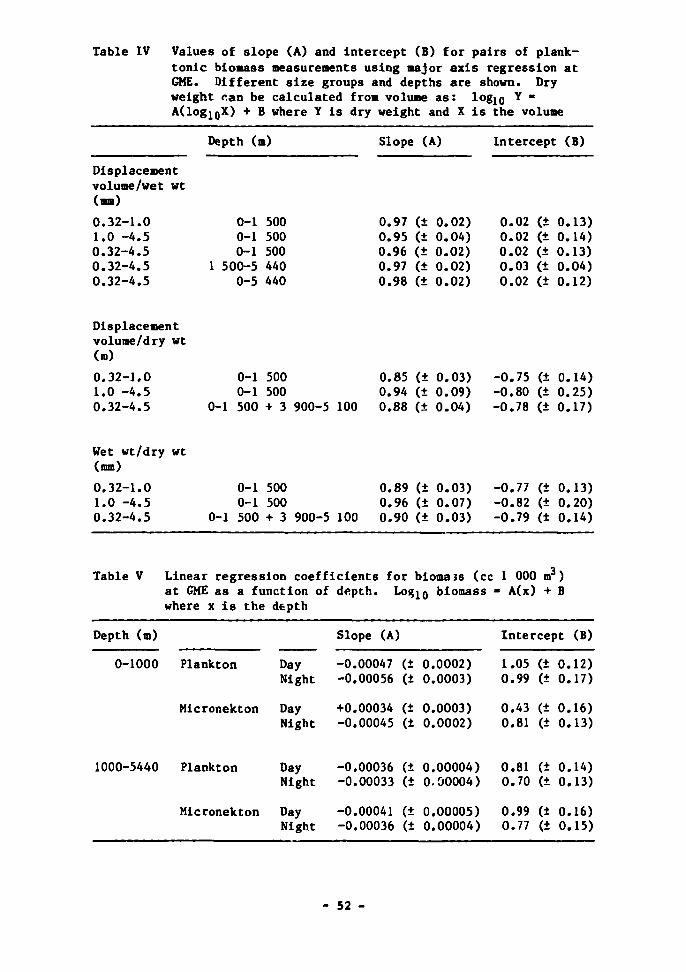
Table IV Values of slope (A) and intercept (B) for pairs of plank-tonic biomass measurements using major axis regression at GME. Different size groups and depths are shown. Dry weight can be calculated from volume as: log10
v * A(logigX) + B where Y is dry weight and X is the volume
Displacement volume/wet wt (mm)
0.32-1.0 1.0 -4.5 0.32-4.5 0.32-4.5 0.32-4.5
Depth (m)
0-1 500 0-1 500 0-1 500
1 500-5 440 0-5 440
Slope (A)
0.97 (± 0.02) 0.95 (± 0.04) 0.96 (± 0.02) 0.97 (± 0.02) 0.98 (± 0.02)
Intercept (B)
0.02 (± 0.13) 0.02 (± 0.14) 0.02 (± 0.13) 0.03 (± 0.04) 0.02 (± 0.12)
Displacement volume/dry wt (m)
0.32-1.0 1.0 -4.5 0.32-4.5
0-1 500 0-1 500
0-1 500 + 3 900-5 100
0.85 (± 0.03) 0.94 (± 0.09) 0.88 (± 0.04)
-0.75 (± 0.14) -0.80 (± 0.25) -0.78 (± 0.17)
Wet wt/dry wt (mm)
0.32-1.0 1.0 -4.5 0.32-4.5
0-1 500 0-1 500
0-1 500 + 3 900-5 100
0.89 (± 0.03) 0.96 (± 0.07) 0.90 (± 0.03)
-0.77 (± 0.13) -0.82 (± 0.20) -0.79 (± 0.14)
Table V Linear regression coefficients for bioma3B (cc 1 000 m ) at GME as a function of depth. Log10 biomass - A(x) + B where x is the depth
Depth (m)
0-1000
1000-5440
Plankton
Micronekton
Plankton
Micronekton
Day Night
Day Night
Day Night
Day Night
Slope (A)
-0.00047 (± -0.00056 (+
+0.00034 (± -0.00045 (±
-0.00036 (± -0.00033 (±
-0.00041 (± -0.00036 (±
0.0002) 0.0003)
0.0003) 0.0002)
0.00004) 0-00004)
0.00005) 0.00004)
Intercept (B)
1.05 (± 0.12) 0.99 (± 0.17)
0.43 (± 0.16) 0.81 (± 0.13)
0.81 (± 0.14) 0.70 (± 0.13)
0.99 (± 0.16) 0.77 (+ 0.15)
- 52 -
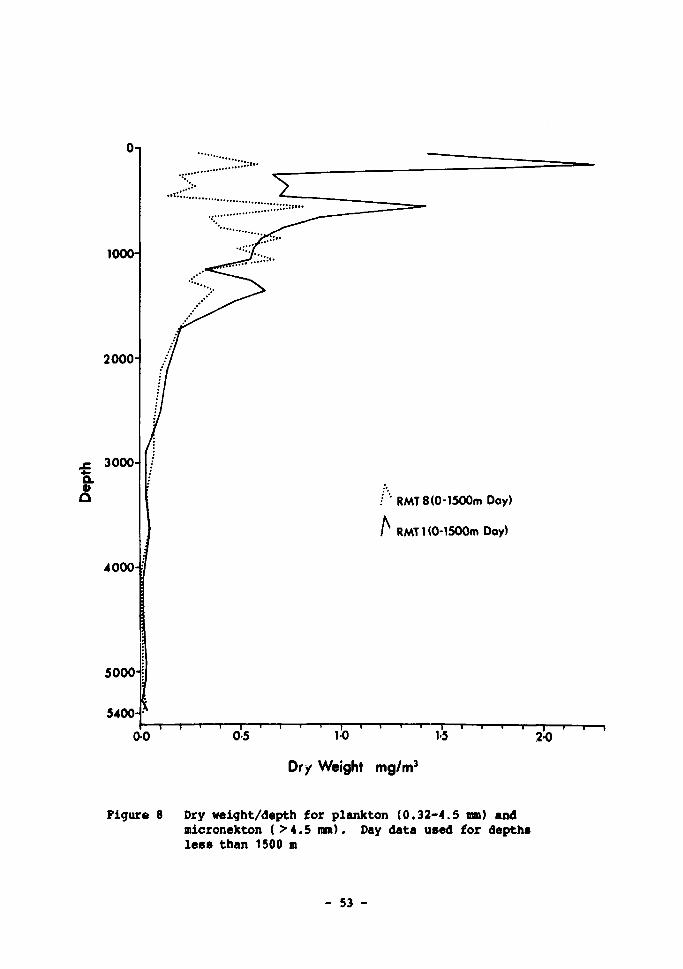
1000-
2000-
3000-
I
4000-1
5000
5400-
• ' RMT 8(0-1500m Doy)
A RMTl(0-1500mDay)
~05 S" "» r — | 1 1 1
20
Dry Weight mg/m3
Figure 6 Dry weight/depth for plankton (0.32-4.5 mm) and micronekton (>4.5 mm). Day data used for depths less than 1500 m
- 53 -
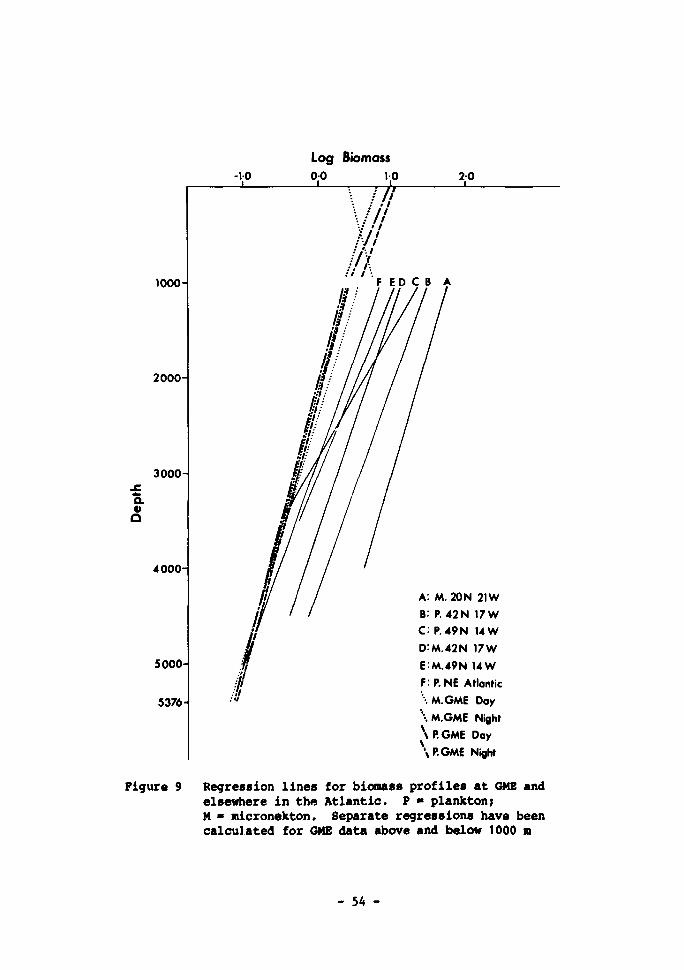
2000-
1
-10 _1_
Log Biomass 1.0 o-o
A: M. 20N 21W B: P. 42N 17W C P.49N 14 W D:M.42N 17W E:M.49N 14 W F:P.NE Atlantic \M.GME Day \ M.GME Night \ P. GME Day \ P. GME Night
Figure 9 Regression lines for biomass profiles at GME and elsewhere in the Atlantic. P » plankton; M - micronekton. Separate regressions have been calculated for GME data above and below 1000 m
- 54 -
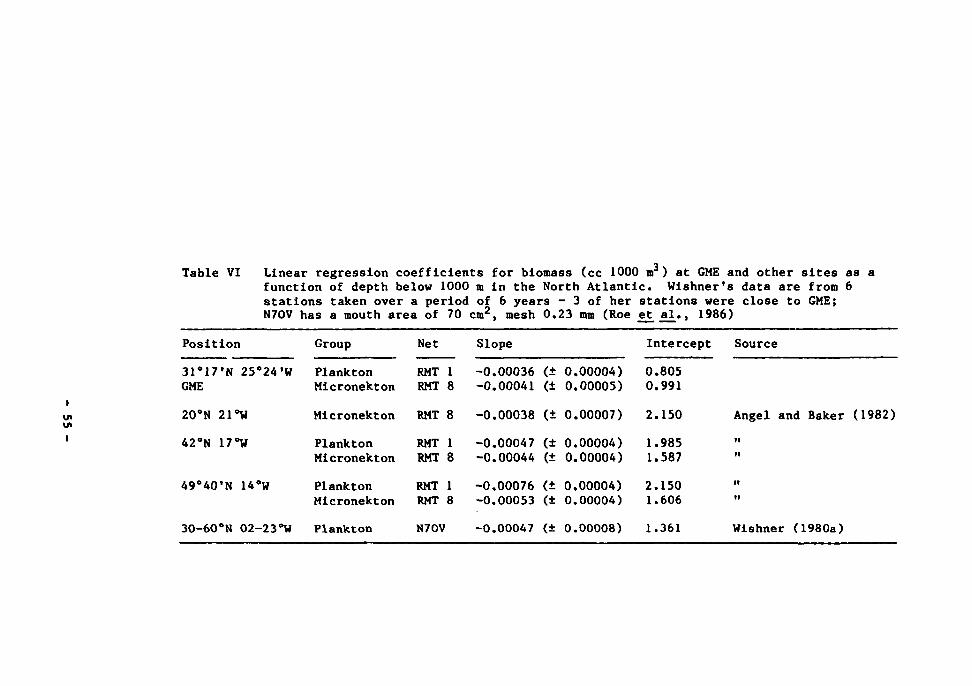
Table VI Linear regression coefficients for biomass (cc 1000 m ) at GME and other sites as a function of depth below 1000 m in the North Atlantic. Wishner's data are from 6 stations taken over a period of 6 years - 3 of her stations were close to GME; N70V has a mouth area of 70 cm2, mesh 0.23 mm (Roe et al., 1986)
Position
31°17»N 25°24'W GME
Group Net Slope
Plankton RMT 1 -0.00036 (± 0.00004) Micronekton RMT 8 -0.00041 (± 0.00005)
Intercept Source
0.805 0.991
ui 20°N 21 °W
42°N 17°W
Micronekton RMT 8 -0.00038 (± 0.00007) 2.150
Plankton RMT 1 -0.00047 (± 0.00004) 1.985 Micronekton RMT 8 -0.00044 (± 0.00004) 1.587
Angel and Baker (1982)
49°40'N 14°W Plankton RMT 1 -0.00076 (± 0.00004) 2.150 Micronekton RMT 8 -0.00053 (± 0.00004) 1.606
30-60°N 02-23°W Plankton N70V -0.00047 (± 0.00008) 1.361 Wishner (1980a)
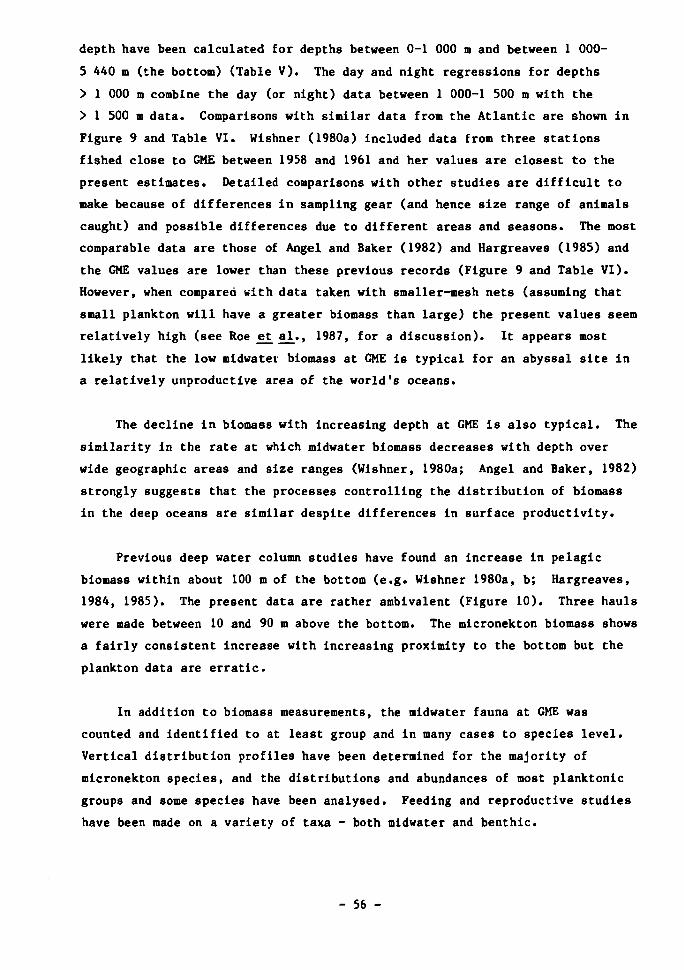
depth have been calculated for depths between 0-1 000 m and between 1 000-
5 440 m (the bottom) (Table V) . The day and night regressions for depths
> 1 000 m combine the day (or night) data between 1 000-1 500 m with the
> 1 500 m data. Comparisons with similar data from the Atlantic are shown in
Figure 9 and Table VI. Wishner (1980a) included data from three stations
fished close to GME between 1958 and 1961 and her values are closest to the
present estimates. Detailed comparisons with other studies are difficult to
make because of differences in sampling gear (and hence size range of animals
caught) and possible differences due to different areas and seasons. The most
comparable data are those of Angel and Baker (1982) and Hargreaves (1985) and
the GME values are lower than these previous records (Figure 9 and Table VI).
However, when compared with data taken with smaller-mesh nets (assuming that
small plankton will have a greater biomass than large) the present values seem
relatively high (see Roe et al., 1987, for a discussion). It appears most
likely that the low midwatei biomass at GME is typical for an abyssal site in
a relatively unproductive area of the world's oceans.
The decline in biomass with increasing depth at GME is also typical. The
similarity in the rate at which midwater biomass decreases with depth over
wide geographic areas and size ranges (Wishner, 1980a; Angel and Baker, 1982)
strongly suggests that the processes controlling the distribution of biomass
in the deep oceans are similar despite differences in surface productivity.
Previous deep water column studies have found an increase in pelagic
biomass within about 100 m of the bottom (e.g. Wishner 1980a, b; Hargreaves,
1984, 1985). The present data are rather ambivalent (Figure 10). Three hauls
were made between 10 and 90 m above the bottom. The micronekton biomass shows
a fairly consistent increase with increasing proximity to the bottom but the
plankton data are erratic.
In addition to biomass measurements, the midwater fauna at GME was
counted and identified to at least group and in many cases to species level.
Vertical distribution profiles have been determined for the majority of
micronekton species, and the distributions and abundances of most planktonic
groups and some species have been analysed. Feeding and reproductive studies
have been made on a variety of taxa - both midwater and benthic.
- 56 -
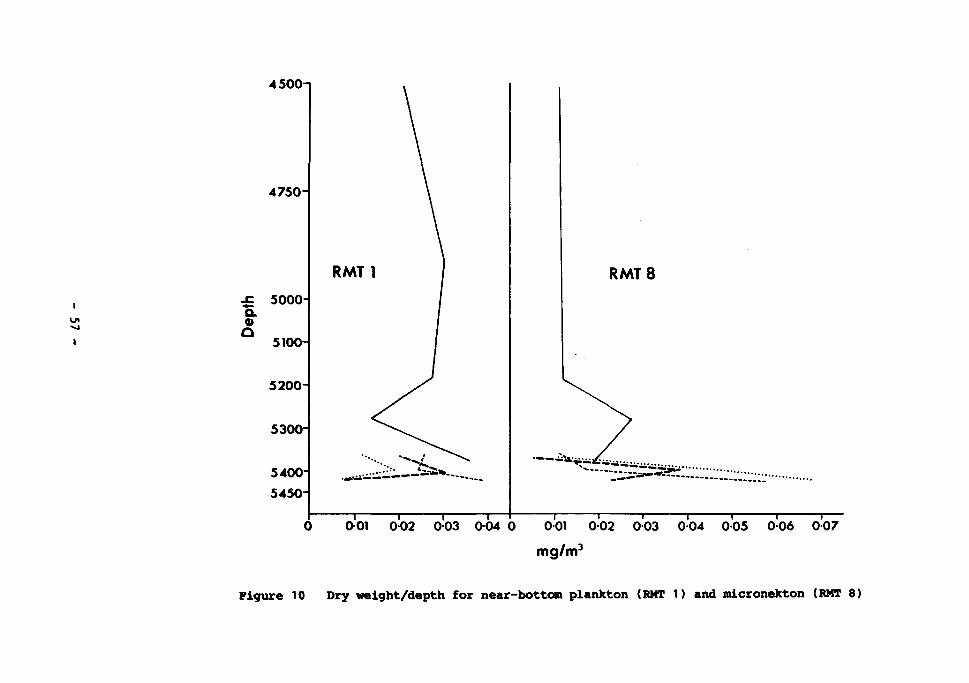
4500n
4750H
•£ 5000 a o Q
5100H
5200-
5300-
5400-
5450-
RMT1 RMT 8
^ - ^ ^ ^ . ^
— i 1 1 1 — i 1 1 1 1 1 1 1 —
0-01 002 003 004 0 001 002 003 004 005 006 007
mg/m3
Figure 10 Dry weight/depth for near-bottom plankton (RMT 1) and micronekton (RMT 8)
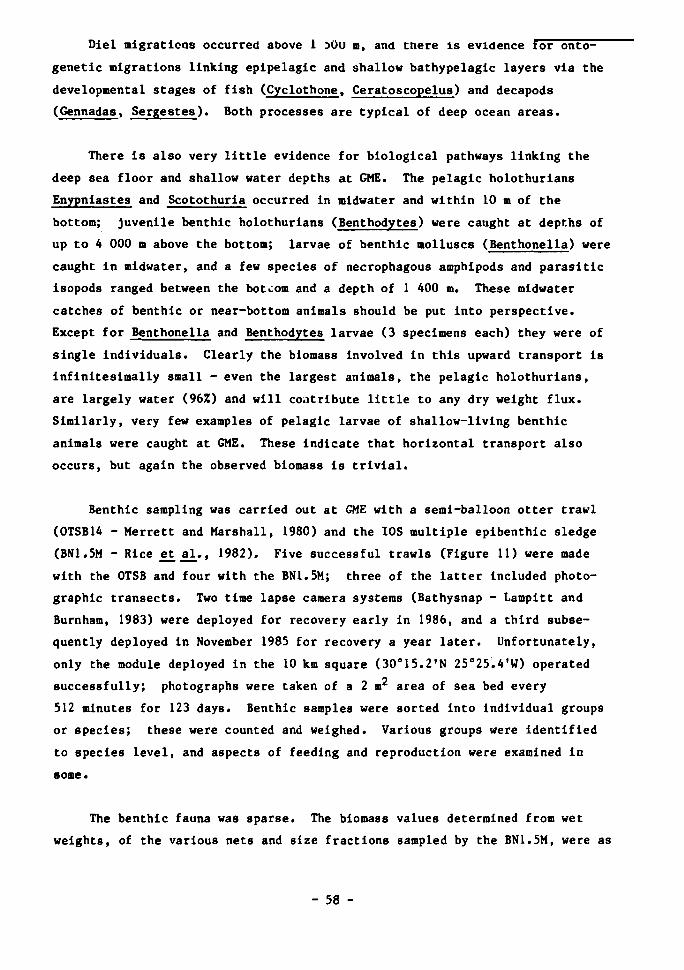
Diel migrations occurred above 1 30u m, and there is evidence for onto-
genetic migrations linking epipelagic and shallow bathypelagic layers via the
developmental stages of fish (Cyclothone, Ceratoscopelus) and decapods
(Gennadas, Sergestes). Both processes are typical of deep ocean areas.
There is also very little evidence for biological pathways linking the
deep sea floor and shallow water depths at GNE. The pelagic holothurians
Enypniastes and Scotothuria occurred in midwater and within 10 m of the
bottom; juvenile benthic holothurians (Benthodytes) were caught at depths of
up to 4 000 m above the bottom; larvae of benthic molluscs (Benthonella) were
caught in midwater, and a few species of necrophagous amphipods and parasitic
isopods ranged between the bottom and a depth of 1 400 m. These midwater
catches of benthic or near-bottom animals should be put into perspective.
Except for Benthonella and Benthodytes larvae (3 specimens each) they were of
single individuals. Clearly the biomass involved in this upward transport is
infinitesimally small - even the largest animals, the pelagic holothurians,
are largely water (96%) and will contribute little to any dry weight flux.
Similarly, very few examples of pelagic larvae of shallow-living benthic
animals were caught at GME. These indicate that horizontal transport also
occurs, but again the observed biomass is trivial.
Benthic sampling was carried out at GME with a semi-balloon otter trawl
(0TSB14 - Merrett and Marshall, 1980) and the 10S multiple epibenthic sledge
(BN1.5M - Rice e£.al.., 1982). Five successful trawls (Figure 11) were made
with the 0TSB and four with the BN1.5M; three of the latter included photo
graphic transects. Two time lapse camera systems (Bathysnap - Lampitt and
Burnham, 1983) were deployed for recovery early in 1986, and a third subse
quently deployed in November 1985 for recovery a year later. Unfortunately,
only the module deployed in the 10 km square (30°15.2'N 25°25.4'W) operated
successfully; photographs were taken of a 2 m2 area of sea bed every
512 minutes for 123 days. Benthic samples were sorted into individual groups
or species; these were counted and weighed. Various groups were identified
to species level, and aspects of feeding and reproduction were examined in
some.
The benthic fauna was sparse. The biomass values determined from wet
weights, of the various nets and size fractions sampled by the BN1.5M, were as
- 58 -
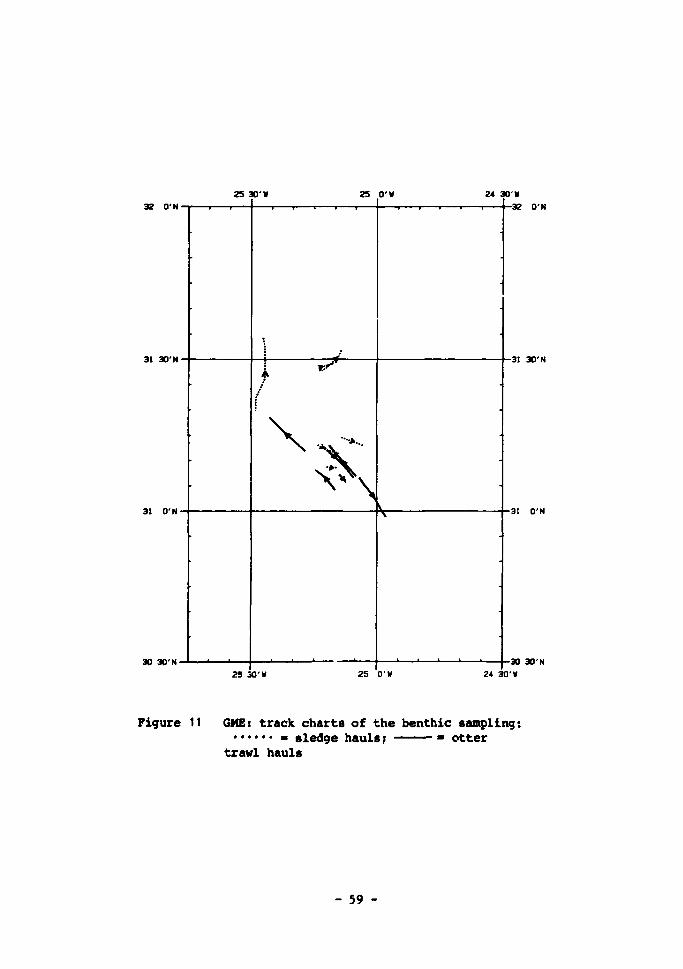
25 30-K 25 O'W
i i i i
23 30'W
• p * -
^ \ J
• •
24 30'W
-i 1 1 1 32 O'N
25 O'W 24 30'W
Figure 11 GME: track charts of the benthic sampling: • sledge hauls; • otter
trawl hauls
- 59 -
follows: otter trawl 16.39-70.64 •*/! 000 m2 of sea bed, mean 38.08 g/
1 000 m2; BN1.5 > 4.0 mm size fraction 11.51-21.96 g/1 000 m2, mean 16.12 g/
1 000 m2, 1-4 mm fraction 0.53-2.75 g/1 000 m2, mean 1.62 g/1 000 m2.
As with the midwater biomass, these figures will underestimate the total
benthic biomass at GME. Absolute comparisons with previous work are similarly
difficult to make because different gears sample different size fractions, and
different areas, depths and times will also have an effect. Generally speak
ing, the benthic biomass at GME was low - but not abnormally so. It is pro
bably typical of an abyssal site in a relatively unproductive area.
Asteroids, principally Hyphalaster and Styracaster, were the most abun
dant animals sampled by the 0TSB14, followed by decapods (Benthesiscyinus) and
fish (mainly Bathymicrops regis). Bivalves dominated the BN1.5M catches with
decapods, asteroids and gastropods also relatively numerous.
Evidence of biological pathways involving the benthic fauna has been des
cribed earlier. In terms of pathways to man, deep-sea fish (especially
macrourids) have received particular attention from the SUG. Some macrourid
species are of sufficient size and occur in sufficient densities that they
might attract commercial interest. Only a single specimen of a potentially
commercial species (Coryphaenoides armatus) was caught at GME. The demersal
fish population there was dominated by small ipnopids (Bathymicrops regis and
Bathypterois longlpes) and the small gelatinous macrourid Echinomacrurus
mollis. These species all have low fecundity and are relatively immobile.
This species assemblage contrasts markedly with northern assemblages
which are dominated by large active macrourids (e.g. Coryphaenoides armatus,
£. leptolepi8) and synaphobranchids of high fecundity. Evidence suggests that
these changes in demersal fish populations may occur in relation to changes in
surface productivity. Whatever their cause, the demersal fish population at
GME is unlikely to be attractive to commercial fisheries, although the possi
bilities of large-scale horizontal migrations by macrourids linking southern
and northern species groups cannot yet be completely discounted.
The Bathysnap sequence of photographs showed that changes in seabed topo
graphy > 1 cm in height, due to biological activity, occurred at very similar
- 60 -
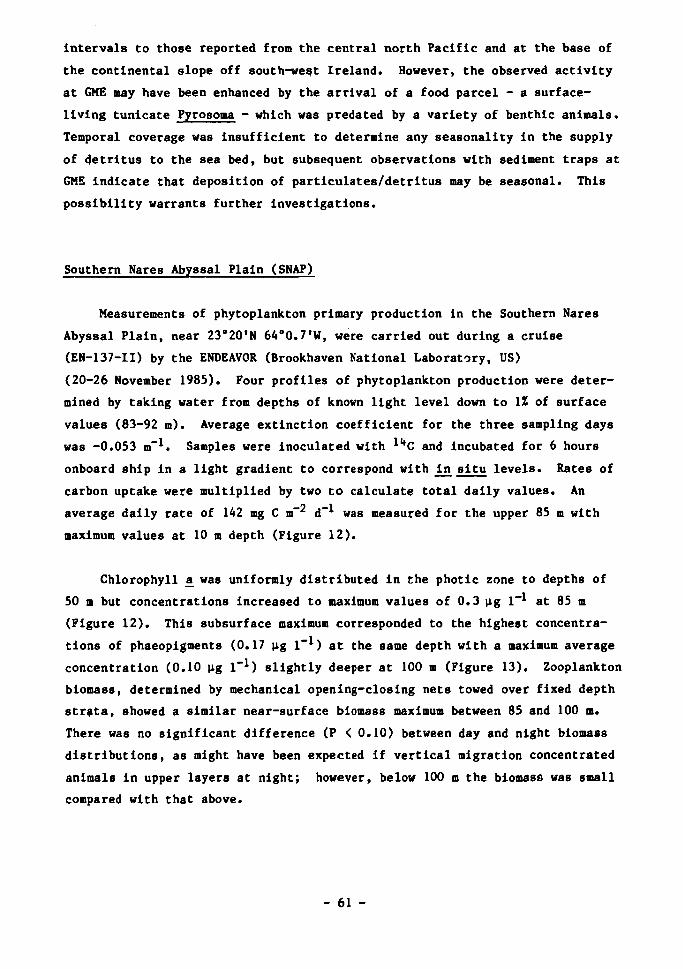
intervals to those reported from the central north Pacific and at the base of
the continental slope off south-west Ireland. However, the observed activity
at GME may have been enhanced by the arrival of a food parcel - a surface-
living tunicate Pyrosoma - which was predated by a variety of benthic animals.
Temporal coverage was insufficient to determine any seasonality in the supply
of detritus to the sea bed, but subsequent observations with sediment traps at
GME indicate that deposition of particulates/detritus may be seasonal. This
possibility warrants further investigations.
Southern Nares Abyssal Plain (SNAP)
Measurements of phytoplankton primary production in the Southern Nares
Abyssal Plain, near 23°20'N 64°0.7'W, were carried out during a cruise
(EN-137-II) by the ENDEAVOR (Brookhaven National Laboratory, US)
(20-26 November 1985). Four profiles of phytoplankton production were deter
mined by taking water from depths of known light level down to 1% of surface
values (83-92 m). Average extinction coefficient for the three sampling days
was -0.053 m-1. Samples were inoculated with 14C and incubated for 6 hours
onboard ship in a light gradient to correspond with in situ levels. Rates of
carbon uptake were multiplied by two to calculate total daily values. An
average daily rate of 142 mg C m d-1 was measured for the upper 85 m with
maximum values at 10 m depth (Figure 12).
Chlorophyll a_ was uniformly distributed in the photic zone to depths of
50 m but concentrations increased to maximum values of 0.3 ug 1_1 at 85 m
(Figure 12). This subsurface maximum corresponded to the highest concentra
tions of phaeopigments (0.17 ug l"1) at the same depth with a maximum average
concentration (0.10 ug 1_1) slightly deeper at 100 m (Figure 13). Zooplankton
bioma88, determined by mechanical opening-closing nets towed over fixed depth
strata, showed a similar near-surface biomass maximum between 85 and 100 m.
There was no significant difference (P < 0.10) between day and night biomass
distributions, as might have been expected if vertical migration concentrated
animals in upper layers at night; however, below 100 m the biomaso was small
compared with that above.
- 61 -
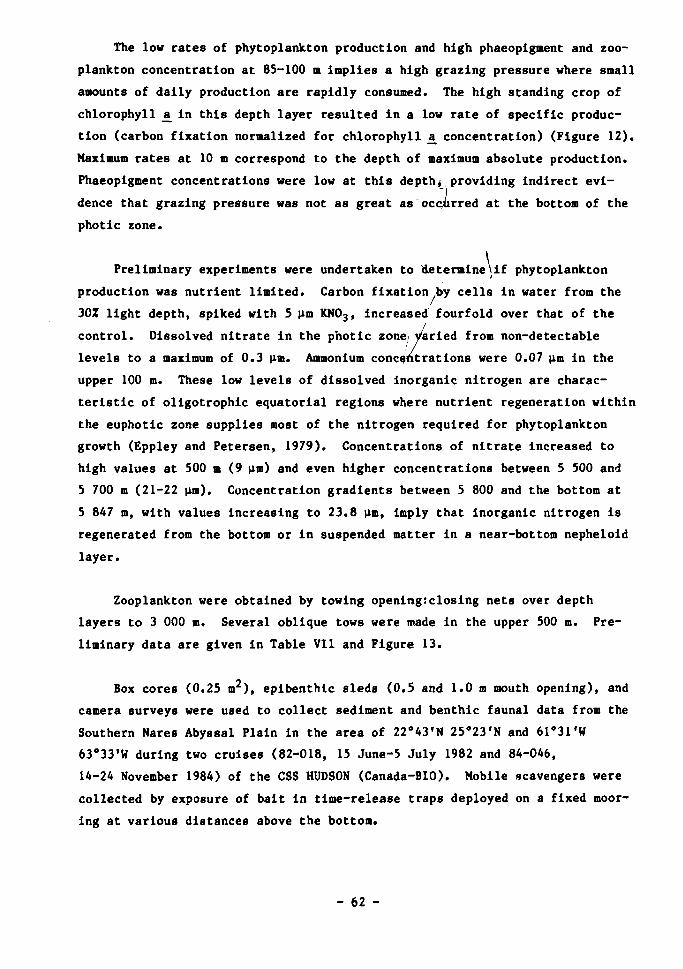
The low rates of phytoplankton production and high phaeopigment and zoo-
plankton concentration at 85-100 m Implies a high grazing pressure where small
amounts of daily production are rapidly consumed. The high standing crop of
chlorophyll a_ in this depth layer resulted in a low rate of specific produc
tion (carbon fixation normalized for chlorophyll £ concentration) (Figure 12).
Maximum rates at 10 m correspond to the depth of maximum absolute production.
Phaeopigment concentrations were low at this depth* providing indirect evi
dence that grazing pressure was not as great as occurred at the bottom of the
photic zone.
Preliminary experiments were undertaken to &etermine\if phytoplankton
production was nutrient limited. Carbon fixation by cells in water from the
30Z light depth, spiked with 5 urn KN03, increased fourfold over that of the
control. Dissolved nitrate in the photic zone varied from non-detectable
levels to a maximum of 0.3 am. Ammonium concentrations were 0.07 urn in the
upper 100 m. These low levels of dissolved inorganic nitrogen are charac
teristic of oligotrophic equatorial regions where nutrient regeneration within
the euphotic zone supplies most of the nitrogen required for phytoplankton
growth (Eppley and Petersen, 1979). Concentrations of nitrate increased to
high values at 500 m (9 urn) and even higher concentrations between 5 500 and
5 700 m (21-22 urn). Concentration gradients between 5 800 and the bottom at
5 847 m, with values increasing to 23.8 urn, imply that inorganic nitrogen is
regenerated from the bottom or in suspended matter in a near-bottom nepheloid
layer.
Zooplankton were obtained by towing opening:closing nets over depth
layers to 3 000 m. Several oblique tows were made in the upper 500 m. Pre
liminary data are given in Table VII and Figure 13.
Box cores (0,25 m 2 ) , epibenthic sleds (0.5 and 1.0 m mouth opening), and
camera surveys were used to collect sediment and benthic faunal data from the
Southern Nares Abyssal Plain in the area of 22°43'N 25°23'N and 61'31'W
63°33'W during two cruises (82-018, 15 June-5 July 1982 and 84-046,
14-24 November 1984) of the CSS HUDSON (Canada-BIO). Mobile scavengers were
collected by exposure of bait in time-release traps deployed on a fixed moor
ing at various distances above the bottom.
- 62 -
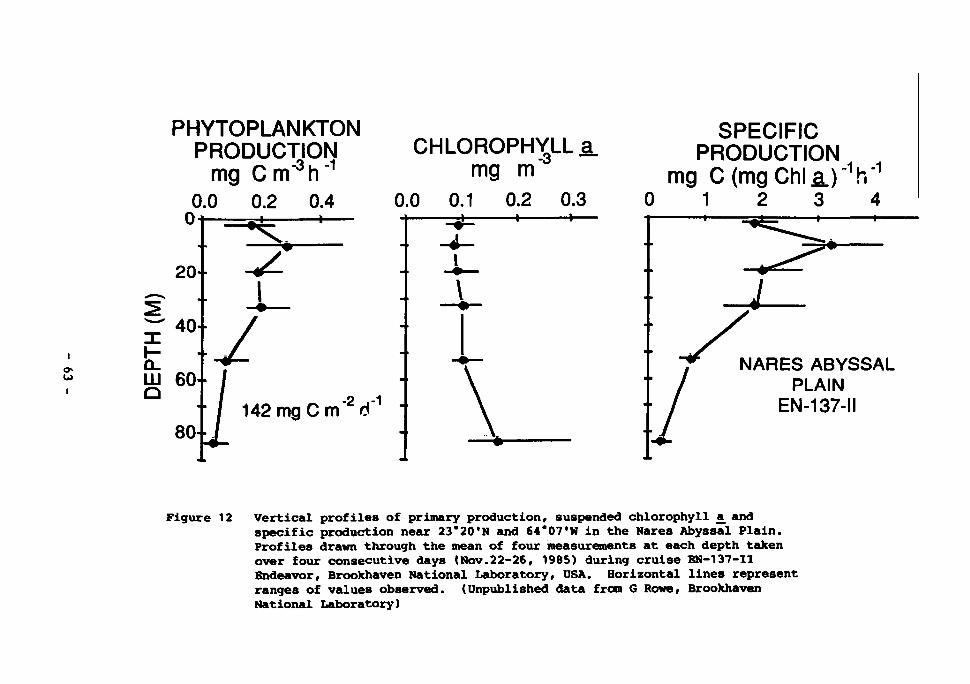
PHYTOPLANKTON PRODUCTION
mg Cm"3!!'1
o.o 0.2 0.4 o
CHLOROPHYLL a. mg m"
0.0 0.1 0.2 0.3 — — • * - » » —
142mgCm"2d"1
SPECIFIC PRODUCTION
mg C (mg Chi 3J "V1
1 2 3 4
NARES ABYSSAL PLAIN
EN-137-II
Figure 12 Vertical profiles of primary production, suspended chlorophyll a_and specific production near 23'20'N and 64*07'w in the Nares Abyssal Plain. Profiles drawn through the mean of four measurements at each depth taken over four consecutive days (Nov.22-26, 1985) during cruise EN-137-11 Endeavor, Brookhaven National Laboratory, USA. Horizontal lines represent ranges of values observed. (Unpublished data from G Rowe, Brookhaven National Laboratory)
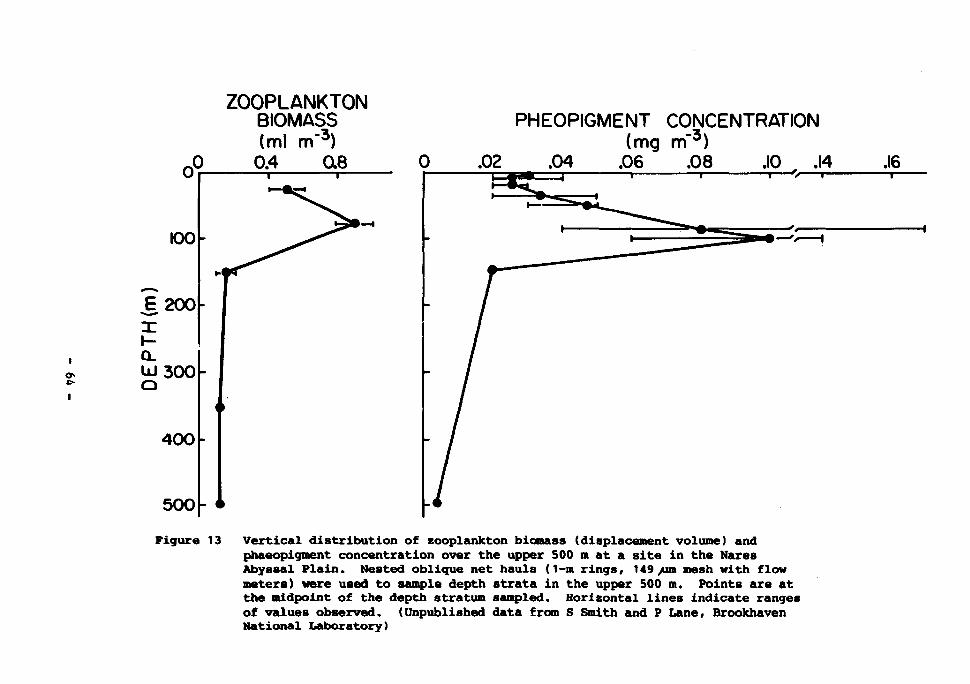
ZOOPLANKTON BIOMASS (ml m"3)
PHEOPIGMENT CONCENTRATION (mg m"3)
400-
500- *
Figure 13 Vertical distribution of zooplankton biomass (displacement volume) and phaeopigment concentration over the upper 500 m at a site in the Nares Abyssal Plain. Nested oblique net hauls (1-m rings, 149/im mesh with flow meters) were used to sample depth strata in the upper 500 m. Points are at the midpoint of the depth stratum sampled. Horizontal lines indicate ranges of values observed. (Unpublished data from S Smith and P Lane, Brookhaven National Laboratory)
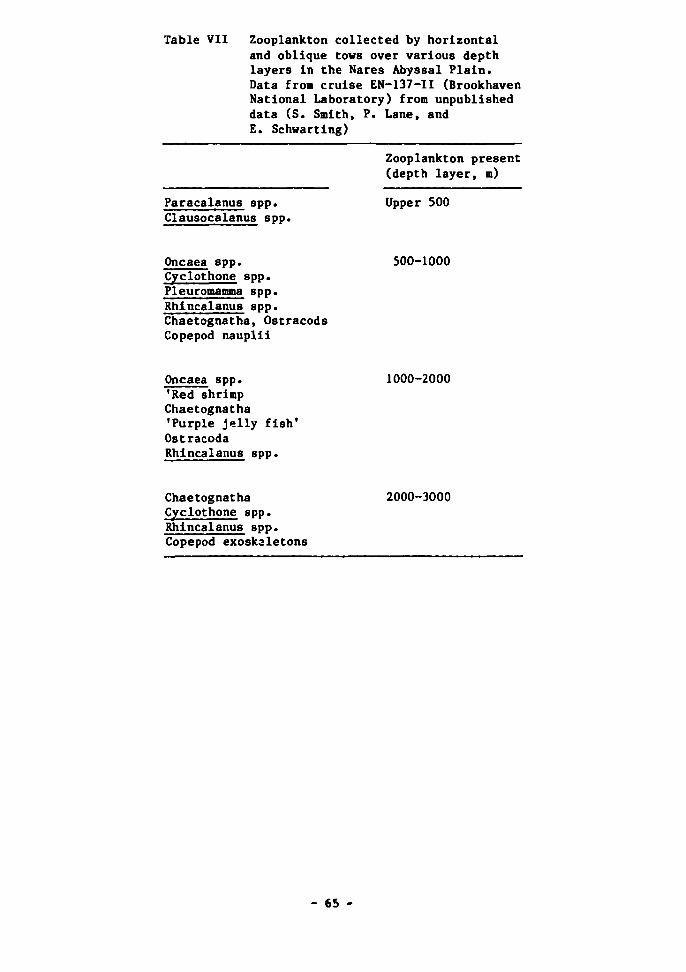
Table VII Zooplankton collected by horizontal and oblique tows over various depth layers in the Nares Abyssal Plain. Data from cruise EN-137-11 (Brookhaven National Laboratory) from unpublished data (S. Smith, P. Lane, and E. Schwarting)
Zooplankton present (depth layer, m)
Paracalanus spp. Upper 500 Clausocalanus spp.
Oncaea spp. 500-1000 Cyclothone spp. Pleuromamma spp. Rhincalanus spp. Chaetognatha, Ostracods Copepod nauplii
Oncaea spp. 1000-2000 'Red shrimp Chaetognatha •Purple jelly fish* Ostracoda Rhincalanus spp.
Chaetognatha 2000-3000 Cyclothone spp. Rhincalanus spp. Copepod exoskaletons
- 65 -
The biomass of benthic organisms in and on the sediment was measured
across a spectrum of sizes, ranging from bacteria to macrofauna, using a
variety of techniques (Schwinghamer, 1985). The biomass spectrum is typically
trimodal with biomass peaks in the bacterial, meiofaunal, and macrofaunal size
ranges (Figure 14). Levels of benthic biomass, however, were very low in
these modal ranges. Bacterial biomass was approximately l/10th, and meio- and
macrofaunal biomasses are approximately l/100th of values typical of similar
sediments (i.e., silt-clay, organic carbon content < 1Z of dry weight) in
temperate shelf and coastal areas.
Direct counts of bacteria (Table VIII) after staining with acridine
orange and mithramycin indicated that cocci and pseudomonad-shaped organisms
of approximately 0.5 um median diameter were the predominant bacteria types.
Incubation on deck at ^n situ temperatures with INT (Zimmerman e£ al., 1978)
showed that only 2.9% to 5.4% of the total number of fluorescent bacteria
counted were actively respiring under these conditions (P. Schwinghamer,
unpublished data). If this proportion is correct, then of the mean standing
stock of bacteria (8 cm3 m~2 wet volume or ~ 0.6 g C m to 10 cm depth),
about 17 to 32 mg bacterial C was active.
The biomass of metazoan meiofauna, consisting mostly of nematodes of a
few typical deep ocean genera (Warwick ar..i Schwinghamer, 1986), had a mean
value of 0.1 cm3 m~2 or 8 mg C m~2. Foraminifera were dominated numerically
by Komokiacea but the agglutinated genus Aschemonella had a very patchy
distribution, accounting for over 90% of the biomass in some box core quadrats
and 0% in most. The biomass of living foraminifera was estimated by staining
with rose bengal and breaking open a representative selection of stained ani
mals. An average of less than 10% of the stained tests contained stained
cyLOplasm. The mean biomass of foraminifera was 1.3 cm m~2 wet volume, but
it ranged from 0 to 3.95 cm"3 m . Foraminifera span the meiofaunal and
smaller macrofaunal size ranges and were the only commonly observed protozoans
in these sediments.
A separate investigation of agglutinated foraminifera in surficial sedi
ments from the Nares Abyssal Plain was conducted during a cruise by TYRO (the
Netherlands) in 1984 (Kuijpers, 1985). Schroder (1985) described the predomi
nant species obtained In undisturbed surface sediment taken by box core. The
- 66 -
benthic foraminiferal assemblage consisted entirely of agglutinated species
(98 to 100%) indicating an environment below the calcium compensation depth
(CCD). The dominant species were Rhizammina algaeformis, Saccorhiza ramosa,
Reophax spp., Haplophragmoides trullissata, Adercotryma glomerata,
Ammobaculites agglutinans var. filiformis, and Ammomarginulina foliacea. The
relic calcareous assemblage, with many poorly preserved, broken or severely
corroded specimens - Epistominella umbonifera, Epistominella exigua, Eponldea
pusillus, Eponides tumidulus, Ophthalmidium acutimargo, Pullenia bulloides,
and Pullenla osloensis. In one box core, 10% of the assemblage at the surface
were calcareous foraminifera but surficial sediment was lost from this sample.
This exposed the relic assemblage a few centimetres below the sediment sur
face; the faunal change indicates that these sediments were above the CCD
during the early Holocene.
Surface water from box cores was sieved through 63 um sieves (Schroder,
1985). The residue retained on sieves contained a rich fauna of species
belonging to the superfamily Komokiacea (Tendal and Hessler, '977). The pre
sence of abundant foraminifera and kumoklaceans in surficial sediments at the
Nares sites sampled could explain the very low macrofaunal biomass observed.
Box cores only sampled the smallest, numerically moot abundant macrofauna.
The biomass ranged from 0 to 0.3 cm m with a mean of 0.1 cm m or
~ 8 mg C m , exclusive of foraminifera. The bivalve mollusc Malletia polita
dominated the metazoan macrofauna, with a single unidentified amphipod and
harpacticoid being the only other individuals recovered in the box cores.
Macrofauna were also collected during three tows of epibenthic sleds over a
total of 7.8 km distance (an area of 5 800 m 2 ) . Bottom distance travelled was
measured by rotation of a spoked wheel and by recording from a tilt-switch
pinger mounted on the towing cable. Again, bivalve molluscs dominated the
catch. Five species were identified by Linda Morse-Porteous of WH0I. They
are Kelliella nitida, Propeamussium poss. squamigerus(?), Malletia polita,
Pseudotindaria erebus, and Spinula nr. scheltemai. Sled samples cannot be
considered as quantitative (Schwinghamer, 1985), but based on the area covered
by the sled tows, the abundance of these animals is approximately 5 indivi
duals/1 000 tn . An estimate of the biomass of large, surface dwelling macro-
fauna was made using a series of bottom photographs covering a total area of
304 m . T.ne organisms were identifiable as an anemone, an annelid, and two
- 67 -
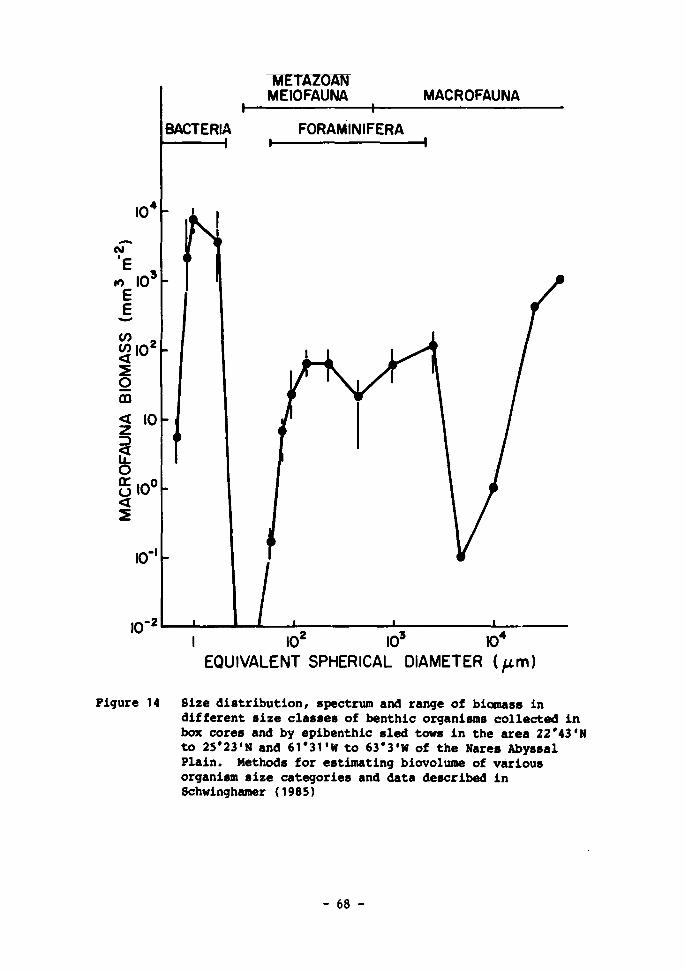
^ETAZOAR MEIOFAUNA MACROFAUNA
FORAMINIFERA
I 10' 10" 10 EQUIVALENT SPHERICAL DIAMETER (yum)
Figure 14 Size distribution, spectrum and range of biomass in different size classes of benthic organisms collected in box cores and by epibenthic sled tows in the area 22'43'D to 25'23'N and 61'31'W to 63'3'W of the Nares Abyssal Plain. Methods for estimating biovolume of various organism size categories and data described in Schwinghamer (1985)
- 68 -
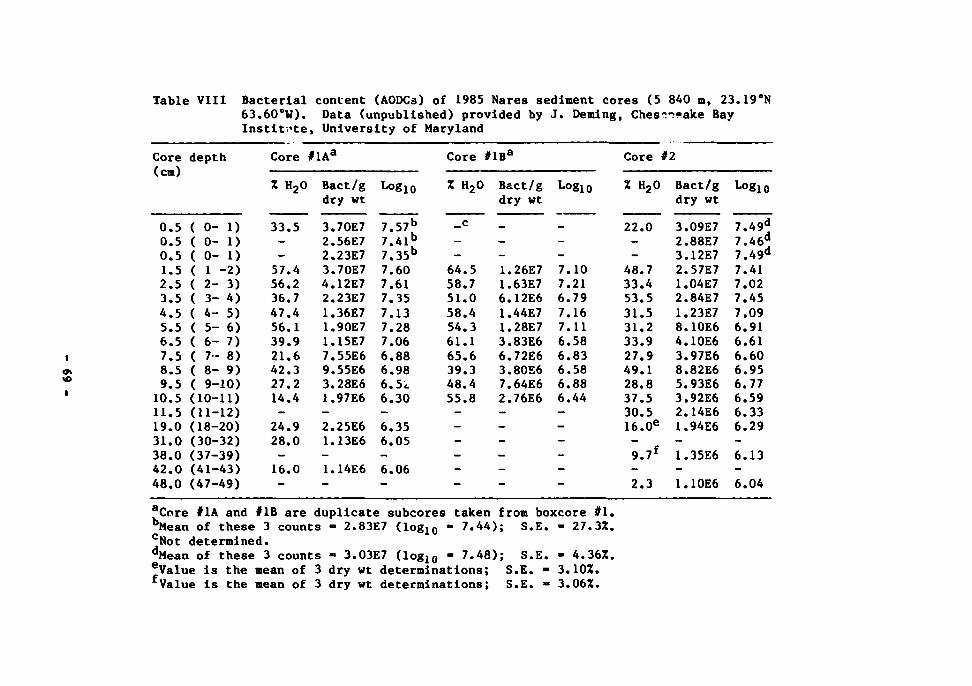
Table VIII Bacterial content (AODCs) of 1985 Nares sediment cores (5 840 m, 23.19°N 63.60°W). Data (unpublished) provided by J. Deming, Ches-^sake Bay Institute, University of Maryland
1
Ot
w 1
Core (cm)
0.5 0.5 0.5 1.5 2.5 3.5 4.5 5.5 6.5 7.5 8.5 9.5 10.5 11.5 19.0 31.0 38.0 42.0 48.0
depth
( 0- 1) ( 0- 1) ( 0- 1) ( 1 -2) ( 2- 3) ( 3- 4) ( 4- 5) ( 5- 6) ( 6- 7) ( 7- 8) ( 8- 9) ( 9-10) (10-11) (11-12) (18-20) (30-32) (37-39) (41-43) (47-49)
Core
X H20
33.5 --57.4 56.2 36.7 47.4 56.1 39.9 21.6 42.3 27.2 14.4 -24.9 28.0 -16.0 —
#lAa
Bact/g dry wt
3.70E7 2.56E7 2.23E7 3.70E7 4.12E7 2.23E7 1.36E7 1.90E7 1.15E7 7.55E6 9.55E6 3.28E6 1.97E6 -2.25E6 1.13E6 -1.14E6 -
Logl0
7.57b
7.41b
7.35b
7.60 7.61 7.35 7.13 7.28 7.06 6.88 6.98 6.5i 6.30 -6.35 6.05 -6.06 -
Core
X H20
_c
--64.5 58.7 51.0 58.4 54.3 61.1 65.6 39.3 48.4 55.8 ------
#lBa
Bact/g dry wt
---1.26E7 1.63E7 6.12E6 1.44E7 1.28E7 3.83E6 6.72E6 3.80E6 7.64E6 2.76E6 ------
Log10
---7.10 7.21 6.79 7.16 7.11 6.58 6.83 6.58 6.88 6.44 -----—
Core #2
X H20
22.0 --48.7 33.4 53.5 31.5 31.2 33.9 27.9 49.1 28.8 37.5 30.5 16.0e
-9.7f
-2.3
Bact/g dry wt
3.09E7 2.88E7 3.12E7 2.57E7 1.04E7 2.84E7 1.23E7 8.10E6 4.10E6 3.97E6 8.82E6 5.93E6 3.92E6 2.14E6 1.94E6 -1.35E6 -1.10E6
Log10
7.49d
7.46d
7.49d
7.41 7.02 7.45 7.09 6.91 6.61 6.60 6.95 6.77 6.59 6.33 6.29 -6.13 -6.04
fCore #1A and #1B are duplicate subcores taken from boxcore #1. ''Mean of these 3 counts - 2.83E7 (log10 - 7.44); S.E. - 27.3X. cNot determined. dMean of these 3 counts - 3.03E7 (log10 - 7.48); S.E. - 4.36%. ®Value is the mean of 3 dry wt determinations; S.E. - 3.10Z. Value is the mean of 3 dry wt determinations; S.E. » 3.06%.
heart urchins and their biomass totalled 263 cm or ~ 21 g C (0.86 cm m or
47 mg C m " 2 ) .
The exceptionally low values of macrofauna biomass require comment. As
mentioned above, volumes of meio- and macrofauna are two orders-of-magnitude
lower than values observed in coastal shelf sediments. This would be expected
in an oligotrophic area such as the Nares Abyssal Plain (Sokolova, 1972). The
impoverished fauna contrasts with even the most oligotrophic North Pacific
(Hessler and Jumars, 1974) where polychaetes dominate the macrofauna.
Numerous studies of macrofauna distribution in the deep sea have shown
that polyc.aetes generally comprise > 50% of the numbers of individuals col
lected in box cores (Hessler and Jumars, 1974; Gage, 1979; Laubier and
Sibuet, 1979; Carey, 1981). The low food supply to benthic fauna in the
Nares Abyssal Plain may prevent populations of suspension feeding polychaetes
from becoming established. This could explain why high standing crops of
polychaetes occur in sediments at hadal depths of trenches where bathymetry
and currents maintain a supply of particulate organic matter (Jumars and
Hessler, 1976).
The possibility that benthic fauna in box cores, collected in the Nares
sites, were not adequately sampled is unlikely. The complete contents of box
cores to 30 cm depth were sieved to ensure that deep burrowing fsuna would be
collected and supernatant water was decanted by siphon to collect resuspended
fauna; thus all macrofauna present was sampled. Meiofauna, collected by
flotation, overlapped the macrofauna size range and no polychaetes were obser
ved. The small number of box cores collected however, and the patchy distri
bution of fauna, limit generalization of the results, especially for estimates
of biomass of larger sized organisms. Collection of one individual of the
mollusc Malletia, had an additional box core been taken, for example, would
double the estimate of macrofauna biomass. Sufficient samples were obtained,
however, to show that infauna biomass in the cores taken was dominated by the
foraminifera Aschemonella with numerical dominance of the much smaller
komokiaceans.
Baited traps with video and time-lapse photographic cameras were deployed
at various heights up to 100 m above the bottom over periods of up to several
- 70 -
days during both ENDEAVOR (USA) and HUDSON (Canada) cruises. Lysianassid
amphipods (Eurythenes gryllus) were only photographed and trapped within 15 m
of the bottom.
At least four different taxa of fish were photographed during the
ENDEAVOR cruise: two ophidiid fishes (Apagesoma edentatum, Barathrites iris),
a macrourid (Coryphanoides armatus) and one unidentified species (personal
communication, D. Stein, Oregon State University). Large penaeid shrimps were
also present in photographs. Numbers of individuals at or near the bait
ranged from 0-32 ophidiids and 0-4 shrimps.
D. Stein provided unpublished data to show that shrimp appeared first in
the time series photographs. Their numbers decreased as fish abundance
increased, then increased again as numbers of fish declined. Numbers of ophi
diids were much greater than numbers of macrourids. Neither ophidiid nor
shrimp abundances were significantly related to current velocity (r = 0.22 for
number of individual ophidiids vs. current velocity). Numbers of fish peaked
when current speed was low or increasing. The short period of observation
(51 hours), however, precluded further statistical analyses. Fish traps using
yellowfin tuna as bait were deployed during the ENDEAVOR cruise. Only one
fish was caught, an Apagesoma edentatum (Family Ophidiidae) 410 mm standard
length, confirming the photographic evidence that this species was present.
Estimates of abundance of scavengers attracted to bait can be made based
on arrival rates and plume models of eddy diffusion (Sainte-Marie and
Hargrave, 1986). Odour from bait is assumed to spread through either an
ellipsoid or elongated plume depending on dispersion by tidal currents mea
sured at the depth of baited trap exposure. Current speeds between 2 and
7 cm s were measured 10-15 m above the bottom during the HUDSON cruise.
Estimates of abundance for scavenging fish, based on model calculations, vary
between 15 and 63 individuals 1 000 m~3. Calculations for large mobile
amphipods such as E_. gryllus varied from 0.1 to 1 individual 1 000 m~2
depending on assumptions of rates and pathways of odour dispersion and
behavioural responses of animals.
Sediment traps were deployed in the Nares Abyssal Plain at various depths
during three separate studies since 1983 (Table IX). The upward flux of
- 71 -
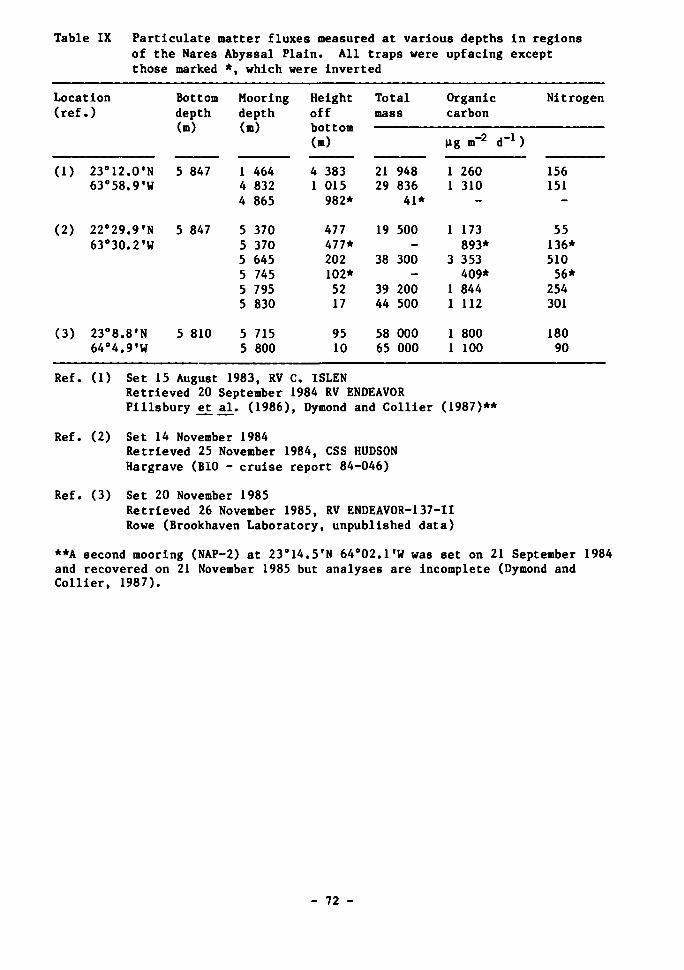
Table IX Particulate matter fluxes measured at various depths in regions of the Nares Abyssal Plain. All traps were upfacing except those marked *, which were inverted
Location (ref.)
(1) 23°12.0,N 63°58.9'W
(2) 22°29.9'N 63°30.2'W
(3) 23°8.8'N 64°4.9'W
Bottom depth (m)
5 847
5 847
5 810
Mooring depth On)
1 4 4
5 5 5 5 5 5
5 5
464 832 865
370 370 645 745 795 830
715 800
Height off bottom (m)
4 383 1 015
982*
477 477* 202 102* 52 17
95 10
Total mass
21 29
19
38
39 44
58 65
948 836 41*
500 -
300 -
200 500
000 000
Organic carbon
ug m"2 d"1 )
1 1
1
3
1 1
1 1
260 310 -
173 893* 353 409* 844 112
800 100
Nitrogen
156 151 -
55 136* 510 56* 254 301
180 90
Ref. (1) Set 15 August 1983, RV C. ISLEN Retrieved 20 September 1984 RV ENDEAVOR Pillsbury et al. (1986), Dymond and Collier (1987)**
Ref. (2) Set 14 November 1984 Retrieved 25 November 1984, CSS HUDSON Hargrave (BIO - cruise report 84-046)
Ref. (3) Set 20 November 1985 Retrieved 26 November 1985, RV ENDEAVOR-137-11 Rowe (Brookhaven Laboratory, unpublished data)
**A second mooring (NAP-2) at 23C14.5'N 64°02.1'W was set on 21 September 1984 and recovered on 21 November 1985 but analyses are incomplete (Dymond and Collier, 1987).
- 72 -
buoyant particles In terms of mass was three orders of magnitude smaller than
the settling flux measured by Dymond and Collier (1987). Organic content was
not determined in these samples, which were collected over four periods of 78
days and one period of 91 days. Hargrave's measurements, on the other hand,
over a short time period (7.3 days) compared organic carbon and nitrogen
fluxes in both vertical directions. Buoyant fluxes of organic particles
varied from 25 to 67% of the downward fluxes. Dymond and Collier (1987)
observed no apparent relationship between the downward and upward flux of
aluminium nor between the downward organic carbon flux and upward bulk flux.
Data in Table IX also show that particulate organic carbon deposition rates
did not vary with height up to 4 383 m off bottom (range of 1.1 to 3.4 mg C
m d ). However, total mass deposition was greater below 100 m above the
bottom (average 51.7 mg m 'd ) compared with that measured at distances
between 200 and 4 383 m above bottom (27.4 mg m~2 d - 1 ) . The average mass flux
at 4 832 m, which is far enough above bottom to minimize input from a nephe-
loid layer, was 10.9 g m a and 0.48 g C m-2 a-1. These values are similar
to the lowest values in the range of rates (11-33 g m~2 a-1 and 0.5-3.0 g C
m aT ) derived from empirical equations relating phytoplankton production
and water depth to particle sedimentation for areas of the south-west part of
the North Atlantic Ocean at 4 450 m depth (Hargrave, 1985a). The values are
characteristic of oligotrophic ocean areas at abyssal depths > 4 000 m, and
they reflect the low productivity of the sites in NAP where moorings were
placed (Dymond and Collier, 1987).
These estimates of particulate organic carbon deposition may be compared
with In situ measurement of sediment oxygen uptake. The comparison allows
calculation of some terms of a carbon budget for benthic communities (Rowe e_t
al., 1986a). An incubation technique similar to that described by Patching et
al. (1986) was adopted, except that box cores rather than a multiple corer
were used to obtain sediment for incubation. The 0.25 nr box corer used for
sampling benthic fauna on HUDSON 84-046 had a detachable spade which permitted
removal of sediment-filled boxes on retrieval. Sediment surfaces in box cores
were relatively undisturbed, as shown by the presence of burrow openings and
tracks caused by bioturbatlon. Several plexiglass cores (25 cm2) about 15 cm
length were pushed approximately 10 cm into the sediment and left in place in
the box.
- 73 -
Filtered sea water was carefully siphoned to fill completely each core.
Two cores were left untreated and two were enriched to examine the effect of
added organic matter on community oxygen uptake. Pieces (approximately 2 g)
of sterile sardines, stored in sealed containers flushed with ethylene oxide
(10%) in CO2 (90%) before incubations, were placed on the surface sediment in
each core. Initial samples for dissolved oxygen determined by a micro-Winkler
method were removed by syringes and cores were capped to avoid air spaces.
The box core was covered and placed in a metal support frame attached to
a subsurface float, a disposable anchor and a transponding acoustic release.
The array descended gently (approximately 1 m s~M to the bottom to moor the
box core in its frame 10 m above the bottom at 5 837 m. Two deployments were
carried out between 17 and 28 November 1984 with a third box incubated in an
insulated water-cooled box on deck at 6°C-7.5°C.
Some major limitations of the incubation technique are discussed by
Patching et^ al_. (1986). The water was not stirred in cores and lack of circu
lation during prolonged incubation over a few days could cause oxygen deple
tion at the sediment surface; however, benthic macrofauna and meiofauna were
present and presumably bioturbation in cores would prevent severe oxygen
depletion at the sediment surface. Agitation causing sediment disturbance
during mooring operations did not disturb sediment because supernatant water
in cores was cl - wichout resuspended particles on retrieval.
Rates of oxygen uptake measured in earlier iji situ studies in the North
western Atlantic at depths up to 5 200 m varied from 0.01 to 0.11 ml 02
m - 2 h - 1 (Smith, 1978). Data obtained from experimental incubations in the
Nares Abyssal Plain without enrichment are on average an order of magnitude
greater. However, the comparison does not account for seasonal increases that
might be expected following sedimentation of material produced during phyto-
plankton blooms which contribute fresh supplies of organic matter to benthic
communities and stimulates respiration (Smith and Baldwin, 1984,:; Patching e£
al., 1986). The order of magnitude increase in oxygen uptake when organic
matter was added to Nares Abyssal Plain sediment (Table X) shows that a rapid
response in respiration is possible. The unenriihed values correspond to a
carbon loss through respiration (assuming a respiratory quotient of 1.0) of
0.2 to 0.5 g C m"2 a"1 (Rowe £££!.•, 1986) if all oxyjen consumed was used for
- 74 -
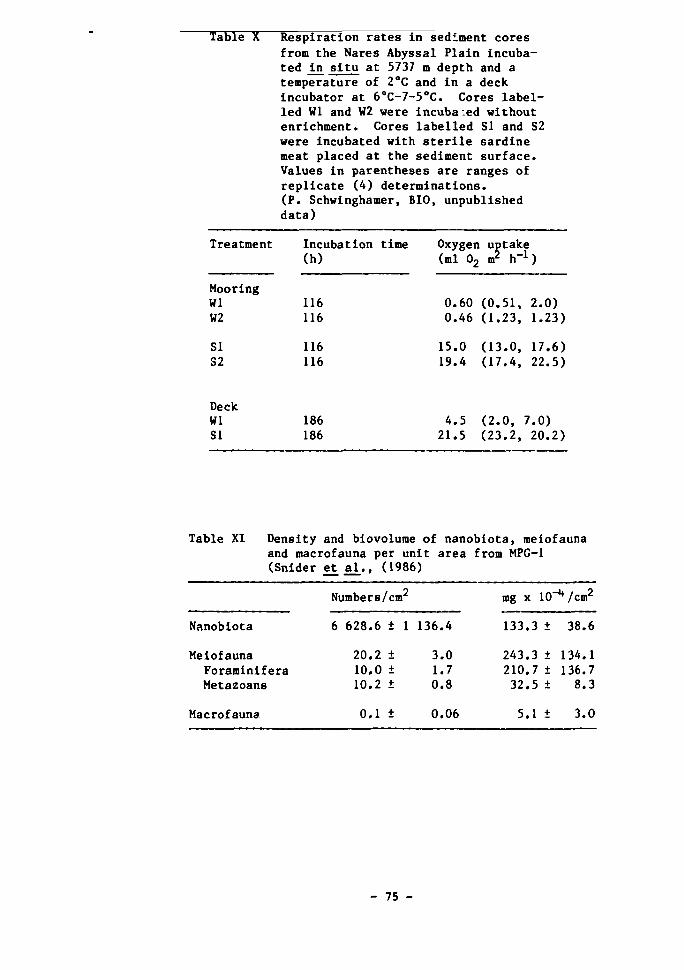
Table X Respiration rates in sediment cores from the Nares Abyssal Plain incubated n situ at 5737 m depth and a temperature of 2°C and in a deck incubator at 6°C-7-5°C. Cores labelled Wl and W2 were incubated without enrichment. Cores labelled SI and S2 were incubated with sterile sardine meat placed at the sediment surface. Values in parentheses are ranges of replicate (4) determinations. (P. Schwinghamer, BIO, unpublished data)
Treatment
Mooring Wl W2
SI S2
Deck Wl SI
Incubation time (h)
116 116
116 116
186 186
Oxygen uptake (ml 02 m
2 h _ 1)
0.60 (0.51, 2.0) 0.46 (1.23, 1.23)
15.0 (13.0, 17.6) 19.4 (17.4, 22.5)
4.5 (2.0, 7.0) 21.5 (23.2, 20.2)
Table XI Density and biovolurae of nanobiota, meiofauna and macrofauna per unit area from MPG-1 (Snider e£ al_., (1986)
Nanobiota
Numbers/cm2
6 628.6 ± 1 136.4
mg x 10"^/cm2
133.3 ± 38.6
Meiofauna Foraminifera Metazoans
20.2 ± 3.0 10.0 ± 1.7 10.2 ± 0.8
243.3 ± 134.1 210.7 ± 136.7
32.5 ± 8.3
Macrofauna 0.1 ± 0.06 5.1 ± 3.0
- 75 -
oxidation of organic matter to C02. The rates are in general agreement with
those measured for annual particulate organic carbon supply in the Nares
Abyssal Plain region (Table XII).
Hatteras Abyssal Plain
A brief visit to this site was made by C. Ingram (Scripps Institution of
Oceanography, USA) on an RV ENDEAVOR - University of Rhode Island - cruise in
May 1982 (EN-084) (Hessler and Ingram, 1986). The study area was E-N2,
36-37°N, 71-72°30'W, 4 200 m. The objective was to deploy traps which had
previously been deployed in the Pacific (MPG-1) in order to sample the amphi-
pod populations of this area. Both funnel traps and hoop traps were used.
The hoop net was designed to trap the entire assemblage of organisms
which respond to a bait fall and thus eliminate the biases inherent in any
funnel trap. For example, inter- or intraspecific behavioural interactions
would be more likely to result in disproportionate representation of species
in a relatively small, confined space (the funnel trap) than in a relatively
large, open space (the hoop net trap). By approximating a natural bait fall,
it was hoped to obtain samples representative of the natural population.
Although it does not eliminate interspecific avoidance, the hoop net trap has
been particularly successful for trapping amphipods, copepods, and fish.
Four funnel-trap stations and 3 hoop-net stations were recovered. Three
of the predominant species caught were the same as those caught in the
Pacific: Paralicella caperesca, Orchomene gerulicorbis, and Eurythenes
gryllus. An additional genus which is uncommon at MPG-1, but common at E-N2
was Cyclocarls. The numbers caught for all species were much less than at
MPG-1. Also, the primary vertical distribution of £. gryllus appeared to be
within the bottom 10 m rather than the bottom 50 m.
Even though the numbers of amphipods caught were low, it does not appear
that this is an area lov; in mobile scavengers. The 1-2 kg of mackerel used as
bait in the hoop nets was gone in 11 h in one case and 17 h in another, while
the hoop net left for 4 h on the bottom returned with the bait barely touched
and a Coryphaenoides armatus(?) in addition to some amphipods. It is likely
- 76 -
that fish or other scavengers consumed the bait rapidly and then left the
immediate area.
Pacific Ocean sites
Studies on Pacific sites have been primarily directed towards processes
and rates rather than detailed faunal studies of biomass, with the exception
of MPG-1. The following is a brief summary.
MPG-1
The MPG-1 area is located (Figure 4) approximately 1 100 km north of
Hawaii and is characteristic of the North Pacific Ocean's abyssal hill, red-
clay, province. The following information on its biology has been obtained
from a report by Snider e± £l. in Sandia Report - SAND85-1037 (1986). Four
stations were selected: H261, 30°4.4'N 157°43.3'W, 5 821 m; H271, 30°7.4»N
157*52.9'W, 5 874 m; H284, 32°1.4'N 157°50.7'W, 5 831 m; H288, 30°53.0'N
157°51.9'W, 5 853 m, located by satellite navigation combined with computeri
zed dead reckoning. In this region the ocean floor lies 5.7 km under oligo
trophy surface waters and is characterized by low relief hills consisting of
red clay sediments with manganese nodules. Currents in the benthic boundary
layer average 2 cm s and rarely exceed 5 cm s . Temperature and salinity
are 1.60°C and 34.69°/oo, respectively.
Samples were obtained with a 0.25 m2 box corer. Even in calm seas, this
corer would cause some sample disturbance at such depths. For this reason,
subsamples taken after the corer is on deck may have serious artifacts. To
avoid this, small corers were attached to the core box so that subsamples were
taken as the corer entered the bottom. Fine surface detail and clarity of
va'-.er in the subcore, even when top water in the rest of the corer was cloudy,
documented the success of this technique.
Subsamples were taken either with round acrylic tubes (1.9 cm ID), or
with square tube arrays, made of nine 2.15 cm ID acrylic tubes. Subsamples
under ferromanganese nodules had to be taken on deck. A large nodule was
- 77 -
carefully lifted without disturbing sediment.The nodule, with some adhering
sediment, was then placed in a plastic bag with an equivalent volume of
fixative. The impression left by the nodule in the sediment was sampled by
1.55 cm ID square acrylic tubes, which were individually inserted into the
sediment in a contiguous array.
In the study, meiofauna were regarded as those organisms which belong to
taxa whose members are typically meiofaunal in size (Hessler and Jumars,
1974), and in this abyssal habitat the majority of meiofaunal organisms pass
through a 300 um screen. Meiofaunal organisms included foraminifera, nema
todes, harpacticoid copepods, tardigrades, ostracods, kinorynchs and gastro-
trichs. Macrofaunal organisms included polychaetes, protobranchs, 'other'
copepods and isopods.
All the samples were stained in a solution of Rose Bengal for 24 h and
then passed through nested screens: 300, 150 and 42 um mesh. As a means of
estimating the biomass of foraminifera, the dimensions of both the individual
test and the stained protoplasm inside it were measured using a camera lucida.
Volumes were calculated using geometric formulae for equivalent cylinders,
cones, and spheres. Biomass was calculated from biovolume using a conversion
factor of 1.02 g cm (density of sea water at 25°C and 1 atm. pressure). A
crude minimum estimate of foraminiferan abundance was made by assuming frag
ments of similar types within a depth layer and in adjacent layers to be from
one individual.
The biovolume of metazoan meiofauna and macrofauna was also estimted
using external dimensions and geometric formulae. A conversion factor of
1.02 g cm-3 again was used to convert biovolume to biomass for all metazoans
except nematodes, where a calculated conversion factor of 1.13 g cm exists
(Weiser, 1960). Biovolumes were calculated for 6 of the 18 acrylic round tube
samples sorted for meiofauna and macrofauna. Estimates were also made for
nanobiota. These were regarded as microorganisms in the size range of
2-42 um. Techniques for their quantitative assessment were given in Burnett
(1977, 1979, 1981). During the 1981 study it was found that it was necessary
to score 'small' nanobiota 2-10 um and 'large' nanobiota (10-42 um)
separately.
- 78 -
The prokaryote nanobiota assemblage was dominated by heavy staining
microspheroids. Eukaryote nanobionts were mainly flagellates and amoebae
(Burnett, 1979). Numerically, the meiofauna was composed of 49.5% foramini-
fera and 50.5% metazoa. However, the foraminiferans made up 87.3% of the
meiofaunal biovolume. The macrofauna consisted of polychaetes (69% numeri
cally, 44% biovolume), calanoid copepods (15%, 15%), protobranchs (8%, 18%)
and isopods (8%, 23%). These organisms were primarily juveniles.
Density and biovolume data are given in Table XI. Biovolume calculations
were converted into biomass estimates using conversion factors given above.
Foraminifera dominated these samples, making up fully 55.2% of the total bio
mass of all size classes of identifiable organisms. Nanobiota also made a
substantial contribution (34.9%) to this total, while metazoan meiofauna and
macrofauna accounted for very little (8.5% and 1.3%, respectively).
The results indicate that the abundance and biomass of both nanobiota and
meiofauna are much greater than those of macrofauna; foraminifera appear to
be particularly important. Their vertical distribution is also of interest.
More than 90% of the biovolume of the nanobenthos was concentrated in the
upper 3.5 cm of sediment, and the greatest density was at the sediment-water
interface. Similarly, more than 90% of all meiofauna was found within 2 cm of
the sediment-water interface, although in this case a significant concentra
tion was not found in the upper few mm of sediment.
With regard to the macrofauna, higher densities weie found for macro-
faunal taxa (1 370 ± 630 m~2 for round tubes and 1 070 ± 710 m~2 for the
square tube array) than those reported by other workers from the central North
Pacific. This was because macrofauna were defined by taxa, not size, thus
including polychaete larvae and other organisms which passed through the
300 um mesh screen (i.e., temporary meiofauna). Considering only macrofauna
> 300 um, densities of 590 ± 417 m~2 from the round tubes and 176 ± 160 m~2
were obtained from the square tube arrays. The high standard errors associa
ted with these values were due to the small size of the ^n situ cores, which
usually sampled one or two raacrofaunal organisms. These cores have a limited
ability to average accurately over large areas. Nevertheless, the densities
of macrofauna > 300 urn compare reasonably well with Hessler and Jumar's (1974)
estimate of 114 ± 8 raacrofaunal organisms m~2 at CLIMAX II. K. L. Smith
- 79 -
(pers. comm.) obtained 185 ± 54 m~2 from MPG-1 in 1978 and 584 ± 90 m~2 in
1979, but included large nematodes and harpacticoid copepods that were
retained on his smallest screen (300 um). A density of 109 ± 44 m-2 can be
calculated from his data when the meiofaunal organisms are removed. The esti
mate of macrofaunal density, in this study using only those > 300 um, agrees
reasonably well with all the above calculations. The data also indicate that
most of the organisms belonging to macrofaunal taxa in the MPG-1 area are
juveniles, and easily pass through a 300 um mesh screen.
Macrofaunal biomass (0.0005 ± 0.0003 mg cm-2 for acrylic round tubes and
0.0004 ± 0.0003 mg cm~2 for the square tube array) was much smaller than that
seen by K. L. Smith (pers. comm.) in the same area (0.005 ± 0.002 mg cm~2 in
1978 and 0.002 ± 0.001 mg cm-2 in 1979) despite the higher numerical densi
ties. Subtracting the biomass of meiofaunal organisms from his 1978 data only
lowers the estimate to 0.004 mg cm-2. The order of magnitude difference
between the estimates in this study and those of K. L. Smith can probably be
attributed to the small 3ize of the macrofauna, and to the small size of samp
lers, which would tend to miss larger and less common organisms.
Studies in the Pacific have paid particular attention to estimates of
deep-sea mobile organisms which could effect both vertical and horizontal
transport of radionuclides. Included in such studies have been comparisons of
catching methods, such as that described by Hessler and Ingram (1986). Two
traps were used: hoop net and funnel traps. A comparison of the catch of -he
predominant amphipods (Paralicella tenuipes, J?, caperesca, and Orchomone
gerulicorbis) was made on the sediment surface at MPG-1. The primary diffe
rence in the catch between them was the numerical variance. Numbers of indi
viduals in the funnel traps varied by 3 orders of magnitude, indicating very
patchy distributions, compared with a similar catch level in all three hoop
nets. This contrast was probably a result of differences in the areal cover
age of the odour plumes from the two types of traps, and thus the relative
volume from which the amphipods were drawn. However, when the hoop net was
deployed at 20 m above the sediment there were indications that it was not
trapping the same as the funnel traps. The average catch in the funnel traps
for this locality (31°N 159°W) did not differ between years (1978,
x - 28.33; 1979, x - 30.15), but the average catch for the two hoop nets
was higher (x « 46). This may have been due to the larger amount of bait,
- 80 -
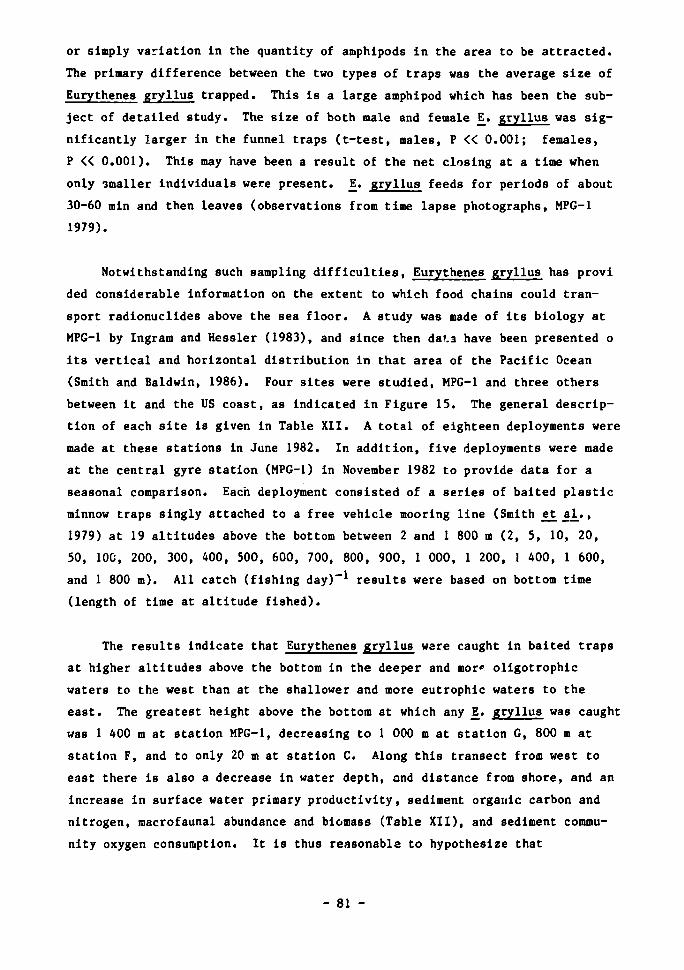
or simply variation in the quantity of amphipods in the area to be attracted.
The primary difference between the two types of traps was the average size of
Eurythenes gryllus trapped. This is a large amphipod which has been the sub
ject of detailed study. The size of both male and female E. gryllus was sig
nificantly larger in the funnel traps (t-test, males, P « 0.001; females,
P « 0.001). This may have been a result of the net closing at a time when
only smaller individuals were present. E_. gryllus feeds for periods of about
30-60 rain and then leaves (observations from time lapse photographs, MPG-1
1979).
Notwithstanding such sampling difficulties, Eurythenes gryllus has provi
ded considerable information on the extent to which food chains could tran
sport radionuclides above the sea floor. A study was made of its biology at
MPG-1 by Ingram and Hessler (1983), and since then dat.a have been presented o
its vertical and horizontal distribution in that area of the Pacific Ocean
(Smith and Baldwin, 1986). Four sites were studied, MPG-1 and three others
between it and the US coast, as indicated in Figure 15. The general descrip
tion of each site is given in Table XII. A total of eighteen deployments were
made at these stations in June 1982. In addition, five deployments were made
at the central gyre station (MPG-1) in November 1982 to provide data for a
seasonal comparison. Each deployment consisted of a series of baited plastic
minnow traps singly attached to a free vehicle mooring line (Smith et al.,
1979) at 19 altitudes above the bottom between 2 and 1 800 m (2, 5, 10, 20,
50, 100, 200, 300, 400, 500, 600, 700, 800, 900, 1 000, 1 200, I 400, 1 600,
and 1 800 m). All catch (fishing day) - 1 results were based on bottom time
(length of time at altitude fished).
The results indicate that Eurythenes gryllus were caught in baited traps
at higher altitudes above the bottom in the deeper and mor» oligotrophic
waters to the west than at the shallower and more eutrophic waters to the
east. The greatest height above the bottom at which any Z. gryllus was caught
was 1 400 m at station MPG-1, decreasing to 1 000 m at station G, 800 m at
station F, and to only 20 m at station C. Along this transect from west to
east there is also a decrease in water depth, and distance from shore, and an
increase in surface water primary productivity, sediment organic carbon and
nitrogen, macrofaunal abundance and biomass (Table XII), and sediment commu
nity oxygen consumption. It is thus reasonable to hypothesize that
- 81 -
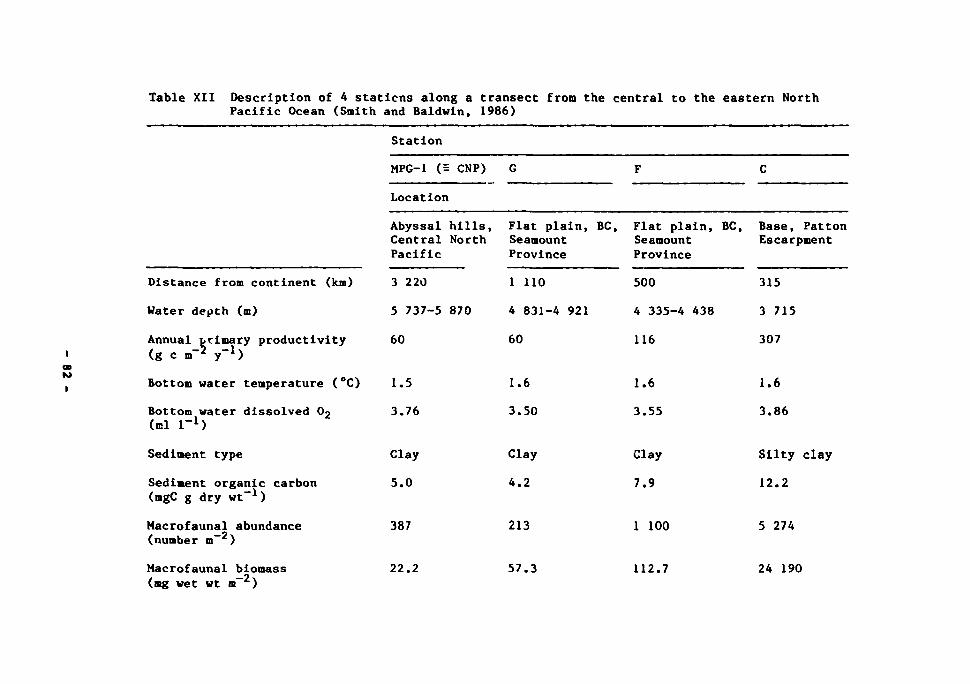
Table XII Description of 4 stations along a transect from the central to the eastern North Pacific Ocean (Smith and Baldwin, 1986)
Station
OB
MPG-1 (H CNP)
Location
Abyssal hills, Flat plain, BC, Flat plain, BC, Base, Patton Central North Seamount Seamount Escarpment Pacific Province Province
Distance from continent (km)
Water depth (m)
Annual primary productivity (g c m"2 y"1)
Bottom water temperature (°C)
Bottom water dissolved 02
(ml 1_1)
Sediment type
Sediment organic carbon (mgC g dry wt-1)
Macrofaunal abundance (number m )
3 220
5 737-5 870
60
1.5
3.76
Clay
5.0
387
1 110
4 831-4 921
60
1.6
3.50
Clay
4.2
213
500
4 335-4 438
116
1.6
3.55
Clay
7.9
1 100
315
3 715
307
1.6
3.86
Silty
12.2
5 274
clay
Macrofaunal biomass (mg wet wt m-2)
22.2 57.3 112.7 24 190
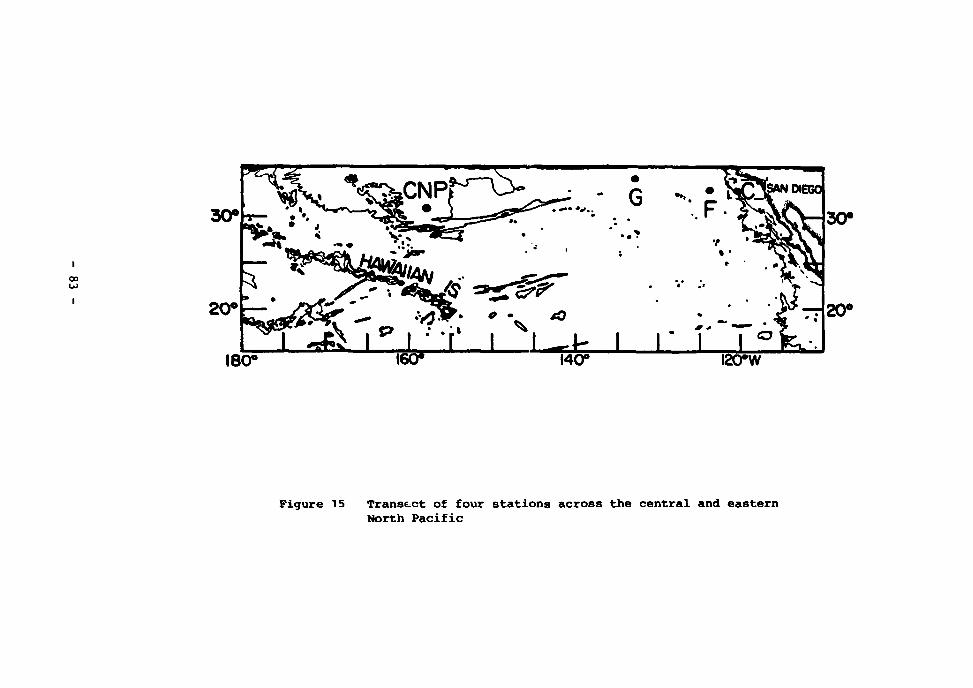
30»
oo
I
>PT> . » ~ •»»>. 30°
& «rrs^ 2 ^ ^ ^ ^ r ^ ' ' ^ — ISO*
i , ua i " i •• r i i —4- i i 160* 140° iao°w
Figure 15 Transact of four stations across the central and eastern North Pacific
scavengers, such as £. gryllus, are distributed over greater vertical ranges
in more oligotrophic environments because of insufficient food supplies nearer
the bottom. The reliance of E_. gryllus on other feeding strategies, such as
predation, may account for a wider vertical distribution in environments of
lower food supply.
An increase in size with increased altitude along the transect was noted,
which agrees with the results of Ingram and Hessler (1983). A predominance of
female amphipods near the bottom was also observed, which compares well with
other findings both in the Atlantic and Pacific. Colour in Eurythenes
gryllus, as in other deep-sea crustaceans, is a result of carotenoid pigments
(Herring, 1972, 1973). In vertical profile, white £. gryllus were generally
closer to the bottom at all 4 stations, while pink and orange variants increa
sed in abundance at altitudes above.
- 84 -
4: MARINE RADIOBIOLOGY
Introduction
In addition to a knowledge of marine biology being essential to assessing
the feasibility of placing high-level wastes in the deep sea, information is
also required on what may best be described as marine radiobiology, because of
the specific nature of the waste being considered. This covers a number of
different areas, such as an evaluation of which radionuclides are accumulated
by which organisms, into which tissues they are concentrated, their routes of
accumulation he relative biological availability of different chemical
forms, and so on. Not all of this information is necessarily required of
deep-sea fauna because the principal route of human exposure is most likely to
result from the consumption of coastal- and surface-water organisms.
Many of the participants during the NEA-SWG programme have contributed to
the radiobiological studies. By and large they fall into three distinct cate
gories of work. The first consists of studies on environmental materials to
determine concentrations of both naturally-occurring and artificial radionuc
lides in both deep- and coastal-water species. This work has been aimed
largely at deriving improved data on concentration factors for modelling pur
poses, to determine which radionuclides are most highly concentrated by which
type of organism, and to provide data from which the radiation background of
deep-sea organisms can be assessed. The second category onsists of labora
tory studies to determine the accumulation and loss of radionuclides, both in
terms of rates and the biological availabil.ty of certain nuclides in diffe
rent materials. These have necessarily been carried out on shallow-water
species, but because such species are likely to form the main pathway back to
man, they are nonetheless relevant to the present assessment. But the third
category of studies, on the irradiation of bacteria, has been carried out
directly on deep-sea fauna.
A number of these different aspects are dealt with elsewhere in the
report: the concentration factor aspects in Chapter 5, transfer factor model
ling in Chapter 8, and environmental effects in Chapter 10. Thus only two
brief summaries will be included here - those on the analyses of
- 85 -
environmental, deep-sea, fauna and some of the laboratory experiments which
have been made with deep-sea materials.
Analyses of deep-sea fauna
A number of analyses of deep-sea fauna have been made in connection with
the CRESP activities in relation to the NEA low-level site, and some of the
results are equally of interest here. For example, studies have been made to
determine the concentrations of 21 Po, a naturally-occurring a-emitter with a
short half-life of 138 days, in deep-sea fauna. The 2 1 0Po arises from the
natural 2 3 8U series, and its immediate precursors are Bi (t1/2 5 days) and
Pb (t1/2 22.3 years). A number of fish caught by various methods near the
sea bed in different areas of the north-east Atlantic, by MAFF and by the
Institute of Oceanographic Sciences, have been analysed. The data obtained to
date (Pentreath, 1983) are shown in Figures 16, 17 and 18 for muscle, liver
and gonad tissue respectively. As can be seen, these preliminary results
suggest that the Po concentrations show no consistent change with increa
sing depth. Thus the Coryphaenoides rupestris and Coryphaenoides armatus uPo concentrations in muscle and gonad tissue are similar, even though the
two species are separated by more than 3 km in depth. The Coryphaenoides
guentheri values are greater than those of either of the other two species of
this genus, and may be related to feeding habits rather than to depth. It is
also important to note that a considerable range of Po values exists within
each species and therefore the resulting absorbed dose rates must be far from
constant for any one population, and probably far from constant for an indivi
dual fish.
In addition to the fish, deep-sea amphipods (Eurythenes gryllus) caught
within the dump site have also been analysed for 2 1 0Po (Pentreath et al.,
1980). In fact the occurrence of zl0Po in deep-sea fauna has been a subject
of some interest in recent years and other investigations have studied, in
particular, Its concentration in a number of deep-sea crustaceans (Cherry and
Heyraud, 1981, 1982; Swinbanks and Shirayama, 1986).
The most extensive set of data on radionuclides in deep-sea fauna is tha
obtained by Feldt et al. (1985), again primarily in relation to low-level
- 86 -
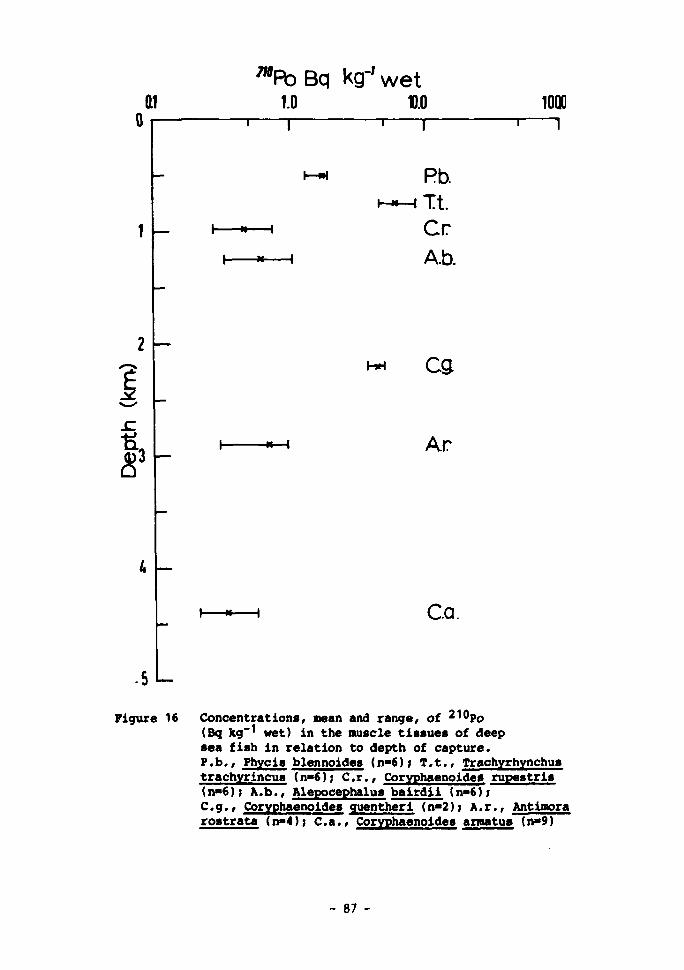
0
™Po Bq kg-' wet Q1 1.0 V.0 1000
2
1 1 1 1 1
Pb.
— i—-—i C r
i—••—i A.b.
& 3 -
HH eg
i »-H A.r
Ca.
Figure 16 Concentrations, mean and range, of 21^Po (Bq kg-1 wet) in the muscle tissues of deep sea fish in relation to depth of capture. P.b., Phycis blennoides (n-6); T.t., Trachyrhynchus trachyrincus (n-6); C.r., Coryphaenoides rupestris (n-6); A.b., Alepocephalus bairdii (n-6); e.g., COryphaenoides guentheri (n-2); A.r., Antimora rostrata (n-4); C.a., Coryphaenoides armatus (n»9)
- 87 -
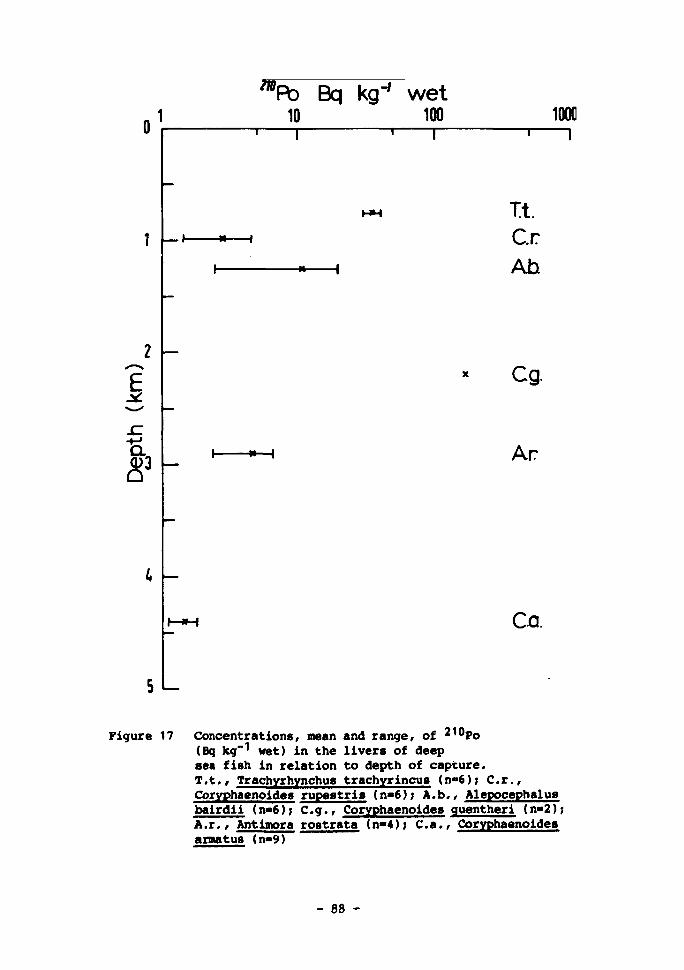
^Ro Bq kg"' w e t 10 100
2 -
E
*
"• r "• r 1000
"" 1
I M 1
I « 1
It. Cr Ah
I »-H
Cg
Ar
Ga
Figure 17 Concentrations, mean and range, of 210Po
(Bq kg'1 wet) in the livers of deep sea fish in relation to depth of capture. T.t., Trachyrhynchus trachyrincus (n»6); C.r., COryphaenoides rupeatris (n«6); A.b., Alepocephalus bairdii (n«6); e.g., Coryphaenoides guentheri (n»2); A.r., Antimora rostrata (n«4); C.a., Coryphaenoides armatus (n-9)
- 88 -
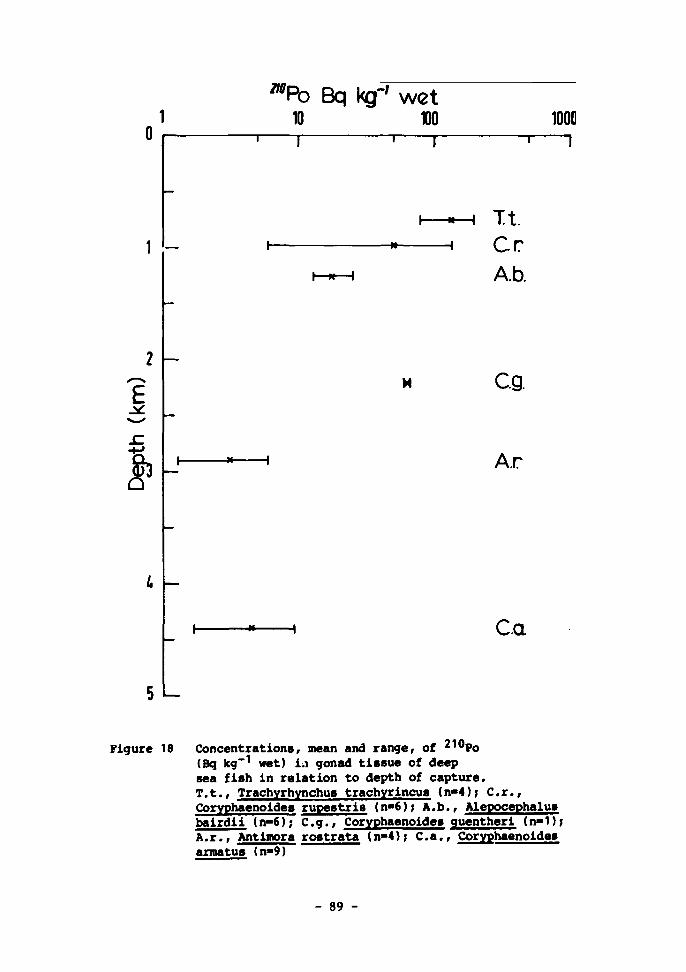
™Po Bq kg"' wet 10 100
T 1-
100C 1 1
I « I
I——I I t — i C r
A.b.
2 -
E eg.
Ar
Ga
Figure 18 Concentrations, mean and range, of *10po (Bq leg-1 wet) i.i gonad tissue of deep sea fish In relation to depth of capture. T.t., Trachyrhynchus trachyrlncus (n«4)j C.r., Coryphaenoldes rupestrls (n-6); A.b., Alepocephalus balrdll (n-6); e.g., Coryphaenoides guentheri (n»1); A.r., Antlmora rostrata (n«4); C.a., Coryphaenoldes armatus (n-9)
- 89 -
dumping in the Atlantic Ocean. Both dump-sites and control sites have been
sampled and the fauna analysed for naturally-occurring and artificial radio
nuclides. In addition to data on ' Po, values on nuclides of Th, Ra, Rn and
Ac were obtained, together with **°K. The majority of results relate to dump
sites rather than control sites, but it appeared that most of the artificial
radionuclides which were observed arose from fallout rather than from the
waste itself. They may therefore serve as useful base-line data for any sub
sequent introduction of radionuclides into the deep sea. Most of the material
was pooled for analysis. Studies made by other investigators, however, have
included examination of individual species. Some data obtained in areas out
side of the dump sites are given in Tables XIII and XIV.
The FRG studies also included siable element analyses; a selection from
Feldt et ah, (1985) is given in Table XV. Other stable element analyses of
deep-sea fauna have been carried out on material from Cape Verde (CVl and CV2)
by Germain et al. (1984). These French studies used neutron activation
techniques to determine the concentrations of 20 elements in two individuals
of a shrimp (Plesiopenaeub sp>) =»nd one fish (Barathrites sp.). The results
indicated that the levels were generally similar to those observed in shallow-
water species.
Analyses of shallow-water fauna
There are a number of elements in radioactive wastes which do not occur
naturally - Tc, Np, Pu, Am and Cm. It is thus extremely difficult to obtain
in situ data of relevance to the derivation of concentration factors, even for
shallow-water species, in the same manner in which they can be obtained for
stable elements. Such studies are essentially limited to the vicinities of
nuclear fuel reprocessing facilities or, for nuclides such as those of Pu and
Am, involve extremely long counting times in order to measure that which has
arisen in the environment from fallout.
A considerable effort has been expended in deriving data on these nuc
lides, as has been recorded in the annual reports. It is sufficient to
mention here that the results of such data have formed the basis for
- 90 -
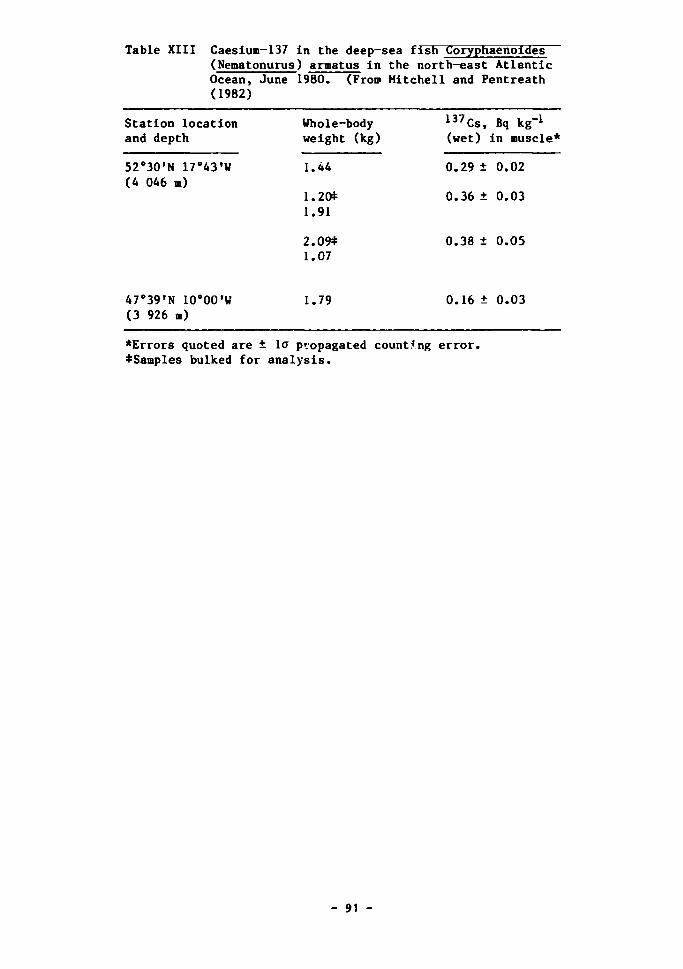
Table XIII Caesium-137 in the deep-! (Nematonurus) armatus in Ocean, June 1980. (From (1982)
Station location and depth
52°30'N 17°43*W (4 046 m)
47°39,N 10°00'W (3 926 m)
Whole-body weight (kg)
1.44
1.20* 1.91
2.09* 1.07
1.79
sea fish Coryphaenoides the north-east Atlantic Mitchell and Pentreath
1 3 7Cs, Bq kg-1
(wet) in muscle*
0.29 ± 0.02
0.36 ± 0.03
0.38 ± 0.05
0.16 ± 0.03
*Errors quoted are ± lo" propagated counting error. *Samples bulked for analysis.
- 91 -
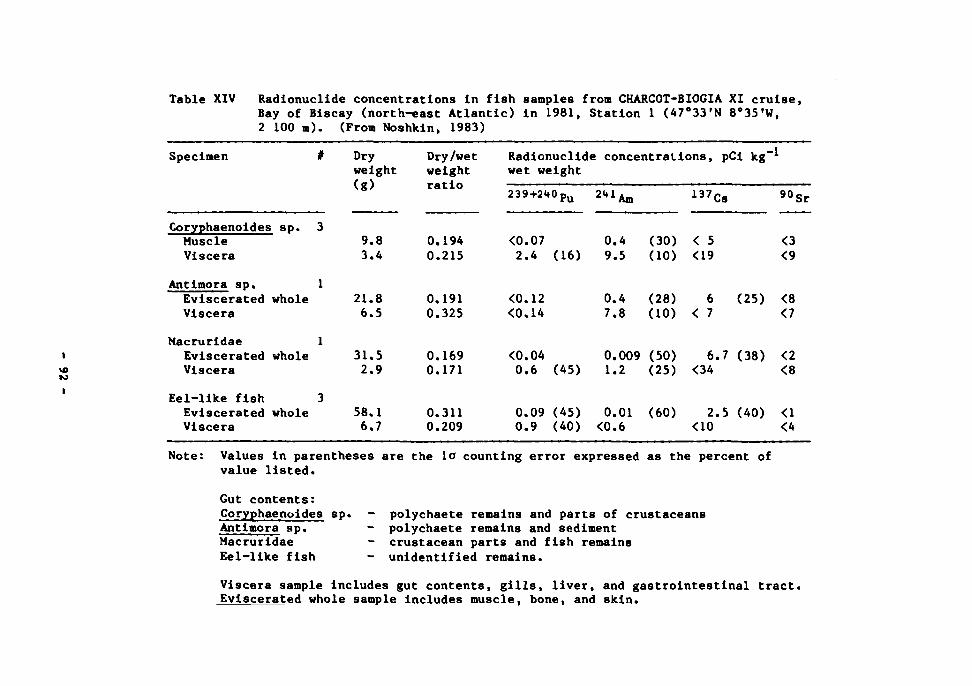
to
Table XIV Radionuclide concentrations in fish samples from CHARCOT-BIOGIA XI cruise, Bay of Biscay (north-east Atlantic) in 1981, Station 1 (47°33*N 8°35*W, 2 100 m). (From Noshkin, 1983)
Specimen
Coryphaenoides sp. Muscle Viscera
Antimora sp. Eviscerated whole Viscera
Macruridae Eviscerated whole Viscera
Eel-like fish Eviscerated whole Viscera
#
3
1
1
3
Dry weight (g)
9.8 3.4
21.8 6.5
31.5 2.9
58.1 6.7
Dry/wet weight ratio
0.194 0.215
0.191 0.325
0.169 0.171
0.311 0.209
Radionuclide concentrati wet weight
239+2<«0pu
<0.07 2.4
<0.12 <0.14
<0.04 0.6
0.09 0.9
(16)
(45)
(45) (40)
2^Am
0.4 9.5
0.4 7.8
0.009 1.2
0.01 <0.6
(30) (10)
(28) (10)
(50) (25)
(60)
ons, pCi kg"
l37Cs
< 5 <19
6 < 7
6.7 <34
2.5 <10
(25)
(38)
(40)
•1
9°Sr
<3 <9
<8 <7
<2 <8
<1 <4
Note: Values in parentheses are the lo counting error expressed as the percent of value listed.
Gut contents: Coryphaenoides sp. Antimora sp. Macruridae Eel-like fish
- polychaete remains and parts of crustaceans - polychaete remains and sediment - crustacean parts and fish remains - unidentified remains.
Viscera sample includes gut contents, gills, liver, and gastrointestinal tract. Eviscerated whole sample includes muscle, bone, and skin.
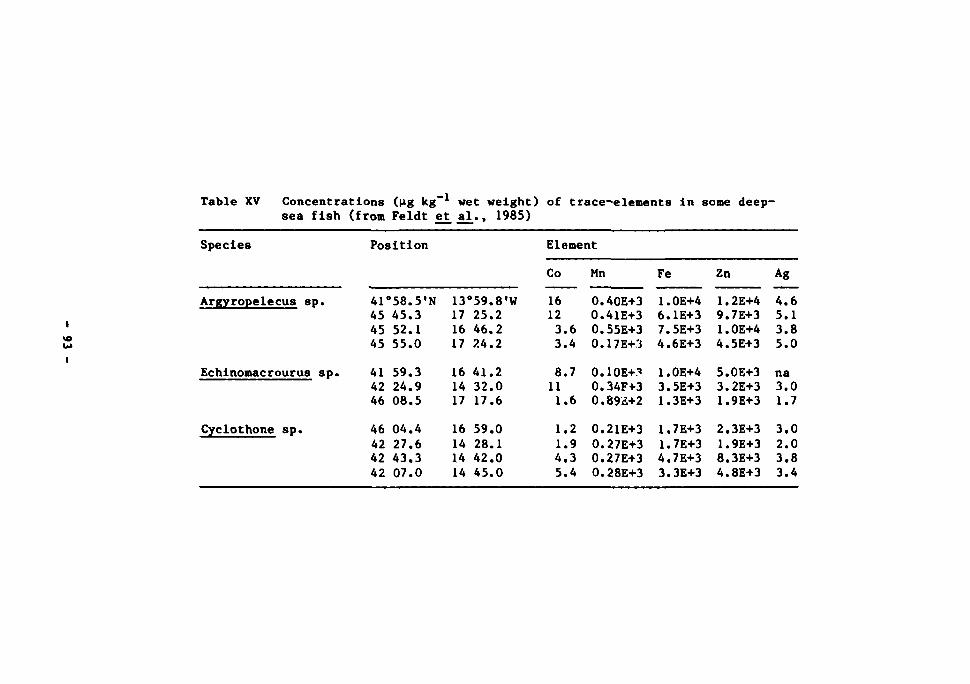
Table XV Concentrations ((Ag kg-1 wet weight) of trace-elements in some deep-sea fish (from Feldt et al., 1985)
Species
Argyropelecus sp.
Echinomacrourus sp.
Cyclothone sp.
Position
41°58.5'N 45 45.3 45 52.1 45 55.0
41 59.3 42 24.9 46 08.5
46 04.4 42 27.6 42 43.3 42 07.0
13°59.8'W 17 25.2 16 46.2 17 24.2
16 41.2 14 32.0 17 17.6
16 59.0 14 28.1 14 42.0 14 45.0
Element
Co
16 12 3.6 3.4
8.7 11 1.6
1.2 1.9 4.3 5.4
Mn
0.40E+3 0.41E+3 0.55E+3 0.17E+3
0.10E+.'' 0.34F+3 0.89£+2
0.21E+3 0.27E+3 0.27E+3 0.28E+3
Fe
1.0E+4 6.1E+3 7.5E+3 4.6E+3
1.0E+4 3.5E+3 1.3E+3
1.7E+3 1.7E+3 4.7E+3 3.3E+3
Zn
1.2E+4 9.7E+3 1.0E+4 4.5E+3
5.0E+3 3.2E+3 1.9E+3
2.3E+3 1.9E+3 8.3E+3 4.8E+3
Ag
4.6 5.1 3.8 5.0
na 3.0 1.7
3.0 2.0 3.8 3.4
concentration factor tabulations, and that a number of them have been summari
zed in IAEA TECDOC 265 (1982) and 368 (1986a).
Environmental and laboratory studies
It is obviously extremely difficult to carry out experiments with living
deep-sea fauna: the experiments either have to be undertaken in situ, or the
fauna collected and maintained in the laboratory under pressure and at low
temperature. Both methods have been used in radiobiological studies.
In situ studies have been initiated by the French Commissariat a
l'Energie Atomique (CEA) in collaboration with the Institut Francais de
Recherche pour l'Exploration de la Mer (IFREMER). The work is still in pro
gress and the following unpublished information has been communicated by
Calmet and Charmasson (personal communication). A free-vehicle colonization
module has been used, at depths in excess of 4 000 m, containing 4 arrays with
4 trays in each. Fourteen of the trays were filled with an artificial sub
stratum mixed with fish meal, and in three of the arrays the food was labelled
with b**Mn, 60Co, 65Zn and 1'*'*Ce in order to study the transfer of these nuc
lides to any colonizing animals. Two of the trays were not labelled. Coloni
zation of all trays occurred, and in the initial experiments a number of poly-
chaetes, from 12 to 45 mm in length, were analysed. The greatest transfer of
nuclide to polychaete was observed for Co.
An alternative method to n situ studies is that of maintaining deep-sea
fauna or micro-organisms in the laboratory. Such experiments have been made
with deep-sea fish to study their physiology, but so far such studies have not
involved the use of radiotracers. However, deep-sea bacteria have been
maintained in the laboratory and exposed to ionizing radiation in order to
study their relative radiosensitivity in comparison with shallower-living
species. These experiments are discussed in Chapter 10.
Laboratory experiments have also been made to investigate the biological
availability of radionuclides adsorbed onto different deep-sea sediments, but
these experiments have had to use shallow-water living species. Nevertheless,
they provide useful information of a comparative nature. It has been shown
- 94 -
that plutonium, in different oxidation states, appears to be about 50Z more
bioavailable to the same species of molluscs and polychaetes than americium
(Aston and Fowler, 1984), and that neptunium has the lowest bioavailability of
these transuranium nuclides (Miramand et al., 1982; Miramand and Germain,
1985; Germain et al., 1987). The results of such experiments have been sum
marized by Belot (1986) in a review of sediment-to-biota transfer data.
There have been many other studies on the transfer of radionuclides
to coastal water organisms in general, the majority being specifically
orientated to the long-lived nuclides. Technetium, in particular, has been
the subject of study at a number of laboratories and reviews of the data
published by Beasley and Lorz (1986) and by Schulte and Scoppa (1987N. A
review of data on transuranium nuclides was published earlier in th<- pogramme
(Pentreath, 1981).
- 95 -
5. BIOLOGICAL CONCENTRATION FACTORS FOR RADIONUCLIDES
Introduction
It is evident from the previous sections that the relationship between
the ambient water, sediments, and the marine fauna and flora, is an essential
component of the feasibility assessment for high-level waste disposal in the
sea. It is also, of course, an essential component of such an assessment for
the disposal of any radionuclides into the sea. In consequence, it is an area
which has been under development since the advent of nuclear power and thus
the subject of many reviews.
The biological concentration factor data requirement for calculating dose
to man via seafood pathways consists of (a) surface and coastal water values -
for this will be the principal route of human exposure, and (b) values for
deep-sea organisms, because these may be different and would be required for
assessing the dose from the direct consumption of deep-sea fauna.
During the programme, two reviews of concentration factor data have been
undertaken specifically for marine-modelling purposes. One was carried out
via the IAEA and NEA (IAEA TecDoc 247, 1985), and one via SANDIA. The latter
has produced three reports: Jackson et al. (1983) and Gomez et al. (1985,
1986). The IAEA report covered all radionuclides whereas the SANDIA reports
only considered certain radionuclides, but were far more detailed at the bio
logical level and included data on biological half-lives and so on. The IAEA
report data were used by the SATG for its modelling calculations because of
its internal consistency across all types of seafood, and all radionuclides.
But the SANDIA reports should be studied carefully because they contain the
detail which underlies many of the assumptions made in other reports. The
details of these reviews are as follows, beginning with a brief review of wha
concentration factor (CF) data actually represent, and the variables which
affect them.
- 96 -
CF values: derivation and factors affecting them
The quantity of an element or radionuclide in biological materials (B) is
almost always discussed in terms of concentration, either on a dry or wet
weight basis (IAEA, 1985). For modelling purposes this value is then usually
represented in terms of a concentration relative to that of the ambient sea
water (S), traditionally expressed as CF. If both biological material and
seawater concentrations are derived per unit weight, this term is dimension-
less (ug kg-1 B/ug kg-1 S or Bq kg-1 B/Bq kg-1 S). In some instances the
seawater concentration is derived in terms of unit volume (ug l-1 or Bq 1 )
but this makes, numerically, little difference to the CF value *hus derived.
For practical purposes, such as in studies with plankton, the concentration in
the biological material may also be derived in terms of unit volume.
A major cause of variance in the data obtained by any of these methods is
that of using either filtered or unfiltered seawater values as the denomina
tor, particularly for calculations based on data derived from coastal water
studies. The CF term has been of particular value for radiological control
practices in which calculations are first made of the expected concentrations
of a radionuclide in a particular water mass for a given rate of discharge,
and then of the expected concentrations, under equilibrium conditions, in the
living and non-living components of that body of water. Because the suspended
load of coastal waters is highly variable in both space and time, it is
usually found that reproducible relationships can only be obtained, for any
one element or radionuclide, by relating the rate of discharge to the filtered
seawater concentration, and then relating this value in turn to a concentra
tion factor based on filtrate-derived data. For this report the same general
approach has been made, wherever possible, using filtrate-derived water
values. All values relate to wet weight.
It should also be noted that, except for algre, the term concentration
factor as used in these circumstances does not Imply that all of the element
within the organism is concentrated by direct accumulation from the water. It
is simply a value that relates the concentration in the organism - which may
have been derived by uptake from sea water, particulate matter, and from
food - to that of the medium in which it lives.
- 97 -
The term is also used by radiobiologists studying the accumulation of
radionuclides by organisms under controlled laboratory conditions, usually
that of direct uptake from sea water. In some experiments the results
obtained are similar to those derived from environmental data; in others they
are not. There are many reasons for such discrepancies, and these are often
the subject of the investigations. It is therefore potentially misleading to
use laboratory-derived data uncritically and, wherever possible,
environmentally-derived data have been used in this compilation, although
these may be equally varied for a number of reasons.
The relationship between the concentration of an element or radionuclide
In a living organism and the ambient sea water is a dynamic one. Rates of
both uptake and excretion are known to be affected by body size, rate of
change of body size, temperature, light (in the case of algae), salinity, etc.
A number of elements which are accumulated by some organisms are not subse
quently eliminated, a variable fraction being virtually permanently incorpora
ted into some parts of the body structure. Skeletal tissues may act as depo
sitories for a number of elements, particularly multivalent cations. Some
elements become incorporated into granules, probably as a means of detoxifi
cation, which may or may not be subsequently excreted. Crustaceans, which
grow by a process of moulting, may lose absorbed material in cast moults as
well as resorbing, before moulting, certain other elements which are then
re-incorporated into the new exoskeleton.
Added to these factors is the continuing change in the concentration of
some elements or radionuclides (in coastal waters) over short periods of time.
It is to be expected, therefore, that real differences exist between some CF
values, even for the same element and species, and that the range of values
derived reflects true environmental fluctuations in any one area. In other
cases, however, the range of values reflects different permanent environmenta
conditions, or may result from the manner in which the measurements were
made.
- 98 -
va ues
The tabulated CF data are given in Appendix A. The values represent an
attempt to update those previously published in IAEA-TECDOC 211 (1978) but a
full review of the very large amount of data available was not possible. Some
subjective judgements were made as to which parts of a marine organism - and
in what proportions - are likely to be consumed by man; these are explained
in the following sub-sections.
In making such an update, emphasis was given to revising those values
which were previously derived as 'best guess' estimates and for which data are
now available, those values which appeared to have particularly low or high CF
values, those materials most likely to be consumed, and those radionuclides
which it was considered were of particular significance in view of their half-
lives, expected mobility, or likely abundance in nuclear wastes. For many
elements a full revision was not possible and, by default, IAEA TECDOC 211
values were retained. In most cases, however, a range of values was suggested
for use in sensitivity analyses. The ranges do not necessarily indicate the
maximum and/or minimum values which have been derived for a particular
species; they represent a range which was considered to be of some value in
allowing for uncertainty in the data base, or variations due to real inter
species differences within a group, but still assuming that a mixture of
species would be consumed from each category of materials.
As a general rule, literature concentrations expressed as dry or freeze-
dried weights were converted to wet weight concentrations by multiplying the
value by 0.2. Concentrations normalized to ash sample weights were converted
to wet weight concentration by multiplying the value by 0.01. Of particular
value were the data compiled by Eisler (1981), Bowen (1979), Phillips (1980),
Coughtrey and Thome (1983a, b); Coughtrey et al. (1983) and Jackson et al.
(1983); use was also made of the classic text of Vinogradov (1953). Many of
the biological data, particularly for the transition metals and others analy
sed for 'pollution' studies, were obtained from locally contaminated environ
ments. To derive a more uniform set of data, a search was made through the
annotated bibliographies of Eisler (1973), Eislp.r and Wapner (1975) and Eisle
e_t a_l. (1978) in order to eliminate values obtained from atypical areas. A
number of values, of course, were also based entirely on radionuclide results.
- 99 -
Where lar?e differences exist between the current recommended values and those
in IAEA TecDoc 211, an attempt was made to review the selection criteria in
the notes accompanying each table (see original IAEA document).
Fish
The CF values required, as previously noted, are those which relate con
centrations in the food substance to those of ambient sea water; considera
tion therefore has to be given to the fraction of the organism consumed. For
fish this usually consists of fillets - muscle plus, possibly, some skin.
When such fillets are commercially prepared they are often contaminated by,
for example, gut contents and other organs such as liver and kidney; portions
of bone might also be included. When chemical analyses are made, however,
fish are usually quite carefully dissected. Because the concentrations of
many elements differ markedly from one organ to another, with muscle usually
having one of the lowest concentrations, quite different results in the
apparent concentration of an element in the edible portion can be obtained.
Such differences resulting from analyses of laboratory and commercially deri
ved fish samples for Pu analyses have been commented upon by Pentreath et al.
(1979). In suggesting a CF value appropriate to models which are used to
assess dose to man, some adjustment (upwards) of the value derived from
laboratory-prepared samples would appear to be appropriate in some cases, and
this was done.
It is also necessary to consider the consequences of the consumption of
whole fish, such as anchovies, which would also include the gut contents. It
would not be realistic to bias all data to allow for continual consumption of
nothing but whole fish, but nevertheless some form of adjustment is clearly
necessary. Data from a sample of 24 650 people in the United States of
America (Rupp £t jd_., 1980) indicate that less than 0.5% consumed anchovies.
If one assumes that the quotient of the whole-body CF to flesh CF is Z, the
effect of eating 0.5% whole fish would be to adjust the recommended CF in the
following manner
- 100 -
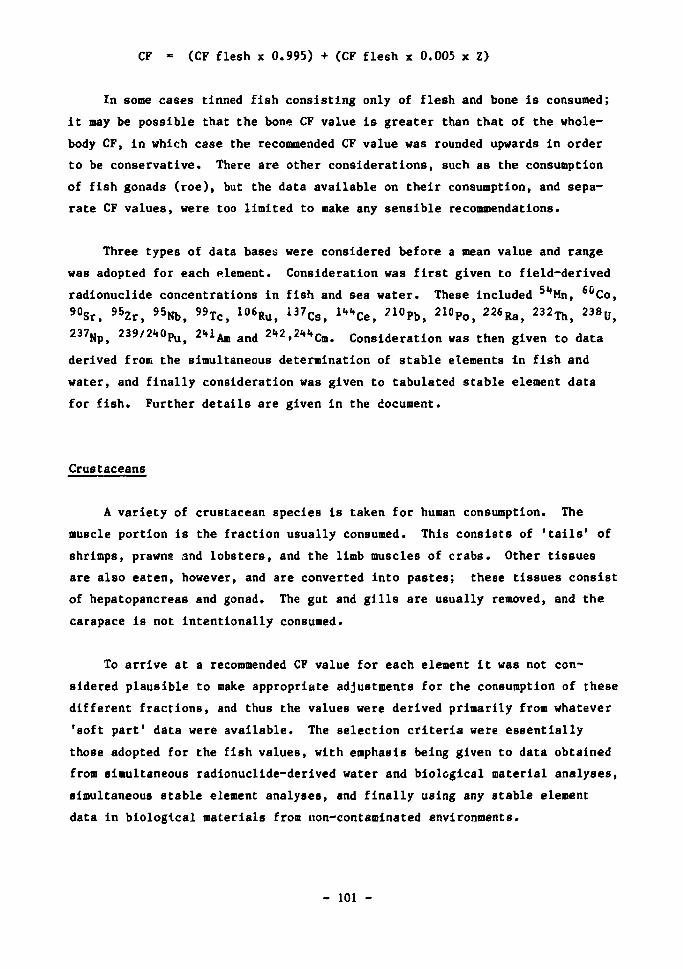
CF - (CF flesh x 0.995) + (CF flesh x 0.005 x Z)
In some cases tinned fish consisting only of flesh and bone is consumed;
it may be possible that the bone CF value is greater than that of the whole-
body CF, in which case the recommended CF value was rounded upwards in order
to be conservative. There are other considerations, such as the consumption
of fish gonads (roe), but the data available on their consumption, and sepa
rate CF values, were too limited to make any sensible recommendations.
Three types of data bases were considered before a mean value and range
was adopted for each element. Consideration was first given to field-derived
radionuclide concentrations in fish and sea water. These included 5**Mn, 6ClCo, 90Sr, 95Zr, 95Nb, 99Tc, 106Ru, i 3 7Cs, ""Ce, ? 1 0Pb, 2 1 0Po, 2 2 6Ra, 2 3 2Th, 2 3 8U, 237Np, 2 3 9 m o P u , 2(,iAm and ^ . ^ C m . Consideration was then given to data
derived from the simultaneous determination of stable elements in fish and
water, and finally consideration was given to tabulated stable element data
for fish. Further details are given in the document.
Crustaceans
A variety of crustacean species is taken for human consumption. The
muscle portion is the fraction usually consumed. This consists of 'tails' of
shrimps, prawns and lobsters, and the limb muscles of crabs. Other tissues
are also eaten, however, and are converted into pastes; these tissues consist
of hepatopancreas and gonad. The gut and gills are usually removed, and the
carapace is not intentionally consumed.
To arrive at a recommended CF value for each element it was not con
sidered plausible to make appropriate adjustments for the consumption of these
different fractions, and thus the values were derived primarily from whatever
'soft part1 data were available. The selection criteria were essentially
those adopted for the fish values, with emphasis being given to data obtained
from simultaneous radionuclide-derived water and biological material analyses,
simultaneous stable element analyses, and finally using any stable element
data in biological materials from non-contaminated environments.
- 101 -
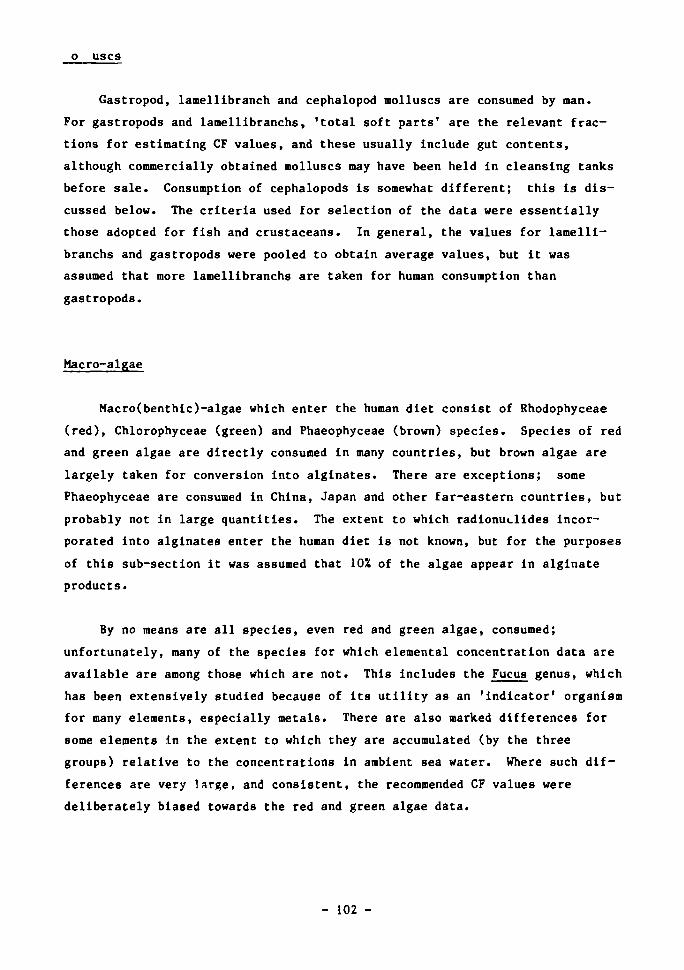
o uses
Gastropod, lamellibranch and cephalopod molluscs are consumed by man.
For gastropods and lamellibranchs, 'total soft parts' are the relevant frac
tions for estimating CF values, and these usually include gut contents,
although commercially obtained molluscs may have been held in cleansing tanks
before sale. Consumption of cephalopods is somewhat different; this is dis
cussed below. The criteria used for selection of the data were essentially
those adopted for fish and crustaceans. In general, the values for lamelli
branchs and gastropods were pooled to obtain average values, but it was
assumed that more lamellibranchs are taken for human consumption than
gastropods.
Macro-algae
Macro(benthic)-algae which enter the human diet consist of Rhodophyceae
(red), Chlorophyceae (green) and Phaeophyceae (brown) species. Species of red
and green algae are directly consumed in many countries, but brown algae are
largely taken for conversion into alginates. There are exceptions; some
Phaeophyceae are consumed in China, Japan and other far-eastern countries, but
probably not in large quantities. The extent to which radionuclides incor
porated Into alginates enter the human diet is not known, but for the purposes
of this sub-section it was assumed that 10% of the algae appear in alginate
products.
By no means are all species, even red and green algae, consumed;
unfortunately, many of the species for which elemental concentration data are
available are among those which are not. This includes the Fucus genus, which
has been extensively studied because of its utility as an 'indicator' organism
for many elements, especially metals. There are also marked differences for
some elements in the extent to which they are accumulated (by the three
groups) relative to the concentrations in ambient sea water. Where such dif
ferences are very large, and consistent, the recommended CF values were
deliberately biased towards the red and green algae data.
- 102 -
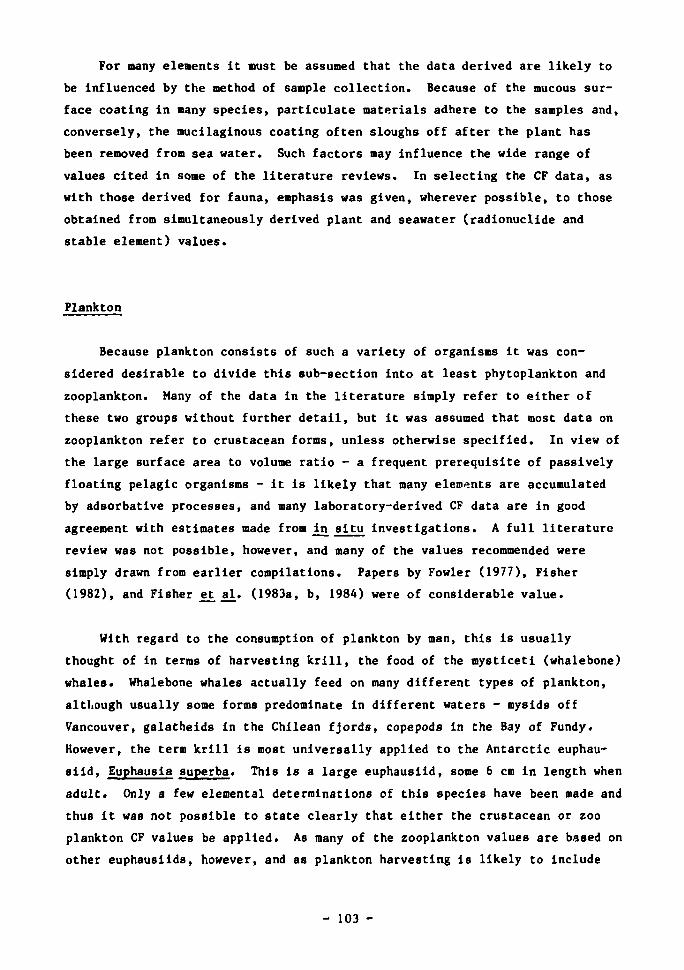
For many elements it must be assumed that the data derived are likely to
be influenced by the method of sample collection. Because of the mucous sur
face coating in many species, particulate materials adhere to the samples and,
conversely, the mucilaginous coating often sloughs off after the plant has
been removed from sea water. Such factors may influence the wide range of
values cited in some of the literature reviews. In selecting the CF data, as
with those derived for fauna, emphasis was given, wherever possible, to those
obtained from simultaneously derived plant and seawater (radionuclide and
stable element) values.
Plankton
Because plankton consists of such a variety of organisms it was con
sidered desirable to divide this sub-section into at least phytoplankton and
zooplankton. Many of the data in the literature simply refer to either of
these two groups without further detail, but it was assumed that most data on
zooplankton refer to crustacean forms, unless otherwise specified. In view of
the large surface area to volume ratio - a frequent prerequisite of passively
floating pelagic organisms - it is likely that many elements are accumulated
by adsorbative processes, and many laboratory-derived CF data are in good
agreement with estimates made from in situ investigations. A full literature
review was not possible, however, and many of the values recommended were
simply drawn from earlier compilations. Papers by Fowler (1977), Fisher
(1982), and Fisher e± al. (1983a, b, 1984) were of considerable value.
With regard to the consumption of plankton by man, this is usually
thought of in terms of harvesting krill, the food of the mysticeti (whalebone)
whales. Whalebone whales actually feed on many different types of plankton,
although usually some forms predominate In different waters - mysids off
Vancouver, galatheids in the Chilean fjords, copepods In the Bay of Fundy.
However, the term krill is most universally applied to the Antarctic euphau-
siid, Euphausia superba. This is a large euphausiid, some 6 cm in length when
adult. Only a few elemental determinations of this species have been made and
thus it was not possible to state clearly that either the crustacean or zoo
plankton CF values be applied. As many of the zooplankton values are based on
other euphausiids, however, and as plankton harvesting is likely to include
- 103 -
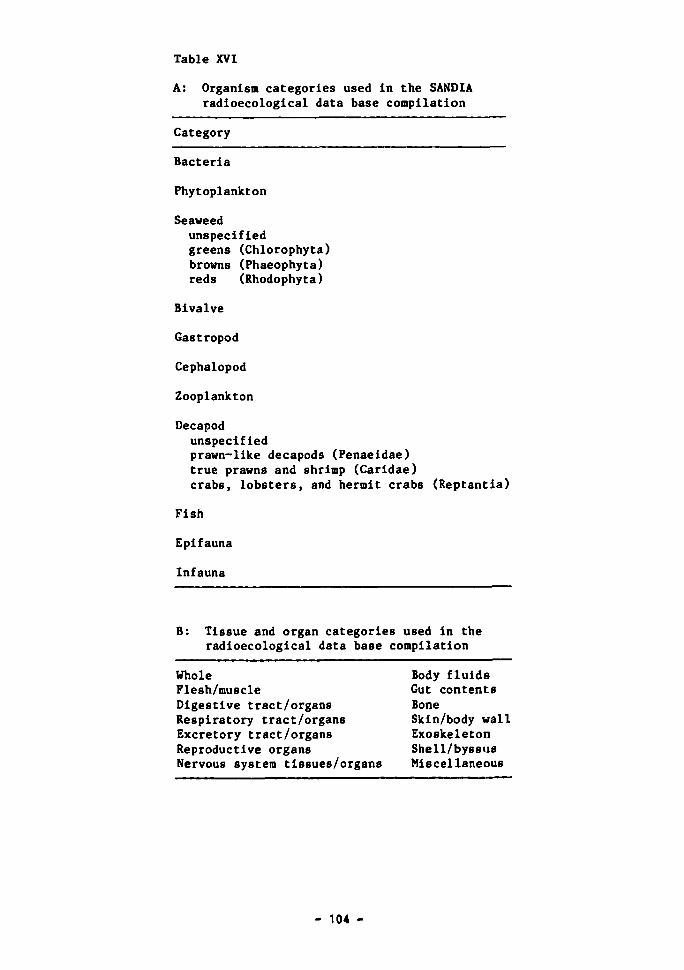
Table XVI
Organism categories used in the SANDIA radioecological data base compilation
Category
Bacteria
Phytoplankton
Seaweed unspecified greens (Chlorophyta) browns (Phaeophyta) reds (Rhodophyta)
Bivalve
Gastropod
Cephalopod
Zooplankton
Decapod unspecified prawn-like decapods (Penaeidae) true prawns and shrimp (Caridae) crabs, lobsters, and hermit crabs (Reptantia)
Fish
Epifauna
Infauna
B: Tissue and organ categories used in the radioecological data base compilation
Whole Body fluids Flesh/muscle Gut contents Digestive tract/organs Bone Respiratory tract/organs Skin/body wall Excretory tract/organs Exoskeleton Reproductive organs Shell/byssus Nervous system tissues/organs Miscellaneous
104
other species, it was suggested that the zooplankton CF values were
preferable.
Cephalopods
As will be discussed in Chapter 7, cephalopods are taken from both
surface and midwater depths for human consumption. The edible fractions of
squid are usually the mantle (from which the viscera have been removed), the
head, and the tentacles, whereas for octopods it is usually the tentacles
only. These edible portions do not, therefore, contain sedimentary materials
or those organs which have high concentrations for many elements; they thus
differ from the 'total soft parts' of other molluscs in terms of their
concentrations of many elements. It is n,t possible to develop a complete
list of CF values for cephalopods, but seme derived values - for the number of
elements - are listed in Table A7 and these have been compared with the
recommended CF values for fish and other molluscs. In comparing these values
it should not be implied that any particular element is either enhanced or
depleted at one link in the food chain relative to another - such as between
fish and cephalopods - because each CF value merely represents the
concentration in what is likely to be consumed relative to sea water. It is
nevertheless clear that the cephalopod CF values differ considerably from
those of other molluscs and, in view of all but three of the values falling a
or within an order of magnitude of the fish values, it was recommended that
fish CF values would be the most appropriate ones to use in a general
evaluation of the cephalopod pathway.
Mesopelagic fish
All the recommendc. CF values presented in Table Al refer to, and are
based on, surface-water sh data. The extent to which such values can be
applied to fish living at depths greater than about 200 m is not entirely
clear, and there is certainly an insufficient data base to derive a complete
separate list of CF values for them. From a brief perusal of the literature
it appeared that the concentrations of a number of trace elements (Mn, Fe, Cu
and Zn) are not significantly different in metsopelagic and coastal water fish,
- 105 -
nor are 137Cs and Sr concentrations (Nakahara et al., 1980). The same
applies to coastal water and mesopelagic cephalopods. It was therefore sug
gested that either the surface-water fish CF values be used throughout, or
that the CF value - if to be applied to deep-ocean water - be adjusted in
proportion to the ratio of the surface water to deep-water elemental
concentrations.
The SANDIA Reports
These documents provide summaries of CF and biological half-time data
compiled from an extensive bibliographic list. The radionuclides considered
were selected on the following basis: high-level waste constituents with
half-lives of the order of 500 years or greater, along with important daughte
products of these nuclides' decay; nuclides which might serve as analogues of
nuclides included in the previous group; and nuclides known to be important
contributors to the natural radiation dose to marine biota (e.g. Po) and/o
nuclides of biologically 'active' elements such as Co.
The data were sorted into subsets and then summarized statistically and
graphically for a given application. The general compilation scheme used was
as follows:
A. CFs reported from in situ investigations (ISCFs)
1. Organism category
2. Tissues, organs, etc. used in measurements
3. Location
(a) Locations with chronic local contamination
(b) Locations with background + fallout
4. Investigator(s) (• reference)
5. Special conditions
B. CFs reported from laboratory experiments (LABCFs)
1. Organism category
2. Tissues, organs, etc. used in measurements
3. Time of exposure in days
- 106 -
4. Exposure concentration in nCi/1 unless otherwise noted
5. Investigator(s)
6. Special conditions
C. Biological half-life data (BHLs) - data reported in days along with per
centage of body burden associated with each pool identified
1. Organism category
2. Tissues, organs, etc. used in measurements
3. Exposure method - labelled food, labelled water, labelled food +
water, oral dose, injection
4. Investigator(s)
5. Special conditions
The categories of organisms (Table XVI) included not only those associa
ted with seafood pathways but epifauna and infauna - ophiuroids, anthozoans,
holothurians, polychaetes and so on - which may be important in the transfer
of radionuclides from contaminated sediments.
The data base also makes note of special conditions relevant to the deri
vation of the values. These include how the original data were reported - as
estimates, mean, range, wet or dry weight, filtered or unfiltered water -
together with notes on temperature, pH, route of exposure, method of depura-i
tion and any other factor which could have an influence on the comparability
of the results with others. In the tabulated information, data originally
reported as a range were recorded as the median between the upper and lower
bounds. Descriptive statistics were only provided for those radionuclides
considered to have been studied well enough to provide a relatively homo
geneous subset of at least three observations. These were: Fe, Co, 95mTc, 13*Cs, 1 3 7Cs, 210Pb, 2 1 0Po, 226Ra, 235Np, 237Np, 2 3 7Pu, 2 3 8Pu,
239/2-0PUf 2 ^ .
Concentration factors were also presented as scatter plots. Some of
these concerned data for the various organism categories for the most well-
studied nuclides (60Co, 90Sr/90Y, 13*Cs, 1 3 7Cs, 237Pu and 2 3 8 ' 2 3 9 P u ) , f o r
naturally-occurring nuclides (210Pb, 2 1 0Po, 2 2 6Ra), and separately for 2 3 5Np, 237Np, 2^Am and 9 5 mTc.
- 107 -
A listing of descriptive statistics for biological half-life sets was
also provided for the nuclides 60Co, 95mTc, 137Cs, 237Np, 237Pu, W2W?u
^ A m .
- 108 -
6. THE ROLE OF BIOLOGICAL PROCESSES IN REDISTRIBUTING
RADIONUCLIDES IN THE OCEANS
Introduction
The potential role of biological processes In effecting and affecting the
gross distribution of radionuclides in the marine environment, arising from
their possible release at the bottom of the oceans, has been the subject of
considerable debate throughout the SWG programme. It has also been the
principal subject of mutual discussions with the physical-oceanography task
group. The basis of such discussions has centred around three principal
topics: the competing role of biologically-mediated transport and physical
processes in exporting radionuclides from close to the sea bed into the upper
water column; the production of particulate materials in the water column
which serve to scavenge radionuclides from it; and the bioturbatory processes
of burrowing fauna on the sea bed which result in radionuclides being cycled
within the upper layers of the sediment, and thus at the all-important
seawater/sediment interface. All three of these topics have been the subject
of reviews in the open literature, in particular those of Angel (1983b, 1984),
GESAMP-19 (1983) and Rowe et al. (1986) on the first topic; of Ballistrieri
££ al_. (1981), Hargrave (1985a), Fowler and Knauer (1986) and Csanady (1986)
on the role of particulates; and by Smith and Schafer (1984), and - particu
larly on the modelling aspects - by Boudreau (1986a, b) on bioturbation pro
cesses. The following is therefore no more than a brief review of some of the
salient points.
Mass transfer of radionuclides up from the deep sea
In order to put some form of perspective into the potential of biological
processes in effecting the mass transport of radionuclides up from the deep
sea, in comparison with physical transport, some initial calculations were
made by Pentreath at an interim SATG meeting in 1980 and reported in the Sixth
Annual Report (Anderson, 1981). For these calculations it was assumed that
all the benthic biomass consisted of echinoderms which produce pelagic larvae.
For a biomass of 0.1 g m~2, at 4 000 to 5 000 m, it was further assumed that
half of this biomass was converted to larvae which floated to the surface eac
- 109 -
year. Applying concentrations factors (CF) to obtain a concentration in the
larvae relative to the water (Bq kg_1/Bq l - 1 ) , the total quantities of
radionuclides transferred was then calculated from
Bq a-1 = 0.1 x 10⁻³ (kg.m-2) x 1 x 1013 (m2) x CF x W x 0.5
where W was the deep-water concentration in Bq l - 1. Using CF values of 10 for 237Np, 300 for 239Pu and 4 000 for 21flAm it was shown that the quantity trans
ferred was, in each case, less than 10~6 of that obtaining in the surface com
partment of the oceanographic model used at that time as the result of purely
physical processes. In short, that they were relatively unimportant.
Such simplistic calculations were treated with deserved scepticism and
more sophisticated calculations were made by Robinson and Mullin at the
Jackson Hole Workshop in 1981 (Mullins and Gomez, Sandia Report 81-0012,
1981). These consisted of combined physical-biological transfer equations
from which the relative rate of biological to physical transport of radionuc
lides out of an area, represented as a 'box* of bottom water in contact with
the sea bed, could be calculated. They estimated this ratio to be of the
order of 4 x 10⁻³:1 by using a number of realistic assumptions regarding
fluxes of materials into and out of the area; again, therefore, it appeared
that physical processes would predominate. Indeed, it was shown in a simpli
fied box model of upper and lower oceans that the introduction of biological
materials actively decrease surface water concentrations because of the gene
ration of particles which scavenge radionuclides and transport them to depth
(Seventh Annual Report, 1982).
Nevertheless, the modelling group convened by GESAMP addressed again the
mass transport question (IAEA, 1986b). Starting with the obvious they stated
that, for a 1 000 m water column and underlying sediment, the total biomass
could amount to 3 g m"2 compared with 103 t m of water. The greater part of
any contaminant will therefore reside in the water unless concentration fac
tors exceed 3 x 1 0 . Thus for this reason alone, in comparison with physical
ones, biological transport mechanisms are usually unimportant for large time
and space scales. Of course the fauna can also move, and the most mobile
fauna are the fishes. The group therefore considered the effect of an abyssa
fish population which accumulated a radionuclide and transported it by
- 110 -
swimming. An assumed standing stock of 0.3 g m~ , concentrated within 10 m of
the sea bed, yields a ratio of biomass:water occupied of 3 x 10⁻⁸ (weight/
weight). Thus even if the fish swam a hundred times faster than the water
moves (1 m s_1 compared with 1 cm s , for instance) the amount of radionuc
lide transported by fish would be less than that transported by water, unless
the concentration factor for the radionuclide exceeded 3 x 10⁵. And even with
this concentration, most of the radionuclide would remain in the fish, and not
be released to the water.
An alternative approach adopted was that based on import/export budgets
of organic carbon coupled with those on energy flow. These calculations
produced a conclusion that a reasonable value for the average transfer by bio
logical material/average transfer by physical upwelling was A x 10-6 CF, where
CF was the concentration factor. Thus, even for a CF of 103 or 101*, th =
relative transport would be small.
The GESAMP group also saw fit to return to the buoyant eggs and larvae
concept. In particular, they considered whether or not biological transport
might be more important if it was concentrated in a local area. One might
suppose, for example, that a dominant (abundant, several grams m ) organism
with wide geographic (at least several hundreds of kilometres) distribution,
perhaps including continental slope regions, aggregated yearly to spawn. One
example could be abyssal rattail fishes, although almost nothing is known of
their spawning habits. Another could be the widespread slope-dwelling eel,
Synaphobranchus kaupl, which in the Atlantic Ocean spawns in the Sargasso Sea
region. If spawning aggregation occurred in the presence of maximum concen
trations of contaminants, and if the maximum concentration in reproductive
products was reached quickly, then the question is raised as to whether the
release of buoyant eggs might provide a significant transfer mechanism.
If the species in question spawned 1/4 of its body weight and had an
average biomass of 1 g m~2 over an area of 10 km , then the production (P) o
buoyant eggs could be 2.5 x 10¹¹ g a~ . The average maximum concentration of
a radionuclide in such an area for a diffusive ocean was given by
max ,„ „ »l/2 1C(KVKH) rS
- Ill -
where r was the radius of the distributed source, K^ and K, the vertical and
horizontal effective dispersion coefficients, and Q the release rate of radio
nuclides into the area. (The calculations were made primarily for low-level
dumping considerations, for which release from disposed packages would be
fairly rapid.)
The total flux (F ) of the radionuclide to the surface by buoyant eggs
was given by \
F • YPC 0 ~* S ' maxMB
where p„ is the density of the eggs. This total flux, when averaged over the
area from which the fish arrive, will obviously be small for long-lived nuc
lides compared with that caused by physical processes.
Because the flux constitutes a source to the surface water that is itself
dispersed, as is the bottom source, the resulting maximum surface concentra
tion (C„) would then be
C CF QP
S pBAvVs
where CF is the concentration factor and the assumption that the surface and
bottom diffusivities are equal. For radionuclides whose decay over the 'rise
time' for the eggs is small, one can compare this concentration with that in
the surface concentration of the far field, the ratio (A) being, in their
report, 3 x CF x 10~6 x X, where X is the decay rate of the nuclide (s _ 1).
Thus, for a long-lived nuclide such as 239Pu (X - 9 x 10~13 s" 1), with a CF of
3 x 10² as initially used by Pentreath, the ratio would be 8 x 10"16:1.
Indeed, for the ratio to be unity, the CF would need to be A x 1017.
The correctness of the biological assumptions inherent in such modelling
exercises has been considered in a recent IOS review (Booty, 1^85). It sug
gested that the data for the meiofaunal and macrofaunal biomasses used in the
models of Robinson and Mullin (1981) and GESAMP (1983) were based on a reason
ably large number of measurements, and are unlikely to be grossly wrong, but
that the data available for megabenthos were less reliable. Nevertheless, it
- 112 -
concluded that: "None of the IOS results have called Into question either the
validity of the models' underlying assumptions or the approximate correctness
of the input data." Thus the original conclusions based on Pentreath's simple
calculations appear to have been validated. The Biology Task Group had, in
the meantime, proceeded to consider the two biological processes which do have
a significant impact on geochemical cycling in the oceans - the creation of
particulate matter in surface waters, and the disturbance of the seawater/
sediment interface.
The role of biologically-mediated particulate matter
The dominant fluxes of biological material are down the biomass gradient,
i.e. from the euphotic zone to the sea bed, although there is active recycling
within the surface 1 000 m as a result of migrations. Below 2 000 m there is
no evidence of regular diel migrations and vertical recycling is unlikely to
be measurable. The best estimates available suggest that only 1-3Z of surface
production reaches the sea floor as settled particles, and of that only a
small percentage gets incorporated into the sediment (Muller and Suess, 1979).
Known benthic standing crop levels together with what few data are available
on benthic turn-over rates suggest that most of the input is either used up by
the metabolism of the benthic community or incorporated into the sediments
(Angel, 1984).
Chemical scavenging by the rain of particulate organic and inorganic
material is known to transfer certain naturally-occurring radionuclides with
atmospheric inputs quite rapidly down to the sea bed. It will therefore be
just as effective at scavenging and returning a number of radionuclides which
diffuse up into the water column back on to the sea bet!.
The vertical transport of particles to various depths in the ocean is
enhanced by plankton-feeding activity at all depths. Animals migrate to feed
in surface layers from mesopelagic depths (Roe et al., 1984) and, as Is often
observed for zooplankton in surface layers, animal biomass may be concentrate
in a narrow depth layer (85-100 m) where phytoplankton degradation products
are accumulated. Herbivorous zooplankton collect almost-neutrally-buoyant
snail particles such as algal cells and detrital material during feeding, and
- 113 -
release dense faecal pellets to increase the rate of downward particle trans
port. In non-tropical latitudes the products of phytoplankton blooms not
grazed by zooplankton may settle directly to reach abyssal depths > 4 000 m in
several days (Billett e^ a^., 1983; Lampitt, 1985). In general, however,
large particles such as aggregates, taecal pellets, moulted exoskeletons, and
carcasses contribute to most of the downward transport of material (Fowler and
Knauer, 1986).
Observed increases in particle flux at intermediate depths in the water
column (Urrere and Knauer, 1981; Karl and Knauer, 1984) indicate that other
processes may generate particles outside of the euphotic zone at the surface.
Heterotrophic (non-photosynthetic) organisms (bacteria, flagellates, proto
zoans) may utilize large reservoirs of dissolved organic carbon in sea water
at any depth. This could be enhanced where particulate matter accumulates at
depths of density discontinuity, as in the thermocline. Thus zooplankton
could Ingest enriched particulate matter to provide a new source of faecal
pellets below the photic zone.
Observed increases in faecal pellet deposition at mid-depths arise either
from migrating animals which feed near the surface and defaecate at deeper
depths, or because they are formed in situ within a depth layer. When this
occurs in less turbulent waters, as below the thermocline, dense faecal
pellets are likely to settle rapidly. Harding (1973) also observed that cold
temperatures at deeper depths retard the decomposition of zooplankton carcas
ses and moults. Thus plankton, at any depth, enhance downward p-.iticle trans
port by their feeding activity. It should be noted, however, that particulate
vertical transport is not only downwards. Thus, as discussed previously,
buoyant particles occur which have an upward trajectory with rates measured at
sites in the Nares Abyssal Plain that amounted to 35-40% of the settling flux.
The origin of such rising particles is unknown (Yayanos and Nevenzel, 1978)
but the role of biological processes in their formation is inferred from thei
high organic content.
There is evidence from attenuance meter profiles of increased concentra
tions of suspended particles below 5 500 ra in the Nares Abyssal Plain (Laine,
1985). Average dry matter sedimentation at depths up to 100 m above bottom
(52 mg m~2 d - 1) was 70% higher than rates measured 200 to 1 000 m above the
- 114 -
bottom. Thus although the main pathway for supply of particulate matter to
areas removed from continental slopes is by downward settling, resuspension
can occur to inject particulate matter laterally into the water column.
A nepheloid layer of particle-rich water may also form by the disaggrega
tion of settled floes that enter the near-bottom shear zone. Fragile floes,
loosely cemented by acterial mucoid films, may be torn apart and kept in a
state of disaggregation in high shear layers. Small individual particles, lov
in organic matter, may be slowly colonized by bacteria. Settling rates of
dispersed small particles are thus retarded, and increased concentrations of
particles remain in suspension near the bottom. For example, Gordon (1977)
observed an average suspended particulate organic carbon concentration of
4.2 ug C l - 1 at depths > 4 000 m for three stations north of Bermuda. At each
site, concentrations approximately 200 m above bottom increased by a factor of
two or more relative to values 400 to 700 m above the bottom. It is thus
possible that the widespread distribution of nepheloid layers is maintained by
an interaction of physical processes which disaggregate the particles.
The role of such potential scavenging processes is such that a thorough
review of dry matter sedimentation in the oceans was carried out (Hargrave,
1985a). The following information has been obtained from this extensive col
lection of data. Recent studies with sediment traps in areas which differ in
levels of phytoplankton production had shown that particulate matter sedimen
tation might be predicted by a relationship between phytoplankton primary
production and small particle sedimentation (Betzer £t £l., 1984). The impor
tance of biological production cycles in the photic zone fcr controlling the
rates and nature of sedimenting material in the ocean was recognized - as
reviewed in Parsons et al. (1984) - and an empirical relationship between
organic carbon production by phytoplankton and sedimentation has been descri
bed (Suess, 1980). These studies have provided a basis for calculating sedi
mentation in ocean regions if phytoplankton production is estimated. Such
calculations were compared with recent measurements of sedimentation, which
were not used to derive equations relating primary production and particle
flux. The comparisons indicated that particulate sedimentation at bathypela-
gic depths in central ocean regions varies within narrow limits, but that
sedimentation in upwelling and shelf-slope areas is variable and likely to be
- 115 -
underestimated by the empirical equations derived from studies of sedimenta-
tion away from ocean margins.
Estimates of particle sedimentation were calculated for various oceanic
sub-regions (Table XVII). The difference between organic carbon sedimentation
over depth is of course a measure of utilization, if horizontal advection of
settling material is not significant relative to the vertical flux and if
there is no new synthesis of organic carbon between depth intervals. Suess
(1980) used this type of calculation, and an assumed mean sinking rate for
particles (100 m d ), to calculate oxygen consumption based on a stoicho-
metric relation with carbon. Carbon loss was calculated as the difference
between the input of organic carbon below the euphotic zone and that sedimen-
ted at a particular depth.
Estimated rates of flux between two depths may also be compared directly
without making assumptions of particle sinking rates. If consumption of orga
nic carbon in the upper 200 m is taken as the difference between phytoplankton
production in the euphotic zone and estimated sedimentation at 200 m, the
volume-(m )-averaged consumption rates for different regions vary from 5 to
1 800 mg C m-3 a-1 (equivalent to from 12 to 4 400 ml 02 m~3 a-1, assuming
2.43 ml 0 2 is consumed for 1 mg C (oxidized) (Table XVIII). Calculated rates
of organic carbon sedimentation imply that consumption rates between 200 and
1 000 m decrease by two orders of magnitude (0.01 to 60 mg C m~3 a-1 = 0.03 tc
150 ml 0 2 m a-1) with a further order of magnitude decrease between 1 000
and 4 000 m (0.001 to 1 mg C m~3 a-1 = 0.002 to 2.6 ml 02 m~3 a" 1).
The magnitude of these values, over appropriate depth ranges, corresponds
to estimates of oxygen consumption in the water column of the eastern Pacific
Ocean compiled by Suess (1980). More recent calculations of water column res
piration for the upper 100 m of the north central gyre of the Pacific were
made by Piatt e£ jal_. (1984) by assigning a size-scaled respiration rate for
the biomass of organisms between 2 and 232 urn. A volume-averaged community
respiration rate equivalent to * 900 mg C m~3 a-1 was derived. If an estimate
of biomass of organisms < 2 )in in size (picoplcnkton) was included, estimates
were increased by a factor of three (» 2 600 mg C m"3 a - 1 ) . The range of
calculated values for carbon consumption in the upper 200 m of the central
- 116 -
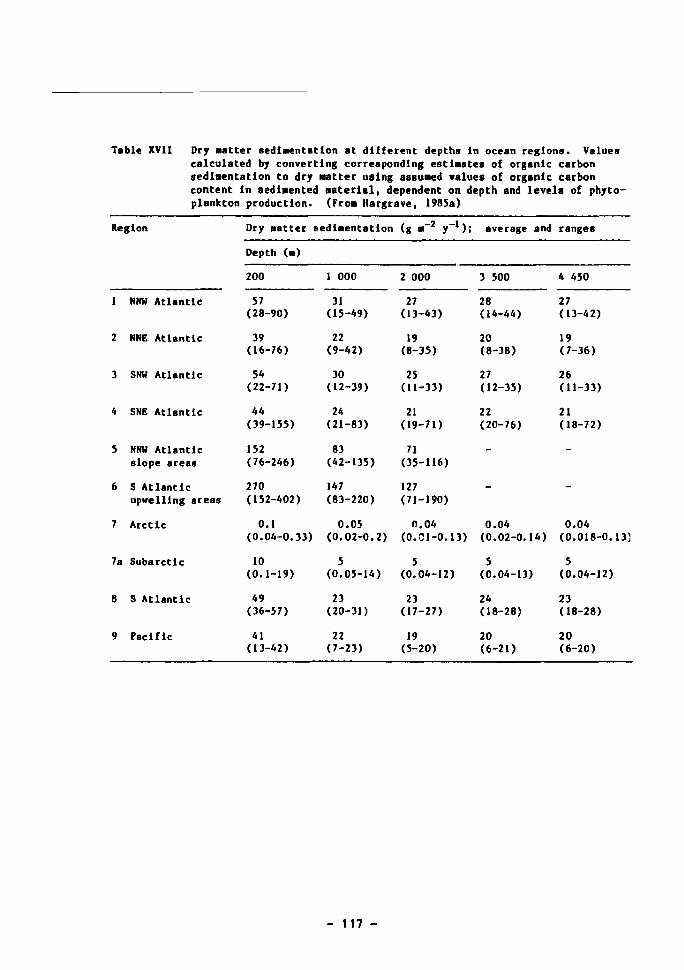
Table XVII Dry matter sedimentation at different depths In ocean regions. Values calculated by converting corresponding estimates of organic carbon sedimentation to dry matter using assumed values of organic carbon content in sedlmented material, dependent on depth and levels of phyto-plankton production. (From Margrave, 1985a)
Re
1
2
3
4
5
6
7
7a
8
9
gion
NNW Atlantic
NNE Atlantic
SNW Atlantic
SNE Atlantic
NNW Atlantic slope areas
S Atlantic upwelling areas
Arctic
Subarctic
S Atlantic
Pacific
Dry matter
Depth (•)
200
57 (28-90)
39 (16-76)
54 (22-71)
44 (39-155)
152 (76-246)
270 (152-402)
0.1 (0.04-0.33)
10 (0.1-19)
49 (36-57)
41 (13-42)
sedimentation
1 000
31 (15-49)
22 (9-42)
30 (12-39)
24 (21-83)
83 (42-135)
147 (83-220)
0.05 (0.02-0.2)
5 (0.05-14)
23 (20-31)
22 (7-23)
(g - _ 2 y _ 1 ) ;
2 000
27 (13-43)
19 (8-35)
25 (U-33)
21 (19-71)
71 (35-116)
127 (71-190)
0.04 (0.C1-0.13)
5 (0.04-12)
23 (17-27)
19 (5-20)
average and
3 500
28 (14-44)
20 (8-38)
27 (12-35)
22 (20-76)
-
-
0.04 (0.02-0.14)
5 (0.04-13)
24 (18-28)
20 (6-21)
ranges
4 450
27 (13-42)
19 (7-36)
26 (11-33)
21 (18-72)
-
-
0.04 (0.018-0.13)
5 (0.04-12)
23 (18-28)
20 (6-20)
- 117 -
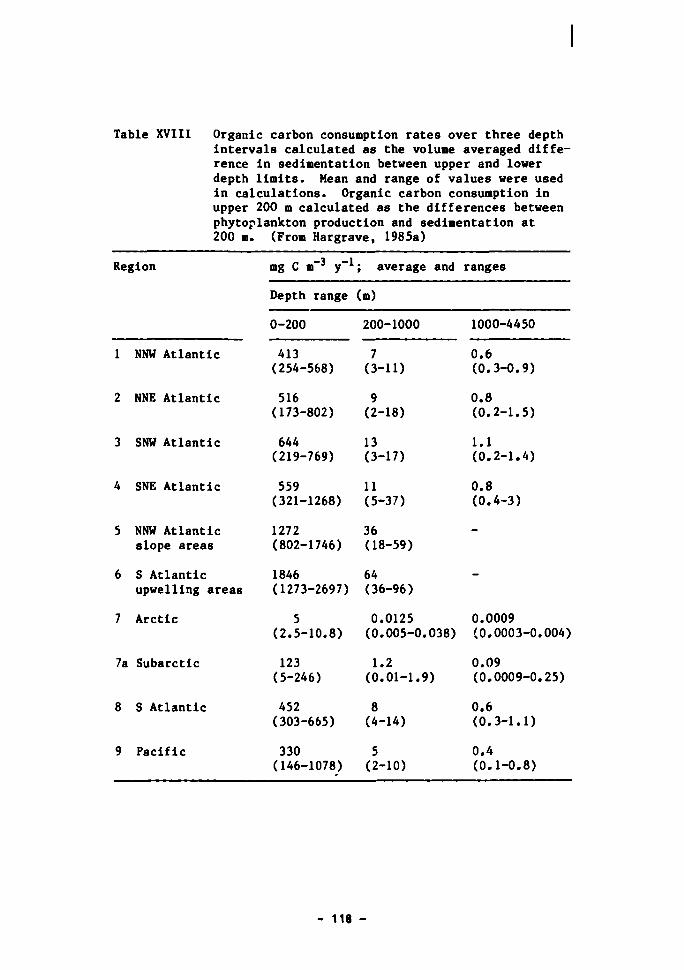
Table XVIII Organic carbon consumption rates over three depth Intervals calculated as the volume averaged difference in sedimentation between upper and lower depth limits. Mean and range of values were used in calculations. Organic carbon consumption in upper 200 m calculated as the differences between phytoplankton production and sedimentation at 200 m. (From Hargrave, 1985a)
Region mg C m~3 y~l; average and ranges
Depth range (m)
1
2
3
4
5
6
7
7a
8
9
NNW Atlantic
NNE Atlantic
SNW Atlantic
SNE Atlantic
NNW Atlantic slope areas
S Atlantic upwelling areas
Arctic
Subarctic
S Atlantic
Pacific
0-200
413 (254-568)
516 (173-802)
644 (219-769)
559 (321-1268)
1272 (802-1746)
1846 (1273-2697)
5 (2.5-10.8)
123 (5-246)
452 (303-665)
330 (146-1078)
200-1000
7 (3-11)
9 (2-18)
13 (3-17)
11 (5-37)
36 (18-59)
64 (36-96)
0.0125 (0.005-0.038)
1.2 (0.01-1.9)
8 (4-14)
5 (2-10)
1000-4450
0.6 (0.3-0.9)
0.8 (0.2-1.5)
1.1 (0.2-1.4)
0.8 (0.4-3)
-
-
0.0009 (0.0003-0.004)
0.09 (0.0009-0.25)
0.6 (0.3-1.1)
0.4 (0.1-0.8)
- 118 -
areas of the North Atlantic and Pacific Oceans (200-1 300 mg C m-* a - 1) is
similar in magnitude to these values.
It was concluded by Hargrave (1985a) that estimates of organic carbon
content present in material settled in sediment traps, combined with calcula
ted rates of organic carbon flux - dependent on the level of phytoplankton
production and depth - yield values of dry matter sedimentation over depth
which are not different by mere than a factor of five from observed rates in
studies completed since 1980. The unresolved seasonality in most studies of
sedimentation in the open ocean introduces an error of this magnitude. Calcu
lations from empirical regressions and observations since 1980 show that,
dependent on levels of phytoplankton production, dry matter sedimentation at
bathypelagic depths in central ocean regions varies between 5 and 50 g m
a . Sedimentation in shallow waters (< 1 000 m) over continental shelves and
adjacent slopes is increased five-fold (25 to 250 g m-2 a ) with higher rates
in areas receiving terrigenous material or subject to laterally transported
particulate matter. Areas of high phytoplankton production in upwelling
regions have rates of dry matter flux an order of magnitude above those which
occur in the central ocean.
Massive depositions of phytodetritus originating from the spring bloom
have been observed at depths of up to A 475 m off south-west Ireland and in
the Rockall Trough (Billett e_t al ., 1983; Lampitt, 1985). A similar seasonal
sinking, of senescent radiolaria, also occurs in late summer in the north
Pacific (Vinogradov and Tseitlin, 1983). Such variations are not however
restricted to temperate regions; seasonal variations in midwater fluxes have
been observed in deep sediment traps in the Sargasso Sea and Panama Basin
(Deuser and Ross, 1980; Deuser, 1986; Honjo, 1982; Ittekot e£ al. 1984a;
Ittekot et al., 1984b), and seasonal variations in zooplankton abundance occur
to depths of at least 2 000 m in the Sargasso Sea (Deevey and Brooks, 1971).
Other indirect evidence of seasonality in the deep sea comes from seasonal
reproduction in several species of echinoderms and fish (Tyler and Gage, 1980,
1984; Tyler et al_., 1982; Rannou, 1975; Gordon, 1979), from the existence
of varves in the Gulf of California (Calvert, 1966), from supposed annual
growth bands on deep-sea molluscs and fish otoliths (Turekian et_ aJU, 1975;
Savvatimskly et al., 1978; Geistdorfer, 1982), and from variations in the
deep-sea community oxygen consumption (Smith and Baldwin, 1984a).
- 119 -
Thus seasonal variability may be expected to occur at sites such as GME,
and there is indeed evidence to suggest that it does. Indirect indications of
such variability are provided by the midwater fish data, but seasonality has
been observed directly from sediment traps deployed at GME between December
1985 and October 1986. Fluxes were highest between December and May and
lowest between May and July (IOS unpublished data).
The manner in which such particulate materials interact with radionuc
lides, and thus the resultant fluxes, were not discussed by the BTG. These
matters were handled by the Physical Oceanography Task Group. But it is worth
recording that, since the principal calculations and modelling has been com-
rleted, a thorough and extensive review of the role of large particles in the
transport of elements through the water column has been published by Fowler
and Knauer (1986). This review contains an excellent summary of a large quan
tity of very relevant data to such ocean modelling, and forms a mope valuable
data base for future work.
Bioturbatlon
Bioturbation is the disturbance of the superficial layers of sediment by
biological processes. It can affect the sediment in a number of ways. The
principal effect is that of the reworking of sediments by the burrowing of
infaunal organisms or deposit-feeding epifauna. This reworking may expose
radionuclides whose source is within the sediments, or bury those arising from
the water column. It may also influence the porosity of the sediments.
Extensive reworking is generally considered to be limited to the top 10 cm of
the bottom deposits of the deep sea, in which the chemical characteristics are
usually uniform. However, a number of burrowing organisms are known to pene
trate deeper and their burrows are likely to alter the chemical environment
within their immediate vicinity, as well as greatly increase sediment poro
sity. Photographic surveys have shown that the apparent degree of reworking
can vary substantially between quite small adjacent areas.
In addition, bioturbation can result in resuspension of material from the
effects of exhalent respiratory currents, the burrowing of the infauna, and
the more vigorous movements of the scavenger/carnivore community. And it can
- 120 -
also result in the roughening of the sediment/water interface caused by
tracks, burrows and mounds, which alters the frictional drag between sediment
and water. In low current conditions this may inhibit resuspension, but if
the water movements exceed a critical limit the roughness may increase the
rate of erosion.
The nature and extent of animal burrows in deep-sea sediments has been
reviewed in an IOS report (Hydes, 1982). Quantitative estimates of mixing
rates have been discussed by several authors (e.g. Guinasso and Schink, 1975;
Smith and Schafer, 1984; Smith etal., 1986). Through the BTG, data have
also been discussed which have arisen from the CRESP activities, as reported
in the Tenth Annual Report (1987). Studies of sediment bioturbation by
benthic fauna were summarized for a number of locations in the North Atlantic
Ocean (Kershaw, 1985) and at the NEA low-level dump site (Kershaw et al.,
1985) using 1UC and 2 1 0Pb dating methods. The data (Table XTX) show that
sediments are mixed to a depth (L) of up to 15 cm and that rates of bioturba
tion (D ) vary from 1 to 15 x 10~9 cm2 s-1. Sediment accumulation rates (w) D
range from < 0.05 to about 3 cm ka~ , showing that annual mixing of surface
sediments by fauna can exceed the annual rate of burial. This means that
superficial deposits are reworked many times before permanent burial.
Bioturbation results in the transfer of particles and pore-water across
the sediment-water interface. Analyses of lf*C and 2 1 0Pb profiles within sedi
ment cores give a measure of the net result of these fluxes. These mixing
rates can also be observed directly. An ^n situ dialysis probe (Kepkay,
1985) was developed to measure the diffusion of isotopes introduced into the
subsurface of undisturbed sediment. The experiments were carried out with
nearshore sediment to measure the mobility of trace metals and two radionuc
lides (2i,1Am and 137Cs) in terms of their rate of sorption to sediment par
ticles. Bacterial and chemical processes (separated by poisoning with sodium
azide) were involved in sorption reactions that restricted the mobility of
both radionuclides. The binding of 241Am was closely associated with bac
terial manganese oxidation, whereas 137Cs remained in solution, behaving more
like copper. The probe has been tested using 5>fMn introduced at the depth of
transition from oxidizing to reducing conditions (Kepkay, 1986). Probes were
also incubated in box cores retrieved and re-moored near the bottom in the
Nares Abyssal Plain. These data have yet to be fully analysed, but results
- 121 -
show that studies of in situ ion mobility in surface sediments are possible.
The role of microbial participation in the flux of substances through the
sediment can be quantified directly.
Laboratory experiments have also been performed to study the exchange of
*Am and " Pu between sea water, labelled organic particles, and sediments
(Hargrave, 1986). Concentrations of both elements adsorbed on to moulted
exoskeletons f-*>m the euphausiid Meganyctlphanes norvegica decreased exponen
tially with 50Z retention times of three to seven days when moults were
incubated in filtered sea water with small amounts of sediment. Most of the
radioactivity lost from moults was adsorbed to < 43 um silt particles. These
particles comprise > 95Z of the sediment weight. However, when adsorbed con
centrations were calculated as atoms |im~2, adsorption of both actinides was
greatest in the carbonate-rich sand size fraction of the sediment. The
enrichment shows that non-homogeneous distributions may arise between particle
types when actinides such as ^Am and 2 Pu which are sorbed to surfaces of
organic particles are transferred to sediments.
Thus it has been shown throughout the programme that biological processes
play a major role in determining the distribution of radionuclides in the
oceans; primarily by the production of particles and by bioturbation. Their
principal importance, however, is in providing pathways which lead to human
exposure via seafood consumption, as will be discussed in the next chapter.
- 122 -
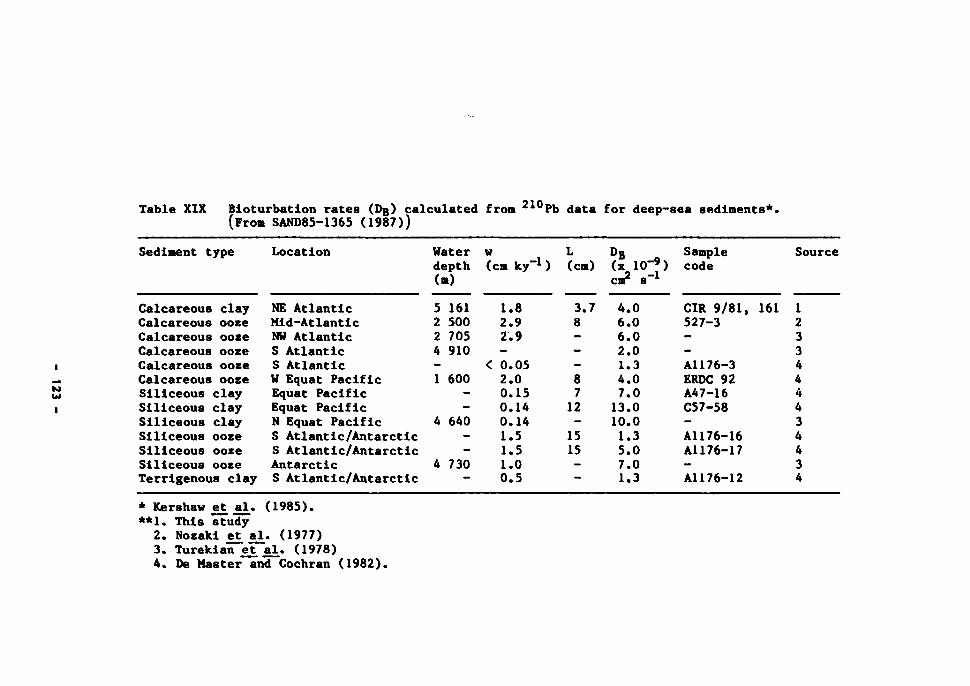
Table XIX Bloturbatlon rates (Dg) calculated from 21 Pb data for deep-sea sediments*. (From SAND85-1365 (1987))
to
Sediment type
Calcareous clay Calcareous ooze Calcareous ooze Calcareous ooze Calcareous ooze Calcareous ooze Siliceous clay Siliceous clay Siliceous clay Siliceous ooze Siliceous ooze Siliceous ooze Terrigenous clay
Location
NE Atlantic Mid-Atlantic NW Atlantic S Atlantic S Atlantic U Equat Pacific Equat Pacific Equat Pacific N Equat Pacific S Atlantic/Antarctic S Atlantic/Antarctic Antarctic S Atlantic/Antarctic
Water depth (m)
5 161 2 500 2 705 4 910 -1 600
--
4 640 --
4 730 -
w (
<
cm ky_1)
1.8 2.9 2.9 -0.05 2.0 0.15 0.14 0.14 1.5 1.5 1.0 0.5
L (cm)
3.7 8 ---8 7 12 -15 15 --
DB (x 10-?) cm2 s"1
4.0 6.0 6.0 2.0 1.3 4.0 7.0 13.0 10.0 1.3 5.0 7.0 1.3
Sample code
Source
CIR 9/81, 161 1 527-3 --All76-3 ERDC 92 A47-16 C57-58 -A1176-16 A1176-17 -A1176-12
2 3 3 4 4 4 4 3 4 4 3 4
* Kershaw et al. (1985). **1. This study
2. Nozaki et al. (1977) 3. Turekian et al. (1978) 4. De Master and Cochran (1982).
7: BIOLOGICAL PATHWAYS OF THE TRANSFER OF RADIONUCLIDES BACK TO MAN
Introduction
The possibility of radionuclides being transported back to man from the
deep sea, via biological pathways, needs to be considered from a number of
different aspects. First of all, one of the most important calculations to be
made in evaluating the feasibility of high-level aste disposal into the
sedlcents of the deep sea is that which estimates the potential dose to man 1
relation to the recommended dose limits for members of critical groups. In
other words, in relation to those pathways which would result in the highest
doses to individuals rather than the dose to populations as a whole. The
extent to which biological pathways contribute to collective doses, and the
role they play in effecting the large-scale distribution of radionuclides in
the sea, will be discussed separately in Chapter 9.
Biological pathways are not, of course, the only pathways of transfer;
but they are considered to be the prime means by which radionuclides could
result in human exposure - by the consumption of seafood.
The first point to note is that the vast majority of seafood taken for
human consumption is obtained from depths of less than 200 m, whereas the dis
posal sites considered are at depths greater than 4 000 m. Benthic algae are
harvested from waters of a few tens of metres, the majority of bivalve and
univalve molluscan shellfish, and crustaceans, are taken in waters of less
than 100 m, and fish are caught primarily in waters of less than 200 m. Most
of this seafood is also taken at the margins of the ocean. The principal
means by which the human population could be exposed to radionuclides arising
from the deep sea is thus as a result of advective and diffusive processes
eventually leading to the contamination of these surface and coastal waters,
and thus, in turn, to the contamination of shallow-water seafood. It is for
this reason that such emphasis is quite rightly placed in the 'far-field'
modelling of physical and chemical oceanography. Nevertheless, it is also
necessary to consider the possibilities of other more direct links between ma
and the deep sea.
- 124 -
The first and easiest to discuss of such possibilities is the direct con
sumption by man of species living at depths of > 4 km, including those within
a disposal area. Fish which are sufficiently large to eat do exist at these
depths - notably Coryphaenoides armatus, which weighs > 1 kg - but their den
sity is low, as discussed in Chapter 4. Indeed it is extremely unlikely that
fish from such depths would ever provide a sustainable life-time food source
for a critical group, although they could be consumed by some individuals at
infrequent intervals.
The second possibility is that species regularly consumed at 'fishable'
depths have food chain links with fauna at greater depths. This is best exa
mined by considering what is known about the deepest living species which are
regularly eaten, or those species which are caught in the open ocean. But it
is also necessary to consider the question the other way round, and to examine
the possibility of contaminated biota in the region of a disposal site result
ing in the transfer of radionuclides along discrete pathways back to shallower
waters. Both possibilities have been examined.
Existing commercial 'deep-sea' pathways
Squid and other cephalopoda are much prized as seafoods, and most people
are aware that squid also inhabit the deep sea. This potential pathway is
thus often cited as an important one, and was addressed in some detail in
relation to the NEA low-level waste dump site in the Atlantic (NEA, 1985).
The conclusions of that study are equally valid here. The total quantity of
cephalopoda taken for food is between 1 and 1.5 million tonnes (Mt), over half
of this being taken in the north-east Pacific Ocean. Estimates of the poten
tial cephalopod fishery vary considerably. For example, Voss (1973) gave an
annual value for shelf seas and upper slope resources of between 8 ;nd 12 Mt,
but a more recent review (Caddy, 1983) estimates the true potential to be
closer to 2.9 Mt.
Essentially only three types of cephalopod are caught commercially:
octopods, sepioids and teuthoids. The first two - octopus and cuttlefish -
are largely bottom-living organisms whereas the third group, the squids, occur
at all depths in the sea. All three have certain aspects of their biology in
- 125 -
connon, and these are inportant fron a fisheries point of view. Cephalopoda
in general are not notably fecund. Most species lay large, teleolecithal
(yolky), benthonic eggs, often well protected in gelatinous egg cases, and
•any species appear to brood or otherwise guard the eggs until they hatch.
With a short, free planktonic, stage in most species the survival rate of the
larvae is therefore considered to be quite high. The tine to hatching of soae
species is also apparently temperature-related so that larvae hatch at the
optimum feeding period. This is important because a large number of cephalo-
pods are thought to spawn only once in their relatively short life-tines: the
majority of squid live only 1 to 3 years and die after spawning, the same is
true for the cuttlefish, and octopods nay live only 3 to 4 years. This is one
reason for modifying the potential catch estimates: although the standing
stock at any one tine may be relatively high, their short life span is such
that the high productivity/bionass quotient suggests that the sustainable
yield would be considerably different, and lower, fron that of a comparable
fish stock in which the adults spawn several times throughout their lives
(Caddy, 1983; Amaratunga, 1983). A review of advancements in assessing
cephalopod resources has recently been compiled by the FAO (1983).
In common with other cephalopoda, most squid have high growth and morta
lity rates. Mature females are often found in population sanples during much
of the year and many species are believed to spawn at different periods during
the year producing different cohorts. Smaller oceanic squid, and juvenile
stages of other cephalopods, feed on planktonic organisms but make a transi
tion to a diet of fish or squid later in life. Cannibalism is of widespread
occurrence and this probably represents a mechanism for ensuring that the gene
pool - essential for stock replacement in an annual species with only a single
spawning per individual per life-time - makes a successful transition from a
planktivorous mode of life to higher order predation in an uncertain environ
ment (Caddy, 1983). The relatively large size of prey relative to body size
even allows predation on other individuals of the sane cohort. This use of
cannibalism is facilitated in some species by sexual dimorphism in growth,
females growing faster than males, the larger Individuals preying on smaller
males. Squid usually take part in one or more migratory phases during their
life history, and populations are often distributed in relation to major
oceanic current systems and close to the boundaries of water masses with dif
ferent temperature or other hydrographlc characteristics.
126 -
Two families of squid are exploited extensively, the Loliginidae and the
Onmastrephidae. The loliginids are myopsid squid and the common genus Loligo
is found in all the major oceanic regions, with a habitat ranging from very
shallow water to depths of ~ 200 m at the continental shelf break. Their
migration patterns usually reflect north-south distribution changes in water
temperature or local inshore-offshore orientations. Small ones feed largely
on crustaceans, larger ones on fish, and cannibalism also occurs. These
neritic squid are fished commercially world-wide and of particular importance
are: I., forbesi in Europe south to Madeira; I., vulgaris from Europe and the
Mediterranean south to the Gulf of Guinea; I., pealil from New England to the
Caribbean; h. edulis in the Indo-West Pacific; and L. opalescens off
California.
Members of the other major family of squid taken commercially, the
ommastrephids, are oegopsid squid. These occur in all seas; some species are
totally oceanic but others migrate inshore during certain seasons. By far the
largest fishery is the Japanese one for Todarodes pacificus. In the north
Atlantic there is a smaller one for Illex llleceprosus and JL coindeti, and
other species are caught in the Pacific and Indian Oceans. Two species of
Ommastrephes are important in local fisheries, £. calori on the north-eastern
coast of the Atlantic and in the Mediterranean, and £. pteropus in the south
Atlantic and Caribbean.
With regard to the potential for squid playing a significant role as a
pathway of radionuclide transfer to man, both their horizontal and vertical
distributions are of relevance. For example, the American squid, Loligo
pealii moves laterally over considerable distances, the northern limit of its
range being 600 km further south in winter than it it in summer (Summers,
1969). In winter the bulk of the population is concentrated in the centre of
the mid-Atlantic Bight on the outer edge of the continental shelf; in spring
and summer the populations move inshore and in general populations are most
abundant where the bottom temperature exceeds 8°C. But of greater importance
are the vertical migrations. Both loliginid and ommastrephid squid exhibit
diurnal migrations, being nearer the surface at night. Squid are often
associated with deep scatttring layers and their vertical migrations are pre
sumably associated with the pursuit of food species. The loliginids are
relatively shallow-water living, however, and only the omtnastrephids appear to
- 127 -

engage in extensive vertical migrations. In view of their short life-cycles
it is to be presumed that individuals of each species could have spent parts
of their lives at the different depths over which the specie3 has been found -
as opposed to there being different populations living pertinently at diffe
rent depths. Both (>. caroli and £. pteropus are the dominant near-surface
species where they occur. Schools of up to 50 individuals appear regularly at
the surface at night but they have been observed at depths of 1 500 and
3 000 m respectively (Baker, 1957, 1960). The omnastrap Slid Todarodes sagit-
tatus is common in the Mediterranean and Atlantic, exterding to northern
Norway, Iceland, Bear Island and the Lofoten Islands and entering the fishing
grounds off Madeira to the south during March, April and Hay. It is taken
both for food and bait in Madeira and in Norway (Rees and Maul, 1956; Wiborg,
1978), and although it comes to the surface at night its daytime distribution
is between 70 and 800 m, and may extend to 1 000 m. Some species are known to
have fairly well-defined depth ranges in certain areas, however; for example,
Illex coindeti, the predominant species on the broad continental shelf off
Morocco, is completely replaced by £. pteropus at a depth of about 180 m
(Clarke, 1963).
It therefore appears unlikely, in view of the known vertical distribu
tions of the species caught commercially, that any squid consumed by man would
have spent a significant part of its life cycle in waters > 3 000 m and, for
the majority of cephalopods, in waters > 1 000 m. Cephalopods are, neverthe
less, known to inhabit waters > 3 000 m. In an extensive review of oceanic
squid, Clarke (1966) records that only a third of oegopsid squid species have
been recorded at depths > 1 500 m and that, essentially, the only family which
extends to depths greater than 3 000 m is the Chiroteuthidae. None of this
family is taken commercially. Sustainable direct links between cephalopods in
deep oceanic water and man are thus unknown, at present.
Apart from squid, the only other links with the deep sea are certain
species of fish. The tuna and tuna-like species are caught at great distance
from land, and they do eat squid. But they are essentially surface-water fish
(< 100 m depth) which range over large areas of the world's oceans. They are
migratory, and their geographical distribution is usually closely correlated
with surface-water temperatures. They do not, therefore, constitute a link
with the deep sea other than via the squid upon which they prey.
- 128 -
Of other commercial fish species, few are caught at depths > 500 m but
one notable exception is the espada, or black scabbard (Aphanopus carbo).
According to Wheeler (1978) this species is considered to live in midwater at
depths of 180 to 6&0 m off southern Europe, coming closer to the surface at
night; in more northern waters it is considered to live at a somewhat deeper
range, from 300 to 900 m. Harrisson (1967), however, reports that this
species is fished off Madeira to depths of up to 1 600 m, lines typically
being set at depths of between 550 and 1 100 m where the sea bed is at a depth
of 1 500 m. Other data on Aphanopus carbo indicate a depth range of 1 800 m
to 2 200 m off Madeira (Bettencourt e£ ajL, 1980). It is certainly not clear
as to what depth range the species may inhabit during its total life cycle,
and whether or not it should be considered as a demersal form confined to the
continental slopes and the banks around islands and coastal ridges. Its diet
includes many mesopelagic species, including those of the Searsidae, Stomiati-
dae and a wide variety of ceratioid angler-fishes (Harrisson, 1967) and it is
also believed to include shrimps and squid (Wheeler, 1978).
The black scabbard is something of a local delicacy and is not fished
extensively elsewhere, even though it exists in reasonable numbers. Trawls
off western Ireland, for example, have yielded catch rates of 21 kg h_1 at
depths of 550 to 800 m (Bridger, 1978). The landings of black scabbard are
not reported by FAO in its annual fishery statistics. Landings for 1981, from
Portuguese data, indicated an annual catch of less than 6 000 t.
In addition to the black scabbard, there is a considerable fisheries
potential at depths > 200 m, in some areas, for fish such as blue ling, fork-
beards, grenadiers and various sharks. Exploratory fishing by the UK at
depths between 550 and 1 200 m have yielded ~ 700 kg h-1 of mixed species
(Bridger, 1978). Other countries have explored fishing potential to depths of
1 500 or 2 000 m for both fish and invertebrates. Such fisheries developments
depend partly on economics, but even if such fisheries were to be exploited
there is little evidence to suggest that sustainable food chain links would
exist with fauna at depths greater than 4 000 m, as discussed in the subse
quent paragraphs.
- 129 -
The possibility of mldwater transport
The role of biological processes within the water column, from the sur
face down, in effecting the transport of radionuclides along potential path
ways to man has been the subject of several reviews - for example Angel
(1983b) and the extent to which pelagic organisms in the open ocean extend
their range into underlying waters has already been discussed in Chapter 2.
It is a subject which has also been reviewed in some detail in an IOS report
'fted by Booty (1985). There is no evidence to suggest that regular diel
ations link deep water (> 4 000 m) and epipelagic and mesopelagic zones.
Vertical transport from the sea bed
An alternative to attempting to trace food links from surface waters to
the deep sea is to consider the evidence relating to the vertical distribution
of fauna above the sea floor at great depths. Necrophageous amphipods are
well known examples of benthic/near-bottom living animals which also occur
many hundreds of metres above the sea bed. Eurythenes gryllus is the best
documented example but several other species have similar behaviour and
distributions (see, for example, Roe e_t £]_•, 1987 and references therein).
Ingram and Hessler (1983) have stressed the Importance of physical pro
cesses in influencing the vertical distribution of amphipods within 50 m of
the bottom in the Pacific based on the following: the distance that odour can
diffuse from a food fall, and the idea that the vertical distribution of
Eurythenes gryllus, up to tens of metres above the bottom, is primarily a
function of chemosensory reception of food falls, and strongly influenced by
two physical conditions within the benthic boundary layer. The first is that
the population base is delimited by the turbulent Ekman layer - approximately
4 m off the ocean floor - which results in slower odour dispersion by currents
along the bottom. And the second is that the upper extreme of the major popu
lation is determined by the vertical diffusion rate of an odour. They predic
ted that this dispersal rate, coupled with the rapid ingestion of a 1 to 5 kg
food fall in 24 to 28 h, would limit upward diffusion of an odour to approxi
mately 20 m. These views have been modified by Smith and Baldwin (1984b) who
considered that, given the high densities of amphipods attracted to bait near
- 130 -
the bottom, the inferred low abundance of these animals (Hessler, 1974), and
the slow diffusion rate of an odour vertically, it would seem unlikely that
E. gryllus at 20 m or higher would benefit from a food fall in time. Instead,
they proposed that, for IS. gryllus and probably other deep-sea scavenging
amphipods, chemoreception is important in the near-field - odour disseminating
distance - but that mechanoreception is more important in the far-field - the
sound reception range. Thus the arrival of a food fall first attracts scaven
gers in the near-field, and the 'noise' of their feeding and swimming is
carried rapidly beyond the near-field odour boundary to scavengers occupying
the far-field.
It is possible that amphipods residing some distance above the bottom
could detect bait falls before they reach the bottom and track them either by
chemoreception or mechanoreception, particularly in view of the fact that
Hamner and Hamner (1977) have shown that planktonic shrimp are capable of
tracking odour trails created by falling organic particles. The gut contents
provide some insights into the niche occupied by _E. gryllus caught in baited
traps at various heights above the bottom. Gut contents of 57 12. gryllus
collected at station MPG-1 in June and November 1982 (altitudes > 20 m) reveal
that amphipods below 100 m had amorphous material or nothing in their gut
(94.4%). Many animals above 100 m, however, had slices or chunks of tissue in
their guts (38.6%), some of which appeared to be squid. Thus amphipods living
near the bottom could feed primarily by necrophagy (on dead material) whereas
those further up the water column could be predatory. Indeed it was noted
that the morphology of Eurythenes gryllus - with specially adapted slicing
mouth parts (Dahl, 1979) and grasping-type dactyls - would suggest that, as
predators, these animals could utilize prey of a wide variety of sizes up to
fishes considerably larger than themselves. In addition, their increased siz
coupled with increased swimming speed and increased distance off the bottom
would enable them successfully to pursue large mobile animals: an energeti
cally efficient strategy. Possible prey species in the North Pacific are the
rat-tail fishes. E_. gryllus has also been reported to attack fish hooked on
set lines and cling to moribund prey floating to the surface (Templeman, 1967'
Bowman and Manning, 1972).
In summary, therefore, it would appear that although some amphipods do
occur well above the sea bed, this is still a strategy related to a food
- 131 -
source which either arises from overlying waters or from pelagic species at
depth which, in turn, probably rely on a similar food source. But there are
other species which may well feed on the bottom, on sediment, and then rise up
into the water column. The most spectacular of these are not amphipods, but
holothurians - sea cucumbers, a class of echinoderms.
The majority of holothurians live, as adults, on the sea bed. Some of
the benthic species, e.g. Benthodytes and Psychropotes have pelagic juveniles
which have been caught thousands of metres above the bottom. Juvenile Bentho
dytes were caught in midwater at GME and a general account of the biology and
ecology of these animals is given in Roe e_t ja . (1987). Other holothurians
have a totally pelagic lifestyle, living just above the sea bed in open ocean
areas. These benthopelagic species were very poorly known prior to the advent
of acoustically telemetered trawls, photographic systems and submersibles, but
many specimens have now been found living within 100 m or so of the sea bed at
abyssal depths (see Roe et al., 1987).
Several species of pelagic holothurians occur at mesopelagic/shallow
bathypelagic depths as well as near to the bottom. One species (Enypniastes
diaphana) has even been found swimming at the surface. At GME E_. diaphana and
Scotothuria herringl were most abundant within 100 m of the sea bed but a
juvenile Enypniastes was caught 2 500 m above the bottom and individual
Scotothuria were caught at up to 4 000 m above the bottom.
The reasons for these migrations, their frequency, duration, extent and
the numbers of animals which undertake them are unknown. Many, but not all,
of the pelagic individuals are juveniles and one possibility is that these are
undergoing an ontogenetic migration or dispersal phase. Both Enypniastes and
Scotothuria feed on the bottom ingesting sediment, and even the guts of speci
mens taken within 100 m of the bottom are usually packed with material.
This could represent a possible mechanism for raising contaminated sedi
ment off the bottom, but the guts of all animals captured in shallow midwater
have been empty. Whether or not midwater feeding occurs is unknown. Clearly
these extensive migrations could act as a direct link between the bottom- and
near-surface layers. Quantitatively, however, these migrations are thought to
represent such a small amount of biomass that it is most unlikely that they
- 132 -
will contribute to a significant upward flux of material relative to physical
processes on a large, basin-wide, scale, as discussed in Chapter 6. Further
work is needed to clarify these migrations.
Several fish are also known to have extensive vertical ranges above the
sea floor. The best documented of these are macrourids (e.g. Coryphaenoides
sp.) which have been caught up to 1 400 m above the sea bed (Roe, 1985). In
addition, specimens of the benthic tripod fish, Bathypterois have been taken
at 1 000 m over a sounding depth of 3 200 m to the south of the Azores (Booty,
1985). And at 42°N 17°W single specimens of juvenile Halogyreus johnsoni and
Paratlparis species were taken at 1 000 m over a sounding of about 5 000 m
(Angel et al., 1982). There are also a number of reports in the literature of
benthopelagic fishes with mesopelagic prey in their stomachs, which have been
interpreted as evidence for the occurrence of migrations by bottom-living
fishes up into midwater to feed.
Other activities may of course result in the upward transport of mate
rial. The larvae of a number of benthic species develop in midwater, such as
those of the mollusc Benthonella (Roe et al., 1987). Feeding by predators and
scavengers which involves the breaking up of food before consumption can also
result in the release of buoyant substances such as lipids into the water
(Yayanos and Nevenzel, 1978). Although such processes involve small-sized
particles, and are most unlikely to provide an important pathway, more infor
mation on the source and fate of buoyant particles is required.
Thus it must be concluded that none of the observations to date indicate,
or imply that, sustainable food chain links exist vertically through the wate
column from the deep sea to the surface. Indeed the paucity of fauna between
2 500 D and to within 100 m or so of the sea floor, together with the lack of
evidence of vertical migrations at depths greater than 2 000 m, makes such a
hypothesis exceedingly unlikely. But there is one further possibility of
transport of radionuclides back to man, and that is along a 'corridor', close
to the sea bed, in the bentho-pelagic zone.
- 133 -
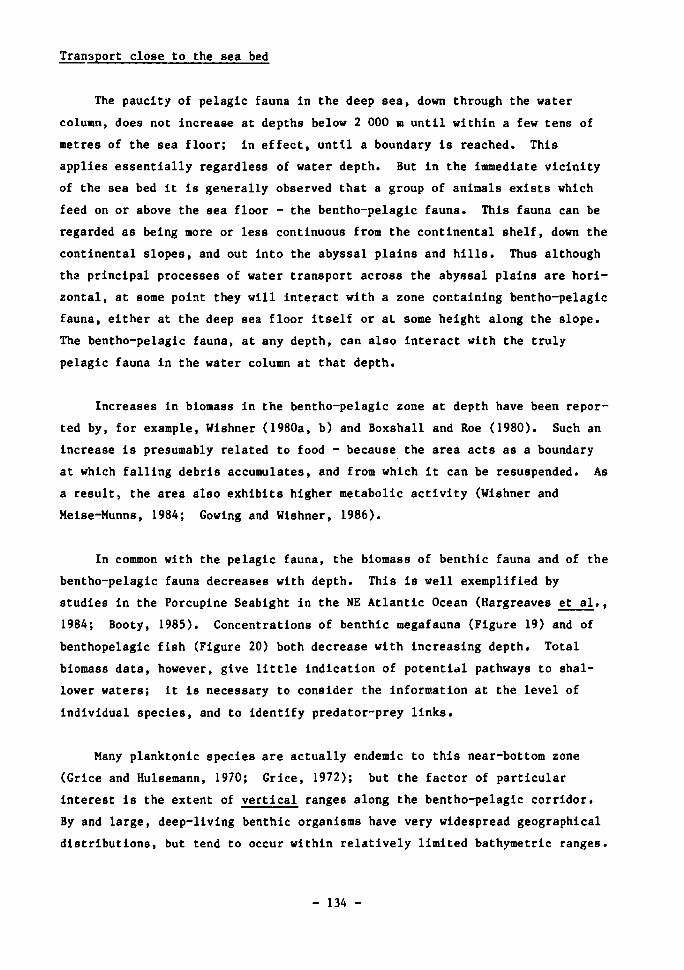
Transport close to the sea bed
The paucity of pelagic fauna in the deep sea, down through the water
column, does not increase at depths below 2 000 m until within a few tens of
metres of the sea floor; in effect, until a boundary is reached. This
applies essentially regardless of water depth. But in the immediate vicinity
of the sea bed it is generally observed that a group of animals exists which
feed on or above the sea floor - the bentho-pelagic fauna. This fauna can be
regarded as being more or less continuous from the continental shelf, down the
continental slopes, and out into the abyssal plains and hills. Thus although
the principal processes of water transport across the abyssal plains are hori
zontal, at some point they will interact with a zone containing bentho-pelagic
fauna, either at the deep sea floor itself or at some height along the slope.
The bentho-pelagic fauna, at any depth, can also interact with the truly
pelagic fauna in the water column at that depth.
Increases in biomass in the bentho-pelagic zone at depth have been repor
ted by, for example, Wishner (1980a, b) and Boxshall and Roe (1980). Such an
increase is presumably related to food - because the area acts as a boundary
at which falling debris accumulates, and from which it can be resuspended. As
a result, the area also exhibits higher metabolic activity (Wishner and
Meise-Nunns, 1984; Gowing and Wishner, 1986).
In common with the pelagic fauna, the biomass of benthic fauna and of the
bentho-pelagic fauna decreases with depth. This is well exemplified by
studies in the Porcupine Seabight in the NE Atlantic Ocean (Hargreaves et al.,
1984; Booty, 1985). Concentrations of benthic megafauna (Figure 19) and of
benthopelagic fish (Figure 20) both decrease with increasing depth. Total
biomass data, however, give little indication of potential pathways to shal
lower waters; It is necessary to consider the information at the level of
individual species, and to identify predator-prey links.
Many planktonic species are actually endemic to this near-bottom zone
(Grice and Hulsemann, 1970; Grice, 1972); but the factor of particular
interest is the extent of vertical ranges along the bentho-pelagic corridor.
By and large, deep-living benthic organisms have very widespread geographical
distributions, but tend to occur within relatively limited bathymetric ranges.
- 134 -
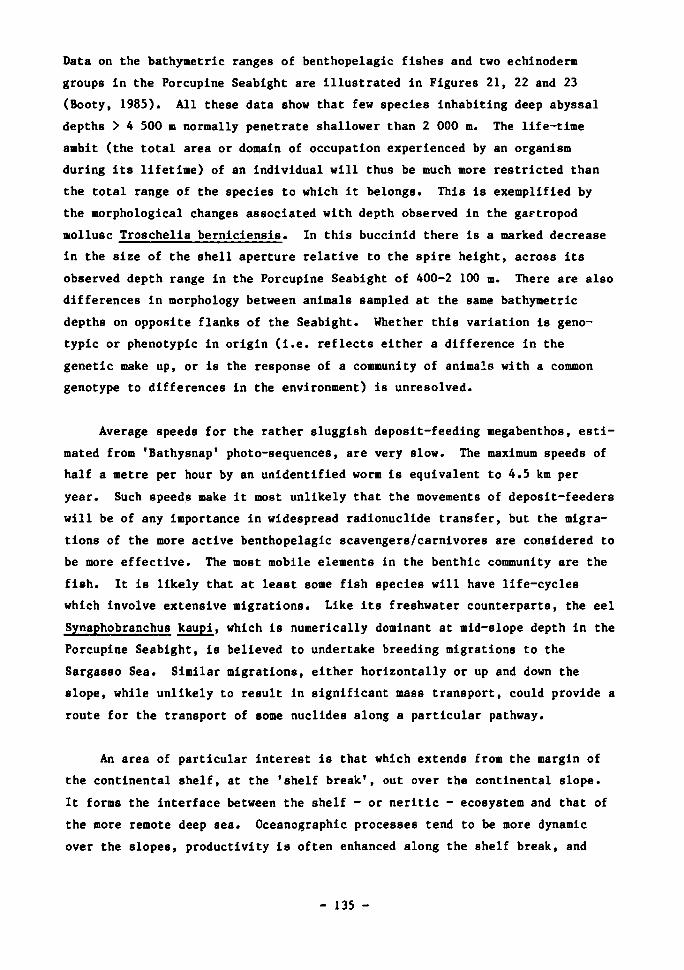
Data on the bathymetrie ranges of benthopelagic fishes and two echinoderm
groups in the Porcupine Seabight are illustrated in Figures 21, 22 and 23
(Booty, 1985). All these data show that few species inhabiting deep abyssal
depths > 4 500 m normally penetrate shallower than 2 000 m. The life-time
ambit (the total area or domain of occupation experienced by an organism
during its lifetime) of an individual will thus be much more restricted than
the total range of the species to which it belongs. This is exemplified by
the morphological changes associated with depth observed in the gastropod
mollusc Troschelia berniciensis. In this buccinid there is a marked decrease
in the size of the shell aperture relative to the spire height, across its
observed depth range in the Porcupine Seabight of 400-2 100 m. There are also
differences in morphology between animals sampled at the same bathymetric
depths on opposite flanks of the Seabight. Whether this variation is geno-
typic or phenotypic in origin (i.e. reflects either a difference in the
genetic make up, or is the response of a community of animals with a common
genotype to differences in the environment) is unresolved.
Average speeds for the rather sluggish deposit-feeding megabenthos, esti
mated from 'Bathysnap' photo-sequences, are very slow. The maximum speeds of
half a metre per hour by an unidentified worm is equivalent to 4.5 km per
year. Such speeds make it most unlikely that the movements of deposit-feeders
will be of any importance in widespread radionuclide transfer, but the migra
tions of the more active benthopelagic scavengers/carnivores are considered to
be more effective. The most mobile elements in the benthic community are the
fish. It is likely that at least some fish species will have life-cycles
which involve extensive migrations. Like its freshwater counterparts, the eel
Synaphobranchus kaupl, which is numerically dominant at mid-slope depth in the
Porcupine Seabight, is believed to undertake breeding migrations to the
Sargasso Sea. Similar migrations, either horizontally or up and down the
slope, while unlikely to result in significant mass transport, could provide a
route for the transport of some nuclides along a particular pathway.
An area of particular interest is that which extends from the margin of
the continental shelf, at the 'shelf break', out over the continental slope.
It forms the interface between the shelf - or neritlc - ecosystem and that of
the more remote deep sea. Oceanographic processes tend to be more dynamic
over the slopes, productivity is often enhanced along the shelf break, and
- 135 -
0-001 Biomass, g. ash free dry weight per mz
o-oi o-i i-o o
200-1
500
1000-
1500-
2000-1
10-0
E
r £2500-Q.
3000-
3500-
4000-
4500-
soooJ
Figure 19 Vertical profile of megabenthic biomass expressed as grammes ash-free dry weight per m2 observed in the Porcupine Seabight region during the IOS benthic programme.
- 136 -
Kg/I000m2
o-
200-
500-
1000-
ttOO-
2000-
E £ 0.2900-
3000-
3500-
4000-
4900
5000-
W 2-0
Figure 20 Vertical distribution of benthopelagic fish biomaos expressed as kilogrammes wet weight per 1000 m2
observed in the Porcupine Seabight region during the IOS deep trawling survey using a semi-balloon otter trawl
- 137 -
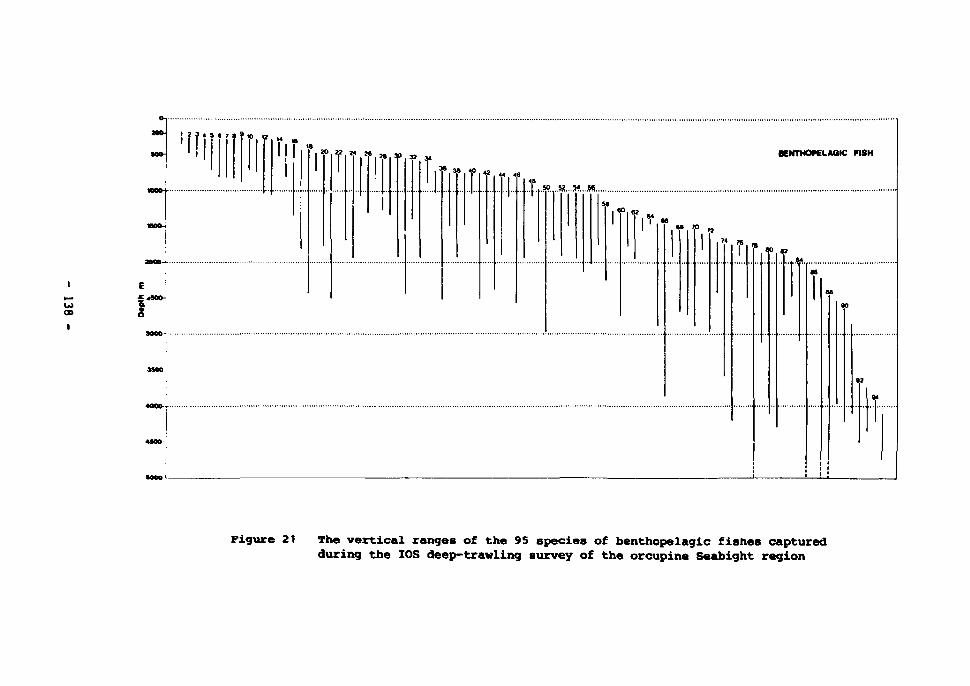
00
200-
S00-
1000-
« 0 0 - .
xrao-
E Jjjaoo-
&
3000-
1500
4000-
4300
1 2 3 4
'HI > « 1 a » » a
rr r T 24 M . 2» 30 32
T|T 30 1 42 44 46
|T SO V
50 r 6 2 H OS
68 "> 7,
l 74 r r» • 0
BENTHOfELAQIC
(2
at
OB
90
i
FISH
( 2
T 1
Figure 21 The vertical ranges of the 95 species of benthopelagic fishes captured during the IOS deep-trawling survey of the orcupine Seabight region
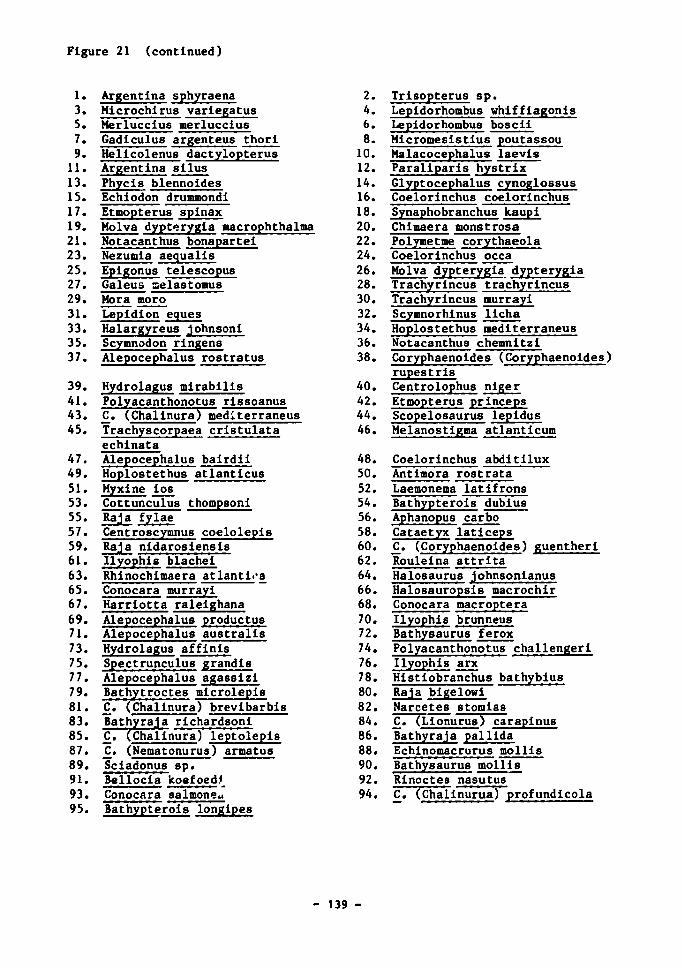
Figure 21 (continued)
1. Argentina sphyraena 3. Microchirus variegatus 5. Merluccius merluccius 7. Gadicuius argenteus thori 9. Helicolenus dactylopterus 11. Argentina silus 13. Phycis blennoides 15. Echiodon drummondi 17. Etmopterus spinax 19. Molva dypterygia macrophthalma 21. Notacanthus bonapartei 23. Nezumia aequalis 25. Epigonus telescopus 27. Galeus aelastomus 29. Mora moro 31. Lepidion eques 33. Halargyreus johnsonl 35. Scymnodon ringens 37. Alepocephalus rostratus
39. Hydrolagus mirabills 41. Polyacanthonotus rlssoanus 43. C. (Challnura) mediterraneus 45. Trachyscorpaea cristulata
echinata 47. Alepocephalus bairdii 49. Hoplostethus atlanticus 51. Myxine ios 53. Cottunculus thompsoni 55. Raja fylae 57. Centroscymnus coelolepis 59. Raja nidarosiensis 61. Ilyophis blachei 63. Rhinochimaera atlantii'a 65. Conocara murrayi 67. Harriotta ralelghana 69. Alepocephalus productus 71. Alepocephalus australls 73. Hydrolagus affinis 75. Spectrunculus grandls 77. Alepocephalus agassizi 79. Bathytroctes mlcrolepls 81. C_. (Chalinura) brevibarbis 83. Bathyraja richardsoni 85. £. (Chalinura) leptolepis 87. £. (Nematonurus) armatus 89. Sciadonus sp. 91. Bellocla koefoedJ 93. Conocara salmoneu 95. Bathypterois longipes
2. Trisopterus sp. 4. Lepidorhombus whiffiagonis 6. Lepidorhombus boscii 8. Micromesistius poutassou
10. Malacocephalus laevis 12. Paraliparis hystrix 14. Glyptocephalus cynoglossus 16. Coelorinchus coelorinchus 18. Synaphobranchus kaupi 20. Chimaera monstrosa 22. Polymetme corythaeola 24. Coelorinchus occa 26. Molva dypterygia dypterygia 28. Trachyrincus trachyrincus 30. Trachyrincus murrayi 32. Scymnorhinus llcha 34. Hoplostethus mediterraneus 36. Notacanthus chemnitzi 38. Coryphaenoides (Coryphaenoides)
rupestris 40. Centrolophus niger 42. Etmopterus princeps 44. Scopelosaurus lepidus 46. Melanostigma atlantlcum
48. Coelorinchus abditilux 50. Antlmora rostrata 52. Laemonema latifrons 54. Bathypterois dubius 56. Aphanopus carbo 58. Cataetyx laticeps 60. £. (Coryphaenoldes) guentheri 62. Rouleina attrita 64. Halosaurus johnsonianus 66. Halosauropsis macrochir 68. Conocara macroptera 70. Ilyophis brunneus 72. Bathysaurus ferox 74. Polyacanthonotus challenger! 76. Ilyophis arx 78. Histlobranchus bathyblus 80. Raja bigelowi 82. Narcetes stomias 84. cT (Llonurus) carapinus 86. Bathyraja pallida 88. Echinomacrurus mollis 90. Bathysaurus mollis 92. Rinoctes nasutus 94. £. (Chalinurua) profundlcola
139 -
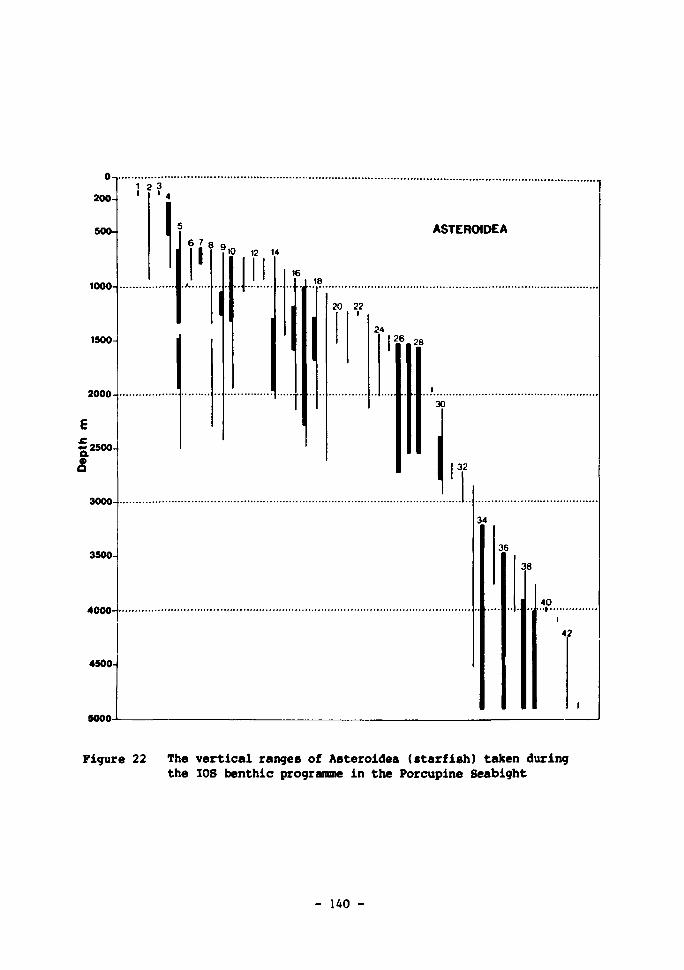
1 2 ?
ASTEROIDEA 6 l 8 Q
I a ' 0 . 12 14
2000-
3000-
20 22
24 I 26 28
30
32
34
36
38
40
«P
Figure 22 The vertical ranges of Asteroidea (starfish) taken during the IOS benthic programme in the Porcupine Seabight
- 140 -
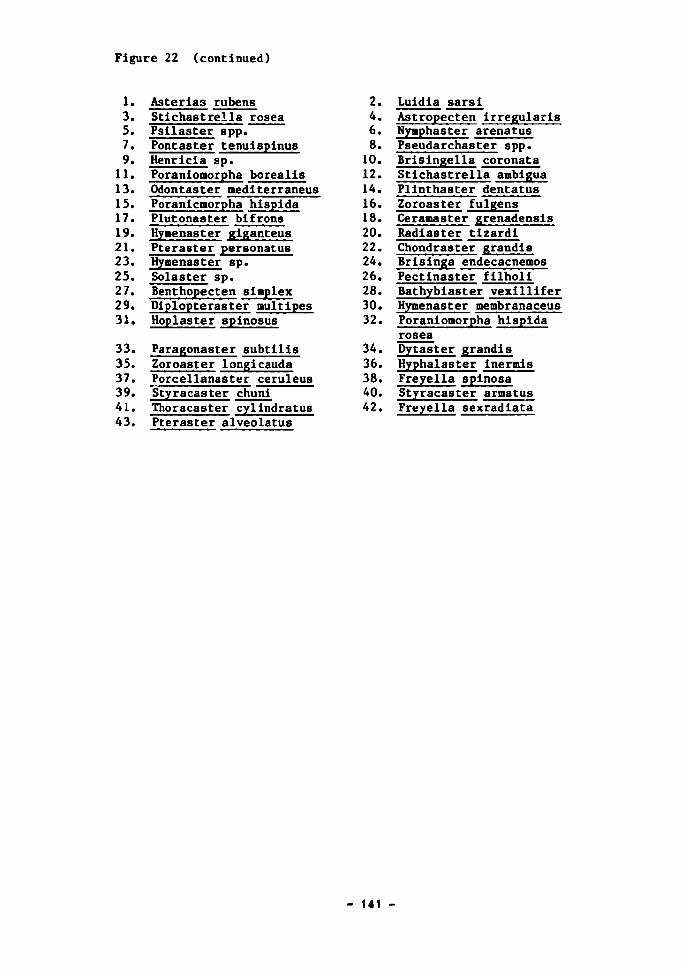
Figure 22 (continued)
1. Asterias rubens 3. Stichastrella rosea 5. Psilaster spp. 7. Pontaster tenuispinus 9. Henricia sp.
11. Poranlomorpha borealis 13. Odontaster mediterraneus 15. Poranicmorpha hispida 17. Plutonaster bifrons 19. Hymenaster giganteus 21. Pteraster personatus 23. Hymenaster sp. 25. Solaster sp. 27. Benthopecten simplex 29. Dlplopteraster multipes 31. Hop1aster spinosus
33. Paragonaster subtills 35. Zoroaster longicauda 37. Porcellanaster ceruleus 39. Styracaster chuni 41. Thoracaster cylindratus 43. Pteraster alveolatus
2. Luidia sarsi 4. Astropecten irregularis 6. Nymphaster arenatus 8. Pseudarchaster spp.
10. Brisingella coronata 12. Stichastrella ambigua 14. Plinthaster dentatus 16. Zoroaster fulgens 18. Cerama8ter grenadensis 20. Radiaster tizardi 22. Chondraster grandis 24. Brisinga endecacnemos 26. Pectinaster filholi 28. Bathybiaster vexillifer 30. Hymenaster membranaceus 32. Poraniomorpha hispida
rosea 34. Dytaster grandis 36. Hyphalaster inermis 38. Freyella spinosa 40. Styracaster armatus 42. Freyella sexradiata
- 141
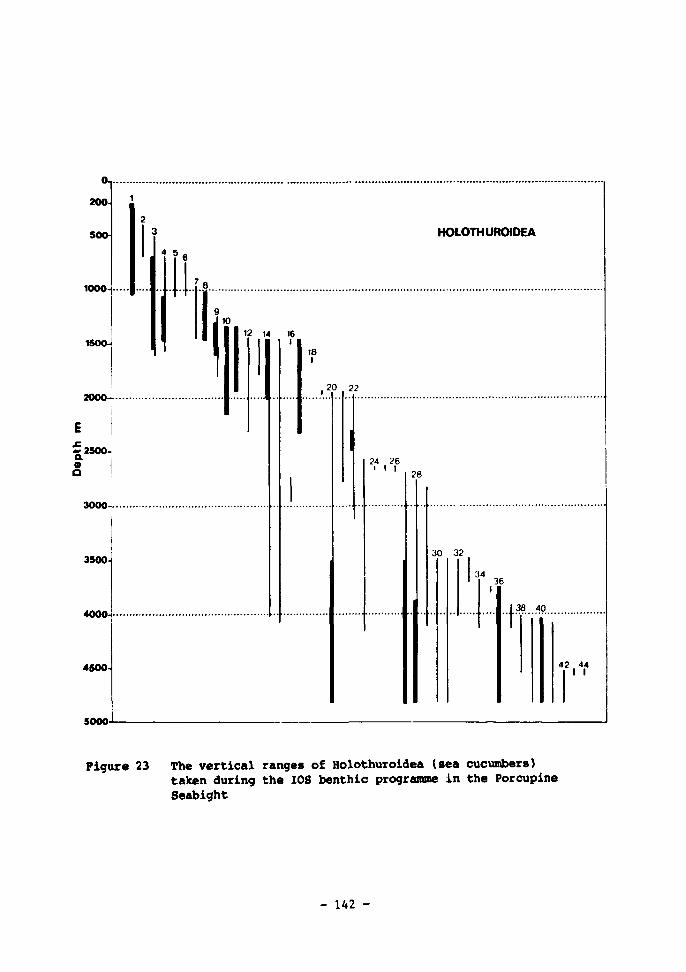
0 ,
200-
500-
1000
1500-
2000-
HOLOTHUROIDEA
« 5 ,
10 12 14 16
I
20 22
~2500-
3000-
24 2 6 • I 1
28
3500
4000-
4500-
5000
30 32
34 36
| 38 40
42 44 I I
Figure 23 The vertical ranges of Holothuroidea (sea cucumbers) taken during the IOS benthic programme in the Porcupine Seabight
- 142 -

Figure 23 (continued)
1. Stichopus tremulus 3. Laetmogone violacea 5. Echinocucumis hispida 7. Mesothuria intestlnalis
9. Mesothuria verrilli 11. Mesothuria lactea 13. Parorlza pallens 15. Kolga hyalina 17. Paelopatides grlsea 19. Mesothuria nov. sp. 1 21. Peniagone azorica 23. Benthothuria funebris 25. Nov. gen. Apoda 27. Molpadia blakei
29. Cherbonniera utricuius 31. Deima validum valldum 33. Protankyra brychla 35. Mesothuria nov. sp. 2 37. Pseudostlchopus villosus 39. Amperima rosea 41. Parorlza prouhol 43. Pseudostlchopus nov. sp.
2. Thyone fusus 4. Bathyplotes natans 6. Psolus squamatus 8. Ypsilothuria talisman!
talisman! 10. Benthogone rosea 12. Mesothuria macroccana 14. Elpidia echinata 16. Mesothuria cathedralis 18. Mesothuria bifurcata 20. Peniagone diaphana 22. Psychropotes depressa 24. Labidoplax sp. 26. Myrlotrochus sp. 28. Oneirophanta nutabilis
mutabllis 30. Benthodytes sordida 32. Siniotrochus nov. sp. 34. Myriotrochus bathybius 36. Psychropotes longlcauda 38. Mesothuria candelabri 40. Pseudostichopus atlanticus 42. Pseudostichopus marenzellerl 44. Psychropotes semperiana
- 143
although it is not a physical barrier it does form an important boundary both
to the zoogeographic distributions of many species and to the way in which the
ecosystems function. On the shelf, the surface pelagic communities are inti
mately linked with the benthic communities and the two strongly interact,
whereas in the deep ocean the shallow pelagic zone is much less influenced by
benthic biological processes. Over the slope this linkage between the shallow
pelagic and benthic systems progressively weakens as the depth increases. So
slope regions are transition zones between the shelf and the deep ocean. In
some areas the slope transition is blurred by the hydrographic processes.
Along the north-east coast of the United States, for example, warm-core eddies
which are spawned from the meandering of the Culf Stream system carry oceanic
species in over the shelf. Incursions of oceanic species over the shelf break
off Europe, however, seem not to be so frequent; although in some years warm
water oceanic species (sometimes termed the Lusitanlan fauna) are advected
north of Scotland and enter the North Sea.
Hargreaves et^ _aJL. (1984) have carried out a detailed assessment of the
biological processes occurring close to the sea bed in the slope region of the
Goban Spur, which lies to the south of the entrance to the Porcupine Seabight.
Their observations were supplemented by others made on the northern flank of
the Seabight. They demonstrated a clear increase in the standing crop of
biomass in the 50-100 m of water immediately overlying the sea floor. This
was attributed to the greater availability of food created by the sea floor
acting as a sediment trap, and subsequent resuspension.
Specific analysis of the catches showed th«t certain taxonomic groups
displayed a greater response than others; polychaetes, for example, exhibited
a very striking increase in biomass, whereas planktonic ostracods showed
little. The total community increase was dominated by decapods and copepods
which were the main constituents of these deep communities. Comparisons with
midwater catches taken nearby in deeper water showed that two decapods,
Sergestes arcticus and Gennadas elegans, not only increased substantially in
abundance close to the sea bed but also extended their distributions into
greater depths over the slopes (Hargreaves, 1984). In both these species the
shallower portion of the population performed diel vertical migrations, but it
was not possible to establish if animals inhabiting the near sea floor under
took such migrations. Some of the data suggested that some of the
- 144 -
bathypelagic species were being displaced by this submergence of normally
mesopelagic species. However, many species appeared to be unaffected by the
presence of the sea bed and their abundances and vertical ranges over the
slope were similar to those observed over deep water. One bathypelagic
species, the ostracod Conchoecia pusilla, spread up from shallow bathypelagic
depths to mesopelagic depths over the slope.
These changes in vertical distributions over slope regions offer an
alternative explanation for the observations of benthopelagic fishes having
midwater species in their stomachs. This had been used to argue that these
fishes, which are seldom taken more than a few metres above the sea floor,
were making regular, extensive migrations up into the midwater to feed; but
from the observations of Hargreaves et al. (1984) the migrations may be by the
pelagic species moving down. However, this does highlight the probability of
a much greater vertical exchange of biomass occurring via feeding migrations
in slope regions.
In the Porcupine Seabight region, the sampling extended down to depths of
1 650 m. There was little evidence of a highly novel fauna, as had been found
in near seabed samples collected at 4 000 m off NU Africa. Studies of benthic
zonation suggest that there is a considerable change in benthic community
structure between 2 000-2 500 m, corresponding approximately to the midwater
change from bathypelagic and abyssopelagic. If there is a comparable deep-
slope faunal boundary in the near-bottom pelagic fauna, this could imply that
biological exchange across the boundary is inhibited relative to other depths.
It may be important to establish whether or not there is any faunal continuity
between upper and mid-slope regions and abyssal depths, particularly amongst
the more highly mobile pelagic forms.
Hargreaves e£ ajk (1984) concluded that slope regions are likely to be a
dynamic interface between the deep-living benthic and benthopelagic communi
ties and the shallower-living shelf communities. They also concluded that if
substantial quantities of radionuclides were transported up to mid-slope
depths (i.e. < 2 000 m) then biological processes could play a 'significant'
role in moving them on to the shelf. But the words 'substantial' and 'signi
ficant' mean little without comparative quantitative data, not only on biota
but on the quantities of specific radionuclides associated with them.
- 145 -
In summary, therefore, the principal means by which radionuclides could
result in human exposure, via seafood pathways, remains that of the ingestion
of shallow- and coastal-water species. Alternatively, the direct consumption
of deep-sea fish could provide a more direct but limited pathway. A review by
GESAMP (IAEA, 1986b) concluded that it would require an area of some 108 m2 to
support a 'fishery', at 4 000 m depth, which would sustain a yield of about
1 fish per day, providing a 300 g fillet for consumption. The possibility of
food-chain transfer links cannot be ignored, however, and although none are
known to exist some attempts have been made to model such food chains in a
theoretical sense, and these are discussed in Chapter 8.
- 146 -
8. BIOLOGICAL TRANSFER FACTOR MODELLING
Introduction
It was concluded in the previous chapter that discrete pathways to man
direct from the deep sea, along a food chain, are extremely unlikely. Never
theless, their possibility cannot be excluded; and yet when none are actually
known, it is not possible to quantify them, although it is usually possible to
model what such a food chain pathway could be in theory, and to constrain it
in such a way that it represents a reasonable hypothesis of what could
happen.
There have actually been many previous attempts to construct food chain
models for pollutant transfer through aquatic environments: for example, that
of Williams (1972) for steady state, non-linear food webs; three and four
compartmental models (Conover and Francis, 1973); the use of gamma and log-
normal distributions (Eberhardt and Gilbert, 1973); equilibrium models for
diverse food chains (Thomann, 1981); models of unstructured food webs
(Isaacs, 1973) and models specifically designed to simulate radionuclide
transfer in the deep sea (Doi et al., 1980). Most of these models require a
fairly extensive data base. And when the food chain transfer is only
considered within a single body of water it is much simpler to model it on a
concentration factor basis because, as previously discussed, the CF value is
an assumed equilibrium value which represents the accumulation of a radio
nuclide from all sources, including prey. The purpose of a food-chain pathway
should be to estimate the concentrations in organisms in water or sediments
which are out of equilibrium with their ambient medium. Thus In the deep sea,
where water movements tend to be fairly horizontal along isopycnals, there is
a possibility of a radionuclide being biologically transported in a direction
normal to the main water flow. In order for a sustained transfer along a
pathway to result in human exposure it is nevertheless necessary to assume
that some degree of equilibrium exists between the predator and prey at each
link in the chain. A simple means of calculating such a transfer was sugges
ted at an interim meeting and published in the Sixth Annual Reporl ("Anderson,
1981). This was further developed (Pentreath, 1983) and used in the NEA Site
Suitability Review for low-level waste dumping in the NE Atlantic Ocean.
- 147 -
Simple equilibrium food-chain models
The basis of the model used (Fentreath, 1983) was as follows. It is
assumed that the transfer of a radionuclide from one link in a food chain to
another can be represented by a transfer factor (TF) such that
TF - - E ^ -(k+X)
where r* is the fractional feeding rate of the predator at that link (kg kg-1
day ), f is the fraction of the nuclide absorbed, k is 0.693/biological
half-life in days and X. the decay constant (day-1). The value of each TF
represents the transfer of the nuclide from one link in the food chain to the
next, at equilibrium, but does not include accumulation from sea water - with
which the organism would not be in equilibrium.
The version used was the same as that employed in the NEA Site Suitabi
lity Review (1985), in which it is assumed that, at the base of the food
chain, annelids consume contaminated surface sediment. Annelids are assumed
to be predated upon by amphlpods which, in turn, are consumed by squid. Squid
are assumed to be predated upon directly by tuna and by rattail fish; the
latter being consumed by sharks. Finally, swordfish are assumed to predate
equally on both squid and rattails. The feeding habits of the fish were deri
ved from data in Wheeler (1978). Calculations were then made of the dose to
man from consuming shark, swordfish or tuna at a rate of 219 kg per year
(600 g per day).
Certain assumptions had to be made with regard to the variables used.
The amounts of food consumed, in terms of percent body weight day , have been
kept constant throughout and are: annelid, 0.5%; amphipod, 0.5%; squid,
7.5%; rattail, 5.0%; shark, 5.0%; tuna, 7.5%; and swordfish, 3.75% on each
of squid and rattails. Because the best biological data sets available are
for the Cs nuclides, only 5Cs was considered in these preliminary calcula
tions. The variables used are given in Table XX.
The most limiting case for calculations using these values would be that
In which each link in the food chain is assumed to feed entirely on the
- 148 -
preceding one; in other words, that the surface-dwelling fish were maintained
on a food chain which initially arose solely from the deep-sea fauna. This is
clearly impossible. Nevertheless, there is a possibility that each link in
the food chain could obtain some fraction of its annual food intake from a
preceding link which had become contaminated. At present it is uncertain as
to where in such a food chain the probability of this occurring is greatest.
Two possibilities were therefore considered. In the first (option 1) it was
assumed there was a probability of 0.3 that amphipods would consume contami
nated annelids, a probability of 0.1 that squid would consume the amphipods, a
probability of 0.03 that rattails would consume the squid, and a probability
of 0.001 that the higher links in the food chain would consume the rattails or
the squid, as appropriate to the food chain. This, essentially, implies a
logarithmic decrease in probabilities along the food chain, which may well be
the case in view of the greater diversity of available food for surface and
midwater-living fish. Alternatively, a second set of calculations was made
(option 2) in which it was assumed that the probability of the amphipods con
suming the annelids was small (0.001) but, if they did become contaminated and
migrated into mid- and surface-waters, there was a higher probability (0.03)
that they would be consumed by squid, and an even higher probability (0.3)
that a particular population of rattails, and higher predators (probability of
0.1), would feed upon their respective links in the food chain.
The two options were applied to data supplied by the RATG for the bottom
boxes of the disposal area and its surroundings (boxes 20, 18 and 15), for
'favourable', 'mean', and 'unfavourable' conditions. The results are given in
Tables XXI, XX11 and XXIII. A K. of 3E3 was used to calculate the concentra-d
tions of 3 Cs in the sediment. As can be seen, the range of dose rates (10-9
to 10"19 mSv a"1) is well below that of the 1 mSv a"1 ICRP limit recommended
for members of the public.
Such a model can be further developed in a number of different ways.
Belot (1986) has proposed a multi-exponential form to describe the derivation
of transfer factors from laboratory studies. Experimentally-derived values
for the transfer of Pu and Am from labelled sediments to animals are given in
Table XXIV, and iii situ data are given in Table XXV.
- 149 -
Using his own version of the transfer factor model, Belot has calculated
the quotient of the expected concentration in a predator relative to the prey
(Cp /C ), assuming a feeding rate of 0.05% per day and experimentally-derived
values for absorption and excretion. The results are given in Table XXVI.
They indicate that the expected concentrations in the predator would be lower
than that of the prey in all cases, except for Tc in Haliotus (an ormer) and
the two crustaceans Homarus gammarus and Lysmata seticaudata. The accumula-
tion of Tc in the environment is very species-specific and thus it is diffi
cult to assess ils food chain transferability in a general sense.
With regard to 'biomagnification', and other aspects of food chain accu
mulation, views differ, as discussed by Pentreath (1977). This results
primarily from a lack of definition of what is meant by food chain accumula
tion, concentration, magnification, and so on, and from a selective use of
quantities. Thus the concentration of an element in a predator may be con
sidered by one author to have increased along the food chain when its concen
tration in, for example, the liver, is greater than that of its prey measured
on a whole-body basis. In contrast, the opposite conclusion may be arrived at
if the comparison is made with the concentration of the element in a sample of
the predator's muscle. Both conclusions are equally valid within their terms
of definition but are frequently cited out of context. When the mass transfer
of an element from one link in the food chain to another is considered, the
general tendency is for a decrease in concentration at the higher trophic
levels, partly because the muscle which has a low concentration factor for
many elements comprises the largest fraction of body weight - for fish more
than 50%. Where the concentration of an element in the muscle is relatively
high, as for caesium and mercury, an overall increase has been found. A
relationship between the concentration of a radionuclide in fish musclj -
which approximates to the whole-body value - and the parameters of intake and
excretion has been tentatively derived by Preston et_ a\_. (1972) and Pentreath
(1973). It was argued that for those radionuclides which are principally
accumulated from food the dally input necessary to maintain a concentration
factor of " 103, and biological half-time of * 102, would require the food
species to have a concentration factor of at least the same order of magni
tude, assuming that it was completely absorbed across the gut wall. Because
assimilation efficiencies are < 100%, the required concentration factor of the
prey would have to be even higher. Indeed, assimilation efficiencies for
- 150 -
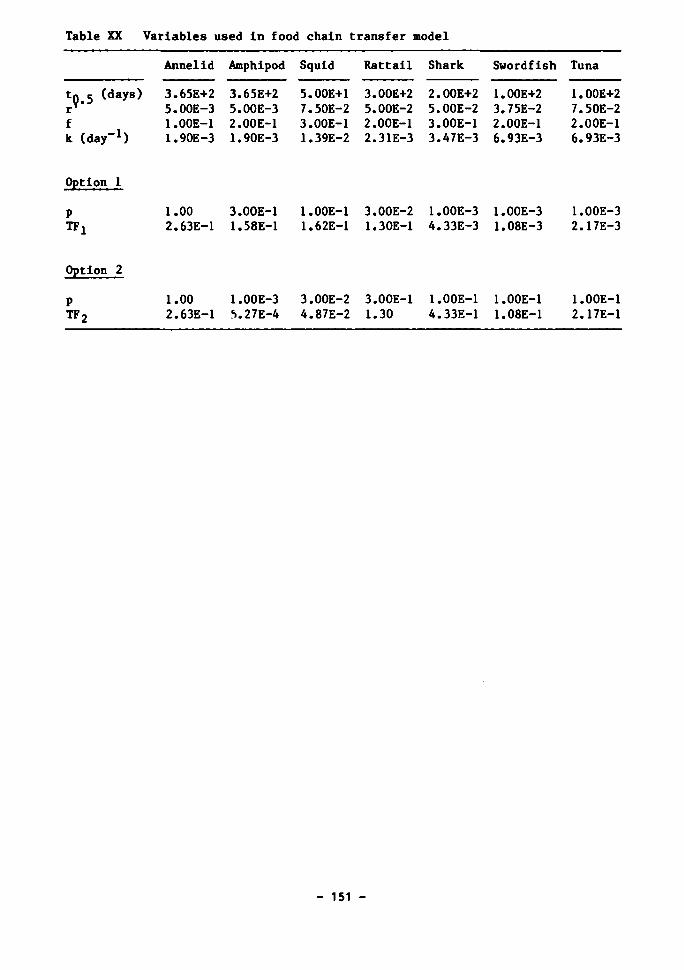
Table XX Variables used in food chain transfer model
t«>5 (days) r f k (day-1)
Option 1
P TFX
Option 2
P TF2
Annelid
3.65E+2 5.00E-3 l.OOE-1 1.90E-3
1.00 2.63E-1
1.00 2.63E-1
Amphipod
3.65E+2 5.00E-3 2.00E-1 1.90E-3
3.00E-1 1.58E-1
l.OOE-3 5.27E-4
Squid
5.00E+1 7.50E-2 3.00E-1 1.39E-2
l.OOE-1 1.62E-1
3.00E-2 4.87E-2
Rattail
3.00E+2 5.00E-2 2.00E-1 2.31E-3
3.00E-2 1.30E-1
3.00E-1 1.30
Shark
2.00E+2 5.00E-2 3.00E-1 3.47E-3
l.OOE-3 4.33E-3
1.00E-1 4.33E-1
Swordfish
1.00E+2 3.75E-2 2.00E-1 6.93E-3
1.00E-3 1.08E-3
1.00E-1 1.08E-1
Tuna
1.00E+2 7.50E-2 2.00E-1 6.93E-3
1.00E-3 2.17E-3
1.00E-1 2.17E-1
- 151 -
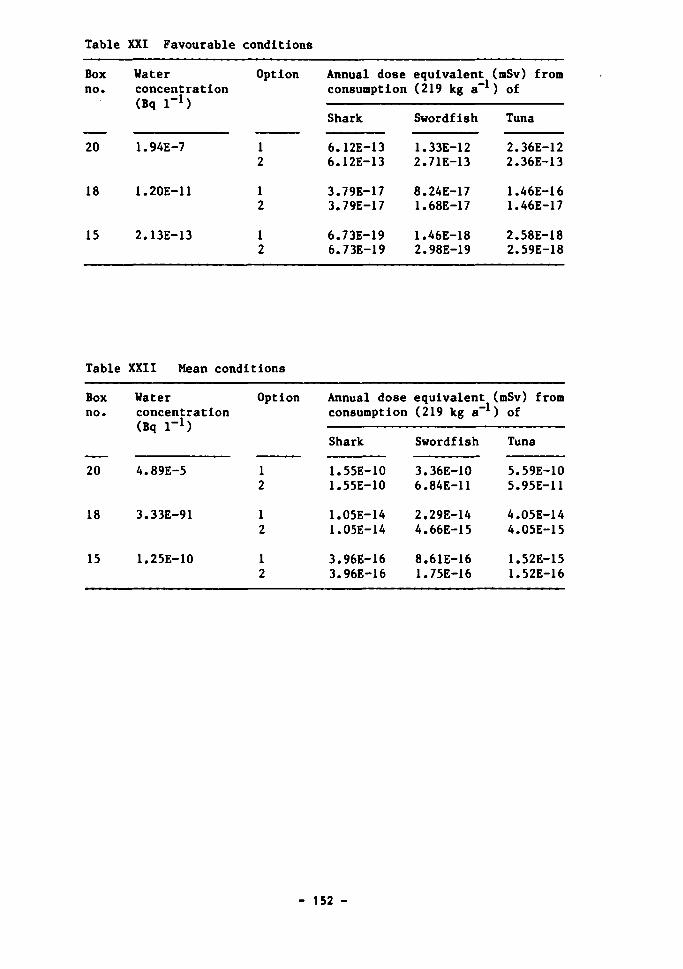
Table XXI Favourable conditions
Box no.
20
18
15
Water concentration (Bq l"1)
1.94E-7
1.20E-11
2.13E-13
Option
1 2
1 2
1 2
Annual dose consumption
Shark
6.12E-13 6.12E-13
3.79E-17 3.79E-17
6.73E-19 6.73E-19
equivalent (219 kg a-1
Swordfish
1.33E-12 2.71E-13
8.24E-17 1.68E-17
1.46E-18 2.98E-19
(mSv) from ) of
Tuna
2.36E-12 2.36E-13
1.46E-16 1.46E-17
2.58E-18 2.59E-18
Table XXII Mean conditions
Box no.
20
18
15
Water concentration (Bq l"1)
4.89E-5
3.33E-91
1.25E-10
Option
1 2
1 2
1 2
Annual dose consumption
Shark
1.55E-10 1.55E-10
1.05E-14 1.05E-14
3.96E-16 3.96E-16
equivalent (219 kg a-1
Swordfish
3.36E-10 6.84E-11
2.29E-14 4.66E-15
8.61E-16 1.75E-16
(mSv) from ) of
Tuna
5.59E-10 5.95E-11
4.05E-14 4.05E-15
1.52E-15 1.52E-16
- 152 -
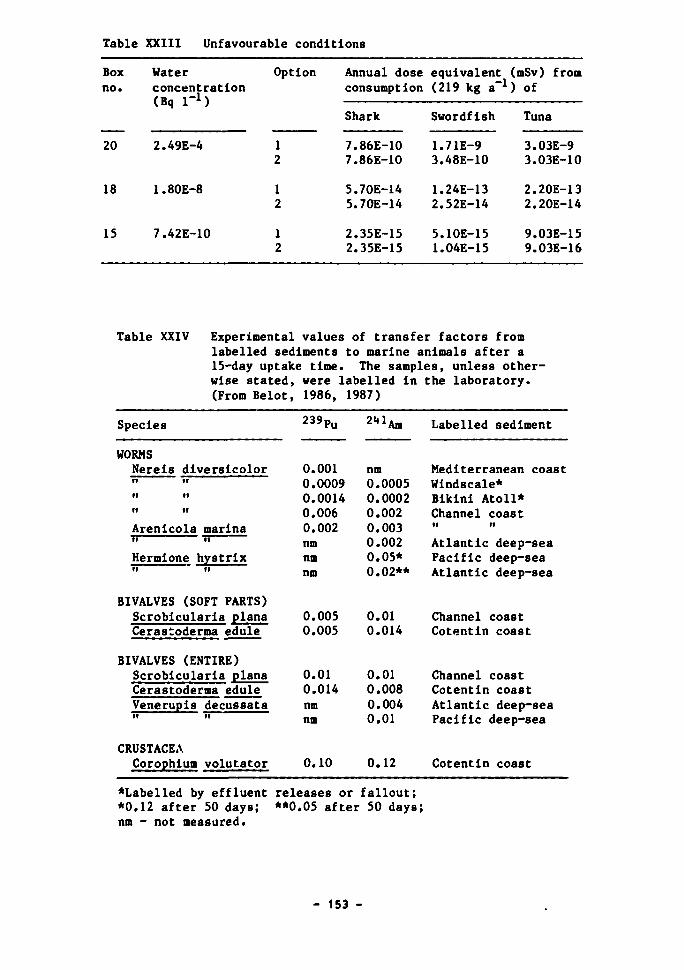
Table XXIII Unfavourable conditions
Box no.
20
18
15
Water concentration (Bq l"1)
2.49E-4
1.80E-8
7.42E-10
Option
1 2
1 2
1 2
Annual dose consumption
Shark
7.86E-10 7.86E-10
5.70E-14 5.70E-14
2.35E-15 2.35E-15
equivalent (219 kg a-1
Swordfish
1.71E-9 3.48E-10
1.24E-13 2.52E-14
5.10E-15 1.04E-15
(mSv) from ) of
Tuna
3.03E-9 3.03E-10
2.20E-13 2.20E-14
9.03E-15 9.03E-16
Table XXIV Experimental values of transfer factors from labelled sediments to marine animals after a 15-day uptake time. The samples, unless otherwise stated, were labelled in the laboratory. (From Belot, 1986, 1987)
Species
WORMS Nereis diversicolor it ii
•i ••
II it
Arenicola marina •i II
Hermione hystrix II II
BIVALVES (SOFT PARTS) Scrobicularia plana Cerastoderma edule
BIVALVES (ENTIRE) Scrobicularia plana Cerastoderma edule Venerupis decussata II it
CRUSTACEA Corophium volutator
239Pu
0.001 0.0009 0.0014 0.006 0.002 nm nm nm
0.005 0.005
0.01 0.014 nm nm
0.10
^ A m
nm 0.0005 0.0002 0.002 0.003 0.002 0.05* 0.02**
0.01 0.014
0.01 0.008 0.004 0.01
0.12
Labelled sediment
Mediterranean coast Windscale* Bikini Atoll* Channel coast II II
Atlantic deep-sea Pacific deep-sea Atlantic deep-sea
Channel coast Cotentin coast
Channel coast Cotentin coast Atlantic deep-sea Pacific deep-sea
Cotentin coast
*Labelled by effluent releases or fallout; *0.12 after 50 days; **0.05 after 50 days; nm - not measured.
- 153 -
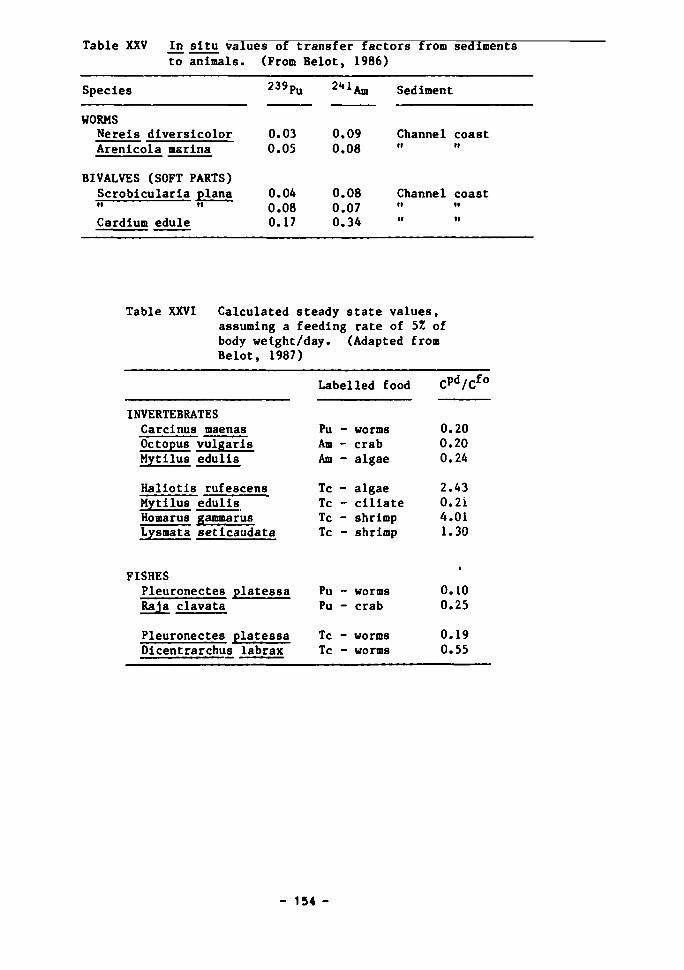
Table XXV In situ values of transfer facti to animals.
Species
WORMS Nereis diversicolor Arenicola marina
BIVALVES (SOFT PARTS) Scrobicularia plana ii it
Cardium edule
(From
239pu
0.03 0.05
0.04 0.08 0.17
Belot, 1986)
2H1Am
0.09 0.08
0.08 0.07 0.34
ors from sediments
Sediment
Channel coast tt tt
Channel coast II H
II II
Table XXVI Calculated steady state values, assuming a feeding rate of 52 of body weight/day. (Adapted from Belot, 1987)
INVERTEBRATES Carcinus maenas Octopus vulgaris Mytilus edulis
Haliotis rufescens Mytilus edulis Homarus gammarus Lysmata seticaudata
FISHES Pleuronectes platessa Raja clavata
Pleuronectes platessa Dicentrarchus labrax
Labelled food
Pu Am Am
Tc Tc Tc Tc
Pu Pu
Tc Tc
-
-
--
-
--
--
worms crab algae
algae ciliate shrimp shrimp
worms crab
worms worms
cpd/cfo
0.20 0.20 0.24
2.43 0.2i 4.01 1.30
•
0.10 0.25
0.19 0.55
- 154 -
caesium are high, as noted by (Baptist and Price, 1962) and, incidentally, the
retention of the organic form of mercury is also very high (Pentreath, 1976).
From the deep-sea modelling point of v aw, however, as in the case of the
low-level dumpsite assessment, the overriding factor is the probability of
each link in the food chain being 100Z sustained. Thus although it was shown 1 37
that 1J Cs concentrations in a predator could be higher than its prey, it
would need to subsist entirely on that prey, at that concentration, in order
to do so. In the transfer of radionuclides along a discrete pathway from
> 4 000 m to surface waters this is unlikely in the extreme, although the
ultimate link in the food chain could have obtained some of its prey at
enhanced concentrations, as was shown in the calculations.
- 155 -
9. COLLECTIVE DOSE CONSIDERATIONS
Introduction
If serious consideration is to be given to comparisons between marine
disposal and other disposal options, collective dose commitment calculations
need to be based upon as realistic assumptions as possible. The extent to
which the committed dose should be truncated is clearly not a concern of the
Biology Task Group, but the collective aspect is of relevance because it
raises the question of what is the maximum sustainable yield of the oceans,
and the areas from which this yield would be sustained. The Group has there
fore provided a summary of seafoods consumed, compatible with the oceanic
areas of the Mk A box model.
Any collective dose calculations made at present will necessarily be
heavily biased by the areas from which the largest quantities of seafoods are
taken. The current annual world marine fish catch is of the order of
5 x 10' t, the largest percentages of seafood being taken from the north-west
Pacific (~ 302) and the north-east Atlantic (~ 20%). In addition to knowing
the geographic areas from which seafoods are taken, it may also be necessary -
depending on the nature of the physical oceanographic models used - to know
the depth of capture. With regard to collective dose commitments it would
also be of value to estimate the likely future catch rate at different depths.
It is known that considerable stocks of fish exist at depths which are not
currently fished, for a variety of reasons, and that large stocks of inverte
brates - such as squid and krill - may also be increasingly exploited. Some
estimates could be made of this unexploited food source, but any model which
incorporated such values would have to include some function which reflected
the probability of such a stock being exploited. The probability function
could be weighted in terms of depth, and possibly in relation to distance from
the coast.
The population size is not required in order to make a collective dose
commitment calculation; it is derived from the fact that x Bq kg'1 multiplied
by the total kg consumed will result in a man-Sv value for each radionuclide
by using a dose/unit input value. It is nevertheless desirable to know which
population will receive this detriment, and the population so exposed is not
- 156 -
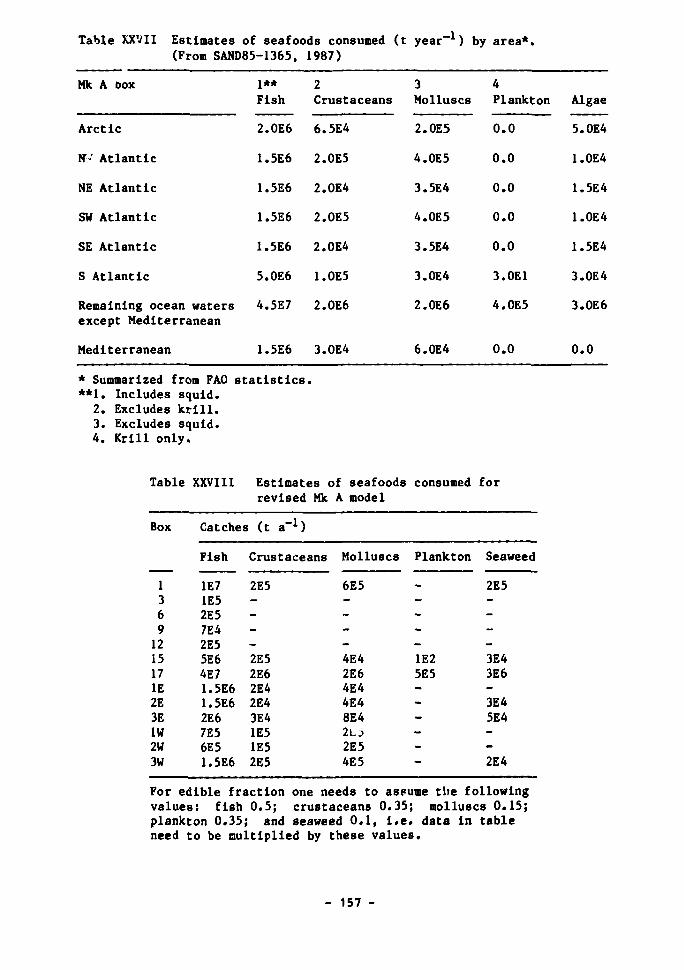
Table XXVII Estimates of seafoods consumed (t year ) by area*. (From SAND85-1365, 1987)
Mk A box
Arctic
NV Atlantic
NE Atlantic
SW Atlantic
SE Atlantic
S Atlantic
Remaining ocean waters except Mediterranean
Mediterranean
* Summarized from FAO **1. Includes squid.
2. Excludes krill. 3. Excludes squid. 4. Krill only.
1** Fish
2.0E6
1.5E6
1.5E6
1.5E6
1.5E6
5.0E6
4.5E7
1.5E6
statistics
2 Crustaceans
6.5E4
2.0E5
2.0E4
2.0E5
2.0E4
1.0E5
2.0E6
3.0E4
•
3 Molluscs
2.0E5
4.0E5
3.5E4
4.0E5
3.5E4
3.0E4
2.0E6
6.0E4
4 Plankton
0.0
0.0
0.0
0.0
0.0
3.0E1
4.0E5
0.0
Algae
5.0E4
1.0E4
1.5E4
1.0E4
1.5E4
3.0E4
3.0E6
0.0
Table XXVIII Estimates of seafoods consumed for revised Mk A model
Box Catches (t a - 1)
Fish Crustaceans Molluscs Plankton Seaweed
1 3 6 9 12 15 17 IE 2E 3E 1W 2W 3W
1E7 1E5 2E5 7E4 2E5 5E6 4E7 1.5E6 1.5E6 2E6 7E5 6E5 1.5E6
2E5 ----2E5 2E6 2E4 2E4 3E4 1E5 1E5 2E5
6E5 ----4E4 2E6 4E4 4E4 8E4 2Li 2E5 4E5
— ----1E2 5E5 -----—
2E5 ----3E4 3E6 -3E4 5E4 --2E4
For edible fraction one needs to aspume tlte following values: fish 0.5; crustaceans 0.35; molluscs 0.15; plankton 0.35; and seaweed 0.1, I.e. data in table need to be multiplied by these values.
- 157 -
necessarily that bordering a particular sea area. For example, in 1980 the
top five nations, in ranking order of tonnes of marine fish and shellfish
landed, were Japan, USSR, USA, Peru and China (FAO, 1981). There may also be
some merit in being able to derive a dose equivalent commitment, which is the
integration of the per caput dose equivalent rate, from a given source as a
function of time. Although such a calculation is not often made, it does
allov the estimation of a maximum annual, per caput, dose equivalent at some
time in the future. This can then be compared with a value derived from any
other source of exposure - background, or another waste disposal practice - so
that suitable comparisons can be made.
Quantitative estimates
Quantitative estimates of catches of fish, crustaceans, molluscs, plank
ton and seaweeds were initially made for 30 compartments of the NEA Site
Suitability model (NEA, 1985), and these have been reported in RATG reports.
Some initial estimates were made of catch data for the Mark A model, based on
Food and Agriculture Organization (FAO) statistics over the last few years
(Table XXVII). FAO data are not derived from areas comparable to those in the
model, so the data were adjusted by making allowances for the country In which
landings were made. Allowance was also made for the fraction of landings con
sidered to be consumed. The assumed edible fractions were: fish, 0.5;
crustaceans, 0.35; molluscs, 0.15; and algae, 0.1. Other assumptions were
that the 'fish' catch includes squid, because the CF data for fish and cepha-
lopod molluscs are similar; that the crustacean catch excludes krill; that
the plankton catch consists only of krill; that the molluscan catch excludes
squid; and that the algae include a mixture of phaeophycean, rhodophycean,
and chlorophycean species. Since these earlier data were compiled (Anderson,
Tenth Annual Meeting, Vol. 1, 1987), changes were made to the Mark A model,
necessitating a further revision of the distribution of quantities taken per
unit area. The revised values are given in Table XXVIII.
The extent to which fish catches will vary in the future is difficult to
assess, although the total quantities harvested are unlikely to vary by more
than an order of magnitude. Of equal importance, however, is an assessment of
the areas in which they are likely to be harvested, and the nuclides which are
- 158 -
present - in particular C. This would need to be assessed in greater detail
if one particular site - Atlantic or Pacific - was proposed as a site for
subseabed waste disposal.
- 159 -
10. THE EFFECTS OF RADIATION ON THE DEEP-SEA FAUNA
Introduction
The Biological Task Group has, throughout the programme, been very aware
of the need to ensure adequate protection of the environment as well as evalu
ating the various pathways by which man could be exposed. As has been stated
several times in this report, although remote from man, it should not be for
gotten that the deep sea is in fact the largest ecosystem on Earth, unique in
habitat and structure, and very little understood.
In order to assess the potential impact of high-level waste disposal on
this environment it is first of all necessary to estimate the potential dose
rates to the deep-sea fauna which could result from released radionuclides.
The second step is to evaluate the results - a somewhat more difficult task
because an assessment of any detriment to any member of the marine or any
other fauna differs from an assessment with regard to man in that there are no
internationally agreed sets of criteria with which estimates of dose-effect
relationships, or dose-risk relationships, can be compared (Fentreath and
Woodhead, 1988). Neither is there such an agreed dose-limit above which doses
to individuals would be unacceptable: it is, of course, the protection of the
species at a population level which is of prime concern. It will clearly take
a long time before a comprehensive set of data is acquired to emulate the high
degree of sophistication practised for radiological protection of man. But it
is possible to progress some way towards such an objective, and the first step
is that of establishing dosimetric models appropriate to the geometries of
different types of aquatic organisms. Having derived such models, these can
then be used to estimate the dose rates arising from natural background and
the dose rates arising from ambient concentrations of other radionuclides.
This subject has been discussed in detail by Pentreath and Woodhead (1988).
It is also necessary to compare the estimates of dose rates from these
models with data which are available on the effects of irradiation on aquatic
organisms. These data have largely been derived from studies on shallow-water
marine organisms, and in some cases on freshwater organisms, and may not
therefore be directly applicable to deep-sea fauna; but they do relate to
animals of the same phyla as are found in the deep sea, and in any case - with
- 160 -
one exception - represent the only means by which any detrimental effects can
be assessed at present. The one exception is that of deep-sea marine
bacteria; these have been the subject of direct studies of the effects of
irradiation by Yayanos at La Jolla, as will be described later in the
chapter.
Dosimetric models
The following calculations are based on Pentreath and Woodhead (1988).
There is insufficient information concerning the physiology of the elements in
deep-sea organisms to predict the detailed internal distribution of radionuc
lides and thus derive reasonably accurate estimates of the dose rates to par
ticular organs or tissues which may be considered to be radiosensitive, e.g.
the gonads. Available data on concentrations factors, developed almost
entirely from surface or coastal water organisms, are sufficient only to pro
vide an approximate estimate of whole-body burdens with the assumption of
uniform distribution. Generalized models have therefore been developed to
allow the estimation of the general magnitude of the radiation exposures
likely to be experienced by different types of organisms, both from radionuc
lides uniformly distributed internally and from contaminated water and sedi
ment. The organisms which have been considered are fish, large and small
crustaceans, and molluscs, and in each case the geometry adopted is an
ellipsoid of unit density tissue; the details are given in Table XXIX. These
generalized models have not been selected on the basis of the prevalence of
fish, crustaceans and molluscs in the deep-sea fauna, but in order to give an
indication of the effect of body size (large and small crustaceans), concen
tration factor (usually highest for molluscs) and the effect of external dose
from sediments (benthic and bathypelagic forms) on dose rate.
Gamma radiation
The mean free path for the absorption of Y-radiation from the majority of
radionuclides of interest is sufficiently large that it is reasonable to esti
mate the average dose rate throughout these volumes on the basis of a uniform
- 161 -
distribution of radioactivity in the organisms and published absorbed dose
fractions, i.e.
D = 5.76 x 10"7 E n C * mSv h_1
where E is the Y~ray energy in MeV;
n is the fractional number of y-rays of energy E per disintegration;
C is the radionuclide concentration in the organism in Bq kg ; o
and ij> is the absorbed dose fraction appropriate to the particular geometry
and y-ray energy Ey.
Values of the absorbed dose fraction, $, as a function of energy have been
published for the geometries of the large crustacean and the mollusc (Ellett
and Humes, 1971), and may be estimated by extrapolation for the geometries of
the fish and the small crustacean (Brownell et al., 1968); the data are given
in Figure 24.
For a pelagic organism, the y-ray dose rate from radionuclides in the
water is simply
D - 5.76 x 10⁻⁷ E n C (l-*) mSv h_1
Y Y Y wv
where C is the concentration of the radionuclide in water (Bq k g - 1 ) , w
For benthic organisms occupying the interface between the seawater and
the seabed sediment, the Y~ray dose rate from radionuclides in the water is
reduced to
D - 2.88 x 10~7 E n C (1-<|>) mSv h - 1. Y Y Y wv
For photon-emitting radionuclides in the sea bed, it has been assumed
that the Y~ray dose rate at the seabed-seawater interface is given by
D (») - 2.88 x 10"7 E n Cg(l-<t)) mSv h"1
where C is the concentration of the radionuclide in the seabed sediments s
(Bq k g - 1 ) .
- 162 -
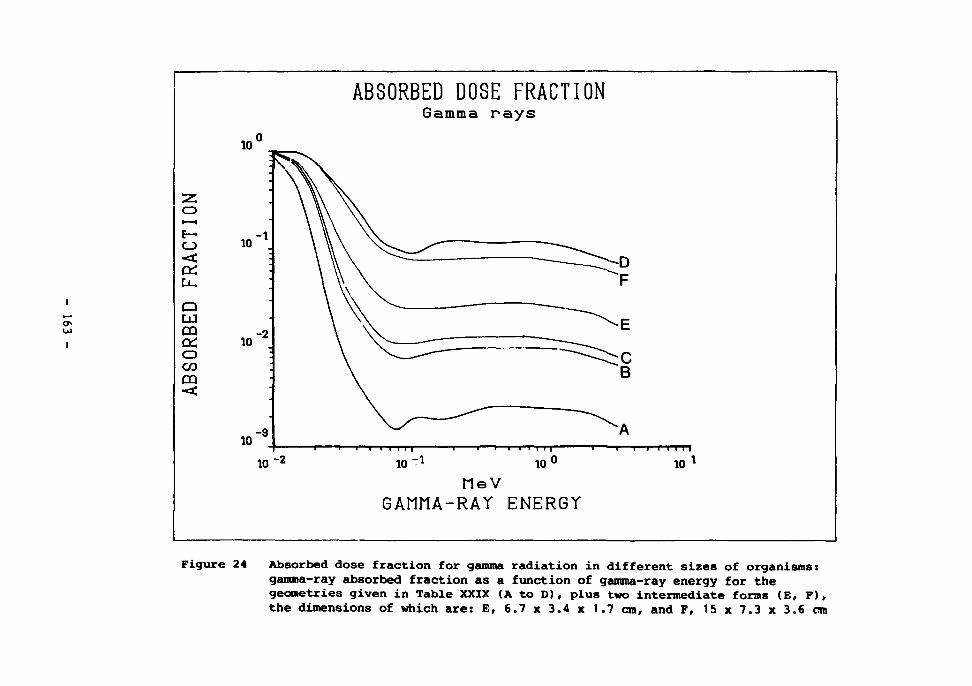
O i — i
E— O • <
Q
o CO
•<
10
10
10
10 -3
ABSORBED DOSE FRACTION Gamma rays
i i i 1 1 1 • i i 1 1 1
10 -2 10 -1
MeV GAMMA-RAY ENERGY
Figure 24 Absorbed dose fraction for gamma radiation in different sizes of organisms: gamma-ray absorbed fraction as a function of gamma-ray energy for the geometries given in Table XXIX (A to D), plus two intermediate forms (E, F), the dimensions of which are: E, 6.7 x 3.4 x 1.7 cm, and F, 15 x 7.3 x 3.6 cm
Beta radiation
Within the constraint of a uniform whole-body distribution of the radio
nuclides, the maximum absorbed dose rate to the organisms from P-radiation
from internal sources will be at the centre of the ellipsoid which is assumed
to represent the body shape. This dose rate has been taken to be the index of
the exposure from p-radiation. In the case of the ellipsoid adopted to
represent fish, the dimensions are sufficiently large (i.e. > the maximum
p-particle range) that the p-ray dose rale at the centre is equal to D - ^ ) ,
i.e.
DQ(«) - 5.76 x 10⁻⁷ f. nQ C mSv h_1
P P P o
TV re E Q is the mean energy of a given p-ray transition in MeV; P _
n„ is the fractional number of transitions of mean energy per E per P P disintegration;
and C is the radionuclide concentration in the fish in Bq kg . o
Conversely, the contributions from p-radiation from the external sources, sea
water and sediment, are evidently zero.
The dimensions of each of the ellipsoids representing the large and small
crustaceans and the molluscs are less than the maximum range of differing pro
portions of the p-particles emitted by the waste radionuclides. Thus the dose
rates at the centres of the ellipsoids can be less than Do(°°). depending on
the p-particle energy, and must be determined by integrating an appropriate
point source dose distribution function over the uniform distribution of
radionuclides in the volumes representing the organisms. A modification of
Loevinger's original dose distribution function has been described elsewhere
together with the energy-dependent constants required for, and examples of,
its application (IAEA, 1976; Woodhead, 1979). The results have been obtained
in terms of the absorbed dose rate at the centre of the ellipsoids, expressed
as a fraction, ty, of Dot0), and are shown in Figure 25 as a function of the P
mean (3-particle energy. Auger and internal conversion electrons are dealt
with in an identical manner. Thus
- 164
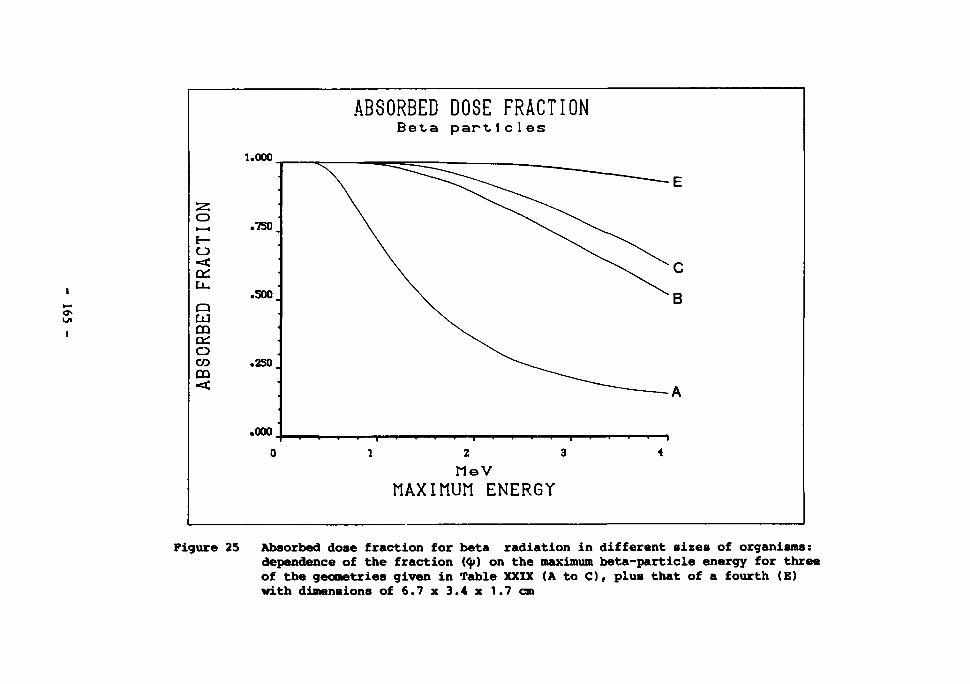
z: 0 1—1
E— O •<
a: CJU
Q UJ CQ oc: 0 CO
m •<
1.000
.750^
.500.
.250^
.000
0
ABSORBED DOSE FRACTION Beta particles
1 2 3
MeV MAXIMUM ENERGY
— ~ — E
\ . C
B
— A
1 • 1 4
Figure 25 Absorbed dose fraction for beta radiation in different sizes of organisms: dependence of the fraction (<f>) on the maximum beta-particle energy for three of the geometries given in Table XXIX (A to C), plus that of a fourth (E) with dimensions of 6.7 x 3.4 x 1.7 cm
D„ = 5.76 x 10"' E- nD C <P mSv h - 1
P p p o
at the centre of the organisms, where 4> is the proportion of D0(°») correspond-P
ing to the particular geometry and mean p-particle energy.
For organisms in the water column clear of the sea bed, the p-particle
dose rate from radionuclides in the water is
D. = 5.76 x 10~7 ¥„ nQ C (l-*) mSv h-1
P P P w
evaluated at the concentration of radionuclide in the water (Bq kg - 1). For
molluscs and large and small crustaceans at the sediment-water interface the
p-particle dose rates from radionuclides in the water and in the sediment are
Dfl = 2.88 x 10~7 Ea nQ[C](l-<J>) mSv h_1
P P P
evaluated at the radionuclide concentrations [C] in water and sediment
respectively.
Alpha radiation
Given the, presently, unavoidable assumption of a uniform distribution of
most of the radionuclides throughout the bodies of the organisms, the ranges
of the a-particles are such that
D « D (») - 1.15 x 10"5 E n C mSv h_1
a a a a o
where E is the energy of the a-particle transition;
n is the fractional number of transitions of energy E per a a
disintegration;
and C is the concentration of the radionuclide in the organism in Bq kg-1. o
The assumption of a uniform distribution of a-emltting radionuclides
throughout the body will clearly result in underestimates of the dose rates to
particular organs where there is substantial differential accumulation by
- 166 -
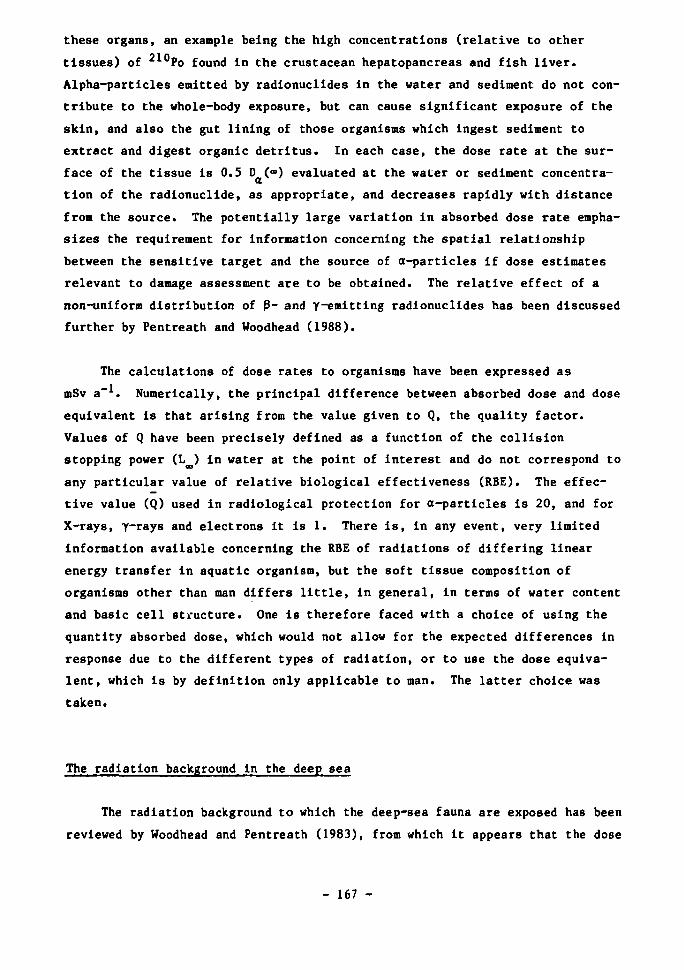
these organs, an example being the high concentrations (relative to other
tissues) of 2 1 0Po found in the crustacean hepatopancreas and fish liver.
Alpha-particles emitted by radionuclides in the water and sediment do not con
tribute to the whole-body exposure, but can cause significant exposure of the
skin, and also the gut lining of those organisms which ingest sediment to
extract and digest organic detritus. In each case, the dose rate at the sur
face of the tissue is 0.5 D (») evaluated at the water or sediment concentra
te
tion of the radionuclide, as appropriate, and decreases rapidly with distance
from the source. The potentially large variation in absorbed dose rate empha
sizes the requirement for information concerning the spatial relationship
between the sensitive target and the source of a-particles if dose estimates
relevant to damage assessment are to be obtained. The relative effect of a
non-uniform distribution of P~ and Y~emitting radionuclides has been discussed
further by Pentreath and Woodhead (1988).
The calculations of dose rates to organisms have been expressed as
mSv a . Numerically, the principal difference between absorbed dose and dose
equivalent is that arising from the value given to Q, the quality factor.
Values of Q have been precisely defined as a function of the collision
stopping power (L ) in water at the point of interest and do not correspond to
any particular value of relative biological effectiveness (RBE). The effec
tive value (Q) used in radiological protection for a-particles is 20, and for
X-rays, y-rays and electrons it is 1. There is, in any event, very limited
information available concerning the RBE of radiations of differing linear
energy transfer in aquatic organism, but the soft tissue composition of
organisms other than man differs little, in general, in terms of water content
and basic cell structure. One is therefore faced with a choice of using the
quantity absorbed dose, which would not allow for the expected differences in
response due to the different types of radiation, or to use the dose equiva
lent, which is by definition only applicable to man. The latter choice was
taken.
The radiation background in the deep sea
The radiation background to which the deep-sea fauna are exposed has been
reviewed by Woodhead and Pentreath (1983), from which it appears that the dose
- 167 -
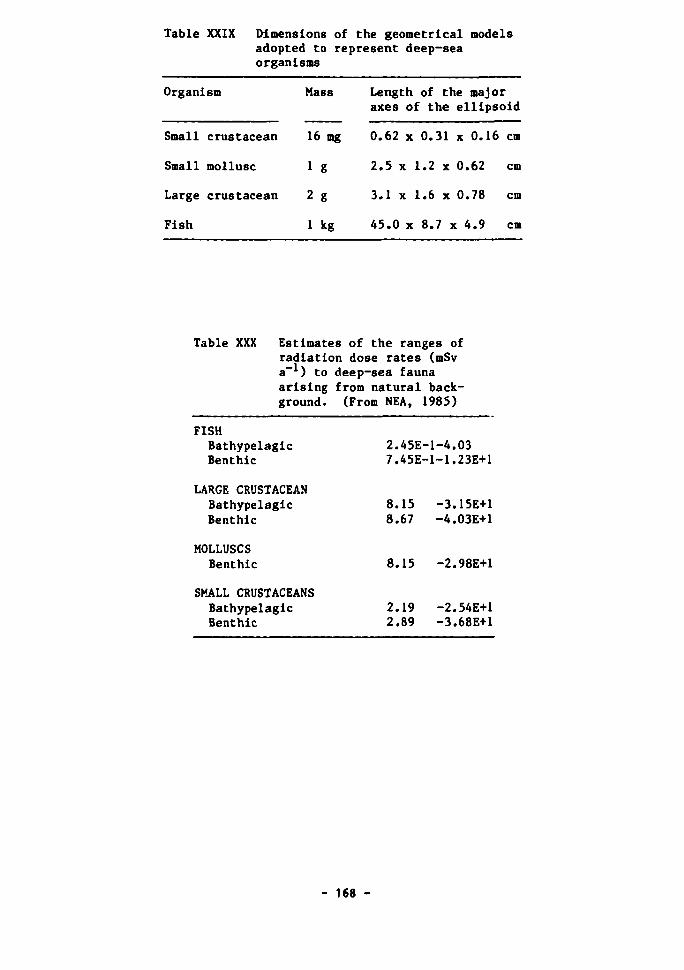
Table XXIX Dimensions of the geometrical models adopted to represent deep-sea organisms
Organism
Small crustacean
Small mollusc
Large crustacean
Fish
Mass
16 mg
1 g
2 g
1 kg
Length of the major axes of the ellipsoid
0.62 x 0.31 x 0.16 cm
2.5 x 1.2 x 0.62 cm
3.1 x 1.6 x 0.78 cm
45.0 x 8.7 x 4.9 cm
Table XXX Estimates of the ranges of radiation dose rates (mSv a-1) to deep-sea fauna arising from natural background. (From NEA, 1985)
FISH Bathypelagic Benthic
LARGE CRUSTACEAN Bathypelagic Benthic
MOLLUSCS Benthic
SMALL CRUSTACEANS Bathypelagic Benthic
2.45E-7.45E-
8.15 8.67
8.15
2.19 2.89
-1-4.03 -1-1.23E+1
-3.15E+1 -4.03E+1
-2.98E+1
-2.54E+1 -3.68E+1
- 168 -
rates received in this environment are just as high and as variable as those
experienced by shallow-water organisms. The data given in Table XXX were
derived using the dosimetric models described above. The major external
source in the water arises from **°K and 87Rb which, being present at concen
trations which vary in direct proportion to salinity, are essentially the same
in deep water as at the surface. The dose rate to the larger fauna from "K
is of the order of 10~3 uSv h - 1. External doses from sedimentary materials -
for the fauna in direct contact with bottom sediments - vary in relation to
the nature of the sedimentary material, but arise primarily from the radio
nuclides of the 2 3 8U and 232Th decay series. Because the concentrations of
uranium and thorium in the deep-sea sediments vary approximately inversely
to the calcium carbonate content, considerable variation exists from one site
to another. There are also differing degrees of disequilibria between the
members of each decay series. Excess Th arises from its precipitation from
U in solution in the overlying water column. Further disequilibria exist 2 30
between " u T h and its daughters. In order to simplify the calculations,
however, it has been assumed that equilibrium does exist in the decay chain
between 2 2 Ra and the stable Pb, and that for the thorium series an equili
brium exists throughout.
With regard to internal sources, again **°K and 87Rb are ubiquitous in
living organisms and little difference would be expected between deep-sea and
shallow-water organisms. Of particular interest, however, is the a-emitting 210
1 Po. The important of this nuclide in marine organisms has long been known
(Folsom and Beasley, i973; Woodhead, 1973). More recent information has
demonstrated that not only are °Po concentrations in the viscera of shallow-
water organisms particularly high but that deeper-living species also contain
comparable concentrations (Heyraud and Cherry, 1979; Pentreath et jd., 1980;
Cherry and Heyraud, 1982'; Pentreath, 1983; Cherry e£ _aLi, 1983). This has
even been demonstrated for fish: for example, concentrations of 2 1 0Po in
Corphaenoldes armatus tissues are not dissimilar from those in species living
in shallower waters; and of equal significance, the concentration? in the
tissues of individuals of the same species can vary by almost an orast of
magnitude (Pentreath et jil., 1980; Pentreath, 1983).
- 169 -
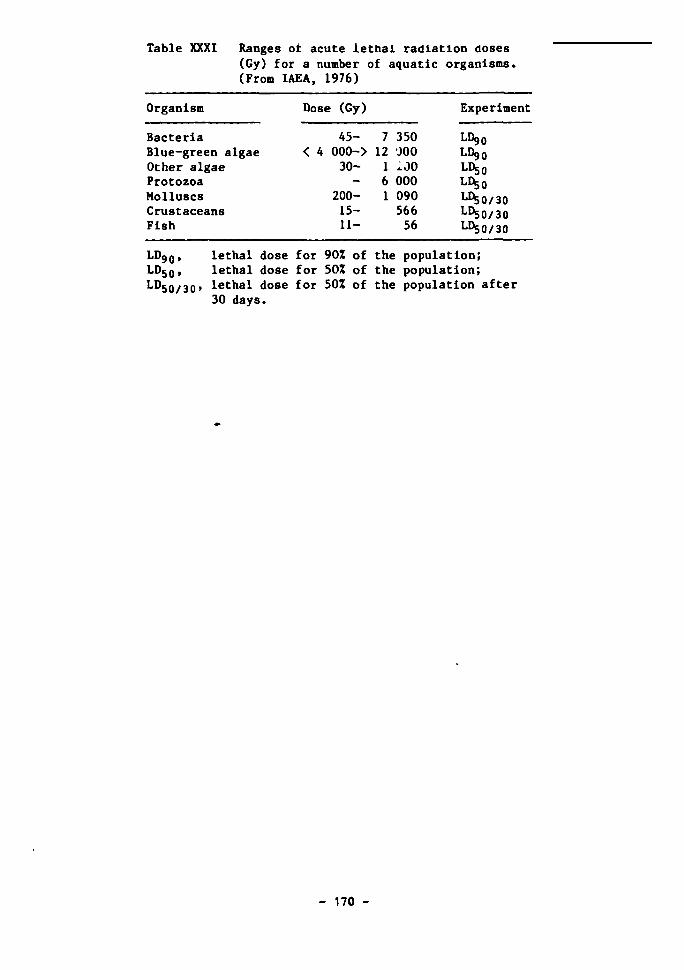
Table XXXI Ranges of acute lethal radiation doses (Gy) for a number of aquatic organisms. (From IAEA, 1976)
Organism
Bacteria Blue-green algae Other algae Protozoa Molluscs Crustaceans Fish
Dose (Gy)
< 4 45-
000-> 30-
200-15-11-
7 350 12 J00 1 -00 6 000 1 090 566 56
Experiment
LD90 LD90 LDgo LD50 LD50/30 LD50/30 LD50/30
LD90» lethal dose for 90Z of the population; LD50, lethal dose for 50Z of the population; LD50/30» lethal dose for 50Z of the population after
30 days.
- 170 -
The effects of radiation on aquatic organisms
The effects of irradiation on marine organisms, the manner in which such
data have been derived and evaluated, and the difficulties of interpreting the
data in terms of environmental impact, have been the subject of two IAEA Tech
nical Reports (IAEA, 1976, 1979). The data contained in these reports, plus
more recent information, have also been exhaustively reviewed by Woodhead
(1984). It has to be admitted that all of these studies have been made on
shallow-water organisms, but they constitute the only means by which the
effects of irradiation on the deep-sea fauna could be evaluated. It should
also be noted that the only experiments in which good estimates of absorbed
dose rates are readily available are those which have been made using external
sealed sources, and thus the dose rates are given here as fractions of a
Gy h"1.
In the first instance it is useful to consider the effects of irradiation
on individual organisms. Some of the earlier data assessed the radiation
doses required to kill a given percentage of adult individuals in a popula
tion - typically 50% after a period of 30 days, the so-called L°5o/30 v al u e«
Such data are given in Table XXXI. They provide little in the way of useful
information, even on a comparative basis, because the 30-day time limit was
selected largely on the basis of experience with small mammals, for which sur
vival after 30 days indicated a good chance of survival over their normal
life-span. Of greater relevance are data relating to 50% survival over
periods of time which are compatible with the life-span of the animal and the
rates at which tissue damage and repair mechanisms occur. It has also been
noted that when organisms are irradiated continuously at low dose rates a
greater total integrated dose is required to produce the same degree of
damage.
From the limited data available from experiments which have been made
over time periods in excess of 30 days, it appears that the individual survi
val rate of invertebrates (molluscs and crustaceans) or fish are unlikely to
be affected at dose rates below 10 nGy h_1 (Woodhead, 1984). Adult organisms
are unlikely to be the most sensitive phase of the life-cycle, however, and
thus many experiments have been made to determine the effects of irradiation
on eggs and larvae, particularly those of fish. Not all of these experiments
- 171 «
have provided sufficiently rigorous attention to dosimetric modelling, and
thus only a limited amount of data is available with which dosimetric
calculations can be compared. The lowest dose rate at which long-term dele
terious effects have been noted on developing fish embryos is, perhaps sur
prisingly, only a factor of 5 less than the value given above for adults, i.e.
2 mGy h , although other studies have concluded that there are no significant
effects at dose rates up to 12 mGy h _ 1 (Woodhead, 1984). Thus, in round
figures, 10 mGy h - 1 appears to be the level above which one might expect an
effect on survival of individuals at different stages of the life-cycle
(Pentreath and Woodhead, 1988).
For organisms other than man it is reasonable to argue that it is not, in
any case, the protection of individual organisms which is of prime concern,
but the population as a whole. In some cases protection at the ecosystem
level may be of paramount importance - as is often the case in the terrestrial
environment - with due allowance for possible perturbations in the populations
of any single species within that ecosystem. In order to assess effects at
the population level it is therefore necessary to consider the effects of
irradiation on the fecundity of species, and to consider those factors which
are effective in controlling the size of the population in the environment.
For shallow-water organisms it has long been known that deliberate culling of
a species has to be balanced by a knowledge of such factors as recruitment to,
and the natural mortality of, a population, and such information is not avail
able for the majority of the deep-sea fauna. Nevertheless, some data are
available on the effects of chronic exposure on the fecundity of aquatic orga
nisms, again primarily on fish, from which it appears that minor damage could
be expected, to the gonads, at dose rates greater than 1 mGy h~ . For this
effect to be important then clearly a significant fraction of the breeding
population would need to receive this level of irradiation over a prolonged
period of time, and the effect of successive breeding cycles throughout the
life-span of the individual breeding adults would also have to be considered.
As a general guide, it has been suggested that if dose rates above 1 mSv h_i
are indicated then a more detailed evaluation would be warranted (Pentreath
and Woodhead, 1988).
- 172 -
The effects of irradiation on deep-sea bacteria
Deep-sea organisms are difficult to cultivate for a variety of reasons;
in particular, the high pressures of the deep ocean pose formidable problems
for the design of capture gear and of aquaria (Brauer, 1972). Bacteria were
actually the first deep-sea organisms to be cultivated under simulated deep-
sea pressures (ZoBell, 1952), and at the moment they are still the only type
of deep-sea organism that can be cultivated, from all ocean depths, in the
laboratory (Yayanos et al., 1982). Bacteria have therefore been irradiated as
part of an important component of the SWG programme by Yayanos at La Jo11a
California. Although the dose rates and doses used were far higher than would
be encountered in waste disposal practices, the study represents a 'tradi
tional' approach to assessing the radiosensitivity of bacteria and other
organisms.
Colonies of bacteria were grown in pour-tubes using a nutrient medium
solidified with either silica gel (Dietz and Yayanos, 1978) or gelatin
(Yayanos and Dietz, 1983). The pour-tube methods allowed for •'.he isolation at
high pressures of the bacteria from samples of the deep sea (Yayanos et_ al.,
1982), for the maintenance of the strains in pressure vessels, and for the use
of colony forming ability (CFA) at high pressures as an assay of damage to
bacteria by physical and chemical agents. The CFA assay was used to study the
sensitivity of the bacteria to gamma rays from 60Co in a manner previously
used to study the thermal inactivations of deep-sea bacteria (Yayanos and
Dietz, 1982; Yayanos and Dietz, 1983).
The strains of bacteria originated from the north Pacific Ocean. The
deep-sea strains came from depths between 1 957 m and 10 476 m. Strains SCI
and PE36 came from the eastern Pacific Ocean near the California coast.
Strains CNPT3 (Yayanos et al., 1979), HS17 and HS31 came from the central
north Pacific Ocean. The PT and MT strains were from various depths of the
Philippine and Mariana Trenches, respectively. The sampling of the deep ocean
was done between 1977 and 1980.
Pure strains of the bacteria were obtained as described by Yayanos jet al..
(1982, 1979). The strains were kept at a pressure close to that at their
depth of origin, and the pressure vessels were housed in well- insulated ice
- 173 -
boxes within a refrigerated cold room. The cultures were grown at the pres-
sure of their depth of origin in type 2216 marine broth until in the late
logarithmic or early stationary phase of growth. Such cultures were used to
make suspensions of cells at a concentration of about 106 cells/ml-1. The
suspensions were irradiated and sampled for serial dilutions. Aliquots of the
dilutions were used to inoculate pour tubes solidified with either gelatin or
silica gel. The pour tubes were incubated at 1 to 3°C and at a pressure cor
responding to that at the depth of origin of the isolate.
The ability to grow at deep-sea conditions, and the dependence of the
rate of growth on pressure, served as a means of identifying whether a bac
terium was a deep-sea strain (Yayanos et al., 1982). Bacterial strains that
originated from depths of between 1 957 and 5 900 m were all barophilic - i.e.
at 2°C they grew best at a high pressure. All of these strains also grew at
atmospheric pressure at 2°C. The D 3 7 values obtained were in the range of
19.2 to 46.4 Gy.
Bacterial strains originating from depths of 7 111 to 10 476 m were obli-
gately barophilic - i.e. no growth was observed at atmospheric pressure and
2°C. The rate at which these strains lost CFA at atmospheric pressure was not
determined, except in the case of isolate MT41. During a 10-hour period at
atmospheric pressure and at 0°C there was a ten-fold loss of colony-forming
units (CFUs) (Yayanos and Dietz, 1983). Therefore, the enhanced radiosensi-
tivity - a D37 of 9 Gy - observed may reflect a synergistic action of decom
pression and radiation. Combined stresses are known to cause a more rapid
loss of CFA than would be found with the stresses applied sequentially.
Radiosensitivity is always defined with respect to a biological endpoint;
in the case of bacteria, it is usually chosen as the ability of a single cell
to form a colony - a visible clump of cells. The results obtained with this
type of assay are, however, subject to a large number of factors (Alper,
1961). Bearing this in mind, it does appear that the values of D 3 7 for the
deep-sea bacteria are at the low end of the range of 19 to 3 170 Gy reported
for marine bacteria. Yayanos et al. (1986) considered that a greater sensiti
vity to radiation might be expected, in view of the darkness of the deep sea,
and therefore on an apparently diminished need of the ability to repair dama
ged DNA, although such a view is open to question.
- 174 -
Dose rates estimated to arise from high-level waste disposal
Calculations of dose rates to organisms have been made using values of
dose equivalent rates per unit of concentration in the water, for each radio
nuclide, for the types of organisms listed in Table XXIX. The values, in
nSv h~l per Bq m , are given in Table XXXII and were taken from Pentreath and
Woodhead (1988). The values allow for both external and internal sources of
exposure: the former by applying a K value, the latter by applying a concen
tration factor value.
Calculations were made, using data supplied by the RATG on concentrations
within the bottom boxes of the RATG model of the disposal area and its sur
roundings (boxes 20, 18 and 15), for 'favourable', 'mean' and 'unfavourable'
conditions. These three conditions represented the mean and range of values
obtained using a deterministic analysis; for example, in the 'unfavourable'
case there is much less adsorption of radionuclides to sediments than is indi
cated by the data available. The results are given in Tables XXXIII to XXXV.
All of these values are orders of magnitude less than those estimated for
natural background radiation, except for 'unfavourable' conditions. Even
then, the dose rates within the site box itself are at the lower limit of
background dose rates, and none exceed 1 mSv a-1 let alone 1 mSv h . It must
therefore be concluded that the expected impact on the deep-sea fauna, from
radioactive elements in waste, would be totally insignificant.
- 175 -
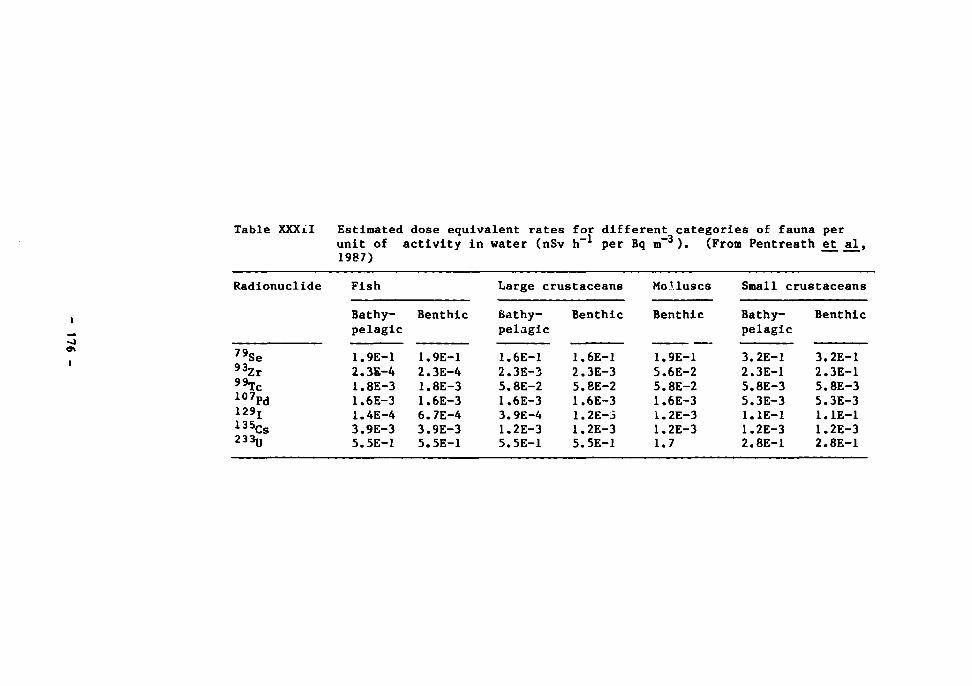
Table XXXAI Estimated dose equivalent rates for different categories of fauna per unit of activity in water (nSv h per Bq m ) . (From Pentreath et alt 1987)
Fish
Bathy-pelagic
1.9E-1 2.3E-4 1.8E-3 1.6E-3 1.4E-4 3.9E-3 5.5E-1
Benthic
1.9E-1 2.3E-4 1.8E-3 1.6E-3 6.7E-4 3.9E-3 5.5E-1
Large crustaceans
Bathy-pelagic
1.6E-1 2.3E-3 5.8E-2 1.6E-3 3.9E-4 1.2E-3 5.5E-1
Benthic
1.6E-1 2.3E-3 5.8E-2 1.6E-3 1.2E-3 1.2E-3 5.5E-1
Molluscs
Benthic
1.9E-1 5.6E-2 5.8E-2 1.6E-3 1.2E-3 1.2E-3 1.7
Small crustaceans
Bathy-pelagic
3.2E-1 2.3E-1 5.8E-3 5.3E-3 1.1E-1 1.2E-3 2.8E-1
Benthic
3.2E-1 2.3E-1 5.8E-3 5.3E-3 1.1E-1 1.2E-3 2.8E-1
Radionuclide
79Se 93Zr "Tc 107pd 129j 135Cs 233U
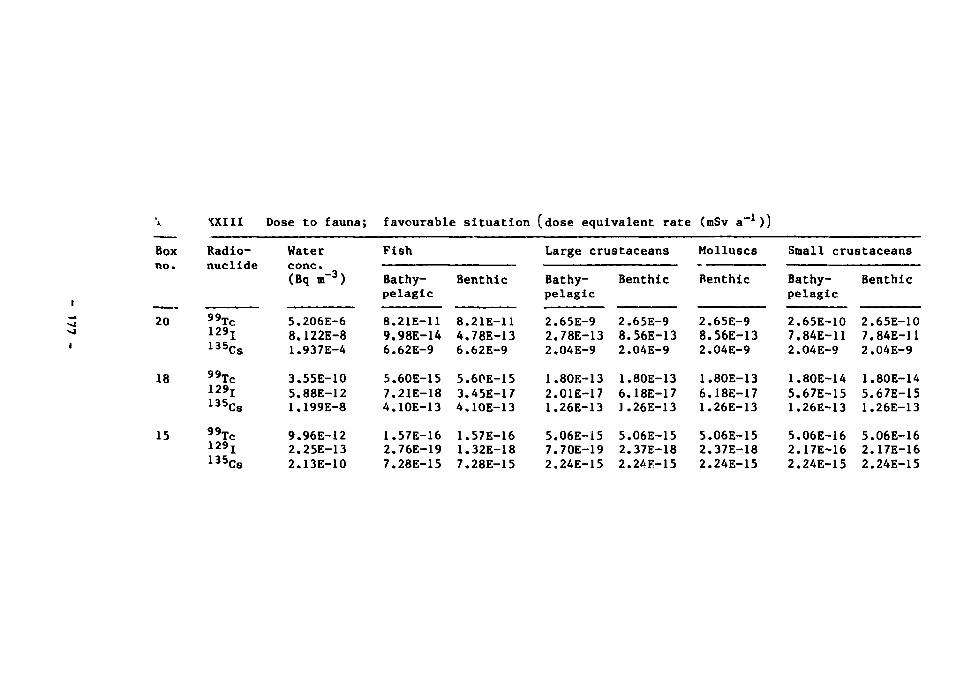
"{XIII Dose to fauna; favourable situation (dose equivalent rate (mSv a ))
Radionuclide
99Tc
129j 135Cs
"Tc 129J 135Cs
99Tc
129j 135Cs
Water
(Bq m-3)
5.206E-6 8.122E-8 1.937E-4
3.55E-10 5.88E-12 1.199E-8
9.96E-12 2.25E-13 2.13E-10
Fish
Bathy-pelagic
8.21E-11 9.98E-14 6.62E-9
5.60E-15 7.21E-18 4.10E-13
1.57E-16 2.76E-19 7.28E-15
Benthic
8.21E-11 4.78E-13 6.62E-9
5.6PE-15 3.45E-17 4.10E-13
1.57E-16 1.32E-18 7.28E-15
Large crustaceans
Bathy-pelagic
2.65E-9 2.78E-13 2.04E-9
1.80E-13 2.01E-17 1.26E-13
5.06E-15 7.70E-19 2.24E-15
Benthic
2.65E-9 8.56E-13 2.04E-9
1.80E-13 6.18E-17 J.26E-13
5.06E-15 2.37E-18 2.24E-15
Molluscs
Benthic
2.65E-9 8.56E-13 2.04E-9
1.80E-13 6.18E-17 1.26E-13
5.06E-15 2.37E-18 2.24E-15
Small crustaceans
Bathy-pelagic
2.65E-10 7.84E-11 2.04E-9
1.80E-14 5.67E-15 1.26E-13
5.06E-16 2.17E-16 2.24E-15
Benthic
2.65E-10 7.84E-J1 2.04E-9
1.80E-14 5.67E-15 1.26E-13
5.06E-16 2.17E-16 2.24E-15
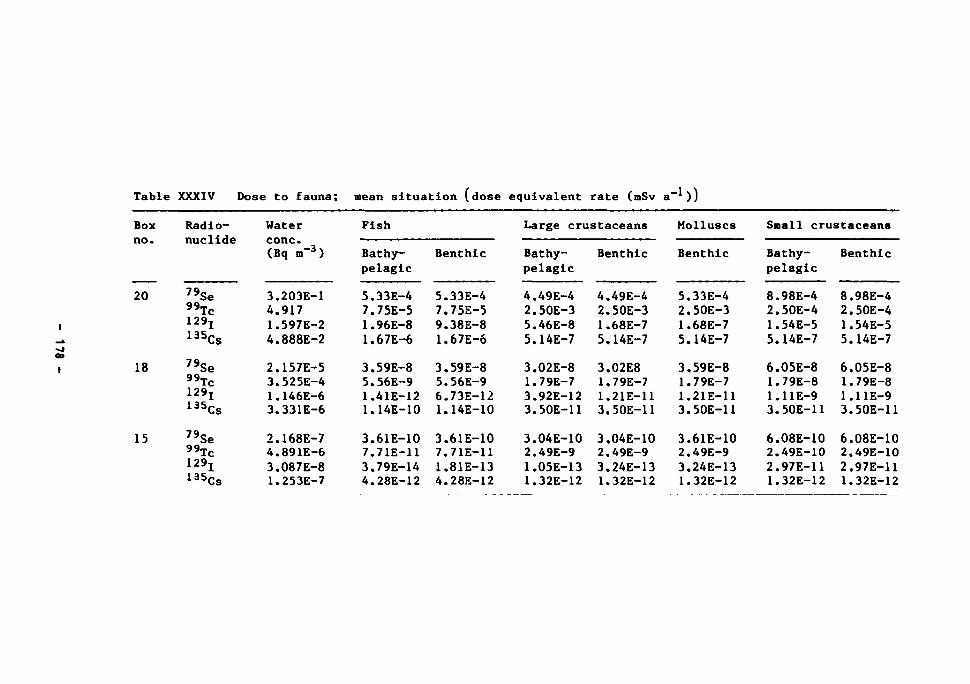
Table XXXIV Dose to fauna; mean situation (dose equivalent rate (mSv a. ))
Box
no.
20
18
15
Radionuclide
79Se 99Tc
129x 135Cs
79Se 99Tc
129x 135Cs
79Se "Tc 129x 135Cs
Water
cone. (Bq m-3)
3.203E-1 4.917 1.597E-2 4.888E-2
2.157E-5 3.525E-4 1.146E-6 3.331E-6
2.168E-7 4.891E-6 3.087E-8 1.253E-7
Fish
Bathy-pelagic
5.33E-4 7.75E-5 1.96E-8 1.67E-6
3.59E-8 5.56E-9 1.41E-12 1.14E-10
3.61E-10 7.71E-11 3.79E-14 4.28E-12
Benthic
5.33E-4 7.75E-5 9.38E-8 1.67E-6
3.59E-8 5.56E-9 6.73E-12 1.14E-10
3.61E-10 7.71E-11 1.81E-13 4.28E-12
Large crustaceans
Bathy-pelagic
4.49E-4 2.50E-3 5.46E-8 5.14E-7
3.02E-8 1.79E-7 3.92E-12 3.50E-11
3.04E-10 2.49E-9 1.05E-13 1.32E-12
Benthic
4.49E-4 2.50E-3 1.68E-7 5.14E-7
3.02E8 1.79E-7 1.21E-11 3.50E-11
3.04E-10 2.49E-9 3.24E-13 1.32E-12
Molluscs
Benthic
5.33E-4 2.50E-3 1.68E-7 5.14E-7
3.59E-8 1.79E-7 1.21E-11 3.50E-11
3.61E-10 2.49E-9 3.24E-13 1.32E-12
Small crustaceans
Bathy-pelagic
8.98E-4 2.50E-4 1.54E-5 5.14E-7
6.05E-8 1.79E-8 1.11E-9 3.50E-11
6.08E-10 2.49E-10 2.97E-11 1.32E-12
Benthic
8.98E-4 2.50E-4 1.54E-5 5.14E-7
6.05E-8 1.79E-8 1.11E-9 3.50E-11
6.08E-10 2.49E-10 2.97E-11 1.32E-12
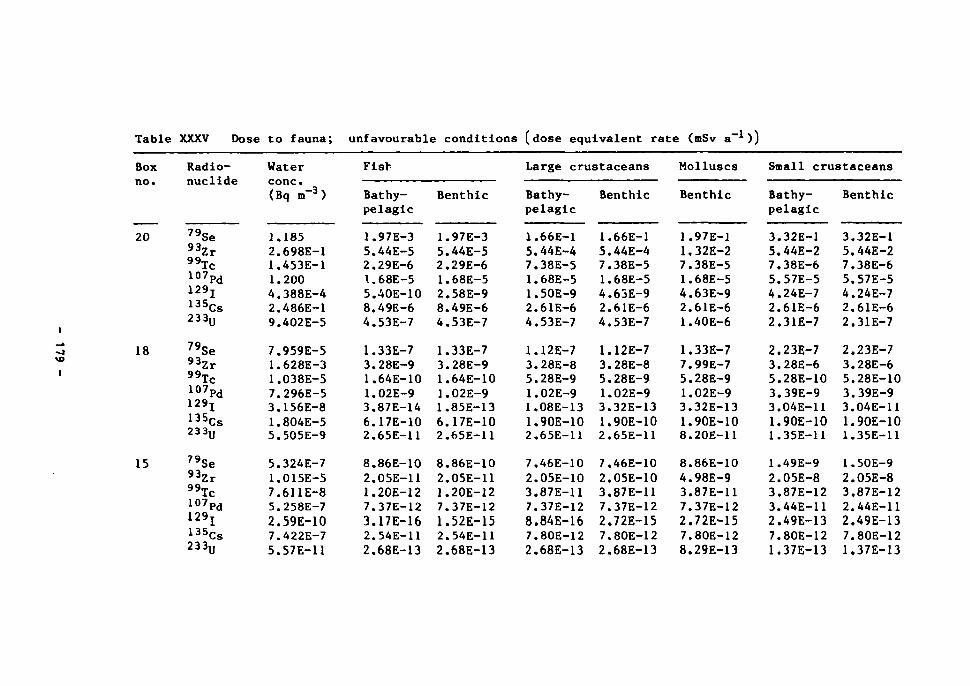
Table XXXV Dose to fauna; unfavourable conditions
Box
no*
20
18
15
Radionuclide
79Se 93Zr "Tc 107pd
129j 135Cs 23 3u
79Se 93Zr "Tc 107pd
129j 1 3 5Cs 233u
79Se 93Zr "Tc 107pd
129j 1 3 5Cs 233D
Water
cone. (Bq m - 3)
1.185 2.698E-1 1.453E-1 1.200 4.388E-4 2.486E-1 9.402E-5
7.959E-5 1.628E-3 1.038E-5 7.296E-5 3.156E-8 1.804E-5 5.505E-9
5.324E-7 1.015E-5 7.611E-8 5.258E-7 2.59E-10 7.422E-7 5.57E-11
Fish
Bathy-pelagic
1.97E-3 5.44E-5 2.29E-6 I.68E-5 5.40E-10 8.49E-6 4.53E-7
1.33E-7 3.28E-9 1.64E-10 1.02E-9 3.87E-14 6.17E-10 2.65E-U
8.86E-10 2.05E-11 1.20E-12 7.37E-12 3.17E-16 2.54E-11 2.68E-13
Benthic
1.97E-3 5.44E-5 2.29E-6 1.68E-5 2.58E-9 8.49E-6 4.53E-7
1.33E-7 3.28E-9 1.64E-10 1.02E-9 1.85E-13 6.17E-10 2.65E-11
8.86E-10 2.05E-11 1.20E-12 7.37E-12 1.52E-15 2.54E-11 2.68E-13
(dose equivalent rate (mSv a-1))
Large crustaceans taceans
Benthic
1.66E-1 5.44E-4 7.38E-5 1.68E-5 4.63E-9 2.61E-6 4.53E-7
Small crustaceans
Bathy-pelagic
1.66E-1 5.44E-4 7.38E-5 1.68E-5 1.50E-9 2.61E-6 4.53E-7
1.12E-7 3.28E-8 5.28E-9 1.02E-9 1.08E-13 1.90E-10 2.65E-11
7.46E-10 2.05E-10 3.87E-11 7.37E-12 8.84E-16 7.80E-12 2.68E-13
1.12E-7 3.28E-8 5.28E-9 1.02E-9 3.32E-13 1.90E-10 2.65E-11
7.46E-10 2.05E-10 3.87E-11 7.37E-12 2.72E-15 7.80E-12 2.68E-13
Molluscs
Benthic
1.97E-1 1.32E-2 7.38E-5 1.68E-5 4.63E-9 2.61E-6 1.40E-6
1.33E-7 7.99E-7 5.28E-9 1.02E-9 3.32E-13 1.90E-10 8.20E-11
8.86E-10 4.98E-9 3.87E-11 7.37E-12 2.72E-15 7.80E-12 8.29E-13
Bathy-pelagj
3. 5. 7, 5. 4, 2. 2,
2, 3, 5, 3, 3, 1. 1.
1. 2. 3, 3. 2, 7. 1,
,32E-.44E-.38E-.57E-• 24E-.61E-• 31E-
.23E-• 28E-.28E-.39E-.04E-.90E-,35E-
• 49E-,05E-.87E-.44E-.49E-• 80E-.37E-
c
-1 -2 -6 -5 -7 -6 -7
-7 -6 -10 -9 -11 -10 -11
-9 -8 -12 -11 -13 -12 -13
Benthic
3.32E-1 5.44E-2 7.38E-6 5.57E-5 4.24E-7 2.61E-6 2.31E-7
2.23E-7 3.28E-6 5.28E-10 3.39E-9 3.04E-11 1.90E-10 1.35E-11
1.50E-9 2.05E-8 3.87E-12 2.44E-11 2.49E-13 7.80E-12 1.37E-13
11. THE FEASIBILITY OF 'MONITORING' POSSIBLE
BIOLOGICAL CHANGES AT A CHOSEN SITE
Introduction
Regardless of the efforts which would be made to assess dose rates,
irradiation effects, or indeed any other potential impact on the deep-sea
fauna, the necessity to 'monitor' the deep sea directly is an aspect of some
debate. Quite clearly any potential site chosen for disposal of nuclear waste
should be the subject of thorough investigation, including that of radio
chemical analysis of materials obtained, prior to any operation in order to
obtain •» 'base-line' data set. There would also, no doubt, be post-operative
investigations - such investigations, presumably, seeking to provide evidence
of change. In view of the deep sea being thought of, traditionally, as an
essentially aseasonal and static environment, it is thus worth considering
briefly the extent to which the deep sea ^£ subject to change as a result of
natural processes. And in view of the low density of fauna, it is also worth
considering the.extent to which any apparent variations in the fauna could be
shown to be statistically different - at the individual or ecosystem level -
either between sites or at the same site.
Environmental influences on community composition
There are a number of factors which are now known to affect the composi
tion of deep-sea communities, although to what extent these are widespread
phenomena remains to be seen. One eff ct is that of variation in organic
matter input. For example, photographic analysis of faunal traces at deep-sea
sites with differing organic matter inputs by Mauviel (1982), Mauviel and
Sibuet (1985) and Young et al. (1985) have found evidence for an influence of
organic input on the ratio of burrowing to mobile deposit-feeding megafauna.
Where organic input was relatively lower, mobile deposit-feeders were more
abundant than burrowing forms; whereas burrowing deposit-feeders became more
abundant at sites where organic matter input was gr<v jr. The suggestions and
evidence that the deep sea does indeed have a degree of seasonality due to
organic matter input was discussed in Chapter 2, and this is an area which
needs much further study.
- 180 -
Apart from organic matter Input, the other major environmental variable
at abyssal depths Is that of current velocity. Two levels of influence of
current velocity on fauna composition can be distinguished. Areas of slightly
elevated to moderate current velocities are favourable to the sedentary
suspension-feeding component of the megafauna. Such currents increase the
amount of suspended organic particles flowing past suspension- feeders. The
availability of hard substrate for these fixed organisms may limit their
ability to exploit favourable current regimes, although this has not yet been
studied in the abyssal environment. The best-documented examples of current
effects in deep-sea community structure came from studies of seamounts where
the topography of the mount locally accelerates currents. Genln et al. (1986)
describe a suspension-feeder dominated megafauna on a seamount, where a
favourable current regime and hard substrate result in a rich and diverse
fauna, dominated by sedentary suspension feeders such as sponges, black
corals, anemones and tunlcates. The corals were most abundant in areas where
water flow was at a maximum.
A second influence of water currents on faunal composition is that of
recently-discovered benthic 'storms'. In these dynamic equivalents of atmos
pheric storms, an eddy or strong flow augments the local bottom current at
3-5 km depths, resulting in a fast water flow, the entrainment of sediment,
and resulting erosion. During the waning phase of the storm a heavy blanket
of sediment is rapidly re-deposited. These storms were first studied below
the Gulf Stream in the north-east Atlantic (Hollister and McCave, 1984) and
there now appears to be evidence for similar abyssal storm activity in several
other regions of the world.
The influence of these storms on the benthic fauna has been studied at
the Hebble site on the Scotian Rise (Thistle e_t £l., 1985; Thistle and
Sherman, 1985). Study was focused on the sediment infauna, the macrofauna and
meiofauna. Analysis and comparison with data from deep sites unaffected by
benthic storms revealed several features which have been interpreted as being
storm-related. Abundances of polychaetes, bivalves, isopods and tanaids were
notably high and may be related to enhanced food availability caused by the
currents. Qualitatively, the infauna was characterized by the dominance of a
small number of species and few adults (polychaetes and bivalves). This indi
cates that the storms are indeed disturbing events that produce an infauna
- 181 -
similar to that in recolonization experiments as described by Thistle et^ al.
(1985). These authors suggest that sediments are repeatedly denuded of fauna
by storms and recolonized by species with planktonic larvae. In addition, all
faunal groups tended to be dominated by species capable of burrowing into the
sediment (Thistle et al., 1985). The influence of storm events in benthic
megafaunal composition has yet to be studied.
The general environmental stability of the deep sea and the conditions
restricting organism growth have also led researchers to hypothesize that
deep-sea organisms would be slow to recolonize areas subject to serious
environmental disturbance. As for growth and reproductive strategies, there
are two apparently conflicting bodies of evidence for the rapidity of recolo
nization: experiments by Grassle (1977) and Levin and Smith (1984) reveal
very slow recolonization rates, while Turner (1973) and Desbruyeres et al.
(1980, 1985) report very rapid recolonization. Experiments designed to test
recolonization rate, while differing in some technical aspects, have in common
the placing of a de-faunated substrate - normally sediment - on the seafloor,
usually in recoverable containers, for periods of several months to years and
then comparing faunal composition and abundance in the recovered substrate
with that in surrounding sediments. One result, common to all experiments, is
that species dominant in surrounding sediments are slow to recolorize azoic
substrate compared with similar experiments in shallow water. (Grassle, 1977;
Levin and Smith, 1984). The rapid recolonization reported by Desbruyeres et
al. (1980) involved uncommon species, and Turner (1973) reported rapid
colonization of wood panels placed on the sea floor by wood-boring bivalves,
which are very specialized opportunistic species. Thus, while reports of
recolonization rates are conflicting, all reveal that the dominant fauna of
the deep sea - or at least the dominant fauna collected by box cores - is slow
to recolonize experimental substrates. Recently Smith (1985b), and Smith et_
al. (1986) have proposed that experimental design and apparatus may bias such
experiments, so that natural processes and successive events in recolonization
may be mechanically impeded or missed because of inadequate observational
series. Jii situ studies of megafaunal mounds have recently indicated an
unexpectedly rapid response in the deep-sea community, and high colonization
of artificial mounds by the background community. Many species thus seem
adapted to respond to frequent disturbance resulting from natural or
artificial mound building (Smith e£ a_l., 1986). Resolution of this important
- 182 -
question - the ability of deep-sea organisms to recolonize disturbed
substrate - appears to require more extensive experimentation. Factors that
need to be considered in the timing and interpretation of recolonization
experiments are the evidence for periodicity in growth, reproduction, and lar
val settlement in the deep-sea environment.
Estimating changes in faunal composition
Man has already had an impact on the deep-sea floor as a result of the
dumping of a variety of waste products. Trials have also been made to estab
lish the possible impact of large-scale deep-sea mining for metals recoverable
from manganese nodules. Techniques are also available to interpret, statis
tically, the species composition in deep-sea ecosystems, and the possible
utility of such an approach to describe a disposal site is worth further con
sideration. As discussed in the previous chapter, effects on the ecosystem
resulting from irradiation are extremely unlikely. Nevertheless, there may be
mechanical effects and a site would need surveying both before and after use.
The sampling of any such area would need, first of all, to be based on a
'random sampling' strategy: in the case of the deep sea, it is in fact diffi
cult to sample in any other way! The sampling frequency should approximately
equal the inverse of the square of the desired precision (ratio of the stan
dard error to the mean). Thus, for example, for a precision of 0.1, 100
samples would be required, and the minimum number of samples needed to compare
two sites with 0.95 confidence limits would be 200, i.e. 100 from each site.
There are two types of tests which are often used to examine species com
position: the 'diversity index' and 'cluster analysis'. The main diversity
indices in common use have been summarized by Green (1979) and are as
follows:
(i) S: the number of species in a sample, thought, by some, to be the onl)
truly objective measure of diversity.
- 183 -
(ii) Margalef's Index (d)
d = s - 1/log N
where N is the total number of individuals in the sample (all
species).
(ill) The Simpson Index (D)
D = 1 - I[N (N -l)]/[N(n-l)] J J J
where N is the number of individuals of species j. This is the proba
bility that two randomly selected individuals in the sample will be
different species.
(iv) The Brillouin Index (H)
H = 1/N log Nid^!^! Ng!)
This is an index of the uncertainty as to which of S species an indivi
dual from the sample belongs, if it is randomly sampled from a fully
censused collection of N individuals (a measure of the information con
tent per symbol of a message made up of N symbols of S different
kinds).
(v) The Shannon-Weaver Index (H')
(H«) - I p log p
where p is the proportion of the population that is the jth species.
(vi) Sanders' Rarefaction Index (SR) which attempts to remedy the problem of
the dependence of diversity effects on sample size.
Many of these diversity indices incorporate two separate components: the
number of species present, and the 'equitability' of abundance among them,
- 184 -
which unfortunately may vary independently of each other. 'Equitability' is
the ratio of the diversity (H') to its maximum possible value (M) when all
species are equally abundant; thus it is the opposite of 'dominance'. The
most serious limitation of diversity indices, from the ecological point of
view, is that they do not reveal information about the particular taxa that
characterize the sample. Thus, in case of any impact, they do not inform as
to which species or species-groups brought about the change in the community
which was observed, because this kind of information is lost in the computa
tion. Critical reviews of the diversity technique have been written by Pielou
(1966, 1975) and Green (1979).
Cluster analysis is potentially a more powerful tool, making full use of
the three-dimensional data - sites x species x time (Williams and Stephenson,
1973). Sites may be compared in terms of their species complements ('normal
analysis') or species may be compared in terms of the sites at which they were
found ('inverse analysis'). The Null hypothesis is that test site and control
site are much the sane in their species complement. Should samples cluster
into groups from the test area, on the one hand, and the control area, on the
other, then there may have been an effect. If the differences between the two
clusters can be shown to be significant with respect to appropriate'statisti
cal tests, then the possibility that these clusters may have arisen just by
chance can largely be eliminated. Many kinds of similarity index have been
used. Chardy (1975) and Monniot (1979) have used the Kulczensky-2 Index (1)
for deep-sea fauna, where
1 - \(-^r + -£-) x 100 2 s+u s+v
and s » number of species common to both sites, u « number of species present
in A and absent from B, and 1 • number of species present in B and absent
from A.
Cluster analyses may draw on simple qualitative data, i.e. whether
species are present in a sample or are absent, or more detailed quantitative
data, including the numerical abundance of each species relative to some
physical measure, such as area of substratum, or volume of water. The collec
tion of presence/absence data is less time-consuming, permitting the
- 185 -
examination of more samples from the test site, and these data usually contain
enough information to detect significant differences. Haedrich et al. (1980)
have applied such clustering techniques to the analysis of the megabenthic
fauna of the deep sea.
One of the problems associated with the use of species to detect an
impact is that, as has been stressed throughout, the fauna of the deep sea is
incompletely known. Thus it would not be possible to include all the species
living at the disposal site; some selection would be imposed. This need not
be a severe handicap, however, nor need it lead to biassed results. Much of
the information about the structure of a community in space and time may be
carried by just a few species. Thus, if a species subset is chosen, time and
effort is saved in laborious sorting, counting and identification. However,
several questions need to be taken into account in making the selection. For
example, sampling bias must be minimized, hence sedentary species may be more
appropriate than mobile ones v;hich could avoid the sampling device; and, as
with any tool or method, the species that is likely to be sensitive to an
impact is more appropriate to the study than the one that is thought to be
insensitive. Non-mobile species that live in close contact with the sediment
are probably the most appropriate choice. There is some debate about whether
species or genera are more appropriate for environmental impact studies
(Green, 1979). Based on empirical data from meiobenthos surveys, Jumars
(1981) concludes that 'guilds' of species should be chosen for the analysis
rather than arrays of single species, but this may not be necessary with the
macrofauna where the species are fewer and much better knowni Photographic
surveys could also be made, but the work involved in evaluating the results i
far from trivial.
- 186 -
12. CONCLUSIONS AND RECOMMENDATIONS
As stated in the Introduction, biological processes are important for
a number of reasons with regard to assessing the feasibility of high-level
waste disposal in the deep sea: because they affect the distribution of
radionuclides in the oceans, because they provide biological pathways to man,
and because the fauna in deep-sea ecosystems require protection in their own
right.
Taking these reasons in order, the role of biological processes in
bringing about the mass transfer of radionuclides in the oceans is important,
as discussed in Chapter 6. All of the evidence suggests that such processes
could not markedly affect the bulk transport of radionuclides from the deep-
sea to surface waters, in comparison with physical processes. Indeed the
principal role of organisms is that of producing particulate materials which
scavenge radionuclides in the water column and return them to the sea floor,
thus reducing the upward rates of such transport for most radionuclides;
however the spatial and temporal variabilities of such fluxes are not yet
fully quantified. The upward flux of buoyant particles has been identified;
this pathway requires further investigation because further studies of the net
flux are required. This is an important area because the net flux directly
affects the prediction of surface-water concentrations and thus the potential
dose to man; although as already stated, all of the evidence suggests that
the net flux is overwhelmingly downwards.
Bioturbatory processes at the seawater-sediment interface are more com
plex, in that they both accelerate the introduction of radionuclides from deep
in the sediments into the water column, and they affect the re-incorporation
of radionuclides scavenged from the water column back into the sediment. They
may also markedly alter the chemical form of the nuclides. Few studies have
addressed this important process which ultimately affects the mass distribu
tion of many radionuclides in the oceans.
Biological pathways have been discussed in Chapter 7. It would appear
that, at the present state of knowledge, the principal and most feasible path
way which could result in human exposure is that of the consumption of
- 187 -
seafoods taken from coastal waters, waters which would have become contamina
ted as a result of advective and diffusive processes. As a second possibi
lity, the direct consumption of deep-sea fish could provide a shorter pathway,
but one which is unlikely to be sustained. And a third possibility is that of
discrete food chains from the deep sea into shallower waters. No such pathway
direct to man has yet been identified, although there are a number of possibi
lities, as discussed in Chapter 7. The most difficult aspect of assessing the
importance of such pathways is their quantification, particularly the probabi
lity of each link being sustained. Some modelling in this direction has been
started, as discussed in Chapter 8, but there is clearly scope for future work
in this direction. For example, there is increasing evidence of vertical
migrations at depth, and of a highly mobile benthopelagic fauna - mobile both
vertically and horizontally. Quantitative assessments of the frequency,
extent and biomass involved in such migrations could now be made. This would
allow the development of more realistic food chain models, and the means of
validating them in terms of basic assumptions of predator/prey relationships.
The chemical analyses of migrating organisms would also allow quantitative
validation of the transfer of elements from one link in the food chain to the
next. As to collective dose, the only assumptions which can be made are those
based on present-day experience, plus an extrapolation using ideas for the
maximum sustainable yields of the oceans. This is another area which would be
amenable to some simplified modelling.
With regard to the all-important safeguarding of the deep-sea ecosystem,
the principal comments to be made are those relating to estimates of dose
rates. These indicate that no adverse effects would be expected. But the
potential impact from general disturbance of a site, or of accidents, has not
been considered in detail by the BTG. There is clearly scope for further wor
in this area, including in situ experiments in the deep sea. The technology
is now available to place and retrieve experimental packages on the deep-sea
floor so that the effects of irradiation from seabed sources, the effects of
mechanical disturbance, raised temperatures and so on can be assessed more
directly.
It must of course be remembered that the deep sea is the largest ecosys
tem on Earth. There have been dramatic increases in our knowledge of this
environment in recent years, but our level of understanding is still very low.
- 188 -
In consequence, the models used have had to be kept as simple as possible in
order to be compatible with the quality of che data available. On the basis
of such models, and our knowledge of the deep sea in general, no biological
factors have been identified which would preclude sub-seabed disposal of waste
from a list of possible options. Nevertheless, recent discoveries such as the
highly productive chemosynthesis-based communities around geothermal vents
indicate that major advances are still being made and thus, by inference,
could be made in the future. All of the biological aspects are amenable to
future research. Available expertise varies between countries and any conti
nued programme should be internationally coordinated.
Thus any commitment to keeping deep-sea disposal as a viable option for
high-level waste must be accompanied by an equal commitment to sustain an
active international programme of deep-sea biological research. It needs to
be emphasized that even a pre-operational survey would require a considerable
effort merely to identify the material, and that the number of scientists
capable of making such identification - taxonomists - are few and far between.
Aspects of seasonal variability, as indicated by organic matter input, will
necessitate detailed study. But fundamental to all of these aspects is the
reliance upon the deployment of adequate technology. The radical increases i
our understanding of the structure of the dynamics of deep-sea ecosystems in
the 1970s resulted from the development of new instrumentation. Sufficient
technology now exists to address the outstanding aspects of research which
have already been identified; these can be significantly advanced over rela
tively short time-scales. No future steps towards investigating the sea dis
posal option should be taken without allowance for a concomitant biological
programme.
- 189 -
REFERENCES
Aller, J. Y. and Aller, R. C. (1986). Evidence for localized enhancement of biological activity associated with tube and burrow structures in deep-sea sediments at the HEBBLE site, western north Atlantic. Deep-Sea Res., JJ3 (6), 755-790.
Alper, T. (1961). Effects on subcellular units and free-living cells. In: Mechanisms in Radiobiology, Vol. 1 (Eds. M. Errera and A. Forssberg). Academic Press, New York, pp.353-417
Amaratunga, T. (1983). The role of cephalopods in the marine ecosystem. FAO Tech. Pap., _231_, 379-415.
Anderson, D. R. (Ed.) (1981). Proceedings of the 6th Annual NEA-Seabed Working Group Meeting, Paris, France, February 2-5, 198'. SAND81-0427, Sandia National Labs., 69-75.
Anderson, D. R. (Ed.) (1987). Tenth international meeting of the NEA co-ordinated program to assess the subseabed disposal of nuclear wastes. Vol. 1. SAND85-1365, Sandia National Labs., 146 pp.
Angel, M. V. (1979a). Studies on Atlantic halocyprid cstracods: their vertical distributions and community structure in the central gyre region along latitude 30°N from off Africa to Bermuda. Pr>.<;. Oceanogr., ji, 3-124.
Angel, M. V. (1979b). Zoogeography of the Atlantic Ocean. In: Zoogeography and Diversity in Plankton (Eds. S. van der Spoel and A. C. Pierrot-Bults). Bunge Scientific Publishers, Utrecht, pp.168-190
Angel, M. V. (1983a). A vertical profile of planktonic ostracods from depths of 1500-3900 m at a north-east Atlantic station. In: Applications o Ostracoda (Ed. R. F. Maddocks). University of Houston, Texas, pp.549-559.
Angel, M. V. (1983b). Are there any potentially important routes whereby radionuclides can be transferred by biological processes from the sea-bed towards the surface. In: Ecological Aspects of Radionuclide Release (Ed. P. J. Coughtrey). Special Publication No. 3 of the British Ecological Society. Blackwell Scientific Publications, Oxford, pp.161-176.
Angel, M. V. (1984). A review of biological processes within oceanic water columns relevant to the assessment of the safety of disposal of waste, notably radioactive isotopes on or within the seabed. IOS Report, No. 198, 97 pp.
Angel, M. V. and Baker, A. de (1982). Vertical distribution of the standing crop of plankton and micronekton at three stations in the northeast Atlantic. Biol. Oceanogr., 2» l-30.
- 190 -
Angel, M. V. and Fasham, M. J. R. (1975). Analysis of the vertical and geographic distributions of the abundant species of planktonic ostracods in the north-east Atlantic. J. mar. biol. Ass. U.K., 55, 709-737.
Angel, M. V., Hargreaves, P., Kirkpatrick, P. and Domanski, P. (1982). Low variability in planktonic and micronektonic populations at 1000 m depth in the vicinity of 42°N 17°W; evidence against diel migratory behaviour in the majority of species. Biol. Oceanogr., ±, 287-319.
Aston, S. R. and Fowler, S. W. (1984). Experimental studies on the bioaccumulation of plutonium from sea water and a deep-sea sediment by clams and polychaetes. J. Environ. Radioactivity, J_, 67-78.
Backus, R. H., Craddock, J. E., Haedrich, R. L. and Robison, B. H. (1977). Atlantic mesopelagic zoogeography. In: Fishes of the Western North Atlantic, 7. Memoir of the Sears Foundation for Marine Research, No. 1, part 7, pp.266-287.
Badcock, J. and Merrett, N. R. (1976). Midwater fishes in the eastern North Atlantic. 1. Vertical distribution and associated biology in 30°N 23°W, with developmental notes on certain mytophfds. Prog. Oceanogr., I, 3-58.
Badcock, J. and Merrett, N. R. (1977). On the distribution of midwater fishes in the eastern North Atlantic. In: Oceanic Sound Scattering Prediction (Eds. N. R. Andersen and B. J. Zahuranec). Plenum Press, New York, pp.249-282.
Baker, A. de C. (1957). Underwater photographs in the study of oceanic squid. Deep-Sea Res., j», 126-129.
Baker, A. de C. (1960). Observations of squid at the surface in the NE Atlantic. Deep-Sea Res., J>, 206-210.
Balistrieri, L. S., Brewer, P. G. and Murray, J. W. (1981). Scavenging residence times of trace metals and surface chemistry of sinking particles in the deep ocean. Deep-Sea Res., 28A, 101-121.
Baptist, J. P. and Price, T. J. (1962). Accumulation and retention of caesium-137 by marine fishes. Fishery Bull., US Fish. Wild. Service, 6£, 177-187.
Beasley, T. M. and Lorz, H. V. (1986). A review of the biological and geo-chemical behaviour of technetium in the marine environment. In: Technetium in the Environment, (Ed. G. Esmet and C. Myttenaere). Elsevier Applied Science Publishers, pp.197-216.
Belot, Y. (1986). Transfer of long-lived radionuclides through marine food chains: a review of transfer data. J. Environ. Radioact., _4, 83-90.
Belot, Y. (1987). Personal communication.
Bensoussan, M. G., Scodittl, P. M. and Bianchi, A. J. M. (1984). Bacterial flora from echlnoderm guts and associated sediment in the abyssal Vem Fault. Mar. Biol., 79, 1-10.
- 191 -
Bettencourt, A. 0. de, Carreiro, M. C. Vaz and Sequeria, M. M. (1980). Contribution au controle radiologique du milieu marin. In: Marine Radioecology. Proc. 3rd NEA Seminar. NEA/OECD, Paris, pp.47-54.
Betzer, P. R., Showers, W. J., Laws, E. A., Winn, C. D., Di Tullis, G. R. and Kroopnick, P. M. (1984). Primary productivity and particle fluxes on a transect of the equator at 153°W in the Pacific Ocean. Deep-Sea Res., JH, 1-11.
Billett, D. S. M., Lampitt, R. S., A. L. Rice and Mantoura, R. F. C. (1983). Seasonal sedimentation of phytoplankton to the deep-sea benthos. Nature, Lond., 302, 520-522.
Booty, B. (Ed.) (1985). Status Report on Research at the Institute of Oceanographic Sciences Related to the Possible Disposal of Radioactive Waste on or Beneath the Seafloor, April 1979-March 1984. Institute of Oceanographic Sciences, Report No. 204, 333 pp.
Boudreau, B. P. (1986a). Mathematics of tracer mixing in sediments. I: Spatially-dependent, diffusive mixing. Am. J. Sci., 286, 161-198.
Boudreau, B. P. (1986b). Mathematics of tracer mixing in sediments. II. Nonlocal mixing and biological conveyor-belt phenomena. Am. J. Sci., 286, 199-238.
Bowen, H. J. M. (1979). Environmental Chemistry of the Elements. Academic Press, London, 333 pp.
Bowman, T. E. and Manning, R. B. (1972). Two Arctic bathyal crustaceans: the shrimp Bythocaris cryonesus new species, and the amphipod Eurythenes gryllus, with in-situ photographs from Ice Island T-3. Crustaceana, 2J3, 187-201.
Boxshall, G. A. and Roe, H. S. J. (1980). The life history and ecology of the aberrant bathypelagic genus Benthomosphria Sars, 1909 (Copepoda, Misophrioida). Bulletin of the British Museum (Natural History), Zoology, j58, 9-41.
Brauer, R. (Ed.) (1972). Barobiology and the Experimental Biology of the Dee Sea, North Carolina Sea Grant Program. University of North Carolina, Chapel Hill, 428 pp.
Bridger, J. P. (1978). New deep-water trawling grounds to the west of Britain. Lab. Leafl., MAFF Direct. Fish. Res., Lowestoft, (41), 40 pp.
Brownell, G. L., Ellett, W. H. and Reddy, A. R. (1968). Absorbed fractions for photon dosimetry. J. Nucl. hed., Suppl. 1, 27-39.
Burnett, B. R. (1977). Quantitative sampling of microbiota of the deep-sea benthos. I. Sampling technique and some data from the abyssal centra North Pacific. Deep-Sea Res., V*_, 781-789.
- 192 -
Burnett, B. R. (1979). Quantitative sampling of microbiota of the deep-sea benthos. II. Evaluation of technique and introduction to the biota of the San Diego Trough. Transactions of the American Microscopical Society, 98, 233-242.
Burnett, B. R. (1981). Quantitative sampling of nanobiota (microbiota) of the deep-sea benthos. III. The bathyl San Diego Trough. Deep-Sea Res., 28A, 649-663.
Caddy, J. F. (1983). The cephalopoda: factors relevant to their population dynamics and to the assessment and management of stocks. FAO Tech. Pap., 232, 416-452.
Cahet, G. and Sibuet, M. (1986). Activite biologique en domaine profond: transformations biochimiques in situ de composes organiques marques au carbone-14 a 1'interface eau-seidiment par 2 000 m de profondeur dans le golfe de Gascogne. Mar. Biol., JK), 307-315.
Calvert, S. E. (1966). Origin of diatom-rich varved sediments from the Gulf of California. J. Geology, _74.» 546-565.
Carey, A. G. Jr. (1981). A comparison of benthic infaunal abundance on two abyssal plains in the northeast Pacific Ocean. Deep-Sea Res., 28A (5), 467-479.
Chardy, P. (1975). Les isopodes asellotes de la plaine abyssale Atlantique. Exploitation mathematique des donnees. These, Universite Pierre et Marie Curie, Paris, 390 pp.
Cherry, R. D. and Heyraud, M. (1981). Plonium-210 content of marine shrimp: variations with biological and environmental factors. Mar. Biol., 65, 165-175.
Cherry, R. D. and Heyraud, M, (1982). Evidence of high natural radiation doses in certain mid-water oceanic organisms. Science, NY, 218, 54-56.
Cherry, R. D., Heyraud, M. and Higgo, J. J. W. (1983). Polonium-210: its relative enrichment in the hepatopancreas of marine invertebrates. Mar. Ecol. Prog. Ser., JU, 229-236.
Childress, J. J. and Price, M. H. (1978). Growth rate of the bathypelagic crustacean Gnathophausla ingens (Mysidacea: Lophogastridae). I. Dimensional growth rate and population structure. Mar. Biol., 50, 47-62.
Clarke, M. R. (1963). Economic importance of North Atlantic squid. New Sclent., _1_7, 568-570.
Clarke, M. R. (1966). A review of the systematics and ecology of oceanic squids. Adv. Mar. Biol., ,4, 91-300.
Conover, R. J. and Francis, V. (1973). The use of radioactive isotopes to measure the transfer of materials in aquatic food chains. Mar. Biol., 18, 272-283.
- 193 -
Coughtrey, P. J., Jackson, D. and Thorne, M. C. (1983). Radionuclide Distribution and Transport in Terrestrial and Aquatic Ecosystems, Vol. 3. A. A. Balkema, Rotterdam, 372 pp.
Coughtrey, P. J. and Thorne, M. C. (1983a). Radionuclide Distribution and Transport in Terrestrial and Aquatic Ecosystems, Vol. 1. A. A. Balkema, Rotterdam, 496 pp.
Coughtrey, P. J. and Thorne, M. C. (1983b). Radionuclide Distribution and Transport in Terrestrial and Aquatic Ecosystems, Vol. 2. A. A. Balkema, Rotterdam, 500 pp.
Craven, D. B. Jahnke, R. A. and Carlucci, A. F. (1986). Fine-scale vertical distributions of microbial biomass and activity in California Borderland sediments. Deep-Sea Res., 21 (3>» 379-390.
Csanady, G. T. (1986). Mass transfer to and from small particles in the sea. Limnol. Oceanogr., 31, 237-248.
Dahl, E. (1979). Deep-sea carrion feeding amphipods: evolutionary patterns i niche adaptation. Oikos, 33, 167-175.
Dayton, P. K. and Hessler, R. R. (1972). Role of biological disturbance in maintaining diversity in the deep-sea. Deep-Sea Res., _1£, 199-208.
Deevey, G. B. and Brooks, A. L. (1971). The annual cycle in quantity and com position of the zooplankton of the Sargasso Sea off Bermuda. II. The surface to 2000 m. Limnol. Oceanogr., J^, 927-943.
De Master, D. J. and Cochran, J. K. (1982). Particle mixing rates in deep-se sediments determined from excess 2 1 0Pb and 32Si profiles. Earth Planet. Sci. Lett., 6^, 257-271.
Deming, J. W. (1985). Bacterial growth in deep-sea sediment trap and boxcore-samples. Mar. Ecol. Prog. Ser., J25_, 305-312.
Deming, J. W. and Colwell, R. R. (1985). Observations of barophilic microbia activity in samples of sediment and intercepted particulates from the Dmerara abyssal plain. Appl. Environ. Microbiol., 5_0_ (4), 1002-1006.
Deming, J. W., Tabor, . 1. and Colwell, R. R. (1981). Barophilic growth of bacteria from intestinal tracts of deep-sea invertebrates. Microbiol. Ecol., _7, 85-94.
Desbruyeres, D., Bervas, J. W. and Khripounoff, A. (1980). Un cas de colonisation rapide d'un sediment profond. Oceanologica Acta, 2. (3), 285-291.
Desbruyeres, D., Deming, J. W., Dinet, A. and Khripounoff, A. (1985). Reactions de l'ecosysteme benthique profond aux perturbations: nouveaux resultats experimentaux. In: Peuplements Profonds du Golfe de Gascogne (Eds. L. Laubier and C. L. Monniot). IFREMER, pp.193-208.
- 194 -
Deuser, W. G. (1986). Seasonal and interannual variations in deep water particle fluxes in the Sargasso Sea and their relation to the surface hydrography. Deep-Sea Res., jJ|3, 225-246.
Deuser, W. G. and Ross, E. H. (1980). Seasonal change in the flux of organic carbon to the deep Sargasso Sea. Nature, Lond., 283, 364-365.
Deuser, W. G., Ross, E. H. and Anderson, R. F. (1981). Seasonality in the supply of sediment to the deep Sargasso-Sea and implications for the rapid transport of matter to the deep ocean. Deep-Sea Res., 28A, 495-505.
Dietz, A. A. and Yayanos, A. A. (1978). Silica gel medium for isolating and studying bacteria under hydrostatic pressure. Appl. Environ. Microbiol., _36_, 966-968.
Doi, T., Kidachi, T., Honjo, K., Matsushita, Y., Nemoto, T., Shimizu, M., Sudo, H. and Tsuruga, H. (1980). A preliminary assessment of biological transport of radionuclides dumped at sea bottom. In: Marine Radioecology, Proc. 3rd NEA Seminar. NEA/OECD, 95-110.
Dymond, J. and Collier, R. W. (1987). Nares Abyssal Plain sediment flux studies, FY 1985 Annual Report. In: SAND86-2527. Sandia National Labs., B1-B24.
Eberhardt, L. L. and Gilbert, R. 0. (1973). Gamma and lognormal distributions as models in studying food chain kinetics. Battelle Northwest Labs., Rep. BNWL-1747, UC-23, 95 pp.
Eisler, R. (1973). Annotated bibliography on biological effects of metals in aquatic environments (No. 1-567). United States Environmental Protection Agency, Rep. R3-73-O07, 287 pp.
Eisler, R. (1981). Trace Metal Concentrations in Marine Organisms. Pergamon Press, New York, 685 pp.
Eisler, R., O'Neill, D. J. and Thompson, G. W. (1978). Third annotated bibliography on biological effects of metals in aquatic environments (No. 1293-2246). United States Environmental Protection Agency, Rep. EPA/600/3-78-005, 487 pp.
Eisler, R. and Wapner, M. (1975). Second annotated bibliography on biological effects of metals in aquatic environments (No. 568-1292). United States Environmental Protection Agency, Rep. EPA/600/3-75-008, 400 pp.
Ellett, W. H. and Humes, R. M. (1971). Absorbed fractions for small volumes containing photon-emitting radioactivity. J. Nucl. Med., J_2, Suppl. 5, 25-32.
Eppley, R. W. and Peterson, B. J. (1979). Particulate organic matter flux an planktonic new production in the deep ocean. Nature, Lond., 282, 677-680.
- 195 -
FAO (1983). Advances in Assessment of World Cephalopod Resources. FAO Technical Paper 231.
Fasham, M. J. R. and Angel, M. V. (1975). The relationship of the zoogeo-graphic distributions of the planktonic ostracods in the north-east Atlantic to the water mass. J. mar. biol. Ass. U.K., 55, 739-757.
Fasham, M. J. R. and Foxton, P. (1979). Zonal distribution of pelagic Decapoda (Crustacea) in the eastern north Atlantic and its relation to physical oceanography. J. Exp. Mar. Biol. Ecol., 37, 225-253.
Fasham, M. J. R., Piatt, T., Irwin, B. and Jones, K. (1985). Factors affecting the spatial pattern of the deep chlorophyll maximum in the region of the Azores front. Progress in Oceanoraphy, J^, 129-165.
Feldt, W., Kanisch, G., Kanisch, M. and Vobach, M. (1985). Radioecological studies of sites in the Northeast Atlantic used for dumping of low-level radioactive wastes. Results of the research cruises of FRV "Walther Herwig" 1980-1984. Arch. FishWiss., 21 O), 91-195.
Fisher, N. S. (1982). Bioaccumulation of technetium by marine phytoplankton. Environ. Sci. Technol., JK>, 579-581.
Fisher, M. S., Bjerregaard, P. and Fowler, S. W. (1983a). Interactions of marine plankton with transuranic elements. 1. Biokinetics of neptunium, plutonium, americium and californium in phytoplankton. Limnol. Oceanogr., J8, 432-447.
Fisher, N. S., Bjerregaard, P. and Fowler, S. W. (1983b). Interactions of marine plankton with transuranic elements. 3. Biokinetics of americium in euphausiids. Mar. Biol., 7j , 261-268.
Fisher, N. S., Bohe, M. and Teyssie, J.-L. (1984). Accumulation and toxicity of Cd, Zn, Ag and Hg in four marine phytoplankters. Mar. Ecol. Prog. Ser., _U), 201-213.
Folsom, T. R. and Beasley, T. M. (1973). Contributions from the alpha-emitter, polonium-210, to the natural radiation environment of marine organisms. In: Radioactive Contamination of the Marine Environment, IAEA-SM-158. IAEA, Vienna, pp.625-632.
Fowler, S. w. (1977). Trace metals in zooplankton particulate products. Nature, Lond., 269, 51-53.
Fowler, S. W. and Knauer, G. A. (1986). Role of large particles in the transport of elements and organic compounds through the oceanic water column. Prog. Oceanogr., J_6» 1*7-194.
Gage, J. D. (1979). Macrobenthic community structure in the Rockall Trough. Ambio, 2» 43-46.
Gage, J. D. and Tyler, P. A. (1982). Growth strategies in deep-sea ophiurids. International Echinoderms Conference, Tampa Bay (Ed. J. M. Lawrence). Balkema, Rotterdam, 305-311.
- 196 -
Gardner, U. D., Hinga, K. R. and Marra, J. (1983). Observations on the degradation of biogenic material in the deep ocean with implications on accuracy of sediment trap fluxes. J. Mar. Res., 41, 195-214.
Geistdoerfer, P. (1982). Rythmes biologiques et croisance des poissons dans les grander prondeurs marines. Oceania, jl, 599-609.
Genin, A., Dayton, P K., Lonsdale, P. F. and Spiess, F. N. (1986). Corals on seamount peaks provide evidence of current acceleration over deep-sea topography. Nature, Lond., 323, 59-61.
George, R. Y. and Menzies, R. J. (1968). Further evidence for seasonal breeding cycles in deep sea. Nature, Lond., 220, 80-81.
Germain, P., Boust, D., Sibuet, M., Philipott, J.-C, Hemon, G. (1984). Analyses elementaires de sediments et d'organismes provenant de la plaine abyssale du Cap Vert (Sites CV1 et CV2). Rapport CEA-R-5275, Commissariat a l'Energie Atomique, France, 16 pp.
Germain, P., Gandon, R., Masson, M. and Guegueniat, P. (1987). Experimental studies of the transfer of neptunium from sea water to sediments and organisms (Annelids and Molluscs). J. Environ. Radioactivity, _5, 37-55.
Gomez, L. S., Kupferman, S. L. and Marietta, M. G. (1986). Subseabed Disposal Project Annual Reports: Environmental Studies October 1981 through September 1983, SAND85-1037. Sandia National Labs., 522 pp.
Gomez, L. S., Marietta, M. G. and Jackson, D. W. (1985). Compilation of selected marine radioecological data for the U.S. subseabed program: summaries of available radioecological concentration factors and biological half-lives, SAND84-2087. Sandia National Laboratories, Albuquerque, New Mexico.
Gomez, L. S., Marietta, M. G. and Jackson, D. W. (1986). Compilation of selected marine radioecological data for the U.S. subseabed programe: summaries of available radioecological concentration factors and biological half-lives, SAND85-2631. Sandia National Laboratories, Albuquerque, New Mexico.
Gordon, D. C. Jr. (1977). Variability of particulate organic carbon and nitrogen along the Halifax-Bermuda section. Deep Sea Res., 24, 257-270.
Gould, W. J. (1985). Physical oceanography of the Azores front. Prog. Oceanogr., _U, 167-190.
Gowing, M. M. and Silver, M. W. (1985). Minipellets: a new and abundant size class of marine fecal pellets. J. Mar. Res., _4_3, 395-416.
Gowing, M. M. and Wishner, K. F. (1986). Trophic relationships of deep-sea calanoid copepods from the benthic boundary layer of the Santa Catallna Basin, California. Deep-Sea Res., 3_3, 939-961.
- 197 -
Grassle, J. F. (1977). Slow recolonization of deep-sea sediment. Nature, Lond., 265, 618-619.
Grassle, J. F. and Sanders, H. L. (1973). Life histories and the role of dis turbance. Deep-Sea Res., 0, 643-659.
Green, R. H. (1979). Sampling Design and Statistical Methods for Environmental Biologists. Wiley Interscience.
Grice, G. D. (1972). The existence of a bottom-living calanoid copepod fauna in deep water with descriptions of five new species. Crustaceana, J23, 219-242.
Grice, G. D. and Hulsemann, K. (1970). New species of bottom-living calanoid copepods collected in deep water by the DSRV Alvin. Bulletin of the Museum of Comparative Zoology, 139, 185-230.
Guinasso, N. L. and Schink, D. R. (1975). Quantitative estimates of biological mixing rates in abyssal sediments. J. Geophys. Res., 80, 3032-3043.
Haedrich, R. L., Rowe, G. T. and Polloni, P. T. (1980). The megabenthic fauna in the deep sea south of New England, USA. Mar. Biol., J>Z» 165-179.
Hamner, P. and Hamner, W. M. (1977). Chemosensory tracking of scent trails by the planktonic shrimp Acetes sibogae australis. Science, NY, 195, 886-888.
Harding, G. C. H. (1973). Decomposition of marine copepods. Limnol. Oceanogr., J_8, 670-673.
Hargrave, B. T. (1985a). Particle sedimentation in the ocean. Ecol. Modelling, 30, 229-246.
Hargrave, B. T. (1985b). Feeding rates of abyssal scavenging amphipods (Eurythenes gryllus) determined in situ by time-lapse photography. Deep Sea Res., J32 (4), 443-450.
Hargrave, B. T. (1986). Transfer of 2t,1Am and 2 3 7Pu from euphausiid moults to a carbonate-rich marine sediment. J. Environ. Radioact., 2^, 125-143.
Hargreaves, P. M. (1984). The distribution of Decapoda (Crustacea) in the open ocean and near-bottom over an adjacent slope in the northern north-east Atlantic Ocean during autumn 1979. J. mar. biol. Ass. U.K., .64, 829-857.
Hargreaves, P. M. (1985). The distribution of Mysidacea in the open ocean and near-bottom over slope regions in the northern north-east Atlantic Ocean during 1979. J. Plank. Res., ]_, 241-261.
Hargreaves, P. M., Ellis, C. J. and Angel, M. V. (1984). An assessment of biological processes close to the sea bed in a slope region and its significance to the assessment of sea-bed disposal of radioactive waste. 10S, Rep. No. 185, 121 pp.
- 198 -
Harrisson, C. M. H. (1967). On Methods for Sampling Mesopelagic Fishes. Symp. zool. Soc. Lond., 19, 71-126.
Herring, P. J. (1972). Depth distribution of the carotenoid pigments and lipids of some oceanic animals. I. Mixed zooplankton, copepods and euphausiids. J. mar. biol. Ass. U.K., 52, 179-189.
Herring, P. J. (1973). Carotenoid pigments and lipids of decapods. J. mar. biol. Ass. U.K., _53, 539-562.
Hessler, R. R. (1974). The structure of deep benthic communities from central oceanic waters. In: The Biology of the Oceanic Pacific (Ed. B. Miller). Oregon State University Press, pp.79-93.
Hessler, R. R. and Ingram, C. L. (1986). Benthic biology studies. In: Sub-seabed disposal Project Annual Reports: Oct. 81 through Sept. 1983, SAND85-1037. Sandia National Labs., 331-342.
Hessler, R. R. and Jumars, P. A. (1974). Abyssal community analysis from replicate box cores in the central North Pacific. Deep-Sea Res., 21, 185-209.
Hessler, R. R. and Sanders, L H. (1967). Faunal diversity in the deep-sea. Deep-Sea Res., _14, 65-78.
Heyraud, M. and Cherry, R. D. (1979). Polonium-210 and lead-210 in marine food chains. Mar. Biol., _52, 227-236.
Hollister, C. D. and McCave, I. N. (1984). Sedimentation under deep-sea storms. Nature, Lond., _309, 220-225.
Honjo, S. (1980). Material fluxes and modes of sedimentation in the mesopelagic and bathypelagic zones. J. Mar. Res., j!8, 53-97.
Honjo, S. (1982). Seasonality and interaction of biogenic and lithogenic particulate flux at the Panama Basin. Science, NY, 218, 883-884.
Honjo, S., Doherty, K. W., Agrawal, Y. C. and Asper, V. L. (1984). Direct optical assessment of large amorphous aggregates (marine snow) in the deep ocean. Deep-Sea Res., 3l_ (1), 67-76.
Hull, R. M. (1985). Biomass analysis of zooplankton collected at 39°30'N 1 5 % to 46°N 14°W. IOS, Internal Document No. 242 (unpublished manuscript).
Hydes, D. J. (1982). Animal burrows in deep-sea sediments. IOS, Report No. 151, 27 pp.
IAEA (1976). Effects of ionizing radiation on aquatic organisms and ecosystems. Tech. Rep. Series No. 172, 131 pp.
IAEA (1978). The Radiological Basis of the IAEA Revised Definition and Recommendations Concerning High-level Radioactive Waste Unsuitable foi Dumping at Sea. IAEA-TECDOC-211. IAEA, Vienna, 58 pp.
- 199 -
IAEA (1979). Methodology for assessing impacts of radioactivity on aquatic ecosystems. Tech. Rep. Series No. 190, 416 pp.
IAEA (1982). Transuranic cycling behaviour in the marine-environment. IAEA-TECDOC-265. IA*\, Vienna, 176 pp.
IAEA (1985). Sediment K^s and concentration factors for radionuclides in the marine environment. Tech. Rep. Series No. 2A7, 71 pp.
IAEA (1986a). Definition and recommendations for the Convention on the Prevention of Marine Pollution by Dumping of Wastes and other Matter, 1972. Safety Series No. 78. IAEA, Vienna, 73 pp.
IAEA (1986b). An oceanographic model for the dispersion of wastes disposed of in the deep sea. Tech. Rep. Series No. 263, 166 pp.
Ingram, C. L. and Hessler, R. R. (1983). Distribution and behaviour of scavenging amphipods from the central North Pacific. Deep-Sea Res., 30, 683-706.
Isaacs, J. D. (1973). Potential trophic biomasses and trace substance concentration in unstructured marine food webs. Mar. Biol., 22, 97-104.
Ittekot, V., Deuser, W. G. and Degens, E. G. (1984a). Seasonality in the fluxes of sugars, amino acids and amino sugars to the deep ocean: Sargasso Sea. Deep-Sea Res., 2i» 1057-1069.
Ittekot, V., Degens, E. T. and Honjo, S. (1984b). Seasonality in the fluxes of sugars to the deep ocean: Panama Basin. Deep-Sea Res., 31, 1071-1083.
Jackson, D. W., Gomez, L. S. and Marietta, M. G. (1983). Compilation of Selected Marine Radioecological Data for the US Subseabed Program. Sandia Laboratories, Rep. SAND-73-1725.
James, P. T. (1983). The distribution of euphausiids along 32°N in the Atlantic Ocean. IOS Rep. (171), 47 pp.
Jannasch, H. W. and Taylor, C. D. (1984). Deep-sea microbiology. Ann. Rev. Microbiol., JJ8, 487-514.
Jumars, P. A., 1981. Limits in predicting and detecting benthic community responses to manganese nodule mining. Marine Mining, _3, 213-229.
Jumars, ''. A. and Hessler, R. R. (1976). Hadal community structure: implications from the Aleutian Trench. J. Mar. Res., i» 547-560.
Karl, D. M. and Knauer, G. A. (1984). Vertical distribution, transport, and exchange of carbon in the northeast Pacific Ocean: evidence for multiple zones of biological activity. Deep-Sea Res., 3j.» 221-243.
Kepkay, P. E. (1985). Kinetics of microbial manganese oxidation and trace metal binding in sediments: results from an in situ dialysis technique. Limnol. Oceanogr., 30, 713-726.
- 200 -
Kepkay, P. E. (1986). Microbial binding of trace metals and radionuclides in sediments: results from an in situ dialysis technique. J. Environ. Radloact., _3» 85-102.
Kershaw, P. J. (1985). 1J*C and 2 1 0Pb in NE Atlantic sediments: evidence of biological reworking in the context of radioactive waste disposal. J. Environ. Radioactivity, j2, 87-106.
Kershaw, P. J., Smith, N. J. and Noshkin, V. E. (1985). Bioturbation. In: Interim Oceanographic Description of the North-East Atlantic Sice for the Disposal of Low-level Radioactive Waste, Vol. 2. OECD, Paris, pp.65-68.
Khripounoff, A. and Rowe, G. T. (1985). Les apports organiques et leur transformations en milieu abyssal a 1'interface eau-sediment dans l'ocean Atlantique tropical. Oceanologica Acta, 8 (3), 293-301.
Kuijpers, A. (1985). Geological studies of the southern Nares Abyssal Plain, western North Atlantic. Progress report 1984. Rijks Geologisrhe Dienst, Haarlem, The Netherlands, 127 pp.
Laine, E. P. (1985). Endeavor Cruise EN-121, Leg II, September 18-0ctober 1, 1984. Nares Abyssal Plain. Report SAND85-7172. Sandia National Laboratories, Albuquerque, New Mexico, 108 pp.
Lampitt, R. S. (1985). Evidence for the seasmal deposition of detritus to the deep-sea floor and its subsequent resuspension. Deep-Sea Res., 32_ (8), 885-897.
Lampitt, R. S. and Burnham, M. P. (1983). A free fall time lapse camera and current meter system (Bathysnap) with notes on the foraging behaviour of a bathyal decapod shrimp. Deep-Sea Res., 20^, 1009-1017.
Laubier, L. and Sibuet, M. (1979). Ecology of the Benthic communities of the deep north-east Atlantic. Ambio Special Report, £, 37-42.
Levin, L. A. and Smith, C. R. (1984). Response of background fauna to disturbance and enrichment in the deep-sea: a sediment tray experiment. Deep-Sea Res., 3± O D , 1277-1285.
Lockyer, C. (1977). Observations on diving behaviour of the sperm whale Physeter catodon. In: A Voyage of Discovery (Ed. M. V. Angel). Pergamon Press, Oxford, pp.591-609.
Longhurst, A. R. (1976). Vertical migration. In: The Ecology of the Sea. Blackwell Scientific Publ., Oxford, pp.116-137.
Mauviel, A. and Sibuet, M. (1985). Repartition des traces animales et importance de la bioturbation. In: Peuplements Profonds du Golfe de Gascogne (Eds. L. Laubier and C. L. Monniot). IFREMER, pp.157-173.
Menzies, R. J, George, R. Y. and Rowe, G. T. (1973). Abyssal Environment and Ecology of the World Oceans. John Wiley and Sons, 488 pp.
- 201 -
Merrett, N. R. (1978). On the identity and pelagic occurrence of larval and juvenile state of rat-tail fishes (Family Macrouridae) from 60°N 20°W and 53° 20°W. Deep-Sea Res., J25, 147-160.
Merrett, N. R. and Marshall, N. B. (1980). Observations on the ecology of deep-sea bottom-living fishes collected off northwest Africa (08°-27"N). Prog. Oceanogr., _9. 185-244.
Miller, C. B., Frost, B. W., Batchelder, H. P., demons, M. J. and Conway, R. E. (1984). Life histories of large grazing copepods in a subarctic ocean gyre: Neocalanus plumchrus, Neocalanus cristatus and Eucalanus bungii in the northeast Pacific. Prog. Oceanogr., 13, 201-243.
Miramand, P. and Germain, P. (1985). Sea-water uptake, sediment transfer and histoautoradiographic study of plutonium (z Pu) and americium (*H1Am in the edible cockle Cerastoderma edule (L.). Mar. Ecol. Prog. Ser., 11, 59-68.
Miramand, P., Germain, P. and Camus, H. (1982). Uptake of americium and plutonium from contaminated sediments by three benthic species: Arenlcola marina, Corophium volutator, and Scrobicularla plana. Mar. Ecol. Prog. Ser., ]_, 59-65.
Mitchell, N. T. and Pentreath, R. J. (1982). Monitoring in the north-east Atlantic Ocean for the dumping of packaged radioactive waste. In: Radiological Protection - Advances in Theory and Practice. 3rd Int. Symp. Soc. Radiol. Prot., Vol. 1, pp.120-125.
Monniot, F. (1979). Faunal similarities among abyssal Atlantic basins. Sarsia, J>4, 93-95.
Muller, P. J. and Suess, E. (1979). Productivity sedimentation rate, and sedimentary organic matter in the ocean. I. Organic carbon preservation. Deep-Sea Res., 26A, 1347-1362.
Mullin, M. M. and Gomez, L. S. (1981). Biological and related chemical research concerning subseabed disposal of high-level nuclear raste: report of a workshop at Jackson Hole, Wyoming, January 12-16, 1981. SAND81-0012. Sandia National Labs., 43 pp.
Nakahara, M., Euda, T., Suzuki, T., Ishii, T. and Suzuki, H. (1980). Concentration factors of mesopelagic organisms. In: Marine Radioecology. Proc. 3rd NEA Seminar, Tokyo, 1979. 0ECD, Paris, pp.323-334.
NEA (1983). Interim oceanographic decription of the North-East Atlantic site for the disposal of low-level radioactive waste. (Ed. by P. A. Gurbutt and R. R. Dickson). NEA-0ECD, Paris, 132 pp.
NEA (1985). Review of the continued suitability of the dumping site for radioactive waste in the North-East Atlantic. NEA-OECD, Paris, 448 pp.
- 202 -
NEA (1986). Interim oceanographic description of the North-East Atlantic site for the disposal of low-level radioactive waste, Vol. 2. (Ed. by R. R. Dickson, P. A. Gurbutt and P. J. Kershaw). NEA-OECD, Paris, 191 pp.
Noshkin, V. E. (1983). Fallout concentrations in sediments and some biota from regions of the north-east Atlantic. In: Interim Oceanographic Description of the North-east Atlantic Site for the Disposal of Low-level Radioactive Waste. NEA/OECD, Paris, pp.119-124.
Nozaki, Y., Cochran, J. K. and Turekian, K. K. (1977). Radiocarbon and 2 1 0Pb distribution in submersible-taken deep-sea cores from project FAMOUS. Earth Planet. Sci. Lett., 3^, 167-173.
Parsons, T. R., Takahashi, M. and Hargrave, B. (1984). Biological Oceanographic Processes. 3rd edition. Pergamon Press, Oxford.
Patching, J. W., Raine, R. C. T., Barnett, P. R. 0. and Watson, J. (1986). Abyssal benthic oxygen consumption in the northeastern Atlantic: measurements using the suspended core technique. Oceanol. Acta, j), 1-7.
Pentreath, R. J. (1973). The roles of food and water in the accumulation of radionuclides by marine teleost and elasmobranch fish. In: Radioactive Contamination of the Marine Environment, IAEA-SM-158. IAEA, Vienna, pp.421-436.
Pentreath, R. J. (1976). The accumulation of mercury from food by the plaice, Pleuronectes platessa L. J. Exp. Mar. Biol. Ecol., J25, 51-65.
Pentreath, R. J. (1977). Radionuclides in fish. Oceanogr. Mar. Biol. Ann. Rev., _15, 365-460.
Pentreath, R. J. (1981). The biological availability to marine organisms of transuranium and other long-lived nuclides. In: Impacts of Radionuclide Releases into the Marine Environment, IAEA-SM-248. IAEA, Vienna, pp.241-272.
Pentreath, R. J. (1983). Biological studies. In: Interim Oceanographic Description of the North-east Atlantic Site for the Disposal of Low-level Radioactive Waste. OECD/NEA, Paris, pp.101-118.
Pentreath, R. J., Lovett, M. B., Harvey, B. R. and Ibbett, R. D. (1979). Alpha-emitting nuclides in commercial fish species caught in the vicinity of Windscale, UK, and their radiological significance to man. In: Biological Implications of Radionuclides Released from Nuclear Industries. Proc. Symp. Vienna, 1979. IAEA, Vienna, pp.227-245.
Pentreath, R. J. and Woodhead, D. S. (1988). Towards the development of criteria for the protection of marine fauna in relation to the disposal of radioactive wastes into the sea. In: Radiation Protection in Nuclear Energy, IAEA-CN-51. IAEA, Vienna (In press).
- 203 -
Pentreath, R. J., Woodhead, D. S., Harvey, B. R. and Ibbett, R. D. (1980). A preliminary assessment of some naturally-occurring radionuclides in marine organisms (including deep-sea fish) and the absorbed dose resulting from them. In: Marine Radioecology. Proc. 3rd NEA Seminar. NEA/OECD, pp.291-302.
Phillips, D. J. H. (1980). Quantitative Aquatic Biological Indicators. Applied Science Publishers, London. 488 pp.
Pielou, E. C. (1966). The measurement of diversity in different types of biological collections. J. Theoret. Biol., _13, 131-144.
Pielou, E. C. (1975). Population and Community Ecology. Gordon and Breach, New York, 424 pp.
Pillsbury, R. D., Barstow, D., Moore, B., Pittock, G., Root, D. C , Simpkins, J. and Still, R. E. (1986). Contractor Report, SAND85-7215. Sandia National Labs.
Piatt, T., Gallegos, C. L. and Harrison, W. G. (1981). Photoinhibition of photosynthesis in natural assemblages of marine phytoplankton. J. Mar. Res., 2?_t 687-701.
Piatt, T., Lewis, M. and Geider, R. (1984). Thermodynamics of the pelagic ecosystem: elementary closure conditions for biological production in the open ocean. In: Flows of Energy and Material in Marine Ecosystems-(Ed. M. J. R. Fasham). Plenum Press, New York, pp.49-84.
Preston, A., Jefferies, D. F. and Pentreath, R. J. (1972). The possible contributions of radioecology to marine productivity studies. Symp. zool. Soc. Lond., j29_, 271-284.
Pugh, P. R. (1975). The distributions of siphonophores in a transect across the north Atlantic Ocean at 32 °N. J. Exp. Mar. Biol. Ecol., j[0, 77-97.
Ralijaona, C , Van Wambecke, F. and Bianchi, A. (1983). Etude de la microflore bacterienne isolee du contenu du tractus digestif de poissons abyssaux. Revue Internationale d'Oceanographique Medicale, Vols.LXX-LXXI, 67-78.
Rannou, M. (1975). Biologie marine - donnees nouvelles sur l'activite reproductrice cyclique des poissons benthiques bathyaux et abyssaux. Compte Rendus de l'Academie des Sciences, Paris, 281, 60-75.
Rannou, M. (1976). Age et croissance d'un poisson bathyal: Nezu'da sclerorhynchus (Macrouridae Gadiforme) de la mer d'Alboran. Cahiers de Biologie Marine, Tome XVII, 413-421.
Rees, W. J. and Maul, G. E. (1956). The Cephalopoda of Madeira. Records and distribution. Bull. Br. Mus. Nat. Hist., 2 (°)> 259-281.
Reimers, C. E., Fischer, K. K., Merewether, R., Smith, K. L. and Jahnke, R. A. (1986). Oxygen microprofiles measured in situ in deep ocean sediments. Nature, Lond., 3_20, 7141-744.
- 204 -
Reimers, C. E. and Smith, K. L. Jr. (1986). Reconciling measured and predicted fluxes of oxygen across the deep-sea sediment-water interface. Limnol. Oceanogr., 31_ (2), 305-318.
Reimers, C. E. and Suess, E. (1983). The partitioning of organic carbon fluxes and sedimentary organic matter decomposition rates in the ocean. Mar. Chem., 13, 141-168.
Rex, M. A. (1981). Community structure in the deep-sea benthos. Ann. Rev. Ecol. Systematic, 12, 331-353.
Rex, M. A., Van Ummersen, C. A. and Turner, R. D. (1979). Reproductive pattern in marine environment - Reproductive pattern in the Abyssal Snail, Benthonella tenella (Jeffreys). In: Reproductive Ecology of Marine Invertebrates (Ed. S. E. Stancyk). University of South California Press, Columbia, pp.173-188.
Rice, A. L., Aldred, R. G., Darlington, E. and Wild, M. A. (1982). The quantitative estimation of the deep-sea megabenthos: a new approach to an old problem. Oceanologica Acta, _5_ (1), 63-72.
Robertson, D. A. (1981). Possible functions of surface structure and size in some planktonic eggs of marine fishes. N.Z. J. Mar. Freshw. Res., 15, 147-153.
Robinson, A. R. and Mullin, M. M. (1981). A model for physical-biological transfer. Sandia National Laboratories, Albuquerque, NM, Report No. SAND-81-0012, 29-31.
Roe, H. S. J. (1984a). The diel migrations and distributions within a meso-pelagic community in the north east Atlantic. 2. Vertical migrations and feeding of mysids and decapod Crustacea. Prog. Oceanogr., 13, 269-118.
Roe, H. S. J. (1984b). biological studies in the eastern north Atlantic (48°N-35°N) centred around the King's Trough flank (42°00'N 21°30'W). IOS Cruise Report, (163), 31 pp.
Roe, H. S. J. (1985). A review of the known biological characteristics of th Great Meteur East site together with a sampling programme for a biolo gical site assessment. IOS, Report No. 211, 37 pp.
Roe, H. S. J., Angel, M. V., Badcock, J., Domanski, P., James, P. T., Pugh, P. and Thurston, M. H. (1984). The diel migrations and distributions within a mesopelagic community in the northeast Atlantic. I. Introduction and sampling procedures. Prog. Oceanogr., J_3, 245-268.
Roe, H. S. J., Badcock, J., Billett, D. S. M., Chidgey, K. C , Domanski, P. A., Ellis, C. J., Fasham, M. J. R., Gooday, A. J., Hargreaves, P. M. D., Huggett, Q. J., James, P. T., Kirkpatrick, P. A., Lampitt, R. S., Merrett, N. R., Muirhead, A., Pugh, P. R., Rice, A. L., Russell, R. A., Thurston, M. H. and Tyler, P. A. (1987). Great Meteor East: a biolog*:al characterisation. IOS, Report No. 248, 260 pp.
- 205 -
Roe, H. S. J., Baker, A. de C., Carson, R. M., Wild, R. and Shale, D. M. (1980). Behaviour of the Institute of Oceanographic Sciences' rectangular midwater trawls: theoretical aspects and experimental observations. Mar. Biol., 5_6_, 247-259.
Roe, H. S. J. and Darlington, E. (1985). A new acoustic control system for deep pelagic trawling close to the sea bed. J. Soc. Underwat. Tech., i±t 2-6.
Roe, H. S. J., Domanski, P. A. and Fasham, M. J. (1986). Great Meteor East. An interim report on biological sampling and general relationship to physical oceanography. IOS, Report No. 225, 60 pp.
Roe, H. S. J. and Shale, D. M. (1979). A new multiple rectangular midwater trawl (RMT 1+8M) and some modifications to the Institute of Oceanographic Sciences* RMT 1+8. Mar. Biol., j>0, 283-288.
Rokop, F. J. (1974). Reproductive patterns in the deep-sea benthos. Science, NY., JJJ6 (4165), 743-745.
Rowe, G. T. (Ed.) (1983). Deep-Sea Biology. Wiley-Interscience Publishers, New York, 560 pp.
Rowe, G. T. (Ed.) (1983a) Deep-Sea Biology. The Seas, 8. Wiley-Interscience, New York, 560 pp.
Rowe, G. T. and Deming, J. W. (1985). The role of bacteria in the turnover of organic carbon in the deep-sea sediments. J. Mar. Res., j43, 925-950.
Rowe, G. T. and Gardner, N. D. (1979). Sedimentation rates in the slope water of the northwest Atlantic Ocean measured directly with sediment traps. J. Mar. Res., 3]_, 581-600.
Rowe, G. T., Merrett, N., Shepherd, J., Needier, G., Hargrave, B. and Marietta, M. (1986). Estimates of direct biological transport of radioactive waste in the deep-sea with special reference to organic carbon budgets. Oceanological Acts, _9 (2)i 199-208.
Rowe, G. T. and Staresinic, N. (1979). Sources of organic matter to the deep-sea benthos. Ambio Special REport, The Deep-Sea-Ecology and Exploitation, £, 19-23.
Rupp, E. M., Miller, F. L. and Baes, C. F. (1980). Some results of recent surveys of fish and shellfish consumption by age and region of US residents. Hlth Phys., 39, 165-175.
Saint-Marie, B. and Hargrave, B. T. (1987). Estimation of scavenger abundance and distance of attraction to bait. Mar. Biol., JJ4, 431-443.
Sanders, H. L. (1968). Marine benthic diversity: a comparative study. American Naturalist, 102, 243-281.
Sanders, H. L. (1969). Benthic marine diversity and the stability-time hypotheses. Brookhaven Symposia in Biology, _22_, 71-81.
- 206 -
Sanders, H. L. and Hessler, R. R. (1969). Ecology cf the deep-sea benthos. Science, NY, IQ (3874), 1419-1424.
Saunders, P. M. (1983). CTD data from the N.E. Atlantic 31°N-46°N, July 1982. IOS Report No. 221, 47 pp.
Schoener, A. (1968). Evidence for reproductive periodicity in the deep-sea. Ecology, j»9 (1), 81-87.
Schroder, C. (1985). Recent distribution of benthoic foraminifera on the Nares Abyssal Plain: preliminary report. In: Geological Studies of the Southern Nares Abyssal Plain, Western North Atlantic. Progress Report, 1984 (Ed. A. Kuijpers). Rijks Geologische Dienst, Haarlem, The Netherlands, pp.121-122.
Schulte, E. H. and Scoppa, P. (1987). Sources and behaviour of technetium in the environment. Sci. Total Environ., ^4_, 163-179.
Schwarz, J. R. Yayanos, A. A. and Colwell, R. R. (1976). Metabolic activities of the intestinal microflora of a deep-sea invertebrate. Appl. Environ. Microbiol., 211. (D» 46-48.
Schwinghamer, P. (1985). Observations on size-structure and pelagic coupling of some shelf and abyssal benthic communities. In: Proc. 19th European Marine Biology Symposium (Ed. P. E. Gibbs). Cambridge, University Press, pp.347-359.
Sibuet, M. (1977). Repartition et diversite des Echinodermes (Holothurides-Asterides) en zone profonde dans le golfe de Gascogne. Deep-Sea Res., 2A, 549-563.
Sibuet, M. (1985). Quantitative distribution of echinoderms (Holothuroidea, Asteroidea, Ophiuroidea, Echinoidea) in relation to organic matter in the sediment, in deep-sea basins of the Atlantic Ocean. In: Proc. 5th International Echinoderm Conference, Galway, 24-29 September 1984 (Eds. B. F. Keegan and B. D. S. O'Connor), pp.99-108.
Sibuet, M. and Juniper, K. (1986). Benthic ecology of the abyssal plain: an overview. CEA/SEABED No. MC 15021, 60 pp.
Sibuet, M., Khripounoff, A., Deming, J,, Colwell, R. and Dinet, A. (1982). Modification of the gut contents in the digestive tract of abyssal holothurians. In: Proc. International Eehinoderms Conference, Tampa Bay (Ed. J. M. Lawrence). A. A. Balkema, Rotterdam, pp.421-428.
Sibuet, M., Monniot, C , Desbruyeres, D., Dinet, A., Khripounoff, A., Rowe, G. and Segonzac, M. (1984), Peuplements benthiques et caracteristiques trophiques du milieu dans la plaine abyseale de Demerara dans 1'ocean Atlantique. Oceanologica Acta, _7 (3)i 345-358.
Silver, M. W. and Alldredge, A. L. (1981). Bathypelagic marine snow deep-sea algal and detrital community. J. Mar. Res., _3_i (3)» 501-530.
- 207 -
Smith, C. R. (1985a). Food for the deep-sea: utilization, dispersal and flux of nekton falls at the Santa Catalina basin floor. Deep-Sea Res., 32_ (4), 417-442.
Smith, C. R. (1985b). Colonization studies in the deep-sea: are results biased by experimental designs? In: Proc. of the Nineteenth European Marine Biology Symposium (Ed. P. E. Gibbs). Cambridge University Press pp.183-190.
Smith, C. R., Jumars, P. A. and De Master, D. J. (1986). In situ studies of megafaunal mounds indicate rapid sediment turnover and community response at the deep-sea floor. Nature, Lond., 323, 251-253.
Smith, J. N., Boudreau, B. P. and Noshkin, V. E. (1986). Plutonium and 2 1 0Pb distributions in northeast Atlantic sediments: subsurface anomalies caused by non-local mixing. Earth Planet. Sci. Lett., 81, 15-28.
Smith, J. N. and Schafer, C. T. (1984). Bioturbation processes in continental slope and rise sediment delineated by Pb-210, microfossil and textural indicators. J. Mar. Res., 42_, 1117-1145.
Smith, K. L. Jr. (1978). Benthic community respiration in N.W. Atlantic: in situ measurements from 40 to 5200 m. Mar. Biol., WJ_, 337-347.
Smith, K. L. Jr. (1982). Zooplankton of a bathyal benthic boundary layer: in situ rates of oxygen consumption and ammonium excretion. Limnol. Oceanogr., 27 , 461-471.
Smith, K. L. Jr. (1983). Metabolism of two dominant epibenthic echinoderms measured at bathyal depths in the Santa Catalina Basin. Mar. Biol., _72, 249-256.
Smith, K. L. Jr. and Baldwin, R. J. (1982). Scavenging deep-sea amphipods: effects of food odor and oxygen consumption and a proposed metabolic strategy. Mar. Biol., 68_, 287-298.
Smith, K. L. Jr. and Baldwin, R. J. (1983). Deep-sea respirometry: in situ techniques. Chapter III, 5. In: Handbook on Polarographic Oxygen Sensors (Eds. E. Gnaiger and H. Forstner). Springer, Berlin, pp.298-319.
Smith, K. L. Jr. and Baldwin, R. J. (1984a). Seasonal fluctuations in deep-sea sediment community oxygen consumption: central and eastern north Pacific. Nature, Lond., 307, 624-625.
Smith, K. L. Jr. and Baldwin, R. J. (1984b). Vertical distribution of the necrophagous amphipod Eurythenes gryllus in the North Pacific: spatial and temporal variation. Deep-Sea Res., 3l_, 1179-1196.
Smith, K. L. Jr. and Baldwin, R. J. (1986). Vertical distribution of the necrophagous amphipod Eurythenes gryllus in the North Pacific: spatial and temporal variations, SAND85-1037. Sandia National Labs., 429-'469.
- 208 -
Smith, K. L. Jr. and Laver, M. B. (1981). Respiration of the bathypelagic fish, Cyclothone acclinidens. Mar. Biol., 61, 261-266.
Smith, K. L. Jr, White, G. A., Laver, M. B., McConnaughey, R. R. and Meador, J. P. (1979). Free veh ^le capture of abyssopelagic animals. Deep-Sea Res., 26A, 57-64.
Snider, L. J., Burnett, B. R. and Hessler, R. R. (1986). The composition and distribution of meiofauna and nanobiota in a central North Pacific deep-sea area. In: SAND85-1037. Sandia National Labs., 343-373.
Sokolova, M. N. (1972). Trophic structure of deep-sea macrobenthos. Mar. Biol., J£, 1-12.
Steeman Nielsen, E. (1951). Measurement of the production of organic matter in the sea. Nature, Lond., 167, 684.
Steeman Nielsen, E. (1952). The use of radioactive carbon (C-14) for measuring organic production in the sea. J. Cons. int. Explor. Mer, 18, 117-140.
Stockton, W. L. and Delaca, T. E. (1982). Food falls in the deep sea: occurrence, quality, and significance. Deep-Sea Res., 29, 157-169.
Suess, E. (1980). Particulate organic carbon flu:: in the oceans - surface productivity and oxygen utilization.' Nature, Lond., 228, 260-263.
Suess, E. and Muller, P. J. (1980). Productivity, sedimentation rate and sedimentary organic matter in the oceans. II. Elemental fractionation. In: Colloques internationaux du CNRS, no.293, biogeochemie de la matiere organique a 1'interface eau-sediment marin (Ed. R. Daumas), pp.17-26.
Summers, W. C. (1969). Winter population of Loligo pealii in the Mid-Atlantic Bight. Biol. Bull. Mar. Biol. Lab., Woods Hole, 137, 202-216
Swinbanks, D. D. and Shirayama, Y. (1986). High levels of natural radionuclides in a deep-sea infaunal xenophyophore. Nature, Lond., 320, 354-358.
Templeman, W. (1907). Predation on living fishes on long line in Baffin Bay by the amphipod Eurythenes gr.yllus (Lichtenstein), and a new distribu tion record. J. Fish. Res. Bd Canada, lk_t 215-217.
Tendal, 0. S. and Hessler, R. R. (1977). An introduction to the biology and systematica of Komokiacea (Textulariina, Foraminiferida). Galathea Rep., Jj4.
Thistle, D. and Sherman, K. M. (1985). The nematode fauna of a deep-sea site exposed to strong near-bottom currents. Deep-Sea Res., J32 (9), 1077-1088.
Thistle, D., Yingst, J. Y. and Fauchald, K. (1985). A deep-sea benthic commu nity exposed to strong near-bottom currents on the Scotian Rise (western Atlantic). Mar. Geol., £6, 91-112.
- 209 -
Thomann, R. V. (1981). Equilibrium model of fate of microcontaminants in diverse aquatic food chains. Can. J. Fish. Aquat. Sci., J38_, 280-296.
Turekian, K. K., Cochran, J. K. and De Master, D. J. (1978). Bioturbation in deep-sea deposits: rates and consequences. Oceanus, 2i_ (1), 34-41.
Turekian, K. K., Cochran, J. K., Kharkar, D. P., Cerrato, P. M., Vaism , J. R., Sanders, H. L., Grassle, J. F. and Allen, J. A. (1975). Slow growth rate of a deep-sea clam determined by 228Ra chronology (growth bands/ages of deep dwelling organisms with hard parts). Proc. National Academic Sciences, USA, _72 (7), 2829-2832.
Turner, R. D. (1973). Wood-boring bivalves, opportunistic species in the deep-sea. Science, NY, 180, 1377-1379.
Tyler, P. A. (1987). Reproductive biology of deep-sea megabenthos. DOE Report, Contract PECD 7/9/037. DOE (UK).
Tyler, P. A. and Gage, J. D. (1980). Reproduction and growth in the deep-sea brittle star Ophlura ljungmani (Lyman). Ocean. Acta, , 177-185.
Tyler, P. A. and Gage, J. D. (1984). Seasonal reproduction of Echinus affinis (Edinodermata:Echinoidea) in the Rockall Trough, northeast Atlantic Ocean. Deep-Sea Res., 31 , 387-402.
Tyler, P. A., Grant, A., Pain, S. L. and Gage, J. D. (1982). Is annual reproduction in deep-sea echinoderms a response to variability in their environment? Nature, Lond., 300, 747-750.
Urrere, M. A. and Knauer, G. A. (1981). Zooplankton fecal pellet fluxes and vertical transport of particulate organic material in the pelagic environment. J. Plankt. Res., 3_, 369-387.
Van der Loeff, M. M. R. and Lavaleye, M. S. S. (1986). Geochemical and biological research at the NEA dump site for low-level radioactive waste. Report of the Dutch DORA program. Netherlands Institute for Sea Research, 134 pp.
Vinogradov, A. P. (1953). The Elementary Chemical Composition of Marine Organisms. Sears Foundation for Marine Research, Memoir 2. Yale University Press, New Haven, 647 pp.
Vinogradov, M. E. (1968). Vertical distribution of the oceanic zooplankton. Izdatel'stvo "Nauka" Moskva. (Translation - Israel Program for Scientific Translations, Jerusalem, 1970).
Vinogradov, M. E. and Tseitlin, V. B. (1983). Deep-sea pelagic domain (aspects of bioenergetics). In: The Sea, Vol. 8 Deep Sea Biology (Ed. G. T. Rowe). Wiley Interscience, New York, pp.123-165.
Vo8s, G. L. (1973). Cephalopod resources of the world. FA0 Fish. Circ, 149, 1-75.
- 210 -
Warwick, R. M. and Schwinghamer, P. (1986). Taxonomic and ecological observations on the marine nematode genus Acantholaimus Allgen, 1933 from the Nares Abyssal Plain, including the probable occurrence of spermatophores. MS.
Wheeler, A. (1978). Key to Fishes of Northern Europe. Frederick Warne Ltd, London, 380 pp.
Wiborg, K. F. (1978). Innsig av akkar, Todarodes sagittatus (Lamarck), til Norskekysten Hosten 1977-Varen 1978. Fisken Hav., 2_, 43-59.
Wiebe, P. H., Madin, L. P., Haury, L. R., Harbison, G. R. and Philbin, L. M. (1978). Diel vertical migration by Salpa aspera; potential for large scale particulate organic matter transport to the deep sea. Mar. Biol., .53, 249-256.
Wieser, W. (1960). Benthic studies in Buzzards Bay. II. The meiofauna. Limnol. Oceanogr., 2» 121-153.
Williams, R. B. (1972). Steady-state equilibrium in simple nonlinear food webs. In: Systems Analysis and Simulation in Ecology, Vol. 2 (Ed. B. C. Patten). Academic Press, New York and London, pp.213-240.
Williams, W. T. and Stephenson, W. (1973). The analysis of three-dimensional data (sites x species x times). J. exp. mar. Biol. Ecol., 11, 207-227.
Wirsen, C. 0. and Jannasch, H. W. (1986). Microbial transformations in deep-sea sediments: free vehicle studies. Mar. Biol., jM, 277-284.
Wishner, K. F. (1980a). The biomass of the deep-sea benthopelagic plankton. Laep-Sea Res., 27A, 203-216.
Wishner, K. F. (1980b). Aspects of the community ecology of deep-sea benthopelagic plankton, with special reference to gymnopleid copepods. Mar. Biol., 60, 179-187.
Wishner, K. F. and Meise Munns, C. J. (1984). In-situ grazing rates of deep-sea benthic boundary-layer zooplankton. Mar. Biol., JJ4, 65-74.
Wolf, T. (1977). Diversity and faunal composition of the deep-sea benthos. Nature, London., _267 (5614), 780-785.
Wood, <?, L. (1972). The Guinness Book of Animal Facts and Feats. Guinness Superlatives Ltd., Enfield, Middlesex, 384 pp.
Woodhead, D. S. (1973). Levels of radioactivity in the marine environment an the dose commitment to marine organisms. In: Radioactive Contamination of the Marine Environment, IAEA-SM-158. IAEA, Vienna, pp.499-525.
Woodhead, D. S. (1979). Methods of dosimetry for aquatic organisms. In: Methodology for Assessing Impacts of Radioactivity on Aquatic Ecosystems. IAEA Tech. Rep. Ser. (190). IAEA, Vienna, pp.43-96.
- 211 -
Woodhead, D. S. (1984). Contamination due to radioactive materials. In: Marine Ecology, Vol. 5, Part 3 (Ed. 0. Kinne). John Wiley & Sons, Chichester, pp.1111-1287.
Woodhead, D. S. and Pentreath, R. J. (1983). A provisional assessment of radiation regimes in deep ocean environments. In: Waste in the Ocean, Vol. 3, pp.133-152.
Yayanos, A. A. and Dietz, A. S. (1982). Thermal inactivation of a barophilic deep-sea bacterium, isolate CNPT-3. Appl. Environ. Microbiol., 43, 1481-1489.
Yayanos, A. A. and Dietz, A. S. (1983). Death of a hadal deep-sea bacterium following its decompression. Science, NY, 220, 497-498.
Yayanos, A. A., Dietz, A. S. and Van Boxtel, R. (1979). Isolation of a deep-sea barophilic bacterium and some of its growth characteristics. Science, NY, 205, 808-810.
Yayanos, A. A., Dietz, A. S. and Van Boxtel, R. (1981). Obligately barophilic bacterium from the Mariana Trench. Proc. National Academic Sciences, USA, 7£ (8), 5212-5215.
Yayanos, A. A., Dietz, A. S. and Van Boxtel, R. (1982). Dependence of reproduction rate on pressure as a hallmark of deep-sea bacteria. Appl. Environ. Microbiol., 44^ 1356-1361.
Yayanos, A. A., Gomez, L. S., van Boxtel, R. and Dietz, A. S. (1986). Studies on the radio8ensitivity of deep sea bacteria. In: Subseabed Disposal Project Annual Reports: Oct. 1981 through Sept. 1983, SAND85-1037. Sandia National Labs., 483-507.
Yayanos, A. A. and Nevenzel, J. C. (1978). Rising-particle hypothesis: rapid ascent of matter from the deep ocean. Naturwissenschaften, 65, 255-256.
Yorke, D. (1966). Least-squares fitting of a straight line. Can. J. Phys., j»4, 1079-1086.
Young, D. K., Jahn, W. H., Richardson, M. D. and Lohanick, A. W. (1985). Photographs of deep-sea lebensspuren: a comparison of sedimentary provinces in the Venezuela Basin, Caribbean Sea. Mar. Geol., 68, 269-301.
Zimmerman, R., Iturriaga, R. and Becker-Birck, J. (1978). Simultaneous deter-mintion of the total number of aquatic bacteria and the number thereof involved in respiration. Appl. Environ. Microbiol., 36, 926-936.
Zobell, C. E. (1952). Life at the bottom of the Philippine Trench. Science NY, 115, 507-508.
- 212 -
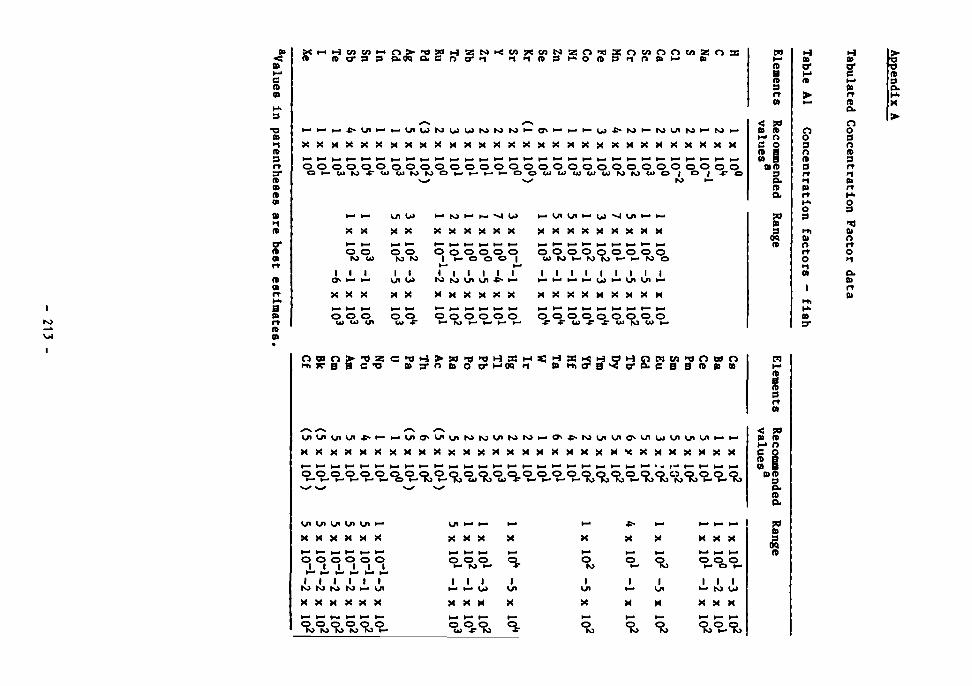
0>
< c A m
M H c o w i i - i o > T 3 ! » H Z M M : v 5 ? « c o N z o ' ^ 2 o c n o o t o z r > a c it 7 3 a O-OQ o. c r> t r I-I i r i A 9 H > o A 9 i - i n o > i - > p>
A a A 9
CD 1 n> 9 r t 3 * (0 CB A CD
O 1 A
o" A CD
r t
A
a 0J A CO
^ ^ ^ ^ ^ ^ ^ ^ ^ ^ ^ ^ % , ^ %s 5-%
X X X X X X X X X X X X X X X X X X X
o o ro w
O O ro to ° , %%%0
0°, 0 - 0 o 0 - 0 o 0
J ° - 0 - 0 o 0: ,
I I I I I I I I I I I I I I I I I I I I
X X X X X X X X X X X X X X X X X X X X
O o ° u ° r , ° - ^ ? . 0M 0 ° ° 0 S r S r 0 * ^ 0 - ^ 0 ^
< 70 01 A M n e o S i
0)A 9 &. A
P 9 A
0 9 O > , f l Z C , T ) H > » ' f l " 8 H 3 : M a : H 3 : i < H C » H p W t n " 0 O B d O r r B B C d o a ' o b o o ' H i m n » H I O ' B ^ B ' B . C B S n t i «
O 09 O A
g 9
££££?££^£^%^£^£^^^%^£5.9,
< sa 6) A r-> r> c o
Si ft) ft)
9 O. A O.
U< U l U l U l U l H>
X X X X X X
0 o o o o o JL ' ,L ' JL ' 1 i i i i i
•o r» to r» i— oi
X X X X X X
^ S o ? ^ 0 -
^ H H h-»
X X X X
fc»- h - * - * H -
o o o o , H - ro *•* • * I I I I
1— I— o* U l
X X X
o o o o u *• ro *•
o ro
I
o ro
X X
9 - ° o
i i
o ro o ro
X X X H- * - H-o o o
I I I •— ro u» X X X
° o ° - ° o
90 ft) 9
0Q A
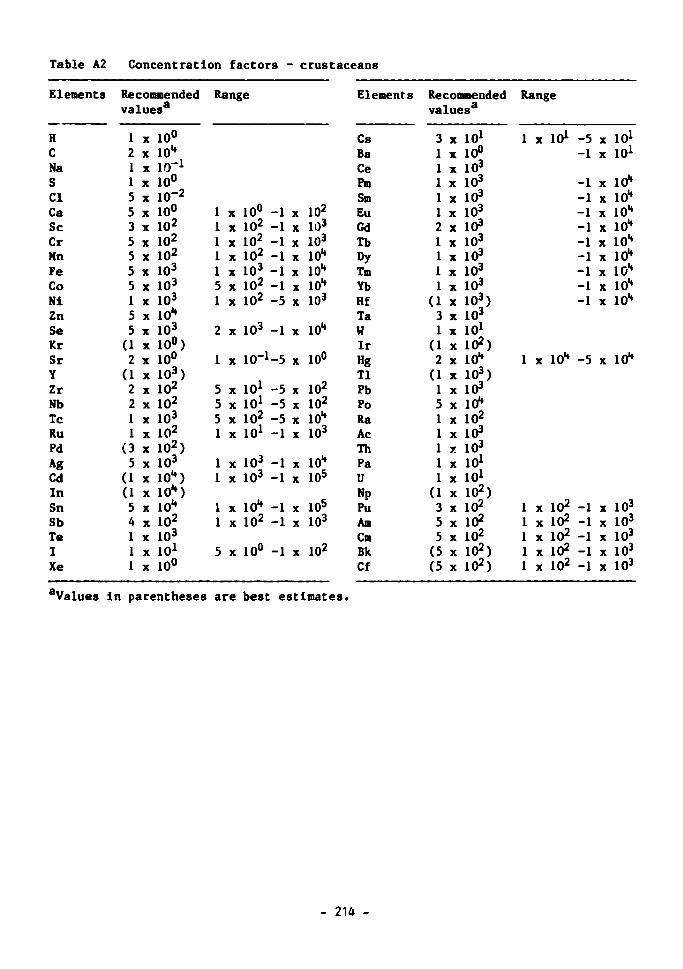
Table A2 Concentration factors - crustaceans
Elements
H C Na S CI Ca Sc Cr Mn Fe Co Ni Zn Se Kr Sr Y Zr Nb Tc Ru Pd Ag Cd In Sn Sb Te I Xe
Recommended values3
1 2 1 1 5 5 3 5 5 5 5 1 5 5 (1 2 (1 2 2 1 1 (3 5 (1 (1 5 4 1 1 1
X
X
X
X
X
X
X
X
X
X 1 X
X
X
X
X
X
X
X
X
X
X
X
X
X
X
X
X
X
X
X
10° 10" L0"1
10° lO-2
10° LO2
LO2
102
103
103
LO3
10* L03
10°) 10° 103) 102
L02
L03
LO2
102) 103
10-) L0-) 10-LO2
103
101
10°
Range
1 1 1 1 1 5 1
2
1
5 5 5 1
1 1
1 1
5
X
X
X
X
X
X
X
X
X
X
X
X
X
X
X
X
X
X
10° -1 102 -1 102 -1 102 -1 103 -1 102 -1 102 -5
103 -1
10_1-5
101 -5 101 -5 102 -5 101 -1
103 -1 103 -1
10* -1 102 -1
10° -1
X
X
X
X
X
X
X
X
X
X
X
X
X
X
X
X
X
X
102
103
103
10* 10* 10* 103
10-
10°
102
102
10* 103
10-105
105
103
102
Elements
Cs Ba Ce Pm Sm Eu Gd Tb Dy Tm Yb Hf Ta W Ir Hg Tl Pb Po Ra Ac Th Pa U Np Pu Am Cm Bk Cf
Recommended values3
3 1 1 1 1 1 2 1 1 1 1 (1 3 1 (1 2 (1 1 5 1 1 1 1 1 (1 3 5 5 (5 (5
X
X ]
X
X
X
X
X
X
X
X
X ] X
X
X
X
X
X
X
X
X
X
X
X
X ] X
X
X
X
X
X
LO1
10° 103
LO3
103
LO3
LO3
LO3
LO3
LO3
LO3
LO3) LO3
LO1
LO2) 10* LO3) LO3
10" LO2
LO3
LO3
LO1
LO1
LO2) LO2
LO2
LO2
LO2) LO2)
Range
1
1
1 1 1 1 1
x 101
x 10**
x 102
x 102
x 102
x 102
x 102
-5 -1
-1 -1 -1 -1 -1 -1 -1 -1 -1
-5
-1 -1 -1 -1 -1
x 101
x 101
x lO* x lO" x lO* x 10" x lO* x 10* x lO* x 10-x lO*
x 10*
x 103
x 103
x 103
x 103
x 103
aValues In parentheses are best estimates.
- 214 -
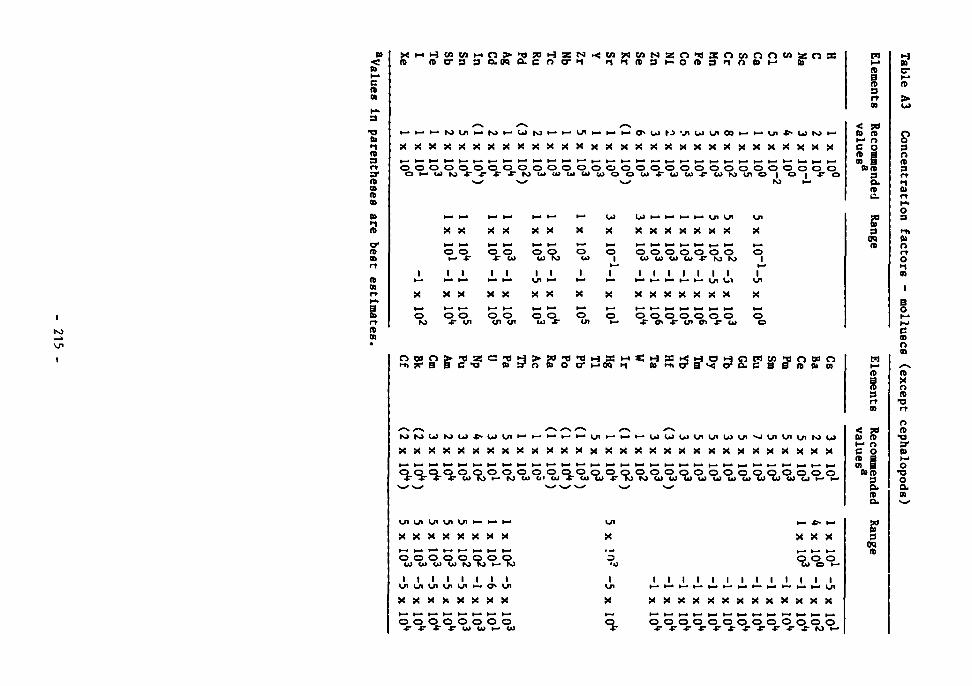
c n
i-» A B m 3
to
to a rr 3 * l » CO
a
X X X X X X X X X X X X X X X X X X X X X X X X X X X X X X
< so a> n> i-1 r> e o at §
(BID 3 (X IV
cr n n
A at
B to rt to 03
X X X X X X X X X X X X X X X X
I I
X X
0 o r u>
1 1
X X
© ©
w to
1 1 X X
o w
1 X
o i
1
X
1 1 1 1 1 1 1
© 1
i— 1
X
© M
© © •c cn
O O Ol </l
© ©_ a> -r
o en
O
*- S ^ S - 0 * 0 * 0 ^
3 OH
>-h *• B B C -O » 3* o » O <T l-«0Q it » n n r S > < O3 CL C 8 B It IB 01 to a to 3
s^s^^^^.^i^^^^^^sL^^
< pa 0) f» •-• r> c o to I
°>. • Mm
3 » CL u i u i m u i u i t - i H ^
x x x x x x x x
O O O O O Q O ©
I t I I I I I I U l U l U l U l U I H O i U l X X X X X X X X
S S S . ^ 0 - 0 - 0 - 0 -
X
I
°r
I I I I I
* - * * H -
X X X
^L^0-i i i i
x x x x x x x x x x x x x
Srvv^^0^0^0^0-
3 00 a
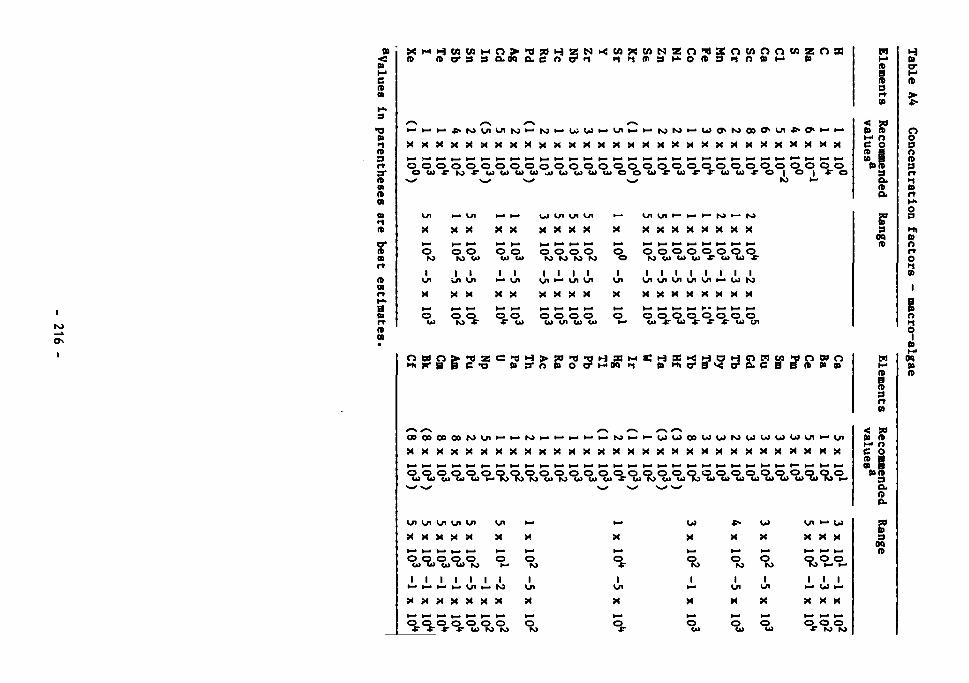
ID
< e A tn
X M H W W H O > T 3 ? 0 H Z N M j C 0 ? < ! W N Z O , T l X n W O n W Z O 3 : p i M A
I a
CO > 1 A 9 r t 3 * A 0> A
CD • 1 A
O* A (B
A a
a to A OB
X X X X X X X X X X X X X X X X X X
I I I I I I I I I I I I I I I I I I
X M M M M M M M M M M M M M M M M M
< Pd B> A H * n
c o
Si COA s a
A
3 OQ A
f
^ % ^ M ^ ^ 5 » ^ ^ ^ % ^ * ^ ^ ^ ^ 5 » 5 . if M M M M M M
O Q O Q O O O a> <** u> u> ro *- K>
I I I I I I I * - * - * - * - . U l * - KJ
M M M M X M M
I Ui
%%%3rCL%% K)
M
O
I
o
u> M
I
M
» • -
o
M
O
I Ui
o
M
o to I
o
u» •— w M M M
* - i— h-
I I I
M M M
^ ^ ^
9 OQ A
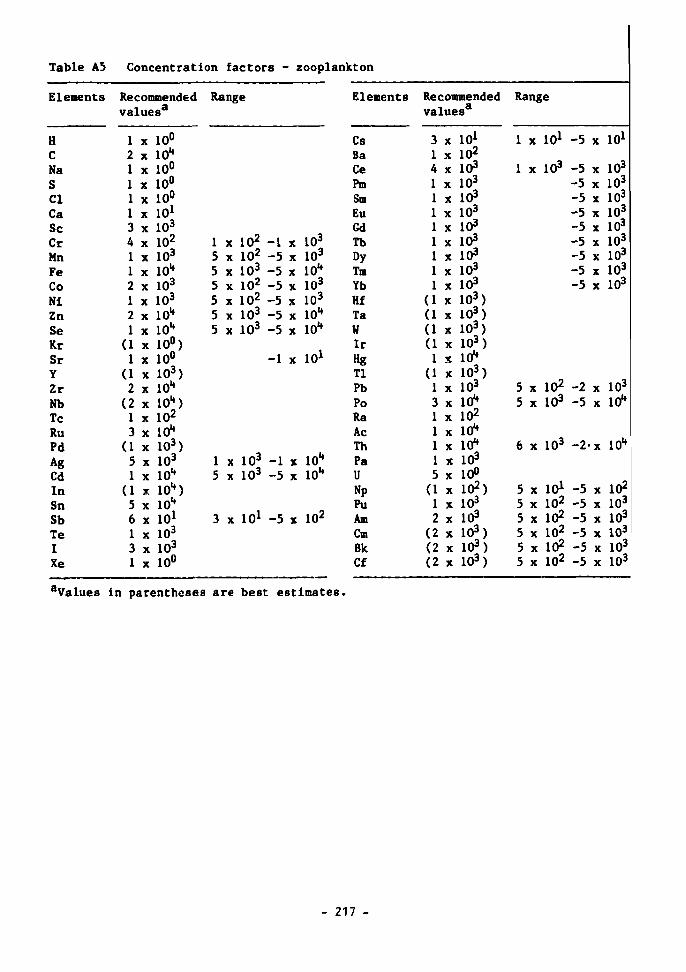
Table A5
Elements
H C Na S CI Ca Sc Cr Mn Fe Co Ni Zn Se Kr Sr Y Zr Nb Tc Ru Pd Ag Cd In Sn Sb Te I Xe
Concentration
Recommended values
1 2 1 1 1 1 3 4 1 1 2 1 2 1 (1 1 (1 2 (2 1 3 (1 5 1 (1 5 6 1 3 1
x '. x '. X
X 1 X
X
X
X
X
X
X 1 X . X
X
X
X
X
X
X
X
X
X
X
X
X
X
X
X
X
X
,a
0° 0" 10° 0° 0° LO1
L03
L02
L03
L0-L03
O3
LO-0-L0°) 10° L03) 10* 10") L02
L0-103) 103
10-10-) 10-10* 103
103
10°
factors -
Range
1 5 5 5 5 5 5
1 5
3
x 102 -1 x 10² -5 x 10³ -5 x 10² -5 x 10² -5 x 10³ -5 x 10³ -5
-1
x 103 -1 x 10³ -5
x 101 -5
- zooplankton
X
X
X
X
X
X
X
X
X
X
X
103
103
10-103
103
io-io-
101
io-io-
102
Elements
Cs Ba Ce Pm Sm Eu Gd Tb Dy Tm Yb Hf Ta W Ir Hg Tl Pb Po Ra Ac Th Pa U Np Pu Am Cm Bk Cf
Recommended values3
(1 (1 (1 (1
0
(i
(2 (2 (2
X •
x '. X
X '.
X
X '. X 1 X
X
X 1 X 1 X
X 1 X
X
X
X
X
X
X
X
X
X
X
X
X
X
X
X
X
LO1
02
103
O3
LO3
LO3
LO3
LO3
LO3
103
LO3
LO3) LO3) LO3) LO3) L0-LO3) LO3
L0-LO2
L0-L0-103
10° 102) 103
103
io?) 103) 103)
Range
1 X
1 X
5 x 5 x
6 x
5 x 5 x 5 x 5 x 5 x 5 x
101
103
102
103
103
101
102
102
102
102
102
-5 x 101
-5 x 10³
-5 x 10³
-5 x 10³
-5 x 10³
-5 x 10³
-5 x 10³
-5 x 10³
-5 x 10³
-5 x 10³
-2 x 10³
-5 x 10-
-2-x 10-
-5 x 10²
-5 x 10³
-5 x 10³
-5 x 10³
-5 x 10³
-5 x 10³
aValues in parentheses are best est imates .
- 217 -
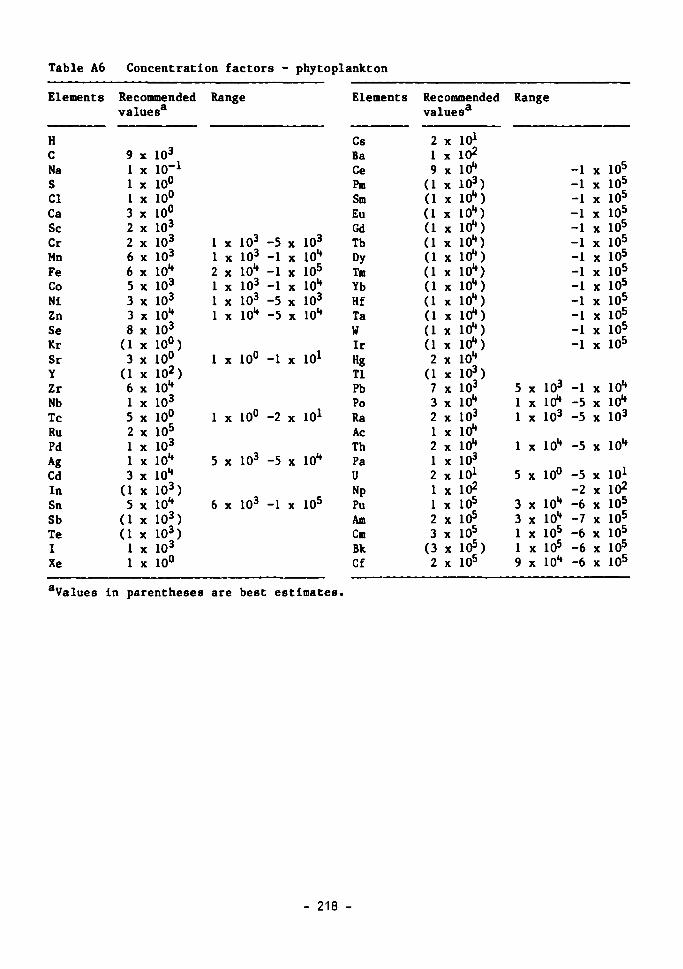
Table A6 Concentration factors - phytoplankton
Elements
H C Na S CI Ca Sc Cr Mn Fe Co Ni Zn Se Kr Sr Y Zr Nb Tc Ru Pd Ag Cd In Sn Sb Te I Xe
Recommended values3
9 x ] 1 X 1 X 1 X 3 x 2 x 2 x 6 x 6 x 5 x 3 x 3 x 8 x (1 x 3 x (1 x 6 x 1 X 5 x 2 x 1 X 1 X 3 x (1 x 5 x (1 x (1 x 1 X 1 X
103
LO"1
10° 10° 10° LO3
LO3
LO3
10-103
103
LO-103
10°) 10° 102) L0-L03
10° LO5
L03
L0-io-LO3) L0-L03) L03) L03
10°
Range
1 1 2 1 1 I
1
1
5
6
X
X
X
X
X
X
X
X
X
X
103
103
10-103
103
io-
10°
10°
103
103
-5 -1 -1 -1 -5 -5
-1
-2
-5
-1
X
X
X
X
X
X
X
X
X
X
103
io-105
10-103
io-
101
101
10-
105
Elements
Cs Ba Ce Pm Sm Eu Gd Tb Dy Tm Yb Hf Ta W Ir Hg Tl Pb Po Ra Ac Th Pa U Np Pu Am Cm Bk Cf
Recommended values3
2 1 9 (1 (1 (1 (1 (1 (1 (1 (1 (1 (1 (1 (1 2 (1 7 3 2 1 2 1 2 1 1 2 3 (3 2
X
X
X
X
X
X
X
X
X
X X
X
X
X
X
X
X
X
X
X
X
X
X
X
X
X
X
X
X
X
101
10* 10-103) 10-) 10-) 10-) 10-) 10-) 10-) 10-) 10-) 10-) 10-) 10-) io-103) 103
10-103
10-10-103
ioi 102
105
10s
105
105) 105
Range
5 1 1
1
5
3 3 1 1 9
X
X
X
X
X
X
X
X
X
X
103
10-103
io-
10°
io-10-105
105
10-
-1 -1 -1 -1 -1 -1 -1 -1 -1 -1 -1 -1 -1
-1 -5 -5
-5
-5 -2 -6 -7 -6 -6 -6
X
X
X
X
X
X
X
X
X
X
X
X
X
X
X
X
X
X
X
X
X
X
X
X
105
10* 105
105
105
105
105
105
105
105
105
10* 105
10-10-103
10-
101
102
105
105
105
105
105
aValues In parentheses are best estimates.
- 218 -
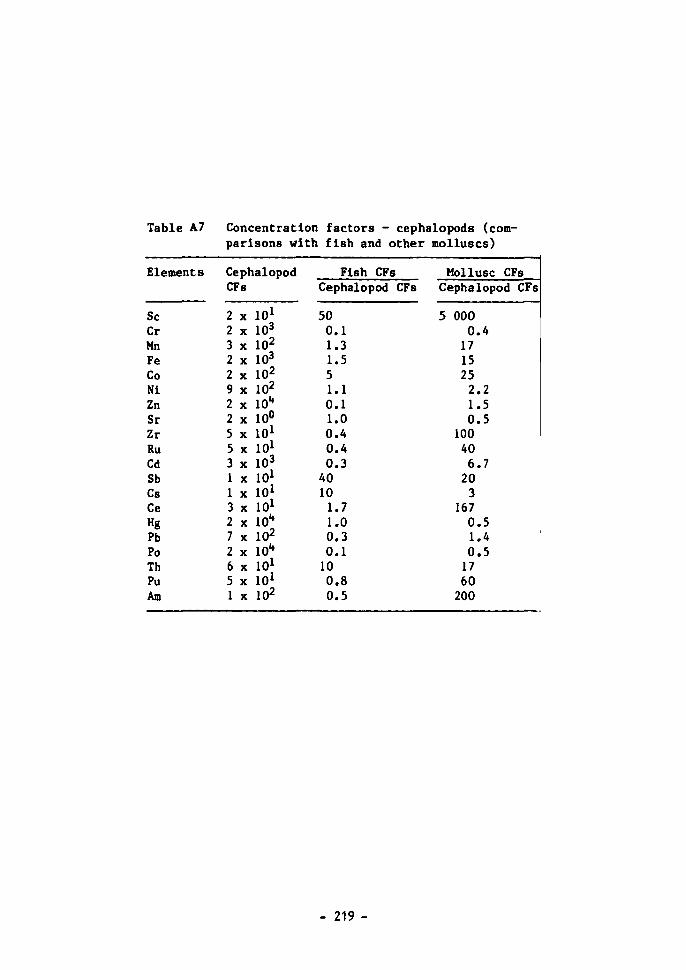
Table A7 Concentration factors - cephalopods (comparisons with fish and other molluscs)
Elements
Sc Cr Mn Fe Co Ni Zn Sr Zr Ru Cd Sb Cs Ce Hg Pb Po Th Pu Am
Cephalopod CFs
2 2 3 2 2 9 2 2 5 5 3 1 1 3 2 7 2 6 5 1
X
X
X
X
X
X
X
X
X
X
X
X
X
X
X
X
X
X
X
X
101
103
102
103
102
102
lO* 10° 101
101
103
101
101
101
io-102
lO* 101
101
102
Fish CFs Cephalopod CFs
50 0.1 1.3 1.5 5 1.1 0.1 1.0 0.4 0.4 0.3 40 10 1.7 1.0 0.3 0.1 10 0.8 0.5
Mollusc CFs Cephalopod CFs
5 000 0.4 17 15 25 2.2 1.5 0.5
100 40 6.7 20 3
167 0.5 1.4 0.5 17 60 200
- 219 -
WHERE TO OBTAIN OECD PUBUCATIONS OU OBTENIR LES PUBUCATIONS DE LTCDE
ARGENTINA - ARGENTINE Carlo* Hindi S.R.L., Florid* lo5.4* Piao. (Gskria Gucmcs) 1333 Buenos Aires
Tel. 33.I7S7.239I y 30.7122
AUSTRALIA - AUSTRALIE D.A. Book (Aast.) Pty. Ltd. 11-13 Sution Street (P.O. Box 163) Mrtcham. Vic 3132 Tel. (03) 873 4411
AUSTRIA - AUTRICHE OECD Publication* and Information Centre. 4 Shnrockstranc, 5300 Bonn (Germany) Tel. (022S) 2I.60.4S
GeraM * Co.. Grabcn 31 . Wicn I Tel. S2.22.3S
BELGIUM - BELGIQUE Jean de Lannoy, Arenac dv Roi 202 B-1060 Brexclk* Tel. (02)538.51.69
CANADA Rcnonf Publishing Company Ltd/ Editions Rcnour Ltee, 1294 Alfoma Road. Ottawa, Ont. Kl B 3W8
Tel: (613) 741-4333 Toll Free/Sans Fran: Ontario, Quebec, Maritime*: I-SOO-267-IS05 Western Canada. Newfoundland: 1100-267-1126 Stores/Magasins: 61 me Sparks St.. Ottawa. Ont. KIP SA6
Tel: (613) 231-8985 211 me Yonge St.. Toronto, Ont. MSB IM4
Tel: (416) 363-3171 Federal Publications Inc.. 301-303 Kin* St. W.. Toronto. Ont. MSV US Tel. (416)581-1552 Les Editions la Liberie inc., 3020 Chcmin S*inte-Foy, Sainte-Foy. P.O. G I X 3V6. Tel. (418)658-3763
DENMARK - D A N E M A R K Munksgaard Eiport and Subscription Service 35, Narrc Ssgadc, DK-1370 Kabcnhavn K
Tel. +45.1.12.85.70
F INLAND - F INLANDE Akalceminen Kirjakauppa, Kcskuskalu 1,00100 Helsinki 10 Tel. 0.12141
FRANCE OCDE/OECD Mail Orders/Commandea par correspondance: 2, n»e Andre-Pascal, 7S77S Pari* Cedex 16 Tel. ( I ) 45.24.12.00 Booksbop/Librairie: 33, rue Octavc-Fcuillel 73016 Paris
Tel ( I ) 45.24.81.67 or/ou (1)45.24.81.81 Librairie de I'Universite, I2g, me Naurelh, 13602 Aix-cn-Provcnce Tel. 42.26 18.08
GERMANY - A L L E M A G N E OECD Publication* and Information Centre, 4 Simrockstraue. 5300 Bonn Tel. (0228)21.60.45
GREECE - GRECE Librairie KaulTmann, 28. rue du Slide, I OS 64 Alliens Tel. 322.21.60
HONG KONG Government Information Service*, Publications (Sale*) Office, Information Service* Department No. I , Battery Path, Central
ICELAND - ISLANDE SnatbjOrn Jonsson A Co., h.f, Hafnamrsii 4 * 9 , P.O.B. 1131-Reykjavik
Tel. I 3 I33 / I428 I / I I 936
INDIA - INDE Oxford Book and Stationery Co., Scindii House New Delhi 110001
Tel. 331.$896/5301 17 Park St., Calcutta 700016 Tel. 240832
INDONESIA - INDONESIE Pdii-Lipi, P.O. Box 3065/JKT.Jakart*
Tel. 583467
IRELAND - IRLANDE TDC Publisher* - Library Suppliers. 12 North Frederick Street. Dublin I
Tel. 744835-749677
ITALY - ITALIE Librcria Comrnissioaaria Sansoni, Via Benedetto Fortini 120/10. 50125 Firenxe Tel. 055/645415 Via Bartolini 29. 20155 Mibno Tel. 365043 La dirTunonc delk pabbheazioni OCSE rieac assicurau dalle principal! librerie ed anche da: Editricc e Librcria Herder, Piazza Montecitorio 120.00186 Roma
Tel. 6794628 Librcria Heepli, ViaHofpl i5,20l2l Milano T d . 865446 Libreria Scientinca Don. Luck) de Biasio "Ackw" Via Meravigli 16. 20123 Milano Tel. 807679
JAPAN - JAPON OECD Publications and Information Centre. Lendic Akasaka BMg.. 2-3-4 Akaiaka. Minato-ku, Tokyo 107 T d . 586.2016
KOREA - COREE Kyoto Book Centre Co. Ltd. P.O.Box: Kwang Hwa Mom 1658, Seoul Tel. (REP) 730.78.91
LEBANON - LIBAN Documenta Scicntifica/Rcdico, Edison Building, Bins St., P.O.B. 5641, Beirut Tel. 354429-344425
MALAYSIA/SINGAPORE -MALAISIE/SINGAPOUR University of Malaya Co-operative Bookshop Ltd.. 7 Lrg SI A/227A. Pctaling Jaya Malaysia Td. 7565000/7565425 Information Publication* Pte Ltd Pei-Fu Industrial Building, 24 New Industrial Road No. 02-06 Singapore I9S3 Tel. 2831786, 2831798
NETHERLANDS - PAYS-BAS SDU Uitgeverij Christoffel Plantijnstraat 2 Poitbus 20014 2500 EA's-Gravenhage Td. 070-789911 Voor bestrllingen: Tel. 070-789880
NEW ZEALAND - NOUVELLE-ZELANDE Government Printing Office Bookshops: Auckland: Retail Bookshop, 25 Rutland Stseet, Mail Orders. 85 Beach Road Private Bag C.P.O. Hamilton: Retail: Ward Street, Mail Orders, P.O. Box 857 Wellington: Retail, Mulgrave Street, (Head Office) Cubacade World Trade Centre, Mail Orders, Private Bag Christchurch: Retail, 159 Hereford Street, Mail Orders, Private Bag Dunedin: Retail. Prince* Street, Mail Orders, P.O. Box 1104
NORWAY • NORVEGE Narvesen Info Center - NIC, Bertram! Narvescns vci 2, P.O.B. 6125 Ettertlad, 0602 Oslo 6
Tel. (02) 67.83.10, (02) 68.40.20
PAKISTAN Mirza Book Agency 65 Shahrah Quaid-E-Azam, Lahore 3 Tel. 66839
PHILIPPINES I.J. Sagun Enterprises, Inc. P.O. Box 4322 CPO Manila
Tel. 695-1946, 922-9495
PORTUGAL Livraria Portugal, Rua do Carmo 70-74, 1117 Liiboa Codex Tel. 360582/3
SINGAPORE/MALAYSIA -SINGAPOUR/MALAISIE See "Malaysia/Singapor". Voir • Malaisie/Singapour.
SPAIN - ESPAGNE Mundi-Prensa Libra*. S.A.. CaatelkS 37. Apartado 1223. Madrid-28001
T d . 431.33.99 Libreria Bosch, Ronda Univcreidad I I , Barcelona 7 Tel. 317.53.08/317.53.58
SWEDEN - SUEDE AB CE Fritzes Kungl. Hovbokhandel. Box 16356, S 103 27 STH. Regeringsgatan 12, DS Stockholm T d . (OS) 23.89.00 Subscription Agency/Abonncmcnl*: Wcnnetgren-Williams AB, Box 30004. SI04 25 Stockholm T d . (08)54.12.00
SWITZERLAND - SUISSE OECD Publications and Information Centre, 4 Shnrockstrasse, 5300 Bonn (Germany) Td. (0228) 21.60.45 Ubrairk Payot, 6rueGrenu*. 1211 Geneve I I
T d . (022)31.89.50
Maditec S.A. Ch. de* Palettes 4 1020 - Renens/Lausannc Td . (021) 35.08.65
United Nations Bookshop/Librairie des Nations-Unies Palais des Nations. 1211 - Geneva 10
Tel. 022-34-60-11 (ext. 48 72) T A I W A N - FORMOSE Good Faith Worldwide Inl'l Co.. Ltd. 9th Boor, No. 118, Scc.2, Chung Hsiao E. Road Taipei Tel. 391.7396/391.7397
T H A I L A N D - T H A I L A N D E Suksit Siam Co., Ltd., 1715 Rama IV Rd , Samyam Bangkok 5 Tel. 2511630
INDEX Book Promotion * Service Ltd. 59/6 Soi Lang Suan. Ploenchit Road Patjumamwan, Bangkok 10500
Tel. 250-1919. 252-1066 TURKEY - TURQUIE Kullur Yayinlari Is-Turk Ltd. Sti. Ataturk Bulvari No: 191/Kat. 21 Kavaklidere/Ankara Tel. 25.07.60 Dolmababcc Cad. No: 29 Bcsiktas/lstanbul Tel. 160.71.88
UNITED K I N G D O M - ROYAUME-UNI H.M. Stationery Office, Postal orders only: (01)211-5656 P.O.B. 276, London SW8 5DT
Telephone orders: (01) 622.3316, or Personal callers: 49 High Holborn, London W C I V 6HB Branches at: Belfast. Birmingham, Bristol, Edinburgh, Manchester
UNITED STATES - ETATS-UNIS OECD Publication* and Information Centre, 2001 L Street, N.W., Suite 700, Washington. D C 20036 - 4095
Tel. (202) 785.6323
VENEZUELA Libreria del E*te, Avda F. Miranda 52. Aptdo. 60337, EdiAcio Galipan, Caracas 106
Td . 951.17.05/951.23.07/951.12.97
YUGOSLAVIA - YOUGOSLAVIE Jugoskwenski Knjiga, Knez Mihajlova 2, P.O.B. 36. Beograd Tel. 621.992
Orders and inquiries from countries where Distributors have not yet been appointed should be sent to: OECD. Publication* Service, 2, rue Andre-Pascal, 75775 PARIS CEDEX 16.
Le* commande* provenaM de pay* od I'OCDE n'a pas encore design* de distributeur doivent etre adrcstecsa: OCDE, Service de* Publications. 2, rue Andre-Pascal, 75775 PARIS CEDEX 16.
72J33-IMTM
OECD PUBUCATIONS. 2, rut Andnt-Pascal, 75775 PARIS CEDEX 18 - No. 44888 1888