i asieb - international atomic energy agency
TRANSCRIPT
PROGRESS IN RESEARCH
APRIL 1, 1992- MARCH 31, 1993
Prepared by
The Cyclotron Institute Staff
Texas A&M University
College Station, TX 77843-3366
DISCLAIMER
This report was prepared as an account of work sponsored by an agency of the United StatesGovernment. Neither the United States Governmentnor any agency thereof, nor any of theiremployees, makes any warranty, express or implied, or assumes any legal liability or responsi-bility for the accuracy, completeness, or usefulness of any information, apparatus, product,orprocess disclosed, or representsthat its use would not infringe privately owned rights. Refer-ence herein to any specific commercial product, process, or service by trade name, trademark,manufacturer, or otherwise does not necessarily constitute or imply its endorsement, recom-mendation, or favoring by the United States Governmentor any agency thereof. The viewsand opinions of authors expressed herein do not necessarily state or reflect those of theUnited States Governmentor any agency thereof.
July 1993
I ASIEBOI13TRIBUTIONOF THIS DOCUMENT 18UNLIMITF..D
f
TABLE O1" CONTENTS
INTRODUCTION ................................................................
I. IIEAVY i()N REACTIONS
Neutron Multiplicity Systematics and Energy Deposition in Reactions Inducedby 30 AMeV 14N, 2°Ne, and 63Cu ................................................ I-I
J. Boger, T. BoRing, L. Cooke, B. Hurst, D. O'KeUy, R. P. Schmitt,and W. Turmel
Excitation Energy Partitioning in the Reaction 2ONe+ 2tmpb at 30 AMeV ....................... I-5B. Hut-st,J. Boger, T. Botting, L. Cooke, D. O'Kelly, W. Turmel, and R. P. Schmitt
Reaction Dynamics in the Formation and the lk_cayof llot Nucleiin 63Cu + Au at 35 AMeV ...................................................... i-6
R. Wada, K. Hagel, R. Tezkratt, G. X. Dai, Y. Lou, ID.Utley, B. Xiao, J. Li, N. Mdeiwayeh, and J. B. Natowitz
The Fate of Compound Systems in Reactions of 40 AMeV Ar with Th or Au Targets ................. I-11D. Utley, X. Bin, K. Hagel, S. Lee, J. Li, Y. Lou, J. B. Natowitz, and R. Wada
Fission in the Reactions of 63Cu + 1°°,92Moat 10, 17, and 25 AMeV and2°Ne + 144"n4s'nS4smat 20 AMeV .................................................. !-16
Y. Lou, L. Cooke, T. Botting, M. Gonin, M. Gui, K. Hagcl, B. Hurst, D. O'Kelly, G. Mouchaty,J. B. Natowitz,R. P. Schmitt,W. Turmel, D. Utley, R. Wada, B. Butch, M. E. Brandan,D. Fabris, F. Gramegna, A. Menchaea-Rocha, G. Nebbia, M. Poggi, J. Ruiz, and G. Viesti
Decay of ilot Nuclei in the Reaction 63Cu + 63Cuat 35 AMeV ............................... 1-19B. Xiao, G. X. Dai, K. Hagel, J. Li, Y. Lou, N.Mdeiwayeh, R. Tezkratt,D. Utley, R. Wada, and J. B. Natowitz
The Muitifragmentation of 4°Ca + 4°Ca .............................................. !-21K. Hagel, M. Gonin,R. Wada,J. B. Natowitz, B. H. Sa, Y. Lou, M. Gui, D. Utley, G. Nebbia, D. Fabris,G. Prete,J. Ruiz, D. Drain, B. Chambon, B. Cheynis, D. Guinct, X. C. Hu, A. Demeyer, C. Pastor, A. Giorni, A. Lleres,P. Stassi, J. B. Viano, and P. Gonthier
Mechanisms of l,ight Charged Particle and Intermediate Mass FragmentProduction for the Reaction 220 MeV 4lie + IS4Sm ...................................... !-26
J. Bogcr, T. Botting, B. Hurst, D. O'Kelly, It. P. Schrnitt,W. Turmel, and S. J. Yennello
!1. NUCLEAR STRUCTURE AND FUNDAMENTAL INTERACTIONS
Nuclear Matter Compressibility from lsoscalar Giant MmJopole Resonance ....................... !!-27S. Shlomo and D. H. Youngblood
Deuteron Elastic Scattering at 110 and 120 MeV ......................................... 11-33A. C. Betker, C. A. Gagliardi, D. R. Semon, R. E. Tril_ble,H. M. Xu, and A. F. Zaruba
Projectile Breakup Reactions Induced with 30 AMeV 160 and 2°Ne ............................. !!-36D. O'Kelly, H. Utsunomiya, T. Botting, L. Cooke, B. tlurst, Y-W. Lui, R. P. Schmitt, and W. Tunnel
Feasibility Study of the Knockout Reaction 7Li(a,2a)3H .................................... 11-38J. Boger, H. Dejbakhsh,T. Botting, B. Hurst, D. O'Kelly, R. P. Schmitt, and W. Tunnel
142 I ., ,_ 22 12GDR _/Decay of Nd Nucleus Produced by 60 ,- "e'l'eand Ne + °Sn• •
Reactions at E =150 MeV ...................................................... JI-40R. K. Choudhury,K. L. Wolf, H. Jabs, J. Shoemaker,J. B. Natowitz, K. Hagel, Y. Lou, R. Wada, R. P. Schmitt,W. Tunnel, and H. Xu
Zu Dependence of Correlated Positron-Electron Peak Cross-S_etinus ............................ 11-41T. E. Cowan, M. W. Clark, J. H. Hartley, D. A. Knapp, J. L. McDonald, J. W. McDonald, D. H. G. Schneider,R. L. Watson, V. Horvat
Progress on the MEGA Experiment ................................................. !1-43C. A. Gagliardi, F. Liu, R. E. Tribble, X. L. Tu, and L. A. Van Ausdcln
The _l(xJ/_(xJ Ratio in the Proton .................................................. !i.49C. A. Gagliardi, E. A. Hawker, and R. E. Tribble
Experimental Program in N-N, Few.N, and Kaon Physics ................................... !1-53L. C. Northcliffe, J. C. Hie.bert, R. A. Kenefick, G. Glass, T. Shima, and collaborators from several other institutions
ill. NUCLEAR TllEORY
Nuclear Structure Study of the Odd-A Tc Isotopes ...................................... !11-57H. Dejbakhsh and S. Shlomo
Investigation of Even-Even Kr Isotopes within IBM-2 Framework ............................. i!i-63H. Dejbakhsh, A. Kolomiets, and S. Shlomo
Single Particle level Density in the Continuum ......................................... !11-66S. Shlomo and H. Dejbakhsh
Light Front Dynamics and the Binding Correction ...................................... !!i-67S. V. Akulinichev
Formation and Decay of Toroidal and Bubble Nuclei and the Nuclear Equation of State .............. i11-68H. M. Xu, J. B. Natowitz, C. A. Gagliardi, R. E. Tribble, C. Y. Wong, and W. G. Lynch
Polyhedron and Sausage Instabilities in the Decay of Bubble and Toroidal Nuclei ................... !!1-70C. Y. Wong, H. M. Xu, and B. Xiao
Disappearance of Flow and the In-Medium Nucleon-Nucleon Cross Section ....................... !!1-73H. M. Xu
Mass Asymmetry, Equation of State, and Nuclear Multlfragmentation .......................... !ii-75H. M. Xu
Symmetric Multi-Fragmentation Barriers and Their Temperature Dependence .................... i!1-78G. X. Dai, J. B. Natowitz, R. Wada, Y. N. Lou, K. Hagel, and B. Xiao
Subthreshold Kaon production in Nucleus-Nucleus Collisions ................................ 111-82X. S. Fang, C. M. Ko, and Y. M. Zheng
Medium Effects on the Rho Meson ................................................ 111-85M. Asakawa and C. M. Ko
Seeing the QCD Phase Transition with Phi Mesons ...................................... iil-87M. Asakawa and C. M. Ko
IV. ATOMIC MOI,ECIJI,AR & MATERIAI,S SCIENCF
Iiigh Resolution Study of X-Ray Emission Induced b)' 6- aml 8-AMeV Xe ions Incident on Solid Targets ... IV-90V. ltorvat, R. Paramcswaran, and R. L. Watson
Systematles of Xe Recoil-Ion Charge State Distributions Produced in 8 AMeV Kr Collisions ............ !V-92R. Parameswaran, R. L. Watson, V. Horvat, and G. Sampoll
ii
Orientation Dependence of Cross Sections for Muitielectron Ionization of CO Molecules in96 MeV Ar t4+ Collisions ....................................................... IV-97
V. Horvat, O. Heber, G. SampoU, R. Parameswaran, alld R. L. Watson
Total Kinetic Energy Research in Dissociative Electron-C:qJture Collisions of 97 MeVAr 14+ with CO Molecules .................................................... IV.100
G. Sampoll, R. L. Watson, O. Hcbcr, V. Horvat, and I<. Paramcswaran
A Method for Simultaneous Position and Time-of-Flight IJ_ermination of Ion-Pairsfrom the Dissociation of Multicharged Molecular Ions .................................... IV-102
O. Heber, V. Horvat, G. Sampoll, R. Parameswaran, a,d R. L. Watson
Studies of the Interaction of Multiply-Charged An"lons with Surfaces .......................... IV-104C. Assad and R. E. Tribble
Measurements of Atomic Ground Term Metastable Lifetimes of llighly-Charged Ions ................ _V-109D. A. Church, Lisheng Yang, Shigu Tu, and Jian Jin
V. SUPERCONDUCTING CYCIA)TRON AND INSTRUMENTATION
KS00 Development and Operations ................................................ V-I 11D. P. May, G. Mouchaty, and G. J. Kim
Deflector Development ........................................................ V-115R. C. Rogers, W. H. Peeler, D. P. May
Quadrupole Field Mapping ..................................................... V-118J. D. Bronson, Y-W. Lui, and D. H. Youngblood
Beam Analysis System ......................................................... V-If9D. H. Youngblood, J. D. Bronson, G. Mouchaty
Single Event Effect Facility ..................................................... V-126R. C. Rogers, D. P. May, R. A. Gutierrez, and P. Smciscr
Computing at the Cyclotron Institute ............................................... V-128K. Hagel and H. Dcjbakhsh
CommLssioning of the Proton Spectrometer Facility ...................................... V-131A. C. Bctker, C. A. Gagliardi, H. M. Xu, and A. F. Z_,ruba
Construction and Initial Operation of MARS .......................................... V-136R. Tribble, J. Bronson, H. Dejbakhsh, C. Gagliardi, S. llale, W. Liu, D. Semon, H. Xu, S. Yenncllo, and X. Zhou
Beam Rate Estimates for MARS .................................................. V-140
J. A. Winger
MDM Spectrometer .......................................................... V-142D. H. Youngblood, Y. W. Lui, J. D. Bronson, G. Henclricks, and D. Borovino
Barium Fluoride Array ........................................................ V-143H..labs, M. Murray, and K. L. Wolf
The 4x Csi Bali ............................................................. V.144
B. Xiao, G. Derrig, K. Hagel, R. Tezkratt, R. Wada, J. B. Natowitz, J. Li, Y. Lou, and D. Utley
VI. PUBLICATIONS
Abstracts of Papers Published ................................................... .Vi-147April 1992 - March 1993
Abstracts of Papers Submitted .................................................. .Vi-157April 1992- March 1993
VII. APPENDIX
Talks Presented ............................................................ Vii-161
Conference Proceedings ....................................................... VI1-163
Research Persoanel and Engineering Staff ........................................... V!1-164
Institute Colloquium Series .................................................... V11-166
Internal !nstitute Seminars ..................................................... V i!- 168
INTRODI.ICTION
April 1992 - March 1993
This Institute annual report for the period 1 April reaction rates of astrophysical interest as had been1992 - 31 March 1993 covers a period which has theoretically predicted.seen the initial runs of three new spectrometers which Theoretical work reported in this document
constitute a major portion of the new detection ranges from nuclear structure calculations using thecapabilities developed for this facility. These devices IBM-2 model to calculations of kaon production andare the Proton Spectrometer (PSP) (data from which the in-medium properties of the rho and phi mesons,are shown on the cover of this document), the Mass the latter as a probe of the QCD phase transition.Achromat Recoil Mass Spectrometer (MARS), and Nuclear dynamics and exotic shapes and fragmen-the Multipole Dipole Multipole (MDM) Particle tation modes of hot nuclei are also addressed.
Spectrometer. These devices are now available to In atomic physics, new measurements of x-raypursue the studies of Gamow Teller states, reactions emission from highly ionized ions, of molecular
of astrophysical interest, and giant resonance studies dissociation and of surface interactions are reported.for which they were constructed, as well as for other Noteworthy also in this year's report are theexperiments. A beam analysis system which will addition of Assistant Professor Sherry Yennello to thedeliver high resolution beams to the MDM Nuclear Chemistry faculty and the progress towardspectrometer is currently under construction. With development of a SEE radiation facility for study ofthe completion of these spectrometer projects, the radiation effects on space station components.facility emphasis is now focused on the development During the report period, 21 graduate students,
of the full capabilities of the K500 cyclotron and on 20 undergraduate students, and 14 post doctoralthe research program, fellows have carried out research projects with
During the report period, the ECR-K500 Institute staff. Institute scientistshavecontinuedtheircyclotron combination operated 5,849 hours. The outside collaborations in MEGA (LAMPF) and STARbeam was actually on target 39 % of this time, (RHIC) during this report period, and have joined areflecting the large amount of time devoted to new collaboration at Fermilab.
development, tuning, and optics of new beams -- The research described in this report is fundednotably 2H to 70 AMeV, 63Cu21+ to 40 AMeV and primarily by the Department of Energy under grants129Xe23+ to 12.5 AMev. DE-FGO5-86ER40256 (nuclear) and DE-FGO5-
Studies of nuclear dynamics and nuclear 84ER13262 (atomic); by the National Sciencethermodynamics using the neutron ball have come to Foundation under grants PHY-8907986 and PHY-fruition during this period &,_indicated in Section I of 9001886 (theory); and by The Robert A. Welchthe report. The Csl ball, which will complete our 41" Foundation under grants A-330, A-355, A-558, A-charged particle detection system and will later see 692, A-972, A-1082, A-1110, and A-1159.use with the neutron ball, will soon be completed. Operation of the facility is also supported by the
In nuclear structure, a critical re.evaluation of University. The Texas A&M MEGA collaboration
the available data on the giant monopole resonance is supported under grant DE-FG05-87ER40310.has indicated that the incompressibility is not Research in the STAR collaboration is supportedspecified to a range smaller than 200-350 MeV by under grant DE-AS05-85ER40207. The LAMPF few
those data. New systematic experiments using the nucleon studies have been funded under grant DE-MDM spectrometer are now underway. In the FGO5-88ER40399. The MDM spectrometer and the
summer of 1992 the MEGA collaboration obtained analysis system are also funded by DOE under grantthe first data on the /z _ e3r decay rate and DE-FGO5-86ER40256.
determination of the Michel parameter in normal /z Some of the data and conclusions presented indecay. Experiments here with the Livermore e+e - this report are based upon preliminary analyses of thespectrometer appear to confirm the existence of experiments. Until this resea;ch is published, itmonoenergetic pair peaks even for relatively low should not be cited without express consent of the
Zprojectile - Ztarget combinations. Studies of the investigators involved.(ot,2a) knockout reaction indicate that this reactionmay prove to be a valuable tool for determination of J.B. Natowitz
July 1993
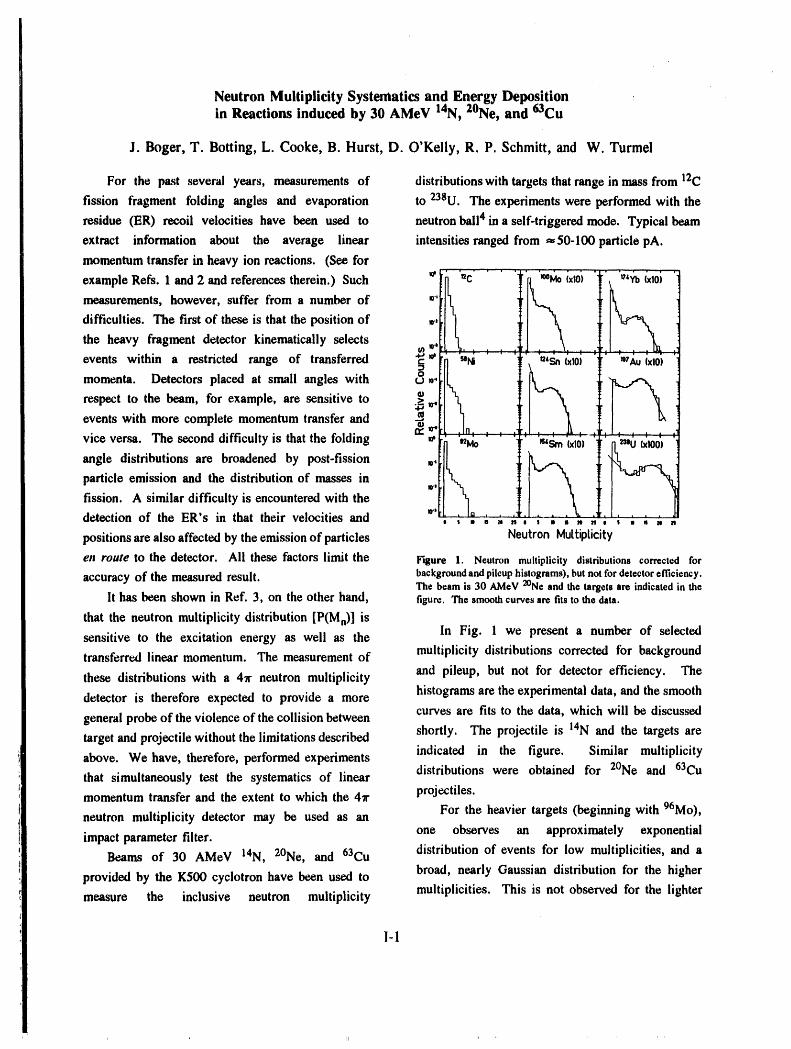
Neutron.Multiplicity Systematics and Energy Depositionin Reactions induced by 30 AMeV 14N, 2°Ne, and 63Cu
J. Boger, T. Botting, L. Cooke, B. Hurst, D. O'Kelly, R. P. Schmitt, and W. Turmel
For the past several years, measurements of distributions with targets that range in mass from 12C
fission fragment folding angles and evaporation to 238U. The experiments were performed with the
residue (ER) recoil velocities have been used to neutron ball 4 in a self-triggered mode. Typical beam
extract information about the average linear intensities ranged from =50-100 particle pA.
momentum transfer in heavy ion reactions. (See for
example Refs. 1 and 2 and references therein.) Such _'L
measurements, however, suffer from a number of _
difficulties. The first of these is that the position of _,
the heavy fragment detector kinematically selects _,
events within a restricted range of transferred o ,___''i "_ " " "_'t "u'_ (xl0i "_'+ "_',_ ixl0i ']momenta. Detectors placed at small angles with _ )_
respect tothebeam, for example, are sensitive to _:11_ IJ_ I_ 1
vice versa. The second difficulty is that the folding _ ,,
angle distributions are broadened by post-fission to_
particle emission and the distribution of masses in ,.,[[_ _[_fission. A similar difficulty is encountered with the
detection of the ER's in that their velocities and '_', , , , _, ,,, , , , _, ,,, , , , ,, ,,
positions are also affected by the emissionof particles Neutron MuLtipLicity
ell route to the detector. All these factorslimit the Figure 1. Neutronmultiplicity distributionscorrectedforaccuracy of the measuredresult, background and pileup histograms),but not for detectorefficiency.
The beam is 30 AMeV 2°Ne and the targets are indicated in theIt has been shown in Ref. 3, on the other hand, figure.The smooth curvesare fitsto thedata.
that the neutron multiplicity distribution [P(Mn)] isIn Fig. 1 we present a number of selectedsensitive to the excitation energy as well as the
transferred linear momentum. The measurement of multiplicity distributions corrected tbr backgroundand pileup, but not for detector efficiency. Thethese distributions with a 47r neutron multiplicityhistograms are the experimental data, and the smoothdetector is therefore expected to provide a morecurves are fits to the data, which will be di_ussed
general probe of the violence of the collision between
target and projectile without the limitations described shortly. The projectile is 14N and the targets areindicated in the figure. Similar multiplicityabove. We have, therefore, performed experimentsdistributions were obtained for 2°Ne and 63Cu
that simultaneously test the systematics of linear
momentum transfer and the extent to which the 47r projectiles.For the heavier targets (beginning with 96Mo),neutron multiplicity detector may be used as an
impact parameter filter, one observes an approximately exponential
Beams of 30 AMeV 14N, 2°Ne, and 63Cu distribution of events for low multiplicities, and abroad, nearly Gaussian distribution for the higherprovided by the K500 cyclotron have been used to
measure the inclusive neutron multiplicity multiplicities. This is not observed for the lighter
I-1
targets (for example 58Ni), which show only the over the de-excitation chain. Average detector
former component. The exponential component is efficiencies for each reaction are listed in Table I in
identified with peripheral collisions between target the row labeled _. Dividing the values of n0 by c
and projectile, and the Gaussian component with the gives the average neutron multiplicity corrected for
more central collisions. For the 14N data, we have the detector response (< m>).
performed fits to the data for each projectile/target ,, _ ,,, , , __
combination using the form 25 t ' ' 0
l=Aexp(_a,n)+Bexl__a2(n_no)2]" (1) 20 __
where In is the intensity for events with multiplicity _ 15n. Accordingly, the neutron multiplicity distributions .--f)
for the central collisions were characterized by their
most probable value no and their widths (or standard _ 10deviations). ::$
Fits to the 14N reactions are shown by the _: 5[-I I I 4 I i I
smooth curves in Fig. 1. We find rather good t" 30 Oagreement between the data and the assumed O 20funcuonal form in all cases. Results of this analysis .4--s Ne 6:D 25
are listed in in Table I. For the reactions with 2°Ne (D ,_r_.the same fitting procedure was used, although in a Z 20jO /
few cases a Gaussian fit was done to the high __O-_S /
multiplicity component alone. In order to estimate the 15 _ o_"average efficiency of the neutron bail, one must take _O_I _?'
into consideration the kinematics of each 10 }/''_target/projectile combination used in this experiment
(as recoil velocities for the fused components will 5 I s I = I , i
vary) and the energy distribution of neutrons (a 100 150 200 250
functionof the emitter temperature)in order to model A (target)the responseof the detector. This is done using a
Figure 2. Experimentally derived average neutron multiplicitiesvery highly modified version of the code DENIS. 5 (solid circles) compared withstatisticalmodelcalculations(open
For the average source velocity, the recoil circles) for the 14N-induced (top) and 2ONe (bottom) reactions.Solid lines that connect the data are to guide the eye.
velocity of the fused component was determined from
the systematics in Ref. 2 for incomplete linear The statistical model code CASCADE has been
momentum transfer. Inclusion of the emitter used to calculate the average neutron multiplicities for
temperature provides the Monte Carlo simulation with the reactions listed in Table I. The linear momentum
a way to generate a neutron energy weighted transferred to the fused component in these reactions
efficiency. Temperatures used in these calculations is on the order of ==74(+ 12)%. 2 We have therefore
of the detector efficiencies were derived from the used the simple reaction model which assumes that
neutron energy spectra generated by the statistical _74% of the projectile mass and charge have fused
model code CASCADE 6 and are therefore averaged with the target, while the other 26% of the projectile
I-2
is emitted at O* with the beam velocity. This means overestimation is the effect of their combined result.
for purpo.,_s of calculating average multiplicities with This possibility is being currently investigated.
CASCADE, the following projectiles have been used It is also important to note, however, that on a
in the calculations: 10Band 15N. relative basis the data and calculated values agree
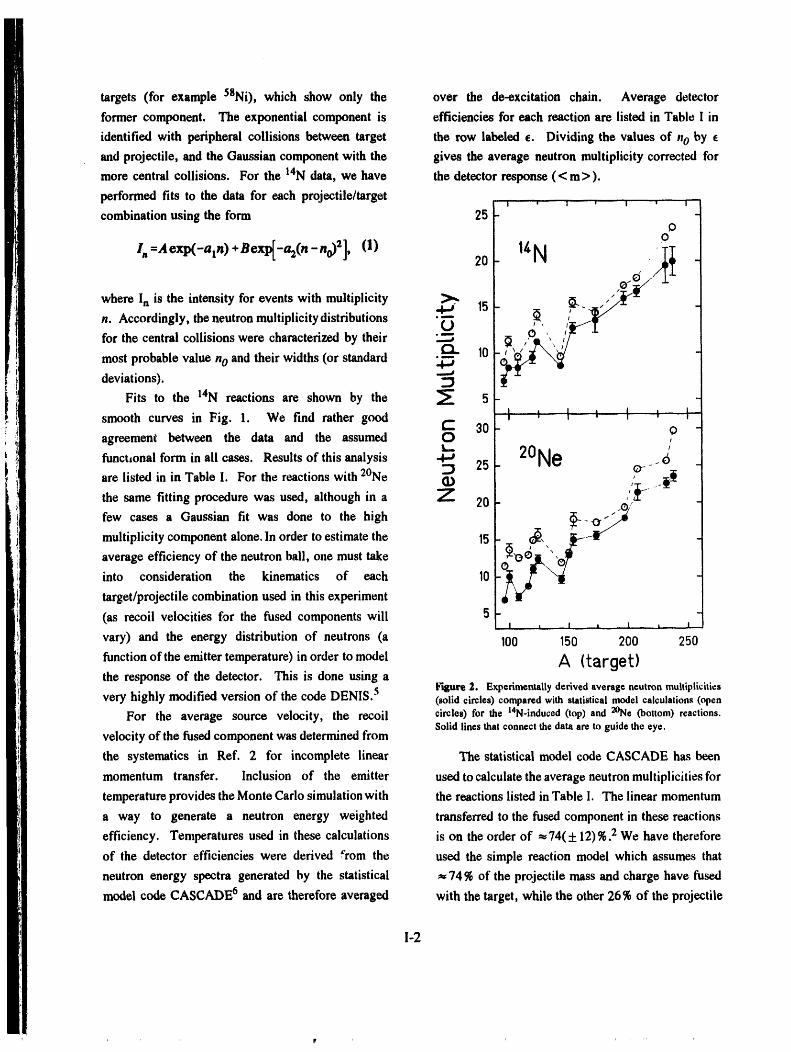
Figure 2 shows a comparison between the quite well: neutron-rich nuclei give relatively large
average neutron multiplicities calculated with the multiplicities and vice versa. This observation
statistical model (open circles) and the experimentally demonstrates that the decay of those nuclei that
derived multiplicities (solid circles) for 14N and 2°Ne. generate large numbers of neutrons is under statistical
Lines between the points serve to guide the eye. In control. This is significant in that the neutron
Fig. 2, one notes that the calculated average neutron multiplicity distribution may be used as an impact
multiplicities are systematically high with respect to parameter filter to separate the central and peripheral
the experimental values. This tendency needs to be reaction processes involved in charged particle
closely examined as it relates to the systematics of production, their energy spectra, and their angular
incomplete fusion as derived from fission fragment distributions.
folding angles and ER recoil velocities. The
uncertainties in the values of nOfrom fits to the data References
have been estimated by taking the differences
between the fitted values (listed in Table I) and the I. O. LaRana et al, Nucl. Phys. A407, 233 (1983).
values derived by taking weighted averages over 2. D. Guerreau et al, Nuclear Matter and Heavy
symmetric intervals about the high multiplicity peaks, lon Collisions, Plenum: New York (1989).
Uncertainties in the statistical model calculations 3. J. Galin, et al, Z. Physik A331, 63 (1988).
of CASCADE have been estimated from the experi- 4. R. P. Schmitt et al, Proceedings of the
mental dispersions in the linear momentum transfer. International Workshop on Dynamical Aspects of
From Ref. 2, this is typically about t-12% of the Nuclear Fission, Smolenice, Czechoslovakia,
average transferred momentum. This means for the June 17-21, 1991.
reactions studied here as little as 62% and as much as 5. J. Poitou and C. Signarbieux, Nucl. Instr. and
86 % of the incident linear momentum may have been Meth., 114, 113 (1974).
transferred to the composite nucleus. For selected 6. E. Puehlhofer, Nucl. Phys. A213, 267 (1977).
targets l°°Mo, 124Sn, and t54Sm), average neutron
multiplicities were calculated for these upper and
lower limits. Results are indicated by the error bars
on the open points in Fig. 2.
Note that the calculated and measured multipli-
cities in the majority of cases lie outside their mutual
calculational and experimental uncertainties for both
the 14N- and 2°Ne-induced reactions. This suggests
at least two possibilities: (1) the statistical model
overestimates the average number of neutrons emitted
during a cascade, or (2) the amount of linear
momentum transferred to the composite system is
overestimated. It is also possible that the observed
I-3
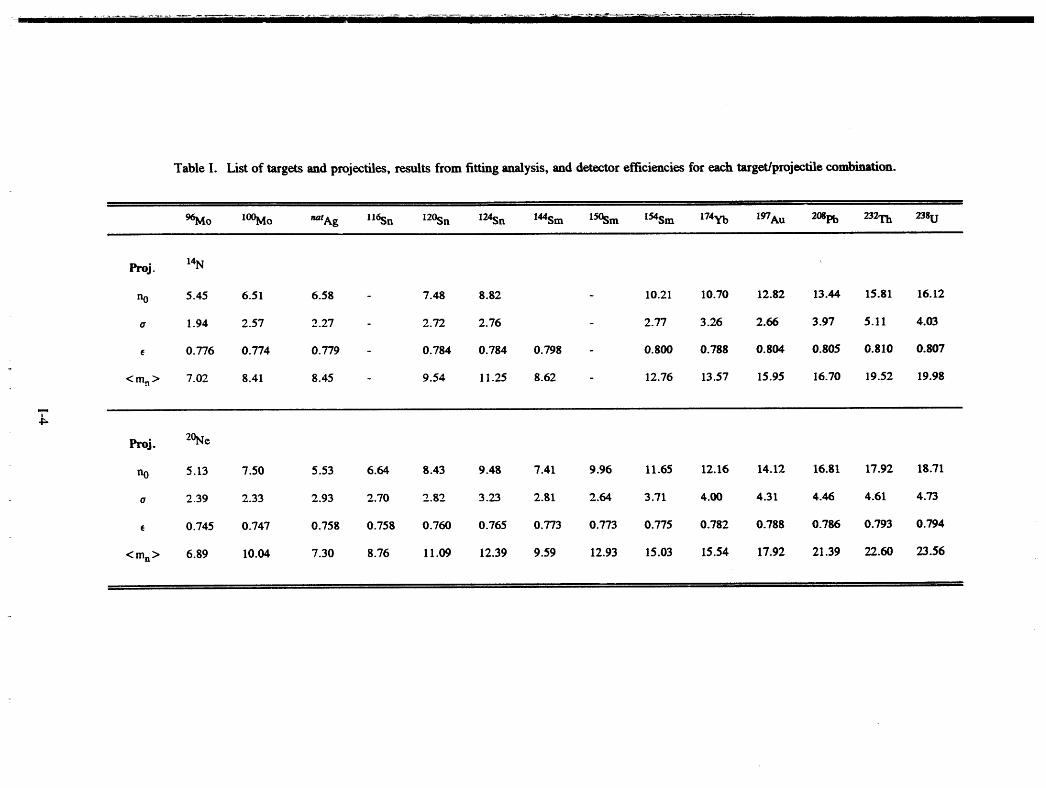
Table I. List of targets and projectiles, results from fitting analysis, and detector efficiencies for each target/projectile combination.
96Mo lOOMo aatAg 116Sn 120Sn 124Sn 144Sm 150$m 154Sm 174yb 197Au 208pb 232Th 238U
Proj. 14)q
no 5.45 6.51 6.58 - 7.48 8.82 - 10.21 10.70 12.82 13.44 15.81 16.12
a 1.94 2.57 2.27 - 2.72 2.76 - 2.77 3.26 2.66 3.97 5.11 4.03
e 0.776 0.774 0.779 - 0.784 0.784 0.798 - 0.800 0.788 0.804 0.805 0.810 0.807
< ran.> 7.02 8.41 8.45 - 9.54 11.25 8.62 - 12.76 13.57 15.95 16.70 19.52 19.98
'7".g.
Proj. 2°Nc
no 5.13 7.50 5.53 6.64 8.43 9.48 7.41 9.96 11.65 12.16 14.12 16.81 17.92 18.71
o 2.39 2.33 2.93 2.70 2.82 3.23 2.81 2.64 3.71 4.00 4.31 4.46 4.61 4.73
e 0.745 0.747 0.758 0.758 0.760 0.765 0.773 0.773 0.775 0.782 0.788 0.786 0.793 0.794
< mn > 6.89 10.04 7.30 8.76 11.09 12.39 9.59 12.93 15.03 15.54 17.92 21.39 22.60 23.56
Excitation Energy Partitioning in the Reaction 2°Ne + 2°sPb at 30 AMeV
B. Hurst, J. Boger, T. Botting, L. Cooke, D. O'Keily, W. Turmel, and R. P. Schmitt
We have recently performed an experiment to tele.,v-..opes were included to gather angular
study projectile-like fragments and neutrons produced distribution information on intermediate mass
in the reaction 30 AMeV 20Ne+2°spb. This fragments (IMF) and fission fragments (FF). These
particular system was selected to see if the neutron six telescopes covered an angular range of 30 ° to
multiplicity distributions could shed some light on the 150 ° degrees (30 °, 50 °, 60 °, 120 °, 130 °, and 150°).
origin of certain continuum structures reported in a Energy signals were recorded from each detector
variety of inelastic scattering experiments involving of the telescopes. The timing was determined by the
both low and intermediate energy heavy ion. 1 While first element. An event was triggered by the logi."al
these structures have sometk,_e.s _en cited as OR of the of particle telescope timing signals. The
evidence for multi-phonon excitations of giant relative timing between each telescope was also
resonances (GR) at high excitation energies, they recorded for each event to allow analysis of possible
have also been attributed to various sequential decay particle particle coincidences.
processes. 2 Since low neutron multiplicities; are expected for
The experiment used a self supporting I mg/cm 2 the more peripheral reactions, the contribution due to
2°spb target. Measurements of the kinetic energy background must be kept to a minimum. One way
and angular distributions of the various fragments this can be accomplished is by varying the counting
produced were made with an array of AE-E silicon and background gate widths. In-beam measurements
detectors. The reaction was carried out in the were made to determinean optimum gatewidthof40
scattering chamber of the neutron bali. The psec. With this gate width the average neutron
measurements were performed with the most forward background was found to be about 0.5 neutrons per
wedges of the neutron ball (which subtend +20 °) event. For a 40 psec gate width, Monte-Carlo
removed to facilitate the placement of particle calculations using a modified version of the code
detectors at small angles and also to insure that DENIS 3 predicts an overall efficiency of70-75_ for
neutrons emitted from the PLF will have a small 252Cfneutrons. The analysis of the data is currently
contribution to the total neutron multiplicity in progress.
distributions. (i.e., The neutrons are strongly
forward fi)cused and so they are not detected by the References
neutron ball.) The total neutron multiplicity
distribution should reflect the excitation energy 1. P. Chomaz et al., Z. Phys. A318, 41 (1984).
deposited in the target. Projectile-like fragments 2. D. Hilscher et al., Phys. Rev. C 20, 575 (1979).
(PLF) were detected using two triple-element, 3. J. Poitou, C. Signarbieux, Nucl. Instrum. 114,
charged particle telescopes. Both PLF telescopes 113 (1974).
consisted of one 300 and two 1000/zm thick surface
barrier transmission detectors collimated to 28.3ram 2.
These two telescopes were placed near the grazing
angle (01ab -- 10 °) at a distance of 35 and 11 cm
from the target. In addition to the two PLF
detectors, six more two-element charged particle
i-5
Reaction Dynamics in the Formation and the Decay of Hot Nucleiin 63Cu + Au at 35 AMeV
R.Wada, K. Hagel, R. Tezkratt, G.X. Dai, Y. Lou, D. Utley,B. Xiao, J. Li, N. Mdeiwayeh and J. B. Natowitz
How hot a nucleus can one make in heavy ion fragmentswere detected at 0 = -6° by a telescope
reactions? Whenthe incidentenergyof theprojectile with a large area Si stripdetector (4cm × 6cm, 7
increases, the nucleons behave more and more like strips) backed by 5mm Csl crystal detector.
free nucleonsand some of them emerge leaving little Intermediatemass fragmentswere detectedby four Si
energy inthecompositesystem. The distributionof telescopes at 15°, 30°, 45°, 60°, and two
the linear momentumtransferhas been studied in Ar Gas-ionization chamber-Si telescopes at 80° and
+ Au,Th reactionsfrom27 AMeV to 77 AMeV! and 120°. Two monitorSi detectors (A0 -- 5/zsr,2ram
leads to observations of the sharpdecrease in cross thick)were set at 0 = +2 ° to normalizeall measuredsection for fission events which have a folding angle cross sectionsto the Rutherfordscattering. The cross
near that expected for centralcollisions. This was sections presentedbelow aregiven in absolute units.
interpretedas a limit to the excitation energy of the In this report we focus on the heavy fragments
compoundnucleus at 600-700 MeV. On the other measuredat 0 = 6° in coincidencewith the neutronhand the average neutronmultiplicity, measured in multiplicity.
the same experiment, steadily increases with CU+AU _t 35 AMeVincreasing incidentenergy, at least from 27 AMeV
.... ' I ' I ' I ' I
to 44 AMeV. This may suggest that the hot ]composite system with high neutron multiplicity 6.0
decays by channelsother than fission. In fact fission ×
decay channelsare significantlyhinderedat the high .4-,c::::/,..0
time of nuclear matter.2,3 This may change the (.3
decay processes of hotnuclei drastically. 2.0
In order to pursue this problemdifferent decay ×channels were observed in coincidence with the 0.0 '
0 10 20 30 /,.0
associated neutronmultiplicityin 63Cu + 197Auat 35 MnAMeV. The experimentwas performedat the Texas
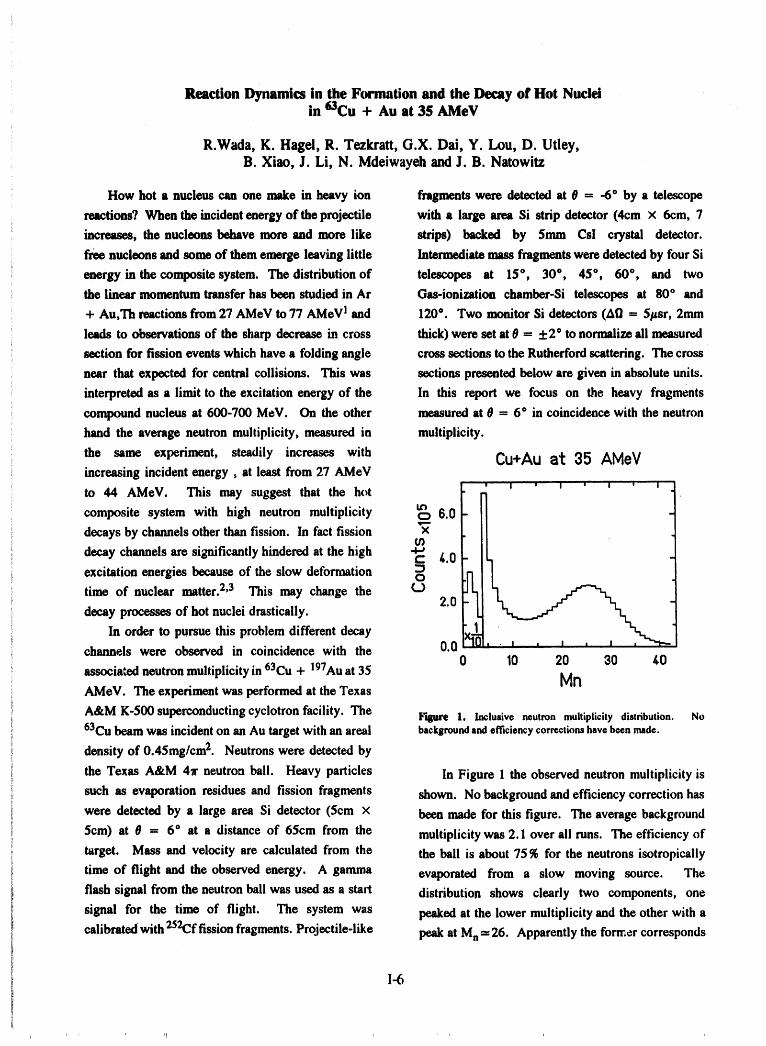
A&M K-500 superconductingcyclotronfacility. The FiBre 1. Inclusiveneutronmultiplicitydistribution.No63Cubeamwas incidenton an Au targetwithan areal backgroundand efficiency correctionshavebeenmade.
density of 0.45mg/cm2. Neutronswere detected by
the Texas A&M 4_r neutronball. Heavy particles In Figure 1 the observed neutronmultiplicityis
such as evaporation residues and fission fragments shown. No backgroundandefficiency correctionhas
were detected by a large area Si detector (hcm x been made for this figure. The averagebackground
5cm) at 0 = 6° at a distance of 65cm from the multiplicitywas 2.1 over all runs. The efficiency of
target. Mass and velocity are calculated from the the ball is about 75 % for the neutrons isotropically
time of flight and the observed energy. A gamma evaporated from a slow moving source. The
flash signal from the neutronball was used as a start distribution shows clearly two components, one
signal for the time of flight. The system was peakedat the lower multiplicityand the other with a
calibratedwith252Cffissionfragments.Projectile-like peakat Mn= 26. Apparentlythe forn:ercorresponds
I-6
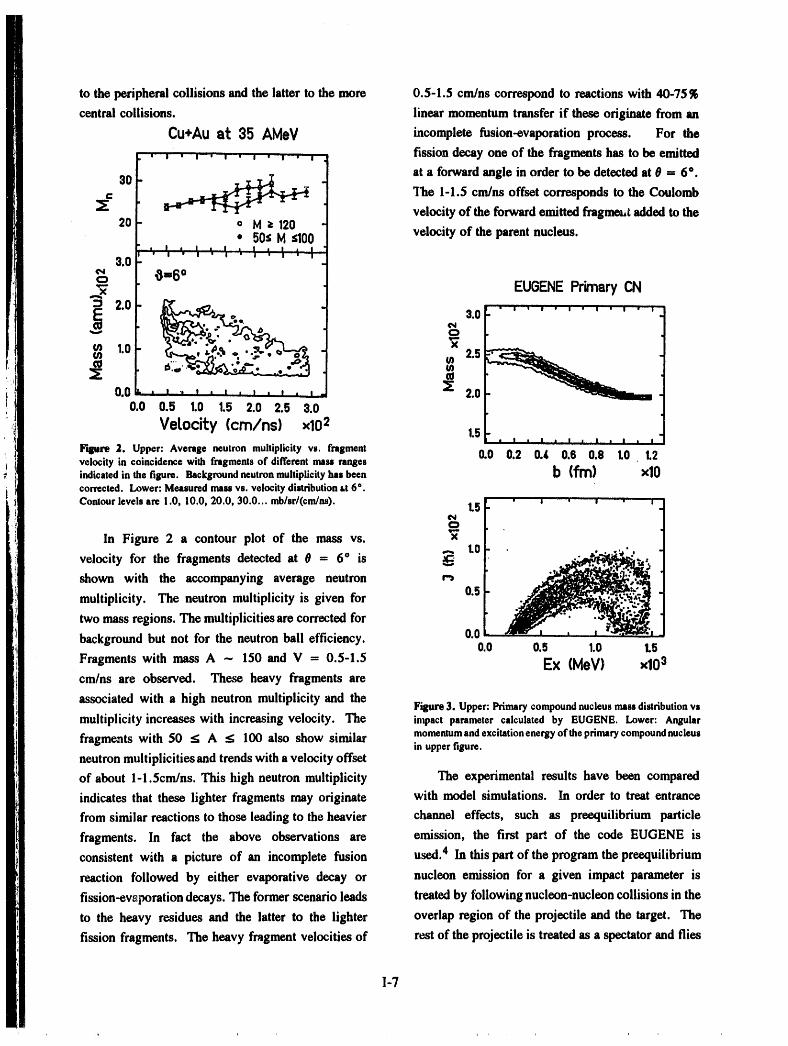
to the peripheral collisions and the latter to the more 0.5-1.5 cm/ns correspond to reactions with 40-75%
central collisions, linear momentum transfer if these originate from an
Cu+Auat 35 AMeV incomplete fusion-evaporation process. For the
. , . , . , . , . , . , fission decay one of the fragments has to be emitted
30 .rT_ at a forward angle in order to be detected at 0 = 6 °.
,. _ The 1-1.5 cmdns offset corresponds to the Coulomb_" velocity of the forward emitted fragmeut added to the20 o M > 120
• 505 M sl00 velocity of the parent nucleus.• . I . I a I , I . I I II • I • I ' I ' I ' I • I
3.0-,",, ,Offi6o
._ EUGENEPrimaryCN
o,0E 3.0t_ b 0
= 1.o _'__" ""__
Z =0.0 , , , J , I , I , ! , , _E 2.0
0,0 0.5 1.0 1.5 2.0 2.5 3.0
VeLocity (cm/ns) xlO 2 t5
Figure 2. Upper: Average neutron multiplicity vs. fragment 0.0 0.2 0.4 0.6 0.O t0 1.2vales:Sty in coincidence with fragments of different mess rangesindicated in the figure. Background neutron multiplicity has been b (fro) xl0corrected. Lower: Measured mass vs. velocity distribution tt 6 °.
Contour levels are 1.0, 10.0, 20.0, 30.0... mblsrl(cndns). 1.5 " ' ' ' " '¢q
In Figure 2 a contour plot of the mass vs. "x
velocity for the fragments detected at 0 = 6 ° is _ - _,
shown with the accompanying average neutron
multiplicity. The neutron multiplicity is given for 0.5
two mass regions. The multiplicities are corrected for0.0
background but not for the neutron ball efficiency. 0.0 0.5 1.0 1.5
Fragments with mass A ~ 150 and V = 0.5-1.5 Ex (MeV) xlO 3cm/ns are observed. These heavy fragments are
associated with a high neutron multiplicity and theFigure 3. Upper: Primary compound nucleus mass distribution vs
multiplicity increases with increasing velocity. The in)pact parameter calculated by EUGENE. Lower: Angular
fragments with 50 < A _ 100 also show similar momentumandexcitation energy of the primary compound nucleusin upper figure.
neutron multiplicities and trends with a velocity offset
of about 1-1.5cm/ns. This high neutron multiplicity The experimental results have been compared
indicates that these lighter fragments may originate with model simulations. In order to treat entrance
from similar reactions to those leading to the heavier channel effects, such as preequilibrium particle
fragments. In fact the above observations are emission, the first part of the code EUGENE is
consistent with a picture of an incomplete fusion used. 4 In this part of the program the preequilibrium
reaction followed by either evaporative decay or nucleon emission for a given impact parameter is
fission-evaporation decays. The former scenario leads treated by following nucleon-nucleon collisions in the
to the heavy residues and the latter to the lighter overlap region of the projectile and the target. The
fission fragments. The heavy fragment velocities of rest of the projectile is treated as a spectator and flies
]-7
away with little energy dissipation. The properties of dependent level density parameter. In the following
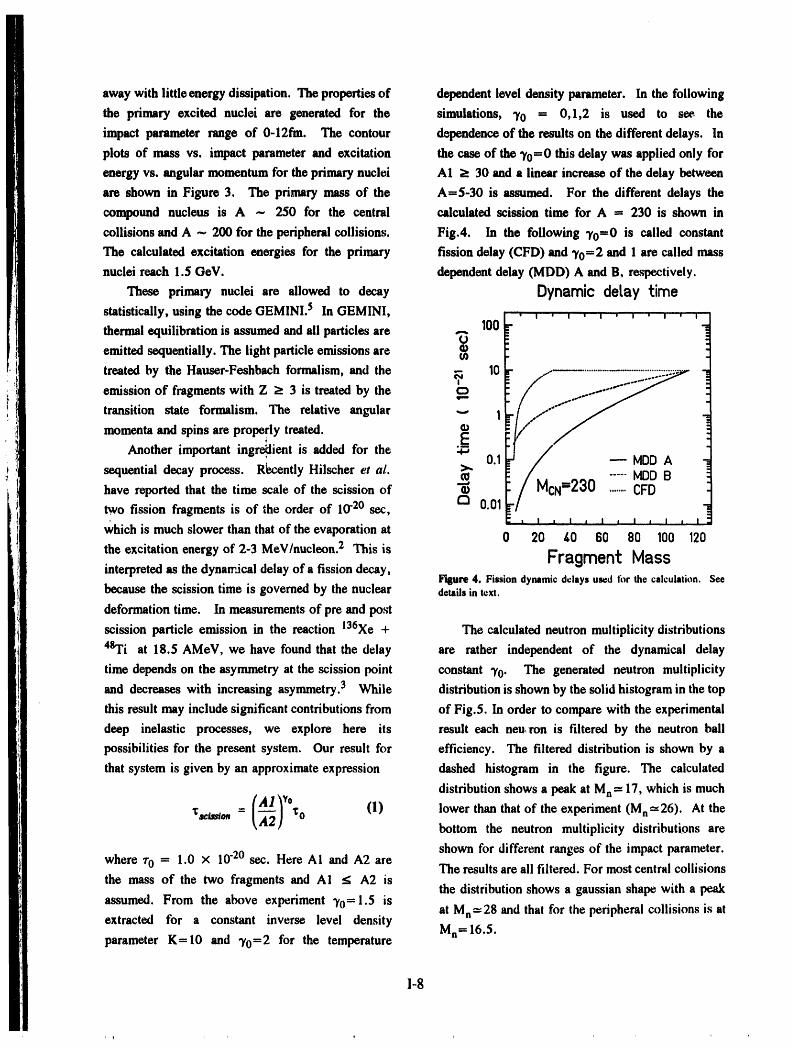
the primary excited nuclei are generated for the simulations, 3'0 = 0,1,2 is used to see the
impact parameter range of O-12fm. The contour dependence of the results on the different delays. In
plots of mass vs. impact parameter and excitation the case of the 70=0 this delay was applied only for
energy vs. angular momentum for the primary nuclei AI > 30 and a linear increase of the delay between
are shown in Figure 3. The primary mass of the A=5-30 is assumed. For the different delays the
compound nucleus is A -, 250 for the central calculated scission time for A = 230 is shown in
collisions and A -, 200 for the peripheral collisions. Fig.4. In the following Y0=O is called constant
The calculated excitation energies for the primary fission delay (CFD) and 3,0=2 and 1 are called mass
nuclei reach 1.5 GeV. dependent delay (MDD) A and B, respectively.
These primary nuclei are allowed to decay Dynamic detay timestatistically, using the codeGEMINl. 5 In GEMINI, .... , , , , _ , , , , , ,
emitted sequentially. The light particle emissions are ,,,
treated by the Hauser-Feshbach formalism, and the
emission of fragments with Z _ 3 is treated by the
transition state formalism. The relative angular 1L=-/..,..."'_
momenta and spins are properly treated. _ _/ / :
Another important ingr_ient is added for the 2_ 0.1_ / .._ ..-_..._M4_D;-- MDD A "-=sequentialdecay process. R_ently Hilscher et al. _" ..... MDD Bhave reported that the time scale of the scissionof "_ [; / MCN=Z_U ..-..-.CFD
two fission fragmentsis of the order of 10.20 sec, t-t 0.01
which is much slower than thatof the evaporationat 0 20 _0 60 80 100 120
the excitationenergy of 2-3 MeV/nucleon.2 This is Fragment Massinterpreted as the dynamical delayof a fissiondecay,
i_re 4. Fissiondynamicdelaysusedfor thecalculation.Seebecause the scission time is governed by the nuclear details in text.
deformation time. In measurements of pre and post
scission particle emission in the reaction 136Xe + The calculated neutron multiplicity distributions
48Ti at 18.5 AMeV, we have found that the delay are rather independent of the dynamical delay
time depends on the asymmetry at the scission point constant Y0. The generated neutron multiplicity
and decreases with increasing asymmetry. 3 While distribution is shown by the solid histogram in the top
this result may include significant contributions from of Fig.5. In order to compare with the experimental
deep inelastic processes, we explore here its result each neu,ron is filtered by the neutron ball
possibilities for the present system. Our result for efficiency. The filtered distribution is shown by a
that system is given by an approximate expression dashed histogram in the figure. The calculated
distribution shows a peak at Mn= 17, which is much
= (A1/'°_=iss/on _'_] _0 (1) lower than that of the experiment (Mn=26). At thebottom the neutron multiplicity distributions are
shown for different ranges of the impact parameter.where lr0 = 1.0 × 10⁻²⁰ sex:. Here AI and A2 are The results are all filtered. For most central collisionsthe mass of the two fragments and AI < A2 is
the distribution shows a gaussian shape with a peakassumed. From the above experiment Y0=l.5 is
at Mn-'28 and that for the peripheral collisions is at
extracted for a constant inverse level density Mn=16.5.parameter K=10 and 30=2 for the temperature
I-8
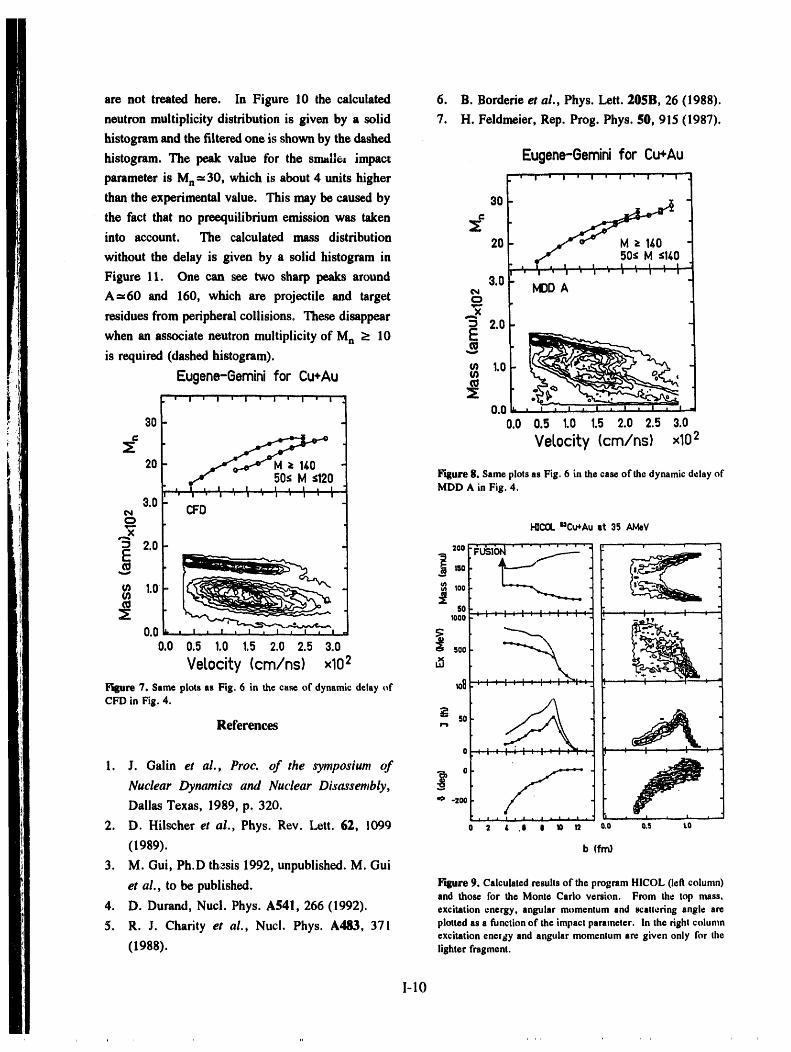
experimental results are underway.EUGENE-.GE]d]J_Cu+Au st 35 AldeV
Eugene-Geminifor Cu+Au00oo- No delays0oo FiLtered s0
¢oooc,) 20
20000 3.0-
¢., No DeLayc_
sooo -- b=0-/,fm= _ -- b=/,-8fm = 2.0
8 1.o2000, O_
°o Io 20 so .Lo 50 0.0Mn 0.( 0.5 1.0 1.5 2.0 2.5 3.0
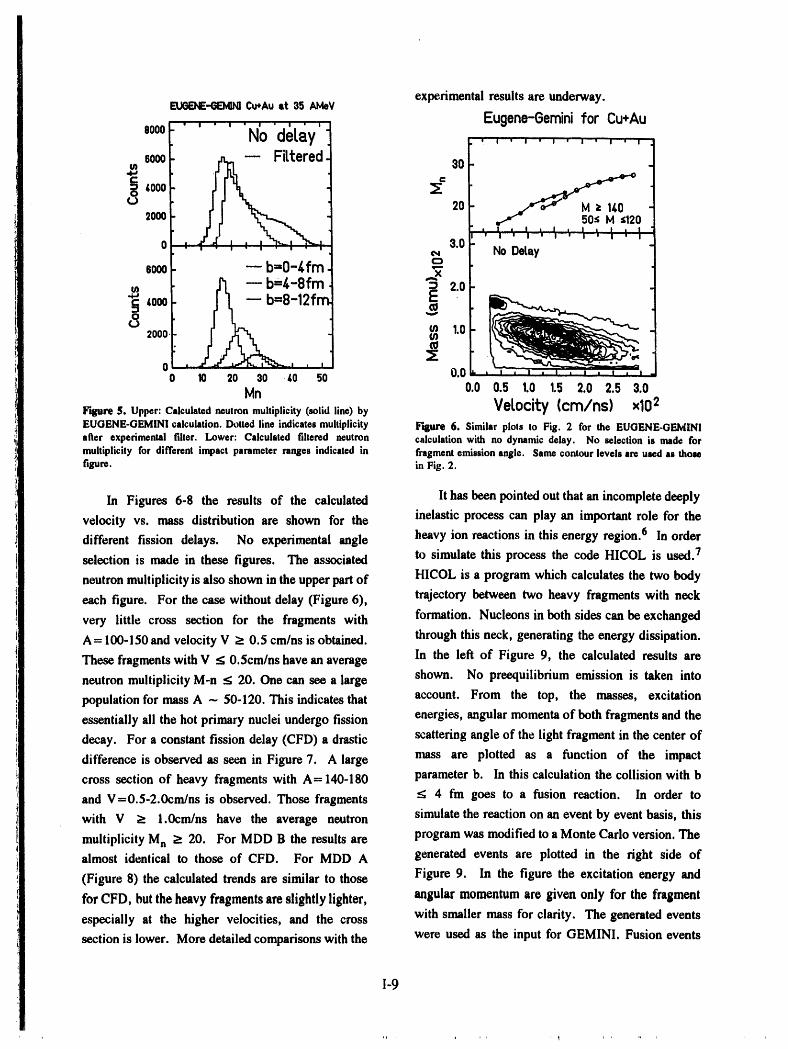
F'Ngure 5. Upper: Calculated neutron multiplicity (solid line) by VeLocity (cm/ns) xl02EUGENE-GEMINI calculation. Dotted line indicates multiplicity Figure 6. Similar plots to Fig. 2 for the EUGENE-GEMINIaller experimental filter. Lower: Calculated filtered neutron calculation with no dynamic delay. No selection is made formultiplicity for different impact parameter ranges indicated in fragment emission angle. Same contour levels are used as thosefigure, in Fig. 2.
In Figures 6-8 the results of the calculated It has been pointed out that an incomplete deeply
velocity vs. mass distribution are shown for the inelastic process can play an important role for the
different fission delays. No experimental angle heavy ion reactions in this energy region. 6 In order
selection is made in these figures. The associated to simulate this process the code HICOL is used. 7
neutron multiplicity is also shown in the upper part of HICOL is a program which calculates the two body
each figure. For the case without delay (Figure 6), trajectory between two heavy fragments with neck
very little cross section for the fragments with formation. Nucleons in both sides can be exchanged
A= 100-150 and velocity V > 0.5 cm/ns is obtained, through this neck, generating the energy dissipation.In the left of Figure 9, the calculated results areThese fragments with V < 0.5cm/ns have an average
neutron multiplicity M-n < 20. One can see a large shown. No preequilibrium emission is taken into
population for mass A --- 50-120. This indicates that account. From the top, the masses, excitation
essentially all the hot primary nuclei undergo fission energies, angular momenta of both fragments and the
decay. For a constant fission delay (CFD) a drastic scattering angle of the light fragment in the center of
difference is observed as seen in Figure 7. A large mass are plotted as a function of the impact
cross section of heavy fragments with A-140-180 parameter b. In this calculation the collision with b
and V=O.5-2.0cm/ns is observed. Those fragments < 4 fm goes to a fusion reaction. In order to
with V > l.Ocm/ns have the average neutron simulate the reaction on an event by event basis, this
multiplicity Mn > 20. For MDD B the results are program was modified to a Monte Carlo version. Thealmost identical to those of CFD. For MDD A generated events are plotted in the right side of
(Figure 8) the calculated trends are similar to those Figure 9. In the figure the excitation energy and
for CFD, but the heavy fragments are slightly lighter, angular momentum are given only for the fragmentwith smaller mass for clarity. The generated eventsespecially at the higher velocities, and the cross
section is lower. More detailed comparisons with the were used as the input for GEMINI. Fusion events
I-9
are not treated here. In Figure 10 the calculated 6. B. Borderie et al., Phys. Lett. 205B, 26 (1988).
neutron multiplicity distribution is given by a solid 7. H. Feldmeier, Rep. Prog. Phys. 50, 915 (1987).
histogram and the filtered one is shown by the dashed
histogram. The peak value for the small°, impact Eugene-Geminifor Cu+Auparameter is Mnffi30, which is about 4 units higher ' , ' , ' , ' , ' ' ' ,
than the experimental value. This may be caused by 30 _ __
the fact that no preequilibrium emission was taken :_ __ t_'4r"into account. The calculated mass distribution 20without the delay is given by a solid histogram in .I" 50< M ':140
* I i I i I i I , l _ l_' I ' I ' ! ' I ' I ' I
Figure 11. One can see two sharp peaks around 8.0
A=60 and 160, which are projectile and target _c_ MDDA
residues from peripheral collisions. These disappear ._x 2.0
is required (dashed histogram). ""m 1.0
Eugene-0emini for Cu+Au
L I i I * I , I" ' I ' ' I ' I ' I""' ' I " " I
0,0 , i , I
30 0.0 0.5 1.0 1.5 2.0 2.5 3.0
= _ VeLocity(cm/ns) xl0 2
=1,o2O,,_ 50:; M s120 F_ure 8. Same plots as Fig. 6 in the case of the dynamic delay of, , , , , , I , I , I MDDAinFig. 4.
3.0[' " ' " ' ' ' ' ' ' ' ' '¢_ C_'D,'- I-gCI3t.UCu*Au at 35 AMaV
x
=E :_2'0 2°0-_u_IN_" "_'-
U) 1.0 _oo(,/)
_ SOlo00 -: " : : : : : " : : : : : = t _ : :
0.0 0.5 1.0 1.5 2.0 2.5 3.0 _o0
VeLocity(cm/ns) xl0 2 ,,=i
Figure 7. Same plots as Fig. 6 in the case of dynamic delay of toe _ ; : • • ,- : : , , , : -
References _,
I I I , , , , • . • , : ; . • , : ,
Nuclear Dynamics and Nuclear Disassembly,
Dallas Texas, 1989, p. 320. "_ -200, ! = , , , i , it , i , • ,
2. D. Hilscher et al., Phys. Rev. Lett. 62, 1099 0 2 t .l I 10 n 0.0 o.s t0
(1989). b (f_
3. M. Gui, Ph.D thesis1992, unpublished.M. Gui
et al., to be published, i_ure 9. Calculated results of the program HICOL (left colunm)and those for the Monte Carlo version. From the top mass,
4. D. Durand, Nucl. Phys. A541, 266 (1992). excitation energy, angularmomentumand scattering angle are
5. R. J. Charity et al., Nucl. Phys. A483, 371 plotted as a funetion of the impact parameter. Intherlghtcolunmexcitation enelgy and angular momentum are given only for the
(1988). lighter fragment.
1-10
HICOLCu+Auat 35 AMeV HICOLCu+Auat 35 AMeV
' ' ' '' ' "' ' ' ooH' 'U' ' ' ' 'No delay H _/ No delay
2000 ..... Filtered _ sooW l_ -- ALL4oe--
0 , "t , I I I I I ___ t 0 II I ' I I I_-_'--_] _111 I0 10 20 30 _.0 50 0 50 _00 _50 200
Mn Mass (amu)
Figure 10. Calculated neutron muitiplioity for the program Figure 11. Calculated mass spectrum for HICOL-GEMINlwith noHOCOL-GEMINi. The filtered multiplicity is shown by a dashed dynamic delay. No selection for the emission angle of the
line. No fission dynamic delay is assumed, fragment is made. Dashed line is indicated for those with theassociate neutron multiplicity > 10.
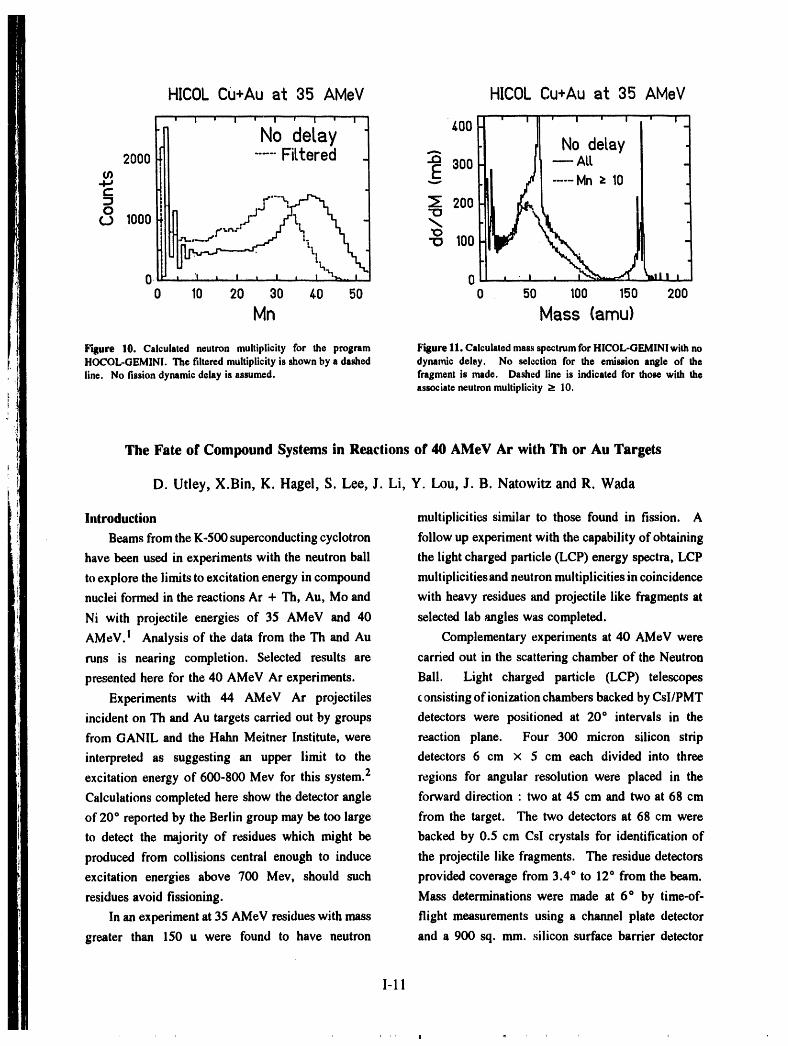
The Fate of Compound Systems in Reactions of 40 AMeV Ar with Th or Au Targets
D. Utley, X.Bin, K. Hagei, S. Lee, J. Li, Y. Lou, J. B. Natowitz and R. Wada
Introduction multiplicities similar to those found in fission. A
Beams from the K-500 superconducting cyclotron follow up experiment with the capability of obtaining
have been used in experiments with the neutron ball the light charged particle (LCP) energy spectra, LCP
to explore the limits to excitation energy in compound multiplicities and neutron multiplicities in coincidence
nuclei formed in the reactions Ar + Th, Au, Mo and with heavy residues and projectile like fragments at
Ni with projectile energies of 35 AMeV and 40 selected lab angles was completed.
AMeV.I Analysis of the data from the Th and Au Complementary experiments at 40 AMeV were
runs is nearing completion. Selected results are carried out in the scattering chamber of the Neutron
presented here for the 40 AMeV Ar experiments. Ball. Light charged particle (LCP) telescopes
Experiments with 44 AMeV Ar projectiles consisting of ionization chambers backed by Csl/PMT
incident on Th and Au targets carried out by groups detectors were positioned at 20 ° intervals in the
from GANIL and the Hahn Meitner Institute, were reaction plane. Four 300 micron silicon strip
interpreted as suggesting an upper limit to the detectors 6 cm × 5 cm each divided into three
excitation energy of 600-800 Mev for this system. 2 regions for angular resolution were placed in the
Calculations completed here show the detector angle forward direction : two at 45 cm and two at 68 cm
of 20 ° reported by the Berlin group may be too large from the target. The two detectors at 68 cm were
to detect the majority of residues which might be backed by 0.5 cm CsI crystals for identification of
produced from collisions central enough to induce the projectile like fragments. The residue detectors
excitation energies above 700 Mev, should such provided coverage from 3.4 ° to 12° from the beam.
residues avoid fissioning. Mass determinations were made at 6 ° by time-of-
In an experiment at 35 AMeV residues with mass flight measurements using a channel plate detector
greater than 150 u were found to have neutron and a 900 sq. mm. silicon surface barrier detector
1-11
separated by a 125 cm flight path. Detector lead to excitation energies of 715 MeV for the gold
responses were determined using Cf-252 (alphas, case and 870 MeV for the thorium case. The_
fission fragments and neutrons), Am-241 (aiphas), values are mean values. As will be discussed later,
Gd-148 (alphas), and a Ta-181 beam degraded and excitation energies in excess of 1000 MeV are
scattered by gold and/or aluminum foils, suggested in some events for the residues from the
thorium target.! ,,, , ,L
Table !. Summaryfor 40 AMeV Ar Beams on Gold and Velocityvs MassDistributionThoriumTargets
_00 ............ I .......... I ....... I -T,_ ^. _ a Ar + Th
Average Fission Residue Fission Residue x 4_0
Values
<Mass> 82 142 103 164 _ _'(,,,, , 300 _._ _.._.
<L,b 146 57 143 69Energy> ' _ i_,o .... _:_!_!_...... ",_, ,...:_:_,_-_,,
All values are averagevalues. Neutron multiplicitiesarebackgroundcorrected,but notefficiencycorrected.
, , , ,,, ................ Mass (arnu)
Summary of Results F'qlure 1. Contour plot of particle mass vs. lab velocity at 6 ° inAverage values of the fission and residue the lab, 40 AlvleV Ar _-Au: Light particles and intermediate mass
fragments are to the left, fission frsgments peak near 100 ainu,characterizations are listed in Table I. Lab energies, residues peaknear150.
average neutron multiplicities, the derived particle
masses, linear momentum transfer (LMT) and Lab Velocity of the Particle
excitation energies for 40 AMeV Ar incident on Th Contour plots for the detected particle lab
and Au targets are given for comparison. Mean velocity versus the particle mass are shown in Fig.
fission fragment masses are roughly 60% of the mass 1 for the Au target and in Fig. 2 for the Th target.
of the residues in both cases. The average mass in Particle masses are determined from the time-of-flight
the Au case is 20 amu less than the respective masses and the eaergy of the detected particle. Suitable
in the Th case, reflecting the lower mass of the corrections for pulse height defect in the energy5 and
target. An estimate of linear momentum transfer plasnv, delay in the timing have been made. In both
(LMT) based on the listed average values would lead plots residues, fission fragments and lighter particles
to LMTs of 55 % for the gold target and 65 % for the are clearly recognizable. The detector was located at
thorium target. Systematics for a 40 AMeV 6 ° from the beam.
projectile would suggest a slightly higher percent In Fig. 1 light particles and projectile like
LMT in the range of 70%. 3 fragments are seen at low mass, A less than 50.
The neutron numbers listed are corrected for Fission fragments are found in the mass range from
background and efficiency. Efficiencies are with approximately 50 to 120. Residues are those events
respect to the Cf-252 neutrons. Actual efficiencies with mass greater than 120. The results for the Th
may be somewhat lower for a moving hot neutron target are given in Fig. 2. Here the three classes of
source. A fact that would lead to slightly higher events are still clearly separable. The yield of
neutron numbers. 4 residues is noticeably less in this case illustrating the
Estimates derived from the LMT values would increase in fissionability of the compound system
1-12
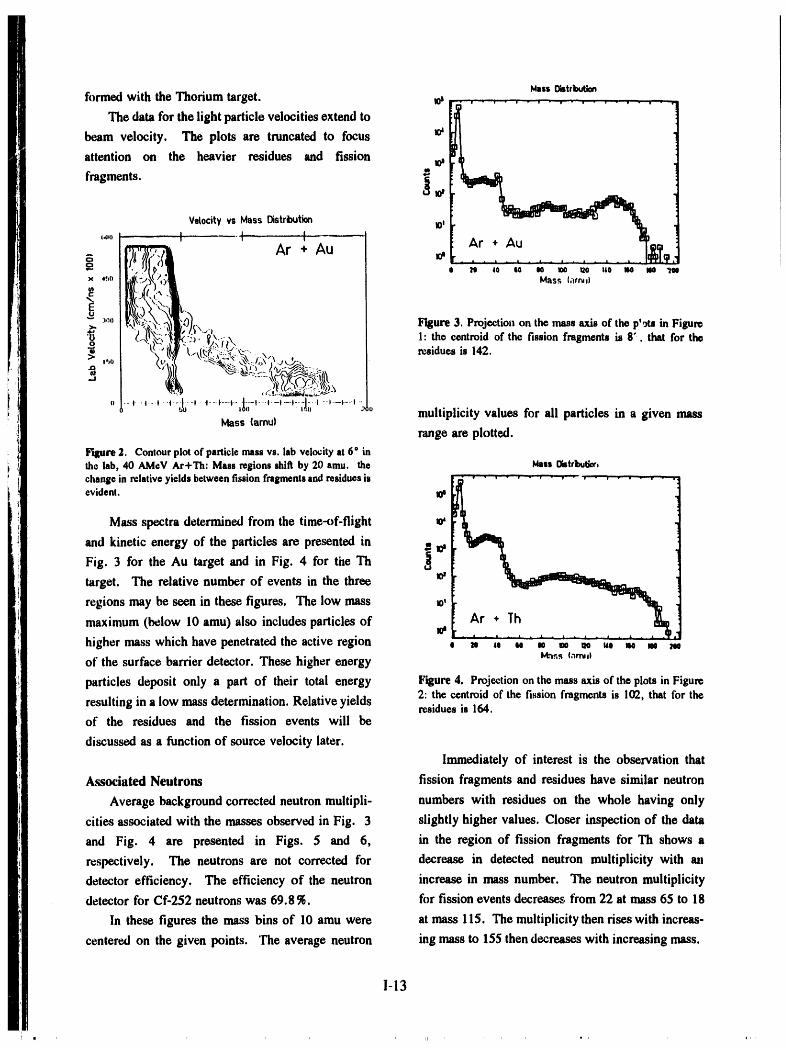
MassI_strixAJonformed with the Thorium target. _s
The data for the light particle velocities extend to
beam velocity. The plots are truncated to focus
attention on the heavier residues and fission Io
fragments. _
Vetecity vs Mass Distribution m'
IAr + Au o
•" 0 /O tO tO II0 IOo 120 I1,0 _ _ "LOllx 4:m Mas._(art.j)
"- :,oo Figure 3. Projectionon the massaxis of the p'_ts in Figure
<_..tt+.',::.'+:_.i-+,._+++ I: the eentroid of the fission fragments is 8?+ that for thet++\tt_.:-i_:.N.+;_..+\:.., residuesis142.
> '"') _X_ "-_'_"_,.x+.-./2('.:,,._-,,
,,*-++,--+o.-+--;lo.-_.,-.-*+--_.-li;-,-+-,--0--_:-;_+.._--,--,.--,_+,o multiplicityvaluesforallparticlesina givenmassMass lamu)
range are plotted.
l_t, ure _. Contour plot of particle massvs. lab velocity at 6 ° inthe lab, 40 AMeV Ar+Th: Mass regions shift by 20 ainu. the I_ss Oistrbu6o¢,change in relative yields between fission fragments and residues is .....• ...... '.... , .... • ....
evident. 10sI
Mass spectra determined from the time-of-flight
and kinetic energy of the particles are presented in _
Fig. 3 for the Au target and in Fig. 4 for the Th
target. The relative number of events in the three m,
regions may be seen in these figures. The low mass _,
maximum (below 10 amu) also includes particles of 10'higher mass which have penetrated the active region s _ ,o _ ,o m _o u0 _, m m
of the surface barrier detector. These higher energy _-,s (,_._,_
particles deposit only a part of their total energy Figure 4. Projectionon the massaxisof the plotsin Figure2: the centroid of the fission fragments is IO2, that for the
resulting in a low mass determination. Relative yields residuesis 164.of the residues and the fission events will be
discussed as a function of source velocity later.
Immediately of interest is the observation that
Associated Neutrons fission fragments and residues have similar neutron
Average background corrected neutron multipli- numbers with residues on the whole having only
cities associated with the masses observed in Fig. 3 slightly higher values. Closer inspection of the data
and Fig. 4 are presented in Figs. 5 and 6, in the region of fission fragments for Th shows a
respectively. The neutrons are not corrected for decrease in detected neutron multiplicity with an
detector efficiency. The efficiency of the neutron increase in mass number. The neutron multiplicity
detector for Cf-252 neutrons was 69.8 %. for fission events decreases from 22 at mass 65 to 18
In these figures the mass bins of 10 amu were at mass 115. The multiplicity then rises with increas-
centered on the given points. The average neutron ing mass to 155 then decreases with increasing mass.
1-13
1' in
NEUTRONSINCONW MASS RELATIVEYIELD AI" fl DEGREES' • ' • • ' • +" "_ • ! " i ! "-''I -- !| I , ! • - • i • • ! • | • I • i • | • !
_ 20 K_
ILlZ !; I A FISNONo: u '.'] so t] r_s_uEst)
_U 12 c,t !4O
'-"=" Au
= Ar+o 2o
6
o 20 ,lo eo 8o m 12o v,o 16o oj o.,¢ o.s o., to 1.2 LI LSMASS(amu) SOURCEVELOCITY(CM/NSEC)
Figure$. Average neutronn, dtipficitie,s in ¢oineid©nccwith Figure 7. Yield of fragmentsby sourcevelocity: goldtarget,particlemass. Errorbarsaretl_ errore,stimatosof themean fission fragmentsourcevelocitiesam correctedforCoulombvalues. Ar + Au repulsionassumingsymmetricfission.
NEUIRONS INCONW MASS24 - • , ". , "' • , ' '.' , '"+ , ; , ' , • _ '"+ .
2z _ )_TtT in Figure 7 and Figure 8. The source velocity of the
20 I'_ __'_ residues is taken to be the lab velocity. The source_o "?-_ velocity for the fission fragments is calculated by
-_ m subtracting the fission fragment velocity determinedLUZn, _ using Viola systematics 6 from the observed laboratory
,z Ar +Th velocity. The source velocity for fission fragments is
_ m then the source velocity of the fissioning system.ms ;a. j The residue yields in the Th case have been further
s E_ "_, separated into two mass ranges: masses 140 to 160, t • . t , s • t .,t | • * • _| _
ZO (O SO SO 100 120 It0 160 leo (RESLOA), and mass greater than 160 (RESHI).MASS (amul
For the Ar + Th case the yields are dominated by
i_ure 6. Av©rageneutronmultiplicitiesincoincidencewith fission at all sourcevelocities. The vast majority ofparticlemass. Errorbarsare theerrorestimatesof themeanvalues. Ar + Th the fission fragments are associated with slower
source velocities and thus are most likely formed in
Similar trends are seen for residues and fission collisions with larger impact parameters. In the plot
fragments in the Ar + Au case. it is seen that residue cross section peaks a+.a source
The higher velocities and the higher associated velocity near 0.9 cm/ns. When the low residue mass
neutron multiplicitieswith decreasing mass separately region is compared to the high residue mass region
seen for each class of events would be consistent for the Th residues it is seen that the lower mass
with the lighter mass products in both classes being residues result from collisions with larger momentum
produced in more central collisions (i.e. the lower the transfers as indicated by a higher source velocity.
mass within each class, the smaller the impact The plot for the Ar + Au ca_ illustrate the
parameter), larger relative yield of residue production for the
lower mass target. Fission dominates for the slower
Relative Yields sources interpreted to result from the most peripheral
Relative yields at 6 ° for fission fragments and collisions as indicated by the low source velocities.
residues as a function of source velocity are presented Residue production begins to compete effectively by
1-14
!
RELA]IVEYIELDAI'6 DEGREES Conclusions
_o Similar neutron numbers prevent neutron
•e m At +T1"1 multiplicities from distinguishing between reactions
leading to fission or residue formation. Source
p too v ns_4or4 velocities and trends in the neutron multiplicityo r_aM_ suggest the residues (in the case of the Th target)
o _o z-.-......__ u ._u^ result from the more central collisions with higher
__ -"_ excitation energy. Within both fission and residue
groups higher neutron multiplicities are associated
me _ with lower detected particle mass.o.s o.e 0.7 o., o.t t.o tt tz t_ L_ t.s
S(X_CEVELOCITY(CM/NSEC) References
Figure 8. Yield of fragmentsby sourcevelocity: Thoriumtarget;RESLOA, 140 to 160; RESHIA,above 160. 1. D. Utley, X. Bin, M. Gui, K. Hagel, Y. Lou, J.
Natowitz and R. Wada, Progress in Research,
1991-1992, Cyclotron Institute, TAMU, p. 13.
0.5 cm/ns and is favored over fission above 0,7 2. U. Jahnke, B. Cramer, G. Ingold, E.Schwinn,
cm/ns. 1989 Annual Report, Hahn Meitner Instit1"_e,
While excitation energies of 700 MeV and 800 Berlin, 1989.
MeV for the Au target and the Th target are implied 3. J. C. Hagel, Ph. D. Thesis, Texas A&M
by the average LMT, collisions resulting in the mass University, 1986.
transfer needed to achieve the source velocities in 4. S.S. Datta, Ph. D. Thesis, Punjab University,
these figures are expected to result in excitation 1987.
energies for the more central collisions in the range 5. S.Kaufman, E.Steinberg, B.Wilkins, J.Unik, and
of 1000 MeV. A.Gorski, 1974, Nuci. Inst. and Meth. llS, 47.
6. V.E. Viola, K. Kwiatkowski, and M. Walker,
1985, Phys. Rev. C 31, 1550.
1-15
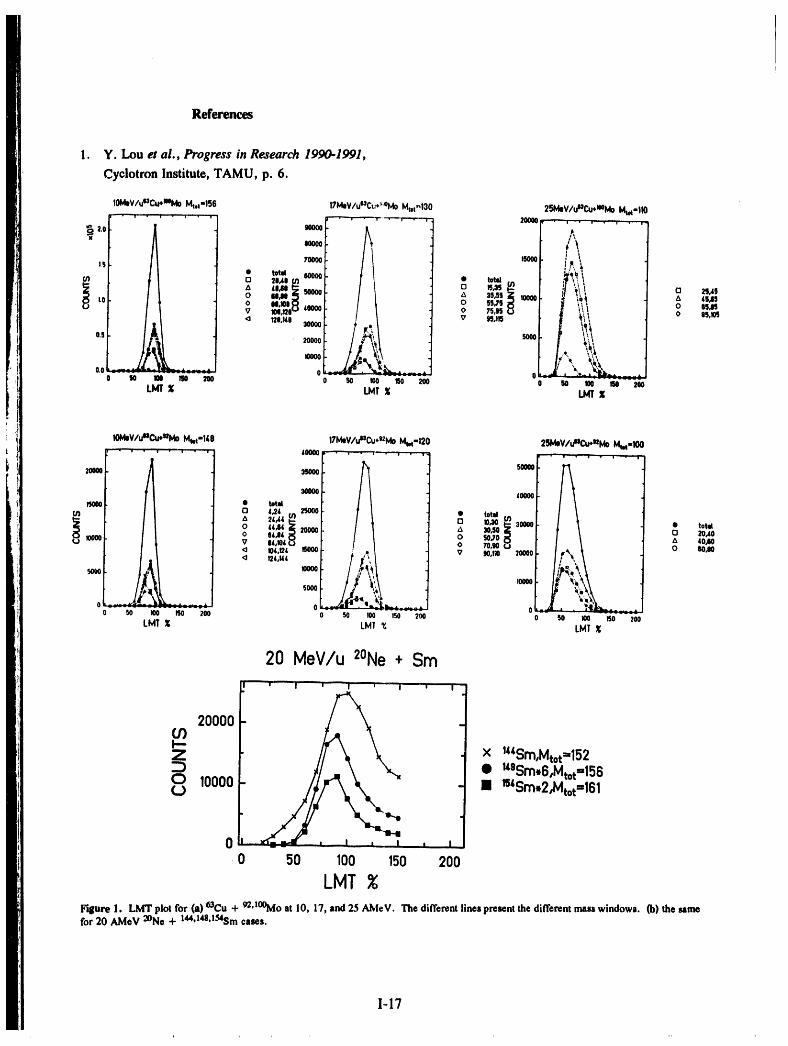
Fission in the Reactions of 63Cu + l°°,_Mo at 10, 17 and 25 AMeVand 2°Ne + 144,148,154Sm at 20 AMeV
Y. Lou, L. Cooke, T. Botting, M. Gonin, M. Gui, K. Hagel, B. Hurst, D. O'Kelly, G. Mouehaty,J. B. Natowitz, R. P. Schmitt, W. Turmel, D. Utley, R. Wada, B. Burch*, M. E. Brandan _,
D. Fabris*, F. GramegnaJ, A. Menchaea-Rocha_, G. Nebbia*, M. Poggi t, J. RuizQ, and G. Viesti t
To study hot excited nuclei with A _ 160 having In Fig. l(a) we show the Linear Momentum
different proton to neutron ratios, we have analyzed Transfer Distributions for the Cu + Mo cases for
the data on fission and light particle decay for the different fragment mass windows. Fig. l(b) shows
reactions 63Cu q 92,1°°Mo at bombarding energies of the same for the Ne + Sm cases.
10, 17, and 25 AMeV, and 2°Ne + 144,148,154Smat Simulations I show that the widths ot the LMT
a bombarding energy of 20 AMeV. These were distributions are primarily due to light particle
carried out at the K500 Cyclotron using the TAMU evaporation. This accounts for the spread to apparent
neutron ball. ! LMt _ 100%. For the 25 AMeV cases, the peak
To characterize the fission events based on the position is lower than expected since the experimental
energies and the detected angles of the fragments we set up just covered the low LMT part of the
apply momentum conservation at the scission point, distribution.
We assume the light particle evaporation is symmetric The total neutron multiplicities are determined
before and after the scission point, so that the using the neutron ball triggered by fission fragment
velocities of the compound nucleus and the fission detection. Excitation energies corresponding to the
fragments will not change. Assuming the total mass most probable LMT were calculated assuming 85 %
is Mtot at the scission point, we can get the fission LMT for the 20 AMeV 2°Ne+ 144'!48"!54Sm and
fragment masses mI and m2. 100%, 90%, and 80% LMT for 10, 17, and 25
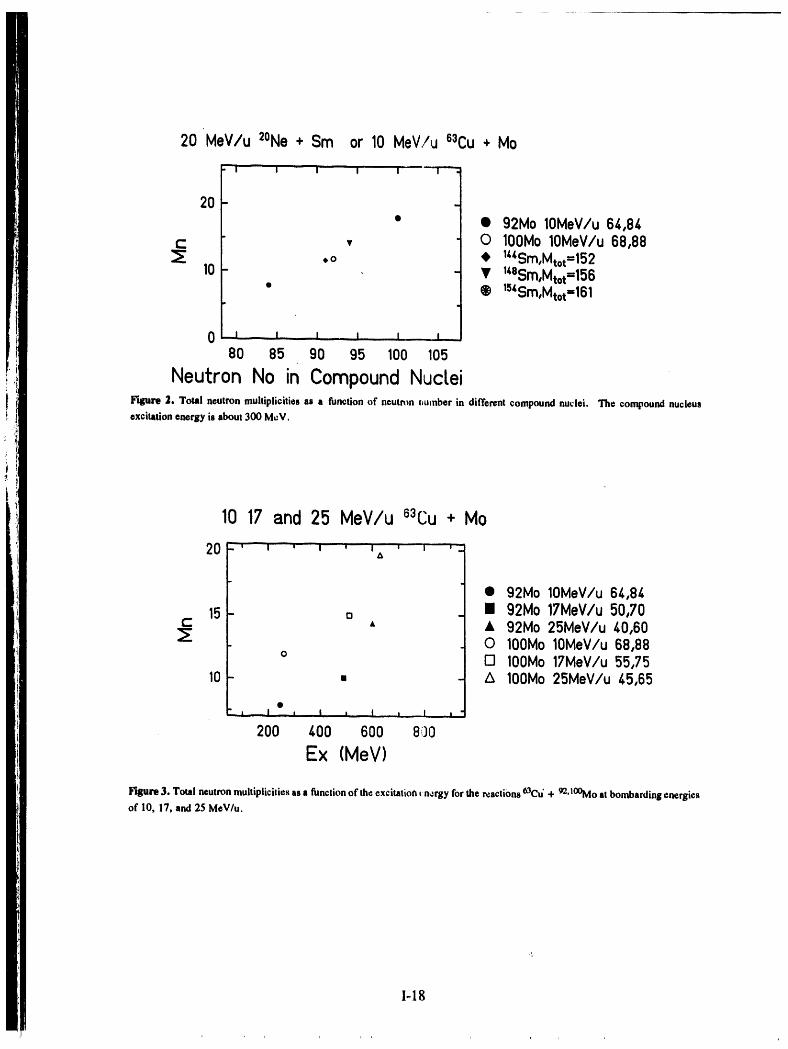
AMeV 63Cu+92'l°°Mo reactions. Fig. 2 shows the
MI = __ Mtot x E2 × sii1202_ total observed neutron multiplicities vs. neutron
El xsin2Ot+E2xsin202 number in the compound nucleus for excitation
energies near 300 MeV. The detected neutron
multiplicity increases with the neutron number in the
M2 = Mt°txEI xsin2Ol (1) compound nucleus. Fig. 3 shows the total neutron
E1 x sin201 +E2 x sin202 multiplicity depends on the excitation energy for the
Cu + Mo cases. While the multiplicities increase
and the velocity of the compound nucleus at the with energy, they do not increase sufficiently to
scission point is account for all the excitation energy.
The light charge particle emission data are in thei
Vcn=I 2 x El x E2 process of analysis.Mtot x(E1 X sill201 + E2 x sin202)
*INFN and Dipartimento di Fisica dell'Universita di
Padova, Padova, Italy
x sin(01 +02) (2) §INFN, Lab. Naz. Legnaro, 1-35020, Legnaro, Italy
tlNFN and Dipartimento di Fisica dell'Universita diThe Linear Momentum Transfer, 0, is then:Bari, Bari, Italy
Vcn _Instituto de Fisica, UNAM, Mexico D.F. 01000,p- M"x (3)
M a V-Vc" Mexico
1-16
References
1. Y. Lou et al., Progress in Research 1990-1991,CyclotronInstitute,TAMU, p. 6.
10MIV/uIICI_IIIMo Mt'I"I§$ 17MeV/uUCu*_M° Mtot"130 2,_IV/uIICt_IIOMo I_-II0
' ; ' " ' " ' " ' _- • _1--,--1"---,---1- 2000( • +, . , , ,
_Z0 e0O00 ' ' " '/,,ooo f
• tMM ",_',i_!, _,_ a _,4g
to o -M = _ .js" moo _+_ _ ,u:o ei,mFI _0ooo j i_! o +s_V 101,121v VO ?S,H U 0 95,10+1
°' .ooo I ,ooo[ .zf_#,i'O.O ;_L ;__:,:_ OO So me Iio 2o0 o So _o ---1!50 2OO ee m te 200
LMTI LMT% LMII
10MeV/uaC_UMo M_=118 17MtV/u"Cu**2Mo Mrs=120 2_ttV/t_C.e*tZMo M_=100' : , • , • , • • 40000t _ , ,, i . , . lr_ , , . ,.,,. , . ,
20000 31000, _
3OOOO I I lOOOO15oeo • tldld(/I t-I 424 . 25000 I lolll
& 21,44_ 0 "2o_ 300oo "totalo _t,14 i_ 20000 ,x _O,_ C] 2O,40
mOO O e_,e4i.l o 5o,7o A to,sov ,£1040 07¢000 O 60,00
<+ .,t2, _ooo _+i _ ..,. 20000
<3 124144 _
moo ,,_.',\
0 50 100 RO 200 50 100 150 200 "- 50 I00 150 200LMTI LM!_ LMT
20 MeV/u +ONe+ Sm,
' I ' I ' I ' I --
20000U)i--Z x _-Sm,Mtot_.152:::) • USSm,6,Mtot=156O 10000 [] 1slC'm,'_,"tot:'_''o ,,_ iOlO
__ _ I
0 50 100 150 200
LMTFslure 1. LMT plotfor (a)6SCu+ _'l°°Mo at 10, 17,and25AMcV. Thedifferentlinespresentthedifferentmaimwindows.Co)thesam,=for 20 AMeV 2°Ne + 144'148'154Smcases.
1-17
20 MeVlu 2°Ne+Sm or10 MeV/u S3Cu+ Mo
29 -
• • 92Mo10MeV/u64,8_c:: v O lOOMolOMeV/u68,88
_E .o _I. v.I.Sm,Mtot=15210 V 140Sm,Mtot=156
• ® 1S_Sm,Mtot=161
0 _! I..... I , t t ,,, I
eo 05 90 95 _00 _05Neutron No in CompoundNucLei
Figure J. Total neutron multiplicities as a function of neutron rJumber in different compound nuclei. The compound nucleusexcitation energy is about 300 McV.
1017and 25 MeV/u63Cu+ Mo20- '..... I ,,m I '1 --
I _ I _ I&
® 92MolOMeV/u64,8415 = [] 92Mo17MeV/u50,70
c " • 92Mo25MeV/u40,60_" 0 lOOMolOMeV/u68,88
o [] lOOMo17MeV/u55,7510 ,, /k lOOMo25MeV/u45,65
"_, I , L ,, I I I I l , "
200 400 600 800
Ex (MeV)
l_ure 3. Total neutron multiplicities as a function of the excitation t n,:rgy for the reactions 63Cu"+ 92,100Mo at bombarding energiesof 10, 17, and 25 MeV/u.
1-18
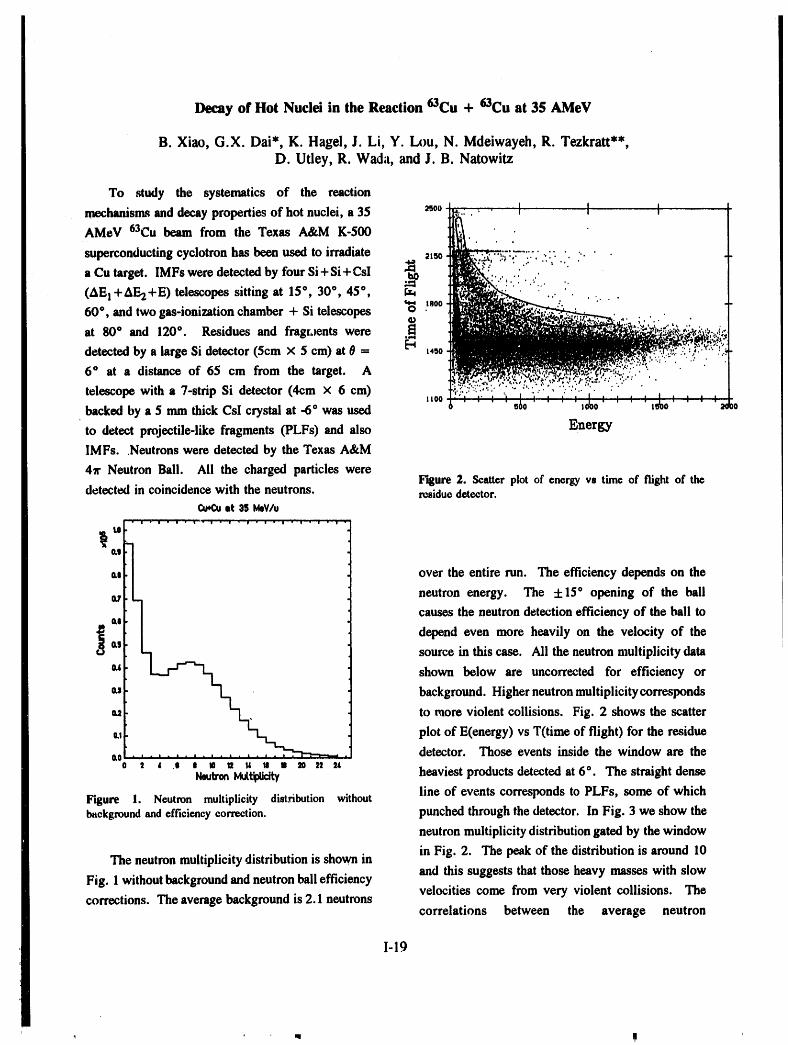
Decay of Hot Nuclei in the Reaction 63Cu + 63Cu at 35 AMeV
B. Xiao, G.X. Dai*, K. Hagel, J. Li, Y. Lou, N. Mdeiwayeh, R. Tezkratt**,
D. Utley, R• Wada, and J. B• Natowitz
To study the systenmtics of the reaction
mechanisms and decay properties of hot nuclei, a35 :'x° L ! 1 I lAMeV 63Cu beam from the Texas A&M K-500 ' .
superconducting cyclotron has been used to irradiate 2_o __"..-"":.' ..:: '. _.. " -I-a Cu target• IMFs were detected by four Si + Si + Csl "_ ''_" ' ..... ' "" k(AE! +AE2+E ) telescopes sitting at 15°, 30°, 45 °, _ " "'"" :' '
60 °, and two gas-ionization chamber + Si telescopes _ leoo__ 1"
. .0. ;.'.. ."_'.'_.a' _ ..." t, .. '. .
• '_ r • _,.,_Jso° .d 12ooR idu.andfr.s,,ontwo o ....... _.....6 ° at a distance of 65 cm from the target. A k__.-':".. I.' '_"_:':.""". "telescope with a 7-strip Si detector (4cm × 6 cm) _'_'__-- , I
1100 ,0 1obacked by a 5 nun thick CsI crystal at -6 ° was used 0
to detect projectile-like fragments (PLFs) and also Energy
IMFs..Neutrons were detected by the Texas A&M
4a" Neutron Bail. All the charged particles wereFigure 2. Scatter plot of energy vs time of flight of the
detected in coincidence with the neutrons, residuedetector.Cu*Cest 85kleVlu
• 'l _' |' • i - i - i . w • i • w - w • w • | • w -
e.t ]/ over the entire run. The efficiency depends on the
neutron energy• The +15 ° opening of the ball
causes the neutron detection efficiency of the ball tou
depend even more heavily on the velocity of the ,e.s
source in this case. All the neutron multiplicity data
o_ shown below are uncorrected for efficiency or
. background. Higher neutron multiplicity correspondsto vaore violent collisions. Fig. 2 shows the scatter
tl plot of E(energy) vs T(time of flight) for the residue
_o . detector. Those events inside the window are the
NeutronI_ttiptid_ heaviest products detected at 6 °. The straight dense
line of events corresponds to PLFs, some of whichF'_ure 1. Neutron multiplicity distribution withoutbackgroundandefficiency correction, punched through the detector. In Fig. 3 we show the
neutron multiplicity distribution gated by the window
in Fig. 2. The peak of the distribution is around 10The neutron multiplicity distribution is shown in
and this suggests that those heavy masses with slowFig. I without background and neutron ball efficiency
velocities come from very violent collisions. Thecorrections. The average background is 2.1 neutrons
correlations between the average neutron
1-19
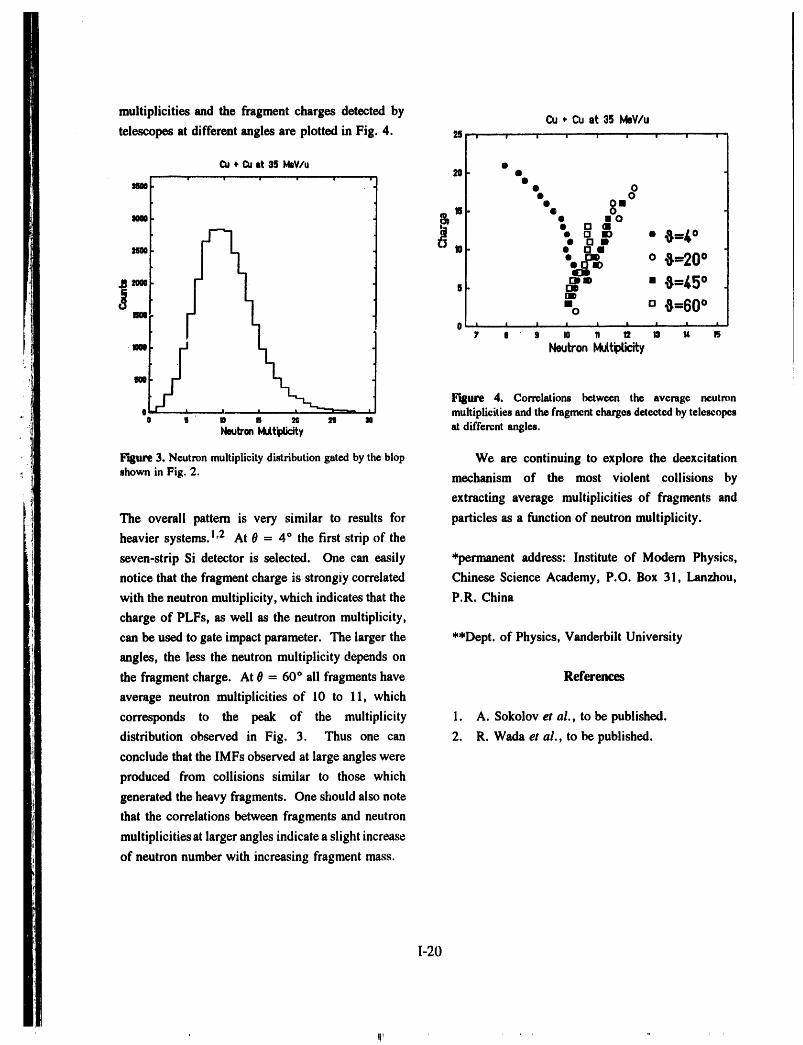
multiplicitiesand thefragmentchargesdetectedby Cu+ Cuat36IvkV/utelescopesatdifferentanglesareplottedinFig.4. _ , ........ .
Cu + 13ist 36 MtV/u •.......... 20 It
" • ;.. o=°°ICm _ • I10
• El OI
•°: •.oo ,, ." ,P." '0'=4°
[ " o+=20 o" s _® = 0=_5°] _" . 0=60o- [ L o
L 0 ,I I I I I i i i i
? il " D tO fl 12 13 14
0 rJ Figure 4. Correlations between the average neutron' ' ' ' multiplicitiesandthe fragmentchargesdetectedby telescopeso 5 Io B 2O 26 N
Neutrm Mutt'li:ity at different angles.
Figure 3. Neutron multiplicity distribution gated by the biop We are continuing to explore the deexcitation
shown in Fig. 2. mechanism of the most violent collisions by
extracting average multiplicities of fragments and
The overall pattern is very similar to results for particles as a function of neutron multiplicity.
heavier systems. 1:2 At 0 = 4 ° the first strip of the
seven-strip Si detector is selected. One can easily *permanent address: Institute of Modern Physics,
notice that the fragment charge is strongiy correlated Chinese Science Academy, P.O. Box 31, Lanzhou,
with the neutron multiplicity, which indicates that the P.R. China
charge of PLFs, as well as the neutron multiplicity,
can be used to gate impact parameter. The larger the **Dept. of Physics, Vanderbilt University
angles, the less the neutron multiplicity depends on
the fragment charge. At 0 = 60 ° all fragments have References
average neutron multiplicities of 10 to 11, which
corresponds to the peak of the multiplicity 1. A. Sokolov et al., to be published.
distribution observed in Fig. 3. Thus one can 2. R. Wada et al., to be published.
conclude that the IMFs observed at large angles were
produced from collisions similar to those which
generated the heavy fragments. One should also note
that the correlations between fragments and neutron
multiplicities at larger angles indicate a slight increase
of neutron number with increasing fragment mass.
1-20
The Multifragmentation of 4°Ca + 4°Ca
K. Hagel, M. Gonin t, R. Wada, J. B, Natowitz, B. H. Sa_, Y. Lou, M. Gui, D. Utley, (1)G. Nebbia, D. Fabris, G. Prete, J. Ruiz, (2)
D. Drain, B. Chambon, B. Cheynis, D. Guinet, X. C. Hu, A. Demeyer, C. Pastor, O)A. Giorni, A. Lleres, P. Stassi, J. B. Viano, (4)
P. Gonthier (5)
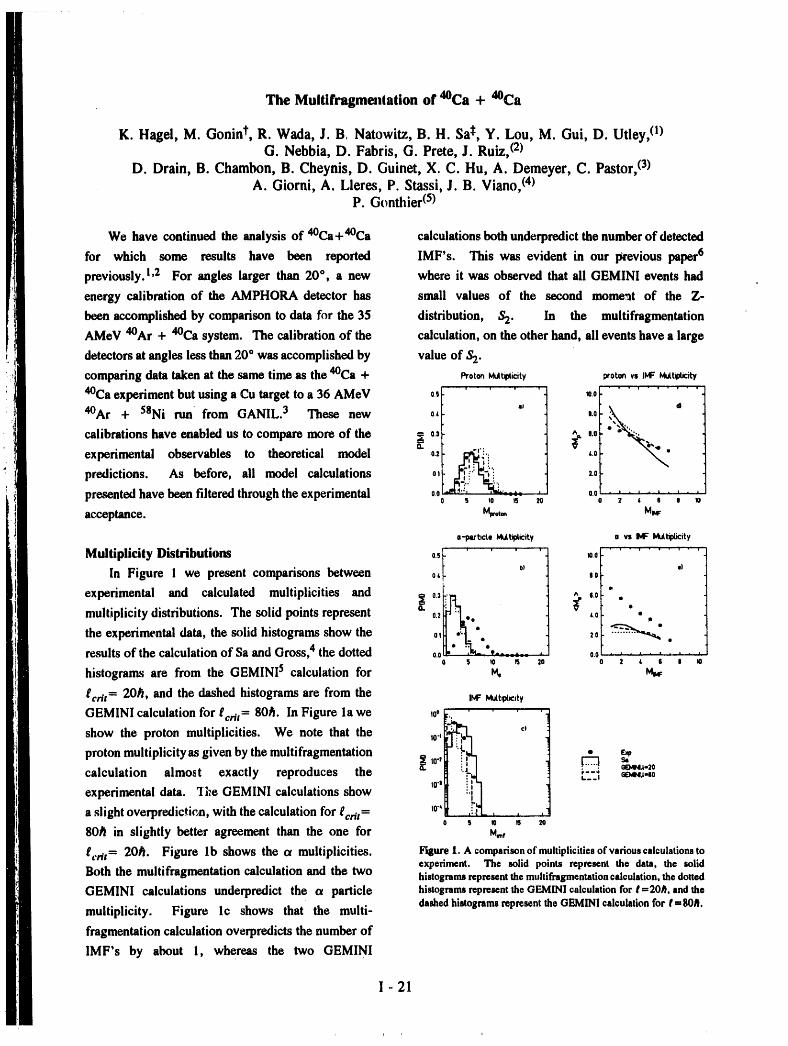
We have continued the analysis of 4°Ca+4°Ca calculations both underpredict the number of detected
for which some results have been reported IMF's. This was evident in our previous paper6
previously. 1,2 For angles larger than 20 °, a new where it was observed that all GEMINI events had
energy calibration of the AMPHORA detector has small values of the second moment of the Z-
been accomplished by comparison to data for the 35 distribution, S2. In the multifragmentation
AMeV 4°Ar + 4°Ca system. The calibration of the calculation, on the other hand, all events have a large
detectors at angles less than 20 ° was accomplished by value of S2.
comparing data taken at the same time as the 4°Ca + Prom_tc_ty _ot_ v, tw _ttCg_y
4°Ca experiment but using a Cu target to a 36 AMeV 0s_ .... _o! ..........
• I at ., ¢0
4°Ar + 58Ni run from GANIL. 3 These new 0, ,..
calibrations have enabled us to compare more of the _ 0., _ ,.0 - "'.
experimental observables to theoretical model a I _ t0.2 "i t.o
predictions. As before, all model calculations 00._-'.°tI........: -_._-_./._.:._ .... , ] 2.00.0 . , . , , t . , . ,presented have been filtered through the experimental 0 _ ,0 18 2o 0 z , , , 1o
acceptance. _,.,= M_
a-partmte ktJttiptic_y • vs I_ Muttipticity
Multiplicity Distributions o.s_ .... .o' ..........b) el
In Figure I we present comparisons between 0, ,o
experimental and calculated multiplicities and _ 03_R.
multiplicity distributions. The solid points represent r _.:: _, s.o . •t.O •
0.2 eo _othe experimental data, the solid histograms show the 0,_ _.._ .. ,o .results of the calculation of Sa and Gross,4 the dotted oo,_ ,",-- •........ o.o ..........
O 5 10 15 20 2 t 6 8 I0
histograms are from the GEMINI 5 calculation for M. M_
ecr/t= 20h, and the dashed histograms are from the Iw M_t_c,ty
GEMINI calculation for ecrtl= 8Oh. In Figure la we 10,_
show the proton multiplicities. We note that the 10-,_':" _'proton multiplicity as given by the multifragmentation _g u ::_ [7_ s,calculation almost exactly reproduces the _t0-,] _'i-_
• . I_MHA..20
'°"N'L'Ia slight overpredictien, with the calculation for ecrit= _0-,_ .!._
o 5 10 18 20
80_ in slightly better agreement than the one for M,_,
fcril- 20h. Figure lb shows the ot multiplicities. Figure1. A comparisonof multiplicitiesof variouscalculationstoexperiment. The solid points represent the data, the solid
Both the multifragmentation calculation and the two histogranm represent the muitifragmentation oaioulation, the dotted
GEMINI calculations underpredict the a particle histograms represent the GEMINI calculation for t-20/L and the
multiplicity. Figure lc shows that the multi- dashed histograms represent the GEMINI calculation for f=80/J.
fragmentation calculation overpredicts the number of
IMF's by about 1, whereas the two GEMINI
1-21
0 = i 0 e-60 e- 1°° 1 e- It°_ o,_
o
oo!: : : ; : ..... -'; , • , , : : : ...... : ', : : ; :• w • ,i • w • | • | • = • w
toO " 20=' 0 " 31=' 0 = 45o ,11" 660
% o._
0O! jProtms,_. : : : : : : .... :its: : : i 0 i : , : : L.......tO
O - go° ,6 - 117° 4 - 148'
r"l Bolt
,o, ,.,......... _ ...........o 5o m m 2o07_osooo so m r_o 2oo 25o _ooo _o m m 1oo2so soo
E, MoV E, k_v E, 54eV
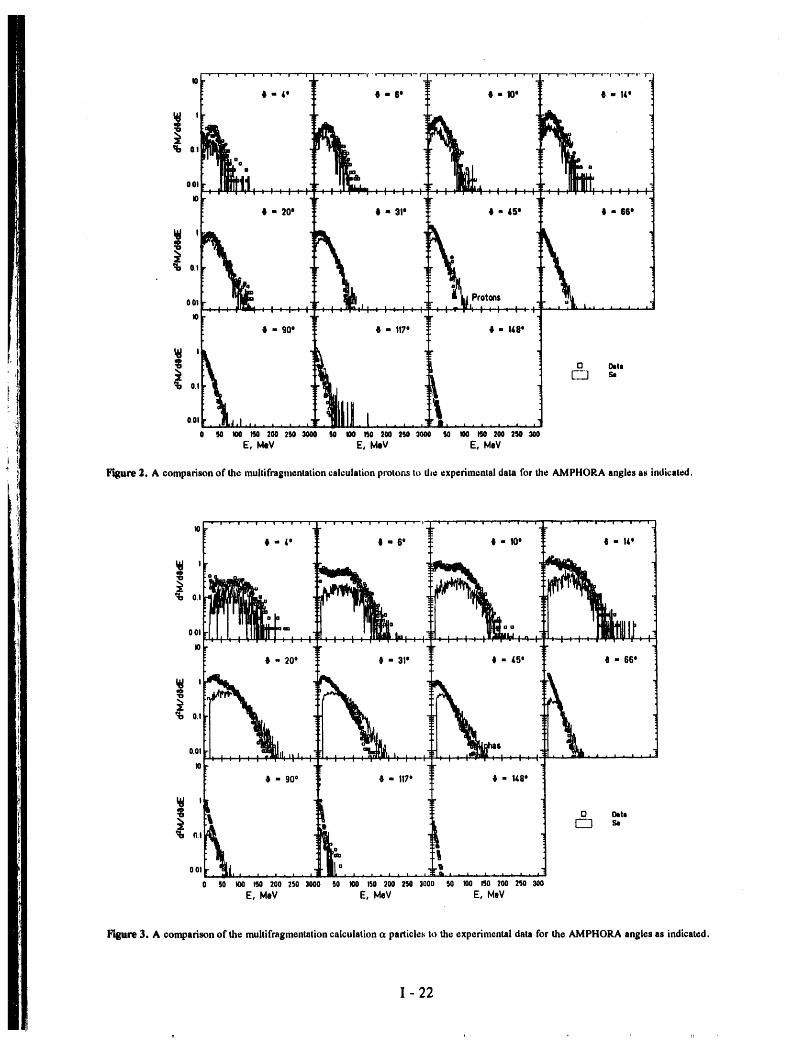
F'isure 2. A comparisonof the multifragmentationcalculationprotonsto die experimentaldata for the AMPHORA anglesas indicated.
_0 r'" I • w • v • i • w • • v • i • i , i • ,r', i: "lr "][ .... ' "' .... ",= ...... "_[ 4) " 4' ! ! "6' !" t = 100 ! 6 = IA' ::
["' ]
1 ' .oo,_[..... II .. ;:;:; °I.,, . ,_ , , , I.J ; , : : . :JOt,, _p, -r -"
4b= 200 0 - 31° . 41• &50 O = 66=
: _
o., , "I !
_, t . t•,ytmL . , . j . |_ . • . , . , . t
D Data
oo, l.......... "_ "I, "o 5o m m 2oo 25o _ooo _o m 15o_oo =r,o3ooo 5o loo _ =oo:e_osoo
E, MoV E, k,leV E, MoV
Figure 3. A comparison of the multiffagmentation calculation (x particl¢_ to the experimental data for the AMPHORA angles as indicated.
! - 22
t" 4' 0 "6' J"lO ° 0"140
i I
0.I _ _b
oo,..............L ......,r .......• i • i • i • i , i • ' i P • i • i v--i • ! • i • i -- i • i , l , ,; • i • i • i - i • i • i - •
m !" ! rI" 20o _: t "31' ! t" 15o : 41=66 o
't: o.i
Protons , }001 ...... •,. , 0 1 + .... , -- ,L .... , , , ...........
I - 900 0 " 1170 'I " l,dS"
O.m .......... "_ ............ tt" .......... "o so mo m _oo2so 3ooo 5o m _o mo _o 3ooo so mo m 2oo2,,o:oo
E, MeV E, I_V E, MeV
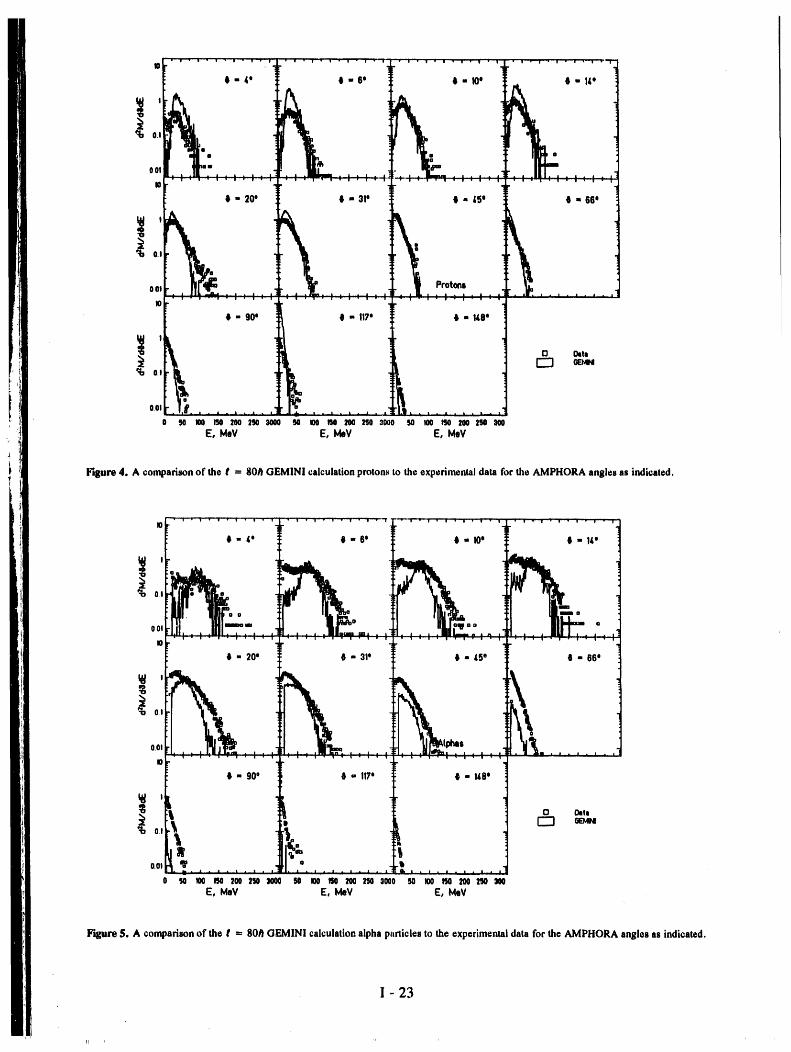
Figure 4. A comparisonof the t = 80/) GEMINI calculationprotonsto the ©xporimentaldata for the AMPHORA anBlesas indicated.
-". ; • +; ,_ i • i • i • .: • i • i'- i • I • i - iIO
1=4" i" 0
0.I o o
+ f[ IP+.:.• o mo
o 12o o
oo0 .,., "lit'--. .... 1'I .... Rill .............. ;:: ........ ::: ............ , .... , .......
" !I " 200 0 " 310 I " +d§e 6 " 660
0.01 i It,..... ,, ....... I. , ...... : : : ', : : ', : :I0 " '+ " i • .i • i • • • ,i
41,- go ° O - 1170 4b - ldO'
!
I L o o.,.t , r-'-I _
0.01 _P o ,t, h . • . I • I • I • I • • • I • I • I . I • I iI_II I I I I I • I i I • I
0 50 'I00 80 _00 2SO2000 50 I00 _0 200 _JO 3000 50 I00 150 200 250 300E, MoV E, MeV E, MeV
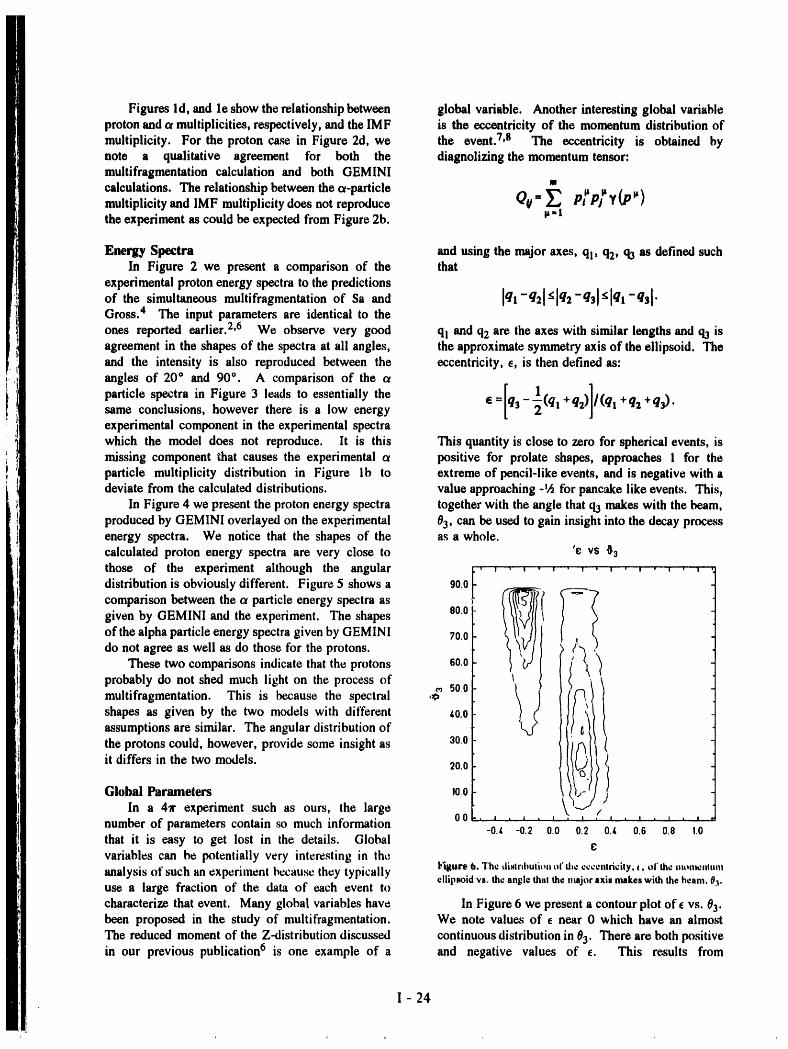
Figure $. A comparison of the t = 80/} GEMINI calculationalpha p_:rticlcsto the experimentaldata for the AMPHORA anglesas indicated.
l- 23
Figures ld, and le show the relationship between global variable. Another interesting global variableproton and ormultiplicities, respectively, and the IMF is the eccentricity of the momentum distribution ofmultiplicity. For the proton case in Figure 2d, we the event. 7,8 The eccentricity is obtained bynote a qualitative agreement for both the diagnolizing the momentum tensor:multifragmentation calculation and both GEMINIcalculations. The relationship between the or-particlemultiplicity and IMF multiplicity does not reproduce Q¢ = _-, PfPf Y(PP)the experiment as could be expected from Figure 2b. P=!
Energy Spectra and using the major axes, ql, q2, q3 as defined suchIn Figure 2 we present a comparison of the that
experimental proton energy spectra to the predictionsof the simultaneous multifragmentation of Sa and [ql-q2[ <]q2-q3[ <[ql-q3["Gross. 4 The input parameters are identical to the
ones reported earlier. 2,6 We observe very good ql and q2 are the axes with similar lengths and q3 isagreement in the shapes of the spectra at all angles, the approximate symmetry axis of the ellipsoid. Theand the intensity is also reproduced between the eccentricity, e, is then defined as:angles of 20 ° and 90 °. A comparison of the at
particle spectra in Figure 3 leads to essentially the e=[ql(ql ]same conclusions, however there is a low energy s- +q2)/(qt +q2+q3) •experimental component in the experimental spectrawhich the model does not reproduce. It is this This quantity is close to zero for spherical events, ismissing component that causes the experimental at positive for prelate shapes, approaches 1 for theparticle multiplicity distribution in Figure lb to extreme of pencil-like events, and is negative with adeviate from the calculated distributions, value approaching -I,4 for pancake like events. This,
In Figure 4 we present the proton energy spectra together with the angle that q3 makes with the beam,produced by GEMINI overlayed on the experimental 03, can be used to gain insight into the decay processenergy spectra. We notice that the shapes of the as a whole.calculated proton energy spectra are very close to 'e vs 03those of the experiment although the angular F' ' ' ' ' ' " ' ' ' ' ' ' ' ' 'distribution is obviously different. Figure 5 shows a 90.0comparison between the oeparticle energy spectra as
given by GEMINI and the experiment. The shapes 00.0of the alpha particle energy spectra given by GEMINI 70.0do not agree as well as do those for the protons.
These two comparisons indicate that the protons 60.0
probably do not shed much light on the process of 0,_ 50.0 //(_/
multifragmentation. This is because the spectralshapes as given by the two models with different _0.0assumptions are similar. The angular distribution of
the protons could, however, provide some insight as 30.0
it differs in the two models. 20.0
Global Parameters lo.o ,In a 4_" experiment such as ours, the large
number of parameters contain so much information 00 . , ...............-o.,c -0.2 o.o 0.2 o.,t o.6 o.e I.othat it is easy to get lost in the details. Global cvariables can be potentially very interesting in theanalysis of such an experiment because they typically Figure6. The distr,bulion of the eccenlricily, t, ot"the m,,mcnnml
ellipsoid vs. the angle thalthe major axis makes with the beam. 03.use a large fraction of the data of each event to
characterize that event. Many global variables have In Figure 6 we present a contour plot of e vs. 03.been proposed in the study of multifragmentation. We note values of e near 0 which have an almost
The reduced moment of the Z-distribution discussed continuous distribution in 03. There are both positivein our previous publication 6 is one example of a and negative values of e. This results from
I - 24
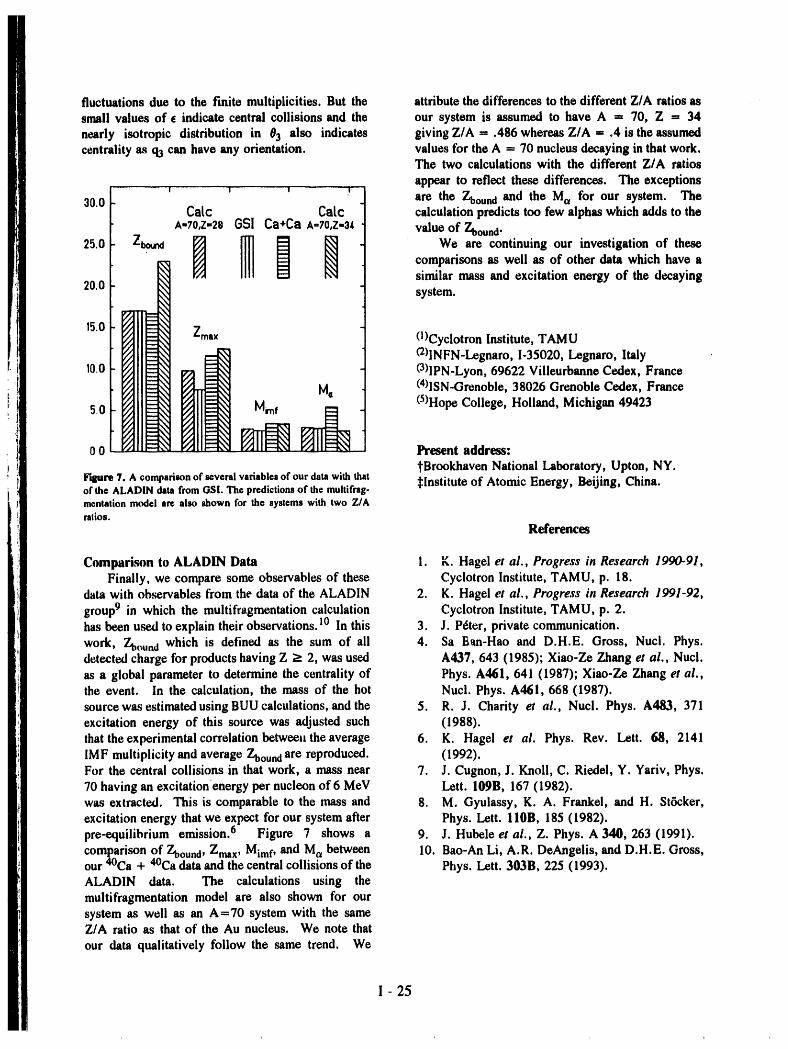
fluctuations due to the finite multiplicities, But the attribute the differences to the different Z/A ratios assmall values of E indicate central collisions and the our system is assumed to have A = 70, Z = 34
nearly isotropic distribution in 03 also indicates giving Z/A -- .486 whereas Z/A - .4 is the assumedcentrality as q3 can have any orientation, values for the A -- 70 nucleus decaying in that work.
The two calculations with the different Z/A ratios
appear to reflect these differences. The exceptions
' ' ' ' _ are the Zbound and the Ma for our system. The30.0 Catc Ca[c calculation predicts too few alphas which adds to the
A-70,Z-2e GS! Ca+CaA-70,z-3_ I value of Zboun d.
25.0 Zbo_ _ _] [_ _ We are continuing our investigation of thesecomparisons as well as of other data which have asimilar mass and excitation energy of the decaying
20.0 system.
15.0 Zmax (I)Cyclotron Institute, TAMU(2)lNFN-Legnaro, 1-35020, Legnaro, Italy
10.0 O)lPN-Lyon, 69622 Villeurbanne Cedex, France
Ma (4)lSN-Orenoble, 38026 Grenoble Cedex, France
50 M_f (5)Hope College, Holland, Michigan 49423
0 0 _ _ Present address:
tBrookhaven National Laboratory, Upton, NY.Figure 2. A comparison of xveral variables of our data with that :l:Instituteof Atomic Energy, Beijing, China.of the ALADIN data from GSI. The predictions of the multifrag-mentation model ere also shown for the systems with two Z/Aratios.
References
Comparison to ALADIN Data 1. K. Hagel et al., Progress in Research 1990-91,Finally, we compare some observables of these Cyclotron Institute, TAMU, p. 18.
data with observables from the data of the ALADIN 2. K. Hagel et al., Progress in Research 1991-92,
group9 in which the multifragmentation calculation Cyclotron Institute, TAMU, p. 2.has been u._.,dto explain their observations. 10 In this 3. J. P_ter, private communication.work, Zbound which is defined as the sum of all 4. Sa Ban-Hao and D.H.E. Gross, Nuci. Phys.detected charge for products having Z > 2, was used A437, 643 (1985); Xiao-Ze Zhang et al., Nucl.as a global parameter to determine the centrality of Phys. A461, 641 (1987); Xiao-Ze Zhang et al.,the event. In the calculation, the mass of the hot Nucl. Phys. A461, 668 (1987).source was estimated using BUU calculations, and the 5. R. J. Charity et al., Nucl. Phys. A483, 371excitation energy of this source was adjusted such (1988).
that theexperimentalcorrelationbetwee, t theaverage 6. K. Hagel et al. Phys. Rev. Lett. 68, 2141IMF multiplicity and average Zboundare reproduced. (1992).For the central collisions in that work, a mass near 7. J. Cugnon, J. Knoll, C. Riedel, Y. Yariv, Phys.70 having an excitation energy per nucleon of 6 MeV Lett. 109B, 167 (1982).was extracted. This is comparable to the mass and 8. M. Gyulassy, K. A. Frankel, and H. St6cker,
excitation energy that we expect for our system after Phys. Lett. IIOB, 185 (1982).pre-equilibrium emission. 6 Figure 7 shows a 9. J. Hubele et al., Z. Phys. A 340, 263 (1991).
comparison of Zbound, Zmax, Mimf, and Mot between 10. Bao-An Li, A.R. DeAngelis, and D.H.E. Gross,our 4°Ca + "_Cadata and the central collisions of the Phys. Lett. 303B, 225 (1993).ALADIN data. The calculations using the
multifragmentation model are also shown for oursystem as well as an A=70 system with the sameZ/A ratio as that of the Au nucleus. We note that
our data qualitatively follow the same trend. We
I -25
Mechanisms of Light Charged Particle and Intermediate Mass FragmentProduction for the Reaction 220 MeV 4He + lS4Sm
J. Boger, T. Botting, B. Hurst, D. O'Kelly, R. P. Schmitt,W. Turmel, and S. J. Yennello
The use of light ion projectiles, such as 3He and This will provide a measure of the contribution from
4He, can yield important insights into the production each reaction process to the total LCP and IMF cro_,;s
mechanisms for intermediate mass fragments. ! With sections. Additionally, the charged particle angular
light projectiles, one can avoid contributions from distributions and energy spectra will be examined by
various bre4_-up processes and thus have a clearer gating on various neutron multiplicity folds. The_
view of the pre-equilibrium fragment emission seen angular distributions and energy spectra could provide
at forward angles. In addition, because of the new clues as to the spin and energy partitioning
relatively low spins involved, one may better between daughterandparent nuclei. Furthermore, it
understand the role of angular momentum in fragment is well known that the anisotropy observed in the
emission, angular distribution is in part driven by the shape of
In a recent experiment, light charged particles the emitting or fissioning nucleus. These shapes
(LCP) and intermediate mass fragments (IMF) (Z > derived from the experimentally measured angular
3) have been measured in coincidence with neutrons distributions can be compared with theoretical
for the reaction 220 MeV 4He + 154Sm. The calculations of the saddle and scission point nuclear
experiment was performed with the neutron baU.2 shapes. Such a comparison may provide insight into
Five, two- to three-element solid state particle the dynamical aspects of the decay process.
detectors were used to detect and identify the charged
particles and to measure their kinetic energies and References
angular distributions. These detectors were placed at
angles of-20 °, 30°, 50 °, 70°, and 90 ° with respect 1. L. Sobotka et al., Phys. Rev. Lett. 51, 2187
to the beam. Solid angles ranged from 4.0 msr to (1983).
8.6 msr. Typical beam intensities were < 10 pAmps. 2. R. P. Schmitt et al., Proceedings of the
From this experiment several things are to be International Workshop on Dynamical Aff_ectsof
learned. The neutron multiplicity distributions are a Nuclear Fission, Smolenice, Czechoslovakia,
measure of the violence of the collision between the June 17-21, 1991.
target and projectile. 3 These multiplicity 3. J. Boger et al (manuscript in preparation).
distributions, measured on an event by event basis in
coincidence with charged particles, will therefore
allow us to separate LCP's and IMF's produced in
peripheral reactions (events with low neutron
multiplicities) from those produced in central
reactions (events with large neutron multiplicities).
1-26
Nuclear Matter Compressibility from lsoscalar Giant Monopole Resonance
S. Shlomo and D. H. Youngblood
The nuclear matter (N=Z) and no Coulomb
interaction) compressibility, Knm, is an important Eoult = _ (3)
quantity characterizing the nuclear medium since it is
directly related to the curvature of the nuclear matter where mk is the RPA sum ruleequation of state, t E=E(o), at the saturation point
(E,p) = (-16 MeV, 0.17 fm3). Accurate (4)determination of Knm is very important for the study
of properties of nuclei (radii, masses, giant Note that with the definition (3) for EOMIt, Kvo! in
resonances, etc.), supernova collapses, neutron stars, (1) is equal5 to Knm.and heavy ion collisions. 2
There have been several attempts in the past5"12The study of the isoscalar giant monopole
to determine Knm using the procedure described byresonances (GMR) in various nuclei provides an
(1) to (4) by a least square (LS) fit to the GMR dataimportant source of information for Knm. The GMR of various sets of nuclei. In these attempts, only awas first discovered in 2°gPb at excitation energy3 of
very limited number of parameters (! to 3), mainly
13.7 MeV. Random phase approximation (RPA) Kvo!, Ksurf, and Ksym, were included in the LS fitcalculations using existing or modified effective
using fixed values (deduced from theory) for the
interactions having Knm= 210:1:30 MeV were in other parameters, such as l_oul and Kcurvin eq. (1).
agreement with experiment. 4 It is important to note, Recently, Sharma and collaborators, in a series of
however, that this commonly accepted value of papers, 10"12claimed that a value of Knm- 300 + 20Knm= 210 :t: 30 MeV was deduced using a limited MeV is obtained using the recent GMR data of
class of effective interactions. Groningen for the nuclei 112,114,116,120,124Snand
With th increase in GMR data in various nuclei, 144'148Smand including those of 2°gPb, 9°Zr, and
it became worthwhile to attempt using a semi- 24Mg. It should be pointed out that this result is
empirical approach to deduce Knm. In this approach, quite different from the commonly accepted value ofwhich is similar to the semi-empirical mass formula,
Knm= 210 + 30 MeV. Very recently, Pearson 13hasone writes 4'5 the compressibility KA of the nucleus
with mass number A, as an expansion in A"1/3, pointed out that Knm is strongly dependent on thevalue assumed for Kcouland that the relation between
Kcouland Knm is model dependent.
(I) In the presentstudy, we take a closer look at the
(Ksy,_+Km A -1/3 +K,o .__ +..., semi-empirical analysis of the GMR data using theprocedure (1) to (4) in an attempt to extract a reliable
value for Knm. We find that the claim of Sharma
where K^ is defined by et al., 10"12 is not reliable since their analysis islimited in the number of data points and the number
= m__E2OUlt(r2). (2) of free parameters included in the LS fit. We haveKA _2 attempted to include the entire GMR data set,
reconciling differences between different laboratories
Here <r2> is the mean square radius of the nucleus and taking the parameters in eq. (1) as fr_
and EGMR is taken to be the scaling energy of the parameters. In the following, we first summarize
GMR defined by some theoretical and experimental observations
II - 27
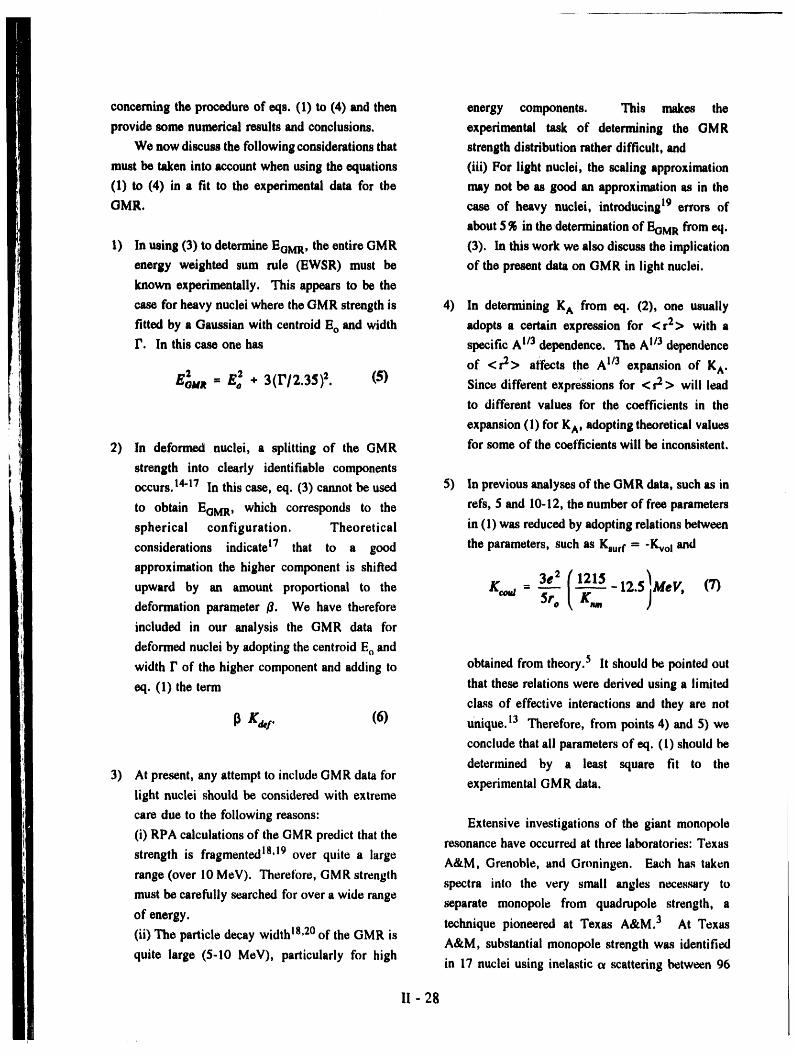
concerning the procedure of eqs. (1) to (4) and then energy components. This makes the
provide some numerical results and conclusions, experimental task of determining the GMR
We now discuss the following considerations that strength distribution rather difficult, and
must be taken into account when using the equations (iii) For light nuclei, the scaling approximation
(1) to (4) in a fit to the experimental data for the may not be as good an approximation as in the
GMR. case of heavy nuclei, introducing 19 errors of
about 5 _ in thedetermination of EOMa from eq.
1) In using (3) to determine EOMR, the entire GMR (3). In this work we also discuss the implication
energy weighted sum rule (EWSR) must be of the present data on GMR in light nuclei.
known experimentally. This appears to be the
case for heavy nuclei where the GMR strength is 4) In determining K^ from eq. (2), one usually
fitted by a Gaussian with centroid Eo and width adopts a certain expression for < r2> with a
I', In this case one has specific A 1/3 dependence. The A I/3 dependence
of <r2> affects the A 1/3 expansion of K^.
£o2un = £_ + 3(i,/2.35)2. (5) Since different exprdssions for < r2 > will lead
to different values for the coefficients in the
expansion (1) for K^, adopting theoretical values
2) In deformed nuclei, a splitting of the GMR for some of the coefficients will be inconsistent.
strength into clearly identifiable components
occurs. 14"17 In this case, eq. (3) cannot be used 5) In previous analyses of the GMR data, such as in
to obtain EOMR, which corresponds to the refs, 5 and 10-12, the number of free parameters
spherical configuration. Theoretical in (1) was reduced by adopting relations between
considerations indicate 17 that to a good the parameters, such as Ksurf - -KvoI and
approximation the higher component is shifted
"" 03e2(121---_5-12"5 ) MeV'K. (7)upward by an amount proportional to the Kma = -_--_-deformation parameter /_. We have therefore
included in our analysis the GMR data for
deformed nuclei by adopting the centroid Eo and
width F of the higher component and adding to obtained from theory. 5 It should be pointed out
eq. (1) the term that these relations were derived using a limited
class of effective interactions and they are not
[3 K'ar,t.. (6) unique. 13 Therefore, from points 4) and 5) we
conclude that all parameters of eq. (1) should be
determined by a least square fit to the3) At present, any attempt to include GMR data for
experimental GMR data.light nuclei should be considered with extreme
care due to the following reasons: Extensive investigations of the giant monopole(i) RPA calculations of the GMR predict that the resonance have occurred at three laboratories: Texas
strength is fragmented 18't9 over quite a large A&M, Grenoble, and Groningen. Each has takenrange (over 10 MeV). Therelbre, GMR strength
spectra into the very small angles necessary tomust be carefully searched for over a wide range
separate monopole from quadrupole strength, a
of energy, technique pioneered at Texas A&M. 3 At Texas(ii) The particle decay width 18,20of the GMR is
A&M, substantial monopole strength was identified
quite large (5-10 MeV), particularly for high in 17 nuclei using inelastic ot scattering between 96
II - 28
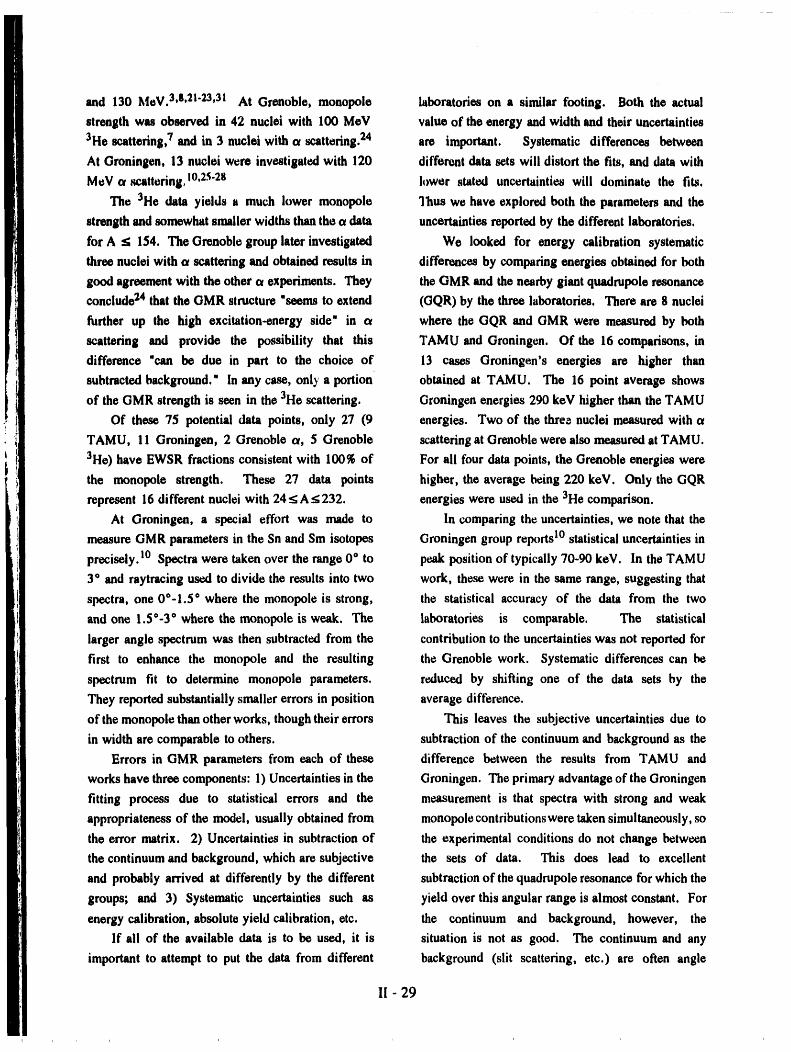
and 130 MoV. 3,8,21"23,31 At Grenoble, monopole laboratories on a similar footing. Both the actual
strength was observed in 42 nuclei with 100 MoV value of the energy and width and their uncertainties
3He scattering, 7 and in 3 nuclei with a scattering.24 are important. Systematic differences between
At Groningen, 13 nuclei were investigated with 120 different data sets will distort the fits, and data with
MeV a scattering, 10'25"28 lower stated uncertainties will dominate the fits.
The 3He data yields a much lower monopole ']1ms we have explored both the parameters and the
strength and somewhat smaller widths than the a data uncertainties reported by the different laboratories.
for A _ 154. The Grenoble group later investigated We looked for energy calibration systematic
three nuclei with a scattering and obtained results in differences by comparing energies obtained for both
good agreement with the other c_experiments. They the GMR and the nearby giant quadrupole resonance
conclude 24 that the GMR structure "seems to extend (GQR) by the three laboratories. There are 8 nuclei
further up the high excitation-energy side" in o_ where the GQR and GMR were measured by both
scattering and provide the possibility that this TAMU and Groningen. Of the 16 comparisons, in
difference "can be due in part to the choice of 13 cases Groningen's energies are higher than
subtracted background." in any case, onl__a portion obtained at TAMU. The 16 point average shows
of the GMR strength is seen in the 3He scattering. Groningen energies 290 keV higher than the TAMU
Of these 75 potential data points, only 27 (9 energies. Two of the three nuclei measured with or
TAMU, 11 Groningen, 2 Grenoble a, 5 Grenoble scattering at Grenoble were also measured at TAMU.
3He) have EWSR fractions consistent with 100% of For all four data points, the Grenoble energies were
the monopole strength. These 27 data points higher, the average being 220 keV. Only the GQR
represent 16 different nuclei with 24 < A < 232. energies were used in the 3He comparison.
At Groningen, a special effort was made to In comparing the uncertainties, we note that the
measure GMR parameters in the Sn and Sm isotopes Groningen group rel_)rts10 statistical uncertainties in
precisely. 10 Spectra were taken over the range 0 ° to peak position of typically 70-90 keV. In the TAMU
3 ° and raytracing used to divide the results into two work, these were in the same range, suggesting that
spectra, one 0°-1.5 ° where the monopole is strong, the statistical accuracy of the data from the two
and one 1.5°-3 ° where the monopole is weak. The laboratories is comparable. The statistical
larger angle spectrum was then subtracted from the contribution to the uncertainties was not reported for
first to enhance the monopole and the resulting the Grenoble work. Systematic differences can be
spectrum fit to determine monopole parameters, reduced by shifting one of the data sets by the
They reported substantially smaller errors in position average dift_rence.
of the monopole than other works, though their errors This leaves the subjective uncertainties due to
in width are comparable to others, subtraction of the continuum and background as the
Errors in GMR parameters from each of these difference between the results from TAMU and
works have three components: 1) Uncertainties in the Groningen. The primary advantage of the Groningen
fitting process due to statistical errors and the measurement is that spectra with strong and weak
appropriateness of the model, usually obtained from monopole contributionswere taken simultaneously, so
the error matrix. 2) Uncertainties in subtraction of the experimental conditions do not change between
the continuum and background, which are subjective the sets of data. This does lead to excellent
and probably arrived at differently by the different subtraction of the quadrupole resonance for which the
groups; and 3) Systematic uncertainties such as yield over this angular range is almost constant. For
energy calibration, absolute yield calibration, etc. the continuum and background, however, the
If all of the available data is to be used, it is situation is not as good. The continuum and any
important to attempt to put the data from different background (slit scattering, etc.) are often angle
11- 29
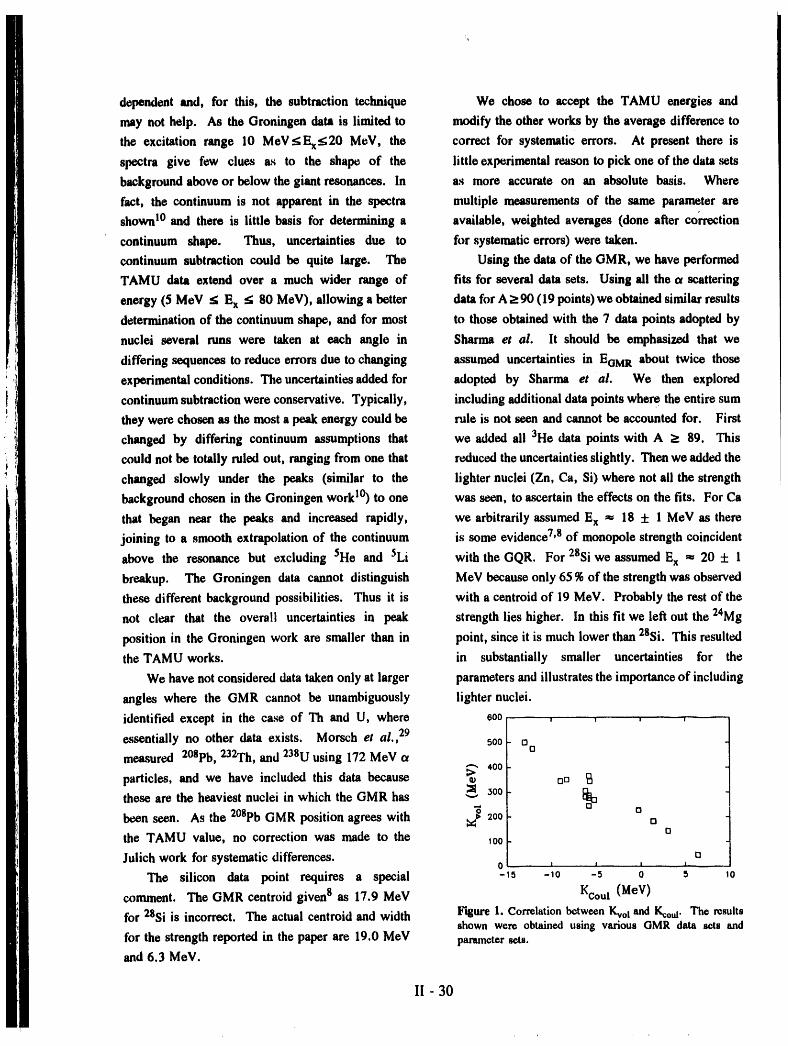
dependent and, for this, the subtraction technique We chose to accept the TAMU energies and
may not help. As the Groningen data is limited to modify the other works by the average difference to
the excitation range 10 MeV<Ex_20 MeV, the correct for systematic errors. At present there is
spectra give few clues as to the shape of the little experimental reason to pick one of the data sets
background above or below the giant resonances. In as more accurate on an absolute basis. Where
fact, the continuum is not apparent in the spectra multiple measurements of the same parameter are
shown 10 and there is little basis for determining a available, weighted averages (done after co_-rection
continuum shape. Thus, uncertainties due to for systematic errors) were taken.
continuum subtraction could be quite large. The Using the data of the GMR, we have performed
TAMU data extend over a much wider range of fits for several data sets. Using all the ot scattering
energy (5 MeV < Ex _ 80 MeV), allowing a better data for A >90 (19 points)we obtained similar results
determination of the continuum shape, and for most to those obtained with the 7 data points adopted by
nuclei several runs were taken at each angle in Sharma et al. It should be emphasized that we
differing sequences to reduce errors due to changing assumed uncertainties in EOMit about twice those
experimental conditions. The uncertaintiesadded for adopted by Sharma et al. We then explored
continuum subtraction were conservative. Typically, including additional data points where the entire sum
they were chosen as the most a peak energy could be rule is not seen and cannot be accounted for. First
changed by differing continuum assumptions that we added all 3He data points with A _ 89. This
could not be totally ruled out, ranging from one that reduced the uncertainties slightly. Then we added the
changed slowly under the peaks (similar to the lighter nuclei (Zn, Ca, Si)where not all the strength
background chosen in the Groningen work 10) to one was seen, to ascertain the effects on the fits. For Ca
that began near the peaks and increased rapidly, we arbitrarily assumed Ex _ 18 + 1 MeV as there
joining to a smooth extrapolation of the continuum is some evidence 7,s of monopole strength coincident
above the resonance but excluding 5He and 5Li with the GQR. For 28Si we assumed Ex _ 20 ± 1
breakup. The Groningen data cannot distinguish MeV because only 65 % of the strength was observed
these different background possibilities. Thus it is with a centroid of 19 MeV. Probably the rest of the
not clear that the overall uncertainties in peak strength lies higher. In this fit we left out the 24Mg
position in the Groningen work are smaller than in point, since it is much lower than 28Si. This resulted
the TAMUworks. in substantially smaller uncertainties for the
We have not considered data taken only at larger parameters and illustrates the importance of including
angles where the GMR cannot be unambiguously lighter nuclei.
identified except in the case of Th and U, where coo -- , , ,
essentially no other data exists. Morsch et al., 29500 r113
measured 2°spb, 232Th, and 238U using 172 MeV ot
particles,and we have included this data because _ 4oo vr_
these are the heaviest nuclei in which the GMR has _._-, _00 v_
been seen. As the 2°spb GMR position agrees with :_ 200 o o _othe TAMU value, no correction was made to the Io0
Julich work for systematic differences, o0 t I I 1,.
The silicon data point requires a special -5 -10 -5 0 5 10
comment. The GMR centroid given s as 17.9 MeV Kcout (MeV)
for 28Si is incorrect. The actual centroid and width Figure 1. Correlationbetween Kvo| and Kcoul. The resultsshown were obtained using various GMR data sets and
for the strength reported in the paper are 19.0 MeV parametersets.and 6.3 MeV.
I! - 30
From Figure 1, it is clear that Kcou!has a large 2. N.K.Oiendenning, Phys.Rev. C37, 2733 (1988).
effect on Knm, and including it as a free parameter 3. D.H. Youngblood, C.M. Rozsa, J.M. Moss,
leads to uncertainties of approximately 50%, except D.R. Brown, and J.D. Bronson, Phys. Rev.
for the 10 point Groningen data set. For this data Lett. 39, 1188 (1977).
_t, with Kcouias a free parameter Knm _ 226 MeV, 4. J.P. Blaizot, Phys. Rep. 64, 171 (1980).
rather than the _ 300 MeV found by Sharma. 5. J. Treiner, H. Krivine, and O. Bohigas, Nucl.
Including both Kcouland Kcurvas parameters leads to Phys. A371, 253 (1981).
errors exceeding 100_ for all coefficients. On the 6. D.H. Youngblood, P. Bogucki, J.D. Bronson,
other hand, Kde f is well defined at about 35 MeV and U. Garg, Y.-W. Lui, and C.M. Rozsa, Phys.
fixing it at this value or allowing it to vary has little Rev. C 23, 1997 (1981).
effect. Adding the 3He data points with A > 89 7. M. Buenerd, in Proc. of Int. Syrup. on Highly
reduces the uncertainties in the parameters slightly. Excited States and Nuclear Structure, Orsay,
Finally, including the data for elements lighter than France, Jou, de Phys. (Paris), edited by N.
Zr helps to further reduce the uncertainties in the Marty and N. Van Giai, Colloq. 45, C4-115
parameters. However, it is not possible to pin down (1984), and references therein.
the value of Knmwith accuracy of better than 509_. 8. Y.-W. Lui, J.D. Bronson, D.H. Youngblood, Y.
Thus the present complete data set is clearly not Toba, and U. Garg, Phys. Rev. C 31, 1642
adequate to limit the range of Knm to better than (1985), and references therein.
about a factor of 1.7 (200 to 350 MeV). Several 9. A. Van der Woude, W.T.A. Borghols, S.
things need to be done to pin down Knm. We need Brandenburg, M.M. Sharma and M.N. Harakeh,
measurements on considerably more than 16 nuclei Phys. Rev. Lett. 58, 2383 (1987).
and with more variation in mass. To the extent 10. M.M.Sharma, W.T.A.Borghols, S.Brandenburg,
possible, spherical nuclei should be chosen to S. Crona, A. Van der Woude and M.H.
eliminate effects of deformation. These Harakeh, Phys.Rev.C 38,2562 (1988); M.M.
measurements need to provide the centroid and width Sharma, in Proc. of Int. Winter Meeting on
of the GMR to better than 150 keV, after taking into Nuclear Physics, Bormio, Italy, edited by I. loft
account possible uncertainties in the continuum. (University of Milan, 1988), Vol.63, p.510.
Significant systematic errors between differing 11. M.M. Sharma, W. Stocker, P. Gleissl, and M.
measurements must be removed. The strength Black, Nucl. Phys. A504, 337 (1989); M.M.
distribution in light nuclei must be mapped over a Sharma in Proc. of the NATO Advanced Study
wide energy range. It will be worthwhile to carry Institute on Nuclear Equation of State, Pettsacola
out RPA calculations of the GMR with effective (Spain), 1989, edited by W. Greiner and H.
interactions that reproduce the ground state properties St6cker (Plenum, NY, 1990), Vol.216A, p.661.
of nuclei and the strength distribution of the GMR for 12. M.M. Sharma (unpublished); M.M. Sharma, in
light as well as heavy nuclei. Slide Report of the Notre Dame Workshop on
Giant Resonances and Related Phenomena, Notre
*Supported in part by the DOE Grant DE-FGG5- Dame, IN, 1991 (unpublished).
86ER40256, the National Science Foundation Grant 13. J.M. Pearson, Phys. Lett. 13271, 12 (1991).
9017008, and The Robert A. Welch Foundation. 14. M. Buenerd, D. Lebrun, Ph. Martin, P. de
Santignon and C. Perrin, Phys. Rev. Lett. 45,
References 1667 (1980).
15. U. Garg, P. Bogucki, J.D. Bronson, Y.-W. Lui,
1. A. Bohr and B.M. Mottleson, Nuclear Structure C.M. Rozsa, and D.H. Youngblood, Phys. Rev.
II (Benjamin, New.York, 1975). Lett. 45, 1670 (1980).
II - 31
16. Y. Abgrall, B. Morand, E. Caurier, and B. 27. _V.T A. Borghols, S.Brandenburg, J.H.Meier,
Grammaticos, Nucl. Phys. A346, 431 (1980). J.M. Schippers, M.M. Sharma, A. van der
17. S. Jang, Nucl. Phys. A401, 303 (1983). Woude, M.N. Harakeh, A. Lindholm, L.
18. N. Van Giai and H. Sagawa, Nucl. Phys. A371, Nilsson, S. Crona, A. HAkansson, L.P.
1 (1981). Ekstr6m, N. Olsson and R. De Leo, Nucl. Phys.
19. Ph. Chomaz, T. Suomijirvi, N. Van Giai, and J. A$84, 205 (1989).
Treiner, Phys. Lett. 13281, 6 (1992). 28. S. Brandenburg, W.T.A.Borghols, A.G.
20. S. Shlomo and G_ Bertsch, Nucl. Phys. A243, Drentje, L.P. Ekstr6m, M.N.Harakeh, A. van
507 (1975). der Woude, A. Hikanson, L. Nilsson, N.
21. U. Garg, P. Bogucki, J.D. Bronson, Y.-W. Lui, Olsson, M. Pignanelli, and R. De Leo, Nucl.
and D.H. Youngblood, Phys. Rev. C 29, 93 Phys. A466, 29 (1987).
(1984). 29. H.P. Morsch, C. Sfik6sd, M. Rogge, P. Turek,
22. Y.-W. Lui, P. Bogucki, J.D. Bronson, D.H. H. Machner, and C. Mayer-B6ricke, Phys. Rev.
Youngblood, and U. Garg, Phys. Rev. C 30, 51 C 22, 489 (1980); H. P. Morsch, M. Rogge,
(1984). P.Turek, C. Mayer-B6ricke and P. Decowski,
23. D.H. Youngblood and Y.-W. Lui, Phys. Rev. C Phys. Re,,,. C 25, 939 (1982).
44, 1878 (1991). 30. J.P. Blaizot, in Proc. of the NATO Advanced
24. G. Duhamel, M. Buenerd, P. de Saintignon, J. Study Institute of Nuclear Equatiov. of State,
Chauvin, D. Lebrun, Ph.Martin and G. Pert'in, Pefisacola, Spain, 1989, edited by W. Greiner
Phys. Rev. C 38, 2509 (1988). and H. St6cker (Plenum, NY 1990), Vol. 216 A,
25. H.J. Lu, S. Erandenburg, R. De Leo, M.N. p. 679.
Harakeh, T.D. Poelhekken, and A. van der 31. Y.-W. Lui, Private communication.
Woude, Phys. Rev. C 33, 1116 (1986).
26. S. Brandenburg, R. De Leo, A.G. Drentje,
M.N. Harakeh, H. Sakai and A. van der Woude,
Phys. Lett. BI30, 9 (1983).
II - 32
|-u
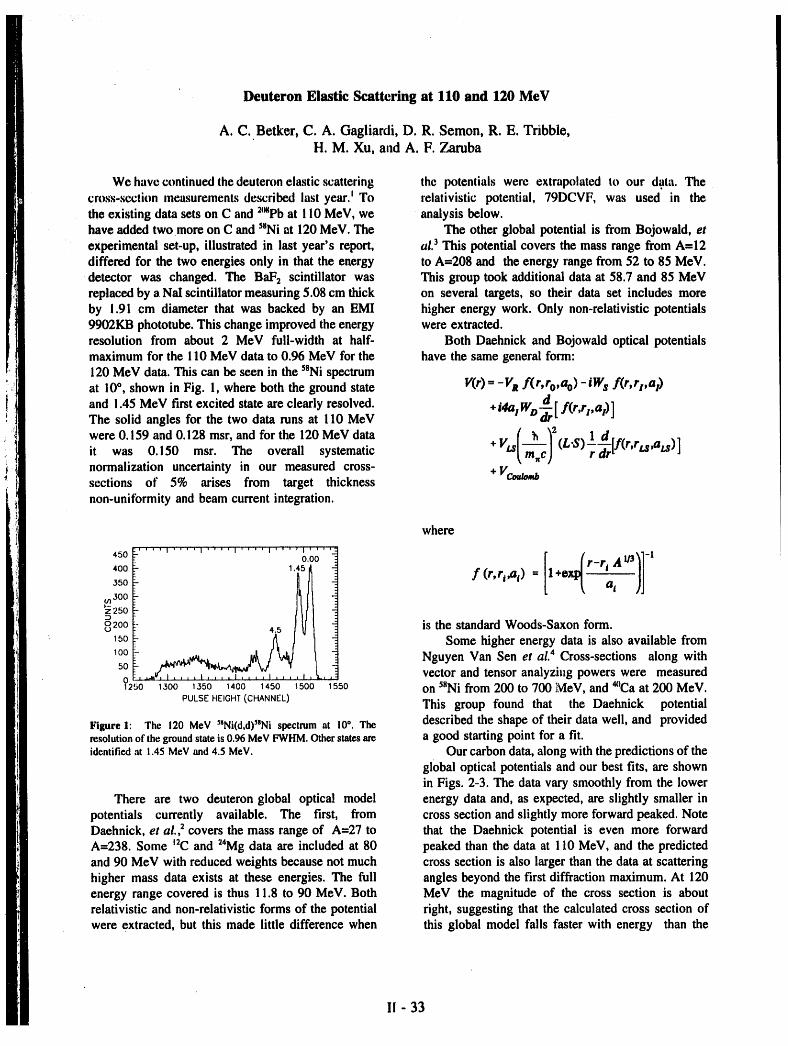
Deuteron Elastic Scattering at 110 and 120 MeV
A. C. Betker, C. A. Gagliardi, D. R. Semon, R. E. Tribble,H. M. Xu, and A. F. Zaruba
We have continued the deuteron elastic scattering the potentials were extrapolated to our data. Thecros;,;-section measurements described last year. I To relativistic potential, 79DCVF, was used in thethe existing data sets on C and 2_pb at 110 MeV, we analysis below.have added two more on C and SSNiat 120 MeV. The The other global potential is from Bojowald, etexperimental set-up, illustrated in last year's report, ¢/1.3 This potential covers the mass range from All2differed for the two energies only in that the energy to A=208 and the energy range from 52 to 85 MeV.detector was changed. The BaF 2 scintillator was This group took additional data at 58.7 and 85 MeVreplaced by a Nal scintillator measuring 5.08 cm thick on several targets, so their data set includes moreby 1.91 cm diameter that was backed by an EMI higher energy work. Only non-relativistic potentials9902KB phototube. This change improved the energy were extracted.resolution from about 2 MeV full-width at half- Both Daehnick and Bojowald optical potentialsmaximum for the 110 MeV data to 0.96 MeV for the have the same general form:120 MeV data. This can be seen in the SSNispectrumat 10°, shown in Fig. 1, where both the ground state V(r) = -V mf(r, ro,a o) -tW s f(r, rr,al)
and 1.45 MeV first excited state are clearly resolved. +i4alW D dd[ f(r,rz,at) ]The solid angles for the two data runs at 110 MeV dr'
were 0.159 and 0.128 msr, and for tbe 120 MeV data +V_(%_2(L's)ldrs%rLs_lzs)11 / --;-[J1, jit was 0.150 msr. The overall systematic _,m_c) ratnormalization uncertainty in our measured cross- +Vcou:ombsections of 5% arises from target thicknessnon-unitbrmity and beam current integration.
where
4._''''I''''I'"''I .... I''''I'''
400E- ,.45d f (r, rj,a l) = 1+ - -
300E- I'I[I
8 _°° _ 4.5 t _ I is the standard Woods-Saxon form.: ,so [- _. )'' Some higher energy data is also available from
l°°i-..^,,_.,__f'_ Nguyen Van Sen et aL4 Cross-sections along with50
,, J, L, vector and tensor analyzing powers were measured?250 1300 1350 1400 1450 1500 1550 on SSNifrom 200 to 700 MeV, and *)Ca at 200 MeV.
PULSEHEIGHT(CHANNEL) This group found that the Daehnick potential
Figure 1: The 120 MeV _BNi(d,d)S_Ni spectrum at 10 °. The described the shape of their data well, and providedresolution of the ground state is 0.96 MeV FWHM. Other states are a good starting point for a fit.identified at 1.45 MeV and 4.5 MeV. Our carbon data, along with the predictions of the
global optical potentials and our best fits, are shownin Figs. 2-3. The data vary smoothly from the lower
There are two deuteron global optical model energy data and, as expected, are slightly smaller in
potentials currently available. The first, from cross section and slightly more forward peaked. NoteDaehnick, et aL,2 covers the mass range of A=27 to that the Daehnick potential is even more forwardA=238. Some uC and 24Mg data are included at 80 peaked than the data at 110 MeV, and the predictedand 90 MeV with reduced weights because not much cross section is also larger than the data at scatteringhigher mass data exists at these energies. The full angles beyond the first diffraction maximum. At 120
energy range covered is thus 11.8 to 90 MeV. Both MeV the magnitude of the cross section is aboutrelativistic and non-relativistic forms of the potential right, suggesting that the calculated cross section ofwere extracted, but this made little difference when this global model falls faster with energy than the
II- 33
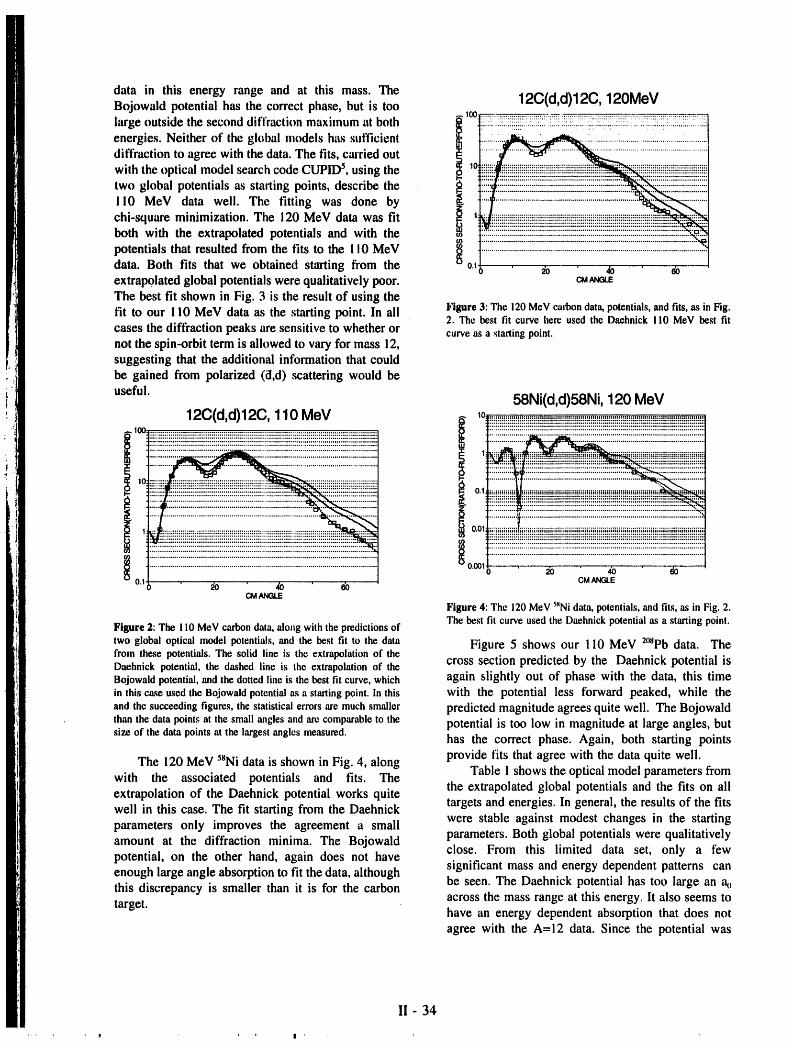
data in this energy range and at this mass. The 12C(d,d)12C,120MeVBojowald potentialhas the correct phase,but is toolarge outside the second diffraction maximum at both too_:_._;_ _::_::._::_:_:_:::_.::_:_::_.;_:_.:.:_;:_:::_:_:__:_energies. Neither of the global models has suMcientdiffraction to agree with the data. The fits, carried outwith the optical model search code CUPID s, using the 1 :::.... --.:............:......:.......::::::::-two global potentials as starting points, describe theII0 MeV data well. The fitting was done bychi-square minimization. The 120 MeV data was fitboth with the extrapolated potentials and with the
potentials that resulted from the fits to the 110 MeV _ __data. Both fits that we obtained starting from the 0.1extrapolated global potentials were qualitatively poor. c_The best fit shown in Fig. 3 is the result of using thefit to our 110 MeV data as the starting point. In all Figure 3: The 120MeVcarbondata, potentials, and fits,as in Fig.
2. The best fit curve here used the Daehnick 110 MeV best fit
cases the diffraction peaks are sensitive to whether or curveas a startingpoint.not the spin-orbit term is allowed to vary for mass 12,suggesting that the additional information that couldbe gained from polarized (_,d) scattering would be
useful. 58Ni(d,d)58Ni,120 MeV12C(d,d)12C,110 MeV lo............................................................................................................!_!_!!::!!::!!!!::!!!!!!!!!_:!!!:_!!!::::!!!!!!!!!::!!:_!!_:!!!!!!!!!!!!!!_:!!!!::r_:!!!!!::!!!:_!!!!::!!!::!::_!!!!!!!!!!!
100 ..................::::::::::::::::::::::::::::::::::::::::::::::::::::::::::::::::::::::::::::::::::::::::::::::_!_!_!i_!_i_i_i_!_!_:_._::::::::::::::::::::::_11 "-;i "i;i ..... :::ill;[_iiii"i'Fi;';i_;_;;iliF;i-;iii'J
'i I0.11 [.=i!ilt-qi.=|| " .=Hi
0.01_
o.ool _ _ 80
0.1 20 _ CM_ANGLE
Figure 4: The 120 MeV S_Nidata, potentials, and fits, as in Fig. 2.
The best fit curve used the Daehnick potential as a starting point.Figure 2: The ! 10 MeV carbon data, along with the predictions of
two global optical model potentials, and the best fit to the data Figure 5 shows our 110 MeV _°sPb data. Thefrom these potentials. The solid line is the extrapolation of the
cross section predicted by the Daehnick potential isDaehnick potential, the dashed line is the extrapolation of the
Bojowald potential, and the dotted line is the best fit curve, which again slightly out of phase with the data, this timein this case used the Bojowald potential as a starting point. In this with the potential less forward peaked, while theand the succeeding figures, the statistical errors are much smaller predicted magnitude agrees quite well. The Bojowaldthan the data points at the small angles and are comparable to the potential is too low in magnitude at large angles, butsize of the data points at the largest angles measured.
has the correct phase. Again, both starting points
The 120 MeV _SNidata is shown in Fig. 4, along provide fits that agree with the data quite well.Table 1 shows the optical model parameters from
with the associated potentials and fits. Thethe extrapolated global potentials and the fits on all
extrapolation of the Daehnick potential works quitewell in this case. The fit starting from the Daehnick targets and energies. In general, the results of the fits
were stable against modest changes in the startingparameters only improves the agreement a smallamount at the diffraction minima. The Bojowald parameters. Both global potentials were qualitativelypotential, on the other hand, again does not have close. From this limited data set, only a fewenough large angle absorption to fit the data, although significant mass and energy dependent patterns canthis discrepancy is smaller than it is for the carbon be seen. The Daehnick potential has too large an %target, across the mass range at this energy. It also seems to
have an energy dependent absorption that does notagree with the A=I2 data. Since the potential was
I1 - 34
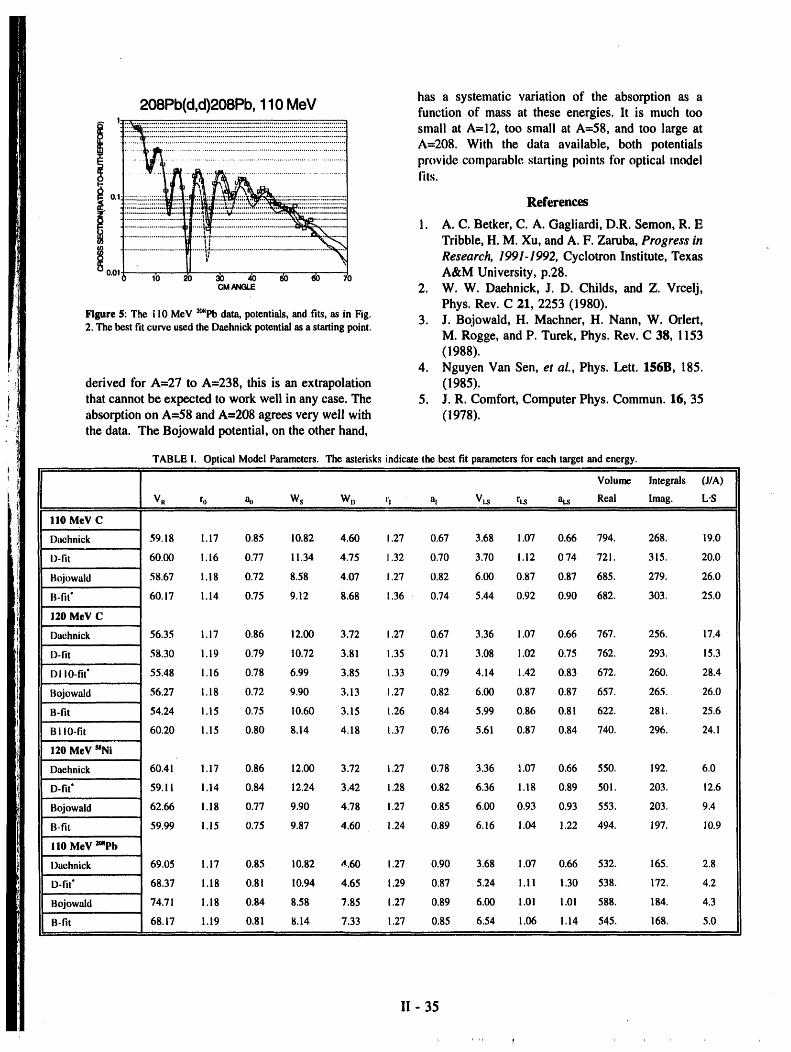
has a systematic variation of the absorption as a208Pb(d,d)208Pb, 110 MoV function of mass at these energies. It is much too
I:!!!:!!...i!!iii!iiiiiii!i!iiii!i!iii!ii!ii!iiiii!i!ii!iiiii!!iiii!!_ii!i!!iii!!iiiiiiiiiiiiii!iii_iii_i!i_iiismall at A=I2, too small at A=58, and too large atA=208. With the data available, both potentials
....... _.....................:....................................................... provide comparable starting points for optical model
........... _ .....d................................................. fits.
I o.,!! ' '
Tribble, It. M. Xu, and A. F. Zaruba, Progress in
Research, 1991-1992, Cyclotron Institute, Texaso.ol lo a0 40 _o eb 70 A&M University, p.28.
c_,_.E 2. W.W. Daehnick, J. D. Childs, and Z. Vrcelj,Phys. Rev. C 21, 2253 (1980).
Figure 5: The i 10 MeV _Pb data, potentials, and fits, as in Fig. 3. J. Bojowald, H. Machner, H. Nann, W. Orlert,2. The best fit curve used the Daehnick potential as a starting point.
M. Rogge, and P. Turek, Phys. Rev. C 38, 1153(1988).
4. Nguyen Van Sen, et al., Phys. Lett. lS6B, 185.derived for A-27 to A=238, this is an extrapolation (1985).that cannot be expected to work well in any case. The 5. J.R. Comfort, Computer Phys. Commun. 16, 35absorption on A=58 and A=208 agrees very well with (1978).the data. The Bojowaid potential, on the other hand,
TABLE !. Optical Model Parameters. The asterisks indicate the best fit parameters for each target and energy.,,
Volume Integrals (J/A)
Vr ro _ Ws WD m'z al VLs rts a_ Real lmag. L.S,,,,
I10 MeV C
Daehnick 59. !8 I. !7 0.85 10.82 4.60 1.27 0.67 3.68 1.07 0.66 794. 268. 19.0
D-fit 60.00 I. !6 0.77 11.34 4.75 1.32 0.70 3.70 1.12 0 74 721. 315. 20.0
Bojowald 58.67 I. 18 0.72 8.58 4.07 1.27 0.82 6.00 0.87 0.87 685. 279. 26.0
B-fit" 60.17 !.14 0.75 9.12 8.68 1.36 0.74 5.44 0.92 0.90 682. 303. 25.0
120 MeV C
Dachnick 56.35 I. 17 0.86 12.00 3.72 1.27 0.67 3.36 1.07 0.66 767. 256. 17.4
D-fit 58.30 i. 19 0.79 10.72 3.8 ! 1.35 0.71 3.08 1.02 0.75 762. 293. 15.3
l)110-fit" 55,48 1.16 0.78 6.99 3.85 1.33 0.79 4.14 1.42 0.83 672. 260. 28.4r ,
Bojowald 56.27 I. 18 0.72 9.90 3.13 1.27 0.82 6.00 0.87 0.87 657. 265. 26.0
B-fit 54.24 1.15 0.75 10.60 3.15 [.26 0.84 5.99 0.86 0.81 622. 281. 25.6
B110-fit 60.20 1.15 0.80 8.14 4.18 1.37 0.76 5.61 0.87 0.84 740. 296. 24.1
120 MeV SJni
Daehnick 60.41 I. 17 0.86 12.00 3.72 1.27 0.78 3.36 1.07 0,66 550. 192. 6.0
D-fit" 59.11 1.14 0.84 12.24 3.42 1.28 0.82 6.36 1.18 0.89 501. 203. 12.6
aojowald 62.66 !.18 0.77 9.90 4.78 1.27 0.85 6.00 0.93 0.93 553. 203. 9.4
B-fit 59.99 1.15 0.75 9.87 4.60 1.24 0.89 6.16 1.04 1.22 494. 197. 10.9, ,
110 MeV 2°aPb,,
Dachnick 69.05 !. !7 0.85 10.82 ,_.60 1.27 0.90 3.68 1.07 0.66 532. 165. 2.8
D-fit" 68.37 1.18 0.81 10.94 4.65 [.29 0.87 5.24 1.11 1.30 538. 172. 4.2
Bojowald 74.71 I. 18 0.84 8.58 7.85 1.27 0.89 6.00 1.01 ! .01 588. 184. 4.3
B-fit 68.17 1.19 0.81 8.14 7.33 1.27 0.85 6.54 1.06 1.14 545. 168. 5.0• ,
II- 35
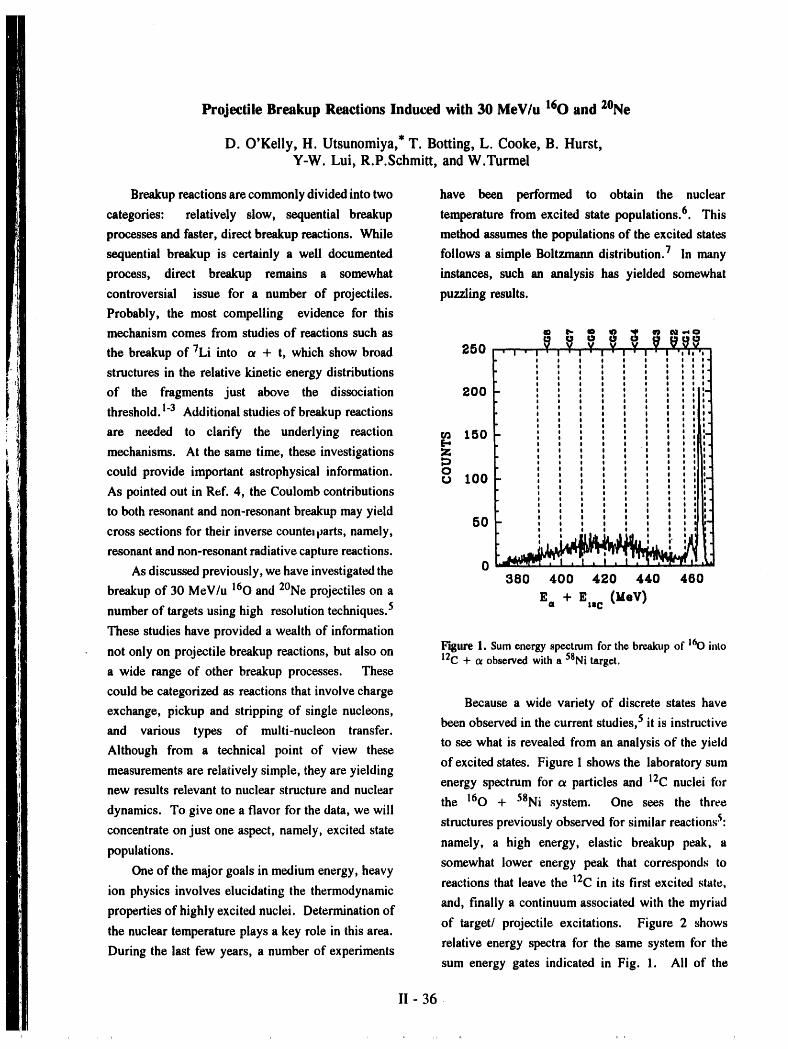
Projectile Breakup Reactions Induced with 30 MeV/u 160 and 2°Ne
D..'Kelly, H. Utsunomiya,* T. BoRing, L. Cooke, B. Hurst,Y-W. Lui, R.P.Schmitt, and W.Turmel
Breakup reactions are commonly divided into two have been performed to obtain the nuclear
categories: relatively slow, sequential breakup temperature from excited state populations. 6. This
processes and faster, direct breakup reactions. While method assumes the populations of the excited states
sequential breakup is certainly a well documented follows a simple Boltzmann distribution. 7 In many
process, direct breakup remains a somewhat instances, such an analysis has yielded somewhat
controversial issue for a number of projectiles, puzzling results.
Probably, the most compelling evidence for this
mechanism comes from studies of reactions such as __ _. _ __° + _ _ _"°the breakup ofTLiinto ot + t, which show broad 250 . a • i i i Y i I J 'l ",l,',
structures in the relative kinetic energy distributions i i
I(of the fragments just above the dissociation 1300 : :
threshold. 1-3 Additional studies of breakup reactions i
are needed to clarify the underlying reaction _ 150 [ _i-_mechanisms. At the same time, these investigations Z : : _ I1!_n,_
could provide important astrophysical information. _oo 100 :i :: :i [li'_111-1
As pointed out in Ref. 4, the Coulomb contributions : : _ [[it
I l
to both resonant and non-resonant breakup may yield : , : ,
cross sections for their inverse countmparts, namely, 50 ' , , , :! ! I 0t t I ! I °, ,'_.+lllt__,l,lJl,,, : ,. ,d
resonant and non-resonant radiative capture reactions. _b___, 2 .__
As discussed previously, we have investigated the 0 380 400 420 440 460
breakup of 30 MeV/u 160 and 2°Ne projectiles on a g + g (geV)number of targets using high resolution techniques. 5 a tac
These studies have provided a wealth of informationFigure 1. Sum energyspectrumfor the breakupof 160 into
not only on projectile breakup reactions, but also on 12c + o_observedwith a 58Ni target.a wide range of other breakup processes. These
could be categorized as reactions that involve chargeBecause a wide variety of discrete states have
exchange, pickup and stripping of single nucleons,been observed in the current studies, 5 it is instructive
and various types of multi-nucleon transfer.to see what is revealed from an analysis of the yieldAlthough from a technical point of view theseof excited states. Figure 1 shows the laboratory sum
measurements are relatively simple, they are yieldingnew results relevant to nuclear structure and nuclear energy spectrum for c_ particles and 12C nuclei for
the 160 + 58Ni system. One sees the threedynamics. To give one a flavor for the data, we will
structures previously observed for similar reactionsS:concentrate on just one aspect, namely, excited state
populations, namely, a high energy, elastic breakup peak, asomewhat lower energy peak that corresponds to
One of the major goals in medium energy, heavyreactions that leave the 12C in its first excited state,
ion physics involves elucidating the thermodynamicand, finally a continuum associated with the myriad
properties of highly excited nuclei. Determination ofof target/ projectile excitations. Figure 2 shows
the nuclear temperature plays a key role in this area.relative energy spectra for the same system for the
During the last few years, a number of experimentssum energy gates indicated in Fig. 1. All of the
II - 36
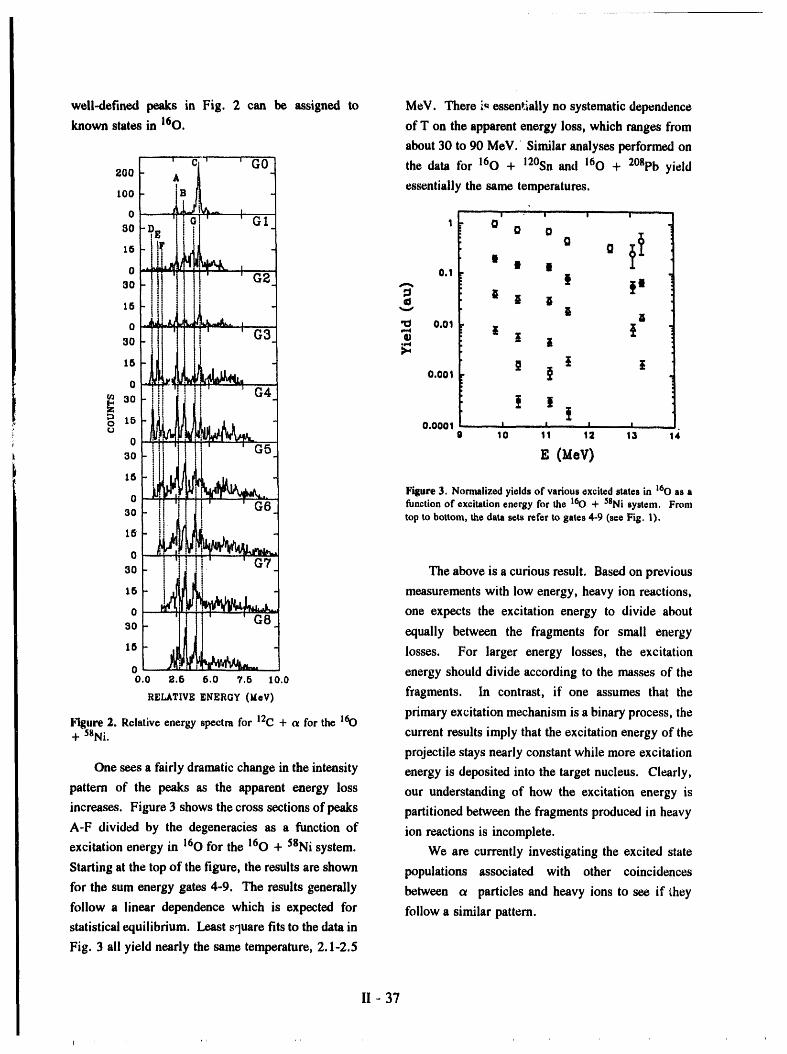
well-defined peaks in Fig. 2 can be assigned to MeV. There i,_essentially no systematic dependence
known states in 160. of T on the apparent energy loss, which ranges from
about 30 to 90 MeV. Similar analyses performed on
Zoo the data for 160 + 12°Sn and 160 + 2°8pb yield
too es_ntially the same temperatures.
0 _ ! " L" I I " l --30 1 D D
15 Q Q X_
| | !1
o o.1 ! i'80
15 ,.4 l tl
o ool z, z
3o zz5 g Z Z
0.0010
I ! i_, _o 15 0.0001 i, i ....,
ro o 1o 11 12 1.1o30 E (MeV)
15
Figure 3. Normalized yields of various excited states in 160 as a
0 function of excitation energy for the 160 + 5sNi system. From
30 top to bottom, the data sets refer to gates 4-9 (see Fig. I).15'
0
30 The above is a curious result. Based on previous
15 measurements with low energy, heavy ion reactions,
0 one expects the excitation energy to divide about
ao equally between the fragments for small energy
10 losses. For larger energy losses, the excitation
o energy should divide according to the masses of the0.0 _-.5 6.0 7.5 10.0
RELATIVE ENERGY (MeV) fragments. In contrast, if one assumes that the
Figure 2. Relative energy spectra for 12C + o_ for the 160 primary excitation mechanism is a binary process, the+ 58Ni" current results imply that the excitation energy of the
projectile stays nearly constant while more excitation
One sees a fairly dramatic change in the intensity energy is deposited into the target nucleus. Clearly,
pattern of the peaks as the apparent energy loss our understanding of how the excitation energy is
increases. Figure 3 shows the cross sections of peaks partitioned between the fragments produced in heavy
A-F divided by the degeneracies as a function of ion reactions is incomplete.
excitation energy in 160 for the 160 + 58Ni system. We are currently investigating the excited state
Starting at the top of the figure, the results are shown populations associated with other coincidences
for the sum energy gates 4-9. The results generally between ot particles and heavy ions to see if they
follow a linear dependence which is expected for follow a similar pattern.statistical equilibrium. Least square fits to the data in
Fig. 3 all yield nearly the same temperature, 2.1-2.5
II - 37
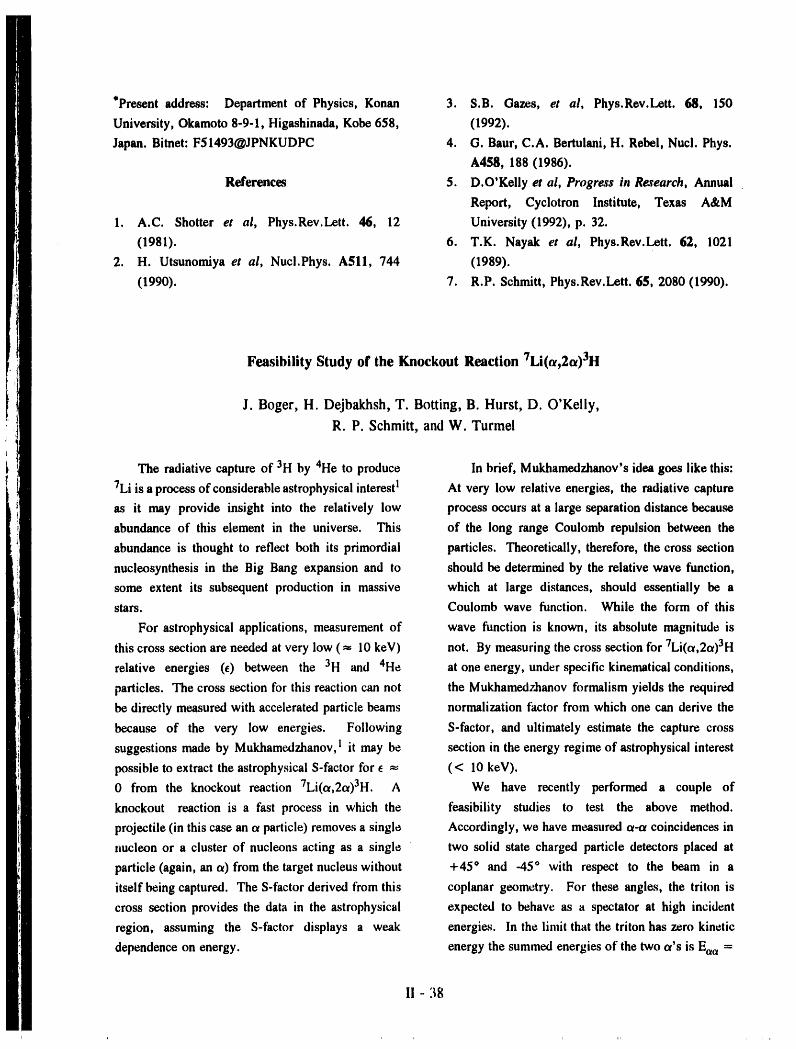
*Present address: Department of Physics, Konan 3. S.B. Gazes, et al, Phys.Rev.Lett. 68, 150
University, Okamoto 8-9-I, Higashinada, Kobe 658, (1992).
Japan. Bitnet: F51493@JPNKUDPC 4. G. Baur, C.A. Bertulani, H. Rebel, Nucl. Phys.
A458, 188 (1986).
References 5. D.O'Kelly et al, Progress in Research, Annual
Report, Cyclotron Institute, Texas A&M
1. A.C. Shotter et al, Phys.Rev.Lett. 46, 12 University (1992), p. 32.
(1981). 6. T.K. Nayak et al, Phys.Rev.Lett. 62, 1021
2. H. Utsunomiya et al, Nucl.Phys. A511, 744 (1989).
(1990). 7. R.P. Schmitt, Phys.Rev.Lett. 65, 2080 (1990).
Feasibility Study of the Knockout Reaction 7Li(_,2a)3H
J. Boger, H. Dejbakhsh, T. BoRing, B. Hurst, D. O'Kelly,
R. P. Schmitt, and W. Turmel
The radiative capture of 3H by 4He to produce In brief, Mukhamedzhanov's idea goes like this:
7Li is a process of considerable astrophysical interestI At very low relative energies, the radiative capture
as it may provide insight into the relatively low process occurs at a large separation distance because
abundance of this element in the universe. This of the long range Coulomb repulsion between the
abundance is thought to reflect both its primordial particles. Theoretically, therefore, the cross section
nucleosynthesis in the Big Bang expansion and to should be determined by the relative wave function,
some extent its subsequent production in massive which at large distances, should essentially be a
stars. Coulomb wave function. While the form of this
For astrophysical applications, measurement of wave function is known, its absolute magnitude is
this cross section are needed at very low ( _ 10 keV) not. By measuring the cross section for 7Li(c_,2cc)3H
relative energies (e) between the 3H and 4He at one energy, under specific kinematical conditions,
particles. The cross section for this reaction can not the Mukhamedzhanov formalism yields the required
be directly measured with accelerated particle beams normalization factor from which one can derive the
because of the very low energies. Following S-factor, and ultimately estimate the capture cross
suggestions made by Mukhamedzhanov, 1 it may be section in the energy regime of astrophysical interest
possible to extract the astrophysical S-factor for _ _ (< 10 keV).
0 from the knockout reaction 7Li(cc,2_)3H. A We have recently performed a couple of
knockout reaction is a fast process in which the feasibility studies to test the above method.
projectile (in this case an c_particle) removes a single Accordingly, we have measured ot-c_coincidences in
nucleon or a cluster of nucleons acting as a single two solid state charged particle detectors placed at
particle (again, an c_) from the target nucleus without +45 ° and -45 ° with respect to the beam in a
itself being captured. The S-factor derived from this coplanar geometry. For these angles, the triton is
cross section provides the data in the astrophysical expected to behave as a spectator at high incident
region, assuming the S-factor displays a weak energies. In the limit that the triton has zero kinetic
dependence on energy, energy the summed energies of the two ot's is Eaa =
II -38
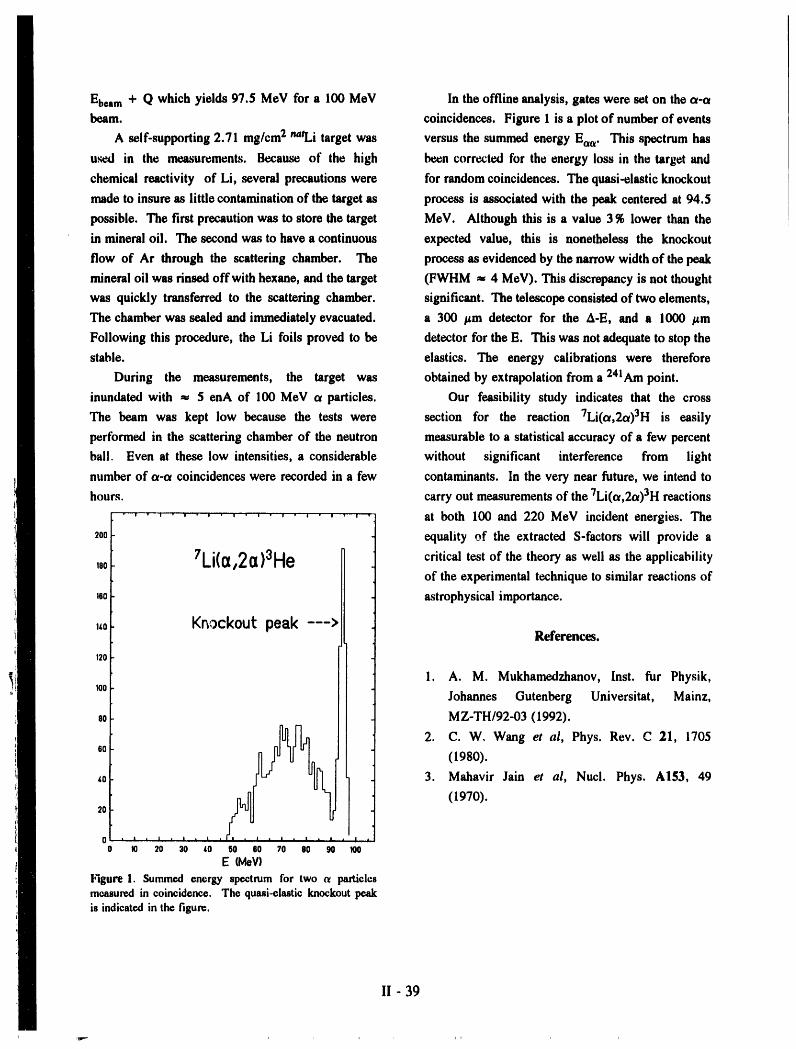
Ebeam+ Q which yields 97.5 MeV for a 100 MeV In the offline analysis, gates were set on the a-a
beam. coincidences. Figure 1 is a plot of number of events
A self-supporting 2.71 mg/cm 2 natLi target was versus the summed energy Eaw This spectrum has
used in the measurements. Because of the high been corrected for the energy loss in the target and
chemical reactivity of Li, several precautions were for random coincidences. The quasi-elastic knockout
made to insure as little contamination of the target as process is associated with the peak centered at 94.5
possible. The first precaution was to store the target MeV. Although this is a value 3 % lower than the
in mineral oil. The second was to have a continuous expected value, this is nonetheless the knockout
flow of Ar through the scattering chamber. The process as evidenced by the narrow width of the peak
mineral oil was rinsed off with hegane, and the target (FWHM _, 4 MeV). This discrepancy is not thought
was quickly transferred to the scattering chamber, significant. The telescope consisted of two elements,
The chamber was sealed and immediately evacuated, a 300 _m detector for the A-E, and a 1000 ttm
Following this procedure, the Li foils proved to be detector for the E. This was not adequate to stop the
stable, elastics. The energy calibrations were therefore
During the measurements, the target was obtained by extrapolation from a 241Am point.
inundated with _ 5 enA of 100 MeV a particles. Our feasibility study indicates that the cross
The beam was kept low because the tests were section for the reaction 7Li(et,2_)3H is easily
performed in the scattering chamber of the neutron measurable to a statistical accuracy of a few percent
ball. Even at these low intensities, a considerable without significant interference from light
number of a-ct coincidences were recorded in a few contaminants. In the very near future, we intend to
hours, carry out measurements of the 7Li(cr,2ot)3H reactions
• ' ' ............ ...... at both 100 and 220 MeV incident energies. The
200 equality of the extracted S-factors will provide a
,. ZLi(a,2a)3He critical test of the theory as well as the applicabilityof the experimental technique to similar reactions of
_s0 astrophysical importance.
,,0 Knockoutpeak --->References.
120 -t
1. A. M. Mukhamedzhanov, Inst. fur Physik,
o mo Johannes Gutenberg Universitat, Mainz,
s0 MZ-TH/92-03 (1992).
2. C. W, Wang et al, Phys. Rev. C 21, 1705
s0 (1980).
_0 3. Mahavir Jain et al, Nucl. Phys. A153, 49
(1970).20
l
0[ • t . i . t , | . . I •
O 10 20 30 60 50 60 70 80 90 100E (MeV)
Figure 1. Summed energy spectrum for two c_ particlesmeasuredin coincidence. The quasi-elasticknockoutpeakis indicatedin the figure.
II-39
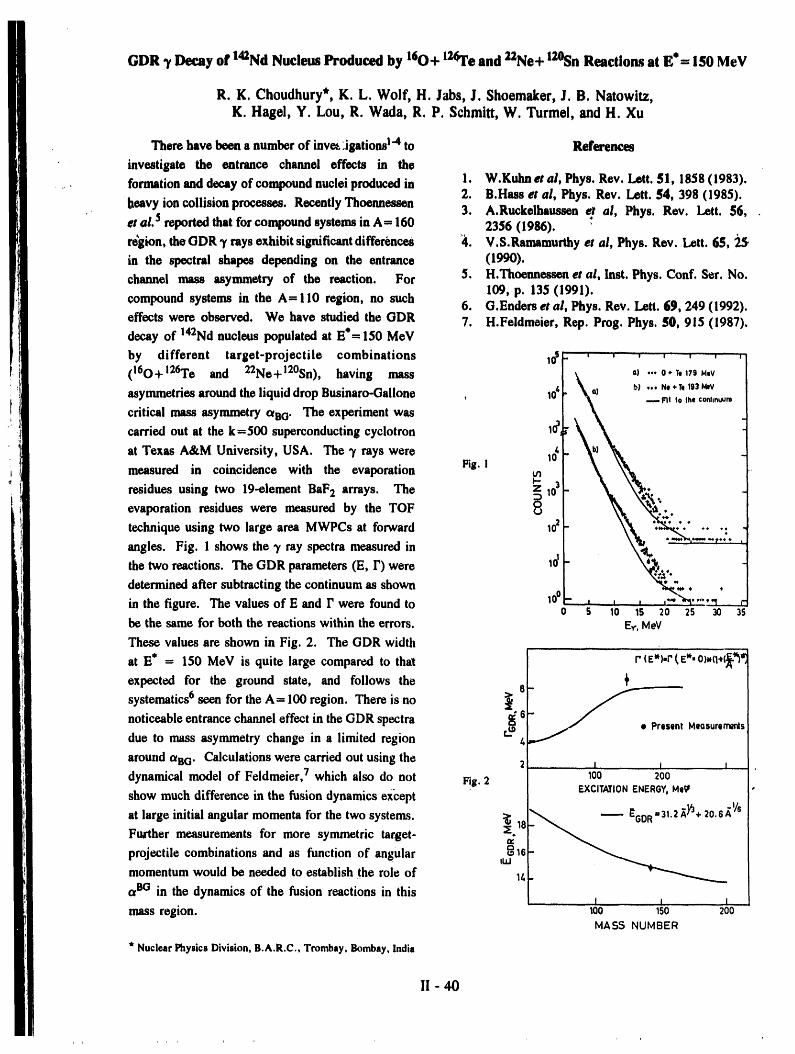
GDR 7 Decay of 142Nd Nucleus Produced by 160+ 12(Pre and _Ne+ lZ°Sn Reactions at E*= 150 MeV
R. K. Choudhury*, K. L. Wolf, H. Jabs, J. Shoemaker, J. B. Natowitz,K. Hagel, Y. Lou, R. Wada, R. P. Schmitt, W. Turmel, and H. Xu
There have been a number of inve_;igations TMto References
investigate the entrance channel effects in the
• .. formation and decay of compound nuclei produced in 1. W.Kuha et al, Phys. Rev. Lett. 51, 1858 (1983),
heavy ion collision processes. Recently Thoennessen 2. B.Hass et al, Phys. Rev. Left. 54, 398 (1985)., 3, A.Ruckelhaussen et al, Phys. Rev. Lett. 56, .
et al. 5 reported that for compound systems in A= 160 2356 (1986),re'gion, the GDR 3' rays exhibit significant differences "4. V.S.Ramamurthy et al, Phys. Rev. Lett. 65,
in the spectral shapes depending on the entrance (1990).
channel mass asymmetry of the reaction. For 5. H.Thoennessenet al, Inst. Phys. Conf. Set. No.109, p. 135 (1991).
compound systems in the A= 110 region, no such6. G.Enders et al, Phys. Rev. Lett. 69, 249 (1992).
effects were observed. We have studied the GDR 7. H.Feldmeier, Rep. Prog. Phys. 50, 915 (1987).decay of 142Nd nucleus populated at E*= 150 MeV
I ! I' '"' ! I ! ! ]by different target-projectile combinations l°S \ o) ... 0*T,170M,v(160+ 126Te and 22Ne+ 12°Sn), having mass
asymmetries around the liquid drop Businaro-Gallone 10_,[._e) _,)... N.*T,193_vcritical mass asymmetry c_eo. The experiment was ' | _x_ -.nt 1oth,co_,,,_m
carried out at the k-500 superconducting cyclotron 103_ _i_ '__ '_.at Texas A&M University, USA. The 'y rays were 104measured in coincidence with the evaporation Fig. !
residues using two 19-element BaF2 arrays. The z 103. ...
evaporation residues were measured by the TOF _ __technique using two large area MWPCs at forward 1o2 - ,.._.- ,::.angles. Fig. 1 shows the 7 ray spectra measured in \4
the two reactions. The GDR parameters (E, I') were 1_ %determined after subtracting the continuum as shown ,.... .in the figure. The values of E and I' were found to 1°° " ' ' ' '_ "_ ' "_o s lo is 20 25 3o 3sbe the same for both the reactions within the errors. E_.,MeV
These values are shown in Fig. 2. The GDR width
at E* = 150 MeV is quite large compared to that r'(E*).r(E*.O).(l+(_-_*,
expected for the ground state, and follows the
systematics 6 seen for the A= 100 region. There is no _ e "_e//
noticeable entrance channel effect in the GDR spectra a_6 PresentMeosuremmtsdue to mass asymmetry change in a limited region #4
around c_eG. Calculations were carried out using the 2 ..I I l..dynamical model of Feldmeier, 7 which also do not Fig. 2 100 200 'show much difference in the fusion dynamics except EXCITATIONENERGY,Me7
" "_A_/_5
at large initial angular momenta for the two systems. _ 18 "'-- " '
Further measurements for more symmetric target- 16projectile combinations and as function of angular ,,,,momentum would be needed to establish the role of 14
ofBG in the dynamics of the fusion reactions in this I I Imass region, loo _so 200
MASS NUMBER
• NuclearPtlyiici Division,B.A.R.C.,Trombay,Bombay,India
II - 40
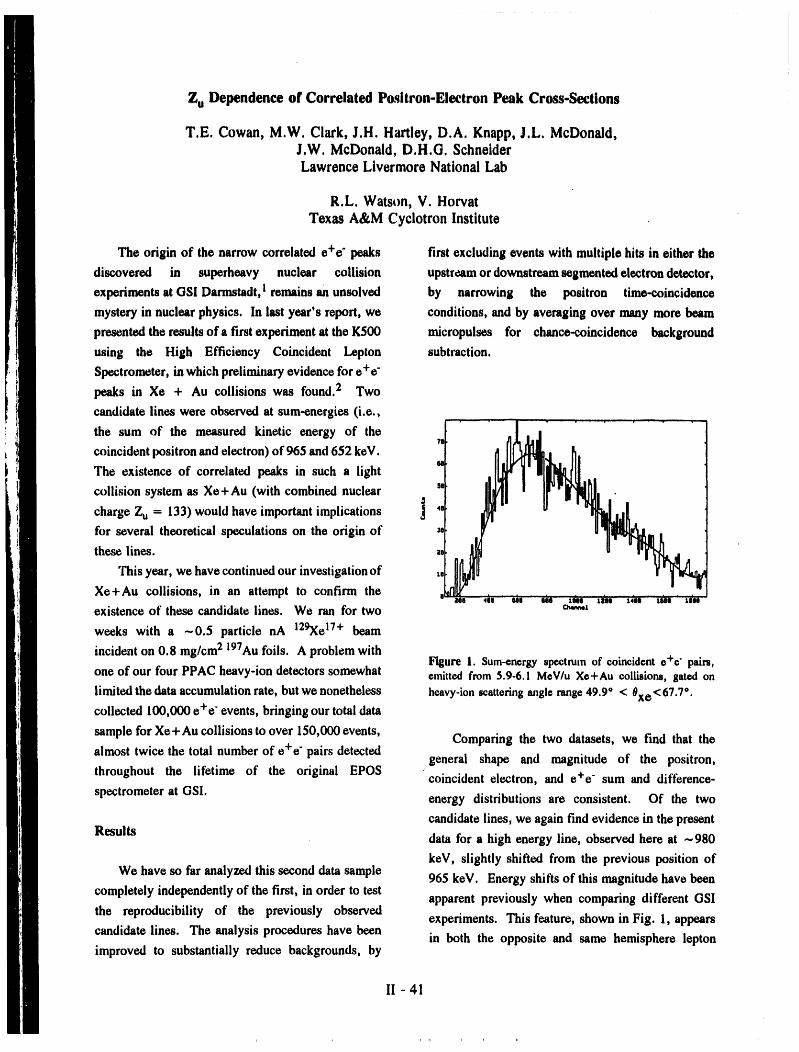
Z u Dependence of Correlated Positron-Electron Peak Cross-Sections
T.E. Cowan, M,W. Clark, J,H. Hartley, D.A. Knapp, J.L. McDonald,J.W. McDonald, D,H.G. SchneiderLawrence Livermore National Lab
R.L. Watson, V. HorvatTexas A&M Cyclotron Institute
The origin of the narrow correlatede+e" peaks trst excludingevents with multiple hits in either the
discovered in superheavy nuclear collision upstreamor downstreamsegmentedelectrondetector,
experimentsat GSI Darmstadt,I remainsan unsolved by narrowing the positron time-coincidence
mysteryin nuclearphysics. In lastyear's report, we conditions, andby averaging over manymore beam
presentedthe resultsof a firstexperimentat theK500 micropulses for chance-coincidence background
using the High Efficiency Coincident Lepton subtraction.
Spectrometer,in whichpreliminaryevidencefore+e"
peaks in Xe + Au collisions was found.2 Twocandidate lines were observed at sum-energies(i.e.,
! •the sum of the measured kinetic energy of the?m
coincidentpositronandelectron)of 965 and 652 keV.
The existence of correlated peaks in such a light u
collision system as Xo+Au (with combined nuclear
charge Zu = 133) would have importantimplications ] 4_
for several theoreticalspeculations on the origin of Nthese lines.
This year, we havecontinuedourinvestigationof ta
Xe+Au collisions, in an attempt to confirm the e, ....... :/a L_, ' _4so' _/u _s'uexistence of these candidate lines. We ran for two c_,,,,,l
weeks with a -0.5 particle nA 129Xe17+beam
incident on 0.8 mg/cm2 197Au foils. A problemwithFigureI. Sum-energyspcxtrumof coincidente+e" pairs,
one of our fourPPAC heavy-ion detectorssomewhat emittedfrom5.9-6.I MeV/uXe+Au collisions,gatedonlimitedthe dataaccumulationrate,butwe nonetheless heavy-ion scattering angle range49.9° < 0xe<67.7°.collected 100,000 e+e - events, bringingourtotal data
sample forXe+Aucollisionstoover 150,00Oevents, Comparing the two datasets, we find that thealmost twice the total numberof e+e" pairsdetected
general shape and magnitude of the positron,throughout the lifetime of the original EPOS coincident electron, and e+e" sum and difference-spectrometerat GSI. energy distributions are consistent. Of the two
candidate lines, we again find evidence in the present
Results data for a high energy line, observed here at -980
keV, slightly shifted from the previous position of
We have so faranalyzed this second data sample 965 keV. Energy shifts of this magnitude have beencompletely independently of the first, in orderto test
apparent previously when comparing different GSIthe reproducibility of the previously observed
experiments. This feature, shown in Fig. 1, appearscandidate lines. The analysis procedures have been
in both the opposite and same hemisphere leptonimproved to substantially reduce backgrounds, by
II - 41
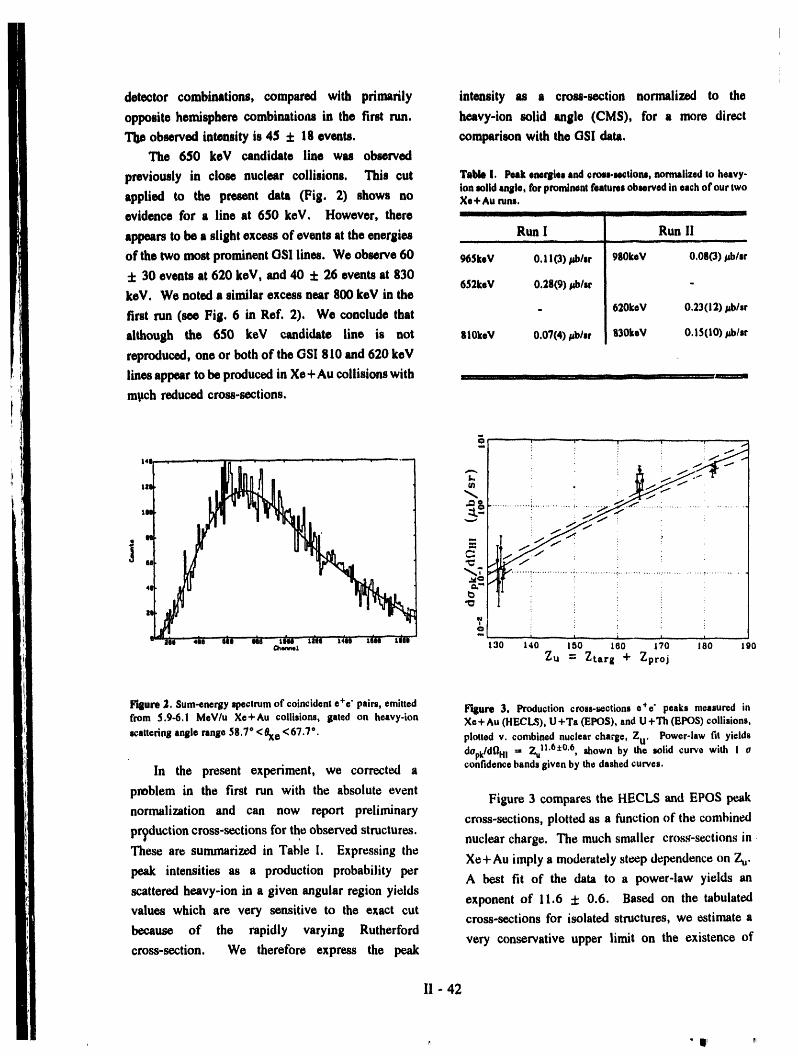
detector combinations, compared with primarily intensity as a cross-section normalized to the
opposite hemisphere combinations in the first run. heavy-ion solid angle (CMS), for a more direct
Tile observed intensity is 45:1:18 events, comparison with the OSl data.
The 650 keV candidate line was observed
previously in close nuclear collisions. This cut TableI, Peakemqliesand0ma-N0tiOnS,normalizedto heavy-ionmildtnllle,forprominentfeaturesobservedineachof ourtwo
applied to the present data (Fig. 2) shows no Xe+Aunms.evidence for a line at 650 keV. However, there , _ " ....
appears to be a slight excess of events at the energies Run I Run I1III I IIIII II II _ IIIII I Ill II _
of the two most prominent GSI lines. We observe 60 965k,V 0. I IO) _b/sr 980keV 0.080) pb/sr
4" 30 events at 620 keV, and 40:1:26 events at 830652keV 0.28(9)A_b/sr
keV. We noted a similar excess near 800 keV in the
first run (see Fig. 6 in Ref. 2), We conclude that . 620keV 0.23(12);tb/sr
although the 650 keV candidate line is not Itl0keV 0.07(4)jub/sr 830keV 0.15(t0);_b/sr
reproduced, one or both of the GSI 810 and 620 keV
lines appear to be produced in Xe+Aucollisionswith r_ _ _,,,,,_r n ..............
mpch reduced cross-sections.
, . .......,,, a.-r ..... :........... ..... :......... ...........ii _ !! :I_I_ : i" :
U
...... i" .= I i iSi
'I' _ i i i
|S| 400 US Nit _tlHIO IZliS t4SS tIHHi tlilll "" ' ......... '- - '_mmt 130 t40 150 160 170 1 0 tg0
2u = Zt.arll + Zproj
Flllure_. Sum-energyspectrumof coincidente+e"pairs,emitted I_ure 3. Productioncross-sectionse+e" peaks measuredinfrom 5.9-6.1 MeV/u Xe+Au collisions, gatedon heavy-ion Xe+Au (HECLS),U+Ta (EPOS),andU+Th (EPOS)collisions,
scatterln8anglerange58.7°<0xe<67.Te. plottedv. contbinednuclearcharge,Zu. Power-lawfit yieldsdOpk/d_Hi= Zu11"6:1:0'6,shownby the wild curvewith i oconfidencebandsgivenby thedashedcurves.
In the present experiment, we corrected a
problem in the first run with the absolute eventFigure 3 compares the HECLS and EPOS peak
normalization and can now report preliminary cross-sections, plotted as a function of the combinedpr_luction cross-sections for the observed structures., nuclear charge. The much smaller cros,_-sections inThese are summarized in Table 1. Expressing the
Xe+Au imply a moderately steep dependence on Z,u.
peak intensities as a production probability per A best fit of the data to a power-law yields anscattered heavy-ion in a given angular region yields
exponent of 11.6 :t: 0.6. Based on the tabulatedvalues which are very sensitive to the exact cut cross-sections for isolated structures, we estimate abecause of the rapidly varying Rutherford
very conservative upper limit on the existence ofcross-section. We therefore express the peak
II - 42
• IIii _,
unresolved features of < 0.5 _b/sr. This yields a We gratefully acknowledge the technical support
lower limit on the exponent for a power-law fit, of the K500 operations staff, and financial support
suggesting that the peak cross-section scales more from the DOE Division of NuclearPhysics under
steeply than at least Zu6. contract No. W-7405-ENO-48, for making these
experiments possible.
Summary
References
In summary, our preliminary observation of
correlated e+e "peaks in Xe+Au collisions has been 1. T. Cowan et al. (EPOS Collaboration), Phys.
confirmed in a second run with more data. A ,,m970 Rev. Lett. 56, 444 (1986); W, Koenig et al.
keV sum-energy line is observed in the two (ORANGE Collaboration), Phys. Lett. 218B,
independent runs at a 2.5 _rto 3 o confidence level, 12 (1989); P. Salabura et al. (EPOS
Weak indication of previously observed GSI lines, Collaboration), Phys. Lett. 7,45B, 153 (1990).
most prominently at 810 keV, is also observed at a
1.5 o level in both runs. We estimate that the 2. T. Cowan et al., Progress in Research,
production cross-sections of the peaks scale with the 1991-1992 (Cyclotron Institute, Texas A&M
combined nuclear charge more steeply than Z_. In University), p. 23.
future runs, we will further explore the Zu
dependence of the peaks with other combinations of
projectile and target nuclei.
Progress on the MEGA Experiment
C. A. Oagliardi, F. Liu, R. E. Tribble, X. L. Tu, and L. A. Van Ausdein
During the past year, we have continued our The summer, 1992, runcycle also represents the first
work on the photon detector for the MEGA time that the entire positron spectrometer system,
experiment at Los Alamos. A detailed description of consisting of eight cylindrical MWPC's to track the
the detector was given in last year's report. 1 positrons and two scintillator barrels to measure their
The MEGA collaboration achieved several major times, was assembled. Although the delay line z
milestones during the past year. The inner two resolution was not as good as we had hoped, and
photon pair spectrometers were installed in essentially there were significant noise and oscillation problems
their final form for the summer, 1992, run cycle, with the electron chamber electronics, the system
These were the first pair spectrometers which have worked sufficiently well that we also obtained our
been constructed with delay line cathodes and reliable first physics data during the summer of 1992. At
MWPC's, thus allowing us to obtain accurate z present, data taken during the run on both the _t _ ey
information regarding shower locations and evolution decay rate and the Michel parameter p in normal
from the wire chambers and to utilize our scintillator- muon decay are being analyzed. We expect to reach
MWPC first-stage trigger, both for the first time. a sensitivity for the/_ -4, eV branching ratio close to
Since the summer run ended, construction of the final that of the current world limit, based on
pair spectrometer has been completed, and its approximately 6 days of data at low beam intensities.
installation is well underway as this is being written. Meanwhile, we expect to achieve overall uncertainties
II - 43
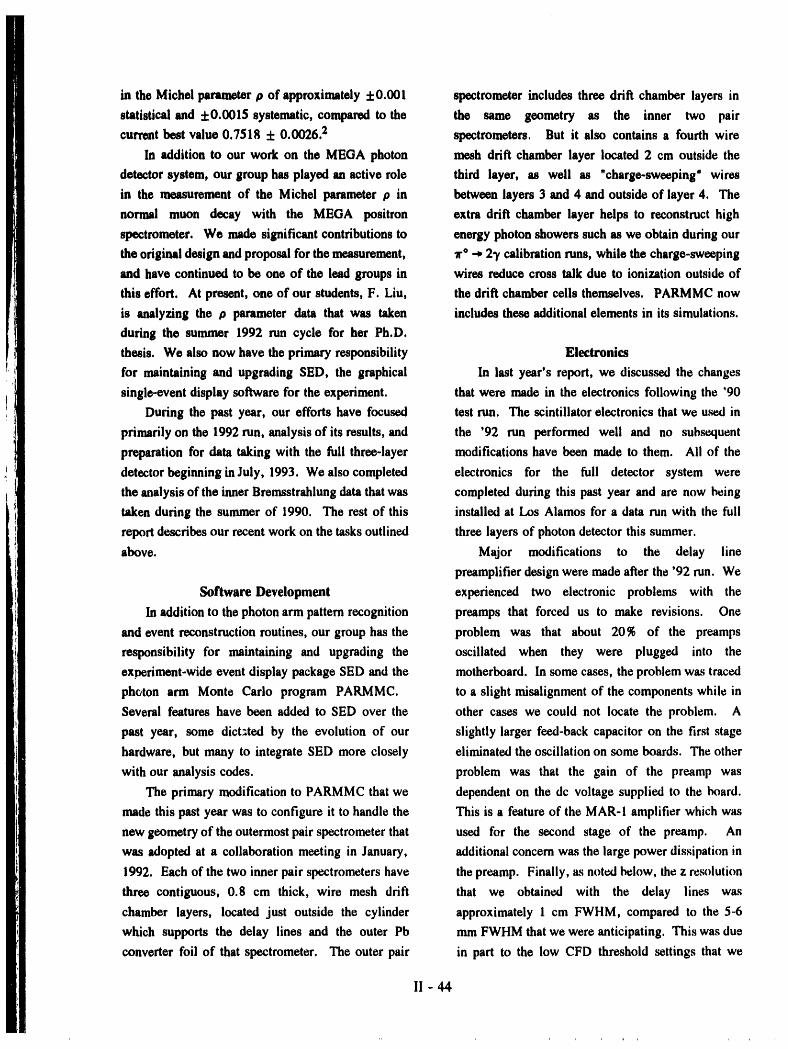
in the Michel parameter p of approximately :!:0.001 spectrometer includes three drift chamber layers in
statistical and :t:O.0015systematic, compared to the the same geometry as the inner two pair
current best value 0,7518 + 0.0026. 2 spectrometers, But it also contains a fourth wire
In addition to our work on the MEGA photon mesh drift chamber layer located 2 cm outside the
detector system, our group has played an active role third layer, as well as "charge-sweeping" wires
in the measurement of the Michel parameter p in between layers 3 and 4 and outside of layer 4. The
normal muon decay with the MEGA positron extra drift chamber layer helps to reconstruct high
spectrometer. We made significant contributions to energy photon showers such as we obtain during our
the original design and proposal for the measurement, T ° -, 27 calibration runs, while the charge-sweeping
and have continued to be one of the lead groups in wires reduce cross talk due to ionization outside of
this effort. At present, one of our students, F. Liu, the drift chamber cells themselves. PARMMC now
is analyzing the D parameter data that was taken includes these additional elements in its simulations.
during the summer 1992 run cycle for her Ph.D.
thesis. We also now have the primary responsibility Electronics
for maintaining and upgrading SED, the graphical In last year's report, we discussed the changes
single-event display software for the experiment, that were made in the electronics following the '90
During the past year, our efforts have focused test run. The scintillator electronics that we u,_J in
primarily on the 1992run, analysis of its results, and the '92 run performed well and no sub._xluent
preparation for data taking with the full three-layer modifications have been made to them. All of the
detector beginning in July, 1993. We also completed electronics for the full detector system were
the analysis of the inner Bremsstrahlung data that was completed during this past year and are now being
taken during the summer of 1990. The rest of this installed at Los Alamos for a data run with the full
report describes our recent work on the tasks outlined three layers of photon detector this summer.
above. Major modifications to the delay line
preamplifier design were made after the '92 run. We
Software Development experienced two electronic problems with the
In addition to the photon arm pattern recognition preamps that forced us to make revisions. One
and event reconstruction routines, our group has the problem was that about 20% of the preamps
responsibility for maintaining and upgrading the oscillated when they were plugged into the
ex.veriment-wide event display package SED and the motherboard. In some cases, the problem was traced
phc,ton arm Monte Carlo program PARMMC. to a slight misalignment of the components while in
Several features have been added to SED over the other cases we could not locate the problem. A
past year, some dictated by the evolution of our slightly larger feed-back capacitor on the first stage
hardware, but many to integrate SED more closely eliminated the oscillation on some boards. The other
with our analysis codes, problem was that the gain of the preamp was
The primary modification to PARMMC that we dependent on the dc voltage supplied to the board.
made this past year was to configure it to handle the This is a feature of the MAR-I amplifier which was
new geometry of the outermost pair spectrometer that used for the second stage of the preamp. An
was adopted at a collaboration meeting in January, additional concern was the large power dissipation in
1992. Each of the two inner pair spectrometers have the preamp. Finally, as noted below, the z resolution
three contiguous, 0.8 cm thick, wire mesh drift that we obtained with the delay lines was
chamber layers, located just outside the cylinder approximately 1 cm FWHM, compared to the 5-6
which supports the delay lines and the outer Pb mm FWHM that we were anticipating. This was due
converter foil of that spectrometer. The outer pair in part to the low CFD threshold settings that we
II - 44
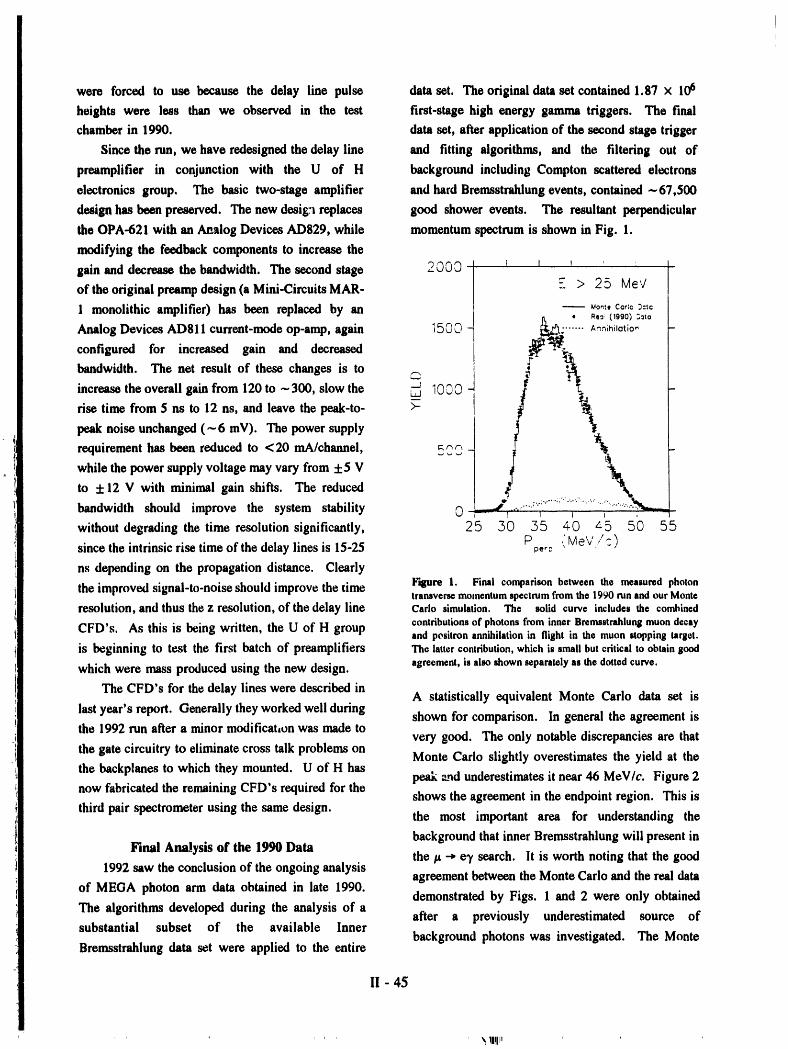
were forced to use because the delay line pulse data set. The original data set contained 1.87 × 10⁶
heights were less than we observed in the test first-stage high energy gamma triggers. The final
chamber in 1990. data set, after application of the second stage trigger
Since the run, we have redesigned the delay line and fitting algorithms, and the filtering out of
preamplifier in conjunction with the U of H background including Compton scattered electrons
electronics group. The basic two-stage amplifier and hard Bremsstrahlung events, contained-67,500
design has been preserved. The new design replaces good shower events. The resultant perpendicular
the OPA-621 with an Analog Devices AD829, while momentum spectrum is shown in Fig. 1.
modifying the feedback components to increase the
gain and decrease the bandwidth. The second stage 2 O0 3 [ I I i
of the original preamp design (a Mini-Circuits MAR- t _ > 2 5 Me'./1 monolithic amplifier) has been replaced by an _ _,o_.co_:o>,_o
Analog Devices ADgll current-mode op-amp, again 15C)0 -_ . _ ...... A_ihilatio_ -
configured for increased gain and decreased _ / _-__bandwidth. The net result of these changes is to _
increasetheoverall gain from 120to -.,300, slowthe _ ,0,,_0 ! / __ -rise time from 5 ns to 12 ns, and leave the peak-to- >-
peak noise unchanged (---6 mY). The power supply ! ! _requirement has been reduced to <20 mA/channel, _ S_
while the power supply voltage may vary from +5 V i j _i_,to + 12 V with minimal gain shifts. The reduced
bandwidth should improve the system stability 0 ,- _"' , , , ,
without degrading the time resolution significantly, 25 30 35 4-0 _-5 50 55
since the intrinsic rise time of the delay lines is 15-25 P pe,_ ,i,MeV/" "=_,
ns depending on the propagation distance. Clearly
the improved signal-to-noise should improve the time F'_lure1. Final comparison between the measuredphotontransverse momentum spectrum from the 1990 run and our Monte
resolution, and thus the z resolution, of the delay line Cado simulation. The solid curve includesthe combined
CFD's. As this is being written, the U of H group contributionsof photons frominnerBremsstrahlung muon decayand positron annihilation in flight in the muon stopping target.
is beginning to test the first batch of preamplifiers The lattercontribution, whichis smallbutcriticalto obtaingood
which were mass produced using the new design, agreement, is also shown separately as the dotted curve.
The CFD's for the delay lines were described inA statistically equivalent Monte Carlo data set is
last year's report. Generally they worked well during shown for comparison. In general the agreement isthe 1992 run after a minor modificat,on was made to
very good. The only notable discrepancies are thatthe gate circuitry to eliminate cross talk problems on Monte Carlo slightly overestimates the yield at thethe backpIanes to which they mounted. U of H has
peak _,_dunderestimates it near 46 MeV/c. Figure 2now fabricated the remaining CFD's required for the
shows the agreement in the endpoint region. This isthird pair spectrometer using the same design.
the most important area for understanding the
background that inner Bremsstrahlung will present inFinal Analysis of the 1990 Data
the _t -* e7 search. It is worth noting that the good
1992 saw the conclusion of the ongoing analysis agreement between the Monte Carlo and the real dataof MEGA photon ann data obtained in late 1990.
demonstrated by Figs. 1 and 2 were only obtainedThe algorithms developed during the analysis of a
after a previously underestimated source ofsubstantial subset of the available Inner
background photons was investigated. The MonteBremsstrahlung data set were applied to the entire
It - 45
11MII;;I
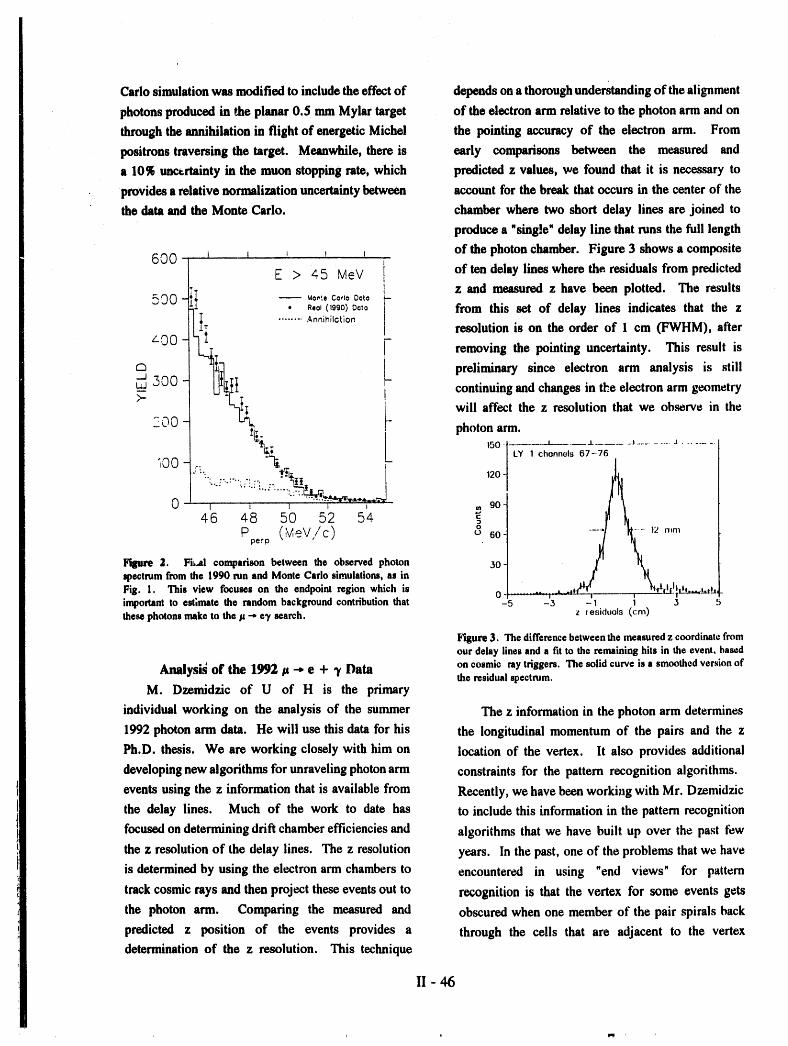
Cado simulation was modified to include the effect of depends on a thorough understanding of the alignment
photons produced in the planar 0.5 mm Mylar target of the electron arm relative to the photon arm and on
through the annihilation in flight of energetic Michel the pointing accuracy of the electron arm. From
positrons traversing the target. Meanwhile, there is early comparisons between the measured and
a 10% uncertainty in the muon stopping rate, which predicted z values, we found that it is necessary to
provides a relative normalization uncertainty between account for the break that occurs in the center of the
the data and the Monte Carlo. chamber where two short delay lines are joined to
produce a "single" delay line that runs the full length
600 I t , , I of the photon chamber. Figure 3 shows a composite1 E > 4 5 MeV [ of ten delay lines where the residuals from predictedI !
I z and measured z have been plotted. The results
_,00 _T _ Mo_:eCcrloOota I
• R,o_(1990)0°to from this set of delay lines indicates that the z
. - ....... Annihilotlon resolution is on the order of 1 cm (FWHM), after
/00 F- removing the pointing uncertainty. This result is
1 "__I preliminary since electron arm analysis is still
500L_ continuing and changes in tee electron arm geometry
7- will affect the z resolution that we observe in the
300 - photon arm.
. 150-[_g" .... J-........J..........J ............
tj....:.... *__.. LY 1 chonnels67--76
/i00 ,-
1201.o.-..,-, ..,
0 I I 90
46 48 50 52 54
Pp_:p (M,eV/c) '_ 8o - "'"'
Fillure 2. Fi_JI comparison between the observed photon 30 _ *,o_--/
spectrum from the 1990 run and Monte Carlo simulations, as in
Fig. 1. This view focuses on the endpoint region which is 0 ........ "*:=_--- , T 'important to estimate the random background contribution that -5 -3 -1 1 3 5
thesephotons make to the tt -* e7 search, z residuols (crn)
Figure 3. The differencebetween the measuredz coordinatefromour delay lines and a fit to the remaining hits in the event, based
Analysi_ of the 1992/_ -4, e + 3' Data on cosmic ray triggers. The solidcurveis a smoothedversionofthe residual spectrum.
M. Dzemidzic of U of H is the primary
individual working on the analysis of the summer The z information in the photon arm determines
1992 photon arm data. He will use this data for his the longitudinal momentum of the pairs and the z
Ph.D. thesis. We are working closely with him on location of the vertex. It also provides additional
developing new algorithms for unraveling photon arm constraints for the pattern recognition algorithms.
events using the z information that is available from Recently, we have been working with Mr. Dzemidzic
the delay lines. Much of the work to date has to include this information in the pattern recognition
focused on determining drift chamber efficiencies and algorithms that we have built up over the past few
the z resolution of the delay lines. The z resolution years. In the past, one of the problems that we have
is determined by using the electron arm chambers to encountered in using "end views" for pattern
track cosmic rays and then project these events out to recognition is that the vertex for some events gets
the photon arm. Comparing the measured and obscured when one member of the pair spirals back
predicted z position of the events provides a through the cells that are adjacent to the vertex
determination of the z resolution. This technique
II - 46
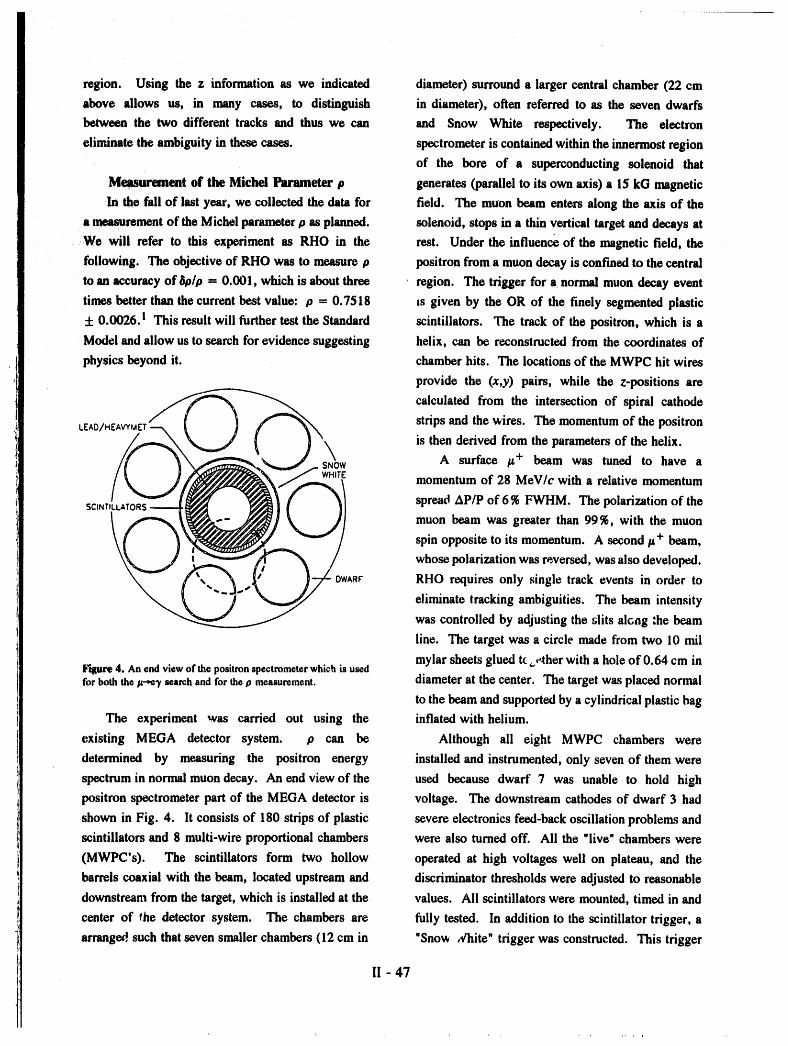
region. Using the z information as we indicated diameter) surround a larger central chamber (22 cm
above allows us, in many cases, to distinguish in diameter), often referred to as the seven dwarfs
between the two different tracks and thus we can and Snow White respectively. The electron
eliminate the ambiguity in these cases, spectrometer is contained within the innermost region
of the bore of a superconducting solenoid that
Measurement of the Michel Parameter p generates (parallel to its own axis) a 15 kG magnetic
In the fall of last year, we collected the data for field. The muon beam enters along the axis of the
a measurement of the Michel parameter p as planned, solenoid, stops in a thin vertical target and decays at
We will refer to this experiment as RHO in the rest. Under the influence of the magnetic field, the
following. The objective of RHO was to measure p positron from a muon decay is confined to the central
to an accuracy of 8pip - 0.001, which is about three region. The trigger for a normal muon decay event
times better than the current best value: p = 0.7518 is given by the OR of the finely segmented plastic
:i:0.0026. i This result will further test the Standard scintillators. The track of the positron, which is a
Model and allow us to search for evidence suggesting helix, can be reconstructed from the coordinates of
physics beyond it. chamber hits. The locations of the MWPC hit wires
provide the (x,y) pairs, while the z-positions are
calculated from the intersection of spiral cathodeLEA0/HEAVYUET strips and the wires. The momentum of the positron
/___/__ __j [_Sw_lO _ is then derived from the parameters of the helix.
A surface /_+ beam was tuned to have a
_-_. __ Q/ momentum of 28 MeV/c with a relative momentum
SC,Nr'LUATORS spread AP/P of 6 % FWHM. The polarization of the
__/___ muon beam was greater than 99_, with the muon
spin opposite to its momentum. A second/_+ beam,
whose polarization was reversed, was also developed.
ARt" RHO requires only single track events in order to
eliminate tracking ambiguities. The beam intensity
was controlled by adjusting the slits along :he beam
line. The target was a circle made from two 10 rail
mylar sheets glued t(, _.therwith a hole of 0.64 cm inF'4lure 4. An end view of the positron spectrometer which is usedfor both the/x-.¢'), search and for the p measurement, diameter at the center. The target was placed normal
to the beam and supported by a cylindrical plastic bag
The experiment was carried out using the inflated with helium.
existing MEGA detector system, p can be Although all eight MWPC chambers were
determined by measuring the positron energy installed and instrumented, only seven of them were
spectrum in normal muon decay. An end view of the used because dwarf 7 was unable to hold high
positron spectrometer part of the MEGA detector is voltage. The downstream cathodes of dwarf 3 had
shown in Fig. 4. It consists of 180 strips of plastic severe electronics feed-back oscillation problems and
scintillators and 8 multi-wire proportional chambers were also turned off. All the "live" chambers were
(MWPC's). The scintillators form two hollow operated at high voltages well on plateau, and the
barrels coaxial with the beam, located upstream and discriminator thresholds were adjusted to reasonable
downstream from the target, which is installed at the values. All scintillators were mounted, timed in and
center of _he detector system. The chambers are fully tested. In addition to the scintillator trigger, a
arranged such that seven smaller chambers (12 cm in "Snow ,¢hite" trigger was constructed. This trigger
II - 47
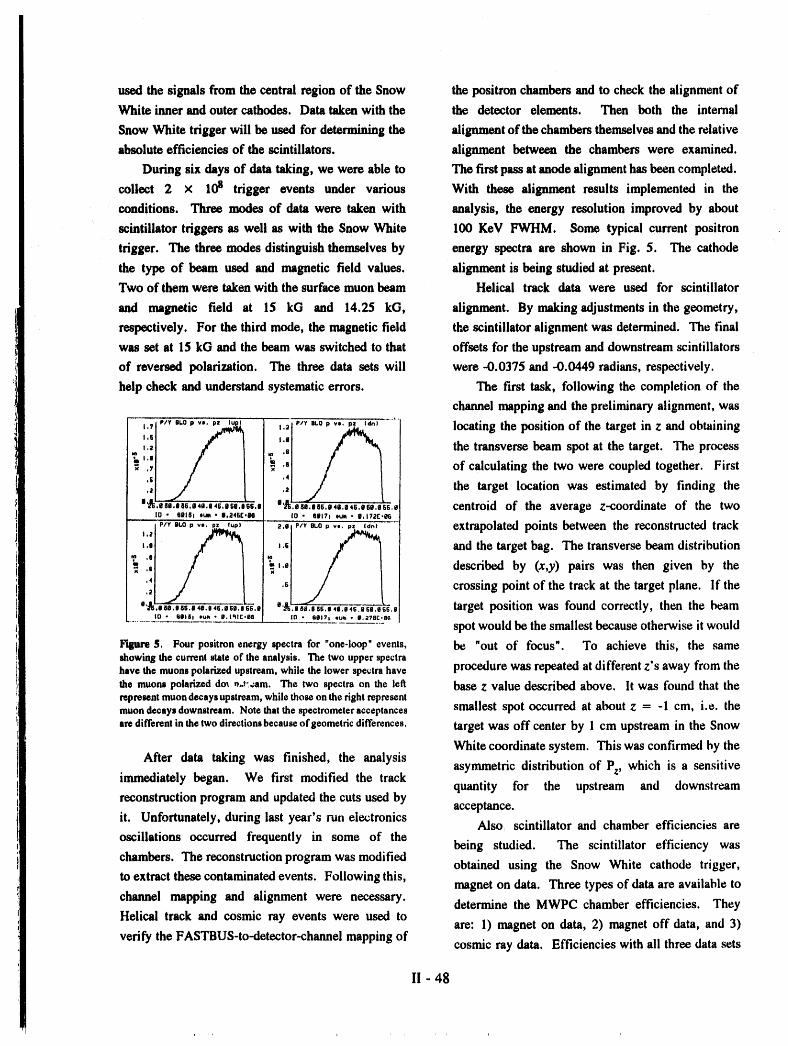
used the signals from the central region of the Snow the positron chambers and to check the alignment of
White inner and outer cathodes. Data taken with the the detector elements. Then both the internal
Snow White trigger will be used for dete_g the alignment of the chambers themselves and the relative
absolute efficiencies of the scintillators, alignment between the chambers were examined.
During six days of data taking, we were able to The first pass at anode alignment has been completed.
collect 2 x 10⁸ trigger events under various With these alignment results implemented in the
conditions. Three modes of data were taken with analysis, the energy resolution improved by about
scintillator triggers as well as with the Snow White 100 KeV FWHM. Some typical current positron
trigger. The three modes distinguish themselves by energy spectra are shown in Fig. 5. The cathode
the type of beam used and magnetic field values, alignment is being studied at present.
Two of them were taken with the surface muon beam Helical track data were used for scintillator
and magnetic field at 15 kG and 14.25 kG, alignment. By making adjustments in the geometry,
respectively. For the third mode, the magnetic field the scintillator alignment was determined. The final
was set at 15 kG and the beam was switched to that offsets for the upstream and downstream scintillators
of reversed polarization. The three data sets will were -0.0375 and -0.0449 radians, respectively.
help check and understand systematic errors. The first task, following the completion of the
channel mapping and the preliminary alignment, was
,.,, ,,Ys_opv.. p. ,_,, ,._,_,Ys_op v.. ,. ,,., locating the position of the target in z and obtaining
,"s] j_._ ,.,! _.s the transverse beam spot at the target. The process
*ii _ .s of calculating the two were coupled together. First'._ '._ the target location was estimated by finding the
|'_;.11/s.ess,114s.o4s,sss,s_s,e 11'_es,ss11,ses,11411.o4s.os11,116s.e centroid of the average z-coordinate of the twoIU • §11151 SUit • 11,245['116 lO • 611178 sum - 11,172E,116
, ,,, sLop_.. 5, ,.,, _.,, ,/v u, _.. ,. ,_., extrapolated points between the reconstructed track
,. ,._ and the target bag. The transverse beam distribution
_'. "-,.s described by (x,y) pairs was then given by the
!i[j [ crossing point of the track at the target plane. If thee .eS0,|es.i14_.|46-.sse.16-6.1g" see ses,,,ss4s osas_ss target position was found correctly, then the beamIU - 611151 tsua_• II.lql£.iM! |O - 6BI71 out • il.27@1"._6
..... spot would be the smallest because otherwise it would
Figure S. Four positron energy spectra for "one-loop" events, be "out of focus". To achieve this, the _meshowing the current state of the analysis. The two upper spectrahave the muons polarized upstream, while the lower spectra have procedure was repeated at different z's away from thethe muons polarized dm n,_,_am. The two spectra on the let_ base z value described above. It was found that therepresent muon decays upstream, while those on the right representmush decays downstream. Notethatthe spectrometer acceptances smallest spot occurred at about z - -1 cm, i.e. the
aredifferentinthe twodirectionsbecauseof geometric differences, target was off center by 1 cm upstream in the Snow
White coordinate system. This was confirmed by the
After data taking was finished, the analysis asymmetric distribution of Pz, which is a sensitiveimmediately began. We first modified the track
quantity for the upstream and downstreamreconstruction program and updated the cuts used by
acceptance.it. Unfortunately, during last year's run electronics Also scintillator and chamber efficiencies areoscillations occurred frequently in some of the
being studied. The scintillator efficiency waschambers. The reconstruction program was modified
obtained using the Snow White cathode trigger,to extract these contaminated events. Following this,
magnet on data. Three types of data are available to
channel mapping and alignment were necessary, determine the MWPC chamber efficiencies. TheyHelical track and cosmic ray events were used to
are: 1) magnet on data, 2) magnet off data, and 3)verify the FASTBUS-to-detector-channel mapping of
cosmic ray data. Efficiencies with all three data sets
II - 48
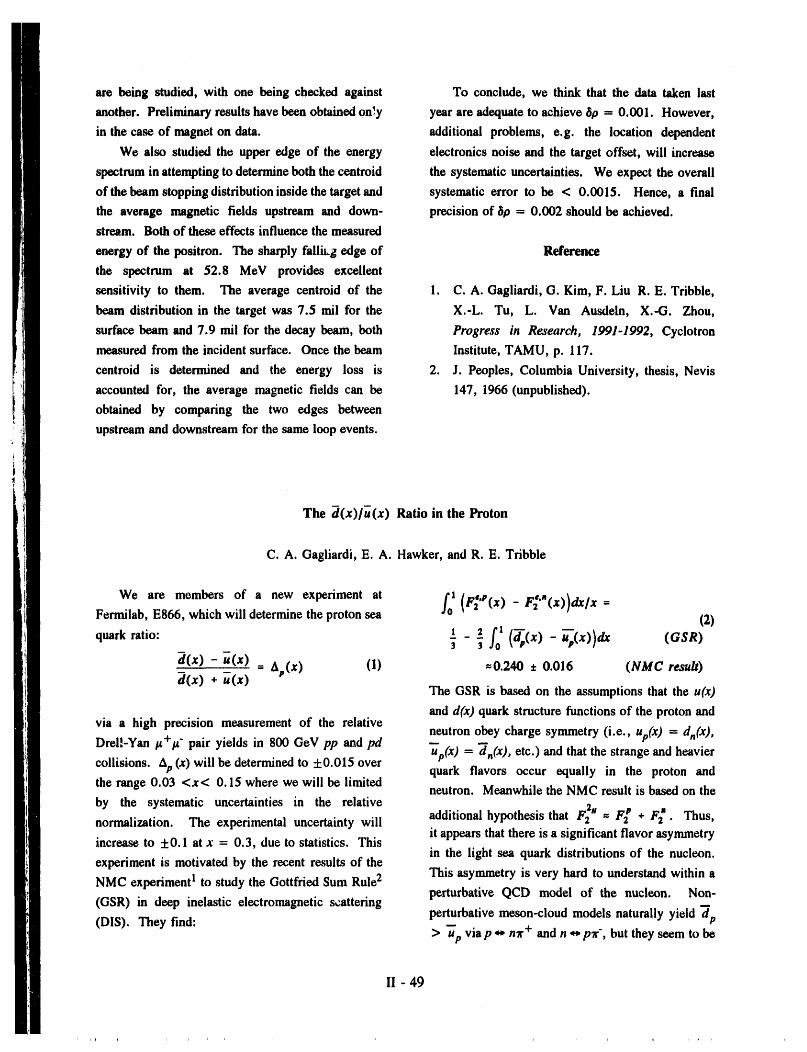
are being studied, with one being checked against To conclude, we think that the data taken last
another. Preliminary results have been obtained on_y year are adequate to achieve _p -- 0.001. However,
in the case of magnet on data. additional problems, e.g. the location dependent
We also studied the upper edge of the energy electronics noise and the target offset, will increase
spectrum in attempting to determine both the centroid the systematic uncertainties. We expect the overall
of the beam stopping distribution inside the target and systematic error to be < 0.0015. Hence, a final
the average magnetic fields upstream and down- precision of bp = 0.002 should be achieved.
stream. Both of these effects influence the measured
energy of the positron. The sharply falliLg edge of Reference
the spectrum at 52.8 MeV provides excellent
sensitivity to them. The average centroid of the I. C.A. Gagliardi, G. Kim, F. Liu R. E. Tribble,
beam distribution in the target was 7.5 mil for the X.-L. Tu, L. Van Ausdeln, X.-G. Zhou,
surface beam and 7.9 mii for the decay beam, both Progress in Research, 1991-1992, Cyclotron
measured from the incident surface. Once the beam Institute, TAMU, p. 117.
centroid is determined and the energy loss is 2. J. Peoples, Columbia University, thesis, Nevis
accounted for, the average magnetic fields can be 147, 1966 (unpublished).
obtained by comparing the two edges between
upstream and downstream for the same loop events.
The cl(x)/u(x) Ratio in the Proton
C. A. Gagliardi, E. A. Hawker, and R. E. Tribble
We are members of a new experiment at fl [r7 (x)- )),a/x -Fermilab, E866, which will determine the proton sea Jo _ (2)
quark ratio: t 2 f,l
d(x) - u(x) = Ap(x) (1) =0.240 ± 0.016 (NMC result)m
d(x) + u(x) The GSR is based on the assumptions that the u(x)
and d(x) quark structure functions of the proton and
via a high precision measurement of the relative neutron obey charge symmetry (i.e., up(x) = dn(x),Drel!-Yan _t+_t"pair yields in 800 GeV pp and pd -- --
up(x) = dn(x), etc.) and that the strange and heaviercollisions. Ap (x) will be determined to +0.015 over quark flavors occur equally in the proton andthe range 0.03 <x< 0.15 where we will be limited neutron. Meanwhile the NMC result is based on theby the systematic uncertainties in the relative
additional hypothesis that F2"= F_ + F2_ . Thus,normalization. The experimental uncertainty willit appears that there is a significant flavor asymmetry
increase to +0.1 at x -- 0.3, due to statistics. Thisin the light sea quark distributions of the nucleon.
experiment is motivated by the recent results of the
NMC experiment I to study the Gottfried Sum Rule2 This asymmetry is very hard to understand within aperturbative QCD model of the nucleon. Non-
(GSR) in deep inelastic electromagnetic scattering
(DIS). They find: perturbative meson-cloud models naturally yield dp> u"pvia p o n_c+ and n _ pTr', but they seem to be
II - 49
unable to explain the magnitude of the observed acquisition system throughput by a factor of over 10
effect. 3,4 and an increase in the acceptance for low mass pairs.
The DrelI-Yan mechanism, qq _ virtual 3' "" We will utilize these enhanced capabilities to obtain
_t+/t"within a hadronic medium, is an excellent probe very high statistics for the low=mass/_+#" pairs that
of the anti-quark distributions in nuclei. 3 The are needed to explore the region x -- 0.05. The_
effective mass and longitudinal momentum of the low-mass pairs will also let us see if shadowing
virtual 7 determine the quantities x_t and Xb-Xt, persists in a system as light as deuterium. We will
respectively, where Xb(Xt ) is the momentum fraction simultaneously obtain > 107 J/_,, > 105 _,', and >
carried by the beam (target)patton. Valence quarks 2000 T to obtain their relative production cross
are far more likely to carry a significant fraction of sections in pp and pd. These are needed to predict
a nucleon's momentum than sea quarks are, so Xb-Xt dilepton yields at RHIC.
> 0.2 strongly favors the association of the quark in The E866 collaboration includes members from
the Drell-Yan process with the beam and the anti- Abilene Christian University, Academia Sinica
quark with the target. Thus, in a first-order (Taiwan), California Institute of Technology,
approximation, proton-induced DrelI-Yan on nuclear Fermilab, Los Alamos, Northern Illinois University,
targets directly measures u (xt ) since up > dp and Oak Ridge, and our group at Texas A&M. The
o(u'u) = 4o(dd'). spokesman is Gerald Garvey from Los Alamos. The
A previous Fermilab experiment, E772, experiment received first-stage approval from the
investigated Dreli-Yan production on d, C, Ca, Fe, Fermilab PAC in December 1992. At that time, the
and W to see if the A-dependent effects observed in PAC gave tentative approval of our full two month
DIS, the "EMC effect," were caused by sea quarks.5 beam time request, and asked u._ to investigate the
Little or no modifications of the sea quark improvements that we could achieve either in
distributions were observed as a function of A except acceptance range at low x or in statistics at high x by
for "shadowing" in the region x < 0.1, which running longer. As of this writing, we expect to
occurred at the same level as in DIS. By contrast, receive second-stage approval from the PAC at its
E772 found large A-dependent effects 6 in the yields next meeting and to run in either late 1994 or early
ofJ/_b, _,' and T. The results of E772 have recently 1995.
been reanalyzed to extract Ap(X) by comparing the We expect to upgrade two major detector
DrelI-Yan yield from W to that from the isoscalar subsystems significantly for E866. The first is the
targets. 7 No significant deviation of Ap(X) from zero data acquisition and run control computer. Although
was found, but the uncertainties are large because (N- the E789 improvements imply that the data
Z)/A is only 0.2 for W and there are significant throughput to tape is now adequate for our needs, the
shadowing corrections that must be applied for such on-line analysis capabilities are quite limited. A large
a heavy target, contribution to the systematic normalization error
E866, which is optimized to investigate Ap (x), is comes from rate-dependent tracking inefficiencies.
an extension ofE772. Our choice of hydrogen and We estimate that we will need to analyze
deuterium targets maximizes our sensitivity to Ap(x) approximately 10% of our events in real time inwhile minimizing shadowing effects. We will use the order to monitor these effects adequately. We are
same spectrometer system which was used by E772. currently investigating options to provide this
It is shown in Figure 1. This, the Fermilab Meson capability. Meanwhile the primary run control
East spectrometer, was originally built for Fermilab 8 computer is a PDP 11-45 that dates to the early days
E605 and was used most recently by E789. of E605 and is very difficult to maintain. We are
Several improvements were made during the considering replacing the PDP 11-45 at the same time
course of E789, notably an increase in the data as we upgrade the on-line analysis. The Los Alamos
II - 50
FigureI,LayoutofspectrometeratFNAL.
and Cal Tech groups share the primary responsibility concluded that this rebuild would expend far more
for the data acquisition system, but all groups, man-effort than justifiable.
including ours, will be called upon to provide some The first two stages of the trigger logic consist of
software support, commercial NIM and CAMAC modules, plus a large
Our group has the primary responsibility for the number of custom-built units that are between 10 and
other major subsystem to be upgraded -- the 20years old andpoorlydocumented. The first stage
hardware trigger. The trigger system for E772 decision looks for very simple coincidence patterns,
consisted of a two-stage process of inspecting hit primarily utilizing standard NIM modules. This
patterns in seven scintillator hodoscopes, four in the configuration provides very little flexibility, together
Y (bend) plane and three in the X (non-bend) plane, with a number of undesirable side-effects. Notably,
to identify candidate tracks. E605 and E789 also it leads to an implicit PI"cut on the/_+/_" pairs that
made extensive use of a custom-built third-stage rejects large PTevents. In parallel with the first-stage
parallel pipeline processor to see if wire chamber hit trigger, a number of custom-built modules, referred
patterns confirmed the preliminary results from the to as trigger matrices, study the hit patterns in
scintillators. This third-stage processor was available hodoscopes Y1, Y2, and Y4 to identify triple-
for E772, but it was not used to veto any events, coincidences that represent candidate/z + or/_" tracks
The bit pattern that it produced was recorded as part that nmy originate from the target. This part of the
of each event, then was used in the on-line and quick trigger logic must be very flexible, since the patterns
first-pass off-line analyses to select potentially of interest at any given time depend on the effective
interesting events. But this procedure was found to masses of the virtual photons being studied and the
introduce poorly understood systematic effects in the currents in the three spectrometer magnets. The
event reconstruction efficiency, so the final pass existing trigger matrices use fast ECL SRAM's that
analysis disregarded it. The existing third-stage are downloaded via CAMAC to provide this
trigger configuration, that of E789, would require an flexibility. Unfortunately, they don't make a decision
extensive rebuild to meet the needs of E866. Given fast enough to provide input to the first-stage trigger
the experience of E772, the collaboration has decision.
II - 51
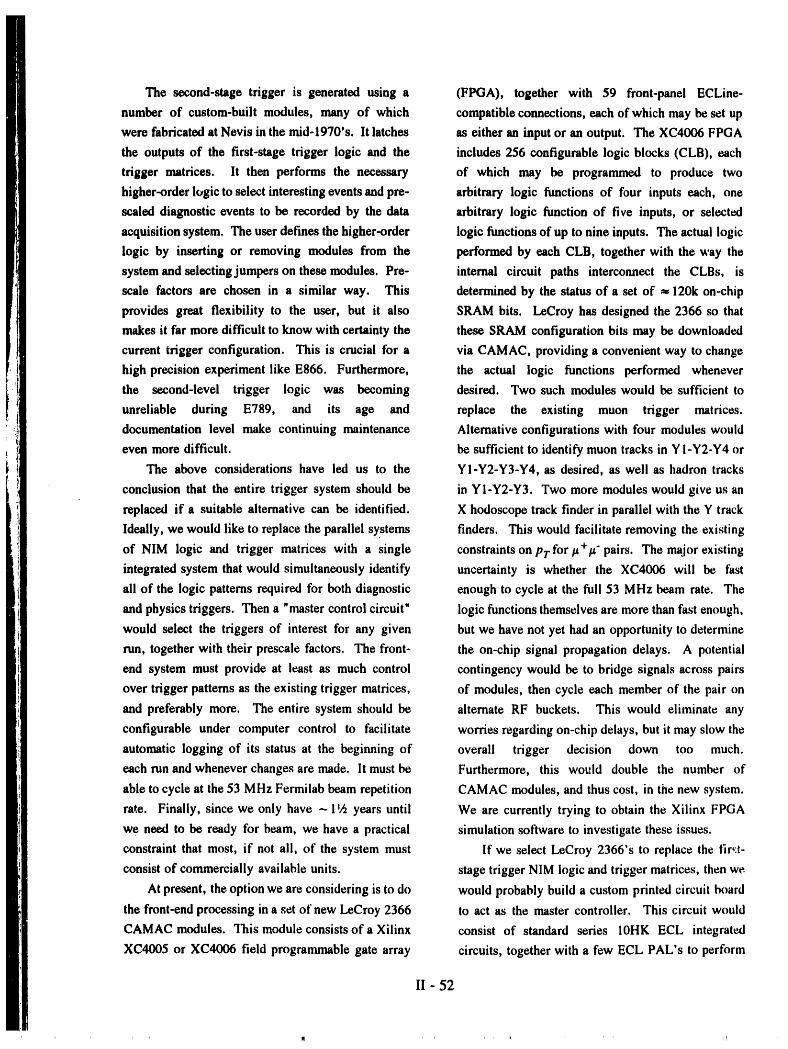
The second-stage trigger is generated using a (FPGA), together with 59 front-panel ECLine-
number of custom-built modules, many of which compatible connections, each of which may be set up
were fabricated at Nevis in the mid-1970's. It latches as either an input or an output. The XC4006 FPGA
the outputs of the first-stage trigger logic and the includes 256 configurable logic blocks (CLB), each
trigger matrices. It then performs the necessary of which may be programmed to produce two
higher-order logic to select interesting events and pre- arbitrary logic functions of four inputs each, one
scaled diagnostic events to be recorded by the data arbitrary logic function of five inputs, or selected
acquisition system. The user defines the higher-order logic functions of up to nine inputs. The actual logic
logic by inserting or removing modules from the performed by each CLB, together with the way the
system and selecting jumpers on these modules. Pre- internal circuit paths interconnect the CLBs, is
scale factors are chosen in a sinfilar way. This deternained by the status of a set of _ 120k on-chip
provides great flexibility to the user, but it also SRAM bits. LeCroy has designed the 2366 so that
wakes it far more difficult to know with certainty the these SRAbt configuration bits may be downloaded
current trigger configuration. This is crucial for a via CAMAC, providing a convenient way to change
high precision experiment like E866. Furthermore, the actual logic functions performed whenever
the second-level trigger logic was beconfing desired. Two such modules would be sufficient to
unreliable during E789, and its age and replace the existing muon trigger matrices.
documentation level make continuing maintenance Alternative configurations with four modules would
even more difficult, be sufficient to identify muon tracks in Y I-Y2-Y4 or
The above considerations have led us to the YI-Y2-Y3-Y4, as desired, as well as hadron tracks
conclusion that the entire trigger system should be in Y I-Y2-Y3. Two more modules would give us an
replaced if a suitable alternative can be identified. X hodoscope track finder in parallel with the Y track
Ideally, we would like to replace the parallel systems finders. This would facilitate removing the existing
of NIM logic and trigger matrices with a single constraints onPTfor#+#" pairs. The major existing
integrated system that would simultaneously identify uncertainty is whether the XC4006 will be last
all of the logic patterns required for both diagnostic enough to cycle at the full 53 MHz beam rate. The
and physics triggers. Then a "master control circuit" logic functions themselves are more than fast enough,
would select the triggers of interest for any given but we have not yet had an opportunity to determine
run, together with their prescale factors. The front- the on-chip signal propagation delays. A potential
end system must provide at least as much control contingency would be to bridge signals across pairs
over trigger patterns as the existing trigger matrices, of modules, then cycle each member of the pair on
and preferably more. The entire system should be alternate RF buckets. This would eliminate any
configurable under computer control to facilitate worries regarding on-chip delays, but it may slow the
automatic logging of its status at the beginning of overall trigger decision down too much.
each run and whenever changes are made. It must be Furthermore, this would double the number of
able to cycle at the 53 MHz Fermilab beam repetition CAMAC modules, and thus cost, in the new system.
rate. Finally, since we only have - 1'/2 years until We are currently trying to obtain the Xilinx FPGA
we need to be ready for beam, we have a practical simulation software to investigate these issues.
constraint that most, if not all, of the system must If we select LeCroy 2366's to replace the fir,:t-
consist of commercially available units, stage trigger NIM logic and trigger matrices, then we
At present, the option we are considering is to do would probably build a custom printed circuit board
the front-end processing in a set of new LeCroy 2366 to act as the master controller. This circuit would
CAMAC modules. This module consists of a Xilinx consist of standard series 10HK ECL integrated
XC4005 or XC4006 field programmable gate array circuits, together with a few ECL PAL's to perform
II - 52
the higher level logic functions that we require. We References
don't intend to begin serious work on this component 1. D.Ailasia et al, Phys. Lett B 249, 366 (1990); P.
until the front-end has been specified. Amaudruz et al, Phys.Rev.Lett.66, 2712 (1991).2. K. Gottfried, Phys.Rev.Lett. 18, 1174 (1967).
The next E866 collaboration meeting is to be3. S.D. Ellis and W.J. Stirling, Phys.Lett.B 256,
held in mid-June. By that time, we should have 258 (1991).
received second-stage approval from the Fermilab 4. E. Eichten, I. Hinchliffe, and C. Quigg, Phys.
PAC and should have a much better estimate of when Rev. D 45, 2269 (1991).5. D.M. Aide et al, Phys.Rev.Lett 64, 2479
we will be running. The various options for(1990).
reconfiguring the trigger system will be discussed in 6. D.M. Aide et al, Phys.Rev.Lett 66, 133 (1991);detail, and a final choice will be made. D.M. Aide et al, Phys.Rev.Lett 66,2285 (1991).
7. P.L. McGaughey et al, Phys.Rev.Lett. 69, 1726(1992).
8. J.A. Crittenden et al, Phys.Rev. D 34, 2584(1986), and references therein.
Experimental Program in N-N, Few-N, and Kaon Physics
" L.C. Northcliffe, J. C. Hiebert, R. A. Kenefick, G. Glass, T. Shimsand collaborators from several other institutions
A. Experiments at LAMPF (Clinton P. Anderson These results will be complemented by
Meson Physics Facility) additional measurements this summer in experiment
E1293, in which the analyzing power for n-p
1. Neutron-proton elastic spin-transfer from 485 to elastic scattering for c.m. angles from 30 ° to 60 ° at
788 MeV 500, 650, 725 and 800 MeV with point to point
This program (LAMPF experiment E876)was uncertainty of 0.005 and overall normalization
initiated in the summer of 1990 with measurements uncertainty of 2%. These measurements will extend
of the spin-transfer parameters KLL, KI.s, KSL our coverage to the c.m. angular range 30°-160 °,
and Kss at 788 MeV, data which were published in which will include both the forward and backward
1991. I The experiment was completed in the peaks. This is of importance because the relative
summer of 1992, with measurements of these magnitude of the two peaks is a sensitive probe of the
parameters at 485 and 635 MeV, and the results isospin-O inelasticities. Joining us in this
have since been published. 2 The results have a collaboration will be scientists from Louisiana Tech
significant impact on the phase-shift analyses, University, Bo[azi_i University (Turkey), and lnstitut
providing sufficient data to over-determine the Ruder Boskovi6(Croatia).
elastic N-N amplitudes near those energies. The
experiment has been done in collaboration with 2. Spin-transfer parameter KLL(0°) for the
scientists from Argonne National Laboratory (ANL), 2H(p,n)2p reaction from 305 to 788 MeV
Los Aiamos National Laboratory (LANL), Rice The spin-transfermeasurementsofE876revealed
University (RiU), Rutgers University (RuU), the a 10-16% normalization discrepancy with previous
University of Central Arkansas (UCA), the measurements of the polarization of the LAMPF
University of Montana (UM), the University of neutron beam. This led to a new proposal (E1234),
Texas at Austin (UTA), and Washington State to remeasure the 2H(p,n)2p spin-transfer parameter
Uniw .*, (WSU). KLL(O°) at beam energies of 305, 485,635, 722 and
II - 53
788 MeV. The results confirmed the need for In this earlier experiment, the parameters CSL
renormalization of the earlier data, and were and CLL for backward c.m. angles, and the
published during the past year.3 The collaboration parameters Css and CLS for forward c.m. angles
was the same as that in E876, with the addition of were measured for various energies betweem 484 and
another collaborator from the University of Colorado. 788 MeV. Collaborators included persons from
ANL, New Mexico State University, LANL, UM
3. Single-pion production in np scattering (LAMPF and WSU. These results have now been
E1097) published. 5,6
Considerable effort was spent on the
development of apparatus for this experiment during 7. Measurement of the p-p elastic spin-correlation
the past few years. Unfortunately, because of parameters ALL and ASL between 500 and 800 MeV
serious budgetary problems at LAMPF, approval of The results of this earlier set of measurements
the experiment was withdrawn late in 1992. have now been published. 7
4. Absolute pp-elastic differential cross sections 8. Measurement of the forward-angle analyzing
from 492 to 793 MeV power in pn and pp quasifree scattering at 643 andMeasurements were made for the c.m. 797 MeV
angular region 300-90 ° at incident energies 492, 576, The results of this earlier experiment also were
642, 728 and 793 MeV. A total uncertainty of less published during the past year. 8
than 1% was made possible by particle-counting for
beam normalization and extensive cross-checking for 9_ Differential cross section for n-p elastic
systematic effects. The new data are consistent with scattering at 459 MeV
previous results above 600 MeV, but have The data of this experiment, also obtained
uncertainties reduced by a factor of _--10. Near 500 earlier, have now been published. 9 This work was
MeV the results are consistent with 90 ° data from done in collaboration with workers from LANL and
TRIUMF, but differ significantly from similar data UTA.
from PSI. The work was done in collaboration with
people from LANL, UCLA, RiU, RuU and UTA, 10. Earlier LAMPF experiments
and served as the basis for the dissertation research In an earlier LAMPF experiment, the
of A. J. Simon, who obtained the PhD degree in May spin-correlation parameter ANN for n-p elastic
1993. A manuscript presenting these results for scattering was measured for energies between 300
publication is in preparation, and 665 MeV. A manuscript presenting the_ results
is nearing completion.
5. Absolute differential cross section measurements
for the p+p--_r + +d reaction for energies 500-800 B. Kaon Experiment at Brookhaven National
MeV Laboratory (BNL)
As a necessary by-product of the preceding
experiment, absolute determinations of the differential Collaborators in this experiment included
cross section for the pp-*_r+d reaction of high personnel from Tel Aviv University, BNL, Vas_r
accuracy were also made. These results have been College, Osaka University and TRIUMF. The final
published. 4 results of the experiment, measurements of the K+
total cross sections for various target nuclei as a
6. Measurements of np elastic spin-correlation test for nucleon "swelling ", have now been
parameters between 500 and 800 MeV published. 10
II - 54
C. Experiment at KEK {National Laboratory for Simon, D.J. Mercer, D.L. Adams, H. Sp,aka,
High Enersy Physics, Tsukuba, Japan): R.H. Jeppesen, G.E. Tripard, and H.
Measurement of the energy dependence of the Woolverton, Phys. Rev. C 45, 2564 (1992).
analyzing power for the pp--pp and pp-,dr + for
energies in the r_ion 500-800 MeV 4, "Absolute Differential Cross-sectionMeasurements for p+p -, g+ +d Reaction at
Participating institutions in this collaboration 500-800 MeV," E. Gillmez, A.J. Ling, C.A.
included KEK, Kyoto University, Tohoku University, Whitten, Jr., M.W. McNaughton, D.L. Adams,V.R. Cupps, G. Glass, A.J. Simon, and K.H.and the Tokyo Institute of Technology. The results
obtained for the pp-*dx + have been published, II and McNaughton, Nucl. Phys. ASSl, 621 (1993).
a manuscript presenting the final results of the5. "Neutron Proton Elastic Scattering Spin-Spin
PF"PP measurements has been submitted for
publication. 12 Correlation Parameter Measurements between500 and 800 MeV. I. CSL and CLL at backward
c.m. angles," W.R. Ditzler, D. Hill, J.D. Other experiments at LAMPF and BNL.
Hoftiezer, K.F. Johnson, D. Lopiano, T.
Shims, H. Shimizu, H. Spinka, R. Stanek, D.
These miscellaneous results have also been Underwood, R.G. Wagner, A. Yokosawa, G.R.
published. Burleson, J.A. Faucett, C.A. Fontenla, R,W.
Gamett, C. Luchini, M. W. RawooI-Sullivan,
References T.S. Bhatia, G. Glass, J,C. Hiebert, R.A.l
Kenefick, S. Nath, L.C. Northcliffe, R.
1. "np Elastic Spin Transfer Measurements at 788 Damjanovich, J.J. Jarmer, J. Vaninetti, R.H.
MeV," M.W. McNaughton, K. Koch, I. Supek, Jeppesen, and G. E. Tripard, Phys. Rev. D. 46,
N. Tanaka, K.H. McNaughton, P.J. Riley, 2792 (1992).
D.A. Ambrose, J.D. Johnson, A. Smith, G.
Glass, J.C. Hiebert, L.C. Northcliffe, A.J. 6. "Neutron-proton elastic scattering spin-spin
Simon, D.L. Adams, R.D. Ransome, D.B. correlation parametermeasurementsbetween500
Clayton, H.M. Spinka, R.H. Jeppesen, and G.E. and 800 MeV: II. Css and CLS at forward c.m.
Tripard, Phys. Rev. C. 44, 2267 (1991). angles," T. Shims, D. Hill, K.F. Johnson, H.
Shimizu, H. Spinka, R. Stanek, D. Underwood,
2. "np Elastic Spin-Transfer Measurements at 485 A. Yokosawa, G. Glass, J.C. Hiebert, R.A.
and 635 MeV," K.H. McNaughton, D.A. Kenefick, S. Nath, L.C. Northcliffe, G.R.
Ambrose, P. Coffey, K. Johnston, P.J. Riley, Burleson, R.W. Gamett, J.A. Faucett, M.W.
M.W. McNaughton, K. Koch, I. Supek, N. Rawool-Sullivan, R. Damjonovich, J.J. Jarmer,
Tanaka, G. Glass, J.C. Hiebert, L.C. R.H. Jeppesen, and G.E. Tripard, Phys. Rev.
Northcliffe, A.J. Simon, D.J. Mercer, D.L. D. 47, 29 (1993).
Adams, H. Spinka, R.H. Jeppesen, G.E.
Tripard, and H. Woolverton, Phys. Rev. C. 46, 7. "Measurement of spin-correlation parameters
47 (1992). ALL and ASL in p-p elastic scattering from 500
to 800 MeV," G. Glass, T.S. Bhatia, J.C.
3. "2H(p,n)2p spin transfer from 305 to 788 Hiebert, R.A. Kenefick, S. Nath, L.C.
MeV," M.W. McNaughton, K. Koch, I. Supek, Northcliffe, W.B. Tippens, D.B. Barlow, J.J.
N. Tanaka, D.A. Ambrose, P. Coffey, K. Jarmer, J.E. Simmons, R.H. Jeppesen, and G.E.
Johnston, K.H. McNaughton, P.J. Riley, G. Tripard, Phys. Rev. C 45, 35 (1992).
Glass, J.C. Hiebert, L.C. Northcliffe, A.J.
II - 55
8. 'Forwardangleanalyzingpower in_'nand _'p and 792.7MeV," E. Olllmez,S. Beedoe,T.
quuifreescatteringat643 and 797 MeV," G. Joroszewiccz,A. O, Ling,(2.A. Whitten,Jr.,
Olau,T.S,Bhatia,J.C.Hiebert,R.A.Kenefick, M, W. McNeughton, J, R. Santana,D. L.
S. Nath,L.C. Northcliffe,W.B. Tippens,and Adams. V. R. Cupps, A, J. Simon, M. L,
J.E.Simmons, Phys.Rev.C. 47,1369(1993). Barlett,K. H. McNaughton,and P. J.Riley,
Phys.Rev.C 43,2067(1991).
9. "Differentialcross sectionfor n-p elastic
scatteringintheangularregion50° < 0* < 15. "A NeutronHodoscopeforMedium Energynp
180° at 459 MeV," L.C. Northcliffe, M. Jain, Scattering Experiments," R. Gamett, D.
M.L, Evans, G. Glass, J.C. Hiebert, R.A. Grosnick, K. Johnson, D. Lopiano, Y. Ohashi,
Kenefick, B.E. Bonnet, J.E. Simmons, C.W. A. Rask, T. Shima, H. Spinka, T. Stanek, D.
Bjork, and P.J. Riley, Phys. Rev. C. 47, 36 Underwood, A. Yokosawa, M. Beddo, G.
(1993). Burleson, J. A. Faucett, G. Kyle, M.
Devereaux, G. Glass, S. Nath, J. J. Jarmer, S.
10. "K + Total Cross Sections on t2C and Medium Pentilll, R. Jeppesen, and G. Triperd, Nucl.
Effects in Nuclei," R.A. Krauss, J. Alster, D. Instrum. Methods A309, 508 (1991).
Ashery, S. Bart, R.E. Chrien, J.C. Hiebert,
R.R. Johnson, T. Kishimoto, I. Mardor, Y. 16. "Elastic Scattering of N-, L-, and S-type
Mardor, M.A. Moinester, R. Olshevsky, E. Polarized 794 MeV Protons from an ND 3 Target
Piasetzky, P.H. Pile, R. Sawafta, R.L. Stearns, Polarized in the S-L Plane," E. Gillmez, D. L.
R.J. Sutter, R. Weiss, and A.I. Yavin, Phys. Adams, S. Beedoe, M. Bleszynski, J.
Rev. C46, 655 (1992). Bystrickey, V. Ghazikhanian, G. Igo, T.
Ja_szewicz, A. G. Ling, M. Nasser, M. W.
11. "Energy Dependence of the Analyzing Power for McNaughton, S. Pentilli, G. Glass, G.
the pp-*l"+d Reaction in the Energy Region Kahrimanis, W. F. Kielhorn, K. H.
500-800 MeV," H.Y. Yoshida, H. Shimizu, H. McNaughton, P. J. Riley, S. Sen, and D. Wolf,
Olmuma, Y. Kobayashi, K. Kobayashi, T. Phys. Rev. C 45, 22 (1992).
Nakagawa, J.A. Holt, G. Glass, J.C. Hiebert,
R.A. Kenefick, S. Nath, L.C. Northcliffe, A. 17. "np-elastic analyzing power AAo and spin transfer
Simon, S. Hiramatsu, Y. Mori, H. Sato, A. K/ct¢," M. W. McNaughton, K. Johnston, D. R.
Takagi, T. Toyama, A. Ueno, and K. lmai, Swenson, D. Tupa, R. L. York, D. A.
Nucl. Phys. A_;41,443 (1992). Ambrose, P. Coffey, K. H. McNaughton, P. J.
Riley, G. Glass, J. C. Hiebert, R. H. Jeppesen,
12. "Energy dependent measurements of the p-p H. Spinka, I. Supek, G. E . Tripard, and H.
elastic analyzing power and narrow dibaryon Wooiverton, Phys. Rev. C 48, 256 (1993).
resonances," Y. Kobayashi, Y. Kobayashi, T.
Nakagawa, H. Shimizu, H. Y. Yoshida, H. 18. "Quick Polarization Analyzer (QPAN)," 1.
Ohnuma, J.A. Holt, G. Glass, J.C. Hiebert, Supek, M. W. McNaughton, K. Koch, N.
R.A. Kenefick, S. Nath, L.C. Northcliffe, A. Tanaka, R. D. Ransome, D. A. Ambrose, K. H.
Simon, S. l-liramatsu, Y. Mori, H. Sato, A. McNaughton, P. J. Riley, G. Glass, J. Hiebert,
Takagi, T. Toyama, A. Ueno, and K. lmai, L. Northcliffe, A. J. Simon, D. L. Adams, R.
submitted to Nu¢l. Phys. A. Jeppesen, H. Spinka, and G. Tripard, Nucl.
lnstrum. Methods A344, 19 (1993).
13. "Absolute differential cross section measurements
for proton-deuteron elastic scattering at 641.3
II - 56
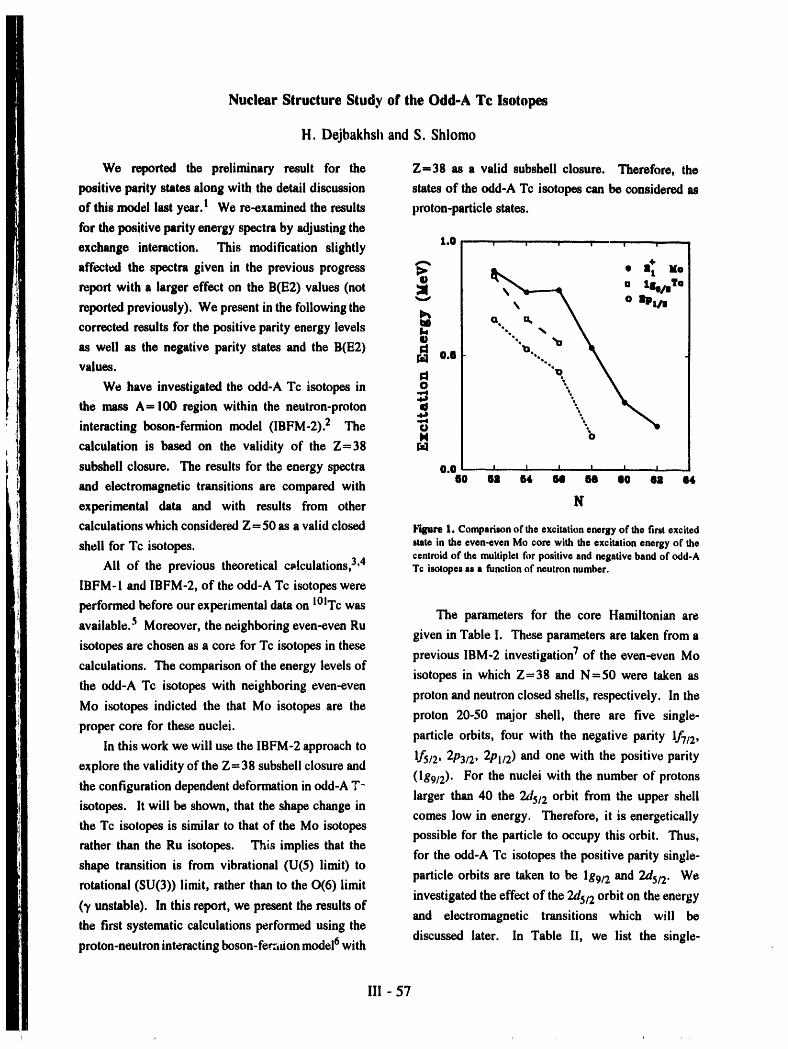
Nuclear Structure Study of the Odd-A Tc Isotopes
H. Dejbakhsh and S. Shlomo
We reported the preliminary result for the Z=38 as a valid subshell closure. Therefore, the
positive parity states along with the detail discussion states of the odd-A Tc isotopes can be considered as
of this model last year.I We re-examined the results proton-particle states.
for the positive parity energy spectra by adjusting the
exchange interaction. This modification slightly 1.o ....... , . , , .....;.... , ,
affected the spectra given in the previous progress • s t Mo
u tllo/iTo
report with a larger effect on the B(E2) values (not _ \ _ o Itpt/ereported previously). We present in the following the I_ ct u, \corrected results for the positive parity energy levels _ ..., ,,as well as the negative parity states and the B(E2) gl
values, r_ o.e
We have investigated the odd-A Tc isotopes in _o_
the mass A-100 region within the neutron-proton ._interacting boson-fermion model (IBFM-2). 2 The "_
M ocalculation is based on the validity of the Z=38
subshell closure. The results for the energy spectra o.e _ _ _ _ ilie §ll §4 60 80 IlO 68 64
and electromagnetic transitions are compared with
experimental data and with results from other N
calculations which considered Z:50 as a valid closed Figure1. Comparison of the excitation energy of the firstexcited
shell for Tc isotopes, state in theeven-evenMocore with the excitationenergyof thecentroidof themuitipletforpositiveandnegativebandof odd-A
All of the previous theoretical c_lculations, 3,4 Tc isotopes as a functionof neutron number.
IBFM-1 and IBFM-2, of the odd-A Tc isotopes were
performed before our experimental data on l°lTc wasThe parameters for the core Hamiltonian are
available. 5 Moreover, the neighboring even-even Rugiven in Table I. These parameters are taken from a
isotopes are chosen as a core for Tc isotopes in theseprevious IBM-2 investigation -/of the even-even Mo
calculations. The comparison of the energy levels ofisotopes in which Z=38 and N=50 were taken as
the odd-A Tc isotopes with neighboring even-evenproton and neutron closed shells, respectively. In the
Mo isotopes indicted the that Mo isotopes are theproton 20-50 major shell, there are five single-
proper core for these nuclei.particle orbits, four with the negative parity 1_/2,
In this work we will use the IBFM-2 approach to1f5/2, 2P3/2, 2Pl/2) and one with the positive parity
explore the validity of the Z= 38 subsheil closure and(199/2). For the nuclei with the number of protons
the configuration dependent deformation in odd-A T _larger than 40 the 2d5/2 orbit from the upper shell
isotopes. It will be shown, that the shape change incomes low in energy. Therefore, it is energetically
the Tc isotopes is similar to that of the Mo isotopespossible for the particle to occupy this orbit. Thus,
rather than the Ru isotopes. This implies that thefor the odd-A Tc isotopes the positive parity single-
shape transition is from vibrational (U(5) limit) toparticle orbits are taken to be lg9/2 and 2d5/2. We
rotational (SU(3)) limit, rather than to the 0(6) limitinvestigated the effect of the 2d5/2 orbit on the energy
(3' unstable). In this report, we present the results ofand electromagnetic transitions which will be
the first systematic calculations performed using the
proton-neutroninteracting boson-fe_Jtion model6 with discussed later. In Table II, we list the single-
II1 - 57
I'1111 I ' r ' I1'111 I _ I_ I .... ' ,,H,,,
Table I. IBM-2 parameters for even-even Me isotopes taken from Ref. 17].
............ ........ ..... l
N N_ G_ c_ x X_ X_l _ ,lli i i i ii lJ,mi, ill
54 2 1.10 0.740 -0.090 0,4 -1.2 43,50 0. :0 0.00
56 3 1.25 0.750 -0.078 0.4 -1.2 -1.00 0.45 0.0658 4 0.81 0.595 -0.060 -0.4 -1.2 -0.55 0.18 0.1260 5 0.60 0.510 -0.080 -0.4 -1.0 -0.22 0.07 0.12
SAil the parameters are in MeV except for Xlr and X, which are dimensionless.
bln these calculations the authors used N_r=2 and Majorana parameters of _1,3=0.035 MeV, and _2=0.08MeV.
the even-even core, should be equal to that of the
Table II. Results from BCS calculation for the corresponding core state, 8 if the monopole- monopoleorbitals involved, along with single particleenergies used in present calculations, interaction vanishes. Therefore, the monopole
........ interaction strength can be extracted for each nucleus
nO' cj(MeV) Ej{MoV) _ from energy differences between the £2; state of2Pt/2 2.10 1.49 0.792P3/2 0.35 2.87 0.95 the even-even Me core and the centroid of the1f5/2 0.90 2.39 0.93 corresponding multiplets, resulting from 2[" ® 9/2 +
1f7/2 -3.20 6.27 0.99 or 21" ® 1/2". Using the available experimental data
lg9/2 3.20 1.24 0.40 for the excited states of the Me and Tc isotopes, we2o'5/2 7.20 4.42 0.02
have obtained the values A a. = -0.12, and -0.23 MeV
, " ,, , , for the positive parity states of 97Tc, and 99Tc,
respectively. The corresponding values for the
Table III. Boson-Fermion interaction parameters negative parity states are Aa. = -0.25, -0.36, andfor both positive- and negative-parity states of -0.39 MoV for 97Tc, 99Tc, and I°lTc, respectively.Tc isotopes. In Figure 1 we have plotted the excitation energy of
Parity A r F T Ar Orbitals the first 2 + state of the even-even Me core along'" - .... with centroid energy of the multiplets for both
+ -0.10 0.87 -4.0 lg9/2,2ds/2 positive and negative parity states. We note that the
- -0.40 0.00 2.5 lf7/2,2P3/2 value of the Aa, depends on the parity of the stateslfs/2,2P3/2and mass number. Although these values differ froma
..... All parameters are in McV. - one isotopes to the next it is seen from Figure I that
assuming a constant value for Aa. is a reasonableparticle energies, ej, quasiparticle energies, Ej, and approximation. We therefore, looked for aoccupation probabilities, off, used in this calculation. description of the excited states of the positive-parity
The parameters for boson-fermion Hamiltonianodd-A Tc isotopes using the same value for the
for positive and negative parity states are given inparameter Aa.. Another constant value was assumed
Table III. The parameters are kept constant for eachfor the negative parity states. The other parameters,
band except for the parameter A a. of the negative I"a. and A_r, were also kept constant, albeit smtr_th
parity band of 97Tc where we used the value of Aa. changes in Aa. and A a. would improve the theoretical= -0.13 MeV. The simplest version of the
prediction. The structure coefficients Xp (P =_ a', v)core-particle coupling (CPC) model predicts that the
in the boson quadrupole operator have the sameenergy of the centroid of multiplets, resulted from
values as in the corresponding even-even Me corecoupling of the single-particle with an excited state of
nuclei. In the present calculations, we first
III - 58
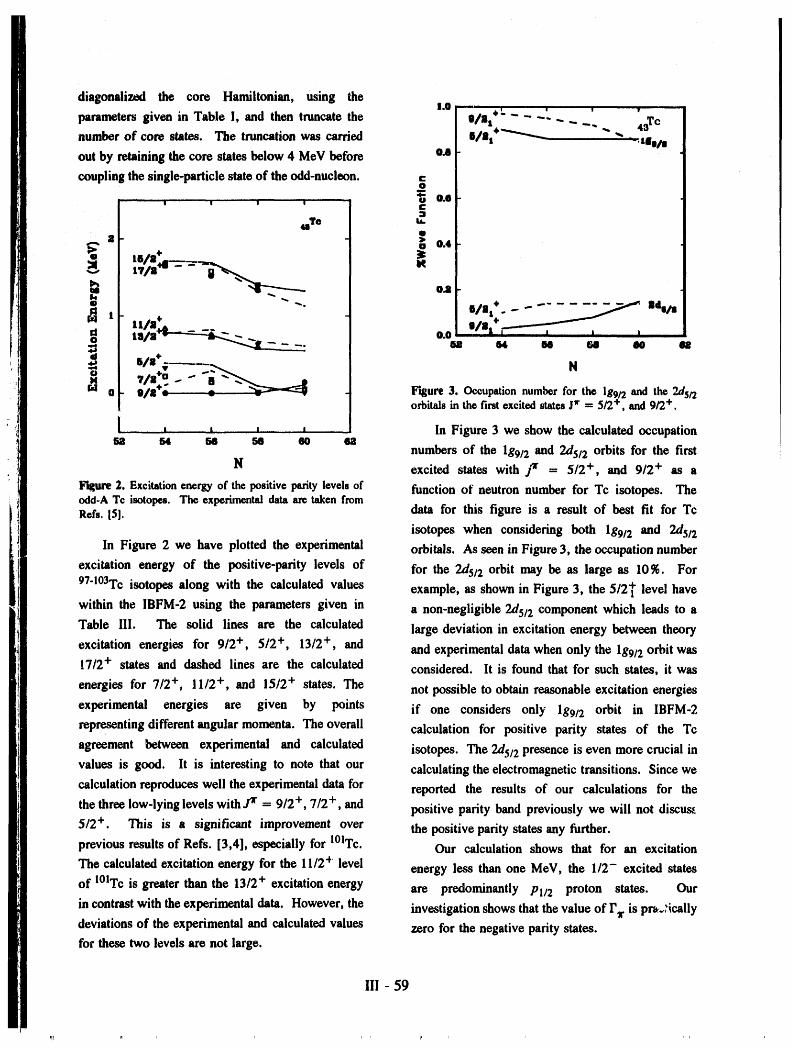
diagonalized the core Hamiltonian, using the I.Q,L ..... ' _ w
parameters given in Table I, and then truncate the w/a t --.... -. -.... 43Tcnumber of core states. The truncation was carried ll/mt+_ '- -. tge/aout by retaining the core states below 4 MeV before o.s
coupling the single-particle state of the odd-nucleon.
"' , I I I ' _ 0._=1ate u,.
# >"
N.-, tV/ll" - g
is/lit+ .. --" _._"_ II_/s_l t tt/a_ _-- o/at+,r...._.-..--_''_m
o.o,, ,.....IsI#+c ______
N 0 O/ll_" lrsgure3. Occupationnumberfor the Ig9/2 and the 2d5/2orbitalsin the firstexcitedstatespr = 5/2+° and 9/2+.
i t i , In Figure 3 we show the calculated occupationf_ 64 fill 68 60 88 i
numbers of the lgg/2 and 2d5/2 orbits for the first
lq excited states with ff = 5/2 +, and 9/2 + as a
Figure 2. Excitationenergyof the positive paritylevels of function of neutron number for Tc isotopes. Theodd-ATc isotopes. The experimentaldataare taken fromRefs. 15]. data for this figure is a result of best fit for Tc
isotopes when considering both lg9/2 and 2d5/2
In Figure 2 we have plotted the experimental orbitals. As seen in Figure 3, the occupation number
excitation energy of the positive-parity levels of for the 2d5/2 orbit may be as large as 10%. For
97"i°3Tc isotopes along with the calculated values example, as shown in Figure 3, the 5/21-level havewithin the IBFM-2 using the parameters given in a non-negligible 2d5/2 component which leads to a
Table III. The solid lines are the calculated large deviation in excitation energy between theory
excitation energies for 9/2 +, 5/2 +, 13/2 +, and and experimental data when only the lgg/2 orbit was
17/2 + states and dashed lines are the calculated considered. It is found that for such states, it wasenergies for 7/2 +, 11/2 +, and 15/2 + states. The not possible to obtain reasonable excitation energies
experimental energies are given by points if one considers only lg9/2 orbit in IBFM-2
representing different angular momenta. The overall calculation for positive parity states of the Tc
agreement between experimental and calculated isotopes. The 2d5/2 presence is even more crucial in
values is good. It is interesting to note that our calculating the electromagnetic transitions. Since we
calculation reproduces well the experimental data for reported the results of our calculations for the
the three low-lying levels with J a"= 9/2 +, 7/2 +, and positive parity band previously we will not discus_
5/2 +. This is a significant improvement over the positive parity states any further.
previous results of Refs. [3,4], especially for l°iTc. Our calculation shows that for an excitation
The calculated excitation energy for the 11/2 + level energy less than one MeV, the 1/2- excited states
of 101To is greater than the 13/2 + excitation energy are predominantly Pl/2 proton states. Our
in contrast with the experimental data. However, the investigation shows that the value of I'a. is pra..:icallydeviations of the experimental and calculated values zero for the negative parity states.for these two levels are not large.
III - 59
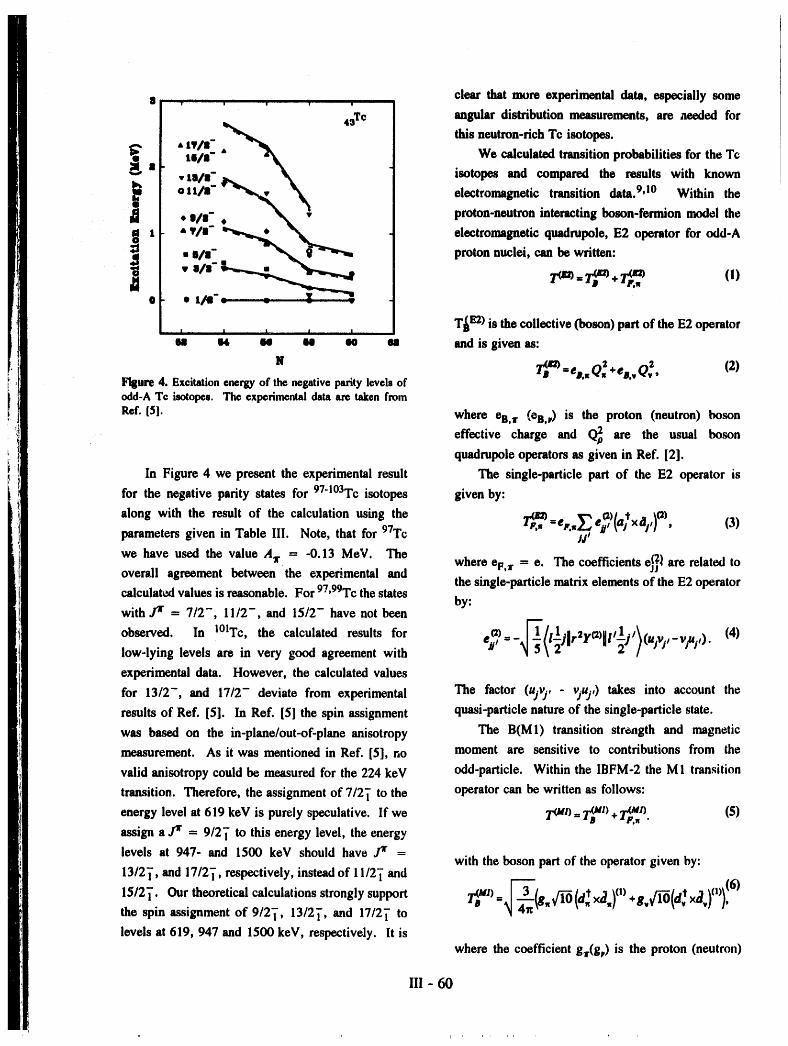
clearthat more experimental data,especially some8 i[ iii | ii | l| |
,aTe angular distribution measurements, are needed for
,_.,ix this neutron-rich Tc isotopes.IV/l"&
till8" "'_ We calculated transition probabilities for the Tc
_'e8 .tsll=_ ,_ isotopesand compared the resultswith knownqk
o11/11 "'_,_ _ electromagnetic transition data.9,10 Within the,818- , "_ • proton-neutron interacting boson-fermion model the
_ t "'18 = _ _ electromagnetic quadrupole, E2 operator for Odd-A• 811= _ g _ proton nuclei, can be written:
. ,.t/t': : " -" T_') is the collective (boson) part of the E2 operatorI I
u _t ea R m u and is given as:
" ,TP°,,..o.+,,.,o;. (2)Flgure 4. Excitationenergyof thenegativeparitylevelsofodd-ATe isotopes.The experimentaldataaretakenfrom
R©f.[5]. where ee,lr (ee,_) is the proton (neutron) ix)son
effective charge and Q_p are the usual Ix)sonquadruple operatorsas given in Ref. [2].
In Figure 4 we present the experimental result The single-particle part of the E2 operator is
for the negative parity states for 97"1°3Tc isotopes given by:
along with the result of the calculation using the T(p_t_)_ (2) , (2)(o, . (3)parameters given in Table III. Note, that for 97Tc jj/
we have used the value A a. = -0.13 MeV. Thewhere eF,a. = e. The coefficients e_} are related to
overall agreement between the exper;mental andthe single-particle matrix elements of the E2 operator
calculated values is reasonable. For 97'99Tc the statesby:
with ./1" = 7/2-, 11/2-, and 15/2- have not been
observed. In 101Tc, the calculated results for e_)=__lllljlraY(a)]i/lj/_(uv / (4)low-lying levels are in very good agreement with , _ z z / 7 J -v/u j/).
experimental data. However, the calculated values
for 13/2-, and 17/2- deviate from experimental The factor (ujvj, - _uj,) takes into account the
results of Ref. [5]. In Ref. [5] the spin assignment quasi-particle nature of the single-particle state.
was based on the in-plane/out-of-plane anisotropy The B(M1) transition strength and magnetic
measurement. As it was mentioned in Ref. [5], no moment are sensitive to contributions from the
valid anisotropy could be measured for the 224 keV odd-particle. Within the IBFM-2 the M 1 transition
transition. Therefore, the assignment of 7/2 T to the operator can be written as follows:
energy level at 619 keV is purely speculative. If we T (u_)=T_n1)+ IF,,,"(Ul). (5)assign a j'x = 9/2T to this energy level, the energylevels at 947- and 1500 keV should have fr =
with the boson part of the operator given by:13/2]', and 17/2 T, respectively, instead of 11/2T and
15/2_'. Our theoretical calculations strongly support T(mHJ)=._(R_VF_(dt_xa_)(1)+g, Vl-_(dt xa,)-'(I)'(6)),the spin assignment of 9/2_', 13/2]', and 17/2_" to _4x'-
levels at 619, 947 and 1500 keV, respectively. It is
where the coefficient g_r(g,) is the proton (neutron)
III - 60
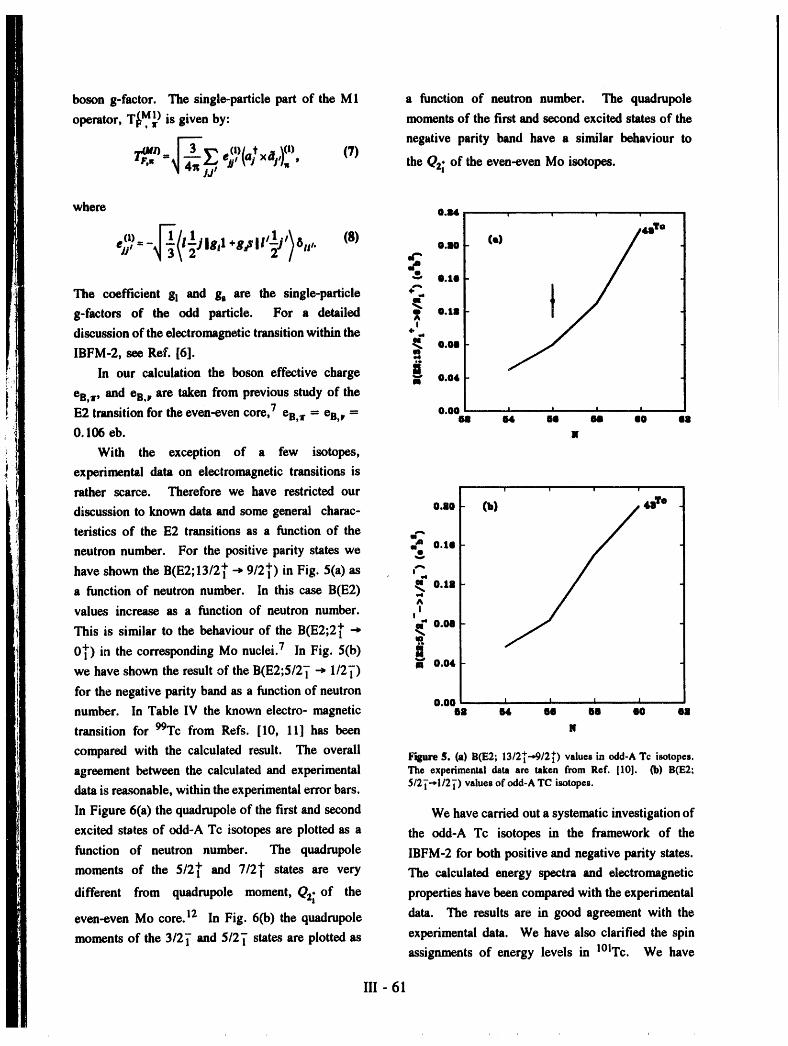
boson g-factor. The single-particle part of the MI a function of neutron number. The quadrupole
(MI) is given by: moments of the first and second excited states of theoperator, Tv, rnegative parity band have a similar behaviour to
e#, _a/ the Q2_ of the even-even Me isotopes.
where n.sa , . , ,
_o)_ 1 1 18) (,I%,-- ji&l+#tll t 6,,. e.so
0.10
The coefficient gl and g, are the single-particle *_
g-factors of the odd particle. For a detailed _" o.ta
discussion of the electromagnetic transition within the +'
IBFM-2, see Ref. [6].O.01
..:,.
In our calculation the boson effective charge 0.04
eB,_r,and en.j, are taken from previous study of the
E2 transition for the even-even core, -/ eB,_r= en, _ = 0.00 , _ , ,011 64 68 6iS 00 all
0.106 eb. x
With the exception of a few isotopes,
experimental data on electromagnetic transitions is
rather scarce. Therefore we have restricted our ' ' ' ' '
discussion to known data and some general charac- o.ao (b) 41't°
teristics of the E2 transitions as a function of the
neutron number. For the positive parity states we _ 0.10
have shown the B(E2;13/2_ --*9/2_) in Fig. 5(a) as
a function of neutron number. In this case B(E2) _ 0.11^
values increase as a function of neutron number, s
This is similar to the behaviour of the B(E2;2_" -* _ o.oe
0_) in the corresponding Me nuclei. 7 In Fig. 5(b) _ o.0,we have shown the result of the B(E2;5/2_" -* 1/2].)
for the negative parity band as a function of neutron0.00 i t i t
number. In Table IV the known electro- magnetic 61 04 so so 0o 01
transition for 99Tc from Refs. [10, 11] has been g
compared with the calculated result. The overallF'ggure $. (a) B(E2; 13/2_'-.9/2_) values in odd-A Tc isotopes.
agreement between the calculated and experimental The experimental data are taken from Ref. [10]. (b) B(E2;
data is reasonable, within the experimental error bars. 5/2]'--i/2]') valuesof odd-ATCisotopes.
In Figure 6(a) the quadrupole of the first and second We have carried out a systematic investigation of
excited states of odd-A Tc isotopes are plotted as a the odd-A Tc isotopes in the framework of the
function of neutron number. The quadrupole IBFM-2 for both positive and negative parity states.
moments of the 5/2_" and 7/21" states are very The calculated energy spectra and electromagnetic
different from quadrupole moment, Qz_ of the properties have been compared with the experimental
even-even Me core. 12 In Fig. 6(b) the quadrupole data. The results are in good agreement with the
moments of the 3/2]" and 5/2]" states are plotted as experimental data. We have also clarified the spinassignments of energy levels in l°lTc. We have
Ill - 61
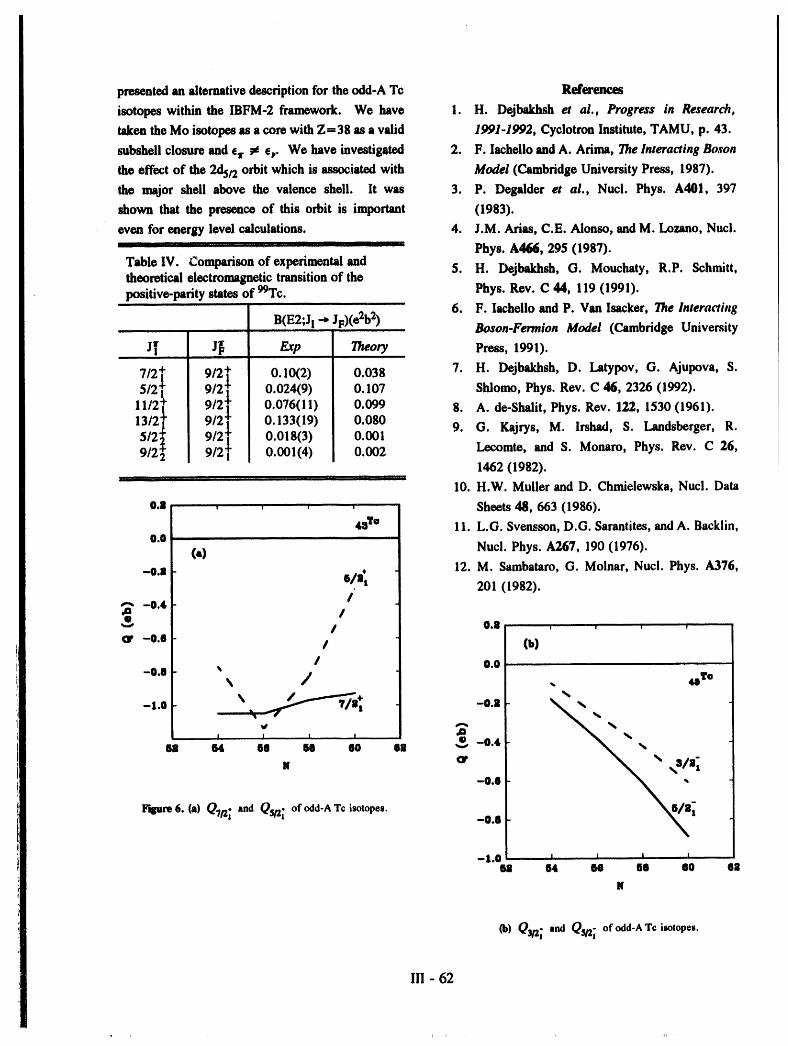
presented an alternative description for the odd-A Tc Referene_
isotopes within the IBFM-2 framework. We have 1. H. Dejbakhsh et at., Progress in Research,
taken the Mo isotopes as a core with Z-38 as a valid 1991-1992, Cyclotron Institute, TAMU, p. 43.
subshell closure and e_r _ e,. We have investigated 2. F. lachello and A. Arima, The Interacting Boson
the effect of the 2d5/2 orbit which is associated with Model (Cambridge University Press, 1987).
the major shell above the valence shell. It was 3. P. Degalder et al., Nuci. Phys. A401, 397
shown that the presence of this orbit is important (1983).
even for energy level calculations. 4. J.M. Arias, C.E. Alonso, and M. Lozjmo, Nuci.
..... Phys. A466, 295 (1987).Table IV. Comparison of experimental and 5. H. Dejbakhsh, G. Mouchaty, R.P. Schmitt,theoretical electromagnetic transition of the
positive-parity states of 99Tc. Phys. Rev. C 44, 119 (1991).6. F. Iachello and P. Van Isacker, The Interacting
B(E2;J! _ JP)(e2b2) Boson-Fermion Model (Cambridge University
J_ J_ F.xp Theory Press, 1991).
7/2_" 9/2_" 0.10(2) 0.038 7. H. Dejbakhsh, D. Latypov, G. Ajupova, S.5/2] 9/2 T 0.024(9) 0.107 Shlomo, Phys. Rev. C 46, 2326 (1992).
11/2_" 9/2 T 0.076(11) 0.099 8. A. de-Shalit, Phys. Rev. 122, 1530 (1961).
13/2 T 9/2 T 0.133(19) 0.080 9. G. Kajrys, M. lrshad, S. Landsberger, R.5/2_ 9/2 T 0.018(3) 0.0019/2 3 9/2]- 0.001(4) 0.002 Lecomte, and S. Monaro, Phys. Rev. C 26,
1462 (1982).k[' i i ii i i , , i
10. H.W. Muller and D. Chmielewska, Nucl. Data
e.a , , , , Sheets 48, 663 (1986).
4aT° 11. L.G. Svensson, D.G. Sarantites, and A. Backlin,0.0
(a) Nuci. Phys. A267, 190 (1976).12. M. Sambataro, G. Molnar, Nucl. Phys. A376,
--O.I O/It 201 (1982)."_ -0.4 /.n /g
/ O.I ....
-0.0 / (b)
I 0.0-0.0 •
% J ,, 44;Yo
-1.o % -o.I '_,L
I I I I _ %6I 64 00 66 00 II v -0.4,
N Gt It
-0.0
Fil_re 6. (a) Q/a; and (_21 of odd-ATc isotopes. -0.e _t
--I.0 I I I I6I 04 60 06 O0 0I
N
Oh) Q$/2; and Q_q2; of odd-A Tc isotopes.
III - 62
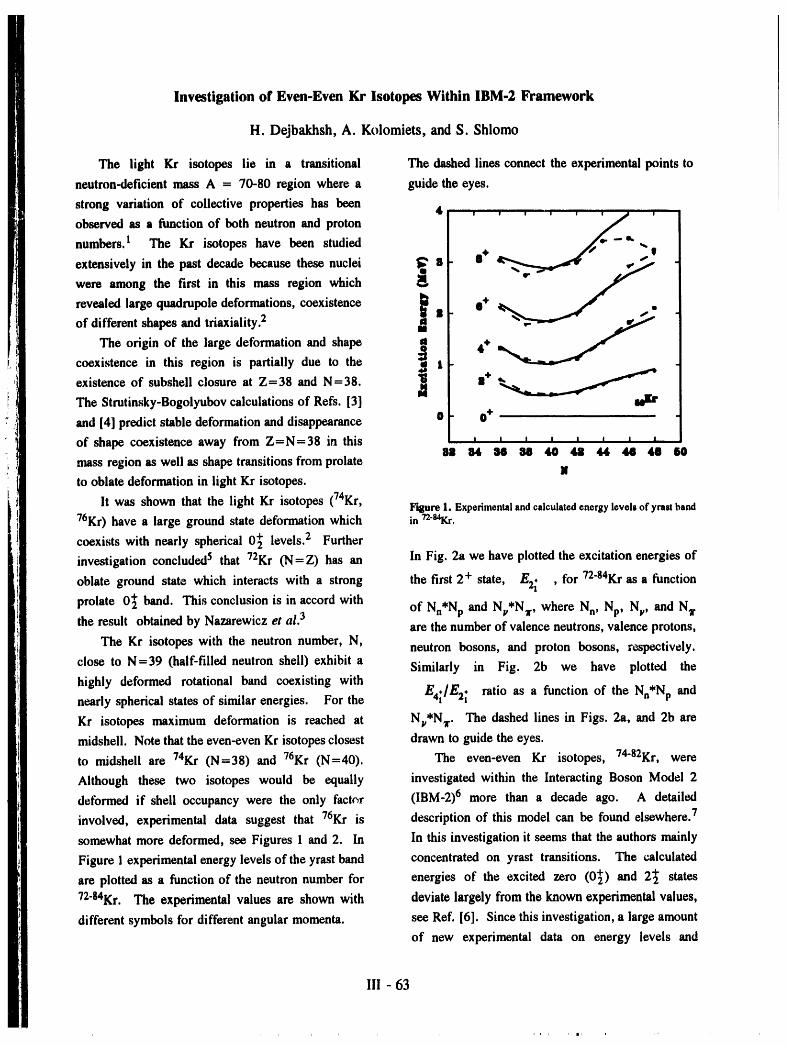
Investigation of Even-Even Kr Isotopes Within IBM-2 Framework
H. Dejbakhsh, A. Kolomiets, and S. Shlomo
The light Kr isotopes lie in a transitional The dashed lines connect the experimental points to
neutron-deficient mass A = 70-80 region where a guide the eyes.I
strong variation of collective properties has been 4 ! ! ! " i I i _i i"
observed as a function of both neutron and proton / O..-- q_
numbers. I The Kr isotopes have been studied 8. "eextensively in the past decade because these nuclei _ a _ _.
were among the first in this mass region whichlit
revealed large quadrupole deformations, coexistence _ e+ _ ,_of different shapes and triaxiality. 2 II •
The origin of the large deformation and shape _q 4*coexistence in this region is partially due to the _ t
iexistence of subshell closure at Z=38 and N=38. _ _.Itl
The Strutinsky-Bogolyubov calculations of Refs. [3]
and [4] predict stable deformation and disappearance o O+
of shape coexistence away from Z=N=38 in this ' ' ' ' ' ' ' '81 841, 8e M 40 43 44 441 48 60mass region as well as shape transitions from prelate IIto oblate deformation in light Kr isotopes.
It was shown that the light Kr isotopes (74Kr, Figure1. Experimental andcalculatedenergylevelsof yrastband76Kr) have a large ground state deformation which in _'8'tKr.
coexists with nearly spherical 0_ levels. 2 Further
investigation concluded 5 that 72Kr (N= Z) has an In Fig. 2a we have plotted the excitation energies of
oblate ground state which interacts with a strong the first 2 + state, E2_ , for 72"84Kras a function
prelate 0_ band. This conclusion is in accord withof Nn*Np and Nj,*N_., where Nn, Np, Nj,, and N_.
the result obtained by Nazarewicz et al.3 are the number of valence neutrons, valence protons,The Kr isotopes with the neutron number, N, neutron bosons, and proton bosons, respectively.
close to N-39 (half-filled neutron shell) exhibit a Similarly in Fig. 2b we have plotted the
highly deformed rotational band coexisting with E4.1/E2.t ratio as a function of the Nn*Np andnearly spherical states of similar energies. For the
Kr isotopes maximum deformation is reached at Nj,*NI.. The dashed lines in Figs. 2a, and 2b are
midshell. Note that the even-even Kr isotopes closest drawn to guide the eyes.
to midsheil are 74Kr (N=38) and 76Kr (N=40). The even-even Kr isotopes, 74"82Kr, were
Although these two isotopes would be equally investigated within the Interacting Boson Model 2
deformed if shell occupancy were the only factor (IBM-2) 6 more than a decade ago. A detailed
involved, experimental data suggest that 76Kr is description of this model can be found elsewhere. 7
somewhat more deformed, see Figures 1 and 2. In In this investigation it seems that the authors mainly
Figure 1 experimental energy levels of the yrast band concentrated on yrast transitions. The calculated
are plotted as a function of the neutron number for energies of the excited zero (0_) and 2_ states
72"84Kr. The experimental values are shown with deviate largely from the known experimental values,
different symbols for different angular momenta, see Ref. [6]. Since this investigation, a large amount
of new experimental data on energy levels and
III - 63
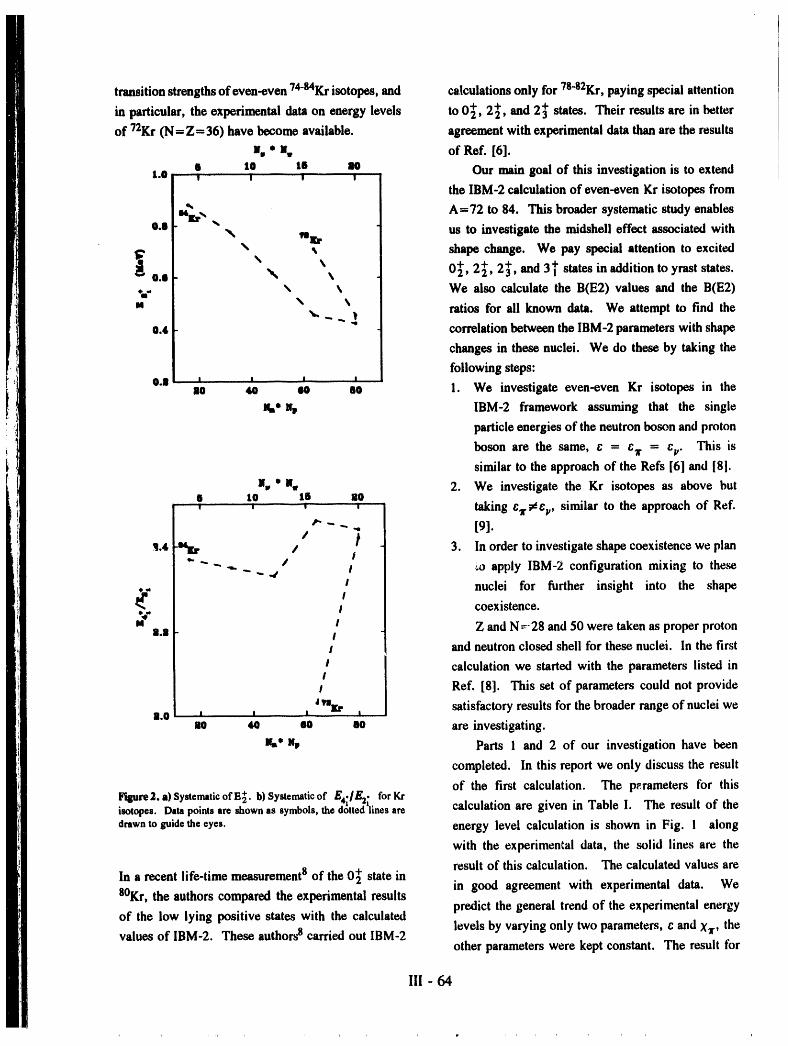
transition strengths of even-even "/4"84Krisotopes, and calculations only for 78"82Kr,paying special attention
in particular, the experimental data on energy levels to 0_, 2_, and 2_"states. Their results are in better
of 72Kr (Nffi Z=36) have become available, agreement with experimental data than are the results
II, * IIw of Ref. [6].
t.O e le t6 aO Our main goal of this investigation is to extendi i I i
the IBM-2 calculation of even-even Kr isotopes from
" A--72 to 84. This broader systematic study enables0.0 '_
N vslr us to investigate the midshell effect associated with\ • shape change. We pay special attention to excited
" ,e.e ,% _, 0_, 2_, 2_', and 3 I" states in addition to yrast states.
+_ \ _ We also calculate the B(E2) values and the B(E2)N _ _ ratios for all known data. We attempt to find the
0.4 correlation between the IBM-2 parameters with shape
changes in these nuclei. We do these by taking the
following steps:I ..... I I '
o.| Io 4o eo ee 1. We investigate even-even Kr isotopes in the
_*N, IBM-2 framework assuming that the single
particle energies of the neutron boson and proton
boson are the same, c = C_r = c_,. This is
similar to the approach of the Refs [6] and [81.
g,, "g,. 2. We investigate the Kr isotopes as above but6 tO 16 gO, , , _ taking cx_ec v, similar to the approach of Ref.
" "_.,. I9]./ t
$.4 .s_ / 3. In order to investigate shape coexistence we plan......... / i
"-- -...4 s _.oapply IBM-2 configuration mixing to theseI nuclei for further insight into the shape
I
_" I coexistence.
M_ I Z and N =28 and 50 were taken as proper protonI1.11 I
I and neutron closed shell for these nuclei. In the first
I calculation we started with the parameters listed inII Ref. [8]. This set of parameters could not provide
nlt. satisfactory results for the broader range of nuclei weII.0 i I • .... i
ao ,to eo oo are investigating.
IIs* H, Parts 1 and 2 of our investigation have been
completed. In this report we only discuss the result
of the first calculation. The parameters for thisFigure2. a) Systematic of E_. b) Systematic of E4,]E 2. for Kr
_. calculation are given in Table I. "l_e result of theisotopes. Data points are shown as symbols, the dotted hnes are
drawn to guide the eyes. energy level calculation is shown in Fig. I along
with the experimental data, the solid lines are the
result of this calculation. The calculated values areIn a recent life-time measurements of the 0_ state in
in good agreement with experimental data. We8°Kr, the authors compared the experimental results
predict the general trend of the experimental energyof the low lying positive states with the calculated
levels by varying only two parameters, c and Xr, thevalues of IBM-2. These authors8 carried out IBM-2other parameters were kept constant. The result for
III-64
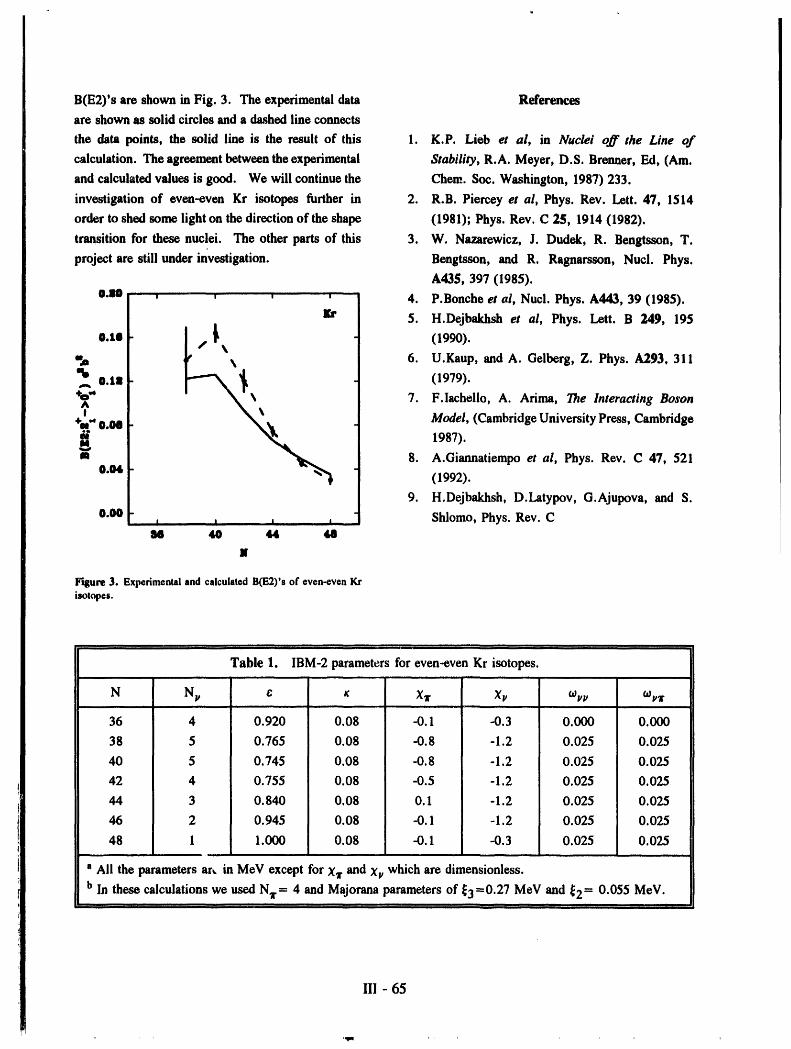
B(E2)'s are shown in Fig. 3. The experimental data References
are shown as solid circles and a dashed line connects
the data points, the solid line is the result of this 1. K.P. Lieb et al, in Nuclei off the Line of
calculation. The agreement between the experimental Stability, R.A. Meyer, D.S. Brenner, Ed, (Am.
and calculated values is good. We will continue the Chem. So¢. Washington, 1987) 233.
investigation of even-even Kr isotopes further in 2. R.B. Piercey et al, Phys. Rev. Lett. 47, 1514
order to shed some light on the direction of the shape (1981); Phys. Rev. C 25, 1914 (1982).
transition for these nuclei. The other parts of this 3. W. Nazarewicz, J. Dudek, R. Bengtsson, T.
project are still under investigation. Bengtsson, and R. Ragnarsson, Nucl. Phys.
A435, 397 (1985).
O.llO . , , , , 4. P.Bonche et al, Nucl. Phys. A443, 39 (1985).
Ib" 5. H.Dejbakhsh et al, Phys. Lett. B 249, 195
o.te _,,_ (1990)._,_ 6. U.Kaup, and A. Gelberg, Z. Phys. A293, 311,,, o.tll (1979).
._" 7. F.IacheUo, A. Arima, The Interacting Boson+m."0.041 Model, (Cambridge University Press, Cambridge
1987).m 8. A.Giannatiempo et al, Phys. Rev. C 47, 521
0.04 (1992).
9. H.Dejbakhsh, D.Latypov, G.Ajupova, and S.
0.041 Shlomo, Phys. Rev. CI14 40 44 411
II
lr_ure 3. Experimental and calculated B(E2)'s of even-even Krisotopes.
,,, , , , ,.,
Table 1. IBM-2 parameters for even-even Kr isotopes.
N N v c r X_r Xv °_vv °_vx
36 4 0.920 0.08 .0.1 -0.3 0.000 0.000
38 5 0.765 0.08 -0.8 -1.2 0.025 0.025
40 5 0.745 0.08 .0.8 -1.2 0.025 0.025
42 4 0.755 0.08 -0.5 -1.2 0.025 0.025
44 3 0. 840 0.08 0.1 -1.2 0.025 0.025
46 2 0.945 0.08 .0.1 -1.2 0.025 0.025
48 1 1.000 0.08 -0.1 .0.3 0.025 0.025
a All the parameters ar_ in MeV except for XT and Xv which are dimensionless.
b In these calculations we used NI.= 4 and Majorana parameters of//3=0.27 MeV and/i2 = 0.055 MeV.
III - 65
Single Particle Level Density in the Continuum
S. Shlomo and H. Dejbakhsh
One of the most interesting experimental results level density, obtained using the Green's function and
in heavy-ion reactions, first seen at our laboratory, is phase shift methods, agrees well with the semi-
the sharp decrease of the level density parameter a classical result of the Thomas-Fermi approximation.
with temperature T (excitation energy). It was found When summed over all L, the level density is positive
that a decreases from A/8 at T<3 MeV to A/14 at T for all values of E. This result is not in contradiction
= 5 MeV. To provide a theoretical explanation, we with Levinson's theorem. In fact, for a fixed L, the
have developed I a model which simultaneously corresponding single particle level density is negative
includes, in a realistic way, many important effects: for large E and fulfills the requirement of Levinson's
(a) surface diffuseness, (2) continuum, (3) space theorem.
variation of the momentum and the frequency 3. For an energy-dependent potential, deduced from
dependent (Ink and m,0) effective masses, and (4) nucleon-nucleus scattering, g(E) is significantly
shell effects. The temperature dependence of these different from that due to an energy independent
effects and of the mean field is also accounted for by potential. Decreasing the magnitude of the potential
the model. Using this model, which represents an depths by 0.3*E, we find that the calculated g(E) by
advance in the state of the art, we have also the phase shift approach becomes negative for E > 40
calculated2 the mass and temperature dependence of MeV. For the Green's function and the Thomas-
a. Fermi methods, g(E) > 0 for an attractive potential
It has been recognized that the single particle well. This disagreement can be easily understood by
level density g(E) should be calculated using a finite noting that the phase shift is directly related to the
potential well, since an accurate treatment of the number of states where the Green's function is
continuum is very important. Considering a Wood- related to the level density. We have modified the
Saxon potential well for a heavy nucleus (A=274), Thomas-Fermi and the Green's function expressions
we have carried out3 accurate numerical calculations to reproduce the single particle level density.
of g(E) applying the methods: (i) Green's function 4. It is important to point out that the local density
approach, (ii) phase shift (derivative) approach, and approximation (LDA), in which a is directly given in
(iii) Thomas-Fermi approximation. It is worthwhile terms of the integral of 01/3, where p is the matter
to note the following: density, is quite often used in the literature (in heavy
1. To determinetheaccuracy and theadvantagesor ion collisions) to relate excitation energy and
disadvantages of these methods, we examined the temperature. Our investigation showed that this LDA
corresponding results for a fixed orbital angular approach overestimates 4 a by almost a factor of 2.
momentum, L, up to L-50. The results for g(E) are
obtained by taking the sum over L to a certain References
maximum value of L. We have also calculated the
correspondin_ smooth single particle level density 1. S. Shlomo and J. B. Natowitz, Phys. Lett. 252B,
using the Strutinski method. We point out that the 187 (1990).
occurrence of a sharp re._nance, such as the L= 8 2. S. Shlomo and J. B. Natowitz, Phys. Rev. C 44,
resonance which has a width of less than 5 ev in our 2878 (1991).
calculations, is a numerical problem for the phase 3. S. Shlomo and H. Dejbakhsh, to be published.
shift (derivative) approach. 4. S. Shlomo, Nucl. Phys. A539, 17 (1992).
2. For an energy independent poten_ml well, the
resulting quantum mechanical (smooth) single particle
III -66
Light Front Dynamics and the Binding Correction
S. V. Akulinichev*
It has been shown I that the binding correction in The authors of Ref. [2], instead of using the
deep inelastic lepton scattering can explain the bulk conservation of the momentum P+, have used the
of the nuclear EMC-effect at x _ 0.2. This result sum rule for the nucleon LF momenta
has significantly restricted searches for the possible
contribution of more exotic effects. However, in _ dp p_)p+ = pa+ / A (2)some later papers2 it was claimed that the binding
correction is unimportant if the light front (LF) where p = (p+, Pl, P2) and p(p) is the nucleon LFw m
representation is used instead of the instant fot r_ (IF) momentum distribution. But the sum rule (2) is not
representation, exact without the contribution of other constituents
In the present work, it is shown that the nuclear (mesons). The part of the binding correction that
binding correction in deep inelastic scattering is was not included in the results of the Ref. [2] is the
essentially independent of the adopted representation, measure of the violation of the sum rule (2) by non-
To prove it, we have used the LF representation, as nucleonic constituents.
in Ref. [2], and compared the result to the earlier
results based on the IF representation. References
In the LF representation, the nuclear structure
function is completely determined by the LF 1. S.V. Akulinichev, S. A. Kulagin, and G. M.
momentum P+ of a struck nucleon. This component Vagradov, Phys. Lett. B 158, 485 (1985); S. V.
of the momentum is strictly conserved and well Akulinichev, S. A. Kulagin, G. M. Vagradov,
defined in the LF representation. Therefore for P+ and S. Shlomo, Phys. Rev. Lett. 55, 2239
of a struck nucleon, we may use the following (1985).
equation
2. U. Oeifke, P. U. Sauer, and F. Coester, Nuci.
p+ = pA+. pA+-I _= mN" Esep (1) Phys. A158, 593 (1990); L. S. Kisslinger and
M. B. Johnson, Phys. Lett. B 259, 416 (1991).
where pA+and p+A-Iare the LF momenta of the initial
and residual nuclei and Esep is the average nucleon
separation energy. The crucial point to obtain (1) is
that the initial and residual nuclei are the free
localizable systems, and therefore their LF momenta
are trivially related to the usual momenta.
Onleave fromInstitutefor NuclearResearch,Moscow 117312, Russia
III - 67
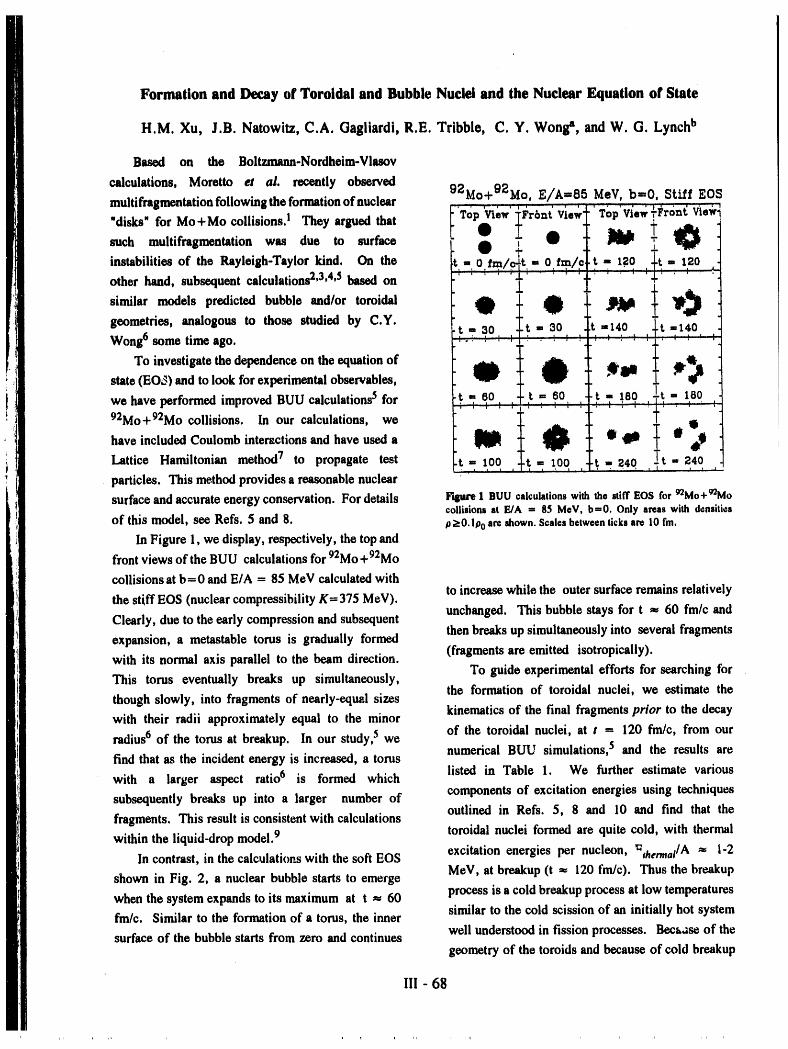
Formation and Decay of Toroidai and Bubble Nuclei and the Nuclear Equation of State
H.M. Xu, J.B. Natowitz, C.A. Gagliardi, R.E. Tribble, C. Y. Wong a, and W. G. Lynch b
Based on the Boltzmann-Nordheim-Vlasov
calculations, Moretto et al. recently observed
multifragmentation following the formation of nuclear 92Mo+92Ho, E/A=85 MeV, b-0, Stiff EOS
"disks" for Me+Me collisions) They argued that Top View _Fr6ntTop
such multifragmentation was due to surface : _ " ]NIIJl! _instabilities of the Rayleigh-Taylor kind, On the t 120 - 120
_ , z ' '_'.'......... 2......otherhand,subsequentcalculations2'3,4,5basedon - "" . "
similar models predicted bubble and/or toroidal e "" e -- j!_jjl i ,_
geometries,analogousto thosestudiedby C.Y. t--3o "_t= 30 , t=140 Tt =.14o.iWong 6some timeago. :-: : : :..:• : , ,., , . _ _±.....
..
To investigatethedependenceon theequationof i" ,. _ .. _state(EOJ)and tolookforexperimentalobservables, ......
we haveperformedimprovedBUU calculations5 for -t =. 60 ._t = e0 ,--t_ 180 Tt = 180
92Mo+92Mocollisions" In °urcalculati°ns'we i _ I} O i t :.have included Coulomb interactions and have used a i _ elf @ J
Lattice Hamiltonian method-/ to propagate test it = 100 _t = 100 .t = 240 "t = 240' i n p a t I ,.', I , I * ' ' ' I ] t ' •
particles. This method provides a reasonable nuclear
surface and accurate energy conservation. For details Fipre I BUU calculationswiththestiffEOSfor 92Mo+92Mocollisionsat E/A = 85 MeV, b=0. Onlyareaswith densities
of this model, see Refs. 5 and 8. p>0.1P0are shown.Scalesbetweenticksare 10fm.
In Figure 1, we display, respectively, the top and
front views of the BUU calculations for 92Mo+92Mo
collisions at b-O and E/A = 85 MeV calculated withto increase while the outer surface remains relatively
the stiff EOS (nuclear compressibility K= 375 MeV).
Clearly, due to the early compression and subsequent unchanged. This bubble stays for t _ 60 fm/c andthen breaks up simultaneously into several fragments
expansion, a metastable torus is gradually formed
with its normal axis parallel to the beam direction. (fragments are emitted isotropically).To guide experimental efforts for searching for
This torus eventually breaks up simultaneously,the formation of toroidal nuclei, we estimate the
though slowly, into fragments of nearly-equal sizeskinematics of the final fragments prior to the decay
with their radii approximately equal to the minorof the toroidal nuclei, at t - 120 fm/c, from our
radius6 of the torus at breakup. In our study,5 wenumerical BUU simulations, 5 and the results are
find that as the incident energy is increased, a tomslisted in Table 1. We further estimate various
with a larger aspect ratio6 is formed which
subsequently breaks up into a larger number of components of excitation energies using techniquesoutlined in Refs. 5, 8 and 10 and find that the
fragments. This result is consistent with calculations
within the liquid-drop model. 9 toroidal nuclei formed are quite cold, with thermalexcitation energies per nucleon, _ermat/A '_ i-2In contrast, in the calculations with the soft EOSMeV, at breakup (t _,, 120 fm/c). Thus the breakup
shown in Fig. 2, a nuclear bubble starts to emerge
when the system expands to its maximum at t _ 60 process is a cold breakup process at low temperaturessimilar to the cold scission of an initially hot systemfm/c. Similar to the formation of a torus, the innerwell understood in fission processes. Becaase of thesurface of the bubble starts from zero and continuesgeometry of the toroids and because of cold breakup
III - 68
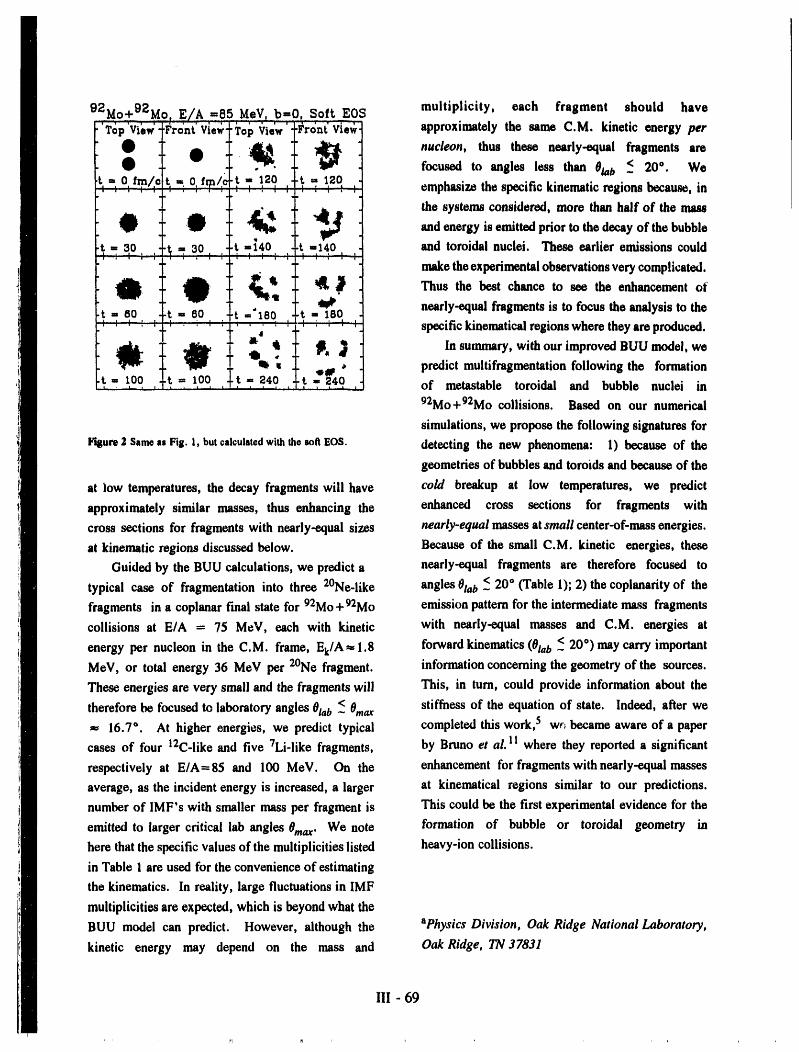
92Mo+92.lvfo_ E/A,=.85+MeV, b=O, S.oftEOS multiplicity, each fragment should have"Top View'-Front View+"TopView' ,Front'Vie_r, approximately the same C.M. kinetic energy per
: ' il :_i_. _ ! nucleon, thus these nearly-equal fragments arei 0 • focused to angles less than 0/a/, < 20 °. We-o m of/ct-'12o t 12o .
,I-- :'I: : : : z i '_ t _ I emphasize the specific kinematic regions because, in• the systems considered, _re than half of the mass
i e -_ .o _¢_ "_10,_ " and energy is emitted prior to the decay of the bubble
"it =+30, :: ", : z :', ........ ', .t =14o . and toroidal nuclei. These earlier emissions could"" make the experimental observations very complicated.
_41, :: _l, _ Thus the best chancet11 to see the enhancement o|'mq
t .. ,iO'" nearly-equal fragments is to focus the analysis to the•t = 80 ,.t = 60 -,'t ='180 --t - 180: : : + ' : : :''' ' _ ; ' I + " : +_ specific kinematicalregionswheretheyareproduced,
• _ _ .. It . .. _+ _ In summary, with our improved BUU model, we_ "" gW " predict multifragmentation following the formation
.t = 100 ,._.t, = 100,, t 7 +40 ,.-t ,7,240 of metastable toroidal and bubble nuclei in
92Mo+92Mo collisions. Based on our numerical
simulations, we propose the following signatures for
l'1gure2 Sameas Fig. I, butcalculatedwiththesoft EOS. detecting the new phenomena: 1) because of the
geometries of bubbles and toroids and because of the
at low temperatures, the decay fragments will have cold breakup at low temperatures, we predict
approximately similar masses, thus enhancing the enhanced cross sections for fragments with
cross sections for fragments with nearly-equal sizes nearly-equal masses at small center-of-mass energies.
at kinematic regions discussed below. Because of the small C.M. kinetic energies, these
Guided by the BUU calculations, we predict a nearly-equal fragments are therefore focused to
typical case of fragmentation into three 2°Ne-like angles Olal,< 20 ° (Table 1); 2)the coplanarity of the
fragments in a coplanar final state for 92Mo+92Mo emission pattern for the intermediate mass fragments
collisions at E/A -- 75 MeV, each with kinetic with nearly-equal masses and C.M. energies at
energy per nucleon in the C.M. frame, Ek/A_ 1.8 forward kinematics (Olab < 20 °) may carry important
MeV, or total energy 36 MeV per 2°Ne fragment, information concerning the geometry of the sources.
These energies are very small and the fragments will This, in turn, could provide information about the
therefore be focused to laboratory angles Olab < Omax stiffness of the equation of state. Indeed, after we
16.7 °. At higher energies, we predict typical completed this work, 5 w_-_became aware of a paper
cases of four 12C-like and five 7Li-like fragments, by Bruno et al. I1 where they reported a significant
respectively at E/A-85 and 100 MeV. On the enhancement for fragments with nearly-equal masses
average, as the incident energy is increased, a larger at kinematical regions similar to our predictions.
number of IMF's with smaller mass per fragment is This could be the first experimental evidence for the
emitted to larger critical lab angles Omax. We note formation of bubble or toroidal geometry in
here that the specific values of the multiplicities listed heavy-ion collisions.
in Table 1 are used for the convenience of estimating
the kinematics. In reality, large fluctuations in IMF
multiplicities are expected, which is beyond what the
BUU model can predict. However, although the aphysics Division, Oak Ridge National Laboratory,
kinetic energy may depend on the mass and Oak Ridge, TN37831
III - 69
bCyclotron Laboratory, Michigan State Unlt_rstty, 8. H.M. Xu, et al,, Phys. Rev. Lett. 65, 843
East Lansing, MI 48824 (1990); Phys. Lett. 13261, 240 (1991); Phys.
Left. B299, 199 (1993); H.M. Xu, Phys. Rev.
Referemces Lett. 67, 2769 (1991); Phys. Rev. C 46, R389
(1992).
1. L.G. Moretto, et al., Phys. Rev. Lett. 69, 1884 9. C.Y. Wong, H.M. Xu, and B. Xiao (to be
(1992). published).
2. W. Bauer, a at., Phys. Rev. Left, 69, 1888 10. B. Remaud, a al., Nucl. Phys. A488, 423c
(1992). (1988).
3. D.H.E. Gross, et al., Ann. Physik 1, 467 11. M. Bruno, aal., Phys. Lett. 13292, 251 (1992).
(1992).
4. B. Borderie, et al., Universit6 Paris Report TABLE I
I.P.N.-91406, 1992 (to be published). Multifragmentdeea_from a metastabletoroidalnucleusin "_Mo + _ZMocollisions predictedby
5. H.M. Xu, Phys. Rev. C 46, R2144 (1992); our improvedBUU modelH.M. Xu, et al., (to be published).
_A IMF multi- I_dA !_, 0,_6. C.Y. Wong, Phys. Lett. 41B, 446 (1972); 41B, Oaev) plieity (MeV) (MeV)
451 (1972); K.T.R. Davies, et al., 41B 455 75 2°Ne 3 1.8 36 16.7"(1972); C.Y. Wong, Annals of Phys. 77, 279
(1973). 85 12C 4 2.4 29 19.1°
7. R.J. Lenk and V.R. Pandharipande, Phys. Rev. 100 7Li 5 2.9 20 20,9 °C 39, 2242 (1989). .... ............
Polyhedron and Sausage Instabilities in the Decay of Bubble and Toroidai Nuclei
C. Y. Wong*, H. M. Xu, and B. Xiao
Recently, exotic nuclear shapes, analogous to deformation energy for the bubble nucleus, Edof can
those studied by C. Y. Wong, 1,2 some time ago, be expressed as
were observed theoretically in BUU simulations. 3"7
In the present work, we wish to examine symmetric E_ = Es(°)[ga(p) +2xg c (p)], (I)
configurations and instabilities leading to the breakup
of toroidal and spherical bubble nuclei into equal where E,(0) = 41roRo2 is the surface energy of an
fragments, with the liquid-drop model. 8 equivalent nucleus of radius R0 which has the _me
We study first the breakup of a spherical bubble volume, x = (3Z2e2/5Ro) + 2Es(°) is the fissility
nucleus. The nuclear matterduring the breakup stage parameter, p -- Ri/R 2 < 1 is the aspect ratio of the
has a surface tension whose coefficient o depends on bubble nucleus with an inner radius R I and an outer
the temperature and the density. For breakup radius R2(Fig. la). The geometrical factor gs(p) for
processes in intermediate-energy heavy-ion reactions, the surface energy and go(P) for the Coulomb energythe nuclear shell effects can be neglected. The are!
II1 - 70
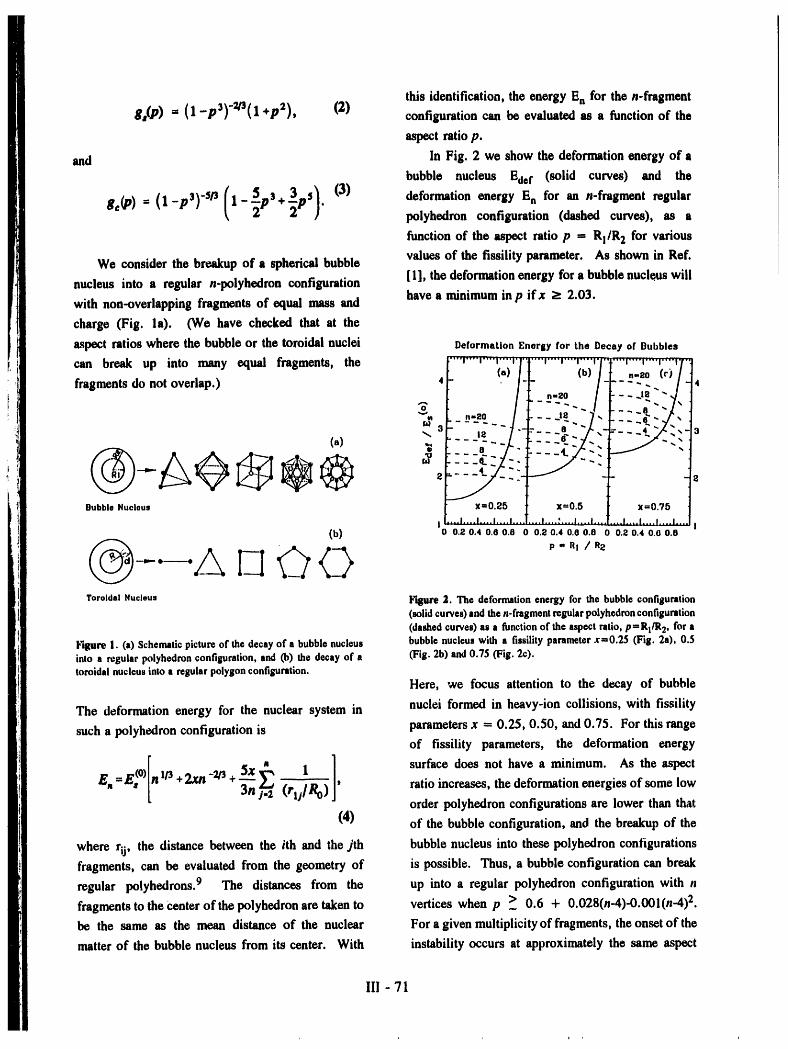
this identification, the energy En for the n-fragment
Be(P) = (1 _p3)-20(1 +p2), (2) configuration can be evaluated as a function of the
aspect ratio p.
and In Fig. 2 we show the deformation energy of a
bubble nucleus Edef (solid curves) and the
go(P) = (l_p3)_sr j (l__52p3+3pS). (3) deformation energy En for an n-fragment regularpolyhedron configuration (dashed curves), as a
function of the aspect ratio p -- RI/R2 for various
values of the fissility parameter. As shown in Ref.We consider the breakup of a spherical bubble
nucleus into a regular n-polyhedron configuration [1], the deformation energy for a bubble nucle.us willhave a minimum in p ifx _e 2,03.
with non-overlapping fragments of equal mass and
charge (Fig. la). (We have checked that at the
aspect ratios where the bubble or the toroidal nuclei DeformationEnergy for the Decay of Bubbles
can break up into many equal fragments, the
fragments do not overlap.) 4 4
.g
ta 3 3
Bubble Nucleus
I(b) 0 0.20.40.e0.8 0 0.20.40.e0,8 0 0.s0.40.00.8
Toroldal Nucleus F'I_i'_ 1. The deformation energy for the bubble configuration
(solidcurves)andthen-fragmentregularpolyhedronconfiguration(dashedcurves)asa functionof the aspectratio,PfRI/R2, fora
t'q_,ure1. (a)Schematicpictureof thedecayof a bubblenucleus bubblenucleuswitha fissilityparameterx=0.25 (Fig. 2a), 0.5iDlea regularpolyhedronconfiguration,and(b) the decayof • (Fig, 2b)•nd0.75 (Fig. 2c).toroidalnucleusinto• regularpolygonconfiguration.
Here, we focus attention to the decay of bubble
The deformation energy for the nuclear system in nuclei formed in heavy-ion collisions, with fissility
such a polyhedron configuration is parameters x = 0.25, 0.50, and 0.75. For this rangeof fissility parameters, the deformation energy
£m=E<,O)[nl_+2xn_a_+Sx_. 2 1 ] surface does not have a minimum. As the aspect3-'_ (rljR0) , ratio increases, the deformation energies of some loworder polyhedron configurations are lower than that
(4) of the bubble configuration, and the breakup of the
where rij, the distance between the ith and the jth bubble nucleus into these polyhedron configurations
fragments, can be evaluated from the geometry of is possible. Thus, a bubble configuration can break
regular polyhedrons. 9 The distances from the up into a regular polyhedron configuration with n
fragments to the Center of the polyhedron are taken to vertices when p > 0.6 + 0.028(n-4)-O.001(n-4) 2.
be the same as the mean distance of the nuclear Fore given multiplicity of fragments, the onset of the
matter of the bubble nucleus from its center. With instability occurs at approximately the same aspect
III - 71
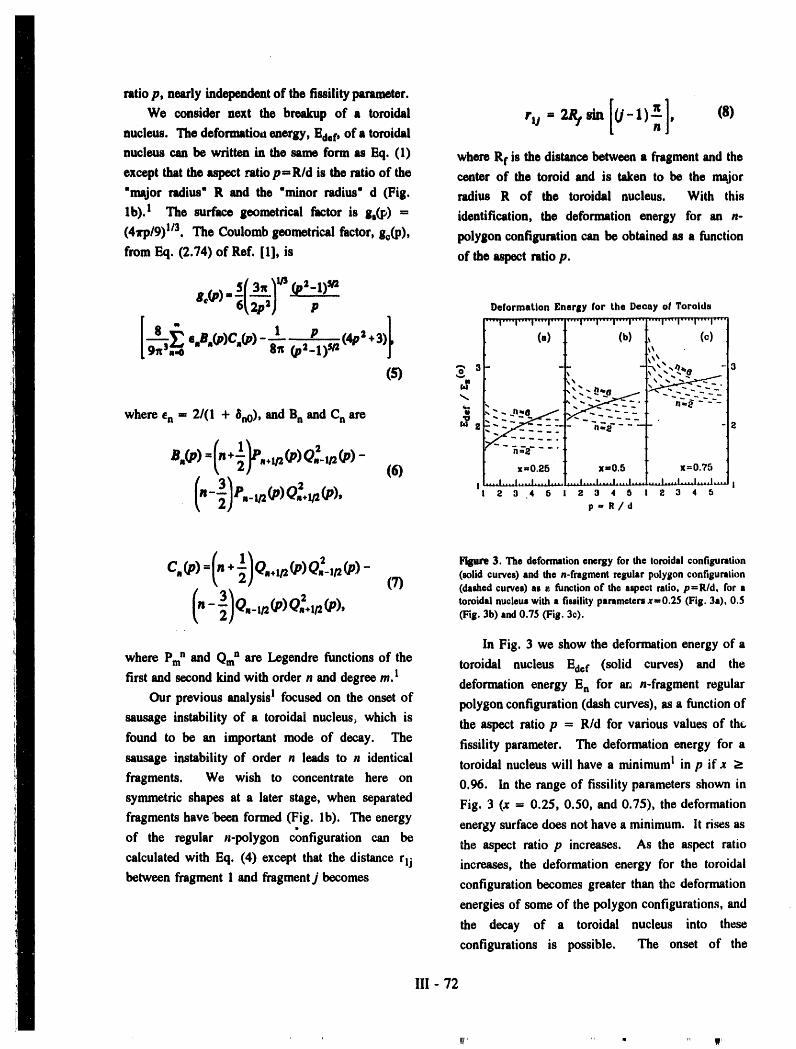
ratiop, nearlyindependentof the fissility parameter.
We consider next the breakup of a toroidal rlj= 2R/sin [(j-l)--x ], (8)nucleus. The deformatiottenergy, l_def, of a toroidal [ n J
nucleus can be written in the same form as Eq. (1) where Rf is the distancebetween a fragmentand the
except thatthe aspect ratiop=R/d is the ratio of the center of the toroid and is taken to be the major"majorradius" R and the "minor radius" d (Fig. radius R of the toroidal nucleus. With this
lb). 1 The surface geometrical factor is g,(p) = identification, the deformation energy for an n-
(4wp/9)l/3. The Coulombgeometricalfactor, go(P), polygonconfiguration can be obtainedas a function
from Eq. (2.74) of Ref. [1], is of the aspect ratiop.
8c(P) _L'_pa) P Deformation Energy for the De©ay o! Torolda
1 P '(4P2+3)t (a) _ (b) ],,, (c)a.s.(e)c.b,)-T I__ ,
(S) 3- . -3• _ _, .. ,.,, _ •
where en : 21(1 + Bn0), and Bn and Cn are _ s """ "---"""--- '_"-.... ..... s
a,(p): + (6) |
L2) paR/d
(/1 1)Q a 2 l_re 3. The deformation energy for the toroidal configurationCn(P) = + +I/2(P)Qn-I/2(_p) - (mild curves) and the n-fragment regular polygon configuration
(7) (dashed curves) as e function of the aspect ratio, p=RId, for a
- -1/2 (_)Qm+ 1/'2(P)' toroidal nucleuswith • fi.ility parametersx=0.25 (Fig. 3,,), 0.5(Fig. 3b) and 0.75 ('Fig. 3c)., ,
In Fig. 3 we show the deformationenergy of awhere Pmn and Qmn are Legendre functions of the toroidal nucleus Edef (solid curves) and the
firstand secondkind with ordern and degreem.l deformationenergy En for ar_n-fragment regularOur previous analysist focused on the onset of polygon configuration(dash curves), as a functionof
sausage instability of a toroidai nucleus, which is the aspect ratio p = Rid for various values of tht;
found to be an important mode of decay. The fissility parameter. The deformationenergy for a
sausage instability of order n leads to n identical toroidal nucleuswill have a minimumI in p if .xfragments. We wish to concentrate here on 0.96. In the range of fissility parametersshown in
symmetric shapes at a later stage, when separated Fig. 3 (x = 0.25, 0.50, and 0.75), the deformationfragments have 'beenformed(Fig. lb). The energy
energy surfacedoes nothave a minimum. It rises asof the regular n-polygon configuration can be
the aspect ratio p increases. As the aspect ratiocalculated with Eq. (4) except that the distance rlj increases, the deformationenergy for the toroidalbetween fragment1 and fragmentj becomes configurationbecomes greaterthan the deformation
energies of some of the polygon configurations,and
the decay of a toroidal nucleus into these
configurations is possible. The onset of the
III - 72
IF' IP'
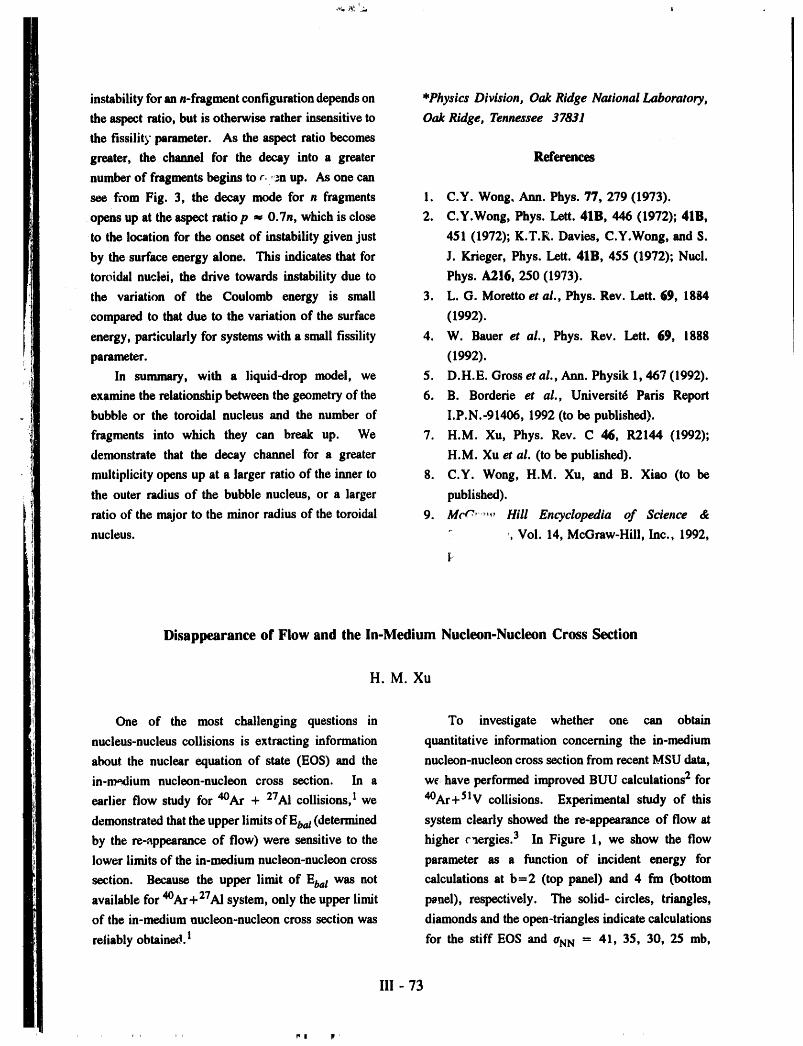
instability for an n-fragment configuration depends on *Physics Division, Oak Ridge National Laboratory,
the aspect ratio, but is otherwise rather insensitive to Oak Ridge, Tennessee 37831
the fissility parameter. As the aspect ratio becomes
greater, the channel for the decay into a greater References
number of fragments begins to r. _3nup. As one can
see fi'om Fig. 3, the decay mode for n fragments 1. C.Y. Wong, Ann. Phys. 77, 279 (1973).
opens up at the aspect ratio p _ 0.7n, which is close 2. C.Y.Wong, Phys. Lett. 41B, 446 (1972); 41B,
to the location for the onset of instability given just 451 (1972); K.T.I_. Davies, C.Y.Wong, and S.
by the surface energy alone. This indicates that for J. Krieger, Phys. Lett. 41B, 455 (1972); Nucl.
toroidal nuclei, the drive towards instability due to Phys. A216, 250 (1973).
the variation of the Coulomb energy is small 3. L.G. Moretto et al., Phys. Rev. Lett. 69, 1884
compared to that due to the variation of the surface (1992).
energy, particularly for systems with a small fissility 4. W. Bauer et al., Phys. Rev. Lett. 69, 1888 Iparameter. (1992).
In summary, with a liquid-drop model, we 5. D.H.E. Gross et al., Ann. Physik 1,467 (1992).
examine the relationship between the geometry of the 6. B. Borderie et al., Universit6 Paris Report
bubble or the toroidal nucleus and the number of I.P,N.-91406, 1992 (to be published).
fragments into which they can break up. We 7. H.M. Xu, Phys. Rev. C 46, R2144 (1992);
demonstrate that the decay channel for a greater H.M. Xu et al. (to be published).
multiplicity opens up at a larger ratio of the inner to 8. C.Y. Wong, H.M. Xu, and B. Xiao (to be
the outer radius of the bubble nucleus, or a larger published).
ratio of the major to the minor radius of the toroidal 9. McCOy,,,, Hill Encyclopedia of Science &
nucleus. " ', Vol. 14, McGraw-Hill, Inc., 1992,
Disappearance of Flow and the In-Medium Nucleon-Nucleon Cross Section
H. M. Xu
One of the most challenging questions in To investigate whether one can obtain
nucleus-nucleus collisions is extracting information quantitative information concerning the in-medium
about the nuclear equation of state (EOS) and the nucleon-nucleon cross section from recent MSU data,
in-n_ium nucleon-nucleon cross section. In a we have performed improved BUU calculations 2 for
earlier flow study for 4°Ar + 27A1 collisions, 1 we 40Ar+51V collisions. Experimental study of this
demonstrated that the upper limits ofEba l (determined system clearly showed the re-appearance of flow at
by the re-appearance of flow) were sensitive to the higher c'lergies. 3 In Figure 1, we show the flow
lower limits of the in-medium nucleon-nucleon cross parameter as a function of incident energy for
section. Because the upper limit of Et,at was not calculations at b-2 (top panel) and 4 fin (bottom
available for 4°Ar+27AI system, only the upper limit panel), respectively. The solid- circles, triangles,
of the in-medium nucleon-nucleon cross section was diamonds and the open-triangles indicate calculations
reliably obtained. I for the stiff EOS and orNN= 41, 35, 30, 25 rob,
Ill - 73
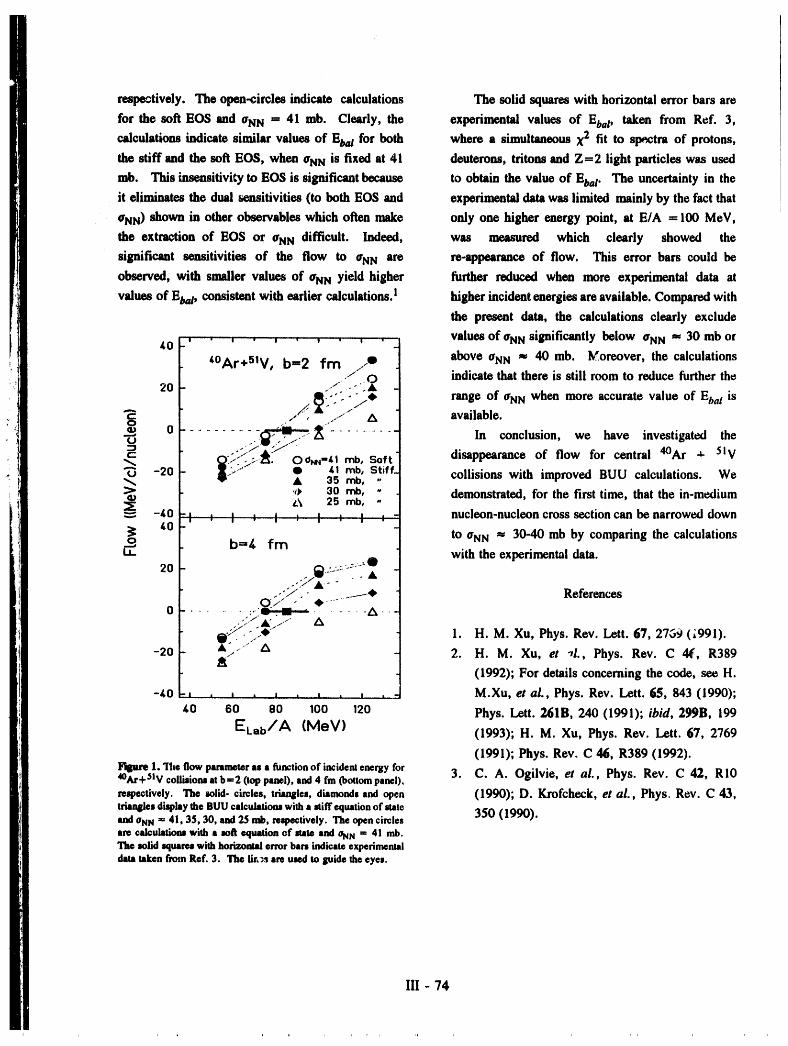
respevtively. The open-circles indicate calculations The solid squares with horizontal error bars are
for the soft EOS and aNN = 41 rob. Clearly, the experimental values of Ebal, taken from Ref. 3,
calculations indicate similar values of Eba/ for both where a simultaneous X2 fit to spectra of protons,
the stiff and the soft EOS, when CNNis fixed at 41 deuterons, tritons and Z=2 light particles was used
rob. This insensitivity to EOS is significant because to obtain the value of EbaI. The uncertainty in the
it eliminates the dual sensitivities (to both EOS and experimental data was limited mainly by the fact that
ONN ) 8howrnin other observables which often make only one higher energy point, at E/A -100 MeV,
the extraction of EOS or ¢rNNdifficult. Indeed, was measured which clearly showed the
significant sensitivities of the flow to UNN are re-appearance of flow. This error bars could be
observed, with smaller values of ONN yield higher further reduced when more experimental data at
values of E/a/, consistent with earlier calculations.I higher incident energies are available. Compared with
the present data, the calculations clearly exclude
tO " ' ' ' ' ' ' ' ' , _ values of ONN significantly below O'NN _ 30 mb or
_°Ar+UIV, b=2 fm ..e above #NN _ 40 mb. Moreover, the calculations•/ O indicate that there is still room to reduce further the
20 /" .-"_A_L'-"'_/* range of OrNNwhen more accurate value of EbaI is
"_ /"__-"" A available.0 .' --
® o ......... ........."u I...--: -- In conclusion, we have investigated the
e- 0_-/.>_. O¢_-LI rob, Soft disappearance of flow for central 40Ar _ 5Iv
-20 l_;"" O tl rob, Stiff. collisions with improved BUU calculations. We"_ qP" A 35 rob, ..
,a, 30 rob, - demonstrated, for the first time, that the in-medium:__ L\ 25 rob, ,._. -40 I : I " I , I , I : - nucleon-nucleon cross section can be narrowed down
_.o to O'NN m 30-40 mb by comparing the calculationso b=4 fm
iT', with the experimental data.
...Tw:-._:.--..,.-'_". • __--_ References
o ....... *.....-,,.-,,I"" , I°
.>.-".&...-" AQ_:. _...# 1. H.M. Xu, Phys. Rev. Lett. 67, 2769 (;991).
&".." A 2. H. M. Xu, et _1., Phys. Rev. C 4_, R389-20 _/
(1992); For details concerning the code, see H.
-40 , . , , , , , , , , - M.Xu, etal.,Phys. Rev. Lett. 65, 843 (1990);
40 60 80 100 120 Phys. Lett. 261B, 240 (1991); ibid, 299B, 199
ELab/A (MoV) (1993); H. M. Xu, Phys. Rev. Lett. 67, 2769
(1991); Phys. Rev. C 46, R389 (1992).1. 'Ihe flow parameter as • function of incident energy for
4OAr+51V¢ollisiona•tb=2(toppanel),and4fm(lmttompanei) ' 3. C. A. Ogilvie, et al., Phys. Rev. C 42, RI0re_peotively. The solid-¢ireles, triangles, diamondsand open (1990); D. Krofcheck, et al., Phys, Rev. C 43,triangles di_lay the BUU calculations with • =tiff equation of _tte
350 (1990).aNN = 41, 35, 30, and 25 rob, reape¢fively. The open circles
are cakuiatiom with • mR equation of gate and ONNm 41 mb.The mild squares with horizontal error ban, indicate experimentaldata taken from Ref. 3. The li_3s are used to guide the eyes.
III - 74
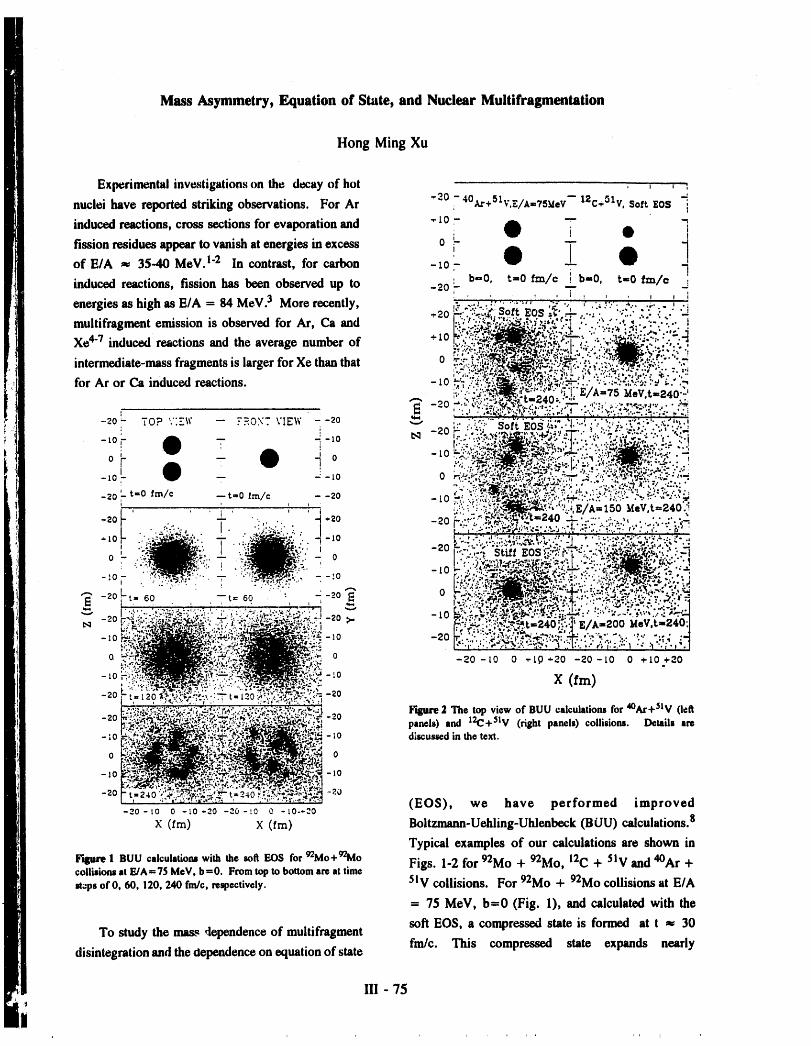
Mass Asymmetry, Equation of State, and Nuclear Muitifragmentation
Hong Ming Xu
Ill - 751
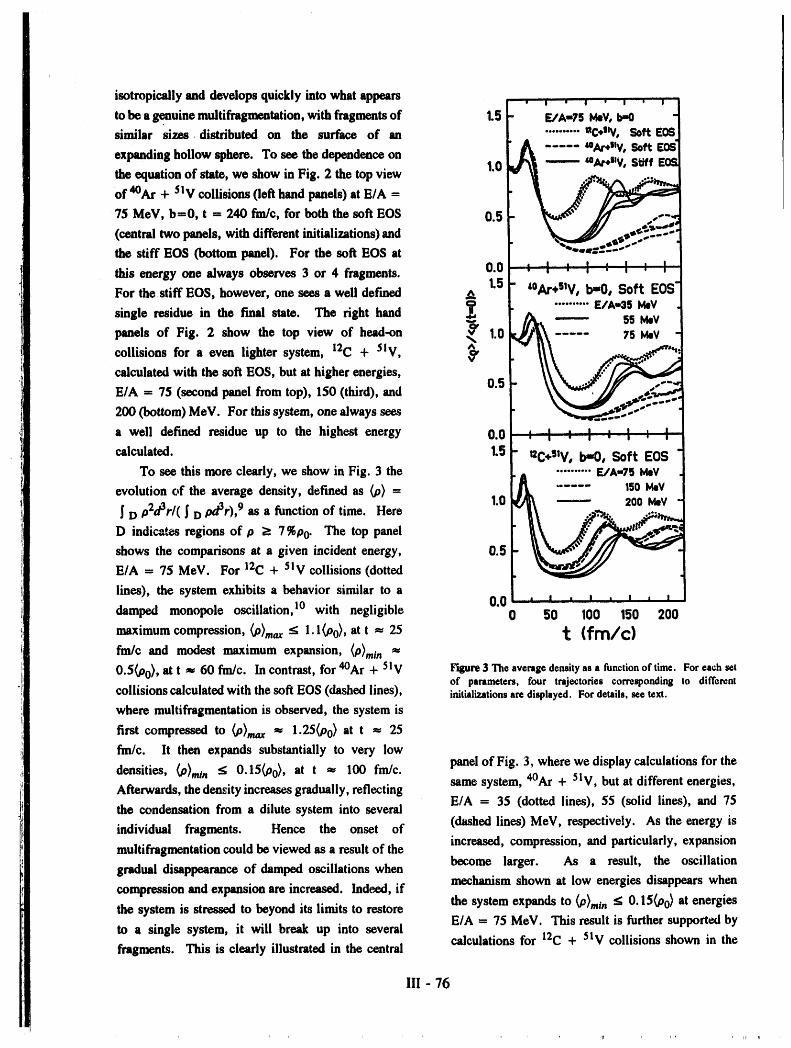
isotropically and develops quickly into what appears t . ',' ' , ' , ' ,I
to be a genuine multifragmentation, with fragments of 1.5 _ g/A-75 I_V, b-0 "_similar sizes distributed on the surface of an | .......... _C*stV, Soft E0sl
r A ..... -.o,,v.s..expanding hollow sphere. To see the dependence on _'_ ------ _Ar+slV,Stiff EOSthe equation of state, we show in Fig. 2 the top view 1.0 /
of 4°At + 5iv collisions (left hand panels)at E/A= _ "__L75 MeV, b=O, t = 240 fro/c, for both the soft EOS 0.5
(central two panels, with different initializations)and J _ J _..,_'_-='_-':
the stiff EOS (bottom panel). For the soft EOS at _, -_-,G==-%**-=''- "
this energy one always observes 3 or 4 fragments. 0.0 ; '. J, ." ,' .' ,' .' ,'
For the stiff EOS, however, one sees a well defmed A 1.5 _ t0Ar+slV, b=0, Soft EOS"
single residue in the final state. The right hand _ _k. .......... E/A-a5 I_V"------ 55 l_V
panels of Fig. 2 show the top view of head-on vq' 1.0 _fl_[_ ..... 75 I_V
c°ilisi°nsf°raeven lightersystem' 12C + 5Iv' _ " \_k /_calculated with the soft EOS, but at higher energies, ,..
E/A = 75 (second panel from top), 150 (third), and 0.5 \_-,,.,_.-/.jr.,,,_
200 (bottom) MeV. For this system, one always sees _.-"_'_,.*::'-*_,"0"- "_,lmJ _v
, I i I I ! t Ia well defined residue up to the highest energy 0.0 i , . , . , . ,
calculated. 1.5 - _C.!lV, b-0, Soft EOSTo see this more clearly, we showin Fig. 3 the .......... E/A=75 I_V
P]k ..... 150MeVevolution of the average density, defined as _) = 1.0 _1_ "---- 200 MeV
D p2d3r/( _ D _/3r), 9 as a function of time. Here _ f__..._._':.,_u_-''".. ""_D indicates regions of p _ 7%p O. The top panel _''_ IIp'P'-''_-
shows the comparisons at a given incident energy, 0.5 _k_._"_¢,//// _-
E/A = 75 MeV. For 12C + 5Iv collisions (dotted
lines), the system exhibits a behavior similar to a
damped monopole osciUation, I0 with negligible 0.0 ' "' ' ' ' ' ' '0 50 100 150 200
maximum compression, _O)max_ l.l(P0), at t "_ 25 t (fm/c)fm/c and modest maximum expansion, (P)min _
0.5(P0), at t _ 60 fm/c. In contrast, for 4°Ar + 5Iv leqlure3 Theaverage densityas a functionof time. Foreach setof parameters, four trajectories corresponding to different
collisions calculated with the soft EOS (dashed lines), initializationsare displayed. [:or details,seetext.
where multifragmentation is observed, the system is
first compressed to _O)max _ 1.25_o 0) at t = 25
fm/c. It then expands substantially to very low
densities, _o)min _g O.15_o0), at t =,, 100 fm/c. panel of Fig. 3, where we display calculations for the
Afterwards, the density increases gradually, reflecting same system, 4°Ar + 5Iv, but at different energies,E/A = 35 (dotted lines), 55 (solid lines), and 75
the condensation from a dilute system into several
individual fragments. Hence the onset of (dashed lines) MeV, respective|y. As the energy is
muitifragmentation could be viewed as a result of the increased, compression, and particularly, expansionbecome larger. As a result, the oscillation
gradual disappearance of damped oscillations whenmechanism shown at low energies disappears when
compression and expansion are increased. Inde,ed, ifthe system expands to (p),.,_ g 0.15(p0) at energies
the system is stressed to beyond its limits to restoreE/A = 75 MeV. This result is further supported by
to a single system, it will break up into severalcalculations for 12C + 5iV collisions shown in the
fragments. This is clearly illustrated in the central
III - 76
E/A=75 MeV,b=0bottom panel of Fig. 3, where oscillations persist up , , . , . , . ,
to energy E/A - 200 MeV for which no _ 'tl //_''". tfragmentation is observed. _ 3 [ / _ "\ -]To investigate whether there is a critical ...
compression or expansion for which _ ]/ \ "'... i
multifragmentation channel opens up, we show in the J 2 I/ \ "''4
t°P Panel °f Fig" 3 calculati°ns f°r 4°At + 5IV "_ (."".._. /..,__j_d_,
collisions with the stiff EOS (solid lines), where W I Lsingle residues are formed at E/A - 75 MeV.
0 I , _"....d" I "'"r.... +""[' I ' I ' I ' I I
Although the final states are completely different (see _ _-'- ...... uc.lIV. Soft EOS"Fig. 2), sin_iar maximum densities are reached for :_ ---4eAr_llv,.Soft E0S
both the stiff and the soft EOS. The difference, _ 3 "----'°Ar*_lV,StiffE0S
however, becomes noticeable during the later _expansion stages which lead to completely different <_ 2final configurations. Thus it is mainly the property _ \
of EOS at the later expansion stages that determines ._ 1 " -.a,as
the final multifragmentation. Stiffer EOS has a LIJ _ ,larger surface tension and therefore its tendency for 0 : : . , , , . , |
a system to break up becomes less. Although it _. 4
appears too early to determine a critical compression, _ /\it may nevertheless be possible to determine a critical 3 ,:. t "
maximum expansion since the major dynamical _ _ ,_2 -
process is already over when the system reaches the X ] \'_\"""" " '/"'=" "maximum expansion. For 4°Ar + 5Iv collisions, we ,:_ 1find that the critical minimum density for the system W ] ",-'_,_, '.....,,¢:::'."..e.........""
to break up appears to be very low, p _ O.15p0. 0 . , . t , t , ITo assess the role of thermal excitation, we have 0 50 I00 150 200
decomposed the transverse excitation energy _ (fro/c)
approximately into three components, energyFigure 4. The decomposition of transverse excitation energy into
associated with compression, or expansion, E*exp,, energies associated with expansion, collective and thermal energiescollective energy, E coil ' and thermal energy, E the, for 4°Ar+51V and 12C+51V collisions. For details see text.
respectively, 8 using a technique similar to that
outlined in Ref. 10, but considering only the
transverse components. In this decomposition, E*exp
represents the energy change when the density maximum energies per nucleon associated with• •
distribution of the system is changed away from that collective expansion, both E exp/Ares and E coilAres,of a ground state nucleus (e.g., the creation of are much larger for 4°Ar + 5Iv system than that for
surfaces due to fragmentation). As shown in Fig. 4, 12C + 5Iv system, independent of equations of
both the collective energies, E'coilAres (central state. In contrast, similar maximum thermal
panel), and the thermal energies, E*_e/Ares (bottom excitation energies per nucleon are reached for both
panel), reach maximum values at t m 40-50 fm/c. 12C and 40Ar induced reactions at t m 40-50 fm/c.
As a result, the systems expand and the energies This suggests that the dynamical and collectivestored in density, E*exp/Ares (top panel), reach expansion, rather than the thermal excitation, playsmaximum values at slightly later times. Clearly, the
III - 77
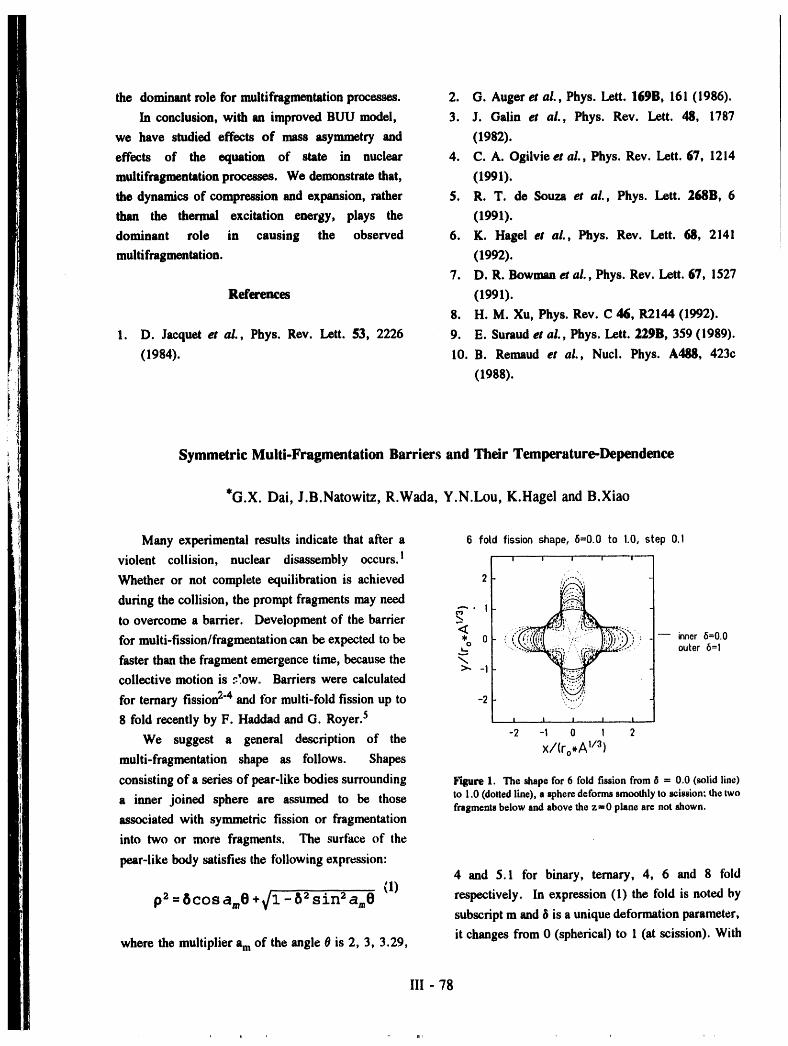
the dominant role for muitifragmentation processes. 2. O. Auger et aL, Phys. Lett. 169B, 161 (1986).
In conclusion, with an improved BUU model, 3. J. Galin et al., Phys. Rev. Lett. 48, 1787
we have studied effects of mass asymmetry and (1982).
effects of the equation of state in nuclear 4. C.A. Ogilvie et al., Phys. Rev. Lett. 67, 1214
multifragmentation processes. We demonstrate that, (1991).
the dynamics of compression and expansion, rather 5. R. T. de Souza et al., Phys. Lett. 268B, 6
than the thermal excitation energy, plays the (1991).
dominant role in causing the observed 6. K. Hagel a al., Phys. Rev. Lett. 68, 2141
multi fragmentation. (1992).
7. D. R. Bowman et al., Phys. Rev. Lett. 67, 1527
References (1991).
8. H.M. Xu, Phys. Rev. C 46, R2144 (1992).
1. D. Jacquet et al., Phys. Rev. Lett. 53, 2226 9. E. Suraudetal., Phys. Lett. 229B, 359(1989).
(1984). 10. B. Remaud et al., Nucl. Phys. A488, 423c
(1988).
Symmetric Multi-Fragmentation Barriers and Their Temperature-Dependence
*G.X. Dai, J.B.Natowitz, R.Wada, Y.N.Lou, K.Hagel and B.Xiao
Many experimental results indicate that after a 6 ford fission shape, 6=0.0 to 1.0, step 0.1
violent collision, nuclear disassembly occurs. I , , , , ,
Whether or not complete equilibration is achieved 2 ii.i-_,_i._
during the collision, the prompt fragments may need
to overcome a barrier. Development of the barrier _ • i
for multi-fission/fragmentation can be expected to be _* (i"_!i _i')0 !ii 'i -......... •_. outer 6=1
faster than the fragment emergence time, because the>" -1
collective motion is .':'.ow. Barriers were calculated
for ternary fission 2"4 and lbr multi-fold fission up to -2
8 fold recently by F. Haddad and G. Royer. 5 , , , , ,
We suggest a general description of the -2 -1 0 I 2
multi-fragmentation shape as follows. Shapes x/(r°*AI/3)
consisting of a series of pear-like bodies surrounding legure 1. The shape for 6 fold fission from 6 - 0.0 (solid line)
a inner joined sphere are assumed to be those to 1.0 (dotted line), a sphere deforms smoothly to scission: the twofragments below and above the z=0 plane are not shown.
associated with symmetric fission or fragmentation
into two or more fragments. The surface of the
pear-like body satisfies the tbllowing expression:4 and 5.1 for binary, ternary, 4, 6 and 8 fold
p2 =Scosam 0 + _/'3.-8 2 sin 2 am0 (1) respectively. In expression (1) the fold is noted bysubscript m and _ is a unique deformation parameter,
it changes from 0 (spherical) to 1 (at scission). Withwhere the multiplier am of the angle 0 is 2, 3, 3.29,
III - 78
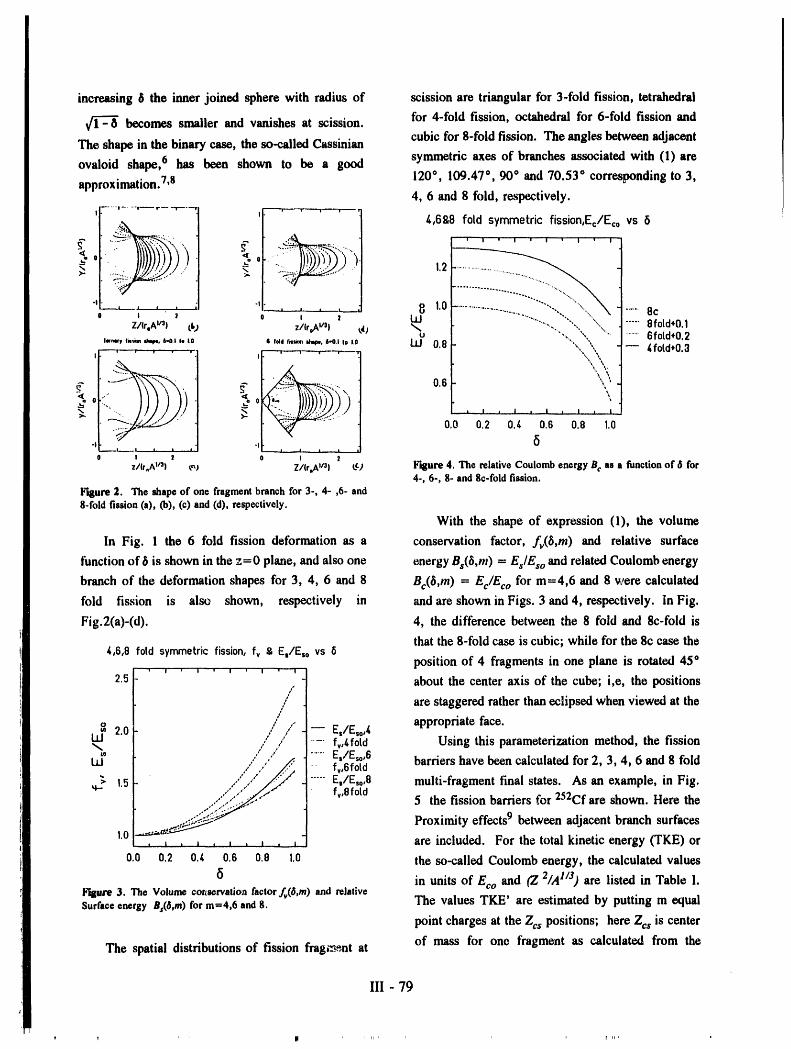
increasing _ the inner joined sphere with radius of scission are triangular for 3-fold fission, tetrahedral
becomes smaller and vanishes at scission, for 4-fold fission, octahedral for 6-fold fission andcubic for 8-fold fission. The angles between adjacent
The shape in the binary case, the so-called Cassinian
ovaloid shape, 6 has been shown to be a good symmetric axes of branches associated with (1)are120°,109.47°,90°and 70.53° correspondingto3,
approximation.7,84,6 and 8 fold,respectively.
.....I.... T''" r ---"--r---"--_ "-'_'-'---r----- I
i i /_,698 fold symmetricfission,Ec/Ecovs 6
' i! ° ........... '''''"''''-I -I
.......... 8, 1,0 ......8c
Z/lr.Av3) it0 z/lroAv_I _,4j ,No .....8fold+0.I.........6fold+0.2I,r,,,,,._,,,_,, S.O._,. ,.0 ,ridf=,,=,,_,,,6-0.1_o,.O LU 0.8 -- 4fold+0.3
I ' I ' '
t..
_. ,..... , , , , 1 , , , ,0.0 0.2 0._ 0.6 0.8 1.0
-I_, -I 6I s I . t s -- * i I t _ i
O I _ I 2
z/IrmAv_) t_) Z/(r°AV3l Lc) F'_ure4. TherelativeCoulombenergyBc asa functionof _ for4-,6-, 8-and8c-foldfission.
Figure2. Theshapeof onefragmentbranchfor3-, 4- ,6-and8-foldfission(a), (b), (c)and(d), respectively.
With the shape of expression (1), the volume
In Fig. 1 the 6 fold fission deformation as a conservation factor, fv(8,m) and relative surface
function of b is shown in the z=0 plane, and also one energy Bs(8,m ) = Es/Eso and related Coulomb energy
branch of the deformation shapes for 3, 4, 6 and 8 Bc(8,m ) = Ec/Eco for m=4,6 and 8 were calculated
fold fission is also shown, respectively in and are shown in Figs. 3 and 4, respectively. In Fig.
Fig.2(a)-(d). 4, the difference between the 8 fold and 8c-fold is
that the 8-fold case is cubic; while for the 8c case the/_,6,8fold symmetricfission,fv g Es/E=ovs 6
position of 4 fragments in one plane is rotated 45°
2,5 about the center axis of the cube; i,e, the positions
are staggered rather than eclipsed when viewed at the
j 2.0 ,/'" _ Es/EsoA appropriate face.
fv,/,fotd Using this parameterization method, the fission
_, I[ . ,,, /,,,_/,__/ Es/Eso,6 barriershavebeencalculatedfor2,3,4,6 and8 fold
LU " fv,6fotd_._ 1,5 Es/Eso,8 multi-fragment final states. As an example, in Fig.
f,,8 fold 5 the fission barriers for 252Cf are shown. Here the
-'::_:_'_" Proximity effects 9 between adjacent branch surfaces1.0i-'=_'_:_• . , , , , , , , , _ are included. For the total kinetic energy(TKE) or
0.0 o.2 o.t 0.6 0.8 1.0 the so-called Coulomb energy, the calculated values
6 in units of Eco and ('Z 2/,41/3) are listed in Table I.Figure3. The Volumeco_,servatio'afactorfv(B,m)and relativeSurfaceenergyBs(6,m)for m=4,6 and8. The values TKE' are estimated by putting m equal
point charges at the Zcs positions; here Zcs is center
of mass for one fragment as calculated from theThe spatial distributions of fission frag_.'_,.-.ntat
III - 79
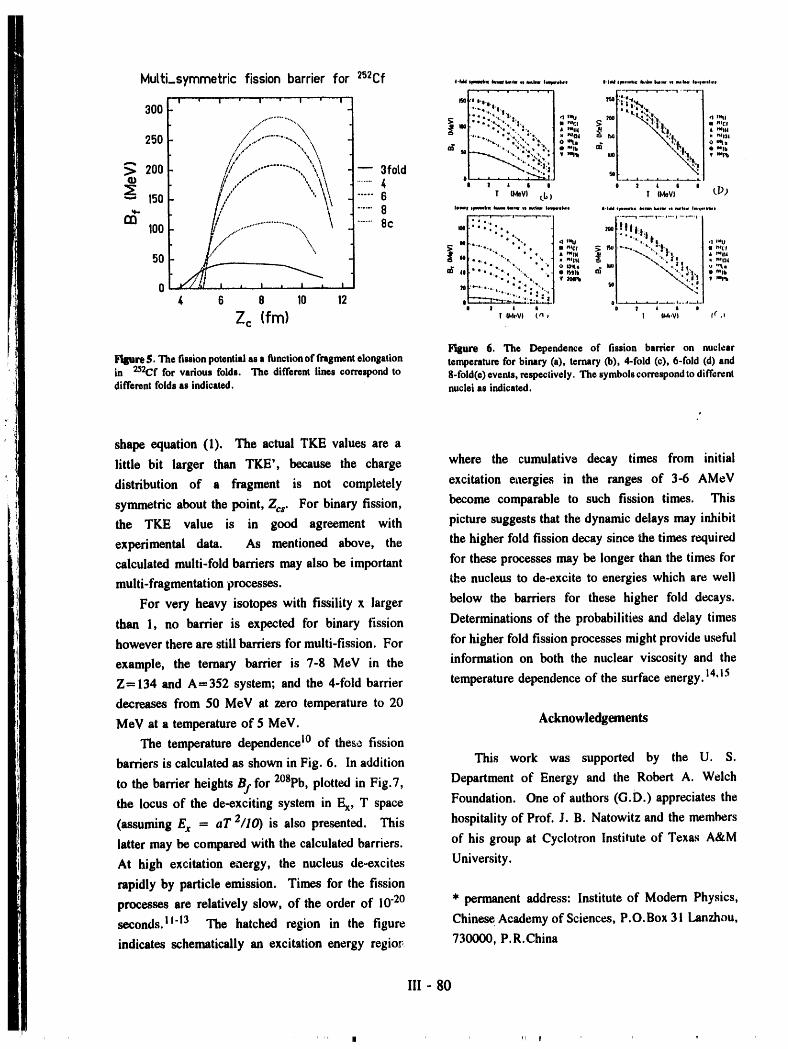
MuttS_symmetric fission barrier for 2s2Cf ,.=,..__...,_ ..... . ..... _. ........... .,
3oo;.' ' ' ' ' ' ' ' '-] =:;?"", " "";:"':'"",_"h .I "_ .o _:,rl,. . ,,_,......................... _; ",•:.,,".,::,, ="-,c, _; - -,c,
.........'',,;'\\ _" _ l._j ,-,,,
250 :'_' _ \}"t.. °
./,,,,.,,,, '..,.."_ 200 _ .......... ; -- 3foLd .
, , , , o-;-=-;-_--;-_.
_"- 150 !/" '.\\ ..... 6 , _,v, ,_ ,,_v, tP>,. \ ......o " '-'"................. ....,--'--T"QQ I00 .........8c =.::::::., .= .....,.
,..o .. ,..,,, .... !.,,,'\50 ;t = ..... " ' m.-,, -,.',. "', ' " 1 ""m "%, "' • ;_ I I lt'rli
•.......,oo..."". ,_ • "'% " V _ i. V
4 6 8 10 12 , o ..........l I I l ! I l I
Zc (fm) ,,..v, ,.,, , ..v, ,_.,
i_lUre 6. The Dependence of fission barrier on nuclearFigure $. The fissionpotential as a functionof fragmentelonBalion temperature for binary (a), ternary (b), 4-fold (c), 6-fold (d) andin 252Cf for various folds. The different lines correspond to 8-fold(e) events, respectively. The symbols correspond to differentdifferent folds as indicated, nuclei as indicated.
P
shape equation (1). The actual TKE values are a
little bit larger than TKE', because the charge where the cumulative decay times from initial
distribution of a fragment is not completely excitation e_iergies in the ranges of 3-6 AMeV
symmetric about the point, Zcs. For binary fission, become comparable to such fission times. This
the TKE value is in good agreement with picture suggests that the dynamic delays may inhibit
experimental data. As mentioned above, the the higher fold fission decay since the times required
calculated multi-fold barriers may also be important for these processes may be longer than the times for
multi-fragmentation processes, the nucleus to de-excite to energies which are well
For very heavy isotopes with fissility x larger below the barriers for these higher fold decays.
than 1, no barrier is expected for binary fission Determinations of the probabilities and delay times
however there are still barriers for multi-fission. For for higher fold fission processes might provide useful
example, the ternary barrier is 7-8 MeV in the information on both the nuclear viscosity and the
Z = 134 and A = 352 system; and the 4-fold barrier temperature dependence of the surface energy. 14,!5
decreases from 50 MeV at zero temperature to 20
MeV at a temperature of 5 MeV. Acknowledgements
The temperature dependence 10 of thes_ fission
barriers is calculated as shown in Fig. 6. In addition This work was supported by the U. S.
to the barrier heights Bj. for 2°8pb, plotted in Fig.7, Department of Energy and the Robert A. WelchFoundation. One of authors (G.D.) appreciates thethe locus of the de-exciting system in Ex, T space
(assuming Ex - aT 2/10) is also presented. This hospitality of Prof. J. B. Natowitz and the members
latter may be compared with the calculated barriers, of his group at Cyclotron Institute of Texas A&M
At high excitation energy, the nucleus de-excites University.
rapidly by particle emission. Times for the fission
processes are relatively slow, of the order of 10-20 * permanent address: Institute of Modern Physics,
seconds. 11"13 The hatched region in the figure Chinese AcademyofSciences, P.O.Box31 Lanzhou,
indicates schematically an excitation energy region: 730000, P.R.China
Ill - 80
g M
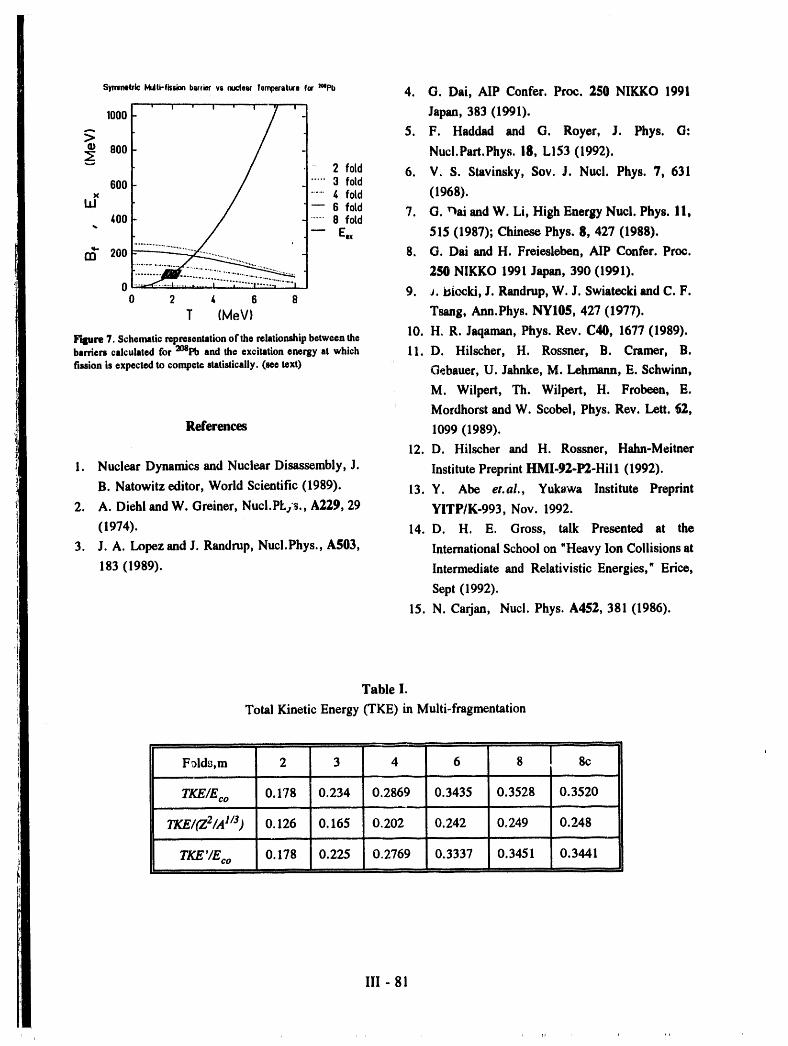
Sy_Mt,k:_U,-fts_ bw,_. ,_.r Wo,_r,t,_°fo__'_ 4. O. Dai, AlP Confer. Proc. 250 NIKKO 1991
1000"'' .......' ' ' Japan,383 (1991).
-"- 5. F. Haddad and G. Royer, J. Phys. G:
>_ 800 Nucl. Part.Phys. 18, L153 (1992).
"" 2 f01d 6. V. S. Stavinsky, Sov. J. Nucl. Phys. 7, 631600 ..... 3 fold
x ...... /, fold (1968).
ttJ -- 6 f0td 7. G. r_ai and W. Li, High Energy Nucl. Phys. 11,400 .........8 ford" -- E. 515 (1987); Chinese Phys. 8, 427 (1988).
C_ 200 8. G. Dai and H. Freiesleben, AlP Confer. Proc.
250 NIKKO 1991 Japan, 390 (1991).
0 9. J. i_iocki, J. Randmp, W. J. Swiatecki and C. F.0 2 _, 6 8T (MeV) Tsang, Ann.Phys. NYI0$, 427 (1977).
10. H. R. Jaqaman, Phys. Rev. C40, 1677 (1989).F[llure 7. Schematic representation of the relationship between thebarriers calculated for 2°_Pb and the excitation energy at which 11. D. Hilscher, H. Rossner, B. Cramer, B.
fission is expected to compete statistically. (see text) Gebauer, U. Jahnke, M. Lehmalm, E. Schwinn,
M. Wilpert, Th. Wilpert, H. Frobeen, E.
Mordhorst and W. Scobel, Phys. Rev. Lett. 62,
References 1099 (1989).
12. D. Hilscher and H. Rossner, Hahn-Meitner
1. Nuclear Dynamics and Nuclear Disassembly, J. Institute Preprint HMI-92-1_-Hill (1992).
B. Natowitz editor, World Scientific (1989). 13. Y. Abe et.al., Yukawa Institute Preprint
2. A. Diehl and W. Greiner, Nuci.PL.,s., A229, 29 YITP/K-993, Nov. 1992.
(1974). 14. D. H. E. Gross, talk Presented at the
3. J.A. Lopez and J. Randrup, Nucl.Phys., A503, International School on "Heavy Ion Collisions at
183 (1989). Intermediate and Relativistic Energies," Erice,
Sept (1992).
15. N. Carjan, Nucl. Phys. A452, 381 (1986).
Table I.
Total Kinetic Energy (TKE) in Multi-fragmentation
i
F_lds,m 2 3 4 6 8 8c,, L, ,,,, ' '
TKE/Eco 0.178 0.234 0.2869 0.3435 0.3528 0.3520
TKE/_2/A 1/3) O.126 O.165 0.202 0.242 0.249 0.248,, ,, ,, -
TKE'/Eco 0.178 0.225 0.2769 0.3337 0.3451 0.3441, ,, ,-
III - 81
Subthreshold Kaon Production in Nucleus-Nucleus Collisions
X. S. Fang, C. M. Ko, and Y. M. Zheng*
Experiments on kaon production from heavy-ion parameter sets. They correspond to a soft and a stiff
collisions are _ing _.._ied out at the nuclear equation-of-state with a compressibility of
Superconducting Syncl_tron Accelerator (SIS) in 200MoV and 380 MoV, respectively.
GSI. t The incident energy per nucleon at the The delta particle is also included and its
collision is around 1 GeV and is below the threshold propagation is treated similarly to the nucleon.
energy of 1.56 GeV for kaon production in the Collisions among nucleons and deltas are treated as
nucleon-nucleon collision in free space. One of the in the cascade model. Besides elastic scattering, both
motivations for this study is to learn about the nuclear nucleons and deltas can interact inelastically via NN
equation-of-state at high densities. As first pointed *, NA. The pion degree of freedom is also included
out in Ref. 2, the kaon yield from heavy-ion via A ** z'N, and it is, however, assumed to
collisions at subthreshold energies can differ by a propagate as a free particle in the nuclear medium.
factor of three depending on the stiffness of the To include kaons in the transport model, we first
nuclear equation-of-state at high densities. Similar note that because of the explicit chiral symmetry
effects have been obtained recently using the breaking, nucleons act on kaons as an effective
covariant BUU model3 and the covariant quantum scalar field. 6'7 This leads to an attractive s-wave
molecular dynamics. 4 interaction for the kaon. There is also a vector
In the transport model for heavy-ion collisions, interaction in the chiral Lagrangian, which leads to an
kaons are usually treated as free particles. We have, s-wave repulsive vector potential for a kaon in the
however, generalized the relativistic transport model 5 nuclear matter.8 As a result, the kaon effective mass
to include both the kaon mean-field potential and the is modified in the medium, i.e.,
collisions of kaons with other particles.
,2 2[ ]The relativistic transport model is based on the mg =m z 1-(_/mK-3/4)(ps/f2mtr) ,
transport equation for the phase space distribution
function_x, p*)of nucleons of an effective mass m* where Ps is the baryon density, the kaon decay
= m - go<o> and momentum p* - p - g,_<t0>, constant isfg .-- 93 MeV and the KN sigma term has
In the above, go and g,o are the coupling constants of value 300 MeV < EKN < 600 MeV.
a nucleon to the scalar (or)and vector (w) mesons, The propagation of kaons with the in-medium
respectively. The expectation values of the scalar nlass is then treated similarly as nucleons.
meson < o> and the vector meson <w> are related Representing the kaon by test particles, its motion is
in the mean-field approximation to the nuclear scalar again given by the classical equations of motion.
and current densities. The relativistic transport The kaon-nucleon collision is included by using
model is solved usin_ the method of pseudoparticles a kaon-nucleon total cross section 9 of about 10 mb
in which each nucleon is replaced by a collection of which we take to be density-independent. After the
test particles. The propagation of these test particles collision the kaon direction is isotropically distributed
is then described'_, _heclassicai equations of motion, as the kaon-nucleon interaction is mainly in the
The coupling constants are determined from the s-wave. Since kaon production is treated
nuclear matter property. Choosing the nucleon perturbatively, its effect on nucleon dynamics is
effective mass tn = 0.83m at the normal nuclear neglected. We therefore do not allow the nucleon
density and allowing the scalar meson self- momentum to change in a kaon-nucleon interaction.interactions, we have obtained in Ref. 5 two
III - 82
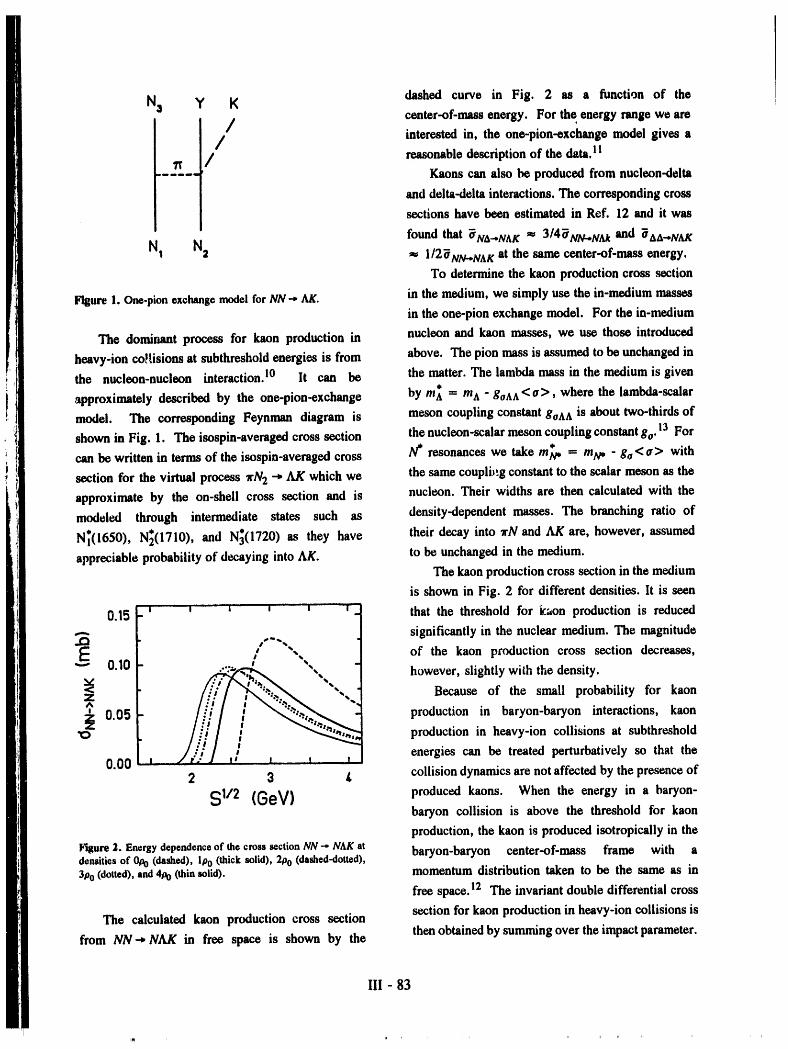
I
N3 Y K dashed curve in Fig. 2 as a function of the !
/ center-of-nutss energy. For the energy range we are
/ interested in, the one-pion-exchange model gives a
/ reasonable description of the data.It. m a..m.m ca, Kaons can also be produced from nucleon-delta
and delta-delta interactions. The corresponding cross
sections have been estimated in Ref. 12 and it was
found that _NA-,NAK _ 3/4¢_'_N/_ and _AA--_'Ag
N1 N2 _ I/2_NN.,NAK at the same center-of-mass energy.
To determine the kaon production cross section
Figure 1. One-pionexchangemodelfor NN .-, AK. in the medium, we simply use the in-medium massesin the one-pion exchange model. For the in-medium
The dominant process for kaon production in nucleon and kaon masses, we use those introduced
heavy-ion collisions at subthreshold energies is from above. The pion mass is assumed to be unchanged in
the nucleon-nucleon interaction. 10 It can be the matter. The lambda mass in the medium is given
approximately described by the one-pion-exchange by m,_ = m A - goAA< _>, where the lambda-scalar
model. The corresponding Feynman diagram is meson coupling constant goAAis about two-thirds of
shown in Fig. 1. The isospin-averaged cross section the nucleon-scalar meson coupling constant go"13 For
can be written in terms of the isospin-averaged cross N* resonances we take m*l¢, - tn_ - go<¢1> with
section for the virtual process lrN2 -4, AK which we the same couplb,.g constant to the scalar meson as the
approximate by the on-shell cross section and is nucleon. Their widths are then calculated with the
modeled through intermediate states such as density-dependent masses. The branching ratio of
N_(1650), N_(1710), and N_(1720) as they have their decay into xN and AK are, however, assumed
appreciable probability of decaying into AK. to be unchanged in the medium.The kaon production cross section in the medium
is shown in Fig. 2 for different densities. It is seen
0.15 _, "' , _ s s ''! that the threshold for kaon production is reduced
significantly in the nuclear medium. The magnitude
, ",. of the kaon production cross section decreases,0.10 ' "# %
",,,, however, slightly with the density.
v_ /:Y//_%.'.,._ "", Because of the small probability for kaon%%
"7 production in baryon-baryon interactions, kaon
"0 "" production in heavy-ion collisions at subthreshold
:; a energies can be treated perturbatively so that theo.oo ' J/"- J '" ,' ' '
2 3 /, collision dynamics are not affected by the presence of
_1/2 (GeV) produced kaons. When the energy in a baryon-baryon collision is above the threshold for kaon
production, the kaon is produced isotropically in the
I,igure2. Energydependenceof thecrosssectionNN -. NAKat baryon-baryon center-of-mass frame with adensitiesof 0p0 (dashed),ip0 (thicksolid),200(dashed-dotted),3P0 (dotted), and 40o (thin solid), momentum distribution taken to be the same as in
free space.12 The invariant double differential cross
section for kaon production in heavy-ion collisions isThe calculated kaon production cross section
then obtained by summing over the impact parameter.from NN _ NAK in free space is shown by the
Ill - 83
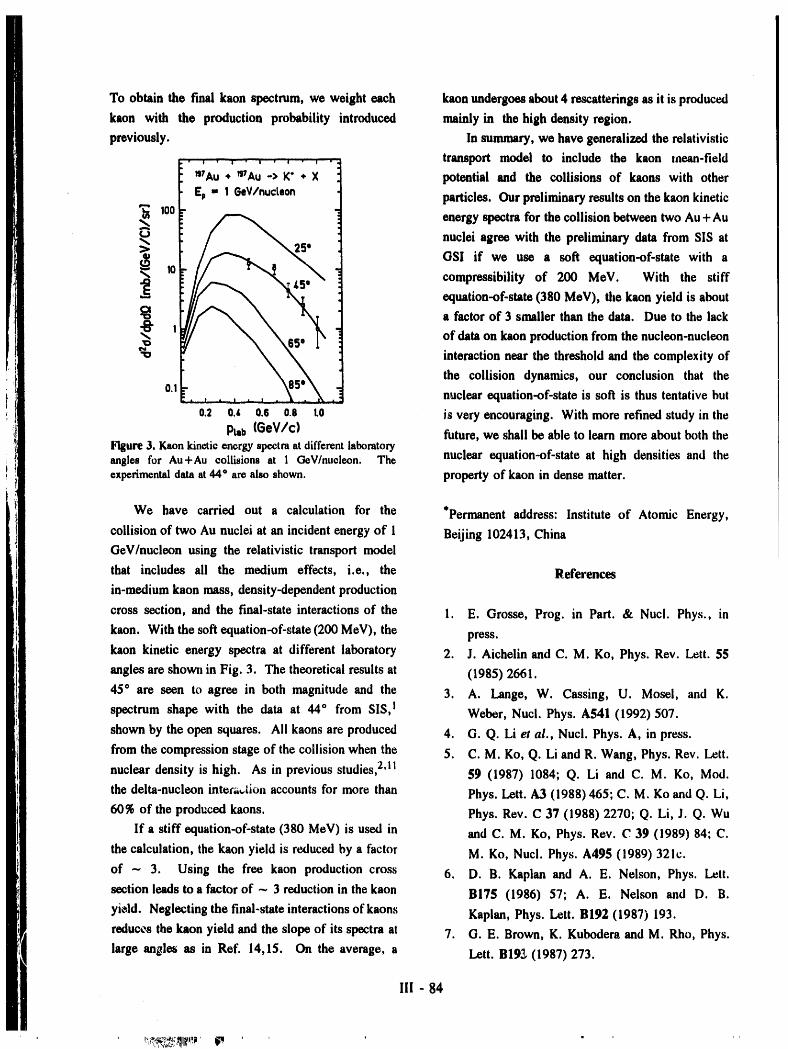
To obtain the final kaon spectrum, we weight each kaon undergoes about 4 rescatterings as it is produced
kaon with the production probability introduced mainly in the high density region.
previously. In summary, we have generalized the relativistic
transport model to include the kaon mean-fieldpotential and the collisions of kaons with other
I Ep = 1 6eV/nucteon , particles. Our preliminary results on the kaon kinetic
'_ energy spectra for the collision between two Au + Au
nuclei agree with the preliminary data from SIS at
GSI if we use a soft equation-of-state with a
lO compressibility of 200 MeV. With the stiff
equation-of-state (380 MeV), the kaon yield is abouta factor of 3 smaller than the data. Due to the lack
on production from the nucleon-nucleonof data kaon
"% _ interaction near the threshold and the complexity of
.\ the collision dynamics, our conclusion that theowL- _ •• !_. , , .... _ . X . nuclear equation-of-state is soft is thus tentative but
0.2 0.t 0.s 0.S 1.0 is very encouraging. With more refined study in the
Ptab (GeV/c) future, we shall be able to learn more about both theF'lgure3. Kaonkineticenergyspectraat differentlaboratoryangles for Au+Au collisions at I GeV/nueleon. The nuclear equation-of-state at high densities and theexperimentaldataat44° are also shown, property of kaon in dense matter.
We have carried out a calculation for the *Permanent address: Institute of Atomic Energy,
collision of two Au nuclei at an incident energy of I Beijing 102413, ChinaGeV/nucleon using the relativistic transport model
that includes all the medium effects, i.e., the References
in-medium kaon mass, density-dependent production
cross section, and the final-state interactions of the 1. E. Grosse, Prog. in Part. & Nucl. Phys., inkaon. With the soft equation-of-state (200 MeV), the press.
kaon kinetic energy spectra at different laboratory 2. J. Aichelin and C. M. Ko, Phys. Rev. Lett. 55
angles are shown in Fig. 3. The theoretical results at (1985) 2661.
45° are seen to agree in both magnitude and the 3. A. Lange, W. Cassing, U. Mosel, and K.spectrum shape with the data at 44 ° from SIS, 1 Weber, Nucl. Phys. A541 (1992)507.
shown by the open squares. All kaons are produced 4. G.Q. Li et al., Nucl. Phys. A, in press.
from the compression stage of the collision when the 5. C.M. Ko, Q. Li and R. Wang, Phys. Rev. Lett.nuclear density is high. As in previous studies, 2'11 59 (1987) 1084; Q. Li and C. M. Ko, Mod.
the delta-nucleon inte_'z,,,tion accounts for more than Phys. Lett. A3 (1988)465; C. M. Ko and Q. Li,
60% of the produced kaons. Phys. Rev. C 37 (1988) 2270; Q. Li, J. Q. Wu
If a stiff equation-of-state (380 MeV) is used in and C. M. Ko, Phys. Rev. C 39 (1989) 84; C.
the calculation, the kaon yield is reduced by a factor M. Ko, Nucl. Phys. A495 (1989) 321c.
of --- 3. Using the free kaon production cross 6. D. B. Kaplan and A. E. Nelson, Phys. Lett.
section leads to a factor of --. 3 reduction in the kaon B175 (1986) 57; A. E. Nelson and D. B.
yield. Neglecting the final-state interactions of kaons Kaplan, Phys. Lett. B192 (1987) 193.
reduces the kaon yield and the slope of its spectra at 7. G.E. Brown, K. Kubodera and M. Rho, Phys.
large an_les as in Ref. 14,15. On the average, a Lett. BIg_ (1987)273.
III - 84
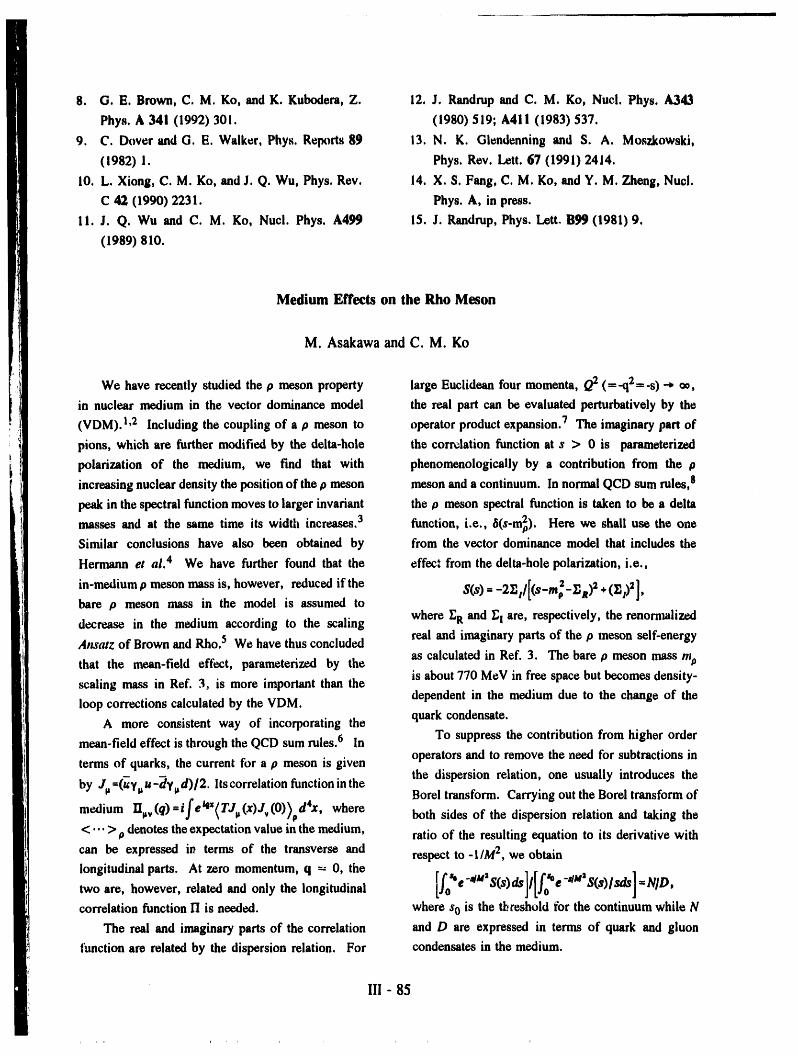
8. G.E. Brown, C. M. Ko, and K. Kubodera, Z. 12. J. Randrup and C. M. Ko, Nucl. Phys. A343
Phys. A 341 (1992) 301. (1980) 519; A411 (1983) 537.
9. C. Dover and G. E. Walker, Phys. Reports 89 13. N. K. Glendenning and S. A. Moszkowski,
(1982) 1. Phys. Rev. Lett. 67 (1991) 2414.
I0. L. Xiong, C. M. Ko, and J. Q. Wu, Phys. Rev. 14. X. S. Fang, C. M. Ko, and Y. M. Zheng, Nucl.
C 42 (1990) 2231. Phys. A, in press.
11. J. Q. Wu and C. M. Ko, Nucl. Phys. A499 15. J. Randrup, Phys. Lett. B99 (1981)9.
(1989) 810.
Medium Effects on the Rho Meson
M. Asakawa and C. M. Ko
We have recently studied the p meson property large Euclidean four momenta, Q2 (_.q2=.s) _ Qo,
in nuclear medium in the vector dominance model the real part can be evaluated perturbatively by the
(VDM). 1,2 Including the coupling of a 0 meson to operator product expansion. 7 The imaginary part of
pions, which are further modified by the delta-hole the correlation function at s > 0 is parameterized
polarization of the medium, we find that with phenomenologically by a contribution from the 0
increasing nuclear density the position of the p meson meson and a continuum. In normal QCD sum rules, 8
peak in the spectral function moves to larger invariant the p meson spectral function is taken to be a delta
masses and at the same time its width increases. 3 function, i.e., 6(s-m2). Here we shall use the oneSimilar conclusions have also been obtained by from the vector dominance model that includes the
Hermann et al. 4 We have further found that the effec: from the delta-hole polarization, i.e.,
in-medium p meson mass is, however, reduced if the 5(s) = -2_ t/[(s-m 2o-_,e)2 +(_ i)2],bare p meson mass in the model is assumed to
where ER and _1 are, respectively, the renornmlizeddecrease in the medium according to the scalingreal and imaginary parts of the p meson self-energy
Ansatz of Brown and Rho.5 We have thus concludedas calculated in Ref. 3. The bare p meson mass mpthat the mean-field effect, parameterized by theis about 770 MeV in free space but becomes density-
scaling mass in Ref. 3, is more important than the
loop corrections calculated by the VDM. dependent in the medium due to the change of the
A more consistent way of incorporating the quark condensate.To suppress the contribution from higher order
mean-field effect is through the QCD sum rules. 6 In
terms of quarks, the current for a p meson is given operators and to remove the need for subtractions inthe dispersion relation, one usually introduces the
by Jp =(uYt,u-dy_d)/2' Itscorrelation function in theBorel transform. Carrying out the Betel transform of
iipv(q)ffiije_x_ljl,(x)j_,(O))pd4x,r,...,., where both sides of the dispersion relation and taking themedium
<... > p denotes the expectation value in the medium, ratio of the resulting equation to its derivative with
can be expressed in terms of the transverse and respect to-I/M 2, we obtainlongitudinal parts. At zero momentum, q --- 0, the
,we..oowo orandoo,,he,on, Od o.,correlation function II is needed, where s o is the tl_reshold for the continuum while N
The real and imaginary parts of the correlation and D are expressed in terms of quark and gluon
function are related by the dispersion relation. For condensates in the medium.
III - 85
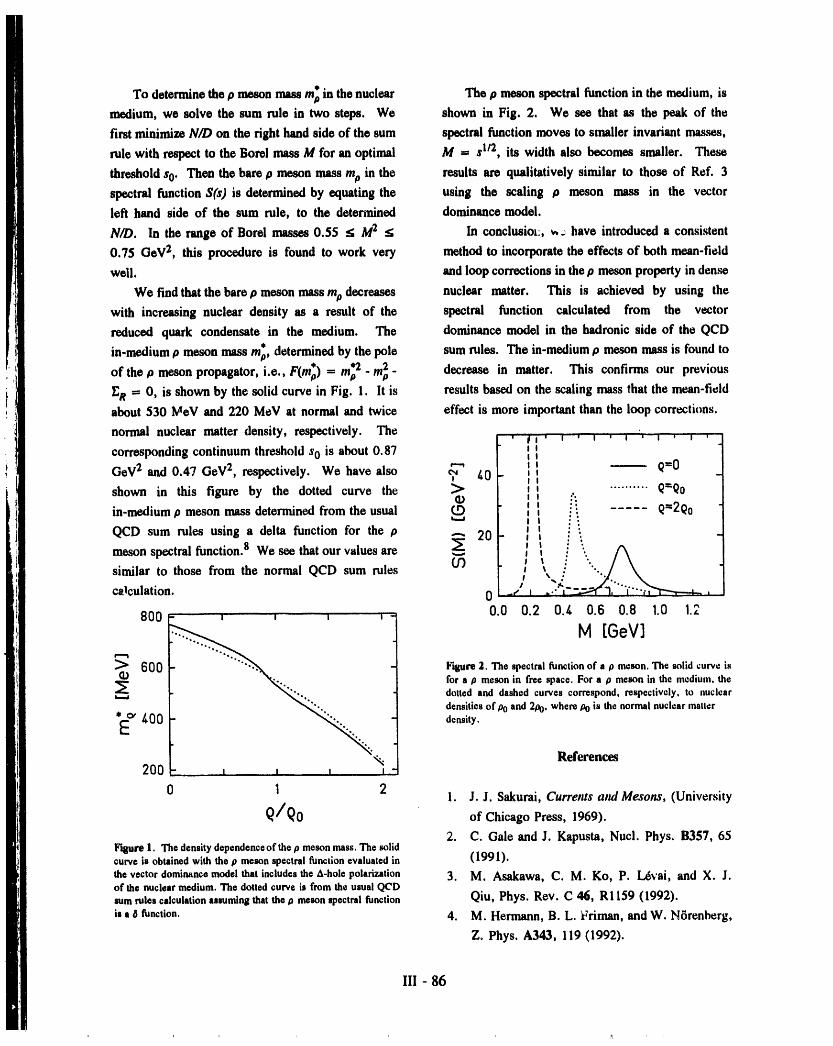
To determine the p meson mass m_ in the nuclear The p meson spectral function in the medium, is
medium, we solve the sum rule in two steps. We shown in Fig. 2. We see that as the peak of the
first minimize N/D on the right hand side of the sum spectral function moves to smaller invariant masses.
rule with respect to the Betel mass M for an optimal M = s I/2, its width also becomes smaller. These
threshold s0. Then the bare p meson mass mp in the results are qualitatively similar to those of Ref. 3
spectral function $(s) is determined by equating the using the scaling p meson mass in the vector
left hand side of the sum rule, to the determined dominance model.
N/D. In the range of Borel masses 0.55 _ M 2 < In conclusiot:, _, = have introduced a consistent
0.75 GeV 2, this procedure is found to work very method to incorporate the effects of both mean-field
well. and loop corrections in the p meson property in dense
We find thatthebarep meson mass mp decreases nuclear matter. This is achieved by using the
with increasing nuclear density as a result of the spectral function calculated from the vector
reduced quark condensate in the medium. The dominance model in the hadronic side of the QCD
in-medium p meson mass m;, determined by the pole sum rules. The in-medium p meson mass is found to
of the p meson propagator, i.e., F(m*o) = m_- m2- decrease in matter. This confirms our previous
]_R = 0, is shown by the solid curve in Fig. 1. It is results based on the scaling mass that the mean-fieldabout 530 MeV and 220 MeV at normal and twice effect is more important than the loop corrections.
normal nuclear matter density, respectively. The ,' I,. , , _ , _, , , , ,corresponding continuum threshold so is about 0.87
f.,...q
GeV2 and 0.47 GeV 2, respectively. We have also _ 40 ------- Q=0shown in this figure by the dotted curve the _" .......... Q=Q0(D :"in-medium p meson mass determined from the usual (.D :: Q=2Q0
QCD sum rules using a delta function for the p "-" 20 . :.
meson spectral function. 8 We see that our values are _" ! " /'_% _ '.
similar to those from the normal QCD sum rules (33 i _ :. "-.../
_lculation. 0 --r' i ..'"," ,
800- , , , '' 0.0 0.2 0.4 0.6 0.8 1.0 1.2
M [GEM]
_' 600 Irlgure 2. The spectral function of a p meson. The solid curve i,_D for a p meson in free space. For a p meson in the medium, the
dotted and dashed curves correspond, respectively, to nucleart-_.J
densities of 00 and 2/)0, where 0o i, the normal nuclear matter
*_'/t 0 0 density.
-_. References200 t m I , , ,
0 1 21. J.J. Sakurai, Currents and Mesons, (University
Q/Qo of Chicago Press, 1969).
2. C. Gale and J. Kapusta, Nucl. Phys. B357, 65Hllure 1. The density dependence of the p meson mass. The solidcurve is obtained with the p meson spectral function evaluated in (1991).
the vector dominancemodelthat includestheA-holepolarization 3. M. Asakawa, C. M. Ko, P. l_vai, and X. J.of the nuclear medium. The dotted curve is from the usual QCD
mm rules calculation assuming that the p meson _ectral function Qiu, Phys. Rev. C 46, R1159 (1992).isa6 function. 4. M. Hermann, B. L. Friman, and W. H6renberg,
Z. Phys. A343, 119 (1992).
III - 86
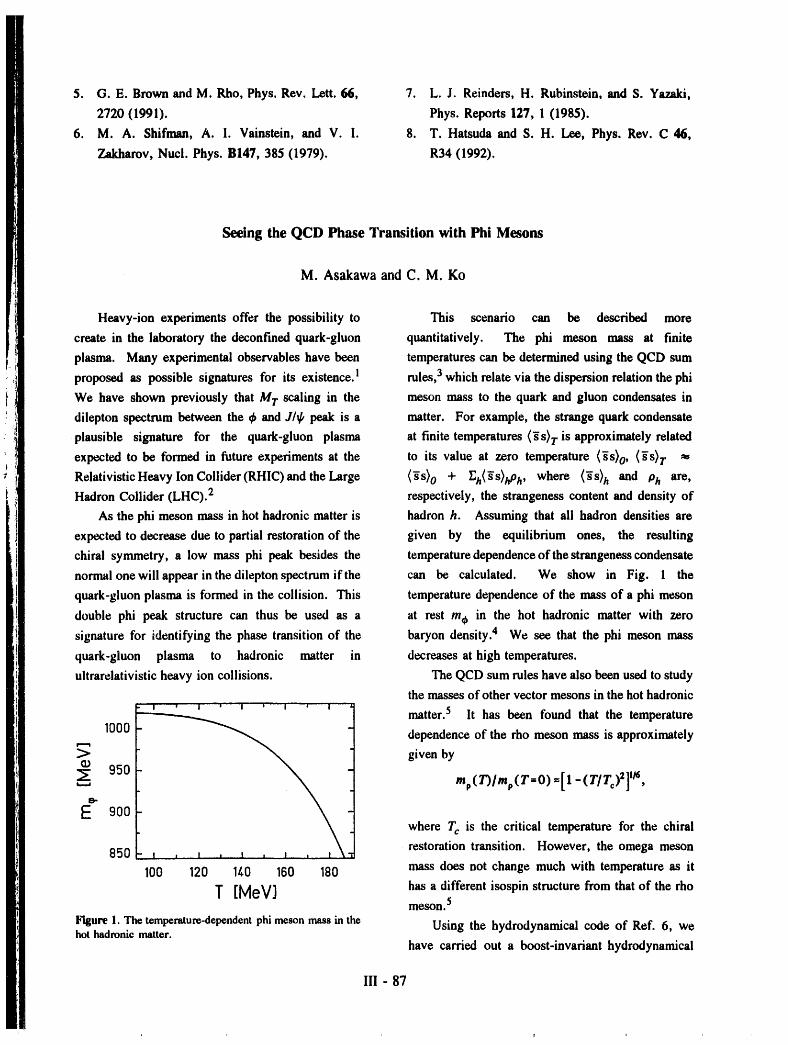
5. G.E. Brown and M. Rho, Phys. Rev. Lett. 66, 7. L.J. Reinders, H. Rubinstein, and S. Yazaki,
2720 (1991). Phys. Reports 127, 1 (1985).
6. M. A. Shifman, A. I. Vainstein, and V.I. 8. T. Hatsuda and S. H. Lee, Phys. Rev. C 46,
Zakharov, Nucl. Phys. B147, 385 (1979). R34 (1992).
Seeing the QCD Phase Transition with Phi Mesons
M. Asakawa and C. M. Ko
Heavy-ion experiments offer the possibility to This scenario can be described more
create in the laboratory the de,confined quark-gluon quantitatively. The phi meson mass at finite
plasma. Many experimental observables have been temperatures can be determined using the QCD sum
proposed as possible signatures for its existence.l rules, 3 which relate via the dispersion relation the phi
We have shown previously that M T scaling in the meson mass to the quark and gluon condensates in
dilepton spectrum between the _ and J/_ peak is a matter. For example, the strange quark condensate
plausible signature for the quark-gluon plasma at finite temperatures (gs)T is approximately related
expected to be formed in future experiments at the to its value at zero temperature (gS)o, (gS)T
Relativistic Heavy Ion Collider (RHIC) and the Large ('_S)o + I_h(gS)hPh, where (gS)h and Ph are,
Hadron Collider (LHC). 2 respectively, the strangeness content and density of
As the phi meson mass in hot hadronic matter is hadron h. Assuming that all hadron densities are
expected to decrease due to partial restoration of the given by the equilibrium ones, the resulting
chiral symmetry, a low mass phi peak besides the temperature dependence of the strangeness condensate
normal one will appear in the dilepton spectrum if the can be calculated. We show in Fig. 1 the
quark-gluon plasma is formed in the collision. This temperature dependence of the mass of a phi meson
double phi peak structure can thus be used as a at rest me in the hot hadronic matter with zero
signature for identifying the phase transition of the baryon density. 4 We see that the phi meson mass
quark-gluon plasma to hadronic matter in decreases at high temperatures.
ultrarelativistic heavy ion collisions. The QCD sum rules have also been used to study
the masses of other vector mesons in the hot hadronic
.... matter.5 It has been found that the temperature
1000 " dependence of the rho meson mass is approximately
>" given by03
._- 950,..., mp( T)/mp (T=O) =[ l -( T/T,)2] '/_,
8-
E 9oowhere Tc is the critical temperature for the chiral
850 restorationtransition. However, the omega meson
100 120 1/,0 160 180 massdoesnot change much with temperatureas ithasa different isospinstructurefrom that of the rhoT [MeV]meson. 5
F'ggure1. The temperature-dependentphi meson massin th© Using the hydrodynamical code of Ref. 6, wehot hadronicmatter.have carried out a boost-invariant hydrodynamical
III - 87
the low n_ss peak and increases with the initial References
temperature as a result of the appreciable transverse
flow at freezeout. I. B. Mfiller, Nucl. Phys. A544, 95c (1992), and
In conclusion, we have shown that the recent references therein.
predictions from the QCD sum rules on the change of 2. M. Asakawa, C. M. Ko, and P. l._vai, Phys.
vector meson masses in hot hadronic matter have Rev. Lett. 70, 398 (1993).
dramatic effects on the dilepton invariant mass 3. M. A. Shifman, A. I. Vainshtein, and V. I.
spectrum from ultrarelativistic heavy ion collisions. Zakharov, Nuci. Phys. B147, 385 (1979).
Due to the dropping phi meson nmss in hot matter, a 4. M. Asakawa and C. M. Ko, submitted to Nucl.
low mass peak besides the normal one appears in the Phys. A.
dilepton spectrum if the quark-gluon plasma is 5. T. Hatsuda, Y. Koike, and S. H. Lee, Nucl.
formed in the collision. This low mass phi meson Phys. B, in press.
peak is thus a viable signal for the phase transition 6. P. L_vai and B. MfiUer, Phys. Rev. Lett. 67,
from the quark-gluon plasma to the hadronic matter. 1519 (1991).
Furthermore, it also allows us to determine the 7. PHENIX Collaboration, Preliminary Conceptual
transition temperature between these two phases of Design Report, June 1992.
matter.
Ill - 89
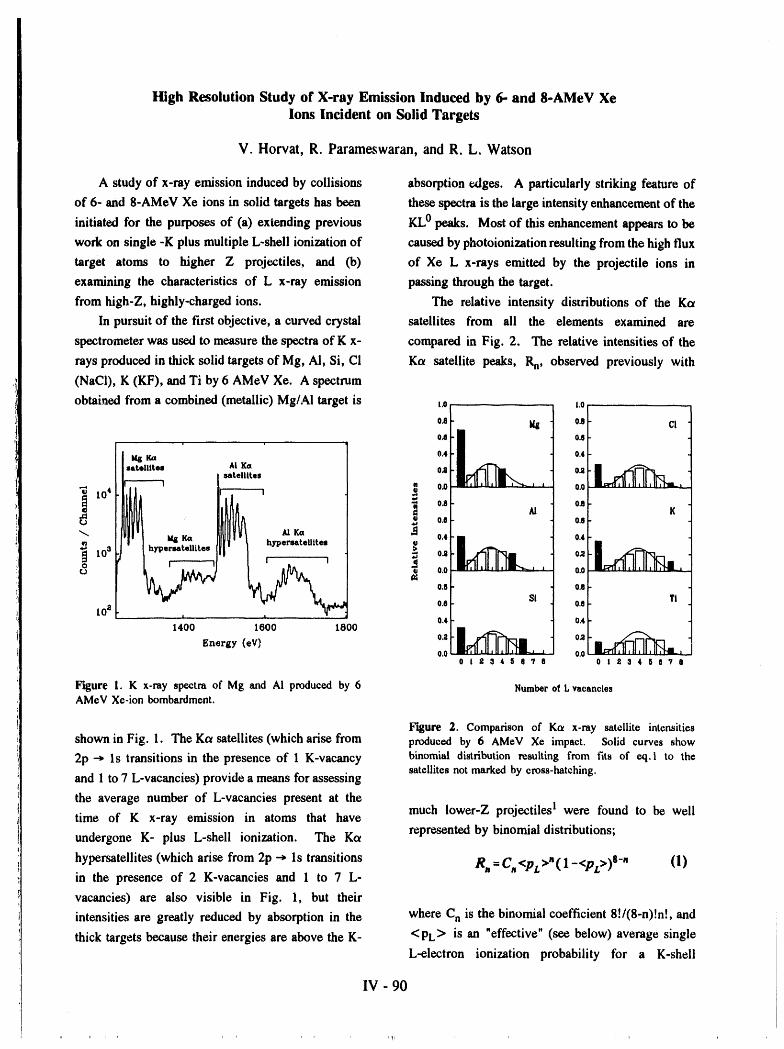
High Resolution Study of X-ray Emission Induced by 6- and 8-AMeV Xe
Ions Incident on Solid Targets
V. Horvat, R. Parameswaran, and R. L. Watson
A study of x-ray emission induced by collisions absorption edges. A particularly striking feature of
of 6- and 8-AMeV Xe ions in solid targets has been these spectra is the large intensity enhancement of the
initiated for the purposes of (a) extending previous KL0 peaks. Most of this enhancement appears to be
work on single -K plus multiple L-shell ionization of caused by photoionization resulting from the high flux
target atoms to higher Z projectiles, and (b) of Xe L x-rays emitted by the projectile ions in
examining the characteristics of L x-ray emission passing through the target.
from high-Z, highly-charged ions. The relative intensity distributions of the Kct
In pursuit of the first objective, a curved crystal satellites from all the elements examined are
spectrometer was used to measure the spectra of K x- compared in Fig. 2. The relative intensities of the
rays produced in thick solid targets of Mg, AI, Si, CI Ka satellite peaks, Rn, observed previously with
(NaCI), K (KF), and Ti by 6 AMeV Xe. A spectrum
obtained from a combined (metallic) Mg/AI target is t.01 l.oi0.e - M4I o.15[- CI
tq Ka 0.4 0.4at,llitem AI Ke. O_
i i
iliI ! satellite8 m _ ,
tO4 -_ o.a0.6
_" tq Ka AI Ka '_ 0.4
10 3 o_ o_. i hrpersatellttes hypersatellttea
o I '" i
0t2stseve 012steeve
Figure I. K x-my spectraof Mg and AI produced by 6 Number ofL vacanciesAMcV Xe-ion bombardment.
Figure 2. Comparison of Ka x-my satelliteintensities
shown inFig.I.The Kc_satellites(whicharisefrom producedby 6 AMeV Xe impact.Solidcurvesshow
2p _ ls transitions in the presence of 1 K-vacancy binomial distribution resulting from fits of eq.l to thesatellites not marked by cross-hatching.
and 1 to 7 L-vacancies) provide a means for assessing
the average number of L-vacancies present at themuch Iower-Z projectiles I were found to be well
time of K x-ray emission in atoms that have
undergone K- plus L-shell ionization. The Ka represented by binomial distributions;
hypersatellites (which arise from 2p -* Is transitions Rn =Cn <PL >n( l_<pz>)81 (I)in the presence of 2 K-vacancies and 1 to 7 L-
vacancies) are also visible in Fig. 1, but their
intensities are greatly reduced by absorption in the where Ca is the binomial coefficient 8!/(8-n)!n!, and
thick targets because their energies are above the K- < pL> is an "effective" (see below) average single
L-electron ionization probability for a K-shell
IV - 90
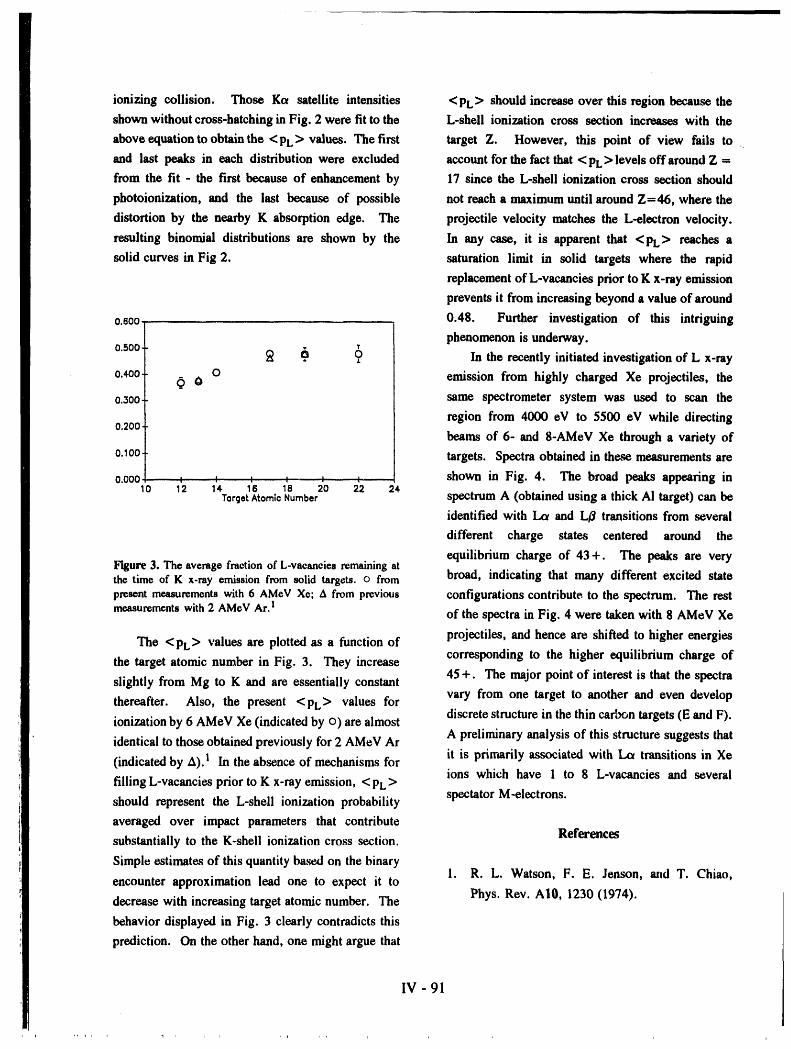
ionizing collision. Those Kc_ satellite intensities <pL > should increase over this region because the
shown without cross-hatching in Fig. 2 were fit to the L-shell ionization cross section increases with the
above equation to obtain the < PL> values. The first target Z. However, this point of view fails to
and last peaks in each distribution were excluded account for the fact that < Pl. > levels off around Z =
from the fit - the first because of enhancement by 17 since the L-shell ionization cross section should
photoionization, and the last because of possible not reach a maximum until around Z=46, where the
distortion by the nearby K absorption edge. The projectile velocity matches the L-electron velocity.
resulting binomial distributions are shown by the In any case, it is apparent that <pL > reaches a
solid curves in Fig 2. saturation limit in solid targets where the rapid
replacement of L-vacancies prior to K x-ray emission
prevents it from increasing beyond a value of around
o.600 0.48. Further investigation of this intriguing
phenomenon is underway.
0.500 _ _ _) In the recently initiated investigation of L x-ray
0.4o0 _ O o emission from highly charged Xe projectiles, the0._00 same spectrometer system was used to scan the
region from 4000 eV to 5500 eV while directing0.200
beams of 6- and 8-AMeV Xe through a variety of
o._oo, targets. Spectra obtained in these measurements are
0.00o i i i i 0 _ shown in Fig. 4. The broad peaks appearing in10 12 16 16 18 20 22 24
TorgetAtomic Number spectrum A (obtainedusinga thick Ai target) can be
identified with Lo and L/_ transitions from several
different charge states centered around the
equilibrium charge of 43 +. The peaks are veryFigure3. Theaveragefraction of L-vacancies remaining at
the time of K x-ray emission from solid targets, o from broad, indicating that many different excited state
present measurements with 6 AMeV Xe; A from previous configurations contribute, to the spectrum. The restmeasurementswith 2 AMeV Ar.I
of the spectra in Fig. 4 were taken with 8 AMeV Xe
The <pL > values are plotted as a function of projectiles, and hence are shifted to higher energies
the target atomic number in Fig. 3. They increase corresponding to the higher equilibrium charge of45 +. The major point of interest is that the spectraslightly from Mg to K and are essentially constant
thereafter. Also, the present <pL > values for vary from one target to another and even developdiscrete structure in the thin carbon targets (E and F).
ionization by 6 AMeV Xe (indicated by o) are almostA preliminary analysis of this structure suggests thatidentical to those obtained previously for 2 AMeV Arit is primarily associated with La transitions in Xe
(indicated by A).1 In the absence of mechanisms forions which have 1 to 8 L-vacancies and several
filling L-vacancies prior to K x-ray emission, < PL>
should represent the L-shell ionization probability spectator M-electrons.
averaged over impact parameters that contribute
substantially to the K-shell ionization cross section. References
Simple estimates of this quantity based on the binary1. R. L. Watson, F. E. Jenson, and T. Chiao,
encounter approximation lead one to expect it to
decrease with increasing target atomic number. The Phys. Rev. AI0, 1230 (1974).
behavior displayed in Fig. 3 clearly contradicts this
prediction. On the other hand, one might argue that
IV - 91
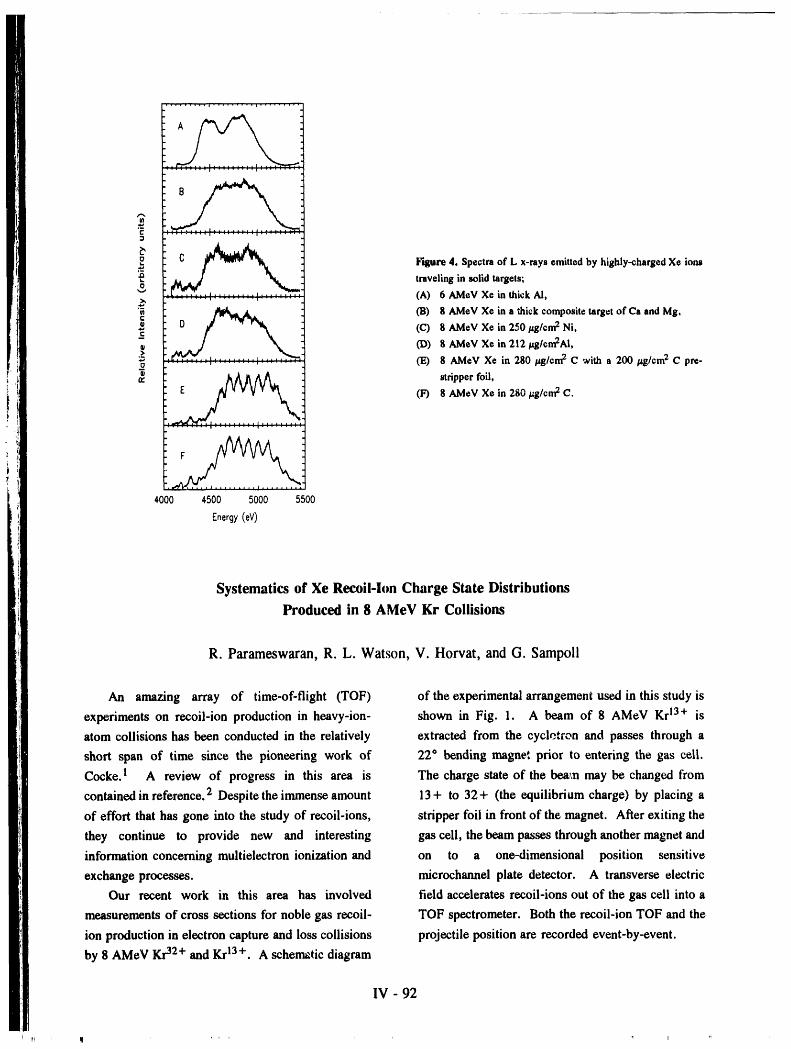
":'. ....... i ......... i ,-.;,,._;
°.C
C Figure4. Spectraof L x-raysemittedby highly-chargedXe ionstravelinginsolidtargets;(A) 6 AMeVXe in thickAI,
cm !_ (B) 8 AirierXe in a thickcompositetargetof Ca andMg,
(C) 8 AlVleVXe in 250/:g/cm2 Ni,m
>_ (D) 8 AMeVXe in 212_tg/cm2Al,, ......... •........ , ......... (E) 8 AlVteVXe in 280 ttg/cm2 C witha 200 ttg/cm2 C pre-
"_ _!_.t stripperfoil,
tr
E (F) 8 AMeVXe in 280/zg/cm2 C.
......... i ..................
4000 4500 5000 5500
Energy(eV)
Systematics of Xe Recoil-Ion Charge State Distributions
Produced in 8 AMeV Kr Collisions
R. Parameswaran, R. L. Watson, V. Horvat, and G. Sampoll
An amazing array of time-of-flight (TOF) of the experimental arrangement used in this study is
experiments on recoil-ion production in heavy-ion- shown in Fig. 1. A beam of 8 AMeV Kr13+ is
atom collisions has been conducted in the relatively extracted from the cycletron and passes through a
short span of time since the pioneering work of 22 ° bending magne', prior to entering the gas cell.
Cocke. 1 A review of progress in this area is The charge state of the beam may be changed from
contained in reference. 2 Despite the immense amount 13+ to 32+ (the equilibrium charge) by placing a
of effort that has gone into the study of recoil-ions, stripper foil in front of the magnet. After exiting the
they continue to provide new and interesting gas cell, the beam passes through another magnet and
information concerning multielectron ionization and on to a one-dimensional position sensitive
exchange processes, microchannel plate detector. A transverse electric
Our recent work in this area has involved field accelerates recoil-ions out of the gas cell into a
measurements of cross sections for noble gas recoil- TOF spectrometer. Both the recoil-ion TOF and the
ion production in electron capture and loss collisions projectile position are recorded event-by-event.
by 8 AMeV Kr32+ and Kr13+. A scherrmticdiagram
IV - 92
i MI' m
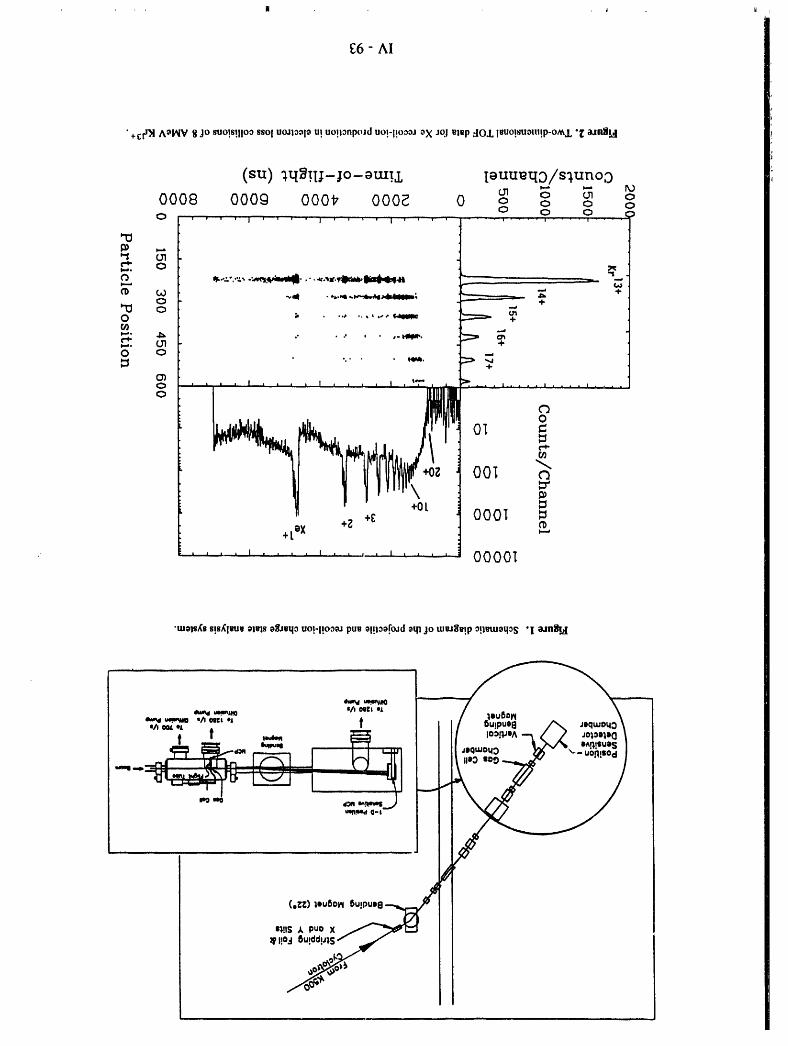
£6- AI
•+cr_l AoI_/8 jo suo!s!llOOSSOluoJIoOlOu! uoponpoJd uo!-l!OOOaoX Joj algp _O1 IRUOlSUom!P-O_l "_ _nllL,!
(su) :_qNTU-;o-0tuT2 IouumtID/slunoD0 (31 0
0008 o00g O00f 000_ 0 o o o o0 0 0 f
0 ' ' ' ' I ' ' ' ' I J ' ' ' ! " '"' • ' : _ _ " " ' " " "' ""'_ .... ' ...... '
"I:1,..,
--, .(1) e'_('O -,.,m •-,..,,J.._,-,,w__; 4-
0 ;' "" ...... " _ +
"" _@ O
0 , , , , I , .... I .... I i _'l" ' • P- • , , , .... , • ,, , , I .....
o i o°OOI
+OL
+z +c 0001 Cb+LeX ,..-,
• ..... ' .... ' .......' .... O0001
•tuols,{ss!s_lrdu Oi_lBo_qo uo!-I!OOO_pua o!!loo.fo_doqlJOm_u3_!p o!l_tUOtlOS "I_n_4[
.... ._*'_0
_,,,,o x__uo_!s
(,_) leuSolN l_ulPueo /
re!IS A puo X"_
q_1!o3 6u!dd!_lSf
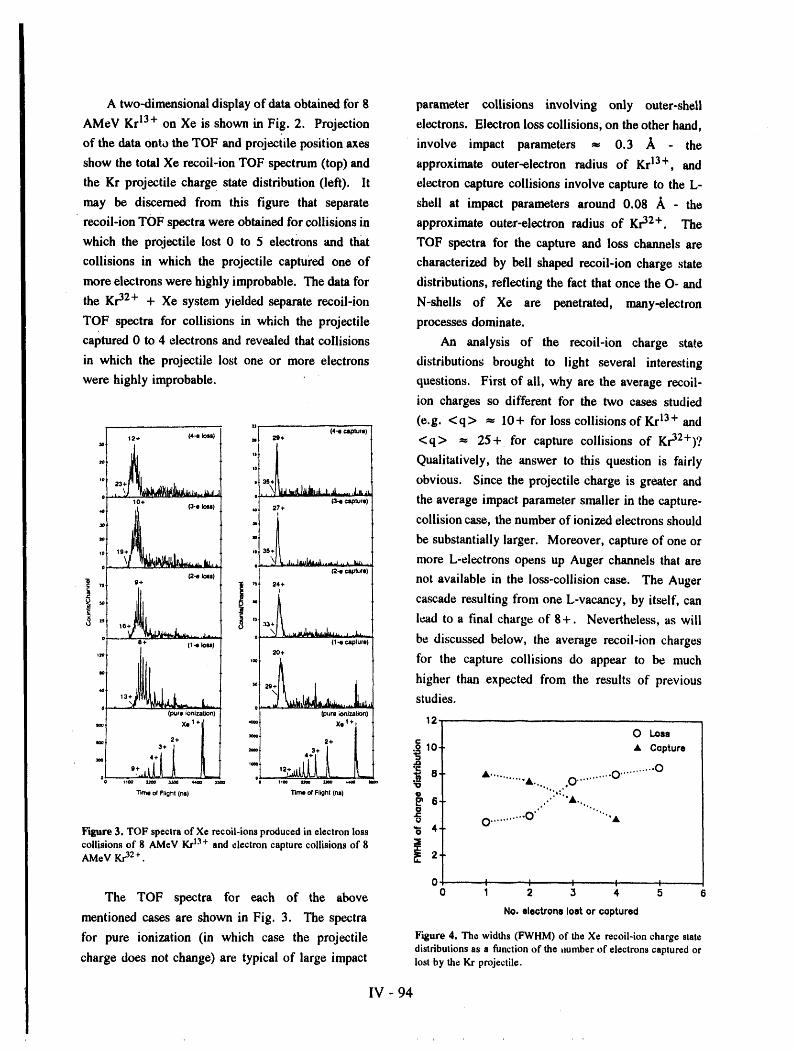
A two-dimensional display of data obtained for 8 parameter collisions involving only outer-shell
AMeV Kr 13+ on Xe is shown in Fig. 2. Projection electrons. Electron loss collisions, on the other hand,
of the data onto the TOF and projectile position axes involve impact parameters = 0.3 A - the
show the total Xe recoil-ion TOF spectrum (top) and approximate outer-electron radius of Kr13+, and
the Kr projectile charge state distribution (left). It electron capture collisions involve capture to the L-
may be discerned from this figure that separate shell at impact parameters around 0.08 A - the
recoil-ion TOF spectra were obtained for collisions in approximate outer-electron radius of Kr32+. The
which the projectile lost 0 to 5 electrons and that TOF spectra for the capture and loss channels are
collisions in which the projectile captured one of characterized by bell shaped recoil-ion charge state
more electrons were highly improbable. The data for distributions, reflecting the fact that once the O- and
the Kr32+ + Xe system yielded separate recoil-ion N-shells of Xe are penetrated, many-electron
TOF spectra for collisions in which the projectile processes dominate.
captured 0 to 4 electrons and revealed that collisions An analysis of the recoil-ion charge state
in which the projectile lost one or more electrons distributions brought to light several interesting
were highly improbable, questions. First of all, why are the average recoil-
ion charges so different for the two cases studied
(e.g. <q> = 10+ for loss collisions of Kr 13+ and(4-o r.apture)
=1 ,2. ('"_" l -"[ "" < q > _ 25 + for capture collisions of Kr32+)?
"] LX_Ja,, Jl _ Qualitatively, the answer to this question is fairly'0 23 J,,._ obvious. Since the projectile charge is greater and' ,o+ _,,) the average impact parameter smaller in the capture-
Jo_ 27+
_ collision case, the number of ionized electrons should
be substantially larger. Moreover, capture of one or_O 35+
more L-electrons opens up Auger channels that are
I ,. (_") _*_') not available in the loss-collision case. The Auger
= cascade resulting from one L-vacancy, by itself, can
.... _+ lead to a final charge of 8+. Nevertheless, as will: . _ b iubowthvr oroonc, =, 2o. for the capture collisions do appear to be much/
,, _,, higher than expected from the results of previous" studies.
_ 10. • Capturei¢00
• ........ • O .......O....."'- .... , ''""t:
ir_,ure 3. TOF spectra of Xe recoil-ions produced in electron loss "6 4_ O ........... O .... "4
collisions of 8 AMeV Kr13+ and electron capture collisions of 8 .5AMeV Kr32+. _ 2-
0 t, : i I i -The TOF spectra for each of the above o 1 2 3 4 5 s
mentioned casesare shown in Fig. 3. The spectra No.electronslostorcaptured
for pure ionization (in which case the projectile Figure 4. The widths (FWHM) of the Xe recoil-ion charge statedistributionsas a function of the _mmberof electronscaptured or
charge doesnot change)are typical of large impact lost by the Kr projectile.
IV - 94
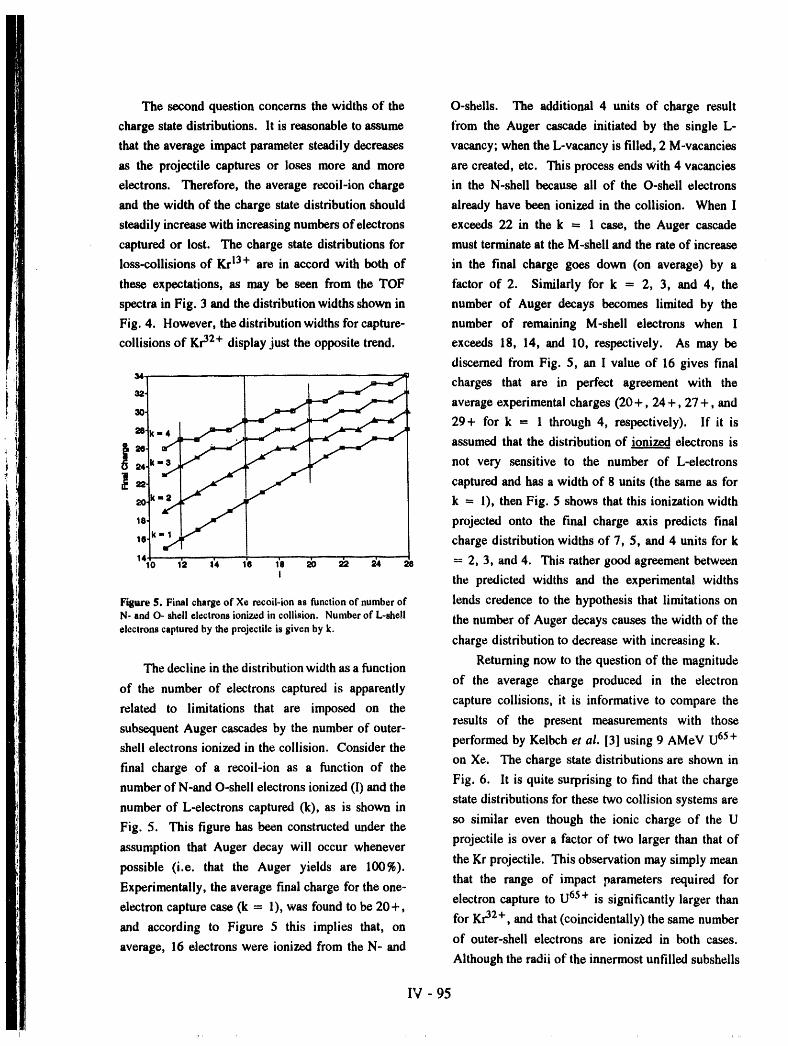
The second question concerns the widths of the O-shells. The additional 4 units of charge result
charge state distributions. It is reasonable to assume from the Auger cascade initiated by the single L-
that the average impact parameter steadily decreases vacancy; when the L-vacancy is filled, 2 M-vacancies
as the projectile captures or loses more and more are created, etc. This process ends with 4 vacancies
electrons. Therefore, the average recoil-ion charge in the N-shell because all of the O-shell electrons
and the width of the charge state distribution should already have been ionized in the collision. When I
steadily increase with increasing numbers of electrons exceeds 22 in the k = 1 case, the Auger cascade
captured or lost. The charge state distributions for must terminate at the M-shell and the rate of increase
loss-collisions of KI"i3. are in accord with both of in the final charge goes down (on average) by a
these expectations, as may be seen from the TOF factor of 2. Similarly for k = 2, 3, and 4, the
spectra in Fig. 3 and the distribution widths shown in number of Auger decays becomes limited by the
Fig. 4. However, the distributionwidths for capture- number of remaining M-shell electrons when I
collisions of Kr32+ display just the opposite trend, exceeds 18, 14, and 10, respectively. As may be
discerned from Fig. 5, an I value of 16 gives final
:,] ___:! _ charges that are in perfect agreement with the
average experimental charges (20 +, 24 +, 27 +, and
ao 29+ for k = I through 4, respectively). If it is
k assumed that the distribution of ionized electrons is
_:i_=_ _ j not very sensitive to the number of L-electronscaptured and has a width of 8 units (the same as for
a0 k=_,._ _ k = 1), then Fig. 5 shows that this ionization width-- I
,e =, I..,_ I projected onto the final charge axis predicts final
le k .y [ charge distribution widths of 7, 5, and 4 units for k'141o 'ia f4 fe 1'a _o _ _ ;_ = 2, 3, and 4. This rather good agreement between
I the predicted widths and the experimental widths
Figure 5. Final charge of Xe recoil-ion as function of number of lends credence to the hypothesis that limitations on
N- and O- shell electrons ionized in collision. Number of L-shell the number of Auger decays causes the width of theelectrons captured by the projectile is given by k.
charge distribution to decrease with increasing k.
The decline in the distribution width as a function Returning now to the question of the magnitudeof the average charge produced in the electron
of the number of electrons captured is apparently
related to limitations that are imposed on the capture collisions, it is informative to compare theresults of the present measurements with those
subsequent Auger cascades by the number of outer-shell electrons ionized in the collision. Consider the performed by Kelbch et al. [3] using 9 AMeV U65+
on Xe. The charge state distributions are shown infinal charge of a recoil-ion as a function of the
number of N-and O-shell electrons ionized (I) and the Fig. 6. It is quite surprising to find that the chargestate distributions for these two collision systems are
number of L-electrons captured (k), as is shown inso similar even though the ionic charge of the U
Fig. 5. This figure has been constructed under the
assumption that Auger decay will occur whenever projectile is over a factor of two larger than that ofthe Kr projectile. This observation may simply meanpossible (i.e. that the Auger yields are 100%).that the range of impact parameters required for
Experimentally, the average final charge for the one-electron capture to U65+ is significantly larger than
electron capture case (k - 1), was found to be 20+,for Kr32+, and that (coincidentally) the same number
and according to Figure 5 this implies that, onof outer-shell electrons are ionized in both cases.
average, 16 electrons were ionized from the N- andAlthough the radii of the innermost unfilled subsheils
IV -95
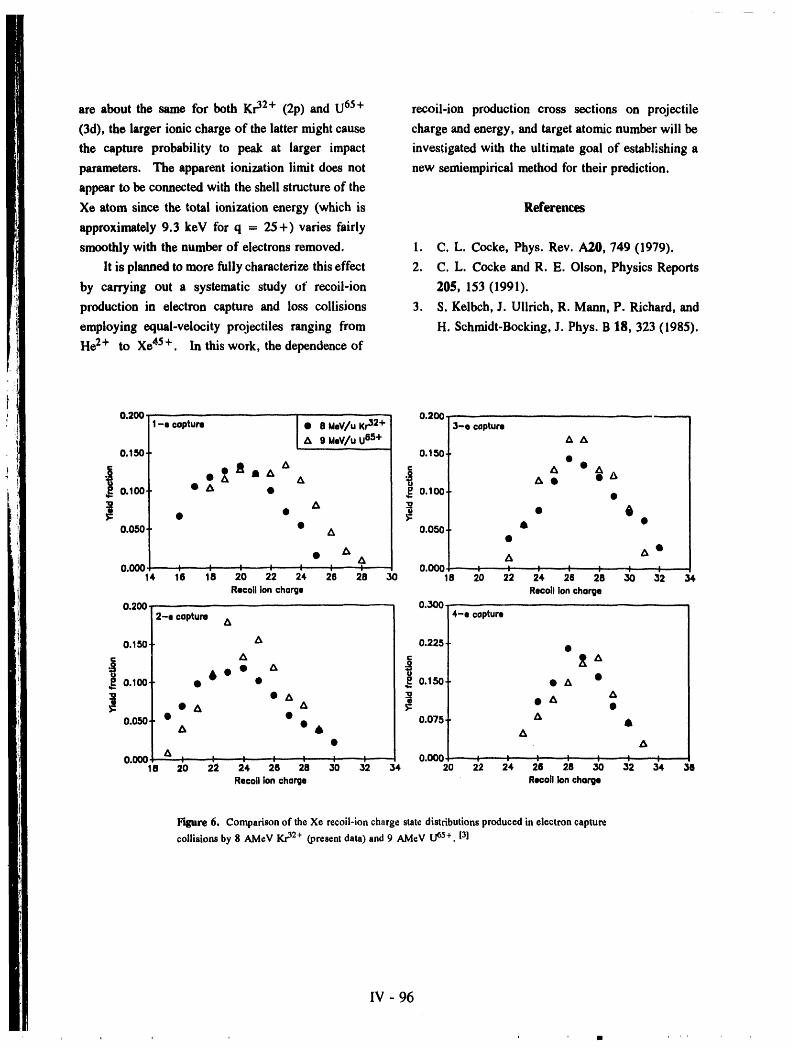
are about the same for both Kr32+ (2p) and U65+ recoil-ion production cross sections on projectile
(3d), the larger ionic charge of the latter might cause charge and energy, and target atomic number will be
the capture probability to peak at larger impact investigated with the ultimate goal of establishing a
parameters. The apparent ionization limit does not new semiempirical method for their prediction.
appear to be connected with the shell structure of the
Xe atom since the total ionization energy (which is References
approximately 9.3 keV for q - 25+) varies fairly
smoothly with the number of electrons removed. 1. C.L. Cocke, Phys. Roy. A20, 749 (1979).
It is planned to more fully characterize this effect 2. C.L. Cocke and R. E. •is•n, Physics Reports
by carrying out a systematic study of recoil-ion 205, 153 (1991).
production in electron capture and loss collisions 3. S. Kelbch, J. Uilrich, R. Mann, P. Richard, and
employing equal-velocity projectiles ranging from H. Schmidt-Bocking, J. Phys. B 18, 323 (1985).
He2+ to Xe45+. In this work, the dependence of
0.200. 0.200.1-e capture • 8 geV/u Kr32+ 3-o capture
II 9 geV/u UsS+ /1 A
0.150. 0.150. •
/1 /10 •/1
0.100, • /1 • 0.100- •
oooo • 0050 • "• A A •/1 /1
O.OOC_ 0.0(_ ; : I I I I I14. 16 18 20 22 24. 26 28 30 18 20 22 24. 28 28 30 32 34
Recoilion charge Recoil ion charge
0.200 0"3001 4-e capture2-e capture /1
O.150 /1 0.225 ' •
._ o.1oo • • _ o.I_ • /10/1 /1 7. 0/1 •
o.o_o- • • 0.075_ /1 6z_ 06 /1
• /1
O.OOG /1-- I .... o .I I I I I 0.000 _ : .' '. I I :18 20 22 24 26 28 30 32 34 20 22 24 26 28 30 32 34 36
Recoil Ion charge RecoilIoncharge
Figure 6. Comparison of the Xe recoil-ion charge state distributions produced in electron capture
collisions by 8 AMeV K_ 2+ (presentdata) and 9 AMeV U_+. [3]
IV - 96
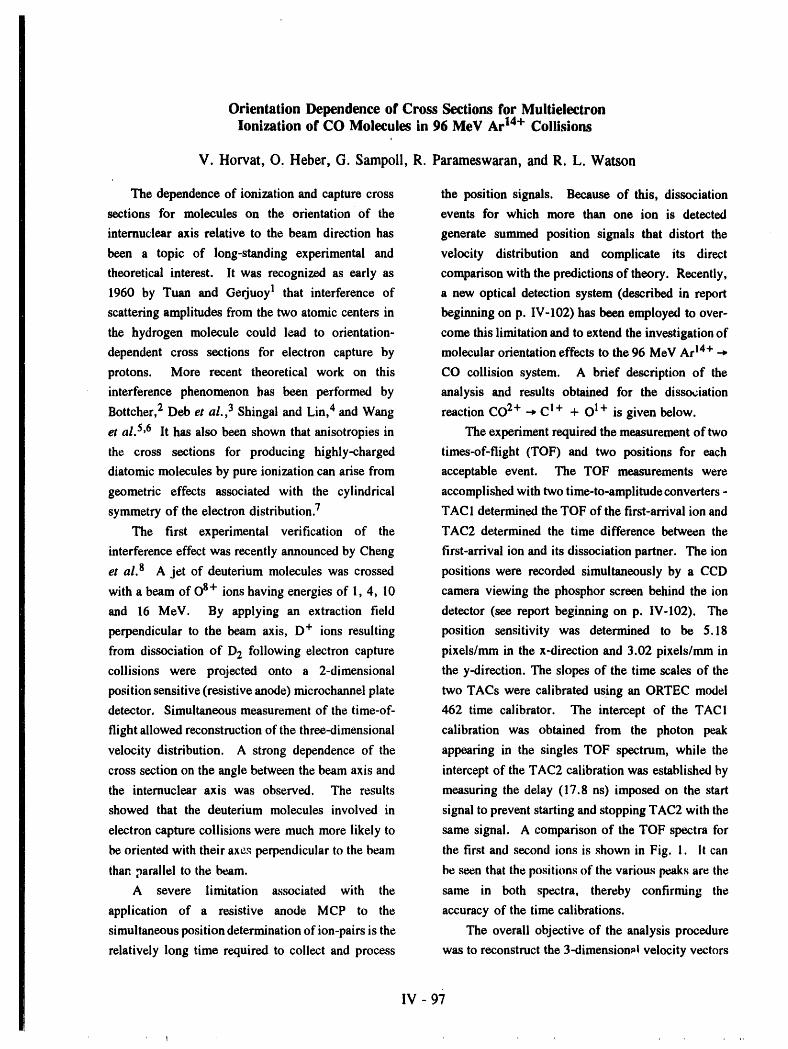
Orientation Dependence of Cross Sections for MultielectronIonization of CO Molecules in 96 MeV Ar 14+ Collisions
V. Horvat, O. Heber, G. Sampoll, R. Parameswaran, and R. L. Watson
The dependence of ionization and capture cross the position signals. Because of this, dissociation
sections for molecules on the orientation of the events for which more than one ion is detected
internuclear axis relative to the beam direction has generate summed position signals that distort the
been a topic of long-standing experimental and velocity distribution and complicate its direct
theoretical interest. It was recognized as early as comparison with the predictions of theory. Recently,
1960 by Tuan and Gerjuoy1 that interference of a new optical detection system (described in report
scattering amplitudes from the two atomic centers in beginning on p. IV-102) has been employed to over-
the hydrogen molecule could lead to orientation- come this limitation and to extend the investigation of
dependent cross sections for electron capture by molecular orientation effects to the 96 MeV Ar 14+
protons. More recent theoretical work on this CO collision system. A brief description of the
interference phenomenon bas been performed by analysis and results obtained for the dissociation
Bottcher, 2 Deb et al., 3 Shingal and Lin, 4 and Wang reaction CO2+ --, C 1+ + O1+ is given below.
et al. 5,6 It has also been shown that anisotropies in The experiment required the measurement of two
the cross sections for producing highly-charged times-of-flight (TOF) and two positions for each
diatomic molecules by pure ionization can arise from acceptable event. The TOF measurements were
geometric effects associated with the cylindrical accomplished withtwotime-to-amplitudeconverters-
symmetry of the electron distribution. 7 TACI determined the TOF of the first-arrival ion and
The first experimental verification of the TAC2 determined the time difference between the
interference effect was recently announced by Cheng first-arrival ion and its dissociation partner. The ion
et al. 8 A jet of deuterium molecules was crossed positions were recorded simultaneously by a CCD
with a beam of Os+ ions having energies of 1, 4, l0 camera viewing the phosphor screen behind the ion
and 16 MeV. By applying an extraction field detector (see report beginning on p. IV-102). The
perpendicular to the beam axis, D + ions resulting position sensitivity was determined to be 5.18
from dissociation of D2 following electron capture pixels/mm in the x-direction and 3.02 pixels/mm in
collisions were projected onto a 2-dimensional the y-direction. The slopes of the time scales of the
position sensitive (resistive anode)microchannel plate two TACs were calibrated using an ORTEC model
detector. Simultaneous measurement of the time-of- 462 time calibrator. The intercept of the TACI
flight aliowedreconstructionofthe three-dimensional calibration was obtained from the photon peak
velocity distribution. A strong dependence of the appearing in the singles TOF spectrum, while the
cross section on the angle between the beam axis and intercept of the TAC2 calibration was established by
the internuclear axis was observed. The results measuring the delay (17.8 ns) imposed on the start
showed that the deuterium molecules involved in signal to prevent starting and stopping TAC2 with the
electron capture collisions were much more likely to same signal. A comparison of the TOF spectra for
be oriented with their axes perpendicular to the beam the first and second ions is shown in Fig. 1. It can
than parallel to the beam. be _,_enthat the positions of the various peaks are the
A severe limitation associated with the same in both spectra, thereby confirming the
application of a resistive anode MCP to the accuracy of the time calibrations.
simultaneous position determination of ion-pairs is the The overall objective of the analysis procedure
relatively long time required to collect and process was to reconstruct the 3-dimension,I velocity vectors
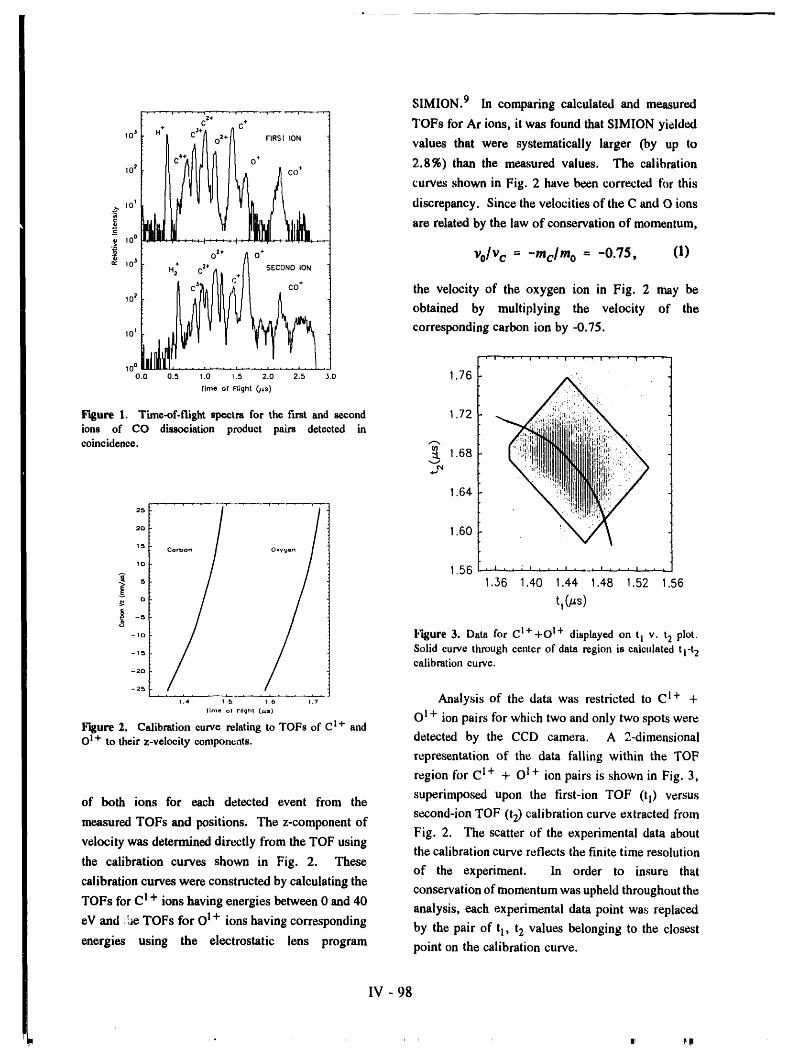
SIMION. 9 In comparing calculated and measured
c2. • TOFs for Ar ions, it was found that SIMION yieldedH + J+, /I C
,d c_ o..It r,,s, ,o, values that were systematically larger (by up to
1°2 c'. o* 2.8%) than the measured values. The calibrationcurves shown in Fig. 2 have been corrected fi)r this
> 1o' discrepancy. Since the velocities of the C and O ions
° are related by the law of conservation of momentum,>o 10 0 , : : :i I : : -'_ :: ." .-'-'=_': :..auuaFa.ah--,.-.,
-Z o'" /_o+ rely c = -mc/mo = -0.75, (1)ac 10 3 H/ C2. t[ SECOND ION
_C .
i the velocity of the oxygen ion in Fig. 2 may be
'°_ obtained by multiplying the velocity of the
,o' corresponding carbon ion by -0.75./
10 °
o.o 0.5 1.0 ,.5 _.o 2.5 3.0 1.76I'ime of Flight (l_S)
Figure 1. Time-of-flightspectrafor the first andsecond 1.72ions of (30 dissociationproduct pairs detected in
coincidence. _ 1.68a,o
1.64
25
2o 1.60
,o 1.56 .i.. :, ....... , ........s 1.36 1.40 1.44 1.48 1.52 .56
_-_-,o Figure3. Data for CI++oI+ displayedon t I v. t2 plot._,., Solid curve throughcenter of data region is calculatedtl-t2
calibrationcurve.-20
-2._,
,., ,_ ,_ ,, Analysis of the data was restricted to C !+ +Time of F'llqht (/._el)
OI + ion pairs for which two and only two spotswereFigure 2. Calibration curve relating to TOFs of C ! + and
OI+ to theirz-velocitycomponents, detected by the CCD camera. A 2-dimensionalrepresentation of the data falling within the TOF
region for C1+ + O l + ion pairs is shown in Fig. 3,
of both ions for each detected event from the superimposed upon the first-ion TOF (tl) versussecond-ion TOF (t2) calibration curve extracted frommeasured TOFs and positions. The z-component ofFig. 2. The scatter of the experimental data about
velocity was determined directly from the TOF usingthe calibration curve reflects the finite time resolution
the calibration curves shown in Fig. 2. Theseof the experiment. In order to insure that
calibration curves were constructed by calculating the conservation of momentum was upheld throughout the
TOFs for CI + ions having energies between 0 and 40 analysis, each experimental data point was replaced
eV and :he TOFs for OI+ ions having corresponding by the pair of ti, t2 values belonging to the closest
energies using the electrostatic lens program point on the calibrationcurve.
IV - 98
m m, llr_I
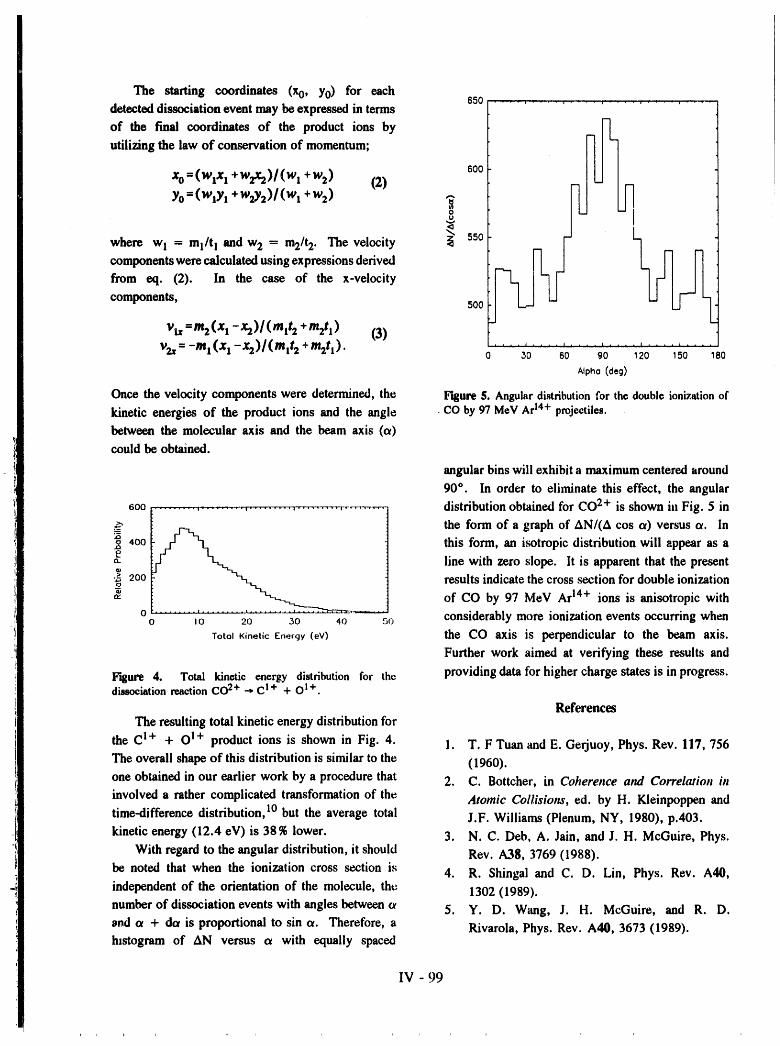
The starting coordinates (xo, Y0) for each650 .............................
detected dissociation event may be expressed in terms
of the final coordinates of the product ions by
utilizing the law of conservation of momentum; R
1'600
XO=(WIXl+W2X2)/(WI+W2) (2) !Yo=(wrY1 +w2Y2)/(wt +w 2) _
where wI - ml/t I and w2 = m2/t2. The velocity _ 55o
components were calculated using expressions derived _.-I _-lj_
from eq. (2). In the case of the x-velocity
components, 500
Ytx=m2(xt- Xz)/(mlt2 +m2tl) (3)
V_ = -ml(X 1- x2)l(mlt2 +m2tl )" o .............................3o eo 9o 120 15o 8oAlpha (deg)
Once the velocity componentswere determined, the Figure5. Angulardistributionfor thedoubleionizationofkinetic energies of the product ions and the angle •CO by 9? M©VAr14+projectiles.between the molecular axis and the beam axis (or)couldbe obtained.
angularbinswill exhibit a maximum centeredaround
90°. In order to eliminate this effect, the angular
Boo .............................. • ........ ,--.-.-..-.-_ distribution obtained for CO2+ is shownin Fig. 5 in
_' _ the form of a graph of AN/(A cos or) versus ¢x. In
" 400 rj-I _1_ this form, an i_tropic distribution will appear as aa. f" _.,.,_ line with zero slope. It is apparent that the present•_ 200 _ results indicate the cross section for double ionizationO
_: of CO by 97 MeV Ar14+ ions is anisotropic with
o considerably more ionization events occurring whenO I 0 20 30 40 50
TotalKineticEnergy(eV) the CO axis is perpendicular to the beam axis.
Further work aimed at verifying these resultsand
Figure 4. Total kinetic energy distributionfor the providingdata for higher chargestatesis in progress.dissociation reaction CO 2+ --* C!+ + O I+ .
References
The resulting total kinetic energy distribution for
the C 1+ + OI+ product ions is shown in Fig. 4. 1. T. F Tuan and E. Gerjuoy, Phys. Rev. 117, 756
The overall shape of this distribution is similar to the (1960).
one obtained in our earlier work by a procedure that 2. C. Bottcher, in Coherence and Correlation in
involved a rather complicated transformation of the Atomic Collisions, ed. by H. Kleinpoppen and
time-difference distribution, 10 but the average total J.F. Williams (Plenum, NY, 1980), p.403.
kinetic energy (12.4 eV) is 38 % lower. 3. N.C. Deb, A. Jain, and J. H. McGuire, Phys.
With regard to the angular distribution, it should Rev. A38, 3769 (1988).
be noted that when the ionization cross section is 4. R. Shingai and C. D. Lin, Phys. Rev. A40,
independent of the orientation of the molecule, th¢: 1302 (1989).
number of dissociation events with angles between _ 5. Y. D. Wang, J. H. McGuire, and R. D.
_nd c_ + da is proportional to sin or. Therefore, a Rivarola, Phys. Rev. A40, 3673 (1989).histogram of AN versus ¢x with equally spaced
IV - 99
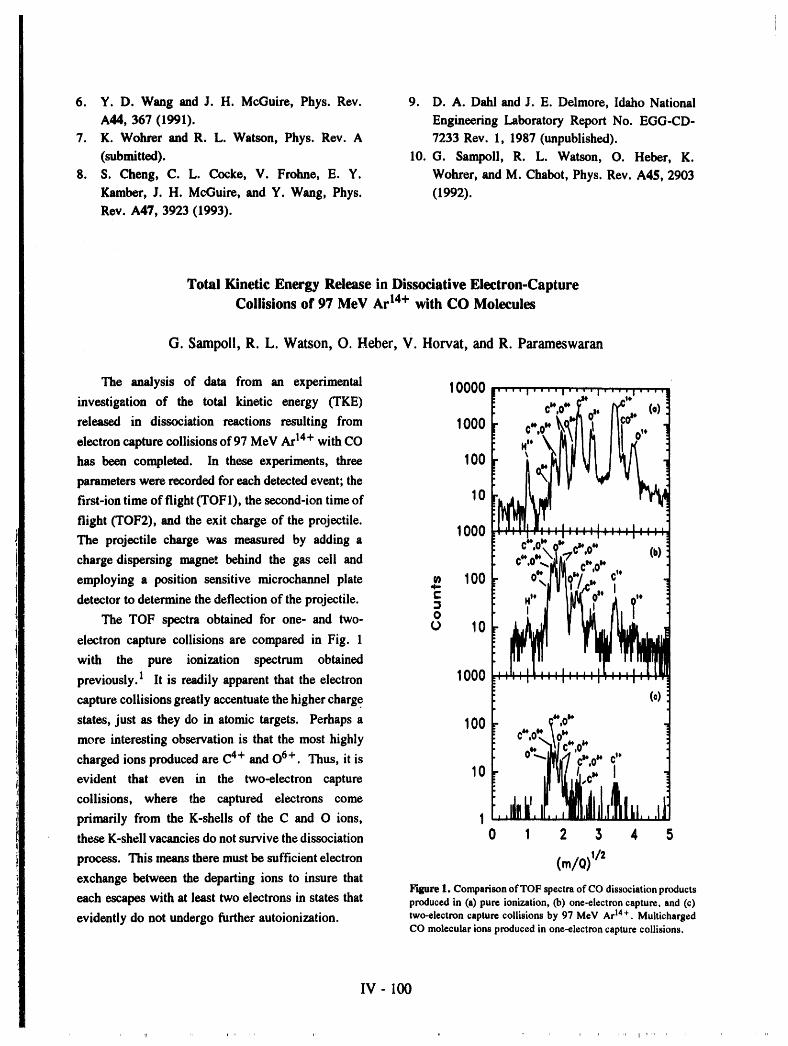
6. Y. D. Wang and J. H. McGuire, Phys. Rev. 9. D.A. Dahl and J. E. Delmore, Idaho National
A44, 367 (1991). Engineering Laboratory Report No. EGG-CD-
7. K. Wohrer and R. L. Watson, Phys. Rev. A 7233 Rev. 1, 1987 (unpublished).
(submitted). 10. G. Sampoll, R. L. Watson, O. Heber, K.
8. S. Cheng, C. L. Cocke, V. Frohne, E.Y. Wohrer, and M. Chabot, Phys. Rev. A45, 2903
Kamber, J. H. McGuire, and Y. Wang, Phys. (1992).
Rev. A47, 3923 (1993).
Total Kinetic Energy Release in Dissociative Electron-Capture
Collisions of 97 MeV Ar t4+ with CO Molecules
G. Sampoll, R. L. Watson, O. Heber, V. Horvat, andR. Parameswaran
The analysis of data from an experimental |0000investigation of the total kinetic energy (TKE)
released in dissociation reactions resulting from 1000
electron capture collisions of 97 MeV Ar14+ with CO
has been completed. In these experiments, three 100
parameters were recorded for each detected event; the
first-ion time of flight (TOF 1), the second-ion time of 10
flight (TOF2), and the exit charge of the projectile.1000
The projectile charge was measured by adding a |
charge dispersing magnet behind the gas cell and
!
employing a position sensitive microchannei plate ¢_ 100 0,,4-
detector to determine the deflection of the projectile. 23O
The TOF spectra obtained for one- and two- 0 10 !electron capture collisions are compared in Fig. 1
with the pure ionization spectrum obtained
previously.i It is readily apparent that the electron 1000 ':,.
capture collisions greatly accentuate the higher charge (c)
states, just as they do in atomic targets. Perhaps a 100 _",0"
more interesting observation is that the most highly ¢*',°_--_o"NU C** -_
Or, _i:l ,Qcharged ions produced are C 4+ and O6+. Thus, it is ""_a/] _,0 _' c"
evident that even in the two-electron capture 10 ", ' I [Ii,_[I ,_/J'_l_'Ca*' litcollisions, where the captured electrons come .JLI, |Iprimarily from the K-shells of the C and O ions, 1 ' | , i,I I'l,, ,I
these K-shell vacancies do not survive the dissociation 0 1 2 3 4 5
This means there must be sufficient electron (m/0_1/2process.
exchange between the departing ions to insure thatF'ggure 1. Comparison of TOF spectra of CO dissociation products
each escapes with at least two electrons in states that produced in (a) pure ionization, (b) one-electroncapture,and(c)evidently do not undergo further autoionization, two-electron capture collisions by 97 MeV Ar M+ . Muiticharged
CO molecular ions produced in one-electron capture collisions.
IV - 100
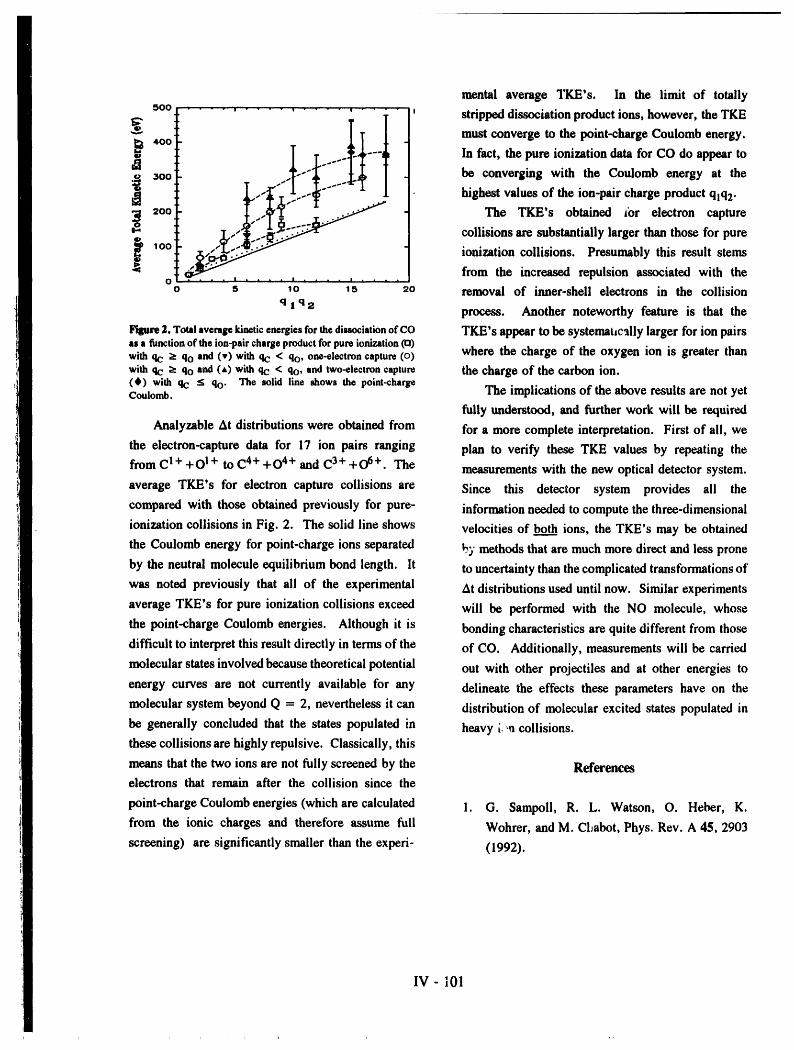
mentalaverageTKE's. In the limitof totally
500 .... , .......... , .... , strippeddissociationproductions,however,theTKE
,too I "'" In fact, the pure ionization data for CO do appear to
300 "" be converging with the Coulomb energy at the
highest values of the ion-pair charge product qlq2"
2oo The TKE's obtained ior electron capturecollisions are substantially larger than those for pure
loo ionization collisions. Presumably this result stemsfrom the increased repulsion associated with theO .... I .... I . . . , I , , , *
o s l o is 2o removal of inner-shell electrons in the collision
q z q e process. Another noteworthy feature is that the
Figure 2. Total average kinetic energies for the diuociation of CO TKE's appear to be systematically larger for ion pairsas a function of the ion-pair charge product for pure ionization 03)with qc _ qo and (v) with qc < qo, one-electron capture (o) where the charge of the oxygen ion is greater thanwith qc _ qo and (,) with qc < qo, and two-electron capture the charge of the carbon ion.(4_) with qc _ qo' The solid line shows the point-chargeCoulomb. The implications of the above results are not yet
fully understood, and further work will be required
Analyzable At distributions were obtained from for a more complete interpretation. First of all, we
the electron-capture data for 17 ion pairs ranging plan to verify these TKE values by repeating the
from C1+ +O 1+ to C4+ +04+ and C3+ +06+. The measurements with the new optical detector system.
average TKE's for electron capture collisions are Since this detector system provides all the
compared with those obtained previously for pure- information needed to compute the three-dimensional
ionization collisions in Fig. 2. The solid line shows velocities of bot_..hhions, the TKE's may be obtained
the Coulomb energy for point-charge ions separated b_,"methods that are much more direct and less prone
by the neutral molecule equilibrium bond length. It to uncertainty than the complicated transformations of
was noted previously that all of the experimental At distributions used until now. Similar experiments
average TKE's for pure ionization collisions exceed will be performed with the NO molecule, whose
the point-charge Coulomb energies. Although it is bonding characteristics are quite different from those
difficult to interpret this result directly in terms of the of CO. Additionally, measurements will be carried
molecular states involved because theoretical potential out with other projectiles and at other energies to
energy curves are not currently available for any delineate the effects these parameters have on the
molecular system beyond Q = 2, nevertheless it can distribution of molecular excited states populated in
be generally concluded that the states populated in heavy i, ,_ collisions.these collisions are highly repulsive. Classically, this
means that the two ions are not fully screened by the Referenceselectrons that remain after the collision since the
point-charge Coulomb energies (which are calculated 1. G. Sampoll, R. L. Watson, O. Heber, K.
from the ionic charges and therefore assume full Wohrer, and M. Cl_abot, Phys. Rev. A 45, 2903
screening) are significantly smaller than the experi- (1992).
IV -I01
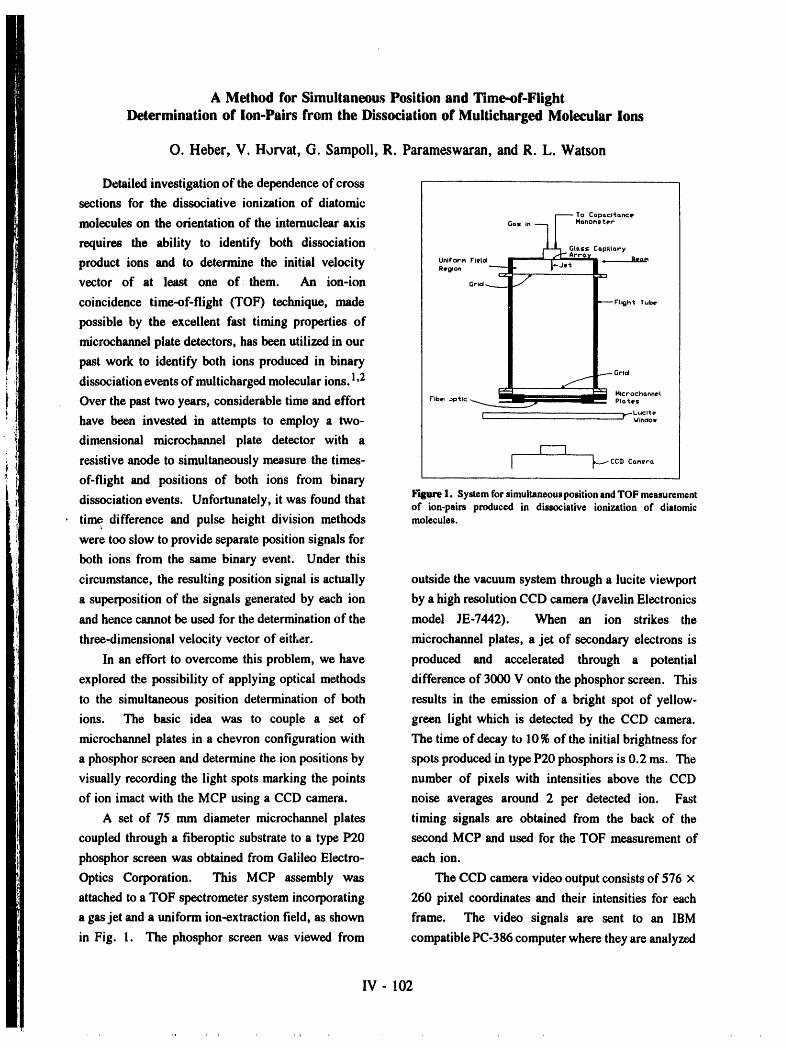
A Method for Simultaneous Position and Time-of-FlightDetermination of Ion-Pairs from the Dissociation of Multicharged Molecular Ions
O. Heber, V. Horvat, G. Sampoll, R. Parameswaran, and R. L. Watson
Detailedinvestigationof the dependenceof crosssections for the dissociative ionization of diatomic
f------ To Capoc;'tance
molecules on the orientationof the internuclearaxis Go,,o--11 Mo,,o..t_..lirequires the ability to identify both dissociation Gto,S$ Cop_.tary
lel_ld I _ Arr_ _ _eam
product ions and to determine the initial velocity ..g,onU_'+_'"--._ l"J'_ l-vector of at least one of: them. An ion-ion _,_.,_ t"I
/coincidence time-of-flight (TOF) technique, made _--r,_h_ ,u_.
/possible by the excellent fast timing properties ofmicrochannelplate detectors, has been utilized in our
past work to identify both ions produced in binary _.._G,,_dissociationevents of multichargedmolecularions.1,2 _ _ _c,och.... LOver the past two years, considerabletimeandeffort r,bo,op,,c_ _--I , • p,_o,
have been invested in attempts to employ a two- L ]..--t.ucstt.WlnOlOW
dimensional microchannel plate detector with a
resistive anode to simultaneouslymeasurethe times- I _ ccDco,,,oof-flight and positions of both ions from binary
dissociationevents. Unfortunately,it was foundthat r'gure1. SystemforsimultaneouspositionandTOFmeasurementof ion-pain produced in dissociative ionization of diatomic
• time difference and pulse height division methods molecules.
were too slow to provide separateposition signals forboth ions from the same binary event. Under this
circumstance,the resultingposition signalis actually outside the vacuumsystem througha lucite viewport
a superposition of the signals generated by each ion by ahighresolutionCCD camera (JavelinElectronics
and hence cannotbe used for thedeterminationof the model JE-7442). When an ion strikes the
three-dimensionalvelocity vector of either, microchannelplates, a jet of secondary electrons is
In an effort to overcome this problem, we have produced and accelerated through a potential
explored the possibility of applying optical methods differenceof 3000 V onto the phosphorscreen. This
to the simultaneousposition determinationof both results in the emission of a bright spot of yellow-
ions. The basic idea was to couple a set of green light which is detected by the CCD camera.
microchannelplates in a chevron configurationwith The timeof decay to 10% of the initialbrightnessfor
a phosphorscreen and determinethe ion positions by spots produced in typeP20 phosphors is 0.2 ms. Thevisually recordingthe light spots markingthe points number of pixeis with intensities above the CCD
of ion imact with the MCP using a CCD camera, noise averages around 2 per detected ion. Fast
A set of 75 mm diametermicrochannelplates timing signals are obtained from the back of the
coupled througha fiberoptic substrateto a type P20 second MCP and used for the TOF measurementof
phosphorscreen was obtained from Galileo Electro- each ion.
Optics Corporation. This MCP assembly was The CCD camera video outputconsistsof 576 x
attachedto a TOF spectrometersystem incorporating 260 pixel coordinates and their intensities for each
a gasjet and a uniformion-extractionfield, as shown frame. The video signals are sent to an IBM
in Fig. 1. The phosphor screen was viewed from compatiblePC-386computerwhere theyareanalyzed
IV - 102
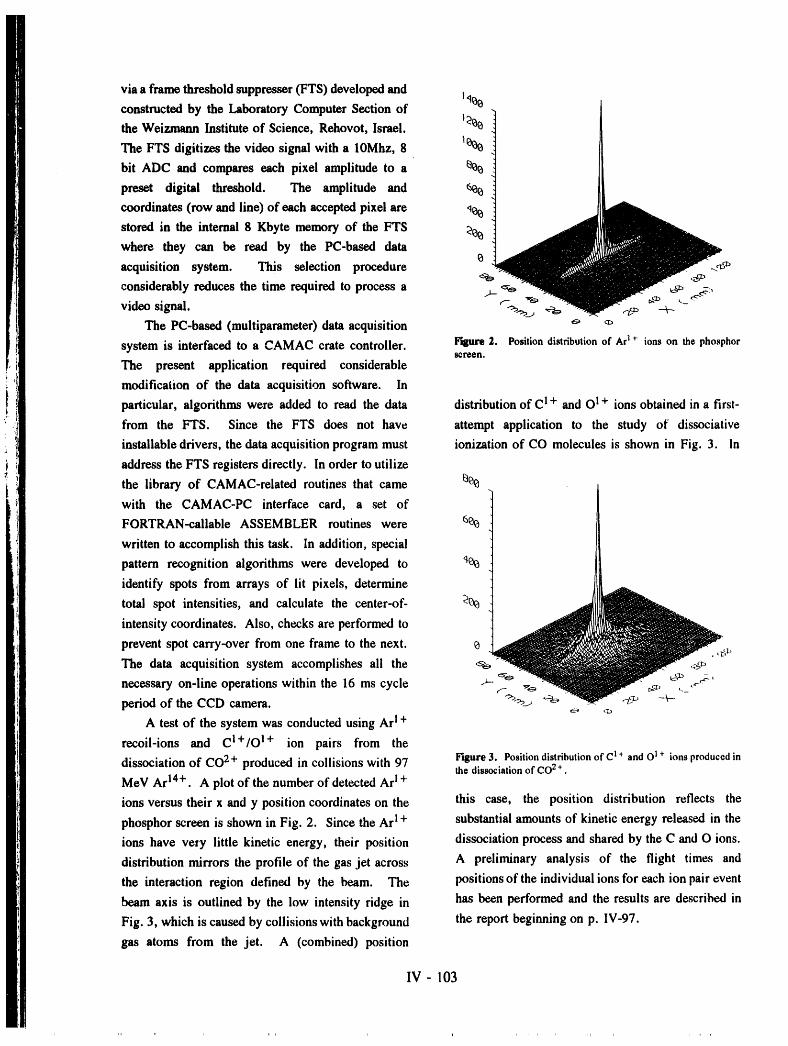
via a frame threshold suppresser (FTS) developed and
constructed by the Laboratory Computer Section of Iq%
the Weizmann Institute of Science, Rehovot, Israel. 1_% 1
The FTS digitizes the video signal with a 10Mhz, 8 1_ 1bit ADC and compares each pixel amplitude to a _%
preset digital threshold. The amplitude and 4%
coordinates (row and line) of each accepted pixel are 4%
stored in the internal 8 Kbyte memory of the FTS _%where they can be read by the PC-based data
acquisition system. This selection procedure ,v_,
considerably reduces the time required to process a _ _o _,_ F:,
video signal. :"_-->:_'__e _, _'_--_ '- _The PC-based (multiparameter) data acquisition _
system is interfaced to a CAMAC crate controller. Figure2. Position distribution of ArI _ ions on the phosphorscreen.
The present application required considerable
modification of the data acquisition software. In
particular, algorithms were added to read the data distribution of Cl + and O I+ ions obtained in a first-
from the FTS. Since the FTS does not have attempt application to the study of dissociative
installable drivers, the data acquisition program must ionization of CO molecules is shown in Fig. 3. In
address the FTS registers directly. In order to utilize
the library of CAMAC-related routines that came _%
with the CAMAC-PC interface card, a set of
FORTRAN-callable ASSEMBLER routines were _%
written to accomplish this task. In addition, special
pattern recognition algorithms were developed to q%
identify spots from arrays of lit pixels, determine
total spot intensities, and calculate the center-of- _-%
0intensity coordinates. Also, checks are performed to
prevent spot carry-over from one frame to the next. .,_,t'
The data acquisition system accomplishes all the >---_necessary on-line operations within the 16 ms cycle _-o . . _ ,,;.,;.,
period of the CCD camera, o,_ _o o _
A test of the system was conducted using Ar I+
recoil-ions and CI+/o 1+ ion pairs from the
dissociation of CO2+ produced in collisions with 97 Hgure 3. Position distribution of C t+ and O1+ ions produced inthe dissociation of CO 2+ .
MeV Ar14+. A plot of the number of detected Ar 1+
ions versus their x and y position coordinates on the this case, the position distribution reflects the
phosphor screen is shown in Fig. 2. Since the Art + substantial amounts of kinetic energy released in the
ions have very little kinetic energy, their position dissociation process and shared by the C and O ions.A preliminary analysis of the flight times anddistribution mirrors the profile of the gas jet across
the interaction region defined by the beam. The positions of the individual ions for each ion pair event
beam axis is outlined by the low intensity ridge in has been performed and the results are described in
Fig. 3, which is caused by collisions with background the report beginning on p. IV-97.
gas atoms from the jet. A (combined) position
IV- 103
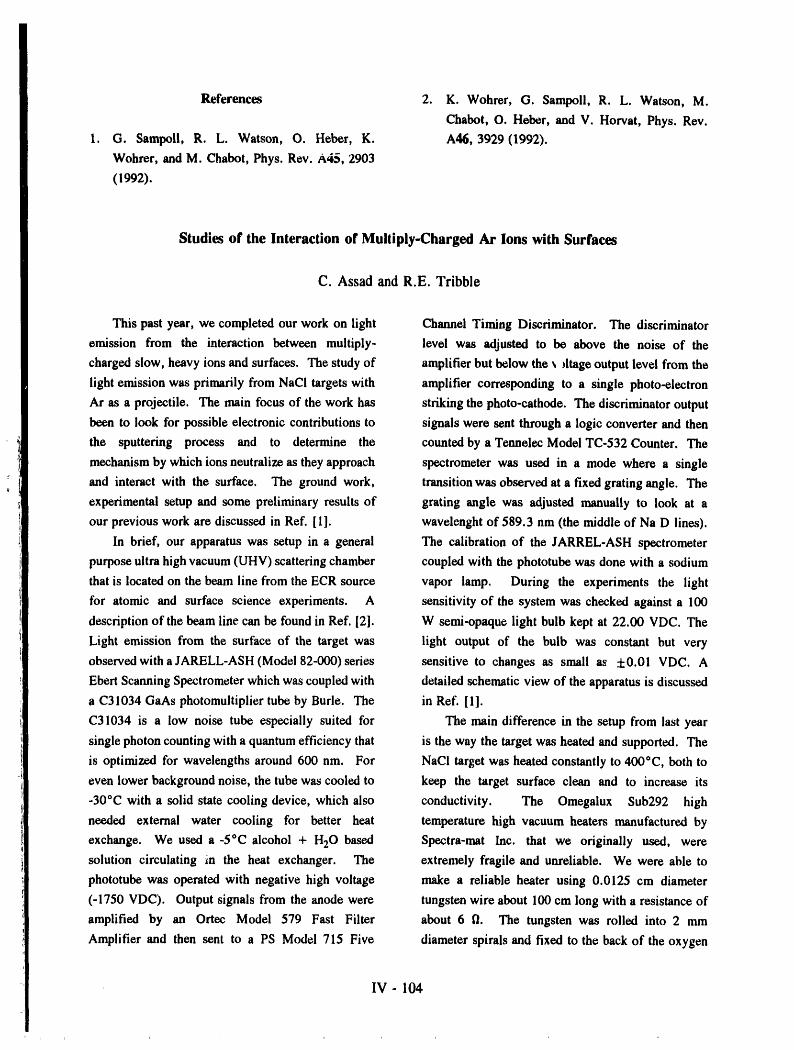
References 2. K. Wohrer, G. Sampoll, R. L. Watson, M.
Chabot, O. Heber, and V. Horvat, Phys. Rev.
1. G. Sampoll, R. L. Watson, O. Heber, K. A46, 3929 (1992).
Wohrer, and M. Chabot, Phys. Rev. A4S, 2903
(1992).
Studies of the Interaction of Multiply-Charged Ar Ions with Surfaces
C. Assad and R.E. Tribble
This past year, we completed our work on light Channel Timing Discriminator. The discriminator
emission from the interaction between multiply- level was adjusted to be above the noise of the
charged slow, heavy ions and surfaces. The study of amplifier but below the ,_dtage output level from the
light emission was primarily from NaCI targets with amplifier corresponding to a single photo-electron
Ar as a projectile. The main focus of the work has striking the photo-cathode. The discriminator output
been to look for possible electronic contributions to signals were sent through a logic converter and then
the sputtering process and to determine the counted by a Tennelec Model TC-532 Counter. The
mechanism by which ions neutralize as they approach spectrometer was used in a mode where a single
and interact with the surface. The ground work, transition was observed at a fixed grating angle. The
experimental setup and some preliminary results of grating angle was adjusted manually to look at a
our previous work are discussed in Ref. [1]. wavelenght of 589.3 nm (the middle of Na D lines).
In brief, our apparatus was setup in a general The calibration of the JARREL-ASH spectrometer
purpose ultra high vacuum (UHV) scattering chamber coupled with the phototube was done with a sodium
that is located on the beam line from the ECR source vapor lamp. During the experiments the light
for atomic and surface science experiments. A sensitivity of the system was checked against a 100
description of the beam line can be found in Ref. [2]. W semi-opaque light bulb kept at 22.00 VDC. The
Light emission from the surface of the target was light output of the bulb was constant but very
observed with a JARELL-ASH (Model 82-000) series sensitive to changes as small as +0.01 VDC. A
Ebert Scanning Spectrometer which was coupled with detailed schematic view of the apparatus is discussed
a C31034 GaAs photomultiplier tube by Burle. The in Ref. [1].
C31034 is a low noise tube especially suited for The main difference in the setup from last year
single photon counting with a quantum efficiency that is the way the target was heated and supported. The
is optimized for wavelengths around 600 nm. For NaCI target was heated constantly to 400°C, both to
even lower background noise, the tube was cooled to keep the target surface clean and to increase its
-30°C with a solid state cooling device, which also conductivity. The Omegalux Sub292 high
needed external water cooling for better heat temperature high vacuum heaters manufactured by
exchange. We used a -5°C alcohol + H20 based Spectra-mat Inc. that we originally used, were
solution circulating in the heat exchanger. The extremely fragile and unreliable. We were able to
phototube was operated with negative high voltage make a reliable heater using 0.0125 cm diameter
(-1750 VDC). Output signals from the anode were tungsten wire about 100 cm long with a resistance of
amplified by an Ortec Model 579 Fast Filter about 6 fl. The tungsten was rolled into 2 nun
Amplifier and then sent to a PS Model 715 Five diameter spirals and fixed to the back of the oxygen
IV- 104
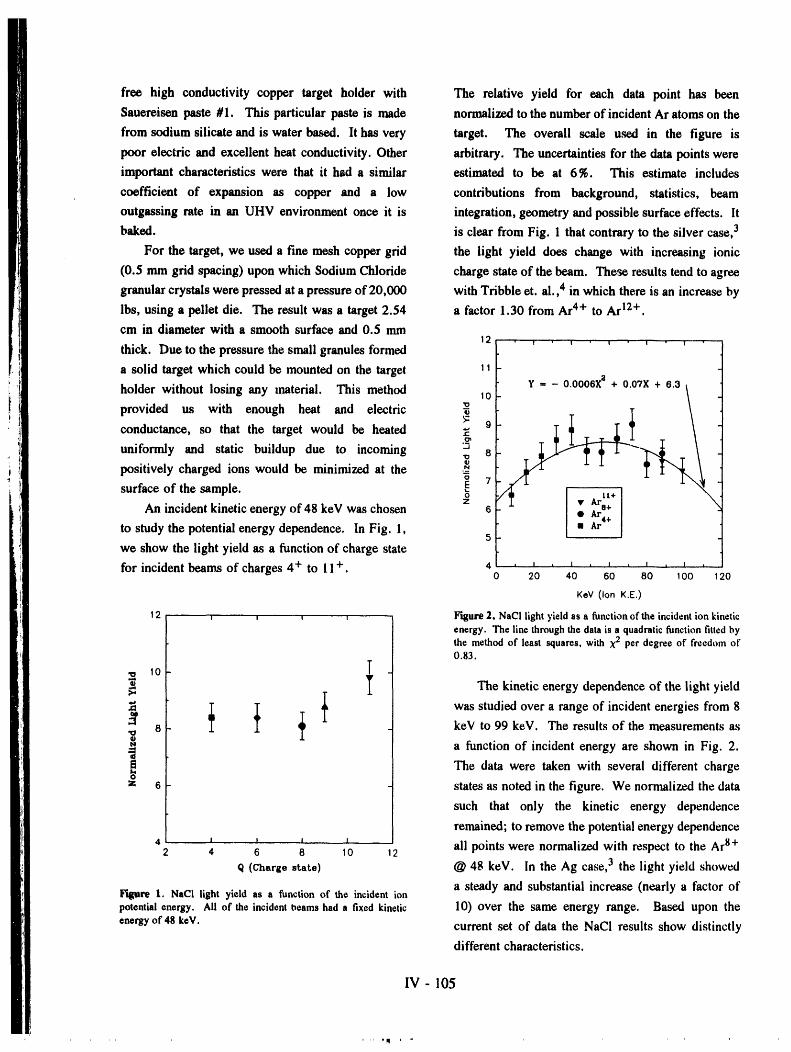
free high conductivity copper target holder with The relative yield for each data point has been
Sauereisen paste #1. This particular paste is made normalized to the number of incident Ar atoms on the
from sodium silicate and is water based. It has very target. The overall scale used in the figure is
poor electric and excellent heat conductivity• Other arbitrary. The uncertainties for the data points were
important characteristics were that it had a similar estimated to be at 6%. This estimate includes
coefficient of expansion as copper and a low contributions from background, statistics, beam
outgassing rate in an UHV environment once it is integration, geometry and possible surface effects. It
baked, is clear from Fig. 1 that contrary to the silver case, 3
For the target, we used a fine mesh copper grid the light yield does change with increasing ionic
(0.5 mm grid spacing) upon which Sodium Chloride charge state of the beam. These results tend to agree
granular crystals were pressed at a pressure of 20,000 with Tribble et. al.,4 in which there is an increase by
lbs, using a pellet die. The result was a target 2.54 a factor 1.30 from Ar4+ to Ar 12+.
em in diameter with a smooth surface and 0.5 nun12 .. , . _ . _ . , . _ .
thick. Due to the pressure the small granules formed [
ta solid target which could be mounted on the target 11
holder without losing any inaterial. This method 10 Y = - °'°°°exa + 0.07x + e.a \ ._provided us with enough heat and electric -_ \ tconductance, so that the target would be heated
.__
uniformly and static buildup due to incoming -Jx_ 8
positively charged ions would be minimized at the ._
surface of the sample. _ 7o
An incident kinetic energy of 48 keV was chosen z 6 •v
i tto study the potential energy dependence. In Fig. 1, s - - -we show the light yield as a function of charge state
for incident beams of charges 4 + toll + 4 . , . i . , . , , _ , j• 0 20 40 60 80 1O0 120
KeY (IonK.E,)
12 , , , , -- Hgure 2. NaCI light yield as a function of the incident ion kineticenergy. The line through the data is a quadratic function titled bythe method of least squares, with X2 per degree of freedom of0.83.
,o T _T The kinetic energy dependence of the light yield
._ _ _ _ _ was studied over a range of incident energies from 8:_ 8 keV to 99 keV. The results of the measurements as
N a function of incident energy are shown in Fig. 2.
fl The data were taken with several different charge
z 6 states as noted in the figure. We normalized the data
such that only the kinetic energy dependence
remained; to remove the potential energy dependence
4 J t _ t all points were normalized with respect to the Ar 8+2 4 6 8 10 12
q (Charge state) @ 48 keV. In the Ag case, 3 the light yield showed
a steady and substantial increase (nearly a factor ofi_gu_ 1. NaCI light yield as a function of the incident ion
potential energy. All of the incident beams had a fixed kinetic 10) over the same energy range. Based upon the
energyof 48keV. current set of data the NaCI results show distinctly
different characteristics.
IV -105
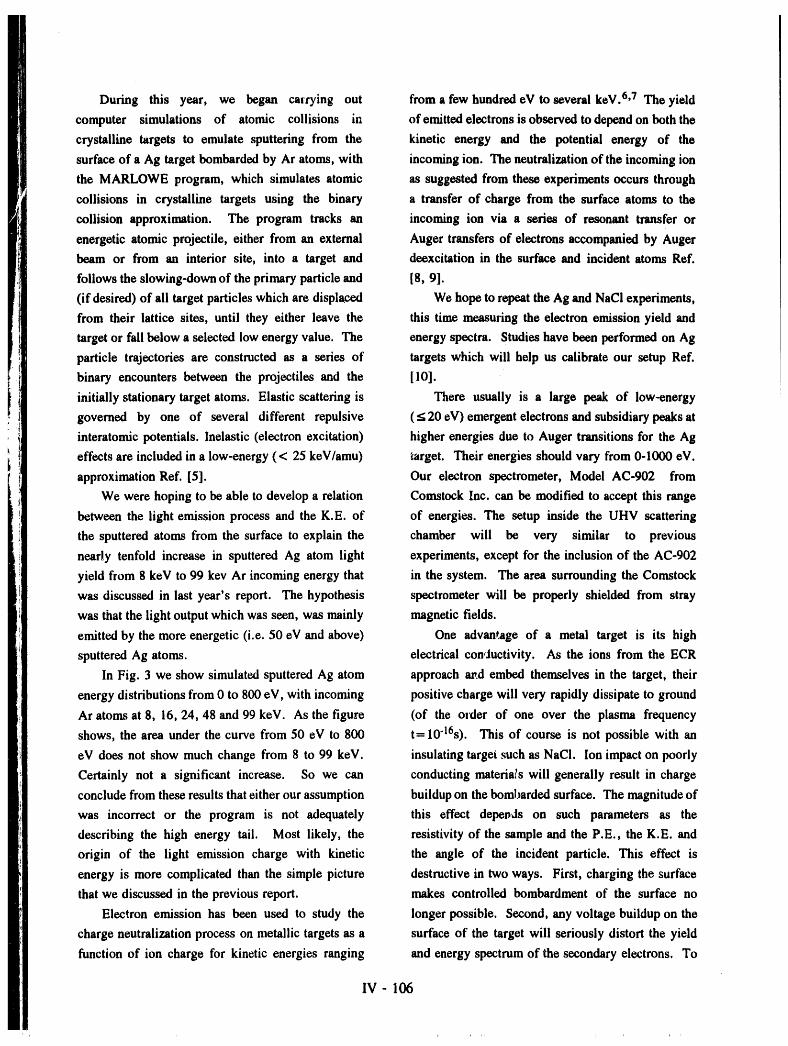
During this year, we began carrying out from a few hundred eV to several keV. 6,7 The yield
computer simulations of atomic collisions in of emitted electrons is observed to depend on both the
crystalline targets to emulate sputtering from the kinetic energy and the potential energy of the
surface of a Ag target bombarded by Ar atoms, with incoming ion. The neutralization of the incoming ion
the MARLOWE program, which simulates atomic as suggested from these experiments occurs through
collisions in crystalline targets using the binary a transfer of charge from the surface atoms to the
collision approximation. The program tracks an incoming ion via a series of resonant transfer or
energetic atomic projectile, either from an external Auger transfers of electrons accompanied by Auger
beam or from an interior site, into a target and deexcitation in the surface and incident atoms Ref.
follows the slowing-down of the primary particle and [8, 9].
(if desired) of all target particles which are displaced We hope to repeat the Ag and NaCI experiments,
from their lattice sites, until they either leave the this time measuring the electron emission yield and
target or fall below a selected low energy value. The energy spectra. Studies have been performed on Ag
particle trajectories are constructed as a series of targets which will help us calibrate our setup Ref.
binary encounters between the projectiles and the [10].
initially stationary target atoms. Elastic scattering is There usually is a large peak of low-energy
governed by one of several different repulsive (< 20 eV) emergent electrons and subsidiary peaks at
interatomic potentials. Inelastic (electron excitation) higher energies due to Auger transitions for the Ag
effects are included in a low-energy (< 25 keV/amu) _arget. Their energies should vary from 0-1000 eV.
approximation Ref. [5]. Our electron spectrometer, Model AC-902 from
We were hoping to be able to develop a relation Comstock Inc. can be modified to accept this range
between the light emission process and the K.E. of of energies. The setup inside the UHV scattering
the sputtered atoms from the surface to explain the chamber will be very similar to previous
nearly tenfold increase in sputtered Ag atom light experiments, except for the inclusion of the AC-902
yield from 8 keV to 99 key Ar incoming energy that in the system. The area surrounding the Comstock
was discussed in last year's report. The hypothesis spectrometer will be properly shielded from stray
was that the light output which was seen, was mainly magnetic fields.
emitted by the more energetic (i.e. 50 eV and above) One advantage of a metal target is its high
sputtered Ag atoms, electrical con,.tuctivity. As the ions from the ECR
In Fig. 3 we show simulated sputtered Ag atom approach _.d embed themselves in the target, their
energy distributions from 0 to 800 eV, with incoming positive charge will very rapidly dissipate to ground
Ar atoms at 8, 16, 24, 48 and 99 keV. As the figure (of the order of one over the plasma frequency
shows, the area under the curve from 50 eV to 800 t= 10"16s). This of course is not possible with an
eV does not show much change from 8 to 99 keV. insulating target such as NaCl. Ion impact on poorly
Certainly not a significant increase. So we can conducting materials will generally result in charge
conclude from these results that either our assumption buildup on the bombarded surface. The magnitude of
was incorrect or the program is not adequately this effect deper_ds on such parameters as the
describing the high energy tail. Most likely, the resistivity of the sample and the P.E., the K.E. and
origin of the light emission charge with kinetic the angle of the incident particle. This effect is
energy is more complicated than the simple picture destructive in two ways. First, charging the surface
that we discussed in the previous report, makes controlled bombardment of the surface no
Electron emission has been used to study the longer possible. Second, any voltage buildup on the
charge neutralization process on metallic targets as a surface of the target will seriously distort the yield
function of ion charge for kinetic energies ranging and energy spectrum of the secondary electrons. To
IV - 106
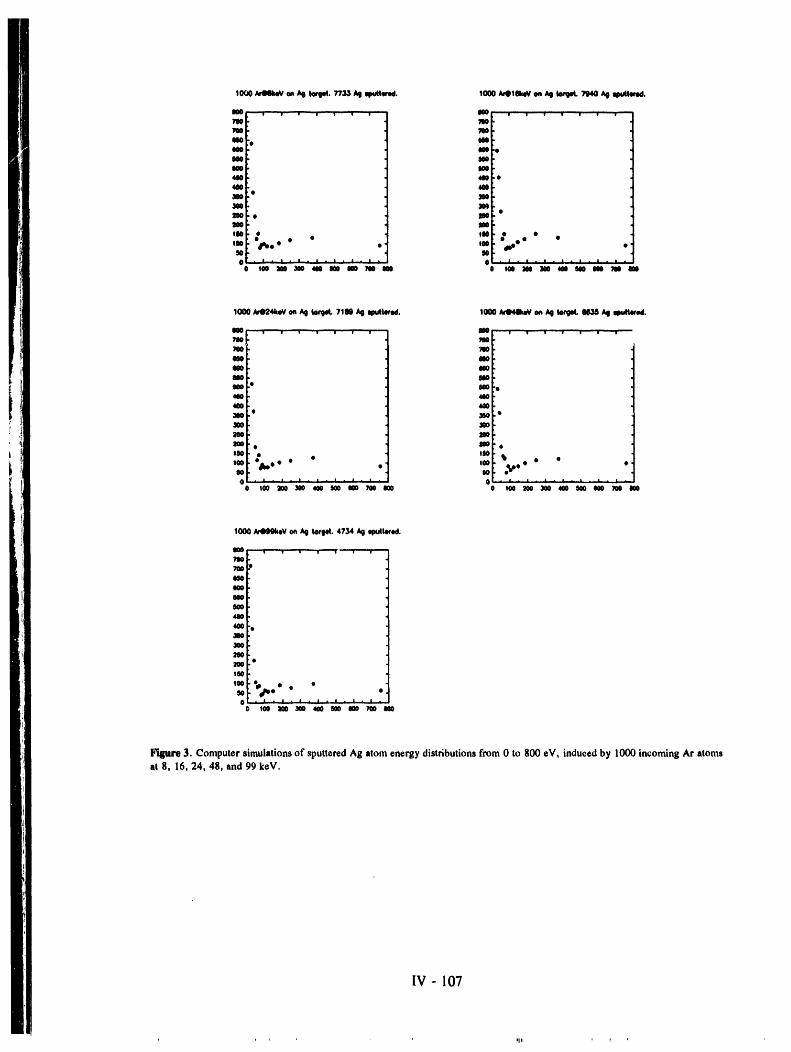
Iooo _voekw on_ tore_. 7733 _ q_ee.od. 1000_drOlek_Von hi lores4._m _ N_ttered.
soa v" • v -r • - v" v lao i J • v ' w w w9_0 7eo7eo 7ooio q4o(_o io
Mo Nomo lwo440 400 •4oo 4oo
e3eo 3oo_mo 3m119o • too
aoo
!" o_jDo 'l° _mpeoO °I00 • • o • •• 000 •90 • 90
• ¢ • , . | . I . J , , . to _oo aoo 3oo 4co uo mo Too No o too no xo m m uo _e m
1ooo_o24kev o_Ae k_oL 71N _ opumwo_. 10oo_ a_ AS _ _ ,NInpu_wed.
010 u" " v ,' ' • | , ' • Jog , • , .. , ..u.., , •
900 700M0 ON4OO NOM0 NO
I_ o
1_ e 300 •
No e lira •190 o • ONI00 %0 • • • tO0
ooO0 O0 o.bo •
0 l_ 2_'300 4_0 gO0 O0O'900"e_o 0 1_ _ 300 400"_0 q_'_O iUDO
1000.al_MHIkeVon AgkJrg44.4734 Ag opufl_'cd,
_10?00
q_o
tmo
o
too
I00 oiij_ • •00 _- • e •
Figure 3, Computer simulations of sputtered Ag atom energy distributions from 0 to 800 eV, induced by 1000 incoming Ar atoms
at 8, 16, 24, 48, and 99 keV.
IV- 107
counteract this problem we plan to use an electron References
gun model FRA-2X1-2 from Kimball Physics to
neutralize the surface. This particular electron gun is 1. C. Assad and R.E. Tribble, Light emission
capable of emitting modest beam currents at energies studies with slow, highly-charged heavy ions,
as low as 5 eV, and currents as high as 220 _tA. Progress in Research 1991-1992, Cyclotron
With this instrument the surface of the sample could Institute, Texas A&M Univ., p. 88.
be flooded with low energy electrons (up to 10 eV), 2. R.L. Watson, D. A. Church, R. E. Tribble, L.
arJ this should prevent the target from charging up. Yang, B. B. Bandong and T. Lotze, Nucl.
A second method is also available, a simple hot lnstrum. Methods BS6/57 (1991)223.
filament near the surface would have the same 3. C. Assad, W. Liu and R. E. Tribble, Nucl.
effect. I1 In either case, we need to study the effect Instrum. Methods 1362/2 (Dec 1991) 201.
of this electron cloud on a metal target first by 4. R.E. Tribble, M. H. Prior, and R. G. Stokstad,
comparing the electron spectrum from a metal target Nucl. Instrum. Methods B44 (1990) 412.
with and without the electron cloud. 5. M.T. Robinson, Nucl. Instrum. Methods 1348
Unlike the previous set of experiments on light (1990) 408.
emission, the data acquisition will need to be 6. F.W. Meyer, C. C. Havener, S. H. Overbury,
computerized. The AC-902 needs to be stepped in K.J. Snowdon, D. M. Zehner, W. Heiland and
voltage so that it can cover the whole range of H. Heroine, Nucl. Instrum. Methods B23 (1987)
electron energies. Data must be recorded during 234.
each voltage step. These tasks are well suited for a 7. S. T. de Zwart, Nucl. Instrum. Methods B23
standardized data-acquisition system, such as (1987) 239.
CAMAC, attached to a computer. A 286-8 MHz 8. P. Varga, Applied Physics A44 (1987) 31.
IBM PC compatible with a 16-bit AT bus will be 9. H. D. Hagstrum, Inelastic Ion-Surface
used in this setup. Also a DSP Technology, Inc. Collisions, edited by N. H. Tolk, J. C. Tully,
CAMAC crate controller model 6002 and a plug-in W. Heiland and C. W. White, Academic, New
card model PC004, will provide us with a high speed York (1977).
DMA interface between the computer and the 10. J. P. Briand, L. De Billy, P. Charles, S.
instrument modules installed in the CAMAC crate. Essabaa, P. Briand, R. Geller, J. P. Desiclaux,
The programing phase of the CAMAC interface S. Bliman and C. Ristori, Physical Rev. A43
computer code is well underway. The language used (1991) 565.
is Microsoft FORTRAN Ver. 5.0. The program is 11. R. E. Tribble, M. H. Prior and R. G. Stokstad,
able to run the CAMAC crate as well as display the Nucl. Instr. and Meth. B44 (1990) 412.
data live and store them. It was written in such way
so that minor changes can be made with minimal
effort while the experiment is running.
IV- 108
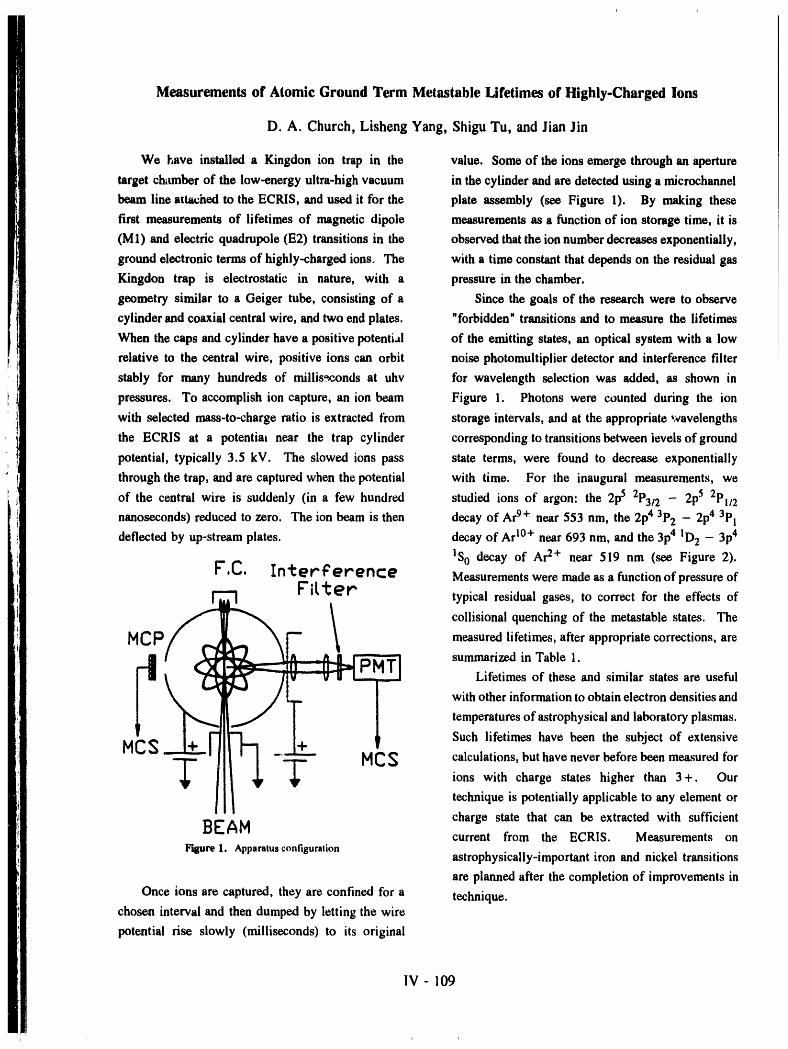
Measurements of Atomic Ground Term Metastable Lifetimes of Highly-Charged Ions
D. A. Church, Lisheng Yang, Shigu Tu, and Jian Jin
We I',ave installed a Kingdon ion trap in the value. Some of the ions emerge through an aperture
target chamber of the low-energy ultra-high vacuum in the cylinder and are detected using a mieroehaunel
beam line attached to the ECRIS, and used it for the plate assembly (see Figure 1). By making these
first measurements of lifetimes of magnetic dipole measurements as a function of ion storage time, it is
(M1) and electric quadrupole (E2) transitions in the observed that the ion number decreases exponentially,
ground electronic terms of highly-charged ions. The with a time constant that depends on the residual gas
Kingdon trap is electrostatic in nature, with a pressure in the chamber.
geometry similar to a Geiger tube, consisting of a Since the goals of the research were to observe
cylinder and coaxial central wire, and two end plates. "forbidden" transitions and to measure the lifetimes
W_en the caps and cylinder have a positive potenti,d of the emitting states, an optical system with a low
relative to the central wire, positive ions can orbit noise photomultiplier detector and interference filter
stably for many hundreds of millisa_onds at uhv for wavelength selection was added, as shown in
pressures. To accomplish ion capture, an ion beam Figure 1. Photons were counted during the ion
with selected mass-to-charge ratio is extracted from storage intervals, and at the appropriate wavelengths
the ECRIS at a potential near the trap cylinder corresponding to transitions between levels of ground
potential, typically 3.5 kV. The slowed ions pass state terms, were found to decrease exponentially
through the trap, and are captured when the potential with time. For the inaugural measurements, we
of the central wire is suddenly (in a few hundred studied ions of argon: the 2p5 2P3/2 - 2p5 2PI/2
nanoseconds) reduced to zero. The ion beam is then decay of Ar9+ near 553 nm, the 2p4 3P2 - 2p4 3P1
deflected by up-stream plates, decay of Ar10+ near 693 nm, and the 3p4 ID2 - 3p4
IS0 decay of Ar2+ near 519 nm (see Figure 2).
F',C. InterFerence Measurements were made as a function of pressure of
[7"1[_ e r typical residual gases, to correct for the effects of
CroP_ _" 1 collisional quenching of the metastable states. The
M measured lifetimes, after appropriate corrections, are
, --naboLifetimes of these and similar states are useful
with other information to obtain electron densities and
temperatures of astrophysical and laboratory plasmas.
MC_ __ Such lifetimes have been the subject of extensive
T T MCS calculations, but have never before been measured forions with charge states higher than 3+. Our
technique is potentially applicable to any element or
_EAM charge state that can be extracted with sufficientcurrent from the ECRIS. Measurements on
Figure1. Apparatusconfigurationastrophysically-important iron and nickel transitions
are planned after the completion of improvements in
Once ions are captured, they are confined for a technique.chosen interval and then dumped by letting the wire
potential rise slowly (milliseconds) to its original
IV- 109
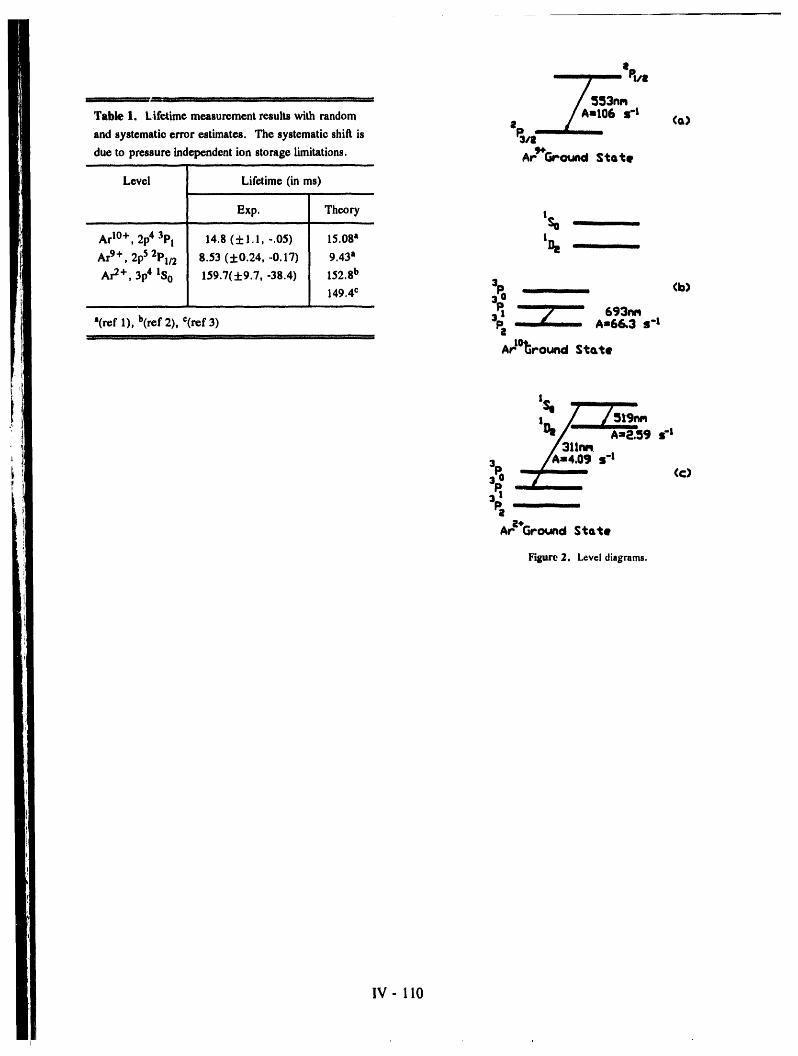
_R• Lt8/- ' .........-- ............................... / 553nn
/, _=tO0 s"_
/ -_
Table l. Lif©timemeasurementresultswith random a (Q)and systematicerror estimates. The systematicshift is P3111
due to pressureindcpend©ntion storage limitations. Arg*C_ot_d $_at:e
Level Lifetime (in ms)
Exp. Theory 1_
ArtO+, 2p4 3p! 14.8 (+I.I, -.05) 15.08a ll_ __ _Ar9+, 2p52Pl/2 8.53 (5:0.24, -0.17) 9.43 a
Ar2+, 3p4 IS0 159.7(+9.7, -38.4) 152.8b149.4c 3R .,, (b)3O
_P, 693nea(ref 1), b(ref2), C(ref3) _'1_ A=6&3 $-t
I- iiiHi Jill illI i i II i fl_lll I
ArtOT3round Sto.t:e
o./ ' ,-'/ 311ne,,
3R _9 s"t3 o (¢)p,
_'Oro_u st:a1:.
Figure2. Leveldiagrams.
IV- II0
K500 Development and Operations
D. P. May, G. Mouchaty, and G. J. Kim
During the 1992-93 reporting period, the power supply with one with better regulation. It was
operation of the K500 has become more reliable at tound that the old supply would randomly go into
higher energies for longer periods. Also, it was unstable modes which were not seen on the control
found that a main-coil repositioning, a raising of the system or even on the current meter of the supply,
KS00 superconducting coil, was necessary in order to and much time was wasted trying to "stabilize" the
run the q/m= I/_ beams again (F.ToT > 50 AMeV). ECR as a consequence.
After this repositioning, trial runs with 62.5, 67.5, Through the first half of the reporting period and
and 70.0 AMeV deuterons were successful. Also including hours scheduled for beam development,
during the reporting period, the highest total energy unscheduled maintenance took up 16.5% of the
beam to date, 40 AMeV 63Cu21+, was developed, scheduled time, deflector maintenance representing
Unfortunately, the experimenters could not effectively 8.5% (262.75 hrs). In the second half, unscheduled
use the low beam current (150 epa), but it did serve maintenance was 9.8 % of the scheduled time with
to illustrate the ability of the source to run long-term deflector maintenance repre,senfing 2.6 % (62.5 hrs).
high-charge-state beams from solid materials. For the period of April 1, 1992 to March 31, 1993,
the operational time is summarized in Table 1 while
K500 R¢.liabi!itv and Stability the scheduled time is listed in Table 2.
Cyclotron reliability has increased substantially
due mainly to an increase in deflector reliability. Main-Coil RepositioningandHieher Energies
Deflector development is described elsewhere in this In attempting to tune a 65 AMeV deuteron beam
progress report, ! but the result has been that Macor _ for an experiment in Dec. 1992, it was found that
insulators with glued titanium ends are used for the beam extraction was difficult and the ultimate
first electrostatic deflector El. Also a new extraction efficiency extremely low. Going down in
conditioning procedure has been worked out. It energy, it was found that a 55 AMoV deuteron beam
involves conditioning slowly with no magnetic field exhibited the same poor behavior. This was despite
and then with magnetic field using a flow of oxygen the fact that a 65 AMeV deuteron beam had been
gas introduced through the rear of the deflector extracted in August, 1991, after the last in a series of
housing. The voltage on the deflector is incremented downward adjustments to the main coil. 2 One more
as drain or microsparking is reduced. This is similar downward adjustment of 0.4 mm was made in
to the conditioning procedure of the sapphire October 1991, and resulted in _ more centered
insulators with argon gas except for the period of no- behavior of I vs. R, but the beam was not extracted.
field conditioning. In December 1992, the beam-probe was loose and
Other improvements include replacement of one "nodding" up and down as it was moved radially so
of the broken Cryotorr 7 cryopumps on the injection that a beam-probe signature of I vs. R on each of the
line with a more reliable Cryotorr 8, replacement of three fingers could not be obtained. Such a signature
the soldered insulator feed-throughs for the inflector could be helpful for future beam diagnostics.
with O-ring sealed ones, and replacement of the It was decided to raise the main coil by 0.2 mm
sliding-pin gas valves on the ECR with more precise and this resulted in much better behavior for
and reliable sapphire-seated gas valves. Also a large extraction of the 55 AMeV beams. Without further
improvement in the stability of the beam resulted rcpositioning, beams of 62.5, 67.5, and 70 AMeV
from the replacement of the ECR analysis-magnet deuterons were successfully developed. The El
V-Ill
deflector voltage for all three beams was Refereaw_
approximately 65 KV (.--6mm gap). The extraction
efficiency for the 62.5 and 67.5 AMeV beams was 1. R.C. Rogers, Progress in Research, 1992-1993,
about 20st, but for 70 AMeV, it dropped to 2st. In Cyclotron Institute, Texas A&M University, p.
February 1993, the main coil was raised an additional V-115.
0.2 mm in response to poor extraction of a 50 AMeV 2. D.P. May, Progress in Research, 1991-1992,
Q/A - 0.5 beam. Although efforts at developing Cyclotron Institute, Texas A&M University,
that beam failed, 65 AMeV deuteron and H_ beams p.95.
were run for 5 days in April 1993 with an initial 3. C. M. Lyneis et al., Proceedings of the lOth
extraction efficiency of 32st and an El deflector International Workshop on ECR Ion Sources,
voltage of 62 kV. Knoxville, TN (1991), p. 47.
ECR Ion Source
Enhancement of the ECR ion source has been Table I. Operational Time
tried resulting in a high-charge-state krypton spectrum ....... ...................St
which is equal to those reported by the LBL 6.4 GHz Hours Tim__._.eECR3. The first stage was left off for this run. The
effect of 10 hours of silane conditioning lasted Beam on target 2282.75 39.0• Cyc.tuning,optics 2283.0 39.0
approximately1 month. Also a high-charge-state Beam development 302.25 5.2copperbeam was developedusingthe solid-feed Scheduledmaintenance 185.5 3.2
mechanismdescribedinthelastreport.Th_ copper Unscheduledmaintenance 727.5 12.5
was placedina tantalumcruciblewithwallsthinner IdleTime 59.5 1.0Cooldown,transfer 8.0 O.I
than those used for lead and bismuth (lmm thick vs.
3.2 mm thick), in order to promote more direct Total 5848.5 100.0
heating of the copper. Table 3 lists the ECR beams ......
available at a source voltage of 10 kV and focused
through object and image slits of 12.7 nun. As
before, the intensities are measured with the image '
slits biased positively by 120 v31ts in order to Table II. Scheduled Beam Time
suppress back-scattered electrons.st
Table 4 is a representative list of beams as of Hours TimeMarch 31, 1992. Several of the beam intensities
were not enhanced by the buncher, but were included Nuclear Physics 1715.5 30.3Nuclear Chemistry 1939.5 34.3
to show the range of the K500. Currently, the 4He+ Atomic Physics 869.0 15.4beam at 30 AMeV is the highest K (480) beam with Outside Collaboration 828.75 14.7
the highest E/A. 40 AMeV 63Cu21+ is the highest E Outside Users 0 0
beam and 70 AMeV deuterons is the highest E/A Beam Development 302.25 5.3
beam. Total 5655.0 100.0
t i , , ,|,,
V-112
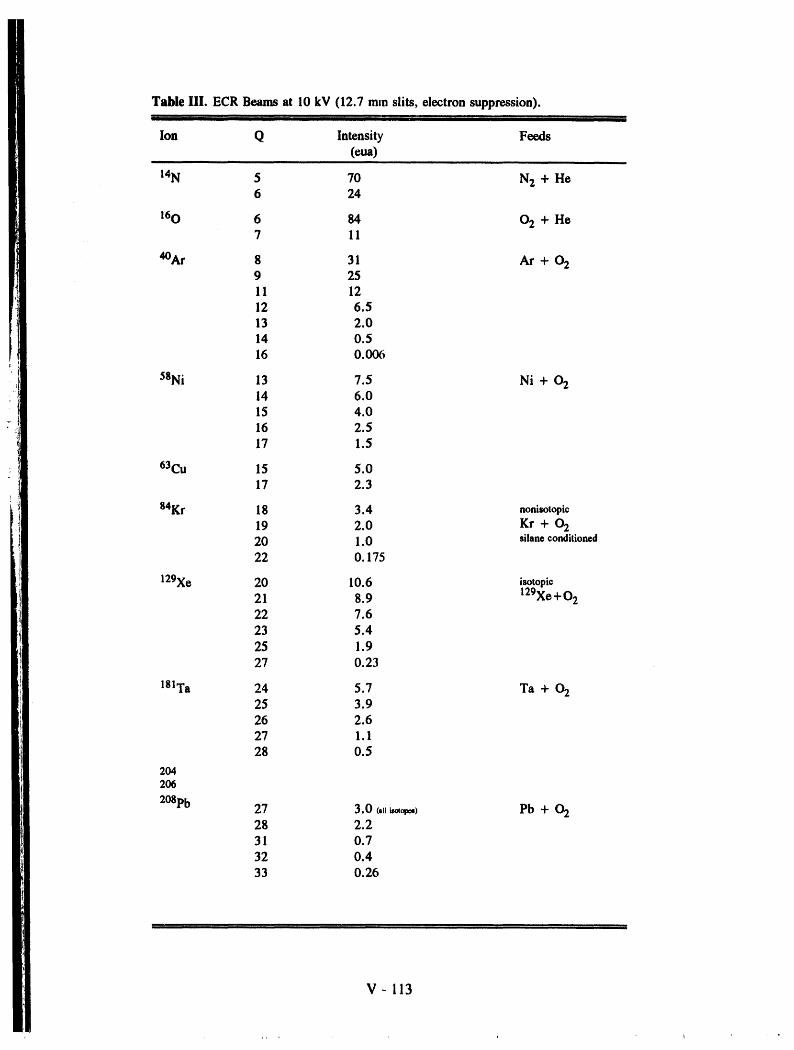
Table llI. ECR Beams at I0 kV (12.7 mm slits, electron suppression).,,II ' T.......
Ion Q Intensity Feeds(eua)
14N 5 70 N 2 + He6 24
160 6 84 02 + He7 11
4°Ar 8 31 Ar + 029 2511 1212 6.513 2.014 0.516 0.006
58Ni 13 7.5 Ni + 0214 6.015 4.016 2.517 1.5
63Cu 15 5.017 2.3
84Kr 18 3.4 nonisotopie
19 2.0 Kr + 0220 1.0 silan¢ conditioned
22 0.175
129Xe 20 10.6 isotopic
21 8.9 129Xe+O222 7.623 5.425 1.927 0.23
181Ta 24 5.7 Ta + 0225 3.926 2.627 1.128 0.5
2O42O6
2°8pb 27 3.0 <.H_,_.} Pb + 0228 2.231 0.732 0.433 0.26
V- 113
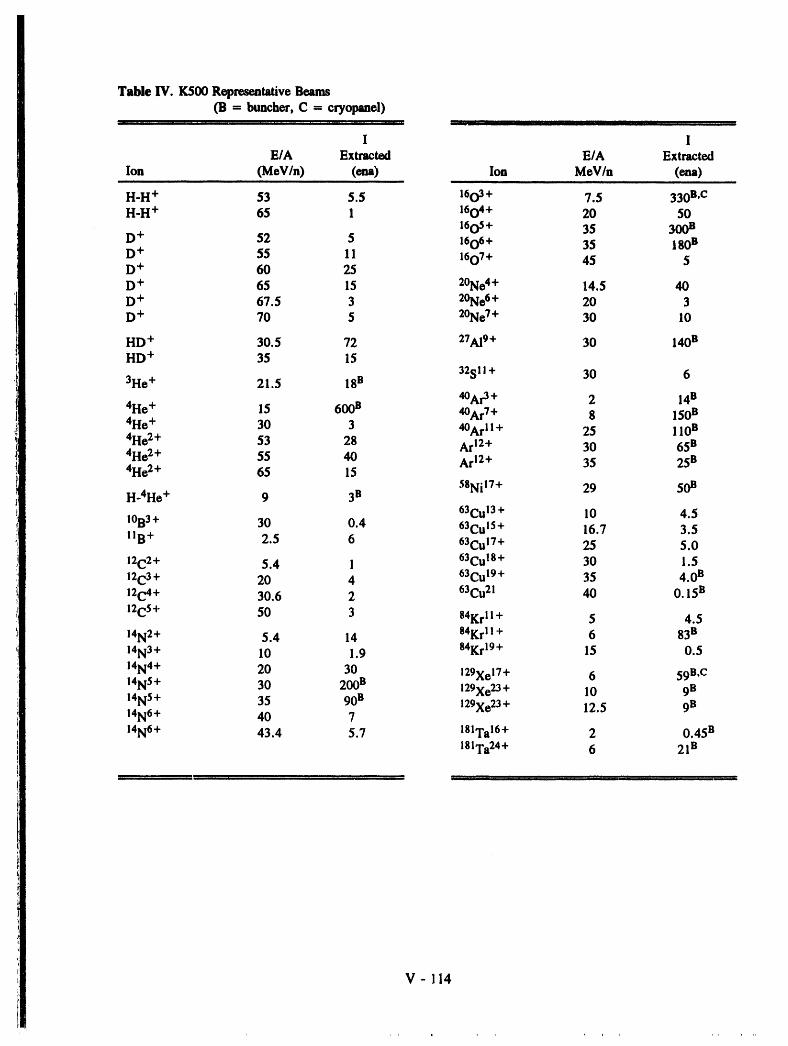
Table IV. K500 Representative Beams(13 --- buncher, C - cryopanel)
II Ilr III I III I i I I
I IE/A Extracted EIA Extracted
Ion (MeV/n) (ena) Ion MeV/n (ena)
H-H + 53 5.5 1603+ 7.5 3308,cH-H + 65 1 1604+ 20 50
1605+ 35 300 eD + 52 5 1606+ 35 180 BD + 55 11 1607+ 45 5D + 60 25D + 65 15 2°Ne4+ 14.5 40D + 67.5 3 2°Ne6+ 20 3D + 70 5 2°NET+ 30 10
HD + 30.5 72 27A19+ 30 140 BHD + 35 15
32S11+ 30 63He+ 21.5 18B
4°At3+ 2 14B4He+ 15 600 B 4°ART+ 8 150e4He+ 30 3 40Arl I+ 25 I l0 B4He2+ 53 28 Ar12+ 30 65e4He2+ 55 40 Ar12+ 35 25e4He2+ 65 15
58Nil7+ 29 50BH-4He + 9 3B
63Cui3 + 10 4.5I°B3 + 30 0.4 63Cul5 + 16.7 3.511B+ 2.5 6 63Cu17+ 25 5.0
12C2+ 5.4 1 63Cu18+ 30 1.5
12C3+ 20 4 63Cul9 + 35 4.0 B12C4+ 30.6 2 63Cu2! 40 0.15B
12C5+ 50 3 84Krll + 5 4.5
14N2+ 5.4 14 84Krl !+ 6 83e14N3+ 10 1.9 84Kr19+ 15 0.5
14N4+ 20 30 129Xel7+ 6 59e'Ci 4N5+ 30 200 e 129Xe23+ 10 9 B14N5+ 35 90B 129Xe23+ 12.5 9 B14N6+ 40 7
14N6+ 43.4 5.7 181Ta16+ 2 0.45 B181Ta24+ 6 21B
V-]I4
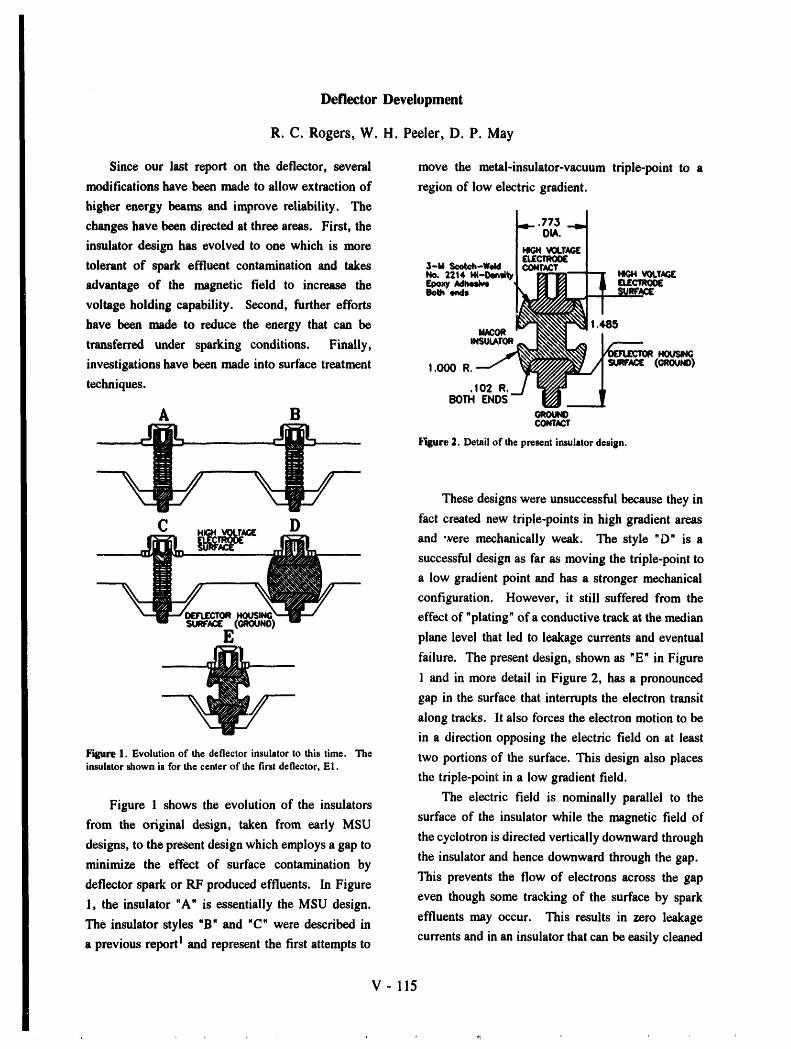
Deflector Development
R. C. Rogers, W. H. Peeler, D. P. May
Since our last report on the deflector, several move the metal-insulator-vacuum triple-point to a
modifications have been made to allow extraction of region of low electric gradient.
higher energy beams and improve reliability. The
changes have been directed at three areas. First, the _ .773I --IDIA.insulator design has evolved to one which is more [ tac_ V_t.TAr_[
I _txcmooc Itolerant of spark effluent contamination and takes 3-u Seetah-W,kl I¢O_r_t /
No. 2214 Hi-Oendtyl _ --'-l--"g _ _OLT_advantage of the magnetic field to increase the ¢poxx,_,_,. ,t lfd I I • txxcmoo(
voltage holding capability. Second, further efforts be, .rids !_ .___.IT _m'_x1.485have been made to reduce the energy that can be tlACO_
transferred under sparking conditions. Finally, wsuu__ _
investigations have been made into surface treatment 1.000 R, _'" _'s_,_ _/] _';_¢t (cm_uso)techniques. .!02 I_.__/
eOTHENOS--COtfhtCr
[_T_ure_I, Detail of the present insulatordesign.
Thesedesignswere unsuccessfulbecausethey in
C D titct created new triple-points in high gradient areas
_lt__ _ and ,vere mechanically weak. The style "D" is a
successful design as far as moving the triple-point to
a low gradient point and has a stronger mechanical
configuration. However, it still suffered from the
effect of "plating" of a conductive track at the median
E plane level that led to leakage currents and eventual
failure. The present design, shown as "E" in Figure
1 and in more detail in Figure 2, has a pronounced
gap in the surface that interrupts the electron transit
along tracks. It also forces the electron motion to be
in a direction opposing the electric field on at least
letgure 1. Evolution of the deflector insulator to this time. The two portions of the surface. This design also placesinsulator shown is for the center of the first deflector, El.the triple-point in a low gradient field.
The electric field is nominally parallel to theFigure 1 shows the evolution of the insulators
surface of the insulator while the magnetic field offrom the original design, taken from early MSU
the cyclotron is directed vertically downward throughdesigns, to the present design which employs a gap to
the insulator and hence downward through the gap.minimize the effect of surface contamination by
This prevents the flow of electrons across the gapdeflector spark or RF produced effluents. In Figureeven though some tracking of the surface by spark1, the insulator "A" is essentially the MSU design.effluents may occur. This results in zero leakageThe insulator styles "B" and "C" were described incurrents and in an insulator that can be easily cleaned
a previous report ! and represent the first attempts to
V- 115
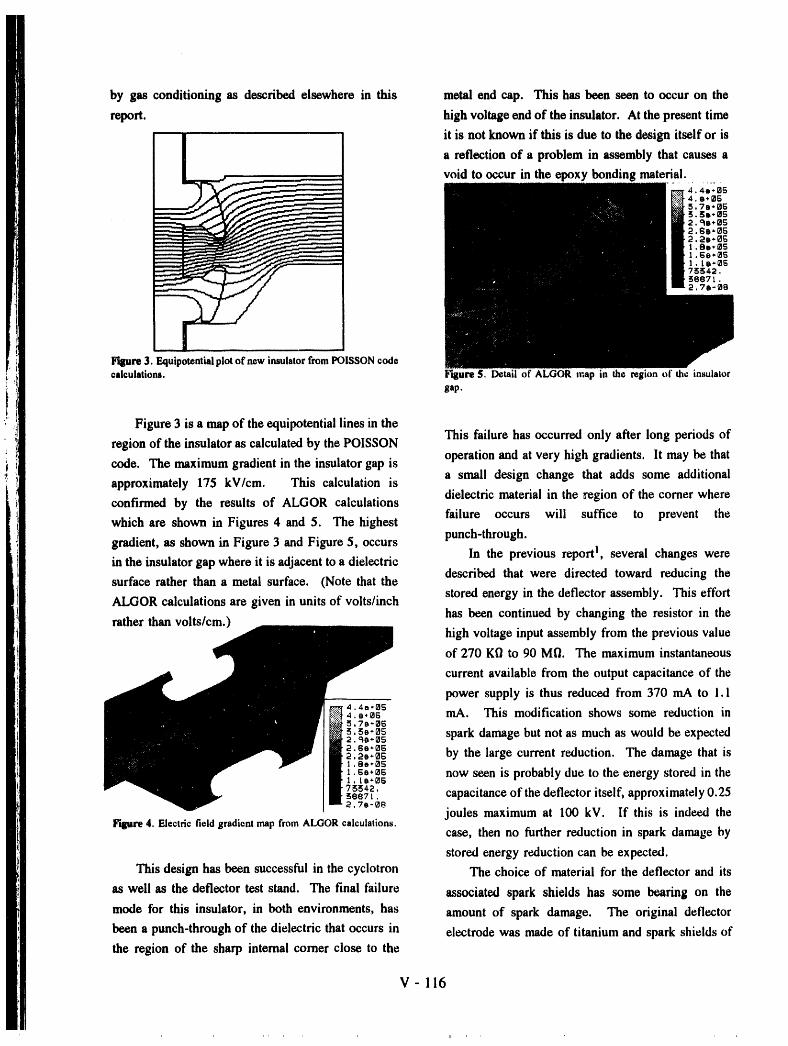
by gas conditioning as described elsewhere in this metal end cap. This has been seen to occur on the
report, high voltage end of the insulator. At the present time
it is not known if this is due to the design itself or is
a reflection of a problem in assembly that causes a
void to occur in the epoxy bonding material.4 4o-054 ¢, 065 70*06$ $,-052 qe*os2 6S.05
!, Be* OS
1, IB*OE7_42._007 t.2.7e-08
l_re 3. Equipotentialplotof newinsulatorfromPOISSONcodecalculations. Hgure $. Detailof ALGERmap in the regionof the insulator
gap.
Figure 3 is a map of the equipotential lines in theThis failure has occurred only after long periods of
region of the insulator as calculated by the POISSON
code. The maximum gradient in the insulator gap is operation and at very high gradients. It may be thata small design change that adds some additional
approximately 175 kV/cm, This calculation isdielectric material in the region of the corner where
confirmed by the results of ALGER calculationsfailure occurs will suffice to prevent the
which are shown in Figures 4 and 5. The highestpunch-through.
gradient, as shown in Figure 3 and Figure 5, occursIn the previous reportI, several changes were
in the insulator gap where it is adjacent to a dielectricdescribed that were directed toward reducing the
surface rather than a metal surface. (Note that thestored energy in the deflector assembly. This effort
ALGER calculations are given in units of volts/inch
rather than volts/era.) has been continued by changing the resistor in thehigh voltage input assembly from the previous value
of 270 Kf_ to 90 MfL The maximum instantaneous
current available from the output capacitance of the
power supply is thus reduced from 370 mA to !. 14.4a-0S•_.,.0_ mA. This modification shows some reduction in5,7a-OE
_, _a-es spark damage but not as much as would be expected2. q8*0S2.G6-062,_,o,._g by the large current reduction. The damage that is1 .8e_0S
1. ss,os now seen is probably due to the energy stored in the1, te-06
7_4_.ses7t. capacitance of the deflector itself, approximately 0.252.70-00
joules maximum at 100 kV. If this is indeed theFigure 4. Electric field gradient map from ALGER calculations.
case, then no further reduction in spark damage by
stored energy reduction can be expected.
This design has been successful in the cyclotron The choice of material for the deflector and its
as well as the deflector test stand. The final failure associated spark shields has some bearing on the
mode for this insulator, in both environments, has amount of spark damage. The original deflector
been a punch-through of the dielectric that occurs in electrode was made of titanium and spark shields ofthe region of the sharp internal corner close to the
V- 116
tungsten or stainless steel were used. It has been The suggestion2,3 that like metals for the
suggested2'3 that using the same materialsfor both electrodeand spark shields are more successful has
gives a bettertoleran_ for sparkdamage. Further, led to orderingof stainless steel electrodes for the Elthe use of anodized electrode surfaces has been deflector. These will be micropolished and
suggested as a technique to reduce the amount of electropolishedalong with the stainless steel spark
sparkingaltogether, shields before testing in the test stand.Severalcombinationsof anodizedelectrodesand The glow discharge conditioning that was
sparkshields have been tried in the test stand. The mentioned above is accomplished by introducingafirst was the titanium electrode with a simple flow of dry oxygen into the test standat a rateto set
anodized surface. At the outset, the electrodewas the pressureto 40 - 100 microns. A negative d.c.
not capable of supporting voltages above 50 kV voltage is applied to the electrode to initiate the
without sparking. This was caused by a rough discharge. The pressureis adjustedto give a voltage
surface texture that results from anodizing. It was drop of about 750 volts across the discharge. At
found that this could be corrected by using a glow higher voltage levels the micro-sparkingthatoccurs
discharge in oxygen to smooththe high pointson the tends to concentratein some areas and damage the
surface. This cleaning techniqueis describedbelow, surface. At the level of 750 volts or below theAfter cleaning, the original anodized titanium micro-sparking is random and seems to simply
electrode supportedthe full 100 kV fora shortperiod remove points on the surface. A treatmenttime ofof time but then failed to the point of being able to one to three hours was required to give the best
supportonly 70 kV withoutexcessive sparking, voltage holding results.
Anodizedaluminumcoatingsonboththetitanium
electrode and an aluminumalloy electrode were also References
tested. In both cases a high purity aluminum
(99.99%) was applied to the electrode before 1. Progress in Research, 1990-1991, Cyclotron
anodizing. The high purity aluminum is required Institute,TAMU, p. 98.
because it was pointed out4 that anodizing of low 2. W. T. Diamond, Proceedings of the 13th
purity aluminum or aluminum alloys results in a hzternational Conference on Cyclotrons atut
crack structure in the surface that exposes the Their Applications (1992), p. 569.
underlying metal. The anodizing of high purity 3. W. T. Diamond, Workshop on High Voltage
aluminum results in a small grain structure surface Deflectors for supercmutucting cyclotrons,
that does not expose the substrate metal. The Cyclotron Institute, Texas A&M University,
anodizedaluminumsurfacealso neeMedto be treated Michigan State University Rept. MUSCP-66
with a glow discharge but was able to hold a higher (1992).
voltage before treatmentthan the anodized titanium 4. Mel Fall, TitaniumFinishingCo., P. O. Box 22,surface. In either case the anodized surfacesseem to 248 Main Street, East Greenville, PA 18041,
hold some promise of better voltage holding personalcommunication.
capabilitybut more testingwill be required.
V- 117
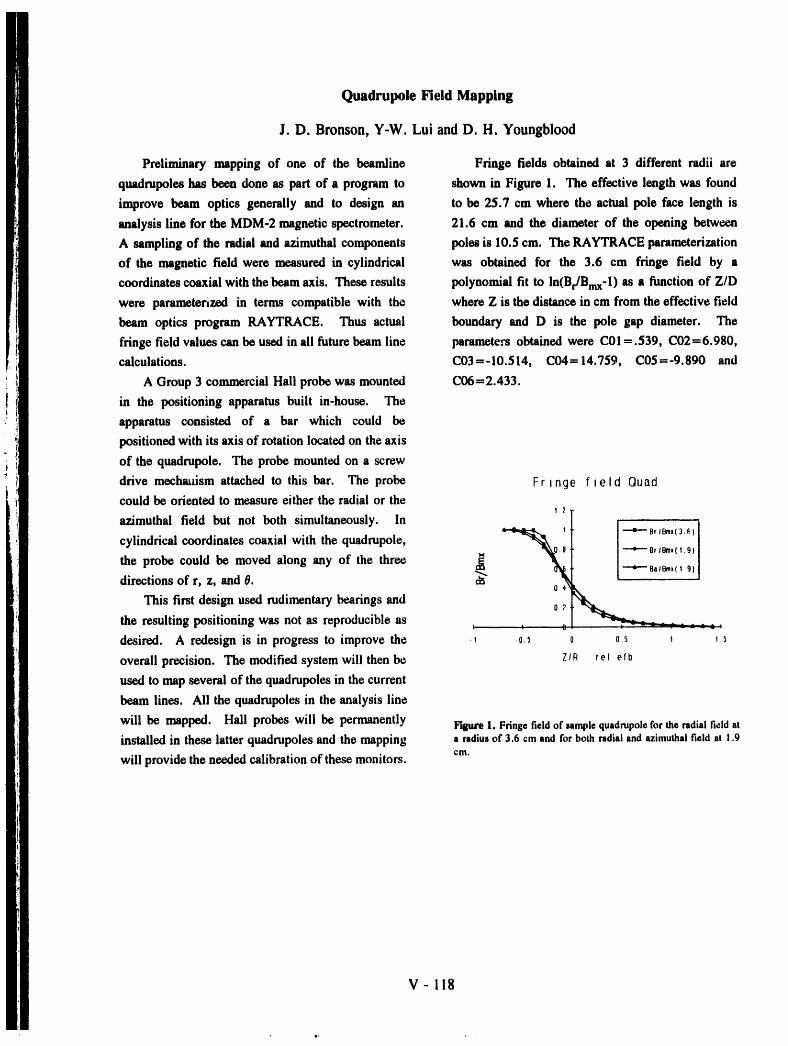
Quadrupole Field Mapping
J. D. Bronson, Y-W. Lui and D. H. Youngblood
Preliminary mapping of one of the boamline Fringe fields obtained at 3 different radii are
quadrupoles has been done as part of a program to shown in Figure I. The effective length was found
improve beam optics generally and to design an to be 25.7 cm where the actual pole face length is
analysis line for the MDM-2 magnetic spectrometer. 21.6 cm and the diameter of the opening between
A sampling of the radial and azimuthal components poles is 10.5 cm. The RAYTRACE parameterization
of the magnetic field were measured in cylindrical was obtained for the 3.6 cm fringe field by a
coordinates coaxial with the beam axis. These results polynomial fit to In(Br/Bmx-l) as a function of Z/D
were parameterized in terms compatible with the where Z is the distance in cm from the effective field
beam optics program RAYTRACE. Thus actual boundary and D is the pole gap diameter. The
fringe field values can be used in all future beam line parameters obtained were COl = .539, C02=6.980,
calculations. C03ffi-I0.514, C04-- 14.759, C05---9.890 and
A Group 3 commercial Hall probe was mounted C06=2.433.
in the positioning apparatus built in-house. The
apparatus consisted of a bar which could be
positioned with its axis of rotation located on the axis
of the quadrupole. The probe mounted on a screw
drive mechanism attached to this bar. The probe Fringe fie I d Ouadcould be oriented to measure either the radial or the
1 2
azimuthal field but not both simultaneously. In
cylindrical coordinates coaxial with the quadrupole, __'_ _ i -4-- B,iBm,i _e)_ Br/Brat(1.9)
the probe could be moved along any of the three _ _Bolem, I, 91directions of r, z, and 0. _"
This first design usedrudimentarybearingsand o 2 __
the resulting positioning was not as reproducible as , , , __ _ ._..... : :.desired. A redesign is in progress to improve the .1 -0.5 o.s _ ,5
overall precision. The modified system will then be zIR re I e Ib
used to map several of the quadrupoles in the current
beam lines. All the quadrupoles in the analysis line
will be mapped. Hall probes will be permanently i_ure 1. Fringe field of sample quadrupole for the radial field at
installed in these latter quadrupoles and the mapping a radius of 3.6 cm and for both radial and azimuthal field a! 1.9
will provide the needed calibration of these monitors, cm.
V-II8
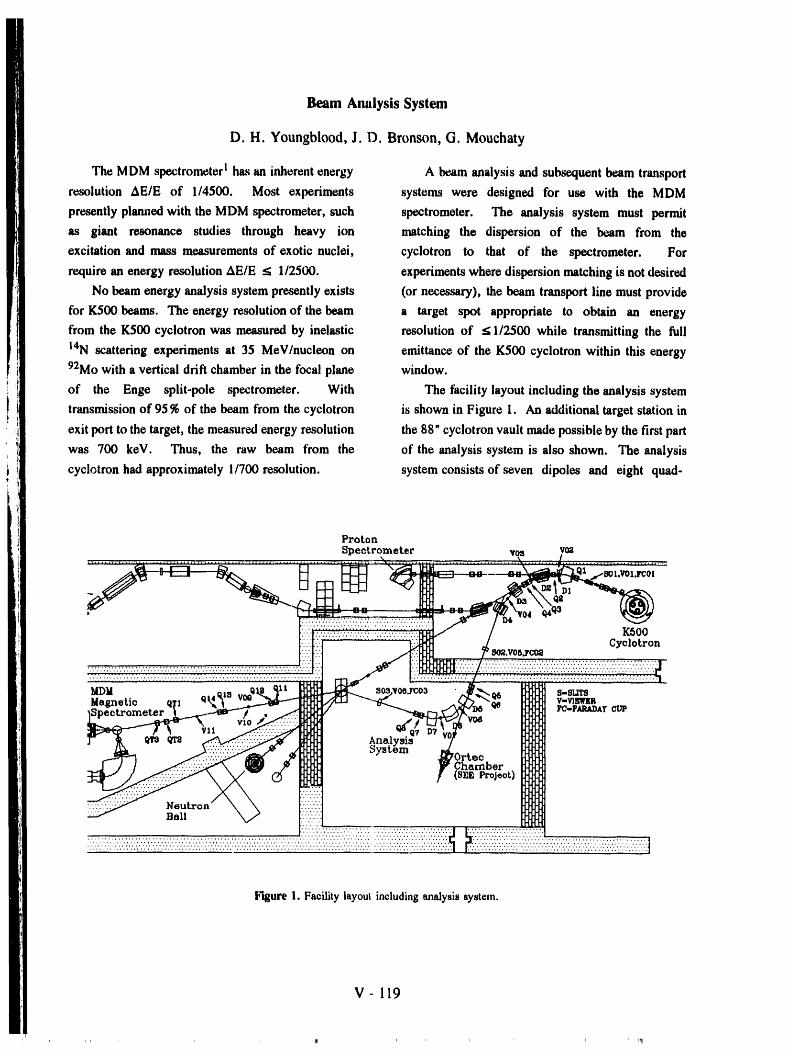
Beam Analysis System
D. H. Youngblood, J. D. Bronson, G. Mouchaty
The MDM spectrometerI hasan inherentenergy A beam analysisand subsequentbeam transport
resolution AE/E of 1/4500. Most experiments systems were designed for use with the MDM
presentlyplannedwith the MDM spectrometer,such spectrometer. The analysis system must permitas giant resonance studies through heavy ion matching the dispersion of the beam from the
excitation and mass measurementsof exotic nuclei, cyclotron to that of the spectrometer. For
requirean energy resolutionAE/E _ 1/2500. experimentswhere dispersionmatchingis not desired
No beamenergy analysissystempresentlyexists (or necessary), the beam transportline must provide
for K500 beams. The energyresolutionof the beam a target spot appropriate to obtain an energyfrom the K500 cyclotron was measuredby inelastic resolution of < 1/2500 while transmittingthe full
14N scattering experiments at 35 MeV/nucleon on emittance of the K500 cyclotron within this energy92Mowith a vertical driftchamberin the focal plane window.
of the Enge split-pole spectrometer. With The facility layout includingthe analysis systemtransmissionof 95 % of the beam from the cyclotron is shown in Figure 1. Anadditionaltarget station in
exit port to thetarget, the measuredenergyresolution the 88" cyclotronvault madepossible by thefirstpart
was 700 keV. Thus, the raw beam from the of the analysis system is also shown. The analysis
cyclotronhad approximately1/700 resolution, systemconsists of seven dipoles and eight quad-
Figure 1. Facility layout including analysis system.
V- 119
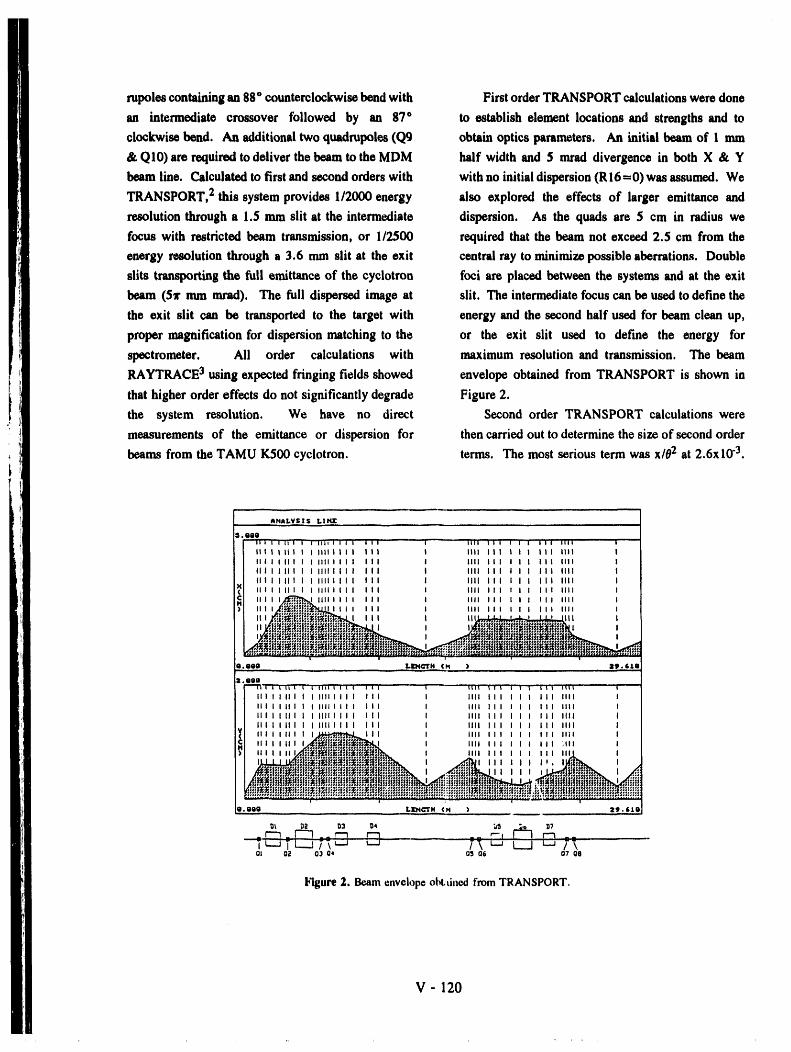
rupoles containing an 88° counterclockwise bend with First order TRANSPORT calculations were done
an intermediate crossover followed by an 87 ° to establish element locations and strengths and to
clockwise bend. An additional two quadrupoles (Q9 obtain optics parameters. An initial beam of 1 nun
& QI0) are required to deliver the beam to the MDM half width and 5 mrad divergence in both X & Y
beam line. Calculated to first and second orders with with no initial dispersion (R l 6 ffi0) was assumed. We
TRANSPORT, 2 this system provides 1/2000 energy also explored the effects of larger emittance and
resolution through a 1.5 mm slit at the intermediate dispersion. As the quads are 5 cm in radius we
focus with restricted beam transmission, or 1/2500 required that the beam not exceed 2.5 cm from the
energy resolution through a 3.6 mm slit at the exit central ray to minimize possible aberrations. Double
slits transporting the full emittance of the cyclotron foci are placed between the systems and at the exit
beam (5f mm mrad). The full dispersed image at slit. The intermediate focus can be used to define the
the exit slit can be transported to the target with energy and the second half used for beam clean up,
proper magnification for dispersion matching to the or the exit slit used to define the energy for
spectrometer. All order calculations with maximum resolution and transmission. The beam
RAYTRACE 3 using expected fringing fields showed envelope obtained from TRANSPORT is shown in
that higher order effects do not significantly degrade Figure 2.
the system resolution. We have no direct Second order TRANSPORT calculations were
measurements of the emittance or dispersion for then carried out to determine the size of second order
beams from the TAMU K500 cyclotron, terms. The most serious term was x/02 at 2.6x10 -3.
AI'4ALVS I S L I I'OC
5. 000
It I ItI I IIII l IIII 1111
II I III I IIII I IIII IIII
II I III I IIII I IIII IIII
II fill I llll l llll llll
lilili iiil , ,o.ooo l.]mc'r x (It ) Z_;. 6 J,ll
:i, ilOcl
,, u llJs,i,i ,i ,,, , i ,,,,II II lllil I I I II Ill I I llllII II lllil I I I II III I I I'IIII II lllilll I II III I I IIII
II., II _,_ III I i _III
'" •...._, V..'_i,.-'_i!il................. _::*_:{°I"*' ° °°° • '
• . leo LI_IqG'I'H (M )
r-3_r'-I _._c___ r-1 :: e--_Ot 02 03 04 (_J 06 07 O0
Figure 2. Beam envelope obtdned from TRANSPORT.
V- 120
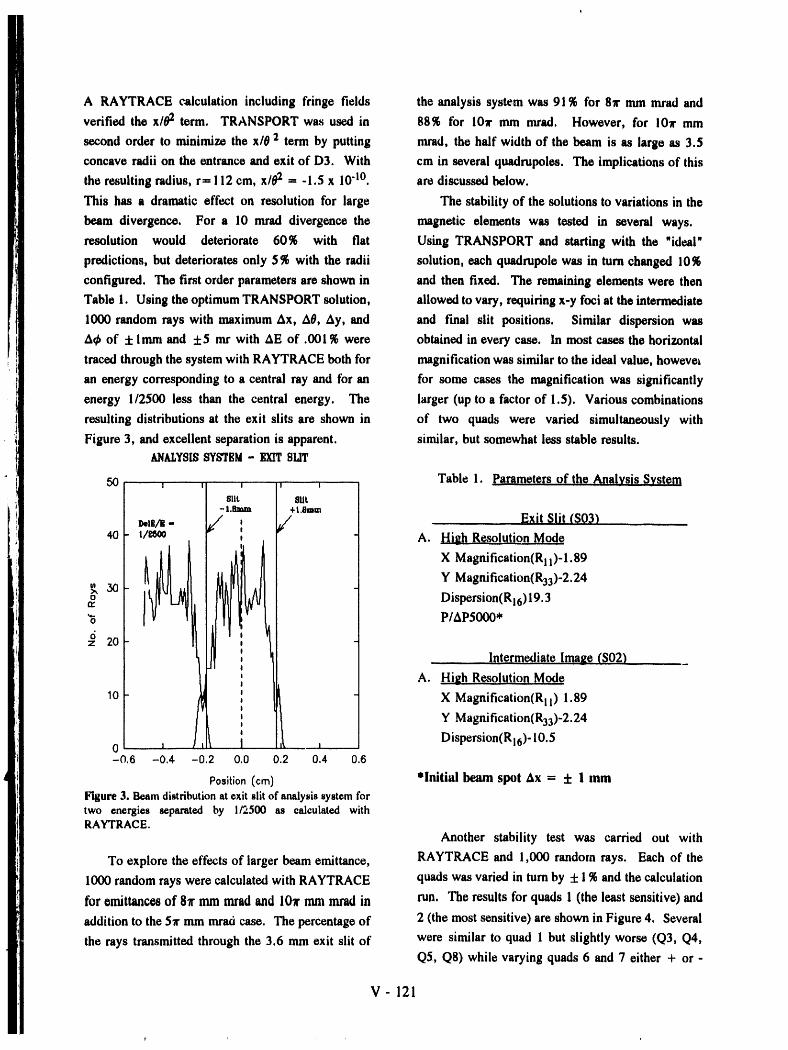
A RAYTRACE calculation including fringe fields the analysis system was 91% for 87r mm mrad and
verified the x/02 term. TRANSPORT was used in 88% for 10T mm mrad. However, for lOT mm
second order to minimize the x/0 2 term by putting mrad, the half width of the beam is as large as 3.5
concave radii on the entrance and exit of D3. With cm in several quadrupoles. The implications of this
the resulting radius, r- i 12 cm, x/02 - -1.5 x 10"10. are discussed below.
This has a dramatic effect on resolution for large The stability of the solutions to variations in the
beam divergence. For a 10 mrad divergence the magnetic elements was tested in several ways.
resolution would deteriorate 60% with flat Using TRANSPORT and starting with the "ideal"
predictions, but deteriorates only 5_ with the radii solution, each quadrupole was in turn changed 10%
configured. The first order parameters are shown in and then fixed. The remaining elements were then
Table 1. Using the optimum TRANSPORT solution, allowed to vary, requiring x-y foci at the intermediate
1000 random rays with maximum _x, A0, Ay, and and f'mal slit positions. Similar dispersion was
n_ of :i: lmm and +5 mr with AE of .001% were obtained in every case. In most cases the horizontal
traced through the system with RAYTRACE both for magnification was similar to the ideal value, howeve_
an energy corresponding to a central ray and for an for some cases the magnification was significantly
energy 1/2500 less than the central energy. The larger (up to a factor of 1.5). Various combinations
resulting distributions at the exit slits are shown in of two quads were varied simultaneously with
Figure 3, and excellent separation is apparent, similar, but somewhat less stable results.DIM,YS[$S'YgIRM- EXITBUT
50 [ , '[ , [' _ Table 1. Parameters of the Analysis Svsten]I I mlt I Slit.I I -t.sau_ I +t.e-mI D,IB/B- I,/ ' I,/ Exit Slit (S03)
40 I- t/_ _" ', [" " A. Hieh Resolution Moc[e| J' ,,
X Magnification(R 11)"1.89Y Magnification(R33)-2.24_,30o [ Dispersi°n(R 16)19.3"6 [ P/AP5000*
:_ 20
Intermediate Image (S02)
A. High Resolqtion Mode
10 - X Magnification(R !1) 1.89
Y Magnification(R33)-2.24
Dispersion(R 16)-10.50 J-0.6 -0.4 -0.2 0.0 0.2 0.4 0.6
Position(crn) *Initial beam spot Ax = 5:1 mmFigure3. Beamdistributionatexitslitof analysissystemfortwo energiesseparatedby 1/2500 as calculatedwithRAYTRACE.
Another stability test was carried out with
To explore the effectsof larger beam emittance, RAYTRACE and 1,000 random rays. Each of the
1000 randomrays were calculatedwith RAYTRACE quadswas varied in turn by + 1% and thecalculation
for emittances of 81"mm mrad and 10_r nan mrad in run. The results for quads 1 (the least sensitive) and
addition to the 5_rmm mrad case. The percentage of 2 (the most sensitive) are shown in Figure 4. Several
the rays transmitted through the 3.6 mm exit slit of were similar to quad 1 but slightly worse (Q3, Q4,QS, Q8) while varying quads 6 and 7 either + or -
V- 121
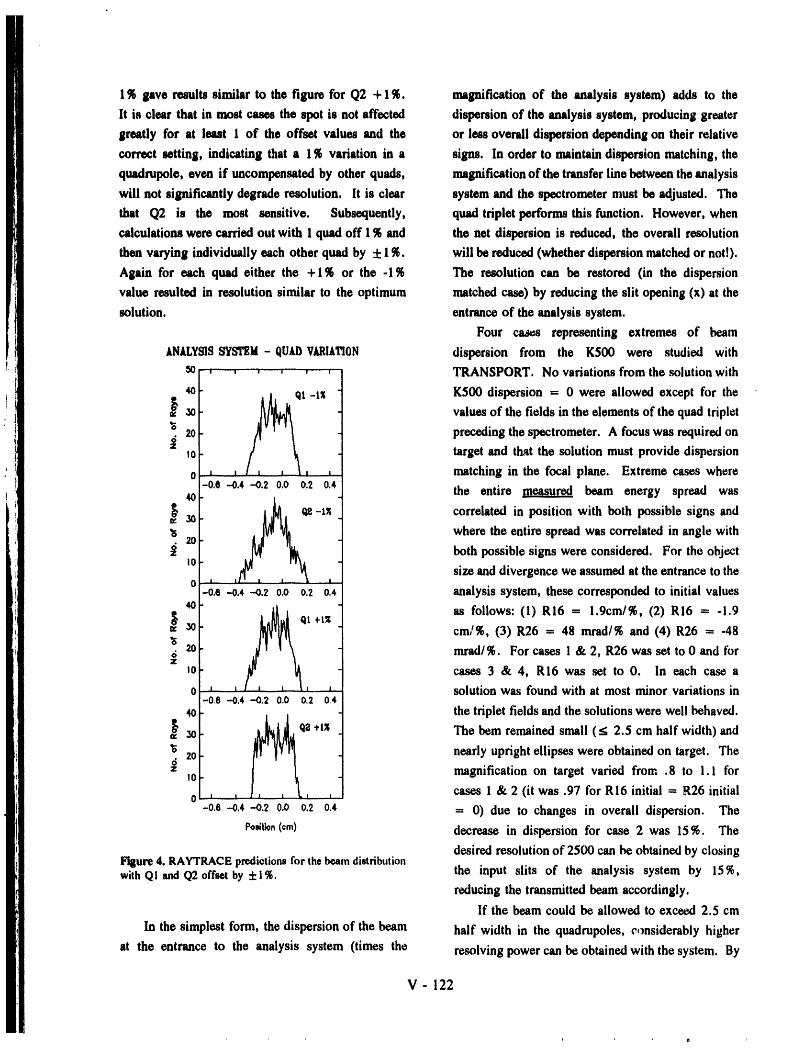
1% gave results similar to the figure for Q2 + 1_. magnification of the analysis system) adds to the
It is clear that in most cases the spot is not affected dispersion of the analysis system, producing greater
greatly for at least 1 of the offset values and the or less overall dispersion depending on their relative
correct setting, indicating that a 1 _ variation in a signs. In order to maintain dispersion matching, the
quadrupole, even if uncompensated by other quads, magnification of the transfer line between the analysis
will not significantly degrade resolution. It is clear system and the spectrometer must be adjusted. The
that Q2 is the most sensitive. Subsequently, quad triplet pefforms this function. However, when
calculations were carried out with 1 quad off 1% and the net dispersion is reduced, the overall resolution
then varying individually each other quad by :t:1_. will be reduced (whether dispersion matched or not!).
Again for each quad either the +1% or the -1% The resolution can be restored (in the dispersion
value resulted in resolution similar to the optimum matched case) by reducing the slit opening (x) at the
solution, entrance of the analysis system.
Four _ representing extremes of beam
ANALYSISSYSTEM- QUArtVARIATION dispersion from the K500 were studied withso , .... , TRANSPORT. No variations from the solution with
40 ___A_i qx,_tz K500 dispersion = 0 were allowed except for the
_o values of the fields in the elements of the quad triplet
'_. 20 preceding the spectrometer. A focus was required on
10 target and that the solution must provide dispersion
0 i , , matching in the focal plane. Extreme cases where
-o.e-0.4-0.2 0.0 0.2 0.4 the entire measured beam energy spread was
_-Ix correlated in position with both possible signs and
where the entire spread was correlated in angle with
both possible signs were considered. For the object
10 size and divergence we assumed at the entrance to the0 I P t
-0.e -e.4 -0.z o.o 0.z 04 analysis system, these corresponded to initial values
40 _ql as follows:(l) Rl6- 1.9cml% (2) R16 = -1.9
u_ 30 cm/%, (3) R26 = 48 mrad/% and (4) R26 = -48
. 20 mrad/% For cases 1 & 2, R26 was set to 0 and forOz
1o cases 3 & 4, RI6 was set to 0. In each case a
0 t , , solution was found with at most minor variations in-06 -0.4 -0.2 0.0 0.2 0.4
40 the triplet fields and the solutions were well behaved.
_3o _ql "_lx The bem remained small (< 2.5 cm half width) and
20 nearly upright ellipses were obtained on target. The
10 magnification on target varied from .8 to I. 1 for
0 i , , cases 1 & 2 (it was .97 for RI6 initial = R26 initial-0.e .-o.4 -0.2 0.0 0.2 o.4 = 0) due to changes in overall dispersion. The
Polltbn (ore) decrease in dispersion for case 2 was 15%. The
desired resolution of 2500 can be obtained by closingFigure 4. RAYTRACEpredictionsfor the beamdistributionwith QI and Q2off.et by +1%. the input slits of the analysis system by 15%,
reducing the transmitted beam accordingly.
If the beam could be allowed to exceed 2.5 cm
In the simplest form, the dispersion of the beam half width in the quadrupoles, c,msiderably higher
at the entrance to the analysis system (times the resolving power can be obtained with the system. By
V - 122
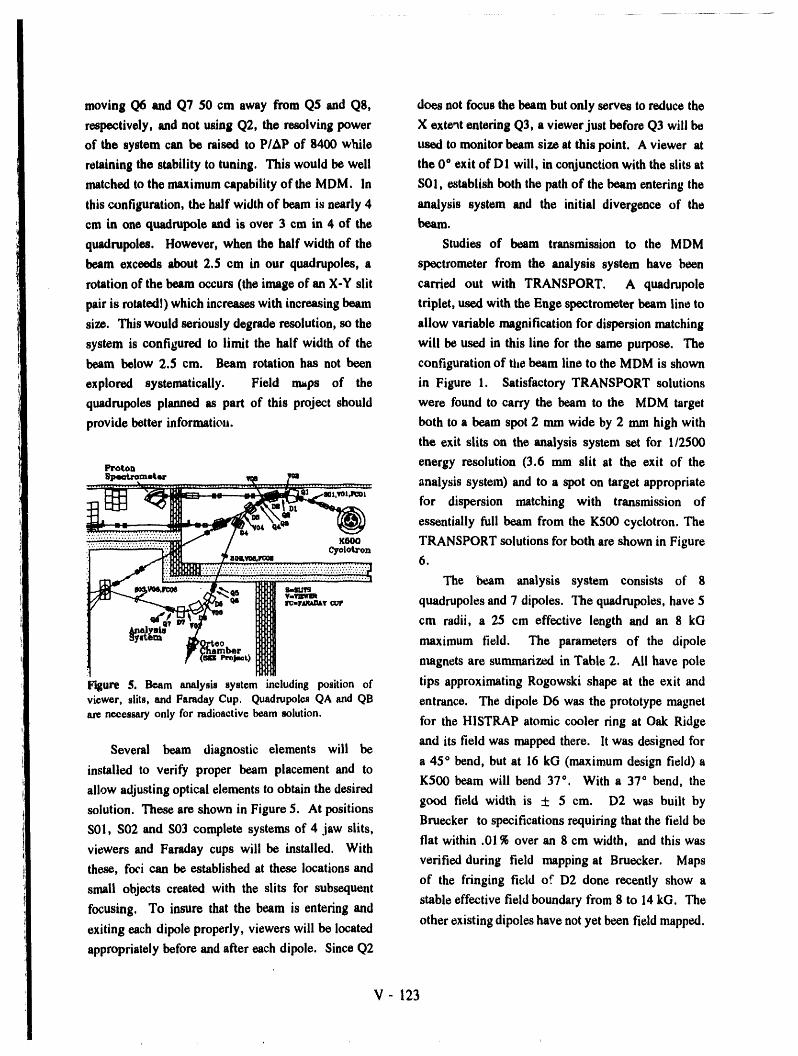
moving Q6 and Q7 50 cm away from Q5 and Qg, doe,s not focus the beam butonly serves to reduce the
respectively, and not using Q2, the resolving power X exte'_tentering Q3, a viewer just before Q3 will be
of the system can be raised to p/Ap of 8400 while used to monitor beam size at this point. A viewer at
retaining the stability to tuning, This would be well the 0 ° exit of DI will, in conjunction with the slits at
matched to the maximum capability of the MDM. in SOl, establish both the path of the beam entering the
this configuration, the half width of beam is nearly 4 analysis system and the initial divergence of the
cm in one quadrupole and is over 3 cm in 4 of the beam.
quadrupoles. However, when the half width of the Studies of beam transmission to the MDM
beam exceeds about 2.5 cm in our quadrupoles, a spectrometer from the analysis system have been
rotation of the beam occurs (the image of an X-Y slit carried out with TRANSPORT. A quadrupole
pair is rotated1) which increases with increasing beam triplet, used with the Enge spectrometer beam line to
size. This would seriously degrade resolution, so the allow variable magnification for dispersion matching
system is configured to limit the half width of the will be used in this line for the same purpose. The
beam below 2.5 cm. Beam rotation has not been configuration of the beam line to the MDM is shown
explored systematically. Field maps of the in Figure 1. Satisfactory TRANSPORT solutions
quadrupoles planned as part of this project should were found to carry the beam to the MDM target
provide better information, both to a beam spot 2 mm wide by 2 mm high with
the exit slits on the analysis system set for 1/2500
pretoa energy resolution (3.6 mm slit at the exit of the
_ ......_.......... _,......,,,_...,,._...._..........._..._,.,........j........,,,:_...,.............. analysis system) and to a spot on target appropriate-- _ _ _ --i: - - ----- \ _ :"r'_ I_t ...-801.'_01_!
..... fordi po,' tonn,ohtng,,,t,h,mi iooof_. me_,_ n _me'4_%'_,",_ _).} essentially full beam from the K500 cyclotron. The
_:i:i:i:!:ii!i_i:!'i:i:i:!:!!:i:i:i!___ "_ "" _ TRANSPORT solutions for both are shown in Figure"_........""'"'"""--'='-"i:._l__/ ___ cyolotron
,-,-, The beam analysis system consists of 8
_"_____ q* _ _.,--._ quadrupoles and 7 dipoles. The quadrupoles, have 5
aly_/my, _e _ cm radii, a 25 cm effective length and an 8 kG
_Y_tl_'_m_'__,e_ber _ maximum field. The parameters of the dipole
t' ("_ e,._,.) [_ nmgnets are summarized in Table 2. All have pole[NHt41
Figure 5. Beam analysis system including position of tips approximating Rogowski shape at the exit andviewer, slits, and FaradayCup. QuadnJpolesQA and QB entrance. The dipole D6 was the prototype magnetare necessaryonly for radioactivebeamsolution.
for the HISTRAP atomic cooler ring at Oak Ridge
and its field was mapped there. It was designed forSeveral beam diagnostic elements will be
a 45 ° bend, but at 16 kG (maximum design field) ainstalled to verify proper beam placement and to
K500 beam will bend 37°. With a 37 ° bend, theallow adjusting optical elements to obtain the desired
solution. These are shown in Figure 5. At positions good field width is + 5 cm. D2 was built byBruecker to specifications requiring that the field be
S01, S02 and S03 complete systems of 4 jaw slits,flat within .01% over an 8 cm width, and this was
viewers and Faraday cups will be installed. Withverified during field mapping at Bruecker, Mapsthese, foci can be established at these locations andof the fringing field of D2 done recently show a
small objects created with the slits for subsequentstable effective field boundary from 8 to 14 kG. The
focusing, To insure that the beam is entering and
exiting each dipole properly, viewers will be located other existing dipoles have not yet been field mapped.
appropriately before and after each dipole. Since Q2
V- 123
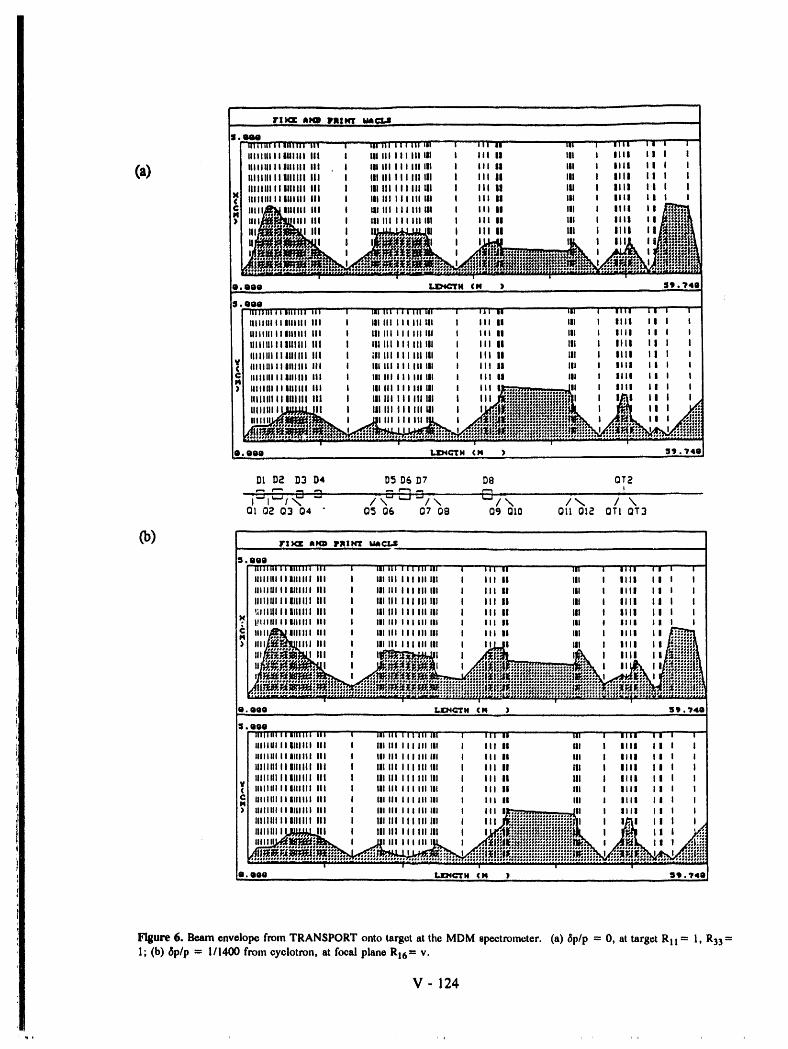
rI_,_ m_ pm wr _ct, s
(51) I lllllllllllllllll III . 181111 IIIIII III II III iiii I I I IJ IIIIIIIIIIIIIIIII !I! III III III III III II III IIII I I I I_J IIIIIIIIIIIIIIIII III III Ill III III III U III IIII II I I
_i lllllllllllllllll III IIIIII IIIIII III II ill IIII ii I I.._I lllil_lllllll III IIIIIII III III III II III IIII !I)I t,J_ILr:._. ,,,, Ill Iii iii iii iii III u iii iiii It _.i_
o.ooo _x (M ) S9 •74....._8J
S, 000
i
I I I _4iii
o,ooo t.x::x,_-rx (_ ) 55_._40
DL D_ D3 D4 D5 D6 D7 D8 OT2.,,., --_ _ i
O! 02 Q3 04 " 05 06 07 08 09 OlO Oil O!Z OTt OT3
Co) ,,>lX ,,,W ,II,NI .¢LS ........_J•O@O
llllllli lllJlllll ill i Ill Ji| Ill Ill ill" I Jl| li" ]]1] i iiil [I J J
lllllllllll|tllll III I llllll lllllltll I III II III I llll II I IIIIIIIIIIIIIIIIII III I llJlll lllllllil I III II ill I IIII II I I!_Jllllllllllllll III I IIIIII llllllllJ I III II III I IIII II I I
lllll_lllllll III I illlll III lllill I II! II III I IIII II) llll_.#..._l_lllll III I III lli III lil lli I llJ....Jl III I IIII I I _
IIl_,_j_l_t"_l III I t_l I _Ji_l IlJj_. I IIII I I ,_J,'_!iJ_
N @i !i ilJJJll!il!iil!iiii!!!iiHiilJi!l iH iNiiiiillilii l l ! i
2J, IOI'"lJlJllllllillllll Ill '"l 1111111illllilll ' i Ill Re Ill I Rill II i i
IIIit111111111111III I IIIIII IIii11111 I III II III I IIII II I IIIIIIIIIIIIIIIIII III I IIIIII IIIIIIIII I III II III I IIII II I Ii1111111111111111|11 I IIIIII IIIIIIIII I III II III I IIII II I IIIIIIIIIIIIIIIIII III I IIIIII IIIIIIIII I III II III I IIII II I I
(_ IIIIIIIIIIIIIIIII III I IIIIII IIIIIllll I III II III I III! II I IIIIIIIIIIIIIIIiil III I IIIIII IIIIIIIII I III II III I II11 II I I
) IIIIIIIIIIIIIIIII III I IIIIII IIIIIIIII I III I_11 I IIII II I I I,,,,,,,,,,,,,,,,,,,, ,,,,,,,,,,,,,,,i ,___.,, , ,_,,,, ,
!
__' _I'"''"'"'_ '.,'__i_ '_ '''_!iii, , , , , , .:.:iiiiil.... , ........ , ........ ;................. ,.... ! ..................... ; .......
O.OOO LENt1' X (_ ) "J'). 74tl
Figure 6. Beam envelope from TRANSPORT onto target at the MDM spectrometer. (a) _p/p = 0, at target RII = I, R33 =I; (b) 8p/p - 1/1400 from eyelotron, at focal plane RI6-" v.
V - 124
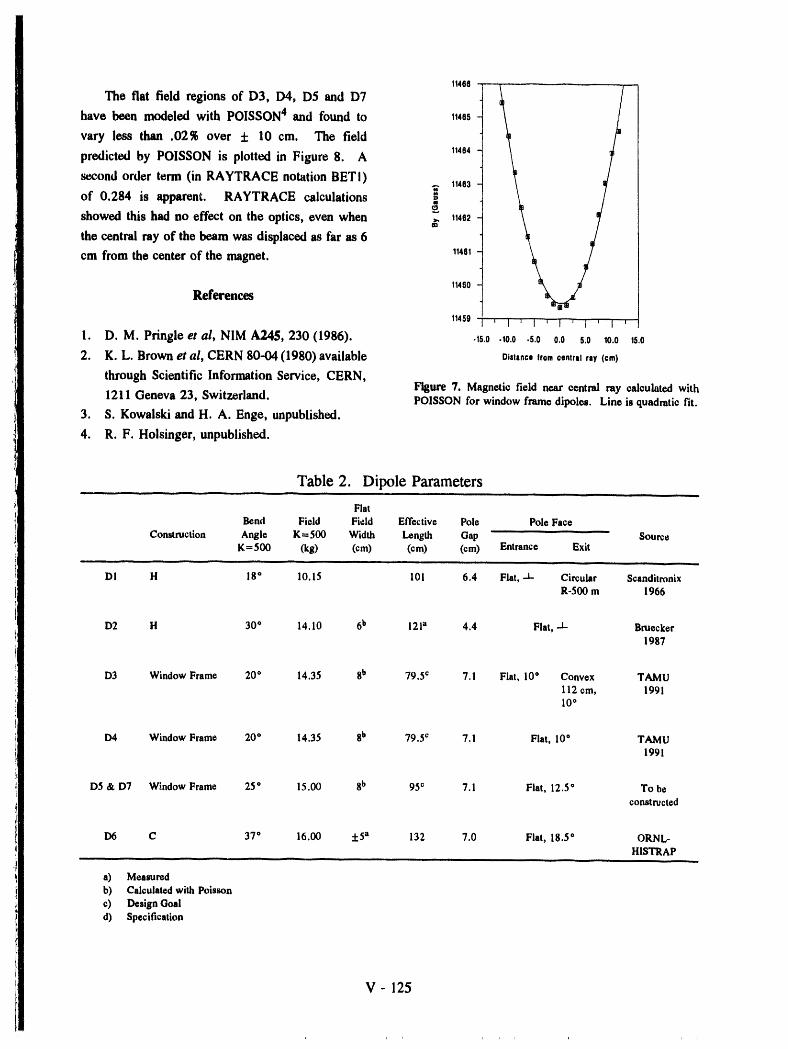
11488 ,,
The flat field regions of D3, D4, D5 and D7
have been modeled with POISSON 4 and found to 11485
vary less than .02% over ± 10 cm. The field
predicted by POISSON is plotted in Figure 8. A 11484
second order term (in RAYTRACE notation BET I) _. 11483
of 0.284 is apparent. RAYTRACE calculations ,_
showed this had no effect on the optics, even when Z 11482the central ray of the beam was displaced as far as 6
cm from the center of the magnet. 11481
11480References
11459 ' '1' ' I ' I ' i ' I '
1. D.M. Pringle et al, NIM A245, 230 (1986). .ls.o .lO.O.s.o o.o s.o lo.o lS.O
2. K.L. Brown et al, CERN 80-04 (1980) available Distance from central ray (Qm)
through Scientific Information Service, CERN,Figure 7. Magnetic field near central ray calculated with
1211 Geneva 23, Switzerland. POISSON for window frame dipoles. Line is quadratic fit.3. S. Kowalski and H. A. Enge, unpublished.
4. R.F. Hoisinger, unpublished.
Table 2. Dipole Parameters
Flat
Bend Field Field Effective Pole Pole Face
Construction Angle K = 500 Width Length Gap SourceK=500 (kg) (cm) (cm) (cm) Entrance Exit
DI H 18" 10.15 101 6.4 Flat, -J- Circular ScanditronixR-500 m 1966
D2 H 30* 14.10 6b 121a 4.4 Flat, -J- Bruecker1987
D3 Window Frame 20 ° 14.35 8b 79.5 ¢ 7.1 Flat, 10" Convex TAMU112 cm, 199110"
D4 Window Frame 20* 14.35 8b 79.5 c 7.1 Flat, 10" TAMU1991
D5 & D7 Window Frame 25* 15.00 8b 95 c 7.1 Flat, 12.5" To be
constructed
i)6 C 37* 16.00 +5 a 132 7.0 Flat, 18.5 ° ORNL-HISTRAP
a) Measuredb) Calculated with Poisson
c) Design Goald) Specification
V- 125
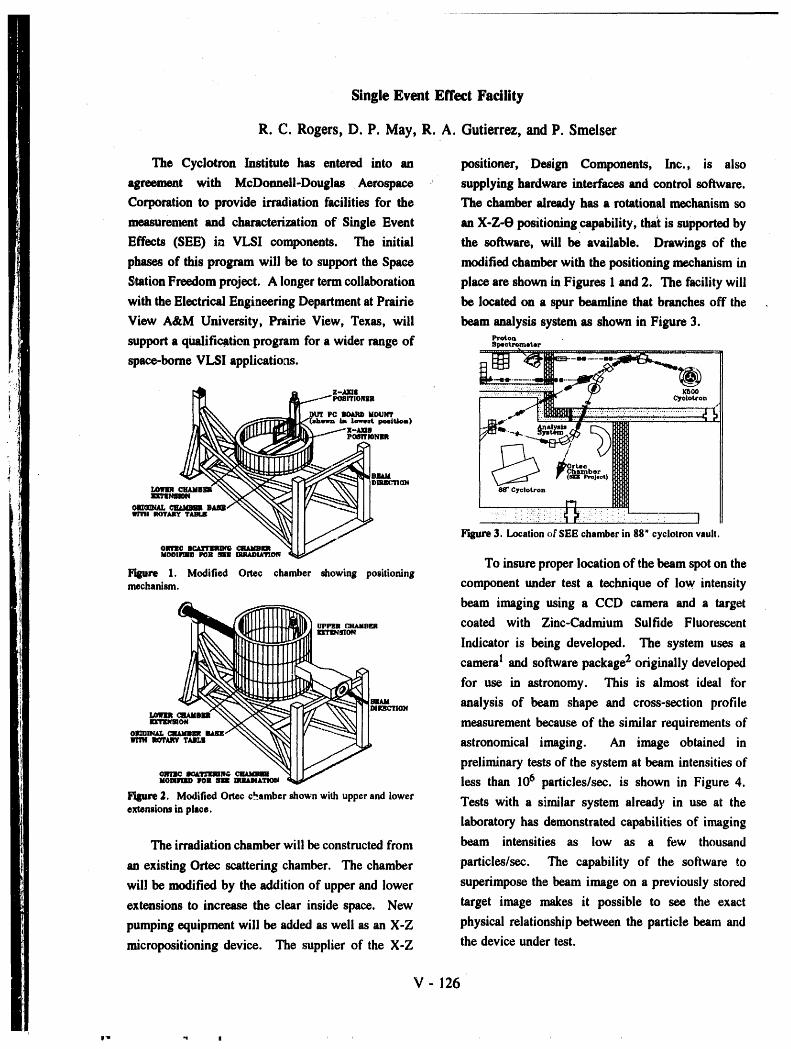
Single Event Effect Facility
R. C. Rogers, D. P. May, R. A. Gutierrez, and P. Smelser
The Cyclotron Institute has entered into an positioner, Design Components, Inc., is alsoagreement with McDonnell-Douglas Aerospace supplyinghardwareinterfaces and control software.
Corporationto provide irradiationfacilities for the The chamberalreadyhas a rotationalmechanismso
measurement and characterization of Single Event an X-Z-O positioningcapability, that is supportedby
Effects (SEE) in VLSI components. The initial the software, will be available. Drawings of the
phases of this program will be to support the Space modifiedchamberwith the positioning mechanism in
StationFreedomproject. A longer termcollaboration place are shown in Figures 1 and 2. The facilitywillwiththe ElectricalEngiaeeringDepartmentat Prairie be located on a spur beamline that branchesoff the
View A&M University, Prairie View, Texas, will beam analysis system as shown in Figure 3.
support a qualifi_tion program fora wider rangeof e._on81metrom,tor............... __,................................................. ,.,,,,,,.,,,,, . ,
space-borne VLSI applications, t_.--,_[_--__..__" -""--":i_i_!::!:!:!!:!:i_i'!:............._!=i_i_:i:!ii:::ii.-_._ (?.,) K_,oo
POBITIONIIR
_,L_(=lMnm Im lowtst peeiUem) l'J_ at It
I 88" Cyclotron l]]qJ_
OII_IMAL _ IIMIII
F'qpwe 3. Locationof SEE chamberin 88" cyclotronvault,olrrJ_ II_ CIKtMIIBMOOIIqlID ItO=t _ DUIADIATIOtN
To insureproperlocationof thebeamspot on theFigure 1. Modified Ortec chamber showing positioningmechanism, componentunder test a technique of low intensity
beam imaging using a CCD camera and a target_aau, am, coated with Zinc-Cadmium Sulfide Fluorescent
Indicator is being developed. The system uses a
camera! and softwarepackage2 originally developed
for use in astronomy. This is almost ideal for!ea,,a analysis of beam shape and cross-section profileIMIUtC'nO_
l,eflnm
mxmo, measurementbecause of the similar requirementsofOI_INAL _IAMBII_ maim.
_n_,.avT,_.s astronomical imaging. An image obtained in
preliminarytestsof the system at beam intensitiesofIJCO..TIIDnI_.
-osmm_o,,sm aemm,_ less than 106 particles/sec, is shown in Figure 4.
Figure 2. ModifiedOrtecc_ambershownwith upper and lower Tests with a similar system already in use at theextensions in place.laboratory has demonstratedcapabilities of imaging
The irradiationchamberwill be constructedfrom beam intensities as low as a few thousand
an existing Ortec scattering chamber. The chamber particles/sec. The capability of the software towill be modified by the addition of upper and lower superimpose the beam image on a previously stored
extensions to increase the clear inside space. New target image makes it possible to see the exact
pumping equipment will be added as well as an X-Z physical relationshipbetween the particle beam andmicropositioning device. The supplier of the X-Z the device under test.
V- 126
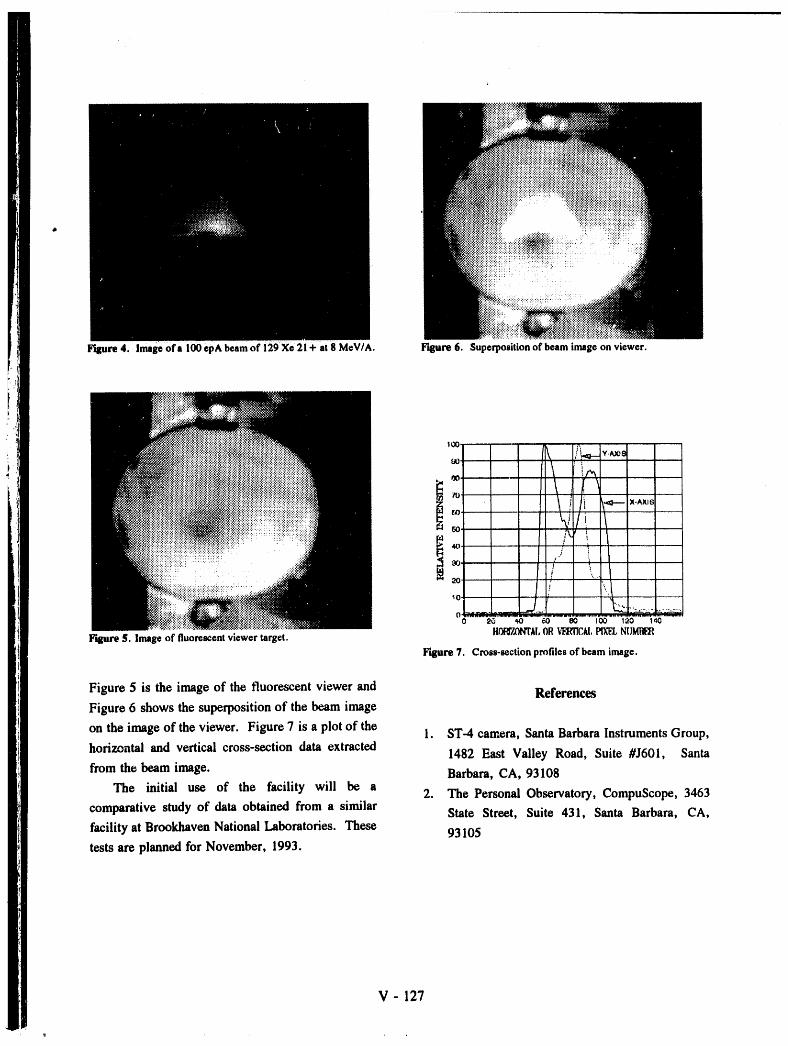
Figure 4. Image of a 100 epA beam of 129 Xe 21 + at 8 MeV/A. Figure 6. Superposition of beam image on viewer.
Figure 5 is the image of the fluorescent viewer and ReferencesFigure 6 shows the superpositionof the beam image
on the image of the viewer. Figure 7 is a plot of the 1. ST-4 camera, Santa BarbaraInstrumentsGroup,horizontal and vertical cross-section data extracted
1482 East Valley Road, Suite #J601, Santa
from the beam image. Barbara, CA, 93108The initial use of the facility will be a
2. The Personal Observatory,CompuScope, 3463comparative study of data obtained from a similar State Street, Suite 431, Santa Barbara, CA,facility at BrookhavenNationalLaboratories. These 93105tests are planned for November, 1993.
V - 127
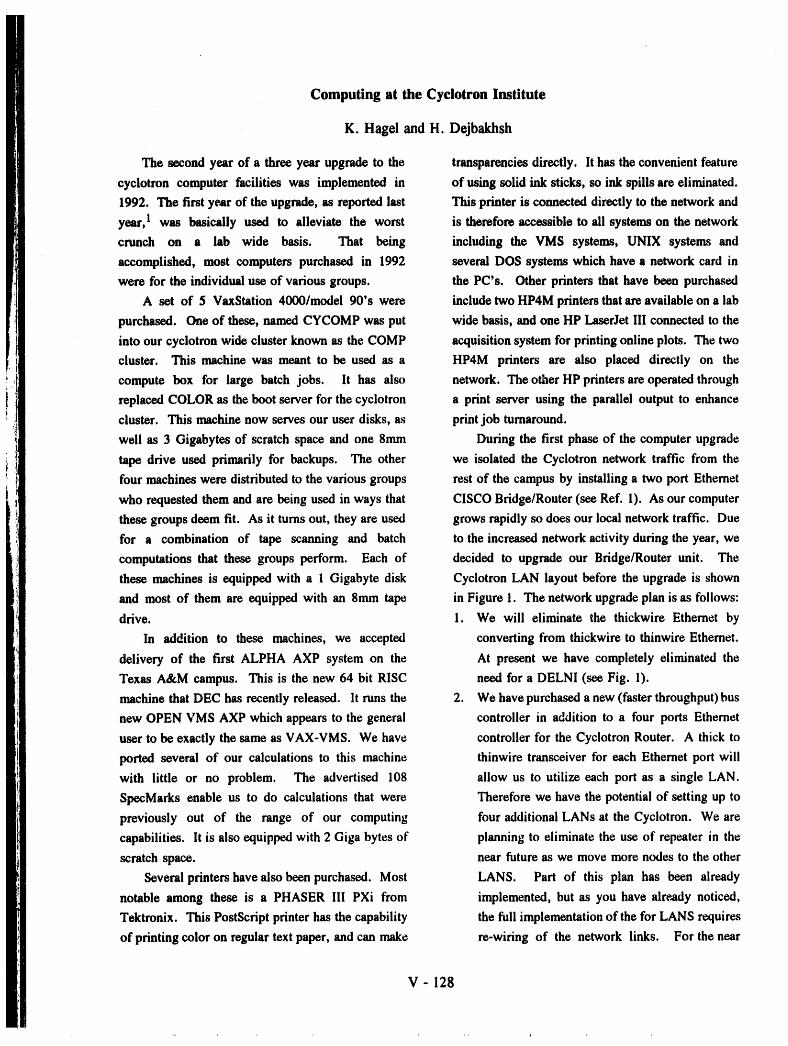
Computing at the Cyclotron Institute
K. Hagel and H. Dejbakhsh
The second year of a three year upgrade to the transparencies directly. It has the convenient feature
cyclotron computer facilities was implemented in of using solid ink sticks, so ink spills are eliminated.
1992. The first year of the upgrade, as reported last This printer is connected directly to the network and
year, 1 was basically used to alleviate the worst is therefore accessible to all systems on the network
crunch on a lab wide basis. That being including the VMS systems, UNIX systems and
accomplished, most computers purchased in 1992 several DOS systems which have a network card in
were for the individual use of various groups, the PC's. Other printers that have been purchased
A set of 5 VaxStation 4000/model 90's were include two HP4M printers that are available on a lab
purchased. One of these, named CYCOMP was put wide basis, and one HP LaserJet III connected to the
into our cyclotron wide cluster known as the COMP acquisition system for printing online plots. The two
cluster. This machine was meant to be used as a HP4M printers are also placed directly on the
compute box for large batch jobs. It has also network. The other HP printers are operated through
replaced COLOR as the boot server for the cyclotron a print server using the parallel output to enhance
cluster. This machine now serves our user disks, as print job turnaround.
well as 3 Gigabytes of scratch space and one 8mm During the first phase of the computer upgrade
tape drive used primarily for backups. The other we isolated the Cyclotron network traffic from the
four machines were distributed to the various groups rest of the campus by installing a two port Ethernet
who requested them and are being used in ways that CISCO Bridge/Router (see Ref. 1). As our computer
these groups deem fit. As it turns out, they are used grows rapidly so does our local network traffic. Due
for a combination of tape scanning and batch to the increased network activity during the year, we
computations that these groups perform. Each of decided to upgrade our Bridge/Router unit. The
these machines is equipped with a 1 Gigabyte disk Cyclotron LAN layout before the upgrade is shown
and most of them are equipped with an 8mm tape in Figure 1. The network upgrade plan is as follows:
drive. 1. We will eliminate the thickwire Ethernet by
In addition to these machines, we accepted converting from thickwire to thinwire Ethernet.
delivery of the first ALPHA AXP system on the At present we have completely eliminated the
Texas A&M campus. This is the new 64 bit RISC need for a DELNI (see Fig. 1).
machine that DEC has recently released. It runs the 2. We have purchased a new (faster throughput) bus
new OPEN VMS AXP which appears to the general controller in addition to a four ports Ethernet
user to be exactly the same as VAX-VMS. We have controller for the Cyclotron Router. A thick to
ported several of our calculations to this machine thinwire transceiver for each Ethernet port will
with little or no problem. The advertised 108 allow us to utilize each port as a single LAN.
SpecMarks enable us to do calculations that were Therefore we have the potential of setting up to
previously out of the range of our computing four additional LANs at the Cyclotron. We are
capabilities. It is also equipped with 2 Giga bytes of planning to eliminate the use of repeater in the
scratch space, near future as we move more nodes to the other
Several printers havealso been purchased. Most LANS. Part of this plan has been already
notable among these is a PHASER III PXi from implemented, but as you have already noticed,
Tektronix. This PostScript printer has the capability the full implementation of the for LANS requires
of printing color on regular text paper, and can make re-wiring of the network links. For the near
V - 128
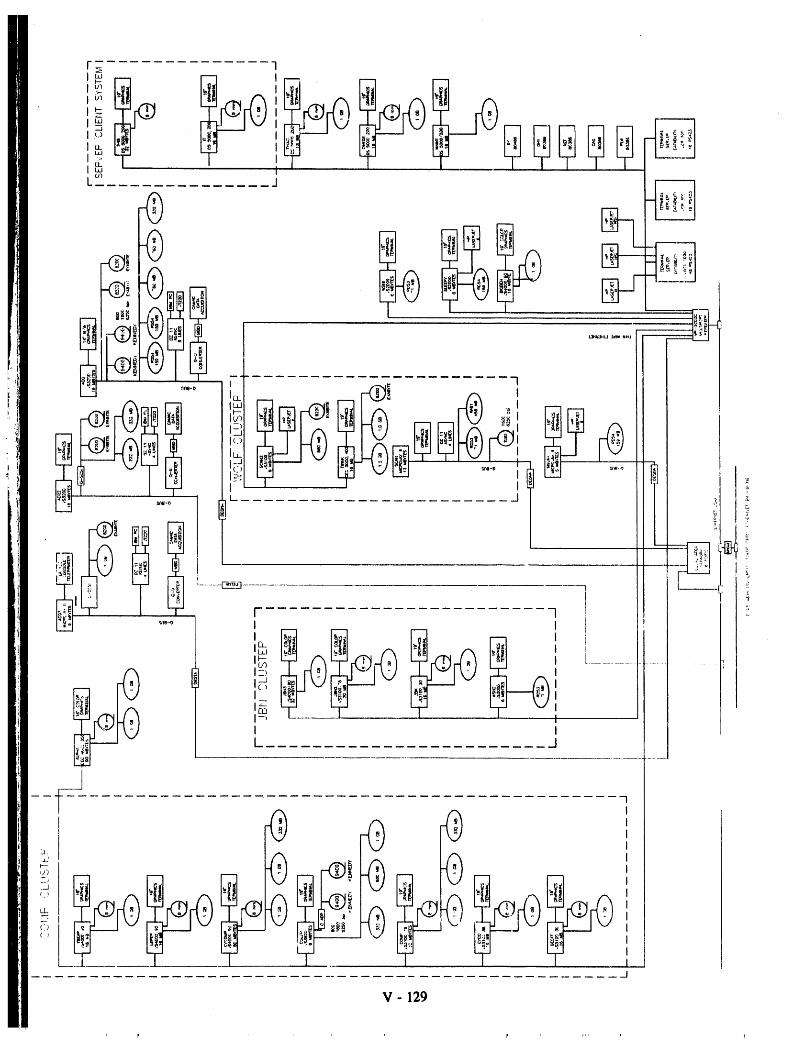

future our LANS will set up using three LANS. There has been no change to the data acquisition
One will be for the VMS systems, the other for system since our last report, I except for replacement
the ULTRIX systems and the third for PC's. of some failing Exabyte tape drives and addition of
Further network re-configuration will take place printers to some of the data acquisition systems in
as the need arises. A sketch of the Cyclotron anticipation of a major data acquisition upg,ade. The
network system in near future is presented in Exabytes tape drives and printer can and will be
Fig. 2. ported to any new system we acquire.
We have also acquired a shareware electronic At present we are in the third year of our three
mail exchange utility in preparation for DECnet phase year computer upgrade. This year we will mainly
5 installation. This utility will replace our GMAIL concentrate on upgrading the data acquisition system.
utility which is used extensively by our users. We will evaluate a few available systems in other
During the second year of the upgrade we have National Labs and Institutes to decide which one will
purchased a few PC 486 with 8 Mbytes of memory better serve our diverse needs and be within our
and 200 to 350 MB of hard disk. These systems budget.
have super VGA controllers and color monitors for
individuals. References
1. Progress in Research, 1991, Cyclotron Institute,
TAMU.
t Phys (Area 10) I
I JBN Segment _/_ ACQ Segment I
i Cyclotron Cluster Segment
Figure 2.
V - 130

Commissioning of the Proton Spectrometer Facility
A.C. Betker, C.A. Gagliardi, H. M. Xu and A. F. Zaruba
During this past year, we performed our first were used between the scintillator hodoscopes tomeasurements with the complete proton spectrometer eliminate non-protons from the singles trigger.(PSP) facility. Figure 1 shows the layout of the The singles (SS) trigger requires that there be atentire system. It consists of a dipole magnet, 2 5- least one hit in each scintillator hodoscope. Given thelayer drift chambers for position measurements, and thickness of the AI absorber, this virtually assures a2 scintillator hodoscopes for energy loss, timing, and proton trigger. This configuration allows us totrigger information. The full facility is described calibrate the entire detector system, and then toelsewhere 1. The system is designed to permit a evaluate its performance. Particle tracks are foundsystematic study of T> Gamow-Teller matrix through the detector system. Once these trajectorieselements across the periodic table with an energy are known, magnet matrix elements relate theseresolution of 500 keV FWHM, significantly better outgoing trajectories to the particle trajectoriesthan is presently available. The reactions for these leaving the target and their energies. This allows usmeasurements are both (d,2He) and (n,p) scattering, to reconstruct the reactants at the target.
The track selection is done on a X2 minimization........................................................................................................................................_.........,:_-..................
_f__ = _ basis' Events with 10 points that d° n°t meet the X2
__ :_i ii___ __ criterion are permitted to eliminate one point. Those
:%.... _) with 9 points that fail the X2 cut are allowed to....... eliminate one point from the drift chamber (DC) that
_ has no missing hits.
• i i
.................................................................... .'JC}O
F_gureI. GenerallayoutoftheprotonSpectrometer.Thedeuteron _4oo : i i
beamentersfromtheright. ! i '
300
The tests described in the rest of this report were 2oo
performed with a 111 MeV deuteron beam from the . .... ....K500, incident on a 11 mg/cm 2 thick C target. This ,oo ..........
beam is n°t °primal f°r the PSP in 2He m°de because L__ _.,!.,, i L_the energy resolution varies inversely with the beam ° -_o -,0 -,o o to ,o 30
energy. The range of accepted excitation energies is omalso a function of the 2He energy, due to the Figure2. X coordinateof all tracksat the exit of the vacuumchamber.kinematics involved. For those parameters wherebeam energy is a hindrance, however, this lowerbeam energy provides worst case performance data. First the scintillator timing is calibrated byThe magnet was at a scattering angle of 10°, with an finding the relative time jitter for every scintillatorangular acceptance of :!:7°. The Q value for the trigger pair. Then the drift chambers are calibrated to12C(d,2He)12B reaction is -14.81 MeV, which, along provide the correct displacement for each measuredwith kinematics, leads to decay protons of about time. This process is iterative. A first approximation
47.6 5:10.0 MeV for the ground state. The magnetic can be made with the assumption that the detectorsfield was set at 9.081 kG to put protons of 50.06 are uniformly illuminated. This initial calibration,
MeV on the central ray. At this field, protons from however, is only approximate. The detector region is32 to 90 MeV reach the detectors, as well as not uniformly illuminated, as there are many moredeuterons from 16 to 45 MeV. Aluminum absorbers protons from deuteron break-up at the high p end of
the magnet, and there are window supports that
V- 131
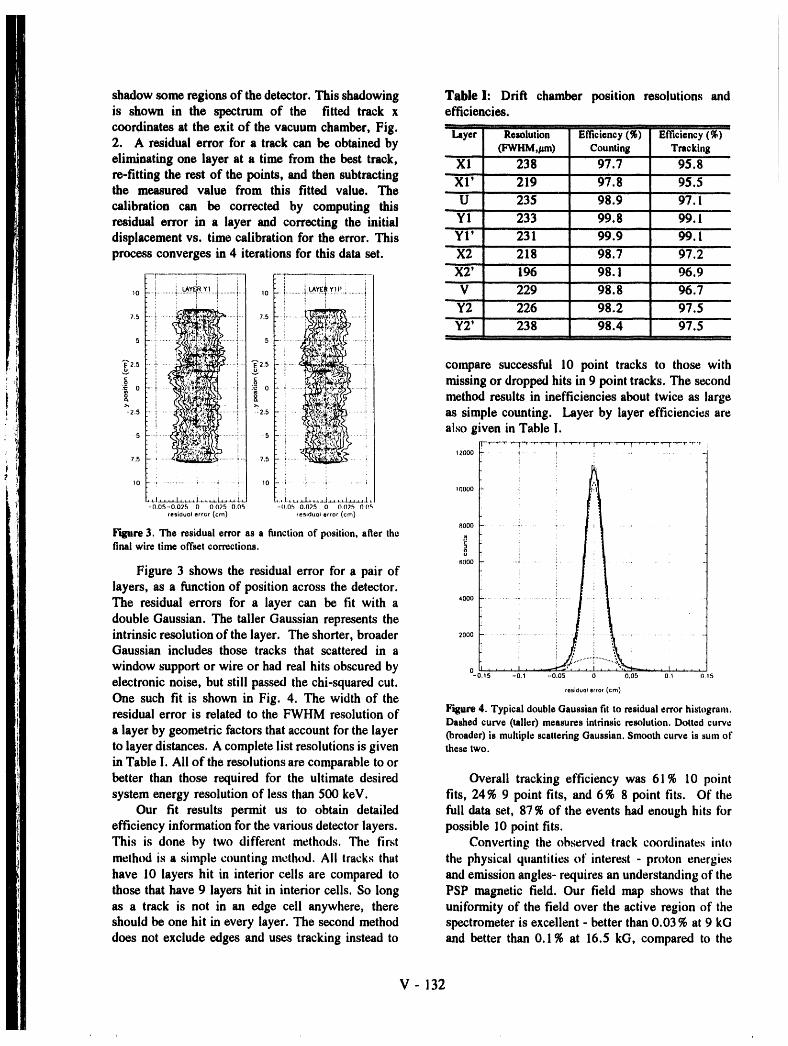
shadow some regionsofthedetector. This shadowing Table I: Drift chamber position resolutions andis shown in the spectrum of the fitted track x efficiencies.coordinates at the exit of the vacuum chamber, Fig. Layer Resolution Efficiency(%) Efficiency_(%) •2. A residual error for a track can be obtained by (FWHM,pm) Counting Trackingeliminating one layer at a time from the best track, .....XI 238 97.7 95.8
re-fitting the rest of the points, and then subtracting - X1; 219 97.8 95.5the measured value from this fitted value. The -
calibration can be corrected by computing this _ U_ 235 98.9 97.1residual error in a layer and correcting the initial YI 233 99.8 99.1displacement vs. time calibration for the error. This YI' 231 99.9 99.1i,,,
process converges in 4 iterations for this data set. X2 218 98.7 97,2
_i i LA_E.RY_I i i i X2' 196 98.1 96.9,o 'I..........._......................r............r.. ,o I ............it:_E_!Pi............i V 229 98.8 96.7
_,5 _'2,5v i....._.-_.._ .......i compare successfulI0 pointtracksto thosewith
_o _ i i i missing or dropped hits in 9 point tracks. The secondo ! i ! method results in inefficiencies about twice as large
_2.5 _2.5 i ....... .......:_ as simple counting. Layer by layer efficiencies are
5 --5•i.....i .......! alsogiveninTable I,.....-.r-,--...,-T_-r-,--_--.--,-r-.-,--,-_-r-.-.-_,..,
12000 .... _'..... i : ...........
7,._ 75 ........... i :10 10 I-- ! " ! ..... ;
!0000
-fL05-0,025 0 0025 0,05 -II{_h 0.025 0 0 075 f3 (!r_
reslduol er¢or (cm) ,esiduo_ error (cm)
8000 . . .. . • .
Figure3. The residualerroras a functionof position,afterthe
final wiretimeoffsetcorrections.6000 .....
Figure 3 shows the residual error for a pair oflayers, as a function of position across the detector.The residual errors for a layer can be fit with a ,coo ........
double Gaussian. The taller Gaussian represents the i J L_iintrinsic resolution of the layer. The shorter, broader 2ooo.............._............._:_ ...... .....
Gaussian includes those tracks that scattered in a i _ ::
window support or wire or had real hits obscured by o ....... , . . .-0.15 -0.1 -0.05 0 0.05 01 0.15
electronic noise, but still passed the chi-squared cut.tes;duoI error (¢m)
One such fit is shown in Fig. 4. The width of theresidual error is related to the FWHM resolution of Fisure4. Typical doubleGaussianfit to residualerror histogram.
Dashedcurve(taller)measuresintrinsicresolution.Dottedcurvea layer by geometric factors that account for the layer (broader) is multiple scattering Gaussian.Smoothcurveis sumofto layer distances. A complete list resolutions is given thesetwo.in Table I. All of the resolutions are comparable to or
better than those required for the ultimate desired Overall tracking efficiency was 61% 10 pointsystem energy resolution of less than 500 keV. fits, 24% 9 point fits, and 6 % 8 point fits. Of the
Our fit results permit us to obtain detailed full data set, 87 % of the events had enough hits forefficiency information for the various detector layers, possible 10 point fits.This is done by two different methods. The first Converting the observed track coordinates into
method is a simple counting method. All tracks that the physical quantities of interest - proton energieshave 10 layers hit in interior cells are compared to and emission angles- requires an understanding of thethose that have 9 layers hit in interior cells. So long PSP magnetic field. Our field map shows that theas a track is not in an edge cell anywhere, there uniformity of the field over the active region of theshould be one hit in every layer. The second method spectrometer is excellent - better than 0.03 % at 9 kGdoes not exclude edges and uses tracking instead to and better than 0.1% at 16.5 kG, compared to the
V - 132
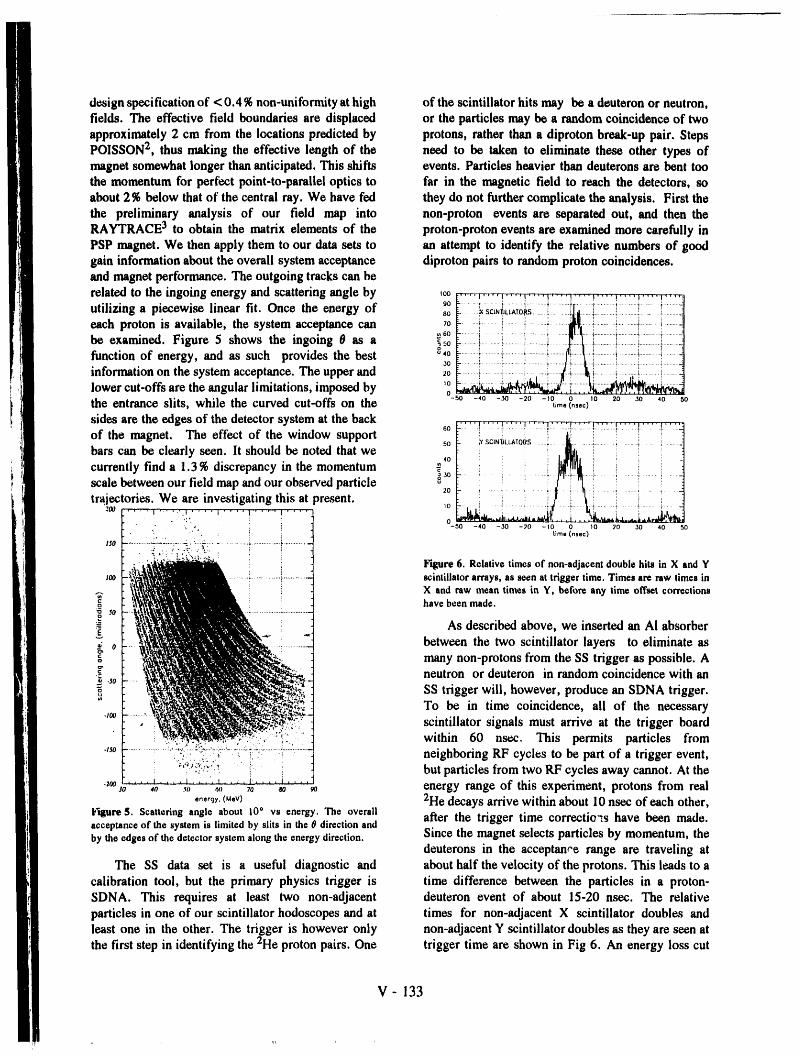
design specification of < 0.4 % non-uniformity at high of the scintillator hits may be a deuteron or neutron,fields. The effective field boundaries are displaced or the particles may be a random coincidence of two
approximately 2 cm from the locations predicted by protons, rather than a diproton break-up pair. StepsPOISSON 2, thus making the effective length of the need to be taken to eliminate these other types ofmagnet somewhat longer than anticipated. This shifts events. Particles heavier than deuterons are bent toothe momentum for perfect point-to-parallel optics to far in the magnetic field to reach the detectors, soabout 2 % below that of the central ray. We have fed they do not further complicate the analysis. First thethe preliminary analysis of our field map into non-proton events are separated out, and then theRAYTRACE 3 to obtain the matrix elements of the proton-proton events are examined more carefully inPSP magnet. We then apply them to our data sets to an attempt to identify the relative numbers of goodgain information about the overall system acceptance diproton pairs to random proton coincidences.and magnet performance. The outgoing tracks can be
related to the ingoing energy and scattering angle by ,oo .-,-__.... , .... , .... r,..... , .... ,,.., i,,,, ! .... _.-_..90 .........i.......i.........i............._.........._I........i..........;.........i.......i...........-
utilizing a piecewise linear fit. Once the energy of ,o ......._SC_N_L_O_........i.........i[| .......i...........i .........i...... i............_each proton is available, the system acceptance can ' _ _ ' _ _ ..i..........i..........i.........-
be examined. Figure 5 shows the ingoing 0 as a _s0 .........i..........i........................_..........._:....t...._.............i...........I...........i..........function of energy, and as such provides the best _°'0 ..........i...........i............._............i.........._--_i .............._..........._.................30 .-...... _......... _.......... i ...... g ......... g............_........... _........... i ......... :
information on the system acceptance. The upper and 20 - .......i..........i .......i........_. ,/_iiiiii_i.........i.........t........t.......:
are the angular limitations, imposed by ': _i,__._::'__lower cut-offs
the entrance slits, while the curved cut-offs on the - 0 -4o -_o -20 -_°t_r_,¢o,.c)°,0 20 _0 ,o 50
sidesaretheedgesofthedetectorsystemattheback _....,....,....,....,....,....,....,....,....,,,_60 .- " ! ..... _..... : ..... t ........ ?......... )........... _........ _ " ' ......
of the magnet. The effect of the window support so :- _fSCINilLLAID_S .....t .......... ) ....... _ ....... _ .... _ ......
bars can be clearly seen. It should be noted that we ,0 ) hJl1_tLcurrently find a 1 3 % discrepancy in the momentum• _ : i i i i ][]_..i'._t ! _ : "
scale between our field map and our observed particle __o .- _........... __.. i ............ i - -°_0L i : i .....i.... !.........i ......i.....i J
:. • T_:'. -so -4o -30 -_o -io o _o _o _o 40 so
f' 1 time(nsec)I$0
Figure 6. Relative times of non-adjacent double hits in X and Y_ "__ ........... _ ................ _ ............. -1 scintillator arrays, as seen at trigger time. Times are raw times in
_:_S • : ! _ X and raw mean times in Y, before any time offset correctionso _t" _. have been made.
_o ...._ _................!...............
_ t_"" _ .. As described above, we inserted an AI absorber_ 0 ............. between the two scintillator layers to eliminate as
many non-protons from the SS trigger as possible. A
._ _¢J/___,l_:... _ neutron or deuteron in random coincidence with anSS trigger will, however, produce an SDNA trigger.
__1____'__.¢__im__?_._ To be in time coincidence, all of the necessary
• '___i__:_'.. ,_-.,,.-...._ scintillator signals must arrive at the trigger board_:I.!IT.._ within 60 nsec. This permits particles from
•,_0 ' __ _\ _- - ' _ neighboring RF cycles to be part of a trigger event,_ :i _ ,t ! !
but particles from two RF cycles away cannot. At the•_oo_o ,o .,,, ,_, 7o _o 9o energy range of this experiment, protons from real
,_,,_, (_.v> 2He decays arrive within about 10 nsec of each other,Figure 5. Scattering angle about 10 ° vs energy. The overall after the trigger time corrections have been made.acceptance of the system is limited by slits in the 0 direction andby the edges of thedetectorsystemalong theenergydirection. Since the magnet selects particles by momentum, the
deuterons in the acceptance range are traveling atThe SS data set is a useful diagnostic and about half the velocity of the protons. This leads to a
calibration tool, but the primary physics trigger is time difference between the particles in a proton-SDNA. This requires at least two non-adjacent deuteron event of about 15-20 nsec. The relative
particles in one of our scintillator hodoscopes and at times for non-adjacent X scintillator doubles andleast one in the other. The trigger is however only non-adjacent Y scintillator doubles as they are seen atthe first step in identifying the 2He proton pairs• One trigger time are shown in Fig 6. An energy loss cut
V- 133
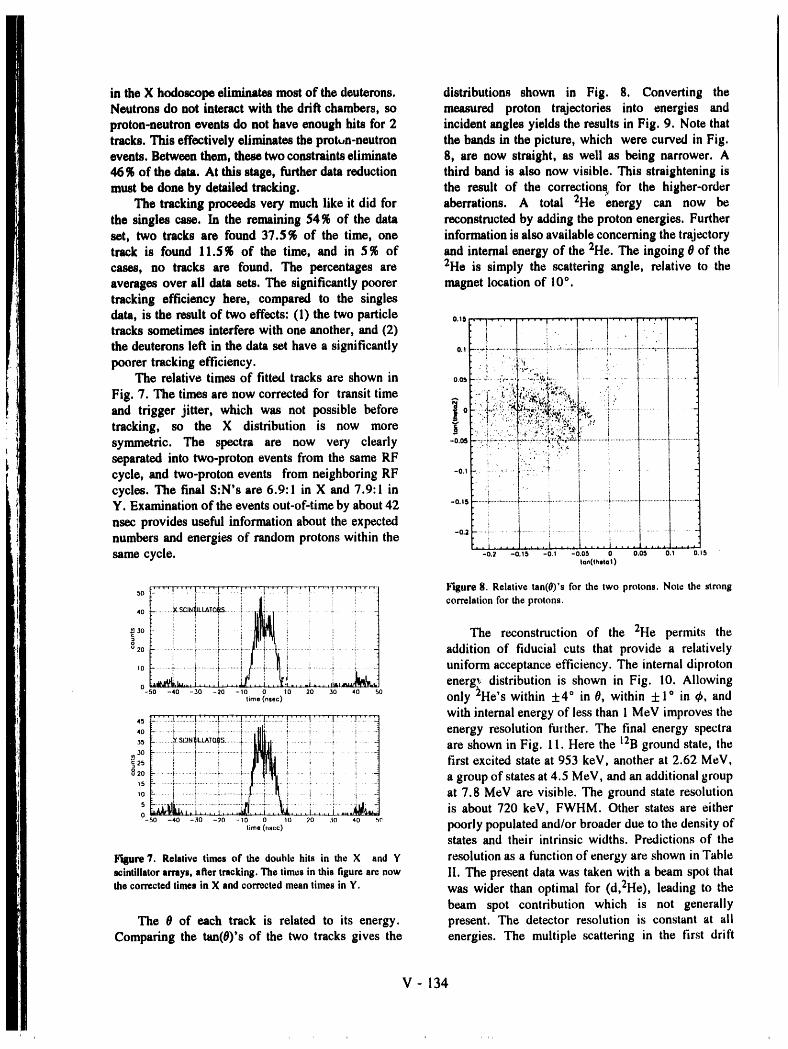
in the X hodoscope eliminates most of the deuterons, distributions shown in Fig. 8. Converting theNeutrons do not interact with the drift chambers, so measured proton trajectories into energies andproton-neutron events do not have enough hits for 2 incident angles yields the results in Fig. 9. Note thattracks. This effectively eliminates the protun-neutron the bands in the picture, which were curved in Fig.events. Between them, these two constraints eliminate 8, are now straight, as well as being narrower. A46 % of the data. At this stage, further data reduction third band is also now visible. This straightening is
must be done by detailed tracking, the result of the corrections for the higher-orderThe tracking proceeds very much like it did for aberrations. A total 2He 'energy can now be
the singles case. In the remaining 54% of the data reconstructed by adding the proton energies. Furtherset, two tracks are found 37.5 % of the time, one information is also available concerning the trajectorytrack is found 11.5% of the time, and in 5% of and internal energy of the 2He. The ingoing 0 of thecases, no tracks are found. The percentages are 2He is simply the scattering angle, relative to theaverages over all data sets. The significantly poorer magnet location of 10°.tracking efficiency here, compared to the singles
data, is the result of two effects: (I) the two particle °"sK"_ '.'" i .... ! ' '"I .... ) ...... : ", .... '.
tracks sometimes interfere with one another, and (2) ': .; . .. t. ' _ ' ' " . -the deuterons left in the data set have a significantly
poorer tracking efficiency. ;i.'.i .....; . ......The relative times of fitted tracks are shown in 0.o_.:.:., ;i;:,.................
Fig. 7. The times are now corrected for transit time [ :- t. i, .:.!,_,_;_,:;..)',_...,:,,I . ..i :-
and trigger jitter, which was not possible before i °L-..:"_';:::"._'_._::._!._tN)'.:!_:_:
tracking, so the X distribution is now more _ _...... ....-.-,_:./.._.-..:[:..::.:;_,#:_, ' . ,.. , .., .., ,., ,% ,,.,:_,-o.osI-"_":_'"':...........,_:.-.-.-,-...-:-,t:,.._._,-_-._ ..........................................................symmetric. The spectra are now very clearly .... !L..... i :-..i:_:i"_separated into two-proton events from the same RF _ r. ..... i icycle, and two-proton events from neighboring RF -0., .......... ,...:...................
Y. Examination of the events out-of-time by about 42 -0.,s ........'..............................................................................
nsec provides useful information about the expected i t [ _ _numbers and energies of random protons within the -0.2 .............................' ' i ' _ i _ l _ ......... __ ........ t I ..... 'I ' m........ i .... _.... 1....
samecycle. -o_ -o.,_ -o., -o.o_ o e.o_ o., o.,_ton(thlto i )
_o 2:' :.!./i '.'U.!.; L!:.!.'.:!: '. '__7T,_'-'-'-'77... ;F_ Hgure 8. Relative tan(0)'s for the two protons. Note the strong
i i _l.i..l_ ) i correlation for the protons._o i i I i |if'Ill i _ _ . The reconstruction of the 2He permits theo_0 .i ..........i............_............._..... i.........i i ..... i.... addition of fiduciai cuts that provide a relatively
,0 ..........)...........i.............i...........) l)_1_......+...,i.......! .........i i..... uniform acceptance efficiency. The internal diprotoni i _ ) .i i i
o ,_L,....,., .... _.... __.!..,_ ...... _..... ,.... _lmk energ,_ distribution is shown in Fig. 10. Allowing-50 -40 -30 -20 -10 0 10 20 30 40 50
,_,,.(o,._) only He s within +4 in 0, within +1 ° in ¢, and
,,_:..:.,..:.._.:.:..:..:.._..!.'.!:.:..._.:.'.:::.'..:.:...'..':..'..L'...'..:..'_:.'.'.:_":",":'I.'..:_ with internal energy of less than 1 MeV improves the: _ _ _ i ,._...t ........i.... i.... i.. energy resolution further. The final energy spectra40 L.........i........i........._.........t .............,: ' : .
_ L........_S_.,,_L_'rO_S........._........[t_ilJ ' ........i ..i ; ' are shown in Fig. 1I. Here the 12Bground state, the
_ : L i i i _t[] i i i i first excited state at 953 keV, another at 2.62 MeV,o i ) ! _ '; ! :. :, !
_o -.......!.........._..............T........_( _]li: I T i- a group of states at 4. 5 MeV, and an additional group
'_ _".......)............)" .L............._°_[!_..... _.....! . .,0 L..........!............). I _V"_ i at 7.8 MeV are visible. The ground state resolution.... _.... i....._ about keY, FWHM. Other states are eithero _', i .... !.... is 720
-50 -40 -.t0 -20 - 10 0 10 20 30 40 5C
_,_,(.....) poorly populated and/or broader due to the density ofstates and their intrinsic widths. Predictions of the
l'_re 7. Relative times of the double hits in the X and Y resolution as a function of energy are shown in Tables_intillator arrays, after tracking. The times in this figure are now II. The present data was taken with a beam spot thatthe corrected times in X and corrected mean times in Y. was wider than optimal for (d,2He), leading to the
beam spot contribution which is not generallyThe O of each track is related to its energy, present. The detector resolution is constant at all
Comparing the tan(0)'s of the two tracks gives the energies. The multiple scattering in the first drift
V - 134
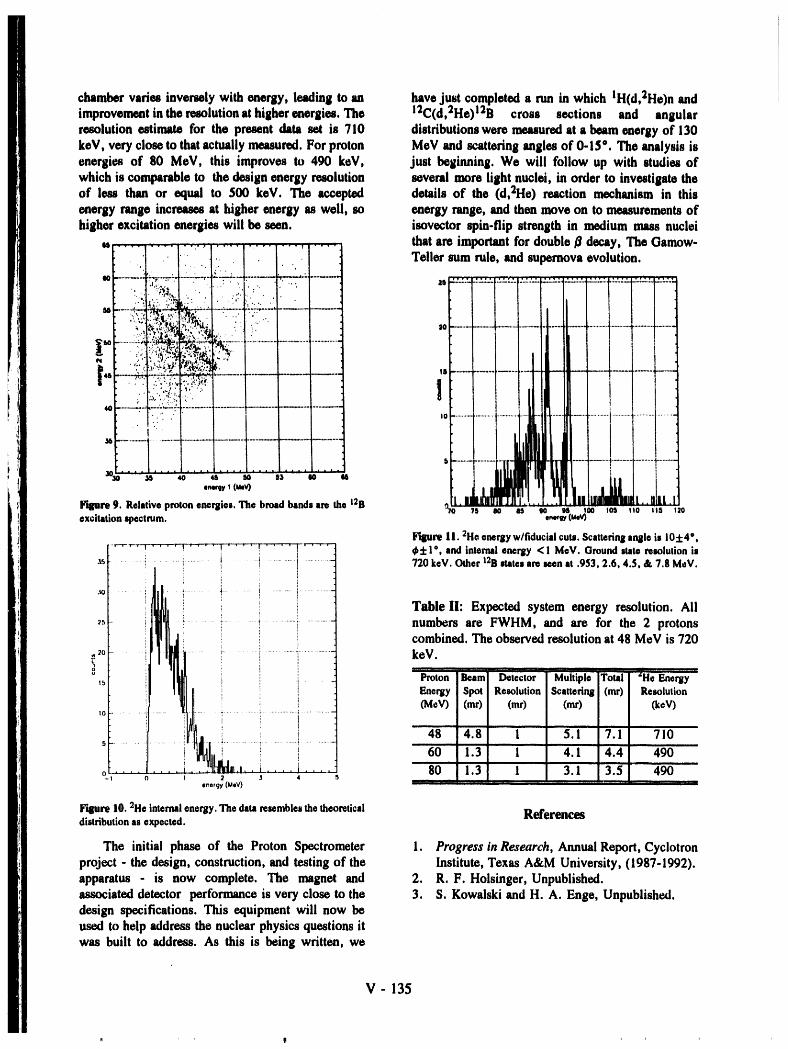
chamber varies inversely with energy, leading to an have just c3mpleted a run in which IH(d,2He)n and i
improvement in the femlution at higher energies, The 12C(d,:!He:_I2B cross sections and angularresolution estimate for the present data set is 710 distributions were measured at a beam energy of 130keV, very close to that actually measured. For proton MeV and scattering angles of O-15°. The analysis isenergies of 80 MeV, this improves to 490 keV, just beginning, We will follow up with studies of
which is comparable to the design energy resolution several more light nuclei, in order to investigate theof less than or equal to 500 keV, The accepted details of the (d,2He) reaction mechanism in thisenergy range increases at higher energy as well, so energy range, and then move on to measurements ofhigher excitation energies will be seen. isovector spin-flip strength in medium mass nuclei
that are important for double 0 decay, The Gamow-
_il :. Teller sum rule' anl sulem_va_v°lluti°n' I _2o.........................................................................,
m ........ 'i-r.,..-._.- ........ - : • • •.':'_.,"=..... . as _z.:. ,;-_:...:-.,..,.. ...y:,.-. .. .. _,:.. ......... .:.:.:.__.i,-=,:2:!'_",. , , .. . .
"I*.........?!I! ................................................"........." ; p2 ........., _,_. . _..-,:_.__ -"_._".._ _1_ ............... - ........... -- .....................
lral_re 9. Relative proton enemies, The broad bands are the 12B ,_ .........-7o 7s ee as oo ts _oo ,05 **o _,s ,2oexcitation spectrum, e_ey (u.v)
i_qlure 11.2He energy w/fiducial cuts, Scattering angle is 10+4",-.1--s-T--r- " ' " ' I ' ' ' ' _ , t i !' , , , , , '_', ,'
35 ................................ i " _:1: I o, and internal energy < 1 MoV. Ground state resolution is............................... 720 keV, Other 12B states are seen at ,953, 2,6, 4,5, & 7,8 MeV.
,, i] Table ll: Expected system energy resolution. All
,_ _........... _........ i ..............._............... numbers are FWHM, and are for the 2 protonscombined. The observed resolution at 48 MeV is 720
.._o ................................ keV.
_5 Proton Beam Detector Multiple Total "HeEnergyEnergy Spot Resolution Scattering (mr) Resolution(MeV) (mr) (mr) (mr) (keY)
.... 60 1.3 1 4.1 4.4 490
80 1.3 1 3.1 3.5 4900-I 0 _ _ 4
energy (_eV) : l , , .....
Figure 10.2He internal energy, The data resembles the theoretical Referencesdistribution as expected.
The initial phase of the Proton Spectrometer 1. Progress in Research, Annual Report, Cyclotronproject - the design, construction, and testing of the Institute, Texas A&M University, (1987-1992).
apparatus - is now complete. The magnet and 2. R.F. Holsinger, Unpublished.associated detector performance is very close to the 3. S. Kowalski and H. A. Enge, Unpublished.design specifications. This equipment will now beused to help address the nuclear physics questions itwas built to address. As this is being written, we
V- 135
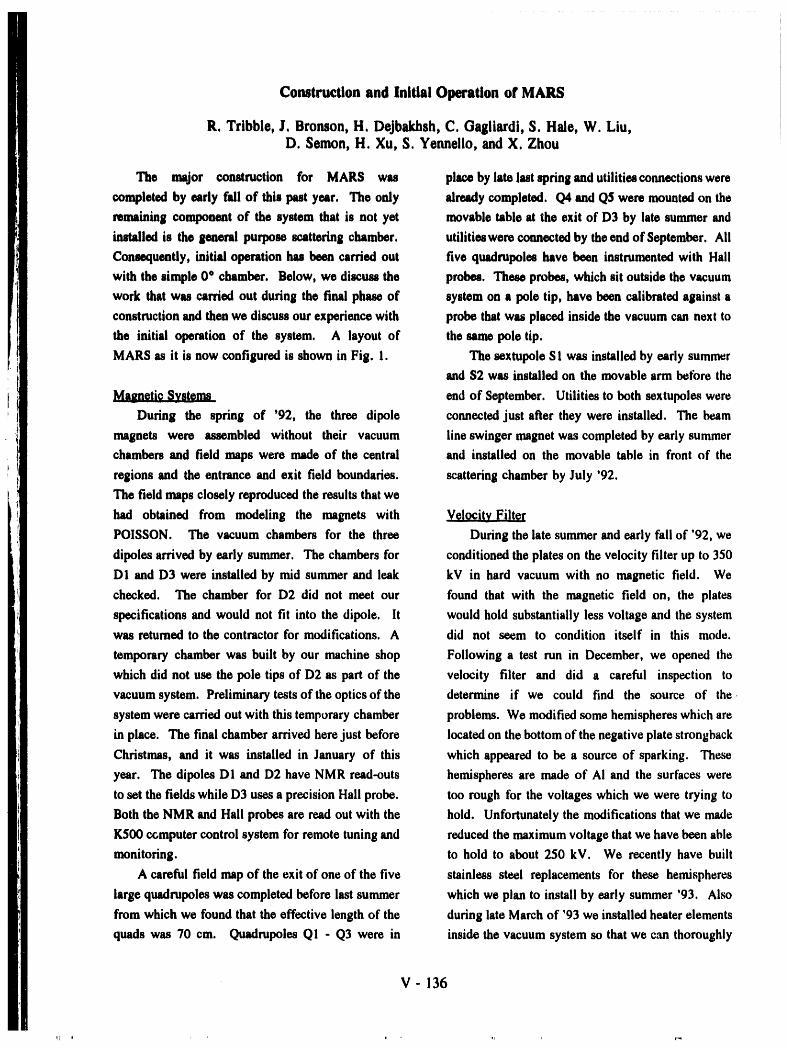
Construction and Initial Operation of MAPS
R. Tribble, J. Bronson, H. Dejbakhsh, C. Gagliardt, S. Hale, W. Liu,D. Semen, H. Xu, S. Yennello, and X. Zhou
The major construction for MARS was place by late last spring and utilities connections were
completed by early fall of this past year. The only already completed. Q4 and Q5 were mounted on the
reining component of the system that is not yet movable table at the exit of D3 by late summer and
installed is the general purpose watttering chamber, utilities were connected by the end of September. All
Consequently, initial operation has been carried out five quadrupoles have been instrumented with Hall
with the simple 0 ° chamber. Below, we discuss the probes. These probes, which sit outside the vacuum
work that was carried out during the fmal phase of system on a pole tip, have been calibrated against a
construction and then we discuss our experience with probe that was placed inside the vacuum can next to
the initial operation of the system. A layout of the same pole tip.
MARS as it is now configured is shown in Fig. 1. The sextupole S1 was installed by early summer
and $2 was installed on the movable arm betbre the
Mt2netic Systems end of September. Utilities to both sextupoles were
During the spring of '92, the three dipole connected just after they were installed. The beam
magnets were assembled without their vacuum line swinger magnet was completed by early summer
chambers and field maps were made of the central and installed on the movable table in front of the
regions and the entrance and exit field boundaries, scattering chamber by July '92.
The field maps closely reproduced the results that we
had obtained from modeling the magnets with VelocityFilterPOISSON. The vacuum chambers for the three During the late summer and early fall of '92, we
dipoles arrived by early summer. The chambers for conditioned the plates on the velocity filter up to 350
D1 and D3 were installed by mid summer and leak kV in hard vacuum with no magnetic field. We
checked. The chamber for D2 did not meet our found that with the magnetic field on, the plates
specifications and would not fit into the dipole. It would hold substantially less voltage and the system
was returned to the contractor for modifications. A did not seem to condition itself in this mode.
temporary chamber was built by our machine shop Following a test run in December, we opened the
which did not use the pole tips of D2 as part of the velocity filter and did a careful inspection to
vacuum system. Preliminary tests oftheopticsofthe determine if we could find the source of the
system were carried out with this temporary chamber problems. We modified some hemispheres which are
in place. The final chamber arrived here just before located on the bottom of the negative plate strongback
Christmas, and it was installed in January of this which appeared to be a source of sparking. These
year. The dipoles DI and D2 have NMR read-outs hemispheres are made of AI and the surfaces were
to set the fields while D3 uses a precision Hall probe, too rough for the voltages which we were trying to
Both the NMR and Hall probes are read out with the hold. Unfortunately the modifications that we made
K500 cGmputercontrol system for remote tuning and reduced the maximum voltage that we have been able
monitoring, to hold to about 250 kV. We recently have built
A careful field map of the exit of one of the five stainless steel replacements for these hemispheres
large quadrupoles was completed before last summer which we plan to install by early summer '93. Also
from which we found that the effective length of the during late March of '93 we installed heater elements
quads was 70 cm. Quadrupoles Q I - Q3 were in inside the vacuum system so that we can thoroughly
V- 136
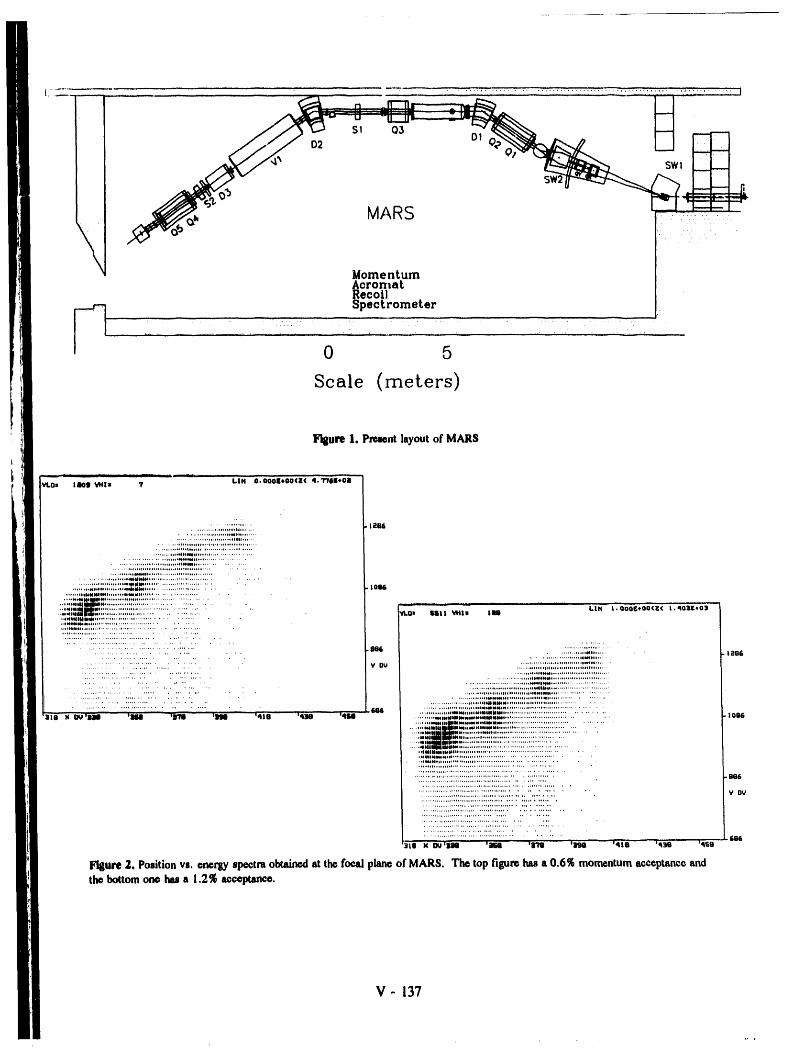
i
Acronlat I
_" *'_vec'r°me'er ........ i_ Recoil J
0 5
Scale (meters)
Fl6ure I. Presentlayoutof MARS
, __ _ _ ........ ;-- -,, L - ' ba'"H O. O00|*OO(Z( 4.776E*011Vl.0= I_IOS '#HI= "4'
1
....
..... It86......... ,.,o,..,,oo., .....
................. ... ....... ,ooo,,........... ,,,.,.*,.,,.r,.,...*,*.,*,0,., ....
........... *,''*0OOmo****''' .................................... *.00"0*_.... .................
......... ,,...., ...,.,,,..,.,, ,**m*, ..............
....... ..*, .....,.....Mq*ml_,.**,' ..........................
...... ..N............*N._0U..* ........................... 1086,,.,.,,,ig_umm...,,., .._m,e*,**,,. ..................
,., ,*.oooNM!l_o4.,.*.. ..... .**.., .........................,.,qmMIUmm, .......................................... L|N I. QOG_*OQlZ( t, qO3g,03....*,,,Omli,ik,..,, .................................... 'nA.0z t, ill '_r_,41= IN*.*,qO041MN_,,*,. ........ *.',,. ......................,*.o*Ioa_.s,*..,, ....... . .......................
. .U_, ...............,,...... ta86........................................ ,,.,.,,o.N*,, .....
.................................... ,,,*,.,._N,..,..,*,*.,, ................................................... ,,,,,,,o*,aa,**,,,.,...,,,,,,..,.,,.. ........
......................... ........................*,,,._',lq..*,..,.,.......................................................... .,,.,.., ..,,,,*,.,***._tk*.* ...........................
................................. . ....... ,.,,.,.,,,,,o,,,,,,,,,,,,.louoo_oo .., ............................................................. . .,..*,_........,**.*.**,..*. oo**No,,., .................
.................. ,.* ,,,,*,O0NmN* -,*,,,,,,,,.,,*,,.-, ............................................................... ,,,,.....,....,,.oeo N_0.o.... ...... .,.,..., ....................
,,, ..... ,..,..,,,.*,Na m0,*o,, 0_*NmHmO..., ..................................iij I<'c_lll 'n_ ,xrm 'hw 'ere '¢_ ",_ii ram+ .........,...,,,.,=,...,.,,,,-,,-................................... tom;
.., ,,* s,_llalllIUllMmo, o*,o,ao*omu**, ,* ,,., ..........................
::::::::::::::::::::::::::::::::::::::::::::::::::::::::::::::::......, ,llSIIN_ID_I,I O.*,H..*****.O.....................................'* mo_m ,4,..,*.*...*,.,, .................................
:::,._,-.,.:,.,.,.,.,.::..::....,.,.,.::::::::::::::::::.: ............. ........ ,,,,, ................................................
'' Y O_
..................................................
......................................
............................................. 6B68 x u_'m '_ 'rm 'nu' ',_|u -'q_g' '_su
l_ure2, Positionvs. energy spectraobtainedat the focal planeof MARS. The top figurehasa 0.6% momentumacceptanceandthebottomone hasa 1.2% acceptance.
V- 137
outgas the ground shield. With the heaters installed, ability to reject the primary beam at 0 ° for inverse
the plates were able to hold the same voltage (about kinematics reactions; (5)determine if the environment
250 kV) with the magnetic field on as with it off. at the scattering chamber is suitable to carryout
We have encountered several problems with the particle-gamma coincident measurements; (6)
HV power supply this year. The system had some measure a mass spectrum. These goals have now
modes of operation that looked like HV breakdown been completed and we are beginning to use the
but did not appear to be coming from inside the device to carry out our first physics measurements.
velocity I_lter or in the HV decks. Problems would The bend angle into MARS is set by two bending
appear and then disappear without any apparent magnets that make up the dipoles on the beam
reason. During a recent test run, we discovered that swinger. A viewer is located in front of the second
the system periodically would make discrete jumps in swinger magnet which allows us to put the beam
the output voltage and that there was noise on the from the first bending magnet on the center line of
negative plate HV that resulted in a broadening of the the second. In order to determine the 0 ° line, we
peaks at the focal plane. Following that test run, we used a transit to locate a target in the beam pipe
have begun to thoroughly debug the control system approximately halfway between Q I and Q2. The
and the two inverters. A number of problems have beam was then centered at the target location and the
been uncovered and fixed during this process. We bending magnets were adjusted until the beam on the
hope to complete the checks by early May. second viewer was also centered. With the beam in
this location, we observed no steering in QI or Q2.
Vacuum and Sup_mrt$ystenls In order to check the beam optics and calibrate
The vacuum components were all completed and the magnets, we have used phosphor viewers that
installed by September '93. The movable arm at the were located along the beam line with transits in the
end of D3 was installed and tested by late last FC chamber just after DI, just before Q3, and at the
summer. The FC chamber located between D 1 and focal plane after Q5. The direct beam is then viewed
Q3 was instrumented with movable Faraday cups with a television camera. The two viewers in the FC
along the sides. Also fixed cups were placed at the chamber allow us to set the magnetic field in D I so
ends of the chamber and a slit system was installed that the beam is traveling along the optical axis in the
just before Q3. The slit system is used both to define section of the momentum achromat between D I and
the momentum acceptance of the achromat and to D2. The viewer before Q3 is useful to check the
stop the beala when the beam momentum is close to settings on Q1 and Q2. By making relatively small
the recoil momentum. A provision has been made in changes in these quadrupole fields, it is possible to
the FC chamber to install a "finger" FC which will produce a double focus at this location. Dipole D2
intercept the beam particles when they are mixed in can be set using the last viewer with the velocity
momentum with the recoil ions. Also the vacuum filter, D3, Q4 and Q5 turned off and the bend angle
control system was completed before the end of '92 after D3 set to 0 °. However, the image at the viewer
and was installed just after the first of this year. is rather large. With D2 set, Q4 and Q5 do not steer
the beam but focus it as expected. The velocity filter
]oitial Tests E and P. fields are calibrated against each other by
During the past few months, we have carried out keeping the beam centered at the focal plane while
a number of test runs with MARS using 58Ni beams turning up the two fields. We have used both a
at 29 Mev/u. The goals of these tests have been: (1) phosphor viewer and a focal plane detector to check
find the O* line into the target chamber; (2)determine the E and B fields. By detuning a solenoid in the
if the optics work as predicted; (3) "calibrate" the ECR source transfer line to lower the beam current,
magnets and the velocity filter; (4) determine our we can view the beam through MARS on a focal
V- 138
plane detector. The detector that we have used for Figure 2 shows two position vs. energy (Si
these studies is a 10 cm single-wire gas proportional detector) spectra that we obtained from a 7 mg/cm2
counter backed by a lcm x 5cm x 500/tin Si solid CH2 target with the 57Cu settings. The momentum
state counter, acceptance slits were set at about .6% and 1.2% full
As noted above, these studies have been carried width for the two spectra. The change in acceptance
out with a 58Ni beam at 29 AMeV. We chose this is clearly shown by the change in the energy spread
beam since we plan to carry out several experiments for the different groups in the figure. By opening the
using 57Cu recoils produced by the inverse kinematics slits further, we observed a group from the i
reaction p(SSNi,57Cu) 2n. The Q-value for the production of 58Cu that occurred at the same position
reaction leading to 57Cu is -21.5 MeV and the as the56Ni group. From Fig. 2, it is clear that 57Cu
threshold energy for the reaction is about 21.7 is nicely separated from other recoil ions in this
AMeV. At this energy, most of thebeam and recoil reaction. The data were taken with a small
ions are fully stripped after they leave a target that is dispersion, approximately 3 mm/%&m/m, since we
at least 1 mg/cm 2 thick. Thus the 57Cu recoils have were encountering problems with the HV power
a p/q that is about 7 % smaller than the beam. With supply on the velocity filter. During the run where
the fields setup to observe the 57Cu recoils, the the data in Fig. 2 were collected, we checked the
primary beam stops on a Faraday cup near the back rates in a Ge detector located at the target chamber
of the FC chamber before the entrance to Q3. We and collected a small amount of particle-gamma
found two places where beam particles could scatter coincidence data. We found that the Ge detector rate
and be transmitted to the focal plane with the 57Cu scaled very closely with the target thickness, and thus
settings. One source of scattering was the movable background due to beam optics and the beam stop at
FC on the high p side of the FC chamber. By the FC chamber was minimal.
changing the shape of this cup and moving it very
close to the back slit, we were able to eliminate the We have nearly completed the construction of a
scattering from it. The other source of scattering is cryogenic gas target that we plan to use in place of
the NMR probe that is located inside of DI. We the CH2 solid target. The gas cell will allow us to
have modified the probe mount with a bellows that substantially increase the beam current and, hence,
allows us to pull the probe out of the way after the increase the yield of recoils like 57Cu so that we can
magnetic field is set. Of course we cannot monitor study their decay or carry out secondary reaction
the magnetic field in D I with the probe out but we measurements. The gas cell will be tested in the
use a common power supply for DI and D2. Thus MARS target chamber in May once again with the
by monitoring D2, we can detert,ine how stable that 58Ni beam. We will monitor the 57Cu yield as a
supply is. DI also uses a trim coil supply so that we function of gas pressure and thereby de_ern_ne the
can adjust the D 1 and D2 fields independently over a cross section for the reaction and the expected yield
small range. The current in the trim supply must of 57Cu for beta decay measurements that we plan to
change by a significant amount before it causes an carry out beginning in the summer of '93.
adverse effect on the magnetic field in D I.
V- 139
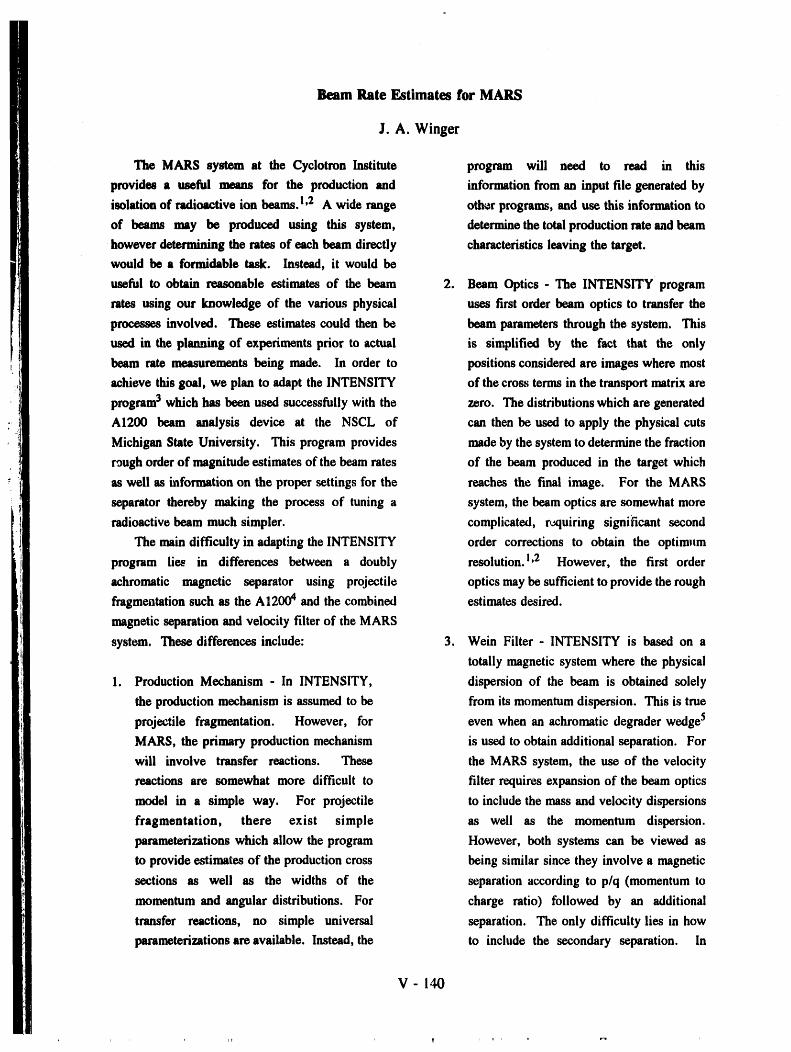
Beam Rate Estimates for MARS
J. A. Winger
The MARS system at the Cyclotron Institute program will need to read in this
provides a useful means for the production and information from an input file generated by
isolation of radioactive ion beams. !,2 A wide range other programs, and use this information to
of beams may be produced using this system, determine the total production rate aad beam
however determining the rates of each beam directly characteristics leaving the target.
would be a formidable task. Instead, it would be
useful to obtain reasonable estimates of the beam 2. Beam Optics - The INTENSITY program
rates using our knowledge of the various physical uses first order beam optics to transfer the
processes involved. These estimates could then be beam parameters through the system. This
used in the planning of experiments prior to actual is simplified by the fact that the only
beam rate measurements being made. In order to positions considered are images where most
achieve this goal, we plan to adapt the INTENSITY of the cross terms in the transport matrix are
program3 which has been used successfully with the zero. The distributions which are generated
A1200 beam analysis device at the NSCL of can then be used to apply the physical cuts
Michigan State University. This program provides made by the system to determine the fraction
rough order of magnitude estimates of the beam rates of the beam produced in the target which
as well as information on the proper settings for the reaches the final image. For the MARS
separator thereby making the process of tuning a system, the beam optics are somewhat more
radioactive beam much simpler, complicated, r,.xluiring significant second
The main difficulty in adapting the INTENSITY order corrections to obtain the optim, m
program lies in differences between a doubly resolution. 1,2 However, the first order
achromatic magnetic separator using projectile optics may be sufficient to provide the rough
fragmentation such as the A12004 and the combined estimates desired.
magnetic separation and velocity filter of the MARS
system. These differences include: 3. Wein Filter - INTENSITY is based on a
totally magnetic system where the physical
1. Production Mechanism - In INTENSITY, dispersion of the beam is obtained solely
the production mechanism is assumed to be from its momentum dispersion. This is true
projectile fragmentation. However, for even when an achromatic degrader wedge 5
MARS, the primary production mechanism is used to obtain additional separation. For
will involve transfer reactions. These the MARS system, the use of the velocity
reactions are somewhat more difficult to filter requires expansion of the beam optics
model in a simple way. For projectile to include the mass and velocity dispersions
fragmentation, there exist simple as well as the momentum dispersion.
parameterizations which allow the program However, both systems can be viewed as
to provide estimates of the production cross being similar since they involve a magnetic
sections as well as the widths of the separation according to p/q (momentum to
momentum and angular distributions. For charge ratio) followed by an additional
transfer reactions, no simple universal separation. The only difficulty lies in how
parameterizations are available. Instead, the to include the secondary separation. In
V-140
general, the MARS system will be important information for understanding results being
considered in two stages: the first stage obtained in an experiment.
being the magnetic separation according to The development of the MDM analysis
p/q with the second stage being the velocity system at the Cyclotron Institute will allow the
filter. This simplifies analysis of the system production and use of radioactive ion beams in
to just three positions: target, dispersive experimental devices not easily coupled to the MARS
image, and fmal image, system. Since the MDM system will be similar in
design to the AI200, the INTENSITY program will
4. Lower Beam Energy - Since the beams be easily adapted to this new system. Doing this, we
available from the KS00 cyclotron are will then be able to make useful predictions
somewhat lower in energy than those concerning theintensitiesofradioactivebeamswhich
considered in the design of the INTENSITY could be used for various secondary interaction
program, changes may be necessary in the experiments.
various energy loss, scattering, and charge
state distribution calculations for good References
results to be obtained.
1. R. E. Tribble, R. H. Burch, and C. A.
These differences are being considered in detail at the Gagliardi, Nucl. Instrum. Meth. A285, 441
present as plans are being form-lated as to the best (1989).
tnethod for modifying the program. 2. R. E. Tribble, C. A. Gagliardi, and W. Liu,
A major advantage of a program such as Nucl. Instrum. Meth. 1356/57, 956 (1991).
INTENSITY lies in the ability to estimate the proper 3. J. A. Winger, B. M. Sherfill, and D. J.
settings for the separator. This information greatly Morrissey, Nucl. Instrum. Meth. B70, 380
reduces the time required to identify, optimize, and (1992).
achieve the best separation for a radioactive beam 4. B. M. Sherrill, D. J. Morrissey, J. A. Nolen
under any set of conditions. An additional advantage Jr., and J. A. Winger, Nuci. Instrum. Meth.
lies in the programs "user friendly" environment B56/57, 1106 (1991).
which involves the use of a set of menus which can 5. J.P. Dufour, R. Del Moral, H. Emmermann, F.
be easily followed with only minimal instruction. In Hubert, D. Jean C. Poinot, M. S. Pravikoff,
addition, it does not require the user to const_ct any and A. Fleury, Nucl. Instrum. Meth. A248, 267
complicated input files in order for the program to be (1986).
useful. (The primary input files are either in
existence, or can be generated by the program itself.)
Although adapting the program to be used with the
MARS system may require adopting the use of some
additional input files (input of production cross
sections is already available), we will strive to make
the production of these files available from additional
menu driven programs. Finally, the program
contains a large number of sub-units which allow
calculation of energy losses, multiple scattering,
ranges, e_. These sub-units are also easily
accessible through the menu system and provide
V- 141
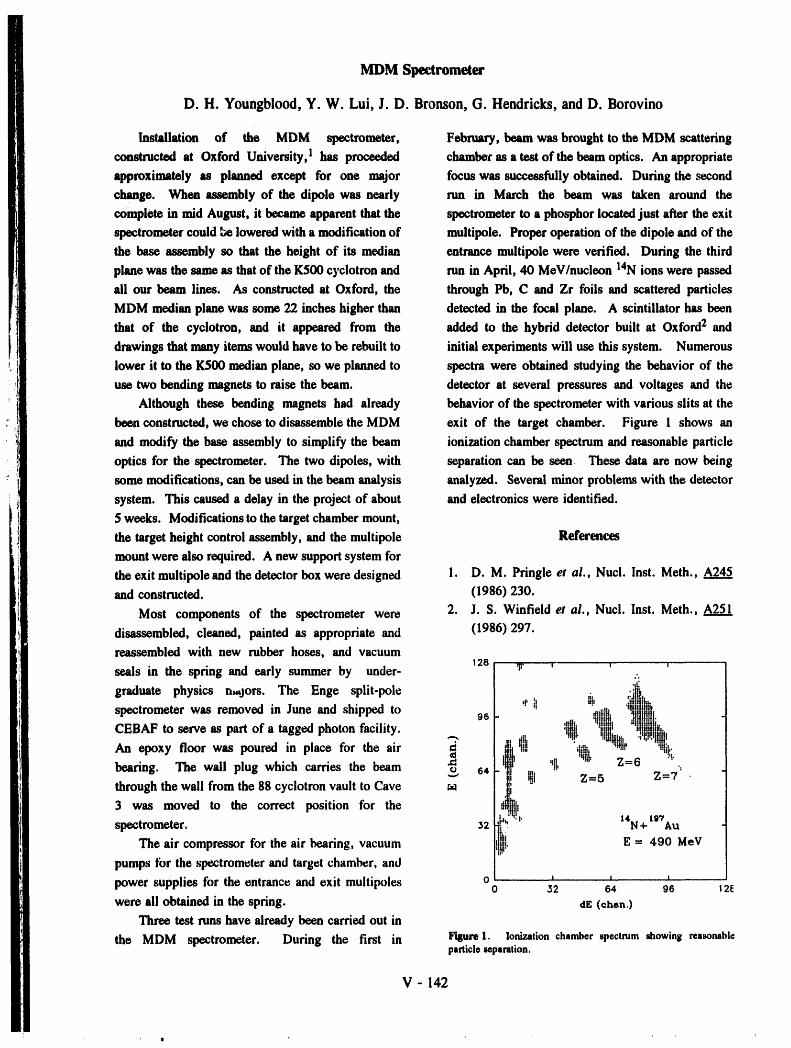
MDM Spectrometer
D. H. Youngblood, Y. W. Lui, J. D. Bronson, G. Hendricks, and D. Borovino
Installation of the MDM spectrometer, February, beam was brought to the MDM scattering
constructed at Oxford University, 1 has proceeded chamber as a test of the beam optics. An appropriate
approximately as planned except for one major focus was successfully obtained. During the second
change. When assembly of the dipole was nearly run in March the beam was taken around the
complete in mid August, it became apparent that the spectrometer to a phosphor located just after the exit
spectrometer could be lowered with a modification of multipole. Proper operation of the dipole and of the
the base assembly so that the height of its median entrance multipole were verified. During the third
plane was the same as that of the K500 cyclotron and run in April, 40 MeV/nucleon 14N ions were passed
all our beam lines. As constructed at Oxford, the through Pb, C and Zr foils and scattered particles
MDM median plane was some 22 inches higher than detected in the focal plane. A scintillator has been
that of the cyclotron, and it appeared from the added to the hybrid detector built at Oxford2 and
drawings that many items would have to be rebuilt to initial experiments will use this system. Numerous
lower it to the K500 median plane, so we planned to spectra were obtained studying the behavior of the
use two bending magnets to raise the beam. detector at several pressures and voltages and the
Although these bending magnets had already behavior of the spectrometer with various slits at the
been constructed, we chose to disassemble the MDM exit of the target chamber. Figure 1 shows an
and modify the base assembly to simplify the beam ionization chamber spectrum and reasonable particle
optics for the spectrometer. The two dipoles, with separation can be seen These data are now being
some modifications, can be used in the beam analysis analyzed. Several minor problems with the detector
system. This caused a delay in the project of about and electronics were identified.
5 weeks. Modifications to the target chamber mount,
the target height control assembly, and the multipole References
mount were also required. A new support system for
the exit multipole and the detector box were designed 1. D.M. Pringle et al., Nucl. Inst. Meth., A245and constructed. (1986) 230.
2. J. S. Winfield et al., Nucl. Inst. Meth., A251Most components of the spectrometer were
disassembled, cleaned, painted as appropriate and (1986) 297.
reassembled with new rubber hoses, and vacuum
seals in the spring and early summer by under- 128 ,. , , ,.'.
graduate physics n,,,jors. The Enge split-pole 'rll .,,i n['°Nl_'tt"I"l_][]i]]i]l[_spectrometer was removed in June and shipped to 9e ti
CEBAF to serve as part of a tagged photon facility. -. _l_l[. '!!W_, I![!l!it!lh,
An epoxy floor was poured in place for the air _ _i i]h ',l_][b -_r_6 "lqiti'
bearing. The wall plug which carries the beam _ 64 d_|'!I I_1 Z-5 Z=7 .
through the wall from the 88 cyclotron vault to Cave
3 was moved to the correct position for the l,. t41q+W_Auspectrometer. 32
The air compressor for the air bearing, vacuum . E = 490 MeVpumps tbr the spectrometer and target chamber, and
power supplies for the entrance and exit multipoles o , J0 32 64 96 t 2E
were all obtained in the spring, dE (than.)
Three test runs have already been carried out in
the MDM spectrometer. During the first in ieqparel. Ionizationchamberspectrumshowing reasonableparticle separation.
V - 142
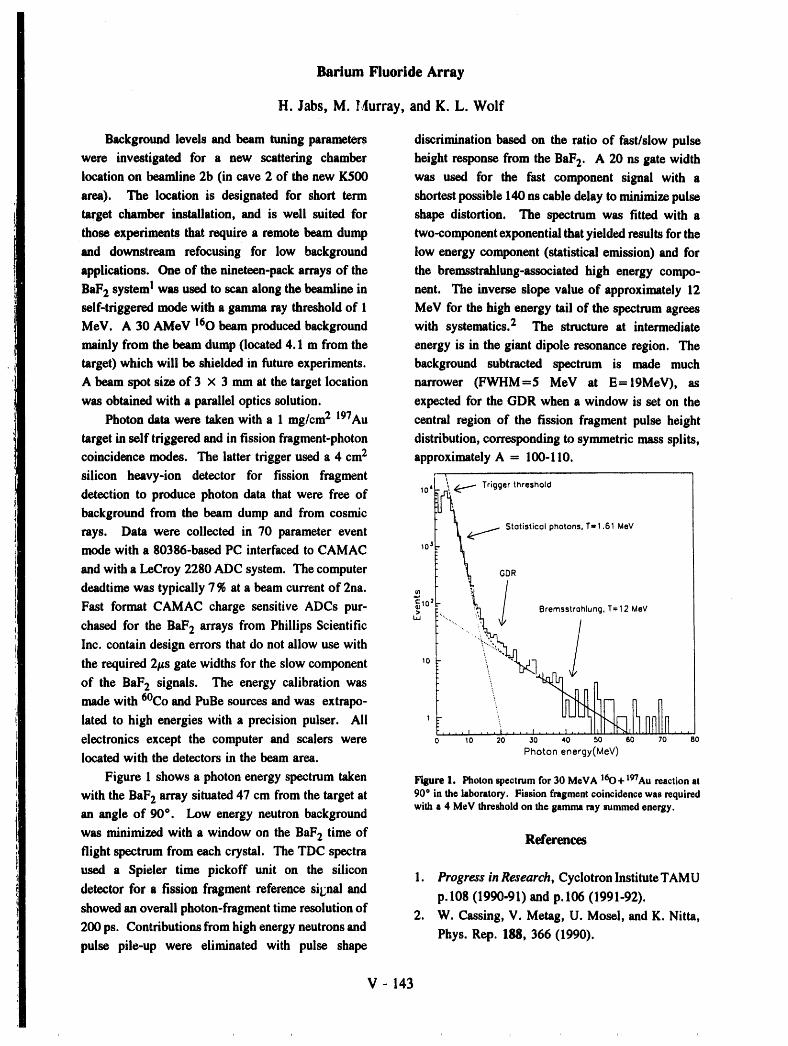
Barium Fluoride Array
H. Jabs, M. I_4urray, and K. L. Wolf
Background levels and beam tuning parameters discrimination based on the ratio of fast/slow pulse
were investigated for a new scattering chamber height response from the BaF2. A 20 ns gate width
location on beamline 2b (in cave 2 of the new K500 was used for the fast component signal with a
area). The location is designated for short term shortest possible 14Onscable delay to minimizepulse
target chamber installation, and is well suited for shape distortion. The spectrum was fitted with a
those experiments that require a remote beam dump two-componentexponential that yielded results for the
and downstream refocusing for low background low energy component (statistical emission) and for
applications. One of the nineteen-pack arrays of the the bremsstrahlung-associated high energy compo-
BaF2 system I was used to scan along the beamline in nent. The inverse slope value of approximately 12
self-triggered mode with a gamma ray threshold of I MeV for the high energy tail of the spectrum agrees
MeV. A 30 AMeV 160 beam produced background with systematics. 2 The structure at intermediate
mainly from the beam dump (located 4.1 m from the energy is in the giant dipole resonance region. The
target) which will be shielded in future experiments, background subtracted spectrum is made much
A beam spot size of 3 x 3 mm at the target location narrower (F_Aq-IM=5 MeV at E- 19MeV), as
was obtained with a parallel optics solution, expected for the GDR when a window is set on the
Photon data were taken with a 1 mg/cm2 197Au central region of the fission fragment pulse height
target in self triggered and in fission fragment-photon distribution, corresponding to symmetric mass splits,
coincidence modes. The latter trigger used a 4 cm2 approximately A - 100-110.
silicon heavy-ion detector for fission fragment ,,
detection to produce photon data that were free of _o,t_,_..- Triggerthreshold
background from the beam dump and from cosmic I _ _ $totisticol photons, T=1.6'I MeVrays. Data were collected in 70 parameter eventmodewith a 80386-basedPC interfacedto CAMAC _03L- L
and with a LeCroy 2280 ADC system. The computer I _ CDR
deadtime was typically 7 % at a beam current of 2na. '_ t _ /
Fast format CAMAC charge sensitive ADCs pur- _'ClOZL-"............ "_i', _ Bremsstrohlung, T=12MeVchasedfor the BaF2 arrays from Phillips Scientific
Inc. containdesign errors thatdo notallow usewith
the required 2#s gate widths for the slow component to \
of the BaF2 signals. The energy calibration was ._made with 6°Co and PuBe sources and was extrapo- _1_lated to high energies with a precision pulser. All _electronics except the computer and scalers were o lo 20 3o 4o _o eo 70 so
Photon energy(MeV)located with the detectors in the beamarea.
Figure 1 shows a photon energy spectrum taken Figure 1. Photon spectrum for 30 MeVA 160+ xg"/Aureaction at
with the BaF2 array situated 47 cm from the target at 90o inthe laboratory. Fission fragment coincidencewas requiredwith a 4 MeV threshold on the gamma ray summed energy.
an angle of 90 °. Low energy neutron background
was minimized with a window on the BaF2 time of Referencesflight spectrum from each crystal. The TDC spectra
used a Spieler time pickoff unit on the silicon1. Progress in Research, Cyclotron Institute TAMU
detector for a fission fragment reference sit;nal andp.108 (1990-91) and p.106 (1991-92).
showed an overall photon-fragment time resolution of2. W. Cassing, V. Metag, U. Mosel, and K. Nitta,
200 ps. Contributions from high energy neutrons andPhys. Rep. 188, 366 (1990).
pulse pile-up were eliminated with pulse shape
V- 143
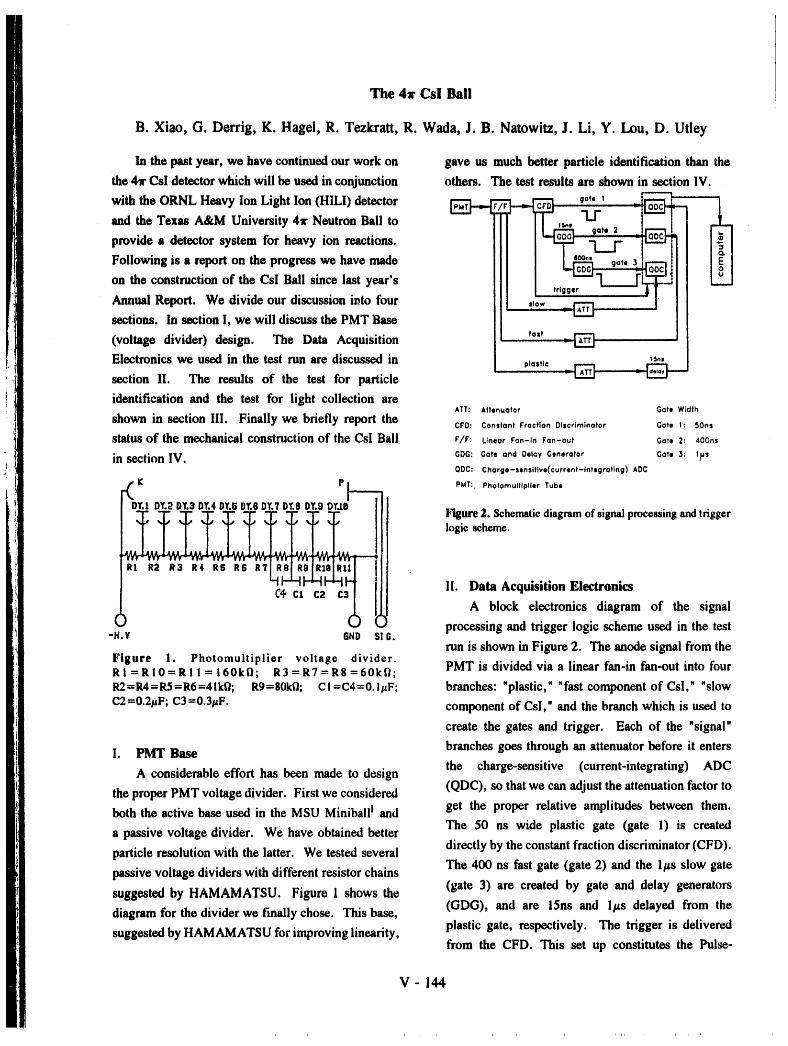
The 4/- Csl Bali
B. Xiao, G. Derrig, K. Hagel, R. Tezkratt, R. Wada, J. B. Natowitz, J. Li, Y. Lou, D. Utley
Inthe past year, we have continued our work on gave us much better particle identification than the
the 4x Csl detector which will be used in conjunction others. The test results are shown in section IV.
/_gate, _[2--_t_I_ '_
withtheORNL Heavy IonLightIon(HILl)detector _ _'_ _i "U" -j_and the Texas A&M University 4x Neutron Ball to ,,. ,
got.2 j_ ._provide a detector system for heavy ion reactions. -L_J--]__. r -j_"Following is a report on the progress we have made ,_.. gate 3I1"_
on the construction of the Csl Ball since last year's trigger y "--_
Annual Report. We divide our discussion into four ,,a, _sections. In section I, we will discuss the PMT Base
(voltage divider) design. The Data Acquisition fast =rT_]
Electronics we used in the test run are discussed in p_ast_c ,s.,
section II. The results of the test for particle _r_,] . _
identification and the test for light collection areATT: Attenuator Gate Width
shown in section III. Finally we briefly report the CrO: Constant fraction Discrim;nator Gate I: SOns
status of the mechanical construction of the CsI Ball r/r: L_nearro,-_n fan-out Go,,Z. _00,,
in section IV. GDG: Gate and Delay Generator Gate 3: lps
QDC: Charge-sensitive(current-integrating) ADC
"_J_ PB_ PMT: Photomultipller Tube0t".1DY._01'.3D¥.4DY.501".8DY.?O_'.8DY.9Ol'.l J Figure2. Schematicdiagramof signalprocessingandtrigger
I! 'o--.II. Data Acquisition Electronics
) C,/,ct c2 c3(_ _ A block electronics diagram of the signal( processing and trigger logic scheme used in the test-H.¥ fiND SIG.run is shown in Figure 2. The anode signal from the
Figure 1. Photomultiplier voltage divider. PMT is divided via a linear fan-in fan-out into fourRI =RI0=RI 1 = 160kfl; R3=R7=R8 =60kfi;R2=R4=RS=R6=41kf_; R9-80k0; CI=C4=0.1#F; branches: "plastic," "fast component of Csl," "slow
C2=0.2/_F; C3=0.3#F. component of Csl," and the branch which is used to
create the gates and trigger. Each of the "signal"
I. PMT Base branches goes through an attenuator before it entersthe charge-sensitive (current-integrating) ADC
A considerable effort has been made to design
the proper PMT voltage divider. First we considered (QDC), so that we can adjust the attenuation factor toboth the active base used in the MSU Miniball ! and get the proper relative amplitudes between them.
The 50 ns wide plastic gate (gate 1) is createda passive voltage divider. We have obtained better
particle resolution with the latter. We tested several directly by the constant fraction discriminator (CFD).The 400 ns fast gate (gate 2) and the l_ts slow gatepassive voltage dividers with different resistor chains
suggested by HAMAMATSU. Figure 1 shows the (gate 3) are created by gate and delay generators
diagram for the divider we finally chose. This base, (GDG), and are 15ns and l/_s delayed from the
suggested by HAMAMATSU for improving linearity, plastic gate, respectively. The trigger is deliveredfrom the CFD. This set up constitutes the Pulse-
V- 144
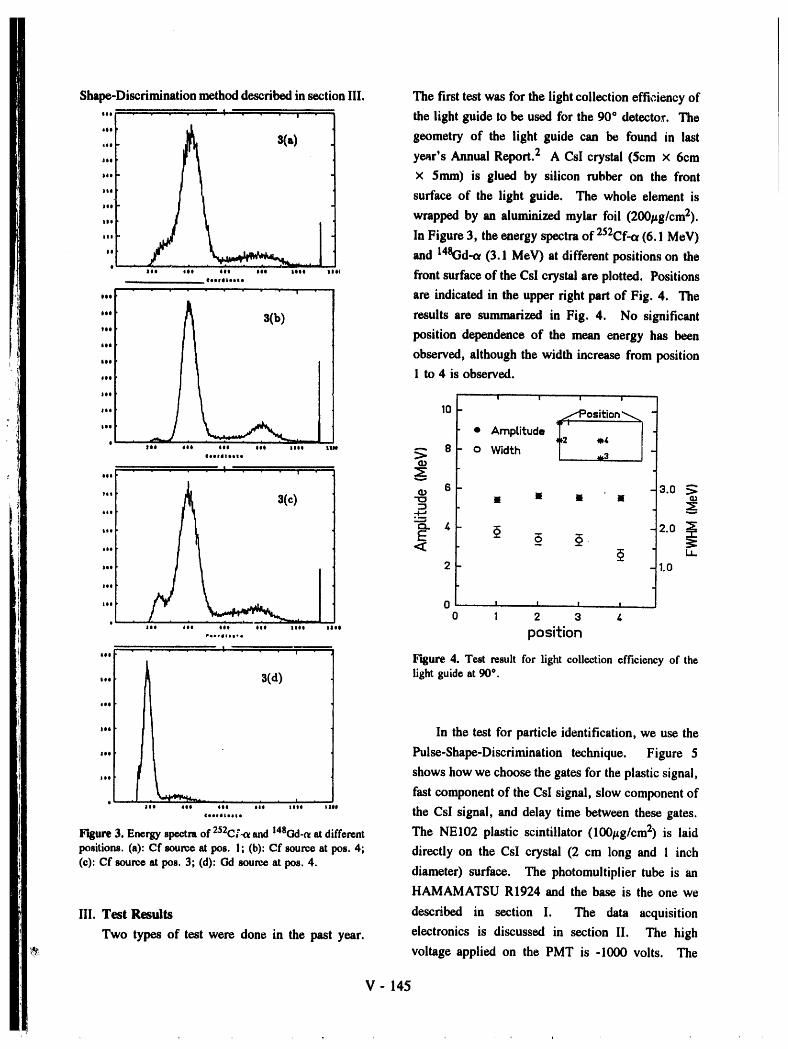
Shape-Discrimination method described in section III. The first test was for the light collection efficiency of
,.. ...... , . t . - the light guide to be used for the 90 ° detector. The
iii 3(a) geometry of the light guide can be found in last
,,. year's Annual Report.2 A Csl crystal (5cm x 6cm
-. × 5mm) is glued by silicon rubber on the front
"' surface of the light guide. The whole element is
',ii , wrappedby an aluminizedmylarfoil(200/_g/cm2).
"' I In Figure 3, the energy spectra of 252Cf-c_ (6. I MeV)
", / .... _. 1 and 148Gd-ot(3.1 MeV) at different positions on the"' '" ,..,,,..,.'" '" '"' "" front surface of the Csl crystal are plotted. Positions
,.. F " ' are indicated in the upper right part of Fig. 4. The
'"t ]_ S(b) results are summarized in Fig. 4. No significant
It
i:i I1 _ position dependence of the mean energy has been,,. I observed, although the width increase from position
,,. r 1 to 4 is observed./
leI _
I ' ' ' '
'"E '° °.,,,°°-"' • Amptitude,I . _ , , , .. _
,,, ,, ,,, ,,, ,,,, s,_ ---. 8 o Widthe,,,lls,,, _ I _3{D
t s 3.o ._'"t _ i I J a.)"I_ I
,,,I. _ _"
2.0"'r,..F "< _ u_,..L 2 1.o
' Iaoe _
ts,[ 0 I I I I. __ o 1 2 3 ,_• |
' ........ ,..,,,.... "' '"' "" posH:ion,, ..... |
"' ' " Figure 4. Test result for light collection efficiency of the,.. light guideat 90°.
t|e
'" In the test for particle identification, we use the
,,. Pulse-Shape-Discrimination technique. Figure 5
... shows how we choose the gates for the plastic signal,
fast component of the CsI signal, slow component oft
'............... ,.._,,,.,. '"' the CsI signal, and delay time between these gates.
Figure 3. Energyspectraof 252C_',-¢Xand 148Gd-o_atdifferent The NEI02 plastic scintillator (100_tg/cm 2) is laid
positions.(a): Cf sourceat pos. I; (b): Cf sourceat pos. 4; directly on the CsI crystal (2 cm long and l inch(c): cf source at pos. 3; (d): Gd sourceat pos. 4.
diameter) surface. The photomultiplier tube is an
HAMAMATSU R1924 and the base is the one we
III. Test Resuits described in section I. The data acquisition
Two types of test were done in the past year. electronics is discussed in section II. The high
_ voltage applied on the PMT is -1000 volts. The
V - 145
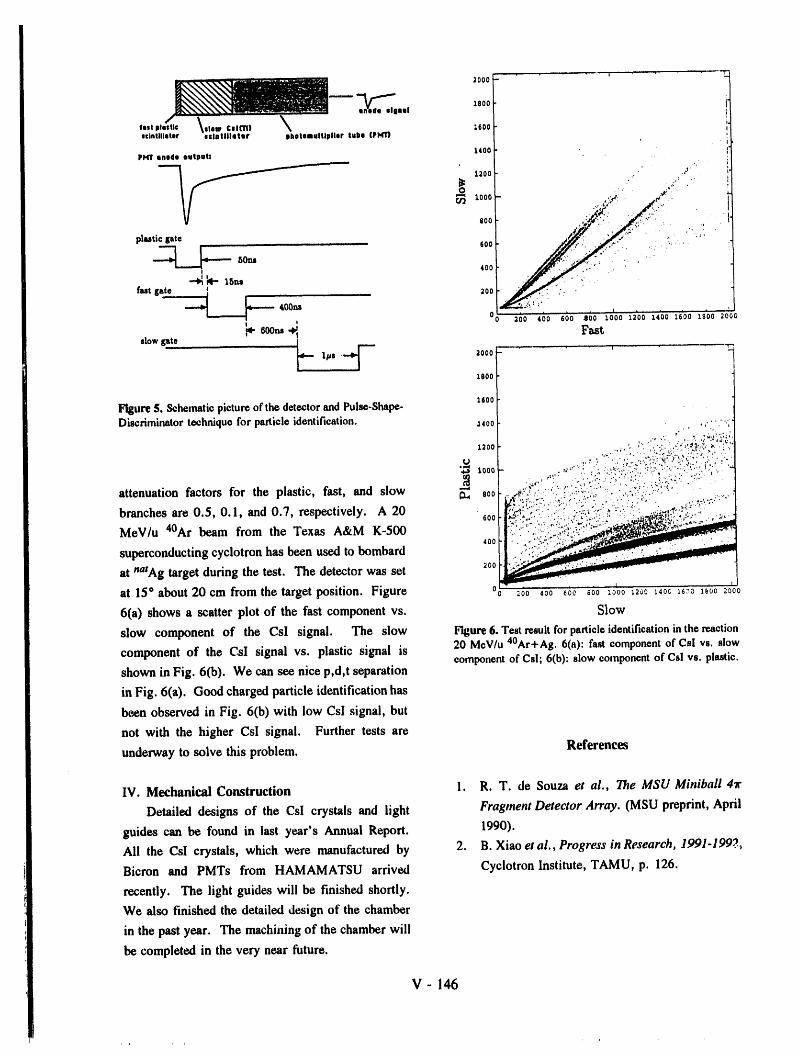
_000 - - v ....... ' ' " ' -'-_
atl
eclntlllster eclntlllutu¢ photsmulUlHler tul)o (PNrl3
Pl.(lr suede output; 1400
• .. ," ., i:!:
r,_ tooo ,";_'_ . _¢,_'P_ i
plastic gate 600 '
-_.__ 50no 4OO
,.t..,. ___ __ 200400ns . .
°o 2_o'_Go6Goago lo'oo12'ooffoo Iioo lloo 2o'_o_-60o__ Fast
slow pte _--- Ips -._ 2ooOl0oo-L-- .r ....... , i
Figure5. Scheinaticpictureofthe detectorandPulse-Shape- z600Discriminatortechniquefor particle identification. _,00 , , •".'_'-',
• ...'' : ,, _'._'_::_ -'*_:L:,1200 .. ;. "- ' : ,-. ":::-.:/'._'. _'.",_'..,_:,'". • : ,,
._ ...,:': : : :.:.':'.::':._,::.,'..:.":,.t:..:...i',., • ..• ._;-. ., , :..,, • .....- .;.._
.,._,:"' .. -_ "'....,; ..; ,. ",'- . .:L;;. "_. •. , :,,-.d .,"." . . _.¢''"''.',,'. ' .'-,',' :_'.*".;, •
attenuation factors for the plastic, fast, and slow O., eoo ._..,::. :.-..:'_,::._.," :.',',;i_:'." :......:_, ." _";:,_,'. . '_.:.," ,::i' ". ,." :'," !':, '" • _,.'.7:_";-" '.._..,'-' .-: .... ,.',,._ v. ". , ., .¢, z..., .
branches are 0.5, 0.1 and 0.7, respectively. A 20 6oo ,--:.-,.,. :.:. _.:,::.. ....... .. ,_::,..... ,-_,., s._ r ' ." - .-',., ', .... .. ..'._L_._,..-, .
MeV/u 40Ar beam from the Texas A&M K-500 [!ii'?! ' _: "__' _ .........."......
400 _1_
superconducting cyclotron has been used to bombard
at natAg target during the test. The detector was set 2oo
at 15° about 20 cm from the target position. Figure o _oo ,oo _oo _oo :ooo _o _o_ _ _oo _0_oo
6(a) shows a scatter plot of the fast component vs. Slow
slow component of the CsI signal. The slow Figure 6. Testresultforparticle identificationin thereaction
component of the CsI signal vs. plastic signal is 20 MeV/u 4°Ar+Ag. 6(a): fast component of Csl vs. slowcomponent of Csl; 6(b): slow component of Csl vs. plastic.shown in Fig. 6(b). We can see nice p,d,t separation
in Fig. 6(a). Good charged particle identification has
been observed in Fig. 6(b) with low CsI signal, but
not with the higher Csl signal. Further tests are
underway to solve this problem. References
IV. Mechanical Construction 1. R. T. de Souza et al., The MSU Miniball 4_r
Detailed designs of the CsI crystals and light Fragment Detector Array. (MSU preprint, April
guides can be found in last year's Annual Report. 1990).
All the CsI crystals, which were manufactured by 2. B. Xiao etal., Progress in Research, 1991-199_
Bicron and PMTs from HAMAMATSU arrived Cyclotron Institute, TAMU, p. 126.
recently. The light guides will be finished shortly.
We also finished the detailed design of the chamber
in the past year. The machining of the chamber will
be completed in the very near future.
V- 146
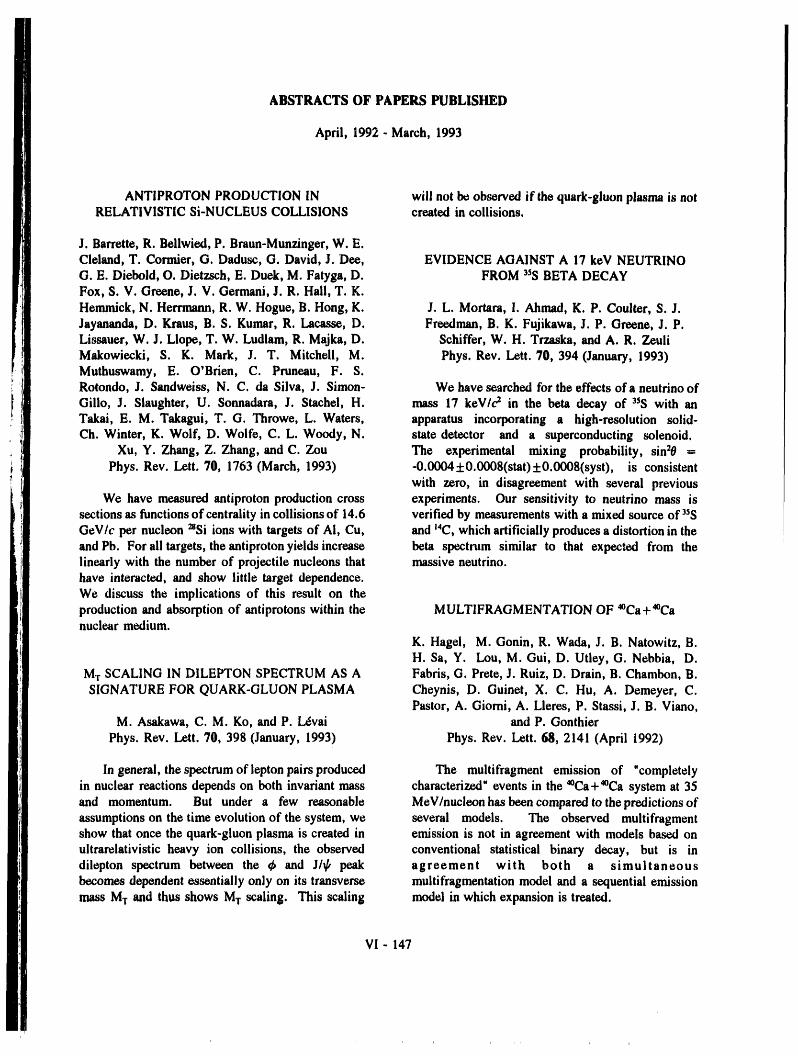
ABSTRACTS OF PAPERS PUBLISHED
April, 1992- March, 1993
ANTIPROTON PRODUCTION IN will not be observed if the quark-gluon plasma is notRELATIVISTIC Si-NUCLEUS COLLISIONS created in collisions.
J. Barrette, R. BeUwied, P. Braun-Munzinger, W. E.Cleland, T. Cormier, G. Dadusc, G. David, J. Dee, EVIDENCE AGAINST A 17 keV NEUTRINO
G. E. Diebold, O. Dietzsch, E. Duek, M. Fatyga, D. FROM 35SBETA DECAYFox, S. V. Greene, J. V. Germani, J. R. Hall, T. K.
Hemmick, N. Herrmann, R. W. Hogue, B. Hong, K. J.L. Mortara, I. Ahmad, K. P. Coulter, S. J.Jayananda, D. Kraus, B. S. Kumar, R. Lacasse, D. Freedman, B. K. Fujikawa, J. P. Greene, J. P.Lissauer, W. J. Llope, T. W. Ludlam, R. Majka, D. Schiffer, W. H. Trzaska, and A. R. Zeuli
Makowiecki, S. K. Mark, J. T. Mitchell, M. Phys. Rev. Lett. 70, 394 (January, 1993)Muthuswamy, E. O'Brien, C. Pruneau, F. S.Rotondo, J. Sandweiss, N. C, da Silva, J. Simon- We have searched for the effects of a neutrino of
Gillo, J. Slaughter, U. Sonnadara, J. Stachel, H. mass 17 keV/c 2 in the beta decay of 3sS with anTakai, E. M. Takagui, T. G. Throwe, L. Waters, apparatus incorporating a high-resolution solid-Ch. Winter, K. Wolf, D. Wolfe, C. L. Woody, N. state detector and a superconducting solenoid.
Xu, Y. Zhang, Z. Zhang, and C. Zou The experimental mixing probability, sin20 =Phys. Rev. Lett. 70, 1763 (March, 1993) -O.0004+0.0008(stat)+0.0008(syst), is consistent
with zero, in disagreement with several previousWe have measured antiproton production cross experiments. Our sensitivity to neutrino mass is
sections as functions of centrality in collisions of 14.6 verified by measurements with a mixed source of 3ssGeV/c per nucleon _Si ions with targets of AI, Cu, and _4C,which artificially produces a distortion in theand Pb. For aU targets, the antiprotonyieids increase beta spectrum similar to that expected from thelinearly with the number of projectile nucleons that massive neutrino.have interacted, and show little target dependence.We discuss the implications of this result on the
production and absorption of antiprotons within the MULTIFRAGMENTATION OF 4°Ca+4°Canuclear medium.
K. Hagei, M. Gonin, R. Wada, J. B. Natowitz, B.H. Sa, Y. Lou, M. Gui, D. Utley, G. Nebbia, D.
MT SCALING IN DILEPTON SPECTRUM AS A Fabris, G. Prete, J. Ruiz, D. Drain, B. Chambon, B.SIGNATURE FOR QUARK-GLUON PLASMA Cheynis, D. Guinet, X. C. Hu, A. Demeyer, C.
Pastor, A. Giorni, A. Lleres, P. Stassi, J. B. Viano,M. Asakawa, C. M. Ko, and P. L6vai and P. Gonthier
Phys. Rev. Lett. 70, 398 (January, 1993) Phys. Rev. Lett. 68, 2141 (April 1992)
In general, the spectrum of lepton pairs produced The multifragment emission of "completelyin nuclear reactions depends on both invariant mass characterized" events in the 4°Ca+®Ca system at 35and momentum. But under a few reasonable MeV/nucleon has been compared to the predictions of
assumptions on the time evolution of the system, we several models. The observed multifragmentshow that once the quark-gluon plasma is created in emission is not in agreement with models based onultrarelativistic heavy ion collisions, the observed conventional statistical binary decay, but is indilepton spectrum between the _ and J/_, peak agreement with both a simultaneousbecomes dependent essentially only on its transverse multifragmentation model and a sequential emissionmass MT and thus shows Mx scaling. This scaling model in which expansion is treated.
VI- 147
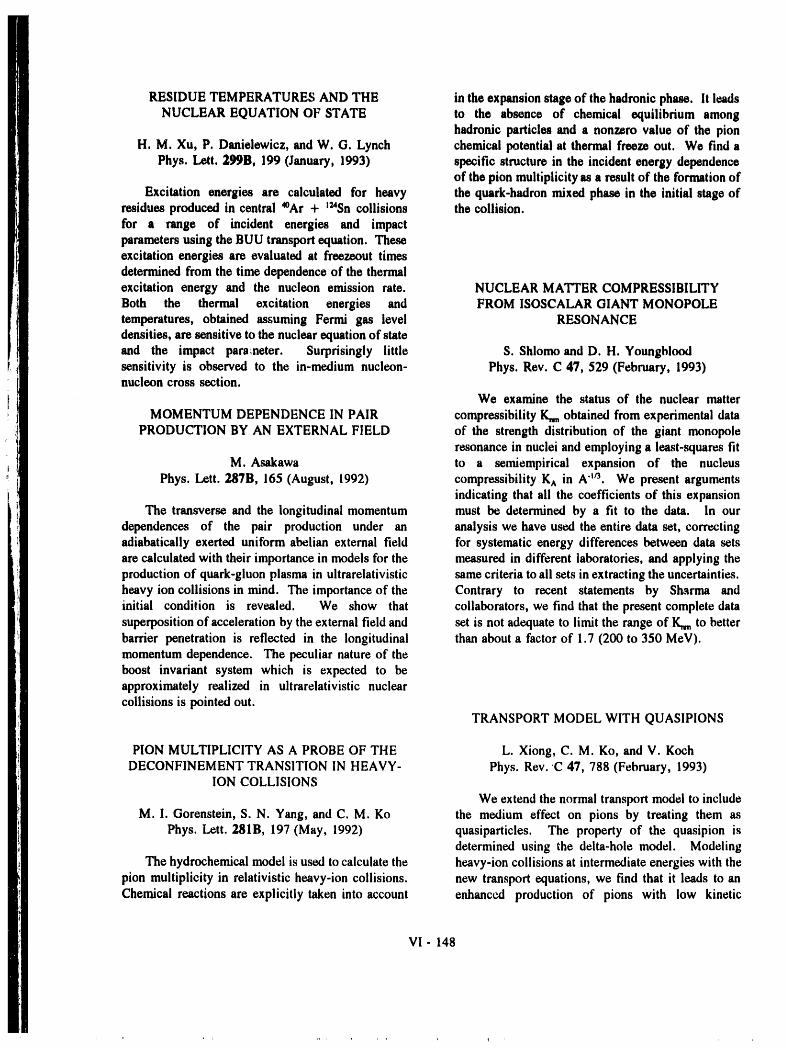
RESIDUE TEMPERATURES AND THE in the expansion stage of the hadronic phase. It leadsNUCLEAR EQUATION OF STATE to the absence of chemical equilibrium among
hadronic particles and a nonzero value of the pionH. M. Xu, P. Danielewicz, and W. G. Lynch chemical potential at thermal freeze out. We find a
Phys. Lett. 299B, 199 (January, 1993) specific structure in the incident energy dependenceof the pion multiplicity as a result of the formation of
Excitation energies are calculated for heavy the quark-hadron mixed phase in the initial stage ofresidues produced in central 4°Ar + :USn collisions the collision.for a range of incident energies and impactparameters using the BUU transport equation. Theseexcitation energies are evaluated at freezeout timesdetermined from the time dependence of the thermalexcitation energy and the nucleon emission rate. NUCLEAR MATTER COMPRESSIBILITY
Both the thermal excitation energies and FROM ISOSCALAR GIANT MONOPOLEtemperatures, obtained assuming Fermi gas level RESONANCEdensities, are sensitive to the nuclear equation of stateand the impact para_neter. Surprisingly little S. Shlomoand D. H. Youngbloodsensitivity is observed to the in-medium nucleon- Phys. Rev. C 47, 529 (February, 1993)nucleon cross section.
We examine the status of the nuclear matter
MOMENTUM DEPENDENCE IN PAIR compressibility K_ obtained from experimental dataPRODUCTION BY AN EXTERNAL FIELD of the strength distribution of the giant monopole
resonance in nuclei and employing a least-squares fitM. Asakawa to a semiempirical expansion of the nucleus
Phys. Lett. 287B, 165 (August, 1992) compressibility K^ in A"tt3. We present argumentsindicating that all the coefficients of this expansion
The transverse and the longitudinal momentum must be determined by a fit to the data. In ourdependences of the pair production under an analysis we have used the entire data set, correctingadiabatically exerted uniform abelian external field for systematic energy differences between data setsare calculated with their importance in models for the measured in different laboratories, and applying theproduction of quark-gluon plasma in ultrarelativistic same criteria to all sets in extracting the uncertainties.heavy ion collisions in mind. The importance of the Contrary to recent statements by Sharma andinitial condition is revealed. We show that collaborators, we find that the present complete data
superposition of acceleration by the external field and set is not adequate to limit the range of K,,mto betterbarrier penetration is reflected in the longitudinal than about a factor of 1.7 (200 to 350 MeV).momentum dependence. The peculiar nature of theboost invariant system which is expected to beapproximately realized in ultrarelativistic nuclearcollisions is pointed out.
TRANSPORT MODEL WITH QUASIPIONS
PION MULTIPLICITY AS A PROBE OF THE L. Xiong, C. M. Ko, and V. KochDECONFINEMENT TRANSITION IN HEAVY- Phys. Rev. C 47, 788 (February, 1993)
ION COLLISIONS
We extend the normal transport model to includeM. I. Gorenstein, S. N. Yang, and C. M. Ko the medium effect on pions by treating them as
Phys. Lett. 281B, 197 (May, 1992) quasiparticles. The property of the quasipion isdetermined using the delta-hole model. Modeling
The hydrochemical model is used to calculate the heavy-ion collisions at intermediate energies with thepion multiplicity in relativistic heavy-ion collisions, new transport equations, we find that it leads to anChemical reactions are explicitly taken into account enhanc-cd production of pions with low kinetic
VI- 148
energies, This gives a plausible explanation for the of pion-nucleon scattering, tending to confirm theobserved enhancement of soft pions in the Bevalac need for an upward renormalization of the angularexperiments, distribution by ~ 10 %.
MASS ASYMMETRY, EQUATION OF STATE,AND NUCLEAR MULTIFRAGMENTATION
DISAPPEARANCE OF ROTATION IN HEAVY-ION COLLISIONS H.M. Xu
Phys. Rex,. C 46, R2144 (December, 1992)H. M. Xu
Phys. Rev. C 47, 891 (February, 1993) Muitifragmentation is observed with an improvedBoltznmnn-Uehling-Uhlenbeck model for deAr+SSV
The azimuthal distributions of nucleons are and _Mo+_Mo collisions. For nC induced
studied for central _°Ar + mV collisions from E/A = reactions, however, a single residue is observed up to35 to 125 MeT based on a Boltzmann equation. We energy E/A _ 200 MeT. By investigating thedemonstrate that the contribution to azimuthal dependence on the masses of the projectile and targetasymmetry from residue rotation decreases with and on the equation of state, we demonstrate that theincident energy and eventually vanishes at energies dynamics of compression and expansion, rather thanE/A > 75 MeT. In contrast, the contribution from the thermal excitation energy, plays the dominant rolethe directed transverse motion remains important in causing the observed multifragmentation.throughout the energy range investigated. We showthat the disappearance of rotation is mainly associated EXPLORING THE VALIDITY OF Z= 38 ANDwith the onset of multifragmentation for which the Z-50 PROTON CLOSED SHELLS IN EVEN-thermal instabilities appear to play a minor role. EVEN Me ISOTOPES
DIFFERENTIAL CROSS SECTION FOR n-p H. Dejbakhsh, D. Latypov, G. Ajupova, andELASTIC SCATTERING IN THE ANGULAR S. Shlomo
REGION 50 ° <0.< 180 ° AT 459 MeT Phys. Rev. C 46, 2326 (December, 1992)
L. C. Northcliffe, M. Jain, M. L. Evans, G. Glass, Energy spectra, B(E2) values, and ratios of theJ. C. Hiebert, R. A. Kenefick, B. E. Bonner, J.E. neutron-rich even-even Me isotopes in the mass 100
Simmons, C. W. Bjork, and P. J. Riley region have been investigated in terms of the neutron-
Phys. Rev. C 47, 36 (January, 1993) proton interacting boson model. Two differentapproaches were used. The first investigation is
The differential cross section for n-p elastic based on the validity of the Z-38 subshell closure
scattering at 459 MeT in the c.m. angular region considering SSSr as a doubly magic core. In the50 ° <0"< 180° has been measured with high second calculation Z=50 and N-50 were considered
statistical precision and good relative accuracy. The as valid closed shells leading to m°Sn as a core. The
uncertainty in the absolute normalization (based on results from both calculations are compared withthe simultaneously measured yield of deuterons from experimental data.the np-*,dlre reaction) was initially estimated to be-_ 7 %. The results agree well with back-angle data RHO MESON IN DENSE HADRONIC MATTERobtained independently at LAMPF but less well withresults from Saclay and the Princeton-Pennsylvania M. Asakawa, C. M. Ko, P. l_vai, and X. J. QiuAccelerator and, except for a normalization Phys. Rev. C 46, R1159 (October, 1992)difference of 10%, are fairly well represented by aphase-shift fit. The pole-extrapolation method of The spectral function of a the meson that is atChew was used to extract the pion-nucleon coupling rest in dense hadronic matter and couples strongly toconstantf 2 from the back-angle portion of the data. the pion is studied in the vector dominance model byThe value obtained,f2---O.069, is somewhat smaller including the effect of the delta-hole polarization onthan the values 0.0735-0.0790 obtained from analyses the pion. With the free the-meson mass in the
VI -149
Lagrangian, we find that both the rho-meson peak section is narrowed down to ass _s 30-40 mb, for theand width increase with increasing nuclear density, first time, using recent experimental data.
and that a low-mass peak appears at invariant massaround three times the pion mass. Includir, g the K+ TOTAL CROSS SECTIONS ON nC AND
decreasing density-dependent hadron masses in the MEDIUM EFFECTS IN NUCLEILagrangian as suggested by the scaling law of Brownand Rho, we find instead that the the peak moves to R.A. Krauss, J. Alster, D. Ashery, S. Bart, R. E.smaller invariant masses with diminishing strength Chrien, J. C. Hiebert, R. R. Johnson, T. Kishimoto,
when the nuclear density increases. The low-mass I. Mardor, Y. Mardor, M. A. Moinester, R.peak also shifts down with increasing density and Olshewky, E. Piasetsky, P. H. Pile, R. Sawafta, R.becomes more pronounced. The relevance of the L. Stearns, R. J. Sutter, R. Weiss, and A. I. Yavinthe-meson property in dense matter to dilepton Phys. Rev. C 46, 655 (August, 1992)production in heavy-ion collisions is discussed.
The total cross sections for K. mesons on carbonand deuterium nuclei have been measured at eleven
ANTILAMBDA ENHANCEMENT IN momenta in the range 450-740 MeV/c. TheULTRARELATIVISTIC HEAVY ION experimental technique was of the standard
COLLISIONS transmission type. The K + meson is the leaststrongly interacting of available hadronic probes, with
C. M. Ko, M. Asakawa, and P. l_vai a long mean free path in nuclear matter. At lowPhys. Rev. C 46, 1072 (September, 1992) incident momentum the/(+N interaction is dominated
by the S,, phase shift and varies slowly with energy.In the Walecka model, the antilambda mass in These characteristics make the K+ an ideal tool for
dense nuclear matter is smaller than its value in free probing the nuclear volume to reveal nuclear mediumspace. This reduces the threshold for antilambda effects. Measurements of the ratio of the total crossproduction in dense matter that forms in the sections, per nucleon, of K+-n2C to K+-d have beencompression stage of ultrarelativistic heavy ion suggested as a way to reveal effects of the nuclearcollisions. Because of the large number of mesons medium. The total cross section ratios are found to
produced in the collision, the process KM _ _, lie significantly above those predicted by the usualwhere M denotes either a pion or a rho meson, is nuclear m_im_l corrections. This suggests thatnovelshown to be important and provides thus a plausible phenomena are taking place within the nucleus.explanation for the observed enhancement of Several models which incorporate such phenomenaantilambda yield in recent experiments carried out at are discussed, including nucleon "swelling," massCERN SPS with nuclear beams, rescaling, nuclear pions, and relativistic effects.
DISAPPEARANCE OF FLOW AND THE IN-MEDIUM NUCLEON-NUCLEON CROSS
SECTION CHARGED PARTICLE MULTIPLICITY IN 2sSi
+ AI, Cu, AND Pb REACTIONS AT EIs b -- 14.6H. M. Xu GeV/nucleon
Phys. Rev. C 46, R389 (August, 1992)J. Barrette, R. Bellwied, P. Braun-Munzinger, W. E.
Based on a Boltzmann equation, the transverse Cieland, G. David, O. Dietzsch, E. Duek, M.momentum distributions are calculated for central Fatyga, D. Fox, S. V. Greene, J. R. Hall, R.4°Ar+SSV collisions with an aim to determine the in- Heifetz, T. K. Hemmick, M. Herman, N. Hermann,
medium nucleon-nucleon cross section. Indeed, the R.W. Hogue, G. lngold, K. Jayananda, D. Kraus,calculations suggest that measurements of the energy S. Kumar, R. Lacasse, D. Lissauer, W. J. Llope, T.of balance9 F-_n, can provide a powerful tool to pin Ludlam, R. Majka, D. Makowiecki, S. K. Mark, S.down the in-medium nucleon-nucleon cross section. R. McCorkle, J. T. Mitchell, M. Muthuswamy, E.
Within our improved Boltzmann-Uehling-Uhlenbeck O'Brien, L. Olsen, V. Polychronakos, C. Pruneau,(BUU) model, the in-medium nucleon-nucleon cross M. RawooI-SuUivan, F. Rotondo, J. Sandweiss, J.
VI- 150
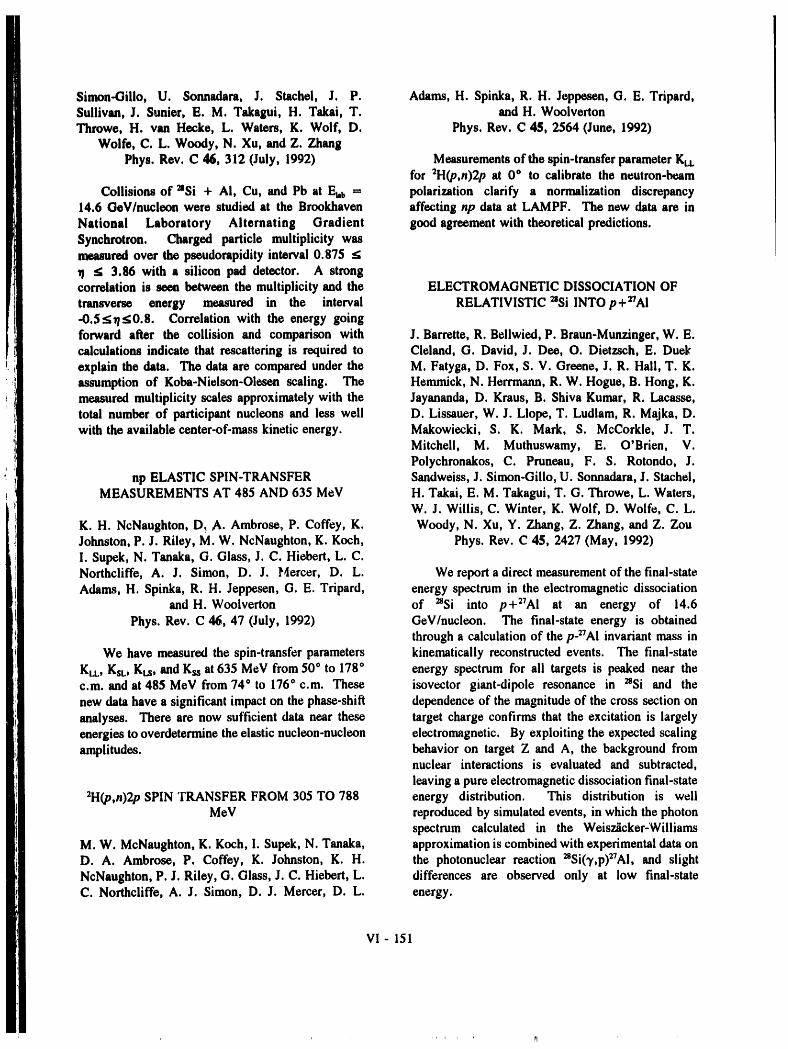
Simon-GiUo, U. Sonnadara, J. Stachel, J.P. Adams, H. Spinka, R. H. Jeppesen, G. E. Tripard,Sullivan, J. Stmier, E. M. Takagui, H. Takai, T. and H. WoolvertonThrowe, H. van Hecke, L. Waters, K. Wolf, D. Phys, Rev. C 45, 2564 (June, 1992)
Wolfe, C. L. Woody, N. Xu, and Z, Zhang
Phys. Rev. C 46, 312 (July, 1992) Measurements of the spin-transfer parameter KLLfor 21-1(p,n)2p at 0 ° to calibrate the neutron-beam
Collisions of aSi + AI, Cu, and Pb at F__b-" polarization clarify a normalization discrepancy14.6 GeV/nucleon were studied at the Brookhaven affecting np data at LAMPF. The new data are inNational Laboratory Alternating Gradient good agreement with theoretical predictions.
Synchrotron. Charged particle multiplicity wasmeasured over the pseudorapidity interval 0.875 <
:_ 3.86 with a silicon pad detector. A strongcorrelation is seen between the multiplicity and the ELECTROMAGNETIC DISSOCIATION OFtransverse energy measured in the interval RELATIVISTIC _Si INTO p+_AI-0.5.<_<0.8. Correlation with the energy goingforward after the collision and comparison with J. Barrette, R. Bellwied, P. Braun-Munzinger, W. E.calculations indicate that rescattering is required to Cleland, G. David, J. Dee, O. Dietzsch, E. Duekexplain the data. The data are compared under the M. Fatyga, D. Fox, S. V. Greene, J. R. Hall, T. K.assumption of Koba-Nielson-Olesen scaling. The Hemmick, N. Herrmann, R. W. Hogue, B. Hong, K.measured multiplicity scales approximately with the Jayananda, D. Kraus, B. Shiva Kumar, R. Lacasse,total number of participant nucleons and less well D. Lissauer, W. J. Llope, T. Ludlam, R. Majka, D.with the available center-of-mass kinetic energy. Makowiecki, S. K. Mark, S. McCorkle, J. T.
Mitchell, M. Muthuswamy, E. O'Brien, V.Polychronakos, C. Pruneau, F. S. Rotondo, J.
np ELASTIC SPIN-TRANSFER Sandweiss, J. Simon-Gillo, U. Sonnadara, J. Stachel,MEASUREMENTS AT 485 AND 635 MeV H. Takai, E. M. Takagui, T. G. Throwe, L. Waters,
W. J. Willis, C. Winter, K. Wolf, D. Wolfe, C. L.
K. H. NcNaughton, D, A. Ambrose, P. Coffey, K. Woody, N. Xu, Y. Zhang, Z. Zhang, and Z. ZouJohnston, P. J. Riley, M. W. NcNaughton, K. Koch, Phys. Rev. C 45, 2427 (May, 1992)
I. Supek, N. Tanaka, G. Glass, J. C. Hiebert, L. C.Northcliffe, A. J. Simon, D. J. I'4ercer, D.L. We report a direct measurement of the final-stateAdams, H. Spinka, R. H. Jeppesen, G. E. Tripard, energy spectrum in the electromagnetic dissociation
andH. Woolverton of 2sSi into p+27AI at an energy of 14.6Phys. Rev. C 46, 47 (July, 1992) GeV/nucleon. The final-state energy is obtained
through a calculation of the p-27Al invariant mass inWe have measured the spin-transfer parameters kinematically reconstructed events. The final-state
KLL,KSL,Kt.s, and Kss at 635 MeV from 50 ° to 178 ° energy spectrum for all targets is peaked near thec.m. and at 485 MeV from 74 ° to 176 ° c.m. These isovector giant-dipole resonance in 2sSi and the
new data have a significant impact on the phase-shift dependence of the magnitude of the cross section onanalyses. There are now sufficient data near these target charge confirms that the excitation is largelyenergies to overdetermine the elastic nucleon-nucleon electromagnetic. By exploiting the expected scalingamplitudes, behavior on target Z and A, the background from
nuclear interactions is evaluated and subtracted,
leaving a pure electromagnetic dissociation final-state
2H(p,n)2p SPIN TRANSFER FROM 305 TO 788 energy distribution. This distribution is wellMeV reproduced by simulated events, in which the photon
spectrum calculated in the Weisz_cker-WilliamsM. W. McNaughton, K. Koch, I. Supek, N. Tanaka, approximation is combined with experimental data onD. A. Ambrose, P. Coffey, K. Johnston, K.H. the photonuclear reaction 2sSi(y,p)27Al, and slightNcNaughton, P. J. Riley, G. Glass, J. C. Hiebert, L. differences are observed only at low final-stateC. Northcliffe, A. J. Simon, D. J. Mercer, D.L. energy.
VI- 151
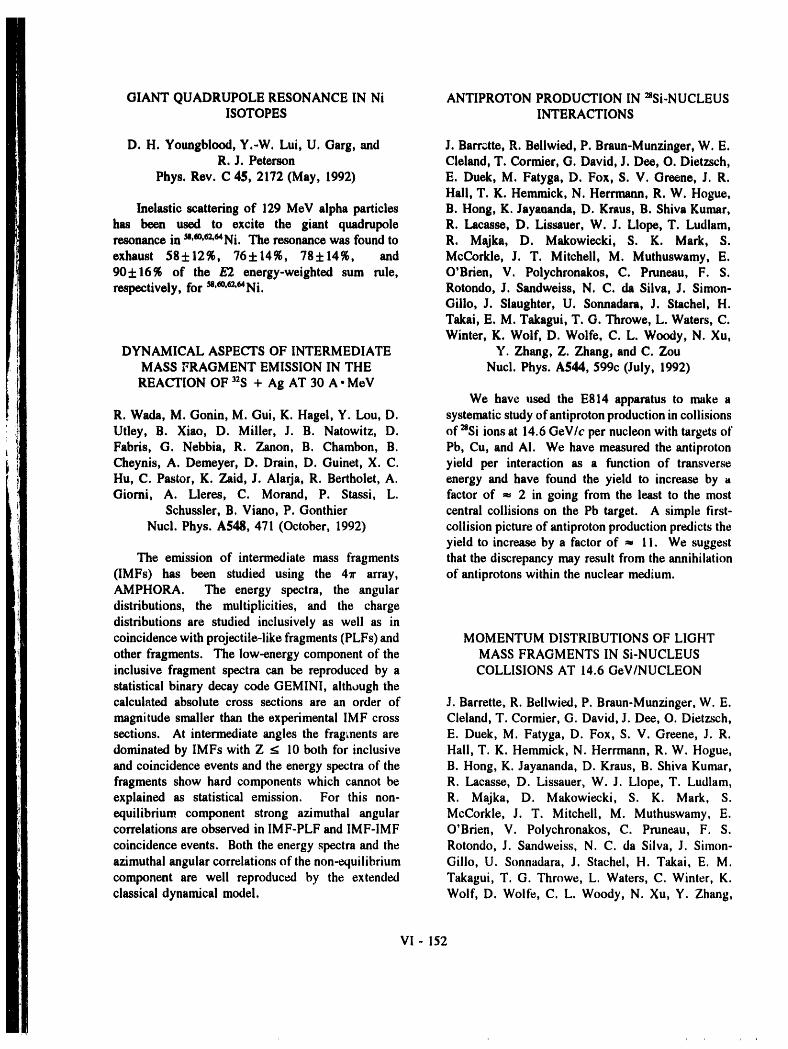
GIANT QUADRUPOLE RESONANCE IN Ni ANTIPROTON PRODUCTION IN :_Si-NUCLEUSISOTOPES INTERACTIONS
D. H. Youngblood, Y.-W. Lui, U. Garg, and J. Barrvtte, R. Bellwied, P. Braun-Munzinger, W. E.R. J. Peterson Cleland, T. Cormier, G. David, J. Dee, O. Dietzsch,
Phys. Rev. C 45, 2172 (May, 1992) E. Duek, M. Fatyga, D. Fox, S. V. Greene, J. R.Hall, T. K. Hemmick, N. Herrmann, R. W. Hogue,
Inelastic scattering of 129 MoV alpha particles B. Hens, K. Jayananda, D. Kraus, B. Shiva Kumar,has been used to excite the giant quadrupole R. Lacasse, D. Lissauer, W. J. Llope, T. Ludlam,resonance inSS._°._2'SSNi.The resonancewasfoundto R. Majka, D. Mskowiecki, S. K. Mark, S.exhaust 58±12%, 76±14_, 78:t:14%, and McCorlde, J. T. Mitchell, M. Muthuswamy, E.90±16_ of the E2 energy-weighted sum rule, O'Brien, V. Polychronakos, C. Pruneau, F. S.respectively, for 5s'_'_"Ni. Rotondo, J. Sandweiss, N. C. da Silva, J. Simon-
Gillo, J. Slaughter, U. Sonnadara, J. Stachei, H.Takai, E. M. Takagui, T. O. Throwe, L. Waters, C.Winter, K. Wolf, D. Wolfe, C. L. Woody, N. Xu,
DYNAMICAL ASPECTS OF INTERMEDIATE Y. Zhang, Z. Zhang, and C. ZouMASS FRAGMENT EMISSION IN THE Nucl. Phys. A544, 599c (July, 1992)REACTION OF 32S + Ag AT 30 A" MeV
We have used the E814 apparatus to make aR. Wada, M. Gonin, M. Gui, K. Hagel, Y. Lou, D. systematic study ofantiproton production in collisionsUtley, B. Xiao, D. Miller, J. B. Natowitz, D. of 28Siions at 14.6 GeV/c per nucleon with targets ofFabris, G. Nebbia, R. Zanon, B. Chambon, B. Pb, Cu, and AI. We have measured the antiprotonCheynis, A. Demeyer, D. Drain, D. Guinet, X.C. yield per interaction as a function of transverseHu, C. Pastor, K. Zaid, J. Alarja, R. Bertholet, A. energy and have found the yield to increase by aGiorni, A. Lleres, C. Morand, P. Stassi, L. factor of _ 2 in going from the least to the most
Schussler, B. Viano, P. Gonthier central collisions on the Pb target. A simple first-Nucl. Phys. A548, 471 (October, 1992) collision picture of antiproton production predicts the
yield to increase by a factor of _ 11. We suggestThe emission of intermediate mass fragments that the discrepancy may result from the annihilation
(IMFs) has been studied using the 41r array, of antiprotonswithin the nuclear medium.AMPHORA. The energy spectra, the angulardistributions, the multiplicities, and the chargedistributions are studied inclusively as well as incoincidence with projectile-like fragments (PLFs) and MOMENTUM DISTRIBUTIONS OF LIGHTother fragments. The low-energy component of the MASS FRAGMENTS IN Si-NUCLEUSinclusive fragment spectra can be reproduced by a COLLISIONS AT 14.6 GeV/NUCLEONstatistical binary decay code GEMINI, although thecalculated absolute cross sections are an order of J. Barrette, R. Bellwied, P. Braun-Munzinger, W. E.magnitude smaller than the experimental tMF cross Cleland, T. Cormier, G. David, J. Dee, O. Dietzsch,sections. At intermediate angles the fragknents are E. Duek, M. Fatyga, D. Fox, S. V. Greene, J. R.dominated by IMFs with Z < 10 both for inclusive Hall, T. K. Hemmick, N. Herrmann, R. W. Hogue,and coincidence events and the energy spectra of the B. Hens, K. Jayananda, D. Kraus, B. Shiva Kumar,fragments show hard components which cannot be R. Lacasse, D. Lissauer, W. J. Llope, T. Ludlam,explained as statistical emission. For this non- R. Majka, D. Makowiecki, S. K. Mark, S.equilibrium component strong azimuthal angular McCorkle, J. T. Mitchell, M. Muthuswamy, E.correlations are observed in IMF-PLF and IMF-IMF O'Brien, V. Polychronakos, C. Pruneau, F. S.coincidence events. Both the energy spectra and the Rotondo, J. Sandweiss, N. C. da Silva, J. Simon-azimuthal angular correlations of the non-equilibrium Gillo, U. Sonnadara, J. Stachel, H. T_ai, E. M.component are well reproduced by the extended Takagui, T. G. Thrc_we, L. Waters, C. Winter, K.
classical dynamical model. Wolf, D. Wolfe, C. L. Woody, N. Xu, Y. Zhang,
VI - 152

Z. Zhang, and C. Zou ENERGY DEPENDENCE OF THE ANALYZINGNucl. Phys. A544, 423c (July, 1992) POWER FOR THE pp _ _r+d REACTION IN
THE ENERGY REGION 500-800 MeV
Transverse momentum distributions of light massbeam rapidityfragments *H, 3He, and 4H in reactions H.Y. Yoshida, H. Shimizu, H. Ohnuma, Y.of _Si + Al, Cu and Pb are presented. The widths Kobayashi, K. Kobayashi, T. Nakagawa, J. A. Holt,of the distributions are found to increase with G. Glass, J. C. Hiebert, R. A. Kenefick, S. Nath, L.
increasing projectile-target overlap. This dependence C. Northcliffe, A. Simon, S. Hiramatsu, Y. Mori,is not consistent with the observed distributions being H. Sato, A. Takagi, T. Toyama, A. Ueno, andassociated with the Fermi momentum of the nucleons K. Imai
on the projectile nucleus. Nucl. Phys. A541, 443 (May, 1992)
The energy dependence of the analyzing powerAy for the pp--_+d reaction was measured duringpolarized beam acceleration from 500 to 800 MeV,
RECENT RESULTS FROM EXPERIMENT 814 using an internal target inserted into the beam everyAT BROOKHAVEN acceleration cycle. The measurements were made
with the pion laboratory angle fixed at 68 ° and withJ. Barrette, R. Bellwied, P. Braun-Munzinger, W.E. incident proton energy bins varying from 10 to 30Cleland, T. M. Comfier, G. David, J. Dee, G.E. MeV in width. The statistical accuracy per bin is
DieIx, ld, O. Dietzsch, M. Fatyga, D. Fox, J.V. AAy -- 0.06.Germani, M. Ghalambor-Dezfuli, S. Gilbert, S. V.Greene, J. R. Hall, T. K. Hemmick, N. l-lerrmann,
B. Hong, G. Ingoid, K. Jayananda, D. Kraus, B.Shiva Kumar, R. Laeas_, D. Lissauer, W. J. Llope,T. W. Ludlam, S. McCorkle, R. Majka, S. K. Mark,J. T. Mitchell, M. Muthuswamy, E. O'Brien, V. MECHANISMS OF NON-EQUILIBRIUMPolychronakos, C. Pruneau, F. Rotondo, J. LIGHT-PARTICLE EMISSION IN 32S -_- AgSandweiss, N. C. da Silva, J. Simon-Gillo, U. REACTIONS AT 30 A.MeVSonnadara, J. Stachel, H. Takai, E. M. Takagui, T.G. Throwe, C. Winter, G. Wang, L. Waters, K. R. Wada, M. Gonin, M. Gui, K. Hagel, Y. Lou, D.Wolf, D. Wolfe, C. L. Woody, N. Xu, Y. Zhang, Utley, J. B. Natowitz, G. Nebbia, D. Fabris, R.
Z. Zlumg, and C. Zou Billerey, B. Cheynis, A. Demeyer, D. Drain, D.Nucl. Phys. A$44, 137c (July, 1992) Guinet, C. Pastor, L. Vagneron, K. Zaid, J. Alarja,
A. Giorni, D. Heuer, C. Morand, B. Viano, C.
Recent results from the E814 collaboration are Mazur, C. Ng6, S. Leray, R. Lucas, M. Ribrag, and
presented for reactions of 14.6 GeV/nucleon 2sSi E. Tomasiprojectiles with targets of AI, Cu, and Pb. This Nucl. Phys. A539, 316 (March, 1992)includes transverse energy distributions over the fullsolid angle and the distribution of charged particle Energy spectra of light charged particlesmultiplicity in the forward hemisphere. Furthermore, (Z= 1,2), observed at 0Lp= 5°-150 ° in coincidencewe present recent results on transverse momentum with fragments of Z = 5-14 at 0v = + 9 ° arespectra and rapidity distributions for protons and examined. The fragment-energy spectra show twodiscuss them in terms of stopping and/or components, one with a projectile-like velocity andtransparency. A fraction of nucleons emerges at another with a much lower velocity. Light particlesbeam rapidity, even for the most central collisions, in coincidence with fragments of projeetile-l|KeThese "punch-through" distributions are shown to velocity show a very strong left-right asymmetry inyield information on the in-medium nucleon-nucleon the forward hemisphere. At very forward angles thecross section. Finally, we discuss antiproton asymmetry is essentially dominated by a recoil effectproduction at 0 ° as a function of event centrality to of the ejectile emitted from the fragment. Theshed some light on possible reabsorption, asymmetry at intermediate angles (27 ° <0<60 °)
VI- 153
shows a strong dependence on the charge of the RESPONSE OF THE PARTICIPANTfragments and the asymmetry is similar among those CALORIMETER TO 1.5-6.8 GeV/c ELECTRONSfor the composite particles, whereas the asymmetry AND HADRONSis much smaller for protons. Light particles in
coincidence with the lower-energy component of the D. Fox, J. Simon-Gillo, M. W. Rawooi-Sullivan, J.fragment spectra show much less asymmetry. For G. Boissevain, W. E. Cieland, A. Gavron, B. V.such fragments a-particle energy spectra are Jacak, D. Kraus, W. Sondheim, J. P. Sullivan, H.reproduced withoutan intermediate-velocity source of van Hecke, S. Watson, K. L. Wolf, and Z. Zhanghigh apparent temperature, whereas this high Nucl. Instrum. Methods A317, 474
temperature source is needed for the proton spectra. (February, 1992)These facts may indicate that the dominant emission
mechanism of the intermediate-velocity protons and The Participant Calorimeter for Experiment 814a-particles is different. Possible mechanisms for the at BNL is a lead-scintillator sampling calorimeter.production of these particles are discussed. The response of the calorimeter to beams of e,/L, a"
and p from 1.56 to 6.8 GeV/c is presented. The' design and performance of two gain monitoring
systems are described, one system measures theresponse of single scintillator plates in thecalorimeter. The calorimeter electromagnetic energy
DYNAMICAL AND STATISTICAL resolution varies from 24 to 32%A/E for different
PROPERTIES OF HOT NUCLEI towers. For hadron energies over 5 GeV the ah/E =43+3%V'F,, and e/h = 1.02+0.07.
L B. Natowitz, M. Gonin, K. Hagel, R. Wada, S.Shlomo, X. Bin, M. Gui, Y. Lou, D. Utley, T. DISSOCIATION OF MULTICHARGED COBotting, R. K. Choudhury, L. Cooke, B. Hurst, D. MOLECULAR IONS PRODUCED INO'Kelly, R. P. Schmitt, W. Turmel, H. Utsunomiya, COLLISIONS WITH 97 MeV Arl4+:G. Nebbia, D. Fabris, J. A. Ruiz, G. Nardelli, M. DISSOCIATION FRACTIONS AND
Poggi, R. Zanon, G. Viesti, R. H. Butch, F. BRANCHING RATIOSGramegna, G. Prete, D. Drain, B. Chambon, B.
Cheynis, D. Guinet, X. C. Hu, A. Demeyer, C. K. Wohrer, G. Sampoll, R. L. Watson, M. Chabot,Pasteur, A. Giomi, A. Lieres, P. Stassi, B. Viano, O. Heber, and V. Horvat
A.Menchaca Rocha, M.E. Brandan, and P. Gonthier Phys. Rev. A 46, 3929 (October, 1992)Nucl. Phys. A538, 263c (March, 1992)
Data on the production and dissociation of CO O_Properties of medium mass nuclei having molecular ions (where Q = I through 7) obtained by
excitation energies of 1.5 to 6 MeV/u have been ion-ioncoincidencetime-of-flightmeasurements wereprobed in measurements of the multiplicities and analyzed to determine production yields, dissociationenergy spectra of emitted particles and fragments, fractions, and branching ratios. A detailedThe particle spectra indicate a progressive reduction comparison of the dissociation fractions for CO+ andof both the level density parameter, a, and the CO2+ for several collision systems in the sameemission barriers as the excitation energy is perturbative regime revealed them to be quite similar,increased. The evolution of the dominant de- whereas the dissociation fraction for CO + producedexcitation modes, observed with increasing excitation by valence-electron photoionization is a factor of 1.8energy, is found to be qualitatively consistent with to 3.6 larger. The results for Q :> 2 indicated athe predictions of statistical models. There is, preference for dissociation channels leading tohowever, evidence that dynamics may play an symmetric or nearly symmetric charge division. Animportant role in fragment emission processes. At enhancement of the total ionization yields for Q > 4energies of 6 MeV/u multifragment emission is an was ob_rved, and it suggests that electron transferimportant process. Varying theoretical models fidiowed by LMM Auger decay plays an importantpredict such multifragment events but differ in their role in determining the final charges of thepredictions of the probability of such events, dissociation products.
VI - 154
K-SHELL IONIZATION OF INTERMEDIATE-Z photoionization.ELEMENTS BY 30-MeV/amu H, N, Ne, AND Ar
IONS SPYN-ROTATION PARAMETERS A AND R FOR
"a+p AND "a'p ELASTIC SCATFERING FROMV. Horvat, G. Sampoll, K. Wohrer, M. Chabot, and 427 TO 657 MoV/c
R. L. Watson
Phys. Rev. A 46, 2572 (September, 1992) I. Supek, D. B. Barlow, W. J. Briscoe, J. F. Davis,G. J, Kim, D. W. Lane, A. Mokhtari, B. M. K.
Cross sections for K x-ray production in solid Nefkens, C. Pillai, M. E. Sadler, C. J. Seftor, M. F.
targets (Z= 13,22,26,29,32,40,42,46, and 50) by 30- Taragin, and J. A. WightmanMeV/amu beams of H, N, Ne, and Ar were Phys. Rev. D 47, 1762 (March, 1993)measured. The cross sections were determined byrecording the spectra of K x-rays with a Si(Li) The spin-rotation parameters A and R and thedetector in coincidence with beam particles detected related spin-rotation angle/_ have been measured for
in a microchannel plate assembly. The K-shell- "a+p and "a'pelastic scattering using protons polarizedionization cross sections deduced from these data in the scattering plane. The pion-beam momenta are
agree quite well with the predictions of the perturbed- 427, 471,547, 625, and 657 MeV/c and the angularstationary-state theory with energy loss, Coulomb range is -0.9 <COSec.re.<0.3. The scattered pion anddeflection, and relativistic corrections. Detailed recoil proton were detected in coincidence, using aanalyses of the projectile and target Z dependences of scintillator hodoscope for the pions, and the Largethe cross sections were performed. Also, the relative Acceptance Spectrometer combined with the JANUSintensities of K x-rays from double K-shell ionization polarimeter for the recoil protons. The results areof the higher-Z targets are presented for N, Ne, and compared with the four recent "aN partial waveAr projectiles, analyses (PWA's). Our data show that the major
features of these PWA's are correct. The A and R
DISSOCIATION OF MULTICHARGED CO measurements complete our program of pion-nucleonMOLECULAR IONS PRODUCED IN experiments, providing full data sets at three of the
COLLISIONS WITH 97-MeV Art4+: TOTAL- above beam momenta. Such sets can be used to testKINETIC-ENERGY DISTRIBUTIONS the constraints in the PWA's or to obtain a model-
independent set of "aN scattering amplitudes.G. Sampoll, R. L. Watson, O. Heber, V. Horvat, K.
Wohrer, and M. Chabot NEUTRON-PROTON ELASTIC SCATTERINGPhys. Rev. A 45, 2903 (March, 1992) SPIN-SPIN CORRELATION PARAMETER
MEASUREMENTS BETWEEN 500 AND 800
Transient molecular ions of COq+ (where q = 2- MeV. II. Css AND Cta AT FORWARD c.m.7) were produced in single collisions of 97-MeV ANGLESAr14+ projectile with neutral CO molecules. Theresulting dissociation products were identified by T. Shima, D. Hill, K. F. Johnson, H. Shimizu, H.
coincidence time-of-flight spectroscopy in which the Spinka, R. Stanek, D. Underwood, A. Yokosawa, G.time-of-flight of the first ion to reach the detector and Glass, J. C. Hiebert, R. A. Kenefick, S. Nath, L. C.the time difference between the first ion and its Northcliffe, G. R. Burleson, R. W. Garnett, J. A.
partner were recorded event by event. An iterative Faucett, M. W. RawooI-Sullivan, R. Damjanovich,matrix-transformation procedure was employed to J.J. Jarmer, R. H. Jeppesen, and G. E. Tripardconvert the time-difference spectra for the prominent Phys. Rev. D 47, 29 (January, 1993)dissociation channels into total-kinetic-energy
distributions. Analysis of the total-kinetic-energy Results are presented for the spin-spin correlation
distributions and comparisons with the available data parameters Css and Cta for free np elastic scatteringfor CO2+ and COs+ from synchrotron radiation at neutron beam kinetic energies of 484, 634, 720,experiments led to the conclusion that ionization by and 788 MeV and c.m. angles between 250 and 80°.
Ar-ion impact populated states having considerably The measurements were performed with a polarizedhigher excitation energies than those accessed by neutron beam and a polarized proton target. These
VI - 155
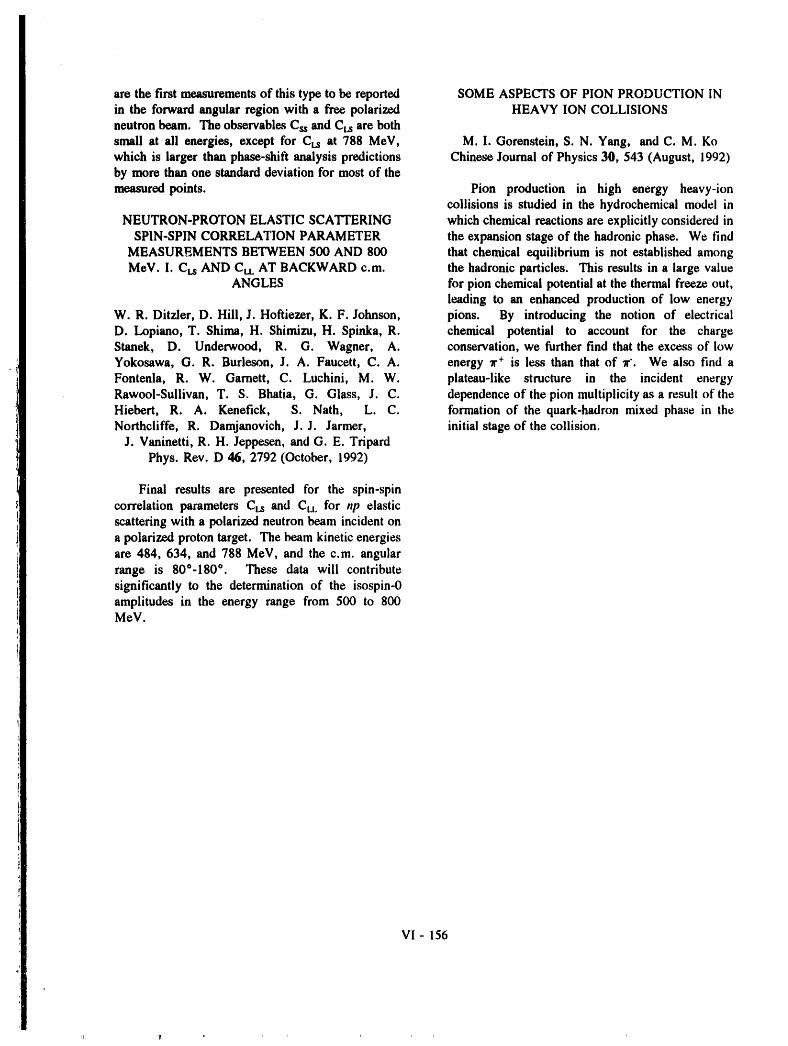
are the first measurements of this type to be reported SOME ASPECTS OF PION PRODUCTION INin the forward angular region with a free polarized HEAVY ION COLLISIONSneutron beam. The observables Css and CLSare bothsmall at all energies, except for CLs at 788 MeV, M.I. Gorenstein, S. N. Yang, and C. M. Kowhich is larger than phase-shift analysis predictions Chinese Journal of Physics 30, 543 (August, 1992)by more than one standard deviation for most of themeasured points. Pion production in high energy heavy-ion
collisions is studied in the hydrochemical model inNEUTRON-PROTON ELASTIC SCATTERING which chemical reactions are explicitly considered in
SPIN-SPIN CORRELATION PARAMETER the expansion stage of the hadronic phase. We find
MEASUREMENTS BETWEEN 500 AND 800 that chemical equilibrium is not established amongMeV. I. Ct.s AND CL, AT BACKWARD c.m. the hadronic particles. This results in a large value
ANGLES for pion chemical potential at the thermal freeze out,leading to an enhanced production of low energy
W. R. Ditzler, D. Hill, J. Hoftiezer, K. F. Johnson, pions. By introducing the notion of electricalD. Lopiano, T. Shima, H. Shimizu, H. Spinka, R. chemical potential to account for the chargeStanek, D. Underwood, R. G. Wagner, A. conservation, we further find that the excess of lowYokosawa, G. R. Burleson, J. A. Faucett, C.A. energy _'+ is less than that of w'. We also find aFontenla, R. W. Garnett, C. Luchini, M.W. plateau-like structure in the incident energyRawooI-Sullivan, T. S. Bhatia, G. Glass, J.C. dependence of the pion multiplicity as a result of theHiebert, R. A. Kenefick, S. Nath, L.C. formation of the quark-hadron mixed phase in theNorthcliffe, R. Damjanovich, J.J. Jarmer, initial stage of the collision.
J. Vaninetti, R. H. Jeppesen, and G. E. TripardPhys. Rev. D 46, 2792 (October, 1992)
Final results are presented for the spin-spincorrelation parameters CLS and Ct.L for np elasticscattering with a polarized neutron beam incident ona polarized proton target. The beam kinetic energiesare 484, 634, and 788 MeV, and the c.m. angularrange is 80°-180 ° . These data will contributesignificantly to the determination of the isospin-0amplitudes in the energy range from 500 to 800MeV.
VI- 156
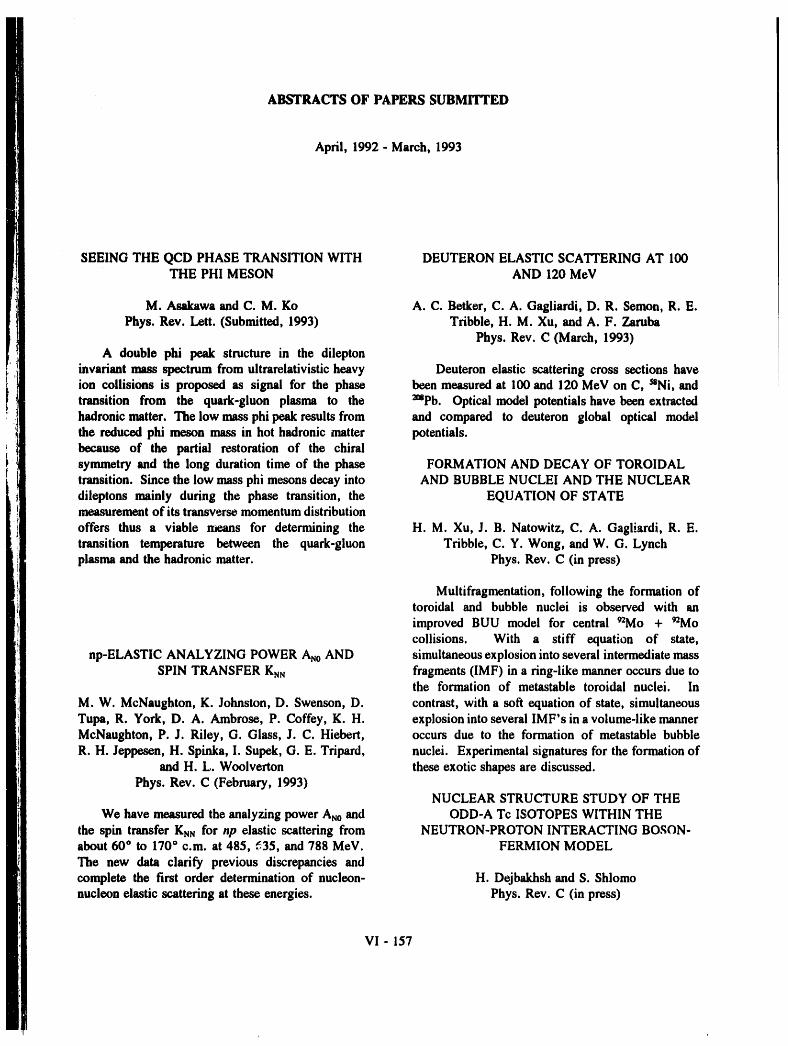
ABSTRACTS OF PAPERS SUBMITTED
April, 1992- March, 1993
SEEING THE QCD PHASE TRANSITION WITH DEUTERON ELASTIC SCATTERING AT 100THE PHI MESON AND 120 MeV
M. Asakawa and C. M. Ko A.C. Betker, C. A. Gagliardi, D. R. Semon, R. E.Phys. Rev. Lett. (Submitted, 1993) Tribble, H. M. Xu, and A. F. Zaruba
Phys. Roy. C (March, 1993)A double phi peak structure in the dilepton
invariant mass spectrum from ultrarelativistic heavy Deuteron elastic scattering cross sections haveion collisions is proposed as signal for the phase been measured at 100 and 120 MeV on C, 5*Ni, andtransition from the quark-gluon plasma to the _Pb. Optical model potentials have been extracted
hadronic matter. The low mass phi peak results from and compared to deuteron global optical modelthe reduced phi meson mass in hot hadronic matter potentials.because of the partial restoration of the chiralsymmetry and the long duration time of the phase FORMATION AND DECAY OF TOROIDALtransition. Since the low mass phi mesons decay into AND BUBBLE NUCLEI AND THE NUCLEARdileptons mainly during the phase transition, the EQUATION OF STATEmeasurement of its transverse momentum distribution
offers thus a viable means for determining the H.M. Xu, J. B. Natowitz, C. A. Gagliardi, R. E.transition temperature between the quark-gluon Tribble, C. Y. Wong, and W. G. Lynchplasma and the hadronic matter. Phys. Roy. C (in press)
Multifragmentation, following the formation oftoroidal and bubble nuclei is observed with an
improved BUU model for central 92Mo + 92Mocollisions. With a stiff equation of state,
np-ELASTIC ANALYZING POWER AN0AND simultaneous explosion into several intermediate massSPIN TRANSFER KNN fragments (IMF) in a ring-like manner occurs due to
the formation of metastable toroidal nuclei. In
M. W. McNaughton, K. Johnston, D. Swenson, D. contrast, with a soft equation of state, simultaneous
Tupa, R. York, D. A. Ambrose, P. Coffey, K.H. explosion into several IMF's in a volume-like mannerMcNanghton, P. J. Riley, G. Glass, J. C. Hiebert, occurs due to the formation of metastable bubble
R. H. Jeppesen, H. Spinka, I. Supek, G. E. Tripard, nuclei. Experimental signatures for the formation ofand H. L. Woolverton these exotic shapes are discussed.
Phys. Roy. C (February, 1993)NUCLEAR STRUCTURE STUDY OF THE
We have measured the analyzing power AN0and ODD-A Tc ISOTOPES WITHIN THEthe spin transfer KNNfor np elastic scattering from NEUTRON-PROTON INTERACTING BOSON-about 60 ° to 170° c.m. at 485, 535, and 788 MeV. FERMION MODEL
The new data clarify previous discrepancies andcomplete the first order determination of nucleon- H. Dejbakhsh and S. Shlomonucleon elastic scattering at these energies. Phys. Rev. C (in press)
VI- 157
We have investigated the odd-A Tc isotopes in an attractive one for the antikaon. With these effectsthe mass 100 region within the neutron-proton included in the relativistic transport model, it is foundinteracting boson-fermion model (IBFM-2). The that the slope parameter of the kaon kinetic energycalculation is based on the validity of the Z-38 distribution is larger than that of the antikaon. This
subsheU closure. The results for the energy spectra is consistent with the experimental data from heavy-and electromagnetic transitions are compared with ion collisions in the Alternating Gradientexperimental data and with results from other Synchrontron experiments at Brookhaven.calculations which considered Z= 50 as a valid closed
shell for Tc isotopes.
MEDIUM EFFECTS ON SUBTHRESHOLD MEDIUM EFFECTS ON THE RHO MESON,
KAON PRODUCTION FROM HEAVY-IONCOLLISIONS M. Asakawa and C. M. Ko
Phys. Rev. C (Submitted, 1993)Y. M. Zheng, X. S. Fang, and C. M. Ko
Phys. Rev. C (Submitted, 1993) The property of a the meson in dense matter isstudied using the QCD sum rule. The spectral
The relativistic transport model, in which the function appearing on the hadronic side of the sumnucleon effective mass is connected to the scalar field rule is evaluated in the vector dominance model that
while its energy is shifted by the vector potential, is takes into account the interaction between the theextended to include the kaon degree of freedom. We meson and the pion. Including pion modification byfurther take into account the density dependence of the delta-hole polarization in the nuclear medium, wethe kaon effective mass in nuclear matter due to the find that as the nuclear density increases the theexplicit chiral symmetry breaking. For kaon meson peak in the spectral function shifts to smallerpropagation in nuclear matter, we also include the invariant masses and its width becomes smaller. Werepulsive vector potential due to nucleons. The effect discuss the possibility of studyting the the mesonof reduced kaon mass on kaon production from the property in dense matter via the dilepton invariantbaryon-baryon interaction is evaluated in the one- mass spectrum from heavy-ion collisions.pion-exchange model. We find that the reduced kaonmass in dense matter leads to an enhanced kaon yieldin heavy-ion collisions at about 1 GeV/nucleon that isbelow the threshold for kaon production from ENERGY DEPENDENT MEASUREMENTS OFnucleon-nucleon interaction in free space. We have THE p-p ELASTIC ANALYZING POWER ANDalso included explicitly the kaon rescattering from NARROW DIBARYON RESONANCESnucleons. Both kaon rescattering and the repulsive
vector potential affect significantly the final kaon Y. Kobayashi, K. Kobayashi, T. Nakagawa, H.kinetic energy spectra. The calculated kaon energy Shimizu, H. Y. Yoshida, H. Ohnuma, J. A. Holt, G.
spectra with the improved relativistic transport model Glass, J. C. Hiebert, R. A. Kenefick, S. Nath, L. C.agree reasonably with the preliminary data from the Northcliffe, A. J. Simon, S. Hiramatsu, Y. Mori, H.SIS at GSI. Sate, A. Takagi, T. Toyama, A. Ueno, and K. lmai
Nucl. Phys. A (Submitted, 1992)
MEDIUM EFFECTS ON KAON AND The energy dependence of the p-p elastic
ANTIKAON SPECTRA IN HEAVY-ION analyzing power has been measured using an internalCOLLISIONS target during polarized beam acceleration. The data
were obtained in incident-energy steps varying fromX. S. Fang, C. M. Ko, G. E. Brown and V. Koch 4 to 17 MeV over an energy range from 0.5 to 2.0
Phys. Rev. C (Submitted, 1993) GeV. The statistical uncertainty of the analyzing
power is typically less than 0.01. A narrow structureIn the linear chiral perturbation theory, both kaon is observed around 2.17 GeV in two proton invariant
and antikaon masses decrease in dense matter. There mass distribution. A possible explanation for theis also a repulsive vector potential for the kaon and structure with narrow resonances is discussed.
VI- 158
PHI MESON MASS IN HOT AND DENSE included in the calculation. It is found that kaons
MATI'ER undergo substantial rescatterings as they are mostlyproduced in high density region. This leads to
M. Asakawa and C. M. Ko significant effects on kaon final kinetic energyNucl. Phys. A (Submitted, 1993) spectra.
The phi meson mass in hot and dense nuclearmatter is studied in the QCD sum rules method. We DYNAMICAL PAIR PRODUCTION ANDfind that it decreases substantially as a result of the INDUCED CURRENT IN BOOST-INVARIANTabundant number of strange particles in the matter. FLUX-TUBE MODEL
M. Asakawa
Phys. Rev. D (Submitted, 1992)
QCD SUM RULES FOR RHO MESON IN We calculate the current induced by boost-DENSE MATTER invariant external flux-tube field to understand pair
production in dynamical situations. By solving oneM. Asakawa and C. M. Ko particle Dirac equation under the classical boost-
Nucl. Phys. A (in press) invariant external field, we show that if the fermionis massless no current is observed in the flux-tube.
Using the QCD sum rules, we study the property The result is confirmed by calculating also the linearof a the meson in dense hadronic matter. Instead of response of the vacuum. We also consider the pair
the simple rho meson pole approximation for the rho production classically when the flux-tube is stillmeson spectral function at low momenta, we evaluate invariant under the Lorentz boost in the longitudinalit using the vector dominance model that takes into direction but expanding transversely. It is suggestedaccount the interaction between rho meson and pion. that in the case with transverse expansion theIncluding pion modification by the delta-hole phenomenologicai longitudinal momentum
polarization in the nuclear medium, we find that as dependence of the pair production which has beenthe nuclear density increases the rho meson peak in used in the literature is understood naturally.the spectral function shifts to smaller invariantmasses. We discuss the possibility of studying therho meson property in dense matter via the dileptoninvariant mass spectrum from heavy ion collisions.
RHO MESON SPECTRAL FUNCTION INDENSE MATTER
C. M. Ko
Phys. Rep. (in press)RESCATTERING EFFECTS ON KAON
ENERGY SPECTRA IN HEAVY-ION The spectral function of a rho meson at rest inCOLLISIONS dense hadronic matter is studied in the vector
dominance model by including both the effect of theX. S. Fang, C. M. Ko, and Y. M. Zheng delta-hole polarization on pion and the scaling in-
Nucl. Phys. A (in press) medium hadron masses of Brown and Rho. It isfound that as the nuclear density increases the rho
Kaon production from heavy ion collisions at meson peak moves to smaller invariant masses withenergies that are below the threshold for its diminishing strength. Also, a low mass peak aroundproduction in free space is studied in the relativistic three times the pion mass appears and shifts downVlasov-Uehling-Uhlenbeck model. Because of the with increasing density. The change of the rhosmall production probability, kaon production in meG,on property in dense matter can be investigatedbaryon-baryon reactions is treated perturbatively, via the dilepton invariant mass spectrum from heavy-The rescattering of the kaon by nucleons is, however, ion collisions.
VI - 159
IONIZATION OF NOBLE GAS ATOMS BY studied include 18.5 AMeV 13eXe+ 4'Ti, 30 AMeVALPHA PARTICLES AND FISSION 32S + Ag and 35 AMeV *)Ca + *)Ca. Nuclei with
FRAGMENTS FROM THE DECAY OF 252Cf excitation energies of 3-6 MeV/u are produced inthese reactions.
B. M. Hill, R. L. Watson, K. Wohrer, B. B.
Bandong, G. Sampoil, and V. Horvat TWO THEOREMS ON THE KERNEL OF(in press) FADDEEV EQUATIONS FOR SCATTERING OF
THREE CHARGED PARTICLES AND SOME
Charge state distributions of He, Ne, Ar, Kr, and APPLICATIONSXe ions produced in single collisions with alpha
particles and fission fragments from the decay of D.M. Latypov and M. K. Mukhamedzhanovu2Cf have been measured using time-of-flight J. Math. Phys. (Submitted, 1993)spectroscopy. The measurements reveal that the
maximum number of electrons removed in a fission The operator T_3o which represents the singularfragment collision ranges from 8 in the case of Ne to part of kernel of Faddeev equations for the scattering20 in the case of Xe. Recoil-ion production cross of charged particles above breakup threshold issections have been determined for the resolvable ionic studied. The operator is considered in two classes ofcharge states and compared with the predictions of a functions. The functions from the first class have on-model based upon the independent electron shell limit and the functions from the second classapproximation, have an on-shell singularity o_a type (z-P2)I=, aeR.
In both classes the most singular part of "fiG° isfound to be proportional to a delta function. In order
NUCLEAR EFFECTS IN DILEPTON AND for Faddeev equations to have a solution in theQUARKONIUM PRODUCTION second class, or is shown to be equal to the sum of
So_erfeld parameters of all two-body subsystems.S. V. Akulinichev
(February, 1993) ON THE COULOMB SINGULAR KERNEL OFLIPPMAN-SCHWINGER TYPE EQUATION
The dilepton, J/_ and T production in nuclei byfast protons and pions is discussed. A new scenario D.M. Latypov and A. M. Mukhamedzhanovis suggested: the initial state interactions are J. Math. Phys. (Submitted, 1993)described by inelastic scattering (absorption) of
constituent quarks, whereas for the final state Lippman-Schwinger type equation with Coulombinteractions in quarkonium production we adopt the singular kernel is considered. It is shown that all its"color transparency" model. For the dilepton solutions are singular on the energy shell, k2/2#-E.production by protons the contribution of excess In order for this equation to have a solution with apions is important. The available data are singularity of the type (E-k2/2/_+ k) _=,ot is shown toqualitatively described, be equal to the Coulomb parameter _1. The Coulomb
singular kernel in the given class of functions is
STATISTICAL AND DYNAMICAL ASPECTS found to split into a &function and a kernel whichOF HOT NUCLEUS DE-EXCITATION smoothes the singularity.
M. Gui, K. Hagel, J. Li, Y. Lou, J. B. Natowitz, R.Wada, D. Utley, B. Xiao
(January, 1993)Proceedings of Predeal International Summer
School
Recent experiments designed to explore fragmentemission dynamics, time scales for fragment emissionfrom highly excited nuclei, and multifragmentemission processes are summarized. Reactions
VI - 160
TALKS PRESENTED
April 1992- March 1993
Competing De-Excitation Modes in Hot Nuclei, J. B. Natowi|:_, ._, Catania Workshop on Heavy IonReactions, Catania, Italy (May, 1992).
Rho Meson Spectral Function in Dense Matter, C. M. Ko, !nvited Ta_k, Conference on Realistic Nuclear Structure,Stony Brook, New York (May, 1992).
Hadrons in Dense Matter, M. Asakawa, C. M. Ko, P. LSvai, International Workshop on QCD Vacuum, Paris,France (June, 1992).
Performance of the Texas A&M ECRIS, G. Mouchatv, R. C. Rogers, P. Smelser, D. P. May, 13th InternationalConference on Cyclotrons and their Applications, Vancouver, Canada (June, 1992).
Design of a Beam Buncher Using a Half-Cosine Drivit_g Function, Ftt.__, 13th International Conferenceon Cyclotron_ and their Applications, Vancouver, Canada (June, 1992).
Effect of the Main Coil Position on the Accelerated Beam of the KSO0 Cyclotron, D. P. May and G. Mouchaty, 13thInternational Conference on Cyclotrons and their Applications, Vancouver, Canada (June, 1992).
Results from the Deflector Test Stand at Texas A&M University, _, G. Derrig, W. Dewees, P. Smelser, D.Tran, R. C. Rogers, 13th International Conference on Cyclotrons and their Applications, Vancouver, Canada (June,1992).
Probing Dense Hadronic Matter in Heavy Ion Collisions, C. M. Ko, Invited Talk, International Workshop onIntermediate and High Energy Nuclear Physics, Beijing, China (August, 1992).
Statistical and Dynamical Aspects of Hot Nucleus De-Excitation, J, B. Natowitz, Invit.edTalk, International PredealSchool on Nuclear Physics, Predeal, Romania (August, 1992).
Dynamical and Statistical IMF Emission in Heavy Ion Reactions Near the Fermi Energy, R, Wada, K. Hagei, H.L. Johnston, J. Li, Y. Lou, D. Utley, B. Xiao, J. B. Natowitz, Fall Meeting of the Division of Nuclear Physics,Santa Fe, New Mexico, (October, 1992), Bulletin of the American Physical Society 37 No. 5, pg. 1262 (1992).
Exaporation Residue Production in Reactions with 35 atut 40 AMeV 4°At, D. Utle¥, Y. Lou, B. Xiao, M. Gui, J.Li, R. Wada, K. Hagel, J. B. Natowitz, Fall Meeting of the Division of Nuclear Physics, Santa Fe, New Mexico(October, 1992), Bulletin of the American Physical Society 37 No. 5, pg. 1262 (1992).
Fission-Like Processes in the Reaction _Cu + S°°Moat tO, 17 atut 25 MeV/u, Y, Lou, T. Betting, L. Cooke, M.Gonin, M. Gui, K. Hagel, B. Hurst, G. Mouchaty, J. Natowitz, D. O'Kelly, R. P. Schmitt, W. Tunnel, D.
Utley, R. Wada, M. E. Brandan, A. Menchaca-Rocha, B. Butch, D. Fabris, G. Nebbia, F. Gramegna, M. Poggi,G. Prete, J. Ruiz, G. Viesti, Fall Meeting of the Division of Nuclear Physics, Santa Fe, New Mexico (October,1992), Bulletin of the American Physical Society 37 No. 5, pg. 1299 (1992).
Hot Nuclei Produced in the _°Ca + 4°Ca Reaction at 35 MeV/u, _, M. Gonin, R. Wada, J. B. Natowitz,
B. H. Sa, Y. Lou, M. Gui, D. Utley, G. Nebbia, D. Fabris, G. Prete, J. Ruiz, D. Drain, B. Chambon, B.Cheynis, D. Guinet, S. C. Hu, A. Demeyer, C. Pastor, A. Giorni, A. Lleres, P. Stassi, J. B. Viano, P. Gonthier,Fall Meeting of the Division of Nuclear Physics, Santa Fe, New Mexico (October, 1992), Bulletin of the AmericanPhysical Society 37 No. 5, pg. 1262 (1992).
VII- 161

The Mass Asymmetry Dependence of Scission Times in the Reactions of 18.5 AMeVaJ6Xe + aTl, _, K. HaRel,Y. Lou, J. B. Natowitz, D. Utley, R. Wada, B. Xiao, G. Enders, W. Ki!lm, V. Metag, R. Novotny, O. Schwalb,R, Charity, R. Freifelder, A, Gobbi, W. Henninlt, K. D. Hildenbrand, R. Mayer, R. S. Simon, J. Wessels, G.
Casini, A. Olmi, A. A. Stefanini, Fall Meeting of the Division of Nuclear Physics, Santa Fe, New Mexico(October, 1992), Bulletin of the American Physical Society 37 No. 5, pg. 1261 (1992).
Phi Meson in Hot Dense Matter, ._ and C. M. Ko, Bulletin of the American Physical Society, Santa Fe,New Mexico (October, 1992).
Rescattertng Effects on Kaon Spectrum in Heavy lon Collisions, X. S. Fang and C. M. Ko, Bulletin of theAmerican Physical Society, Santa Fe, New Mexico (October, 1992).
The MT -Scaling in the Dilepton Spectrum as a Signature for the Quark-Gluon Plasma, M. Asakawa and C. M.Ko, International Workshop XXI on Gross Properties of Nuclei and Nuclear Excitations, Hirschegg, Austria(January, 1993).
Particle Production and Propagation in Dense Matter, C. M. Ko, Invited Talk, Workshop on Heavy-Ion Physicsat the AGS, Boston, Massachusetts (January, 1993).
Kaon Production and Propagation in Dense Matter Formed in Heavy Ion Collisions at Subthreshold Energies,C. M. Ko, X. S. Fang, Y. M. Zheng, International Workshop XXI on Gross Properties of Nuclei and NuclearExcitations, Hirschegg, Austria (January, 1993).
Medium Effects on Subthreshold Kaon Production in Heavy Ion Collisions, X. $. Fang, C. M. Ko, Y. M. Zheng,Ninth Winter Workshop on Nuclear Dynamics, Key West, Florida (February, 1993).
Rho Meson in Dense Matter, C. M, Ko and M. Asakawa, Ninth Winter Workshop on Nuclear Dynamics, KeyWest, Florida (February, 1993).
Vll- 162
CONFERENCE PROCEEDINGS
April 1, 1992 - March 31, 1993
Rho Meson Spectral Function tn Dense Matter, _, Conference on Realistic Nuclear Structure, Stony Brook,New York (May, 1992) (in press).
Performance of the Texas A&M ECRI$, _h.._Qg.f,hg_, R. C. Rogers, P. Smelser, D. P. May, 13th InternationalConference on Cyclotrons and their Applications, Vancouver, Canada (June, 1992), p. 369.
Design of a Beam Buncher Using a Ha_-Coslne Driving Function, L._J_gf, n, 13th International Conferenceon Cyclotrons and their Applications, Vancouver, Canada (June, 1992), p. 629.
Effect of the Main Coil Position on the Accelerated Beam of the KSO0 Cyclotron, D. P, May and G. Mouchaty, 13thInternational Conference on Cyclotrons and their Applications, Vancouver, Canada (June, 1992), p. 439.
Results from the Deflector Test Stand at Texas A&M Utliversity, D. May, G. Derrig, W. Dewees, P. Smelser, D.Tran, R. C. Rogers, 13th International Conference on Cyclotrons and their Applications, Vancouver, Canada (June,1992), p. 602.
Hadrons in Dense Matter, M. Asakawa, C. M. Ko, P. L_vai, Proceedings of the International Workshop on QCD
Vacuum, Paris, France (June, 1992), p. 298.
Probing Dense Hadronic Matter in Heavy Ion Collisions, C. M, KO, International Workshop on Intermediate andHigh Energy Nuclear Physics, Beijing, China (August, 1992).
Particle Production and Propagation in Dense Matter, .C.M. K0, Workshop on Heavy-Ion Physics at the AGS,Boston, Massachusetts (January, 1993) (in press).
Kaon Production and Propagation in Dense Matter Formed in Heavy Ion Collisions at SubthreshoM Energies,C. M, Ko, X. S. Fang, Y. M. Zheng, International Workshop XXI on Gross Properties of Nuclei and NuclearExcitations, Hirschegg, Austria (January, 1993) (in press).
The Mr.Scaling in the Dilepton Spectrum as a Signature for the Quark-Gluon Plasma, M. Asak_lw_land C. M. Ko,Proceedings of the International Workshop XXI on Gross Properties of Nuclei and Nuclear Excitations, I-lirschegg,Austria (January, 1993) (in press).
Rho Meson in Dense Matter, C. M. Ko and M. Asakawa, Ninth Winter Workshop on Nuclear Dynamics, KeyWest, Florida (February, 1993) World Scientific (in press).
Medium Effects on Subthreshold Kaon Production in Hem_ Ion Collisions, ._, C. M. Ko, Y. M. Zheng,Proceedings of the Ninth Winter Workshop on Nuclear Dynamics, Key West, Florida (February, 1993)
Scieptific (in press).
VII- 163
RESEARCH PERSONNEL AND ENGINEERING STAFF
FACULTY AND RESEARCH GROUP LEADERS RESEARCH ASSOCIATES
Carl A. Oagiiardi, Associate Prof'e_mr of Physics Masayuki Asakawa Michael Murray '°John C. Hiebert, Professor of Physics John Beget e R. Parameswaran
Che Ming Ko, Professor of Physics Aaron Chacon Gabriel Sampoll"Joseph B. Natowitz, Professor of Chemistry, Director Guangxi Dai7 Xiao-Lin TuLee Northcliffe, Profesmr of Physics George Kims Jeff Winger nRichard P. Schmitt, Professor of Chemistry Damir Latypov° Hongming XuRobert E. Tribble, Professor of Physics Wenzhong Liu Yu-Ming Zheng13Rimd L. Watson, Professor of Chemistry Xiao-Gang ZhouKevin L. Wolf, Professor of ChemistrySherry J. Yennello,I Assistant Professor of ChemistryDave H. Youngblood, Professor of Physics GRADUATE STUDENTS
VISITING SCIENTISTS
ChemistryS. V. Almlinichev, 2 Institute for Nuclear Research,
Moscow, Russia I
R, A. Eramzhyan, 3 Institute for Nuclear Research, Tye Botting Do,,'othy Mille_ 5Moscow, Russia Larry Cooke 14 Donna O'Kelly
Bradley Hurst William TurmelRESEARCH STAFF Harry Jabs Dennis Utley
Lane Whiteseil '6
Jeff Bronson, Senior Scientist
Haydeh Dejbakhsh, Assistant Research Scientist PhysicsJohn C. Hagei, Assistant Research ScientistVladimir Horvat, 4 Assistant Research Scientist
George Kim,5 Accelerator PhysicistYiu-Wing Lui, Research Scientist Gulnara Ajupova Shaleen Lee_°Don May, Accelerator Physicist Chahriar Assad Jiangtao Li2'George.s Mouchaty, Accelerator Physicist Angela Betker Fan LiuShalom Shlomo, Senior Scientist Xiao Bin Yunian Lou
Ryoichi Wads, Associate Research Scientist Xushan Fang David Semon22Stephen Fitzsimmons '_ Anthony Simon
ENGINEERING STAFF Jincai Jiang" Leo Van AusdeinBen Kokenge _9 Frank Welte 23
Walter Chapman, Mechanical Engineer AnastasiaZarubau
Greg Derrig, Mechanical EngineerRobert Gutierrez, Electrical EngineerRobert C. Rogers, Chief Engineer
Peter Smelser, Cryogenics Engineer
1From1-1-93 7From 12-1-92 'SFrom6-1-92 - 2-28-93 '*From6-4-92
2From8-24-92 - 12-31-92 SThrough4-30-92 '4Through12-31-92 2°From7-1-923From2-1-93 9Through8-31-92 '_l'hrough5-31-92 2'From6-1-924From6-1-92 '*From9-7-92 'SThmugh5-31-92 22From2-1-93SFrom5-1-92 'JThrough2-28-93 'TThrough5-31-92 7_From12-1-92 - 1-3|-93_From7-1-92 nFrom 3-1-93 I'From I-1-93 2*l'hrough12-31-92
VII- 164
Ill I I
INSTITUTE COLLOQUIUM SERIES
April 2 Jeremy Brown, Princeton University Proton Induced Pion Production Near Threshold
April 7 John Boger, State University of New Asymmetric Fission Barriers: A Comparison ofYork at Stony Brook Derived Versus Predicted Barriers
April 13 Sherry YenneUo, Michigan State Understanding Nuclear Fragmentation ReactionUniversity Mechanisms
April 14 Shoji Nagamiya, Columbia University, Nuclear Matter as an Assembly of Quarks-New York Experimental Challenge with Heavy Ion Beams
May 5 Umesh Oarg, University of Notre Dame From Single-Particle to Superdeformed: AMultitude of Shapes in the Hg Nuclei
May 21 Rick Casten, Brookhaven National Valence Correlation Schemes and Collectivity inLaboratory Nuclei
June 9 Ben Zeidman, Argonne National A Brief Overview of the Startup CEBAFLaboratory and Hampton University Experimental Program
July 2 Michael Murray, Los Alamos National Particle Spectra and Interferometry Results inLaboratory Relativistic Heavy Ion Experiments
July 16 Arturo Gomez, Nuclear Science RPA Calculations of the Nuclear ResponseInstitute, Mexico Function in the Continuum
August 20 T. Udagawa, University of Texas at Decay of the Delta Excited in NucleiAustin
August 25 R. Eramzhyan, Institute for Nuclear Photofragmentation of eLi and _LiResearch, Moscow, Russia
September 11 R. Eramzhyan, Institute for Nuclear Induced Pseudo-Scalar Weak Coupling and SpinResearch, Moscow, Russia Multipole Excitation in Nuclei
VII - 165
September 25 D. Kella, Weizmann Institute of Probing the First Microsecond Af..er the SmallScience, Israel l_mg-Coulomb Explosion Imaging at the
Weizmann Institute
October 5 R. t_ramzhyan, Institute for Nuclear Decay of Giant Dipole Resonance in the sd ShellResearch, Moscow, Russia Nuclei
October 19 M. Gonin, Brookhaven National Hadron Production in Si + A and Au + Au at
Laboratory AGS Energies
October 20 Linwood Lee, State University of New Near-Barrier Heavy-Ion Transfer Reactions
York at Stony Brook
October 23 G. Viesti, University of Padova, Italy Level Density Studies in Highly Excited Nucleiwith A=40-160 '_
October 30 Guoqiang Li, University of Idaho, Theoretical Description of Particle Production inMoscow Nucleus-Nucleus Collisions
November 11 Claude Lyneis, Cyclotron Laboratory, _!vancedECR Source for the CyclotronBerkeley
November 13 C.Y. Wong, Oak Ridge National The Decay of Toroidal and Bubble NucleiLaboratory
November 17 t._m Shapira, Oak Ridge National Fusion and Transfer at Sub- and Near-Barrier
Laboratory Energi_
November 24 M. Rajasekaran, University of Madras, Particle Emission from Excited FusedIndia Compounds at High Spins
December 1 Jill Marques, University of Sao Paulo, Symmet6cal Representation of the TransitionBrazil Matrix
December 8 Vladimir Zelevinsky, Institute for Regular and Chaotic Featuresof Many BodyNuclear Physics, Novosibirsk, Russia Dynamics
VII- 166
January 12 Yoram Alhassid, Yale University Hot Nuclei - Theory and Phenomena
January 28 Li Xiong, State University of New Photon and Dilepton Production at RHIC'sYork at Stony Brook Energies
February 16 S.V. Akulinichev, Institute for Nuclear Nuclear Effects in Dilepton and QuarkoniumResearch, Moscow, Russia Production
February 23 David J. Vieira, Los Alamos National Studies of Exotic Nuclei at LAMPF and GSILaboratory
March 12 S. Pratt, Michigan State University Hadronic Microscopes for Intermediate-EnergyHeavy-lon Collisions
March 26 Chungsik Song, University of Effective Field Theory of Hadrons at FiniteMinnesota Temperature
March 29 X.-Q. Xie, Lawrence Berkeley Physics of the ECR SourceLaboratory
March 30 Xin-Nian Wang, Lawrence Berkeley Parton Dynamics in Ultrarelativistic Heavy-lonLaboratory Collisions
VII- 167
' INTERNAL INSTITUTE SEMINARS
December 10 Donna O'KeUy, Texas A&M University Electromagnetic Dissociation of Nuclei
February 8 Angie Betker, Texas A&M University Initial Pedornumce of the Proton Spectrometer
March 2 Hongming Xu, Texas A&M University Disappearance of Fusion, Flow and Rotation inHeavy Ion Collisions
VII- 168
IT/ IT/
- ,I,..... " "1" - ii _ - • ' - _ ..... _ ............... i ii"_|i_r"-iilli i il illllll liii ,Ti_iii ill,..... ,, ..... _..=-,,.,_....... ,__..._- ............... _,-_,-_......................... - .............I IlillH II II I/ Ill II II