integrated geophysical and hydrogeochemical studies of shallow aquifer contamination in osubi, near...
TRANSCRIPT

Journal of Earth Sciences and Geotechnical Engineering, vol. 5, no.4, 2015, 79-102
ISSN: 1792-9040 (print), 1792-9660 (online)
Scienpress Ltd, 2015
Integrated Geophysical and Hydrogeochemical Studies of
Shallow Aquifer Contamination in Osubi, Near Warri,
Southern Nigeria
Ofomola, M. O1
Abstract
Integrated geophysical and hydrogeochemical studies of shallow aquifer contamination
emanating from dumpsites in Osubi area, near Warri, Southern Nigeria has been carried
out. This was with a view to mapping contaminant presence and its impact on
groundwater in the area. Geophysical methods employed include the Spontaneous
Potential (SP), adopting the Gradient and the Fixed Base array techniques, the Dipole-
dipole array techniques, and the Electrical Resistivity, adopting the Vertical Electrical
Sounding(VES) method. A total of Nine (9) VES stations were occupied across the
dumpsite using the schlumberger configuration with electrode separation, AB/2 ranging
from 40 to 225 m. Dipole-dipole profiling was carried out along two orthogonal traverse
lines of length ranging from 50 to 250 m with electrode separation of 5 m. Spontaneous
Potential profiling was also carried out with electrode spacing of 5 and 10 m. From the
dumpsite area, water samples were collected from boreholes, hand dug wells, and
swamps, close to and far away from the dumpsites for chemical analysis. All these
measurements were carried out in both the rainy and dry seasons in order to establish the
seasonal variation of the migration of leachate from the dumpsites. The geoelectric
sections from the VES generated revealed three to four probable subsurface geoelectric
units, which are the topsoil, clayey sand/sandy clay and sand. Around the dumpsites, the
resistivity values from the VES and Dipole - dipole measurement to a depth of about 15 m
varies from 18 to 400 ohm-m as against higher values of up to 2500 ohm-m outside the
dumpsite area. Also, the spontaneous potential (SP) profiles show high positive potential
of up to 500 mV outside the dumpsite area to as low as -450 mV around the dumpsite area
in both seasons. The low potential and resistivity values around the dumpsite area could
be the signature of the oxido-reduction phenomenon occurring at depth in the
contaminated groundwater.
Keywords: Contaminant, Oxido-reduction, Dumpsite, Spontaneous potential, Dipole-
dipole
1Department of Physics, Delta State University Abraka, Nigeria, Tel: +2348035057322

80 Ofomola, M. O
1 Introduction
Osubi is a growing community near Warri. The Warri Airport (also known as Osubi
Airstrip) is located in the area, and there is a rapid infrastructural development around the
airport region due to the closeness and prominence to the Niger Delta oil-producing area
of Nigeria. Osubi is fast becoming a busy modern community with rapid expansion of
building projects for the modern living. There is the world-renowned Nigeria Petroleum
Training Institute (PTI) nearby, and other infrastructural developments in the area. This
has led to the migration of people to the area, and uncontrolled and indiscriminate
dumping of both industrial and domestic wastes which are direct threat to the quality of
the environment, especially surface and groundwater resources. Leachate generated from
industrial and domestic landfill during the rain may eventually percolate and contaminate
groundwater. Consequently, pollution from landfills leads to potentially communicable
diseases. Groundwater is the subsurface transporting agent for dissolved chemicals
including contaminants. Materials dissolved from the wastes may be transported from the
burial or disposal site by groundwater flow, with the result that the quality of water from
wells is impacted by the contaminated groundwater. In addition, natural discharges of an
aquifer, such as at springs and seeps, can return a contaminant to the surface. Because of
the low speed of groundwater movement and natural flushing of aquifers, when areas are
contaminated, they commonly remain so for decades or longer. Also, contaminant
emanating from dumpsites usually enters the aquifer system from the land surface,
percolating down through the aerated soil and unsaturated (vadose) zone. This may extend
6 or 9 m into the soil, and many reductive and oxidative biological processes take place
and this may also impact negatively on the quality of groundwater (NRC, 1984)[1].
Integrated geophysical and hydrogeochemical methods have been adopted by several
authors for aquifer contaminant studies (Adepelumi et al., 2001 [2], Ehirim and
Nwankwo., 2010 [3], Ayolabi et al., 2013 [4], Ayolabi and Folashade., 2005 [5], Ugwu
and Nwosu., 2009 [6], Alile et al., 2010 [7])
1.1 Location and Geology of the Study Area
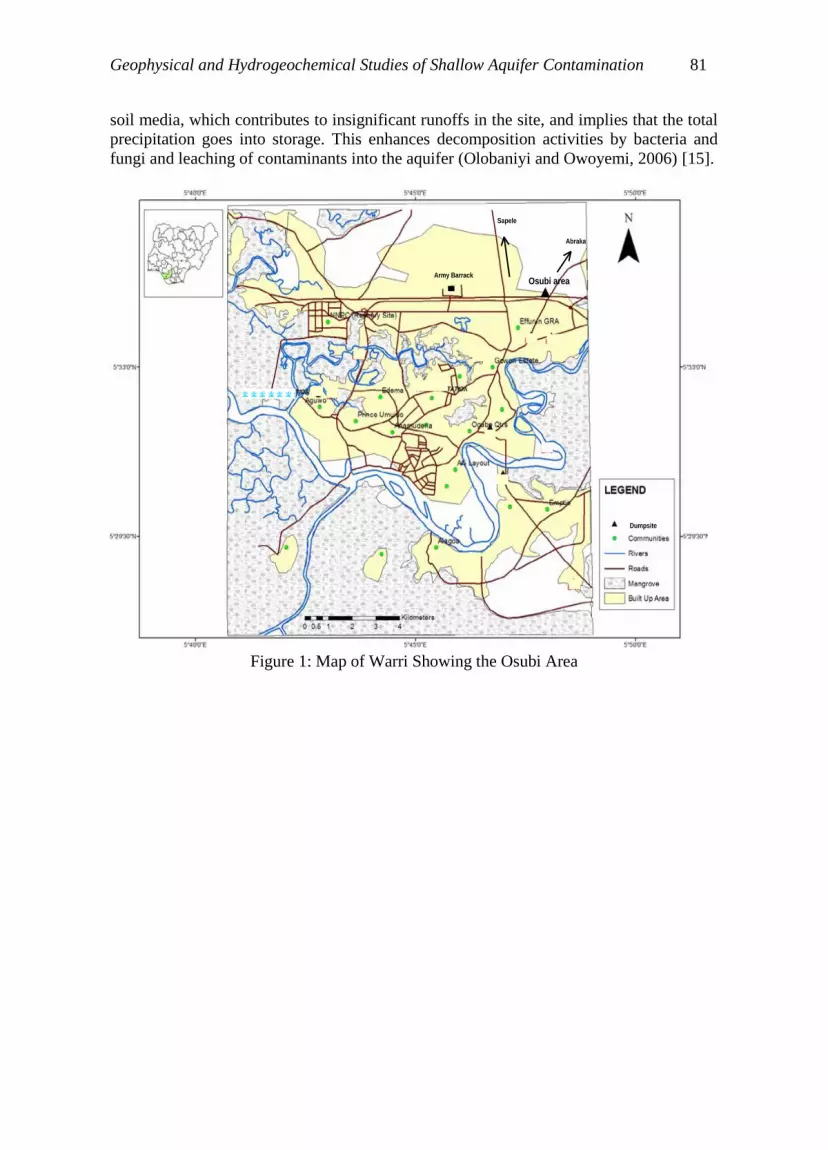
Osubi is located in Okpe Local Government Area of Delta state, southern Nigeria (Figure
1). The population is approximately over 8000 people in the 2006 national census. The
dumpsite studied is located along the Eku - Warri expressway. It is situated around
geographic coordinates of latitude 5039.638I N and longitude 5049.000I E (Figure 2)
covering an area of 100 by 100 m.
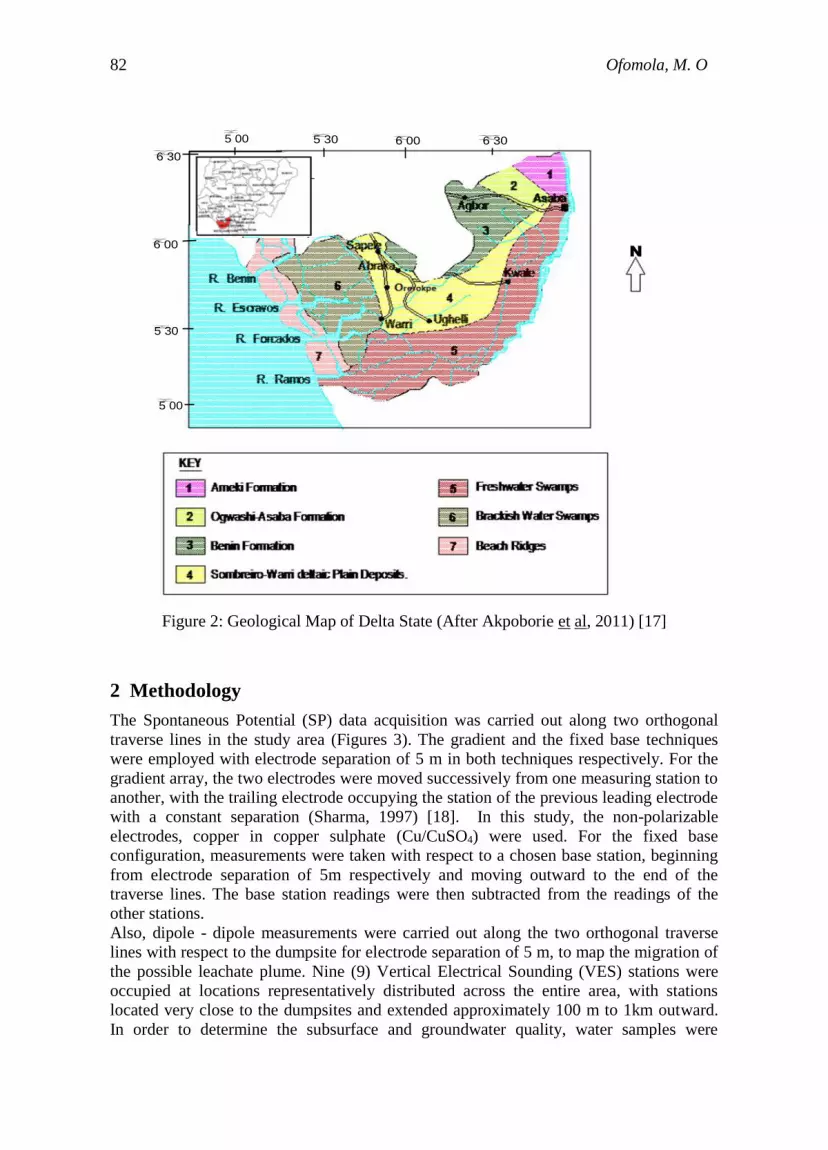
The area under study falls within the Niger Delta Province, with the regional geology
studied by several researchers (Asseez, 1989 [8], Reyment, 1965 [9], Short and Stauble,
1967 [10], Murat, 1970 [11], Merki, 1970[12]). Osubi area is characterised by nearly flat
topography sloping very slightly seawards (Akpokodje and Etu Efeotor, 1987 [13]) and
underlain by low-lying physiograhic province Quaternary sands of the Sombriero deltaic
plain (Figure 2). According to Wigwe, (1975) [14]; Olobaniyi and Owoyemi, (2006) [15],
This formation consists of fine to medium and coarse-grained unconsolidated sands that
are often feldspathic (with 30 - 40 wt % feldspars) and occasionally gravelly. The plain is
generally flat and rises only very gently towards the north and northeast with a gradient of
about 1:960 (Odemerho and Ejemeyovwi, 2007) [16], and elevation does not exceed 20 m
above sea level. The area is characterized by the proximity of the aquifers to the surface,
water table varying from 0 to 4m, flat topography, high annual rainfall, and permeable
Geophysical and Hydrogeochemical Studies of Shallow Aquifer Contamination 81
soil media, which contributes to insignificant runoffs in the site, and implies that the total
precipitation goes into storage. This enhances decomposition activities by bacteria and
fungi and leaching of contaminants into the aquifer (Olobaniyi and Owoyemi, 2006) [15].
Figure 1: Map of Warri Showing the Osubi Area
Abraka
Sapele
Army Barrack
Dumpsite
Osubi area
82 Ofomola, M. O
Figure 2: Geological Map of Delta State (After Akpoborie et al, 2011) [17]
2 Methodology
The Spontaneous Potential (SP) data acquisition was carried out along two orthogonal
traverse lines in the study area (Figures 3). The gradient and the fixed base techniques
were employed with electrode separation of 5 m in both techniques respectively. For the
gradient array, the two electrodes were moved successively from one measuring station to
another, with the trailing electrode occupying the station of the previous leading electrode
with a constant separation (Sharma, 1997) [18]. In this study, the non-polarizable
electrodes, copper in copper sulphate (Cu/CuSO4) were used. For the fixed base
configuration, measurements were taken with respect to a chosen base station, beginning
from electrode separation of 5m respectively and moving outward to the end of the
traverse lines. The base station readings were then subtracted from the readings of the
other stations.
Also, dipole - dipole measurements were carried out along the two orthogonal traverse
lines with respect to the dumpsite for electrode separation of 5 m, to map the migration of
the possible leachate plume. Nine (9) Vertical Electrical Sounding (VES) stations were
occupied at locations representatively distributed across the entire area, with stations
located very close to the dumpsites and extended approximately 100 m to 1km outward.
In order to determine the subsurface and groundwater quality, water samples were
5 30
5 00
6 00
6 30
5 00 5 30 6 00 6 30
N

Geophysical and Hydrogeochemical Studies of Shallow Aquifer Contamination 83
collected from different locations across the dumpsites, in the study area based on an
earlier field reconnaissance survey. Water samples were collected from dug wells,
boreholes, streams, burrowed pits, swamps and rivers at regular predetermined time
intervals for Hydrogeochemical studies. Geophysical measurements for the study were
carried out in both the rainy (June, 2012) and dry (December, 2012) seasons to determine
the influence of climatic changes on the generation and migration of leachate and the
effects that changes in hydrogeologic conditions (seasonal changes) would have on the
response of each method adopted. The ABEM signal averaging system terrameter (SAS
1000) model was used for resistivity and the spontaneous potential (SP) data acquisition.
Piezometric levels of wells were taken using the depth measuring tapes, while the
coordinates (longitude and latitude) of the VES points, traverse lines, boreholes and wells
were obtained with the aid of the global positioning system (Etrex, 2004). Water samples
were also collected using the water sample container (2 litres plastic bottles) for
hydrogeochemical analysis.
Figure 3: Data Acquisition Map for the Study Area
5.81 5.812 5.814 5.816 5.818 5.82 5.822 5.824 5.826 5.828 5.83
longitude
5.64
5.642
5.644
5.646
5.648
5.65
5.652
5.654
5.656
5.658
5.66
latit
ude
0 50 100 150 200
PTI HousingNew site of PTI
Osubi Airstrip
To Osubi town
To Effurun Roundabout
PTI
LEGEND
VES stations
Dipole dipole/SP traverse
Petroleum Training Institute
Osubi Dumpsite
m
Woodridge Hotel
V1V2
V3
V4
V5
V9
V6
V7
V8
FLOODED AREA
FLOODED AREA
Stream
SW
Borehole
Hand dug well
Stream water
HDW
SW

84 Ofomola, M. O
3 Results and Discussion
3.1 Spontaneous Potential (SP) Profiles across Osubi Area
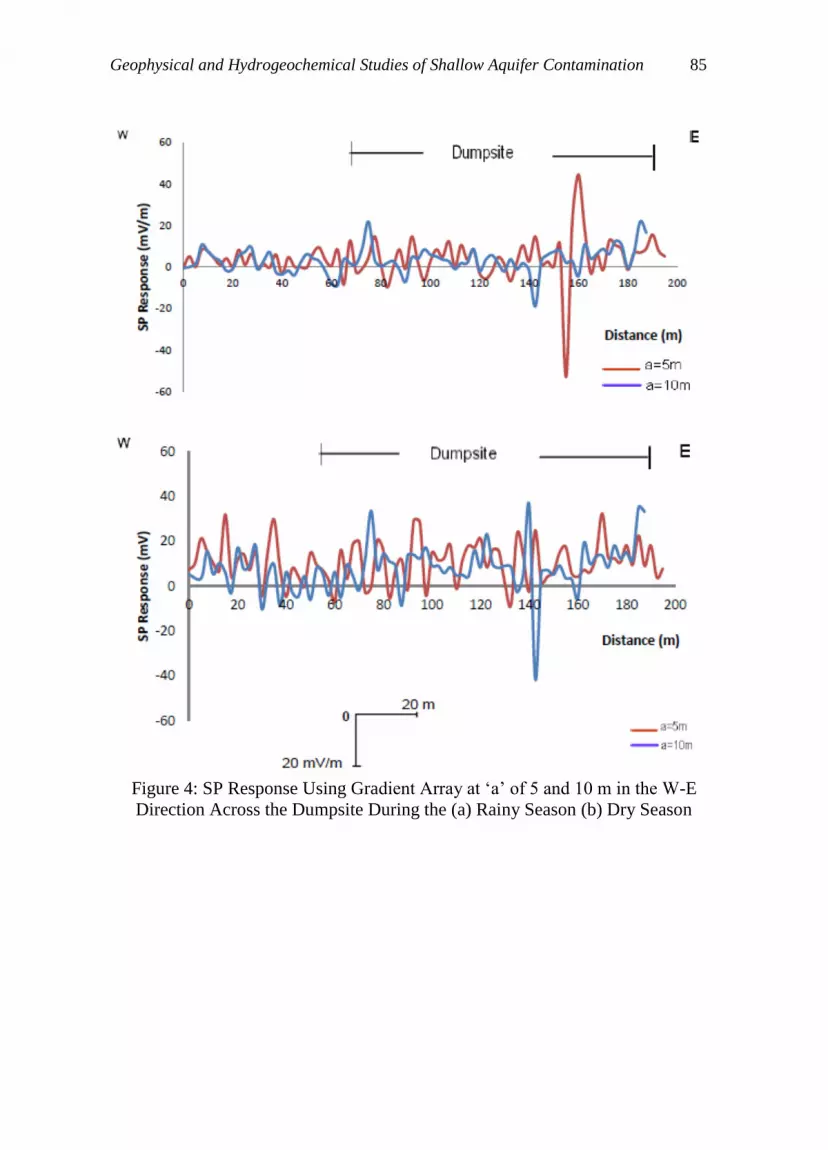
The SP response employing the gradient array along the W-E direction (Figure 4) shows a
relatively low potential of less than 20 and 40 mV/m outside the dumpsite area in the
rainy and dry season respectively, using electrode spacing of 5 and 10 m. The responses
under the dumpsite area reduce further to as low as -50 mV/m in both seasons which is
indicative of the presence of leachate from the dumpsite. This movement from positive to
negative which is more prominent at a distance between 120 and 170 m is indicative of
the movement of leachate and the presence of buried metallic materials from the
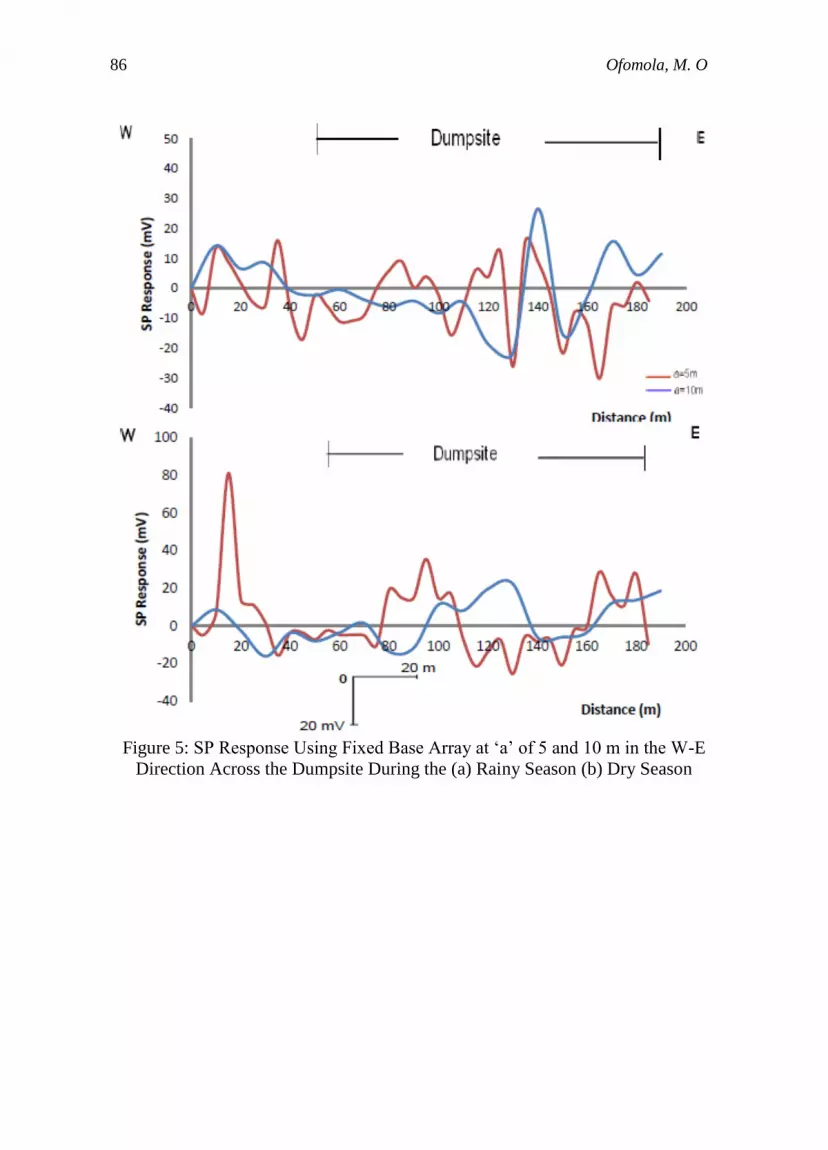
dumpsite. However, the response from the fixed base array in both the rainy and dry
seasons (Figure 5) shows positive values to as high as 20 mV and 80 mV under the
presupposed undisturbed area in both seasons to as low as -20 mV around the dumpsite
area with the major anomalous zone at a distance of 20 to 80 m and 120 to 170m
respectively . In the SW-NE direction, the gradient array profiles (Figure 6) show a steady
decrease of about 20 to 100 mV outside the dumpsite area to as low as -100 mV under the
dumpsite area in both the rainy and dry seasons. Also, from the fixed base array in the
SW-NE direction (Figure 7), the response around the dumpsite area ranges from 10 to -25
mV with the major anomalous zones at a distance of 60 to 120 m.
3.2 Dipole: Dipole Pseudosections across Osubi Area
The dipole dipole 2-D resistivity structure in the W-E direction with electrode spacing of
5 m shows three distinct layers in both seasons (Figures 8). The topsoil with blue
coloration has resistivity ranging from 21 to 38 ohm-m in the rainy season, and the topsoil
has been merged with the second layer in the dry season showing around stations 9 and
10, and stations 20 to 26, with resistivity ranging from 18 to 52 ohm-m. The low
resistivity of the topsoil may be an indication of the presence of leachate from the
dumpsite. The second layer characterised by the light green colour band is composed of
fine sand and has resistivity ranging from 52 to 95 ohm-m, and 54 to 130 ohm-m; and a
thickness ranging from 1.5 to 5.5 m, and < 25 m in the rainy and dry season respectively.
The third layer characterised by the yellowish – red colour is composed of the medium to
coarse grained sand. The modelled layer resistivity values are generally between 136 to
1077 ohm-m, and 203 to 1864 ohm-m in the both seasons respectively.
Geophysical and Hydrogeochemical Studies of Shallow Aquifer Contamination 85
Figure 4: SP Response Using Gradient Array at ‘a’ of 5 and 10 m in the W-E
Direction Across the Dumpsite During the (a) Rainy Season (b) Dry Season
86 Ofomola, M. O
Figure 5: SP Response Using Fixed Base Array at ‘a’ of 5 and 10 m in the W-E
Direction Across the Dumpsite During the (a) Rainy Season (b) Dry Season

Geophysical and Hydrogeochemical Studies of Shallow Aquifer Contamination 87
Figure 6: SP Response Using Gradient Array at ‘a’ of 5 and 10 m in the SW-NE
Direction Across the Dumpsite During the (a) Rainy Season (b) Dry Season

88 Ofomola, M. O
Figure 7: SP Response Using Fixed Base Array at ‘a’ of 5 and 10 m in the SW-NE
Direction Across the Dumpsite During the (a) Rainy Season (b) Dry Season

Geophysical and Hydrogeochemical Studies of Shallow Aquifer Contamination 89
Figure 8: 2-D Resistivity Structure at a=5 m in the W-E Direction Across the
Dumpsite During the Rainy and Dry Season respectively
Also, the 2-D resistivity structure in the SW-NE direction across the dumpsite shows
three distinct subsurface layers (Figures 9). With electrode spacing of 5 m, the topsoil
display characteristically very low resistivity in deep blue colour band of 10.9 to 52.6
ohm-m, and 12.9 to 60.1 ohm-m in the rain and dry season respectively. The topsoil
within the identified zones may have been contaminated by the leachate from the dump.
The second layer characterised by deep blue/ greenish colouration has resistivity generally
less than 200 and 220 ohm-m in both seasons respectively.
Dumpsite

90 Ofomola, M. O
Figure 9: 2-D Resistivity Structure at a= 5 m in the SW-NE Direction Across the
Dumpsite During the Rainy and Dry Season
The patches of very low resistivity zones (in deep blue colour) embedded within the low
resistivity second layer are diagnostic of the presence of contamination from the
dumpsite. The third layer with yellowish – red – purple colour band is the medium to
coarse grained sand which has a resistivity of 338 to 1700 ohm-m, and 317 to 600 ohm-m
in both seasons respectively. Along this traverse, the leachate is found to be moving in the
north eastern direction and also vertical migration between VES 6 - 9, to a depth of over
25 m and this will have direct impact on the quality of groundwater in the area.
3.3 Vertical Electrical Sounding Results
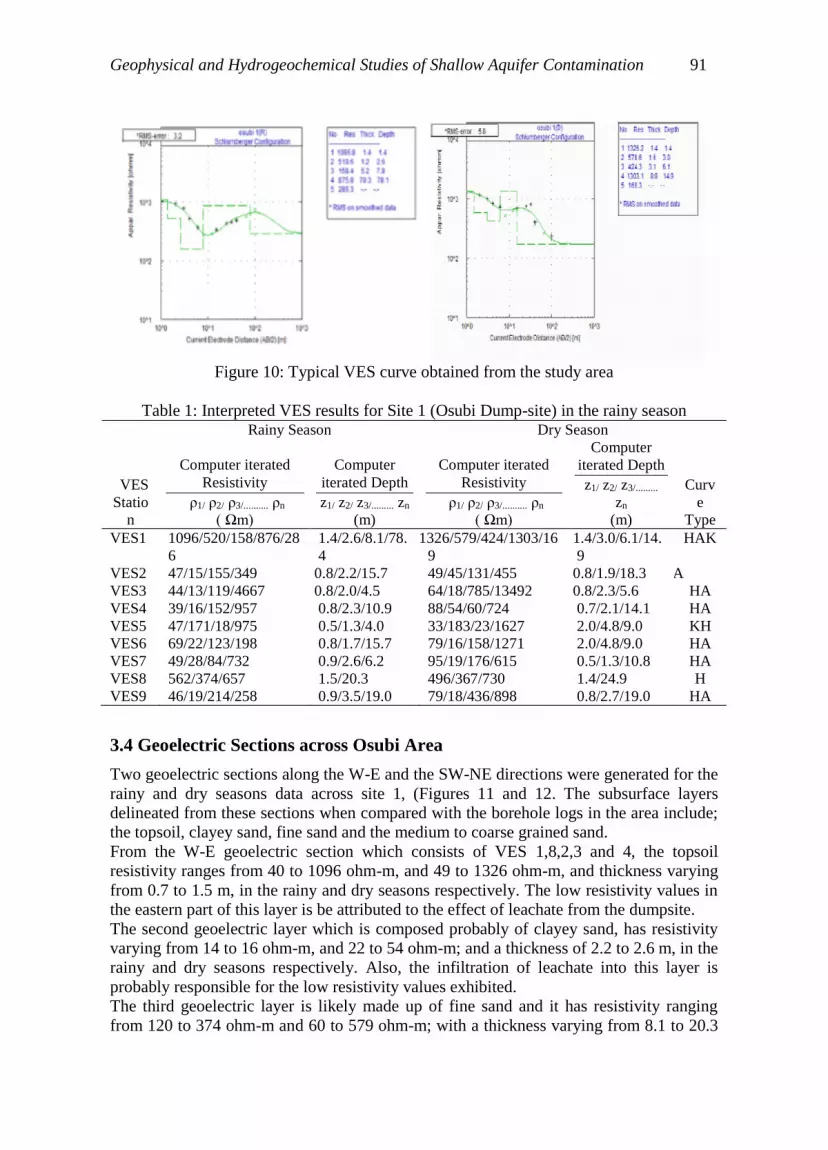
The field curves of the geoelectric data show the relation between the apparent resistivity
and half the current electrode spacing (Figure 10). The First order geoelectric parameters
of resistivity (ρ) and depth (z) from the results of the VES is presented in table 1, during
the two seasons.
V7
V9V5
V4
V6
Dumpsite
Geophysical and Hydrogeochemical Studies of Shallow Aquifer Contamination 91
Figure 10: Typical VES curve obtained from the study area
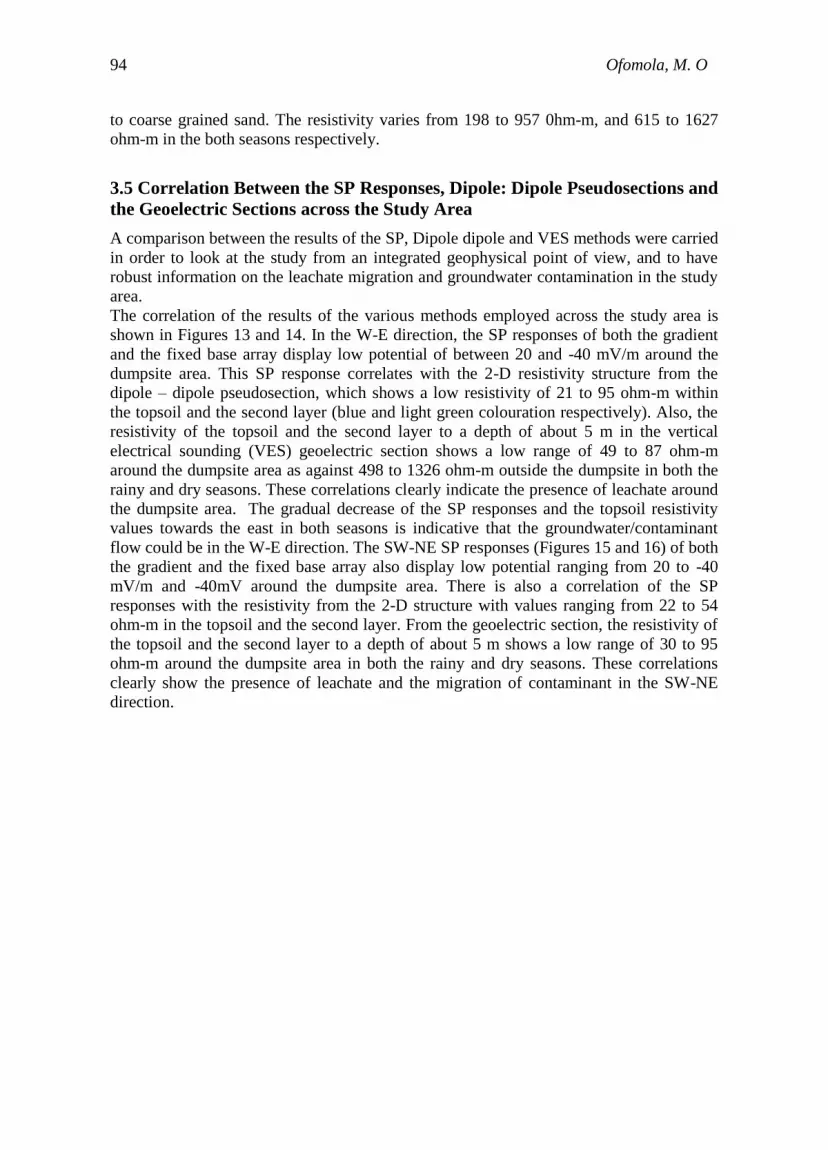
Table 1: Interpreted VES results for Site 1 (Osubi Dump-site) in the rainy season Rainy Season Dry Season
VES
Statio
n
Computer iterated
Resistivity
ρ1/ ρ2/ ρ3/.......... ρn
( Ωm)
Computer
iterated Depth
z1/ z2/ z3/......... zn
(m)
Computer iterated
Resistivity
ρ1/ ρ2/ ρ3/.......... ρn
( Ωm)
Computer
iterated Depth
z1/ z2/ z3/.........
zn
(m)
Curv
e
Type
VES1 1096/520/158/876/28
6
1.4/2.6/8.1/78.
4
1326/579/424/1303/16
9
1.4/3.0/6.1/14.
9
HAK
VES2 47/15/155/349 0.8/2.2/15.7 49/45/131/455 0.8/1.9/18.3 HA
VES3 44/13/119/4667 0.8/2.0/4.5 64/18/785/13492 0.8/2.3/5.6 HA
VES4 39/16/152/957 0.8/2.3/10.9 88/54/60/724 0.7/2.1/14.1 HA
VES5 47/171/18/975 0.5/1.3/4.0 33/183/23/1627 2.0/4.8/9.0 KH
VES6 69/22/123/198 0.8/1.7/15.7 79/16/158/1271 2.0/4.8/9.0 HA
VES7 49/28/84/732 0.9/2.6/6.2 95/19/176/615 0.5/1.3/10.8 HA
VES8 562/374/657 1.5/20.3 496/367/730 1.4/24.9 H
VES9 46/19/214/258 0.9/3.5/19.0 79/18/436/898 0.8/2.7/19.0 HA
3.4 Geoelectric Sections across Osubi Area
Two geoelectric sections along the W-E and the SW-NE directions were generated for the
rainy and dry seasons data across site 1, (Figures 11 and 12. The subsurface layers
delineated from these sections when compared with the borehole logs in the area include;
the topsoil, clayey sand, fine sand and the medium to coarse grained sand.
From the W-E geoelectric section which consists of VES 1,8,2,3 and 4, the topsoil
resistivity ranges from 40 to 1096 ohm-m, and 49 to 1326 ohm-m, and thickness varying
from 0.7 to 1.5 m, in the rainy and dry seasons respectively. The low resistivity values in
the eastern part of this layer is be attributed to the effect of leachate from the dumpsite.
The second geoelectric layer which is composed probably of clayey sand, has resistivity
varying from 14 to 16 ohm-m, and 22 to 54 ohm-m; and a thickness of 2.2 to 2.6 m, in the
rainy and dry seasons respectively. Also, the infiltration of leachate into this layer is
probably responsible for the low resistivity values exhibited.
The third geoelectric layer is likely made up of fine sand and it has resistivity ranging
from 120 to 374 ohm-m and 60 to 579 ohm-m; with a thickness varying from 8.1 to 20.3

92 Ofomola, M. O
m, and 7.8 to 20.3 m in the rainy and dry seasons respectively. Comparison with the
lithologic information from drilled well shows this layer is water bearing and the
preferred source for portable water for the inhabitants in the area.
Figure 11: Geoelectric Section along the W-E Direction in Site 1 (Osubi) During
the (a) Rainy Season (b) Dry Season

Geophysical and Hydrogeochemical Studies of Shallow Aquifer Contamination 93
Figure 12: Geoelectric Section Along the SW-NE Direction in Site 1(Osubi)
During the (a) Rainy Season (b) Dry Season
The SW-NE geoelectric section consists of VES 7, 6, 4, 5and 9. The topsoil resistivity
ranges from 39 to 69 ohm-m, and 34 to 95 ohm-m, and thickness varying from 0.5 to 0.9
m, in the rainy and dry seasons respectively. The low resistivity obtained in this layer
could be attributed to the effect of leachate from the dumpsite.
The second geoelectric layer which is probably composed of clayey sand, with resistivity
varying from 16 to 172 ohm-m, and 16 to 183 ohm-m; and a thickness of 1.3 to 3.5 m,
and 1.7 to 3.5 m in the rainy and dry seasons respectively. The infiltration of leachate into
this layer and lithology could be responsible for the low resistivity exhibited. The third
geoelectric layer is probably made up of fine sand and it has resistivity ranging from 18 to
214 ohm-m and 60 to 436 ohm-m; with a thickness varying from 4.0 to 19.0 m, in the
rainy and dry seasons respectively. The fourth geoelectric layer is composed of medium
94 Ofomola, M. O
to coarse grained sand. The resistivity varies from 198 to 957 0hm-m, and 615 to 1627
ohm-m in the both seasons respectively.
3.5 Correlation Between the SP Responses, Dipole: Dipole Pseudosections and
the Geoelectric Sections across the Study Area
A comparison between the results of the SP, Dipole dipole and VES methods were carried
in order to look at the study from an integrated geophysical point of view, and to have
robust information on the leachate migration and groundwater contamination in the study
area.
The correlation of the results of the various methods employed across the study area is
shown in Figures 13 and 14. In the W-E direction, the SP responses of both the gradient
and the fixed base array display low potential of between 20 and -40 mV/m around the
dumpsite area. This SP response correlates with the 2-D resistivity structure from the
dipole – dipole pseudosection, which shows a low resistivity of 21 to 95 ohm-m within
the topsoil and the second layer (blue and light green colouration respectively). Also, the
resistivity of the topsoil and the second layer to a depth of about 5 m in the vertical
electrical sounding (VES) geoelectric section shows a low range of 49 to 87 ohm-m
around the dumpsite area as against 498 to 1326 ohm-m outside the dumpsite in both the
rainy and dry seasons. These correlations clearly indicate the presence of leachate around
the dumpsite area. The gradual decrease of the SP responses and the topsoil resistivity
values towards the east in both seasons is indicative that the groundwater/contaminant
flow could be in the W-E direction. The SW-NE SP responses (Figures 15 and 16) of both
the gradient and the fixed base array also display low potential ranging from 20 to -40
mV/m and -40mV around the dumpsite area. There is also a correlation of the SP
responses with the resistivity from the 2-D structure with values ranging from 22 to 54
ohm-m in the topsoil and the second layer. From the geoelectric section, the resistivity of
the topsoil and the second layer to a depth of about 5 m shows a low range of 30 to 95
ohm-m around the dumpsite area in both the rainy and dry seasons. These correlations
clearly show the presence of leachate and the migration of contaminant in the SW-NE
direction.

Geophysical and Hydrogeochemical Studies of Shallow Aquifer Contamination 95
Figure 13: Gradient and Fixed Base array Responses, 2D Resistivity Structure at a = 5m
and Geoelectric Section at the W-E Direction over Site 1 (Osubi area) during the Rainy
Season

96 Ofomola, M. O
Figure 14: Gradient and Fixed Base Array SP Responses, 2D Resistivity Structure
at a = 5m, and Geoelectric Section in the W-E Direction Over the Dumpsite
During the Dry Season

Geophysical and Hydrogeochemical Studies of Shallow Aquifer Contamination 97
Figure 15: Gradient and Fixed Base Array SP Responses, 2D Resistivity Structure
at a = 5m, and Geoelectric Section in the SW-NE Direction Over the Dumpsite
During the Rainy Season

98 Ofomola, M. O
Figure 16: Gradient and Fixed Base Array SP Responses, 2D Resistivity Structure
at a = 5m, and Geoelectric Section in the SW-NE Direction Over the Dumpsite
During the Dry Season
3.6 Hydrogeochemical Analysis
Table 2 show the results of samples collected from two hand dug wells, a borehole and
swamp around the dumpsite in both the rainy and dry seasons. Most of the parameters
determined fell within the World Health Organisation (WHO) and the Nigerian Standard

Geophysical and Hydrogeochemical Studies of Shallow Aquifer Contamination 99
for Drinking water quality (NSDWQ), under the Standard Organisation of Nigeria (SON),
acceptable limits. Comparing the rainy and dry season results, there is a decrease in the
concentration of total dissolved solids (TDS), total suspended solids (TSS) and chloride in
the dry season. This could be attributed to the breaking down of much of the
biodegradable mass with time, while the decomposition of the organic components of the
waste by the action of micro organisms increases the level of organic matter for the period
of the rainy season. The high concentration of detrimental substances such as iron, lead
and total viable bacteria counts in all the samples call for urgent attention. This could be
as a result of corrosion of metallic scraps, infiltration of used engine/motor oil and faecal
contamination respectively. Also, the electrical conductivity of SW, HDW1 and HDW2
close to the dumpsite is observed to be fairly high, > 200 µs/cm3 in the rainy season and
>500 µs/cm3 in the dry season. This is in agreement with the low resistivity of < 100 ohm-
m observed in VES 2 and 3 close to the wells.

100 Ofomola, M. O
Table 2: Physiochemical parameters of groundwater from the study area in the rainy and dry seasons
Parameter
NSDQW
Max
Permissible
WHO’s
Max
Permissible
RAINY SEASON DRY SEASON
HDW1 HDW2 SW BH HDW1 HDW2 SW BH
PH 6.5 – 8.5 5.5 – 8.5 6.40 7.00 6.60 6.50 6.85 7.50 7.63 6.52
Total Solids (TS) mg/L 500 34.91 39.26 37.84 19.57 34.26 39.26 35.54 19.23
Total dissolved solids
(TDS) mg/L 500 500 19.28 28.63 12.43 11.94 19.14 27.87 18.65 11.52
Total suspended solids
(TSS) mg/L 1000 1000 28.63 28.76 29.41 11.63 26.31 28.15 27.64 11.54
Alkalinity (mg/L) 2.63 7.94 0.94 0.50 2.45 7.55 0.63 0.50
Colour
Reddish
brown
Golden
green
Golden
green Colourless
Reddish
brown
Golden
green
Golden
green Colourless
Total Hardness (mg/L) 150 34.70 35.51 29.43 25.64 34.55 34.93 26.95 25.61
Carbonates (mg/L) 2.30 11.90 1.20 1.40 2.10 11.45 2.45 1.25
Chloride (mg/L) 250 200 18.47 16.58 18.84 12.43 15.35 15.53 15.86 10.87
Nitrate (mg/L) 50 10 11.07 10.46 10.73 8.64 10.65 10.15 10.43 8.55
Sulphate (mg/L) 100 200 9.43 8.16 7.89 7.63 8.76 8.05 7.35 7.41
Lead (mg/L) 0.01 0.01 0.021 0.416 0.017 0.02 0.016 0.405 0.018 0.02
Potassium (mg/L) 11.47 11.34 0.98 0.78 14.65 15.43 6.84 0.83
Sodium 200 6.16 5.78 8.41 4.63 8.56 7.34 12.54 4.85
Phosphate (mg/L) 4.17 3.84 5.64 2.94 5.73 8.05 6.23 2.96
Calcium (mg/L) 75 18.63 24.63 16.31 3.47 22.86 28.23 19.54 3.52
Magnesium (mg/L) 50 16.16 21.63 11.16 8.04 19.65 24.15 15.23 8.16
Copper (mg/L) 1.0 1.0 ND ND ND ND ND ND ND ND
Iron (mg/L) 0.3 0.3 0.11 0.14 0.38 0.03 0.18 0.18 0.45 0.03
Temperature (0C) 25.60 25.60 25.60 25.70 25.60 25.60 25.60 25.70
Turbidity (NTU) 5.0 5.0 22.0 28.03 16.16 6.17 25.0 29.85 21.32 6.25
Conductivity (µs/cm3) 1000 500 510.0 653.0 655.0 465 340.0 350 300.0 340
Total viable bacteria
count (cfu/mL) 10 31.6 34.7 48.4 10.4 24.8 29.5 41.5 8.2

Geophysical and Hydrogeochemical Studies of Shallow Aquifer Contamination 101
4 Conclusion
The integrated geophysical and hydrogeochemical methods have shown that the shallow
aquifer around the dumpsite area has been contaminated by leachate emanating from the
dumpsite. It is therefore recommended that continuous groundwater quality monitoring
and treatment should be encouraged in the area. Also, Efforts should be made by
government to drill boreholes to deeper depth, and construct proper and well designed
landfill sites at areas far away from the metropolis and proper environmental measures
should be taken to safeguard the aquifer from contamination.
5 References
[1] NRC. National Research Council, Groundwater Contamination, Geophysics
Research Forum, National Research Council, National Academy Press, Washington,
D.C., (1984) p3 - 10.
[2] A.A. Adepelumi, B.D. Ako and T.R. Ajayi Groundwater contamination in the
basement-complex area of Ile-Ife, southwestern Nigeria: A case study using the
electrical-resistivity geophysical method. Hydrogeology Journal, 9: (2001) 611-622
[3] C. N. Ehirim, and C. N. Nwankwo, Evaluation of aquifer characteristics and
groundwater quality using geoelectric method in Choba, Port Harcourt. Archives of
Applied Science Research, 2(2): (2010) 396-403.
[4] E. A. Ayolabi, A. F. Folorunso, and S. S. Idem. Application of Electrical Resistivity
Tomography in Mapping Subsurface Hydrocarbon Contamination. Earth Science
Research, Vol 2, No 1 (2013) pp 93 - 104
[5] E. A. Ayolabi, and J. O. Folashade. Geophysical and Hydrochemical Assessment of
Groundwater Pollution due to a Dumpsite in Lagos State, Nigeria. Journal of
Geophysical Society of India, 66: (2005) 318-322
[6] S. A. Ugwu, and J. I. Nwosu, Effect of Waste Dumps on Groundwater in Choba
using Geophysical Method. Appl. Sci. Environ. Manage, Vol. 13(1) (2009) 85 – 89.
[7] O. M. Alile., S. I. Jegede and R. E. Emekeme. Subsurface probe and hydrochemical
analysis for the purpose of siting waste landfill. African Journal of Environmental
Science and Technology, Vol. 4(1) (2010) pp. 001-005.
[8] O. L. Asseez,. Review of the Stratigraphy, Sedimentation and Structure of the Niger
Delta. Edited by Kogbe, Rock View (Nig) Ltd. Jos. (1989) Pp 311-324.
[9] R. A. Reyment. Aspects of the Geology of Nigeria. University of Ibadan Press,
Ibadan. (1965) 132pp
[10] K. C. Short., and A. J. Stauble. Outline of Geology of Niger Delta: AAPG Bull., 51
(1967), 761-779.
[11] R. C. Murat. Stratigraphy and Paleogeography of the Cretaceous and Lower Tertiary
in Southern Nigeria: In African Geology. University of Ibadan Press, (1970) 635-
648
[12] J. P Merki. Structural Geology of the Cenozoic Niger Delta: In African Geology.
University of Ibadan Press, (1970) 251-267
[13] E.G. Akpokodje, and J. O. Etu-Efeotor. The Occurrence and Economic Potential of
clean sand deposits of the Niger Delta. Journal of African Earth Sciences, 6(1),
(1987), 61-65

102 Ofomola, M. O
[14] G.A. Wigwe. The Niger Delta: Physical. In G.E.K. Ofomata (ed). Nigeria in maps:
Eastern States. Ethiope Publ. House, Benin City (1975).Pp380–400.
[15] S. B. Olobaniyi, and F. B Owoyemi. Characterization by Factor Analysis of The
Chemical Facies of Groundwater in the Deltaic Plain Sands Aquifer of Warri,
Western Niger Delta, Nigeria. African Journal of Science And Technology, Vol. 7,
No. 1, (2006). pp. 73 - 81
[16] F.O. Odemerho and D.O.Ejemeyovwi. The Physiographic Provinces and Drainage
Systems of Delta State, Nigeria, In: F.O. Odemerho et al.(eds) Delta State in Maps,
Delta State University, Abraka, (2007 ) pp. 9-17.
[17] I.A. Akpoborie, A.A.I. Etobro, B. Nfor, and S. Odagwe. Aspects of the geology and
groundwater conditions of Asaba, Nigeria. Archives of Applied Science Research,
3(2), (2011) 537– 550
[18] P. V. Sharma, , Environmental and engineering Geophysics. Cambridge University
Press, (1997) pp 265 – 281.