hydrogeochemical evolution of ordovician limestone groundwater in yanzhou, north china
TRANSCRIPT
Hydrogeochemical evolution of Ordovician limestonegroundwater in Yanzhou, North China
Yong Han,1,2 Guangcai Wang,1,2* Charles A Cravotta III,3 Weiyue Hu,4 Yueyue Bian,1
Zongwen Zhang1 and Yuanyuan Liu11 School of Water Resources and Environment, China University of Geosciences (Beijing), Beijing, China,
2 State Key Laboratory of Biogeology and Environmental Geology, China University of Geosciences (Beijing), Beijing, China,3 Pennsylvania Water Science Center, U.S. Geological Survey, New Cumberland, PA, USA,
4 Xi’an Branch of China Coal Research Institute, Xi’an, China,
Abstract:
Major-ion compositions of groundwater are employed in this study of the water–rock interactions and hydrogeochemical evolutionwithin a carbonate aquifer system. The groundwater samples were collected from boreholes or underground tunnels in the Ordovicianlimestone of Yanzhou Coalfield where catastrophic groundwater inflows can be hazardous to mining and impact use of thegroundwater as a water supply. The concentration of total dissolved solid (TDS) ranged from 961 to 3555mg/l and indicatesmoderately to highly mineralized water. The main water-type of the middle Ordovician limestone groundwater is Ca-Mg-SO4, withSO4
2- ranging from 537 to 2297mg/l, and average values of Ca2+ and Mg2+ of 455.7 and 116.6mg/l, respectively. The water sampleswere supersaturated with respect to calcite and dolomite and undersaturated or saturated with respect to gypsum. Along the generalflow direction, deduced from increases of TDS and Cl-, the main water–rock interactions that caused hydrogeochemical evolution ofthe groundwater within the aquifer were the dissolution of gypsum, the precipitation of calcite, the dissolution or precipitation ofdolomite, and ion exchange. Ion exchange is the major cause for the lower mole concentration of Ca2+ than that of SO4
2-. Thegroundwater level of Ordovician aquifer is much higher than that of C-P coal-bearing aquifers, so the potential flow direction isupward, and the pyrite in coal is not a possible source of sulfate; additional data on the stable sulfur and oxygen isotopic composition ofthe sulfate may be helpful to identify its origin. Although ion exchange probably accounts for the higher mole concentration of Na+
than that of Cl-, the dissolution of aluminosilicate cannot be ruled out. The data evaluation methods and results of this study could beuseful in other areas to understand flow paths in aquifers and to provide information needed to identify the origin of groundwater.Copyright © 2012 John Wiley & Sons, Ltd.
KEY WORDS water–rock interactions; hydrogeochemical evolution; Karst aquifer; Yanzhou Coalfield; North China
Received 17 September 2011; Accepted 2 March 2012
INTRODUCTION
The coalfield in North China accounts for over 60% of thecoal output of China. Over the past several decades,shallow coal reserves gradually have been exhausted;thus, the coal in deep reserves is becoming the main targetfor new mines in the region (Gao et al., 2009). In most ofthe coalfields in North China, the deep coal depositsoverlie an extremely thick Middle Ordovician carbonateaquifer, which is a hazard to mining because of potentialfor catastrophic inflows of groundwater to the overlyingdeep mines. At the same time, the Ordovician limestonegroundwater is an important water resource in NorthChina (Wu and Wang, 2006). Thus, knowledge of thehydrogeology of the Ordovician groundwater is importantfor mining safety and for management of the waterresource. Spatial variations in the chemical characteristics ofthe groundwater can be useful for elucidating the ground-water origin, circulation, and water–rock interactions that
contribute to hydrochemical evolution processes (Wanget al., 2006).The chemical composition of groundwater is controlled
by the composition and quantity of rainfall, the geologicalstructure and the mineralogy of the watersheds andaquifers, and geochemical processes along flow pathswithin the aquifer (André et al., 2005; Moral et al., 2008;Gastmans, 2010). Because the groundwater geochemicalevolution and circulation are closely related, the spatialvariations in chemistry of groundwater can be used toidentify important geochemical processes and major flowpaths within an aquifer system (Plummer et al., 2002;Guler et al., 2002; Rajmohan and Elango, 2004; Stotleret al., 2009; Belkhiri et al., 2010).This study evaluates feasible water–rock interactions to
explain the hydrogeochemical evolution of the Ordovicianlimestone groundwater at three coal mines of YanzhouCoalfield in North China. The spatial and temporalvariations of major cations and anions are interpreted toindicate the potential origin and circulation of thegroundwater and to provide a basis for understanding therisk factors associated with catastrophic inrushing of waterto deep mines and for developing strategies for waterresource management in the study area.
*Correspondence to: Guangcai Wang, School of Water Resources andEnvironment, China University of Geosciences (Beijing), 29 XueyuanRoad, Beijing 100083, China.E-mail: [email protected]
HYDROLOGICAL PROCESSESHydrol. Process. (2012)Published online in Wiley Online Library(wileyonlinelibrary.com) DOI: 10.1002/hyp.9297
Copyright © 2012 John Wiley & Sons, Ltd.
STUDY AREA
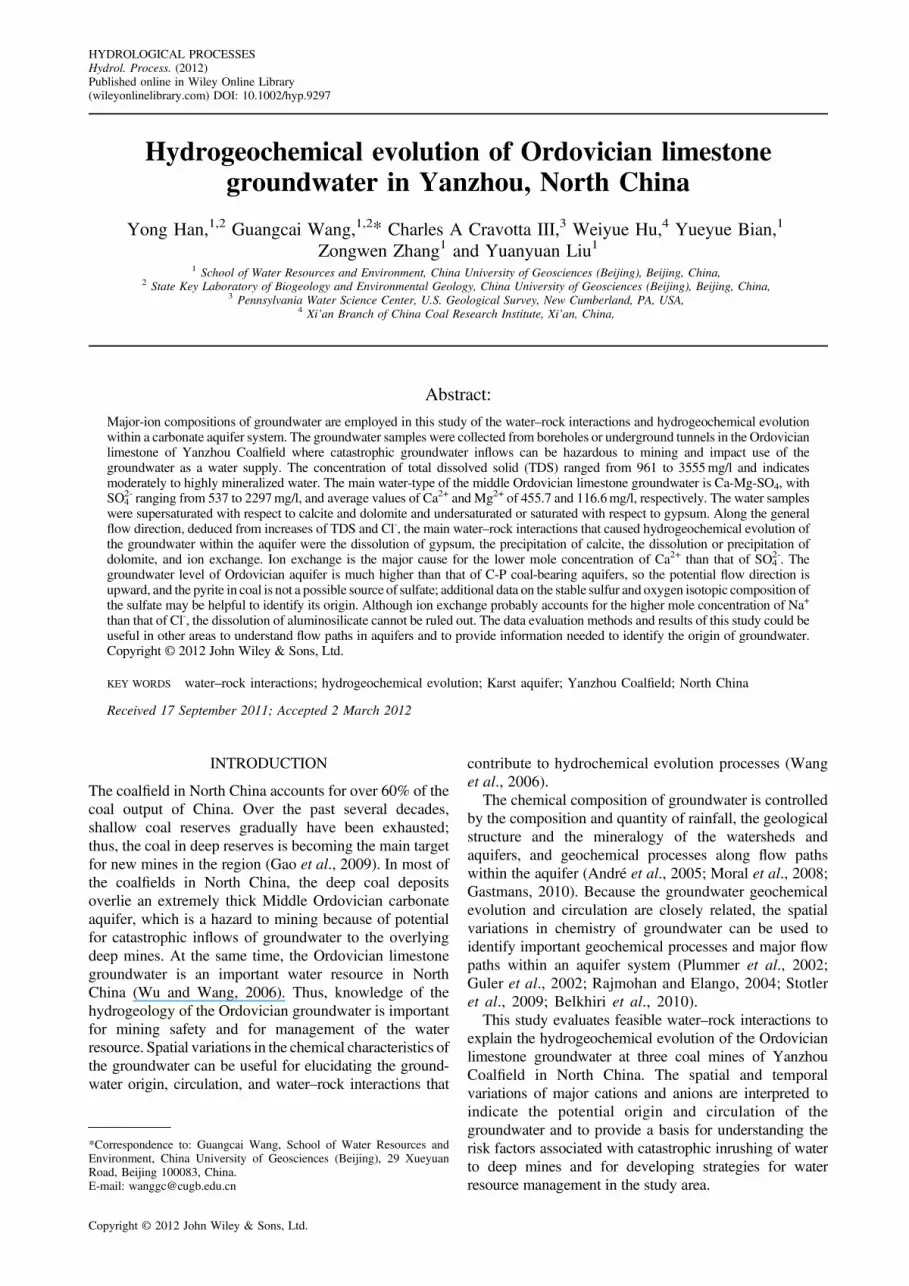
The Dongtan, Baodian, and Xinglong coal mines arelocated in the central part of Yanzhou Coalfield,Shandong Province, North China. The Si River andBaima River flow through the area underlain by thesemines (Figure 1). The land surface is in an extremely flatalluvial plain with elevation ranging from 40 to 46m. Thearea has four distinctive seasons and a temperate semi-humid monsoon climate with a mean annual temperatureof 13.1–16.1 �C. The average annual precipitation rangesfrom 269 to 1264mm, with the majority (65%) fallingfrom July to August. The average annual potentialevapotranspiration is 1800 to 2414mm.Yanzhou Coalfield is an incomplete eastward-plunging
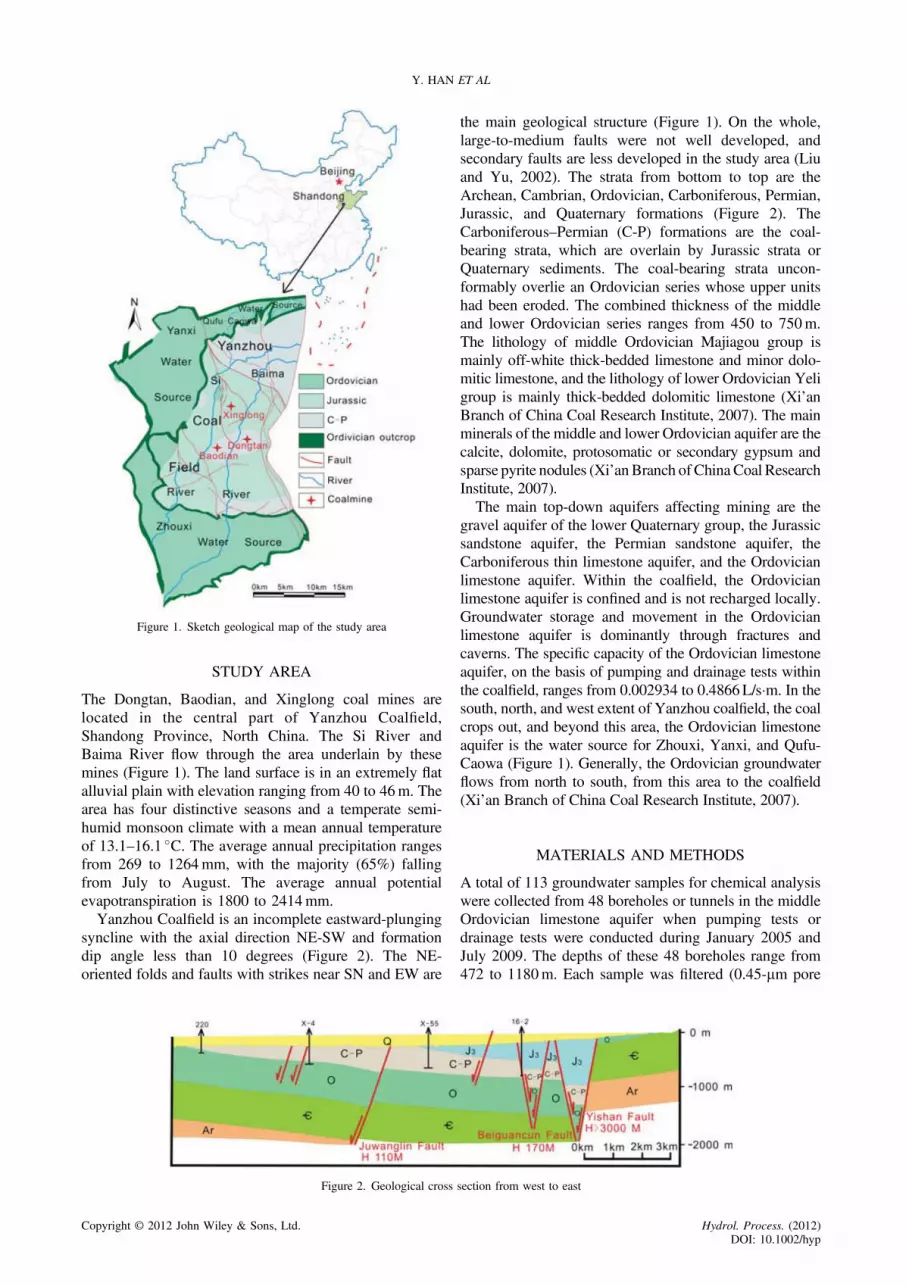
syncline with the axial direction NE-SW and formationdip angle less than 10 degrees (Figure 2). The NE-oriented folds and faults with strikes near SN and EW are
the main geological structure (Figure 1). On the whole,large-to-medium faults were not well developed, andsecondary faults are less developed in the study area (Liuand Yu, 2002). The strata from bottom to top are theArchean, Cambrian, Ordovician, Carboniferous, Permian,Jurassic, and Quaternary formations (Figure 2). TheCarboniferous–Permian (C-P) formations are the coal-bearing strata, which are overlain by Jurassic strata orQuaternary sediments. The coal-bearing strata uncon-formably overlie an Ordovician series whose upper unitshad been eroded. The combined thickness of the middleand lower Ordovician series ranges from 450 to 750m.The lithology of middle Ordovician Majiagou group ismainly off-white thick-bedded limestone and minor dolo-mitic limestone, and the lithology of lower Ordovician Yeligroup is mainly thick-bedded dolomitic limestone (Xi’anBranch of China Coal Research Institute, 2007). The mainminerals of the middle and lower Ordovician aquifer are thecalcite, dolomite, protosomatic or secondary gypsum andsparse pyrite nodules (Xi’anBranch of China Coal ResearchInstitute, 2007).The main top-down aquifers affecting mining are the
gravel aquifer of the lower Quaternary group, the Jurassicsandstone aquifer, the Permian sandstone aquifer, theCarboniferous thin limestone aquifer, and the Ordovicianlimestone aquifer. Within the coalfield, the Ordovicianlimestone aquifer is confined and is not recharged locally.Groundwater storage and movement in the Ordovicianlimestone aquifer is dominantly through fractures andcaverns. The specific capacity of the Ordovician limestoneaquifer, on the basis of pumping and drainage tests withinthe coalfield, ranges from 0.002934 to 0.4866L/s�m. In thesouth, north, and west extent of Yanzhou coalfield, the coalcrops out, and beyond this area, the Ordovician limestoneaquifer is the water source for Zhouxi, Yanxi, and Qufu-Caowa (Figure 1). Generally, the Ordovician groundwaterflows from north to south, from this area to the coalfield(Xi’an Branch of China Coal Research Institute, 2007).
MATERIALS AND METHODS
A total of 113 groundwater samples for chemical analysiswere collected from 48 boreholes or tunnels in the middleOrdovician limestone aquifer when pumping tests ordrainage tests were conducted during January 2005 andJuly 2009. The depths of these 48 boreholes range from472 to 1180m. Each sample was filtered (0.45-mm pore
Figure 1. Sketch geological map of the study area
Figure 2. Geological cross section from west to east
Y. HAN ET AL
Copyright © 2012 John Wiley & Sons, Ltd. Hydrol. Process. (2012)DOI: 10.1002/hyp

size) and preserved (ice, HNO3). The samples were storedin sealed polyethylene bottles on ice until analysed in thelaboratory.The groundwater pH and temperature were measured
in situ, and the concentrations of K+, Na+, Ca2+, Mg2+,HCO3
- , SO42-, and Cl- were measured in the Hydrochem-
istry Laboratory, the Institute of Hydrogeology andEnvironmental Geology, Chinese Academy of GeologicalSciences. Ca2+ and Mg2+ were analysed using atomicabsorption spectrophotometry, K+ and Na+ by atomicemission spectrophotometry, and Cl- and SO4
2- by ionchromatography (Wang et al., 2005). The chemicalresults were only accepted when the charge balance errorwas within �5%. Total dissolved solid (TDS) wascalculated as summation of all major ions.The geochemical program PHREEQC (Parkhurst and
Appelo, 1999) was used to compute the saturation index(SI) of major minerals, including calcite, dolomite, andgypsum. The SI indicates the potential for chemicalequilibrium between water and minerals and the tendencyfor water–rock interaction (Wen et al., 2008). Ifundersaturated (SI< 0), that phase, if present, feasiblycould be dissolved by the groundwater and, thus, could bea potential source of constituents. Likewise, if super-saturated (SI> 0), that phase feasibly could precipitate,thus limiting the constituent concentrations.
RESULTS AND DISCUSSION
Hydrochemical characteristics of Ordovician groundwater
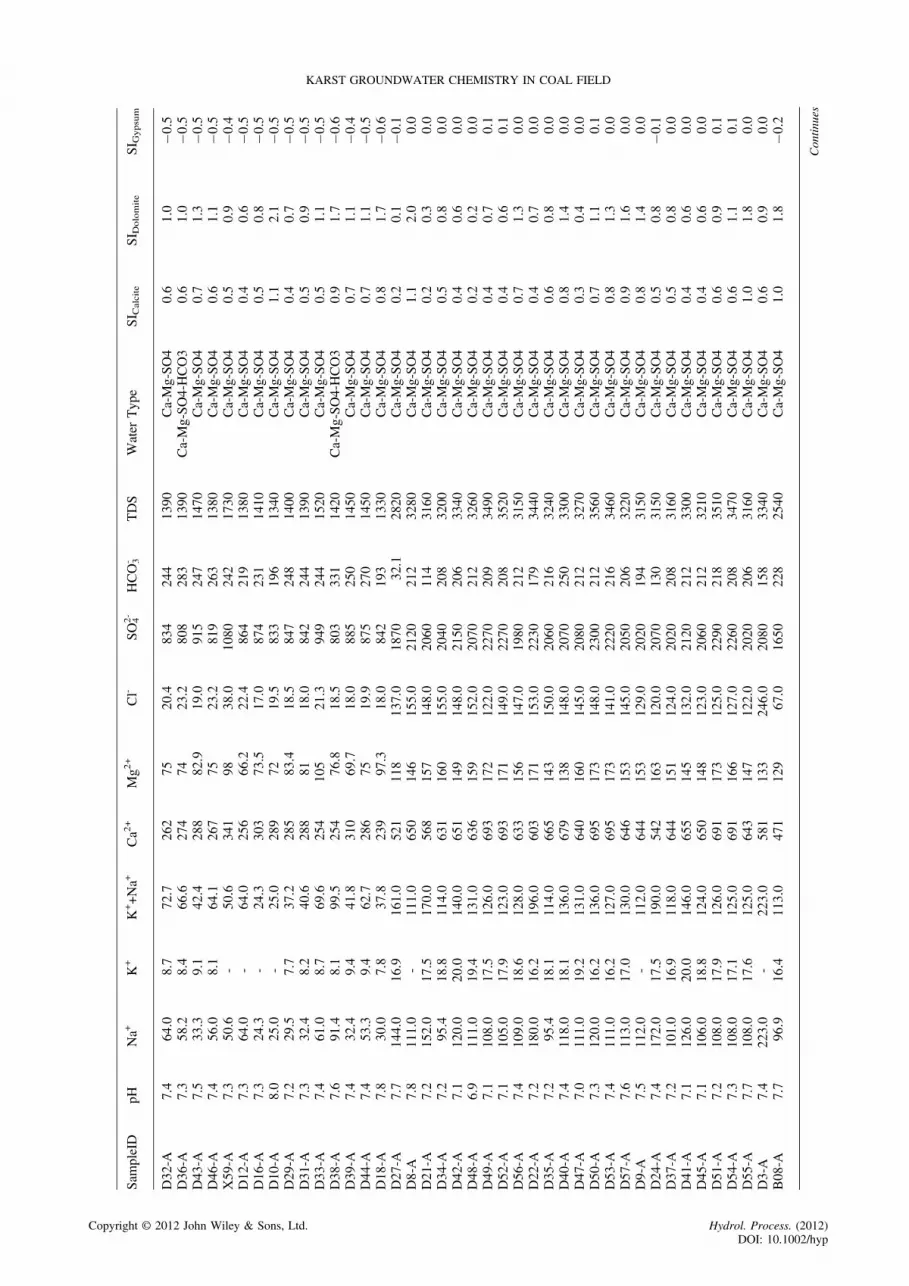
The TDS of the groundwater samples ranged from 961to 3555mg/l (Table I) and indicates moderately to highlymineralized water. The main anion was SO4
2- rangingfrom 537 to 2296mg/l. The main cations were Ca2+ andMg2+, with average values of 455.7 and 116.6mg/l,respectively. The pH ranged from 6.9 to 8.0.All the groundwater samples from the three coal mines
plot within the upper region of a Piper diagram, consistentwith mine drainage and gypsum dissolution (Figure 3).The predominant water-type is Ca-Mg-SO4, with someclassified as Ca-Mg-SO4-HCO3.
Saturation index
The SI values for calcite and dolomite for all sampleswere greater than 0 (Table II), indicating supersaturationand potential for precipitation of the carbonate minerals.In contrast, the SI of gypsum for most groundwatersamples was less than 0 (Table II), indicating that thegroundwater could feasibly dissolve gypsum, if present,along the flow path.
Ground water in recharge areas or in the upgradientarea of regional flow systems commonly is undersaturatedwith respect to calcite, dolomite, and gypsum. Suchundersaturation can result from insufficient mineralsources (leached from shallow rocks) and/or short timeof contact with the aquifer minerals and, consequently,less extensive water–rock interactions (Wang et al.,2005). Likewise, ground water that has had prolongedcontact with the aquifer may attain equilibrium with theminerals. In a confined, homogeneous aquifer, generallyTDS increases because of progressive mineral dissolutionalong the groundwater flow path. Therefore, TDS can beused with locational data to deduce groundwater flowdirection and origin (Gastmans, 2010).The SI values for calcite and dolomite ranged from 0 to
1.17 and 0 to 2.18, respectively, and were not correlatedwith TDS (Figure 4). Furthermore, the concentrations ofCa2+, Mg2+, and HCO3
- were not correlated with SICalcite(Figure 5) or SIDolomite (Figure 6), which also suggeststhat calcite and dolomite did not continue dissolvingalong the flow path. In contrast, SIGypsum was less than 0and was positively correlated with TDS (Figure 4). Thisindicates that the groundwater has the capacity to dissolvegypsum along the general flow direction and that theaddition of Ca2+ from the dissolution of gypsum couldlead to the observed supersaturation with respect to calciteand dolomite. Figure 7 supports the interpretation that thedissolution of gypsum can produce exponential increasesin Ca2+ and SO4
2- concentrations. The correlation
Table I. Chemical summary of Ordovician groundwater in the study area (units: mg/l)
pH K+ Na+ K++Na+ Ca2+ Mg2+ Cl- SO42- HCO3
- TDS
Average 7.4 14.6 82.4 93.3 455.7 116.6 80.1 1463.8 222.5 2320.8Max 8.0 32.3 223.1 223.1 695.0 173.2 299.6 2296.5 331.4 3555.4Min 6.9 6.9 24.3 24.3 193.6 54.8 17 537.1 32.1 961.1
Figure 3. Piper diagram of Ordovician groundwater samples
KARST GROUNDWATER CHEMISTRY IN COAL FIELD
Copyright © 2012 John Wiley & Sons, Ltd. Hydrol. Process. (2012)DOI: 10.1002/hyp

Table
II.Ions
concentrationof
Ordovicianground
water
inthestud
yarea
(units:mg/l)
Sam
pleID
pHNa+
K+
K++Na+
Ca2
+Mg2
+Cl-
SO42-
HCO3-
TDS
Water
Typ
eSI C
alcite
SI D
olomite
SI G
ypsum
X42
-A7.7
54.7
-54
.731
679
.613
6.0
786
244
1490
Ca-Mg-SO4
1.0
1.7
�0.5
X43
-A7.7
46.3
-46
.327
779
.153
.679
724
113
70Ca-Mg-SO4
0.9
1.7
�0.5
X62
-A7.3
27.0
-27
.019
454
.820
.453
725
696
1Ca-Mg-SO4-HCO3
0.4
0.7
�0.7
X52
-A7.5
31.8
-31
.821
966
.621
.966
219
911
00Ca-Mg-SO4
0.6
1.0
�0.6
X40
-A7.4
73.7
-73
.730
285
.445
.392
224
915
50Ca-Mg-SO4
0.6
1.1
�0.5
X41
-A7.3
70.1
-70
.130
486
.649
.093
324
415
70Ca-Mg-SO4
0.5
0.9
�0.4
X10
-A7.8
55.4
13.3
68.7
345
93.4
43.8
1110
244
1780
Ca-Mg-SO4
1.1
1.9
�0.4
X26
-A7.3
50.0
10.8
60.8
341
94.7
44.2
1060
244
1730
Ca-Mg-SO4
0.5
0.9
�0.4
X21
-A7.3
64.6
13.0
77.6
336
92.6
79.0
1080
244
1780
Ca-Mg-SO4
0.5
0.9
�0.4
X22
-A7.2
69.2
12.8
82.0
338
92.9
77.5
1090
244
1810
Ca-Mg-SO4
0.4
0.7
�0.4
X27
-A7.2
63.1
12.8
75.9
338
92.6
49.0
1080
246
1760
Ca-Mg-SO4
0.4
0.7
�0.4
X36
-A7.7
43.0
-43
.032
993
.635
.999
424
616
20Ca-Mg-SO4
1.0
1.8
�0.4
X37
-A7.7
44.8
-44
.833
394
.435
.910
2023
016
50Ca-Mg-SO4
0.9
1.7
�0.4
X12
-A7.4
50.8
13.8
64.5
366
98.1
41.8
1170
237
1860
Ca-Mg-SO4
0.7
1.1
�0.3
X20
-A7.3
46.0
11.4
57.4
361
101
59.6
1150
244
1850
Ca-Mg-SO4
0.6
1.0
�0.3
X29
-A7.1
56.2
12.1
68.2
357
102
39.5
1160
242
1840
Ca-Mg-SO4
0.3
0.5
�0.3
X11
-A7.8
50.8
13.8
64.5
366
98.1
41.8
1160
244
1850
Ca-Mg-SO4
1.1
2.0
�0.3
X19
-A7.4
47.7
11.9
59.6
374
9659
.611
8024
218
90Ca-Mg-SO4
0.7
1.2
�0.3
X28
-A7.2
47.7
11.9
59.6
363
106
41.4
1170
240
1860
Ca-Mg-SO4
0.4
0.8
�0.3
X45
-A7.9
79.6
-79
.637
697
.846
.411
9023
719
10Ca-Mg-SO4
1.2
2.1
�0.3
X08
-A7.1
50.8
12.7
63.5
384
101
46.1
1200
244
1920
Ca-Mg-SO4
0.4
0.5
�0.3
X15
-A7.0
50.0
12.0
62.0
385
101
42.3
1210
236
1920
Ca-Mg-SO4
0.2
0.3
�0.3
X24
-A7.4
47.7
10.8
58.5
379
101
43.3
1170
244
1880
Ca-Mg-SO4
0.7
1.2
�0.3
X60
-A7.8
74.9
-74
.927
174
.732
.383
923
314
10Ca-Mg-SO4
1.0
1.8
�0.5
X09
-A7.6
50.8
12.7
63.5
380
103
46.6
1210
244
1920
Ca-Mg-SO4
0.9
1.6
�0.3
X16
-A7.4
49.2
12.2
61.4
386
97.3
42.3
1210
231
1910
Ca-Mg-SO4
0.7
1.1
�0.3
X25
-A7.8
47.7
11.2
58.8
373
108
43.3
1200
241
1900
Ca-Mg-SO4
1.1
2.0
�0.3
X57
-A7.7
62.3
-62
.332
712
247
.111
7020
818
30Ca-Mg-SO4
0.9
1.7
�0.4
X47
-A7.8
54.7
-54
.737
110
842
.611
8021
218
60Ca-Mg-SO4
1.0
1.9
�0.3
X48
-A7.7
62.3
-62
.325
913
945
.710
8016
016
60Ca-Mg-SO4
0.7
1.5
�0.5
X14
-A7.0
43.1
11.1
54.2
306
75.1
20.9
940
256
1520
Ca-Mg-SO4
0.2
0.2
�0.4
X30
-A7.8
87.7
9.3
97.0
256
82.2
26.6
849
328
1480
Ca-Mg-SO4-HCO3
1.1
2.1
�0.5
X38
-A7.8
62.3
-62
.337
999
.258
.211
3024
918
50Ca-Mg-SO4
1.1
2.0
�0.3
X39
-A7.9
63.8
-63
.836
910
044
.511
2024
018
20Ca-Mg-SO4
1.2
2.2
�0.3
X46
-A7.3
79.7
-79
.736
697
.748
.111
6026
218
80Ca-Mg-SO4
0.6
1.0
�0.3
X06
-A7.2
49.8
11.5
61.3
344
103
41.8
1160
203
1820
Ca-Mg-SO4
0.3
0.6
�0.3
X07
-A7.6
53.8
12.9
66.8
375
103
41.4
1190
244
1900
Ca-Mg-SO4
0.9
1.6
�0.3
X18
-A7.7
48.5
10.9
59.4
374
101
70.0
1190
240
1910
Ca-Mg-SO4
1.0
1.8
�0.3
X23
-A7.1
49.2
11.2
60.4
367
105
42.8
1180
241
1880
Ca-Mg-SO4
0.3
0.5
�0.3
X50
-A7.7
30.5
-30
.524
610
218
.183
323
513
50Ca-Mg-SO4
0.8
1.7
�0.6
X44
-A7.8
76.2
-76
.235
180
30.3
1100
241
1760
Ca-Mg-SO4
1.1
1.9
�0.3
D23
-A7.5
43.0
6.9
49.9
291
80.5
20.4
936
231
1490
Ca-Mg-SO4
0.7
1.2
�0.5
D28
-A7.2
31.9
7.2
39.1
299
72.4
20.4
847
250
1400
Ca-Mg-SO4
0.4
0.7
�0.5
D30
-A7.3
50.5
7.3
57.9
255
91.6
22.3
837
270
1400
Ca-Mg-SO4
0.5
1.0
�0.5
Y. HAN ET AL
Copyright © 2012 John Wiley & Sons, Ltd. Hydrol. Process. (2012)DOI: 10.1002/hyp
D32
-A7.4
64.0
8.7
72.7
262
7520
.483
424
413
90Ca-Mg-SO4
0.6
1.0
�0.5
D36-A
7.3
58.2
8.4
66.6
274
7423.2
808
283
1390
Ca-Mg-SO4-HCO3
0.6
1.0
�0.5
D43
-A7.5
33.3
9.1
42.4
288
82.9
19.0
915
247
1470
Ca-Mg-SO4
0.7
1.3
�0.5
D46
-A7.4
56.0
8.1
64.1
267
7523
.281
926
313
80Ca-Mg-SO4
0.6
1.1
�0.5
X59
-A7.3
50.6
-50
.634
198
38.0
1080
242
1730
Ca-Mg-SO4
0.5
0.9
�0.4
D12
-A7.3
64.0
-64
.025
666
.222
.486
421
913
80Ca-Mg-SO4
0.4
0.6
�0.5
D16
-A7.3
24.3
-24
.330
373
.517
.087
423
114
10Ca-Mg-SO4
0.5
0.8
�0.5
D10
-A8.0
25.0
-25
.028
972
19.5
833
196
1340
Ca-Mg-SO4
1.1
2.1
�0.5
D29
-A7.2
29.5
7.7
37.2
285
83.4
18.5
847
248
1400
Ca-Mg-SO4
0.4
0.7
�0.5
D31
-A7.3
32.4
8.2
40.6
288
8118
.084
224
413
90Ca-Mg-SO4
0.5
0.9
�0.5
D33
-A7.4
61.0
8.7
69.6
254
105
21.3
949
244
1520
Ca-Mg-SO4
0.5
1.1
�0.5
D38-A
7.6
91.4
8.1
99.5
254
76.8
18.5
803
331
1420
Ca-Mg-SO4-HCO3
0.9
1.7
�0.6
D39
-A7.4
32.4
9.4
41.8
310
69.7
18.0
885
250
1450
Ca-Mg-SO4
0.7
1.1
�0.4
D44
-A7.4
53.3
9.4
62.7
286
7519
.987
527
014
50Ca-Mg-SO4
0.7
1.1
�0.5
D18
-A7.8
30.0
7.8
37.8
239
97.3
18.0
842
193
1330
Ca-Mg-SO4
0.8
1.7
�0.6
D27
-A7.7
144.0
16.9
161.0
521
118
137.0
1870
32.1
2820
Ca-Mg-SO4
0.2
0.1
�0.1
D8-A
7.8
111.0
-11
1.0
650
146
155.0
2120
212
3280
Ca-Mg-SO4
1.1
2.0
0.0
D21
-A7.2
152.0
17.5
170.0
568
157
148.0
2060
114
3160
Ca-Mg-SO4
0.2
0.3
0.0
D34
-A7.2
95.4
18.8
114.0
631
160
155.0
2040
208
3200
Ca-Mg-SO4
0.5
0.8
0.0
D42
-A7.1
120.0
20.0
140.0
651
149
148.0
2150
206
3340
Ca-Mg-SO4
0.4
0.6
0.0
D48
-A6.9
111.0
19.4
131.0
636
159
152.0
2070
212
3260
Ca-Mg-SO4
0.2
0.2
0.0
D49
-A7.1
108.0
17.5
126.0
693
172
122.0
2270
209
3490
Ca-Mg-SO4
0.4
0.7
0.1
D52
-A7.1
105.0
17.9
123.0
693
171
149.0
2270
208
3520
Ca-Mg-SO4
0.4
0.6
0.1
D56
-A7.4
109.0
18.6
128.0
633
156
147.0
1980
212
3150
Ca-Mg-SO4
0.7
1.3
0.0
D22
-A7.2
180.0
16.2
196.0
603
171
153.0
2230
179
3440
Ca-Mg-SO4
0.4
0.7
0.0
D35
-A7.2
95.4
18.1
114.0
665
143
150.0
2060
216
3240
Ca-Mg-SO4
0.6
0.8
0.0
D40
-A7.4
118.0
18.1
136.0
679
138
148.0
2070
250
3300
Ca-Mg-SO4
0.8
1.4
0.0
D47
-A7.0
111.0
19.2
131.0
640
160
145.0
2080
212
3270
Ca-Mg-SO4
0.3
0.4
0.0
D50
-A7.3
120.0
16.2
136.0
695
173
148.0
2300
212
3560
Ca-Mg-SO4
0.7
1.1
0.1
D53
-A7.4
111.0
16.2
127.0
695
173
141.0
2220
216
3460
Ca-Mg-SO4
0.8
1.3
0.0
D57
-A7.6
113.0
17.0
130.0
646
153
145.0
2050
206
3220
Ca-Mg-SO4
0.9
1.6
0.0
D9-A
7.5
112.0
-11
2.0
644
153
129.0
2020
194
3150
Ca-Mg-SO4
0.8
1.4
0.0
D24
-A7.4
172.0
17.5
190.0
542
163
120.0
2070
130
3150
Ca-Mg-SO4
0.5
0.8
�0.1
D37
-A7.2
101.0
16.9
118.0
644
151
124.0
2020
208
3160
Ca-Mg-SO4
0.5
0.8
0.0
D41
-A7.1
126.0
20.0
146.0
655
145
132.0
2120
212
3300
Ca-Mg-SO4
0.4
0.6
0.0
D45
-A7.1
106.0
18.8
124.0
650
148
123.0
2060
212
3210
Ca-Mg-SO4
0.4
0.6
0.0
D51
-A7.2
108.0
17.9
126.0
691
173
125.0
2290
218
3510
Ca-Mg-SO4
0.6
0.9
0.1
D54
-A7.3
108.0
17.1
125.0
691
166
127.0
2260
208
3470
Ca-Mg-SO4
0.6
1.1
0.1
D55
-A7.7
108.0
17.6
125.0
643
147
122.0
2020
206
3160
Ca-Mg-SO4
1.0
1.8
0.0
D3-A
7.4
223.0
-22
3.0
581
133
246.0
2080
158
3340
Ca-Mg-SO4
0.6
0.9
0.0
B08
-A7.7
96.9
16.4
113.0
471
129
67.0
1650
228
2540
Ca-Mg-SO4
1.0
1.8
�0.2
Contin
ues
Sam
pleID
pHNa+
K+
K++Na+
Ca2
+Mg2
+Cl-
SO42-
HCO3-
TDS
Water
Typ
eSI C
alcite
SI D
olomite
SI G
ypsum
KARST GROUNDWATER CHEMISTRY IN COAL FIELD
Copyright © 2012 John Wiley & Sons, Ltd. Hydrol. Process. (2012)DOI: 10.1002/hyp

Table
II.(Con
tinued)
Sam
pleID
pHNa+
K+
K++Na+
Ca2
+Mg2
+Cl-
SO42-
HCO3-
TDS
Water
Typ
eSI C
alcite
SI D
olomite
SI G
ypsum
B09
-A7.2
96.9
16.4
113.0
458
137
65.1
1610
224
2490
Ca-Mg-SO4
0.5
0.8
�0.2
B25
-A7.3
110.0
17.2
127.0
489
120
62.5
1690
218
2590
Ca-Mg-SO4
0.6
0.9
�0.1
B29
-A7.1
111.0
17.8
129.0
489
122
64.2
1650
221
2570
Ca-Mg-SO4
0.4
0.5
�0.1
B41
-A7.2
107.0
32.3
139.0
501
123
67.6
1690
216
2630
Ca-Mg-SO4
0.5
0.7
�0.1
B21
-A7.9
125.0
18.7
144.0
608
142
141.0
1970
203
3110
Ca-Mg-SO4
1.2
2.2
0.0
B22
-A7.2
130.0
20.4
150.0
597
150
137.0
2050
206
3190
Ca-Mg-SO4
0.5
0.8
0.0
B26
-A7.2
132.0
17.0
149.0
622
138
139.0
1930
208
3080
Ca-Mg-SO4
0.5
0.8
0.0
B30
-A7.2
129.0
17.6
147.0
618
142
139.0
1980
206
3130
Ca-Mg-SO4
0.5
0.8
0.0
B33
-A7.7
119.0
18.0
137.0
621
145
132.0
1960
217
3110
Ca-Mg-SO4
1.1
1.9
0.0
D5-A
7.4
204.0
-20
4.0
658
134
262.0
2100
203
3460
Ca-Mg-SO4
0.7
1.2
0.0
B10
-A7.3
113.0
19.4
132.0
559
139
107.0
1840
215
2880
Ca-Mg-SO4
0.6
1.0
�0.1
B11
-A7.8
110.0
19.2
129.0
555
140
110.0
1820
208
2860
Ca-Mg-SO4
1.1
2.0
�0.1
B07
-A7.2
88.8
16.4
105.0
555
157
98.9
1800
220
2830
Ca-Mg-SO4
0.5
0.9
�0.1
B23
-A7.0
65.1
15.7
80.8
581
144
91.3
1930
206
2930
Ca-Mg-SO4
0.3
0.3
0.0
B27
-A7.2
96.9
14.3
111.0
572
143
91.3
1850
216
2880
Ca-Mg-SO4
0.5
0.8
�0.1
B39
-A7.2
92.8
15.8
109.0
618
113
93.0
1800
212
2840
Ca-Mg-SO4
0.5
0.7
0.0
D4-A
7.5
135.0
-13
5.0
530
119
93.0
1800
164
2760
Ca-Mg-SO4
0.7
1.1
�0.1
B24
-A7.2
98.5
15.1
114.0
593
134
95.9
1860
218
2910
Ca-Mg-SO4
0.5
0.8
0.0
B28
-A7.3
98.5
16.0
114.0
593
132
97.2
1830
209
2870
Ca-Mg-SO4
0.6
1.0
�0.1
B31
-A7.2
94.6
16.9
112.0
585
137
89.6
1800
206
2830
Ca-Mg-SO4
0.5
0.8
�0.1
B32
-A7.4
94.6
16.9
112.0
585
138
93.4
1800
217
2840
Ca-Mg-SO4
0.7
1.2
�0.1
B34
-A7.2
94.6
17.1
112.0
581
140
92.1
1840
193
2860
Ca-Mg-SO4
0.5
0.7
�0.1
B35
-A7.1
94.6
17.1
112.0
581
141
91.7
1830
207
2860
Ca-Mg-SO4
0.4
0.6
�0.1
B36
-A7.2
92.3
15.9
108.0
586
141
92.1
1860
209
2890
Ca-Mg-SO4
0.5
0.8
�0.1
B37
-A7.3
91.2
15.5
107.0
585
139
91.3
1860
208
2880
Ca-Mg-SO4
0.6
1.0
�0.1
B38
-A7.2
91.7
15.3
107.0
592
135
94.7
1870
212
2900
Ca-Mg-SO4
0.5
0.8
0.0
B40
-A7.5
91.7
15.3
107.0
600
128
92.1
1840
218
2880
Ca-Mg-SO4
0.9
1.4
0.0
D15
-A7.8
136.0
-13
6.0
655
136
300.0
1840
147
3140
Ca-Mg-SO4
1.0
1.7
0.0
Y. HAN ET AL
Copyright © 2012 John Wiley & Sons, Ltd. Hydrol. Process. (2012)DOI: 10.1002/hyp

coefficients (r2) between Ca2+ and SIGypsum, and SO42- and
SIGypsum were 0.994 and 0.987, respectively.
Major ion contributions to TDS
The relations among TDS and major ions can be usefulto interpret major hydrogeochemical evolution processeswithin an aquifer and also can be used to deduce thesources of ions and the origin of the groundwater (Kumar2009). For cations in the Ordovician groundwatersamples, there is very good linear correlation between
the concentration of Ca2+ and TDS (r2 = 0.978), and therate of increase of Ca2+ with TDS (slope) is greater thanthose for Mg2+, Na+, and K+ (Figure 8). For anions, TDSand the concentration of SO4
2- exhibit the highestcorrelation (r2 = 0.996), and the rate of increase of SO4
2-
with TDS exceeds those for other anions. The concen-tration of Cl- increased with TDS, albeit more slowly thanSO4
2, whereas the concentration of HCO3- decreased
(Figure 9). These trends can be interpreted to indicatethat as gypsum dissolved, releasing Ca2+ and SO4
2-, calcite
0.0
2.0
4.0
6.0
8.0
10.0
12.0
14.0
16.0
18.0
0.00 0.25 0.50 0.75 1.00 1.25 1.50
SI (Calcite)
Ion
conc
entr
atio
n (m
mol
/l)
Ca
HCO3
Figure 5. Plot of saturation index (SI; calcite) versus ion concentration
0.0
2.0
4.0
6.0
8.0
10.0
12.0
14.0
16.0
18.0
0.00 0.40 0.80 1.20 1.60 2.00 2.40 2.80
SI (Dolomite)
Ion
conc
entr
atio
n (m
mol
/l)
Ca
Mg
HCO3
Figure 6. Plot of SI (dolomite) versus ion concentration
R2 (SIGypsum) = 0.968
-1.0
-0.5
0.0
0.5
1.0
1.5
2.0
2.5
900 1350 1800 2250 2700 3150 3600 4050TDS (mg/l)
SI
Calcite
Dolomite
Gypsum
Figure 4. Scatter plot of total dissolved solid (TDS) versus SI
y (Ca) = 15.813 e1.697 x
R2 = 0.994
y (SO4)= 21.451 e1.774 x
R2 = 0.987
0.0
2.5
5.0
7.5
10.0
12.5
15.0
17.5
20.0
22.5
25.0
-0.80 -0.65 -0.50 -0.35 -0.20 -0.05 0.10
SI (Gypsum)
Ion
conc
entr
atio
n (m
mol
/l)
Ca
SO4
Figure 7. Plot of SI (calcite) versus ion concentration
R2 (Ca)= 0.978
R2 (Mg)= 0.894
R2 (Na+K)= 0.772
0
100
200
300
400
500
600
700
800
900 1400 1900 2400 2900 3400 3900TDS (mg/l)
Cat
ion
conc
entr
atio
n (m
g/l)
Ca
Mg
Na+K
Figure 8. Plot of TDS versus cation concentration
R2
(SO4) = 0.996
R2
(HCO3)= 0.303
R2
(Cl)= 0.747
0
300
600
900
1200
1500
1800
2100
2400
900 1400 1900 2400 2900 3400 3900
TDS (mg/l)
Ani
on c
once
ntra
tion
(mg/
l)
HCO3
SO4
Cl
Figure 9. Plot of TDS versus anion concentration
KARST GROUNDWATER CHEMISTRY IN COAL FIELD
Copyright © 2012 John Wiley & Sons, Ltd. Hydrol. Process. (2012)DOI: 10.1002/hyp

became supersaturated and may have precipitated,decreasing HCO3
- concentrations along the flow path.
Ion exchange and source of Na+
If Ca2+, Mg2+, SO42-, and HCO3
- were solely derivedfrom the dissolution of carbonate (calcite or dolomite) andevaporate minerals (gypsum) and if Na+ and Cl- weresolely from the dissolution of halite, ratios of themilliequivalents of the ions, (Ca +Mg)/(SO4 +HCO3) orNa/Cl, would be a constant value of 1.0 ( Edmunds et al.,2002), regardless of the TDS and associated concentra-tions of the major ions (Figures 10, 11, and 12). ExcessNa+, indicated by points plotting above the line of
equality for Na versus Cl (Figure 11), and deficientCa +Mg, indicated by points plotting below the line ofequality for Ca +Mg versus SO4 +HCO3 (Figure 12), areconsistent with the release of Na+ and removal of Ca2+ orMg2+ by ion exchange reactions:
Ca2þ þ 2Na� EX ¼ 2Naþ þ Ca� EX (1)
In Figure 13, the points plotting in the lower rightquadrant of the diagram are consistent with ion exchange,whereas the points plotting in the upper left quadrant ofthe figure may indicate reverse ion exchange (Rajmohanand Elango, 2004; Ettazarini, 2005).Figure 10 shows that the mole ratio of Na/Cl was
mostly greater than 1, which indicates Na+ may haveincreased because of the dissolution of halite plus ionexchange or, possibly, dissolution of aluminosilicates,such as albite and sodium montmorillonite, which arepresent with silt in the erosion fissures of the middleOrdovician. Nevertheless, these aluminosilicates are notlikely to be substantial sources of Na+ because theirsolubility is very low, and their dissolution rates are veryslow at near-neutral pH conditions in the aquifer.
Gypsum, calcite, and dolomite are primary reactants
If Ca2+ and SO42- were derived solely from dissolution
of gypsum, the ratio of [Ca2+]/[SO42-] would be 1 : 1
(Figure 14). As shown in Figure 14, Ca2+ is positively
0.0
1.0
2.0
3.0
4.0
5.0
6.0
7.0
8.0
0.0 1.0 2.0 3.0 4.0 5.0 6.0 7.0 8.0 9.0Cl (mmol/l)
Na/
Cl
Figure 10. Plot of Cl (mmol/l) versus ratio of Na (mmol/l) and Cl (mmol/l)
0.0
1.5
3.0
4.5
6.0
7.5
9.0
10.5
0.0 1.5 3.0 4.5 6.0 7.5 9.0 10.5Cl (mmol/l)
Na
(mm
ol/l)
d = 1:1
Figure 11. Plot of Cl versus Na
0.0
10.0
20.0
30.0
40.0
50.0
60.0
10.0 18.0 26.0 34.0 42.0 50.0 58.0
SO4+HCO3 (meq/l)
Ca+
Mg
(meq
/l)
d = 1:1
Figure 12. Plot of SO4 +HCO3 and Ca +Mg
-7.5
-6.0
-4.5
-3.0
-1.5
0.0
1.5
3.0
4.5
-3.0 -1.5 0.0 1.5 3.0 4.5Na-Cl(meq/l)
Ca+
Mg-
SO4-
HC
O3(
meq
/l)
d = 1:1
Figure 13. Plot of Na-Cl and SO4 +HCO3-Ca-Mg
y = 0.709 x + 0.573
R2 = 0.970
5.0
7.5
10.0
12.5
15.0
17.5
20.0
22.5
25.0
5 8 10 13 15 18 20 23 25SO4 (mmol/l)
Ca
(mm
ol/l)
d = 1:1
Figure 14. Plot of SO4 and Ca
Y. HAN ET AL
Copyright © 2012 John Wiley & Sons, Ltd. Hydrol. Process. (2012)DOI: 10.1002/hyp

correlated with SO42-, but the ratio [Ca2+] : [SO4
2-] is0.7086. Presuming that gypsum dissolution takes place,ion exchange or calcite precipitation are consistent withthe observed [Ca2+] : [SO4
2-] being less than 1 : 1.Pyrite oxidation is not an important source of sulfate in
the Ordovician carbonate aquifer. Because the inrushingof groundwater to the deep coal mines results fromupward potential flow from the Ordovician carbonatestrata (the groundwater elevation within the Ordovicianaquifer varies between +15.3 and +27.7m) to the C-Pcoal-bearing strata (the highest groundwater elevationis �100.0m), the constituents in the limestone ground-water sampled for this study are presumed to haveoriginated within the upgradient limestone aquifer, not thedowngradient C-P aquifer. Nevertheless, sparse pyritenodules are present in the middle Ordovician stratum, andthe overall reactions involving the oxidation of pyrite (FeS2)and neutralization by calcite could yield [Ca2+] : [SO4
2-],ranging from 1 : 1 to 2 : 1:
FeS2 þ 2CaCO3� þ 3:5O2 þ H2O
¼ Fe2þ þ 2SO42� þ 2Ca2þ þ 2HCO3
�(2)
FeS2 þ 4CaCO3� þ 3:75O2 þ 3:5H2O
¼ Fe OHð Þ3 þ 2SO42� þ 4Ca2þ þ 4HCO3
�(3)
Although such neutralization reactions could account fornet-alkaline groundwater at coal mines (Cravotta et al.,1999), they are not believed to be important in the studyarea. First, the groundwater level within the Ordovicianaquifer is much higher than that of C-P coal-bearingaquifers, so the potential flow direction is upward at the sitessampled, and the pyrite in coal is not a possible source ofsulfate. Second, the ratio [Ca2+] : [SO4
2-] is only 0.7086(Figure 14), which is inconsistent with reactions 2 and 3.Third, the maximum Fe2+ and Fe3+ concentrations for thegroundwater samples were 1.0 and 0.9mg/l, respectively,which is consistent with only 6.53 mg/l of SO4
2- from FeS2,assuming Fe remains in solution (Equation 2); however,the observed concentration of SO4
2- ranges from 537 to2297 mg/l.If calcite is the sole source of Ca2+ and HCO3
- , the slopefor [Ca2+]/[HCO3
- ] would be 1 : 1 to 1 : 2:
CaCO3� þ Hþ ¼ Ca2þ þ HCO3
� (4)
CaCO3 þ H2O þ CO2 ¼ Ca2þ þ 2HCO3� (5)
Nevertheless, the concentration of Ca2+ does notincrease with that of HCO3
- (Figure 15), the concentrationof HCO3
- decreases as TDS increases (Figure 9), andSICalcite is greater than 0 (Figure 4), indicating that calcitedissolution is not a feasible source of Ca2+ along the flowpath. Likewise, SIDolomite is greater than 0 (Figure 4), andthe sum of Ca2+ and Mg2+ does not increase with HCO3
-
(Figure 16), which indicates that dolomite is not animportant source of the increased Ca2+ along the flowpath. However, dissolution of dolomite may take placeunder some conditions because calcite dissolves faster
than dolomite, and the groundwater may achieve saturationwith calcite while undersaturated with dolomite. Thus,dissolution of dolomite can be a source of Ca2+ and Mg2+
and can result in the precipitation of calcite, which can leadto further dissolution of dolomite as Ca2+, HCO3
- , and pHdecrease (reverse of reaction 4). If the mole ratio of([Ca] + [Mg]) : [HCO3] is 1 : 1 to 1 : 2 (Equations 4 and 5),the dissolution of carbonate minerals (calcite and dolomite,not distinguished) may account for the Ca2+ and Mg2+
(Bhardwaj et al., 2010). However, the ([Ca] + [Mg]) :[HCO3] ratio of most groundwater samples from theOrdovician limestone aquifer were greater than 2, whichindicates there are other likely sources of Ca2+ (Figure 17).Lastly, because the mole ratio of [Ca2+] : [Mg2+] in thegroundwater is substantially greater than 1 (Figure 18),dolomite dissolution is not indicated as an important sourceof Ca2+. As shown in former analysis, gypsum may be themain source of SO4
2-and explain the corresponding increasein the concentration of Ca2+ in downgradient directionacross the study area.
CONCLUSIONS
This study demonstrates that spatial variations in therelations among major ions can be employed to identifythe main water–rock interactions that lead to thegeochemical evolution of groundwater within an aquifer.In the study area, the chemical characterization of the
0.0
2.0
4.0
6.0
8.0
10.0
12.0
14.0
16.0
18.0
0.0 1.0 2.0 3.0 4.0 5.0 6.0HCO3 (mmol/l)
Ca
(mm
ol/l)
d = 1:2
Figure 15. Plot of HCO3 and Ca
0.0
4.0
8.0
12.0
16.0
20.0
24.0
28.0
0.0 1.0 2.0 3.0 4.0 5.0 6.0HCO3 (mmol/l)
Ca+
Mg
(mm
ol/l)
d = 1:2
Figure 16. Plot of HCO3 and Ca +Mg
KARST GROUNDWATER CHEMISTRY IN COAL FIELD
Copyright © 2012 John Wiley & Sons, Ltd. Hydrol. Process. (2012)DOI: 10.1002/hyp
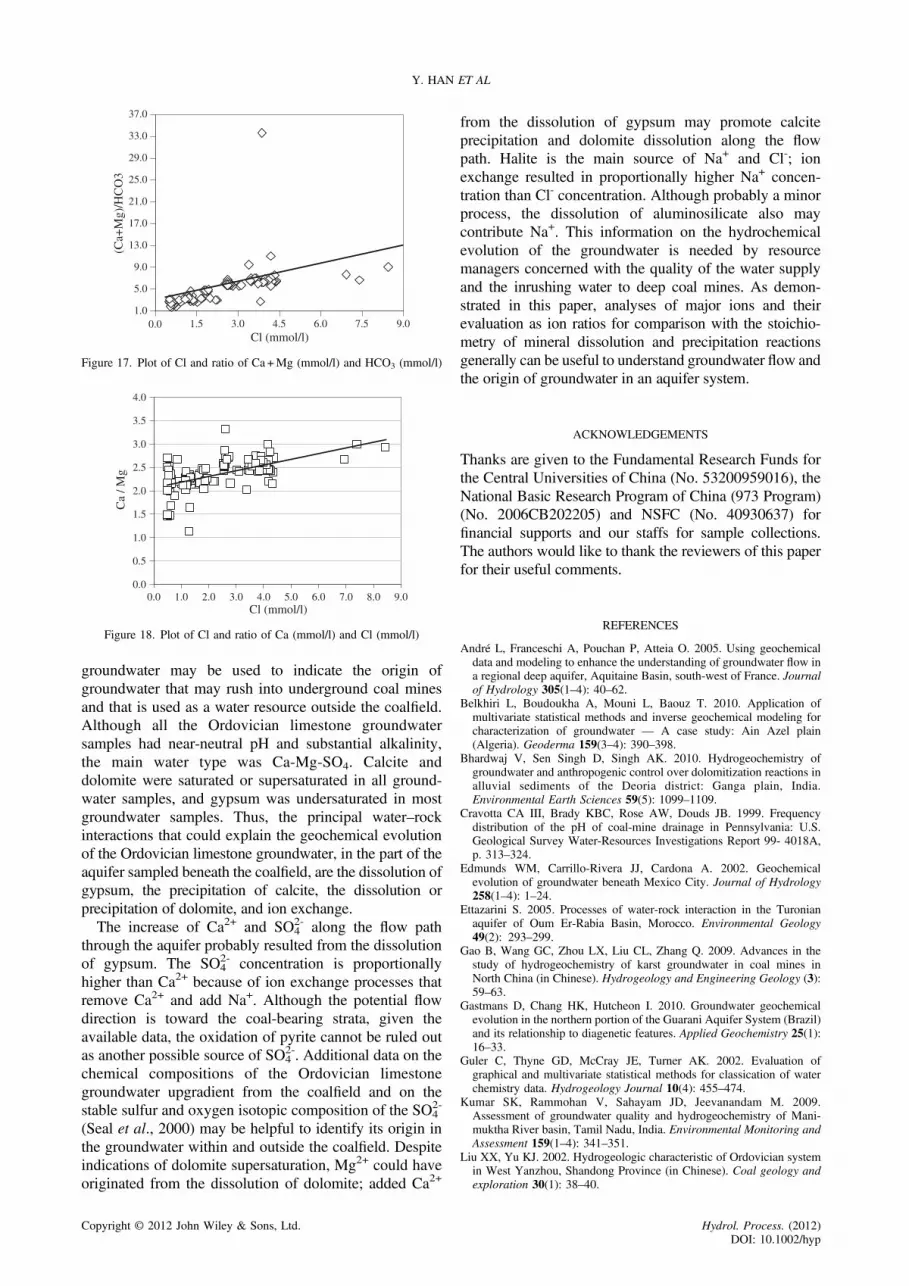
groundwater may be used to indicate the origin ofgroundwater that may rush into underground coal minesand that is used as a water resource outside the coalfield.Although all the Ordovician limestone groundwatersamples had near-neutral pH and substantial alkalinity,the main water type was Ca-Mg-SO4. Calcite anddolomite were saturated or supersaturated in all ground-water samples, and gypsum was undersaturated in mostgroundwater samples. Thus, the principal water–rockinteractions that could explain the geochemical evolutionof the Ordovician limestone groundwater, in the part of theaquifer sampled beneath the coalfield, are the dissolution ofgypsum, the precipitation of calcite, the dissolution orprecipitation of dolomite, and ion exchange.The increase of Ca2+ and SO4
2- along the flow paththrough the aquifer probably resulted from the dissolutionof gypsum. The SO4
2- concentration is proportionallyhigher than Ca2+ because of ion exchange processes thatremove Ca2+ and add Na+. Although the potential flowdirection is toward the coal-bearing strata, given theavailable data, the oxidation of pyrite cannot be ruled outas another possible source of SO4
2-. Additional data on thechemical compositions of the Ordovician limestonegroundwater upgradient from the coalfield and on thestable sulfur and oxygen isotopic composition of the SO4
2-
(Seal et al., 2000) may be helpful to identify its origin inthe groundwater within and outside the coalfield. Despiteindications of dolomite supersaturation, Mg2+ could haveoriginated from the dissolution of dolomite; added Ca2+
from the dissolution of gypsum may promote calciteprecipitation and dolomite dissolution along the flowpath. Halite is the main source of Na+ and Cl-; ionexchange resulted in proportionally higher Na+ concen-tration than Cl- concentration. Although probably a minorprocess, the dissolution of aluminosilicate also maycontribute Na+. This information on the hydrochemicalevolution of the groundwater is needed by resourcemanagers concerned with the quality of the water supplyand the inrushing water to deep coal mines. As demon-strated in this paper, analyses of major ions and theirevaluation as ion ratios for comparison with the stoichio-metry of mineral dissolution and precipitation reactionsgenerally can be useful to understand groundwater flow andthe origin of groundwater in an aquifer system.
ACKNOWLEDGEMENTS
Thanks are given to the Fundamental Research Funds forthe Central Universities of China (No. 53200959016), theNational Basic Research Program of China (973 Program)(No. 2006CB202205) and NSFC (No. 40930637) forfinancial supports and our staffs for sample collections.The authors would like to thank the reviewers of this paperfor their useful comments.
REFERENCES
André L, Franceschi A, Pouchan P, Atteia O. 2005. Using geochemicaldata and modeling to enhance the understanding of groundwater flow ina regional deep aquifer, Aquitaine Basin, south-west of France. Journalof Hydrology 305(1–4): 40–62.
Belkhiri L, Boudoukha A, Mouni L, Baouz T. 2010. Application ofmultivariate statistical methods and inverse geochemical modeling forcharacterization of groundwater — A case study: Ain Azel plain(Algeria). Geoderma 159(3–4): 390–398.
Bhardwaj V, Sen Singh D, Singh AK. 2010. Hydrogeochemistry ofgroundwater and anthropogenic control over dolomitization reactions inalluvial sediments of the Deoria district: Ganga plain, India.Environmental Earth Sciences 59(5): 1099–1109.
Cravotta CA III, Brady KBC, Rose AW, Douds JB. 1999. Frequencydistribution of the pH of coal-mine drainage in Pennsylvania: U.S.Geological Survey Water-Resources Investigations Report 99- 4018A,p. 313–324.
Edmunds WM, Carrillo-Rivera JJ, Cardona A. 2002. Geochemicalevolution of groundwater beneath Mexico City. Journal of Hydrology258(1–4): 1–24.
Ettazarini S. 2005. Processes of water-rock interaction in the Turonianaquifer of Oum Er-Rabia Basin, Morocco. Environmental Geology49(2): 293–299.
Gao B, Wang GC, Zhou LX, Liu CL, Zhang Q. 2009. Advances in thestudy of hydrogeochemistry of karst groundwater in coal mines inNorth China (in Chinese). Hydrogeology and Engineering Geology (3):59–63.
Gastmans D, Chang HK, Hutcheon I. 2010. Groundwater geochemicalevolution in the northern portion of the Guarani Aquifer System (Brazil)and its relationship to diagenetic features. Applied Geochemistry 25(1):16–33.
Guler C, Thyne GD, McCray JE, Turner AK. 2002. Evaluation ofgraphical and multivariate statistical methods for classication of waterchemistry data. Hydrogeology Journal 10(4): 455–474.
Kumar SK, Rammohan V, Sahayam JD, Jeevanandam M. 2009.Assessment of groundwater quality and hydrogeochemistry of Mani-muktha River basin, Tamil Nadu, India. Environmental Monitoring andAssessment 159(1–4): 341–351.
Liu XX, Yu KJ. 2002. Hydrogeologic characteristic of Ordovician systemin West Yanzhou, Shandong Province (in Chinese). Coal geology andexploration 30(1): 38–40.
0.0
0.5
1.0
1.5
2.0
2.5
3.0
3.5
4.0
0.0 1.0 2.0 3.0 4.0 5.0 6.0 7.0 8.0 9.0Cl (mmol/l)
Ca
/ Mg
Figure 18. Plot of Cl and ratio of Ca (mmol/l) and Cl (mmol/l)
1.0
5.0
9.0
13.0
17.0
21.0
25.0
29.0
33.0
37.0
0.0 1.5 3.0 4.5 6.0 7.5 9.0Cl (mmol/l)
(Ca+
Mg)
/HC
O3
Figure 17. Plot of Cl and ratio of Ca +Mg (mmol/l) and HCO3 (mmol/l)
Y. HAN ET AL
Copyright © 2012 John Wiley & Sons, Ltd. Hydrol. Process. (2012)DOI: 10.1002/hyp
Moral F, Cruz-Sanjulian JJ, Olias M. 2008. Geochemical evolution ofgroundwater in the carbonate aquifers of Sierra de Segura (BeticCordillera, southern Spain). Journal of Hydrology 360(1–4): 281–296.
Parkhurst DL, Appelo CAJ. 1999. User’s guide to PHREEQC (Version 2)—A computer program for speciation, batch-reaction, one-dimensionaltransport, and inverse geochemical calculations: U.S. Geological SurveyWater-Resources Investigations Report 99–4259, pp. 3–4.
Plummer LN, Laura MB, Anderholm SK. 2002. How ground-waterchemistry helps us understand the aquifer. In: Ground-water resourcesof the Middle Rio Grande Basin, Bartolino JR, Cole JC (eds). U.S.Geological Survey Circular 1222, pp. 92–94.
Rajmohan N, Elango L. 2004. Identification and evolution of hydro-geochemical processes in the groundwater environment in an area of thePalar and Cheyyar River Basins, Southern India. EnvironmentalGeology 46(1): 47–61.
Seal RR, Alpers CN, Rye RO. 2000. Stable isotope systematics of sulfateminerals. Reviews in Mineralogy and Geochemistry 40: 541–602.
Stotler RL, Frape SK, Ruskeeniemi T, Ahonen L, Onstott TC, Hobbs MY.2009. Hydrogeochemistry of groundwaters in and below the base of
thick permafrost at Lupin, Nunavut, Canada. Journal of Hydrology373(1–2): 80–95.
Wang GC, Zhang ZC, Wang M, Cravotta CA, Liu CL. 2005. Implicationsof Ground Water Chemistry and Flow Patterns for Earthquake Studies.Ground Water 43(4): 478–484.
Wang YX, Guo QH, Su CL, Ma T. 2006. Strontium isotopecharacterization and major ion geochemistry of karst water flow,Shentou, northern China. Journal of Hydrology 328(3–4): 592–603.
Wen XH, Wu YQ, Wu J. 2008. Hydrochemical characteristics ofgroundwater in the Zhangye Basin, Northwestern China. EnvironmentalGeology 55(8): 1713–1724.
Wu Q, Wang MY. 2006. Characterization of water bursting anddischarge into underground mines with multilayered groundwater flowsystems in the North China coal basin. Hydrogeology Journal 14(6):882–893.
Xi’an Branch of China Coal Research Institute. 2007. Report of thehydrogeological exploration of lower group coal in Xinglongcoalmine of Yanzhou Coal Mining Incorporated Company (inChinese).
KARST GROUNDWATER CHEMISTRY IN COAL FIELD
Copyright © 2012 John Wiley & Sons, Ltd. Hydrol. Process. (2012)DOI: 10.1002/hyp