limestone & other calcareous materials-260916.pmd - indian
TRANSCRIPT
LIMESTONE AND OTHER CALCAREOUS MATERIALS
32-1
Indian Minerals Yearbook 2015 (Part- III : Mineral Reviews)
54th
Edition
LIMESTONE & OTHER CALCAREOUS MINERALS
(ADVANCE RELEASE)
GOVERNMENT OF INDIA MINISTRY OF MINES
INDIAN BUREAU OF MINES
Indira Bhavan, Civil Lines, NAGPUR – 440 001
PHONE/FAX NO. (0712) 2565471
PBX : (0712) 2562649, 2560544, 2560648
E-MAIL : [email protected] Website: www.ibm.gov.in
March, 2017
LIMESTONE AND OTHER CALCAREOUS MATERIALS
32-2
32Limestone & Other Calcareous Materials
The term limestone is applied to any calcareous
sedimentary rock consisting essentially of
carbonates. The two most important constituents
are calcite and dolomite. Limestone often contains
magnes ium carbona te , e i ther as do lomi te
CaMg (CO3)
2 or magnesite (MgCO
3) mixed with
calcite. Such rocks are termed as'dolomitic' or
'magnesian' limestone. Limestones altered by
dynamic or contact metamorphism become
coarsely crystalline and are referred to as 'marbles'
and 'crystalline limestones' . Other common
varieties of limestones are 'marl', 'oolite' (oolitic
limestone), shelly limestone, algal limestone, coral
limestone, pisolitic limestone, crinoidal limestone,
travert ine, onyx, hydraulic l imestone, l i tho
graphic limestone, etc. However, the limestone
which is used by industries in bulk quantity is a
bedded type sedimentary limestone.
Other calcareous material used by industry are
'chalk', a white, extremely fine-grained, usually soft
and friable variety of limestone, composed largely
of microscopic small remains of foraminifera and
broken shelly fragments; 'kankar', irregular nodules
and concretions of impure calcium carbonate of
all sizes found in the older surface alluvium or
soils; and 'limeshell', the thick calcareous shells
of molluscs deposited in the form of beds as well
as present in ancient lakes and shallow seas.
A limestone rock which separates well along
the stratification into a few centimetres thick
slab is termed 'flagstone' . The dimensional
limestone used for building and ornamental
stone purposes is discussed in the Reviews
on 'Marble ' and 'S la te , Sandstone & Other
Dimension Stones'.
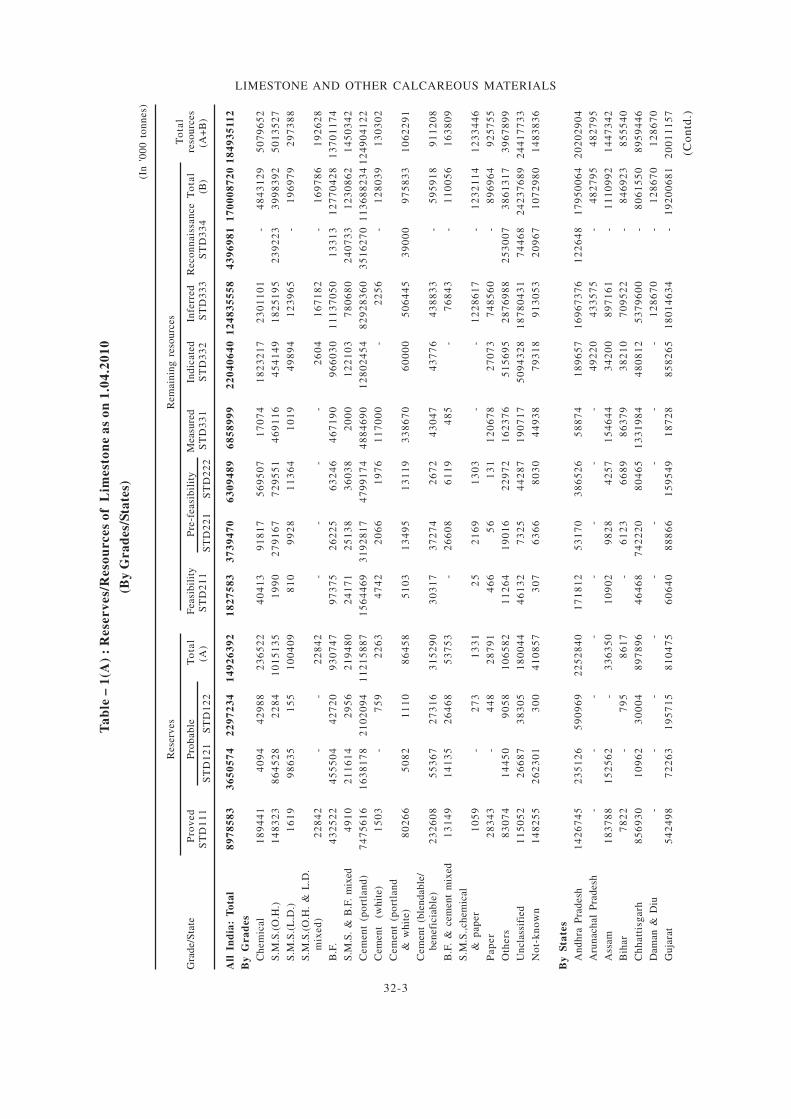
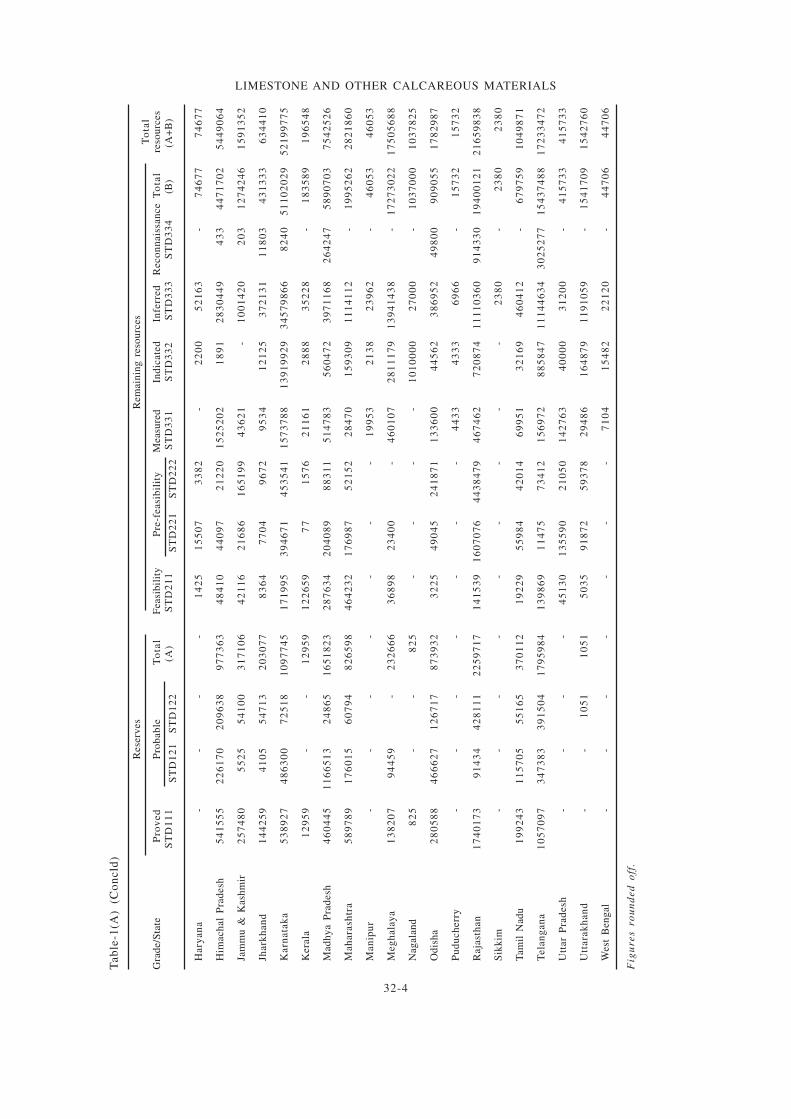
RESOURCESThe to ta l resources o f l imes tone of
all categories and grades as per UNFC system as
on 1.4.2010 are estimated at 184,935 million
tonnes, of which 14,926 million tonnes (8%) are
placed under reserves category and 170,009
million tonnes (92%) are under remaining resources
category. Karnataka is the leading state having
28% of the to ta l resources fo l lowed by
Andhra Pradesh,Gujarat and Rajasthan (11%
each) , Te langana (9%) ,Chha t t i sgarh (5%) ,
Madhya Pradesh (4%) and remaining 21% by other
states. Gradewise, cement grade (Portland) has
lead ing share o f about 68% fo l lowed by
Unclassified grades (13%) and BF grade (7%).
Remaining (16%) are others. (Table-1(A).
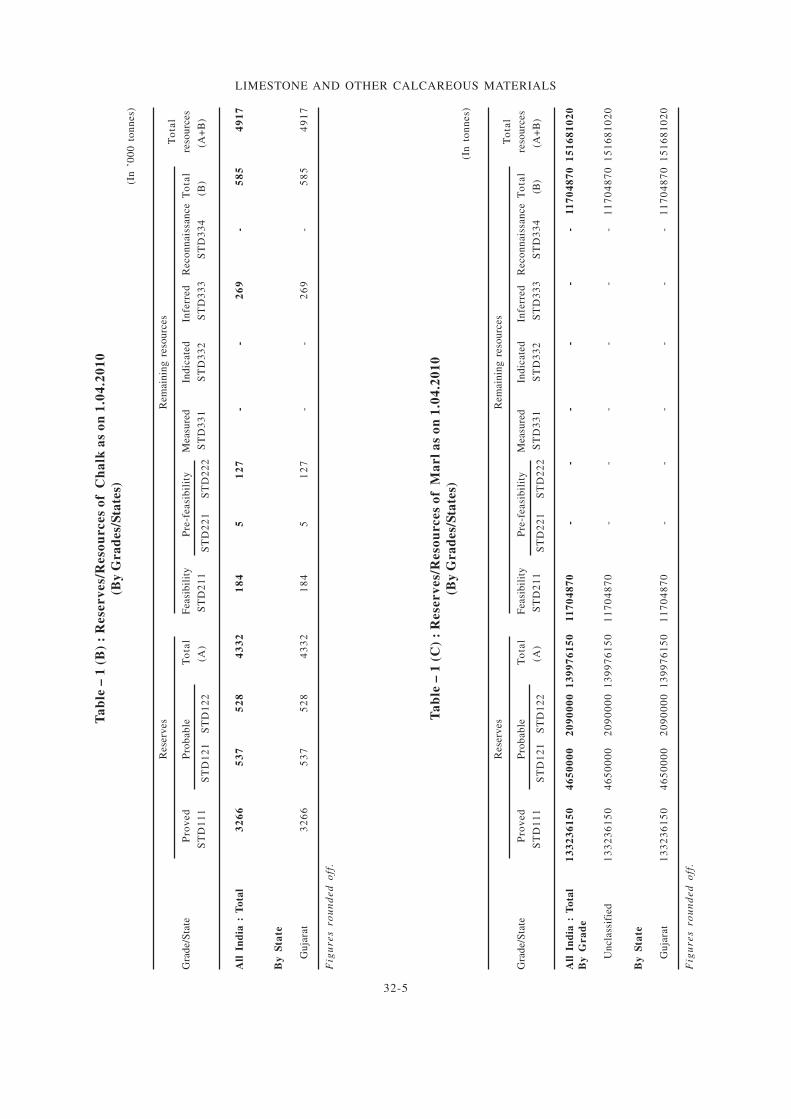
The total resources of chalk of all cate-
gories and grades as per UNFC system as on
1.4.2010 are estimated in Gujarat at 4.92 million
tonnes of which 4.33 mil l ion tonnes (88%)
are under reserves category and 0.59 million
tonnes (12%) are under remaining resources
category (Table-1(B).
The total resources of marl of all categories
and grades as per UNFC system as on 1.4.2010
are estimated in Gujarat State only at 151.68 million
tonnes of which 139.98 million tonnes (92%) are
under reserves category and 11.70 million tonnes
(8%) are under remaining resources category
(Table - 1 (C).
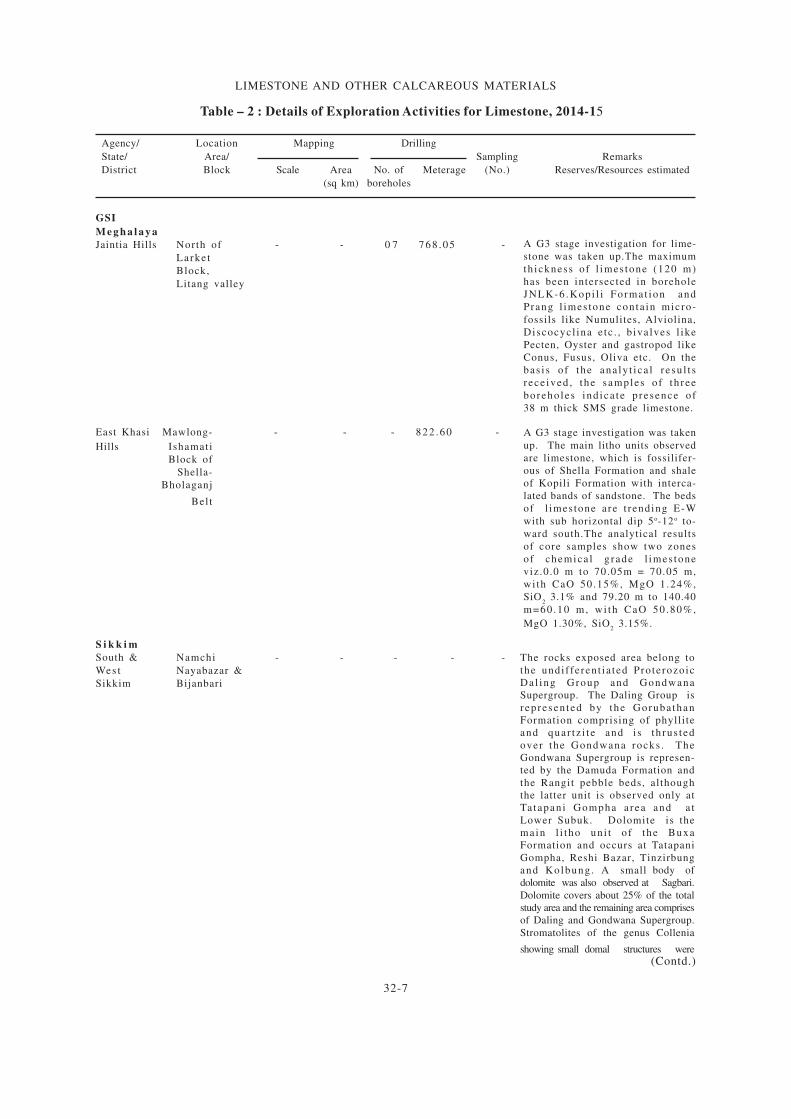
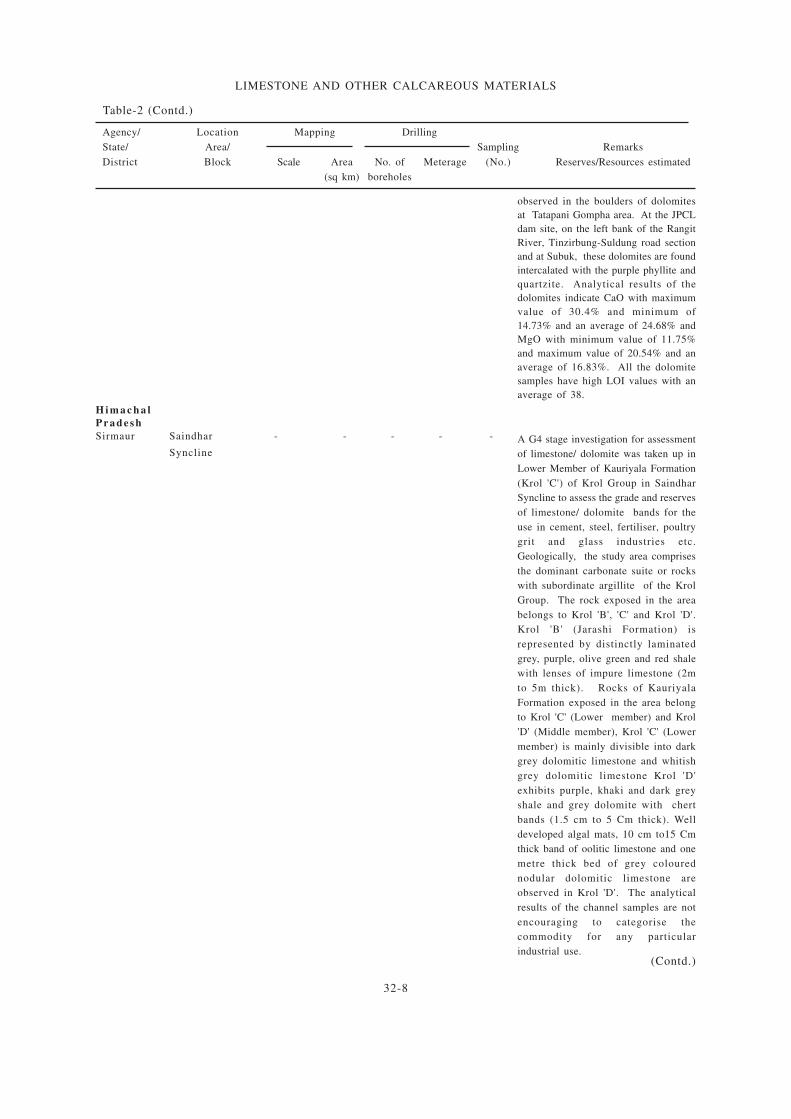
EXPLORATION & DEVELOPMENTExploration was carried out by GSI in the state
of Sikkim, Himachal Pradesh, Meghalaya and
Rajasthan. Directorates of Mining and Geology
of Chhatt isgarh and Rajasthan and Mineral
Exploration Corporation Limited in the state of
Naga land a l so ca r r ied ou t exp lora t ion for
limestone. Details of work carried out are
furnished in Table-2.
LIMESTONE AND OTHER CALCAREOUS MATERIALS
32-3
Ta
ble
– 1
(A)
: R
ese
rv
es/
Reso
urces
of
Lim
est
on
e a
s o
n 1
.04
.20
10
(By
Gra
des/
Sta
tes)
(In
'0
00
to
nn
es)
Rese
rves
Rem
ain
ing
reso
urc
es
To
tal
Gra
de/S
tate
Pro
ved
Pro
bab
leT
ota
lF
easi
bil
ity
Pre
-feasi
bil
ity
Measu
red
Ind
icate
dIn
ferr
ed
Reco
nn
ais
san
ce
To
tal
reso
urc
es
ST
D1
11
ST
D1
21
ST
D1
22
(A)
ST
D2
11
ST
D2
21
ST
D2
22
ST
D3
31
ST
D3
32
ST
D3
33
ST
D3
34
(B
)(A
+B
)
All
In
dia
: T
ota
l8
97
85
83
36
50
57
42
29
72
34
14
92
63
92
18
27
58
33
73
94
70
63
09
48
96
85
89
99
22
04
06
40
12
48
35
55
84
39
69
81
17
00
08
72
01
84
93
511
2
By
Gra
des
Ch
em
ical
18
94
41
40
94
42
98
82
36
52
24
04
13
91
81
75
69
50
71
70
74
18
23
21
72
30
11
01
-4
84
31
29
50
79
65
2
S.M
.S.(
O.H
.)1
48
32
38
64
52
82
28
41
01
51
35
19
90
27
91
67
72
95
51
46
91
16
45
41
49
18
25
19
52
39
22
33
99
83
92
50
13
52
7
S.M
.S.(
L.D
.)1
61
99
86
35
15
51
00
40
98
10
99
28
11
36
41
01
94
98
94
12
39
65
-1
96
97
92
97
38
8
S.M
.S.(
O.H
. &
L.D
.
mix
ed
)2
28
42
--
22
84
2-
--
-2
60
41
67
18
2-
16
97
86
19
26
28
B.F
.4
32
52
24
55
50
44
27
20
93
07
47
97
37
52
62
25
63
24
64
67
19
09
66
03
01
11
37
05
01
33
13
12
77
04
28
13
70
11
74
S.M
.S.
& B
.F.
mix
ed4
91
02
11
61
42
95
62
19
48
02
41
71
25
13
83
60
38
20
00
12
21
03
78
06
80
24
07
33
12
30
86
21
45
03
42
Cem
en
t (p
ort
lan
d)
74
75
61
61
63
81
78
21
02
09
41
12
15
88
71
56
44
69
31
92
81
74
79
91
74
48
84
69
01
28
02
45
48
29
28
36
03
51
62
70
11
36
88
23
41
24
90
41
22
Cem
en
t (
wh
ite)
15
03
-7
59
22
63
47
42
20
66
19
76
11
70
00
-2
25
6-
12
80
39
13
03
02
Cem
en
t (p
ort
lan
d
& w
hit
e)
80
26
65
08
21
11
08
64
58
51
03
13
49
51
31
19
33
86
70
60
00
05
06
44
53
90
00
97
58
33
10
62
29
1
Cem
en
t (b
len
dab
le/
ben
efi
cia
ble
)2
32
60
85
53
67
27
31
63
15
29
03
03
17
37
27
42
67
24
30
47
43
77
64
38
83
3-
59
59
18
91
12
08
B.F
. &
cem
en
t m
ixed
13
14
91
41
35
26
46
85
37
53
-2
66
08
61
19
48
5-
76
84
3-
11
00
56
16
38
09
S.M
.S.,
ch
em
ical
& p
ap
er
10
59
-2
73
13
31
25
21
69
13
03
--
12
28
61
7-
12
32
11
41
23
34
46
Pa
pe
r2
83
43
-4
48
28
79
14
66
56
13
11
20
67
82
70
73
74
85
60
-8
96
96
49
25
75
5
Oth
ers
83
07
41
44
50
90
58
10
65
82
11
26
41
90
16
22
97
21
62
37
65
15
69
52
87
69
88
25
30
07
38
61
31
73
96
78
99
Un
cla
ssif
ied
11
50
52
26
68
73
83
05
18
00
44
46
13
27
32
54
42
87
19
07
17
50
94
32
81
87
80
43
17
44
68
24
23
76
89
24
41
77
33
No
t-k
no
wn
14
82
55
26
23
01
30
04
10
85
73
07
63
66
80
30
44
93
87
93
18
91
30
53
20
96
71
07
29
80
14
83
83
6
By
Sta
tes
An
dh
ra P
rad
esh
14
26
74
52
35
12
65
90
96
92
25
28
40
17
18
12
53
17
03
86
52
65
88
74
18
96
57
16
96
73
76
12
26
48
17
95
00
64
20
20
29
04
Aru
nach
al
Pra
desh
--
--
--
--
49
22
04
33
57
5-
48
27
95
48
27
95
Ass
am
18
37
88
15
25
62
-3
36
35
01
09
02
98
28
42
57
15
46
44
34
20
08
97
16
1-
11
10
99
21
44
73
42
Bih
ar
78
22
-7
95
86
17
-6
12
36
68
98
63
79
38
21
07
09
52
2-
84
69
23
85
55
40
Ch
hatt
isg
arh
85
69
30
10
96
23
00
04
89
78
96
46
46
87
42
22
08
04
65
13
31
98
44
80
81
25
37
96
00
-8
06
15
50
89
59
44
6
Dam
an &
Diu
--
--
--
--
-1
28
67
0-
12
86
70
12
86
70
Gu
jara
t5
42
49
87
22
63
19
57
15
81
04
75
60
64
08
88
66
15
95
49
18
72
88
58
26
51
80
14
63
4-
19
20
06
81
20
01
11
57
(Co
ntd
.)
LIMESTONE AND OTHER CALCAREOUS MATERIALS
32-4
Rese
rves
Rem
ain
ing
reso
urc
es
To
tal
Gra
de/S
tate
Pro
ved
Pro
bab
leT
ota
lF
easi
bil
ity
Pre
-feasi
bil
ity
Measu
red
Ind
icate
dIn
ferr
ed
Reco
nn
ais
san
ce
To
tal
reso
urc
es
ST
D1
11
ST
D1
21
ST
D1
22
(A)
ST
D2
11
ST
D2
21
ST
D2
22
ST
D3
31
ST
D3
32
ST
D3
33
ST
D3
34
(B
)(A
+B
)
Hary
an
a-
--
-1
42
51
55
07
33
82
-2
20
05
21
63
-7
46
77
74
67
7
Him
ach
al
Pra
desh
54
15
55
22
61
70
20
96
38
97
73
63
48
41
04
40
97
21
22
01
52
52
02
18
91
28
30
44
94
33
44
71
70
25
44
90
64
Jam
mu
& K
ash
mir
25
74
80
55
25
54
10
03
17
10
64
21
16
21
68
61
65
19
94
36
21
-1
00
14
20
20
31
27
42
46
15
91
35
2
Jhark
han
d1
44
25
94
10
55
47
13
20
30
77
83
64
77
04
96
72
95
34
12
12
53
72
13
11
18
03
43
13
33
63
44
10
Karn
ata
ka
53
89
27
48
63
00
72
51
81
09
77
45
17
19
95
39
46
71
45
35
41
15
73
78
81
39
19
92
93
45
79
86
68
24
05
11
02
02
95
21
99
77
5
Kera
la1
29
59
--
12
95
91
22
65
97
71
57
62
11
61
28
88
35
22
8-
18
35
89
19
65
48
Mad
hy
a P
rad
esh
46
04
45
11
66
51
32
48
65
16
51
82
32
87
63
42
04
08
98
83
11
51
47
83
56
04
72
39
71
16
82
64
24
75
89
07
03
75
42
52
6
Mah
ara
shtr
a5
89
78
91
76
01
56
07
94
82
65
98
46
42
32
17
69
87
52
15
22
84
70
15
93
09
11
14
11
2-
19
95
26
22
82
18
60
Man
ipu
r-
--
--
--
19
95
32
13
82
39
62
-4
60
53
46
05
3
Meg
hala
ya
13
82
07
94
45
9-
23
26
66
36
89
82
34
00
-4
60
10
72
81
11
79
13
94
14
38
-1
72
73
02
21
75
05
68
8
Nag
ala
nd
82
5-
-8
25
--
--
10
10
00
02
70
00
-1
03
70
00
10
37
82
5
Od
ish
a2
80
58
84
66
62
71
26
71
78
73
93
23
22
54
90
45
24
18
71
13
36
00
44
56
23
86
95
24
98
00
90
90
55
17
82
98
7
Pu
du
ch
err
y-
--
--
--
44
33
43
33
69
66
-1
57
32
15
73
2
Raja
sth
an
17
40
17
39
14
34
42
81
11
22
59
71
71
41
53
91
60
70
76
44
38
47
94
67
46
27
20
87
41
11
10
36
09
14
33
01
94
00
12
12
16
59
83
8
Sik
kim
--
--
--
--
-2
38
0-
23
80
23
80
Tam
il N
ad
u1
99
24
31
15
70
55
51
65
37
01
12
19
22
95
59
84
42
01
46
99
51
32
16
94
60
41
2-
67
97
59
10
49
87
1
Tela
ng
an
a1
05
70
97
34
73
83
39
15
04
17
95
98
41
39
86
91
14
75
73
41
21
56
97
28
85
84
71
11
44
63
43
02
52
77
15
43
74
88
17
23
34
72
Utt
ar
Pra
desh
--
--
45
13
01
35
59
02
10
50
14
27
63
40
00
03
12
00
-4
15
73
34
15
73
3
Utt
ara
kh
an
d-
-1
05
11
05
15
03
59
18
72
59
37
82
94
86
16
48
79
11
91
05
9-
15
41
70
91
54
27
60
West
Ben
gal
--
--
--
-7
10
41
54
82
22
12
0-
44
70
64
47
06
Fig
ure
s ro
un
de
d o
ff.
Tab
le-1
(A)
(C
on
cld
)
LIMESTONE AND OTHER CALCAREOUS MATERIALS
32-5
Ta
ble
– 1
(B
) :
Rese
rv
es/
Reso
urces
of
Ch
alk
as
on
1.0
4.2
01
0
(By
Gra
des/
Sta
tes)
(In
’0
00
to
nn
es)
Rese
rves
Rem
ain
ing
reso
urc
es
To
tal
Gra
de/S
tate
Pro
ved
Pro
bab
leT
ota
lF
easi
bil
ity
Pre
-feasi
bil
ity
Measu
red
Ind
icate
dIn
ferr
ed
Reco
nn
ais
san
ce
To
tal
reso
urc
es
ST
D1
11
ST
D1
21
ST
D1
22
(A)
ST
D2
11
ST
D2
21
ST
D2
22
ST
D3
31
ST
D3
32
ST
D3
33
ST
D3
34
(B)
(A+
B)
All
In
dia
: T
ota
l3
26
65
37
52
84
33
21
84
51
27
--
26
9-
58
54
91
7
By
Sta
te
Gu
jara
t3
26
65
37
52
84
33
21
84
51
27
--
26
9-
58
54
91
7
Fig
ure
s ro
un
de
d o
ff.
Ta
ble
– 1
(C
) :
Rese
rv
es/
Reso
urces
of
Ma
rl
as
on
1.0
4.2
01
0
(By
Gra
des/
Sta
tes)
(In
to
nn
es)
Rese
rves
Rem
ain
ing
reso
urc
es
To
tal
Gra
de/S
tate
Pro
ved
Pro
bab
leT
ota
lF
easi
bil
ity
Pre
-feasi
bil
ity
Measu
red
Ind
icate
dIn
ferr
ed
Reco
nn
ais
san
ce
To
tal
reso
urc
es
ST
D1
11
ST
D1
21
ST
D1
22
(A)
ST
D2
11
ST
D2
21
ST
D2
22
ST
D3
31
ST
D3
32
ST
D3
33
ST
D3
34
(B
)(A
+B
)
All
In
dia
: T
ota
l1
33
23
61
50
46
50
00
02
09
00
00
13
99
76
15
01
17
04
87
0-
--
--
-1
17
04
87
01
51
68
10
20
By
Gra
de
Un
cla
ssif
ied
13
32
36
15
04
65
00
00
20
90
00
01
39
97
61
50
11
70
48
70
--
--
--
11
70
48
70
15
16
81
02
0
By
Sta
te
Gu
jara
t1
33
23
61
50
46
50
00
02
09
00
00
13
99
76
15
01
17
04
87
0-
--
--
-1
17
04
87
01
51
68
10
20
Fig
ure
s ro
un
de
d o
ff.
LIMESTONE AND OTHER CALCAREOUS MATERIALS
32-6
Ta
ble
– 1
(D
) :
Rese
rv
es/
Reso
urces
of
Sh
ale
as
on
1.0
4.2
01
0
(By
Gra
des/
Sta
tes)
(In
'0
00
to
nn
es)
Rese
rves
Rem
ain
ing
reso
urc
es
To
tal
G
rade/
Sta
teP
rov
ed
Pro
bab
leT
ota
lF
easi
bil
ity
Pre
-feasi
bil
ity
Measu
red
Ind
icate
dIn
ferr
ed
Reco
nn
ais
san
ce
To
tal
reso
urc
es
ST
D1
11
ST
D1
21
ST
D1
22
(A)
ST
D2
11
ST
D2
21
ST
D2
22
ST
D3
31
ST
D3
32
ST
D3
33
ST
D3
34
(B
)(A
+B
)
All
In
dia
: T
ota
l1
49
92
76
26
31
53
31
--
24
5-
02
52
83
58
01
59
11
By
Gra
de
Un
cla
ssif
ied
14
99
27
62
63
15
33
1-
-2
45
-0
25
28
35
80
15
91
1
By
Sta
te
An
dh
ra P
rad
esh
52
1-
-5
21
--
24
5-
02
52
83
58
01
10
1
Tel
ang
ana
14
81
0-
-1
48
10
--
--
00
00
14
81
0
Fig
ure
s ro
un
de
d o
ff.
LIMESTONE AND OTHER CALCAREOUS MATERIALS
32-7
(Contd.)
Table – 2 : Details of Exploration Activities for Limestone, 2014-15
Agency/ Location Mapping Drilling
State/ Area/ Sampling Remarks
District Block Scale Area No. of Meterage (No.) Reserves/Resources estimated
(sq km) boreholes
GSI
M e g h a l a y a
Jaintia Hills North of - - 0 7 768 .05 -
Larke t
Block,
Litang valley
A G3 stage investigation for lime-
stone was taken up.The maximum
thickness o f l imes tone (120 m)
has been intersected in borehole
JNLK-6 .Kopi l i Format ion and
Prang l imes tone conta in micro-
fossils like Numulites, Alviolina,
Discocycl ina e tc . , b iva lves l ike
Pecten, Oyster and gastropod like
Conus, Fusus, Oliva etc. On the
bas i s o f the ana ly t i ca l r e su l t s
rece ived , the samples o f th ree
boreho les ind ica te p resence o f
38 m thick SMS grade limestone.
A G3 stage investigation was taken
up. The main litho units observed
are limestone, which is fossilifer-
ous of Shella Formation and shale
of Kopili Formation with interca-
lated bands of sandstone. The beds
of l imes tone are t rending E-W
with sub horizontal dip 5o-12o to-
ward south.The analytical results
of core samples show two zones
of chemica l g rade l imes tone
viz.0.0 m to 70.05m = 70.05 m,
wi th CaO 50.15%, MgO 1.24%,
SiO2 3.1% and 79.20 m to 140.40
m=60 .10 m, wi th CaO 50 .80%,
MgO 1.30%, SiO2 3.15%.
S i k k i m
South & Namchi - - - - -
Wes t Nayabazar &
Sikkim Bijanbari
The rocks exposed area belong to
the undi f fe ren t ia ted Pro terozoic
Da l ing Group and Gondwana
Supergroup. The Daling Group is
r ep resen ted by the Goruba than
Formation comprising of phyllite
and quar tz i t e and i s th rus ted
over the Gondwana rocks . The
Gondwana Supergroup is represen-
ted by the Damuda Formation and
the Rangit pebble beds, although
the latter unit is observed only at
Ta tapan i Gompha a rea and a t
Lower Subuk. Dolomite is the
main l i tho un i t o f the Buxa
Formation and occurs at Tatapani
Gompha, Reshi Bazar, Tinzirbung
and Kolbung . A small body of
dolomite was also observed at Sagbari.
Dolomite covers about 25% of the total
study area and the remaining area comprises
of Daling and Gondwana Supergroup.
Stromatolites of the genus Collenia
showing small domal structures were
East Khasi Mawlong- - - - 822 .60 -
Hills Ishamati
Block of
Shella-
Bholaganj
Bel t
LIMESTONE AND OTHER CALCAREOUS MATERIALS
32-8
Table-2 (Contd.)
Agency/ Location Mapping Drilling
State/ Area/ Sampling Remarks
District Block Scale Area No. of Meterage (No.) Reserves/Resources estimated
(sq km) boreholes
(Contd.)
observed in the boulders of dolomites
at Tatapani Gompha area. At the JPCL
dam site, on the left bank of the Rangit
River, Tinzirbung-Suldung road section
and at Subuk, these dolomites are found
intercalated with the purple phyllite and
quartzite. Analytical results of the
dolomites indicate CaO with maximum
value of 30.4% and minimum of
14.73% and an average of 24.68% and
MgO with minimum value of 11.75%
and maximum value of 20.54% and an
average of 16.83%. All the dolomite
samples have high LOI values with an
average of 38.
H i m a c h a l
P r a d e s h
Sirmaur Saindhar - - - - -
Syncline
A G4 stage investigation for assessment
of limestone/ dolomite was taken up in
Lower Member of Kauriyala Formation
(Krol 'C') of Krol Group in Saindhar
Syncline to assess the grade and reserves
of limestone/ dolomite bands for the
use in cement, steel, fertiliser, poultry
grit and glass industries etc.
Geologically, the study area comprises
the dominant carbonate suite or rocks
with subordinate argillite of the Krol
Group. The rock exposed in the area
belongs to Krol 'B', 'C' and Krol 'D'.
Krol 'B' (Jarashi Formation) is
represented by distinctly laminated
grey, purple, olive green and red shale
with lenses of impure limestone (2m
to 5m thick). Rocks of Kauriyala
Formation exposed in the area belong
to Krol 'C' (Lower member) and Krol
'D' (Middle member), Krol 'C' (Lower
member) is mainly divisible into dark
grey dolomitic limestone and whitish
grey dolomitic limestone Krol 'D'
exhibits purple, khaki and dark grey
shale and grey dolomite with chert
bands (1.5 cm to 5 Cm thick). Well
developed algal mats, 10 cm to15 Cm
thick band of oolitic limestone and one
metre thick bed of grey coloured
nodular dolomitic limestone are
observed in Krol 'D'. The analytical
results of the channel samples are not
encouraging to categorise the
commodity for any particular
industrial use.
LIMESTONE AND OTHER CALCAREOUS MATERIALS
32-9
Table-2 (Contd.)
Agency/ Location Mapping Drilling
State/ Area/ Sampling Remarks
District Block Scale Area No. of Meterage (No.) Reserves/Resources estimated
(sq km) boreholes
(Contd.)
Rajasthan
Bandah area
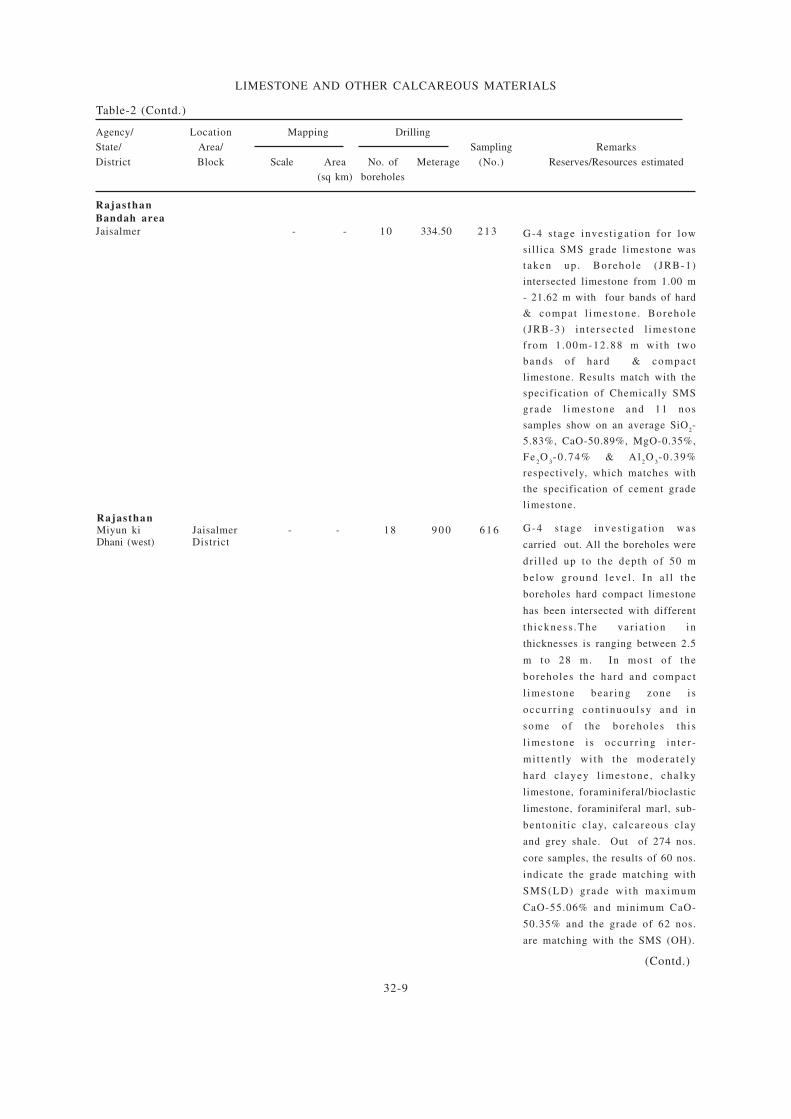
Jaisalmer - - 10 334.50 2 1 3 G-4 s tage inves t iga t ion for low
sill ica SMS grade l imestone was
taken up . Boreho le ( JRB-1)
intersected limestone from 1.00 m
- 21.62 m with four bands of hard
& compat l imes tone . Boreho le
( JRB-3) in te r sec ted l imes tone
f rom 1 .00m-12 .88 m wi th two
bands o f ha rd & compac t
limestone. Results match with the
specification of Chemically SMS
grade l imes tone and 11 nos
samples show on an average SiO2-
5.83%, CaO-50.89%, MgO-0.35%,
F e2O
3-0 .74% & A l
2O
3-0 .39%
respectively, which matches with
the specification of cement grade
limestone.
RajasthanMiyun ki Jaisalmer - - 18 9 0 0 6 1 6Dhani (west) District
G-4 s t age inves t iga t ion was
carried out. All the boreholes were
dr i l led up to the depth of 50 m
be low ground l eve l . In a l l t he
boreholes hard compact limestone
has been intersected with different
th ickness .The va r i a t ion in
thicknesses is ranging between 2.5
m to 28 m. In mos t o f the
boreholes the hard and compact
l imes tone bea r ing zone i s
occur r ing con t inuou l sy and in
some of the boreho les th i s
l imes tone i s occur r ing in te r -
mi t t en t ly wi th the modera te ly
hard c l ayey l imes tone , cha lky
limestone, foraminiferal/bioclastic
limestone, foraminiferal marl, sub-
bentoni t ic c lay, ca lcareous c lay
and grey shale. Out of 274 nos.
core samples, the results of 60 nos.
indicate the grade matching with
SMS(LD) g rade wi th maximum
CaO-55.06% and minimum CaO-
50.35% and the grade of 62 nos.
are matching with the SMS (OH).
LIMESTONE AND OTHER CALCAREOUS MATERIALS
32-10
Agency/ Location Mapping Drilling
State/ Area/ Sampling Remarks
District Block Scale Area No. of Meterage (No.) Reserves/Resources estimated
(sq km) boreholes
Table-2 (Contd.)
(Contd.)
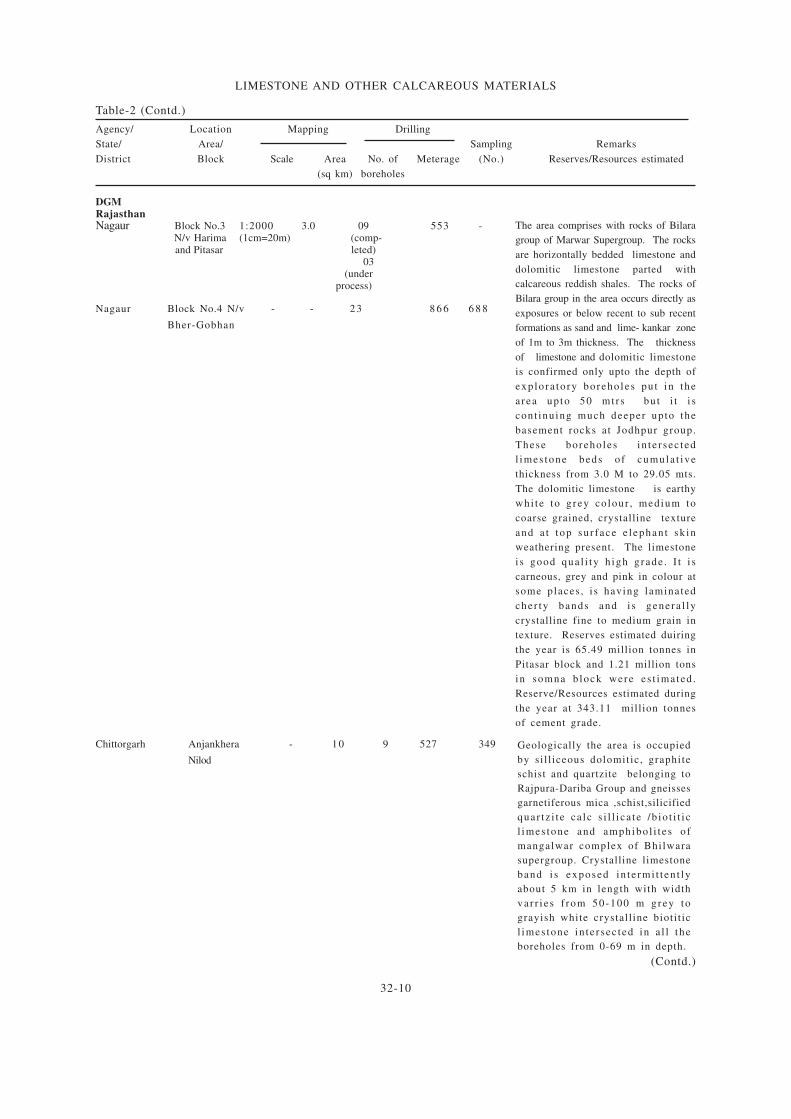
The area comprises with rocks of Bilara
group of Marwar Supergroup. The rocks
are horizontally bedded limestone and
dolomitic limestone parted with
calcareous reddish shales. The rocks of
Bilara group in the area occurs directly as
exposures or below recent to sub recent
formations as sand and lime- kankar zone
of 1m to 3m thickness. The thickness
of limestone and dolomitic limestone
is confirmed only upto the depth of
exp lo ra to ry boreho les pu t in the
a rea up to 50 mt r s bu t i t i s
cont inuing much deeper upto the
basement rocks at Jodhpur group.
These boreho les in te r sec ted
l imes tone beds o f cumula t ive
thickness from 3.0 M to 29.05 mts.
The dolomitic limestone is earthy
whi te to g rey co lour , medium to
coarse grained, crystalline texture
and a t top su r face e lephan t sk in
weathering present. The limestone
i s good qua l i ty h igh g rade . I t i s
carneous, grey and pink in colour at
some places , i s having laminated
cher ty bands and i s genera l ly
crystalline fine to medium grain in
texture. Reserves estimated duiring
the year is 65.49 million tonnes in
Pitasar block and 1.21 million tons
in somna b lock were es t ima ted .
Reserve/Resources estimated during
the year at 343.11 million tonnes
of cement grade.
Nagaur Block No.4 N/v - - 23 8 6 6 6 8 8
Bher-Gobhan
DGMRajasthanNagaur Block No.3 1:2000 3.0 09 553 -
N/v Harima (1cm=20m) (comp- and Pitasar leted)
03 (under process)
Chittorgarh Anjankhera - 10 9 527 349
Nilod
Geologically the area is occupied
by si l l iceous dolomitic, graphite
schist and quartzite belonging to
Rajpura-Dariba Group and gneisses
garnetiferous mica ,schist,silicified
quar tz i t e ca lc s i l l i ca te /b io t i t i c
l imes tone and amphibo l i t e s o f
mangalwar complex of Bhilwara
supergroup. Crystalline limestone
band i s exposed in te rmi t t en t ly
about 5 km in length with width
var r i e s f rom 50-100 m grey to
grayish white crystall ine bioti t ic
l imes tone in te r sec ted in a l l the
boreholes from 0-69 m in depth.
LIMESTONE AND OTHER CALCAREOUS MATERIALS
32-11
Agency/ Location Mapping Drilling
State/ Area/ Sampling Remarks
District Block Scale Area No. of Meterage (No.) Reserves/Resources estimated
(sq km) boreholes
Table-2 (Contd.)
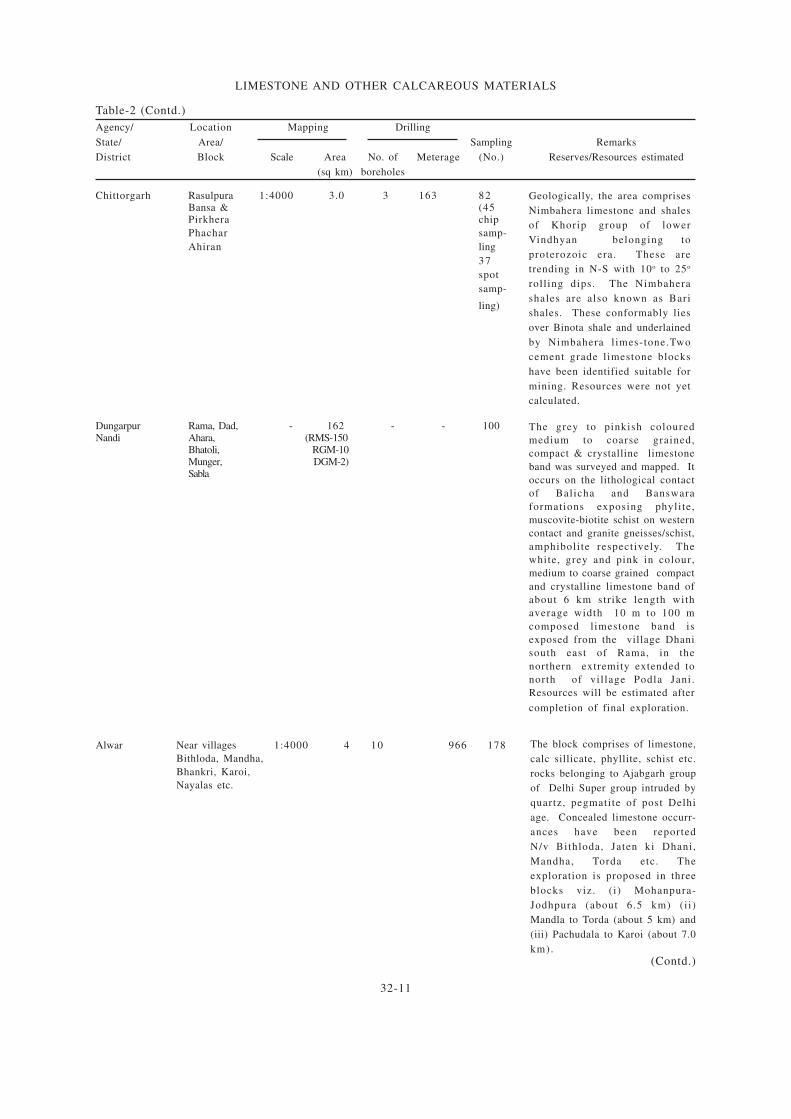
Chittorgarh Rasulpura 1:4000 3.0 3 163 82Bansa & (45Pirkhera chip
Phachar samp-
Ahiran ling
37
spot
samp-
ling)
Geologically, the area comprises
Nimbahera limestone and shales
of Khorip group of lower
Vindhyan belonging to
proterozoic era. These are
trending in N-S with 10o to 25o
roll ing dips. The Nimbahera
shales are also known as Bari
shales. These conformably lies
over Binota shale and underlained
by Nimbahera l imes-tone.Two
cement grade limestone blocks
have been identified suitable for
mining. Resources were not yet
calculated.
Dungarpur Rama, Dad, - 162 - - 100Nandi Ahara, (RMS-150
Bhatoli, RGM-10Munger, DGM-2)Sabla
The grey to pinkish coloured
medium to coarse grained,
compact & crystalline limestone
band was surveyed and mapped. It
occurs on the lithological contact
of Balicha and Banswara
formations exposing phyli te,
muscovite-biotite schist on western
contact and granite gneisses/schist,
amphiboli te respectively. The
white, grey and pink in colour,
medium to coarse grained compact
and crystalline limestone band of
about 6 km strike length with
average width 10 m to 100 m
composed l imestone band is
exposed from the village Dhani
south east of Rama, in the
northern extremity extended to
north of vil lage Podla Jani.
Resources will be estimated after
completion of final exploration.
Alwar Near villages 1:4000 4 10 966 178
Bithloda, Mandha,
Bhankri, Karoi,
Nayalas etc.
The block comprises of limestone,
calc sillicate, phyllite, schist etc.
rocks belonging to Ajabgarh group
of Delhi Super group intruded by
quartz, pegmatite of post Delhi
age. Concealed limestone occurr-
ances have been reported
N/v Bithloda, Jaten ki Dhani,
Mandha, Torda etc. The
exploration is proposed in three
blocks viz. ( i) Mohanpura-
Jodhpura (about 6.5 km) (i i)
Mandla to Torda (about 5 km) and
(iii) Pachudala to Karoi (about 7.0
km).
(Contd.)
LIMESTONE AND OTHER CALCAREOUS MATERIALS
32-12
Agency/ Location Mapping Drilling
State/ Area/ Sampling Remarks
District Block Scale Area No. of Meterage (No.) Reserves/Resources estimated
(sq km) boreholes
Table-2 (Contd.)
(Contd.)
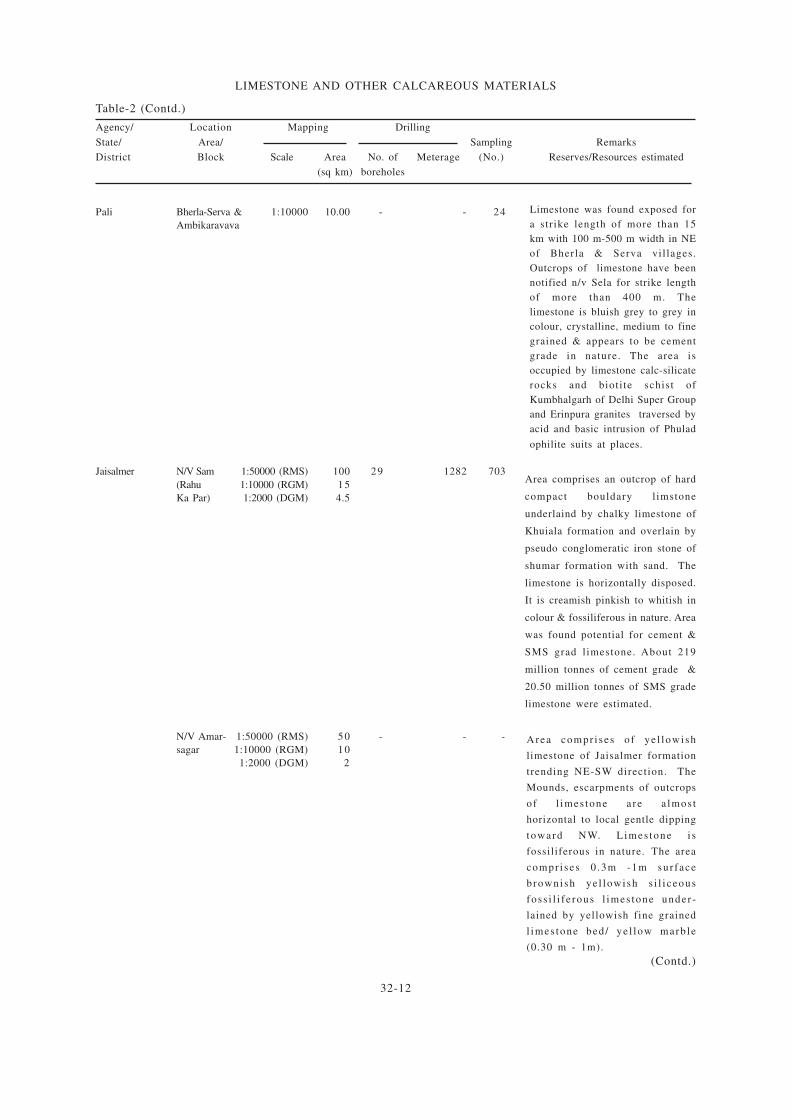
Limestone was found exposed for
a strike length of more than 15
km with 100 m-500 m width in NE
of Bherla & Serva vil lages.
Outcrops of limestone have been
notified n/v Sela for strike length
of more than 400 m. The
limestone is bluish grey to grey in
colour, crystalline, medium to fine
grained & appears to be cement
grade in nature. The area is
occupied by limestone calc-silicate
rocks and bioti te schist of
Kumbhalgarh of Delhi Super Group
and Erinpura granites traversed by
acid and basic intrusion of Phulad
ophilite suits at places.
Pali Bherla-Serva & 1:10000 10.00 - - 24
Ambikaravava
Area comprises an outcrop of hard
compact bouldary l imstone
underlaind by chalky limestone of
Khuiala formation and overlain by
pseudo conglomeratic iron stone of
shumar formation with sand. The
limestone is horizontally disposed.
It is creamish pinkish to whitish in
colour & fossiliferous in nature. Area
was found potential for cement &
SMS grad l imestone. About 219
million tonnes of cement grade &
20.50 million tonnes of SMS grade
limestone were estimated.
Jaisalmer N/V Sam 1:50000 (RMS) 100 29 1282 703
(Rahu 1:10000 (RGM) 15
Ka Par) 1:2000 (DGM) 4.5
Area compr i ses o f ye l lowish
limestone of Jaisalmer formation
trending NE-SW direction. The
Mounds, escarpments of outcrops
of l imes tone a re a lmos t
horizontal to local gentle dipping
toward NW. L imes tone i s
fossiliferous in nature. The area
compr i ses 0 .3m -1m sur face
brownish ye l lowish s i l i ceous
foss i l i f e rous l imes tone under -
lained by yellowish fine grained
l imes tone bed / ye l low marb le
(0.30 m - 1m).
N/V Amar- 1:50000 (RMS) 50 - - -
sagar 1:10000 (RGM) 10
1:2000 (DGM) 2
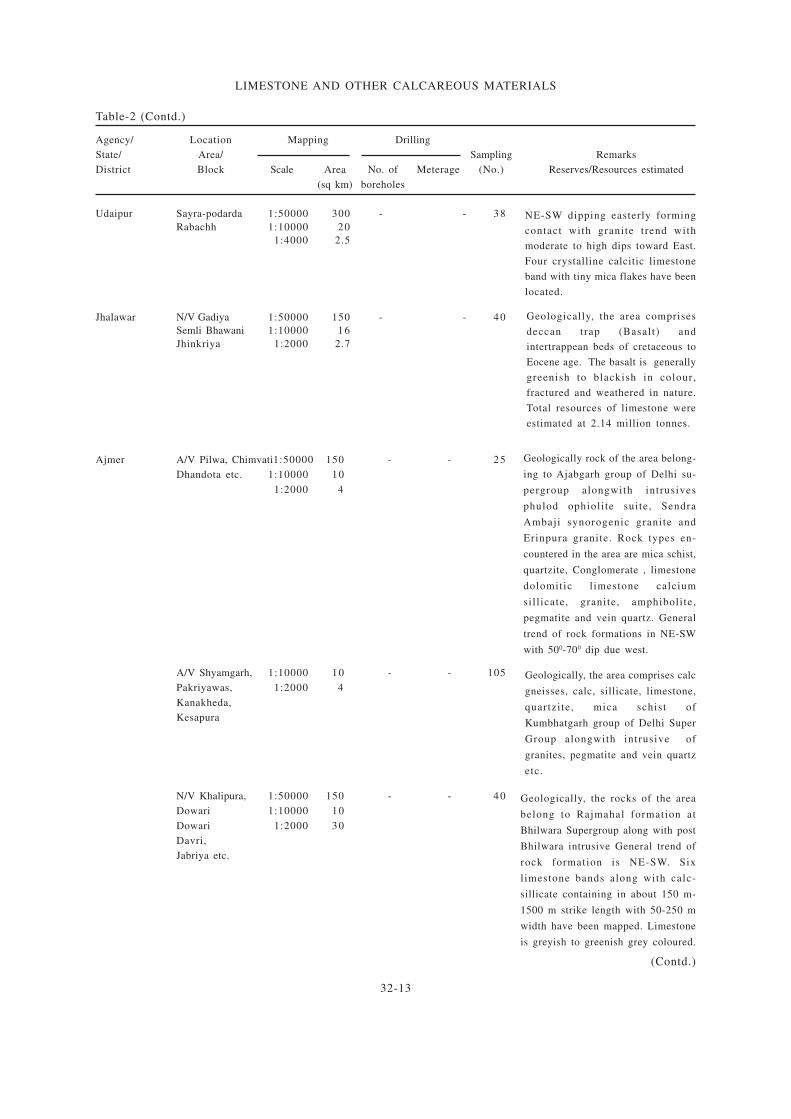
LIMESTONE AND OTHER CALCAREOUS MATERIALS
32-13
Agency/ Location Mapping Drilling
State/ Area/ Sampling Remarks
District Block Scale Area No. of Meterage (No.) Reserves/Resources estimated
(sq km) boreholes
Table-2 (Contd.)
(Contd.)
Jhalawar N/V Gadiya 1:50000 150 - - 40
Semli Bhawani 1:10000 16
Jhinkriya 1:2000 2.7
Geologically, the area comprises
deccan trap (Basalt) and
intertrappean beds of cretaceous to
Eocene age. The basalt is generally
greenish to blackish in colour,
fractured and weathered in nature.
Total resources of limestone were
estimated at 2.14 million tonnes.
Ajmer A/V Pilwa, Chimvati1:50000 150 - - 25
Dhandota etc. 1:10000 10
1:2000 4
A/V Shyamgarh, 1:10000 10 - - 105
Pakriyawas, 1:2000 4
Kanakheda,
Kesapura
N/V Khalipura, 1:50000 150 - - 40
Dowari 1:10000 10
Dowari 1:2000 30
Davri,
Jabriya etc.
Udaipur Sayra-podarda 1:50000 300 - - 38
Rabachh 1:10000 20
1:4000 2.5
NE-SW dipping easterly forming
contact with granite trend with
moderate to high dips toward East.
Four crystalline calcitic limestone
band with tiny mica flakes have been
located.
Geologically, the area comprises calc
gneisses, calc, sillicate, limestone,
quartzite, mica schist of
Kumbhatgarh group of Delhi Super
Group alongwith intrusive of
granites, pegmatite and vein quartz
etc.
Geologically rock of the area belong-
ing to Ajabgarh group of Delhi su-
pergroup alongwith intrusives
phulod ophioli te suite, Sendra
Ambaji synorogenic granite and
Erinpura granite. Rock types en-
countered in the area are mica schist,
quartzite, Conglomerate , limestone
dolomitic l imestone calcium
sill icate, granite, amphiboli te,
pegmatite and vein quartz. General
trend of rock formations in NE-SW
with 500-700 dip due west.
Geologically, the rocks of the area
belong to Rajmahal formation at
Bhilwara Supergroup along with post
Bhilwara intrusive General trend of
rock formation is NE-SW. Six
limestone bands along with calc-
sillicate containing in about 150 m-
1500 m strike length with 50-250 m
width have been mapped. Limestone
is greyish to greenish grey coloured.
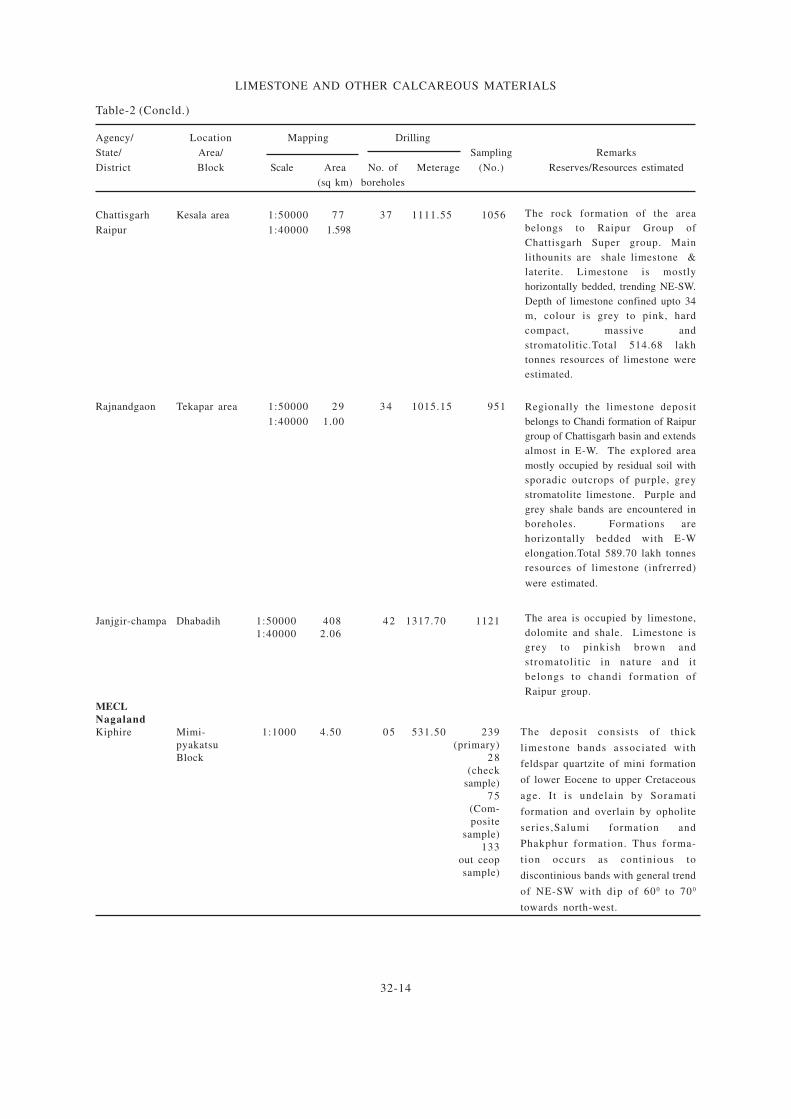
LIMESTONE AND OTHER CALCAREOUS MATERIALS
32-14
Chattisgarh Kesala area 1:50000 77 37 1111.55 1056
Raipur 1:40000 1.598
Table-2 (Concld.)
Agency/ Location Mapping Drilling
State/ Area/ Sampling Remarks
District Block Scale Area No. of Meterage (No.) Reserves/Resources estimated
(sq km) boreholes
The rock formation of the area
belongs to Raipur Group of
Chattisgarh Super group. Main
lithounits are shale limestone &
laterite. Limestone is mostly
horizontally bedded, trending NE-SW.
Depth of limestone confined upto 34
m, colour is grey to pink, hard
compact, massive and
stromatolitic.Total 514.68 lakh
tonnes resources of limestone were
estimated.
Rajnandgaon Tekapar area 1:50000 29 34 1015.15 951
1:40000 1.00
Regionally the limestone deposit
belongs to Chandi formation of Raipur
group of Chattisgarh basin and extends
almost in E-W. The explored area
mostly occupied by residual soil with
sporadic outcrops of purple, grey
stromatolite limestone. Purple and
grey shale bands are encountered in
boreholes. Formations are
horizontally bedded with E-W
elongation.Total 589.70 lakh tonnes
resources of limestone (infrerred)
were estimated.
Janjgir-champa Dhabadih 1:50000 408 42 1317.70 1121
1:40000 2.06
The area is occupied by limestone,
dolomite and shale. Limestone is
grey to pinkish brown and
stromatoli t ic in nature and i t
belongs to chandi formation of
Raipur group.
MECL
Nagaland
Kiphire Mimi- 1:1000 4.50 05 531.50 239
pyakatsu (primary)
Block 28
(check
sample)
75
(Com-
posite
sample)
133
out ceop
sample)
The deposit consists of thick
limestone bands associated with
feldspar quartzite of mini formation
of lower Eocene to upper Cretaceous
age. I t is undelain by Soramati
formation and overlain by opholite
series,Salumi formation and
Phakphur formation. Thus forma-
tion occurs as continious to
discontinious bands with general trend
of NE-SW with dip of 60 0 to 70 0
towards north-west.
LIMESTONE AND OTHER CALCAREOUS MATERIALS
32-15
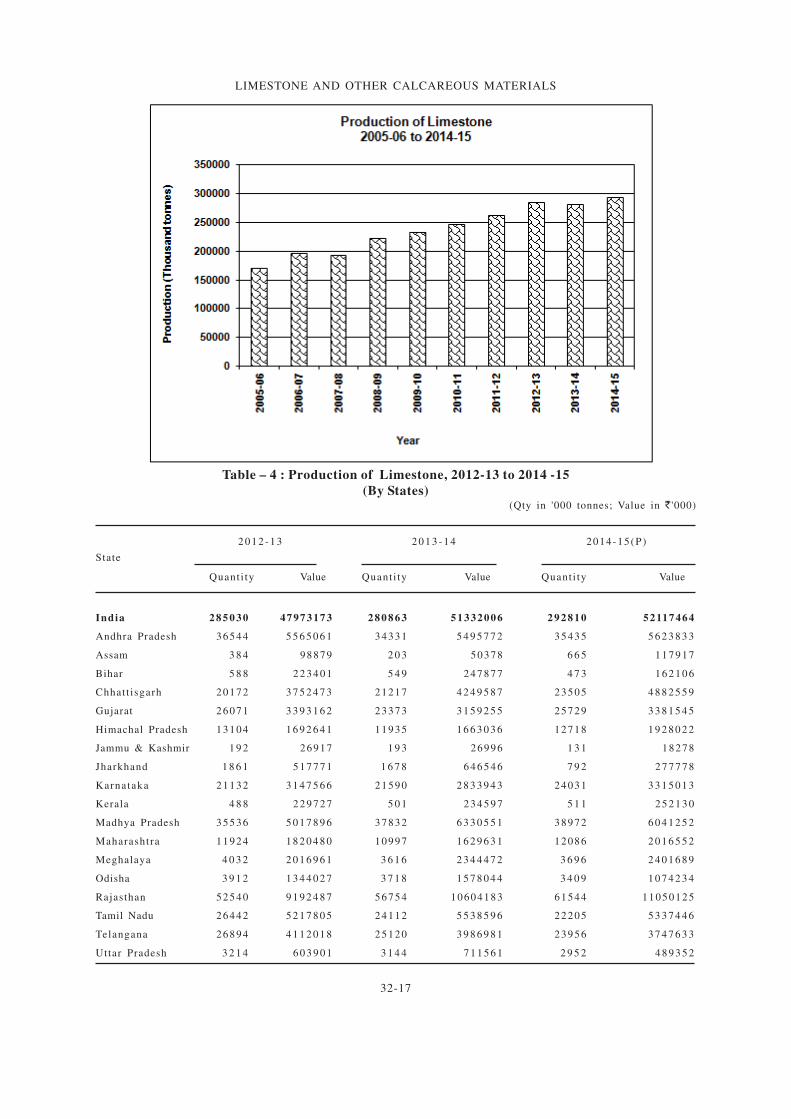
PRODUCTION, STOCKS ANDPRICES
Limestone
The production of limestone in 2014-15 at
292.8 million tonnes increased by about 4% as
compared to that of the previous year owing to
high demand in the market.
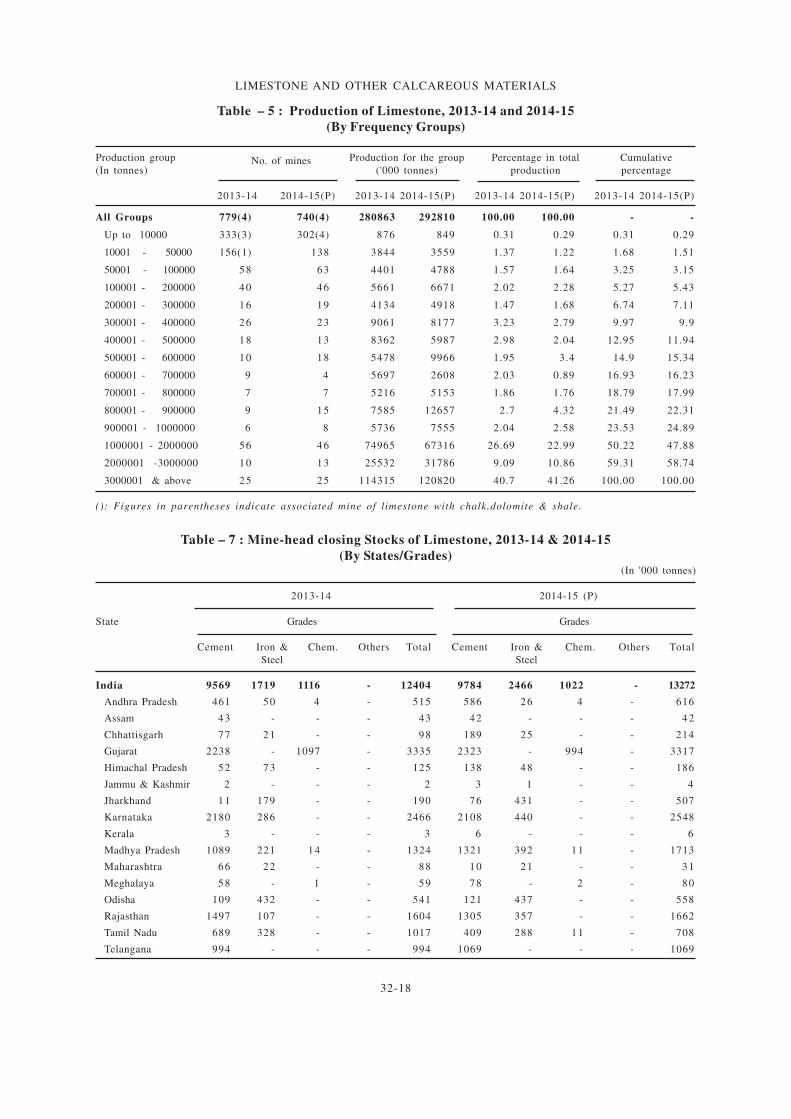
There were 740 reporting mines in 2014-15 as
against 779 during the previous year. Twenty five
mines, each producing more than 3 million tonnes
per annum contributed about 41% of the total
production of limestone in 2014-15. The share of
13 mines, each in the production range of 2 to 3
mill ion tonnes was about 11% of the total
production. About 23% of the total production
was contributed by 46 mines, each producing 1 to
2 million tonnes, annually. The remaining 25% of
the total production was reported by 656 mines
and four associated mines during the year. Twenty
five principal producers contributed about 79%
of the to ta l p roduc t ion . About 4% of the
production was reported by public sector mines
as against 4.1% in the previous year.
About 97% of the to ta l product ion of
limestone during 2014-15 was of cement grade, 2%
of iron & steel grade and the rest 1% consisted
of chemical grade.
Rajasthan was the leading producing state
accounting for (21%) of the total production of
limestone, followed by Madhya Pradesh (13%),
Andhra Pradesh (12%), Gujarat (9%), Karnataka,
Telangana,Chhattisgarh and Tamil Nadu (8% each
), Himachal Pradesh and Maharashtra (4% each)
and the remain ing 5% was cont r ibu ted by
Meghalaya, Odisha,Uttar Pradesh, Jharkhand,
Assam, Kerala, Bihar,and Jammu & Kashmir.
Mine-head closing stock of limestone for
the year 2014-15 was 13.3 million tonnes as
against 12.4 million tonnes for the previous year.
Average daily labour employment in limestone
mines in 2014-15 was 21,655 as against 22,977 in
the previous year (Tables - 3 to 7).
The prices of limestone are furnished in the
General Review on 'Prices'.
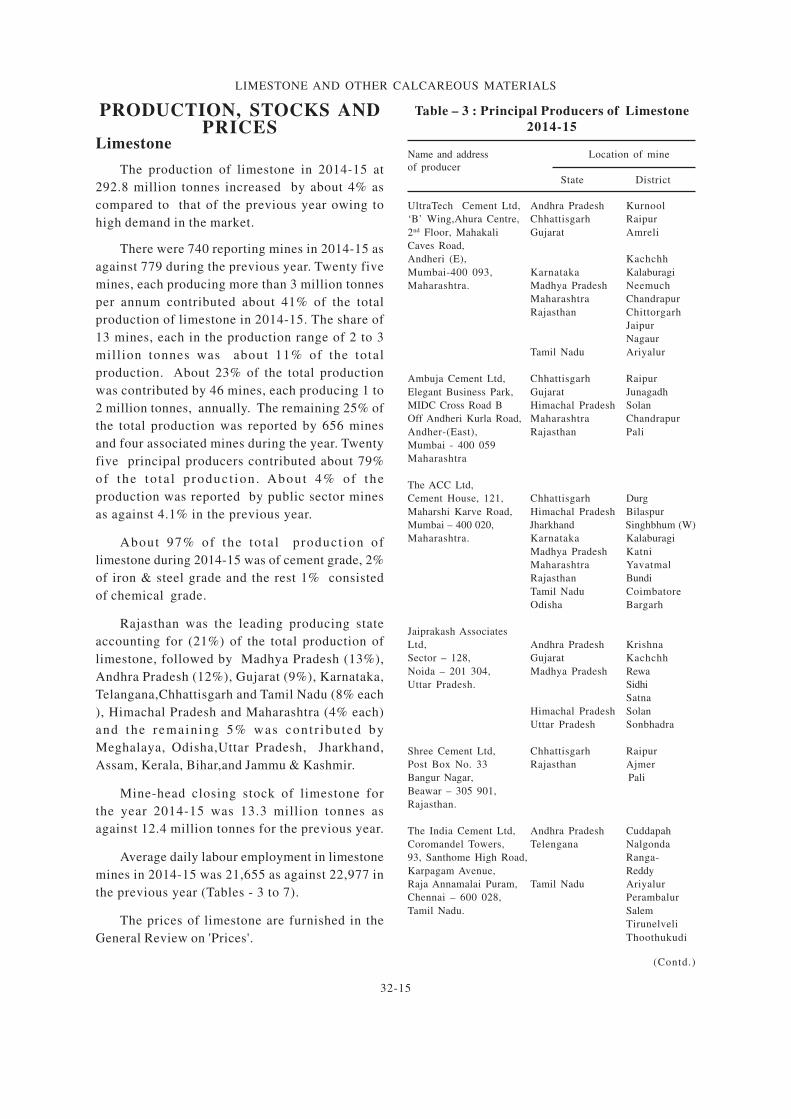
Table – 3 : Principal Producers of Limestone
2014-15
Name and address Location of mine
of producer
State District
UltraTech Cement Ltd, Andhra Pradesh Kurnool
‘B’ Wing,Ahura Centre, Chhattisgarh Raipur
2nd Floor, Mahakali Gujarat Amreli
Caves Road,
Andheri (E), Kachchh
Mumbai-400 093, Karnataka Kalaburagi
Maharashtra. Madhya Pradesh Neemuch
Maharashtra Chandrapur
Rajasthan Chittorgarh
Jaipur
Nagaur
Tamil Nadu Ariyalur
Ambuja Cement Ltd, Chhattisgarh Raipur
Elegant Business Park, Gujarat Junagadh
MIDC Cross Road B Himachal Pradesh Solan
Off Andheri Kurla Road, Maharashtra Chandrapur
Andher-(East), Rajasthan Pali
Mumbai - 400 059
Maharashtra
The ACC Ltd,
Cement House, 121, Chhattisgarh Durg
Maharshi Karve Road, Himachal Pradesh Bilaspur
Mumbai – 400 020, Jharkhand Singhbhum (W)
Maharashtra. Karnataka Kalaburagi
Madhya Pradesh Katni
Maharashtra Yavatmal
Rajasthan Bundi
Tamil Nadu Coimbatore
Odisha Bargarh
Jaiprakash Associates
Ltd, Andhra Pradesh Krishna
Sector – 128, Gujarat Kachchh
Noida – 201 304, Madhya Pradesh Rewa
Uttar Pradesh. Sidhi
Satna
Himachal Pradesh Solan
Uttar Pradesh Sonbhadra
Shree Cement Ltd, Chhattisgarh Raipur
Post Box No. 33 Rajasthan Ajmer
Bangur Nagar, Pali
Beawar – 305 901,
Rajasthan.
The India Cement Ltd, Andhra Pradesh Cuddapah
Coromandel Towers, Telengana Nalgonda
93, Santhome High Road, Ranga-
Karpagam Avenue, Reddy
Raja Annamalai Puram, Tamil Nadu Ariyalur
Chennai – 600 028, Perambalur
Tamil Nadu. Salem
Tirunelveli
Thoothukudi
(Contd.)
LIMESTONE AND OTHER CALCAREOUS MATERIALS
32-16
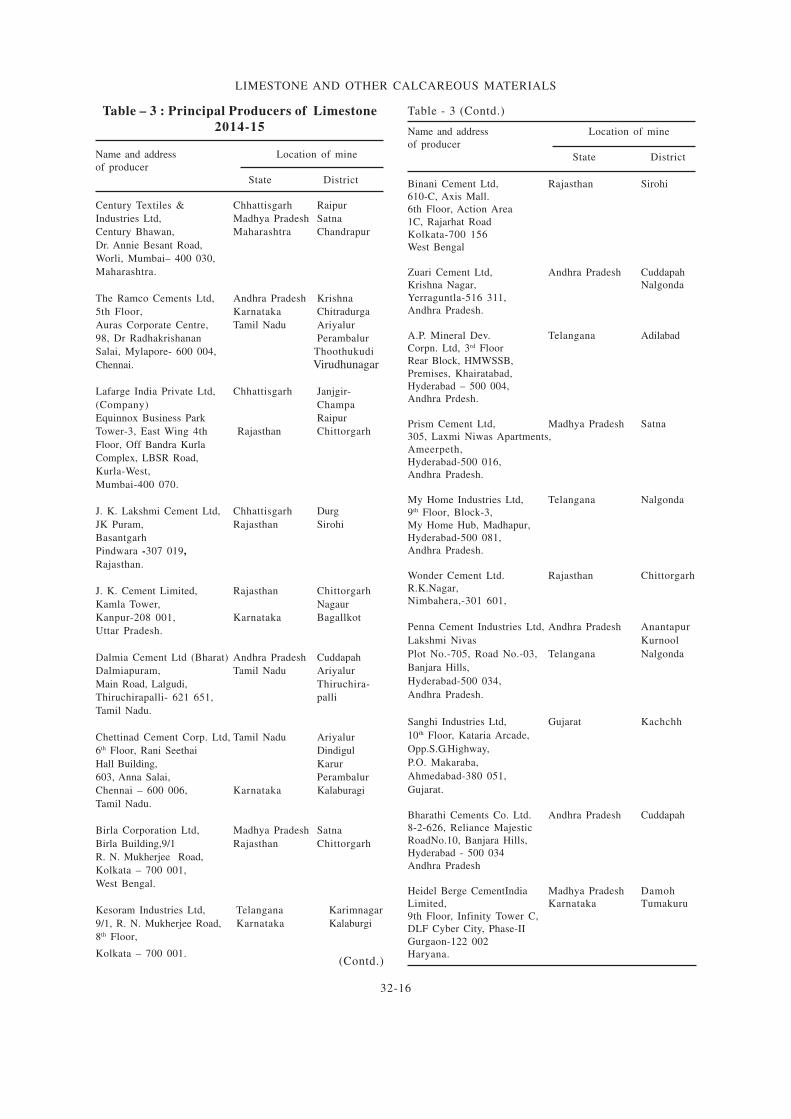
Table – 3 : Principal Producers of Limestone
2014-15
Name and address Location of mine
of producer
State District
(Contd.)
Table - 3 (Contd.)
Name and address Location of mine
of producer
State District
Century Textiles & Chhattisgarh Raipur
Industries Ltd, Madhya Pradesh Satna
Century Bhawan, Maharashtra Chandrapur
Dr. Annie Besant Road,
Worli, Mumbai– 400 030,
Maharashtra.
The Ramco Cements Ltd, Andhra Pradesh Krishna
5th Floor, Karnataka Chitradurga
Auras Corporate Centre, Tamil Nadu Ariyalur
98, Dr Radhakrishanan Perambalur
Salai, Mylapore- 600 004, Thoothukudi
Chennai. Virudhunagar
Lafarge India Private Ltd, Chhattisgarh Janjgir-
(Company) Champa
Equinnox Business Park Raipur
Tower-3, East Wing 4th Rajasthan Chittorgarh
Floor, Off Bandra Kurla
Complex, LBSR Road,
Kurla-West,
Mumbai-400 070.
J. K. Lakshmi Cement Ltd, Chhattisgarh Durg
JK Puram, Rajasthan Sirohi
Basantgarh
Pindwara -307 019,
Rajasthan.
J. K. Cement Limited, Rajasthan Chittorgarh
Kamla Tower, Nagaur
Kanpur-208 001, Karnataka Bagallkot
Uttar Pradesh.
Dalmia Cement Ltd (Bharat) Andhra Pradesh Cuddapah
Dalmiapuram, Tamil Nadu Ariyalur
Main Road, Lalgudi, Thiruchira-
Thiruchirapalli- 621 651, palli
Tamil Nadu.
Chettinad Cement Corp. Ltd, Tamil Nadu Ariyalur
6th Floor, Rani Seethai Dindigul
Hall Building, Karur
603, Anna Salai, Perambalur
Chennai – 600 006, Karnataka Kalaburagi
Tamil Nadu.
Birla Corporation Ltd, Madhya Pradesh Satna
Birla Building,9/1 Rajasthan Chittorgarh
R. N. Mukherjee Road,
Kolkata – 700 001,
West Bengal.
Kesoram Industries Ltd, Telangana Karimnagar
9/1, R. N. Mukherjee Road, Karnataka Kalaburgi
8th Floor,
Kolkata – 700 001.
Binani Cement Ltd, Rajasthan Sirohi
610-C, Axis Mall.
6th Floor, Action Area
1C, Rajarhat Road
Kolkata-700 156
West Bengal
Zuari Cement Ltd, Andhra Pradesh Cuddapah
Krishna Nagar, Nalgonda
Yerraguntla-516 311,
Andhra Pradesh.
A.P. Mineral Dev. Telangana Adilabad
Corpn. Ltd, 3rd Floor
Rear Block, HMWSSB,
Premises, Khairatabad,
Hyderabad – 500 004,
Andhra Prdesh.
Prism Cement Ltd, Madhya Pradesh Satna
305, Laxmi Niwas Apartments,
Ameerpeth,
Hyderabad-500 016,
Andhra Pradesh.
My Home Industries Ltd, Telangana Nalgonda
9th Floor, Block-3,
My Home Hub, Madhapur,
Hyderabad-500 081,
Andhra Pradesh.
Wonder Cement Ltd. Rajasthan Chittorgarh
R.K.Nagar,
Nimbahera,-301 601,
Penna Cement Industries Ltd, Andhra Pradesh Anantapur
Lakshmi Nivas Kurnool
Plot No.-705, Road No.-03, Telangana Nalgonda
Banjara Hills,
Hyderabad-500 034,
Andhra Pradesh.
Sanghi Industries Ltd, Gujarat Kachchh
10th Floor, Kataria Arcade,
Opp.S.G.Highway,
P.O. Makaraba,
Ahmedabad-380 051,
Gujarat.
Bharathi Cements Co. Ltd. Andhra Pradesh Cuddapah
8-2-626, Reliance Majestic
RoadNo.10, Banjara Hills,
Hyderabad - 500 034
Andhra Pradesh
Heidel Berge CementIndia Madhya Pradesh Damoh
Limited, Karnataka Tumakuru
9th Floor, Infinity Tower C,
DLF Cyber City, Phase-II
Gurgaon-122 002
Haryana.
LIMESTONE AND OTHER CALCAREOUS MATERIALS
32-17
Table – 4 : Production of Limestone, 2012-13 to 2014 -15
(By States)(Qty in '000 tonnes; Value in ` '000)
2 0 1 2 - 1 3 2 0 1 3 - 1 4 2014-15(P)
State
Quant i ty Value Quant i ty Value Quant i ty Value
India 2 8 5 0 3 0 47973173 2 8 0 8 6 3 51332006 2 9 2 8 1 0 52117464
Andhra Pradesh 36544 5 5 6 5 0 6 1 34331 5 4 9 5 7 7 2 35435 5 6 2 3 8 3 3
Assam 3 8 4 98879 2 0 3 50378 6 6 5 1 1 7 9 1 7
Bihar 5 8 8 2 2 3 4 0 1 5 4 9 2 4 7 8 7 7 4 7 3 1 6 2 1 0 6
Chhatt isgarh 20172 3 7 5 2 4 7 3 21217 4 2 4 9 5 8 7 23505 4 8 8 2 5 5 9
Gujarat 26071 3 3 9 3 1 6 2 23373 3 1 5 9 2 5 5 25729 3 3 8 1 5 4 5
Himachal Pradesh 13104 1 6 9 2 6 4 1 11935 1 6 6 3 0 3 6 12718 1 9 2 8 0 2 2
Jammu & Kashmir 1 9 2 26917 1 9 3 26996 1 3 1 18278
Jharkhand 1 8 6 1 5 1 7 7 7 1 1 6 7 8 6 4 6 5 4 6 7 9 2 2 7 7 7 7 8
Karnataka 21132 3 1 4 7 5 6 6 21590 2 8 3 3 9 4 3 24031 3 3 1 5 0 1 3
Kerala 4 8 8 2 2 9 7 2 7 5 0 1 2 3 4 5 9 7 5 1 1 2 5 2 1 3 0
Madhya Pradesh 35536 5 0 1 7 8 9 6 37832 6 3 3 0 5 5 1 38972 6 0 4 1 2 5 2
Maharashtra 11924 1 8 2 0 4 8 0 10997 1 6 2 9 6 3 1 12086 2 0 1 6 5 5 2
Meghalaya 4 0 3 2 2 0 1 6 9 6 1 3 6 1 6 2 3 4 4 4 7 2 3 6 9 6 2 4 0 1 6 8 9
Odisha 3 9 1 2 1 3 4 4 0 2 7 3 7 1 8 1 5 7 8 0 4 4 3 4 0 9 1 0 7 4 2 3 4
Rajasthan 52540 9 1 9 2 4 8 7 56754 10604183 61544 11050125
Tamil Nadu 26442 5 2 1 7 8 0 5 24112 5 5 3 8 5 9 6 22205 5 3 3 7 4 4 6
Telangana 26894 4 1 1 2 0 1 8 25120 3 9 8 6 9 8 1 23956 3 7 4 7 6 3 3
Uttar Pradesh 3 2 1 4 6 0 3 9 0 1 3 1 4 4 7 1 1 5 6 1 2 9 5 2 4 8 9 3 5 2
LIMESTONE AND OTHER CALCAREOUS MATERIALS
32-18
Table – 5 : Production of Limestone, 2013-14 and 2014-15
(By Frequency Groups)
Production group Production for the group Percentage in total Cumulative
(In tonnes)No. of mines
('000 tonnes) production percentage
2013-14 2014-15(P) 2013-14 2014-15(P) 2013-14 2014-15(P) 2013-14 2014-15(P)
All Groups 779(4) 740(4) 280863 292810 100.00 100.00 - -
Up to 10000 333(3) 302(4) 876 849 0.31 0.29 0.31 0.29
10001 - 50000 156(1) 138 3844 3559 1.37 1.22 1.68 1.51
50001 - 100000 58 63 4401 4788 1.57 1.64 3.25 3.15
100001 - 200000 40 46 5661 6671 2.02 2.28 5.27 5.43
200001 - 300000 16 19 4134 4918 1.47 1.68 6.74 7.11
300001 - 400000 26 23 9061 8177 3.23 2.79 9.97 9.9
400001 - 500000 18 13 8362 5987 2.98 2.04 12.95 11.94
500001 - 600000 10 18 5478 9966 1.95 3.4 14.9 15.34
600001 - 700000 9 4 5697 2608 2.03 0.89 16.93 16.23
700001 - 800000 7 7 5216 5153 1.86 1.76 18.79 17.99
800001 - 900000 9 15 7585 12657 2.7 4.32 21.49 22.31
900001 - 1000000 6 8 5736 7555 2.04 2.58 23.53 24.89
1000001 - 2000000 56 46 74965 67316 26.69 22.99 50.22 47.88
2000001 -3000000 10 13 25532 31786 9.09 10.86 59.31 58.74
3000001 & above 25 25 114315 120820 40.7 41.26 100.00 100.00
(): Figures in parentheses indicate associated mine of limestone with chalk,dolomite & shale.
Table – 7 : Mine-head closing Stocks of Limestone, 2013-14 & 2014-15
(By States/Grades) (In '000 tonnes)
2013-14 2014-15 (P)
State Grades Grades
Cement Iron & Chem. Others Total Cement Iron & Chem. Others Total
Steel Steel
India 9569 1719 1116 - 12404 9784 2466 1022 - 13272
Andhra Pradesh 461 50 4 - 515 586 26 4 - 616
Assam 43 - - - 43 42 - - - 42
Chhattisgarh 77 21 - - 98 189 25 - - 214
Gujarat 2238 - 1097 - 3335 2323 - 994 - 3317
Himachal Pradesh 52 73 - - 125 138 48 - - 186
Jammu & Kashmir 2 - - - 2 3 1 - - 4
Jharkhand 11 179 - - 190 76 431 - - 507
Karnataka 2180 286 - - 2466 2108 440 - - 2548
Kerala 3 - - - 3 6 - - - 6
Madhya Pradesh 1089 221 14 - 1324 1321 392 11 - 1713
Maharashtra 66 22 - - 88 10 21 - - 31
Meghalaya 58 - 1 - 59 78 - 2 - 80
Odisha 109 432 - - 541 121 437 - - 558
Rajasthan 1497 107 - - 1604 1305 357 - - 1662
Tamil Nadu 689 328 - - 1017 409 288 11 - 708
Telangana 994 - - - 994 1069 - - - 1069
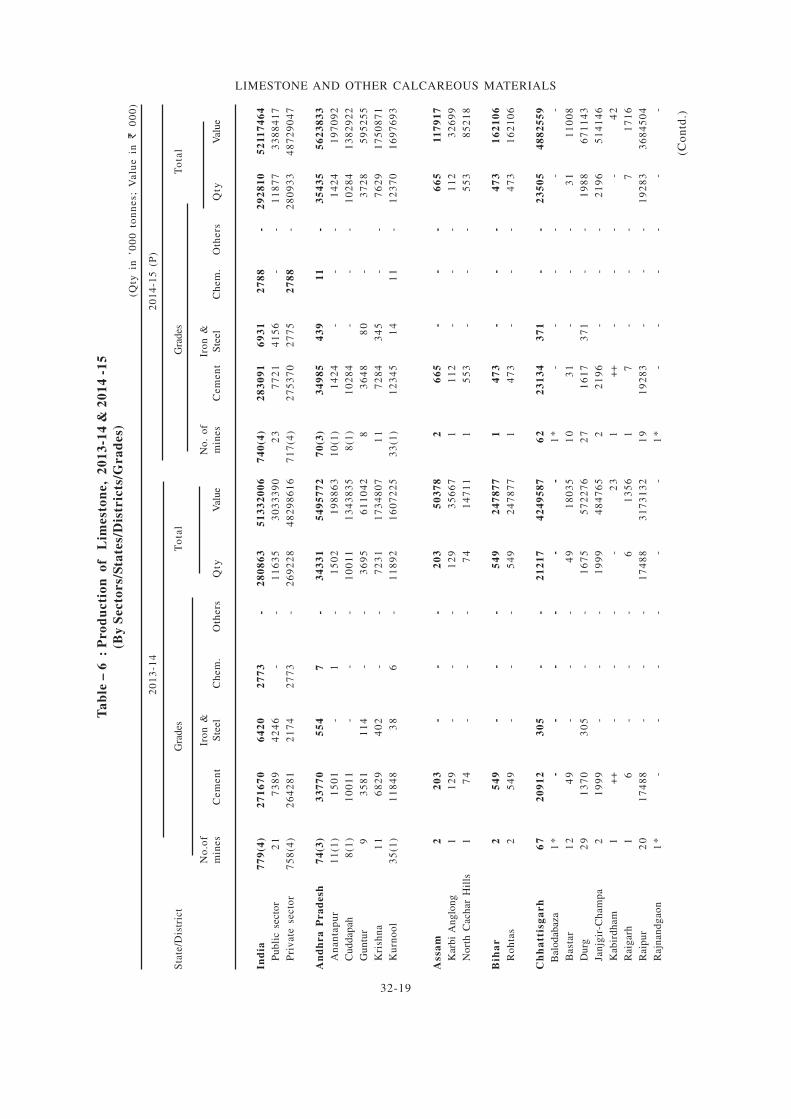
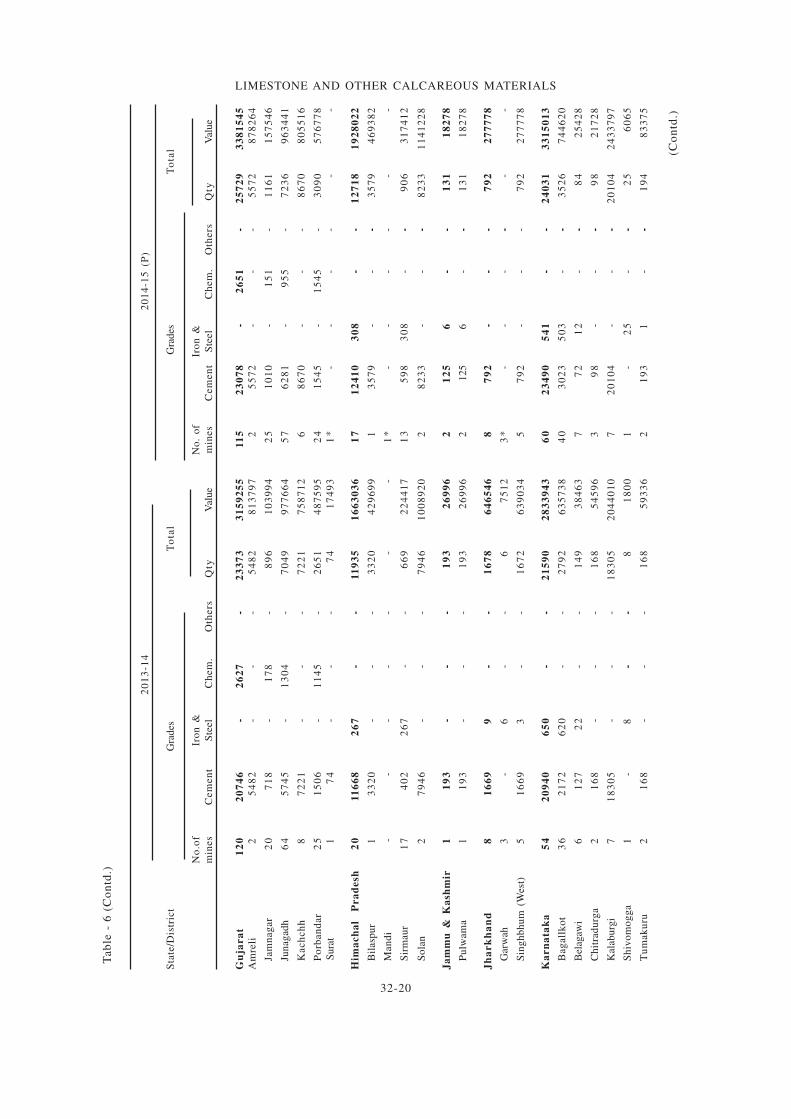
LIMESTONE AND OTHER CALCAREOUS MATERIALS
32-19
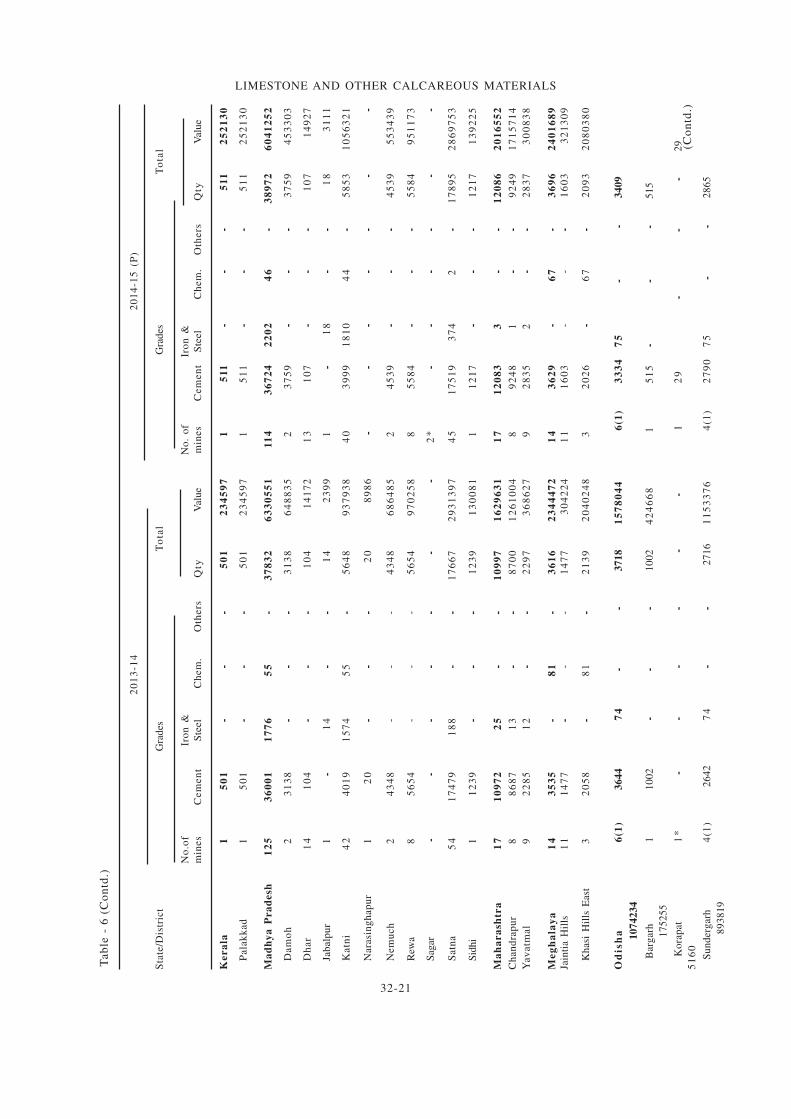
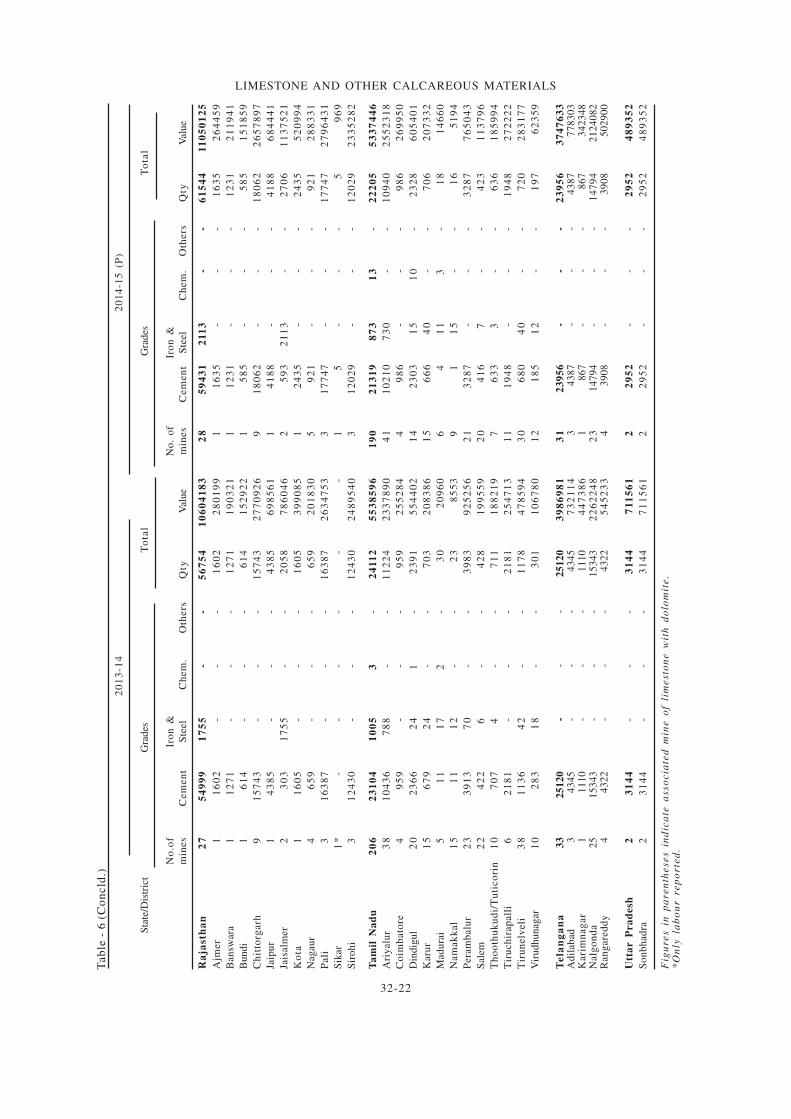
Ta
ble
– 6
:
Pro
du
cti
on
o
f L
imest
on
e,
20
13
-14
& 2
01
4 -
15
(By
Secto
rs/
Sta
tes/
Dis
tric
ts/G
ra
des)
(Qty
in
’0
00
to
nn
es;
Va
lue
in `
00
0)
In
dia
77
9(4
)2
71
67
06
42
02
77
3-
28
08
63
51
33
20
06
74
0(4
)2
83
09
16
93
12
78
8-
29
28
10
52
11
74
64
Pu
bli
c s
ecto
r2
17
38
94
24
6-
-1
16
35
30
33
39
02
37
72
14
15
6-
-1
18
77
33
88
41
7
Pri
vate
secto
r7
58
(4)
26
42
81
21
74
27
73
-2
69
22
84
82
98
61
67
17
(4)
27
53
70
27
75
27
88
-2
80
93
34
87
29
04
7
An
dh
ra
Pra
desh
74
(3)
33
77
05
54
7-
34
33
15
49
57
72
70
(3)
34
98
54
39
11
-3
54
35
56
23
83
3
An
an
tap
ur
11
(1)
15
01
-1
-1
50
21
98
86
31
0(1
)1
42
4-
--
14
24
19
70
92
Cu
dd
ap
ah
8(1
)1
00
11
--
-1
00
11
13
43
83
58
(1)
10
28
4-
--
10
28
41
38
29
22
Gu
ntu
r9
35
81
11
4-
-3
69
56
11
04
28
36
48
80
-3
72
85
95
25
5
Kri
shn
a1
16
82
94
02
--
72
31
17
34
80
71
17
28
43
45
--
76
29
17
50
87
1
Ku
rno
ol
35
(1)
11
84
83
86
-1
18
92
16
07
22
53
3(1
)1
23
45
14
11
-1
23
70
16
97
69
3
Assa
m2
20
3-
--
20
35
03
78
26
65
--
-6
65
11
79
17
Kar
bi
An
glo
ng
11
29
--
-1
29
35
66
71
11
2-
--
11
23
26
99
No
rth
Cach
ar
Hil
ls1
74
--
-7
41
47
11
15
53
--
-5
53
85
21
8
Bih
ar
25
49
--
-5
49
24
78
77
14
73
--
-4
73
16
21
06
Ro
hta
s2
54
9-
--
54
92
47
87
71
47
3-
--
47
31
62
10
6
Ch
ha
ttis
ga
rh
67
20
91
23
05
--
21
21
74
24
95
87
62
23
13
43
71
--
23
50
54
88
25
59
B
alo
dab
aza
1*
--
--
--
1*
--
--
--
Bast
ar
12
49
--
-4
91
80
35
10
31
--
-3
11
10
08
Du
rg2
91
37
03
05
--
16
75
57
22
76
27
16
17
37
1-
-1
98
86
71
14
3
Jan
jgir
-Ch
am
pa
21
99
9-
--
19
99
48
47
65
22
19
6-
--
21
96
51
41
46
Kab
ird
ham
1+
+-
--
-2
31
++
--
--
42
Raig
arh
16
--
-6
13
56
17
--
-7
17
16
Raip
ur
20
17
48
8-
--
17
48
83
17
31
32
19
19
28
3-
-
-1
92
83
36
84
50
4
Rajn
an
dg
ao
n1
*-
--
--
-1
*-
--
--
-
(Co
ntd
.)
20
13
-14
20
14
-15
(P
)
Sta
te/D
istr
ict
Gra
des
To
tal
Gra
des
To
tal
No
.of
Iro
n &
No
. o
fIr
on
&
min
es
Cem
en
tS
teel
Ch
em
.O
thers
Qty
Val
ue
min
es
Cem
en
tS
teel
Ch
em
.O
thers
Qty
Val
ue
LIMESTONE AND OTHER CALCAREOUS MATERIALS
32-20
Gu
jar
at
12
02
07
46
-2
62
7-
23
37
33
15
92
55
11
52
30
78
-2
65
1-
25
72
93
38
15
45
Am
reli
25
48
2-
--
54
82
81
37
97
25
57
2-
--
55
72
87
82
64
Jam
nag
ar
20
71
8-
17
8-
89
61
03
99
42
51
01
0-
15
1-
11
61
15
75
46
Jun
ag
ad
h6
45
74
5-
13
04
-7
04
99
77
66
45
76
28
1-
95
5-
72
36
96
34
41
Kach
ch
h8
72
21
--
-7
22
17
58
71
26
86
70
--
-8
67
08
05
51
6
Po
rban
dar
25
15
06
-1
14
5-
26
51
48
75
95
24
15
45
-1
54
5-
30
90
57
67
78
S
ura
t1
74
--
-7
41
74
93
1*
--
--
--
Him
ach
al
Pra
desh
20
11
66
82
67
--
11
93
51
66
30
36
17
12
41
03
08
--
12
71
81
92
80
22
Bil
asp
ur
13
32
0-
--
33
20
42
96
99
13
57
9-
--
35
79
46
93
82
Man
di
--
--
--
-1
*-
--
--
-
Sir
mau
r1
74
02
26
7
-
-6
69
22
44
17
13
59
83
08
--
90
63
17
41
2
So
lan
27
94
6-
--
79
46
10
08
92
02
82
33
--
-8
23
31
14
12
28
Ja
mm
u &
Ka
shm
ir1
19
3-
--
19
32
69
96
21
25
6-
-1
31
18
27
8
Pu
lwam
a1
19
3-
--
19
32
69
96
2
12
56
--
13
11
82
78
Jh
ar
kh
an
d8
16
69
9-
-1
67
86
46
54
68
79
2-
--
79
22
77
77
8
Gar
wah
3-
6-
-6
75
12
3*
--
--
--
Sin
gh
bh
um
(W
est
)5
16
69
3-
-1
67
26
39
03
45
79
2-
--
79
22
77
77
8
Ka
rn
ata
ka
54
20
94
06
50
--
21
59
02
83
39
43
60
23
49
05
41
--
24
03
13
31
50
13
Bag
all
ko
t3
62
17
26
20
--
27
92
63
57
38
40
30
23
50
3-
-3
52
67
44
62
0
Bel
agaw
i6
12
72
2-
-1
49
38
46
37
72
12
--
84
25
42
8
Ch
itra
du
rga
21
68
--
-1
68
54
59
63
98
--
-9
82
17
28
Kal
abu
rgi
71
83
05
--
-1
83
05
20
44
01
07
20
10
4-
--
20
10
42
43
37
97
Sh
ivo
mo
gg
a1
-8
--
81
80
01
-2
5-
-2
56
06
5
Tu
mak
uru
21
68
--
-1
68
59
33
62
19
31
--
19
48
33
75
20
13
-14
20
14
-15
(P
)
Sta
te/D
istr
ict
Gra
des
To
tal
Gra
des
To
tal
No
.of
Iro
n &
No
. o
fIr
on
&
min
es
Cem
en
tS
teel
Ch
em
.O
thers
Qty
Val
ue
min
es
Cem
en
tS
teel
Ch
em
.O
thers
Qty
Val
ue
(Co
ntd
.)
Tab
le -
6 (
Co
ntd
.)
LIMESTONE AND OTHER CALCAREOUS MATERIALS
32-21
20
13
-14
20
14
-15
(P
)
Sta
te/D
istr
ict
Gra
des
To
tal
Gra
des
To
tal
No
.of
Iro
n &
No
. o
fIr
on
&
min
es
Cem
en
tS
teel
Ch
em
.O
thers
Qty
Val
ue
min
es
Cem
en
tS
teel
Ch
em
.O
thers
Qty
Val
ue
(Co
ntd
.)
Tab
le -
6 (
Co
ntd
.)
Ke
ra
la1
50
1-
--
50
12
34
59
71
51
1-
--
51
12
52
13
0
Pala
kk
ad
15
01
--
-5
01
23
45
97
15
11
--
-5
11
25
21
30
Ma
dh
ya
Pra
desh
12
53
60
01
17
76
55
-3
78
32
63
30
55
11
14
36
72
42
20
24
6-
38
97
26
04
12
52
Da
mo
h2
31
38
--
-3
13
86
48
83
52
37
59
--
-3
75
94
53
30
3
Dh
ar
14
10
4-
--
10
41
41
72
13
10
7-
--
10
71
49
27
Jab
alp
ur
1-
14
--
14
23
99
1-
18
--
18
31
11
Katn
i4
24
01
91
57
45
5-
56
48
93
79
38
40
39
99
18
10
44
-5
85
31
05
63
21
Nara
sin
gh
ap
ur
12
0-
--
20
89
86
--
--
--
-
Nem
uch
24
34
8-
--
43
48
68
64
85
24
53
9-
--
45
39
55
34
39
Rew
a8
56
54
--
-5
65
49
70
25
88
55
84
--
-5
58
49
51
17
3
Sag
ar-
--
--
--
2*
--
--
--
Satn
a5
41
74
79
18
8-
-1
76
67
29
31
39
74
51
75
19
37
42
-1
78
95
28
69
75
3
Sid
hi
11
23
9-
--
12
39
13
00
81
11
21
7-
--
12
17
13
92
25
Ma
ha
ra
sh
tra
17
10
97
22
5-
-1
09
97
16
29
63
11
71
20
83
3-
-1
20
86
20
16
55
2
Ch
an
dra
pu
r8
86
87
13
--
87
00
12
61
00
48
92
48
1-
-9
24
91
71
57
14
Yav
atm
al
92
28
51
2-
-2
29
73
68
62
79
28
35
2-
-2
83
73
00
83
8
Me
gh
ala
ya
14
35
35
-8
1-
36
16
23
44
47
21
43
62
9-
67
-3
69
62
40
16
89
Jain
tia H
ills
11
14
77
--
-1
47
73
04
22
41
11
60
3-
--
16
03
32
13
09
Kh
asi
Hil
ls E
ast
32
05
8-
81
-2
13
92
04
02
48
32
02
6-
67
-2
09
32
08
03
80
Od
ish
a6
(1)
36
44
74
-
-
3
71
81
57
80
44
6(1
)3
33
47
5
-
-
34
09
10
74
23
4
B
arg
arh
1
1
00
2-
-
-
1
00
24
24
66
8
15
15
-
-
-
51
5
17
52
55
K
ora
pat
1*
--
-
-
--
12
9-
-
-
29
51
60
S
un
derg
arh
4(1
)
2
64
27
4
-
-
27
16
11
53
37
64
(1)
27
90
75
-
-
28
65
8
93
81
9
LIMESTONE AND OTHER CALCAREOUS MATERIALS
32-22
Ra
jasth
an
27
54
99
91
75
5-
-5
67
54
10
60
41
83
28
59
43
12
11
3-
-6
15
44
11
05
01
25
Ajm
er
11
60
2-
--
16
02
28
01
99
11
63
5-
--
16
35
26
44
59
Ban
swara
11
27
1-
--
12
71
19
03
21
11
23
1-
--
12
31
21
19
41
Bundi
16
14
--
-6
14
15
29
22
15
85
--
-5
85
15
18
59
Ch
itto
rgarh
91
57
43
--
-1
57
43
27
70
92
69
18
06
2-
--
18
06
22
65
78
97
Jaip
ur
14
38
5-
--
43
85
69
85
61
14
18
8-
--
41
88
68
44
41
Jais
alm
er
23
03
17
55
--
20
58
78
60
46
25
93
21
13
--
27
06
11
37
52
1
Ko
ta1
16
05
--
-1
60
53
99
08
51
24
35
--
-2
43
55
20
99
4
Nag
au
r4
65
9-
--
65
92
01
83
05
92
1-
--
92
12
88
33
1
Pali
31
63
87
--
-1
63
87
26
34
75
33
17
74
7-
--
17
74
72
79
64
31
Sik
ar
1*
--
--
--
15
--
-5
96
9
Sir
oh
i3
12
43
0-
--
12
43
02
48
95
40
31
20
29
--
-1
20
29
23
35
28
2
Ta
mil
Na
du
20
62
31
04
10
05
3-
24
11
25
53
85
96
19
02
13
19
87
31
3-
22
20
55
33
74
46
Ari
yalu
r3
81
04
36
78
8-
-1
12
24
23
37
89
04
11
02
10
73
0-
-1
09
40
25
52
31
8
Co
imb
ato
re4
95
9-
--
95
92
55
28
44
98
6-
--
98
62
69
95
0
Din
dig
ul
20
23
66
24
1-
23
91
55
44
02
14
23
03
15
10
-2
32
86
05
40
1
Karu
r1
56
79
24
--
70
32
08
38
61
56
66
40
--
70
62
07
33
2
Mad
ura
i5
11
17
2-
30
20
96
06
41
13
-1
81
46
60
Nam
ak
kal
15
11
12
--
23
85
53
91
15
--
16
51
94
Pera
mb
alu
r2
33
91
37
0-
-3
98
39
25
25
62
13
28
7-
--
32
87
76
50
43
Sal
em2
24
22
6-
-4
28
19
95
59
20
41
67
--
42
31
13
79
6
Th
oo
thu
ku
di/
Tu
tico
rin
10
70
74
--
71
11
88
21
97
63
33
--
63
61
85
99
4
Tir
uch
irap
all
i6
21
81
--
-2
18
12
54
71
31
11
94
8-
--
19
48
27
22
22
Tir
un
elv
eli
38
11
36
42
--
11
78
47
85
94
30
68
04
0-
-7
20
28
31
77
Vir
ud
hu
nag
ar1
02
83
18
--
30
11
06
78
01
21
85
12
--
19
76
23
59
Te
lan
ga
na
33
25
12
0
-
-
-
25
12
03
98
69
81
31
2
39
56
--
-2
39
56
37
47
63
3A
dil
ab
ad
3
4
34
5
-
-
-
43
45
73
21
14
3
43
87
-
-
-
4
38
7
77
83
03
Kari
mn
ag
ar
1
1
11
0
-
-
-
11
10
44
73
86
1
8
67
-
-
-
86
7
34
23
48
Nalg
on
da
2
5
1
53
43
-
-
-
1
53
43
22
62
24
82
3
1
47
94
-
-
-
14
79
4
2
12
40
82
Ran
gare
dd
y
4
43
22
-
-
-
4
32
25
45
23
3
4
39
08
-
-
-
39
08
5
02
90
0
Utt
ar P
ra
desh
23
14
4-
--
31
44
71
15
61
22
95
2-
--
29
52
48
93
52
So
nb
had
ra2
31
44
--
-3
14
47
11
56
12
29
52
--
-2
95
24
89
35
2
Fig
ure
s in
p
are
nth
ese
s in
dic
ate
a
sso
cia
ted
m
ine
o
f li
me
sto
ne
w
ith
d
olo
mit
e.
*O
nly
la
bo
ur re
po
rte
d.
20
13
-14
20
14
-15
(P
)
S
tate
/Dis
tric
tG
rades
To
tal
Gra
des
To
tal
No
.of
Iro
n &
No
. o
fIr
on
&
min
es
Cem
en
tS
teel
Ch
em
.O
thers
Qty
Val
ue
min
es
Cem
en
tS
teel
Ch
em
.O
thers
Qty
Val
ue
Tab
le -
6 (
Co
ncld
.)
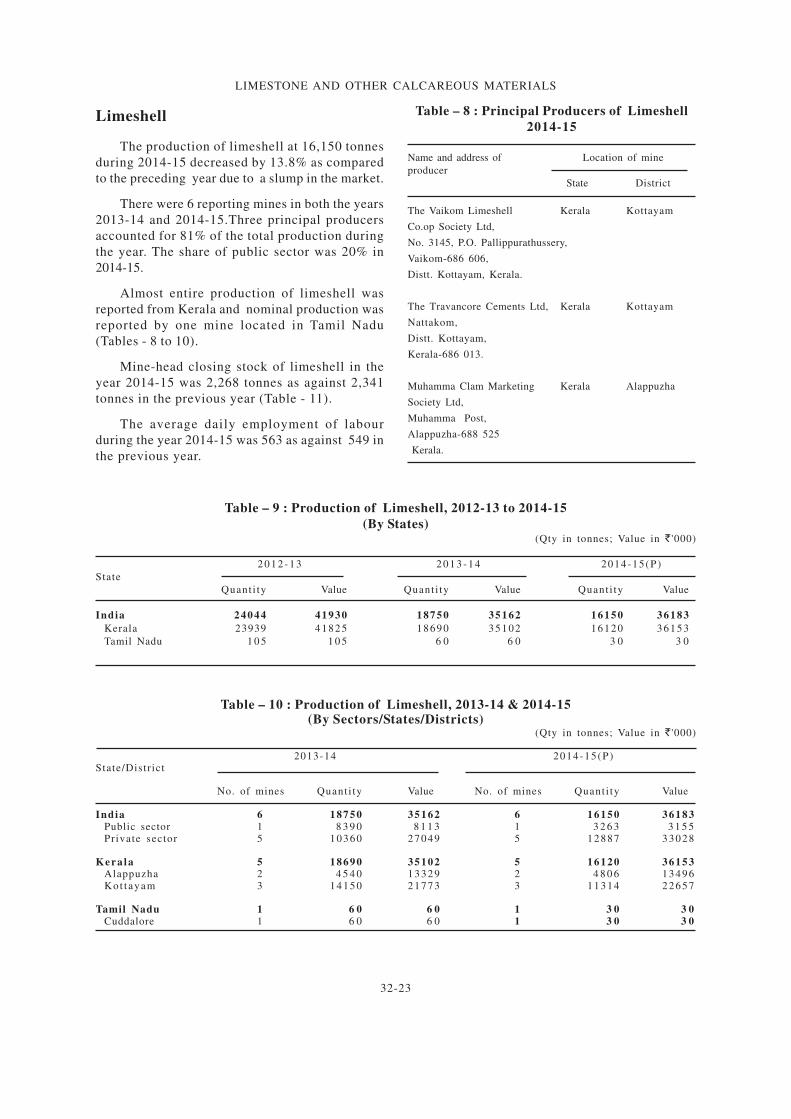
LIMESTONE AND OTHER CALCAREOUS MATERIALS
32-23
Limeshell
The production of limeshell at 16,150 tonnes
during 2014-15 decreased by 13.8% as compared
to the preceding year due to a slump in the market.
There were 6 reporting mines in both the years
2013-14 and 2014-15.Three principal producers
accounted for 81% of the total production during
the year. The share of public sector was 20% in
2014-15.
Almost entire production of limeshell was
reported from Kerala and nominal production was
reported by one mine located in Tamil Nadu
(Tables - 8 to 10).
Mine-head closing stock of limeshell in the
year 2014-15 was 2,268 tonnes as against 2,341
tonnes in the previous year (Table - 11).
The average daily employment of labour
during the year 2014-15 was 563 as against 549 in
the previous year.
Table – 8 : Principal Producers of Limeshell
2014-15
Name and address of Location of mine
producer
State District
The Vaikom Limeshell Kerala Kottayam
Co.op Society Ltd,
No. 3145, P.O. Pallippurathussery,
Vaikom-686 606,
Distt. Kottayam, Kerala.
The Travancore Cements Ltd, Kerala Kottayam
Nattakom,
Distt. Kottayam,
Kerala-686 013.
Muhamma Clam Marketing Kerala Alappuzha
Society Ltd,
Muhamma Post,
Alappuzha-688 525
Kerala.
Table – 10 : Production of Limeshell, 2013-14 & 2014-15(By Sectors/States/Districts)
(Qty in tonnes; Value in ` '000)
2013-14 2014-15(P)State/District
No. of mines Quant i ty Value No. of mines Quant i ty Value
India 6 18750 35162 6 16150 36183Public sector 1 8 3 9 0 8 1 1 3 1 3 2 6 3 3 1 5 5Private sector 5 10360 27049 5 12887 33028
Kera la 5 18690 35102 5 16120 36153Alappuzha 2 4 5 4 0 13329 2 4 8 0 6 13496Kot t ayam 3 14150 21773 3 11314 22657
Tamil Nadu 1 6 0 6 0 1 3 0 3 0Cuddalore 1 6 0 6 0 1 3 0 3 0
Table – 9 : Production of Limeshell, 2012-13 to 2014-15
(By States)(Qty in tonnes; Value in ` '000)
2 0 1 2 - 1 3 2 0 1 3 - 1 4 2014-15(P)
State
Quant i ty Value Quant i ty Value Quant i ty Value
India 24044 41930 18750 35162 16150 36183
Kerala 23939 41825 18690 35102 16120 36153
Tamil Nadu 1 0 5 1 0 5 6 0 6 0 3 0 3 0
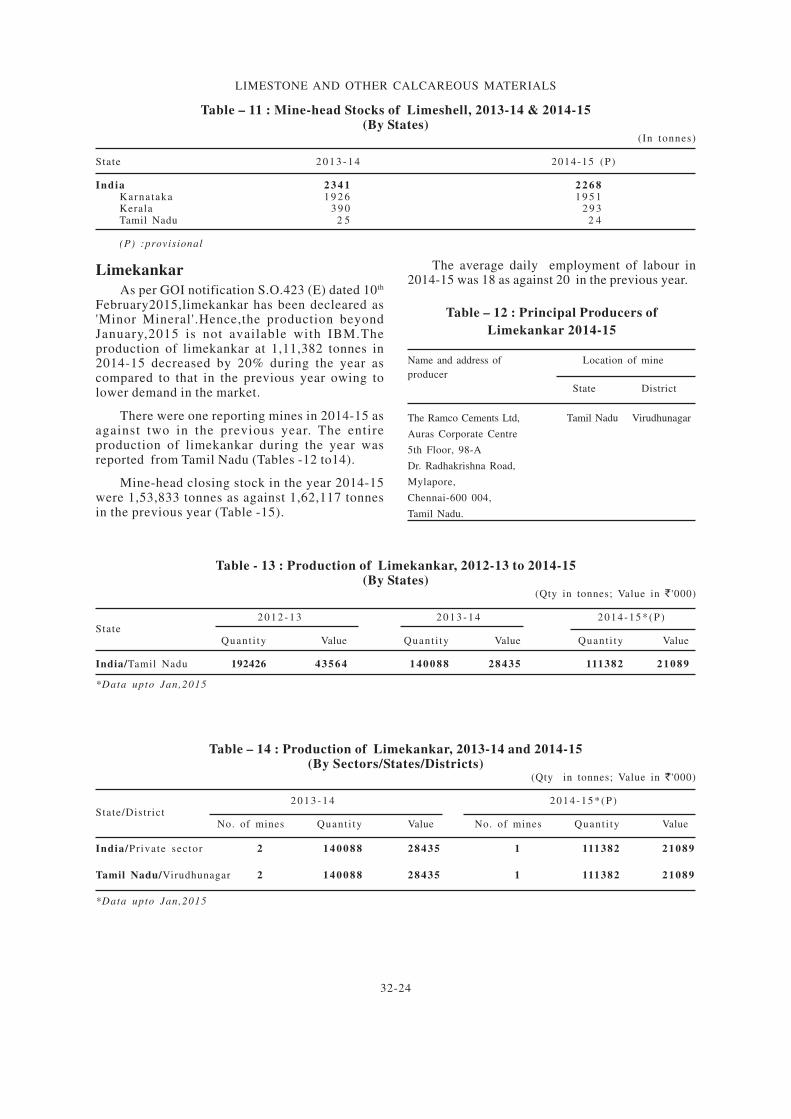
LIMESTONE AND OTHER CALCAREOUS MATERIALS
32-24
Limekankar
As per GOI notification S.O.423 (E) dated 10th
February2015,limekankar has been decleared as'Minor Mineral'.Hence,the production beyondJanuary,2015 is not available with IBM.Theproduction of limekankar at 1,11,382 tonnes in2014-15 decreased by 20% during the year ascompared to that in the previous year owing tolower demand in the market.
There were one reporting mines in 2014-15 asagainst two in the previous year. The entireproduction of limekankar during the year wasreported from Tamil Nadu (Tables -12 to14).
Mine-head closing stock in the year 2014-15were 1,53,833 tonnes as against 1,62,117 tonnesin the previous year (Table -15).
Table – 11 : Mine-head Stocks of Limeshell, 2013-14 & 2014-15(By States)
(In tonnes)
State 2 0 1 3 - 1 4 2014-15 (P)
India 2 3 4 1 2 2 6 8Karnataka 1 9 2 6 1 9 5 1Kerala 3 9 0 2 9 3Tamil Nadu 2 5 2 4
(P) :provisional
Table – 12 : Principal Producers of
Limekankar 2014-15
Name and address of Location of mine
producer
State District
The Ramco Cements Ltd, Tamil Nadu Virudhunagar
Auras Corporate Centre
5th Floor, 98-A
Dr. Radhakrishna Road,
Mylapore,
Chennai-600 004,
Tamil Nadu.
Table - 13 : Production of Limekankar, 2012-13 to 2014-15(By States)
(Qty in tonnes; Value in ` '000)
2 0 1 2 - 1 3 2 0 1 3 - 1 4 2014-15*(P )State
Quant i ty Value Quant i ty Value Quant i ty Value
India/Tamil Nadu 192426 43564 1 4 0 0 8 8 28435 111382 21089
*Data upto Jan,2015
Table – 14 : Production of Limekankar, 2013-14 and 2014-15(By Sectors/States/Districts)
(Qty in tonnes; Value in ` '000)
2 0 1 3 - 1 4 2014-15*(P )State/District
No. of mines Quant i ty Value No. of mines Quant i ty Value
India/Private sector 2 1 4 0 0 8 8 28435 1 111382 21089
Tamil Nadu/Virudhunagar 2 1 4 0 0 8 8 28435 1 111382 21089
*Data upto Jan,2015
The average daily employment of labour in2014-15 was 18 as against 20 in the previous year.
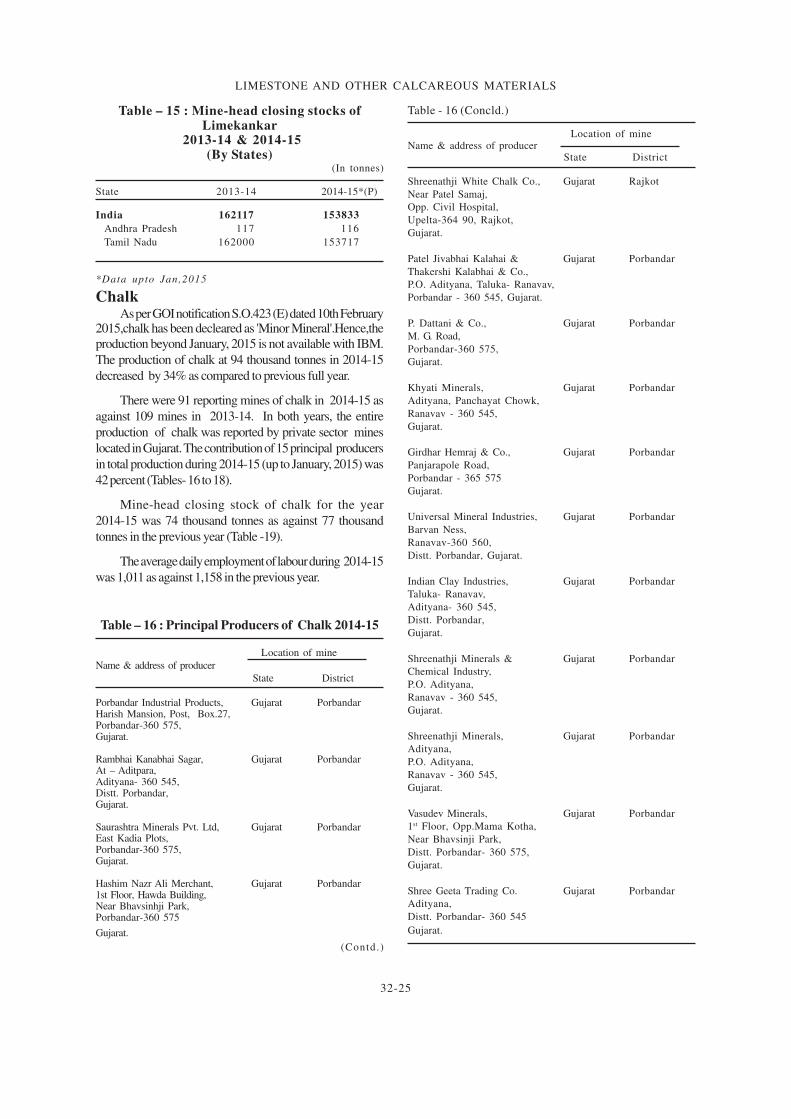
LIMESTONE AND OTHER CALCAREOUS MATERIALS
32-25
Table – 15 : Mine-head closing stocks ofLimekankar
2013-14 & 2014-15(By States)
(In tonnes)
State 2013-14 2014-15*(P)
India 162117 153833
Andhra Pradesh 117 116
Tamil Nadu 162000 153717
*Data upto Jan,2015
ChalkAs per GOI notification S.O.423 (E) dated 10th February
2015,chalk has been decleared as 'Minor Mineral'.Hence,the
production beyond January, 2015 is not available with IBM.
The production of chalk at 94 thousand tonnes in 2014-15
decreased by 34% as compared to previous full year.
There were 91 reporting mines of chalk in 2014-15 as
against 109 mines in 2013-14. In both years, the entire
production of chalk was reported by private sector mines
located in Gujarat. The contribution of 15 principal producers
in total production during 2014-15 (up to January, 2015) was
42 percent (Tables- 16 to 18).
Mine-head closing stock of chalk for the year
2014-15 was 74 thousand tonnes as against 77 thousand
tonnes in the previous year (Table -19).
The average daily employment of labour during 2014-15
was 1,011 as against 1,158 in the previous year.
Table – 16 : Principal Producers of Chalk 2014-15
Location of mine
Name & address of producer
State District
Porbandar Industrial Products, Gujarat PorbandarHarish Mansion, Post, Box.27,Porbandar-360 575,Gujarat.
Rambhai Kanabhai Sagar, Gujarat PorbandarAt – Aditpara,Adityana- 360 545,Distt. Porbandar,Gujarat.
Saurashtra Minerals Pvt. Ltd, Gujarat PorbandarEast Kadia Plots,Porbandar-360 575,Gujarat.
Hashim Nazr Ali Merchant, Gujarat Porbandar1st Floor, Hawda Building,Near Bhavsinhji Park,Porbandar-360 575
Gujarat.
Shreenathji White Chalk Co., Gujarat Rajkot
Near Patel Samaj,
Opp. Civil Hospital,
Upelta-364 90, Rajkot,
Gujarat.
Patel Jivabhai Kalahai & Gujarat Porbandar
Thakershi Kalabhai & Co.,
P.O. Adityana, Taluka- Ranavav,
Porbandar - 360 545, Gujarat.
P. Dattani & Co., Gujarat Porbandar
M. G. Road,
Porbandar-360 575,
Gujarat.
Khyati Minerals, Gujarat Porbandar
Adityana, Panchayat Chowk,
Ranavav - 360 545,
Gujarat.
Girdhar Hemraj & Co., Gujarat Porbandar
Panjarapole Road,
Porbandar - 365 575
Gujarat.
Universal Mineral Industries, Gujarat Porbandar
Barvan Ness,
Ranavav-360 560,
Distt. Porbandar, Gujarat.
Indian Clay Industries, Gujarat Porbandar
Taluka- Ranavav,
Adityana- 360 545,
Distt. Porbandar,
Gujarat.
Shreenathji Minerals & Gujarat Porbandar
Chemical Industry,
P.O. Adityana,
Ranavav - 360 545,
Gujarat.
Shreenathji Minerals, Gujarat Porbandar
Adityana,
P.O. Adityana,
Ranavav - 360 545,
Gujarat.
Vasudev Minerals, Gujarat Porbandar
1st Floor, Opp.Mama Kotha,
Near Bhavsinji Park,
Distt. Porbandar- 360 575,
Gujarat.
Shree Geeta Trading Co. Gujarat Porbandar
Adityana,
Distt. Porbandar- 360 545
Gujarat.
Location of mineName & address of producer
State District
Table - 16 (Concld.)
(Contd.)
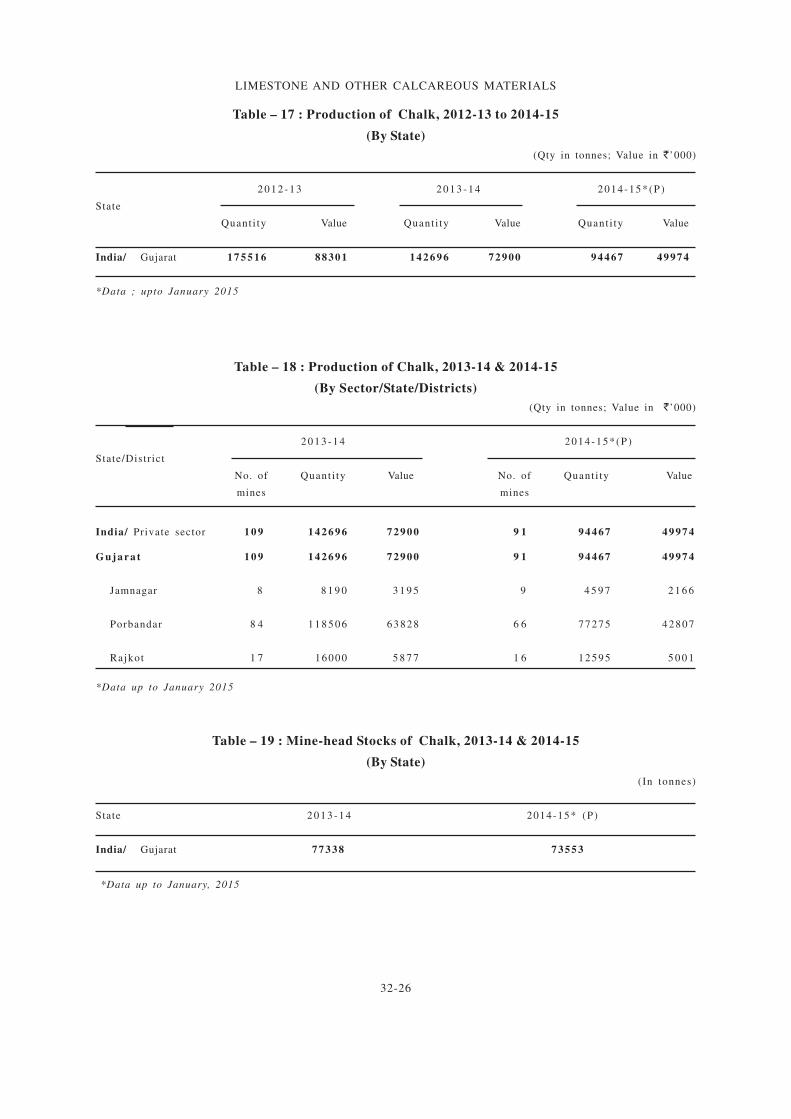
LIMESTONE AND OTHER CALCAREOUS MATERIALS
32-26
Table – 17 : Production of Chalk, 2012-13 to 2014-15
(By State)
(Qty in tonnes; Value in `’000)
2 0 1 2 - 1 3 2 0 1 3 - 1 4 2014-15*(P )
State
Quant i ty Value Quant i ty Value Quant i ty Value
India/ Gujarat 1 7 5 5 1 6 88301 1 4 2 6 9 6 72900 94467 49974
*Data ; upto January 2015
Table – 19 : Mine-head Stocks of Chalk, 2013-14 & 2014-15
(By State)
(In tonnes)
State 2 0 1 3 - 1 4 2014-15* (P)
India/ Gujarat 77338 73553
*Data up to January, 2015
Table – 18 : Production of Chalk, 2013-14 & 2014-15
(By Sector/State/Districts)
(Qty in tonnes; Value in `’000)
2 0 1 3 - 1 4 2014-15*(P )
State/District
No. of Quant i ty Value No. of Quant i ty Value
mines mines
India/ Private sector 1 0 9 1 4 2 6 9 6 72900 9 1 94467 49974
G u j a r a t 1 0 9 1 4 2 6 9 6 72900 9 1 94467 49974
Jamnagar 8 8 1 9 0 3 1 9 5 9 4 5 9 7 2 1 6 6
Porbandar 8 4 1 1 8 5 0 6 63828 6 6 77275 42807
Rajkot 1 7 16000 5 8 7 7 1 6 12595 5 0 0 1
*Data up to January 2015
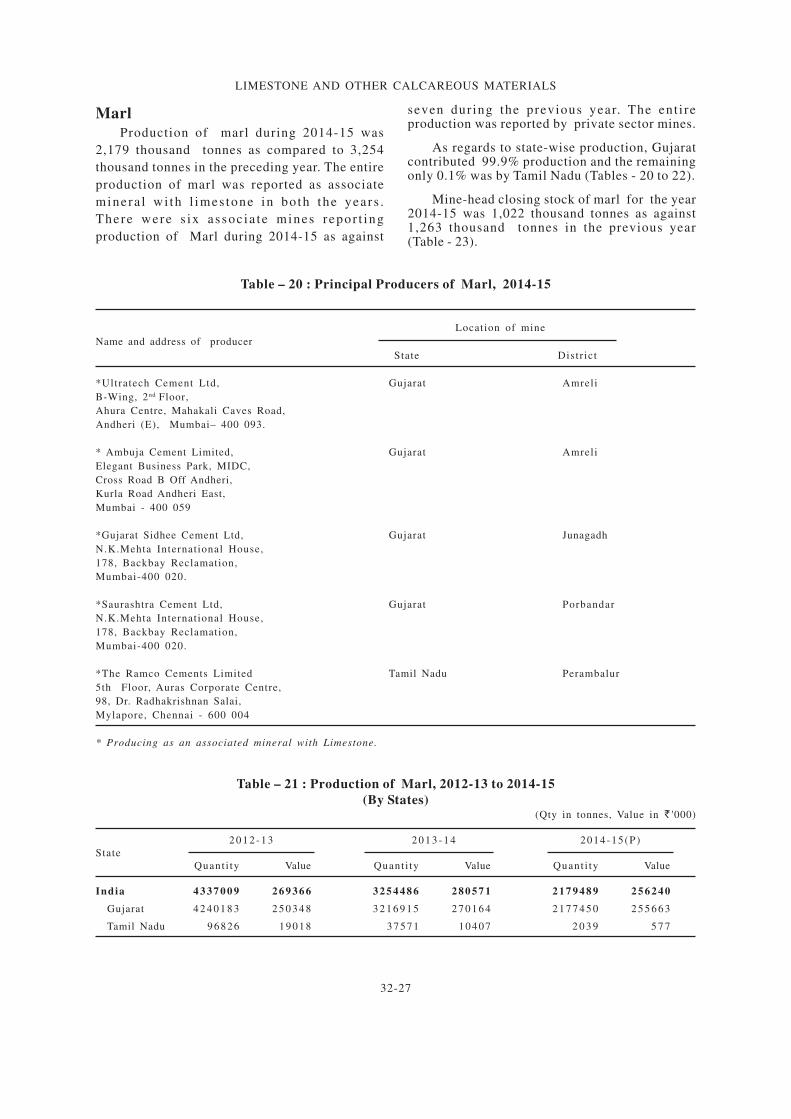
LIMESTONE AND OTHER CALCAREOUS MATERIALS
32-27
Marl
Production of marl during 2014-15 was
2,179 thousand tonnes as compared to 3,254
thousand tonnes in the preceding year. The entire
production of marl was reported as associate
minera l wi th l imes tone in bo th the years .
There were s ix assoc ia te mines repor t ing
production of Marl during 2014-15 as against
Table – 20 : Principal Producers of Marl, 2014-15
Location of mine
Name and address of producer
State Distr ict
*Ultratech Cement Ltd, Gujarat Amreli
B-Wing, 2nd Floor,
Ahura Centre, Mahakali Caves Road,
Andheri (E), Mumbai– 400 093.
* Ambuja Cement Limited, Gujarat Amreli
Elegant Business Park, MIDC,
Cross Road B Off Andheri,
Kurla Road Andheri East,
Mumbai - 400 059
*Gujarat Sidhee Cement Ltd, Gujarat Junagadh
N.K.Mehta International House,
178, Backbay Reclamation,
Mumbai-400 020.
*Saurashtra Cement Ltd, Gujarat Porbandar
N.K.Mehta International House,
178, Backbay Reclamation,
Mumbai-400 020.
*The Ramco Cements Limited Tamil Nadu Perambalur
5th Floor, Auras Corporate Centre,
98, Dr. Radhakrishnan Salai,
Mylapore, Chennai - 600 004
* Producing as an associated mineral with Limestone.
seven during the previous year. The ent i reproduction was reported by private sector mines.
As regards to state-wise production, Gujaratcontributed 99.9% production and the remainingonly 0.1% was by Tamil Nadu (Tables - 20 to 22).
Mine-head closing stock of marl for the year2014-15 was 1,022 thousand tonnes as against1,263 thousand tonnes in the previous year(Table - 23).
Table – 21 : Production of Marl, 2012-13 to 2014-15
(By States)(Qty in tonnes, Value in L '000)
2 0 1 2 - 1 3 2 0 1 3 - 1 4 2014-15(P)
State
Quant i ty Value Quant i ty Value Quant i ty Value
India 4 3 3 7 0 0 9 2 6 9 3 6 6 3 2 5 4 4 8 6 2 8 0 5 7 1 2 1 7 9 4 8 9 2 5 6 2 4 0
Gujarat 4 2 4 0 1 8 3 2 5 0 3 4 8 3 2 1 6 9 1 5 2 7 0 1 6 4 2 1 7 7 4 5 0 2 5 5 6 6 3
Tamil Nadu 96826 19018 37571 10407 2 0 3 9 5 7 7
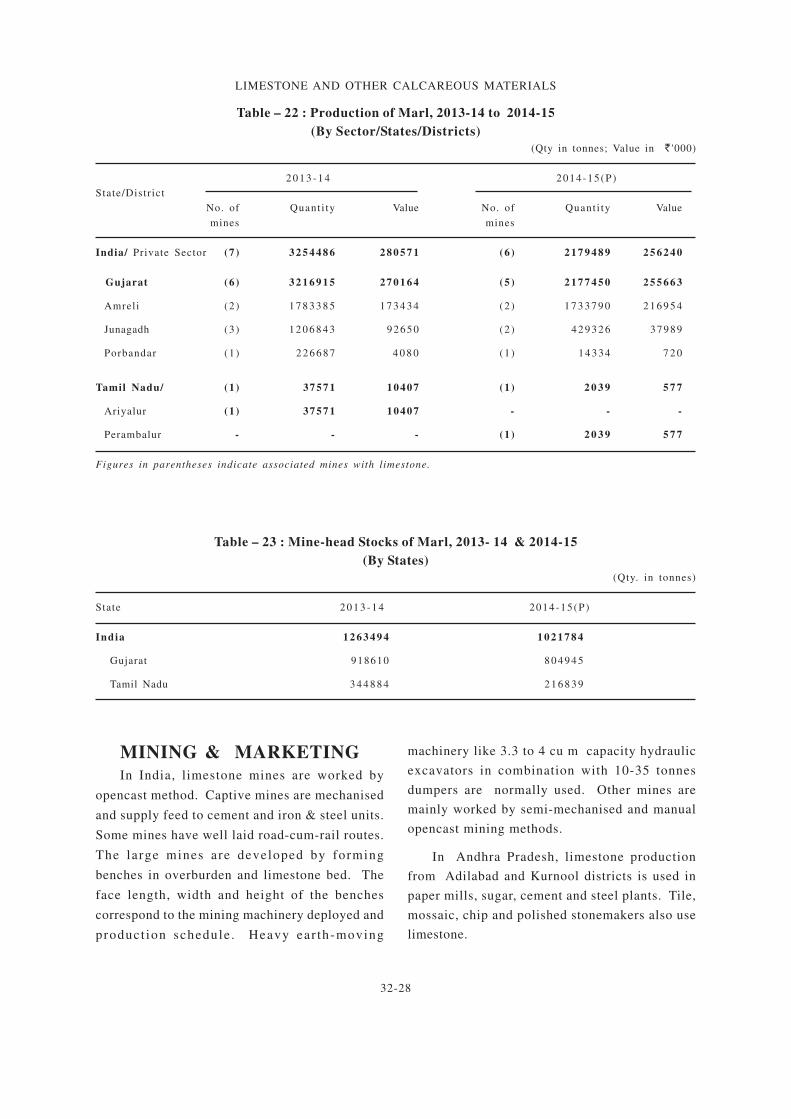
LIMESTONE AND OTHER CALCAREOUS MATERIALS
32-28
Table – 22 : Production of Marl, 2013-14 to 2014-15
(By Sector/States/Districts)
(Qty in tonnes; Value in L '000)
2 0 1 3 - 1 4 2014-15(P)
State/District
No. of Quant i ty Value No. of Quant i ty Value
mines mines
India/ Private Sector (7 ) 3 2 5 4 4 8 6 2 8 0 5 7 1 (6 ) 2 1 7 9 4 8 9 2 5 6 2 4 0
Gujarat (6 ) 3 2 1 6 9 1 5 2 7 0 1 6 4 (5 ) 2 1 7 7 4 5 0 2 5 5 6 6 3
Amreli (2 ) 1 7 8 3 3 8 5 1 7 3 4 3 4 (2 ) 1 7 3 3 7 9 0 2 1 6 9 5 4
Junagadh (3 ) 1 2 0 6 8 4 3 92650 (2 ) 4 2 9 3 2 6 37989
Porbandar (1 ) 2 2 6 6 8 7 4 0 8 0 (1 ) 14334 7 2 0
Tamil Nadu/ (1 ) 37571 10407 (1 ) 2 0 3 9 5 7 7
Ariyalur (1 ) 37571 10407 - - -
Perambalur - - - (1 ) 2 0 3 9 5 7 7
Figures in parentheses indicate associated mines with limestone.
Table – 23 : Mine-head Stocks of Marl, 2013- 14 & 2014-15
(By States)
(Qty. in tonnes)
State 2 0 1 3 - 1 4 2014-15(P)
India 1 2 6 3 4 9 4 1 0 2 1 7 8 4
Gujarat 918610 8 0 4 9 4 5
Tamil Nadu 3 4 4 8 8 4 2 1 6 8 3 9
MINING & MARKETING
In India, limestone mines are worked by
opencast method. Captive mines are mechanised
and supply feed to cement and iron & steel units.
Some mines have well laid road-cum-rail routes.
The large mines are developed by forming
benches in overburden and limestone bed. The
face length, width and height of the benches
correspond to the mining machinery deployed and
product ion schedule . Heavy ear th-moving
machinery like 3.3 to 4 cu m capacity hydraulic
excavators in combination with 10-35 tonnes
dumpers are normally used. Other mines are
mainly worked by semi-mechanised and manual
opencast mining methods.
In Andhra Pradesh, limestone production
from Adilabad and Kurnool districts is used in
paper mills, sugar, cement and steel plants. Tile,
mossaic, chip and polished stonemakers also use
limestone.
LIMESTONE AND OTHER CALCAREOUS MATERIALS
32-29
Limestone produced in Bihar is supplied
mainly to cement plants, foundries and lime kiln
units.
In Raipur and Durg districts of Chhattisgarh,
the limestone produced is suitable for Iron & Steel
Industry. The Bhilai Steel Plant obtains i ts
requirements of limestone from Nandini mines in
Durg district. The cement grade limestone is also
produced in the region and there is large cluster
of cement plants are in around Raipur.
Limestone produced in Gujarat is consumed
mainly in cement and chemical industries and also
in textile, foundries and steel plants. The dolomitic
limestone in Gujarat is used for making slabs and
tiles.
Limestone produced in Himachal Pradesh is
supplied to cement plants, paper industry, sugar
mills and lime kilns. The production from Bilaspur
district is despatched to fertilizer unit of National
Fertilizers Ltd, (NFL) at Naya Nangal.
Limestone produced in Jammu & Kashmir is
suitable for cement manufacturing.
In Karnataka, limestone is supplied generally
to paper mills and cement plants. However,
limestone of Kalaburgi district, commonly known
as 'Shahabad stones', is used as flag stone or
flooring stones.
Limestone from Madhya Pradesh is used in
cement, sugar, paper, steel and lime industries.
In Maharashtra, apart from cement and sugar
industries, limestone is used in Ferro-manganese
Industry as flux and also in Tanning Industry.
Limestone mined in Rajasthan is consumed
in capt ive cement p lants on a la rge sca le .
Limestone of Nagaur district is utilised as feed
for white cement plants as well as in steel plants
as low silica SMS grade flux and in Chemical
Industry. Crystalline limestone of Rajasthan is
widely known as a decorative ornamental stone.
The limestone worked in Bundi district and
Raghunathgarh in Jaipur district is an excellent
flagstone, for use as a paving stone.
The limestone produced in Dehradun-Garhwal
areas of Uttarakhand used to be supplied to
Sugar, Paper, Steel, Glass, Chemical and Cement
Industries in the past.
Limestone in Tamil Nadu is consumed by
various industries like Cement, Steel, Paper,
Foundry, Fertilizer and Chemicals.
Limeshell from Kerala is used mainly in
Chemical, Cement and White cement Industries.
It is also used in the manufacture of polyfibre
and in Tanning industry.
USESLimestone used for industrial purpose falls
under 'major mineral', while the use of limestone
in lime kilns and for building purposes comes
under 'minor mineral' as per Mines and Minerals
(Development and Regulation) Act, 1957.
The threshold value of limestone has been
revised by IBM, Notification in 2009, as follows:
(i) For limestone deposits in Chhattisgarh,
Gujarat, Himachal Pradesh, Madhya Pradesh,
Maharashtra, Rajasthan, Uttarakhand & Uttar
Pradesh - CaO - 34% (min), MgO - 4% (max).
(ii) For limestone deposits of Andhra Pradesh,
Jharkhand, Karnataka, Kerala, Odisha & Tamil
Nadu - CaO - 35% (min), MgO - 4% (max), SiO2 -
18% (max) & Alkalies - 0.5% (max).
The principal use of limestone is in the Cement
Industry. Other important uses are as flux in
metallurgical processes; in Glass, Ceramic, Paper,
Textile and Tanning Industries; for manufacture
of calcium carbide, alkali and bleaching powder;
for water purification and sugar refining; in
fertilizer (calcium ammonium nitrate) and as soil
conditioning agent in agriculture; crushed stone
for ballast and filler in concrete and asphalt; as
rectangular slab in lithography. The whiting (chalk
and precipitated limestone) is used as a filler in
rubber, oil cloth, paint, cosmetic, tooth paste, shoe
polish, etc. Limestone is also used in underground
mine dusting to prevent the propogation of
explosions.
Lime is prepared by heating limestone in kilns
up to 1000 OC. The CO2 released is effluxed and
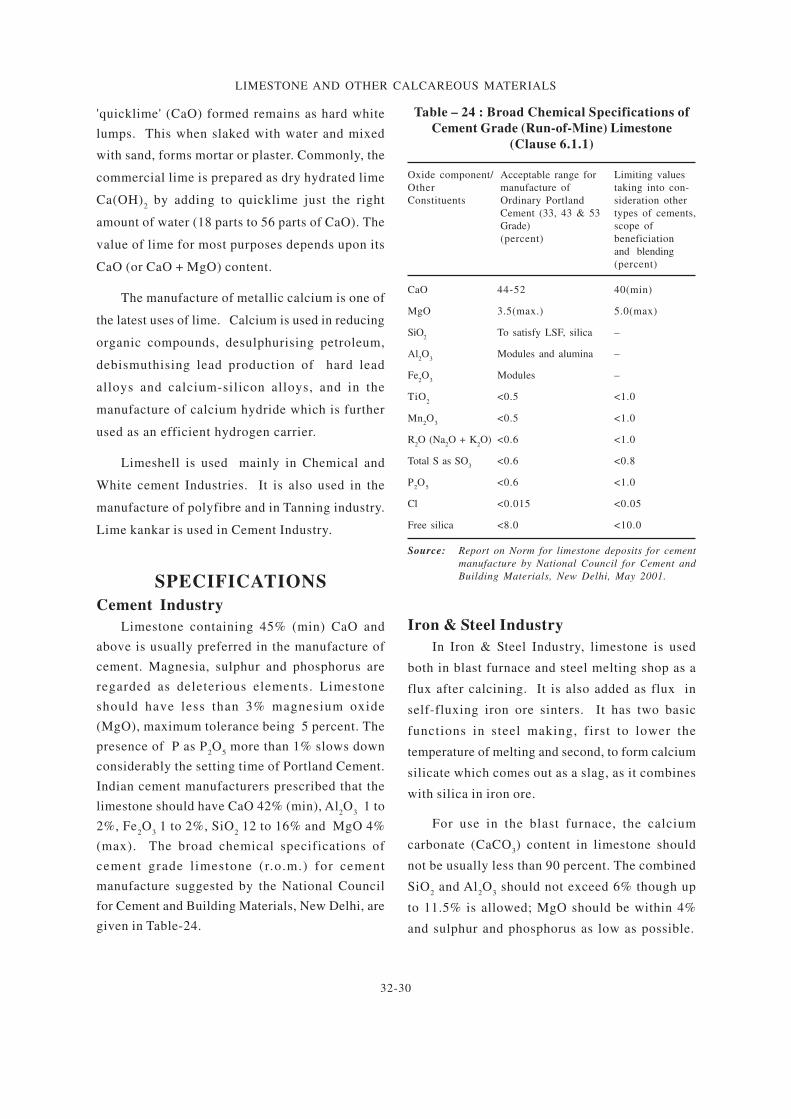
LIMESTONE AND OTHER CALCAREOUS MATERIALS
32-30
'quicklime' (CaO) formed remains as hard white
lumps. This when slaked with water and mixed
with sand, forms mortar or plaster. Commonly, the
commercial lime is prepared as dry hydrated lime
Ca(OH)2 by adding to quicklime just the right
amount of water (18 parts to 56 parts of CaO). The
value of lime for most purposes depends upon its
CaO (or CaO + MgO) content.
The manufacture of metallic calcium is one of
the latest uses of lime. Calcium is used in reducing
organic compounds, desulphurising petroleum,
debismuthising lead production of hard lead
alloys and calcium-silicon alloys, and in the
manufacture of calcium hydride which is further
used as an efficient hydrogen carrier.
Limeshell is used mainly in Chemical and
White cement Industries. It is also used in the
manufacture of polyfibre and in Tanning industry.
Lime kankar is used in Cement Industry.
SPECIFICATIONS
Cement Industry
Limestone containing 45% (min) CaO and
above is usually preferred in the manufacture of
cement. Magnesia, sulphur and phosphorus are
regarded as deleterious elements. Limestone
should have less than 3% magnesium oxide
(MgO), maximum tolerance being 5 percent. The
presence of P as P2O
5 more than 1% slows down
considerably the setting time of Portland Cement.
Indian cement manufacturers prescribed that the
limestone should have CaO 42% (min), Al2O
3 1 to
2%, Fe2O
3 1 to 2%, SiO
2 12 to 16% and MgO 4%
(max). The broad chemical specifications of
cement grade l imestone (r.o.m.) for cement
manufacture suggested by the National Council
for Cement and Building Materials, New Delhi, are
given in Table-24.
Table – 24 : Broad Chemical Specifications of
Cement Grade (Run-of-Mine) Limestone
(Clause 6.1.1)
Oxide component/ Acceptable range for Limiting values
Other manufacture of taking into con-
Constituents Ordinary Portland sideration other
Cement (33, 43 & 53 types of cements,
Grade) scope of
(percent) beneficiation
and blending
(percent)
CaO 44-52 40(min)
MgO 3.5(max.) 5.0(max)
SiO2
To satisfy LSF, silica –
Al2O
3Modules and alumina –
Fe2O
3Modules –
TiO2
<0.5 <1.0
Mn2O
3<0.5 <1.0
R2O (Na
2O + K
2O) <0.6 <1.0
Total S as SO3
<0.6 <0.8
P2O
5<0.6 <1.0
Cl <0.015 <0.05
Free silica <8.0 <10.0
Source: Report on Norm for limestone deposits for cement
manufacture by National Council for Cement and
Building Materials, New Delhi, May 2001.
Iron & Steel Industry
In Iron & Steel Industry, limestone is used
both in blast furnace and steel melting shop as a
flux after calcining. It is also added as flux in
self-fluxing iron ore sinters. It has two basic
functions in steel making, first to lower the
temperature of melting and second, to form calcium
silicate which comes out as a slag, as it combines
with silica in iron ore.
For use in the blast furnace, the calcium
carbonate (CaCO3) content in limestone should
not be usually less than 90 percent. The combined
SiO2 and Al
2O
3 should not exceed 6% though up
to 11.5% is allowed; MgO should be within 4%
and sulphur and phosphorus as low as possible.
LIMESTONE AND OTHER CALCAREOUS MATERIALS
32-31
In Steel Melting Shop (SMS), insolubles in
limestone should not exceed more than 4 percent.
Good fluxing limestone should naturally be low in
acid constituents like silica, alumina, sulphur and
phosphorus. Limestone should be dense, massive,
preferably fine-grained, compact and non-fritting
on burning.
BIS has prescr ibed specif icat ions for
flux grade limestone for use in steel plants as per
IS : 10345 - 2004 (Second Revision; Reaffirmed
2009).
Glass Industry
Glass Indus t ry requ i res h igh ca lc ium
limestone (94.5% CaCO3) and 97.5% of combined
CaCO3 and MgCO
3. Iron and other colouring
matters are regarded as objectionable and Fe2O
3
should be up to 0.20% (max). For colourless glass,
limestone should contain 98.5% CaCO3 (min), iron
content as Fe2O
3 should not be more than 0.04%;
and for bottle glass, Fe2O
3 up to 0.05% is used.
The BIS specifications (IS : 997 - 1973); First
Amendment, (Reaffirmed Feb.2013) for limestone
for use in Glass Industry are as follows:
Silica as SiO2
2.5%
Total iron (Fe2O
3)
a) Calcite or marble 0.05%
b) Limestone 0.10%
c) Dolomitic limestone or dolomite 0.15%
Lime (as CaO) 53.0%
Total lime and magnesia 54.50%
(as CaO + MgO)
Chemical Industry
The calcium carbide manufacturers generally
prefer lime containing 95% CaO (min) with
limitations of not more than 3% SiO2, not more
than 0.95% phosphorus and other impurities not
exceeding more than 2%. For the manufacture of
bleaching powder, lime containing 95% and
above CaO is required. Total Fe2O
3 +Al
2O
3+MnO
2
should be less than 2%; MgO should be below
2% and SiO2 less than 1.5%. Bleaching powder is
prepared by absorpt ion of chlor ine by dry
hydrated lime. The hydrated lime should not
contain more than 2% excess water. Iron and
manganese oxides lead to unsuitability of the
product and iron oxides tend to discolour the
b leached mate r ia l . Magnes ia renders the
bleaching powder hygroscopic. Silica and clay
impede solution and settling of bleaching powder.
BIS has prescribed specification for limestone
for use in chemical industry as per IS: 3204:1978
(First revision.Feb, 2009).
Sugar Industry
In Sugar Industry, lime is used for clarification
of cane and beet ju ice , v iz , removing the
impurities from the juice and also for precipitating
sugar from impurities. Milk of lime 1% in volume
of cane juice is added to pre-heated juice.
Limestone used in Sugar Industry must be high
in active lime (CaO 80% min), but low in iron,
alumina and silica. Magnesia should be less than
one percent. Excess silica is undesirable because
it separates as a gelatinous precipitate which
covers the sugar crystals and retards their growth
and filteration. Magnesia is objectionable because
magnesium carbonate is soluble in sugar juice.
Presence of iron tends to colour the finished
product.
The BIS spec i f ica t ions o f l imes tone
for chemica l indus t r ies a re fu rn i shed in
Table - 25.
Fertilizer Industry
Limestone is used only as carrier in the
manufacture of calcium ammonium nitrate fertilizer.
For this purpose, l imestone should contain
MgCO3+CaCO
3 85% (min), SiO
2 5% (max) and acid
insolubles 14% (max).
Foundry Industry
The chemical requirements of l imestone
for use in foundries as per BIS specification
(IS : 4140 -1978); has been withdrawn.
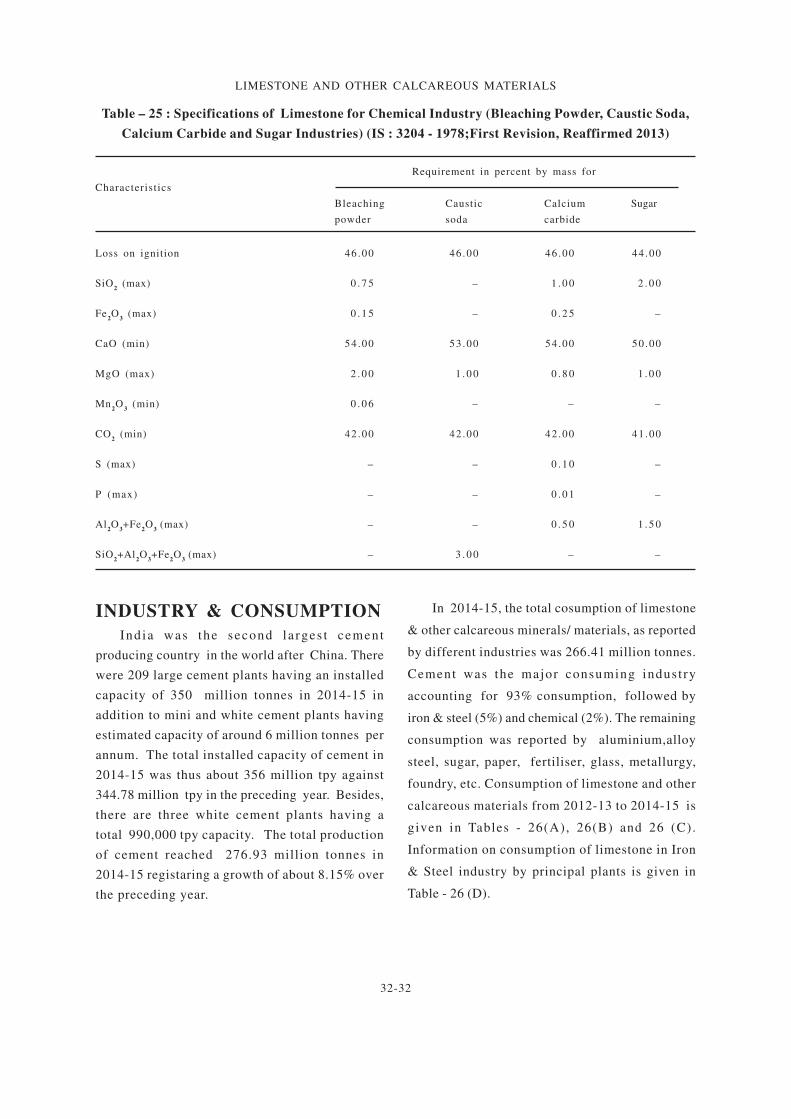
LIMESTONE AND OTHER CALCAREOUS MATERIALS
32-32
Table – 25 : Specifications of Limestone for Chemical Industry (Bleaching Powder, Caustic Soda,
Calcium Carbide and Sugar Industries) (IS : 3204 - 1978;First Revision, Reaffirmed 2013)
Requirement in percent by mass for
Characteristics
Bleaching Caustic Calcium Sugar
powder soda carbide
Loss on ignition 46 .00 46 .00 46 .00 44 .00
SiO2 (max) 0 . 7 5 – 1 . 0 0 2 . 0 0
Fe2O
3 (max) 0 . 1 5 – 0 . 2 5 –
CaO (min) 54 .00 53 .00 54 .00 50 .00
MgO (max) 2 . 0 0 1 . 0 0 0 . 8 0 1 . 0 0
Mn2O
3 (min) 0 . 0 6 – – –
CO2 (min) 42 .00 42 .00 42 .00 41 .00
S (max) – – 0 . 1 0 –
P (max) – – 0 . 0 1 –
Al2O
3+Fe
2O
3 (max) – – 0 . 5 0 1 . 5 0
SiO2+Al
2O
3+Fe
2O
3 (max) – 3 . 0 0 – –
INDUSTRY & CONSUMPTION
Ind ia was the second la rges t cement
producing country in the world after China. There
were 209 large cement plants having an installed
capacity of 350 million tonnes in 2014-15 in
addition to mini and white cement plants having
estimated capacity of around 6 million tonnes per
annum. The total installed capacity of cement in
2014-15 was thus about 356 million tpy against
344.78 million tpy in the preceding year. Besides,
there are three white cement plants having a
total 990,000 tpy capacity. The total production
of cement reached 276.93 million tonnes in
2014-15 registaring a growth of about 8.15% over
the preceding year.
In 2014-15, the total cosumption of limestone
& other calcareous minerals/ materials, as reported
by different industries was 266.41 million tonnes.
Cement was the major consuming industry
accounting for 93% consumption, followed by
iron & steel (5%) and chemical (2%). The remaining
consumption was reported by aluminium,alloy
steel, sugar, paper, fertiliser, glass, metallurgy,
foundry, etc. Consumption of limestone and other
calcareous materials from 2012-13 to 2014-15 is
given in Tables - 26(A), 26(B) and 26 (C).
Information on consumption of limestone in Iron
& Steel industry by principal plants is given in
Table - 26 (D).
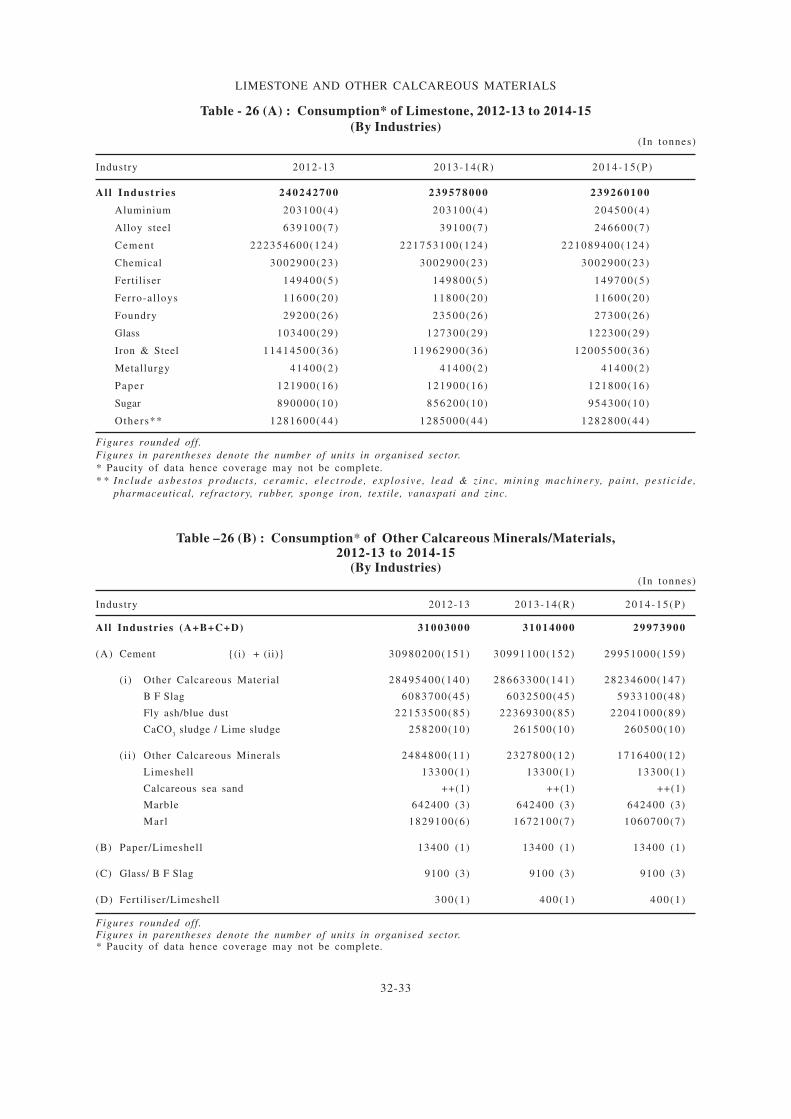
LIMESTONE AND OTHER CALCAREOUS MATERIALS
32-33
Table - 26 (A) : Consumption* of Limestone, 2012-13 to 2014-15
(By Industries)(In tonnes)
Industry 2012-13 2013-14(R) 2014-15(P)
All Industr ies 2 4 0 2 4 2 7 0 0 2 3 9 5 7 8 0 0 0 2 3 9 2 6 0 1 0 0
Aluminium 203100(4 ) 203100(4 ) 204500(4 )
Alloy steel 639100(7 ) 39100(7 ) 246600(7 )
Cement 222354600(124) 221753100(124) 221089400(124)
Chemical 3002900(23) 3002900(23) 3002900(23)
Fertiliser 149400(5 ) 149800(5 ) 149700(5 )
Ferro-alloys 11600(20 ) 11800(20 ) 11600(20 )
Foundry 29200(26 ) 23500(26 ) 27300(26 )
Glass 103400(29) 127300(29) 122300(29)
Iron & Steel 11414500(36 ) 11962900(36 ) 12005500(36 )
Metallurgy 41400(2 ) 41400(2 ) 41400(2 )
Paper 121900(16) 121900(16) 121800(16)
Sugar 890000(10) 856200(10) 954300(10)
Others** 1281600(44) 1285000(44) 1282800(44)
Figures rounded off.
Figures in parentheses denote the number of units in organised sector.
* Paucity of data hence coverage may not be complete.
* * Include asbes tos products , ceramic , e lec trode, explos ive , lead & z inc , mining machinery, paint , pes t ic ide ,
pharmaceutical, refractory, rubber, sponge iron, textile, vanaspati and zinc.
Table –26 (B) : Consumption* of Other Calcareous Minerals/Materials,2012-13 to 2014-15
(By Industries)(In tonnes)
Industry 2012-13 2013-14(R) 2014-15(P)
All Industries (A+B+C+D) 31003000 31014000 29973900
(A) Cement {(i) + (ii)} 30980200(151) 30991100(152) 29951000(159)
(i) Other Calcareous Material 28495400(140) 28663300(141) 28234600(147)
B F Slag 6083700(45) 6032500(45) 5933100(48)
Fly ash/blue dust 22153500(85 ) 22369300(85 ) 22041000(89 )
CaCO3 sludge / Lime sludge 258200(10) 261500(10) 260500(10)
(i i) Other Calcareous Minerals 2484800(11) 2327800(12) 1716400(12)
Limeshell 13300(1 ) 13300(1 ) 13300(1 )
Calcareous sea sand ++(1) ++(1) ++(1)
Marble 642400 (3) 642400 (3) 642400 (3)
Marl 1829100(6) 1672100(7) 1060700(7)
(B) Paper/Limeshell 13400 (1) 13400 (1) 13400 (1)
(C) Glass/ B F Slag 9100 (3) 9100 (3) 9100 (3)
(D) Fertiliser/Limeshell 300 (1 ) 400 (1 ) 400 (1 )
Figures rounded off.Figures in parentheses denote the number of units in organised sector.* Paucity of data hence coverage may not be complete.
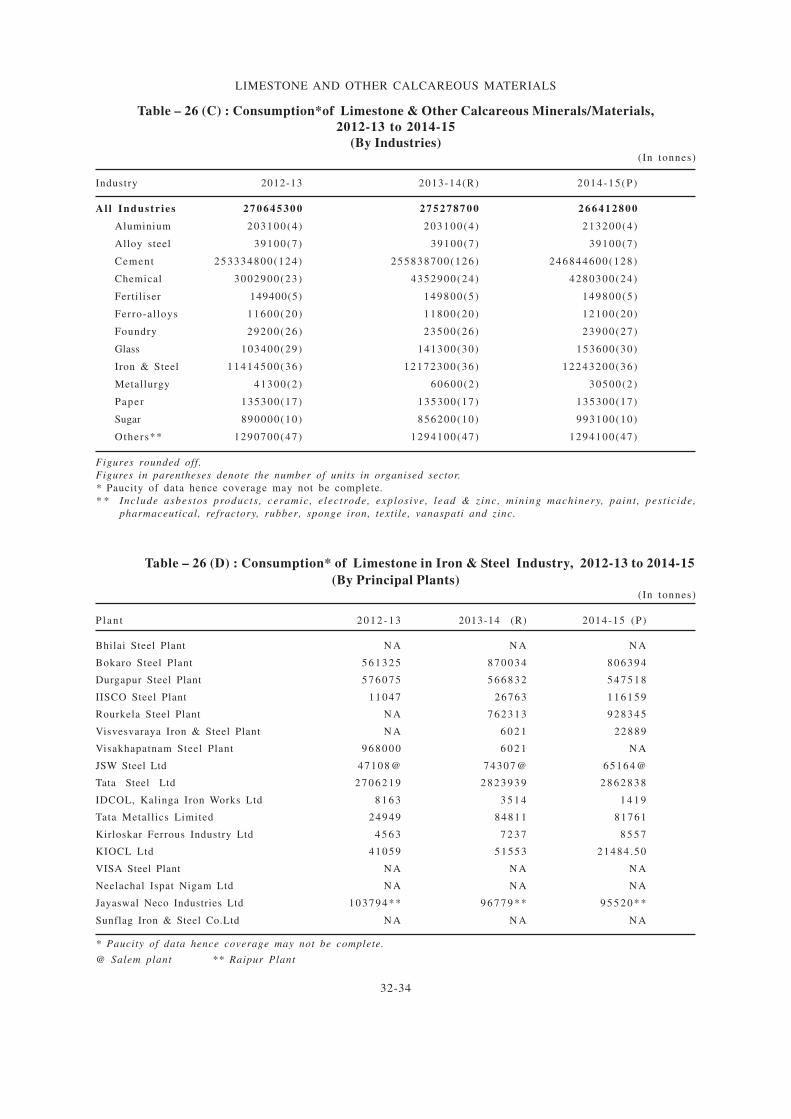
LIMESTONE AND OTHER CALCAREOUS MATERIALS
32-34
Table – 26 (D) : Consumption* of Limestone in Iron & Steel Industry, 2012-13 to 2014-15
(By Principal Plants)(In tonnes)
P lan t 2 0 1 2 - 1 3 2013-14 (R) 2014-15 (P)
Bhilai Steel Plant N A N A N A
Bokaro Steel Plant 5 6 1 3 2 5 8 7 0 0 3 4 8 0 6 3 9 4
Durgapur Steel Plant 5 7 6 0 7 5 5 6 6 8 3 2 5 4 7 5 1 8
IISCO Steel Plant 11047 26763 1 1 6 1 5 9
Rourkela Steel Plant N A 7 6 2 3 1 3 9 2 8 3 4 5
Visvesvaraya Iron & Steel Plant N A 6 0 2 1 22889
Visakhapatnam Steel Plant 9 6 8 0 0 0 6 0 2 1 N A
JSW Steel Ltd 47108@ 74307@ 65164@
Tata Steel Ltd 2 7 0 6 2 1 9 2 8 2 3 9 3 9 2 8 6 2 8 3 8
IDCOL, Kalinga Iron Works Ltd 8 1 6 3 3 5 1 4 1 4 1 9
Tata Metallics Limited 24949 84811 81761
Kirloskar Ferrous Industry Ltd 4 5 6 3 7 2 3 7 8 5 5 7
KIOCL Ltd 41059 51553 21484 .50
VISA Steel Plant N A N A N A
Neelachal Ispat Nigam Ltd N A N A N A
Jayaswal Neco Industries Ltd 103794** 9 6 7 7 9 * * 9 5 5 2 0 * *
Sunflag Iron & Steel Co.Ltd N A N A N A
Table – 26 (C) : Consumption*of Limestone & Other Calcareous Minerals/Materials,
2012-13 to 2014-15
(By Industries)(In tonnes)
Industry 2012-13 2013-14(R) 2014-15(P)
All Industr ies 2 7 0 6 4 5 3 0 0 2 7 5 2 7 8 7 0 0 2 6 6 4 1 2 8 0 0
Aluminium 203100(4 ) 203100(4 ) 213200(4 )
Alloy steel 39100(7 ) 39100(7 ) 39100(7 )
Cement 253334800(124) 255838700(126) 246844600(128)
Chemical 3002900(23) 4352900(24) 4280300(24)
Fertiliser 149400(5) 149800(5 ) 149800(5 )
Ferro-alloys 11600(20 ) 11800(20 ) 12100(20 )
Foundry 29200(26 ) 23500(26 ) 23900(27 )
Glass 103400(29) 141300(30) 153600(30)
Iron & Steel 11414500(36 ) 12172300(36 ) 12243200(36 )
Metallurgy 41300(2 ) 60600(2 ) 30500(2 )
Paper 135300(17) 135300(17) 135300(17)
Sugar 890000(10) 856200(10) 993100(10)
Others** 1290700(47) 1294100(47) 1294100(47)
Figures rounded off.
Figures in parentheses denote the number of units in organised sector.
* Paucity of data hence coverage may not be complete.
* * Include asbestos products , ceramic, e lectrode, explosive, lead & zinc, mining machinery, paint , pest ic ide,
pharmaceutical, refractory, rubber, sponge iron, textile, vanaspati and zinc.
* Paucity of data hence coverage may not be complete.
@ Salem plant ** Raipur Plant
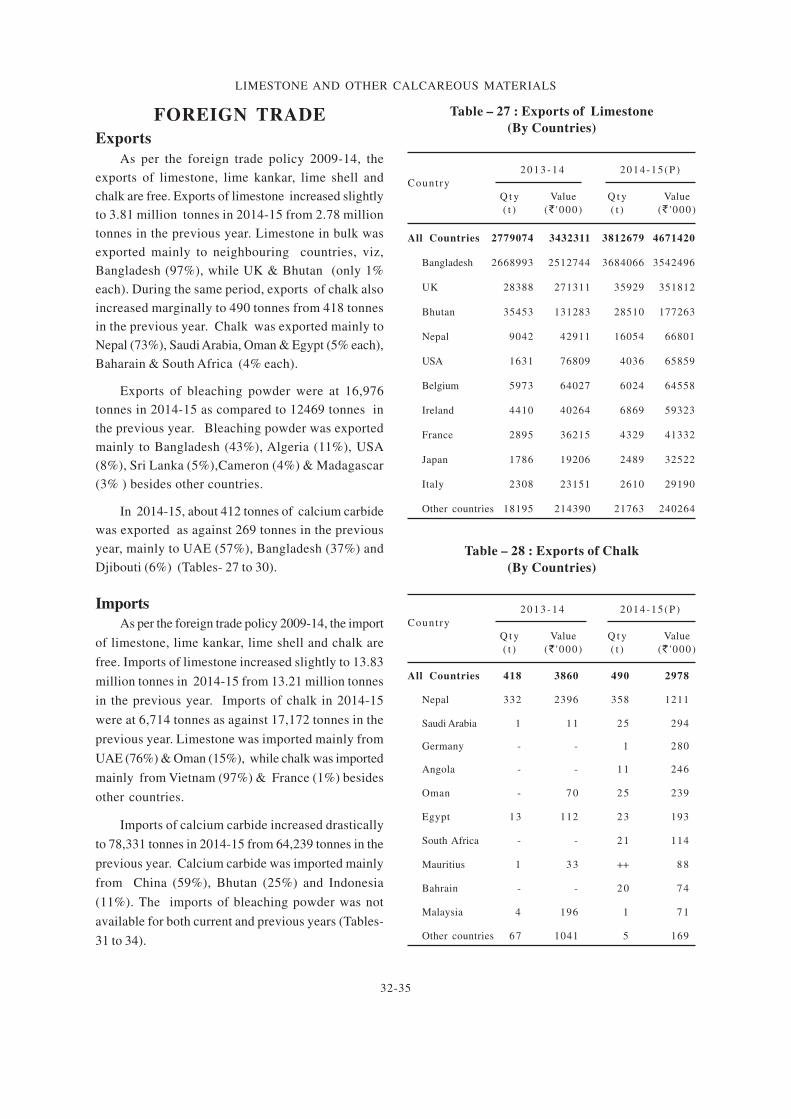
LIMESTONE AND OTHER CALCAREOUS MATERIALS
32-35
FOREIGN TRADE
Exports
As per the foreign trade policy 2009-14, the
exports of limestone, lime kankar, lime shell and
chalk are free. Exports of limestone increased slightly
to 3.81 million tonnes in 2014-15 from 2.78 million
tonnes in the previous year. Limestone in bulk was
exported mainly to neighbouring countries, viz,
Bangladesh (97%), while UK & Bhutan (only 1%
each). During the same period, exports of chalk also
increased marginally to 490 tonnes from 418 tonnes
in the previous year. Chalk was exported mainly to
Nepal (73%), Saudi Arabia, Oman & Egypt (5% each),
Baharain & South Africa (4% each).
Exports of bleaching powder were at 16,976
tonnes in 2014-15 as compared to 12469 tonnes in
the previous year. Bleaching powder was exported
mainly to Bangladesh (43%), Algeria (11%), USA
(8%), Sri Lanka (5%),Cameron (4%) & Madagascar
(3% ) besides other countries.
In 2014-15, about 412 tonnes of calcium carbide
was exported as against 269 tonnes in the previous
year, mainly to UAE (57%), Bangladesh (37%) and
Djibouti (6%) (Tables- 27 to 30).
Imports
As per the foreign trade policy 2009-14, the import
of limestone, lime kankar, lime shell and chalk are
free. Imports of limestone increased slightly to 13.83
million tonnes in 2014-15 from 13.21 million tonnes
in the previous year. Imports of chalk in 2014-15
were at 6,714 tonnes as against 17,172 tonnes in the
previous year. Limestone was imported mainly from
UAE (76%) & Oman (15%), while chalk was imported
mainly from Vietnam (97%) & France (1%) besides
other countries.
Imports of calcium carbide increased drastically
to 78,331 tonnes in 2014-15 from 64,239 tonnes in the
previous year. Calcium carbide was imported mainly
from China (59%), Bhutan (25%) and Indonesia
(11%). The imports of bleaching powder was not
available for both current and previous years (Tables-
31 to 34).
Table – 27 : Exports of Limestone
(By Countries)
2 0 1 3 - 1 4 2014-15(P)
Count ry
Q t y Value Q t y Value
( t ) (` ' 000) ( t ) (` ' 000)
All Countries 2779074 3432311 3812679 4671420
Bangladesh 2668993 2512744 3684066 3542496
UK 28388 271311 35929 351812
Bhutan 35453 131283 28510 177263
Nepal 9042 42911 16054 66801
USA 1631 76809 4036 65859
Belgium 5973 64027 6024 64558
Ireland 4410 40264 6869 59323
France 2895 36215 4329 41332
Japan 1786 19206 2489 32522
Italy 2308 23151 2610 29190
Other countries 18195 214390 21763 240264
Table – 28 : Exports of Chalk
(By Countries)
2 0 1 3 - 1 4 2014-15(P)
Count ry
Q t y Value Q t y Value
( t ) (` ' 000) ( t ) (` ' 000)
All Countries 418 3860 490 2978
Nepal 332 2396 358 1211
Saudi Arabia 1 11 25 294
Germany - - 1 280
Angola - - 11 246
Oman - 70 25 239
Egypt 13 112 23 193
South Africa - - 21 114
Mauritius 1 33 ++ 88
Bahrain - - 20 74
Malaysia 4 196 1 71
Other countries 67 1041 5 169
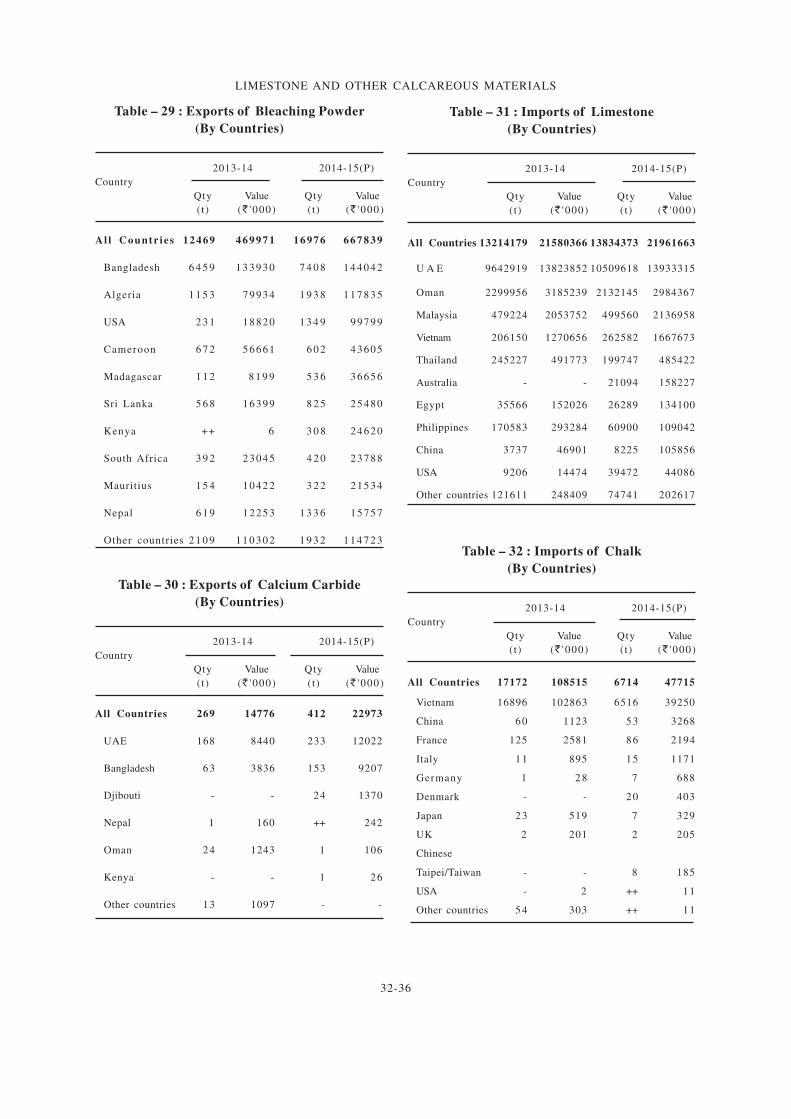
LIMESTONE AND OTHER CALCAREOUS MATERIALS
32-36
Table – 29 : Exports of Bleaching Powder
(By Countries)
2013-14 2014-15(P)
Country
Qty Value Qty Value
(t) (` ' 000) (t) (` ' 000)
Al l Countr ies 12469 4 6 9 9 7 1 16976 6 6 7 8 3 9
Bangladesh 6 4 5 9 1 3 3 9 3 0 7 4 0 8 1 4 4 0 4 2
Algeria 1 1 5 3 79934 1 9 3 8 1 1 7 8 3 5
USA 2 3 1 18820 1 3 4 9 99799
Cameroon 6 7 2 56661 6 0 2 43605
Madagascar 1 1 2 8 1 9 9 5 3 6 36656
Sri Lanka 5 6 8 16399 8 2 5 25480
Kenya ++ 6 3 0 8 24620
South Africa 3 9 2 23045 4 2 0 23788
Mauritius 1 5 4 10422 3 2 2 21534
Nepal 6 1 9 12253 1 3 3 6 15757
Other countries 2 1 0 9 1 1 0 3 0 2 1 9 3 2 1 1 4 7 2 3
Table – 30 : Exports of Calcium Carbide
(By Countries)
2013-14 2014-15(P)
Country
Qty Value Qty Value
(t) (` ' 000) (t) (` ' 000)
All Countries 269 14776 412 22973
UAE 168 8440 233 12022
Bangladesh 63 3836 153 9207
Djibouti - - 24 1370
Nepal 1 160 ++ 242
Oman 24 1243 1 106
Kenya - - 1 26
Other countries 13 1097 - -
Table – 31 : Imports of Limestone
(By Countries)
2013-14 2014-15(P)
Country
Qty Value Qty Value
(t) (` ' 000) (t) (` ' 000)
All Countries 13214179 21580366 13834373 21961663
U A E 9642919 13823852 10509618 13933315
Oman 2299956 3185239 2132145 2984367
Malaysia 479224 2053752 499560 2136958
Vietnam 206150 1270656 262582 1667673
Thailand 245227 491773 199747 485422
Australia - - 21094 158227
Egypt 35566 152026 26289 134100
Philippines 170583 293284 60900 109042
China 3737 46901 8225 105856
USA 9206 14474 39472 44086
Other countries 121611 248409 74741 202617
Table – 32 : Imports of Chalk
(By Countries)
2013-14 2014-15(P)
Country
Qty Value Qty Value
(t) (` ' 000) (t) (` ' 000)
All Countries 17172 108515 6714 47715
Vietnam 16896 102863 6516 39250
China 60 1123 53 3268
France 125 2581 86 2194
Italy 11 895 15 1171
Germany 1 28 7 688
Denmark - - 20 403
Japan 23 519 7 329
UK 2 201 2 205
Chinese
Taipei/Taiwan - - 8 185
USA - 2 ++ 11
Other countries 54 303 ++ 11
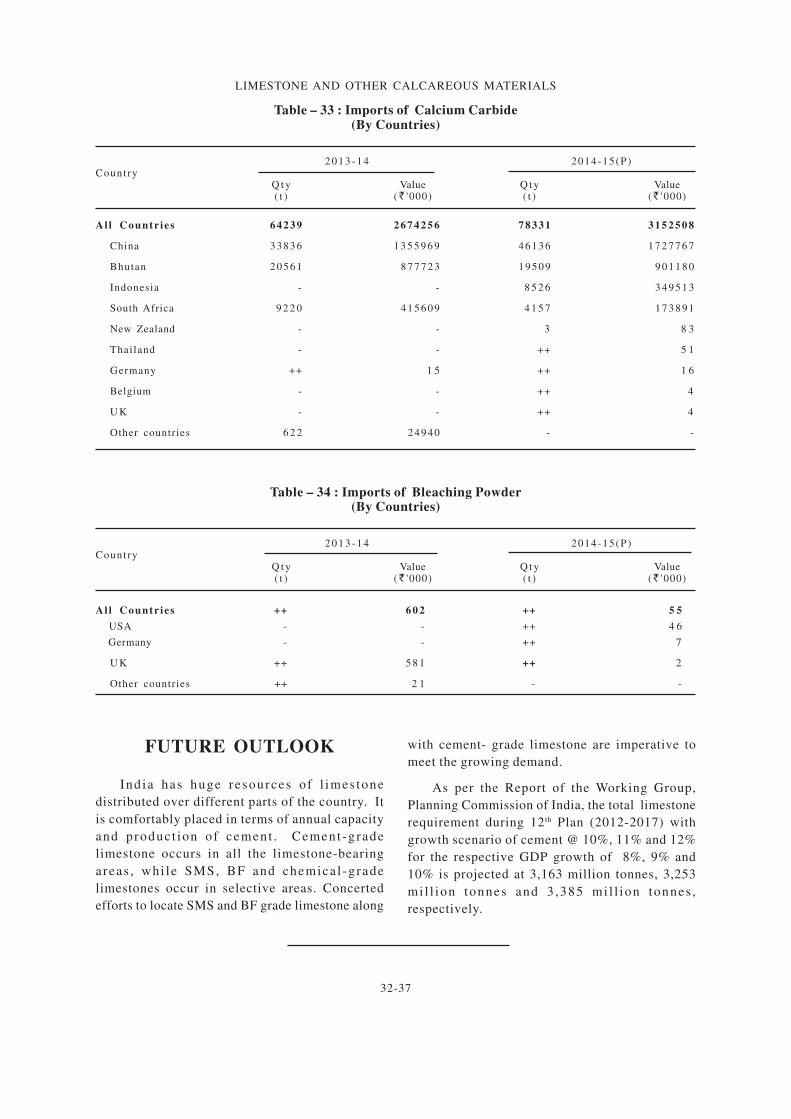
LIMESTONE AND OTHER CALCAREOUS MATERIALS
32-37
Table – 33 : Imports of Calcium Carbide(By Countries)
2 0 1 3 - 1 4 2014-15(P)Count ry
Q t y Value Q t y Value( t ) (L '000) ( t ) (L '000)
Al l Countr ies 64239 2 6 7 4 2 5 6 78331 3 1 5 2 5 0 8
China 33836 1 3 5 5 9 6 9 46136 1 7 2 7 7 6 7
Bhutan 20561 8 7 7 7 2 3 19509 9 0 1 1 8 0
Indonesia - - 8 5 2 6 3 4 9 5 1 3
South Africa 9 2 2 0 4 1 5 6 0 9 4 1 5 7 1 7 3 8 9 1
New Zealand - - 3 8 3
Thailand - - ++ 5 1
Germany ++ 1 5 ++ 1 6
Belgium - - ++ 4
U K - - ++ 4
Other countries 6 2 2 24940 - -
FUTURE OUTLOOK
Ind ia has huge resources o f l imes tone
distributed over different parts of the country. It
is comfortably placed in terms of annual capacity
and produc t ion of cement . Cement -grade
limestone occurs in all the limestone-bearing
areas , whi le SMS, BF and chemica l -grade
limestones occur in selective areas. Concerted
efforts to locate SMS and BF grade limestone along
with cement- grade limestone are imperative to
meet the growing demand.
As per the Report of the Working Group,
Planning Commission of India, the total limestone
requirement during 12 th Plan (2012-2017) with
growth scenario of cement @ 10%, 11% and 12%
for the respective GDP growth of 8%, 9% and
10% is projected at 3,163 million tonnes, 3,253
mi l l ion tonnes and 3 ,385 mi l l ion tonnes ,
respectively.
Table – 34 : Imports of Bleaching Powder(By Countries)
2 0 1 3 - 1 4 2014-15(P)Count ry
Q t y Value Q t y Value( t ) (L '000) ( t ) (L '000)
Al l Countr ies ++ 6 0 2 ++ 5 5
USA - - ++ 4 6
Germany - - ++ 7
U K ++ 5 8 1 ++ 2
Other countries ++ 2 1 - -