modelling unsaturated moisture transport in heterogeneous limestone
TRANSCRIPT
Transport in Porous Media 52: 333–350, 2003.© 2003 Kluwer Academic Publishers. Printed in the Netherlands.
333
Modelling Unsaturated Moisture Transportin Heterogeneous Limestone(Part 1. A Mesoscopic Approach)
STAF ROELS∗, JAN CARMELIET and HUGO HENSDepartment of Civil Engineering, Catholic University of Leuven, Kasteelpark Arenberg 51, B-3001Leuven, Belgium
(Received: 13 August 2001; in final form: 2 May 2002)
Abstract. In this paper we investigate the influence of microheterogeneity on the phenomenologicalmacroscopic material properties. The material analysed is Savonnières: a French layered oolitic lime-stone. Due to the complex microstructure of the material the moisture permeability cannot uniquelybe determined based on indirect measurement data. To overcome this problem we present an up-scaling technique based on the modelling of transport phenomena on the mesoscale. The techniqueallows to determine an equivalent macroscopic permeability based on the geometric configurationand the permeability of the composing constituents.
Key words: microheterogeneous, mesoscopic modelling, upscaling technique, moisturepermeability, equivalent permeability.
1. Introduction
The most common way to model moisture transfer phenomena in porous mediais the continuum approach (Whitaker, 1977; Bear and Bachmat, 1990). It assumesthat the physical properties of the porous medium can be associated with math-ematical field variables, whose time and space dependencies are represented inthe form of differential balance equations of mass, momentum and energy. In thisstudy we limit to unsaturated moisture transfer under isothermal conditions. Themoisture transport in an open porous medium can then be written by the followingwell-known differential equation:
∂w
∂t= −c(pc)
∂pc
∂t= −∇T (k∇pc) (1)
with w the moisture content (kg/m3), pc the capillary pressure (Pa),c(pc) = |∂w/∂pc| the moisture capacity (kg/m3 Pa) and k(pc) the unsaturatedpermeability (s). Hence, modelling moisture flow requires the knowledge of theappropriate non-linear constitutive equations: the moisture permeability k(pc) and
∗Author for correspondence: Tel.: +32-16-321348; Fax: +32-16-321980;e-mail: [email protected]
334 STAF ROELS ET AL.
the moisture retention curve w(pc). The latter describes the moisture content w asa function of the driving potential. It can be determined combining different tech-niques, such as hygroscopic measurements, pressure membrane apparatus results,mercury intrusion porosimetry, etc. The moisture permeability is more difficult toobtain. Three common techniques can be distinguished to determine the moisturepermeability of porous materials: using analytic expressions, inverse methods andnetwork models.
Several simple analytic relationships between unsaturated moisture permeabilityand moisture content can be found in literature (e.g. Gardner, 1958; Brooks andCorey, 1966; Mualem, 1976; van Genuchten, 1978). However, as can be expected,the use of these analytic expressions has limited validity. Simplified analytic ex-pressions do not provide universal solutions that can be used to describe multipleassociated phenomena such as wetting and drying (Carmeliet and Roels, 2001).Furthermore, Bear et al. (1987) have shown, by computer simulations on a 3D-network of capillary tubes with random radii, that the unsaturated moisturepermeability in the different directions will have a different relationship to satura-tion. Consequently, most simple analytic relations are only valid for homogeneousisotropic media.
Inverse methods are used to determine the moisture permeability from mea-sured transient moisture content profiles in one-dimensional imbibition or dryingexperiments. Best known is the Boltzmann transform method (Cranck, 1989), usedon gamma-ray or NMR-results (Pel, 1995; Descamps, 1997). Disadvantage of themethod is that it requires, besides a constant moisture content at the boundary anda uniform initial moisture content, a semi-infinite homogeneous medium, which isan unreasonable assumption for a lot of materials.
A third common method is the use of network models. Network models arebased on the idea that the pore space may be represented by an interconnected net-work of capillary tubes or chambers and throats. They were first introduced by Fatt(1956) and in a later stage combined with percolation concepts (Diaz et al., 1987;Sahimi, 1993). Only recently, network models became popular to predict the mois-ture permeability of porous materials (Neimark, 1989; Xu et al., 1997). To accountfor the broad pore size distribution of most porous building materials, resultingin a highly non-linear permeability, Carmeliet et al. (1999) proposed a multiscaleapproach based on the concept of examining the porous space at different levels ofmagnification. Using a network model requires that the typical microstructure ofthe material can be incorporated in a conceptual way. For (micro) heterogeneousmaterials this is not so obvious. To overcome the problem we present a techniquebased on modelling the moisture transfer on an intermediate level: the mesoscale.
The use of numerical simulations on a mesoscale in order to gain insight intothe material behaviour and to obtain more realistic simulations at macroscopic levelis not new. In the field of concrete, ‘numerical concrete’, developed by Wittmannet al. (1984) and Roelfstra et al. (1985) has already shown encouraging results.Wittmann et al. (1984) showed that the shrinkage and creep of composite porous
MODELLING MOISTURE TRANSPORT IN LIMESTONE 335
materials can be simulated realistically using generated mesostructures to accountfor the typical concrete heterogeneity of embedded aggregates in a cement matrix.More recently Schlangen (1993) and Vervuurt (1997) developed a mesoscopic lat-tice model to investigate the fracture behaviour of concrete. Our aim in this paperis to apply the mesoscopic approach to model unsaturated moisture transport inmicroheterogeneous porous building materials.
The paper starts with a brief description of the material investigated:Savonnières limestone. Then, a technique to model the transient moisture transferin Savonnières on the mesolevel is presented. The mesodomains are obtained fromscanning electron microscopy (SEM) images. In the last part we use the samemesoscopic scale to determine an equivalent macroscopic permeability based onthe geometric configuration and the permeability of the constituents. In “Modellingunsaturated moisture transport in heterogeneous limestone. Part 2. Macroscopicsimulations” (Roels et al., 2003) the predicted permeability curves will be used forone- and two-dimensional simulations on the macroscale.
2. Savonnières Limestone
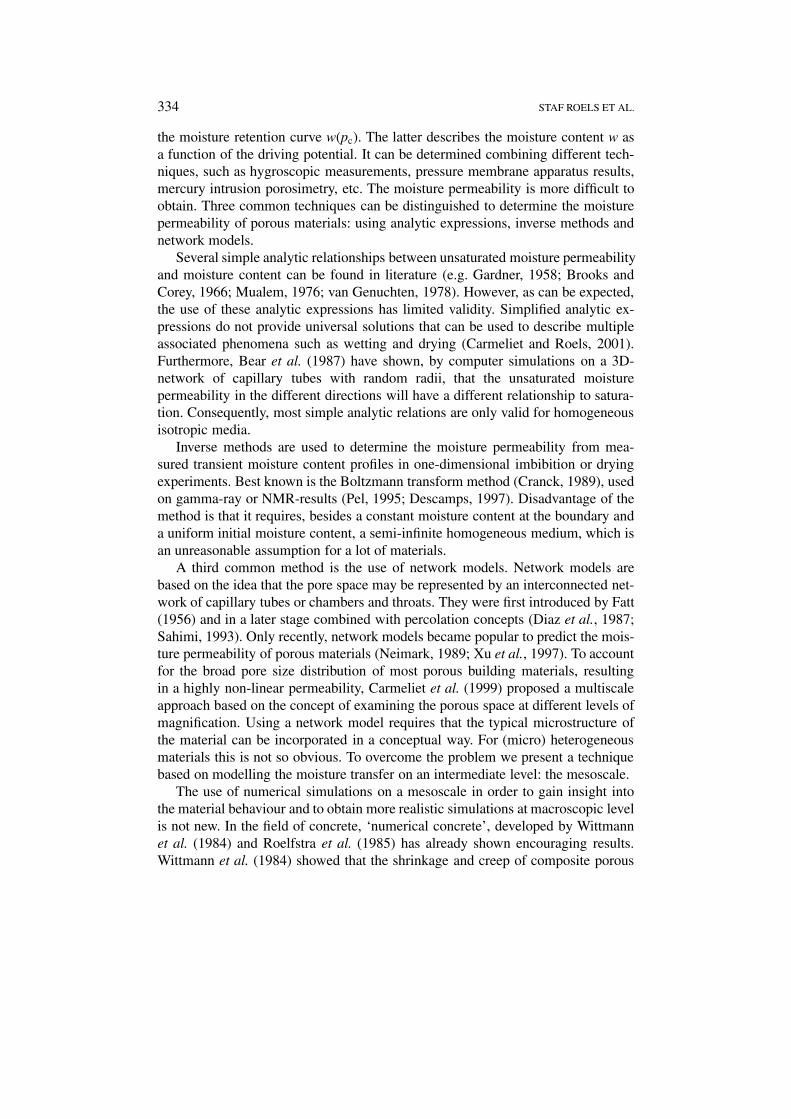
To investigate the effect of heterogeneity on unsaturated moisture transfer in porousmaterials we performed measurements and simulations on Savonnières limestone.Savonnières limestone is found in France and commonly used as building stone.The stone is characterised by both micro- and macroheterogeneity (Figure 1). Thediagenetic processes during the formation of the stone caused a very complex mi-crostructure. In addition, discrete layers consisting of small bivalve shell moulds
Figure 1. The different levels of observation, illustrated for Savonnieres limestone.
336 STAF ROELS ET AL.
are present, which act as preferential flow channels during moisture uptake. Theresult is a macroscopic layered structure, consisting of two subgroups with differentmoisture transfer properties (Roels et al., 2000).
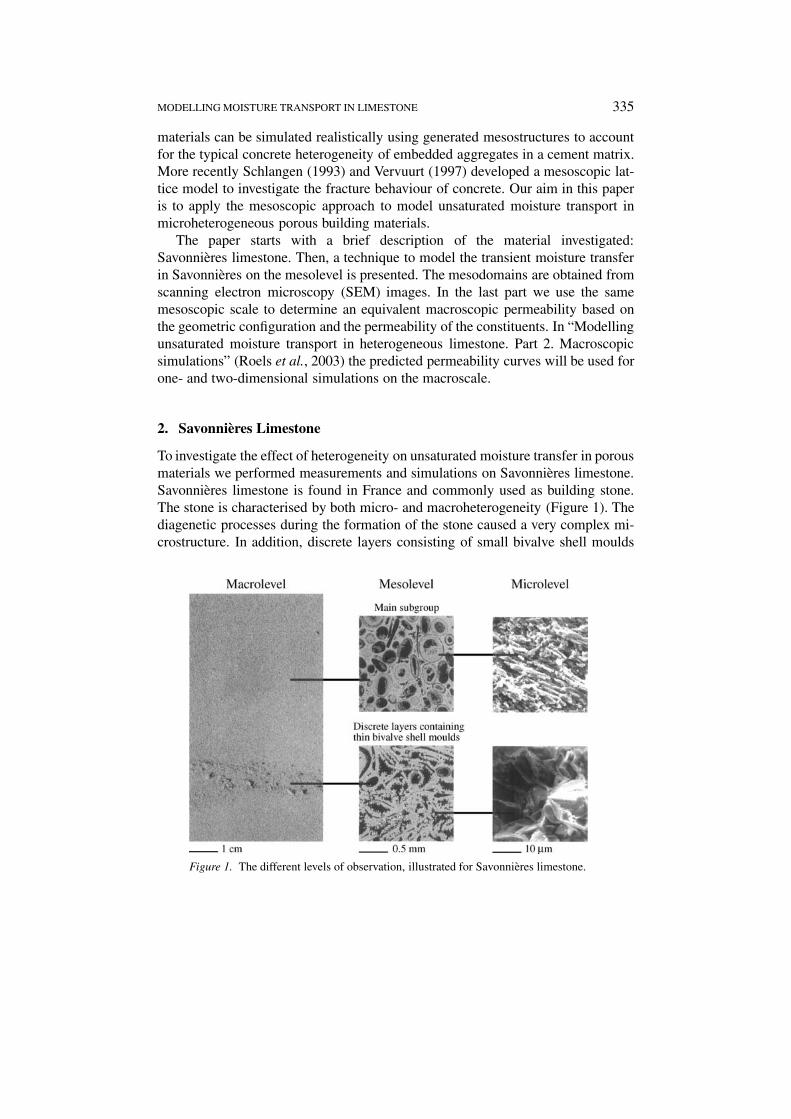
The SEM-graph in Figure 2 illustrates the typical visual representation of thepore structure of the main subgroup. The material is composed of ooliths, sphericalgrains, which have been cemented. The ooliths are developed around a nucleus andshow a radial and concentric structure. Some of the ooliths are intact but most ofthem are poorly preserved. The hollows (5), forming the mouldic macroporsity,can assume all proportions: from only the centre of the oolith to almost the entire
Figure 2. Top: SEM-image of Savonnieres limestone; showing the pores in black. (1–2)intra-granular microporosity, (3) intergranular mesopores, (4) intergranular macroporosityand (5) mouldic porosity. Bottom: pore volume distribution fv(r) as a function of pore rad-ius for Savonnieres limestone. The numbers correspond to the constituents on the SEM-graph.
MODELLING MOISTURE TRANSPORT IN LIMESTONE 337
oolith, leaving only the perimeter intact. The grain walls consist of fine porouscalcite (1–2). The ooliths are embedded in a mesoporous calcite paste (3), whereintriangular-shaped intergranular macropores appear (4).
The pore volume distribution of both layers of Savonnières is determined bythe following procedure. First the main wetting and main drainage moisture re-tention curves are determined using classical techniques, such as mercury porosi-metry, pressure membrane apparatus, sorption isotherm and micrograph imageanalysis. Then, using a conceptual hysteresis model the pore volume distributionof the different components: the macropores, the calcite paste, grain walls and shellmoulds is determined (Roels et al., 2001). Figure 2 shows the obtained pore volumedistribution as a function of pore radius for the main subgroup. The numberscorrespond to the constituents on the SEM-graph.
3. Mesoscopic Modelling of Transient Moisture Transfer
For the modelling of moisture transport in Savonnières limestone at mesoscale weuse the continuum approach. The mesoscale structures obtained from the SEM-images, serve as a basis. This means that we limit the modelling to two-dimensional.Main disadvantage is that we lose some information about the connectivity. It isobvious that in a 3D-structure representation the ooliths will touch each other,while this will seldom be the case in a 2D-representation. However, since thesecontact zones are small, we can assume that this will be of minor importanceand that the phenomena are well incorporated in the 2D-simulations. The mainadvantage of the 2D-model, on the other hand, is that, by starting from real im-ages, no assumption is made about the distribution of ooliths, macropores and shellmoulds.
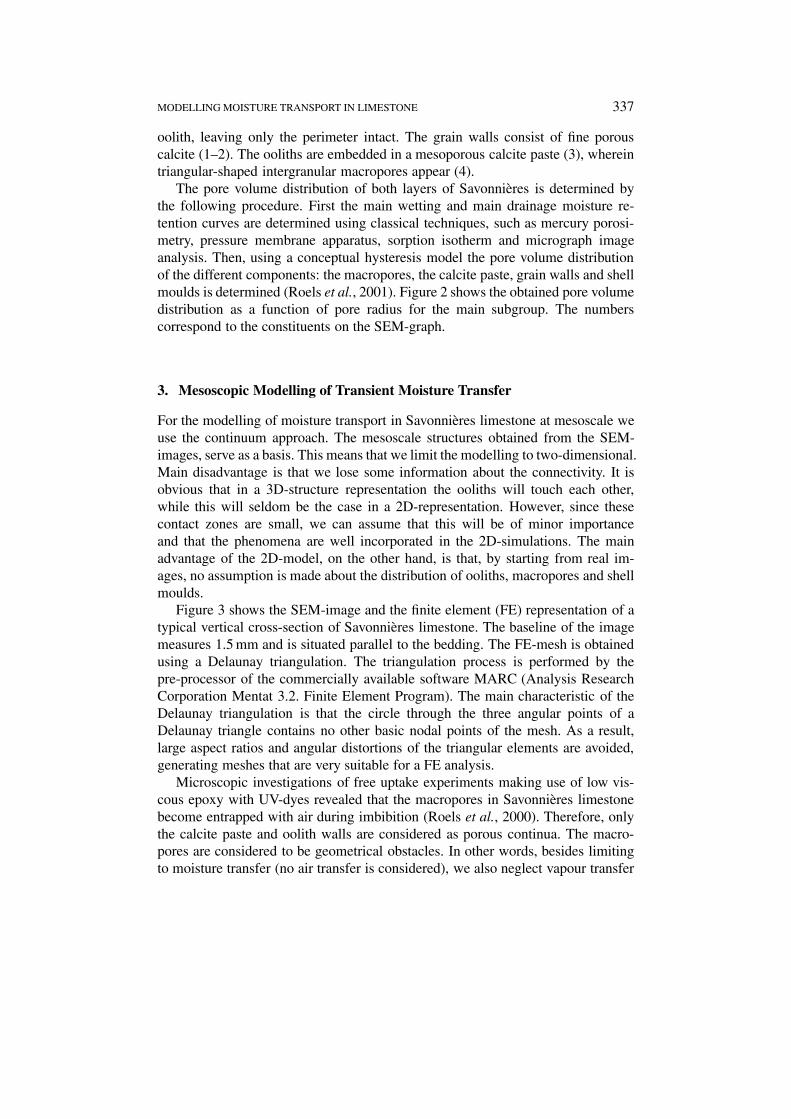
Figure 3 shows the SEM-image and the finite element (FE) representation of atypical vertical cross-section of Savonnières limestone. The baseline of the imagemeasures 1.5 mm and is situated parallel to the bedding. The FE-mesh is obtainedusing a Delaunay triangulation. The triangulation process is performed by thepre-processor of the commercially available software MARC (Analysis ResearchCorporation Mentat 3.2. Finite Element Program). The main characteristic of theDelaunay triangulation is that the circle through the three angular points of aDelaunay triangle contains no other basic nodal points of the mesh. As a result,large aspect ratios and angular distortions of the triangular elements are avoided,generating meshes that are very suitable for a FE analysis.
Microscopic investigations of free uptake experiments making use of low vis-cous epoxy with UV-dyes revealed that the macropores in Savonnières limestonebecome entrapped with air during imbibition (Roels et al., 2000). Therefore, onlythe calcite paste and oolith walls are considered as porous continua. The macro-pores are considered to be geometrical obstacles. In other words, besides limitingto moisture transfer (no air transfer is considered), we also neglect vapour transfer
338 STAF ROELS ET AL.
Figure 3. Top: SEM-graph of Savonnieres limestone and the corresponding FE-mesh,bottom: saturation contours after 0.5 s (left) and 4 s (right), simulating imbibition from the leftside.
in the macropores. Furthermore, we ignore possible corner flow and surface flowin the macropores.
Modelling the transport phenomena at mesoscale requires the knowledge of themoisture retention curve and the permeability curve of the different constituents(oolith walls and calcite paste). The moisture retention curve of each constitu-ent can easily be obtained from the pore volume distribution (Roels, 2000). Themoisture permeability of oolith walls and calcite paste is more difficult to obtain.No direct or indirect measurement technique can be applied. However, since weknow the apparent pore volume distribution of each constituent and, assumingeach constituent as homogeneous and isotropic, we can use a static network model(Carmeliet et al., 1999) to predict the moisture permeability of the oolith walls and
MODELLING MOISTURE TRANSPORT IN LIMESTONE 339
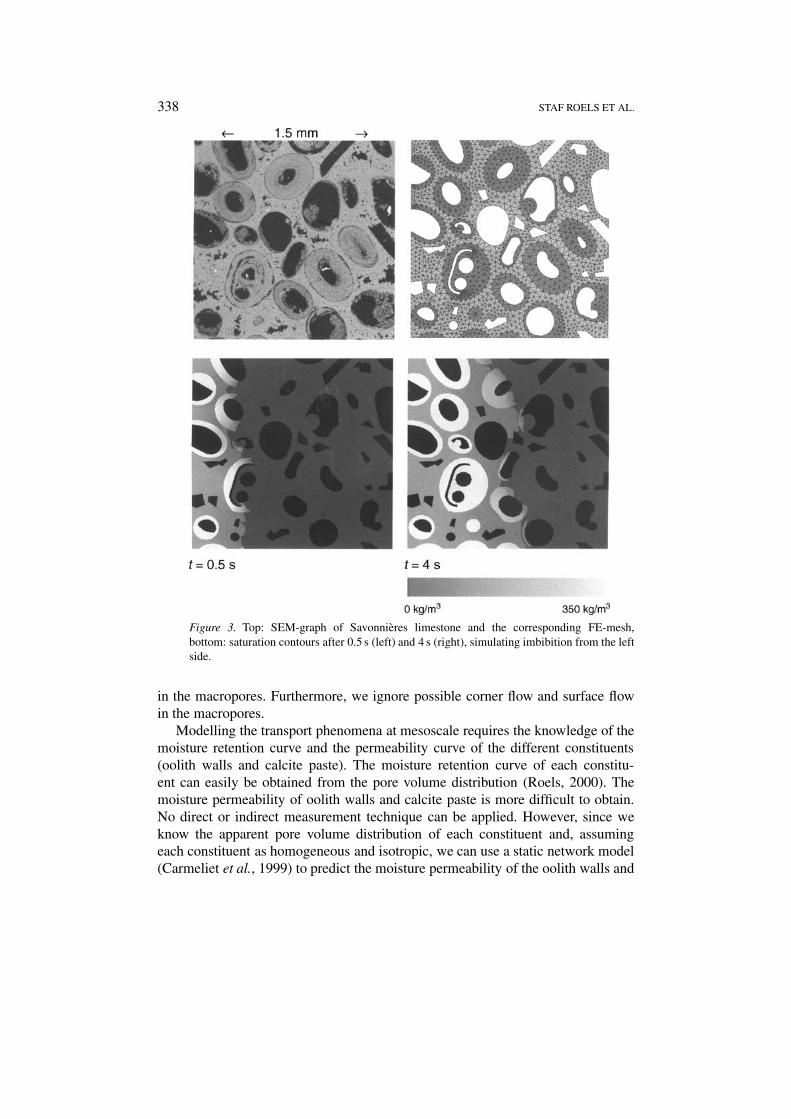
Figure 4. Top: moisture retention curve (continuous line) and corresponding apparent porevolume distribution fv(r) (dotted line) of the oolith walls and calcite paste and bottom:permeability curves as determined with a static network model (Carmeliet et al., 1999).
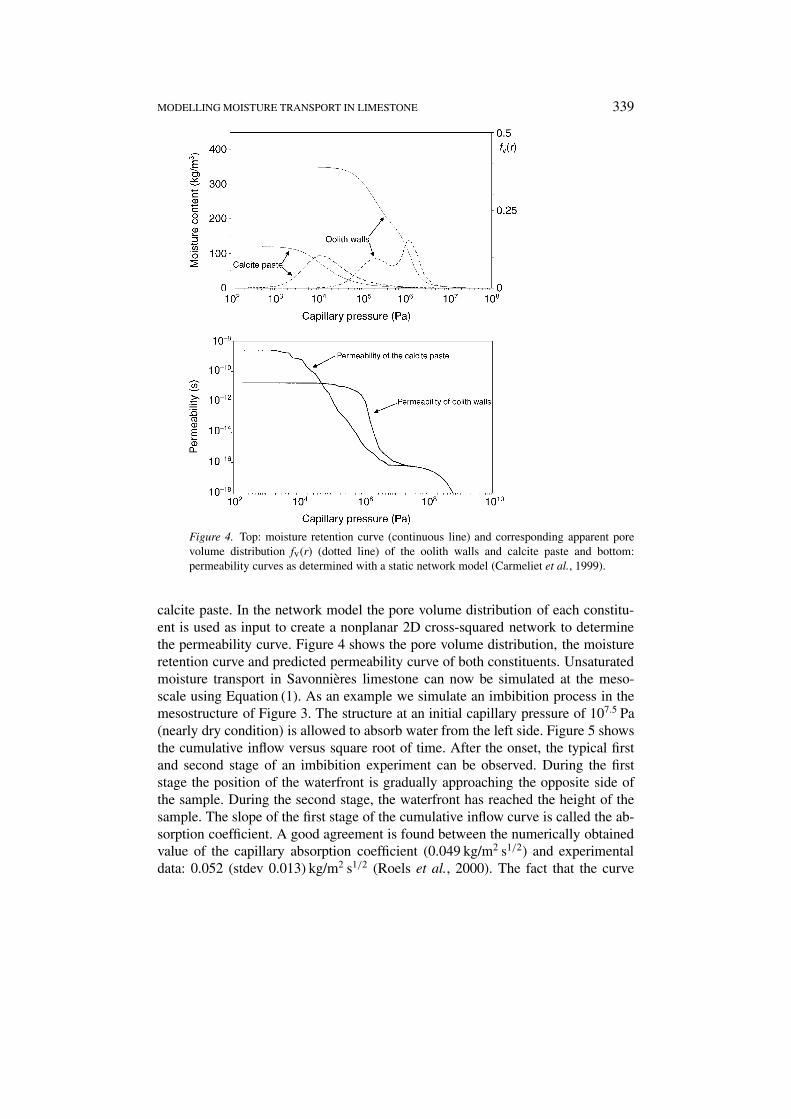
calcite paste. In the network model the pore volume distribution of each constitu-ent is used as input to create a nonplanar 2D cross-squared network to determinethe permeability curve. Figure 4 shows the pore volume distribution, the moistureretention curve and predicted permeability curve of both constituents. Unsaturatedmoisture transport in Savonnières limestone can now be simulated at the meso-scale using Equation (1). As an example we simulate an imbibition process in themesostructure of Figure 3. The structure at an initial capillary pressure of 107.5 Pa(nearly dry condition) is allowed to absorb water from the left side. Figure 5 showsthe cumulative inflow versus square root of time. After the onset, the typical firstand second stage of an imbibition experiment can be observed. During the firststage the position of the waterfront is gradually approaching the opposite side ofthe sample. During the second stage, the waterfront has reached the height of thesample. The slope of the first stage of the cumulative inflow curve is called the ab-sorption coefficient. A good agreement is found between the numerically obtainedvalue of the capillary absorption coefficient (0.049 kg/m2 s1/2) and experimentaldata: 0.052 (stdev 0.013) kg/m2 s1/2 (Roels et al., 2000). The fact that the curve
340 STAF ROELS ET AL.
Figure 5. Simulation of an imbibition process in the mesostructure of Figure 3: cumulativeinflow plotted versus square root of time. The solid line corresponds to the numerical result,the dashed line to a linear regression.
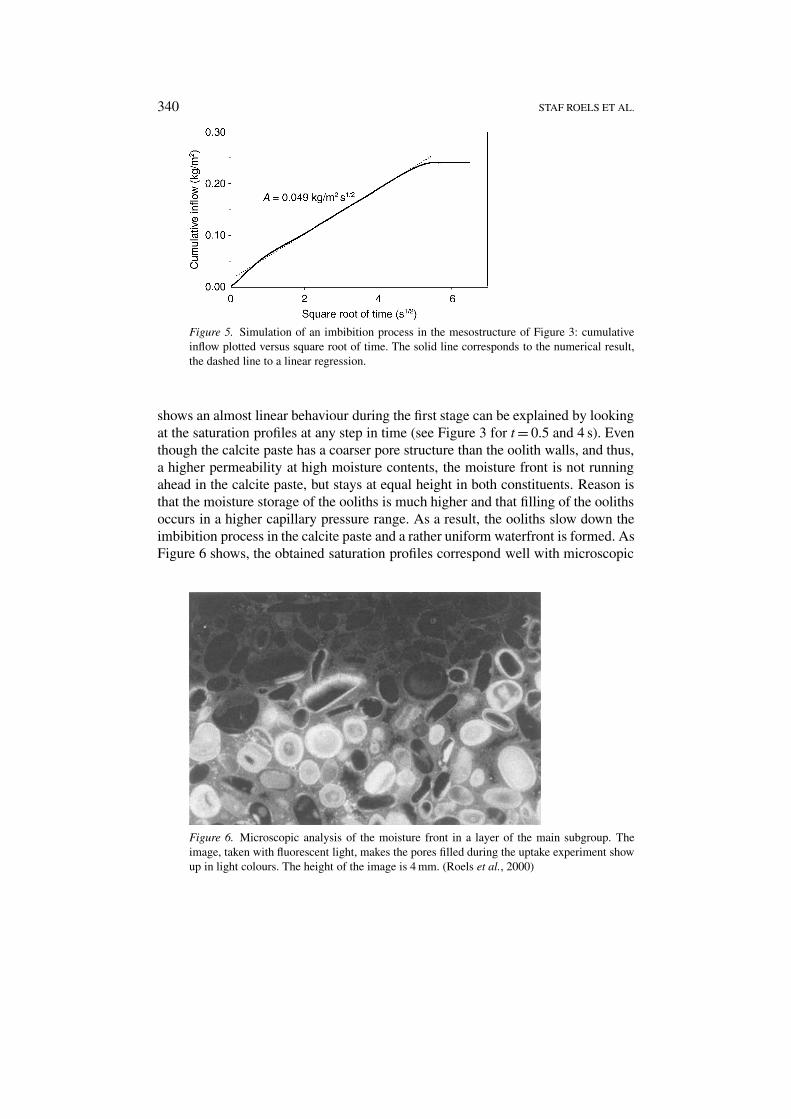
shows an almost linear behaviour during the first stage can be explained by lookingat the saturation profiles at any step in time (see Figure 3 for t = 0.5 and 4 s). Eventhough the calcite paste has a coarser pore structure than the oolith walls, and thus,a higher permeability at high moisture contents, the moisture front is not runningahead in the calcite paste, but stays at equal height in both constituents. Reason isthat the moisture storage of the ooliths is much higher and that filling of the oolithsoccurs in a higher capillary pressure range. As a result, the ooliths slow down theimbibition process in the calcite paste and a rather uniform waterfront is formed. AsFigure 6 shows, the obtained saturation profiles correspond well with microscopic
Figure 6. Microscopic analysis of the moisture front in a layer of the main subgroup. Theimage, taken with fluorescent light, makes the pores filled during the uptake experiment showup in light colours. The height of the image is 4 mm. (Roels et al., 2000)
MODELLING MOISTURE TRANSPORT IN LIMESTONE 341
analysis of free uptake experiments making use of coloured low viscous epoxyresin (Roels et al., 2000).
Although the mesoscale model clearly shows how the microheterogeneity in-fluences the moisture flow behaviour of Savonnières limestone, the use of a meso-scale for structures with realistic dimensions is completely inordinate. For a2D-simulation of a small plate of Savonnières of 20 × 20 cm2 the resulting gridshould contain more than 100 million nodes. Therefore, it is necessary to moveto a larger scale by replacing the microheterogeneous medium with a fictitiousequivalent homogeneous one.
4. Computation of the Upscaled or Equivalent Permeability
4.1. METHODOLOGY
The change of scale poses a problem of how to predict the permeability at themacroscale starting from the mesostructure. The problem is even more complicateddue to the fact that permeability is not an additive variable: an equivalent per-meability cannot be calculated as a simple arithmetic mean. Different up-scalingtechniques to calculate an equivalent permeability can be found in literature. Agood review of various methods is given by Renard and de Marsily (1997).
Given the validity of the simulations on the mesoscale model, we have chosen tocalculate the equivalent permeability in both directions from a numerical solutionof a mesoscopic static directional flow problem. This implies Equation (1) to bevalid at all scales considered. We can simulate a directional flow by prescribing, asboundary conditions on a mesostructure, a unit capillary pressure gradient betweentwo sides of the mesh and no flow on the perpendicular sides. The numericalsolution yields the stationary flow rate Q over the mesostructure. The equivalentpermeability for a certain saturation level is then given by:
Keq(S(pc)) = Q
�
�
�pc(2)
where � is the distance between the two sides with a prescribed gradient and � isthe cross-section traversed by the flow Q. This process is repeated for different sat-uration levels (capillary pressures) and the relationship between capillary pressureand equivalent permeability is determined. Applying the boundary conditions onthe perpendicular sides and repeating the flow simulations, the permeability in theperpendicular direction is obtained.
4.2. NUMERICAL RESULTS FOR SAMPLES OF THE MAIN SUBGROUP
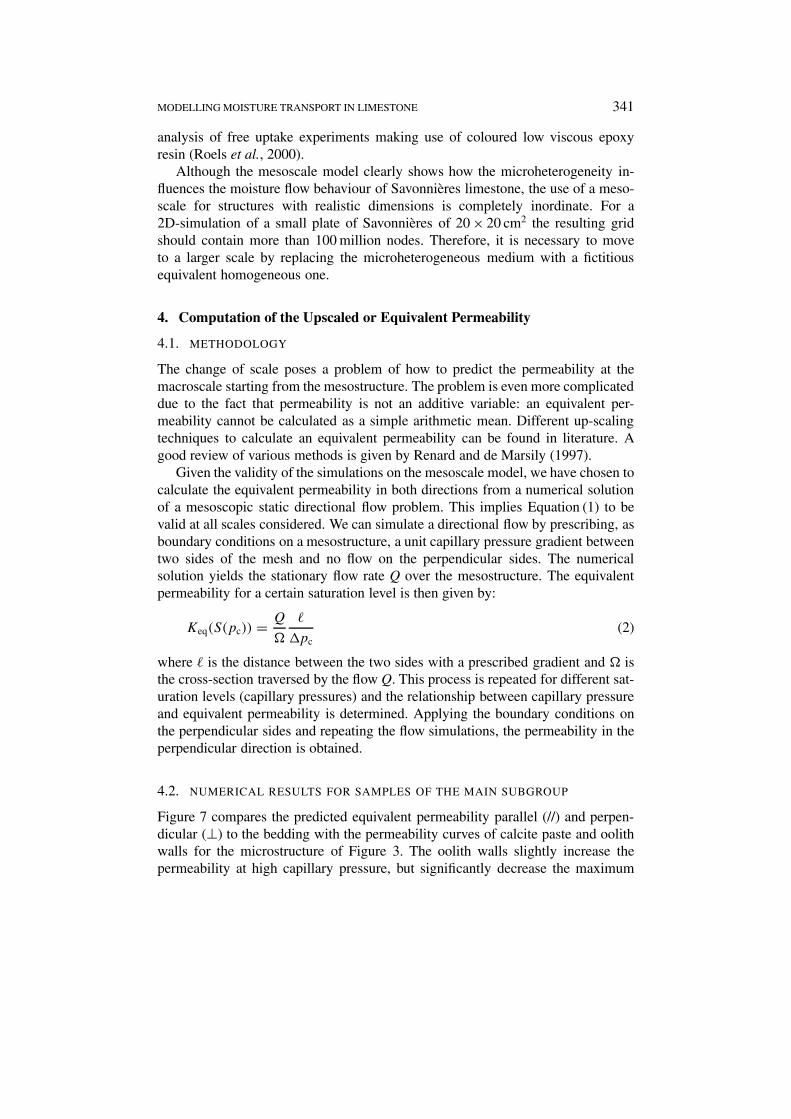
Figure 7 compares the predicted equivalent permeability parallel (//) and perpen-dicular (⊥) to the bedding with the permeability curves of calcite paste and oolithwalls for the microstructure of Figure 3. The oolith walls slightly increase thepermeability at high capillary pressure, but significantly decrease the maximum
342 STAF ROELS ET AL.
Figure 7. Permeability curves of the constituents and the predicted equivalent permeabilityfor the mesostructure of Figure 3.
imbibition permeability at low capillary pressures. The permeability parallel tothe bedding is over the total range higher than the permeability perpendicularto the bedding. The difference, however, is small. Given the upscaled equivalentpermeability curves, an imbibition experiment is simulated with the same initialand boundary conditions as for the transient moisture transport simulation on themesostructure. The calculations yield the following values for the absorption coef-ficients: A|| = 0.044 kg/m2 s1/2 and A⊥ = 0.042 kg/m2 s1/2. These results are in goodagreement with the experimental data (Roels et al., 2000) and the result of thetransient mesoscopic modelling.
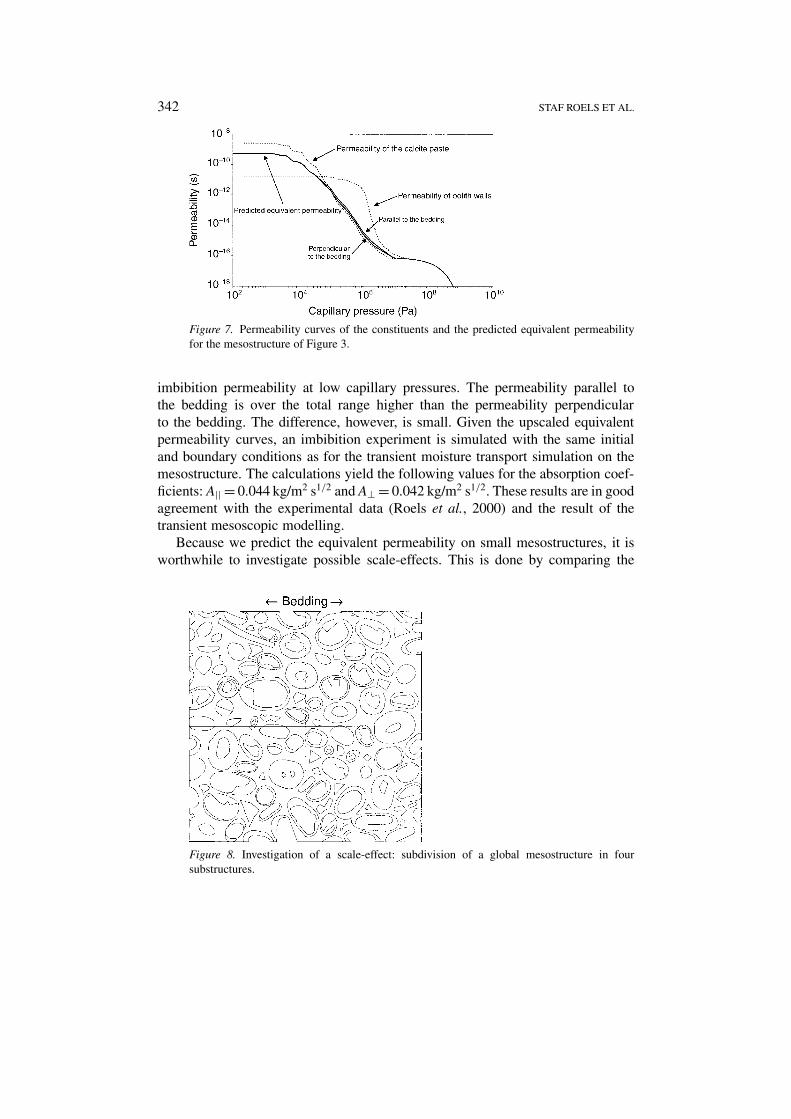
Because we predict the equivalent permeability on small mesostructures, it isworthwhile to investigate possible scale-effects. This is done by comparing the
Figure 8. Investigation of a scale-effect: subdivision of a global mesostructure in foursubstructures.
MODELLING MOISTURE TRANSPORT IN LIMESTONE 343
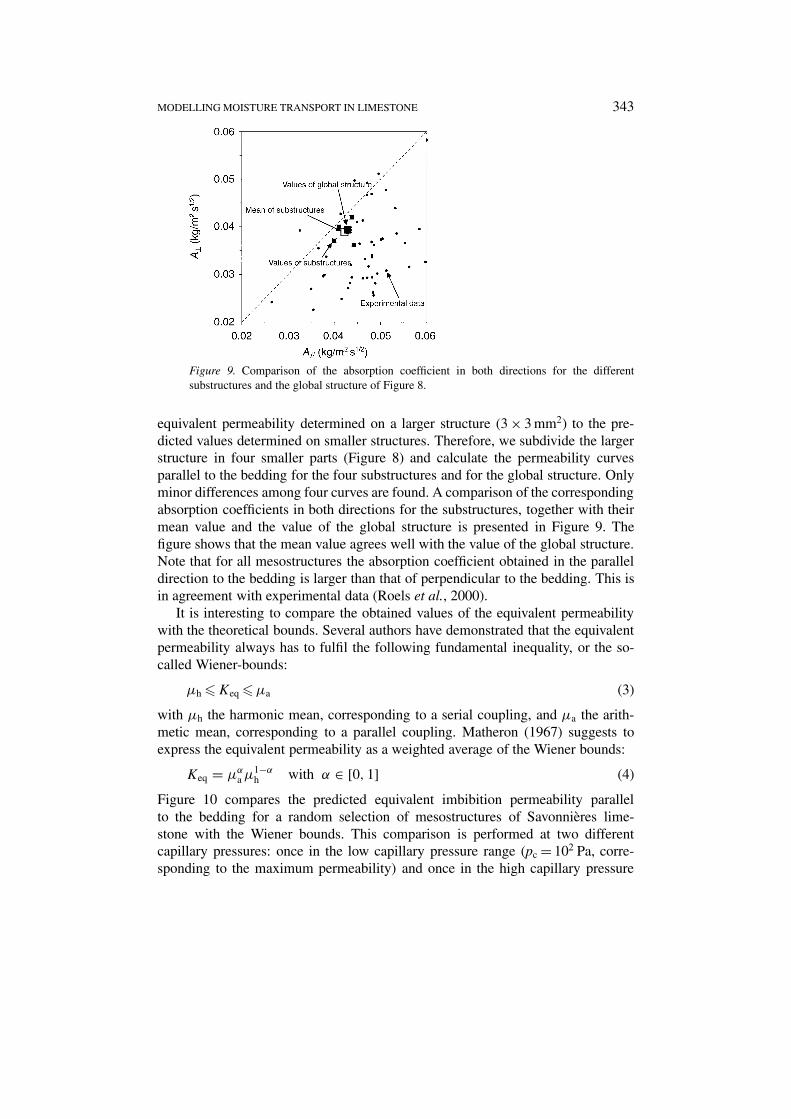
Figure 9. Comparison of the absorption coefficient in both directions for the differentsubstructures and the global structure of Figure 8.
equivalent permeability determined on a larger structure (3 × 3 mm2) to the pre-dicted values determined on smaller structures. Therefore, we subdivide the largerstructure in four smaller parts (Figure 8) and calculate the permeability curvesparallel to the bedding for the four substructures and for the global structure. Onlyminor differences among four curves are found. A comparison of the correspondingabsorption coefficients in both directions for the substructures, together with theirmean value and the value of the global structure is presented in Figure 9. Thefigure shows that the mean value agrees well with the value of the global structure.Note that for all mesostructures the absorption coefficient obtained in the paralleldirection to the bedding is larger than that of perpendicular to the bedding. This isin agreement with experimental data (Roels et al., 2000).
It is interesting to compare the obtained values of the equivalent permeabilitywith the theoretical bounds. Several authors have demonstrated that the equivalentpermeability always has to fulfil the following fundamental inequality, or the so-called Wiener-bounds:
µh � Keq � µa (3)
with µh the harmonic mean, corresponding to a serial coupling, and µa the arith-metic mean, corresponding to a parallel coupling. Matheron (1967) suggests toexpress the equivalent permeability as a weighted average of the Wiener bounds:
Keq = µαa µ1−α
h with α ∈ [0, 1] (4)
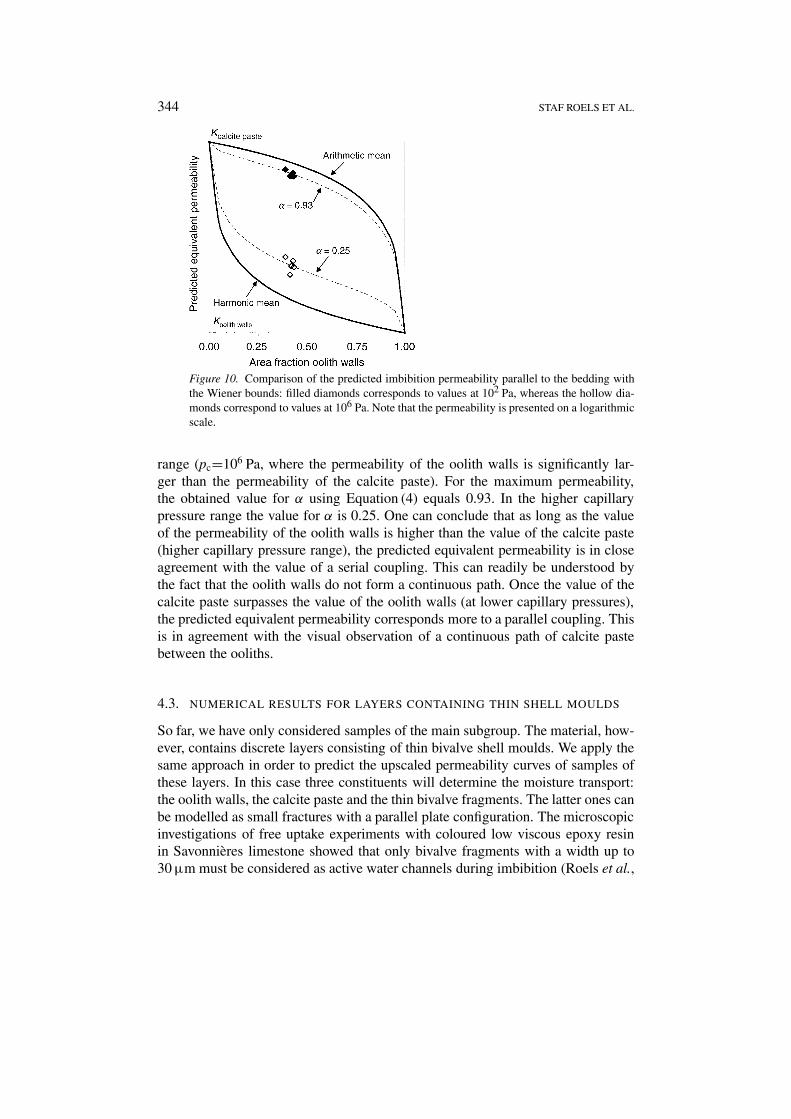
Figure 10 compares the predicted equivalent imbibition permeability parallelto the bedding for a random selection of mesostructures of Savonnières lime-stone with the Wiener bounds. This comparison is performed at two differentcapillary pressures: once in the low capillary pressure range (pc = 102 Pa, corre-sponding to the maximum permeability) and once in the high capillary pressure
344 STAF ROELS ET AL.
Figure 10. Comparison of the predicted imbibition permeability parallel to the bedding withthe Wiener bounds: filled diamonds corresponds to values at 102 Pa, whereas the hollow dia-monds correspond to values at 106 Pa. Note that the permeability is presented on a logarithmicscale.
range (pc=106 Pa, where the permeability of the oolith walls is significantly lar-ger than the permeability of the calcite paste). For the maximum permeability,the obtained value for α using Equation (4) equals 0.93. In the higher capillarypressure range the value for α is 0.25. One can conclude that as long as the valueof the permeability of the oolith walls is higher than the value of the calcite paste(higher capillary pressure range), the predicted equivalent permeability is in closeagreement with the value of a serial coupling. This can readily be understood bythe fact that the oolith walls do not form a continuous path. Once the value of thecalcite paste surpasses the value of the oolith walls (at lower capillary pressures),the predicted equivalent permeability corresponds more to a parallel coupling. Thisis in agreement with the visual observation of a continuous path of calcite pastebetween the ooliths.
4.3. NUMERICAL RESULTS FOR LAYERS CONTAINING THIN SHELL MOULDS
So far, we have only considered samples of the main subgroup. The material, how-ever, contains discrete layers consisting of thin bivalve shell moulds. We apply thesame approach in order to predict the upscaled permeability curves of samples ofthese layers. In this case three constituents will determine the moisture transport:the oolith walls, the calcite paste and the thin bivalve fragments. The latter ones canbe modelled as small fractures with a parallel plate configuration. The microscopicinvestigations of free uptake experiments with coloured low viscous epoxy resinin Savonnières limestone showed that only bivalve fragments with a width up to30 µm must be considered as active water channels during imbibition (Roels et al.,
MODELLING MOISTURE TRANSPORT IN LIMESTONE 345
2000). To model the moisture transfer in the bivalve fragments we use a constantfracture aperture model. We simplify the problem even more by assuming that allactive bivalve fragments have the same aperture of 20 µm. Furthermore, we neglectthe wall roughness of the bivalve fragments as well as any possible corner flow.As a result of these simplifications, the constant fracture aperture model yields astepwise water retention curve. All bivalve fragments are assumed to imbibe ordrain at a fixed critical capillary pressure, determined by the constant width b ofthe aperture (the occupancy criterion):
p∗c = 2σ
b(5)
with σ (the surface tension (0.0725 N/m at 20◦C). The corresponding liquid waterpermeability is also described by a step function (Bear, 1993):
K =
0, pc > p∗c
ρlb2
12η, pc � p∗
c(6)
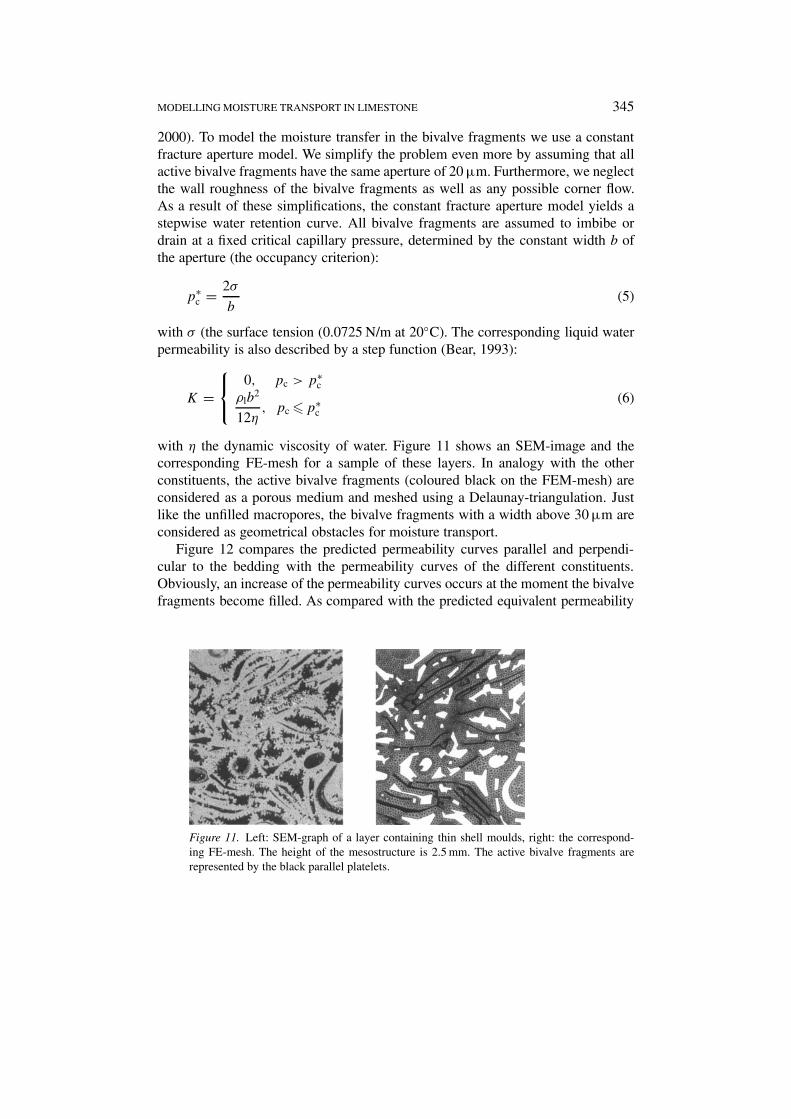
with η the dynamic viscosity of water. Figure 11 shows an SEM-image and thecorresponding FE-mesh for a sample of these layers. In analogy with the otherconstituents, the active bivalve fragments (coloured black on the FEM-mesh) areconsidered as a porous medium and meshed using a Delaunay-triangulation. Justlike the unfilled macropores, the bivalve fragments with a width above 30 µm areconsidered as geometrical obstacles for moisture transport.
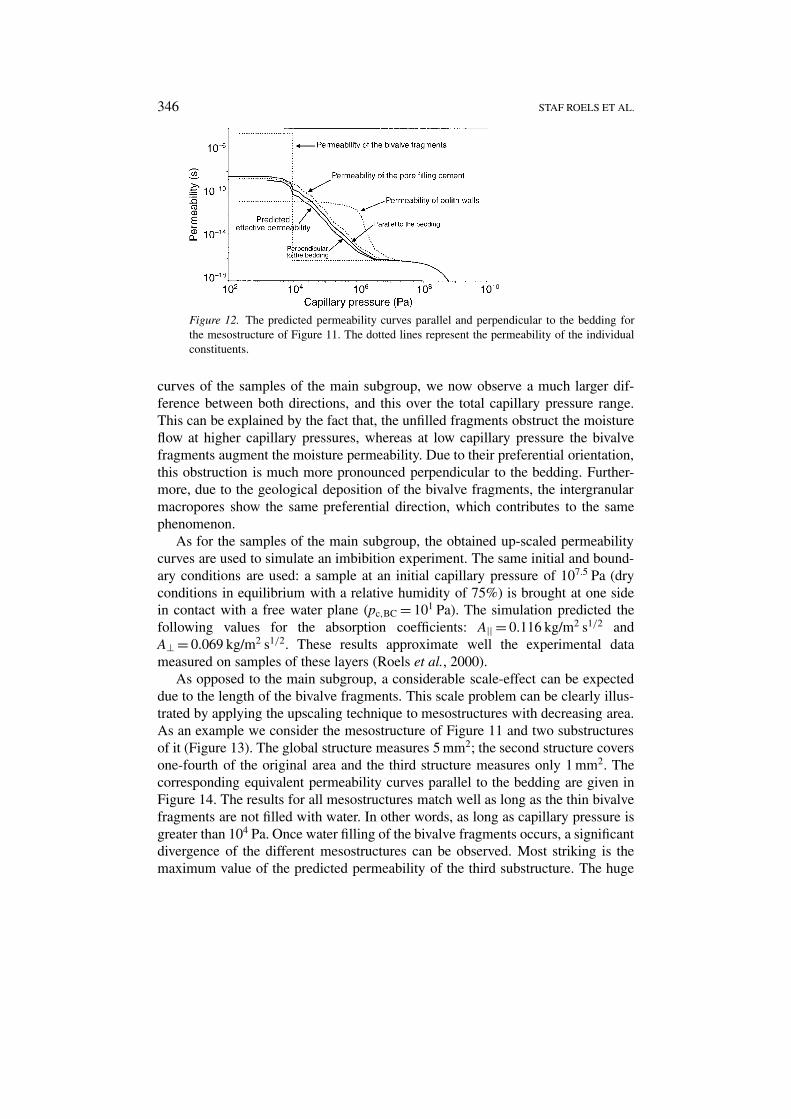
Figure 12 compares the predicted permeability curves parallel and perpendi-cular to the bedding with the permeability curves of the different constituents.Obviously, an increase of the permeability curves occurs at the moment the bivalvefragments become filled. As compared with the predicted equivalent permeability
Figure 11. Left: SEM-graph of a layer containing thin shell moulds, right: the correspond-ing FE-mesh. The height of the mesostructure is 2.5 mm. The active bivalve fragments arerepresented by the black parallel platelets.
346 STAF ROELS ET AL.
Figure 12. The predicted permeability curves parallel and perpendicular to the bedding forthe mesostructure of Figure 11. The dotted lines represent the permeability of the individualconstituents.
curves of the samples of the main subgroup, we now observe a much larger dif-ference between both directions, and this over the total capillary pressure range.This can be explained by the fact that, the unfilled fragments obstruct the moistureflow at higher capillary pressures, whereas at low capillary pressure the bivalvefragments augment the moisture permeability. Due to their preferential orientation,this obstruction is much more pronounced perpendicular to the bedding. Further-more, due to the geological deposition of the bivalve fragments, the intergranularmacropores show the same preferential direction, which contributes to the samephenomenon.
As for the samples of the main subgroup, the obtained up-scaled permeabilitycurves are used to simulate an imbibition experiment. The same initial and bound-ary conditions are used: a sample at an initial capillary pressure of 107.5 Pa (dryconditions in equilibrium with a relative humidity of 75%) is brought at one sidein contact with a free water plane (pc,BC = 101 Pa). The simulation predicted thefollowing values for the absorption coefficients: A|| = 0.116 kg/m2 s1/2 andA⊥ = 0.069 kg/m2 s1/2. These results approximate well the experimental datameasured on samples of these layers (Roels et al., 2000).
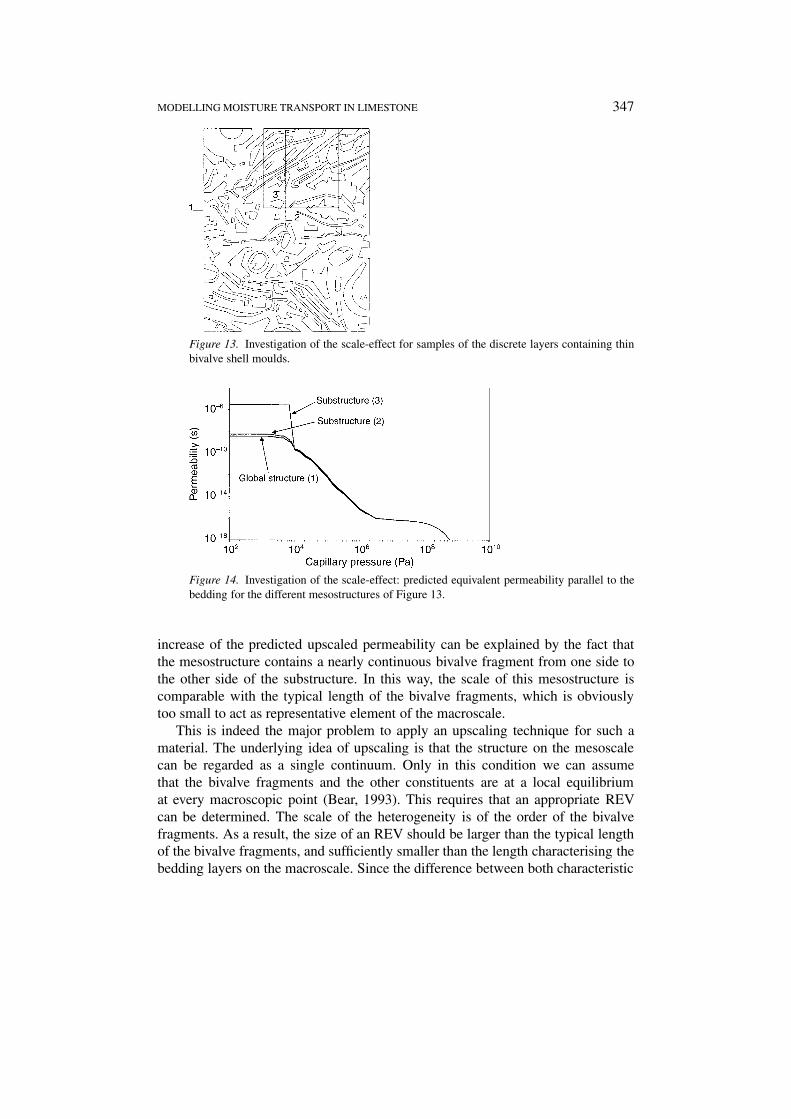
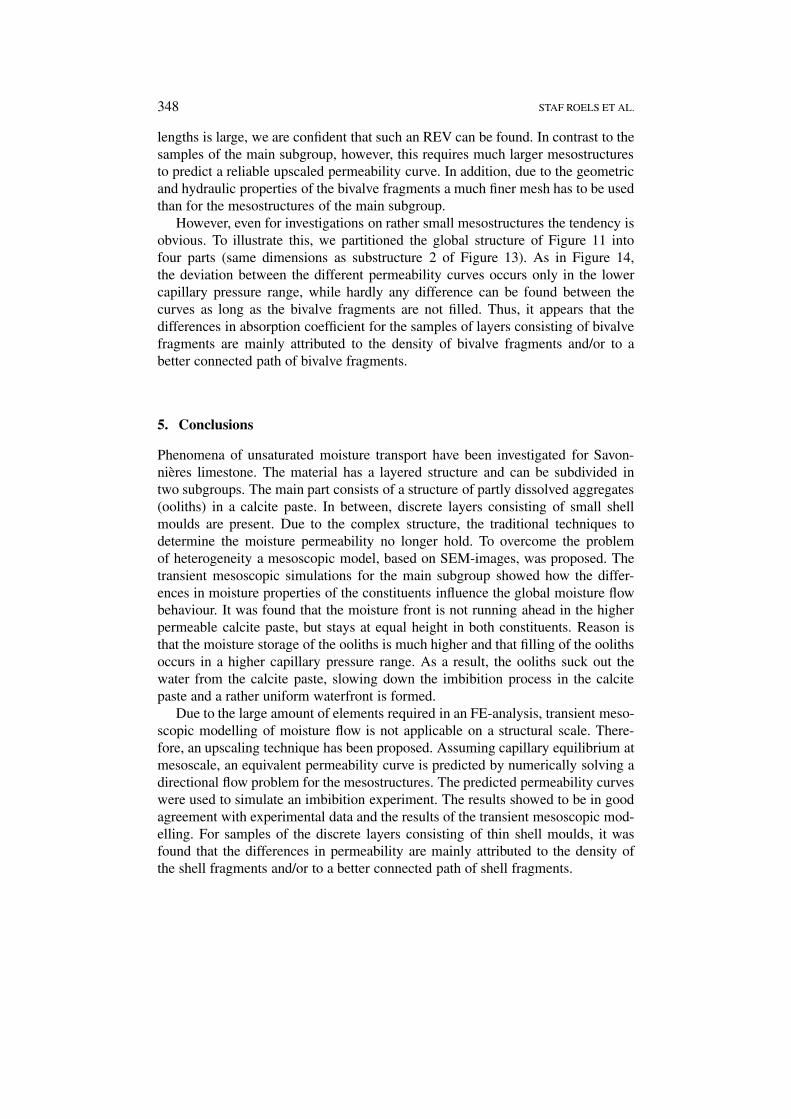
As opposed to the main subgroup, a considerable scale-effect can be expecteddue to the length of the bivalve fragments. This scale problem can be clearly illus-trated by applying the upscaling technique to mesostructures with decreasing area.As an example we consider the mesostructure of Figure 11 and two substructuresof it (Figure 13). The global structure measures 5 mm2; the second structure coversone-fourth of the original area and the third structure measures only 1 mm2. Thecorresponding equivalent permeability curves parallel to the bedding are given inFigure 14. The results for all mesostructures match well as long as the thin bivalvefragments are not filled with water. In other words, as long as capillary pressure isgreater than 104 Pa. Once water filling of the bivalve fragments occurs, a significantdivergence of the different mesostructures can be observed. Most striking is themaximum value of the predicted permeability of the third substructure. The huge
MODELLING MOISTURE TRANSPORT IN LIMESTONE 347
Figure 13. Investigation of the scale-effect for samples of the discrete layers containing thinbivalve shell moulds.
Figure 14. Investigation of the scale-effect: predicted equivalent permeability parallel to thebedding for the different mesostructures of Figure 13.
increase of the predicted upscaled permeability can be explained by the fact thatthe mesostructure contains a nearly continuous bivalve fragment from one side tothe other side of the substructure. In this way, the scale of this mesostructure iscomparable with the typical length of the bivalve fragments, which is obviouslytoo small to act as representative element of the macroscale.
This is indeed the major problem to apply an upscaling technique for such amaterial. The underlying idea of upscaling is that the structure on the mesoscalecan be regarded as a single continuum. Only in this condition we can assumethat the bivalve fragments and the other constituents are at a local equilibriumat every macroscopic point (Bear, 1993). This requires that an appropriate REVcan be determined. The scale of the heterogeneity is of the order of the bivalvefragments. As a result, the size of an REV should be larger than the typical lengthof the bivalve fragments, and sufficiently smaller than the length characterising thebedding layers on the macroscale. Since the difference between both characteristic
348 STAF ROELS ET AL.
lengths is large, we are confident that such an REV can be found. In contrast to thesamples of the main subgroup, however, this requires much larger mesostructuresto predict a reliable upscaled permeability curve. In addition, due to the geometricand hydraulic properties of the bivalve fragments a much finer mesh has to be usedthan for the mesostructures of the main subgroup.
However, even for investigations on rather small mesostructures the tendency isobvious. To illustrate this, we partitioned the global structure of Figure 11 intofour parts (same dimensions as substructure 2 of Figure 13). As in Figure 14,the deviation between the different permeability curves occurs only in the lowercapillary pressure range, while hardly any difference can be found between thecurves as long as the bivalve fragments are not filled. Thus, it appears that thedifferences in absorption coefficient for the samples of layers consisting of bivalvefragments are mainly attributed to the density of bivalve fragments and/or to abetter connected path of bivalve fragments.
5. Conclusions
Phenomena of unsaturated moisture transport have been investigated for Savon-nières limestone. The material has a layered structure and can be subdivided intwo subgroups. The main part consists of a structure of partly dissolved aggregates(ooliths) in a calcite paste. In between, discrete layers consisting of small shellmoulds are present. Due to the complex structure, the traditional techniques todetermine the moisture permeability no longer hold. To overcome the problemof heterogeneity a mesoscopic model, based on SEM-images, was proposed. Thetransient mesoscopic simulations for the main subgroup showed how the differ-ences in moisture properties of the constituents influence the global moisture flowbehaviour. It was found that the moisture front is not running ahead in the higherpermeable calcite paste, but stays at equal height in both constituents. Reason isthat the moisture storage of the ooliths is much higher and that filling of the oolithsoccurs in a higher capillary pressure range. As a result, the ooliths suck out thewater from the calcite paste, slowing down the imbibition process in the calcitepaste and a rather uniform waterfront is formed.
Due to the large amount of elements required in an FE-analysis, transient meso-scopic modelling of moisture flow is not applicable on a structural scale. There-fore, an upscaling technique has been proposed. Assuming capillary equilibrium atmesoscale, an equivalent permeability curve is predicted by numerically solving adirectional flow problem for the mesostructures. The predicted permeability curveswere used to simulate an imbibition experiment. The results showed to be in goodagreement with experimental data and the results of the transient mesoscopic mod-elling. For samples of the discrete layers consisting of thin shell moulds, it wasfound that the differences in permeability are mainly attributed to the density ofthe shell fragments and/or to a better connected path of shell fragments.
MODELLING MOISTURE TRANSPORT IN LIMESTONE 349
References
Bear, J.: 1993, Modelling flow and contaminant transport in fractured rocks, in: J. Bear, C. F.Tsang and G. de Marsily (eds), Flow and Contaminant Transport in Fractured Rocks, 1st edn.,Academic Press, San Diego.
Bear, J. and Bachmat, Y.: 1990, Introduction to Modelling of Transport Phenomena in Porous Media,Kluwer Academic Publishers, Dordrecht.
Bear, J., Braester, C. and Menier, P. C.: 1987, Effective and relative permeabilities of anisotropicporous media, Transport in Porous Media 2, 301–316.
Brooks, R. H. and Corey, A. T.: 1966, Properties of porous media affecting fluid flow, Proc. Amer.Soc. Civil Eng. 92, 61–87.
Carmeliet, J. and Roels, S.: 2001, Determination of the isothermal moisture transport properties ofporous building materials, J. Thermal Env. Building Sci. 24, 183–210.
Carmeliet, J., Descamps, F. and Houvenaghel, G.: 1999, Multiscale network for simulating liquidwater and water vapour transfer properties of porous building materials, Transport in PorousMedia 35, 67–88.
Cranck, J.: 1989, The Mathematics of Diffusion, Oxford Science Publications, Oxford.Descamps, F.: 1997, Continuum and discrete modelling of isothermal water and air transfer in porous
media, PhD Thesis, Catholic University of Leuven, Leuven, Belgium.Diaz, C. E., Chatzis, I. and Dullien, F. A. L.: 1987, Simulation of capillary pressure curves using bond
correlated site percolatio on a simple cubic network, Transport in Porous Media 2(3), 215–240.Fatt, I.: 1956, The network model of porous media. III. The dynamic properties of networks with
tube radius distribution, Trans. AIME Petrol. Div. 207, 164–177.Gardner, W. R.: 1958, Some steady state solutions of the unsaturated moisture flow equation, with
application to evaporation from a water table, Soil Sci. 85, 228–232.Matheron, G.: 1967, Eléments Pour une Théorie des Milieux Poreux, Masson, Paris, France.Mualem, Y.: 1976, Hysteresis models for prediction of the hydraulic conductivity of unsaturated
porous media, Water Resour. Res. 12(6), 1248–1254.Neimark, A. V.: 1989, Multiscale percolation systems, Sov. Phys. JETP 69(4), 786–791.Pel, L.: 1995, Moisture transport in porous building materials, PhD Thesis, Technical University
Eindhoven, Eindhoven, The Netherlands.Renard, P. and de Marsily, G.: 1997, Calculating equivalent permeability: a review, Adv. Water
Resour. 20, 253–278.Roelfstra, P. E., Sadouki, H. and Wittmann, F. H.: 1985, Le béton numérique, Matériaux et
Constructions 18, 327–335.Roels, S.: 2000, Modelling unsaturated moisture transport in heterogeneous limestone, PhD Thesis,
Catholic University of Leuven, Leuven, Belgium.Roels, S., Carmeliet, J., Hens, H. and Elsen, J.: 2000, Microscopic analysis of imbibition processes
in oolitic limestone, Geophys. Res. Lett. 27(21), 3533–3536.Roels, S., Elsen, J., Carmeliet, J. and Hens, H.: 2001, Characterisation of pore structure by combining
mercury porosimetry and micrography, Mater. Struct. 34, 76–82.Roels, S., Carmeliet, J. and Hens, H.: 2003, Modelling unsaturated moisture transport in heterogen-
eous limestone. Part 2. Macroscopic simulations. Transport in Porous Media 52, 351–369.Sahimi, M.: 1993, Flow phenomena in rocks: from continuum modelling to fractals, percolation,
cellular automata, and simulated annealing, Rev. Mod. Phys. 65, 1393–1534.Schlangen, E.: 1993, Experimental and numerical analysis of fracture processes in concrete, PhD
Thesis, Technical University Delft, The Netherlands.van Genuchten, M. T.: 1978, Calculating the Unsaturated Hydraulic Conductivity with a New Closed
Form Analytic Model. Report 78-WR-08, Princeton University, Princeton, NJ.Vervuurt, A.: 1997, Interface fracture in concrete, PhD Thesis, Technical University Delft, The
Netherlands.

350 STAF ROELS ET AL.
Whitaker, S.: 1977, Simultaneous heat, mass and momentum transfer in porous media: a theory ofdrying porous media, Adv. Heat Transfer, 119–203.
Wittmann, F. H., Roelfstra, P. E. and Sadouki, H.: 1984, Simulation and analysis of compositestructures. Mater. Sci. Eng. 68, 239–248.
Xu, K., Daian, J. F. and Quenard, D.: 1997, Multiscale structures to describe porous media. Part I.Theoretical background and invasion by fluids. Transport in Porous Media 26, 51–73.