individual feeding variability of protozoan and crustacean zooplankton analyzed with flow cytometry
TRANSCRIPT

Notes
Limnol. Oceanogr., 32(3), 1987, 691-699 0 1987, by the American Society of Limnology and Oceanography, Inc.
691
Individual feeding variability of protozoan and crustacean zooplankton analyzed with flow cytometry’
Abstract-Feeding of protozoan and crusta- cean zooplankton was analyzed by flow cytom- etry (FCM), resulting in direct counts of particles ingested by each individual. Ciliates (Cyclidium sp.) were allowed to feed on Microcystis aerugi- nosa and analyzed directly on a flow cytometer for cyanobacterial autofluorescence coincident with each ciliate. Numbers of Microcystis cells ingested (e.g. 0, 1, 2, 3, or 4 ciliate-‘) were esti- mated from the total fluorescence intensity of each ciliate. Crustaceans (Daphnia magna and Bosmina tubicen) were fed fluorescent beads or Microcystis, sonicated to release their gut con- tents, and the resulting suspension from each in- dividual was quantitatively analyzed by FCM. These methods allow estimation of several as- pects of feeding behavior, including particle se- lectivity, mechanisms of particle capture, gut vol- ume of small organisms, feeding and clearance rates, and individual variation of the preceding parameters. Flow cytometry is more rapid than direct counts by microscope and more accurate than many indirect methods.
Feeding habits of aquatic animals can be analyzed by direct or indirect methods (see Peters 1984). Direct methods, such as gut content analysis, yield precise results for individual animals, but are laborious and time-consuming, often prohibitively so for small organisms such as zooplankton (e.g. Gerritsen and Porter 1982). This situation often leads to restriction of sample size and replication. Indirect methods involve counting prey items in the water column before and after exposure to feeding animals (Peters 1984). These methods generally use several feeding animals per experimental sample and automated counting methods, making them rapid and economical, but precluding information on individual vari- ation. They may also introduce errors un- related to feeding due, for example, to growth
1 This research was supported by NSF grants BSR 84- 1585 1 (J.G.), BSR 84-07928 (K.G.P.), and the Uni- versity of Georgia Program for Biotechnology. C. M. Yentsch and an anonymous reviewer commented on the manuscript. Lake Oglethorpe Limnological Asso- ciation Contribution 30.
and mortality of prey during the experi- ment.
Variation among individuals is an im- portant biological phenomenon (Mayr 19 8 2); observations of only population mean or aggregate behaviors lose potentially rel- evant information. For instance, nonselec- tive feeding by all members of a population may produce similar aggregate behavior as varying selection among individuals within the population. Individual specialization on different food species is fundamentally dif- ferent from nonselective behavior and can be an important factor in the autecology of animals.
The introduction of flow cytometry (FCM) to the aquatic sciences has led to the de- velopment of techniques to rapidly count and sort phytoplankton (e.g. Trask et al. 1982; Yentsch et al. 1983; Wood et al. 1985) and to the improvement of indirect feeding analysis (Cucci et al. 1985; Stoecker et al. 1986). We report here analysis of feeding by individual zooplankton and protozoo- plankton using direct counts of ingested material on a flow cytometer. These direct counts are more rapid and require less sam- ple processing than microscope direct counts. Large numbers of samples can be run to yield information on individual vari- ability in feeding habits.
Fluorescent microspheres have become increasingly popular in research on plank- tonic trophic interactions. Beads are not food items, and organisms may not respond to them in the same way as to food. The mi- crospheres are useful, however, in that they are easily counted, well defined, and can be manipulated to elucidate feeding mecha- nisms (e.g. Gerritsen and Porter 1982; Hes- sen 19 8 5). In our investigations here we used both fluorescent beads and living cyano- bacteria, Microcystis aeruginosa, as food for zooplankton.
The ciliate Cyclidium sp. was isolated from Lake Oglethorpe, Georgia, and main- tained in a 0.1% Cerophyll medium (w/v)

692 Notes
L90° LS
Fig. 1. Frequency distribution histogram of for- ward-angle light scatter (FALS) and log 90” light scatter (L9OLS) of a culture of Cyclidium. Large peak in the center represents Cyclidium cells; peak close to axis (small FALS) represents debris in culture media. The heavy line represents bit-map gate drawn around the Cyclidium peak. All events falling within the polygon of the gate were analyzed for fluorescence (see Fig. 2).
with Aerobacter aerogenes as a food source. Ciliates in log-phase growth were separated from bacteria by gentle rinsing with 0.2-pm filtered culture medium over a 3-pm Nu- clepore filter. Ciliates were resuspended in fresh culture medium to a final concentra- tion of about 8 50 ml- l. Cyclidium was al- lowed to acclimate for l-3 h in combusted 50-ml beakers before the experimental food suspensions were added.
A nontoxic strain of M. aeruginosa was grown in a 16 : 8-h L/D cycle. Immediately before the experiments, cells in log-phase growth were filtered through a l.O-pm Nu- clepore filter. This step ensured that only single cells were present in feeding suspen- sions. We counted Microcystis on a Zeiss epifluorescence microscope with a rhoda- mine filter set (Zeiss 48 77 15). Appropriate amounts of the cyanobacterium were added to ciliate suspensions to give final concen- trations of either 1 O4 or 1 O5 Microcystis ml- l. Ciliates were allowed to feed for exactly 4 or 8 min. Ingestion was then stopped by adding 20% paraformaldehyde (2% final concn). A 5-ml subsample was removed from each experimental chamber for mi- croscopic examination, and the remaining suspension was concentrated by centrifu- gation at 1,200 X g for 5 min for flow cy- tometry.
For microscopic counts of particle inges- tion, ciliates were prestained for 12 h with 250 pg ml-l primulin and filtered onto a black, 2.0-pm Nuclepore filter (Sanders and
, // a. Unfed Control ,
z
RED FLUORESCENCE
Fig. 2. Fluorescence histograms (256 channel) of Cyclidium cells from Fig. 1. a-Unfed control; b- animals fed for 8 min in 1 OS ml-’ Microcystis. Chan- nels O-40 = Cyclidium with 0 Microcystis; 41-80 = 1 Microcystis; 81-120 = 2; 121-160 = 3, 161-200 = 4; and 201-255 = 5 or more.
Porter 1986). Most uningested Microcystis, which could interfere with counting, passed through the 2-pm filter. We scored 80 cil- iates for ingested Microcystis using the epi- fluorescence microscope and appropriate filter set.
FCM analysis was done with a Coulter EPICS 7 53 flow cytometer using argon ex- citation of 800 mW at 5 14 nm. Microcystis autofluorescence, consisting of phycoery- thrin and chlorophyll emission, was reflect- ed to a photomultiplier tube (PMT) with a 590-nm, short-pass dichroic filter (> 590 nm, reflected; ~590 nm, passed). An ad- ditional 570-nm, long-pass absorption filter was mounted in front of the PMT. We first ran a sample consisting of Microcystis alone to set voltage and gain on the red-fluores- cence PMT (1,500 V, gain 20) then an unfed control sample of Cyclidium to identify the ciliates by forward-angle light scatter (FALS) and log 90” light scatter (L9OLS). A bit-map gate was drawn around the ciliate popula- tion identified in the FALS-L90LS histo- gram (Fig. l), and events within the bit map were subsequently analyzed for red fluores- cence.
We analyzed 10,000 ciliates per sample. Repeated tests of the same sample resulted in a C.V. of I%, as long as the sample was well mixed. Cyclidium was weakly autoflu- orescent, as are other ciliates (J. Paulin pers. comm.), and individual ciliates (- 10 x 18 pm in cross section) had integrated red flu- orescence about equal to an individual Mi- crocystis (- 1 -pm diam). Experimental sam-

Notes 693
Table 1. FCM counts, Cyclidium feeding on Microcystis. N = 10,000 ciliates.
FeedIng % Cyclrdwn contaming n M~rocystu Mean No. Mlcrocvstrs time ingested Clearance rate
concn (min) 0 I 2 3 24 (ciliate-I) (ml ciliate-’ h-l)
104 4 99.5 0.3 0.2 - - 0.007 9.02 x 10~~ 104 8 94.8 4.5 0.7 - - 0.060 3.78 x 1O-5 105 4 79.3 13.4 6.0 1.2 0.1 0.29 4.07 x 10⁻⁵ 105 8 63.5 20.5 11.1 4.0 0.9 0.58 4.07 x 10⁻⁵
ples produced a multimodal fluorescence histogram, representing ciliates that had in- gested 0, 1, or > 1 Microcystis (Fig. 2). These histograms were analyzed for ingestion of cyanobacteria by dividing them into inter- vals corresponding to numbers of cells in- gested and subtracting from them the equiv- alent intervals in the control sample (Fig. 2).
The flow cytometric analysis of ciliate feeding showed similar patterns as with mi- croscopical counts of the same experiments (Tables 1,2). Distributions of Cyclidium that had ingested 0, 1, 2, 3, or 4 Microcystis ap- peared to follow a Poisson distribution, sug- gesting that feeding is a random encounter process (Gerritsen and Strickler 1977). The FCM counts (N = 10,000) gave a better fit to the Poisson distribution as well as more consistent feeding rates at different feeding times and concentrations than did the mi- croscopical counts (N = 80) (Tables 1, 2). Mean numbers of Microcystis ingested dou- bled between 4 and 8 min at lo5 cells ml-’ and increased tenfold between 8 min at lo4 cells and 8 min at lo5 (Table 1). The ex- ception was 4 min at lo4 cells where FCM analysis found few ciliates that had ingested Microcystis.
Relative to microscopical counts, FCM consistently underestimated ingestion by 30-40%. Three factors may have contrib- uted to this bias: In this experiment, there
was background autofluorescence from par- ticles in the ciliate media, which gave high counts in the unfed control. Since the back- ground was subtracted from the experimen- tal samples, ingestion may have been higher than was calculated. Preliminary experi- ments with fluorescent beads (data not shown) had lower background fluorescence in the control, and FCM counts did not un- derestimate microscope counts. Second, the FCM cannot distinguish between living cil- iates and dead cells or ciliate-sized detritus, again resulting in underestimation of inges- tion. This error could be reduced by clean- ing the samples with gradient centrifugation or elutriation or by staining ciliates with a fluorescent marker (e.g. DAPI) to distin- guish them from detritus. Third, a person counting cells in a microscope may subcon- sciously search for cells containing fluores- cence or may overlook nonfluorescent cells. We think that the contribution of this factor was minimal.
The cladocerans Daphnia magna (EPA- Duluth strain) and Bosmina tubicen (from Okefenokee Swamp) were cultured on Chlamydomonas reinhardi. Four sets of ex- periments are described here: a size-selec- tion experiment where the animals were given a mixture of 0.57- and 2.53~pm car- boxylated fluorescent beads; measurement of the gut volume of D. magna; a clearance- rate experiment with the cyanobacterium
Table 2. Microscope counts, Cyclidium feeding on Microcystis. N = 80 ciliates.
Feedmg % Cyclldlum contarnmg n Mlcrocystls Mean No. Mlcrocystls time mgested Clearance rate
concn (min) 0 I 2 3 24 (ciliate-‘) (ml cdiate-’ h-‘)
104 4 96.2 3.8 - - - 0.04 4.7 x 10⁻⁵ 104 8 91.3 8.7 - - 0.09 5.5 x 10⁻⁵ 105 4 68.7 18.8 6.2 3.8 2.5 0.54 7.6 x 1O-5 105 8 50.0 20.0 15.0 11.2 3.8 0.99 6.9 x lO-5
694 Notes
lo”-
lo”- P 7
2 f 10 ' 1
0 10 102 lo3 lo4
b. Bosmina
lo”-
3 P 10 -
- L 2
10 ! I
lo2 lo4
Feeding Time, s
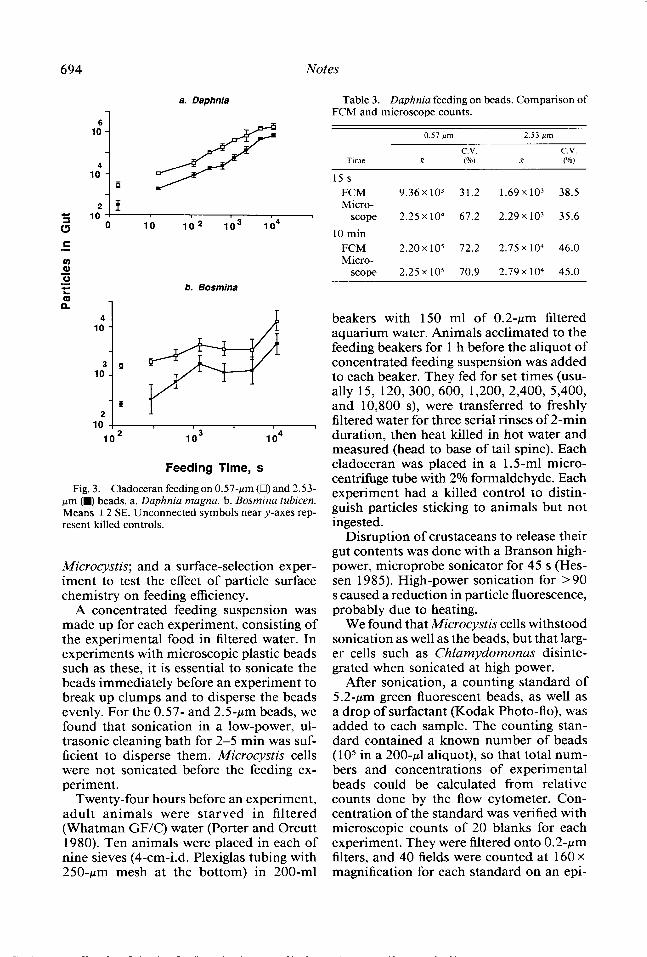
Fig. 3. Cladoceran feeding on 0.57~pm (Cl) and 2.53- pm 0 beads. a. Daphnia magna. b. Bosmina tubicen. Means +2 SE. Unconnected symbols near y-axes rep- resent killed controls.
Microcystis; and a surface-selection exper- iment to test the effect of particle surface chemistry on feeding efficiency.
A concentrated feeding suspension was made up for each experiment, consisting of the experimental food in filtered water. In experiments with microscopic plastic beads such as these, it is essential to sonicate the beads immediately before an experiment to break up clumps and to disperse the beads evenly. For the 0.57- and 2.5pm beads, we found that sonication in a low-power, ul- trasonic cleaning bath for 2-5 min was suf- ficient to disperse them. Microcystis cells were not sonicated before the feeding ex- periment.
Twenty-four hours before an experiment, adult animals were starved in filtered (Whatman GFK) water (Porter and Orcutt 1980). Ten animals were placed in each of nine sieves (4-cm-i.d. Plexiglas tubing with 250-pm mesh at the bottom) in 200-ml
Table 3. Daphnia feeding on beads. Comparison of FCM and microscope counts.
Time
15 s
0.57 pm 2.53 pm
C.V. C.V. R (O/o) x (o/o)
FCM 9.36x lo3 31.2 1.69x lo3 38.5 Micro-
scope 2.25x lo4 67.2 2.29x lo3 35.6
10 min FCM 2.20x 10⁵ 72.2 2.75 x lo4 46.0 Micro-
scope 2.25x lo5 70.9 2.79 x lo4 45.0
beakers with 150 ml of 0.2-pm filtered aquarium water. Animals acclimated to the feeding beakers for 1 h before the aliquot of concentrated feeding suspension was added to each beaker. They fed for set times (usu- ally 15, 120, 300, 600, 1,200, 2,400, 5,400, and 10,800 s), were transferred to freshly filtered water for three serial rinses of 2-min duration, then heat killed in hot water and measured (head to base of tail spine). Each cladoceran was placed in a 1.5-ml micro- centrifuge tube with 2% formaldehyde. Each experiment had a killed control to distin- guish particles sticking to animals but not ingested.
Disruption of crustaceans to release their gut contents was done with a Branson high- power, microprobe sonicator for 45 s (Hes- sen 1985). High-power sonication for >90 s caused a reduction in particle fluorescence, probably due to heating.
We found that Microcystis cells withstood sonication as well as the beads, but that larg- er cells such as Chlamydomonas disinte- grated when sonicated at high power.
After sonication, a counting standard of 5.2~pm green fluorescent beads, as well as a drop of surfactant (Kodak Photo-flo), was added to each sample. The counting stan- dard contained a known number of beads ( lo5 in a 200-~1 aliquot), so that total num- bers and concentrations of experimental beads could be calculated from relative counts done by the flow cytometer. Con- centration of the standard was verified with microscopic counts of 20 blanks for each experiment. They were filtered onto 0.2-pm filters, and 40 fields were counted at 160 x magnification for each standard on an epi-

Notes 695
Table 4. Ingestion of beads by 10 Daphnia magna. Animals fed 40 min.
Beads
Ammal
1 2 3 4 5 6 7 8 9
10 Mean
Particles in suspension
Relative efficiency on 0.57~r.lm beads*
Length (mm)
2.8 3.0 3.0 3.0 3.4 3.0 2.8 2.9 2.6 2.9 2.9
0.57 pm 2.5 firn (x 106) (x 105)
1.13 1.94 1.13 2.05 1.94 3.17 2.22 3.58 0.059 1.21 0.813 0.873 0.499 0.890 0.832 1.19 0.485 0.753 0.529 0.812 0.963 1.65
2.8 x lo5 4.2 x lo4
Ratlo 0.57 : 2.5
5.81 5.52 6.12 6.19 0.490 9.31 5.60 7.01 6.44 6.50 5.90
6.71
87.9%
Vol. ingested (nl)
1.69 1.79 2.78 3.15 1 .oo 0.793 0.776 1.05 0.663 0.716 1.44
* Ratlo (animal): ratlo (suspension).
fluorescence microscope. The standard and two experimental bead types were easily distinguished by green fluorescence excited at 488 nm, 800 mW in the flow cytometer, and each sample was analyzed until a count of 1,000 (Daphnia) or 5,000 (Bos- mina) standard beads was reached.
Feeding of cladocerans in the size-selec- tion experiment is shown in Fig. 3, and FCM analysis compared favorably with micro- scopic analysis of gut contents (Table 3). The advantages of FCM are that it counts a larger subsample of an individual’s gut and that the analysis is much faster (l-2 min per animal with FCM vs. about 40 min per animal by microscope).
One of the major advantages of this meth- od of analyzing feeding experiments is that the individual feeding of the animals can be examined (Table 4). All animals in these experiments were healthy and active, but not all animals fed nor did those feeding do so at the same rates, illustrating individual
behavior in spite of the animals being from the same clone. Of 10 D. magna fed 40 min, total volume ingested varied fourfold, al- though body sizes were similar (Table 4). One of the 10 fed more on 0.57~pm beads, another on 2.5~pm beads, but most were nonselective (Table 4).
In these experiments, apparent net inges- tion rate declined between 1.5 and 3 h (5,400-10,800 s; Fig 3a). This decrease would indicate either that the ingestion rate had decreased, due to a nearly full gut, or that defecation of beads had increased. After 3 h (10,800 s) of feeding, Daphnia guts ap- peared full when observed under a micro- scope. It is possible that the number of beads retained in the gut could increase beyond 3 h due to stretching and distending of the gut.
For certain measurements, it is appro- priate to delete individuals that do not feed. We did so for the total numbers of particles ingested and for the relative efficiency of
Table 5. Cladoceran clearance rates and relative feeding efficiency. Means of all feeding times up to 40 min.
Particle
Clearance rate
(ml arum.-’ h-l 1 &95% C.I. N
Relative efficiency
K +c.1. N
Daphnia 0.57~pm beads 4.04 0.58 60 88.4% 8.0 58 2.53~pm beads 4.89 0.599 60 - Microcystis 1.66 0.449 40 -
Bosmina* 0.57~pm beads 0.047 0.026 9 37.6% 12.4 33 2.53~pm beads 0.127 0.0658 9 -
* 20-min experiment only.

696 Notes
2.0 2.5 3.2 4.0
Body Length, mm
Fig. 4. Regression of Daphnia magna gut volume on body length (head to base of tail spine).
feeding on small particles. Bosmina showed less ability to ingest small (0.57 pm) parti- cles than did Daphnia (Table 5), as also not- ed by DeMott and Kerfoot (1982). Selectiv- ity of D. magna varied among individuals (Table 4).
Total gut volume of Daphnia was mea- sured with 2.5-pm beads alone. Animals were allowed to feed for 5 h in a suspension of 1 x 1 O6 beads ml- I, yielding a bead con- centration 20 x greater than in the previous experiment. The volume concentration of beads was close to the optimal feeding con- centration of D. magna (Porter et al. 1982). Microscopic examination revealed that the animals’ guts were completely filled with beads, including esophagus and hindgut. After fixing, the animals were sonicated and analyzed as above.
The relation of Daphnia gut volume to body length is shown in Fig. 4. We assumed that the beads were in close hexagonal pack- ing in the gut (e.g. Fenchel 1980) yielding a gut volume of 1.24 x volume of ingested beads. The exponent relating body length to gut volume was 3.4. Specific metabolism of cladocerans may be constant or increase during ontogeny (Lynch et al. 1986), re- quiring a gut volume-body length exponent of 23.
To illustrate that the method can be used to analyze live food particles, we show an experiment with the cyanobacterium A4. aeruginosa. Animals were first placed in fil- tered water to which 5.7-pm, colorless poly- styrene beads had been added. This procedure cleared their guts of pigment- containing food particles that might inter-
I I I
2 10 IO3
Feeding Time, s
Fig. 5. Daphnia magna feeding on Microcystis. Mi- crocystis-m; 5.7~brn particles that were prefed to the animals before the experiment-Cl. Means ? 2 SE; un- connected symbols near y-axis represent killed con- trols.
fere with fluorescent measurement of the experimental Microcystis. They were prefed with the beads for 8 h, followed by 16 h of additional starvation in filtered water. Ten animals were placed in each of four sieves in beakers as before, and a feeding aliquot of Microcystis was added to each. Feeding treatments were killed control, 300, 600, 1,200, and 2,400 s. Animals were anesthe- tized in club soda, measured, preserved in 2% formaldehyde, and stored in the dark at 5°C. They were sonicated and filtered as be- fore. In the flow cytometer, Microcystis was detected with orange-red fluorescence (> 590 nm), standard beads with green fluorescence (530-5 50 nm), and colorless 5.7-pm beads with FALS. Excitation was 800 mW at 5 14 nm. Samples were counted to 2,000 stan- dard beads.
Temporal as well as individual variability also occurred when Daphnia fed on Micro- cystis (Fig. 5). Feeding decreased slightly during exposures of 5-20 min, possibly re- flecting initial sampling by the animals, fol- lowed by acclimation to the feeding con- ditions. The animals did not substantially clear their guts of the residual 5.7~pm beads, perhaps because the cumulative volume of the Microcystis (N 1 -pm diam) was small. These cyanobacteria are a poor, possibly toxic, food source for Daphnia (Nizan et al. 1986) and clearance rate was low (Table 5). In the 40-min experiment, there was no clear effect of digestion or mastication of the Mi- crocystis. In many animals (30-50%) the flu-

Notes 697
Table 6. Ingestion of amide- and carboxyl-surfaced beads by Bosmina tubicen in Okefenokee Swamp water. N = 14 animals. Percent efficiency is the ratio of observed (in gut) to expected (in suspension), referenced to 2.5~km beads.
Beads Concn m
suspension
No. ingested*
x SD
% efficiency
.z SD
Efficiency rat10 amide : carboxyl
R SD
0.50-pm amide 2.7 x lo5 4.5 2.4 86 15 2.3 0.63
0.5 7-pm carboxyl 6.9 x lo5 5.5 3.7 39 25 2.5-pm carboxyl 1.5X 10⁴ 0.30 0.16 100 -
* x 10).
orescence intensity of the food particles was reduced, although cell size was not affected. This decline may reflect leakage or destruc- tion of pigments following ingestion (Con- over et al. 1986), although cells were not broken into smaller fragments. Differential digestion of algae is known (Porter 1973). We recommend short experimental feeding times to minimize losses due to mastication and digestion.
A commonly used measure of the impact of filter feeders on their prey population and on pelagic waters as a whole is clearance rate. As a population measure, it should comprise all animals, including those that do not feed. Clearance rates are given in Table 5, but should be interpreted with cau- tion. Feeding rates are affected by accli- mation to the feeding conditions, and these animals were not acclimated. We include them as an illustration of what can be mea- sured with direct gut content analysis by flow cytometry.
To measure rates on acclimated animals under steady state conditions, one could use food particles labeled with fluorescent dyes such as DAPI, FITC, AO, or immunoflu- orescent markers (e.g. Bohlool and Schmidt 1980). The labeled particles would then be added after animals had acclimated to feed- ing conditions. Alternatively, an aliquot of fluorescent beads could be added to a food suspension as a marker, assuming the beads are ingested with the same efficiency as the food particles.
Long experimental feeding times lead to erroneous clearance rates since egestion may begin in 12 h. These methods cannot dis- tinguish between reduction in calculated mean feeding rate due to satiation and that due to egestion of food particles.
A strength of this method is that it allows investigation of passive, nonbehavioral food selection mechanisms. Surface chemistry of small particles is known to affect the effi- ciency with which particles are retained (Gerritsen and Porter 1982). For this illus- tration of the method, we repeated an earlier experiment to determine feeding efficiency on beads with amide surfaces vs. those with carboxyl surfaces (Gerritsen and Porter 1982).
We fed Bosmina a mixture of 0.50~pm, amide-surfaced beads (blue), 0.57-pm, car- boxyl-surfaced beads (green), and 2.5 -pm, carboxyl-surfaced beads (green) in the ratio of 18 : 46 : 1. The large beads are effectively sieved at 100% efficiency, and feeding effi- ciency of the two smaller beads is measured relative to the large beads.
The blue beads required UV excitation, and we found that 300-mW UV was also sufficient to obtain some green fluorescence from the coumarin-stained green beads. A UV filter blocked the laser light, a 540-nm, short-pass dichroic filter deflected the blue fluorescence to a PMT equipped with a 5 30- nm, short-pass filter, and the green PMT had a 5 15-nm, long-pass filter.
Amide-surfaced particles, which have less surface charge than carboxyl-surfaced par- ticles, were ingested at more than twice the efficiency of the carboxyl particles (Table 6), in accord with our previous results for Daphnia (Gerritsen and Porter 1982).
Flow cytometry for crustacean feeding studies works best with smaller food par- ticles such as bacteria or cyanobacteria (< 5 pm). Larger food cells, such as Chlamy- domonas, are not recommended since they break up under both sonication and mas- tication.

698 Notes
Flow cvtometrv is a fast and efficient ingestion, digestion and egestion by suspension
means fo; direct- gut-content analysis of feeders. Mar. Ecol. Prog. Ser. 24: 201-204.
zooplankton. Our samples were analyzed at DEMOIT, W. R., AND W. C. KERFOOT. 1982. Com-
20 h-l or faster, and machine plus techni- petition among Cladocerans: Nature of the inter- action between Bosmina and Daphnia. Ecology --
cian time is typically $125 h- I, yielding a 63: 1949-1966. cost, in 1986, of $6.25 per sample. Micro- FENCHEL, T. 1980. Suspension feeding in a ciliated
scopic analysis is 1.5 h- l at $ lo-$ 15 h- ’ protozoan: Functional response and particle size
technician time or $7-$10 per sample. FCM selection. Microb. Ecol. 6: l-l 1.
is thus less costly and at least 13 times faster GERRITSEN, J., AND K. G. PORTER. 1982. The role of
surface chemistry in filter feeding by zooplankton. than microscopic analysis. It would be Science 216: 1225-l 227.
equally feasible to do these analyses with a -, AND J. R. STRICKLER. 1977. Encounter prob-
smaller benchtop or microscope-based flow abilities and community structure in zooplankton:
cytometer (e.g. Olson et al. 1983). A mathematical model. J. Fish. Res. Bd. Can. 34: 73-82.
- We have made direct measurements of HESSEN, D. 0. 1985. Filtering structures and particle individual feeding to yield estimates of size selection in coexisting Cladocera. Oecologia
within-population variability, selectivity, 66: 368-372.
feeding rates, feeding mechanisms, and LYNCH, M., L. J. WEIDER, AND W. LAMPERT. 1986.
morphology. These methods are especially Measurement of the carbon balance in Daphnia. Limnol. Oceanogr. 31: 17-33.
easy for microscopic ciliate or flagellate MAYR, E. 1982. The growth of biological thought.
feeding since individual protozoans can be Harvard.
analyzed without separation from the feed- NIZAN, S., C. DIMENTMAN, AND M. SHILO. 1986. Acute
ing suspension. FCM analysis saves time toxic effects of the cyanobacterium Microcystis aeruginosa on Daphnia magna. Limnol. Ocean-
and allows exneriments to be done with oar. 31: 497-502. - more samples and more replicates than oth- OLSO;, R. J., S. L. FRANKEL, S. W. CHISHOLM, AND H.
er counting methods. M. SHAPIRO. 1983. An inexpensive flow cytom- eter for the analysis of fluorescence signals in phy-
Jeroen Gerritsen toplankton: Chlorophyll and DNA distributions.
Robert W. Sanders J. Exp. Mar. Biol. Ecol. 68: 129-144. PETERS, R. H. 1984. Methods for the study of feeding,
Department of Zoology and grazing and assimilation by zooplankton, p. 336-
Institute of Ecology 412. Zn J. A. Downing and F. H. Rigler [eds.], A manual on methods for the assessment of second-
University of Georgia ary productivity in fresh waters, 2nd ed. Blackwell. Athens 30602 PORTER, K. G. 1973. Selective grazing and differential
Susan W. Bradley digestion of algae by zooplankton. Nature 244: 179-180.
Institute of Ecology University of Georgia
-, J. GERRITSEN, AND J. D. ORCUTT, JR. 1982. The effect of food concentration on swimming pat- tern, feeding behavior, ingestion, assimilation, and
Karen G. Porter respiration by Daphnia. Limnol. Oceanogr. 27: 935-949.
Department of Zoology and Institute of Ecology
-, AND J. D. ORCUTT, JR. 1980. Nutritional adequacy, manageability and toxicity as factors that determine the food quality of green and blue-
University of Georgia green algae for Daphnia. Am. Sot. Limnol. Ocean- ogr. Spec. Symp. 3: 268-281. New England.
SANDERS, R. W., AND K. G. PORTER. 1986. Use of
References metabolic inhibitors to estimate protozooplank- ton grazing and bacterial production in a mono-
BOHLOOL, B. B., AND E. L. SCHMIDT. 1980. Immu- mictic eutrophic lake with an anaerobic hypolim- nofluorescence applications in microbial ecology. nion. Appl. Environ. Microbial. 52: 101-107. Adv. Soil Microb. Ecol. 4: 203-241. STOECKER, D. K., T. C. CUCCI, E. M. HULBURT, AND
CONOVER, R.J.,R. DURVASULA,~. ROY,AND R. WANG. C. M. YENTSCH. 1986. Selective feeding by Bal- 1986. Probable loss of chlorophyll-derived pig- union sp. (Ciliata: Balanionidae) on phytoplank- ments during passage through the gut of zooplank- ton that best support its growth. J. Exp. Mar. Biol. ton, and some of the consequences. Limnol. Ecol. 95: 113-130. Oceanogr. 31: 878-887. TRASK, B. J., G. J. VAN DEN ENGH, AND J. H. EL-
CUCCI, T. L., AND OTHERS. 1985. Flow cytometry: A GERSHUIZEN. 1982. Analysis of phytoplankton by new method for characterization of differential flow cytometry. Cytometry 2: 258-264.

Notes 699
WOOD, A. M., AND OTHERS. 1985. Discrimination between types of pigments in marine Synechococ- cus spp. by scanning spectroscopy, epifluorescence microscopy, and flow cytometry. Limnol. Ocean- ogr. 30: 1303-1315.
and cell sorting: A technique for analysis and sort- ing of aquatic particles. Limnol. Oceanogr. 28: 1275-1280.
Submitted: 1 April 1986 Accepted: 19 December 1986 YENTSCH, C. M., AND OTHERS. 1983. Flow cytometry
Limnol. Oceanogr., 32(3), 1987, 699-702 0 1987, by the American Society of Limnology and Oceanography, Inc.
Flatworm predator (Mesostoma cf. lingua) releases a toxin to catch planktonic prey (Daphnia magna) l
Abstract-In aquaria, Daphnia magna de- creased in numbers as the population density of the substrate-bound predaceous flatworm Me- sostoma cf. lingua increased. Above a threshold worm density, Daphnia disappeared completely. It was shown experimentally that this was due to the presence in the environment of a neurotoxin diffusing from webs of mucus produced by the worm. The toxin decomposed rapidly, and its inactivation rate was strongly temperature-de- pendent. It is concluded that Mesostoma is an ambush predator with a strategy that comes clos- est to that of a web-building spider, but with the complication that both the worm and the web are poisonous.
Many aquatic predators release com- pounds into the water which signal their presence to possible prey. Prey typically react by morphological changes, making them less vulnerable to the predator. Thus, Brachio- nus calyczjlorus develops posterior spines in response to the presence of Asplanchna (de Beauchamp 1952; Gilbert 1967); Daph- nia carinata develops a helmet in the pres- ence of notonectids (Grant and Bayly 198 1); various Keratella species develop longer spines in the presence of cyclopoid preda- tors or Asplanchna than in their absence (Green 1980; Gilbert and Stemberger 1984; Stemberger and Gilbert 1984); Daphnia pu- lex produces dorsal spines (Nackenzahne) which render it less vulnerable to Cha- oborus americanus (Krueger and Dodson 1981).
In these examples the nontoxic nature of
I Dedicated to W. T. Edmondson on the occasion of his official university retirement with wishes for con- tinued scholarly productivity.
the predator chemical conveys an advan- tage to the prey, not to the predator. The reverse, i.e. the condition in which a pred- ator continuously releases a compound tox- ic to its prey, is here documented for the rhabdocoelid flatworm Mesostoma cf. lin- gua.
The predatory nature of rhabdocoelids has been known for a long time. Steinmann and Von Bresslau (19 13) and Von Bresslau (1933) described the hunting behavior of Mesostoma ehrenbergii as follows: the flat- worm hangs on a mucous thread and cap- tures daphnids which swim by, engulfing them with its ventral body surface and sub- sequently sucks them out. A similar behav- ior was also reported by Schwartz and He- bert (1982); in addition, mucus trapping (Pennak 1978) and active searching (Bauch- henss 197 1; Schwartz and Hebert 1982) are performed. Thus, the idea that flatworms may be an important element in shaping zooplankton communities, especially in small ponds and in the weedy littoral of lakes, is rapidly gaining support (Maly et al 1980; Schwartz and Hebert 1987). Occa- sionally, hints are made to the “poisonous” (Steinmann and Von Bresslau 19 13) or “paralyzing” (Schwartz and Hebert 19 8 2) effect of the touch of a Mesostoma on its prey, but the release of a toxin into the en- vironment has not been advocated before.
The flatworm M. cf. lingua was obtained from dried mud collected in 1980 by H.J.D. in a pan in the valley of the Pongolo River, South Africa, and hatched in aquaria in the laboratory later. This strain differs from strains from Europe and North Ameica by