hydrological long-term dry and wet periods in the xijiang river basin, south china
TRANSCRIPT
Hydrol. Earth Syst. Sci., 17, 135–148, 2013www.hydrol-earth-syst-sci.net/17/135/2013/doi:10.5194/hess-17-135-2013© Author(s) 2013. CC Attribution 3.0 License.
Hydrology andEarth System
Sciences
Hydrological long-term dry and wet periods in the Xijiang Riverbasin, South China
T. Fischer1,2, M. Gemmer1,2, B. Su1,3, and T. Scholten2
1National Climate Center of the China Meteorological Administration, Beijing, China2Department of Geosciences, University of Tubingen, Tubingen, Germany3Nanjing University of Information, Science and Technology, Nanjing, China
Correspondence to:T. Fischer ([email protected]) and B. Su ([email protected])
Received: 11 July 2012 – Published in Hydrol. Earth Syst. Sci. Discuss.: 19 September 2012Revised: 24 November 2012 – Accepted: 22 December 2012 – Published: 17 January 2013
Abstract. In this study, hydrological long-term dry and wetperiods are analyzed for the Xijiang River basin in SouthChina. Daily precipitation data of 118 stations and data ondaily discharge at Gaoyao hydrological station at the mouthof the Xijiang River for the period 1961–2007 are used. Ata 24-month timescale, the standardized precipitation index(SPI-24) for the six sub-basins of the Xijiang River and thestandardized discharge index (SDI-24) for Gaoyao station areapplied. The monthly values of the SPI-24 averaged for theXijiang River basin correlate highly with the monthly valuesof the SDI-24. Distinct long-term dry and wet sequences canbe detected.
The principal component analysis is applied and showsspatial disparities in dry and wet periods for the six sub-basins. The correlation between the SPI-24 of the six sub-basins and the first principal component score shows that67 % of the variability within the sub-basins can be explainedby dry and wet periods in the east of the Xijiang Riverbasin. The spatial dipole conditions (second and third prin-cipal component) explain spatiotemporal disparities in thevariability of dry and wet periods. All sub-basins contributeto hydrological dry periods, while mainly the northeasternsub-basins cause wet periods in the Xijiang River. We canalso conclude that long-term dry events are larger in spatialextent and cover all sub-basins while long-term wet eventsare regional phenomena.
A spectral analysis is applied for the SPI-24 and the SDI-24. The results show significant peaks in periodicities of11–14.7 yr, 2.8 yr, 3.4–3.7 yr, and 6.3–7.3 yr. The same pe-riodic cycles can be found in the SPI-24 of the six sub-basinsbut with some variability in the mean magnitude. A wavelet
analysis shows that significant periodicities have been sta-ble over time since the 1980s. Extrapolations of the recon-structed SPI-24 and SDI-24 represent the continuation ofobserved significant periodicities at given magnitudes until2030. The projected hydrological long-term dry and wet pe-riods can be used for planning purposes in water resourcesmanagement. The applied methodologies prove to be able toidentify spatial disparities, and to detect significant period-icities in hydrological long-term dry and wet periods in theXijiang River basin.
1 Introduction
Decadal sequences of wet and dry years are historically doc-umented for China, including the Huanghe (Yellow) River,the Yangtze River, and the Zhujiang (Pearl) River. Spatiotem-poral changes in hydrological dry and wet patterns havebeen observed for large areas in China for the past 50–60 yr since the meteorological and hydrological observationnetwork has been extended. China is influenced by com-plex atmospheric circulation regimes that result in diverseprecipitation patterns. These cause more frequent meteoro-logical weather risks such as extreme droughts or seriousfloods than recorded in other parts of the world (Bordi etal., 2004a). A significant share of the global economic lossesdue to floods in the last decades has been recorded in China.According to the Munich Reinsurance Company (Berz andKron, 2004), the floods on the Yangtze and Songhua riversin 1998 and the 1996 floods on the Yangtze, Huanghe andHuaihe rivers caused material damages of 30.7 billion USD
Published by Copernicus Publications on behalf of the European Geosciences Union.
136 T. Fischer et al.: Hydrological long-term dry and wet periods
and 24 billion USD, respectively (nominal 1998 and 1996price level). Droughts in the north, northeast, and southwestof China in 2009 have caused direct economic losses of about18 billion USD.
Regional climate characteristics and the spatiotemporalvariation of dry and wet periods in China have been de-scribed nationally (Zhai et al., 2010a, b), regionally (Bordiet al., 2003, 2004a; Zhai and Qi, 2009), and on basin scales(Zhang et al., 2005; Gemmer et al., 2008; Fischer et al., 2011,2012, 2013). For China, the highest number of articles on ob-served changes in precipitation and river discharge are avail-able for the Yangtze and the Yellow River. For example, Zhaiet al. (2010b) analyzed changes from wet to more dry con-ditions and their impacts on the stream flow in the westernregions of the Yellow and Yangtze rivers in the past 50 yr.Liu et al. (2011) projected an increase in spring/summer pre-cipitation and its corresponding stream flow of the YellowRiver for the 21st century. In the past few years, more litera-ture on these topics has been made available for the Zhujiangand Xijiang rivers.
The Xijiang River basin is located in subtropical SouthChina. It is the major tributary of the Zhujiang River basin,the third largest river basin in China, and has a population ofmore than 100 million. The population and industrializationhave been increasing in recent decades. Thus the damage po-tential resulting from extreme climate events and other natu-ral disasters has risen (Feng et al., 2007; Fischer et al., 2011,2012, 2013; Gemmer et al., 2011). Changes in precipitationand discharge in the Xijiang River basin with its tributariesare an important field of study for understanding their inter-action and consequences.
As many other large rivers in China, the Xijiang River aspart of the Zhujiang River basin is characterized by dams.The total storage capacity of reservoirs in the entire Zhu-jiang River basin had reached 65 km3 by 2005, which ac-counts for 23 % of the annual water discharge of the river(Dai et al., 2008). Annual water discharge is mainly influ-enced by variability in precipitation, and the construction ofreservoirs/dams in the Zhujiang River basin had little influ-ence on water discharge (Zhang et al., 2008).
Precipitation variability has therefore a high impact on wa-ter discharge in the Xijiang River. Recent findings on precip-itation trends, climate extremes, and change points (Fischeret al., 2011, 2012) suggest that the hydrology in the XijiangRiver basin has also changed. Xu et al. (2010) indicated thatannual discharge of the Zhujiang River correlates well withbasin-averaged precipitation. However, Gemmer et al. (2011)have observed increasing tendencies to dryer conditions andstronger precipitation intensities for the entire Zhujiang Riverbasin from 1961 to 2007. Fischer et al. (2011) have observedincreasing numbers for dry days, and Zhang et al. (2009)confirmed a tendency to drier conditions in the west of thebasin. Another study suggests that the Zhujiang River basinhas the largest human footprint of the 10 largest river basinsin South and East Asia (Varis et al., 2012). Observations in
climatological and hydrological time series show spatiotem-poral changes of stream flow in the past 50 yr, mostly on an-nual scale. The characteristics and frequencies of long-termdry and wet periods in the Xijiang River basin have yet tobe detected. Most of the studies mentioned above employedstandard methods for assessing spatiotemporal changes inprecipitation, in discharge, and in their trends, e.g. the stan-dardized precipitation index, the aridity index, and nonpara-metric trend tests.
The main interest of this study is to evaluate changes inlong-term precipitation pattern and their hydrological im-pact on the Xijiang River. The characteristics of hydrologicallong-term dry and wet periods are therefore analyzed in thismanuscript. In previous studies, Bordi et al. (2003, 2004a, b,2007) and Subash et al. (2011) applied the standardized pre-cipitation index, the principal component analysis, and thepower spectrum including the Morlet wavelet transform toassess the climatic conditions of a certain area, to capturepattern of co-variability, and to predict significant cycles ofdry and wet periods. Combining these methods, we put ourfocus on the fluctuations in long-term dry and wet sequencesof the past and the near future (1961–2030) in the XijiangRiver basin. Therefore, we apply the standardized precipita-tion index (SPI), which is recommended by the World Mete-orological Organization (WMO) to characterize wet and dryperiods (Klein Tank et al., 2009). Alongside, the standardizeddischarge index (SDI) is applied to characterize dry and wetperiods in river discharge. This will allow identifying howprecipitation patterns influence the discharge of the river. Thetime series of the SPI and SDI are extrapolated in order to de-tect indications on dry and wet periods until 2030. This willbe important information for water management and the de-sign of adaptation measures.
In the following chapter, we first introduce the regionalsettings, the data we obtained and generated, and the method-ologies we applied. The methodologies include the calcula-tion of the SPI and SDI and the analysis of their principalcomponents to identify regions with common climate vari-ability. In Sect. 2, the power spectrum and the wavelet trans-form are applied to determine periodic cycles and to extrap-olate the time series until 2030. In Sect. 3, the results aredelivered for dry and wet periods in the Xijiang River basinand its six sub-basins. Finally, the findings are discussed andconcluded in Sect. 4.
2 Regional settings, data, and methods
2.1 Regional settings
The Zhujiang River basin in subtropical South China (Fig. 1)covers an area of approximately 450 000 km2 with a popula-tion of more than 160 million. The region is one of the eco-nomically most prosperous areas of China and has very highdevelopment rates. Its GDP per capita accounts for more than
Hydrol. Earth Syst. Sci., 17, 135–148, 2013 www.hydrol-earth-syst-sci.net/17/135/2013/

T. Fischer et al.: Hydrological long-term dry and wet periods 137
Fig. 1.Location of the river system, the six sub-basins, and the me-teorological and hydrological stations in the Xijiang River basin inSouth China.
40 000 CNY per year, which is one of China’s highest rates(National Bureau of Statistics of China:www.stats.gov.cn).Since the 1950s, approximately 9000 dams with a reservoirstorage capacity of 65 km3 have been constructed (Dai et al.,2008; Waterpub, 2012). In 2008, the Longtan Dam, China’sthird largest hydropower dam with an estimated capacity of4.9 GW, started operating in the upper reaches of the Hong-shui River (China Daily, 2008).
The Xijiang (west) River is the largest tributary of the Zhu-jiang River and accounts for 78 % of the total drainage areaof the Zhujiang River basin. The daily discharge of the Xi-jiang River is observed at Gaoyao hydrological station. Inthis study, the Xijiang River basin is divided into its six sub-basins (Beipan, Nanpan, Yujiang, Hongshui, Liujiang, andLijiang; see Fig. 1) in order to achieve a high level of spatialdifferentiation. Due to the availability of discharge data atGaoyao and the high importance in the Zhujiang River basin,the Xijiang River basin and its six sub-basins are examinedon their hydrological long-term dry and wet periods.
2.2 Data
Daily precipitation data of 118 weather stations in the Xi-jiang River basin (Fig. 1) for the period 1961–2007 and dailyaverage discharge data of the hydrological station at Gaoyaoon the Xijiang River for the period 1961–2006 are used. TheNational Meteorological Information Center (NMIC) of theChina Meteorological Administration (CMA) provided thedatasets. Each dataset was controlled on quality by the NMIC(Qian and Lin, 2005). The NMIC checked the data on homo-geneity using the departure accumulation method (Buishand,1982). Less than 0.1 percent of data gaps appear in daily pre-cipitation records.
2.3 Methods
2.3.1 Standardized precipitation and discharge indices(SPI & SDI)
At first, the total precipitation for the Xijiang River basin andseparately for its six sub-basins (Fig. 1) is calculated on aweighted area approach using the Thiessen polygon method.This method is a common approach for modelling the spatialdistribution of rainfall based on station observations (Jianget al., 2007). A Thiessen polygon is formed around eachmeteorological station by first creating lines to the nearestneighbours. These lines are then bisected with perpendicu-lars that join either another perpendicular or the border of asub-basin/basin to form the polygons. Each polygonal areais recalculated and then displayed as the percentage of thetotal area of the sub-basin/basin. For each station, the pre-cipitation is multiplied with the respective percentage of itsThiessen polygon. The calculations of all polygons inside asub-basin/basin are summed up to represent the total precipi-tation of the respective sub-basin/basin. In this study, the totalprecipitation of each sub-basin/basin is used to calculate thestandardized precipitation index (SPI) for the six sub-basinsand the entire Xijiang River basin.
The SPI is calculated with the statistical software R toquantify dry and wet periods (McKee et al., 1993). The SPIis a meteorological index using monthly precipitation data(Mishra and Singh, 2010). Comprehensive descriptions onthe SPI and its application in China are available, e.g. fromBordi et al. (2004a), Zhang et al. (2009), Zhai et al. (2010a,b), and Zhao et al. (2012). The SPI is calculated for theweighted area-averaged monthly precipitation data and com-puted by fitting the two-parameter gamma distribution to thefrequency distribution of the precipitation summed to a 24-month timescale (SPI-24). Here, the 24-month scale is suit-able for the determination of hydrological dry and wet peri-ods (Bordi et al., 2004a).
The standardized discharge index (SDI) is calculated cor-respondingly to the SPI. The same approach and distribu-tion function (two-parameter gamma distribution) is applied.The SDI contains monthly discharge data and expresses hy-drological excess or deficit availability of water. McKee etal. (1993) suggested the application of the SPI procedureto other water variables, such as observed discharge data.Hence, the method can be derived from McKee et al. (1993),Nalbantis and Tsakiris (2009), and Mishra and Singh (2010),although the respective terminology and input data vary ineach of the manuscripts. To our best knowledge, the SDI hasnot been applied in the Xijiang River basin before. In thisstudy, the SDI is calculated for monthly averaged dischargedata at a 24-month scale (SDI-24).
In our analyses, we partially consider the categories ofthe SPI/SDI values according to Lloyd-Hughes and Saun-ders (2002), who defined the values at−1.00 to−1.49 asmoderately dry (−1.50 to−1.99 as severely dry, and−2 or
www.hydrol-earth-syst-sci.net/17/135/2013/ Hydrol. Earth Syst. Sci., 17, 135–148, 2013
138 T. Fischer et al.: Hydrological long-term dry and wet periods
less as extremely dry), and the values at 1.00 to 1.49 as mod-erately wet (1.50 to 1.99 as severely wet, and 2 or more asextremely wet). As we use the averages of total precipitation(for Xijiang and its six sub-basins), lower SPI values occurthan if single station data would have been used such as forthe SDI. Hence, the magnitudes of dry and wet categories inthe SPI of the sub-basins are not comparable with those ofthe entire basin (and the SDI).
2.3.2 Principal component analysis
The principal component analysis (PCA) is broadly used foridentifying patterns in climate data and for highlighting theirsimilarities and differences (Santos et al., 2011). Bordi etal. (2003, 2004a, b, 2007) and Zhao et al. (2012) describethe use and background of the PCA in detail. In this study,we calculate the PCA with the statistical software R and usethe PCA for identifying the spatial co-variability of the SPI-24 in the six sub-basins of the Xijiang River. A set of linearlyindependent spatial patterns (loadings) is generated, whichdescribes the correlations with the specific principal compo-nents (PC). We analyze the spatial homogeneity or hetero-geneity of dry and wet periods in the Xijiang River’s sub-basins with the results for the PCA’s loading patterns. Theresults are used to underline the regional disparities and inter-relations of dry and wet periods at the sub-basin scale.
2.3.3 Power spectrum and continuous wavelet analysis
The fast Fourier transform is used to generate the power spec-trum of the signal in the monthly time series (Schonwiese,2006; Wilks, 2006). We determine significant periodicitiesthat are embedded in the time series based on the ampli-tude of the corresponding signal. Similarly, a continuouswavelet transform is used to break up the signal into shiftedand scaled versions of the original wavelet by decompos-ing a time series into a time/frequency space (Torrence andCompo, 1998). In this study, we apply the Morlet wavelet,which is the most commonly used continuous wavelet trans-form for visualizing the amplitudes in the time/frequencyspace. The calculations are made with the related packages ofthe statistical software R. The significance of the amplitudesof the periodicities is based on the 90 % confidence level thatis calculated with the Chi-squared distribution at four degreesof freedom (Becker et al., 2008; Bordi et al., 2004a). The re-sults are used for detecting periodicities and their changesin time (i.e. time–frequency relationships) in climatologicaldatasets. Gao et al. (2010) used the continuous wavelet trans-form likewise in order to assess the fluctuation of monthlyobserved and projected average stream flows (return periodsof extremes) in the Huaihe River basin in China. Becker etal. (2008) determined quasi-periodicities of extreme precip-itation events in the Yangtze River basin by employing thecontinuous wavelet analysis.
2.3.4 Extrapolation
The time series for the SPI-24 and SDI-24 are extrapolatedfrom 2007 to 2030 in order to show dry and wet periodsfor the next two decades, using the parameterized software“AutoSignal”. We apply the fast Fourier transform to the sig-nificant periodicities that have been identified in the powerspectrum analysis. We estimate future monthly values by ex-trapolating the observed time series as applied by Bordi etal. (2004a). This estimation is based on the assumption thatthe significant periods are stable in time; i.e. the periodicity issimilar for the following two decades (Becker et al., 2008).We expect that there will be no major changes in the fre-quency of dry and wet periods (i.e. stable periodicities) in thenear future (until 2030), as previous studies (e.g. Gemmer etal., 2011; Fischer et al., 2011) did find few significant trendsonly in observed monthly precipitation pattern. In order tocharacterize the reliability of this assumption, we investigatethe stability of significant periods in the wavelet analyses.
3 Results
3.1 Relationship between precipitation and discharge
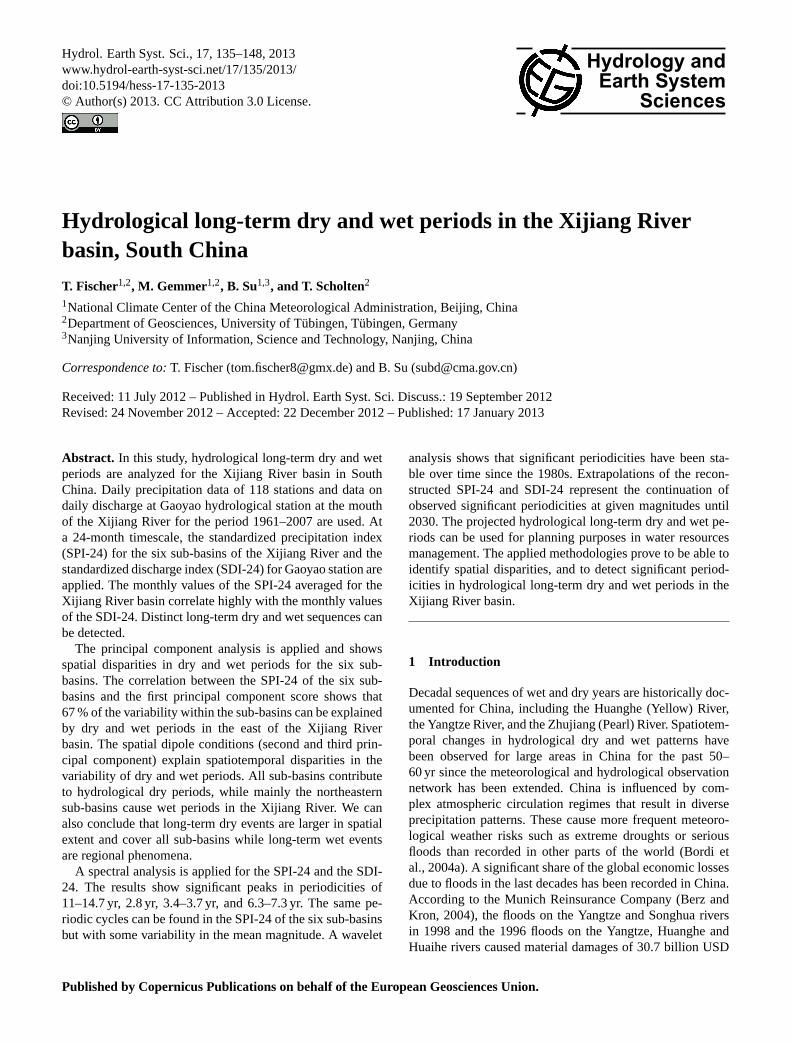
We follow the principle that a river basin as a hydrologicalunit is drained by a river of first order and its tributaries andthat most precipitation over the land area of the river basinwill result in surface runoff that accumulates in the main riversystem. Hence, the annual precipitation over the river basincan be compared with the discharge at the point where it exitsthe defined river basin’s boundary. Figure 2 shows the timeseries of the area-averaged annual precipitation in the XijiangRiver basin and the mean annual discharge at Gaoyao hydro-logical station from 1961 to 2006. The annual average pre-cipitation is about 1350 mm, and the inter-annual variabilityis 10 % according to the coefficient of variation. Two dis-tinct minima in annual precipitation (below 1100 mm) canbe observed for 1963 and 1989, respectively. A maximum inannual precipitation (above 1700 mm) occurred in 1994.
The annual average discharge from 1961 to 2006 is7000 m3 s−1 (Fig. 2). The inter-annual variability is 19 %.Two minima in discharge (below 5000 m3 s−1) appeared in1963 and 1989, consecutively with the minima in precipita-tion. Two maxima (above 10 000 m3 s−1) can be observed in1968 and 1994. A strong correlation (0.88) is found for themonthly area-averaged precipitation and monthly dischargeat Gaoyao station from 1961 to 2006.
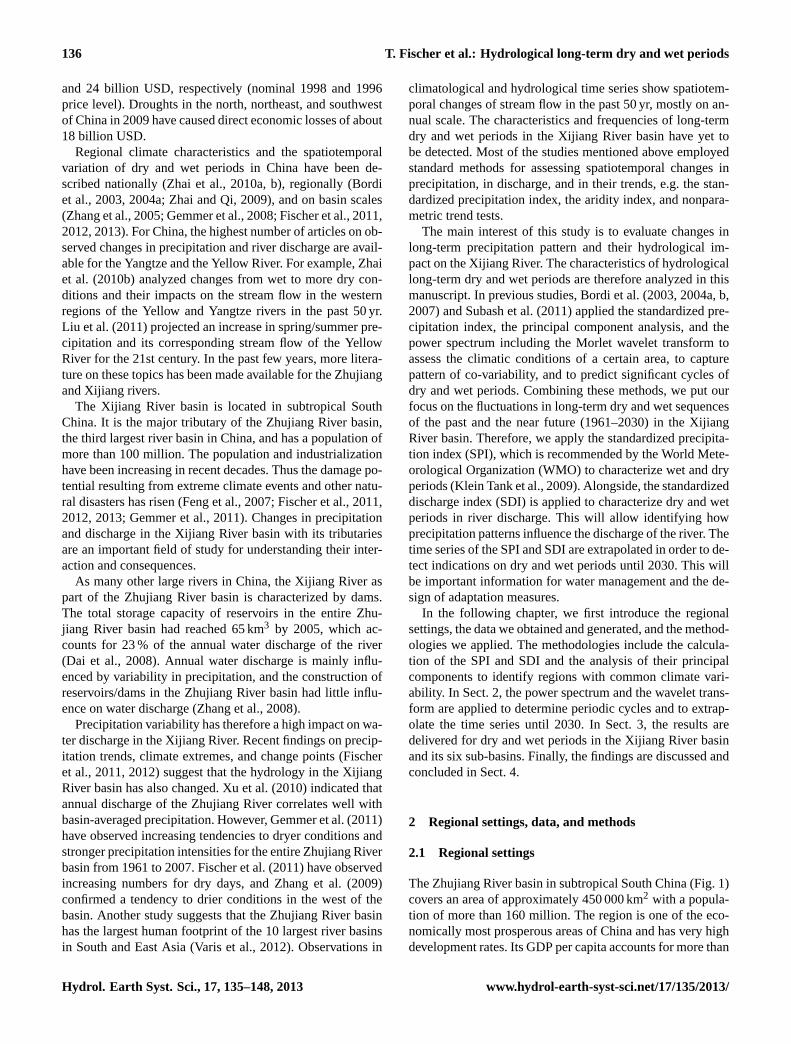
Figure 3 shows the average distribution of monthly pre-cipitation in the Xijiang River basin and the average distri-bution of monthly discharge at Gaoyao hydrological stationfrom 1961–2006. June shows the highest monthly precipi-tation with nearly 250 mm. The highest monthly dischargecan be measured in July with nearly 16 000 m3 s−1. We canidentify a distinct seasonality with a noticeable dry period
Hydrol. Earth Syst. Sci., 17, 135–148, 2013 www.hydrol-earth-syst-sci.net/17/135/2013/
T. Fischer et al.: Hydrological long-term dry and wet periods 139
Fig. 2. Annual precipitation (grey bars) in the Xijiang River basinand annual discharge (black line) at Gaoyao hydrological station1961–2006.
Fig. 3. Average monthly precipitation (grey bars) in the XijiangRiver basin and average monthly discharge (black line) at Gaoyaohydrological station 1961–2006.
from November to March, when monthly precipitation is lessthan 50 mm and monthly discharge can account for less than4000 m3 s−1. Based on the coefficient of variation, the high-est inner-annual variability of monthly precipitation can beobserved in December with 69 % and the highest monthlyvariability of discharge occurs in March (64 %). The highpercentages are mainly due to the low magnitudes of pre-cipitation and discharge in these months.
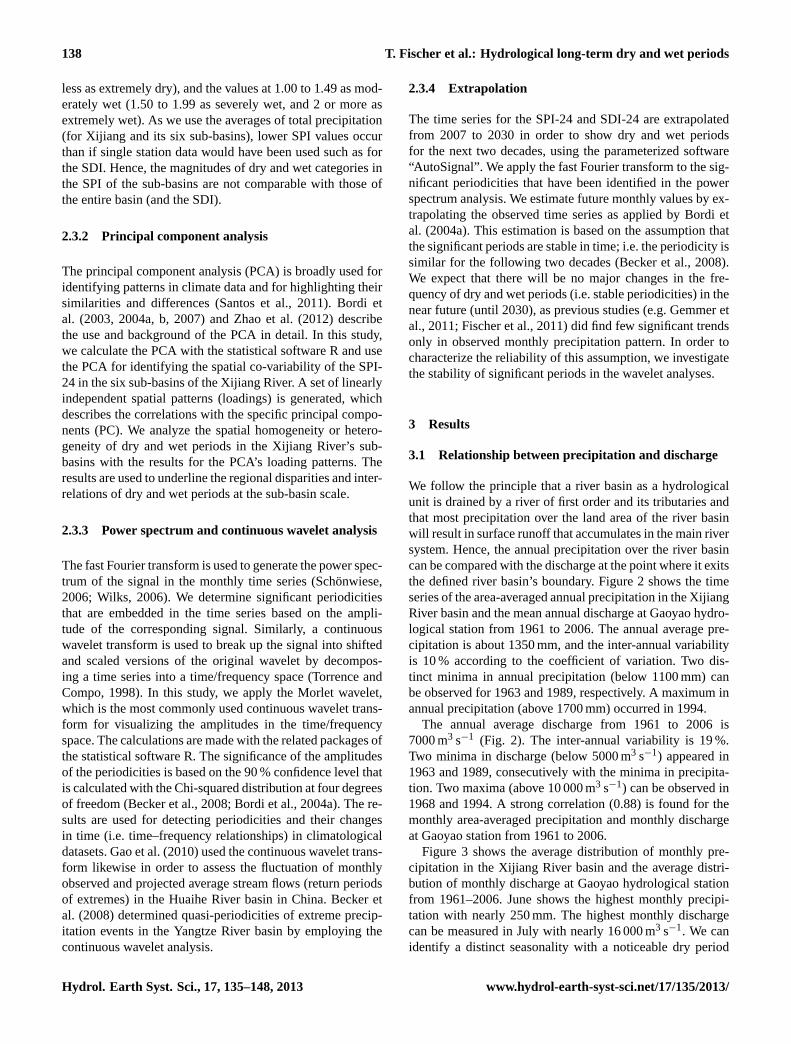
The monthly precipitation and discharge in 1963 and 1994are shown in Fig. 4. As compared to the long-term average,much less (more) precipitation and discharge was observedin 1963 (1994), especially in summer (May to August). Pre-cipitation and discharge were 40 % to 85 % below average in1963 and 30 % to 100 % above average in 1994.
The time series show a strong correlation between themonthly area-averaged precipitation and monthly dischargein the Xijiang River basin. Based on the monsoon climate inthe research area, the inner-annual variability of precipitationand discharge corresponds as expected. It is of high interestwhether the inter-annual variability of precipitation and dis-charge can be linked to typical hydrological long-term dryand wet periods. Therefore, the magnitude and periodicity of
Fig. 4. Average monthly precipitation (grey bars) in the XijiangRiver basin and average monthly discharge (black line) at Gaoyaohydrological station in 1963 (left) and 1994 (right).
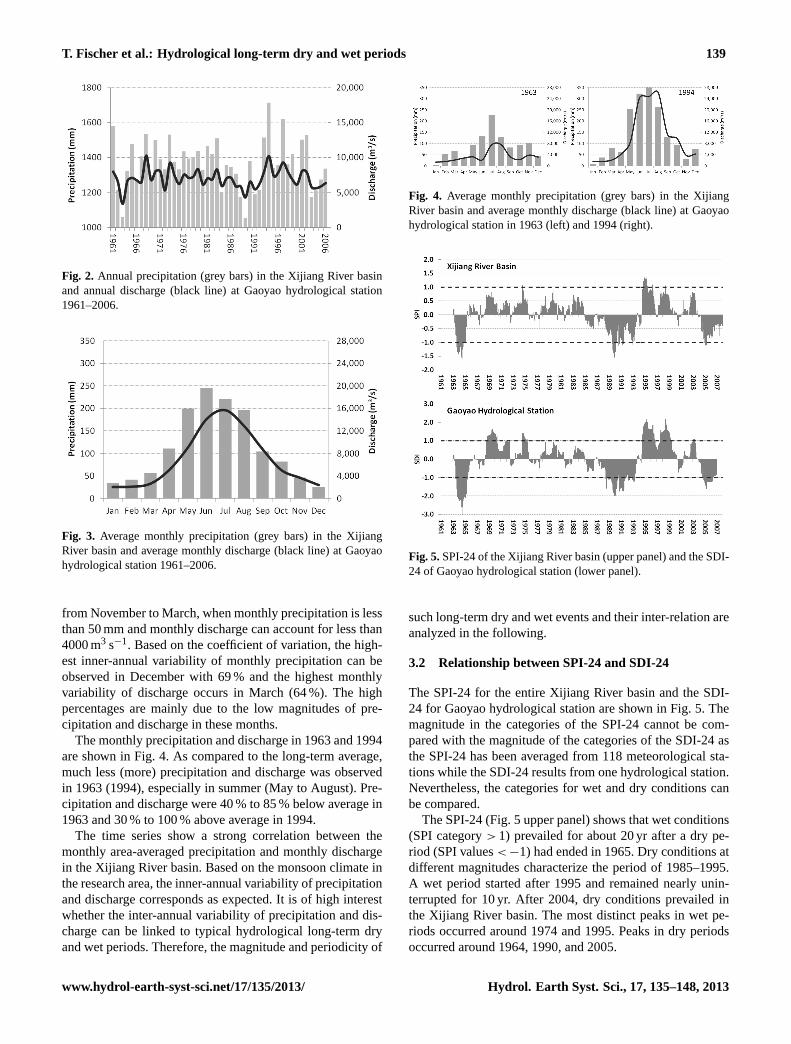
Fig. 5.SPI-24 of the Xijiang River basin (upper panel) and the SDI-24 of Gaoyao hydrological station (lower panel).
such long-term dry and wet events and their inter-relation areanalyzed in the following.
3.2 Relationship between SPI-24 and SDI-24
The SPI-24 for the entire Xijiang River basin and the SDI-24 for Gaoyao hydrological station are shown in Fig. 5. Themagnitude in the categories of the SPI-24 cannot be com-pared with the magnitude of the categories of the SDI-24 asthe SPI-24 has been averaged from 118 meteorological sta-tions while the SDI-24 results from one hydrological station.Nevertheless, the categories for wet and dry conditions canbe compared.
The SPI-24 (Fig. 5 upper panel) shows that wet conditions(SPI category> 1) prevailed for about 20 yr after a dry pe-riod (SPI values< −1) had ended in 1965. Dry conditions atdifferent magnitudes characterize the period of 1985–1995.A wet period started after 1995 and remained nearly unin-terrupted for 10 yr. After 2004, dry conditions prevailed inthe Xijiang River basin. The most distinct peaks in wet pe-riods occurred around 1974 and 1995. Peaks in dry periodsoccurred around 1964, 1990, and 2005.
www.hydrol-earth-syst-sci.net/17/135/2013/ Hydrol. Earth Syst. Sci., 17, 135–148, 2013

140 T. Fischer et al.: Hydrological long-term dry and wet periods
Table 1.Duration and magnitude of peak events in dry (SPI< −1) and wet (SPI> 1) periods in the six sub-basins of the Xijiang River basin,the entire basin (Xijiang), and at Gaoyao hydrological station (SDI< −1, SDI> 1), 1963–2006.
Duration (months)
Peak Event in: Period Nanpan Beipan Hongshui Liujiang Yujiang Lijiang Xijiang Gaoyao
Dry period 1963–1965 14 9 16 20 20 19 18 25(< −1) 1988–1990 17 14 11 8 16 3 10 25
1990–1992 8 11 3 4 5 22 7 202004–2006 2 27 6 3 6 8 6 22
event sum 41 61 36 35 47 52 41 92
Wet period 1968–1970 0 13 12 7 0 0 0 21(> 1) 1974/1975 3 0 2 2 8 12 2 11
1994–1996 0 0 13 20 5 21 12 261997/1998 0 0 2 3 2 15 1 23
event sum 3 13 29 32 15 48 15 81
Mean Magnitude (sum of monthly SPI values)
Peak Event in: Period Nanpan Beipan Hongshui Liujiang Yujiang Lijiang Xijiang Gaoyao
Dry period 1963–1965 −21.4 −11.3 −23.1 −25.1 −26.8 −24.7 −23.0 −51.0(< −1) 1988–1990 −23.0 −25.8 −15.7 −9.5 −21.1 −3.4 −13.1 −35.7
1990–1992 −8.5 −20.1 −3.2 −4.6 −6.0 −30.5 −7.8 −29.32004–2006 −3.4 −33.4 −6.4 −3.1 −6.3 −10.2 −6.5 −29.5
event sum −56.3 −90.6 −48.5 −42.4 −60.2 −68.8 −50.4 −145.5
Wet period 1968–1970 0.0 16.0 13.5 7.7 0.0 0.0 0.0 29.1(> 1) 1974/1975 3.3 0.0 2.3 2.1 9.2 14.0 2.2 13.5
1994–1996 0.0 0.0 20.0 35.2 5.3 28.0 14.4 43.81997/1998 0.0 0.0 2.1 3.4 2.2 18.0 1.0 35.7
event sum 3.3 16.0 37.9 48.5 16.7 60.0 17.6 122.1
Changes in the categories of the SDI-24 (Fig. 5 lowerpanel) occurred similarly to that in the SPI-24. The SDI-24 takes the same chronological positive and negative courseand shows the same peaks and durations of dry and wet peri-ods as the SPI-24. The highest peak of dry conditions in theSPI-24 (around 1964) marks the most severe dry event in theSDI-24. The coefficient of correlation of the average SPI-24and the SDI-24 is 0.94.
The peak years in SPI-24/SDI-24 occur simultaneouslywith the maxima and minima in the annual precipitation andannual average discharge (Fig. 2). The SPI-24/SDI-24 re-veals long-term dry and wet periods for the Xijiang Riverbasin. The strong similarities imply a high impact of naturalprecipitation pattern on the discharge. This relationship canbe spatially disaggregated and explained by investigating theSPI-24 of the six sub-basins.
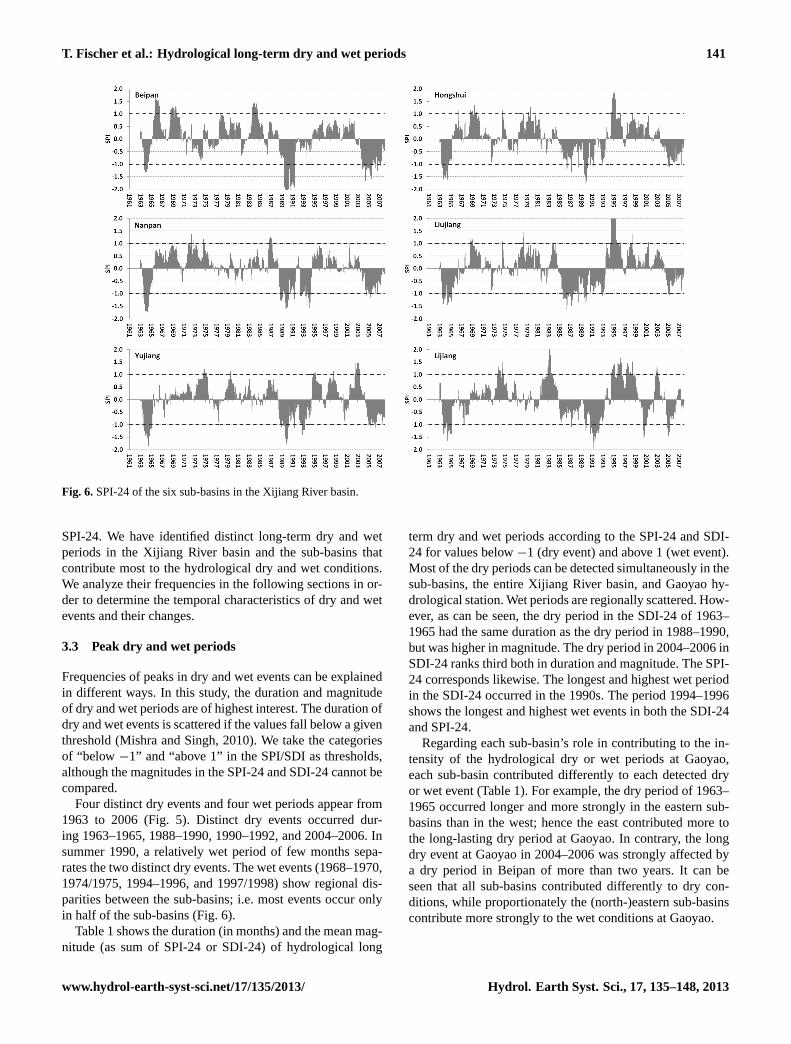
The SPI-24 of the six sub-basins is illustrated in Fig. 6.Sequences of wet and dry periods vary in the sub-basins. Ingeneral, the SPI-24 of the sub-basins takes the same courseas the averaged SPI-24 for the entire basin (Fig. 5). However,the wet conditions after 1965 are more distinct (1) in magni-tude for the Beipan sub-basin (northwest) and (2) in duration
for the Nanpan sub-basin (west). Beipan shows a higher mag-nitude in the dry event of the early 1990s, whereas dry con-ditions lasted longer in the Liujiang sub-basin (southeast).
Focusing on wet periods (SPI> 1) and dry periods (SPI< −1), dry events appear simultaneously in all six sub-basinsaround 1965, 1990 and 2005. The dry event around 1986 ap-pears in 50 % of the sub-basins. Most of the wet periods ap-peared simultaneously in two to three of the sub-basins only(e.g. 1983, 2003). The wet event around 1975 occurred infive of the six sub-basins, but wet periods never appeared si-multaneously in all of the six sub-basins. Figure 6 shows thespatial variability of dryness and wetness conditions. As canbe seen, dry periods have a larger spatial extent than wet pe-riods.
The correlation coefficient between the SPI-24 of eachof the six sub-basins and the SDI-24 varies between 0.65(Beipan) and 0.82 (both Hongshui and Yujiang). This sug-gests that each sub-basin has a considerable impact on theSDI-24 at Gaoyao hydrological station. However, some sub-basins contribute higher to the discharge than others.
Conclusively, dry and wet periods in the SDI-24 canbe profoundly explained by dry and wet conditions in the
Hydrol. Earth Syst. Sci., 17, 135–148, 2013 www.hydrol-earth-syst-sci.net/17/135/2013/
T. Fischer et al.: Hydrological long-term dry and wet periods 141
Fig. 6.SPI-24 of the six sub-basins in the Xijiang River basin.
SPI-24. We have identified distinct long-term dry and wetperiods in the Xijiang River basin and the sub-basins thatcontribute most to the hydrological dry and wet conditions.We analyze their frequencies in the following sections in or-der to determine the temporal characteristics of dry and wetevents and their changes.
3.3 Peak dry and wet periods
Frequencies of peaks in dry and wet events can be explainedin different ways. In this study, the duration and magnitudeof dry and wet periods are of highest interest. The duration ofdry and wet events is scattered if the values fall below a giventhreshold (Mishra and Singh, 2010). We take the categoriesof “below −1” and “above 1” in the SPI/SDI as thresholds,although the magnitudes in the SPI-24 and SDI-24 cannot becompared.
Four distinct dry events and four wet periods appear from1963 to 2006 (Fig. 5). Distinct dry events occurred dur-ing 1963–1965, 1988–1990, 1990–1992, and 2004–2006. Insummer 1990, a relatively wet period of few months sepa-rates the two distinct dry events. The wet events (1968–1970,1974/1975, 1994–1996, and 1997/1998) show regional dis-parities between the sub-basins; i.e. most events occur onlyin half of the sub-basins (Fig. 6).
Table 1 shows the duration (in months) and the mean mag-nitude (as sum of SPI-24 or SDI-24) of hydrological long
term dry and wet periods according to the SPI-24 and SDI-24 for values below−1 (dry event) and above 1 (wet event).Most of the dry periods can be detected simultaneously in thesub-basins, the entire Xijiang River basin, and Gaoyao hy-drological station. Wet periods are regionally scattered. How-ever, as can be seen, the dry period in the SDI-24 of 1963–1965 had the same duration as the dry period in 1988–1990,but was higher in magnitude. The dry period in 2004–2006 inSDI-24 ranks third both in duration and magnitude. The SPI-24 corresponds likewise. The longest and highest wet periodin the SDI-24 occurred in the 1990s. The period 1994–1996shows the longest and highest wet events in both the SDI-24and SPI-24.
Regarding each sub-basin’s role in contributing to the in-tensity of the hydrological dry or wet periods at Gaoyao,each sub-basin contributed differently to each detected dryor wet event (Table 1). For example, the dry period of 1963–1965 occurred longer and more strongly in the eastern sub-basins than in the west; hence the east contributed more tothe long-lasting dry period at Gaoyao. In contrary, the longdry event at Gaoyao in 2004–2006 was strongly affected bya dry period in Beipan of more than two years. It can beseen that all sub-basins contributed differently to dry con-ditions, while proportionately the (north-)eastern sub-basinscontribute more strongly to the wet conditions at Gaoyao.
www.hydrol-earth-syst-sci.net/17/135/2013/ Hydrol. Earth Syst. Sci., 17, 135–148, 2013
142 T. Fischer et al.: Hydrological long-term dry and wet periods
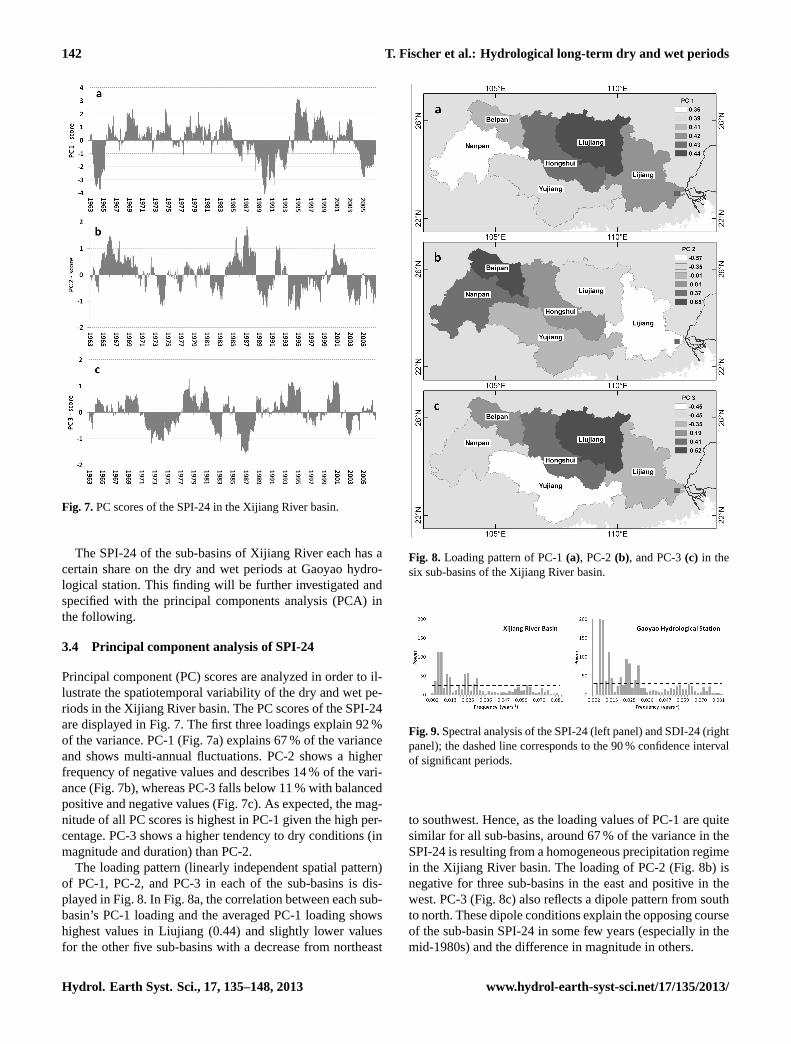
Fig. 7.PC scores of the SPI-24 in the Xijiang River basin.
The SPI-24 of the sub-basins of Xijiang River each has acertain share on the dry and wet periods at Gaoyao hydro-logical station. This finding will be further investigated andspecified with the principal components analysis (PCA) inthe following.
3.4 Principal component analysis of SPI-24
Principal component (PC) scores are analyzed in order to il-lustrate the spatiotemporal variability of the dry and wet pe-riods in the Xijiang River basin. The PC scores of the SPI-24are displayed in Fig. 7. The first three loadings explain 92 %of the variance. PC-1 (Fig. 7a) explains 67 % of the varianceand shows multi-annual fluctuations. PC-2 shows a higherfrequency of negative values and describes 14 % of the vari-ance (Fig. 7b), whereas PC-3 falls below 11 % with balancedpositive and negative values (Fig. 7c). As expected, the mag-nitude of all PC scores is highest in PC-1 given the high per-centage. PC-3 shows a higher tendency to dry conditions (inmagnitude and duration) than PC-2.
The loading pattern (linearly independent spatial pattern)of PC-1, PC-2, and PC-3 in each of the sub-basins is dis-played in Fig. 8. In Fig. 8a, the correlation between each sub-basin’s PC-1 loading and the averaged PC-1 loading showshighest values in Liujiang (0.44) and slightly lower valuesfor the other five sub-basins with a decrease from northeast
Fig. 8. Loading pattern of PC-1(a), PC-2(b), and PC-3(c) in thesix sub-basins of the Xijiang River basin.
Fig. 9.Spectral analysis of the SPI-24 (left panel) and SDI-24 (rightpanel); the dashed line corresponds to the 90 % confidence intervalof significant periods.
to southwest. Hence, as the loading values of PC-1 are quitesimilar for all sub-basins, around 67 % of the variance in theSPI-24 is resulting from a homogeneous precipitation regimein the Xijiang River basin. The loading of PC-2 (Fig. 8b) isnegative for three sub-basins in the east and positive in thewest. PC-3 (Fig. 8c) also reflects a dipole pattern from southto north. These dipole conditions explain the opposing courseof the sub-basin SPI-24 in some few years (especially in themid-1980s) and the difference in magnitude in others.
Hydrol. Earth Syst. Sci., 17, 135–148, 2013 www.hydrol-earth-syst-sci.net/17/135/2013/
T. Fischer et al.: Hydrological long-term dry and wet periods 143
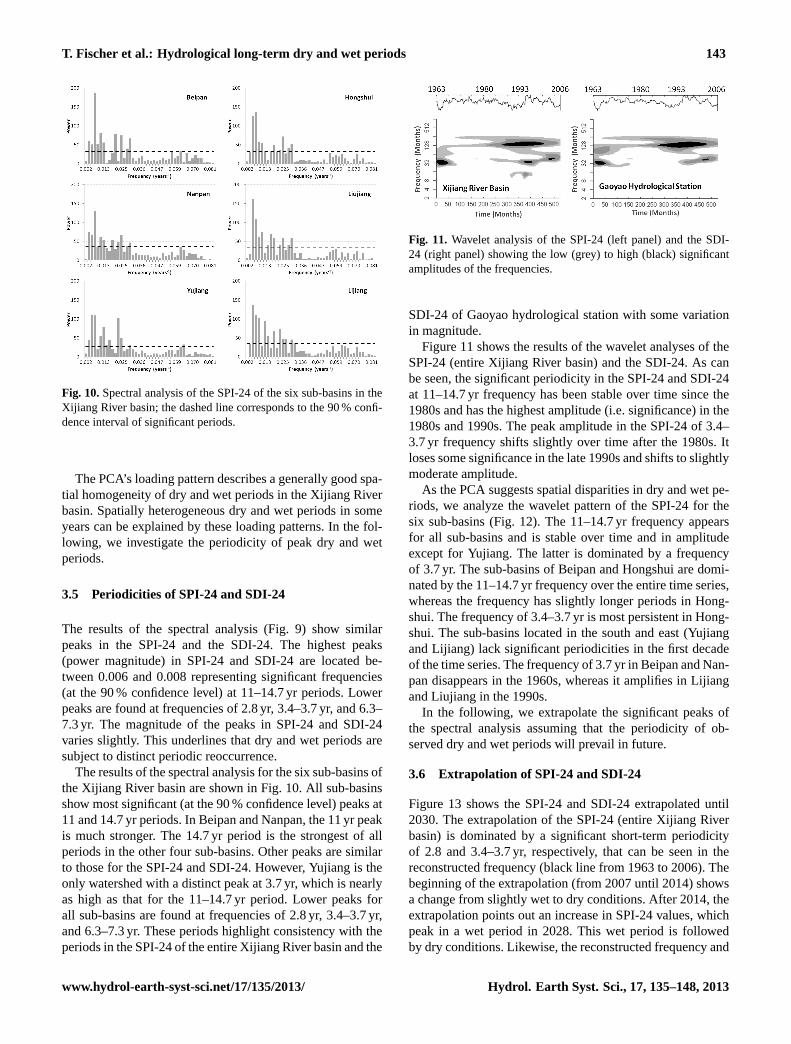
Fig. 10.Spectral analysis of the SPI-24 of the six sub-basins in theXijiang River basin; the dashed line corresponds to the 90 % confi-dence interval of significant periods.
The PCA’s loading pattern describes a generally good spa-tial homogeneity of dry and wet periods in the Xijiang Riverbasin. Spatially heterogeneous dry and wet periods in someyears can be explained by these loading patterns. In the fol-lowing, we investigate the periodicity of peak dry and wetperiods.
3.5 Periodicities of SPI-24 and SDI-24
The results of the spectral analysis (Fig. 9) show similarpeaks in the SPI-24 and the SDI-24. The highest peaks(power magnitude) in SPI-24 and SDI-24 are located be-tween 0.006 and 0.008 representing significant frequencies(at the 90 % confidence level) at 11–14.7 yr periods. Lowerpeaks are found at frequencies of 2.8 yr, 3.4–3.7 yr, and 6.3–7.3 yr. The magnitude of the peaks in SPI-24 and SDI-24varies slightly. This underlines that dry and wet periods aresubject to distinct periodic reoccurrence.
The results of the spectral analysis for the six sub-basins ofthe Xijiang River basin are shown in Fig. 10. All sub-basinsshow most significant (at the 90 % confidence level) peaks at11 and 14.7 yr periods. In Beipan and Nanpan, the 11 yr peakis much stronger. The 14.7 yr period is the strongest of allperiods in the other four sub-basins. Other peaks are similarto those for the SPI-24 and SDI-24. However, Yujiang is theonly watershed with a distinct peak at 3.7 yr, which is nearlyas high as that for the 11–14.7 yr period. Lower peaks forall sub-basins are found at frequencies of 2.8 yr, 3.4–3.7 yr,and 6.3–7.3 yr. These periods highlight consistency with theperiods in the SPI-24 of the entire Xijiang River basin and the
Fig. 11. Wavelet analysis of the SPI-24 (left panel) and the SDI-24 (right panel) showing the low (grey) to high (black) significantamplitudes of the frequencies.
SDI-24 of Gaoyao hydrological station with some variationin magnitude.
Figure 11 shows the results of the wavelet analyses of theSPI-24 (entire Xijiang River basin) and the SDI-24. As canbe seen, the significant periodicity in the SPI-24 and SDI-24at 11–14.7 yr frequency has been stable over time since the1980s and has the highest amplitude (i.e. significance) in the1980s and 1990s. The peak amplitude in the SPI-24 of 3.4–3.7 yr frequency shifts slightly over time after the 1980s. Itloses some significance in the late 1990s and shifts to slightlymoderate amplitude.
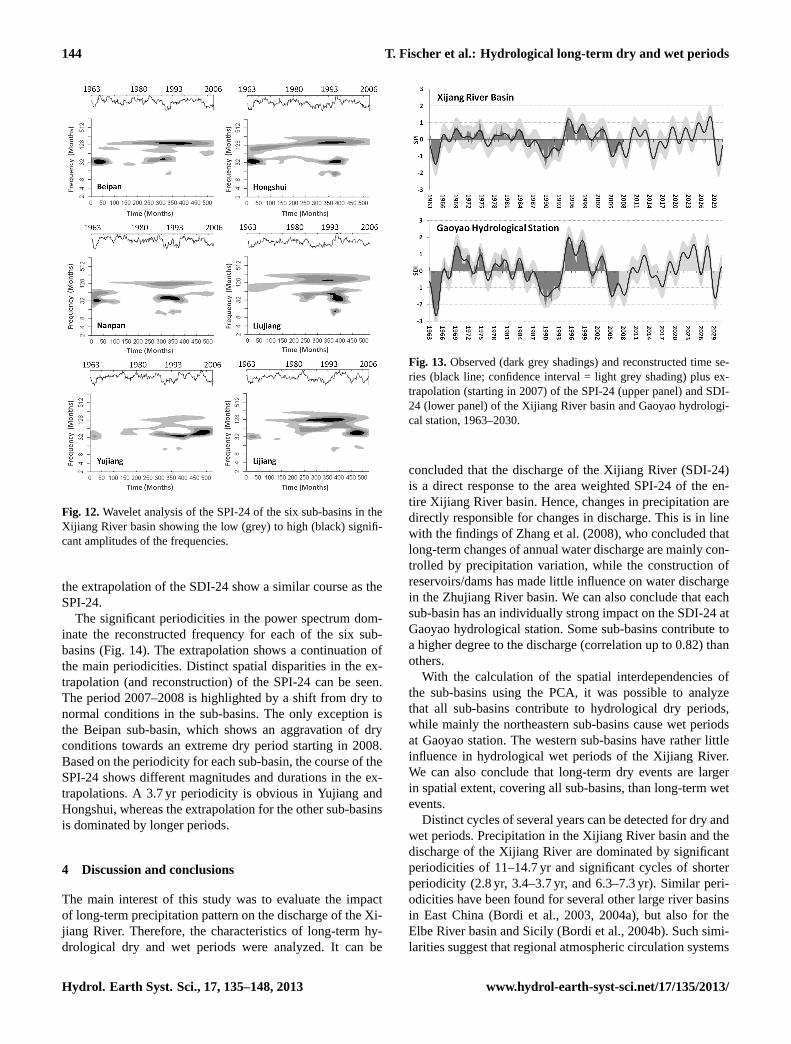
As the PCA suggests spatial disparities in dry and wet pe-riods, we analyze the wavelet pattern of the SPI-24 for thesix sub-basins (Fig. 12). The 11–14.7 yr frequency appearsfor all sub-basins and is stable over time and in amplitudeexcept for Yujiang. The latter is dominated by a frequencyof 3.7 yr. The sub-basins of Beipan and Hongshui are domi-nated by the 11–14.7 yr frequency over the entire time series,whereas the frequency has slightly longer periods in Hong-shui. The frequency of 3.4–3.7 yr is most persistent in Hong-shui. The sub-basins located in the south and east (Yujiangand Lijiang) lack significant periodicities in the first decadeof the time series. The frequency of 3.7 yr in Beipan and Nan-pan disappears in the 1960s, whereas it amplifies in Lijiangand Liujiang in the 1990s.
In the following, we extrapolate the significant peaks ofthe spectral analysis assuming that the periodicity of ob-served dry and wet periods will prevail in future.
3.6 Extrapolation of SPI-24 and SDI-24
Figure 13 shows the SPI-24 and SDI-24 extrapolated until2030. The extrapolation of the SPI-24 (entire Xijiang Riverbasin) is dominated by a significant short-term periodicityof 2.8 and 3.4–3.7 yr, respectively, that can be seen in thereconstructed frequency (black line from 1963 to 2006). Thebeginning of the extrapolation (from 2007 until 2014) showsa change from slightly wet to dry conditions. After 2014, theextrapolation points out an increase in SPI-24 values, whichpeak in a wet period in 2028. This wet period is followedby dry conditions. Likewise, the reconstructed frequency and
www.hydrol-earth-syst-sci.net/17/135/2013/ Hydrol. Earth Syst. Sci., 17, 135–148, 2013
144 T. Fischer et al.: Hydrological long-term dry and wet periods
Fig. 12.Wavelet analysis of the SPI-24 of the six sub-basins in theXijiang River basin showing the low (grey) to high (black) signifi-cant amplitudes of the frequencies.
the extrapolation of the SDI-24 show a similar course as theSPI-24.
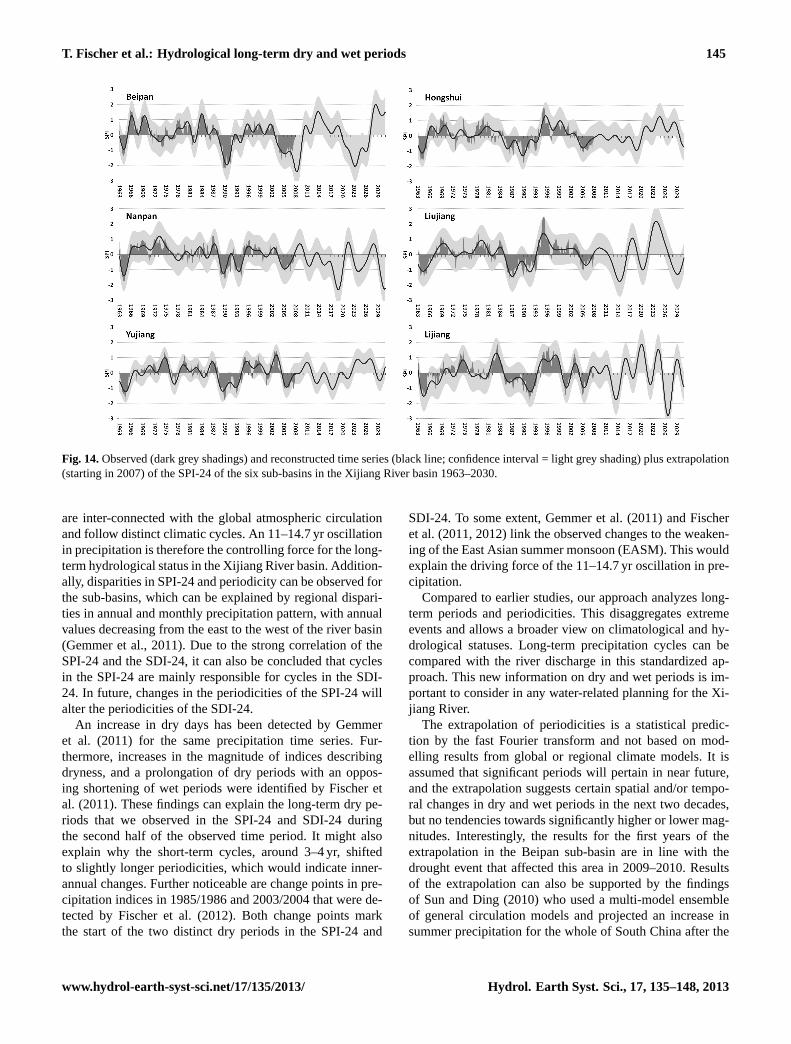
The significant periodicities in the power spectrum dom-inate the reconstructed frequency for each of the six sub-basins (Fig. 14). The extrapolation shows a continuation ofthe main periodicities. Distinct spatial disparities in the ex-trapolation (and reconstruction) of the SPI-24 can be seen.The period 2007–2008 is highlighted by a shift from dry tonormal conditions in the sub-basins. The only exception isthe Beipan sub-basin, which shows an aggravation of dryconditions towards an extreme dry period starting in 2008.Based on the periodicity for each sub-basin, the course of theSPI-24 shows different magnitudes and durations in the ex-trapolations. A 3.7 yr periodicity is obvious in Yujiang andHongshui, whereas the extrapolation for the other sub-basinsis dominated by longer periods.
4 Discussion and conclusions
The main interest of this study was to evaluate the impactof long-term precipitation pattern on the discharge of the Xi-jiang River. Therefore, the characteristics of long-term hy-drological dry and wet periods were analyzed. It can be
Fig. 13.Observed (dark grey shadings) and reconstructed time se-ries (black line; confidence interval = light grey shading) plus ex-trapolation (starting in 2007) of the SPI-24 (upper panel) and SDI-24 (lower panel) of the Xijiang River basin and Gaoyao hydrologi-cal station, 1963–2030.
concluded that the discharge of the Xijiang River (SDI-24)is a direct response to the area weighted SPI-24 of the en-tire Xijiang River basin. Hence, changes in precipitation aredirectly responsible for changes in discharge. This is in linewith the findings of Zhang et al. (2008), who concluded thatlong-term changes of annual water discharge are mainly con-trolled by precipitation variation, while the construction ofreservoirs/dams has made little influence on water dischargein the Zhujiang River basin. We can also conclude that eachsub-basin has an individually strong impact on the SDI-24 atGaoyao hydrological station. Some sub-basins contribute toa higher degree to the discharge (correlation up to 0.82) thanothers.
With the calculation of the spatial interdependencies ofthe sub-basins using the PCA, it was possible to analyzethat all sub-basins contribute to hydrological dry periods,while mainly the northeastern sub-basins cause wet periodsat Gaoyao station. The western sub-basins have rather littleinfluence in hydrological wet periods of the Xijiang River.We can also conclude that long-term dry events are largerin spatial extent, covering all sub-basins, than long-term wetevents.
Distinct cycles of several years can be detected for dry andwet periods. Precipitation in the Xijiang River basin and thedischarge of the Xijiang River are dominated by significantperiodicities of 11–14.7 yr and significant cycles of shorterperiodicity (2.8 yr, 3.4–3.7 yr, and 6.3–7.3 yr). Similar peri-odicities have been found for several other large river basinsin East China (Bordi et al., 2003, 2004a), but also for theElbe River basin and Sicily (Bordi et al., 2004b). Such simi-larities suggest that regional atmospheric circulation systems
Hydrol. Earth Syst. Sci., 17, 135–148, 2013 www.hydrol-earth-syst-sci.net/17/135/2013/
T. Fischer et al.: Hydrological long-term dry and wet periods 145
Fig. 14.Observed (dark grey shadings) and reconstructed time series (black line; confidence interval = light grey shading) plus extrapolation(starting in 2007) of the SPI-24 of the six sub-basins in the Xijiang River basin 1963–2030.
are inter-connected with the global atmospheric circulationand follow distinct climatic cycles. An 11–14.7 yr oscillationin precipitation is therefore the controlling force for the long-term hydrological status in the Xijiang River basin. Addition-ally, disparities in SPI-24 and periodicity can be observed forthe sub-basins, which can be explained by regional dispari-ties in annual and monthly precipitation pattern, with annualvalues decreasing from the east to the west of the river basin(Gemmer et al., 2011). Due to the strong correlation of theSPI-24 and the SDI-24, it can also be concluded that cyclesin the SPI-24 are mainly responsible for cycles in the SDI-24. In future, changes in the periodicities of the SPI-24 willalter the periodicities of the SDI-24.
An increase in dry days has been detected by Gemmeret al. (2011) for the same precipitation time series. Fur-thermore, increases in the magnitude of indices describingdryness, and a prolongation of dry periods with an oppos-ing shortening of wet periods were identified by Fischer etal. (2011). These findings can explain the long-term dry pe-riods that we observed in the SPI-24 and SDI-24 duringthe second half of the observed time period. It might alsoexplain why the short-term cycles, around 3–4 yr, shiftedto slightly longer periodicities, which would indicate inner-annual changes. Further noticeable are change points in pre-cipitation indices in 1985/1986 and 2003/2004 that were de-tected by Fischer et al. (2012). Both change points markthe start of the two distinct dry periods in the SPI-24 and
SDI-24. To some extent, Gemmer et al. (2011) and Fischeret al. (2011, 2012) link the observed changes to the weaken-ing of the East Asian summer monsoon (EASM). This wouldexplain the driving force of the 11–14.7 yr oscillation in pre-cipitation.
Compared to earlier studies, our approach analyzes long-term periods and periodicities. This disaggregates extremeevents and allows a broader view on climatological and hy-drological statuses. Long-term precipitation cycles can becompared with the river discharge in this standardized ap-proach. This new information on dry and wet periods is im-portant to consider in any water-related planning for the Xi-jiang River.
The extrapolation of periodicities is a statistical predic-tion by the fast Fourier transform and not based on mod-elling results from global or regional climate models. It isassumed that significant periods will pertain in near future,and the extrapolation suggests certain spatial and/or tempo-ral changes in dry and wet periods in the next two decades,but no tendencies towards significantly higher or lower mag-nitudes. Interestingly, the results for the first years of theextrapolation in the Beipan sub-basin are in line with thedrought event that affected this area in 2009–2010. Resultsof the extrapolation can also be supported by the findingsof Sun and Ding (2010) who used a multi-model ensembleof general circulation models and projected an increase insummer precipitation for the whole of South China after the
www.hydrol-earth-syst-sci.net/17/135/2013/ Hydrol. Earth Syst. Sci., 17, 135–148, 2013
146 T. Fischer et al.: Hydrological long-term dry and wet periods
2040s. Similarly, Fischer et al. (2013) projected climate ex-tremes in the Zhujiang River basin, using the regional climatemodel CCLM, and did not identify any significant trends inprecipitation extremes for the period 2011–2050. Zeng etal. (2012) applied the outputs from the general circulationmodel ECHAM5 to an artificial neural network to project fu-ture river discharge of the Yangtze River and did not identifyany obvious trends.
Based on these findings, we can draw the hypothesis thatit is more important to investigate periodic events than trendsor extremes. This hypothesis is supported by the statisticalapproach used in this study as compared to a physical or dy-namical approach. Although we are unable to reliably pre-dict the stability of the periodicities with statistical spectral-analysis methods (Ghil et al., 2011), we can put higher con-fidence in short-term extrapolations. These rely on observedsignificant periodicities and not only on near-future projec-tions of global or regional climate models (Becker et al.,2008).
In future, a physically based approach can be used to testthis hypothesis at a smaller regional scale and to considerregional disparities. A recent example can be drawn for theBeipan sub-basin. Our extrapolation shows extreme dry con-ditions in 2008–2009 that are spatially and temporally in linewith the observed long-term dry event that occurred in South-west China in 2009–2010 (Lu et al., 2012). Here, an anoma-lous weakening of the vertical Asian monsoon circulation inSouth Asia has been found responsible for this dry event. Theextrapolation for Beipan takes a different course than that ofthe other sub-basins. The newly available information on the2009–2010 drought proves the extrapolation to be correct. Ithas yet to be confirmed whether the magnitudes of the peaksare precise.
The PCA shows regional disparities in the SPI-24 for thesub-basins. The area-averaged SPI-24 for the Xijiang Riverbasin matches the SDI-24, and each sub-basin has differentlong-term dry and wet periods. At a regional level, any signif-icant changes of precipitation in the sub-basins will changethe discharge and long-term dry and wet periods. This fac-tor might have been underestimated in previous studies (e.g.Zhang et al., 2008). By applying the weighted SPI-24, it canbe concluded that Beipan has a distinct impact on the XijiangRiver’s hydrology, especially during dry conditions such asin 2008–2009. Therefore, the methodology proves to be suit-able for detecting significant periodicities and regional dis-parities in long-term dry and wet periods.
Our initial investigation on long-term dry and wet peri-ods and periodicities did not show any inter-connection withlarge-scale atmospheric circulation indices (e.g. El Nino–Southern Oscillation (ENSO), Madden–Julian oscillation[MJO]). Such physical explanations for the observed period-icities are required to gain more confidence on the stabilityof the cycles and, hence, of the reliability of the extrapolationfor the future (Ghil et al., 2011). Interestingly, several stud-ies have found similar periodicities of dry and wet events for
different regions worldwide, such as China, Europe and India(Bordi et al., 2004b, 2007; Boryczka and Stopa-Boryczka,2006; Subash et al., 2011). Studies by Bordi et al. (2003,2004a), Fischer et al. (2012), Gemmer et al. (2011), Lu etal. (2012), and Zhang et al. (2008) suggest that several large-scale atmospheric circulations cause changes in the strengthof the East Asian monsoon, which causes changing peri-odicities, change points, and trends in precipitation pattern.Nonetheless, the extrapolation of periodicities for the nextdecades provides valuable information on dry and wet pe-riods that can be used for flood risk forecasts and droughtpreparedness.
This study highlights the close spatiotemporal relationshipof climatological dry and wet periods with hydrological dryand wet periods. Very little influence of human activities canbe found in the monthly characteristics of hydrological pro-cesses. Water resource management planning and projectionsof hydrological long-term dry and wet periods in the XijiangRiver basin should take periodicities of regional precipitationpattern into consideration.
Acknowledgements.This study was supported by the Na-tional Basic Research Program of China (973 Program) (No.2010CB428401 and 2012CB955903), the Special Fund of ClimateChange of the China Meteorological Administration (CCSF2011-11), the National Natural Science Foundation of China(40910177), and the Sino-German Centre for Research Promotion,NSFC/DFG (GZ601). The position of Marco Gemmer is supportedby the Center for International Migration and Development(www.cimonline.de).
Edited by: L. Samaniego
References
Becker, S., Hartmann, H., Coulibaly, M., Zhang, Q., and Jiang, T.:Quasi periodicities of extreme precipitation events in the YangtzeRiver basin, China, Theor. Appl. Climatol., 94, 139–152, 2008.
Berz, G. and Kron, W.: Uberschwemmunskatastrophen undKlimaanderung: Trends und Handlungsoptions aus (Ruck-) Ver-sicherungssicht, 264–269, in: Warnsignal Klima: Genug Wasserfur alle? Wissenschaftliche Auswertungen, edited by: Lozan, J.L., Graßl, H., Hupfer, P., Menzel, L., and Schonwiese, C.-D.,Hamburg, Germany, 2004.
Bordi I., Fraedrich, K., Jiang, J., and Sutera, A.: Dry and wet periodsin Eastern Chinawatersheds: patterns and predictability, Journalof Lake Sciences, 15, 56–67, 2003.
Bordi, I., Fraedrich, K., Jiang, J. M., and Sutera, A.: Spatio-temporal variability of dry and wet periods in eastern China,Theor. Appl. Climatol., 79, 81–91, 2004a.
Bordi I., Fraderich, K., Gerstengarbe, F.-W., Werner, P. C., andSutera, A.: Potential predictability of dry and wet periods: Sicilyand Elbe-Basin (Germany), Theor. Appl. Climatol., 77, 125–138,2004b.
Hydrol. Earth Syst. Sci., 17, 135–148, 2013 www.hydrol-earth-syst-sci.net/17/135/2013/
T. Fischer et al.: Hydrological long-term dry and wet periods 147
Bordi, I., Fraedrich, K., Petitta, M., and Sutera, A.: Extreme valueanalysis of wet and dry periods in Sicily, Theor. Appl. Climatol.,87, 61–71, 2007.
Boryczka, J. and Stopa-Boryczka, M.: Cyclic Temperature and Pre-cipitation Fluctuations in Poland in the 19th–21st Centuries, Mis-cellanea Geographica, 12, 43–53, 2006.
Buishand, T. A.: Some methods for testing the homogeneity of rain-fall records, J. Hydrol., 58, 11–27, 1982.
China Daily: China’s 3rd-largest hydropower station to be fullyoperating this year, in: China Daily, 2 September 2008,available at: http://www.chinadaily.com.cn/china/2008-09/02/content6991918(last access: 19 January 2012), 2008.
Dai, S. B., Yang, S. L., and Cai, A. M.: Impacts of dams on thesediment flux of the Pearl River, southern China, Catena, 76, 36–43, 2008.
Feng, S., Nadarajah, S., and Hu, Q.: Modeling Annual Extreme Pre-cipitation in China Using the Generalized Extreme Value Distri-bution, J. Meteorol. Soc. Jpn., 85, 599–613, 2007.
Fischer, T., Gemmer, M., Liu, L., and Su, B.: Precipitation Trendsand dryness/wetness pattern in the Zhujiang River Basin, SouthChina, 1961–2007, Quaternary Int., 244, 138–148, 2011.
Fischer, T., Gemmer, M., Liu, L., and Jiang, T.: Change-pointsin climate extremes in the Zhujiang River Basin, South China,1961–2007, Climatic Change, 110, 783–799, 2012.
Fischer, T., Menz, C., Su, B., and Scholten, T.: Simulated andprojected climate extremes in the Zhujiang River Basin, SouthChina, using the regional climate model COSMO-CLM, Int. J.Climatol., in press, 2013.
Gao, C., Gemmer, M., Zeng, X., Liu, B., Su, B., and Wen, Y.: Pro-jected Streamflow in the Huaihe River Basin (2010–2100) us-ing Artificial Neural Networks (ANN). Stochastic EnvironmentalResearch and Risk Assessment, 24, 685–697, 2010.
Gemmer, M., Jiang, T., Su, B. D., and Kundzewicz, Z. W.: Seasonalprecipitation changes in the wet season and their influence onflood/drought hazards in the Yangtze River Basin, China, Qua-ternary Int., 186, 12–21, 2008.
Gemmer, M., Fischer, T., Jiang, T., Su, B., and Liu, L.: Trends ofPrecipitation Extremes in the Zhujiang River Basin, South China,J. Climate, 24, 750–761, 2011.
Ghil, M., Yiou, P., Hallegatte, S., Malamud, B. D., Naveau, P.,Soloviev, A., Friederichs, P., Keilis-Borok, V., Kondrashov, D.,Kossobokov, V., Mestre, O., Nicolis, C., Rust, H. W., Shebalin,P., Vrac, M., Witt, A., and Zaliapin, I.: Extreme events: dynam-ics, statistics and prediction, Nonlinear Proc. Geoph., 18, 295–350, 2011.
Jiang, T., Chen, Y. D., Xu, C., Chen, X., Chen, X., and Singh, V. P.:Comparison of hydrological impacts of climate change simulatedby six hydrological models in the Dongjiang Basin, South China,J. Hydrol., 336, 316–333, 2007.
Klein Tank, A. M. G., Zwiers, F., and Zhang, X.: Guidelines on– Analysis of extremes in a changing climate in support of in-formed decisions for adaptation. World Meteorological Organi-sation (WMO), Climate Data and Monitoring, WCDMP-No. 72,WMO-TD No. 1500, Geneva, Switzerland, 2009.
Liu, L. L., Liu, Z. F., Ren, X. Y., Fischer, T., and Xu, Y.: Hydrolog-ical impacts of climate change in the Yellow River Basin for the21st century using hydrological model and statistical downscal-ing model, Quaternary Int., 244, 211–220, 2011.
Lloyd-Hughes, B. and Saunders, M. A.: A drought climatology forEurope, Int. J. Climatol., 22, 1571–1592, 2002.
Lu, J. M., Ju, J. H., Ren, J. Z., and Gan, W. W.: The influence ofthe Madden-Julian Oscillation, activity anomalies on Yunnan’sextreme drought of 2009–2010, Sci. China Earth Sci., 55, 98–112, 2012.
McKee, T. B., Doesken, N. J., and Kleist, J.: The relationship ofdrought frequency and duration to time scales, Preprints EighthConf on Applied Climatology, Anaheim, CA. Am. Meteor. Soc.,Boston, 179–184, 1993.
Mishra, A. K. and Singh, V. P.: A review of drought concepts, J.Hydrol., 391, 202–216, 2010.
Nalbantis, I. and Tsakiris, G.: Assessment of hydrological droughtrevisited, Water Resour. Manage., 23, 881–897, 2009.
Qian, W. and Lin, X.: Regional trends in recent temperature indicesin China, Meteorol. Atmos. Phys., 90, 193–207, 2005.
Santos, J. F., Portela, M. M., and Pulido-Calvo, I.: Regional Fre-quency Analysis of Droughts in Portugal, Water Resour. Man-age., 25, 3537–3558, 2011.
Schonwiese, C.-D.: Praktische Statistik fur Meteorologen und Ge-owissenschaftler, 4th Edn., Gebruder Borntrager Verlagsbuch-handlung, Berlin, Stuttgart, 302 pp., 2006.
Subash, N., Sikka, A. K., and Ram Mohan, H. S.: An investiga-tion into observational characteristics of rainfalland temperaturein Central Northeast India – A historicalperspective 1889–2008,Theor. Appl. Climatol., 103, 305–319, 2011.
Sun, Y. and Ding, Y. H.: A projection of future changes in summerprecipitation and monsoon in East Asia, Sci. China Earth Sci.,53, 284–300, 2010.
Torrence, C. and Compo, G. P.: A practical guide to wavelet analy-sis, B. Am. Meteorol. Soc., 79, 61–78, 1998.
Varis, O., Kummu, M., and Salmivaara, A.: Ten major rivers in mon-soon Asia-Pacific: An assessment of vulnerability, Appl. Geogr.,32, 441–454, 2012.
Waterpub: Zhujiang River, China Water Conservancy and Hy-dropower Press, available at:http://www.waterpub.com.cn/JHDB/DetailRiver.asp?ID=5(last access: 19 January 2012),2012.
Wilks, D. S.: Statistical Methods in the Atmospheric Sciences, 2ndEdn., Elsevier Inc., USA, 649 pp., 2006.
Xu, K. H., Milliman, J. D., and Xu, H.: Temporal trend of precip-itation and runoff in major Chinese Rivers since 1951, GlobalPlanet. Change, 73, 219–232, 2010.
Zeng, X., Kundzewicz, Z. W., Zhou, J., and Su, B.: Discharge pro-jection in the Yangtze River basin under different emission sce-narios based on the artificial neural network, Quaternary Int.,282, 113–121, 2012.
Zhai, J. Q., Liu, B., Hartmann, H., Su, B. D., Jiang, T., andFraedrich, K.: Dryness/wetness variations in ten large riverbasins of China during the first 50 years of the 21st century, Qua-ternary Int., 226, 101–111, 2010a.
Zhai, J. Q., Su, B. D., Krysanova, V., Vetter, T., Gao, C., and Jiang,C. T.: Spatial variation and trends in PSDI and SPI indices andtheir relation to streamflow in 10 large regions of China, J. Cli-mate, 23, 649–663, 2010b.
Zhai, L. X. and Qi, F.: Spatial and temporal pattern of precipitationand drought in Gansu Province, Northwest China, Nat. Hazards,49, 1–24, 2009.
www.hydrol-earth-syst-sci.net/17/135/2013/ Hydrol. Earth Syst. Sci., 17, 135–148, 2013

148 T. Fischer et al.: Hydrological long-term dry and wet periods
Zhang, Q., Jiang, T., Gemmer, M., and Becker, S.: Precipita-tion, temperature and runoff analysis from 1950 to 2002 in theYangtze basin, China, Hydrol. Sci., 50, 65–80, 2005.
Zhang, Q., Xu, C.-Y., and Zhang, Z.: Observed changes ofdrought/wetness episodes in the Pearl River basin, China, us-ing the standardized precipitation index and aridity index, Theor.Appl. Climatol., 98, 89–99, 2009.
Zhang, S., Lu, X. X., Higgitt, D. L., Chen, C. T. A., Han, J., andSun, H.: Recent changes of water discharge and sediment load inthe Zhujiang (Pearl River) Basin, China, Global Planet. Change,60, 365–380, 2008.
Zhao, G., Mu, X., Hoermann, G., Fohrer, N., Xiong, M., Su, B.D., and Li, X.: Spatial patterns and temporal variability of dry-ness/wetness in the Yangtze River Basin, China, Quaternary Int.,282, 5–13, 2012.
Hydrol. Earth Syst. Sci., 17, 135–148, 2013 www.hydrol-earth-syst-sci.net/17/135/2013/