how effective are biodiversity conservation payments in mexico?
TRANSCRIPT
RESEARCH ARTICLE
How Effective Are Biodiversity ConservationPayments in Mexico?Sébastien Costedoat1*, Esteve Corbera1,2, Driss Ezzine-de-Blas3, Jordi Honey-Rosés4,Kathy Baylis5, Miguel Angel Castillo-Santiago6
1 Institute of Environmental Science and Technology (ICTA), Universitat Autònoma de Barcelona,Barcelona, Spain, 2 Department of Economics and Economic History, Universitat Autònoma de Barcelona,Barcelona, Spain, 3 Center International en Recherche Agronomique pour le Développement (CIRAD),Montpellier, France, 4 School of Community and Regional Planning, University of British Columbia,Vancouver, British Columbia, Canada, 5 Agriculture and Consumer Economics Department, University ofIllinois, Urbana, Illinois, United States of America, 6 Laboratorio de Análisis de Información Geográfica, ElColegio de la Frontera Sur, San Cristóbal de las Casas, Chiapas, Mexico
AbstractWe assess the additional forest cover protected by 13 rural communities located in the
southern state of Chiapas, Mexico, as a result of the economic incentives received through
the country's national program of payments for biodiversity conservation. We use spatially
explicit data at the intra-community level to define a credible counterfactual of conservation
outcomes. We use covariate-matching specifications associated with spatially explicit vari-
ables and difference-in-difference estimators to determine the treatment effect. We estimate
that the additional conservation represents between 12 and 14.7 percent of forest area en-
rolled in the program in comparison to control areas. Despite this high degree of additional-
ity, we also observe lack of compliance in some plots participating in the PES program. This
lack of compliance casts doubt on the ability of payments alone to guarantee long-term
additionality in context of high deforestation rates, even with an augmented program budget
or extension of participation to communities not yet enrolled.
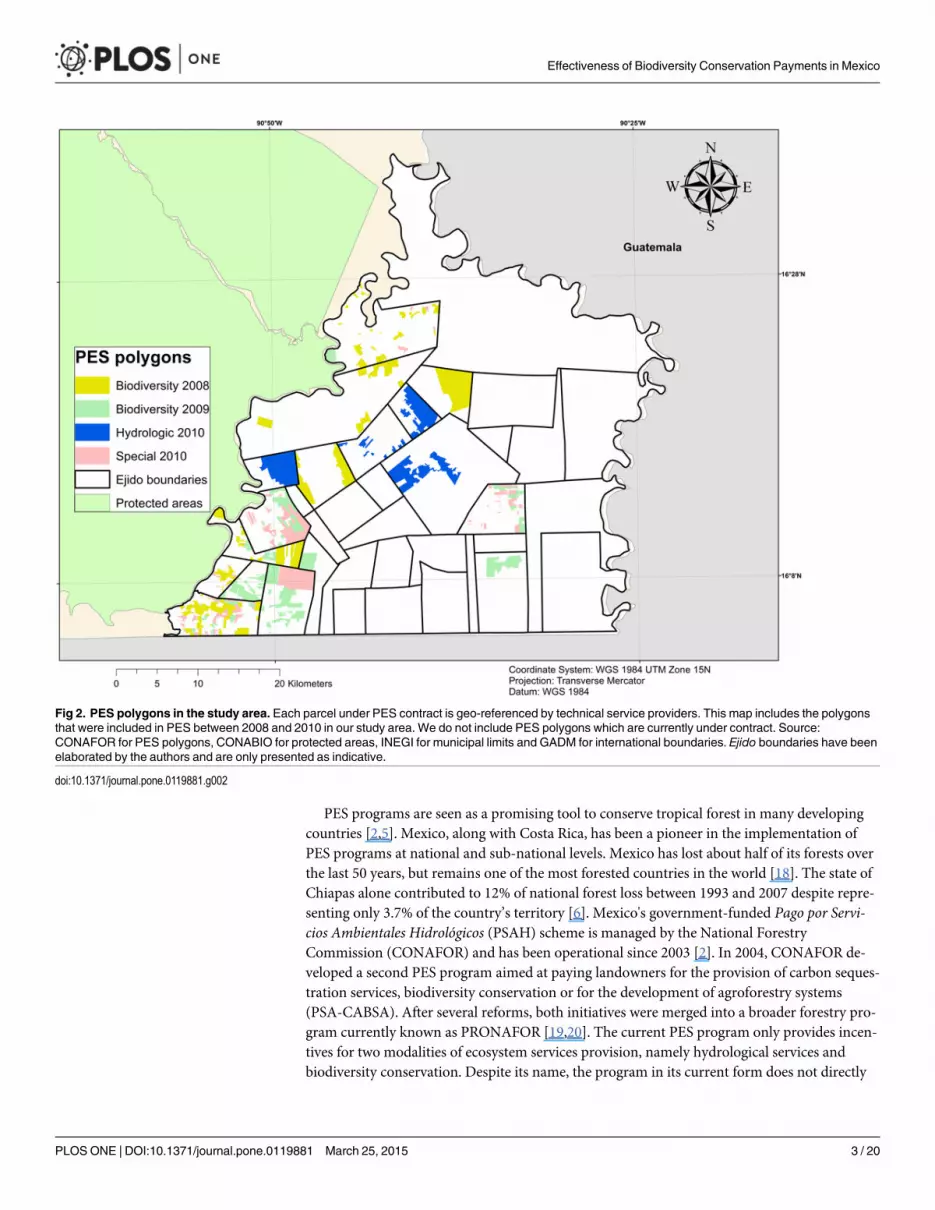
IntroductionPayment for Environmental or Ecosystem Services (PES) programs have become increasinglyimportant for biodiversity and ecosystems conservation worldwide, including in developingcountries [1–3]. Proof of their environmental effectiveness in contributing to avoided defores-tation or the provision of specific ecosystem services is just emerging [3–5]. This article pro-vides insight on the effectiveness of Mexico’s national program of payments for biodiversityconservation, focusing on avoided forest loss as a proxy outcome. The analysis focuses on twomunicipalities in the state of Chiapas which were selected due to their high deforestation rates[6] and the increasing support received from government and NGOs to conserve their tropicalforests (Fig. 1). Between 2005 and 2013, 19 out of the 37 communities located in these munici-palities had received at least one PES contract (Fig. 2).
PLOSONE | DOI:10.1371/journal.pone.0119881 March 25, 2015 1 / 20
a11111
OPEN ACCESS
Citation: Costedoat S, Corbera E, Ezzine-de-Blas D,Honey-Rosés J, Baylis K, Castillo-Santiago MA(2015) How Effective Are Biodiversity ConservationPayments in Mexico? PLoS ONE 10(3): e0119881.doi:10.1371/journal.pone.0119881
Academic Editor: Paul Adam, University of NewSouth Wales, AUSTRALIA
Received: November 21, 2014
Accepted: February 3, 2015
Published: March 25, 2015
Copyright: © 2015 Costedoat et al. This is an openaccess article distributed under the terms of theCreative Commons Attribution License, which permitsunrestricted use, distribution, and reproduction in anymedium, provided the original author and source arecredited.
Data Availability Statement: All relevant data arewithin supporting Information files.
Funding: SC,EC,DE: Biodiversa Framework ProjectINVALUABLE: Values, Markets, and Policies forBiodiversity and Ecosystem Services (PRI-PIMBDV-2011- 1072), http://www.biodiversa.org/118. Thefunders had no role in study design, data collectionand analysis, decision to publish, or preparation ofthe manuscript. EC: ‘Ramón y Cajal’ researchfellowship (Corbera) granted by the SpanishResearch, Development and Innovation Secretariat(RYC-2010-07183). The funders had no role in studydesign, data collection and analysis, decision to
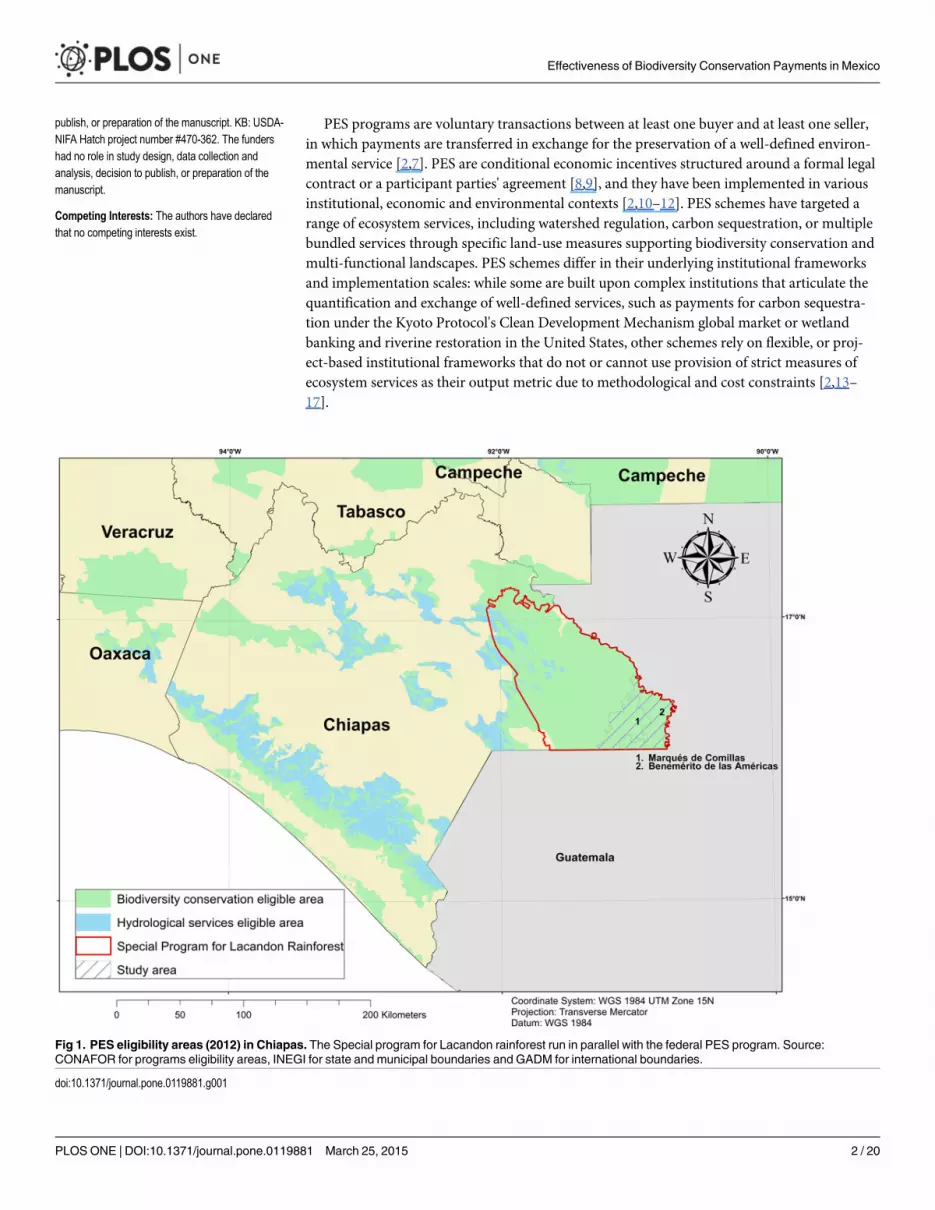
PES programs are voluntary transactions between at least one buyer and at least one seller,in which payments are transferred in exchange for the preservation of a well-defined environ-mental service [2,7]. PES are conditional economic incentives structured around a formal legalcontract or a participant parties' agreement [8,9], and they have been implemented in variousinstitutional, economic and environmental contexts [2,10–12]. PES schemes have targeted arange of ecosystem services, including watershed regulation, carbon sequestration, or multiplebundled services through specific land-use measures supporting biodiversity conservation andmulti-functional landscapes. PES schemes differ in their underlying institutional frameworksand implementation scales: while some are built upon complex institutions that articulate thequantification and exchange of well-defined services, such as payments for carbon sequestra-tion under the Kyoto Protocol's Clean Development Mechanism global market or wetlandbanking and riverine restoration in the United States, other schemes rely on flexible, or proj-ect-based institutional frameworks that do not or cannot use provision of strict measures ofecosystem services as their output metric due to methodological and cost constraints [2,13–17].
Fig 1. PES eligibility areas (2012) in Chiapas. The Special program for Lacandon rainforest run in parallel with the federal PES program. Source:CONAFOR for programs eligibility areas, INEGI for state and municipal boundaries and GADM for international boundaries.
doi:10.1371/journal.pone.0119881.g001
Effectiveness of Biodiversity Conservation Payments in Mexico
PLOS ONE | DOI:10.1371/journal.pone.0119881 March 25, 2015 2 / 20
publish, or preparation of the manuscript. KB: USDA-NIFA Hatch project number #470-362. The fundershad no role in study design, data collection andanalysis, decision to publish, or preparation of themanuscript.
Competing Interests: The authors have declaredthat no competing interests exist.
PES programs are seen as a promising tool to conserve tropical forest in many developingcountries [2,5]. Mexico, along with Costa Rica, has been a pioneer in the implementation ofPES programs at national and sub-national levels. Mexico has lost about half of its forests overthe last 50 years, but remains one of the most forested countries in the world [18]. The state ofChiapas alone contributed to 12% of national forest loss between 1993 and 2007 despite repre-senting only 3.7% of the country’s territory [6]. Mexico's government-funded Pago por Servi-cios Ambientales Hidrológicos (PSAH) scheme is managed by the National ForestryCommission (CONAFOR) and has been operational since 2003 [2]. In 2004, CONAFOR de-veloped a second PES program aimed at paying landowners for the provision of carbon seques-tration services, biodiversity conservation or for the development of agroforestry systems(PSA-CABSA). After several reforms, both initiatives were merged into a broader forestry pro-gram currently known as PRONAFOR [19,20]. The current PES program only provides incen-tives for two modalities of ecosystem services provision, namely hydrological services andbiodiversity conservation. Despite its name, the program in its current form does not directly
Fig 2. PES polygons in the study area. Each parcel under PES contract is geo-referenced by technical service providers. This map includes the polygonsthat were included in PES between 2008 and 2010 in our study area. We do not include PES polygons which are currently under contract. Source:CONAFOR for PES polygons, CONABIO for protected areas, INEGI for municipal limits and GADM for international boundaries. Ejido boundaries have beenelaborated by the authors and are only presented as indicative.
doi:10.1371/journal.pone.0119881.g002
Effectiveness of Biodiversity Conservation Payments in Mexico
PLOS ONE | DOI:10.1371/journal.pone.0119881 March 25, 2015 3 / 20
monitor the provision of these ecosystem services and it is focused exclusively on supportingthe conservation of standing forests. In parallel, CONAFOR also co-sponsors supplementarylocal PES schemes at the local level and other initiatives linked to REDD+ early actions [21–23].
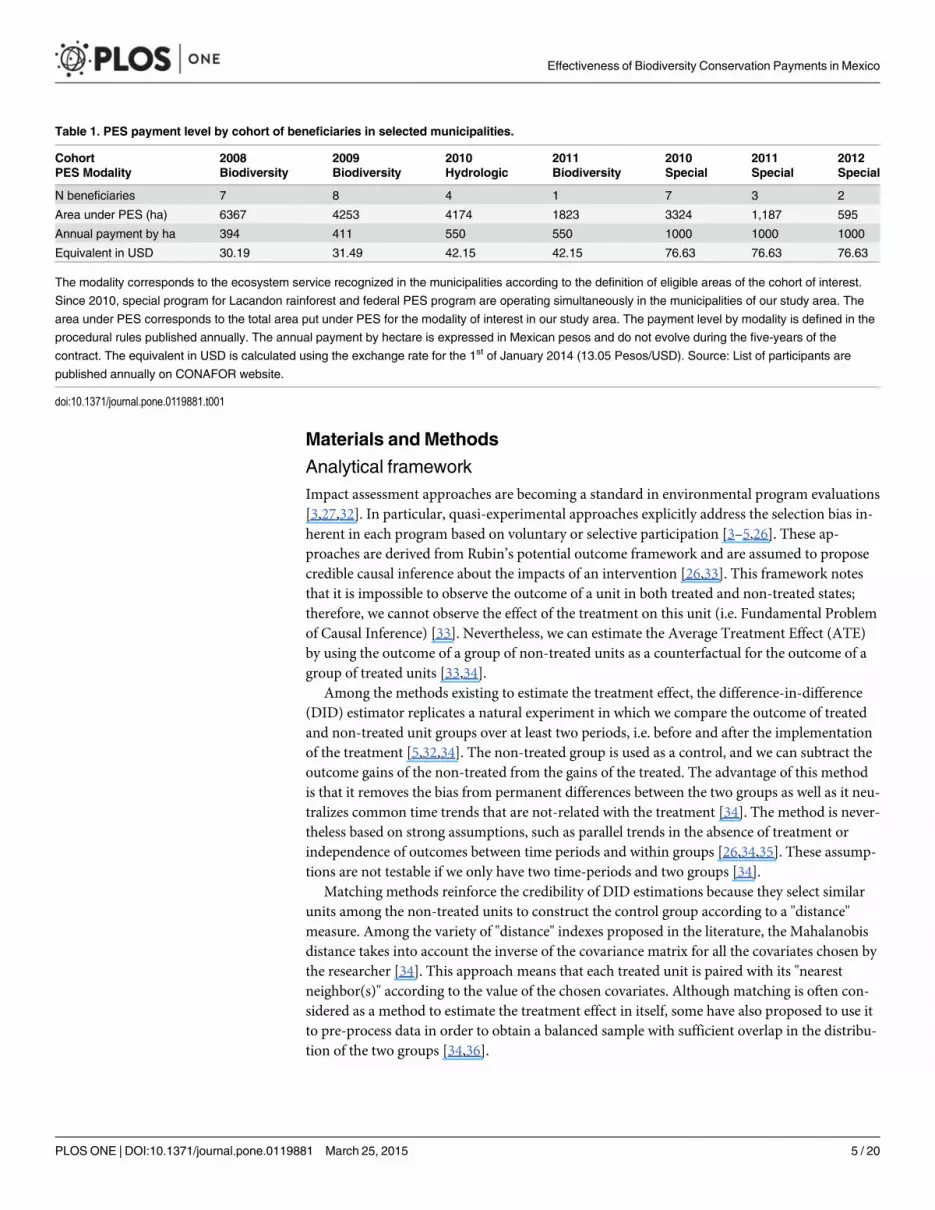
Mexico's PES programs are open to both privately and community owned lands. Around70% of the country's forests are owned by ejidos and indigenous communities [24]. Ejidos are atype of collective tenure recognized after the 1910 Mexican revolution and are generally com-prised of both family-run-de facto private- land plots and common resource managementareas. In turn, indigenous communities are recognized by the State as a form of social propertyexisting prior to the revolution, with subsequently much older customary arrangements for themanagement of the resource commons. PES programs indistinguishably support landowners,ejidos and communities and reward them annually over a renewable five-year period, duringwhich the recipients are mandated to develop forest management and conservation activitieson selected lands. Payment levels have historically differed across modalities, with biodiversityconservation forest parcels receiving on average lower payments per hectare than hydrologicservices (Table 1). More than 2.6 million hectares have been included in the program (2% ofthe national forested area were under PES contract in 2007, year of greatest program exten-sion), which translates into a budget of around 450 million USD [25]. To date, the biodiversitymodality represents roughly 25% of the total land area allocated to PES programs.
The environmental additionality of PES programs is not easily measurable because the ref-erence baseline is hypothetical and thus not observable. Recent development of quasi-experi-mental methods in environmental sciences allows researchers to estimate robustcounterfactuals based on empirical data [3,9,10,11]. Available empirical studies, however, areambiguous about the effectiveness of PES schemes [3,26]. Evidence fromMexico and CostaRica shows that their respective PSAH and PES national programs have had a limited impacton avoided deforestation because, in their early years, payments were allocated to areas withlow deforestation risk [27,28]. However, analyses performed at sub-national level in regionswith higher deforestation have found more significant positive impacts on avoided deforesta-tion [25,29,30].
The contribution of our analysis is twofold. First, we focus on the effectiveness of Mexico'sPES biodiversity conservation modality because, to our knowledge, it has been overlooked todate. Most empirical studies of PES effectiveness have focused on the hydrological servicesscheme [25,21,31]. Second, we perform our analysis comparing grid cells spread over two mu-nicipalities, which involved identifying suitable control groups with good statistical propertiesin a geographically constrained area that is subject to high deforestation pressure. As exoge-nous units of analysis, grid cells help address the lack of tenure data at the plot level and alsoallow us to integrate information from different geographical and administrative scales. We de-fine the size of the spatially explicit grid cells to capture the variation of physical characteristicswithin each ejido.
The analysis shows that deforestation is proceeding apace in the two selected municipalities,with lower rates in communities participating in the PES program. The implementation of thePES program has resulted in significant environmental additionality, indicating a much largereffect than in other studies that analyze the country’s PSAH program over a larger geographicalarea [25,27]. Our different specifications show that, on average, additional conservation repre-sents between 12 and 14.7 percent of the area enrolled under PES. The following sections pres-ent our materials and methods, describe our results in detail and discuss them in light ofdebates around PES contribution to environmental conservation, leakage effects, and the roleof payments in changing land managers' behavior.
Effectiveness of Biodiversity Conservation Payments in Mexico
PLOS ONE | DOI:10.1371/journal.pone.0119881 March 25, 2015 4 / 20
Materials and Methods
Analytical frameworkImpact assessment approaches are becoming a standard in environmental program evaluations[3,27,32]. In particular, quasi-experimental approaches explicitly address the selection bias in-herent in each program based on voluntary or selective participation [3–5,26]. These ap-proaches are derived from Rubin’s potential outcome framework and are assumed to proposecredible causal inference about the impacts of an intervention [26,33]. This framework notesthat it is impossible to observe the outcome of a unit in both treated and non-treated states;therefore, we cannot observe the effect of the treatment on this unit (i.e. Fundamental Problemof Causal Inference) [33]. Nevertheless, we can estimate the Average Treatment Effect (ATE)by using the outcome of a group of non-treated units as a counterfactual for the outcome of agroup of treated units [33,34].
Among the methods existing to estimate the treatment effect, the difference-in-difference(DID) estimator replicates a natural experiment in which we compare the outcome of treatedand non-treated unit groups over at least two periods, i.e. before and after the implementationof the treatment [5,32,34]. The non-treated group is used as a control, and we can subtract theoutcome gains of the non-treated from the gains of the treated. The advantage of this methodis that it removes the bias from permanent differences between the two groups as well as it neu-tralizes common time trends that are not-related with the treatment [34]. The method is never-theless based on strong assumptions, such as parallel trends in the absence of treatment orindependence of outcomes between time periods and within groups [26,34,35]. These assump-tions are not testable if we only have two time-periods and two groups [34].
Matching methods reinforce the credibility of DID estimations because they select similarunits among the non-treated units to construct the control group according to a "distance"measure. Among the variety of "distance" indexes proposed in the literature, the Mahalanobisdistance takes into account the inverse of the covariance matrix for all the covariates chosen bythe researcher [34]. This approach means that each treated unit is paired with its "nearestneighbor(s)" according to the value of the chosen covariates. Although matching is often con-sidered as a method to estimate the treatment effect in itself, some have also proposed to use itto pre-process data in order to obtain a balanced sample with sufficient overlap in the distribu-tion of the two groups [34,36].
Table 1. PES payment level by cohort of beneficiaries in selected municipalities.
Cohort 2008 2009 2010 2011 2010 2011 2012PES Modality Biodiversity Biodiversity Hydrologic Biodiversity Special Special Special
N beneficiaries 7 8 4 1 7 3 2
Area under PES (ha) 6367 4253 4174 1823 3324 1,187 595
Annual payment by ha 394 411 550 550 1000 1000 1000
Equivalent in USD 30.19 31.49 42.15 42.15 76.63 76.63 76.63
The modality corresponds to the ecosystem service recognized in the municipalities according to the definition of eligible areas of the cohort of interest.
Since 2010, special program for Lacandon rainforest and federal PES program are operating simultaneously in the municipalities of our study area. The
area under PES corresponds to the total area put under PES for the modality of interest in our study area. The payment level by modality is defined in the
procedural rules published annually. The annual payment by hectare is expressed in Mexican pesos and do not evolve during the five-years of the
contract. The equivalent in USD is calculated using the exchange rate for the 1st of January 2014 (13.05 Pesos/USD). Source: List of participants are
published annually on CONAFOR website.
doi:10.1371/journal.pone.0119881.t001
Effectiveness of Biodiversity Conservation Payments in Mexico
PLOS ONE | DOI:10.1371/journal.pone.0119881 March 25, 2015 5 / 20
Even with precise identification strategies, there is a risk of missing important factors-e.g.particular unobservable characteristics- that can determine the treatment group and the out-come of interest [34]. In our analysis, we have limited this problem by examining program im-plementation in a geographically limited area where territories have relatively similar historicaltrends, land use patterns, and potentially similar access to information and to infrastructure.
Study areaOur study area encompasses the municipalities ofMarqués de Comillas and Benemérito de lasAméricas, which include 23 and 14 ejidos, respectively (Fig. 1). The municipal limits have beenchosen as study area boundaries because in this case they capture political frontier—betweenMexico and Guatemala- and natural barrier- the Lacantun River separate the municipalitiesfrom the protected rainforest of the Montes Azules Biosphere reserve (Fig. 2).
In the 1970’s, the study area held large tracts of rainforest but as of today less than half ofthe original cover remains today. Over this period, these municipalities have had one of thehighest deforestation rates in the country [6]. Most forest loss in the past was driven by govern-ment settlement policies, which brought large numbers of landless farmers from around thecountry to Chiapas between 1970 and the early 1990s [37]. Present threats to forests are linkedto agricultural and pasture expansion [6], which are activities that are encouraged by govern-ment programs, in addition to a flat topography [37]. Livestock raising has been the main live-lihood activity until this last decade, when new productive activities promoted by privateactors, such as African oil palm cultivation-now grown in 26 of the 37 ejidos-, have gainedprominence [6,37]. Both governmental and non-governmental conservation policies and proj-ects began to be implemented during the 1990s, focused on controlling slash and burn agricul-ture, and illegal timber logging [6,26]. However, limited funding, monitoring and enforcementby both state and federal governments, have contributed to their limited success [6].
PES programs have recently emerged in the two selected municipalities as a complementaryconservation incentive in a context of increasing tensions between land-use change and a grow-ing number of conservation initiatives. For example, our two selected municipalities are locatedwithin a biological corridor established in 2007 to connect various Biosphere reserves in thesouthern part of Mexico [37,38], and in addition to other areas located in the states of Jaliscoand of the Yucatán peninsula, they belong to one of the three key target early action areas forReducing Emissions from Deforestation, forest Degradation and enhancing carbon stocks(REDD+). In Chiapas, early actions are structured around the Special Program for the Lacan-don rainforest (Programa Especial de la Selva Lacandona or PESL, for its Spanish acronym),which is implemented in eight municipalities that still have standing rainforest. This specialprogram includes a PES mechanism specifically designed to address local drivers of deforesta-tion and forest degradation, among other incentives for sustainable use andrainforest conservation.
Participation in Mexico's PES programsCONAFOR annually publishes the eligible areas and selection criteria for participating in thefederal PES programs [18,20,28]. Privately and community owned lands can be included inPES contracts [21,25]. In the case of ejidos, the decision to participate is a collective choice de-cided by the ejido assembly, which is the most important decision-making body made up of allright holders. The parcels included in program funding applications can involve all or a portionof or the community’s commonly managed forests, or selected forested parcels controlled byhouseholds. Applicants can hire technical service providers to develop their application pro-posal and payment-targeted parcels are geo-referenced as polygons. Once an application is
Effectiveness of Biodiversity Conservation Payments in Mexico
PLOS ONE | DOI:10.1371/journal.pone.0119881 March 25, 2015 6 / 20
approved by CONAFOR, the proponent(s) must design a forest management plan on the con-tracted polygons, which is also developed with service providers' support.
In our selected municipalities, the first PES contract was signed in 2005 but the programgained momentum in 2008, when seven ejidos were granted a contract for biodiversity pay-ments (Fig. 2). As noted, 19 ejidos are now involved in the program. The remaining 18 ejidoshave declined or have been unable to participate and, among these, there are four ejidos lackingadministrative pre-requisites to become PES eligible. According to CONAFOR officials, othersdo not participate because they do not own sufficient primary forest or their forests have al-ready been divided among too many families and converted into other land uses. The rest havesimply refused to participate because they are not interested or do not have the ability to makea collective decision in this regard. As the program is voluntary, forest owners can decide notto participate in the program regardless of the level of forest cover found in their properties.
Data and unit of analysisWe would like to be able to compare forest conservation outcomes within PES polygons withsimilar un-treated polygons. However, the polygons are generated exclusively for the needs ofthe PES program, therefore there is no database of un-treated polygons. Nevertheless, informa-tion systems are well developed in Mexico [31] and the National Agricultural Registry (RAN)provides ejidos and communities information about land tenure. Because polygons and ejidoboundaries are geo-referenced, we were able to build a spatially explicit database to select unitsthat were to be used as controls.
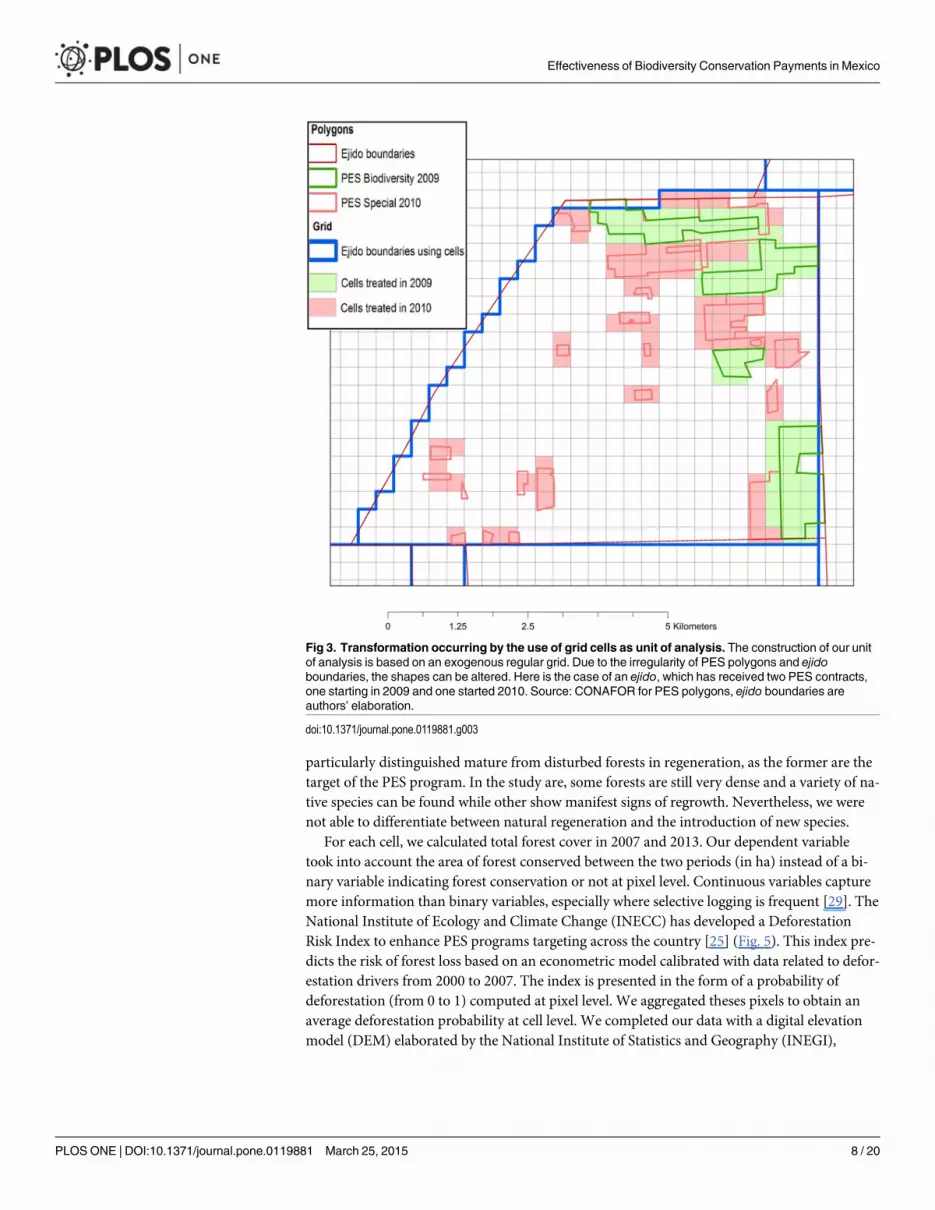
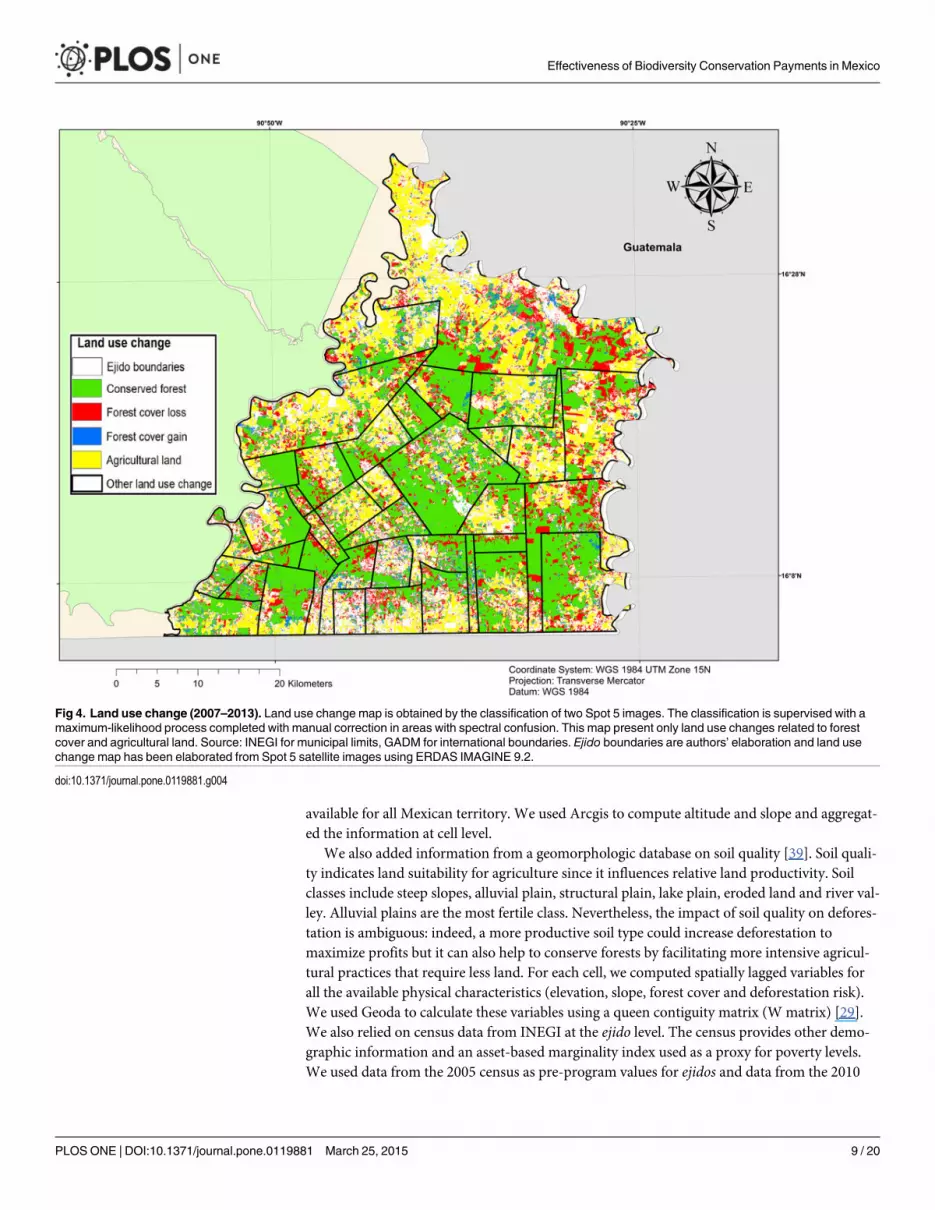
Our data sources are published in different formats. Physical and land use information aredefined at a pixel level while program and administrative data are available as polygons. We de-fined a spatially explicit grid composed of regular squares of 10 hectares—approximately a sidelength of 316 m—to capture different scales of information. This size allowed us to account forthe precision of spatially explicit data while being below the minimum PES eligible area. Eachgrid cell represented an exogenous unit of analysis, which does not correspond strictly to deci-sion-making units [3,29] (Fig. 3). However, it permitted us to generate a spatially explicit data-base that captures a variety of land uses within each ejido. In addition, within a treated ejido,we distinguished between areas treated by the PES program and unenrolled or un-treated par-cels. The main limitation of the use of cells for comparison purposes is a distortion at theboundary between two communities: such boundaries are irregular and a grid cell may overlapwith two communities. Therefore, to categorize a cell as being in one community or anotherwe used the community in which the cell’s centroid resided to determine the community infor-mation associated with that cell. Visual interpretation of community boundaries indicated that,in the municipalities selected, there was no evidence of any forest encroachment from onecommunity into another, as community boundaries were easily distinguishable by contrastingland uses (Fig. 4).
We also used grid cells to capture additional information from other datasets, in particular:i) biophysical features of the landscape (land use, elevation, slope, soil characteristics) and ii)administrative and census data that is assumed to be common across all cells in the same com-munity. We acquired Spot 5 satellite images (10-m resolution) for 2007 and 2013 to detect landuse changes (Fig. 4). For each year, we generated two maps comparing land cover to capturechanges before and after the implementation of PES contracts for our first cohort of interest.We considered eight land-use classes: mature forest, disturbed forest, other vegetation, cultivat-ed lands, rivers, wetlands, urbanized area and undefined area (e.g. roads, clouds or shadows).These classes were a simplification of the classification used by [6]. Our classification, however,had the advantage of making a neat distinction between different vegetative cover, and it
Effectiveness of Biodiversity Conservation Payments in Mexico
PLOS ONE | DOI:10.1371/journal.pone.0119881 March 25, 2015 7 / 20
particularly distinguished mature from disturbed forests in regeneration, as the former are thetarget of the PES program. In the study are, some forests are still very dense and a variety of na-tive species can be found while other show manifest signs of regrowth. Nevertheless, we werenot able to differentiate between natural regeneration and the introduction of new species.
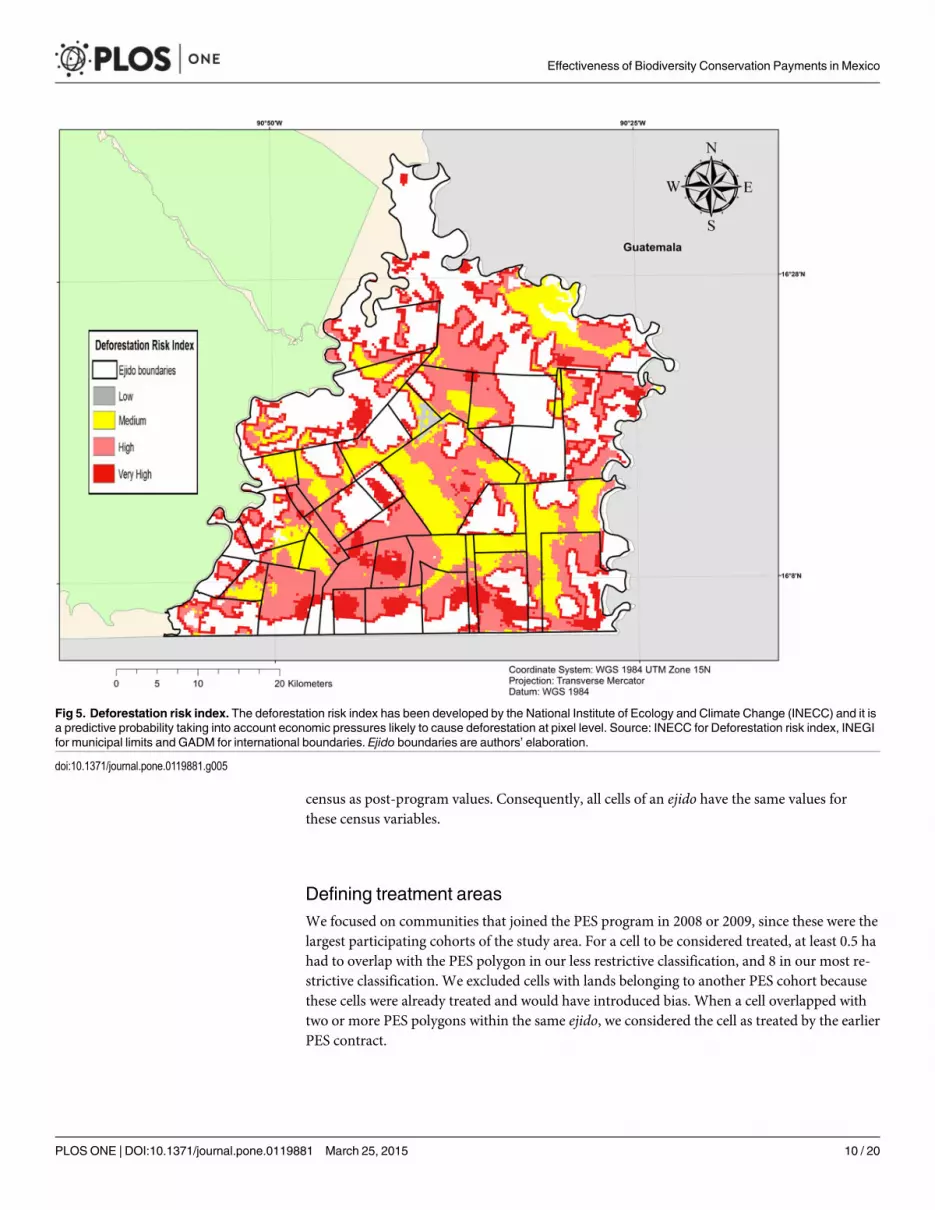
For each cell, we calculated total forest cover in 2007 and 2013. Our dependent variabletook into account the area of forest conserved between the two periods (in ha) instead of a bi-nary variable indicating forest conservation or not at pixel level. Continuous variables capturemore information than binary variables, especially where selective logging is frequent [29]. TheNational Institute of Ecology and Climate Change (INECC) has developed a DeforestationRisk Index to enhance PES programs targeting across the country [25] (Fig. 5). This index pre-dicts the risk of forest loss based on an econometric model calibrated with data related to defor-estation drivers from 2000 to 2007. The index is presented in the form of a probability ofdeforestation (from 0 to 1) computed at pixel level. We aggregated theses pixels to obtain anaverage deforestation probability at cell level. We completed our data with a digital elevationmodel (DEM) elaborated by the National Institute of Statistics and Geography (INEGI),
Fig 3. Transformation occurring by the use of grid cells as unit of analysis. The construction of our unitof analysis is based on an exogenous regular grid. Due to the irregularity of PES polygons and ejidoboundaries, the shapes can be altered. Here is the case of an ejido, which has received two PES contracts,one starting in 2009 and one started 2010. Source: CONAFOR for PES polygons, ejido boundaries areauthors’ elaboration.
doi:10.1371/journal.pone.0119881.g003
Effectiveness of Biodiversity Conservation Payments in Mexico
PLOS ONE | DOI:10.1371/journal.pone.0119881 March 25, 2015 8 / 20
available for all Mexican territory. We used Arcgis to compute altitude and slope and aggregat-ed the information at cell level.
We also added information from a geomorphologic database on soil quality [39]. Soil quali-ty indicates land suitability for agriculture since it influences relative land productivity. Soilclasses include steep slopes, alluvial plain, structural plain, lake plain, eroded land and river val-ley. Alluvial plains are the most fertile class. Nevertheless, the impact of soil quality on defores-tation is ambiguous: indeed, a more productive soil type could increase deforestation tomaximize profits but it can also help to conserve forests by facilitating more intensive agricul-tural practices that require less land. For each cell, we computed spatially lagged variables forall the available physical characteristics (elevation, slope, forest cover and deforestation risk).We used Geoda to calculate these variables using a queen contiguity matrix (W matrix) [29].We also relied on census data from INEGI at the ejido level. The census provides other demo-graphic information and an asset-based marginality index used as a proxy for poverty levels.We used data from the 2005 census as pre-program values for ejidos and data from the 2010
Fig 4. Land use change (2007–2013). Land use change map is obtained by the classification of two Spot 5 images. The classification is supervised with amaximum-likelihood process completed with manual correction in areas with spectral confusion. This map present only land use changes related to forestcover and agricultural land. Source: INEGI for municipal limits, GADM for international boundaries. Ejido boundaries are authors’ elaboration and land usechange map has been elaborated from Spot 5 satellite images using ERDAS IMAGINE 9.2.
doi:10.1371/journal.pone.0119881.g004
Effectiveness of Biodiversity Conservation Payments in Mexico
PLOS ONE | DOI:10.1371/journal.pone.0119881 March 25, 2015 9 / 20
census as post-program values. Consequently, all cells of an ejido have the same values forthese census variables.
Defining treatment areasWe focused on communities that joined the PES program in 2008 or 2009, since these were thelargest participating cohorts of the study area. For a cell to be considered treated, at least 0.5 hahad to overlap with the PES polygon in our less restrictive classification, and 8 in our most re-strictive classification. We excluded cells with lands belonging to another PES cohort becausethese cells were already treated and would have introduced bias. When a cell overlapped withtwo or more PES polygons within the same ejido, we considered the cell as treated by the earlierPES contract.
Fig 5. Deforestation risk index. The deforestation risk index has been developed by the National Institute of Ecology and Climate Change (INECC) and it isa predictive probability taking into account economic pressures likely to cause deforestation at pixel level. Source: INECC for Deforestation risk index, INEGIfor municipal limits and GADM for international boundaries. Ejido boundaries are authors’ elaboration.
doi:10.1371/journal.pone.0119881.g005
Effectiveness of Biodiversity Conservation Payments in Mexico
PLOS ONE | DOI:10.1371/journal.pone.0119881 March 25, 2015 10 / 20
Identification strategySeveral authors such as [25] or [30] pre-process data to reduce the sample to treated and un-treated units that have similar observable characteristics, and to remove possible bias that canaffect the measurement of program effectiveness. We suspect two sources of possible selectionbias, one at the parcel level and the other at the ejido level. In particular, we performed threematching specifications using covariate matching with Mahalanobis distance: two were limitedto matching over physical characteristics of cells (specifications A and B) and the third includ-ed socio-economic and demographic information at ejido level (specification C).
Specification A compared parcels treated in 2008 and 2009 to matched non-treated parcelswithin ejidos that received PES. We matched across biophysical characteristics: forest area in2007, elevation, slope, deforestation risk index and the spatial lags for each of the four covari-ates. We also added an exact matching on the dominant soil in the cells, which served both asan index of relative soil productivity and as a way to control for the geographic location of thecells. Indeed, visual interpretation of the region's geomorphological map suggested that alluvialsoils border rivers and protected areas while other soils are more present in remote areas. Ourset of physical variables was assumed to capture opportunity costs at parcel levels. Because thecontrol group included only parcels of ejidos treated in 2008 or 2009, we were neutralizing theinfluence of unobservable characteristics at ejido level such as decision-making processes andmotivations. We present the covariate balance for all observable characteristics (Table 2, sec-ond column).
However, we suspect specification A may be biased because each ejido decided to enrollsome parcels in the program and not others, and this determination was probably driven byunobservable characteristics related to opportunity costs. Consequently, we would expect un-enrolled forest parcels to be more likely deforested because they potentially had higher oppor-tunity costs and ejidomembers could feel there was an implicit right to deforest because theydid not receive incentives for conservation. Therefore, we ran the same matching specificationbut limited the potential control group to forested cells of non-treated cells ejidos (specificationB). In this case, non-treated ejidos correspond to those that had never received a PES contractbetween 2005 and 2012.
Our third specification, specification C, takes into account the socio-economic and biophys-ical characteristics of cells. We developed a two-step matching and identified pairs of compara-ble ejidos using some of the variables proposed by [40]. For each treated ejido, we identified themost similar non-treated ejido in terms of socio-economic and demographic characteristics. Indoing so, we used the following variables: distance to the nearest city, years since ejido creation,size, population with property rights, and other demographic information (i.e. total population,proportion of people between 15 and 64 years-old, number of people who have been in second-ary school, and marginality index). The heterogeneity of ejido characteristics is very important,so only, eight non-treated ejidos were retained in our control group. The comparison of conser-vation outcomes between treated and matched ejidos would not be sufficient to measure pro-gram impacts. We then performed covariate matching with physical variables defined in thefirst specification. Therefore, for each treated parcel of a treated ejido, matched cells were morephysically similar inside the more similar non-treated ejido (Table 2, fourth column).
We used the matching specifications to measure the Average Treatment Effect on the Treat-ed (ATT), which corresponds to the average impact of the program on forest conservation forunits that have received the program. In all our matching specifications, we employed a bias-adjustment procedure as proposed by [41] and we used both mean-comparison and standard-ized bias statistic to assess covariate balance [42]. In each case, we performed sensitivity analy-sis by discarding the worst 5% match according to Mahalanobis distance, by using two
Effectiveness of Biodiversity Conservation Payments in Mexico
PLOS ONE | DOI:10.1371/journal.pone.0119881 March 25, 2015 11 / 20
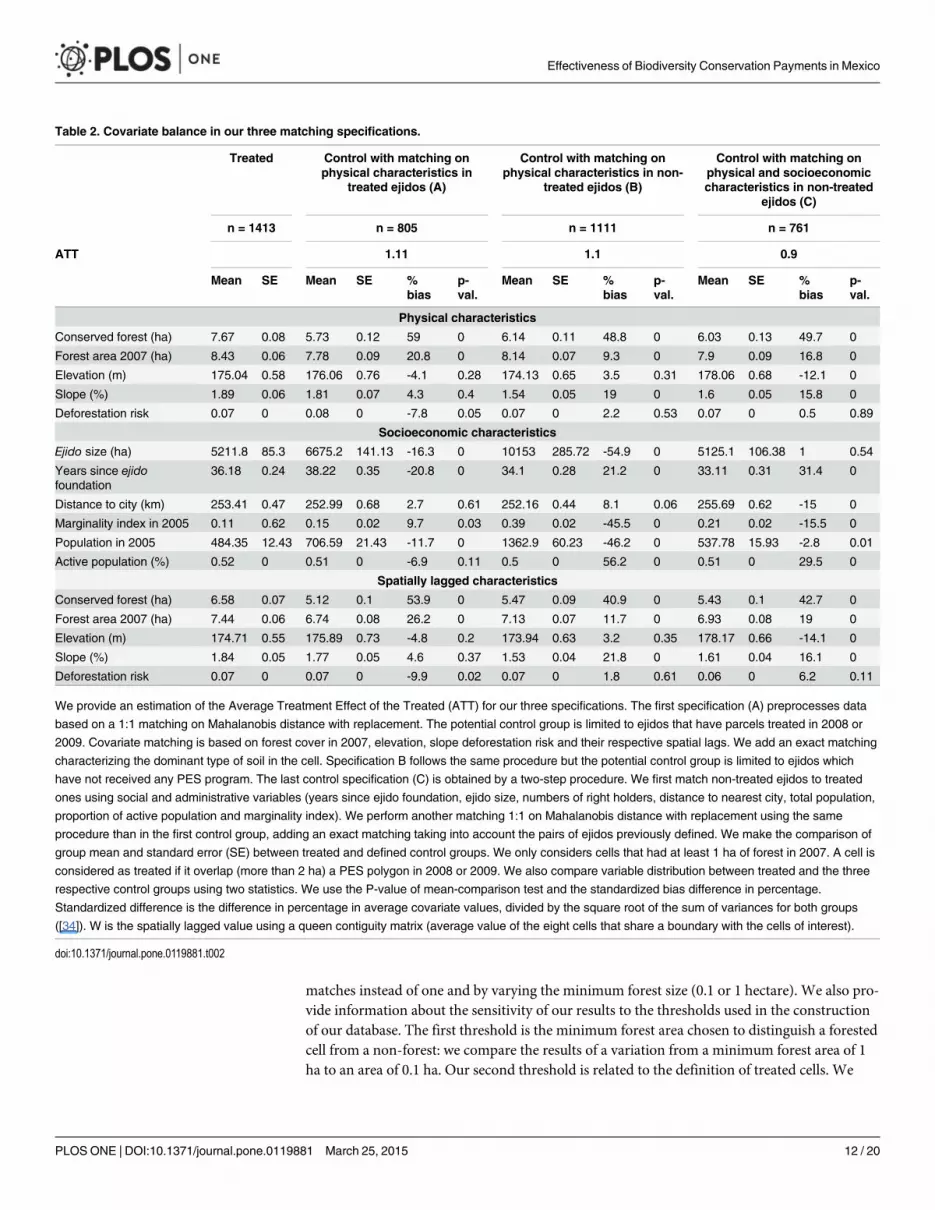
matches instead of one and by varying the minimum forest size (0.1 or 1 hectare). We also pro-vide information about the sensitivity of our results to the thresholds used in the constructionof our database. The first threshold is the minimum forest area chosen to distinguish a forestedcell from a non-forest: we compare the results of a variation from a minimum forest area of 1ha to an area of 0.1 ha. Our second threshold is related to the definition of treated cells. We
Table 2. Covariate balance in our three matching specifications.
Treated Control with matching onphysical characteristics in
treated ejidos (A)
Control with matching onphysical characteristics in non-
treated ejidos (B)
Control with matching onphysical and socioeconomiccharacteristics in non-treated
ejidos (C)
n = 1413 n = 805 n = 1111 n = 761
ATT 1.11 1.1 0.9
Mean SE Mean SE %bias
p-val.
Mean SE %bias
p-val.
Mean SE %bias
p-val.
Physical characteristics
Conserved forest (ha) 7.67 0.08 5.73 0.12 59 0 6.14 0.11 48.8 0 6.03 0.13 49.7 0
Forest area 2007 (ha) 8.43 0.06 7.78 0.09 20.8 0 8.14 0.07 9.3 0 7.9 0.09 16.8 0
Elevation (m) 175.04 0.58 176.06 0.76 -4.1 0.28 174.13 0.65 3.5 0.31 178.06 0.68 -12.1 0
Slope (%) 1.89 0.06 1.81 0.07 4.3 0.4 1.54 0.05 19 0 1.6 0.05 15.8 0
Deforestation risk 0.07 0 0.08 0 -7.8 0.05 0.07 0 2.2 0.53 0.07 0 0.5 0.89
Socioeconomic characteristics
Ejido size (ha) 5211.8 85.3 6675.2 141.13 -16.3 0 10153 285.72 -54.9 0 5125.1 106.38 1 0.54
Years since ejidofoundation
36.18 0.24 38.22 0.35 -20.8 0 34.1 0.28 21.2 0 33.11 0.31 31.4 0
Distance to city (km) 253.41 0.47 252.99 0.68 2.7 0.61 252.16 0.44 8.1 0.06 255.69 0.62 -15 0
Marginality index in 2005 0.11 0.62 0.15 0.02 9.7 0.03 0.39 0.02 -45.5 0 0.21 0.02 -15.5 0
Population in 2005 484.35 12.43 706.59 21.43 -11.7 0 1362.9 60.23 -46.2 0 537.78 15.93 -2.8 0.01
Active population (%) 0.52 0 0.51 0 -6.9 0.11 0.5 0 56.2 0 0.51 0 29.5 0
Spatially lagged characteristics
Conserved forest (ha) 6.58 0.07 5.12 0.1 53.9 0 5.47 0.09 40.9 0 5.43 0.1 42.7 0
Forest area 2007 (ha) 7.44 0.06 6.74 0.08 26.2 0 7.13 0.07 11.7 0 6.93 0.08 19 0
Elevation (m) 174.71 0.55 175.89 0.73 -4.8 0.2 173.94 0.63 3.2 0.35 178.17 0.66 -14.1 0
Slope (%) 1.84 0.05 1.77 0.05 4.6 0.37 1.53 0.04 21.8 0 1.61 0.04 16.1 0
Deforestation risk 0.07 0 0.07 0 -9.9 0.02 0.07 0 1.8 0.61 0.06 0 6.2 0.11
We provide an estimation of the Average Treatment Effect of the Treated (ATT) for our three specifications. The first specification (A) preprocesses data
based on a 1:1 matching on Mahalanobis distance with replacement. The potential control group is limited to ejidos that have parcels treated in 2008 or
2009. Covariate matching is based on forest cover in 2007, elevation, slope deforestation risk and their respective spatial lags. We add an exact matching
characterizing the dominant type of soil in the cell. Specification B follows the same procedure but the potential control group is limited to ejidos which
have not received any PES program. The last control specification (C) is obtained by a two-step procedure. We first match non-treated ejidos to treated
ones using social and administrative variables (years since ejido foundation, ejido size, numbers of right holders, distance to nearest city, total population,
proportion of active population and marginality index). We perform another matching 1:1 on Mahalanobis distance with replacement using the same
procedure than in the first control group, adding an exact matching taking into account the pairs of ejidos previously defined. We make the comparison of
group mean and standard error (SE) between treated and defined control groups. We only considers cells that had at least 1 ha of forest in 2007. A cell is
considered as treated if it overlap (more than 2 ha) a PES polygon in 2008 or 2009. We also compare variable distribution between treated and the three
respective control groups using two statistics. We use the P-value of mean-comparison test and the standardized bias difference in percentage.
Standardized difference is the difference in percentage in average covariate values, divided by the square root of the sum of variances for both groups
([34]). W is the spatially lagged value using a queen contiguity matrix (average value of the eight cells that share a boundary with the cells of interest).
doi:10.1371/journal.pone.0119881.t002
Effectiveness of Biodiversity Conservation Payments in Mexico
PLOS ONE | DOI:10.1371/journal.pone.0119881 March 25, 2015 12 / 20
consider different overlaps between a cell and a PES polygon (0.5, 2 and 8 hectares). The varia-tion of this threshold either conserves or eliminates cells located at the boundaries between en-rolled and un-enrolled forest parcels.
To test the robustness of each specification, we used a difference-in-difference (DID) esti-mator to control for time invariant factors that jointly affected control and treated units. We es-timated the DID with i) an Ordinary Least Square (OLS) model and with ii) a Panel Fixed-Effects (FE) model. Our OLS specification contained our set of physical and socio-economicvariables likely to have an influence on forest conservation independently of PES payments[35]. Because we only had two time periods, a FE model could not take into account eventualserial correlation. Nevertheless, we used panel variables that we considered good proxies foreventual change in decision-making capabilities to account for variations in social and demo-graphic characteristics at ejido level. These variables related to the evolution of total population,marginality index, proportion of active population (between 14 and 65 years-old) and propor-tion of people with secondary education.
Results
Deforestation riskOur results show that, on average, non-treated parcels in treated ejidos have a higher deforesta-tion risk than treated parcels (respectively 0.074 against 0.066) (Table 3, line E and F). This isconsistent with the fact that the deforestation risk index is a proxy for opportunity costs. In-deed, forests with low opportunity costs are more likely to be placed under the program by eji-dos' right-holders because the payment received to conserve is higher than the expectedprofitability of alternative land uses on the allocated lands. We also observe that the average de-forestation risk in non-participant ejidos is similar to that in treated parcels (Table 3, line E andI).
We refined our analysis for treated parcels by decomposing our results by year of first entryinto PES. The first parcels to enter the PES program in 2005 had a very low deforestation risk.This finding is consistent with observations made by [21,27] and with the fact that the use ofthe deforestation risk index to select eligible areas for payment under Mexico's PES programswas only introduced in 2007 [23,31]. We can therefore see that parcels entering the PES pro-gram in 2008 have a higher probability of deforestation (0.075 on average) than previous co-horts. As the stock of forest is limited, forests entering PES in later cohorts have a lowerdeforestation risk-although higher than for the 2005 cohort-, which, however, is similar to theaverage of non-treated parcels in treated ejidos.
Deforestation rateIn 2007, roughly half of the total area of the two municipalities was covered in primary forest,for a total area of 97,852.5 hectares (table 3, third column). By 2013, total forest cover was re-duced to 68,980.6 hectares, which represents an average annual deforestation rate of 6.75%.From the summary statistics, it appears that there is little relation between the predicted defor-estation risk and actual deforestation. If the local conservation programs are successful, wewould expect this outcome as conservation activities and payments target those parcels withsignificant deforestation risk, ideally translating into reduced forest cover loss on those sameparcels. This suspicion is further supported by the fact that the majority of deforestation(55.64%) occurs in non-treated ejidos, which have lost 37.82% of primary forest cover between2007 and 2013 (table 3, line I). However, non-treated parcels of treated ejidos also face a highdeforestation risk but have lost relatively less forest over the same period. This observation canbe interpreted from two opposite perspectives. On the one hand, PES participating ejidos
Effectiveness of Biodiversity Conservation Payments in Mexico
PLOS ONE | DOI:10.1371/journal.pone.0119881 March 25, 2015 13 / 20
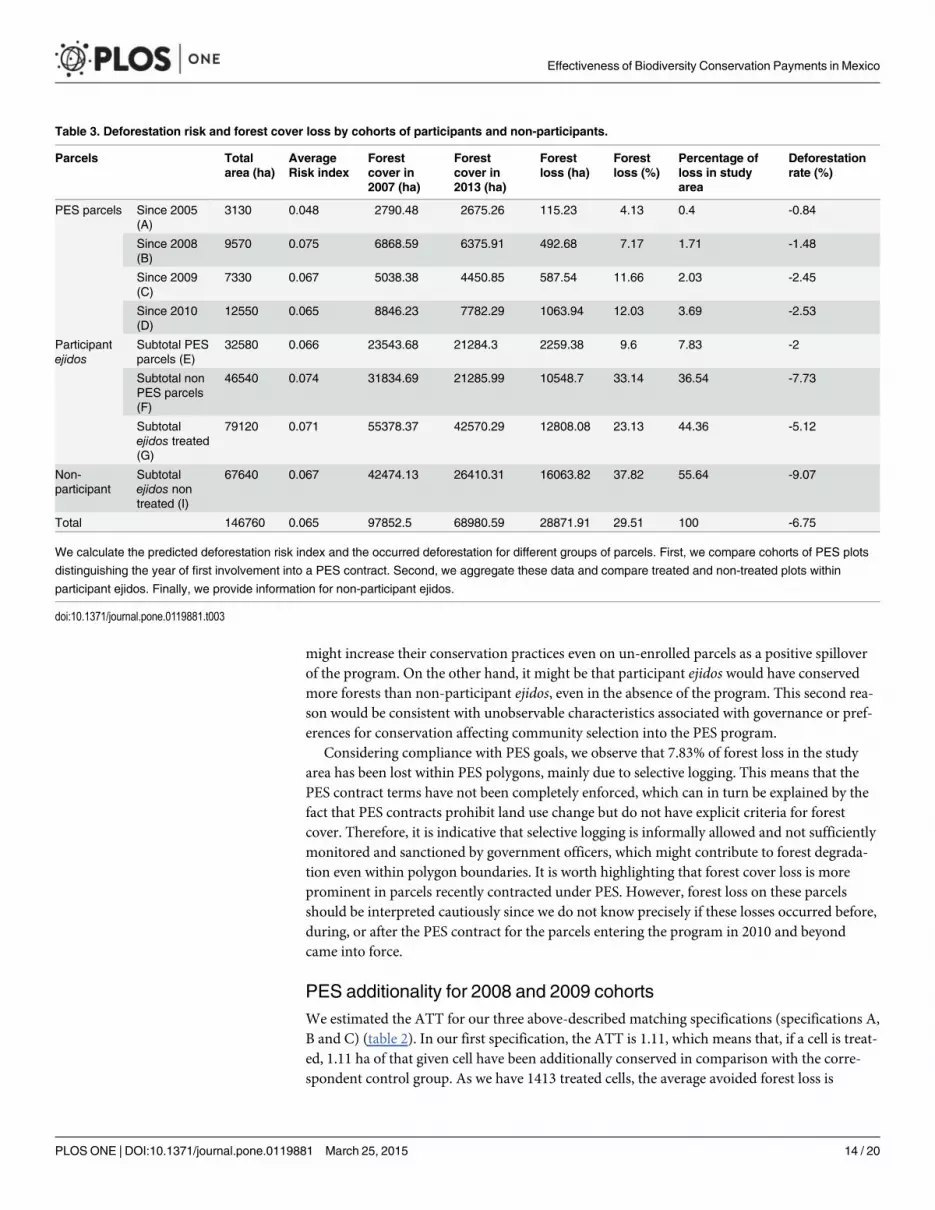
might increase their conservation practices even on un-enrolled parcels as a positive spilloverof the program. On the other hand, it might be that participant ejidos would have conservedmore forests than non-participant ejidos, even in the absence of the program. This second rea-son would be consistent with unobservable characteristics associated with governance or pref-erences for conservation affecting community selection into the PES program.
Considering compliance with PES goals, we observe that 7.83% of forest loss in the studyarea has been lost within PES polygons, mainly due to selective logging. This means that thePES contract terms have not been completely enforced, which can in turn be explained by thefact that PES contracts prohibit land use change but do not have explicit criteria for forestcover. Therefore, it is indicative that selective logging is informally allowed and not sufficientlymonitored and sanctioned by government officers, which might contribute to forest degrada-tion even within polygon boundaries. It is worth highlighting that forest cover loss is moreprominent in parcels recently contracted under PES. However, forest loss on these parcelsshould be interpreted cautiously since we do not know precisely if these losses occurred before,during, or after the PES contract for the parcels entering the program in 2010 and beyondcame into force.
PES additionality for 2008 and 2009 cohortsWe estimated the ATT for our three above-described matching specifications (specifications A,B and C) (table 2). In our first specification, the ATT is 1.11, which means that, if a cell is treat-ed, 1.11 ha of that given cell have been additionally conserved in comparison with the corre-spondent control group. As we have 1413 treated cells, the average avoided forest loss is
Table 3. Deforestation risk and forest cover loss by cohorts of participants and non-participants.
Parcels Totalarea (ha)
AverageRisk index
Forestcover in2007 (ha)
Forestcover in2013 (ha)
Forestloss (ha)
Forestloss (%)
Percentage ofloss in studyarea
Deforestationrate (%)
PES parcels Since 2005(A)
3130 0.048 2790.48 2675.26 115.23 4.13 0.4 -0.84
Since 2008(B)
9570 0.075 6868.59 6375.91 492.68 7.17 1.71 -1.48
Since 2009(C)
7330 0.067 5038.38 4450.85 587.54 11.66 2.03 -2.45
Since 2010(D)
12550 0.065 8846.23 7782.29 1063.94 12.03 3.69 -2.53
Participantejidos
Subtotal PESparcels (E)
32580 0.066 23543.68 21284.3 2259.38 9.6 7.83 -2
Subtotal nonPES parcels(F)
46540 0.074 31834.69 21285.99 10548.7 33.14 36.54 -7.73
Subtotalejidos treated(G)
79120 0.071 55378.37 42570.29 12808.08 23.13 44.36 -5.12
Non-participant
Subtotalejidos nontreated (I)
67640 0.067 42474.13 26410.31 16063.82 37.82 55.64 -9.07
Total 146760 0.065 97852.5 68980.59 28871.91 29.51 100 -6.75
We calculate the predicted deforestation risk index and the occurred deforestation for different groups of parcels. First, we compare cohorts of PES plots
distinguishing the year of first involvement into a PES contract. Second, we aggregate these data and compare treated and non-treated plots within
participant ejidos. Finally, we provide information for non-participant ejidos.
doi:10.1371/journal.pone.0119881.t003
Effectiveness of Biodiversity Conservation Payments in Mexico
PLOS ONE | DOI:10.1371/journal.pone.0119881 March 25, 2015 14 / 20
1568.43 ha, which represent 14.7 percent of the area put under PES in 2008 and 2009. In oursecond specification, which only considers parcels in non-participating ejidos as control group,the additionality of the program is similar, at 1.10 ha per cell (14.6 percent of enrolled area).The similarity of these results can be an indication of the absence of leakage effect in ourfirst specification.
The last specification, which includes socio-economic variables, provides an estimation ofthe ATT that is substantially lower than the estimate from the second specification by nearly0.2 ha by cell (but the avoided deforestation still represent about 12 percent of the enrolledarea). Thus, if we compare similar parcels in similar ejidos, the additionality is relatively lowerthat if we only compare forest parcels that are similar in terms of biophysical characteristics.These differences are probably due to the fact that socio-economic and institutional factorshave an impact on success of the program at community level.
Sensitivity AnalysisWe performed sensitivity analysis over three dimensions. First, we considered how the magni-tude of the ATT estimate changed in response to modifying the matching parameters. Second,we check if the ATT estimate was sensitive to the threshold we outlined for the definition ofminimum forest cover and minimum overlap with PES polygons. As observed in table 4, it ap-pears that our results are somewhat sensitive to these threshold assumptions. Last, we explorethe effect of the matching specification. We choose two matches per treated observation insteadof one and only keeping the best 95% matches. As noted above, we find that our results are sen-sitive to including community characteristics, which implies that these socio-economic vari-ables capture differences in the propensity of communities to enroll in the program anddifferences in forest cover outcomes. In both cases, however, the ATT is significantly differentfrom zero. The analysis of the matching specifications suggests that results are relatively sensi-tive to the threshold we used to determine minimum forest cover and minimum PES overlap.Holding constant the PES overlap area but reducing the minimum forest area from 1 ha to 0.1ha appears to systematically reduce the program impact in all our specifications. This differ-ence suggests that the PES program is less effective in the conservation of small forested areasthan for more compacted areas. Alternatively, the smaller minimum forest area may add noiseto our dependent variables, leading to an error in variables problem, potentially biasing our es-timated treatment toward zero.
We check this result by analyzing how estimates of additionality resulting vary with changesin the minimum PES overlap. Our 8 ha threshold restricts the treated units to only those largelyoverlapping PES polygons and, when doing so, the additionality in all our specifications dimin-ishes. We attribute this result to the fact that some cells imperfectly overlapping PES polygonswere considered as treated with a less strict threshold but became considered as control now.
Robustness analysisFinally, we performed additional estimations to assess the robustness of the previous estima-tion of program impacts (Table 5). In our sample, results from both OLS and FE models give asignificant estimation of program impact. In both estimations, the estimated additionality ishigher than with simple matching specifications. This result implies that either the time-invari-ant parcel characteristics or common time trends bias the treatment results downward.
DiscussionOur results show that Mexico's PES program for biodiversity conservation has been effective inenrolling areas that generally show high deforestation risk. We also have shown that on
Effectiveness of Biodiversity Conservation Payments in Mexico
PLOS ONE | DOI:10.1371/journal.pone.0119881 March 25, 2015 15 / 20
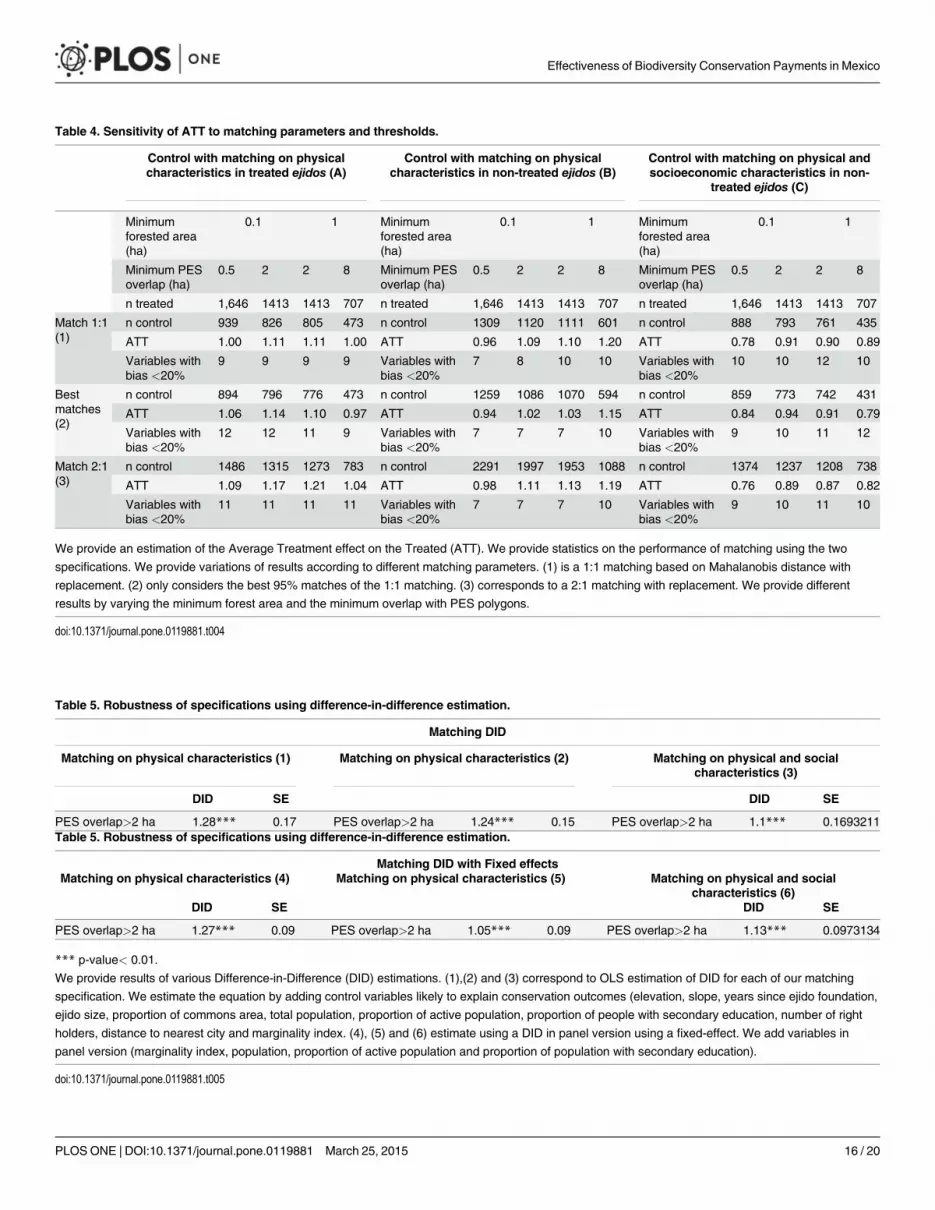
Table 4. Sensitivity of ATT to matching parameters and thresholds.
Control with matching on physicalcharacteristics in treated ejidos (A)
Control with matching on physicalcharacteristics in non-treated ejidos (B)
Control with matching on physical andsocioeconomic characteristics in non-
treated ejidos (C)
Minimumforested area(ha)
0.1 1 Minimumforested area(ha)
0.1 1 Minimumforested area(ha)
0.1 1
Minimum PESoverlap (ha)
0.5 2 2 8 Minimum PESoverlap (ha)
0.5 2 2 8 Minimum PESoverlap (ha)
0.5 2 2 8
n treated 1,646 1413 1413 707 n treated 1,646 1413 1413 707 n treated 1,646 1413 1413 707
Match 1:1(1)
n control 939 826 805 473 n control 1309 1120 1111 601 n control 888 793 761 435
ATT 1.00 1.11 1.11 1.00 ATT 0.96 1.09 1.10 1.20 ATT 0.78 0.91 0.90 0.89
Variables withbias <20%
9 9 9 9 Variables withbias <20%
7 8 10 10 Variables withbias <20%
10 10 12 10
Bestmatches(2)
n control 894 796 776 473 n control 1259 1086 1070 594 n control 859 773 742 431
ATT 1.06 1.14 1.10 0.97 ATT 0.94 1.02 1.03 1.15 ATT 0.84 0.94 0.91 0.79
Variables withbias <20%
12 12 11 9 Variables withbias <20%
7 7 7 10 Variables withbias <20%
9 10 11 12
Match 2:1(3)
n control 1486 1315 1273 783 n control 2291 1997 1953 1088 n control 1374 1237 1208 738
ATT 1.09 1.17 1.21 1.04 ATT 0.98 1.11 1.13 1.19 ATT 0.76 0.89 0.87 0.82
Variables withbias <20%
11 11 11 11 Variables withbias <20%
7 7 7 10 Variables withbias <20%
9 10 11 10
We provide an estimation of the Average Treatment effect on the Treated (ATT). We provide statistics on the performance of matching using the two
specifications. We provide variations of results according to different matching parameters. (1) is a 1:1 matching based on Mahalanobis distance with
replacement. (2) only considers the best 95% matches of the 1:1 matching. (3) corresponds to a 2:1 matching with replacement. We provide different
results by varying the minimum forest area and the minimum overlap with PES polygons.
doi:10.1371/journal.pone.0119881.t004
Table 5. Robustness of specifications using difference-in-difference estimation.
Matching DID
Matching on physical characteristics (1) Matching on physical characteristics (2) Matching on physical and socialcharacteristics (3)
DID SE DID SE
PES overlap>2 ha 1.28*** 0.17 PES overlap>2 ha 1.24*** 0.15 PES overlap>2 ha 1.1*** 0.1693211Table 5. Robustness of specifications using difference-in-difference estimation.
Matching DID with Fixed effectsMatching on physical characteristics (4) Matching on physical characteristics (5) Matching on physical and social
characteristics (6)DID SE DID SE
PES overlap>2 ha 1.27*** 0.09 PES overlap>2 ha 1.05*** 0.09 PES overlap>2 ha 1.13*** 0.0973134
*** p-value< 0.01.
We provide results of various Difference-in-Difference (DID) estimations. (1),(2) and (3) correspond to OLS estimation of DID for each of our matching
specification. We estimate the equation by adding control variables likely to explain conservation outcomes (elevation, slope, years since ejido foundation,
ejido size, proportion of commons area, total population, proportion of active population, proportion of people with secondary education, number of right
holders, distance to nearest city and marginality index. (4), (5) and (6) estimate using a DID in panel version using a fixed-effect. We add variables in
panel version (marginality index, population, proportion of active population and proportion of population with secondary education).
doi:10.1371/journal.pone.0119881.t005
Effectiveness of Biodiversity Conservation Payments in Mexico
PLOS ONE | DOI:10.1371/journal.pone.0119881 March 25, 2015 16 / 20
average, treated parcels in recent cohorts and un-enrolled parcels have similar deforestationrisk, which suggests that participation in PES cannot be explained only by land opportunitycosts but, as other studies have suggested, also by factors related to collective decision-makingand local governance [43]. The program has led to additional forest cover protection in com-parison to what we would have expected in the absence of payments. This finding is consistentwith the existence of a positive relationship between deforestation trends and the eventual envi-ronmental additionality of a PES program [23,24], although the level of additionality found ismuch higher than those observed in other impact evaluation studies of similar PES programsin Mexico [25,29].
The program's additionality diminishes to around 20% when taking into account socio-eco-nomic variables. Given the small number of observations, however, it has not been possible todetermine the relative contribution of leakage effects to such diminished additionality. Robust-ness analysis confirms additionality but variations are found when testing for different classifi-cation thresholds for determining land use units comparison groups with respect to the size ofthe forest parcel and the level of overlap with the PES polygons. Lower additionality in PESlands with smaller forests suggests additionality could be lower in already fragmented forestssurrounding agricultural or pasture lands. Further analysis is needed to confirm this relationbut it raises doubts about the possibility to maintain additionality for current cohorts undercontract. Indeed, in 2008, the minimum area that ejidos could enroll in programs was 20 ha,but in recent years the complementary Special Program for the Lacandon rainforest allows thisminimum area to be split between several parcels.
The analysis also reveals that additionality can be achieved despite low compliance levels insome PES areas (i.e. plots under PES lands have been losing around 10% of forest cover duringthe contract). We argue that the lack of compliance can be explained by constrained forest gov-ernance at collective or household levels coupled with deforestation inertia, as well as by thegovernment's insufficient enforcement of program rules. Regarding the former, it is importantto highlight that non-compliant PES areas can encompass three types of tenure arrangements,namely: de jure commonly held and managed land; de jure commonly held land but de facto di-vided by the assembly and household managed; and de jure household-owned land. Addition-ally, we observed that un-enrolled parcels of treated ejidos have been less deforested thanparcels of non-treated ejidos despite a higher deforestation risk index for the former can implythe presence of a positive spillover of the program. For example, some treated ejidos in the areahave been able to successfully develop ecotourism projects in parallel with the enrollment oftheir forest program [38]. However, asserting the existence, drivers and consequences of thesebehavioral and collective responses with full confidence would require extensive ethnographicwork at community level.
Overall then, given that deforestation has proceeded apace in non-PES and a minority ofPES targeted areas during the study period, we think that the PES program has been insuffi-cient to halt deforestation at municipal level. This outcome is explained by the existence of in-centives to convert forest lands to more profitable land uses such as oil palm cultivation [6,37],resource management competing interests and forest governance failures at ejido level, andlack of enforcement of the PES program by CONAFOR. The long-term permanence of currenthigh additionality levels in the studied municipalities is likely to be dependent upon sustainingpayments over time and keeping PES targeted areas sufficiently large, in combination with al-ternative conservation strategies ranging from improved command and control approaches toinvestment into more diversified forest agricultural economies. A comprehensive conservationand development strategy appears as the necessary next step to take into account all togetherconservation priority zones, biodiversity corridors and agricultural development hot spots[18].
Effectiveness of Biodiversity Conservation Payments in Mexico
PLOS ONE | DOI:10.1371/journal.pone.0119881 March 25, 2015 17 / 20
Supporting InformationS1 File. Sources of data used. To perform this analysis, we have used databases provided bydifferent organizations. We provide information on the availability for each of these sources.(DOC)
S2 File. Data generated by the authors.(ZIP)
AcknowledgmentsThe authors thank El Colegio de la Frontera Sur (ECOSUR, Mexico) for providing access to thecorresponding databases, notably through the ERMEX project. We also thank CONAFOR offi-cials for all the information provided, in particular Sofia Cortina, Adalberto Vargas and MarioPinto. Visits to the participant ejidos have been made possible with the help of PES programstechnical service providers operating in the region. The authors are also grateful for the com-ments received at the international workshop “Evaluating Forest Conservation Initiatives: NewTools and Policy Needs”, December 10–12th, held in Barcelona, Spain, where an earlier versionof this manuscript was presented.
Author ContributionsConceived and designed the experiments: SC JH KB. Analyzed the data: SC MC. Wrote thepaper: SC EC DE JH KB.
References1. Landell-Mills N, Porras IT, International Institute for Environment and Development. Silver bullet or
fools’ gold: a global review of markets for forest environmental services and their impacts on the poor[Internet]. Stevenage, Hertfordshire: International Institute for Environment and Development; 2002.Available: http://pubs.iied.org/pdfs/9066IIED.pdf?
2. Wunder S, Engel S, Pagiola S. Taking stock: A comparative analysis of payments for environmentalservices programs in developed and developing countries. Ecol Econ. 2008; 65: 834–852.
3. Miteva DA, Pattanayak SK, Ferraro PJ. Evaluation of biodiversity policy instruments: what works andwhat doesn’t? Oxf Rev Econ Policy. 2012; 28: 69–92.
4. Ferraro PJ, Pattanayak SK. Money for Nothing? A Call for Empirical Evaluation of Biodiversity Conser-vation Investments. PLoS Biol. 2006; 4: e105. PMID: 16602825
5. Pattanayak SK, Wunder S, Ferraro PJ. Show Me the Money: Do Payments Supply Environmental Ser-vices in Developing Countries? Rev Environ Econ Policy. 2010; 4: 254–274.
6. Soto-Pinto L, Castillo-Santiago MA, Jiménez-Ferrer G. Agroforestry Systems and Local InstitutionalDevelopment for Preventing Deforestation in Chiapas, Mexico. In: Moutinho P, editor. DeforestationAround the World. InTech; 2012. Available: http://www.intechopen.com/books/deforestation-around-the-world/agroforestry-systems-and-local-institutional-development-for-preventing-deforestation-in-chiapas-mex
7. Wunder S. The Efficiency of Payments for Environmental Services in Tropical Conservation. ConservBiol. 2007; 21: 48–58. PMID: 17298510
8. Jack BK, Kousky C, Sims KRE. Designing payments for ecosystem services: Lessons from previousexperience with incentive-based mechanisms. Proc Natl Acad Sci. 2008; 105: 9465–9470. doi: 10.1073/pnas.0705503104 PMID: 18621696
9. Ferraro PJ. Asymmetric information and contract design for payments for environmental services. EcolEcon. 2008; 65: 810–821.
10. Sommerville MM, Jones JPG, Milner-Gulland EJ. A Revised Conceptual Framework for Payments forEnvironmental Services. Ecol Soc. 2009;14. Available: http://www.ecologyandsociety.org/vol14/iss2/art34/
11. Muradian R, Corbera E, Pascual U, Kosoy N, May PH. Reconciling theory and practice: An alternativeconceptual framework for understanding payments for environmental services. Ecol Econ. 2010; 69:1202–1208.
Effectiveness of Biodiversity Conservation Payments in Mexico
PLOS ONE | DOI:10.1371/journal.pone.0119881 March 25, 2015 18 / 20
12. Tacconi L. Redefining payments for environmental services. Ecol Econ. 2012; 73: 29–36.
13. Huang M, Upadhyaya SK, Jindal R, Kerr J. Payments for Watershed Services in Asia: A Review of Cur-rent Initiatives. J Sustain For. 2009; 28: 551–575.
14. Ferraro PJ. Regional Review of Payments for Watershed Services: Sub-Saharan Africa. J Sustain For.2009; 28: 525–550.
15. Southgate D, Wunder S. Paying for Watershed Services in Latin America: A Review of Current Initia-tives. J Sustain For. 2009; 28: 497–524.
16. Jindal R, Swallow B, Kerr J. Forestry-based carbon sequestration projects in Africa: Potential benefitsand challenges. Nat Resour Forum. 2008; 32: 116–130.
17. Milne S, Niesten E. Direct payments for biodiversity conservation in developing countries: practical in-sights for design and implementation. Oryx. 2009; 43: 530–541.
18. Barsimantov J, Kendall J. Community Forestry, Common Property, and Deforestation in Eight MexicanStates. J Environ Dev. 2012; 21: 414–437.
19. Corbera E, Soberanis CG, Brown K. Institutional dimensions of Payments for Ecosystem Services: Ananalysis of Mexico’s carbon forestry programme. Ecol Econ. 2009; 68: 743–761.
20. Shapiro-Garza E. Contesting the market-based nature of Mexico’s national payments for ecosystemservices programs: Four sites of articulation and hybridization. Geoforum. 2013; 46: 5–15.
21. Muñoz-Piña C, Guevara A, Torres JM, Braña J. Paying for the hydrological services of Mexico’s forests:Analysis, negotiations and results. Ecol Econ. 2008; 65: 725–736.
22. Pagiola S. Payments for environmental services in Costa Rica. Ecol Econ. 2008; 65: 712–724.
23. Muñoz-Piña C, Rivera M, Cisneros A, García H. Retos de la focalización del Programa de Pago por losServicios Ambientales en México. Rev Esp Estud Agrosociales Pesq. 2011; 228: 87–113.
24. FRA. Global Forest Resources Assessment 2010,Country Report,Mexico [Internet]. Food and Agricul-ture Organization of the United Nations; 2010. Report No.: FRA2010/132. Available: http://www.fao.org/docrep/013/al567S/al567S.pdf
25. Alix-Garcia J, Sims KR, Yañez-Pagans P. Only one tree from each seed? Environmental effectivenessand poverty alleviation in Mexico’s payments for ecosystem services program.Work Pap Univ WisMadison. 2014; Available: https://www.amherst.edu/system/files/media/One%2520Tree%2520Manuscript%2520Revised%25207-24-2014.pdf
26. Blackman A. Evaluating forest conservation policies in developing countries using remote sensingdata: An introduction and practical guide. For Policy Econ. 2013; 34: 1–16.
27. Alix-Garcia JM, Shapiro EN, Sims KRE. Forest Conservation and Slippage: Evidence fromMexico’sNational Payments for Ecosystem Services Program. Land Econ. 2012; 88: 613–638.
28. Robalino J, Pfaff A. Ecopayments and deforestation in Costa Rica: A nationwide analysis of PSA’s ini-tial years. Land Econ. 2013; 89: 432–448.
29. Honey-Rosés J, Baylis K, Ramírez MI. A Spatially Explicit Estimate of Avoided Forest Loss: Spatial Es-timate of Avoided Forest Loss. Conserv Biol. 2011; 25: 1032–1043. doi: 10.1111/j.1523-1739.2011.01729.x PMID: 21902720
30. Arriagada RA, Ferraro PJ, Sills EO, Pattanayak S, Cordero-Sancho S. Do Payments for EnvironmentalServices Affect Forest Cover? A Farm-Level Evaluation from Costa Rica. Land Economics; 2012.
31. Sims KRE, Alix-Garcia J, Shapiro-Garza E, Fine L, Radeloff V, Aronson G, et al. Adaptive Managementin Mexico’s Payments for Hydrological Services Program Improves Targeting for Environmental andSocial Goals. Conserv Biol. 2014;
32. Greenstone M, Gayer T. Quasi-experimental and experimental approaches to environmental econom-ics. J Environ Econ Manag. 2009; 57: 21–44.
33. Holland PW. Statistics and Causal Inference. J Am Stat Assoc. 1986; 81: 945–960.
34. Imbens GW,Wooldridge JM. Recent Developments in the Econometrics of Program Evaluation. JEcon Lit. 2009; 47: 5–86.
35. Bertrand M, Duflo E, Mullainathan S. HowMuch ShouldWe Trust Differences-In-Differences Esti-mates? Q J Econ. 2004; 119: 249–275.
36. Ho DE, Imai K, King G, Stuart EA. Matching as Nonparametric Preprocessing for Reducing Model De-pendence in Parametric Causal Inference. Polit Anal. 2007; 15: 199–236.
37. Carabias J, Meli P, Hernández G. Evaluación de los impactos de proyectos de desarrollo sustentablesobre la reducción del cambio de uso de suelo en ejidos de Marqués de Comillas, Chiapas. [Internet].INECC; 2012. Available: http://www.inecc.gob.mx/descargas/cclimatico/2012_eval_impac_proy_sust_ejidos.pdf.
Effectiveness of Biodiversity Conservation Payments in Mexico
PLOS ONE | DOI:10.1371/journal.pone.0119881 March 25, 2015 19 / 20
38. Carabias J, Meli P, Landa R, Hernández M, Hernández Cárdenas G, Bravo M. Análisis socio-ambientaldel deterioro y la percepción de las poblaciones locales de la vulnerabilidad y el riesgo frente al cambioclimático, en Marqués de Comillas, Chiapas [Internet]. INECC; 2009. Available: http://www.inecc.gob.mx/descargas/cclimatico/2009_estudio_cc_va7.pdf
39. García-Gil JG, Lugo Hupb J. Las formas del relieve y los tipos de vegetación en la Selva Lacandona.Reserva de la Biosfera Montes Azules, Selva Lacandona: Investigación para su conservación. Vás-quez-Sánchez M. A. and Ramos M. A.. Mexico: Centro de Estudios para la Conservación de losRecursos Naturales (Mexico); 1992. pp. 39–49.
40. Alix-Garcia J. A spatial analysis of common property deforestation. J Environ Econ Manag. 2007; 53:141–157.
41. Abadie A, Imbens GW. Large Sample Properties of Matching Estimators for Average Treatment Ef-fects. Econometrica. 2006; 74: 235–267.
42. Rosenbaum PR, Rubin DB. Constructing a Control Group Using Multivariate Matched Sampling Meth-ods That Incorporate the Propensity Score. Am Stat. 1985; 39: 33.
43. Kosoy N, Corbera E, Brown K. Participation in payments for ecosystem services: Case studies from theLacandon rainforest, Mexico. Geoforum. 2008; 39: 2073–2083.
Effectiveness of Biodiversity Conservation Payments in Mexico
PLOS ONE | DOI:10.1371/journal.pone.0119881 March 25, 2015 20 / 20