balance of payments of the kyrgyz republic
TRANSCRIPT
National Bank of the Kyrgyz Republic
Balance of Paymentsof the
Kyrgyz Republic
First quarter of 2017
July 2017
Bishkek
EDITORIALBOARD:
Chairman:Members of Board:
Executive secretary:
N. JenishA. AidarovaA. KarakozhaevN. Sadykova
K. Kudabaev
Balance of Payments of the Kyrgyz Republic for the first quarter of 2017
Balance of Payments of the Kyrgyz Republic
"Balance of payments of the Kyrgyz Republic" is issued by the National Bank of the Kyrgyz Republic. The legislative basis for thebalance of payments is the Law of the Kyrgyz Republic as of December 16, 2016 No.206 "On the National Bank of the KyrgyzRepublic, banks and banking activity". This document reflects last tendencies in external sector development and shows statisticaldata on the balance of payments, external trade, international reserves, external debt and international investment position, as well asconstruction methods of balance of payments and informational database. This document is published 4 times a year in January,May, July and October and has 3 language versions: Kyrgyz, Russian and English.
This publication provides:- the revised data on direct investments for 2016;- additional estimates of the National Bank of the Kyrgyz Republic on the foreign trade operations for exports;- the data on the international reserves of the National Bank of the Kyrgyz Republic were revised according to the IMFmethodology, thereunder only the assets in convertible currencies were included in the international reserve assets. The assetsin other currencies were presented as other assets in "other investments" item;- the reference period, which is used for calculation of the REER (real effective exchange rate) index, was revised;- preliminary version of the analytical form of the balance of payments of the Kyrgyz Republic compiled on the basis of BPM 6methodology was provided.
Last day for update of data for the present publication is July 20, 2017.
Annotation symbols and notes:… means the absence of data;— means, that indicators/ratios are equal to 0 (zero) or insignificant;- is set between years or months (e.g., 1994-1996 or January-June) and means, that all years and months are covered by the
shown dates.
Deviations in last digits may occur because of rounding numbers when summing up.
In regard with the possible changes in accounting methods or historical data, which are used in the given document, correction of earlierpublished data is acceptable. Therefore, 10 years period can be accounted as "open period".
For any questions, please contact us:Tel.: (+996 312) 66-90-07, 66-90-56Fax: (+996 312) 61-52-85, 61-07-30
Address: 168, Chuy Ave., BishkekThe National Bank of the Kyrgyz RepublicFinancial Statistics and Survey DepartmentBalance of Payments and External Debt DivisionE-mail: [email protected]
Founder: National bank of the Kyrgyz RepublicPublication is registered by the Ministry of Justice of the Kyrgyz Republic
State file number - 605. NBKR, 2017. Copying of this publication must be approved by the National Bank of the Kyrgyz Republic and any citation
should be marked with a source.Published by Publishing House OJSC "M-Maxima"
48/1-6, Gorky Street, Bishkek cityTel.: +996 (312) 90 04 35e-mail: [email protected]
Balance of Payments of the Kyrgyz Republic for the first quarter of 2017
Other publications of the National Bank of the Kyrgyz Republic
Annual Report of the National Bank of the Kyrgyz RepublicThis document is an overall report of the National Bank for the last year. It includes summary on economicdevelopment of the republic and monetary policy, as well as the National Bank financial statements, generalinformation and statistical reviews. It is published in 3 languages: Kyrgyz, Russian and English.
Bulletin of the National Bank of the Kyrgyz RepublicInformational publication includes statistical data on the basic macroeconomic indicators and economy sectorsof the Kyrgyz Republic. It is published in 3 languages: Kyrgyz, Russian and English.
Monetary Policy ReportThis publication describes dynamics of consumer prices in the republic and regions, analysis of the main inflationfactors, informs about the National Bank decisions on monetary policy and provides with inflation preview forthe forthcoming period. It is published quarterly in Kyrgyz, Russian and English.
Report on Stability of the Financial Sector of the Kyrgyz RepublicThe report reflects the NBKR's evaluation of foreign and domestic economic factors influencing the financialstability, the conditions of banks and other financial intermediate institutions, as well as the analysis of the currentstate of affairs in the financial markets and the stability of financial sector of Kyrgyzstan. It is published twice ayear in Kyrgyz, Russian and English.
Statutory Acts of the National Bank of the Kyrgyz RepublicThe purpose of the document is to publish statutory acts of the National Bank in order to provide commercialbanks and public with statutory acts and official information on the National Bank activity, as well as propagandaof the Kyrgyz Republic banking legislation. Presumable publication frequency is once a month in Kyrgyz andRussian languages.
Publications of the National Bank are distributed in accordance with approved delivery list. They can also befound on the National Bank web-site: http://www.nbkr.kg
Balance of Payments of the Kyrgyz Republic for the first quarter of 2017
Balance of Payments of the Kyrgyz Republic for the first quarter of 2017
List of abbreviations
ADB Asian Development BankCB Commercial BanksCIF The price at the frontier of the importing country (cost, insurance, freight)CIS Commonwealth of Independent CountriesEAEU Eurasian Economic UnionFMSRS KR Financial Market Supervision and Regulation Service of the Kyrgyz RepublicFOB The price at the frontier of the exporting country (free on board)GDP Gross Domestic ProductGED Gross External DebtIDB Islamic Development BankIMF International Monetary FundITRS International Transaction Reporting SystemKR Kyrgyz RepublicMA Monetary AuthoritiesMF KR Ministry of Finance of the Kyrgyz RepublicMFA KR Ministry of Foreign Affairs of the Kyrgyz RepublicMM Mass mediaMTC KR Ministry of Transport and Communications of the Kyrgyz RepublicNBKR National Bank of the Kyrgyz RepublicNEER Nominal Effective Exchange RateNFCI Non-bank Financial and Credit InstitutionsNon-CIS Non-Commonwealth of Independent CountriesNSC National Statistics Committee of the Kyrgyz RepublicOPEC Organization of Petroleum Exporting CountriesPED Public External DebtPrivate ED Private External DebtPIP Public Investment ProgramPRGF Poverty Reduction and Growth FacilityREER Real Effective Exchange RateSDR Special Drawing RightsSITC Standard International Trade ClassificationTA Technical AssistanceTED Total External DebtTNEEA Trade Nomenclature of External Economic ActivityUAE the United Arab EmiratesUSA the United States of AmericaVS Valuable SecurityWB World Bank
Balance of Payments of the Kyrgyz Republic for the first quarter of 2017
Content
Current status of the Balance of Payments ..............................................................................................7Annex I. Tables and charts ........................................................................................................................27
Table I.1. Balance of Payments of the Kyrgyz Republic (standard presentation) ................................28Table I.2. Structure of Export by the HS Sections ................................................................................36Table I.3. Structure of Export by the SITC Sections ............................................................................ 36Table I.4. Structure of Import by the HS Sections ...............................................................................37Table I.5. Structure of Import by the SITC Sections ............................................................................ 37Table I.6. Functional Structure of Export .............................................................................................. 38Table I.7. Geographical Structure of Export .......................................................................................... 38Table I.8. Functional Structure of Import .............................................................................................. 39Table I.9. Geographical Structure of Import .......................................................................................... 39Table I.10. Export of Major Types of Products .....................................................................................40Table I.11. Import of Major Types of Products .....................................................................................42Table I.12. Indices of Price and Physical Volume of Export ...................................................................44Table I.13. Indices of Price and Physical Volume of Import ...................................................................45
Export of Basic Goods by Countries .....................................................................................................46Table I.14. Export of Goods to Russian Federation ...............................................................................46Table I.15. Export of Goods to Kazakhstan ...........................................................................................47Table I.16. Export of Goods to Uzbekistan ............................................................................................48Table I.17. Export of Goods to Belarus .................................................................................................49Table I.18. Export of Goods to Switzerland ...........................................................................................50Table I.19. Export of Goods to China .................................................................................................... 51Table I.20. Export of Goods to Turkey ..................................................................................................52Table I.21. Export of Goods to the UAE................................................................................................ 53Import of Basic Goods by Countries ....................................................................................................54Table I.22. Import of Goods from Russian Federation ..........................................................................54Table I.23. Import of Goods from Kazakhstan ....................................................................................... 55Table I.24. Import of Goods from Uzbekistan........................................................................................ 56Table I.25. Import of Goods from Ukraine ............................................................................................. 57Table I.26. Import of Goods from Belarus ............................................................................................. 58Table I.27. Import of Goods from China ................................................................................................ 59Table I.28. Import of Goods from the USA ...........................................................................................60Table I.29. Import of Goods from Germany ...........................................................................................61Table I.30. Import of Goods from Turkey .............................................................................................. 62Table I.31. Import of Goods from Japan ................................................................................................ 63Table I.32. Import of Goods from the Republic of Korea ...................................................................... 64Table I.33. Import of Goods from the Netherlands ................................................................................65Chart I.1. Real and Nominal Effective Exchange Rate Indices ..............................................................66Table I.34. Real and Nominal Effective Exchange Rate Indices .............................................................67Table I.35. Geographic Distribution of Net Inflows of Foreign Direct Investmentsin the Kyrgyz Republic .........................................................................................................................69Table I.36. Foreign Direct Investments by Kinds of Economic Activities in theKyrgyz Republic ................................................................................................................................... 70Table I.37. International Reserves ........................................................................................................70Table I.38. External Debt of the Kyrgyz Republic ................................................................................. 71Table I.39. Geographical Structure of the Private External Debt of the Kyrgyz Republic ...................... 72Table I.40. Structure of the External Debt of the Kyrgyz Republic by types of Creditors ..................... 73Table I.41. Balance of International Investment Position of the Kyrgyz Republic ...............................74Table I.42. Development in Foreign Assets and Liabilities of the Kyrgyz Republic ............................. 75
Annex II.Table II.1. Information Sources, Used by the National Bank for Compilation of the Balanceof Payments of the Kyrgyz Republic .............................................................................................................. 76
CURRENT STATUS OF THE BALANCE OF PAYMENTS
7Balance of Payments of the Kyrgyz Republic for the first quarter of 2017
CURRENT STATUS OF THE BALANCE OF PAYMENTS
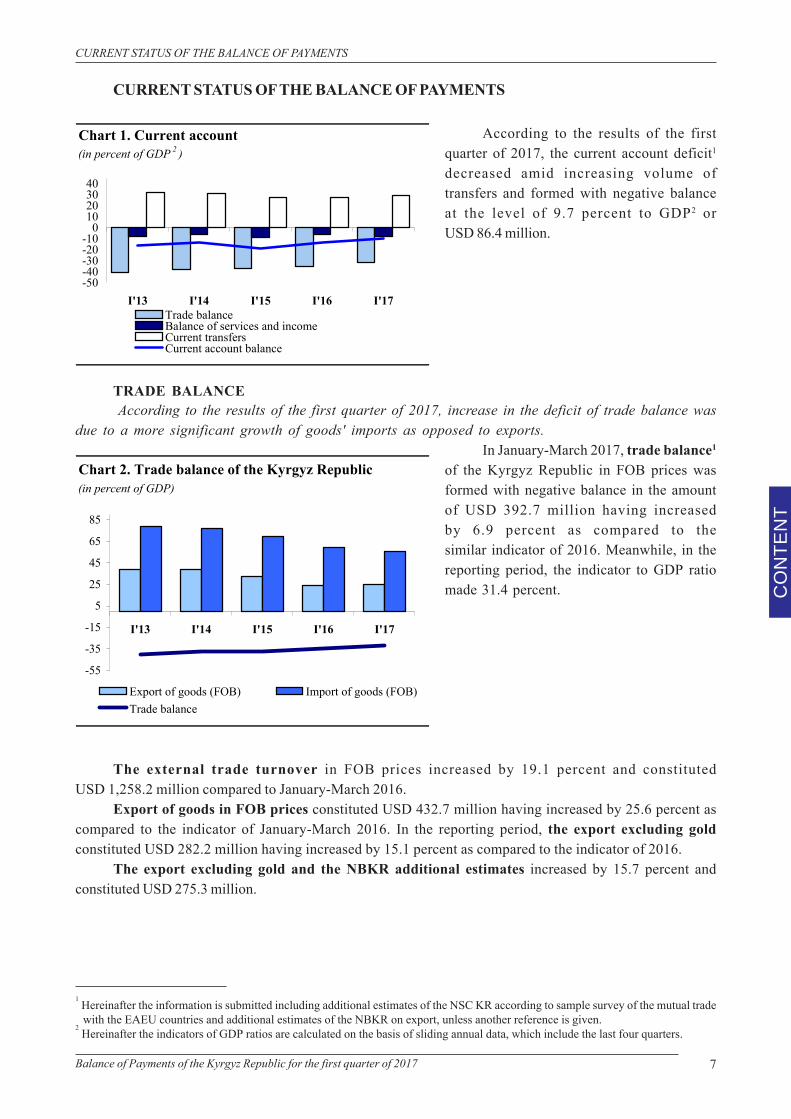
According to the results of the firstquarter of 2017, the current account deficit1
decreased amid increasing volume oftransfers and formed with negative balanceat the level of 9.7 percent to GDP2 orUSD 86.4 million.
TRADE BALANCE According to the results of the first quarter of 2017, increase in the deficit of trade balance was
due to a more significant growth of goods' imports as opposed to exports.In January-March 2017, trade balance1
of the Kyrgyz Republic in FOB prices wasformed with negative balance in the amountof USD 392.7 million having increasedby 6.9 percent as compared to thesimilar indicator of 2016. Meanwhile, in thereporting period, the indicator to GDP ratiomade 31.4 percent.
The external trade turnover in FOB prices increased by 19.1 percent and constitutedUSD 1,258.2 million compared to January-March 2016.
Export of goods in FOB prices constituted USD 432.7 million having increased by 25.6 percent ascompared to the indicator of January-March 2016. In the reporting period, the export excluding goldconstituted USD 282.2 million having increased by 15.1 percent as compared to the indicator of 2016.
The export excluding gold and the NBKR additional estimates increased by 15.7 percent andconstituted USD 275.3 million.
1 Hereinafter the information is submitted including additional estimates of the NSC KR according to sample survey of the mutual tradewith the EAEU countries and additional estimates of the NBKR on export, unless another reference is given.
2 Hereinafter the indicators of GDP ratios are calculated on the basis of sliding annual data, which include the last four quarters.
CO
NTE
NT
Chart 2. Trade balance of the Kyrgyz Republic(in percent of GDP)
-55
-35
-15
5
25
45
65
85
I'13 I'14 I'15 I'16 I'17
Export of goods (FOB) Import of goods (FOB)Trade balance
Chart 1. Current account(in percent of GDP 2 )
-50-40-30-20-10
010203040
I'13 I'14 I'15 I'16 I'17Trade balanceBalance of services and incomeCurrent transfersCurrent account balance
8 Balance of Payments of the Kyrgyz Republic for the first quarter of 2017
CO
NTE
NT
CURRENT STATUS OF THE BALANCE OF PAYMENTS
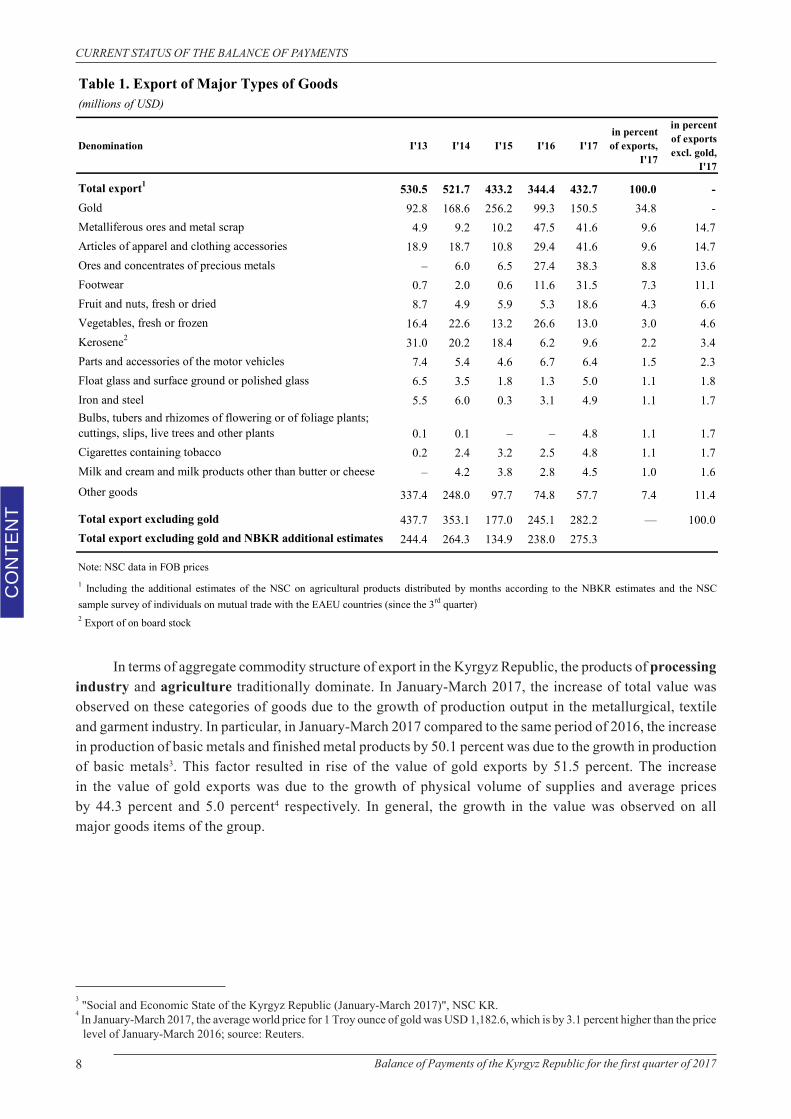
In terms of aggregate commodity structure of export in the Kyrgyz Republic, the products of processingindustry and agriculture traditionally dominate. In January-March 2017, the increase of total value wasobserved on these categories of goods due to the growth of production output in the metallurgical, textileand garment industry. In particular, in January-March 2017 compared to the same period of 2016, the increasein production of basic metals and finished metal products by 50.1 percent was due to the growth in productionof basic metals3. This factor resulted in rise of the value of gold exports by 51.5 percent. The increasein the value of gold exports was due to the growth of physical volume of supplies and average pricesby 44.3 percent and 5.0 percent4 respectively. In general, the growth in the value was observed on allmajor goods items of the group.
3 "Social and Economic State of the Kyrgyz Republic (January-March 2017)", NSC KR.4 In January-March 2017, the average world price for 1 Troy ounce of gold was USD 1,182.6, which is by 3.1 percent higher than the price
level of January-March 2016; source: Reuters.
Table 1. Export of Major Types of Goods(millions of USD)
Denomination I'13 I'14 I'15 I'16 I'17in percentof exports,
I'17
in percentof exportsexcl. gold,
I'17
Total export1 530.5 521.7 433.2 344.4 432.7 100.0 -Gold 92.8 168.6 256.2 99.3 150.5 34.8 -Metalliferous ores and metal scrap 4.9 9.2 10.2 47.5 41.6 9.6 14.7Articles of apparel and clothing accessories 18.9 18.7 10.8 29.4 41.6 9.6 14.7Ores and concentrates of precious metals – 6.0 6.5 27.4 38.3 8.8 13.6Footwear 0.7 2.0 0.6 11.6 31.5 7.3 11.1Fruit and nuts, fresh or dried 8.7 4.9 5.9 5.3 18.6 4.3 6.6Vegetables, fresh or frozen 16.4 22.6 13.2 26.6 13.0 3.0 4.6Kerosene2 31.0 20.2 18.4 6.2 9.6 2.2 3.4Parts and accessories of the motor vehicles 7.4 5.4 4.6 6.7 6.4 1.5 2.3Float glass and surface ground or polished glass 6.5 3.5 1.8 1.3 5.0 1.1 1.8Iron and steel 5.5 6.0 0.3 3.1 4.9 1.1 1.7Bulbs, tubers and rhizomes of flowering or of foliage plants; cuttings, slips, live trees and other plants 0.1 0.1 – – 4.8 1.1 1.7Cigarettes containing tobacco 0.2 2.4 3.2 2.5 4.8 1.1 1.7Milk and cream and milk products other than butter or cheese – 4.2 3.8 2.8 4.5 1.0 1.6Other goods 337.4 248.0 97.7 74.8 57.7 7.4 11.4
Total export excluding gold 437.7 353.1 177.0 245.1 282.2 — 100.0Total export excluding gold and NBKR additional estimates 244.4 264.3 134.9 238.0 275.3
Note: NSC data in FOB prices
2 Export of on board stock
1 Including the additional estimates of the NSC on agricultural products distributed by months according to the NBKR estimates and the NSCsample survey of individuals on mutual trade with the EAEU countries (since the 3rd quarter)
9Balance of Payments of the Kyrgyz Republic for the first quarter of 2017
CO
NTE
NT
CURRENT STATUS OF THE BALANCE OF PAYMENTS
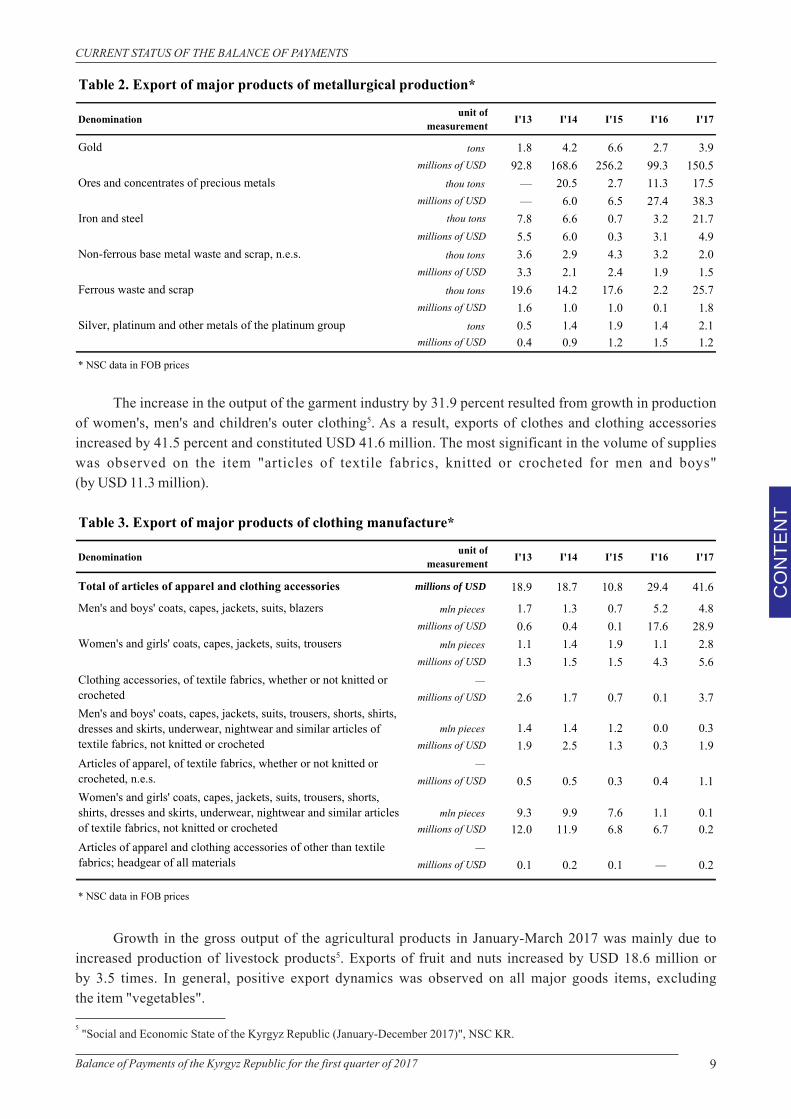
The increase in the output of the garment industry by 31.9 percent resulted from growth in productionof women's, men's and children's outer clothing5. As a result, exports of clothes and clothing accessoriesincreased by 41.5 percent and constituted USD 41.6 million. The most significant in the volume of supplieswas observed on the item "articles of textile fabrics, knitted or crocheted for men and boys"(by USD 11.3 million).
5 "Social and Economic State of the Kyrgyz Republic (January-December 2017)", NSC KR.
Table 2. Export of major products of metallurgical production*
Denomination unit of measurement I'13 I'14 I'15 I'16 I'17
Gold tons 1.8 4.2 6.6 2.7 3.9millions of USD 92.8 168.6 256.2 99.3 150.5
Ores and concentrates of precious metals thou tons — 20.5 2.7 11.3 17.5millions of USD — 6.0 6.5 27.4 38.3
Iron and steel thou tons 7.8 6.6 0.7 3.2 21.7millions of USD 5.5 6.0 0.3 3.1 4.9
Non-ferrous base metal waste and scrap, n.e.s. thou tons 3.6 2.9 4.3 3.2 2.0millions of USD 3.3 2.1 2.4 1.9 1.5
Ferrous waste and scrap thou tons 19.6 14.2 17.6 2.2 25.7millions of USD 1.6 1.0 1.0 0.1 1.8
Silver, platinum and other metals of the platinum group tons 0.5 1.4 1.9 1.4 2.1millions of USD 0.4 0.9 1.2 1.5 1.2
* NSC data in FOB prices
Table 3. Export of major products of clothing manufacture*
Denomination unit of measurement I'13 I'14 I'15 I'16 I'17
Total of articles of apparel and clothing accessories millions of USD 18.9 18.7 10.8 29.4 41.6
Men's and boys' coats, capes, jackets, suits, blazers mln pieces 1.7 1.3 0.7 5.2 4.8millions of USD 0.6 0.4 0.1 17.6 28.9
Women's and girls' coats, capes, jackets, suits, trousers mln pieces 1.1 1.4 1.9 1.1 2.8millions of USD 1.3 1.5 1.5 4.3 5.6
—millions of USD 2.6 1.7 0.7 0.1 3.7
mln pieces 1.4 1.4 1.2 0.0 0.3millions of USD 1.9 2.5 1.3 0.3 1.9
—millions of USD 0.5 0.5 0.3 0.4 1.1
mln pieces 9.3 9.9 7.6 1.1 0.1millions of USD 12.0 11.9 6.8 6.7 0.2
—millions of USD 0.1 0.2 0.1 — 0.2
* NSC data in FOB prices
Articles of apparel and clothing accessories of other than textile fabrics; headgear of all materials
Men's and boys' coats, capes, jackets, suits, trousers, shorts, shirts, dresses and skirts, underwear, nightwear and similar articles of textile fabrics, not knitted or crocheted
Women's and girls' coats, capes, jackets, suits, trousers, shorts, shirts, dresses and skirts, underwear, nightwear and similar articles of textile fabrics, not knitted or crocheted
Clothing accessories, of textile fabrics, whether or not knitted or crocheted
Articles of apparel, of textile fabrics, whether or not knitted or crocheted, n.e.s.
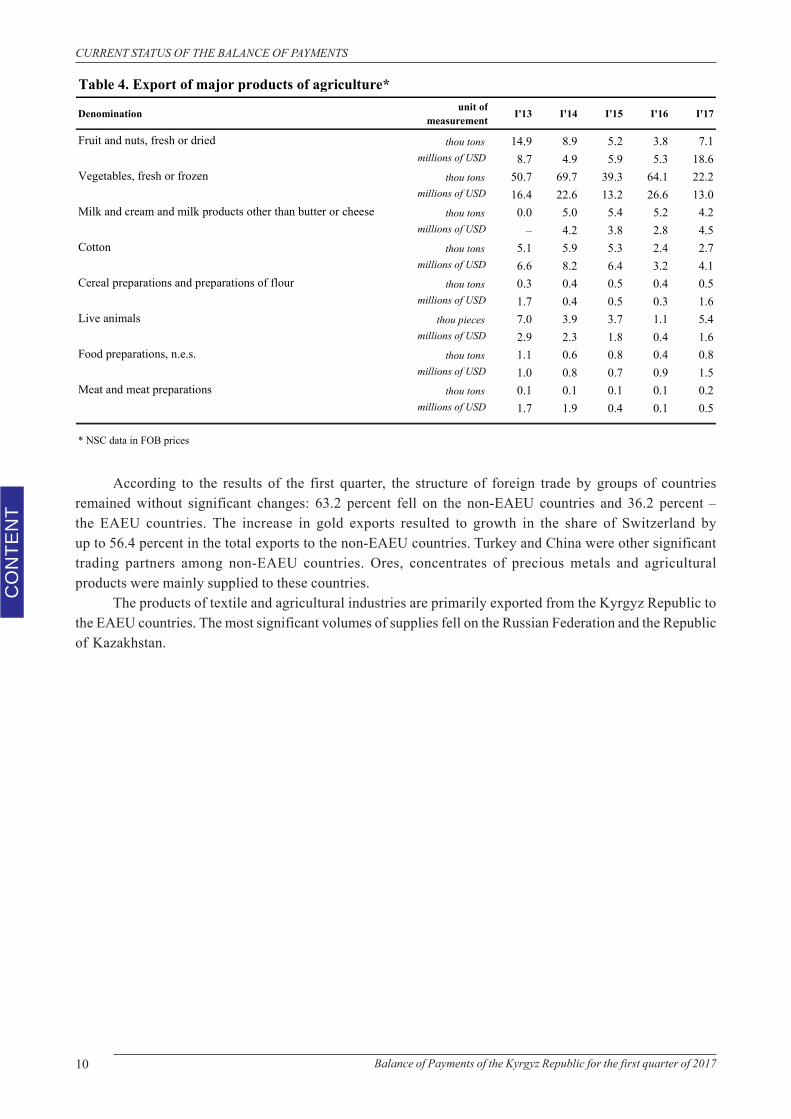
Growth in the gross output of the agricultural products in January-March 2017 was mainly due toincreased production of livestock products5. Exports of fruit and nuts increased by USD 18.6 million orby 3.5 times. In general, positive export dynamics was observed on all major goods items, excludingthe item "vegetables".
10 Balance of Payments of the Kyrgyz Republic for the first quarter of 2017
CO
NTE
NT
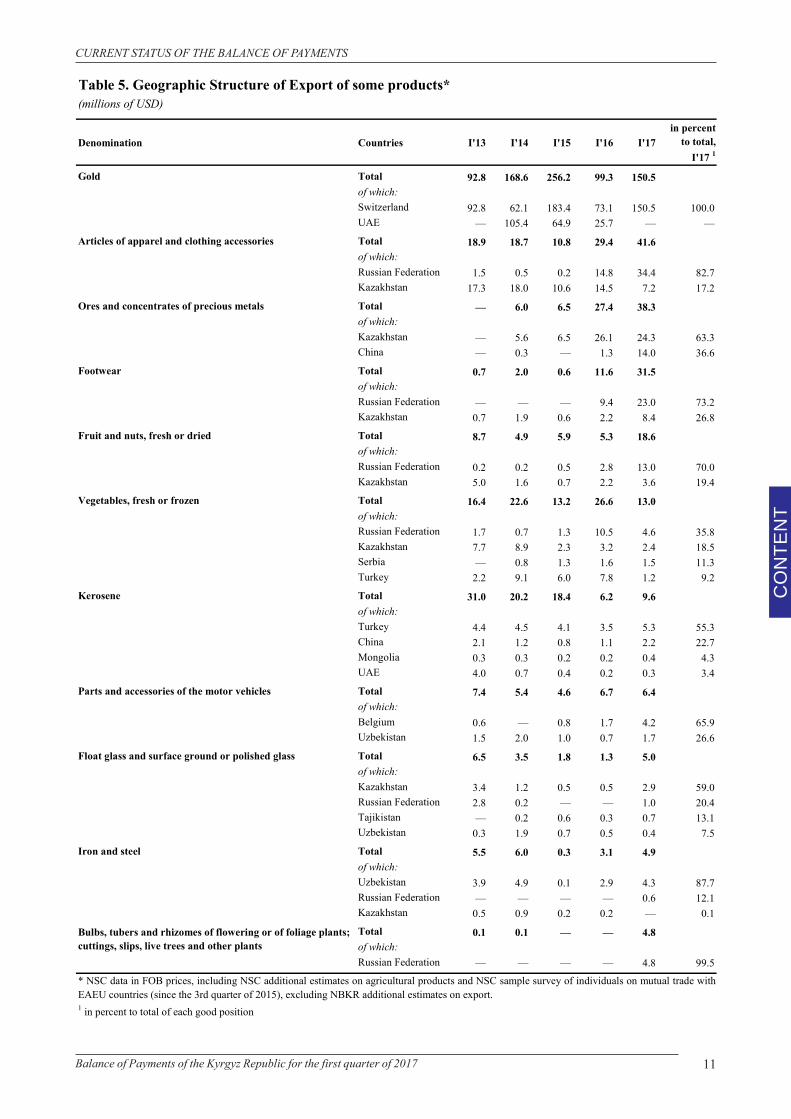
According to the results of the first quarter, the structure of foreign trade by groups of countriesremained without significant changes: 63.2 percent fell on the non-EAEU countries and 36.2 percent –the EAEU countries. The increase in gold exports resulted to growth in the share of Switzerland byup to 56.4 percent in the total exports to the non-EAEU countries. Turkey and China were other significanttrading partners among non-EAEU countries. Ores, concentrates of precious metals and agriculturalproducts were mainly supplied to these countries.
The products of textile and agricultural industries are primarily exported from the Kyrgyz Republic tothe EAEU countries. The most significant volumes of supplies fell on the Russian Federation and the Republicof Kazakhstan.
CURRENT STATUS OF THE BALANCE OF PAYMENTS
Table 4. Export of major products of agriculture*
Denomination unit of measurement I'13 I'14 I'15 I'16 I'17
thou tons 14.9 8.9 5.2 3.8 7.1millions of USD 8.7 4.9 5.9 5.3 18.6
thou tons 50.7 69.7 39.3 64.1 22.2millions of USD 16.4 22.6 13.2 26.6 13.0
thou tons 0.0 5.0 5.4 5.2 4.2millions of USD – 4.2 3.8 2.8 4.5
thou tons 5.1 5.9 5.3 2.4 2.7millions of USD 6.6 8.2 6.4 3.2 4.1
thou tons 0.3 0.4 0.5 0.4 0.5millions of USD 1.7 0.4 0.5 0.3 1.6
thou pieces 7.0 3.9 3.7 1.1 5.4millions of USD 2.9 2.3 1.8 0.4 1.6
thou tons 1.1 0.6 0.8 0.4 0.8millions of USD 1.0 0.8 0.7 0.9 1.5
thou tons 0.1 0.1 0.1 0.1 0.2millions of USD 1.7 1.9 0.4 0.1 0.5
* NSC data in FOB prices
Food preparations, n.e.s.
Meat and meat preparations
Fruit and nuts, fresh or dried
Vegetables, fresh or frozen
Milk and cream and milk products other than butter or cheese
Cotton
Cereal preparations and preparations of flour
Live animals
11Balance of Payments of the Kyrgyz Republic for the first quarter of 2017
CO
NTE
NT
CURRENT STATUS OF THE BALANCE OF PAYMENTS
Table 5. Geographic Structure of Export of some products*(millions of USD)
Denomination Countries I'13 I'14 I'15 I'16 I'17in percent
to total, I'17 1
Gold Total 92.8 168.6 256.2 99.3 150.5of which:Switzerland 92.8 62.1 183.4 73.1 150.5 100.0UAE — 105.4 64.9 25.7 — —
Articles of apparel and clothing accessories Total 18.9 18.7 10.8 29.4 41.6of which:Russian Federation 1.5 0.5 0.2 14.8 34.4 82.7Kazakhstan 17.3 18.0 10.6 14.5 7.2 17.2
Ores and concentrates of precious metals Total — 6.0 6.5 27.4 38.3of which:Kazakhstan — 5.6 6.5 26.1 24.3 63.3China — 0.3 — 1.3 14.0 36.6
Footwear Total 0.7 2.0 0.6 11.6 31.5of which:Russian Federation — — — 9.4 23.0 73.2Kazakhstan 0.7 1.9 0.6 2.2 8.4 26.8
Fruit and nuts, fresh or dried Total 8.7 4.9 5.9 5.3 18.6of which:Russian Federation 0.2 0.2 0.5 2.8 13.0 70.0Kazakhstan 5.0 1.6 0.7 2.2 3.6 19.4
Vegetables, fresh or frozen Total 16.4 22.6 13.2 26.6 13.0of which:Russian Federation 1.7 0.7 1.3 10.5 4.6 35.8Kazakhstan 7.7 8.9 2.3 3.2 2.4 18.5Serbia — 0.8 1.3 1.6 1.5 11.3Turkey 2.2 9.1 6.0 7.8 1.2 9.2
Kerosene Total 31.0 20.2 18.4 6.2 9.6of which:Turkey 4.4 4.5 4.1 3.5 5.3 55.3China 2.1 1.2 0.8 1.1 2.2 22.7Mongolia 0.3 0.3 0.2 0.2 0.4 4.3UAE 4.0 0.7 0.4 0.2 0.3 3.4
Parts and accessories of the motor vehicles Total 7.4 5.4 4.6 6.7 6.4of which:Belgium 0.6 — 0.8 1.7 4.2 65.9Uzbekistan 1.5 2.0 1.0 0.7 1.7 26.6
Float glass and surface ground or polished glass Total 6.5 3.5 1.8 1.3 5.0of which:Kazakhstan 3.4 1.2 0.5 0.5 2.9 59.0Russian Federation 2.8 0.2 — — 1.0 20.4Tajikistan — 0.2 0.6 0.3 0.7 13.1Uzbekistan 0.3 1.9 0.7 0.5 0.4 7.5
Iron and steel Total 5.5 6.0 0.3 3.1 4.9of which:Uzbekistan 3.9 4.9 0.1 2.9 4.3 87.7Russian Federation — — — — 0.6 12.1Kazakhstan 0.5 0.9 0.2 0.2 — 0.1Total 0.1 0.1 — — 4.8of which:Russian Federation — — — — 4.8 99.5
1 in percent to total of each good position
Bulbs, tubers and rhizomes of flowering or of foliage plants; cuttings, slips, live trees and other plants
* NSC data in FOB prices, including NSC additional estimates on agricultural products and NSC sample survey of individuals on mutual trade withEAEU countries (since the 3rd quarter of 2015), excluding NBKR additional estimates on export.
12 Balance of Payments of the Kyrgyz Republic for the first quarter of 2017
CO
NTE
NT
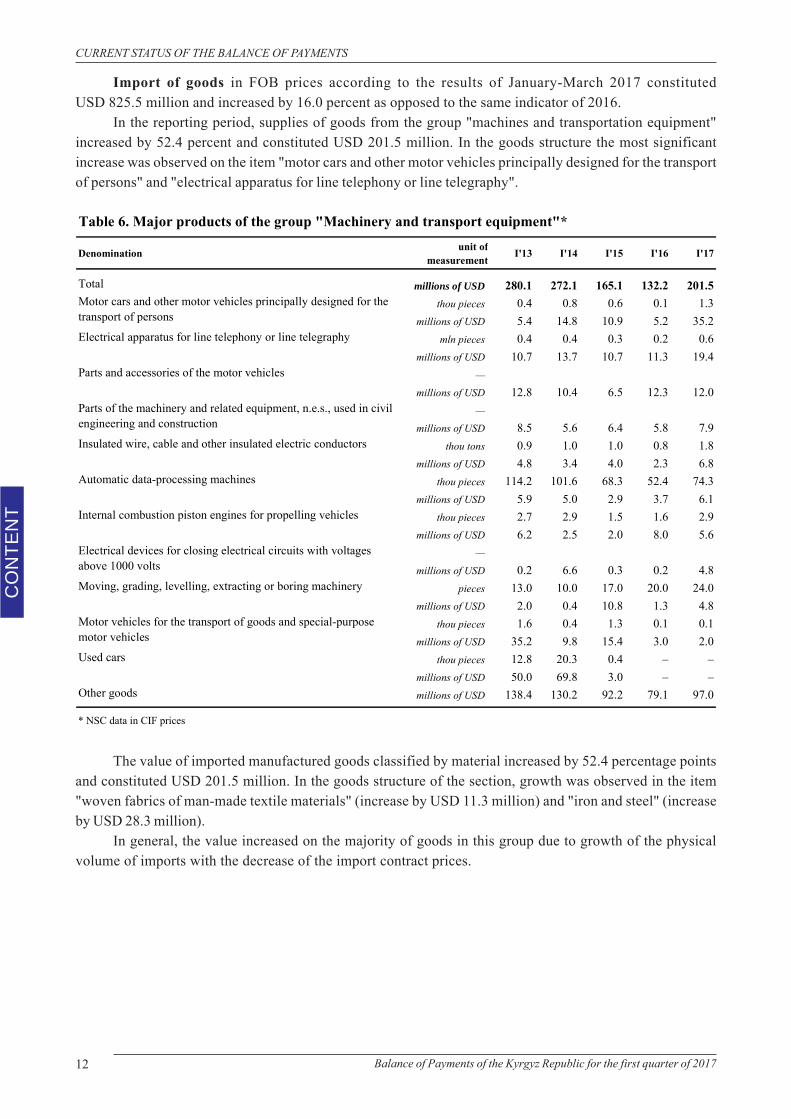
Import of goods in FOB prices according to the results of January-March 2017 constitutedUSD 825.5 million and increased by 16.0 percent as opposed to the same indicator of 2016.
In the reporting period, supplies of goods from the group "machines and transportation equipment"increased by 52.4 percent and constituted USD 201.5 million. In the goods structure the most significantincrease was observed on the item "motor cars and other motor vehicles principally designed for the transportof persons" and "electrical apparatus for line telephony or line telegraphy".
The value of imported manufactured goods classified by material increased by 52.4 percentage pointsand constituted USD 201.5 million. In the goods structure of the section, growth was observed in the item"woven fabrics of man-made textile materials" (increase by USD 11.3 million) and "iron and steel" (increaseby USD 28.3 million).
In general, the value increased on the majority of goods in this group due to growth of the physicalvolume of imports with the decrease of the import contract prices.
CURRENT STATUS OF THE BALANCE OF PAYMENTS
Table 6. Major products of the group "Machinery and transport equipment"*
Denomination unit of measurement I'13 I'14 I'15 I'16 I'17
Total millions of USD 280.1 272.1 165.1 132.2 201.5thou pieces 0.4 0.8 0.6 0.1 1.3
millions of USD 5.4 14.8 10.9 5.2 35.2Electrical apparatus for line telephony or line telegraphy mln pieces 0.4 0.4 0.3 0.2 0.6
millions of USD 10.7 13.7 10.7 11.3 19.4Parts and accessories of the motor vehicles —
millions of USD 12.8 10.4 6.5 12.3 12.0—
millions of USD 8.5 5.6 6.4 5.8 7.9Insulated wire, cable and other insulated electric conductors thou tons 0.9 1.0 1.0 0.8 1.8
millions of USD 4.8 3.4 4.0 2.3 6.8Automatic data-processing machines thou pieces 114.2 101.6 68.3 52.4 74.3
millions of USD 5.9 5.0 2.9 3.7 6.1Internal combustion piston engines for propelling vehicles thou pieces 2.7 2.9 1.5 1.6 2.9
millions of USD 6.2 2.5 2.0 8.0 5.6—
millions of USD 0.2 6.6 0.3 0.2 4.8Moving, grading, levelling, extracting or boring machinery pieces 13.0 10.0 17.0 20.0 24.0
millions of USD 2.0 0.4 10.8 1.3 4.8thou pieces 1.6 0.4 1.3 0.1 0.1
millions of USD 35.2 9.8 15.4 3.0 2.0Used cars thou pieces 12.8 20.3 0.4 – –
millions of USD 50.0 69.8 3.0 – –Other goods millions of USD 138.4 130.2 92.2 79.1 97.0
* NSC data in CIF prices
Parts of the machinery and related equipment, n.e.s., used in civil engineering and construction
Motor vehicles for the transport of goods and special-purpose motor vehicles
Electrical devices for closing electrical circuits with voltages above 1000 volts
Motor cars and other motor vehicles principally designed for the transport of persons
13Balance of Payments of the Kyrgyz Republic for the first quarter of 2017
CO
NTE
NT
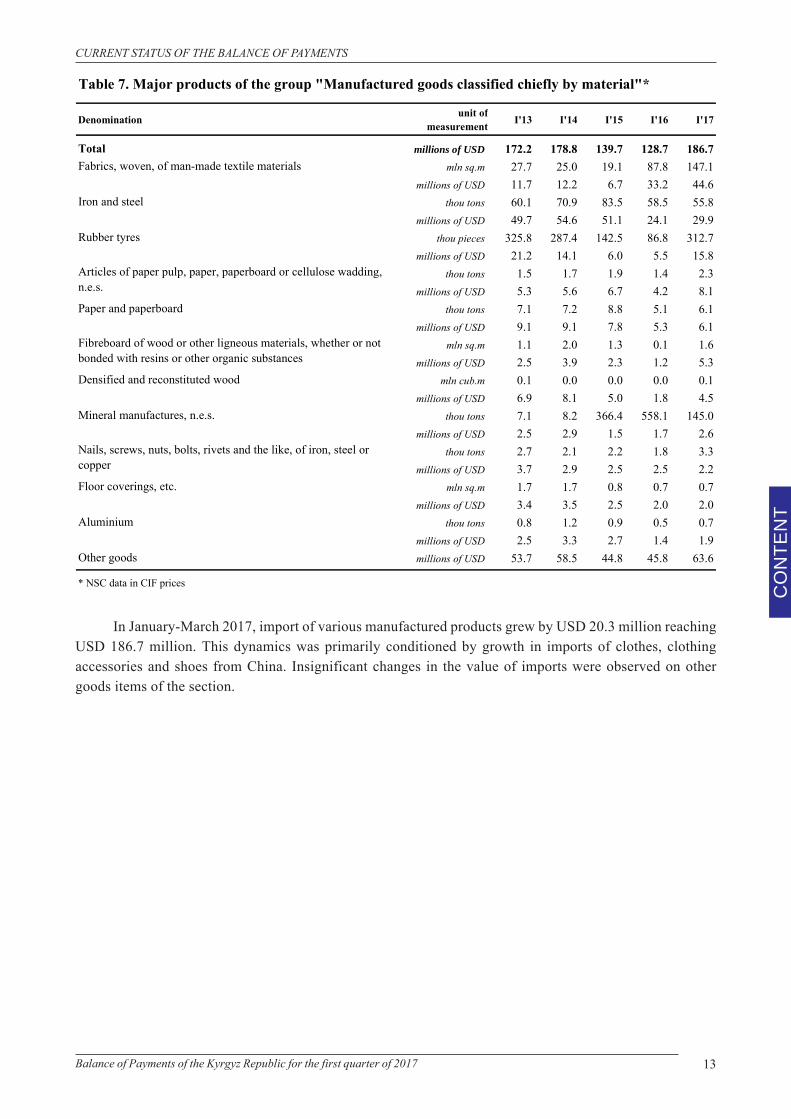
In January-March 2017, import of various manufactured products grew by USD 20.3 million reachingUSD 186.7 million. This dynamics was primarily conditioned by growth in imports of clothes, clothingaccessories and shoes from China. Insignificant changes in the value of imports were observed on othergoods items of the section.
CURRENT STATUS OF THE BALANCE OF PAYMENTS
Table 7. Major products of the group "Manufactured goods classified chiefly by material"*
Denomination unit of measurement I'13 I'14 I'15 I'16 I'17
Total millions of USD 172.2 178.8 139.7 128.7 186.7Fabrics, woven, of man-made textile materials mln sq.m 27.7 25.0 19.1 87.8 147.1
millions of USD 11.7 12.2 6.7 33.2 44.6Iron and steel thou tons 60.1 70.9 83.5 58.5 55.8
millions of USD 49.7 54.6 51.1 24.1 29.9Rubber tyres thou pieces 325.8 287.4 142.5 86.8 312.7
millions of USD 21.2 14.1 6.0 5.5 15.8thou tons 1.5 1.7 1.9 1.4 2.3
millions of USD 5.3 5.6 6.7 4.2 8.1Paper and paperboard thou tons 7.1 7.2 8.8 5.1 6.1
millions of USD 9.1 9.1 7.8 5.3 6.1mln sq.m 1.1 2.0 1.3 0.1 1.6
millions of USD 2.5 3.9 2.3 1.2 5.3Densified and reconstituted wood mln cub.m 0.1 0.0 0.0 0.0 0.1
millions of USD 6.9 8.1 5.0 1.8 4.5Mineral manufactures, n.e.s. thou tons 7.1 8.2 366.4 558.1 145.0
millions of USD 2.5 2.9 1.5 1.7 2.6thou tons 2.7 2.1 2.2 1.8 3.3
millions of USD 3.7 2.9 2.5 2.5 2.2Floor coverings, etc. mln sq.m 1.7 1.7 0.8 0.7 0.7
millions of USD 3.4 3.5 2.5 2.0 2.0Aluminium thou tons 0.8 1.2 0.9 0.5 0.7
millions of USD 2.5 3.3 2.7 1.4 1.9Other goods millions of USD 53.7 58.5 44.8 45.8 63.6
* NSC data in CIF prices
Articles of paper pulp, paper, paperboard or cellulose wadding, n.e.s.
Nails, screws, nuts, bolts, rivets and the like, of iron, steel or copper
Fibreboard of wood or other ligneous materials, whether or not bonded with resins or other organic substances
14 Balance of Payments of the Kyrgyz Republic for the first quarter of 2017
CO
NTE
NT In January-March 2017, in the goods structure of import insignificant decline of supplies was observed
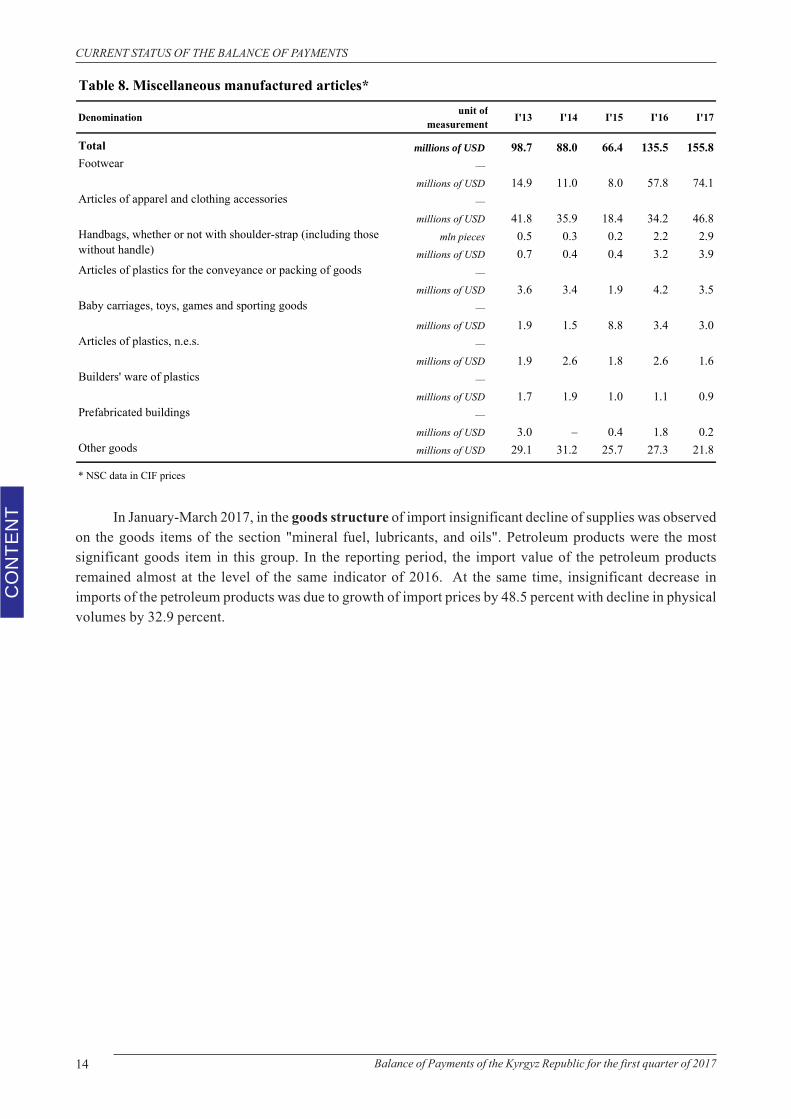
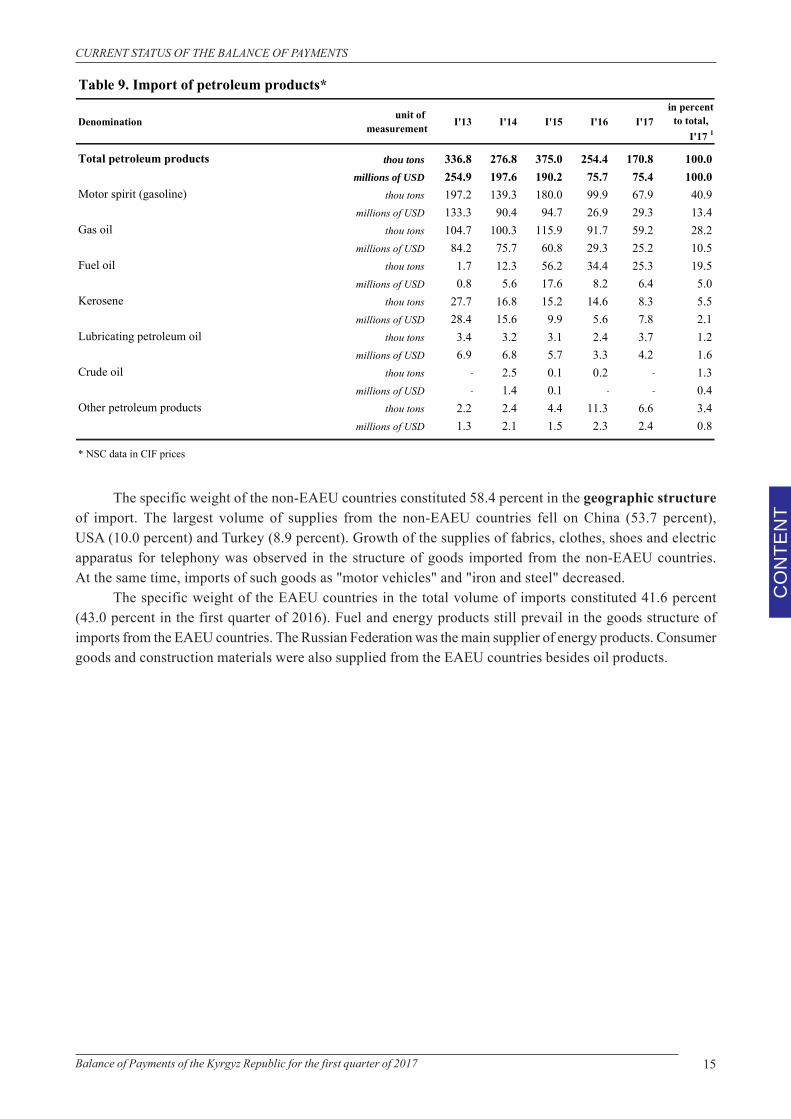
on the goods items of the section "mineral fuel, lubricants, and oils". Petroleum products were the mostsignificant goods item in this group. In the reporting period, the import value of the petroleum productsremained almost at the level of the same indicator of 2016. At the same time, insignificant decrease inimports of the petroleum products was due to growth of import prices by 48.5 percent with decline in physicalvolumes by 32.9 percent.
CURRENT STATUS OF THE BALANCE OF PAYMENTS
Table 8. Miscellaneous manufactured articles*
Denomination unit of measurement I'13 I'14 I'15 I'16 I'17
Total millions of USD 98.7 88.0 66.4 135.5 155.8Footwear —
millions of USD 14.9 11.0 8.0 57.8 74.1Articles of apparel and clothing accessories —
millions of USD 41.8 35.9 18.4 34.2 46.8mln pieces 0.5 0.3 0.2 2.2 2.9
millions of USD 0.7 0.4 0.4 3.2 3.9Articles of plastics for the conveyance or packing of goods —
millions of USD 3.6 3.4 1.9 4.2 3.5Baby carriages, toys, games and sporting goods —
millions of USD 1.9 1.5 8.8 3.4 3.0Articles of plastics, n.e.s. —
millions of USD 1.9 2.6 1.8 2.6 1.6Builders' ware of plastics —
millions of USD 1.7 1.9 1.0 1.1 0.9Prefabricated buildings —
millions of USD 3.0 – 0.4 1.8 0.2Other goods millions of USD 29.1 31.2 25.7 27.3 21.8
* NSC data in CIF prices
Handbags, whether or not with shoulder-strap (including those without handle)
15Balance of Payments of the Kyrgyz Republic for the first quarter of 2017
CO
NTE
NT
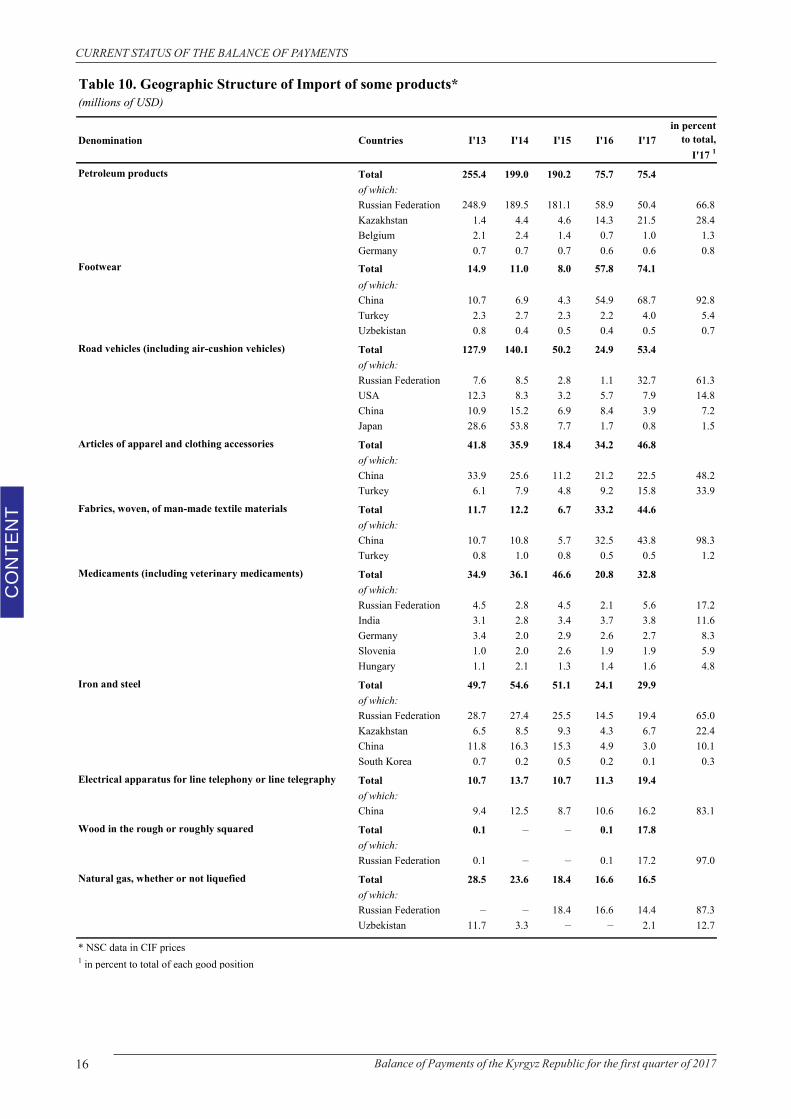
The specific weight of the non-EAEU countries constituted 58.4 percent in the geographic structureof import. The largest volume of supplies from the non-EAEU countries fell on China (53.7 percent),USA (10.0 percent) and Turkey (8.9 percent). Growth of the supplies of fabrics, clothes, shoes and electricapparatus for telephony was observed in the structure of goods imported from the non-EAEU countries.At the same time, imports of such goods as "motor vehicles" and "iron and steel" decreased.
The specific weight of the EAEU countries in the total volume of imports constituted 41.6 percent(43.0 percent in the first quarter of 2016). Fuel and energy products still prevail in the goods structure ofimports from the EAEU countries. The Russian Federation was the main supplier of energy products. Consumergoods and construction materials were also supplied from the EAEU countries besides oil products.
CURRENT STATUS OF THE BALANCE OF PAYMENTS
Table 9. Import of petroleum products*
Denomination unit of measurement I'13 I'14 I'15 I'16 I'17
in percentto total,
I'17 1
Total petroleum products thou tons 336.8 276.8 375.0 254.4 170.8 100.0millions of USD 254.9 197.6 190.2 75.7 75.4 100.0
Motor spirit (gasoline) thou tons 197.2 139.3 180.0 99.9 67.9 40.9millions of USD 133.3 90.4 94.7 26.9 29.3 13.4
Gas oil thou tons 104.7 100.3 115.9 91.7 59.2 28.2millions of USD 84.2 75.7 60.8 29.3 25.2 10.5
Fuel oil thou tons 1.7 12.3 56.2 34.4 25.3 19.5millions of USD 0.8 5.6 17.6 8.2 6.4 5.0
Kerosene thou tons 27.7 16.8 15.2 14.6 8.3 5.5millions of USD 28.4 15.6 9.9 5.6 7.8 2.1
Lubricating petroleum oil thou tons 3.4 3.2 3.1 2.4 3.7 1.2millions of USD 6.9 6.8 5.7 3.3 4.2 1.6
Crude oil thou tons – 2.5 0.1 0.2 – 1.3millions of USD – 1.4 0.1 – – 0.4
Other petroleum products thou tons 2.2 2.4 4.4 11.3 6.6 3.4millions of USD 1.3 2.1 1.5 2.3 2.4 0.8
* NSC data in CIF prices
16 Balance of Payments of the Kyrgyz Republic for the first quarter of 2017
CO
NTE
NT
CURRENT STATUS OF THE BALANCE OF PAYMENTS
Table 10. Geographic Structure of Import of some products*(millions of USD)
Denomination Countries I'13 I'14 I'15 I'16 I'17in percent
to total, I'17 1
Petroleum products Total 255.4 199.0 190.2 75.7 75.4of which:Russian Federation 248.9 189.5 181.1 58.9 50.4 66.8Kazakhstan 1.4 4.4 4.6 14.3 21.5 28.4Belgium 2.1 2.4 1.4 0.7 1.0 1.3Germany 0.7 0.7 0.7 0.6 0.6 0.8
Footwear Total 14.9 11.0 8.0 57.8 74.1of which:China 10.7 6.9 4.3 54.9 68.7 92.8Turkey 2.3 2.7 2.3 2.2 4.0 5.4Uzbekistan 0.8 0.4 0.5 0.4 0.5 0.7
Road vehicles (including air-cushion vehicles) Total 127.9 140.1 50.2 24.9 53.4of which:Russian Federation 7.6 8.5 2.8 1.1 32.7 61.3USA 12.3 8.3 3.2 5.7 7.9 14.8China 10.9 15.2 6.9 8.4 3.9 7.2Japan 28.6 53.8 7.7 1.7 0.8 1.5
Articles of apparel and clothing accessories Total 41.8 35.9 18.4 34.2 46.8of which:China 33.9 25.6 11.2 21.2 22.5 48.2Turkey 6.1 7.9 4.8 9.2 15.8 33.9
Fabrics, woven, of man-made textile materials Total 11.7 12.2 6.7 33.2 44.6of which:China 10.7 10.8 5.7 32.5 43.8 98.3Turkey 0.8 1.0 0.8 0.5 0.5 1.2
Medicaments (including veterinary medicaments) Total 34.9 36.1 46.6 20.8 32.8of which:Russian Federation 4.5 2.8 4.5 2.1 5.6 17.2India 3.1 2.8 3.4 3.7 3.8 11.6Germany 3.4 2.0 2.9 2.6 2.7 8.3Slovenia 1.0 2.0 2.6 1.9 1.9 5.9Hungary 1.1 2.1 1.3 1.4 1.6 4.8
Iron and steel Total 49.7 54.6 51.1 24.1 29.9of which:Russian Federation 28.7 27.4 25.5 14.5 19.4 65.0Kazakhstan 6.5 8.5 9.3 4.3 6.7 22.4China 11.8 16.3 15.3 4.9 3.0 10.1South Korea 0.7 0.2 0.5 0.2 0.1 0.3
Electrical apparatus for line telephony or line telegraphy Total 10.7 13.7 10.7 11.3 19.4of which:China 9.4 12.5 8.7 10.6 16.2 83.1
Wood in the rough or roughly squared Total 0.1 – – 0.1 17.8of which:Russian Federation 0.1 – – 0.1 17.2 97.0
Natural gas, whether or not liquefied Total 28.5 23.6 18.4 16.6 16.5of which:Russian Federation – – 18.4 16.6 14.4 87.3Uzbekistan 11.7 3.3 – – 2.1 12.7
* NSC data in CIF prices1 in percent to total of each good position
17Balance of Payments of the Kyrgyz Republic for the first quarter of 2017
CO
NTE
NT
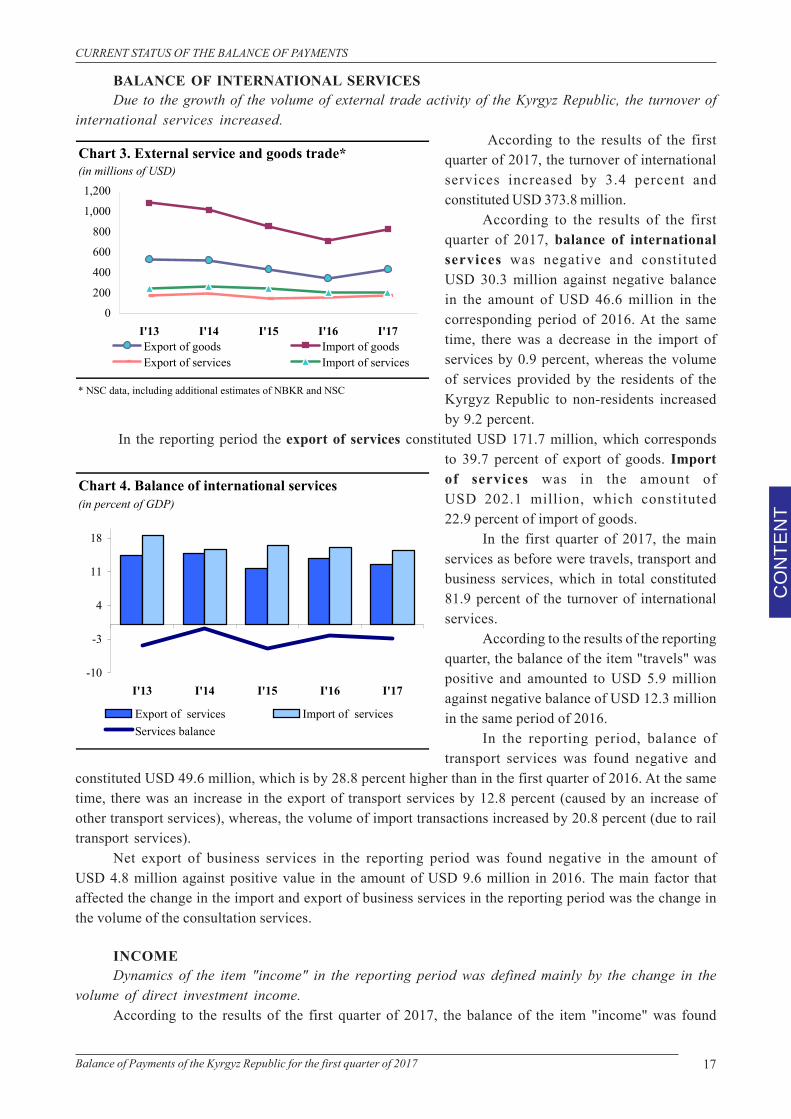
BALANCE OF INTERNATIONAL SERVICESDue to the growth of the volume of external trade activity of the Kyrgyz Republic, the turnover of
international services increased. According to the results of the first
quarter of 2017, the turnover of internationalservices increased by 3.4 percent andconstituted USD 373.8 million.
According to the results of the firstquarter of 2017, balance of internationalservices was negative and constitutedUSD 30.3 million against negative balancein the amount of USD 46.6 million in thecorresponding period of 2016. At the sametime, there was a decrease in the import ofservices by 0.9 percent, whereas the volumeof services provided by the residents of theKyrgyz Republic to non-residents increasedby 9.2 percent.
In the reporting period the export of services constituted USD 171.7 million, which correspondsto 39.7 percent of export of goods. Importof services was in the amount ofUSD 202.1 million, which constituted22.9 percent of import of goods.
In the first quarter of 2017, the mainservices as before were travels, transport andbusiness services, which in total constituted81.9 percent of the turnover of internationalservices.
According to the results of the reportingquarter, the balance of the item "travels" waspositive and amounted to USD 5.9 millionagainst negative balance of USD 12.3 millionin the same period of 2016.
In the reporting period, balance oftransport services was found negative and
constituted USD 49.6 million, which is by 28.8 percent higher than in the first quarter of 2016. At the sametime, there was an increase in the export of transport services by 12.8 percent (caused by an increase ofother transport services), whereas, the volume of import transactions increased by 20.8 percent (due to railtransport services).
Net export of business services in the reporting period was found negative in the amount ofUSD 4.8 million against positive value in the amount of USD 9.6 million in 2016. The main factor thataffected the change in the import and export of business services in the reporting period was the change inthe volume of the consultation services.
INCOMEDynamics of the item "income" in the reporting period was defined mainly by the change in the
volume of direct investment income.According to the results of the first quarter of 2017, the balance of the item "income" was found
CURRENT STATUS OF THE BALANCE OF PAYMENTS
Chart 3. External service and goods trade*(in millions of USD)
* NSC data, including additional estimates of NBKR and NSC
0
200
400
600
800
1,000
1,200
I'13 I'14 I'15 I'16 I'17Export of goods Import of goodsExport of services Import of services
Chart 4. Balance of international services(in percent of GDP)
-10
-3
4
11
18
I'13 I'14 I'15 I'16 I'17
Export of services Import of services Services balance
18 Balance of Payments of the Kyrgyz Republic for the first quarter of 2017
CO
NTE
NT
negative in the amount of USD 56.3 million, which is by 22.6 percent lower than the similar indicatorof 2016. This tendency is mainly a result of reduction in the volume of distributed income of the resident-entities in the form of dividends in favor of foreign direct investors from USD 34.2 to USD 1.7 million.Volume of re-invested income increased and constituted USD 40.9 million.
In the reporting period, the volume of interest payments on the previously received loans decreasedinsignificantly and amounted to USD 16.2 million. The volume of other incomes received by the residents ofthe country on other investments in the first quarter of 2017 increased and constituted USD 6.8 million. As aresult, deficit of the item "incomes on other investments" decreased by 56.8 percent (to USD 9.3 million).
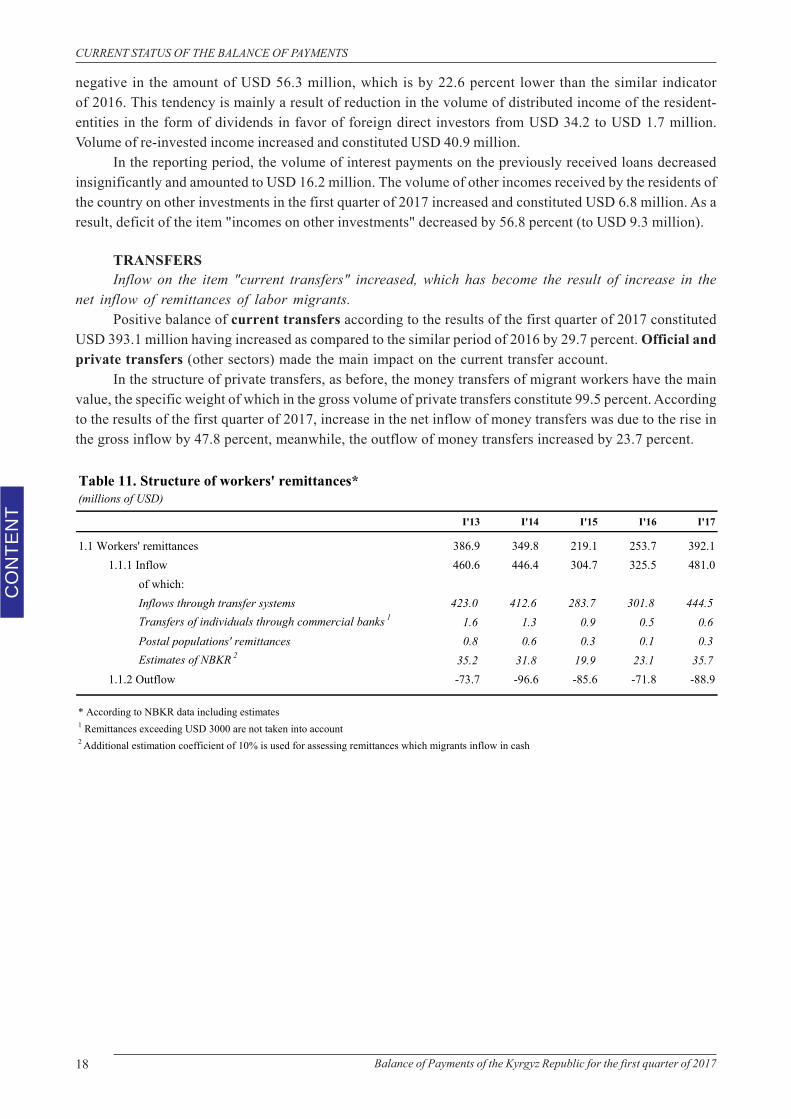
TRANSFERSInflow on the item "current transfers" increased, which has become the result of increase in the
net inflow of remittances of labor migrants.Positive balance of current transfers according to the results of the first quarter of 2017 constituted
USD 393.1 million having increased as compared to the similar period of 2016 by 29.7 percent. Official andprivate transfers (other sectors) made the main impact on the current transfer account.
In the structure of private transfers, as before, the money transfers of migrant workers have the mainvalue, the specific weight of which in the gross volume of private transfers constitute 99.5 percent. Accordingto the results of the first quarter of 2017, increase in the net inflow of money transfers was due to the rise inthe gross inflow by 47.8 percent, meanwhile, the outflow of money transfers increased by 23.7 percent.
CURRENT STATUS OF THE BALANCE OF PAYMENTS
Table 11. Structure of workers' remittances*(millions of USD)
I'13 I'14 I'15 I'16 I'17
1.1 Workers' remittances 386.9 349.8 219.1 253.7 392.11.1.1 Inflow 460.6 446.4 304.7 325.5 481.0
of which:Inflows through transfer systems 423.0 412.6 283.7 301.8 444.5Transfers of individuals through commercial banks 1 1.6 1.3 0.9 0.5 0.6Postal populations' remittances 0.8 0.6 0.3 0.1 0.3Estimates of NBKR 2 35.2 31.8 19.9 23.1 35.7
1.1.2 Outflow -73.7 -96.6 -85.6 -71.8 -88.9
* According to NBKR data including estimates1 Remittances exceeding USD 3000 are not taken into account2 Additional estimation coefficient of 10% is used for assessing remittances which migrants inflow in cash
19Balance of Payments of the Kyrgyz Republic for the first quarter of 2017
CO
NTE
NT
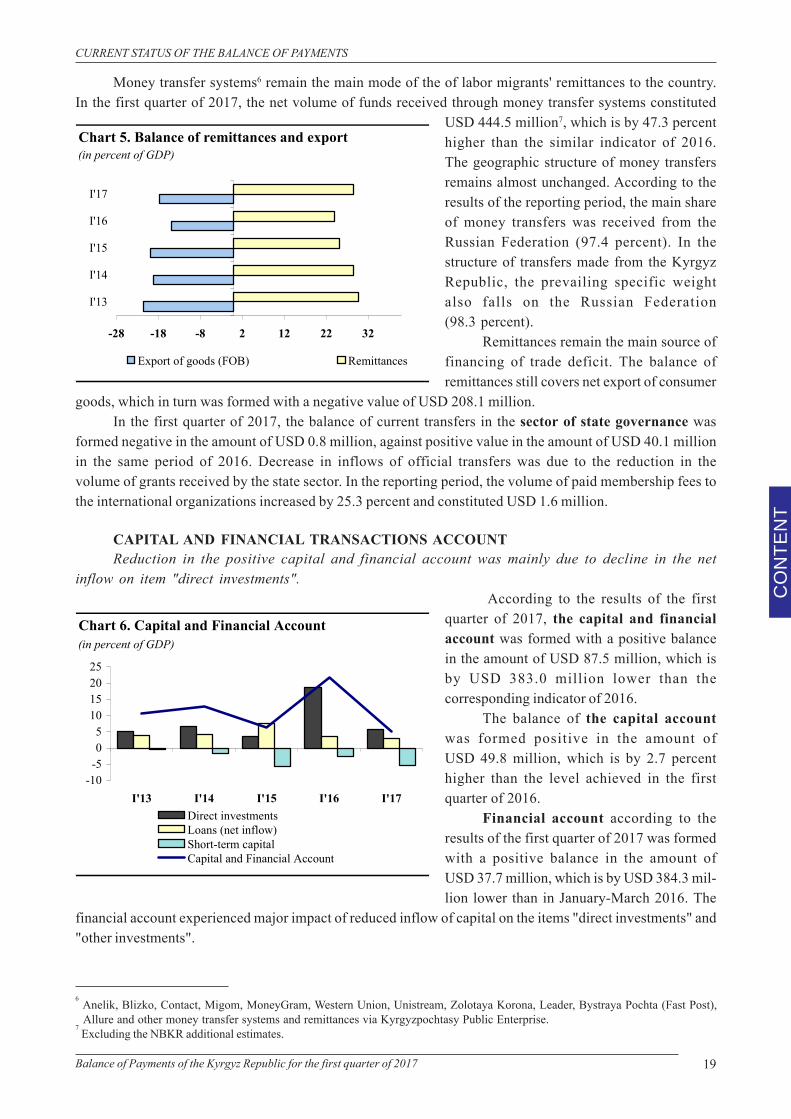
Money transfer systems6 remain the main mode of the of labor migrants' remittances to the country.In the first quarter of 2017, the net volume of funds received through money transfer systems constituted
USD 444.5 million7, which is by 47.3 percenthigher than the similar indicator of 2016.The geographic structure of money transfersremains almost unchanged. According to theresults of the reporting period, the main shareof money transfers was received from theRussian Federation (97.4 percent). In thestructure of transfers made from the KyrgyzRepublic, the prevailing specific weightalso falls on the Russian Federation(98.3 percent).
Remittances remain the main source offinancing of trade deficit. The balance ofremittances still covers net export of consumer
goods, which in turn was formed with a negative value of USD 208.1 million.In the first quarter of 2017, the balance of current transfers in the sector of state governance was
formed negative in the amount of USD 0.8 million, against positive value in the amount of USD 40.1 millionin the same period of 2016. Decrease in inflows of official transfers was due to the reduction in thevolume of grants received by the state sector. In the reporting period, the volume of paid membership fees tothe international organizations increased by 25.3 percent and constituted USD 1.6 million.
CAPITAL AND FINANCIAL TRANSACTIONS ACCOUNTReduction in the positive capital and financial account was mainly due to decline in the net
inflow on item "direct investments". According to the results of the first
quarter of 2017, the capital and financialaccount was formed with a positive balancein the amount of USD 87.5 million, which isby USD 383.0 million lower than thecorresponding indicator of 2016.
The balance of the capital accountwas formed positive in the amount ofUSD 49.8 million, which is by 2.7 percenthigher than the level achieved in the firstquarter of 2016.
Financial account according to theresults of the first quarter of 2017 was formedwith a positive balance in the amount ofUSD 37.7 million, which is by USD 384.3 mil-lion lower than in January-March 2016. The
financial account experienced major impact of reduced inflow of capital on the items "direct investments" and"other investments".
6 Ànelik, Blizko, Contact, Migom, MoneyGram, Western Union, Unistream, Zolotaya Korona, Leader, Bystraya Pochta (Fast Post),Allure and other money transfer systems and remittances via Kyrgyzpochtasy Public Enterprise.
7 Excluding the NBKR additional estimates.
CURRENT STATUS OF THE BALANCE OF PAYMENTS
Chart 5. Balance of remittances and export(in percent of GDP)
-28 -18 -8 2 12 22 32
I'13
I'14
I'15
I'16
I'17
Export of goods (FOB) Remittances
Chart 6. Capital and Financial Account(in percent of GDP)
-10-505
10152025
I'13 I'14 I'15 I'16 I'17Direct investmentsLoans (net inflow)Short-term capitalCapital and Financial Account
20 Balance of Payments of the Kyrgyz Republic for the first quarter of 2017
CO
NTE
NT
Balance of the item "direct investments" was formed negative and constituted USD 48.5 million8 inthe reporting period as opposed to positive value in the amount of USD 134.8 million according to the resultsof three months of 2016.
According to the results of the first quarter of 2017, the net volume of funds attracted to the country onthe item "other investments" was USD 90.6 million. Positive balance of this item was formed under theinfluence of a decrease in the residents' foreign assets and an increase in the liabilities to the non-residents.
In January-March 2017, the assets of the residents decreased by USD 20.4 million. The most significantdecrease was observed in the assets of the residents deposited on their accounts in the foreign banks(by USD 29.2 million). At the same time, the volume of accounts receivable increased by USD 8.8 million.As of the end of March 2017, in total, more than 75.0 percent of the gross volume of accounts receivable fellon the entities of the enterprises that provide supply of electricity and gas, processing industry, as well as theorganizations that deal with the professional, scientific and technical activity. In the reporting period, theincrease in the residents' assets deposited on their accounts in the foreign banks made USD 9.4 million.
The liabilities to the non-residents increased mainly due to the growth of gross inflow of loans to thestate sector by USD 37.9 million. At the same time, the decrease was observed in the volume of privatesector payments for previously received loans, meanwhile, the volume of payments for servicing the loans ofthe state sector remained at the level of the same period of 2016. As a result, the net inflow of loans in thereporting period was positive in the amount of USD 42.4 million.
In the reporting period, the volume of accounts payable of resident entities increased byUSD 35.0 million against negative value in the amount of USD 16.3 million in January-March 2016.In general, the prevailing specific weight in the total volume of accounts payable fell on the enterprises ofmining industry, the organizations that deal with wholesale and retail trade, the enterprises of processing,information and communications sector. These sectors constitute 80 percent of total loan debts.
According to the results of the first quarter of 2017, the overall net balance of payments wasformed negative in the amount of USD 28.0 million.
The balance of the item "Errors and omissions", taking into account the additional estimates of theNational Bank of the Kyrgyz Republic, was formed negative in the amount of USD 29.1 million. The volumeof the international reserve assets9 as of March 31, 2017 constituted USD 1,774.7 million, which covered3.9 months10 of the future import of goods and services.
8 Including the NBKR estimates9 In accordance with the IMF methodology, the international reserve assets comprise the assets only in convertible currencies.10 For reference: the volume of gross international reserves covers 4.5 months of future imports of goods and services.
CURRENT STATUS OF THE BALANCE OF PAYMENTS
21Balance of Payments of the Kyrgyz Republic for the first quarter of 2017
CO
NTE
NT
Table of the Balance of Payments of the Kyrgyz Republic according to the 6th Edition of theBalance of Payments and International Investment Position Manual
Currently, the balance of payments statistics is compiled by the National Bank of the Kyrgyz Republicin accordance with the requirements of the International Monetary Fund’s Balance of Payments Manual,the fifth edition (IMF, 1993). However, in order to meet the new international standards, the NationalBank takes measures on compiling the external sector statistics based on the IMF’s new methods – theBalance of Payments Manual, the sixth edition (hereinafter referred to as the BPM 6).
This box provides the users with a preliminary version of the analytical form of the balance ofpayments of the Kyrgyz Republic compiled on the basis of BPM 6 methodology.
Given that the BPM 6 maintains succession with the methodology of the fifth edition, the balance ofpayments statistics, which are based on the methods of the fifth edition, generally, remain comparablewith the data compiled based on the new methods. At the same time, the meaning of the balance ofpayments accounts changed as some items of the balance of payments were regrouped in accordancewith the BPM 6.
The presentation form of the balance of payments statistics, formerly based on the credit (plus) anddebit (minus) entries was changed in the provisional version of the balance of payments. Credit and debitoperations are registered with a sign "+" in the current account and the capital account. Meanwhile, thebalance of the corresponding items (goods, services, primary income, and secondary income) is definedas a difference between the credit and debit.
The notions "net acquisition of financial assets" and "net incurrence of liabilities" are used instead of"assets" and "liabilities" in the financial account. Net acquisition of assets is equal to the increase in assetsafter deduction of the decrease in assets. Net incurrence of liabilities is equal to the increase of liabilitiesafter deduction of the decrease in the liabilities. Change with a sign "+" indicates the increase in the assetsor liabilities, and change with a sign "-" indicates the decrease in the assets or liabilities. In accordancewith the fifth edition of the Balance of Payments Manual, the increase in the asset was registered with asign "-", the decrease in the assets – with a sign "+".
Statistical discrepancies (the item "Errors and omissions") are obtained as a residual value thatbrings into balance the positive or negative balances resulting from summing the operations registered inthe balance of payments. A positive value of statistical differences indicates the capital inflows into thecountry or export of goods, which are statistically unrecorded. A negative value indicates the capitaloutflows from the country or imports of goods, which are statistically unrecorded.
Full data compiling of the balance of payments and the international investment position in accordancewith the BPM 6 methods shall be implemented in 2017.
CURRENT STATUS OF THE BALANCE OF PAYMENTS
22 Balance of Payments of the Kyrgyz Republic for the first quarter of 2017
CO
NTE
NT
CURRENT STATUS OF THE BALANCE OF PAYMENTS
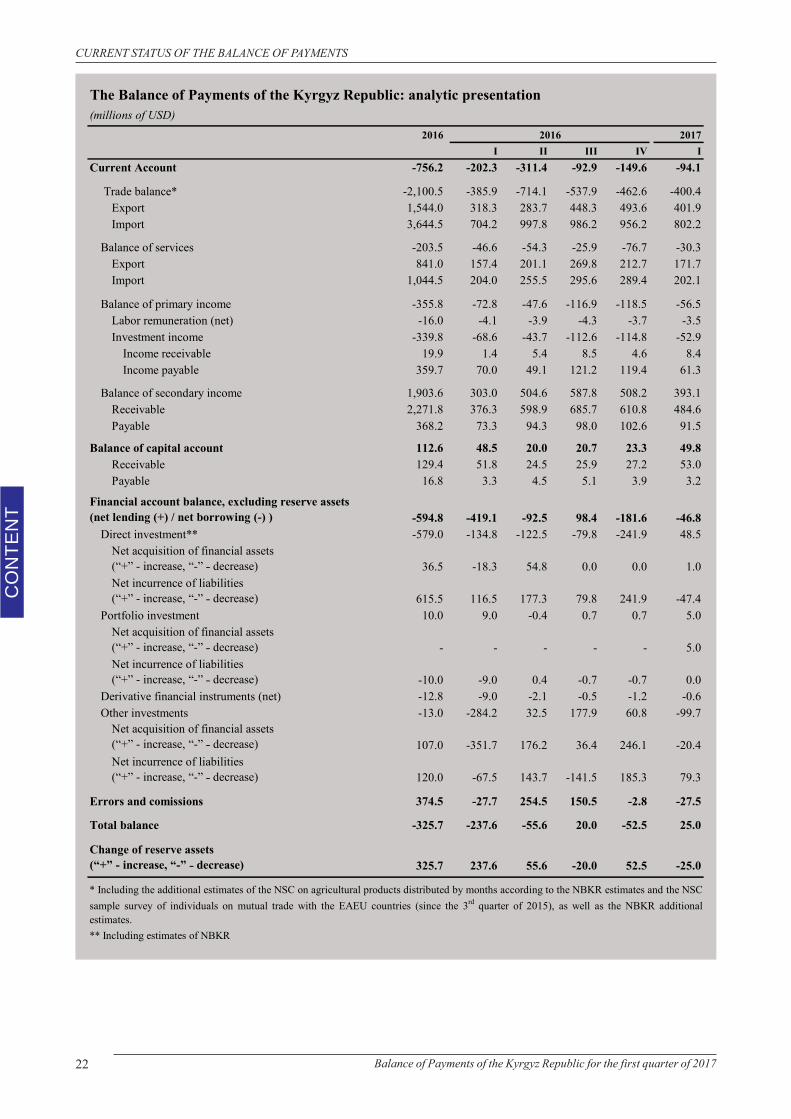
The Balance of Payments of the Kyrgyz Republic: analytic presentation(millions of USD)
2016 2017I II III IV I
Current Account -756.2 -202.3 -311.4 -92.9 -149.6 -94.1
Trade balance* -2,100.5 -385.9 -714.1 -537.9 -462.6 -400.4Export 1,544.0 318.3 283.7 448.3 493.6 401.9Import 3,644.5 704.2 997.8 986.2 956.2 802.2
Balance of services -203.5 -46.6 -54.3 -25.9 -76.7 -30.3Export 841.0 157.4 201.1 269.8 212.7 171.7Import 1,044.5 204.0 255.5 295.6 289.4 202.1
Balance of primary income -355.8 -72.8 -47.6 -116.9 -118.5 -56.5Labor remuneration (net) -16.0 -4.1 -3.9 -4.3 -3.7 -3.5Investment income -339.8 -68.6 -43.7 -112.6 -114.8 -52.9
Income receivable 19.9 1.4 5.4 8.5 4.6 8.4Income payable 359.7 70.0 49.1 121.2 119.4 61.3
Balance of secondary income 1,903.6 303.0 504.6 587.8 508.2 393.1Receivable 2,271.8 376.3 598.9 685.7 610.8 484.6Payable 368.2 73.3 94.3 98.0 102.6 91.5
Balance of capital account 112.6 48.5 20.0 20.7 23.3 49.8Receivable 129.4 51.8 24.5 25.9 27.2 53.0Payable 16.8 3.3 4.5 5.1 3.9 3.2
Financial account balance, excluding reserve assets (net lending (+) / net borrowing (-) ) -594.8 -419.1 -92.5 98.4 -181.6 -46.8
Direct investment** -579.0 -134.8 -122.5 -79.8 -241.9 48.5Net acquisition of financial assets (“+” - increase, “-” ˗ decrease) 36.5 -18.3 54.8 0.0 0.0 1.0Net incurrence of liabilities (“+” - increase, “-” ˗ decrease) 615.5 116.5 177.3 79.8 241.9 -47.4
Portfolio investment 10.0 9.0 -0.4 0.7 0.7 5.0Net acquisition of financial assets (“+” - increase, “-” ˗ decrease) - - - - - 5.0Net incurrence of liabilities (“+” - increase, “-” ˗ decrease) -10.0 -9.0 0.4 -0.7 -0.7 0.0
Derivative financial instruments (net) -12.8 -9.0 -2.1 -0.5 -1.2 -0.6Other investments -13.0 -284.2 32.5 177.9 60.8 -99.7
Net acquisition of financial assets (“+” - increase, “-” ˗ decrease) 107.0 -351.7 176.2 36.4 246.1 -20.4Net incurrence of liabilities (“+” - increase, “-” ˗ decrease) 120.0 -67.5 143.7 -141.5 185.3 79.3
Errors and comissions 374.5 -27.7 254.5 150.5 -2.8 -27.5
Total balance -325.7 -237.6 -55.6 20.0 -52.5 25.0
Change of reserve assets (“+” - increase, “-” ˗ decrease) 325.7 237.6 55.6 -20.0 52.5 -25.0
** Including estimates of NBKR
* Including the additional estimates of the NSC on agricultural products distributed by months according to the NBKR estimates and the NSCsample survey of individuals on mutual trade with the EAEU countries (since the 3rd quarter of 2015), as well as the NBKR additionalestimates.
2016
23Balance of Payments of the Kyrgyz Republic for the first quarter of 2017
CO
NTE
NT
CURRENT STATUS OF THE BALANCE OF PAYMENTS
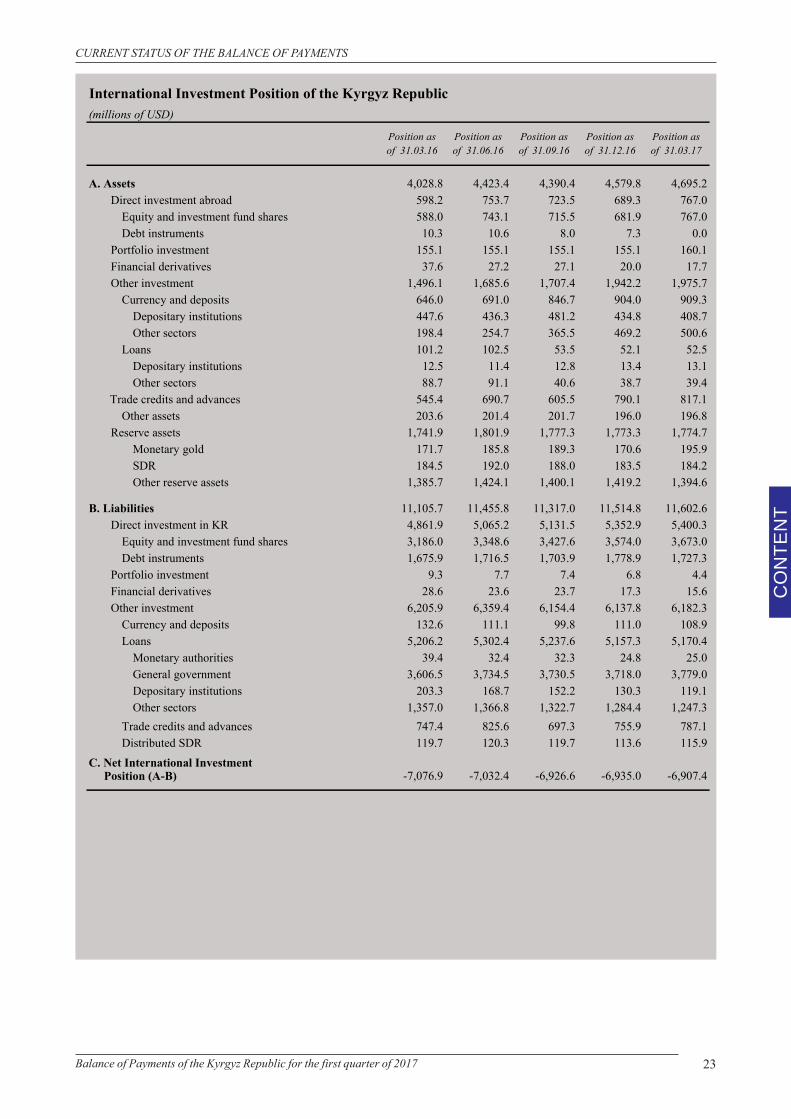
International Investment Position of the Kyrgyz Republic(millions of USD)
A. Assets 4,028.8 4,423.4 4,390.4 4,579.8 4,695.2Direct investment abroad 598.2 753.7 723.5 689.3 767.0
Equity and investment fund shares 588.0 743.1 715.5 681.9 767.0Debt instruments 10.3 10.6 8.0 7.3 0.0
Portfolio investment 155.1 155.1 155.1 155.1 160.1Financial derivatives 37.6 27.2 27.1 20.0 17.7Other investment 1,496.1 1,685.6 1,707.4 1,942.2 1,975.7
Currency and deposits 646.0 691.0 846.7 904.0 909.3Depositary institutions 447.6 436.3 481.2 434.8 408.7Other sectors 198.4 254.7 365.5 469.2 500.6
Loans 101.2 102.5 53.5 52.1 52.5Depositary institutions 12.5 11.4 12.8 13.4 13.1Other sectors 88.7 91.1 40.6 38.7 39.4
Trade credits and advances 545.4 690.7 605.5 790.1 817.1Other assets 203.6 201.4 201.7 196.0 196.8
Reserve assets 1,741.9 1,801.9 1,777.3 1,773.3 1,774.7Monetary gold 171.7 185.8 189.3 170.6 195.9SDR 184.5 192.0 188.0 183.5 184.2Other reserve assets 1,385.7 1,424.1 1,400.1 1,419.2 1,394.6
B. Liabilities 11,105.7 11,455.8 11,317.0 11,514.8 11,602.6Direct investment in KR 4,861.9 5,065.2 5,131.5 5,352.9 5,400.3
Equity and investment fund shares 3,186.0 3,348.6 3,427.6 3,574.0 3,673.0Debt instruments 1,675.9 1,716.5 1,703.9 1,778.9 1,727.3
Portfolio investment 9.3 7.7 7.4 6.8 4.4Financial derivatives 28.6 23.6 23.7 17.3 15.6Other investment 6,205.9 6,359.4 6,154.4 6,137.8 6,182.3
Currency and deposits 132.6 111.1 99.8 111.0 108.9Loans 5,206.2 5,302.4 5,237.6 5,157.3 5,170.4
Monetary authorities 39.4 32.4 32.3 24.8 25.0General government 3,606.5 3,734.5 3,730.5 3,718.0 3,779.0Depositary institutions 203.3 168.7 152.2 130.3 119.1Other sectors 1,357.0 1,366.8 1,322.7 1,284.4 1,247.3
Trade credits and advances 747.4 825.6 697.3 755.9 787.1Distributed SDR 119.7 120.3 119.7 113.6 115.9
C. Net International Investment Position (A-B) -7,076.9 -7,032.4 -6,926.6 -6,935.0 -6,907.4
Position as of 31.03.17
Position as of 31.03.16
Position as of 31.06.16
Position as of 31.09.16
Position as of 31.12.16
24 Balance of Payments of the Kyrgyz Republic for the first quarter of 2017
CO
NTE
NT
CURRENT STATUS OF THE BALANCE OF PAYMENTS
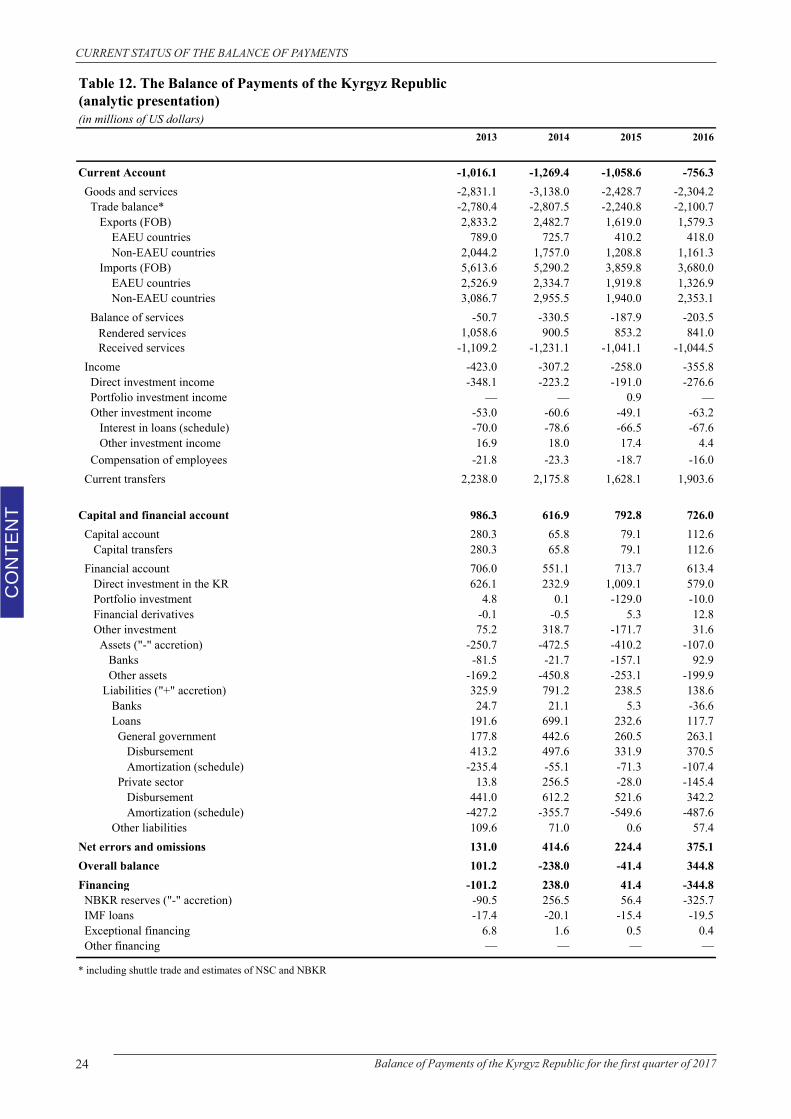
Table 12. The Balance of Payments of the Kyrgyz Republic(analytic presentation)(in millions of US dollars)
2013 2014 2015 2016
Current Account -1,016.1 -1,269.4 -1,058.6 -756.3 Goods and services -2,831.1 -3,138.0 -2,428.7 -2,304.2 Trade balance* -2,780.4 -2,807.5 -2,240.8 -2,100.7 Exports (FOB) 2,833.2 2,482.7 1,619.0 1,579.3 EAEU countries 789.0 725.7 410.2 418.0 Non-EAEU countries 2,044.2 1,757.0 1,208.8 1,161.3 Imports (FOB) 5,613.6 5,290.2 3,859.8 3,680.0 EAEU countries 2,526.9 2,334.7 1,919.8 1,326.9 Non-EAEU countries 3,086.7 2,955.5 1,940.0 2,353.1 Balance of services -50.7 -330.5 -187.9 -203.5
Rendered services 1,058.6 900.5 853.2 841.0Received services -1,109.2 -1,231.1 -1,041.1 -1,044.5
Income -423.0 -307.2 -258.0 -355.8 Direct investment income -348.1 -223.2 -191.0 -276.6 Portfolio investment income — — 0.9 — Other investment income -53.0 -60.6 -49.1 -63.2 Interest in loans (schedule) -70.0 -78.6 -66.5 -67.6 Other investment income 16.9 18.0 17.4 4.4 Compensation of employees -21.8 -23.3 -18.7 -16.0 Current transfers 2,238.0 2,175.8 1,628.1 1,903.6
Capital and financial account 986.3 616.9 792.8 726.0 Capital account 280.3 65.8 79.1 112.6 Capital transfers 280.3 65.8 79.1 112.6 Financial account 706.0 551.1 713.7 613.4 Direct investment in the KR 626.1 232.9 1,009.1 579.0 Portfolio investment 4.8 0.1 -129.0 -10.0 Financial derivatives -0.1 -0.5 5.3 12.8 Other investment 75.2 318.7 -171.7 31.6 Assets ("-" accretion) -250.7 -472.5 -410.2 -107.0 Banks -81.5 -21.7 -157.1 92.9 Other assets -169.2 -450.8 -253.1 -199.9 Liabilities ("+" accretion) 325.9 791.2 238.5 138.6 Banks 24.7 21.1 5.3 -36.6 Loans 191.6 699.1 232.6 117.7 General government 177.8 442.6 260.5 263.1 Disbursement 413.2 497.6 331.9 370.5 Amortization (schedule) -235.4 -55.1 -71.3 -107.4 Private sector 13.8 256.5 -28.0 -145.4 Disbursement 441.0 612.2 521.6 342.2 Amortization (schedule) -427.2 -355.7 -549.6 -487.6 Other liabilities 109.6 71.0 0.6 57.4Net errors and omissions 131.0 414.6 224.4 375.1Overall balance 101.2 -238.0 -41.4 344.8Financing -101.2 238.0 41.4 -344.8 NBKR reserves ("-" accretion) -90.5 256.5 56.4 -325.7 IMF loans -17.4 -20.1 -15.4 -19.5 Exceptional financing 6.8 1.6 0.5 0.4 Other financing — — — —
* including shuttle trade and estimates of NSC and NBKR
25Balance of Payments of the Kyrgyz Republic for the first quarter of 2017
CO
NTE
NT
CURRENT STATUS OF THE BALANCE OF PAYMENTS
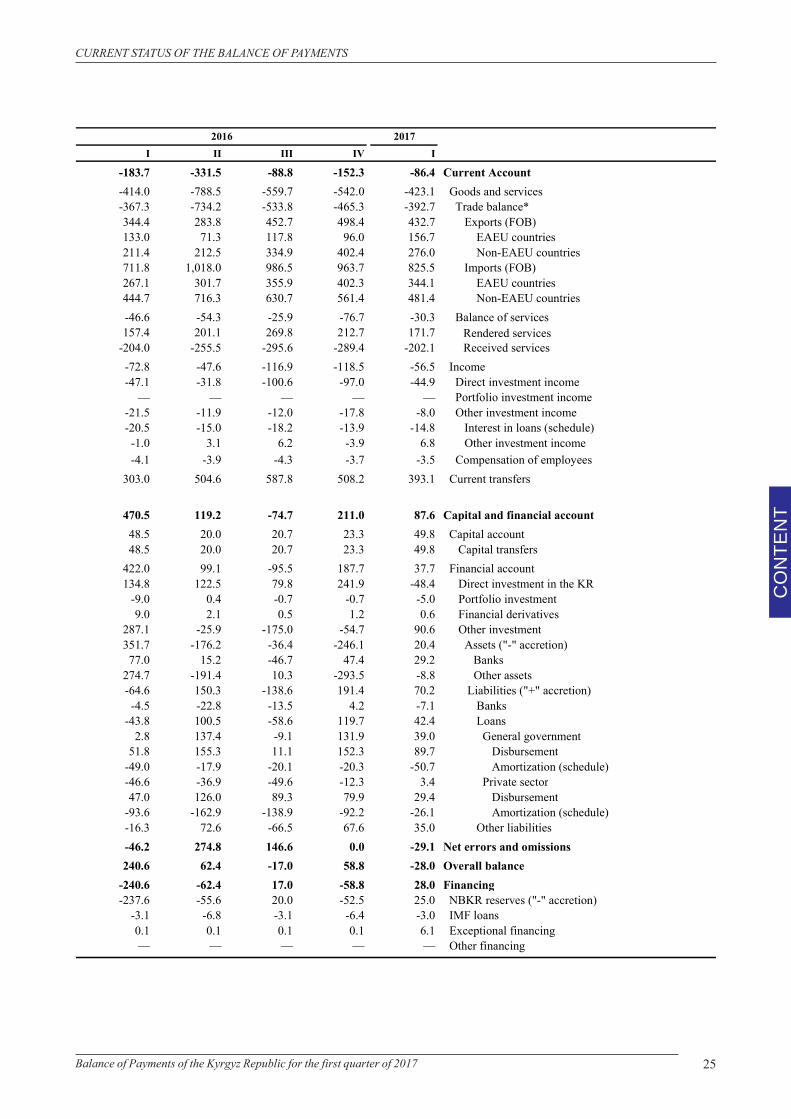
I II III IV I
-183.7 -331.5 -88.8 -152.3 -86.4 Current Account-414.0 -788.5 -559.7 -542.0 -423.1 Goods and services-367.3 -734.2 -533.8 -465.3 -392.7 Trade balance*344.4 283.8 452.7 498.4 432.7 Exports (FOB)133.0 71.3 117.8 96.0 156.7 EAEU countries211.4 212.5 334.9 402.4 276.0 Non-EAEU countries711.8 1,018.0 986.5 963.7 825.5 Imports (FOB)267.1 301.7 355.9 402.3 344.1 EAEU countries444.7 716.3 630.7 561.4 481.4 Non-EAEU countries-46.6 -54.3 -25.9 -76.7 -30.3 Balance of services157.4 201.1 269.8 212.7 171.7 Rendered services
-204.0 -255.5 -295.6 -289.4 -202.1 Received services-72.8 -47.6 -116.9 -118.5 -56.5 Income-47.1 -31.8 -100.6 -97.0 -44.9 Direct investment income
— — — — — Portfolio investment income-21.5 -11.9 -12.0 -17.8 -8.0 Other investment income-20.5 -15.0 -18.2 -13.9 -14.8 Interest in loans (schedule)
-1.0 3.1 6.2 -3.9 6.8 Other investment income -4.1 -3.9 -4.3 -3.7 -3.5 Compensation of employees
303.0 504.6 587.8 508.2 393.1 Current transfers
470.5 119.2 -74.7 211.0 87.6 Capital and financial account 48.5 20.0 20.7 23.3 49.8 Capital account48.5 20.0 20.7 23.3 49.8 Capital transfers
422.0 99.1 -95.5 187.7 37.7 Financial account134.8 122.5 79.8 241.9 -48.4 Direct investment in the KR
-9.0 0.4 -0.7 -0.7 -5.0 Portfolio investment 9.0 2.1 0.5 1.2 0.6 Financial derivatives
287.1 -25.9 -175.0 -54.7 90.6 Other investment 351.7 -176.2 -36.4 -246.1 20.4 Assets ("-" accretion)77.0 15.2 -46.7 47.4 29.2 Banks
274.7 -191.4 10.3 -293.5 -8.8 Other assets-64.6 150.3 -138.6 191.4 70.2 Liabilities ("+" accretion)
-4.5 -22.8 -13.5 4.2 -7.1 Banks-43.8 100.5 -58.6 119.7 42.4 Loans
2.8 137.4 -9.1 131.9 39.0 General government51.8 155.3 11.1 152.3 89.7 Disbursement
-49.0 -17.9 -20.1 -20.3 -50.7 Amortization (schedule)-46.6 -36.9 -49.6 -12.3 3.4 Private sector47.0 126.0 89.3 79.9 29.4 Disbursement
-93.6 -162.9 -138.9 -92.2 -26.1 Amortization (schedule)-16.3 72.6 -66.5 67.6 35.0 Other liabilities-46.2 274.8 146.6 0.0 -29.1 Net errors and omissions240.6 62.4 -17.0 58.8 -28.0 Overall balance
-240.6 -62.4 17.0 -58.8 28.0 Financing-237.6 -55.6 20.0 -52.5 25.0 NBKR reserves ("-" accretion)
-3.1 -6.8 -3.1 -6.4 -3.0 IMF loans0.1 0.1 0.1 0.1 6.1 Exceptional financing— — — — — Other financing
20172016

Annex I. Tables and charts
ANNEX I. TABLES AND CHARTS
CO
NTE
NT
Balance of Payments of the Kyrgyz Republic for the first quarter of 2017 27
28 Balance of Payments of the Kyrgyz Republic for the first quarter of 2017
CO
NTE
NT
ANNEX I. TABLES AND CHARTS
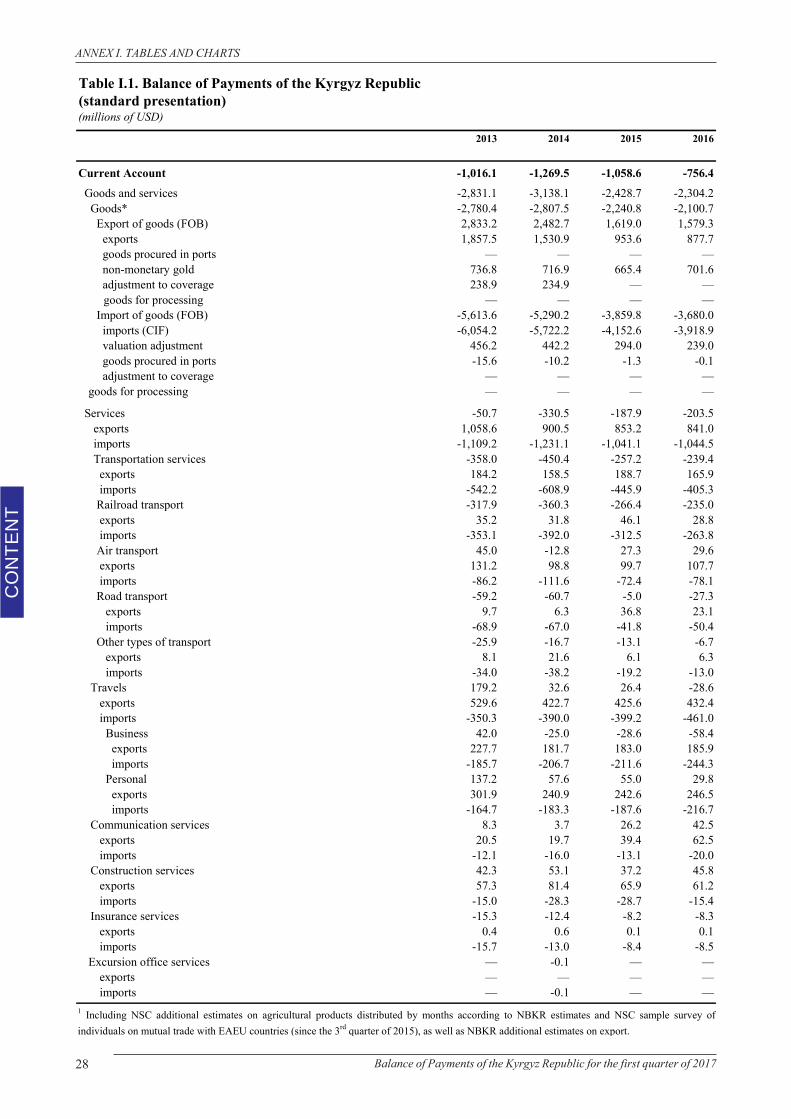
Table I.1. Balance of Payments of the Kyrgyz Republic(standard presentation)(millions of USD)
2013 2014 2015 2016
Current Account -1,016.1 -1,269.5 -1,058.6 -756.4 Goods and services -2,831.1 -3,138.1 -2,428.7 -2,304.2 Goods* -2,780.4 -2,807.5 -2,240.8 -2,100.7 Export of goods (FOB) 2,833.2 2,482.7 1,619.0 1,579.3 exports 1,857.5 1,530.9 953.6 877.7 goods procured in ports — — — — non-monetary gold 736.8 716.9 665.4 701.6 adjustment to coverage 238.9 234.9 — —
goods for processing — — — — Import of goods (FOB) -5,613.6 -5,290.2 -3,859.8 -3,680.0 imports (CIF) -6,054.2 -5,722.2 -4,152.6 -3,918.9 valuation adjustment 456.2 442.2 294.0 239.0 goods procured in ports -15.6 -10.2 -1.3 -0.1 adjustment to coverage — — — —
goods for processing — — — —
Services -50.7 -330.5 -187.9 -203.5 exports 1,058.6 900.5 853.2 841.0 imports -1,109.2 -1,231.1 -1,041.1 -1,044.5 Transportation services -358.0 -450.4 -257.2 -239.4 exports 184.2 158.5 188.7 165.9 imports -542.2 -608.9 -445.9 -405.3 Railroad transport -317.9 -360.3 -266.4 -235.0 exports 35.2 31.8 46.1 28.8 imports -353.1 -392.0 -312.5 -263.8 Air transport 45.0 -12.8 27.3 29.6 exports 131.2 98.8 99.7 107.7 imports -86.2 -111.6 -72.4 -78.1 Road transport -59.2 -60.7 -5.0 -27.3 exports 9.7 6.3 36.8 23.1 imports -68.9 -67.0 -41.8 -50.4 Other types of transport -25.9 -16.7 -13.1 -6.7 exports 8.1 21.6 6.1 6.3 imports -34.0 -38.2 -19.2 -13.0 Travels 179.2 32.6 26.4 -28.6 exports 529.6 422.7 425.6 432.4 imports -350.3 -390.0 -399.2 -461.0 Business 42.0 -25.0 -28.6 -58.4 exports 227.7 181.7 183.0 185.9 imports -185.7 -206.7 -211.6 -244.3 Personal 137.2 57.6 55.0 29.8 exports 301.9 240.9 242.6 246.5 imports -164.7 -183.3 -187.6 -216.7 Communication services 8.3 3.7 26.2 42.5 exports 20.5 19.7 39.4 62.5 imports -12.1 -16.0 -13.1 -20.0 Construction services 42.3 53.1 37.2 45.8 exports 57.3 81.4 65.9 61.2 imports -15.0 -28.3 -28.7 -15.4 Insurance services -15.3 -12.4 -8.2 -8.3 exports 0.4 0.6 0.1 0.1 imports -15.7 -13.0 -8.4 -8.5
Excursion office services — -0.1 — — exports — — — — imports — -0.1 — —1 Including NSC additional estimates on agricultural products distributed by months according to NBKR estimates and NSC sample survey ofindividuals on mutual trade with EAEU countries (since the 3rd quarter of 2015), as well as NBKR additional estimates on export.
29Balance of Payments of the Kyrgyz Republic for the first quarter of 2017
CO
NTE
NT
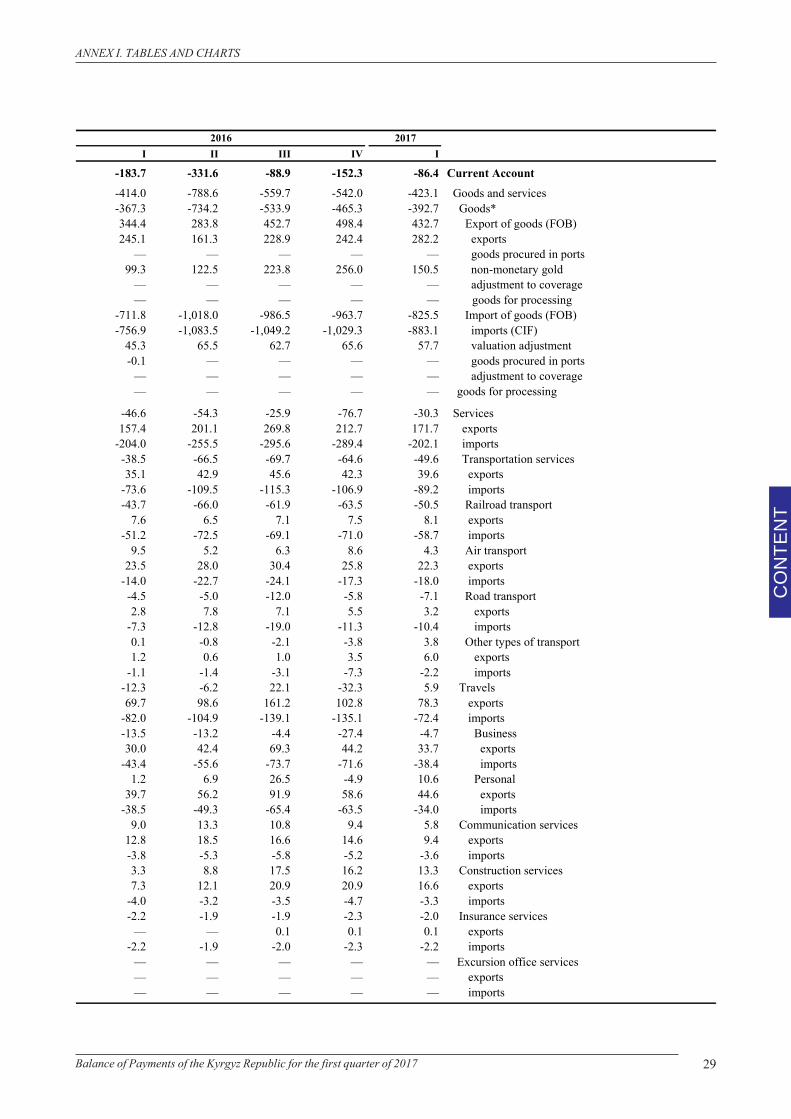
ANNEX I. TABLES AND CHARTS
I II III IV I
-183.7 -331.6 -88.9 -152.3 -86.4 Current Account-414.0 -788.6 -559.7 -542.0 -423.1 Goods and services-367.3 -734.2 -533.9 -465.3 -392.7 Goods*344.4 283.8 452.7 498.4 432.7 Export of goods (FOB)245.1 161.3 228.9 242.4 282.2 exports
— — — — — goods procured in ports99.3 122.5 223.8 256.0 150.5 non-monetary gold
— — — — — adjustment to coverage— — — — — goods for processing
-711.8 -1,018.0 -986.5 -963.7 -825.5 Import of goods (FOB)-756.9 -1,083.5 -1,049.2 -1,029.3 -883.1 imports (CIF)
45.3 65.5 62.7 65.6 57.7 valuation adjustment-0.1 — — — — goods procured in ports
— — — — — adjustment to coverage— — — — — goods for processing
-46.6 -54.3 -25.9 -76.7 -30.3 Services157.4 201.1 269.8 212.7 171.7 exports
-204.0 -255.5 -295.6 -289.4 -202.1 imports-38.5 -66.5 -69.7 -64.6 -49.6 Transportation services35.1 42.9 45.6 42.3 39.6 exports
-73.6 -109.5 -115.3 -106.9 -89.2 imports-43.7 -66.0 -61.9 -63.5 -50.5 Railroad transport
7.6 6.5 7.1 7.5 8.1 exports-51.2 -72.5 -69.1 -71.0 -58.7 imports
9.5 5.2 6.3 8.6 4.3 Air transport23.5 28.0 30.4 25.8 22.3 exports
-14.0 -22.7 -24.1 -17.3 -18.0 imports-4.5 -5.0 -12.0 -5.8 -7.1 Road transport2.8 7.8 7.1 5.5 3.2 exports
-7.3 -12.8 -19.0 -11.3 -10.4 imports0.1 -0.8 -2.1 -3.8 3.8 Other types of transport1.2 0.6 1.0 3.5 6.0 exports
-1.1 -1.4 -3.1 -7.3 -2.2 imports-12.3 -6.2 22.1 -32.3 5.9 Travels69.7 98.6 161.2 102.8 78.3 exports
-82.0 -104.9 -139.1 -135.1 -72.4 imports-13.5 -13.2 -4.4 -27.4 -4.7 Business 30.0 42.4 69.3 44.2 33.7 exports
-43.4 -55.6 -73.7 -71.6 -38.4 imports1.2 6.9 26.5 -4.9 10.6 Personal
39.7 56.2 91.9 58.6 44.6 exports-38.5 -49.3 -65.4 -63.5 -34.0 imports
9.0 13.3 10.8 9.4 5.8 Communication services12.8 18.5 16.6 14.6 9.4 exports-3.8 -5.3 -5.8 -5.2 -3.6 imports3.3 8.8 17.5 16.2 13.3 Construction services7.3 12.1 20.9 20.9 16.6 exports
-4.0 -3.2 -3.5 -4.7 -3.3 imports-2.2 -1.9 -1.9 -2.3 -2.0 Insurance services
— — 0.1 0.1 0.1 exports-2.2 -1.9 -2.0 -2.3 -2.2 imports
— — — — — Excursion office services— — — — — exports— — — — — imports
20172016
30 Balance of Payments of the Kyrgyz Republic for the first quarter of 2017
CO
NTE
NT
ANNEX I. TABLES AND CHARTS
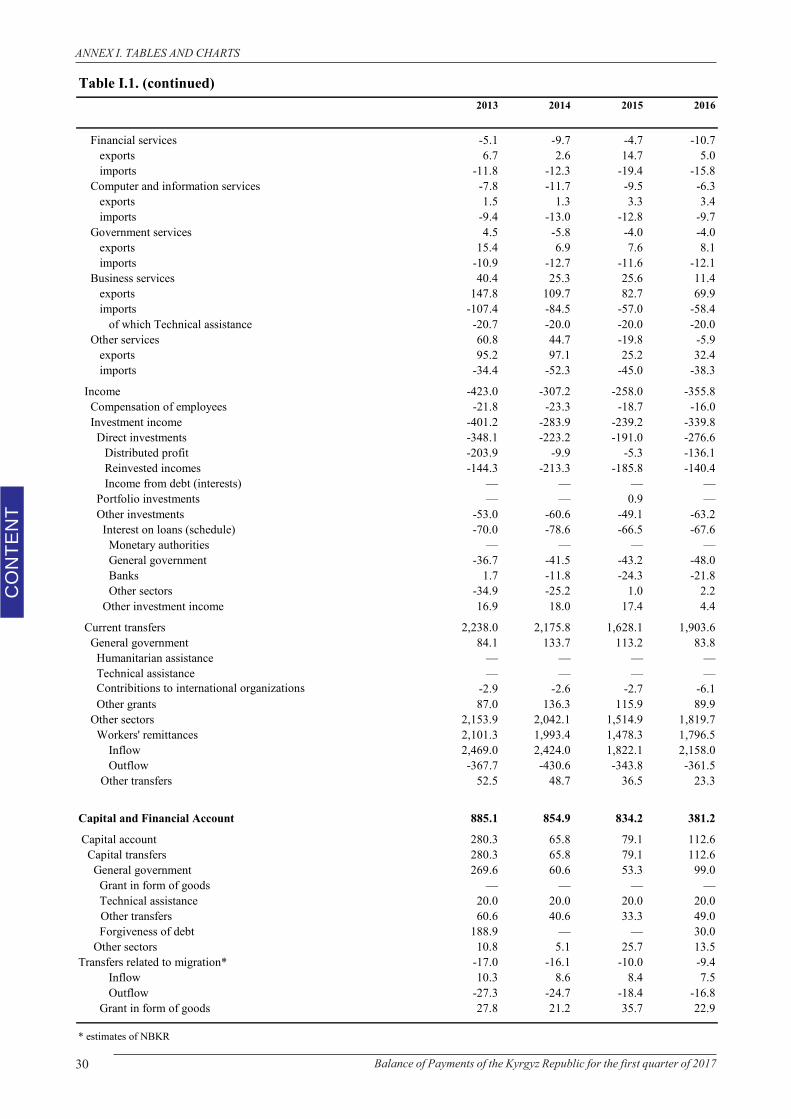
Table I.1. (continued)2013 2014 2015 2016
Financial services -5.1 -9.7 -4.7 -10.7 exports 6.7 2.6 14.7 5.0 imports -11.8 -12.3 -19.4 -15.8 Computer and information services -7.8 -11.7 -9.5 -6.3 exports 1.5 1.3 3.3 3.4 imports -9.4 -13.0 -12.8 -9.7 Government services 4.5 -5.8 -4.0 -4.0 exports 15.4 6.9 7.6 8.1 imports -10.9 -12.7 -11.6 -12.1 Business services 40.4 25.3 25.6 11.4 exports 147.8 109.7 82.7 69.9 imports -107.4 -84.5 -57.0 -58.4 of which Technical assistance -20.7 -20.0 -20.0 -20.0 Other services 60.8 44.7 -19.8 -5.9 exports 95.2 97.1 25.2 32.4 imports -34.4 -52.3 -45.0 -38.3
Income -423.0 -307.2 -258.0 -355.8 Compensation of employees -21.8 -23.3 -18.7 -16.0 Investment income -401.2 -283.9 -239.2 -339.8 Direct investments -348.1 -223.2 -191.0 -276.6
Distributed profit -203.9 -9.9 -5.3 -136.1 Reinvested incomes -144.3 -213.3 -185.8 -140.4 Income from debt (interests) — — — —
Portfolio investments — — 0.9 — Other investments -53.0 -60.6 -49.1 -63.2 Interest on loans (schedule) -70.0 -78.6 -66.5 -67.6 Monetary authorities — — — — General government -36.7 -41.5 -43.2 -48.0 Banks 1.7 -11.8 -24.3 -21.8 Other sectors -34.9 -25.2 1.0 2.2 Other investment income 16.9 18.0 17.4 4.4
Current transfers 2,238.0 2,175.8 1,628.1 1,903.6 General government 84.1 133.7 113.2 83.8 Humanitarian assistance — — — — Technical assistance — — — — Contribitions to international organizations -2.9 -2.6 -2.7 -6.1 Other grants 87.0 136.3 115.9 89.9 Other sectors 2,153.9 2,042.1 1,514.9 1,819.7 Workers' remittances 2,101.3 1,993.4 1,478.3 1,796.5
Inflow 2,469.0 2,424.0 1,822.1 2,158.0Outflow -367.7 -430.6 -343.8 -361.5
Other transfers 52.5 48.7 36.5 23.3
Capital and Financial Account 885.1 854.9 834.2 381.2
Capital account 280.3 65.8 79.1 112.6 Capital transfers 280.3 65.8 79.1 112.6 General government 269.6 60.6 53.3 99.0 Grant in form of goods — — — — Technical assistance 20.0 20.0 20.0 20.0
Other transfers 60.6 40.6 33.3 49.0 Forgiveness of debt 188.9 — — 30.0 Other sectors 10.8 5.1 25.7 13.5Transfers related to migration* -17.0 -16.1 -10.0 -9.4
Inflow 10.3 8.6 8.4 7.5Outflow -27.3 -24.7 -18.4 -16.8
Grant in form of goods 27.8 21.2 35.7 22.9
* estimates of NBKR
31Balance of Payments of the Kyrgyz Republic for the first quarter of 2017
CO
NTE
NT
ANNEX I. TABLES AND CHARTS
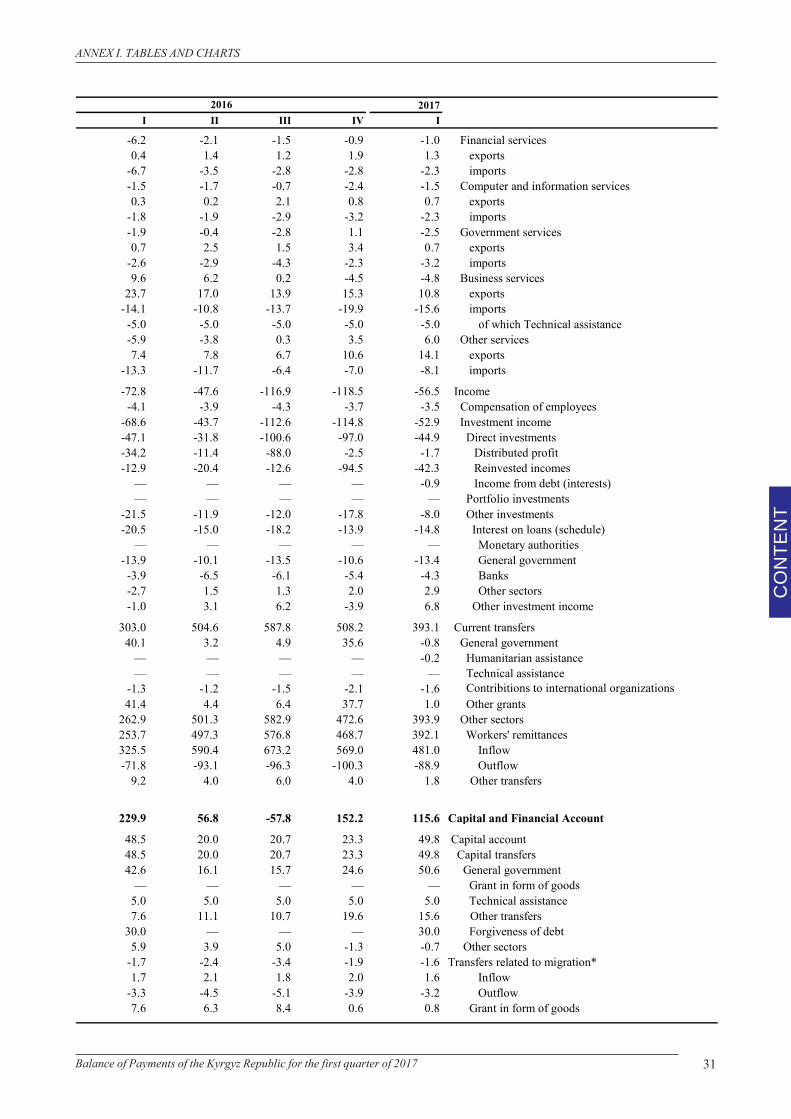
2017I II III IV I
-6.2 -2.1 -1.5 -0.9 -1.0 Financial services0.4 1.4 1.2 1.9 1.3 exports
-6.7 -3.5 -2.8 -2.8 -2.3 imports-1.5 -1.7 -0.7 -2.4 -1.5 Computer and information services0.3 0.2 2.1 0.8 0.7 exports
-1.8 -1.9 -2.9 -3.2 -2.3 imports-1.9 -0.4 -2.8 1.1 -2.5 Government services0.7 2.5 1.5 3.4 0.7 exports
-2.6 -2.9 -4.3 -2.3 -3.2 imports9.6 6.2 0.2 -4.5 -4.8 Business services
23.7 17.0 13.9 15.3 10.8 exports-14.1 -10.8 -13.7 -19.9 -15.6 imports
-5.0 -5.0 -5.0 -5.0 -5.0 of which Technical assistance-5.9 -3.8 0.3 3.5 6.0 Other services7.4 7.8 6.7 10.6 14.1 exports
-13.3 -11.7 -6.4 -7.0 -8.1 imports
-72.8 -47.6 -116.9 -118.5 -56.5 Income-4.1 -3.9 -4.3 -3.7 -3.5 Compensation of employees
-68.6 -43.7 -112.6 -114.8 -52.9 Investment income-47.1 -31.8 -100.6 -97.0 -44.9 Direct investments-34.2 -11.4 -88.0 -2.5 -1.7 Distributed profit-12.9 -20.4 -12.6 -94.5 -42.3 Reinvested incomes
— — — — -0.9 Income from debt (interests)— — — — — Portfolio investments
-21.5 -11.9 -12.0 -17.8 -8.0 Other investments-20.5 -15.0 -18.2 -13.9 -14.8 Interest on loans (schedule)
— — — — — Monetary authorities-13.9 -10.1 -13.5 -10.6 -13.4 General government
-3.9 -6.5 -6.1 -5.4 -4.3 Banks-2.7 1.5 1.3 2.0 2.9 Other sectors-1.0 3.1 6.2 -3.9 6.8 Other investment income
303.0 504.6 587.8 508.2 393.1 Current transfers40.1 3.2 4.9 35.6 -0.8 General government
— — — — -0.2 Humanitarian assistance— — — — — Technical assistance
-1.3 -1.2 -1.5 -2.1 -1.6 Contribitions to international organizations41.4 4.4 6.4 37.7 1.0 Other grants
262.9 501.3 582.9 472.6 393.9 Other sectors253.7 497.3 576.8 468.7 392.1 Workers' remittances325.5 590.4 673.2 569.0 481.0 Inflow-71.8 -93.1 -96.3 -100.3 -88.9 Outflow
9.2 4.0 6.0 4.0 1.8 Other transfers
229.9 56.8 -57.8 152.2 115.6 Capital and Financial Account
48.5 20.0 20.7 23.3 49.8 Capital account48.5 20.0 20.7 23.3 49.8 Capital transfers42.6 16.1 15.7 24.6 50.6 General government
— — — — — Grant in form of goods5.0 5.0 5.0 5.0 5.0 Technical assistance7.6 11.1 10.7 19.6 15.6 Other transfers
30.0 — — — 30.0 Forgiveness of debt5.9 3.9 5.0 -1.3 -0.7 Other sectors
-1.7 -2.4 -3.4 -1.9 -1.6 Transfers related to migration*1.7 2.1 1.8 2.0 1.6 Inflow
-3.3 -4.5 -5.1 -3.9 -3.2 Outflow7.6 6.3 8.4 0.6 0.8 Grant in form of goods
2016
32 Balance of Payments of the Kyrgyz Republic for the first quarter of 2017
CO
NTE
NT
ANNEX I. TABLES AND CHARTS
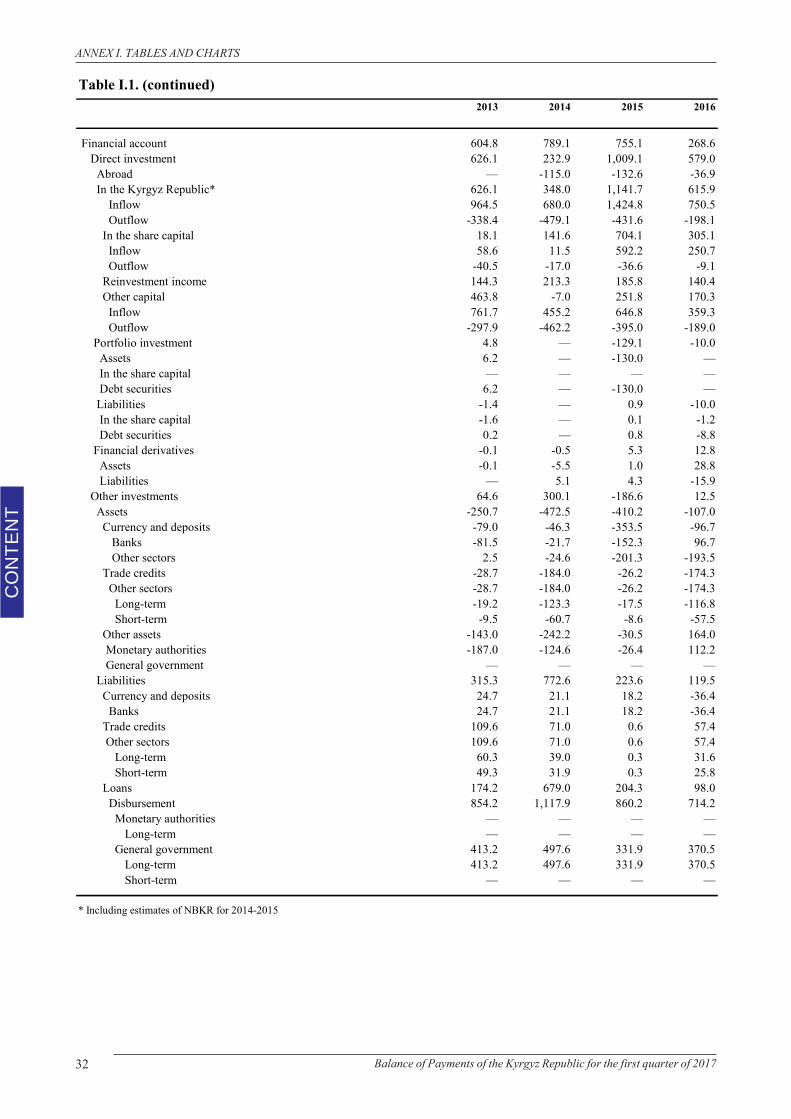
Table I.1. (continued)2013 2014 2015 2016
Financial account 604.8 789.1 755.1 268.6 Direct investment 626.1 232.9 1,009.1 579.0 Abroad — -115.0 -132.6 -36.9 In the Kyrgyz Republic* 626.1 348.0 1,141.7 615.9
Inflow 964.5 680.0 1,424.8 750.5Outflow -338.4 -479.1 -431.6 -198.1
In the share capital 18.1 141.6 704.1 305.1Inflow 58.6 11.5 592.2 250.7Outflow -40.5 -17.0 -36.6 -9.1
Reinvestment income 144.3 213.3 185.8 140.4 Other capital 463.8 -7.0 251.8 170.3
Inflow 761.7 455.2 646.8 359.3Outflow -297.9 -462.2 -395.0 -189.0
Portfolio investment 4.8 — -129.1 -10.0 Assets 6.2 — -130.0 — In the share capital — — — — Debt securities 6.2 — -130.0 — Liabilities -1.4 — 0.9 -10.0 In the share capital -1.6 — 0.1 -1.2 Debt securities 0.2 — 0.8 -8.8 Financial derivatives -0.1 -0.5 5.3 12.8 Assets -0.1 -5.5 1.0 28.8 Liabilities — 5.1 4.3 -15.9 Other investments 64.6 300.1 -186.6 12.5 Assets -250.7 -472.5 -410.2 -107.0 Currency and deposits -79.0 -46.3 -353.5 -96.7 Banks -81.5 -21.7 -152.3 96.7 Other sectors 2.5 -24.6 -201.3 -193.5 Trade credits -28.7 -184.0 -26.2 -174.3 Other sectors -28.7 -184.0 -26.2 -174.3 Long-term -19.2 -123.3 -17.5 -116.8 Short-term -9.5 -60.7 -8.6 -57.5 Other assets -143.0 -242.2 -30.5 164.0 Monetary authorities -187.0 -124.6 -26.4 112.2 General government — — — — Liabilities 315.3 772.6 223.6 119.5 Currency and deposits 24.7 21.1 18.2 -36.4 Banks 24.7 21.1 18.2 -36.4 Trade credits 109.6 71.0 0.6 57.4 Other sectors 109.6 71.0 0.6 57.4 Long-term 60.3 39.0 0.3 31.6 Short-term 49.3 31.9 0.3 25.8 Loans 174.2 679.0 204.3 98.0 Disbursement 854.2 1,117.9 860.2 714.2 Monetary authorities — — — —
Long-term — — — — General government 413.2 497.6 331.9 370.5
Long-term 413.2 497.6 331.9 370.5 Short-term — — — —
* Including estimates of NBKR for 2014-2015
33Balance of Payments of the Kyrgyz Republic for the first quarter of 2017
CO
NTE
NT
ANNEX I. TABLES AND CHARTS
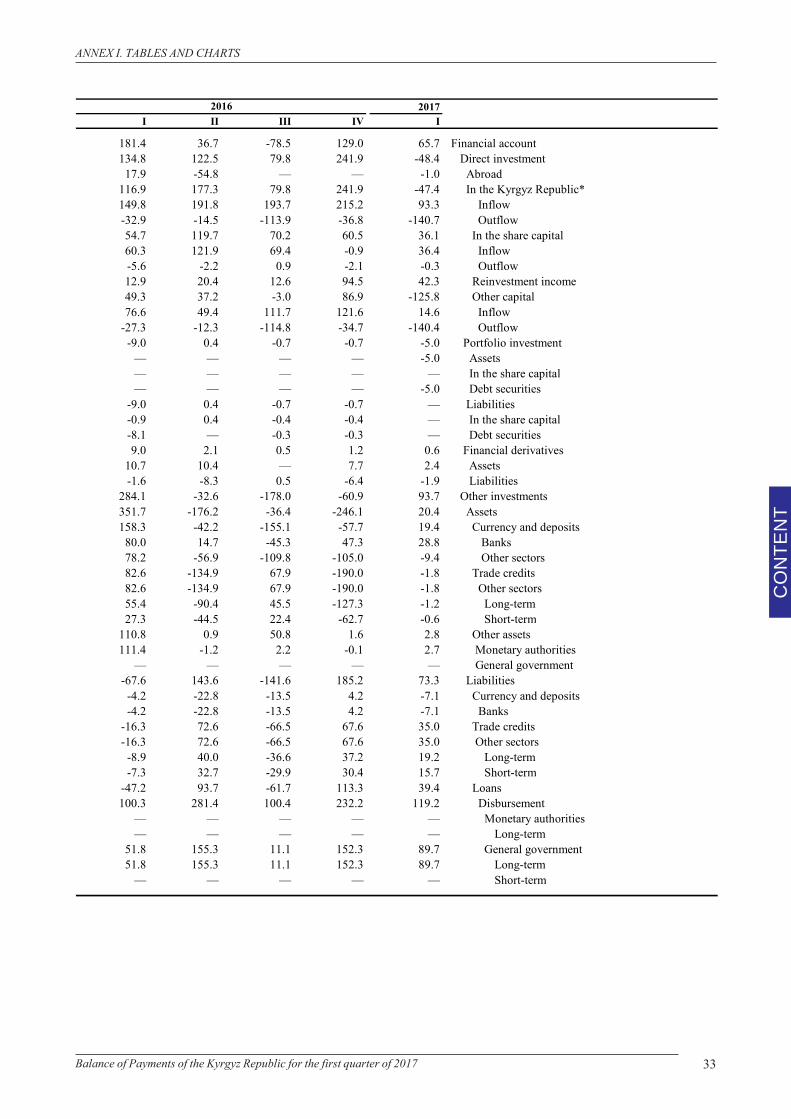
2017I II III IV I
181.4 36.7 -78.5 129.0 65.7 Financial account134.8 122.5 79.8 241.9 -48.4 Direct investment
17.9 -54.8 — — -1.0 Abroad116.9 177.3 79.8 241.9 -47.4 In the Kyrgyz Republic*149.8 191.8 193.7 215.2 93.3 Inflow-32.9 -14.5 -113.9 -36.8 -140.7 Outflow54.7 119.7 70.2 60.5 36.1 In the share capital60.3 121.9 69.4 -0.9 36.4 Inflow-5.6 -2.2 0.9 -2.1 -0.3 Outflow12.9 20.4 12.6 94.5 42.3 Reinvestment income49.3 37.2 -3.0 86.9 -125.8 Other capital76.6 49.4 111.7 121.6 14.6 Inflow
-27.3 -12.3 -114.8 -34.7 -140.4 Outflow-9.0 0.4 -0.7 -0.7 -5.0 Portfolio investment
— — — — -5.0 Assets— — — — — In the share capital— — — — -5.0 Debt securities
-9.0 0.4 -0.7 -0.7 — Liabilities-0.9 0.4 -0.4 -0.4 — In the share capital-8.1 — -0.3 -0.3 — Debt securities9.0 2.1 0.5 1.2 0.6 Financial derivatives
10.7 10.4 — 7.7 2.4 Assets-1.6 -8.3 0.5 -6.4 -1.9 Liabilities
284.1 -32.6 -178.0 -60.9 93.7 Other investments351.7 -176.2 -36.4 -246.1 20.4 Assets158.3 -42.2 -155.1 -57.7 19.4 Currency and deposits
80.0 14.7 -45.3 47.3 28.8 Banks78.2 -56.9 -109.8 -105.0 -9.4 Other sectors82.6 -134.9 67.9 -190.0 -1.8 Trade credits82.6 -134.9 67.9 -190.0 -1.8 Other sectors55.4 -90.4 45.5 -127.3 -1.2 Long-term 27.3 -44.5 22.4 -62.7 -0.6 Short-term
110.8 0.9 50.8 1.6 2.8 Other assets111.4 -1.2 2.2 -0.1 2.7 Monetary authorities
— — — — — General government-67.6 143.6 -141.6 185.2 73.3 Liabilities
-4.2 -22.8 -13.5 4.2 -7.1 Currency and deposits-4.2 -22.8 -13.5 4.2 -7.1 Banks
-16.3 72.6 -66.5 67.6 35.0 Trade credits-16.3 72.6 -66.5 67.6 35.0 Other sectors
-8.9 40.0 -36.6 37.2 19.2 Long-term -7.3 32.7 -29.9 30.4 15.7 Short-term
-47.2 93.7 -61.7 113.3 39.4 Loans100.3 281.4 100.4 232.2 119.2 Disbursement
— — — — — Monetary authorities— — — — — Long-term
51.8 155.3 11.1 152.3 89.7 General government51.8 155.3 11.1 152.3 89.7 Long-term
— — — — — Short-term
2016
34 Balance of Payments of the Kyrgyz Republic for the first quarter of 2017
CO
NTE
NT
ANNEX I. TABLES AND CHARTS
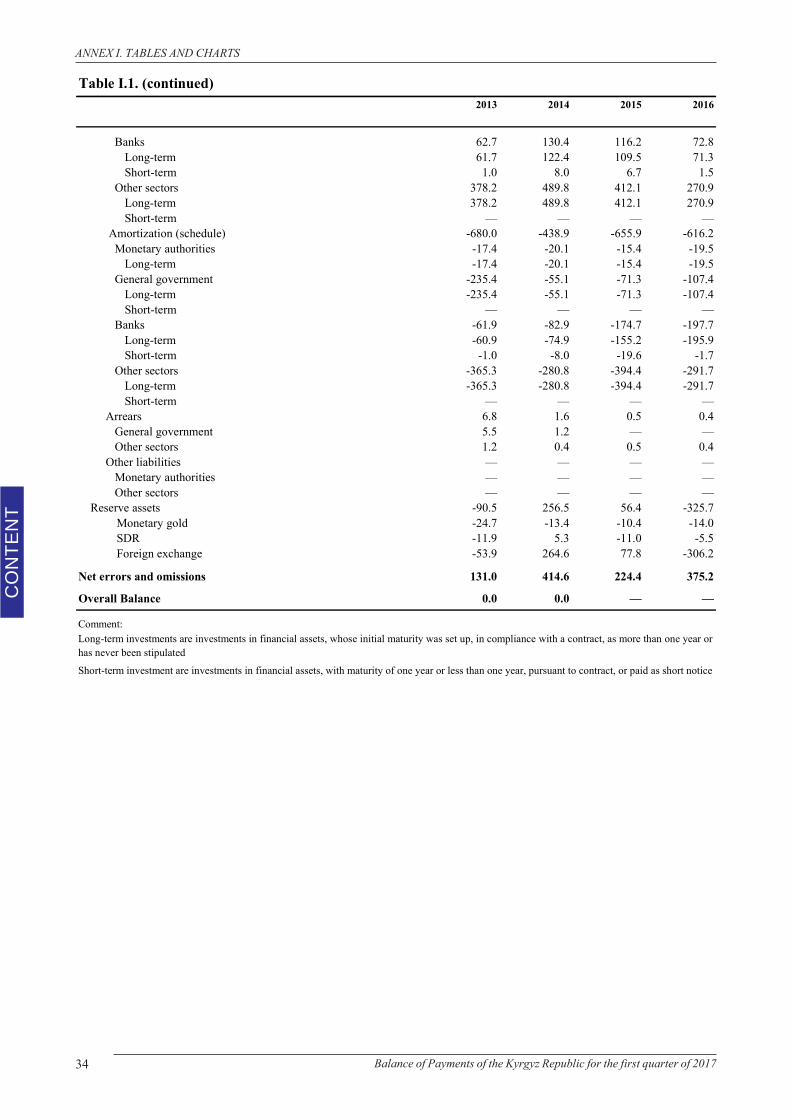
Table I.1. (continued)2013 2014 2015 2016
Banks 62.7 130.4 116.2 72.8 Long-term 61.7 122.4 109.5 71.3 Short-term 1.0 8.0 6.7 1.5
Other sectors 378.2 489.8 412.1 270.9 Long-term 378.2 489.8 412.1 270.9 Short-term — — — —
Amortization (schedule) -680.0 -438.9 -655.9 -616.2 Monetary authorities -17.4 -20.1 -15.4 -19.5
Long-term -17.4 -20.1 -15.4 -19.5 General government -235.4 -55.1 -71.3 -107.4
Long-term -235.4 -55.1 -71.3 -107.4 Short-term — — — —
Banks -61.9 -82.9 -174.7 -197.7 Long-term -60.9 -74.9 -155.2 -195.9 Short-term -1.0 -8.0 -19.6 -1.7
Other sectors -365.3 -280.8 -394.4 -291.7 Long-term -365.3 -280.8 -394.4 -291.7 Short-term — — — —
Arrears 6.8 1.6 0.5 0.4 General government 5.5 1.2 — — Other sectors 1.2 0.4 0.5 0.4 Other liabilities — — — — Monetary authorities — — — — Other sectors — — — — Reserve assets -90.5 256.5 56.4 -325.7
Monetary gold -24.7 -13.4 -10.4 -14.0 SDR -11.9 5.3 -11.0 -5.5 Foreign exchange -53.9 264.6 77.8 -306.2
Net errors and omissions 131.0 414.6 224.4 375.2
Overall Balance 0.0 0.0 — —
Comment:Long-term investments are investments in financial assets, whose initial maturity was set up, in compliance with a contract, as more than one year orhas never been stipulated
Short-term investment are investments in financial assets, with maturity of one year or less than one year, pursuant to contract, or paid as short notice
35Balance of Payments of the Kyrgyz Republic for the first quarter of 2017
CO
NTE
NT
ANNEX I. TABLES AND CHARTS
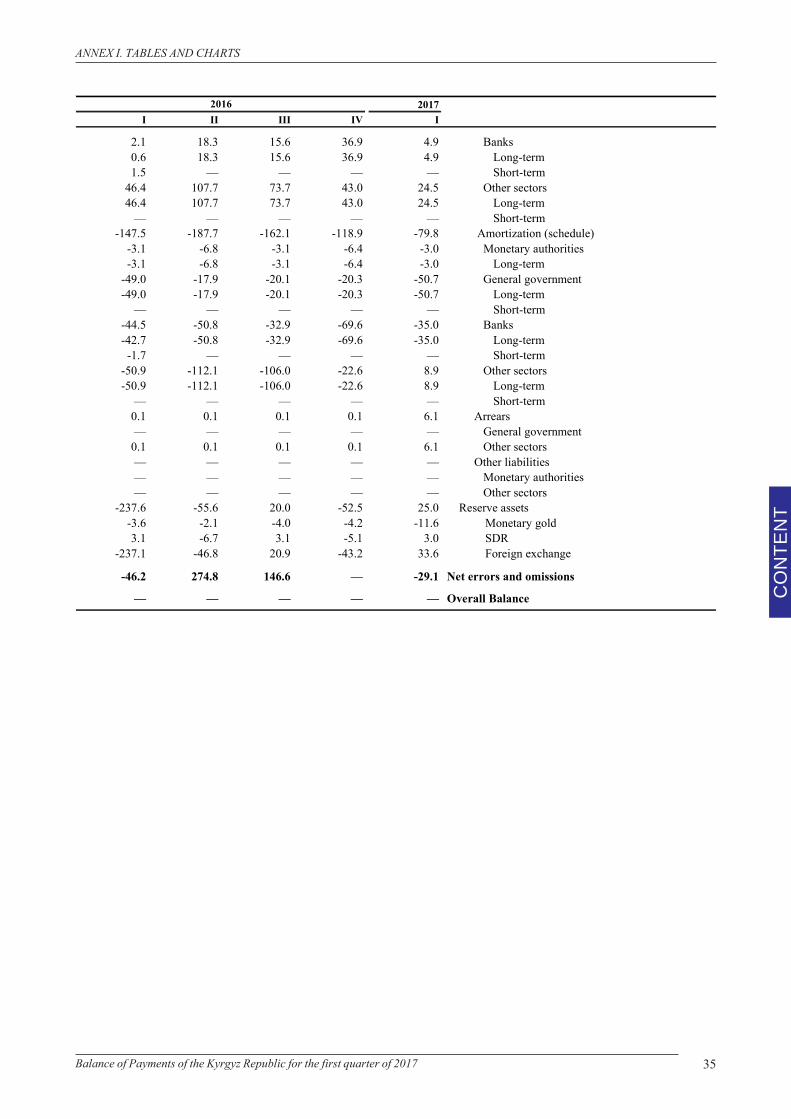
2017I II III IV I
2.1 18.3 15.6 36.9 4.9 Banks0.6 18.3 15.6 36.9 4.9 Long-term 1.5 — — — — Short-term
46.4 107.7 73.7 43.0 24.5 Other sectors46.4 107.7 73.7 43.0 24.5 Long-term
— — — — — Short-term-147.5 -187.7 -162.1 -118.9 -79.8 Amortization (schedule)
-3.1 -6.8 -3.1 -6.4 -3.0 Monetary authorities-3.1 -6.8 -3.1 -6.4 -3.0 Long-term
-49.0 -17.9 -20.1 -20.3 -50.7 General government-49.0 -17.9 -20.1 -20.3 -50.7 Long-term
— — — — — Short-term-44.5 -50.8 -32.9 -69.6 -35.0 Banks-42.7 -50.8 -32.9 -69.6 -35.0 Long-term -1.7 — — — — Short-term
-50.9 -112.1 -106.0 -22.6 8.9 Other sectors-50.9 -112.1 -106.0 -22.6 8.9 Long-term
— — — — — Short-term0.1 0.1 0.1 0.1 6.1 Arrears— — — — — General government
0.1 0.1 0.1 0.1 6.1 Other sectors— — — — — Other liabilities— — — — — Monetary authorities— — — — — Other sectors
-237.6 -55.6 20.0 -52.5 25.0 Reserve assets-3.6 -2.1 -4.0 -4.2 -11.6 Monetary gold3.1 -6.7 3.1 -5.1 3.0 SDR
-237.1 -46.8 20.9 -43.2 33.6 Foreign exchange
-46.2 274.8 146.6 — -29.1 Net errors and omissions
— — — — — Overall Balance
2016
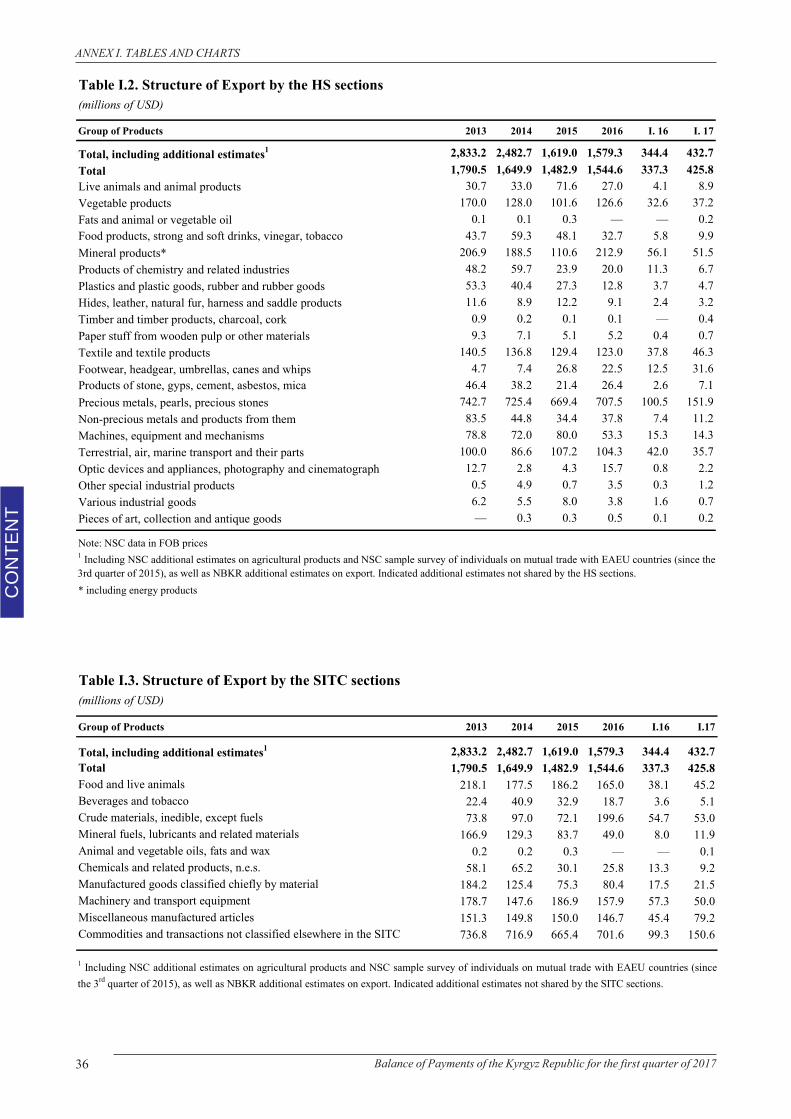
36 Balance of Payments of the Kyrgyz Republic for the first quarter of 2017
CO
NTE
NT
ANNEX I. TABLES AND CHARTS
Table I.2. Structure of Export by the HS sections(millions of USD)
Group of Products 2013 2014 2015 2016 I. 16 I. 17
Total, including additional estimates1 2,833.2 2,482.7 1,619.0 1,579.3 344.4 432.7Total 1,790.5 1,649.9 1,482.9 1,544.6 337.3 425.8Live animals and animal products 30.7 33.0 71.6 27.0 4.1 8.9Vegetable products 170.0 128.0 101.6 126.6 32.6 37.2Fats and animal or vegetable oil 0.1 0.1 0.3 — — 0.2Food products, strong and soft drinks, vinegar, tobacco 43.7 59.3 48.1 32.7 5.8 9.9Mineral products* 206.9 188.5 110.6 212.9 56.1 51.5Products of chemistry and related industries 48.2 59.7 23.9 20.0 11.3 6.7Plastics and plastic goods, rubber and rubber goods 53.3 40.4 27.3 12.8 3.7 4.7Hides, leather, natural fur, harness and saddle products 11.6 8.9 12.2 9.1 2.4 3.2Timber and timber products, charcoal, cork 0.9 0.2 0.1 0.1 — 0.4Paper stuff from wooden pulp or other materials 9.3 7.1 5.1 5.2 0.4 0.7Textile and textile products 140.5 136.8 129.4 123.0 37.8 46.3Footwear, headgear, umbrellas, canes and whips 4.7 7.4 26.8 22.5 12.5 31.6Products of stone, gyps, cement, asbestos, mica 46.4 38.2 21.4 26.4 2.6 7.1Precious metals, pearls, precious stones 742.7 725.4 669.4 707.5 100.5 151.9Non-precious metals and products from them 83.5 44.8 34.4 37.8 7.4 11.2Machines, equipment and mechanisms 78.8 72.0 80.0 53.3 15.3 14.3Terrestrial, air, marine transport and their parts 100.0 86.6 107.2 104.3 42.0 35.7Optic devices and appliances, photography and cinematograph 12.7 2.8 4.3 15.7 0.8 2.2Other special industrial products 0.5 4.9 0.7 3.5 0.3 1.2Various industrial goods 6.2 5.5 8.0 3.8 1.6 0.7Pieces of art, collection and antique goods — 0.3 0.3 0.5 0.1 0.2
Note: NSC data in FOB prices
* including energy products
1 Including NSC additional estimates on agricultural products and NSC sample survey of individuals on mutual trade with EAEU countries (since the3rd quarter of 2015), as well as NBKR additional estimates on export. Indicated additional estimates not shared by the HS sections.
Table I.3. Structure of Export by the SITC sections(millions of USD)
Group of Products 2013 2014 2015 2016 I.16 I.17
Total, including additional estimates1 2,833.2 2,482.7 1,619.0 1,579.3 344.4 432.7Total 1,790.5 1,649.9 1,482.9 1,544.6 337.3 425.8Food and live animals 218.1 177.5 186.2 165.0 38.1 45.2Beverages and tobacco 22.4 40.9 32.9 18.7 3.6 5.1Crude materials, inedible, except fuels 73.8 97.0 72.1 199.6 54.7 53.0Mineral fuels, lubricants and related materials 166.9 129.3 83.7 49.0 8.0 11.9Animal and vegetable oils, fats and wax 0.2 0.2 0.3 — — 0.1Chemicals and related products, n.e.s. 58.1 65.2 30.1 25.8 13.3 9.2Manufactured goods classified chiefly by material 184.2 125.4 75.3 80.4 17.5 21.5Machinery and transport equipment 178.7 147.6 186.9 157.9 57.3 50.0Miscellaneous manufactured articles 151.3 149.8 150.0 146.7 45.4 79.2Commodities and transactions not classified elsewhere in the SITC 736.8 716.9 665.4 701.6 99.3 150.6
1 Including NSC additional estimates on agricultural products and NSC sample survey of individuals on mutual trade with EAEU countries (sincethe 3rd quarter of 2015), as well as NBKR additional estimates on export. Indicated additional estimates not shared by the SITC sections.
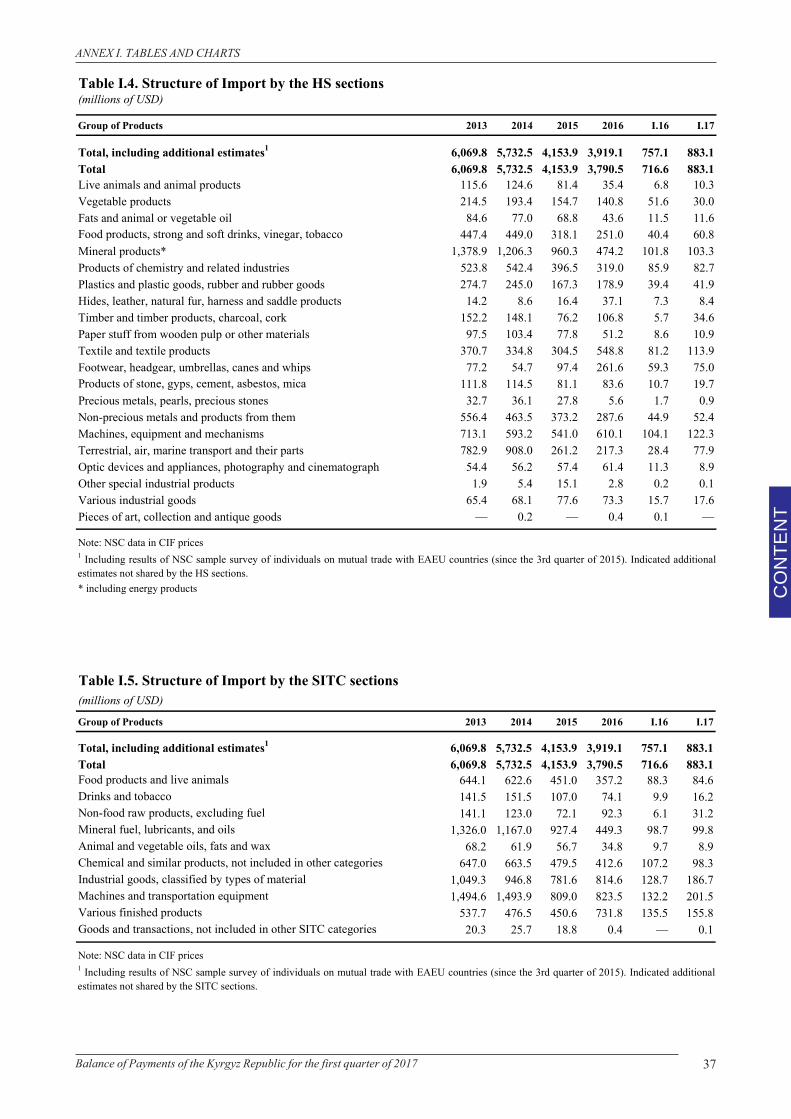
37Balance of Payments of the Kyrgyz Republic for the first quarter of 2017
CO
NTE
NT
ANNEX I. TABLES AND CHARTS
Table I.4. Structure of Import by the HS sections(millions of USD)
Group of Products 2013 2014 2015 2016 I.16 I.17
Total, including additional estimates1 6,069.8 5,732.5 4,153.9 3,919.1 757.1 883.1Total 6,069.8 5,732.5 4,153.9 3,790.5 716.6 883.1Live animals and animal products 115.6 124.6 81.4 35.4 6.8 10.3Vegetable products 214.5 193.4 154.7 140.8 51.6 30.0Fats and animal or vegetable oil 84.6 77.0 68.8 43.6 11.5 11.6Food products, strong and soft drinks, vinegar, tobacco 447.4 449.0 318.1 251.0 40.4 60.8Mineral products* 1,378.9 1,206.3 960.3 474.2 101.8 103.3Products of chemistry and related industries 523.8 542.4 396.5 319.0 85.9 82.7Plastics and plastic goods, rubber and rubber goods 274.7 245.0 167.3 178.9 39.4 41.9Hides, leather, natural fur, harness and saddle products 14.2 8.6 16.4 37.1 7.3 8.4Timber and timber products, charcoal, cork 152.2 148.1 76.2 106.8 5.7 34.6Paper stuff from wooden pulp or other materials 97.5 103.4 77.8 51.2 8.6 10.9Textile and textile products 370.7 334.8 304.5 548.8 81.2 113.9Footwear, headgear, umbrellas, canes and whips 77.2 54.7 97.4 261.6 59.3 75.0Products of stone, gyps, cement, asbestos, mica 111.8 114.5 81.1 83.6 10.7 19.7Precious metals, pearls, precious stones 32.7 36.1 27.8 5.6 1.7 0.9Non-precious metals and products from them 556.4 463.5 373.2 287.6 44.9 52.4Machines, equipment and mechanisms 713.1 593.2 541.0 610.1 104.1 122.3Terrestrial, air, marine transport and their parts 782.9 908.0 261.2 217.3 28.4 77.9Optic devices and appliances, photography and cinematograph 54.4 56.2 57.4 61.4 11.3 8.9Other special industrial products 1.9 5.4 15.1 2.8 0.2 0.1Various industrial goods 65.4 68.1 77.6 73.3 15.7 17.6Pieces of art, collection and antique goods — 0.2 — 0.4 0.1 —
Note: NSC data in CIF prices
* including energy products
1 Including results of NSC sample survey of individuals on mutual trade with EAEU countries (since the 3rd quarter of 2015). Indicated additionalestimates not shared by the HS sections.
Table I.5. Structure of Import by the SITC sections(millions of USD)
Group of Products 2013 2014 2015 2016 I.16 I.17
Total, including additional estimates1 6,069.8 5,732.5 4,153.9 3,919.1 757.1 883.1Total 6,069.8 5,732.5 4,153.9 3,790.5 716.6 883.1Food products and live animals 644.1 622.6 451.0 357.2 88.3 84.6Drinks and tobacco 141.5 151.5 107.0 74.1 9.9 16.2Non-food raw products, excluding fuel 141.1 123.0 72.1 92.3 6.1 31.2Mineral fuel, lubricants, and oils 1,326.0 1,167.0 927.4 449.3 98.7 99.8Animal and vegetable oils, fats and wax 68.2 61.9 56.7 34.8 9.7 8.9Chemical and similar products, not included in other categories 647.0 663.5 479.5 412.6 107.2 98.3Industrial goods, classified by types of material 1,049.3 946.8 781.6 814.6 128.7 186.7Machines and transportation equipment 1,494.6 1,493.9 809.0 823.5 132.2 201.5Various finished products 537.7 476.5 450.6 731.8 135.5 155.8Goods and transactions, not included in other SITC categories 20.3 25.7 18.8 0.4 — 0.1
Note: NSC data in CIF prices1 Including results of NSC sample survey of individuals on mutual trade with EAEU countries (since the 3rd quarter of 2015). Indicated additionalestimates not shared by the SITC sections.
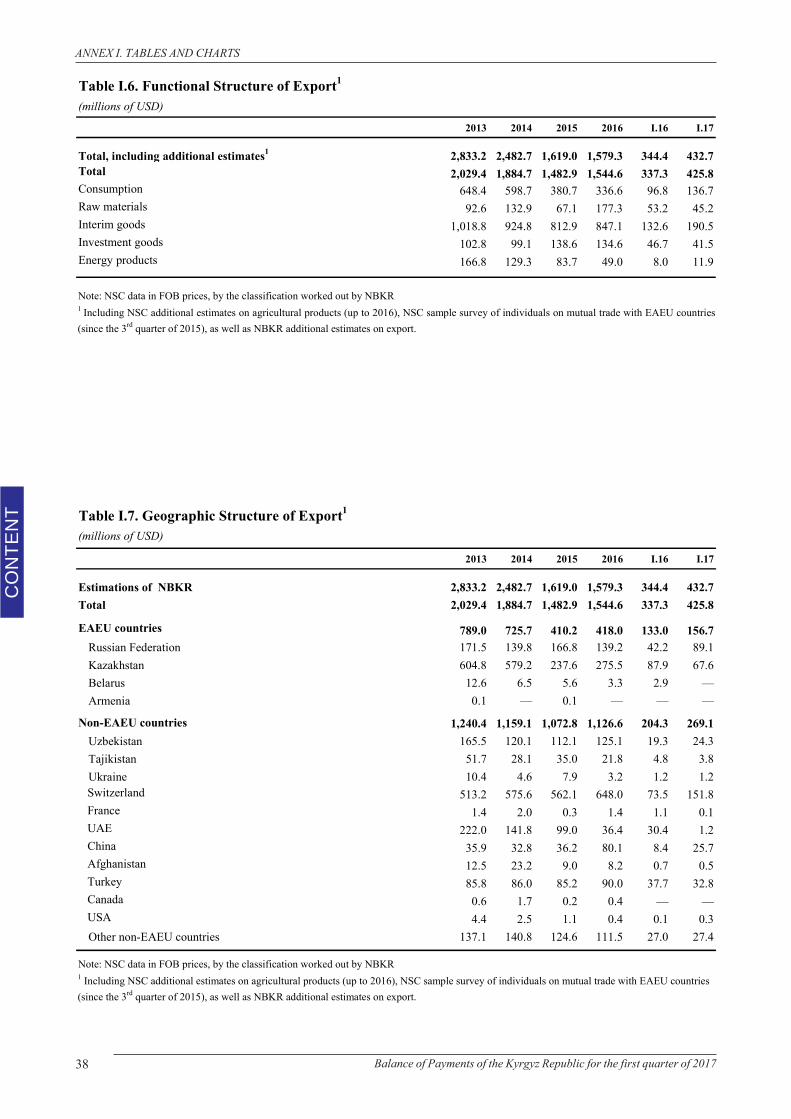
38 Balance of Payments of the Kyrgyz Republic for the first quarter of 2017
CO
NTE
NT
ANNEX I. TABLES AND CHARTS
Table I.6. Functional Structure of Export1
(millions of USD)
2013 2014 2015 2016 I.16 I.17
Total, including additional estimates1 2,833.2 2,482.7 1,619.0 1,579.3 344.4 432.7Total 2,029.4 1,884.7 1,482.9 1,544.6 337.3 425.8Consumption 648.4 598.7 380.7 336.6 96.8 136.7Raw materials 92.6 132.9 67.1 177.3 53.2 45.2Interim goods 1,018.8 924.8 812.9 847.1 132.6 190.5Investment goods 102.8 99.1 138.6 134.6 46.7 41.5Energy products 166.8 129.3 83.7 49.0 8.0 11.9
Note: NSC data in FOB prices, by the classification worked out by NBKR1 Including NSC additional estimates on agricultural products (up to 2016), NSC sample survey of individuals on mutual trade with EAEU countries(since the 3rd quarter of 2015), as well as NBKR additional estimates on export.
Table I.7. Geographic Structure of Export1
(millions of USD)
2013 2014 2015 2016 I.16 I.17
Estimations of NBKR 2,833.2 2,482.7 1,619.0 1,579.3 344.4 432.7Total 2,029.4 1,884.7 1,482.9 1,544.6 337.3 425.8
EAEU countries 789.0 725.7 410.2 418.0 133.0 156.7Russian Federation 171.5 139.8 166.8 139.2 42.2 89.1Kazakhstan 604.8 579.2 237.6 275.5 87.9 67.6Belarus 12.6 6.5 5.6 3.3 2.9 —Armenia 0.1 — 0.1 — — —
Non-EAEU countries 1,240.4 1,159.1 1,072.8 1,126.6 204.3 269.1Uzbekistan 165.5 120.1 112.1 125.1 19.3 24.3Tajikistan 51.7 28.1 35.0 21.8 4.8 3.8Ukraine 10.4 4.6 7.9 3.2 1.2 1.2
Switzerland 513.2 575.6 562.1 648.0 73.5 151.8 France 1.4 2.0 0.3 1.4 1.1 0.1 UAE 222.0 141.8 99.0 36.4 30.4 1.2 China 35.9 32.8 36.2 80.1 8.4 25.7 Afghanistan 12.5 23.2 9.0 8.2 0.7 0.5 Turkey 85.8 86.0 85.2 90.0 37.7 32.8 Canada 0.6 1.7 0.2 0.4 — — USA 4.4 2.5 1.1 0.4 0.1 0.3
Other non-EAEU countries 137.1 140.8 124.6 111.5 27.0 27.4
Note: NSC data in FOB prices, by the classification worked out by NBKR1 Including NSC additional estimates on agricultural products (up to 2016), NSC sample survey of individuals on mutual trade with EAEU countries (since the 3rd quarter of 2015), as well as NBKR additional estimates on export.
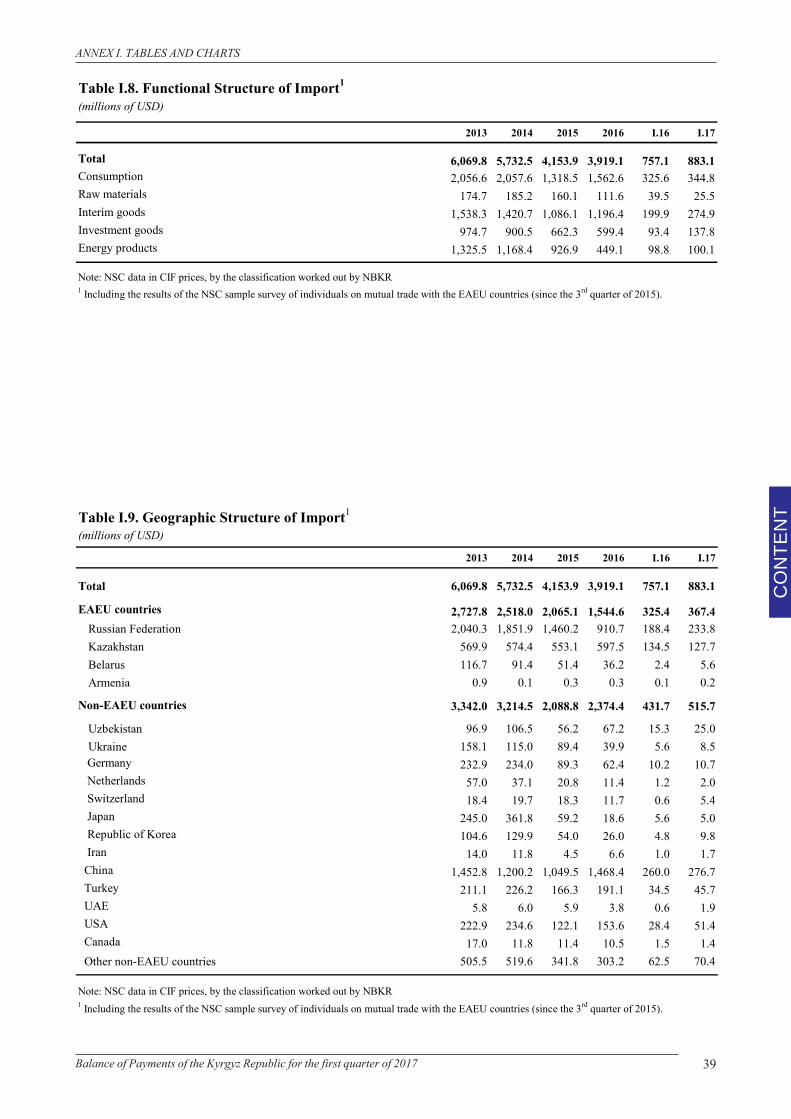
39Balance of Payments of the Kyrgyz Republic for the first quarter of 2017
CO
NTE
NT
ANNEX I. TABLES AND CHARTS
Table I.8. Functional Structure of Import1
(millions of USD)
2013 2014 2015 2016 I.16 I.17
Total 6,069.8 5,732.5 4,153.9 3,919.1 757.1 883.1Consumption 2,056.6 2,057.6 1,318.5 1,562.6 325.6 344.8Raw materials 174.7 185.2 160.1 111.6 39.5 25.5Interim goods 1,538.3 1,420.7 1,086.1 1,196.4 199.9 274.9Investment goods 974.7 900.5 662.3 599.4 93.4 137.8Energy products 1,325.5 1,168.4 926.9 449.1 98.8 100.1
Note: NSC data in CIF prices, by the classification worked out by NBKR1 Including the results of the NSC sample survey of individuals on mutual trade with the EAEU countries (since the 3rd quarter of 2015).
Table I.9. Geographic Structure of Import1
(millions of USD)
2013 2014 2015 2016 I.16 I.17
Total 6,069.8 5,732.5 4,153.9 3,919.1 757.1 883.1
EAEU countries 2,727.8 2,518.0 2,065.1 1,544.6 325.4 367.4Russian Federation 2,040.3 1,851.9 1,460.2 910.7 188.4 233.8Kazakhstan 569.9 574.4 553.1 597.5 134.5 127.7Belarus 116.7 91.4 51.4 36.2 2.4 5.6Armenia 0.9 0.1 0.3 0.3 0.1 0.2
Non-EAEU countries 3,342.0 3,214.5 2,088.8 2,374.4 431.7 515.7
Uzbekistan 96.9 106.5 56.2 67.2 15.3 25.0Ukraine 158.1 115.0 89.4 39.9 5.6 8.5
Germany 232.9 234.0 89.3 62.4 10.2 10.7 Netherlands 57.0 37.1 20.8 11.4 1.2 2.0 Switzerland 18.4 19.7 18.3 11.7 0.6 5.4 Japan 245.0 361.8 59.2 18.6 5.6 5.0 Republic of Korea 104.6 129.9 54.0 26.0 4.8 9.8 Iran 14.0 11.8 4.5 6.6 1.0 1.7 China 1,452.8 1,200.2 1,049.5 1,468.4 260.0 276.7 Turkey 211.1 226.2 166.3 191.1 34.5 45.7 UAE 5.8 6.0 5.9 3.8 0.6 1.9 USA 222.9 234.6 122.1 153.6 28.4 51.4 Canada 17.0 11.8 11.4 10.5 1.5 1.4 Other non-EAEU countries 505.5 519.6 341.8 303.2 62.5 70.4
Note: NSC data in CIF prices, by the classification worked out by NBKR1 Including the results of the NSC sample survey of individuals on mutual trade with the EAEU countries (since the 3rd quarter of 2015).
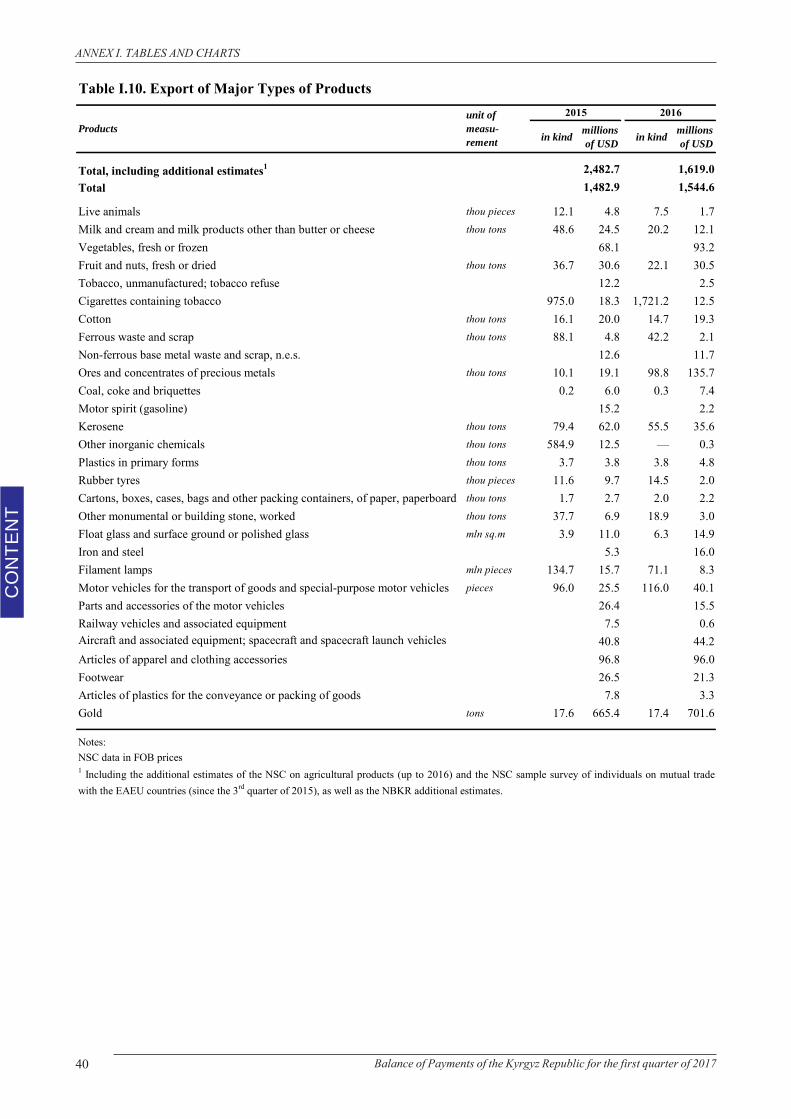
40 Balance of Payments of the Kyrgyz Republic for the first quarter of 2017
CO
NTE
NT
ANNEX I. TABLES AND CHARTS
Table I.10. Export of Major Types of Products
in kind millions of USD in kind millions
of USD
Total, including additional estimates1 2,482.7 1,619.0Total 1,482.9 1,544.6
Live animals thou pieces 12.1 4.8 7.5 1.7Milk and cream and milk products other than butter or cheese thou tons 48.6 24.5 20.2 12.1Vegetables, fresh or frozen 68.1 93.2Fruit and nuts, fresh or dried thou tons 36.7 30.6 22.1 30.5Tobacco, unmanufactured; tobacco refuse 12.2 2.5Cigarettes containing tobacco 975.0 18.3 1,721.2 12.5Cotton thou tons 16.1 20.0 14.7 19.3Ferrous waste and scrap thou tons 88.1 4.8 42.2 2.1Non-ferrous base metal waste and scrap, n.e.s. 12.6 11.7Ores and concentrates of precious metals thou tons 10.1 19.1 98.8 135.7Coal, coke and briquettes 0.2 6.0 0.3 7.4Motor spirit (gasoline) 15.2 2.2Kerosene thou tons 79.4 62.0 55.5 35.6Other inorganic chemicals thou tons 584.9 12.5 — 0.3Plastics in primary forms thou tons 3.7 3.8 3.8 4.8Rubber tyres thou pieces 11.6 9.7 14.5 2.0Cartons, boxes, cases, bags and other packing containers, of paper, paperboard thou tons 1.7 2.7 2.0 2.2Other monumental or building stone, worked thou tons 37.7 6.9 18.9 3.0Float glass and surface ground or polished glass mln sq.m 3.9 11.0 6.3 14.9Iron and steel 5.3 16.0Filament lamps mln pieces 134.7 15.7 71.1 8.3Motor vehicles for the transport of goods and special-purpose motor vehicles pieces 96.0 25.5 116.0 40.1Parts and accessories of the motor vehicles 26.4 15.5Railway vehicles and associated equipment 7.5 0.6Aircraft and associated equipment; spacecraft and spacecraft launch vehicles 40.8 44.2Articles of apparel and clothing accessories 96.8 96.0Footwear 26.5 21.3Articles of plastics for the conveyance or packing of goods 7.8 3.3Gold tons 17.6 665.4 17.4 701.6
Notes:NSC data in FOB prices
Productsunit of measu-rement
1 Including the additional estimates of the NSC on agricultural products (up to 2016) and the NSC sample survey of individuals on mutual tradewith the EAEU countries (since the 3rd quarter of 2015), as well as the NBKR additional estimates.
20162015
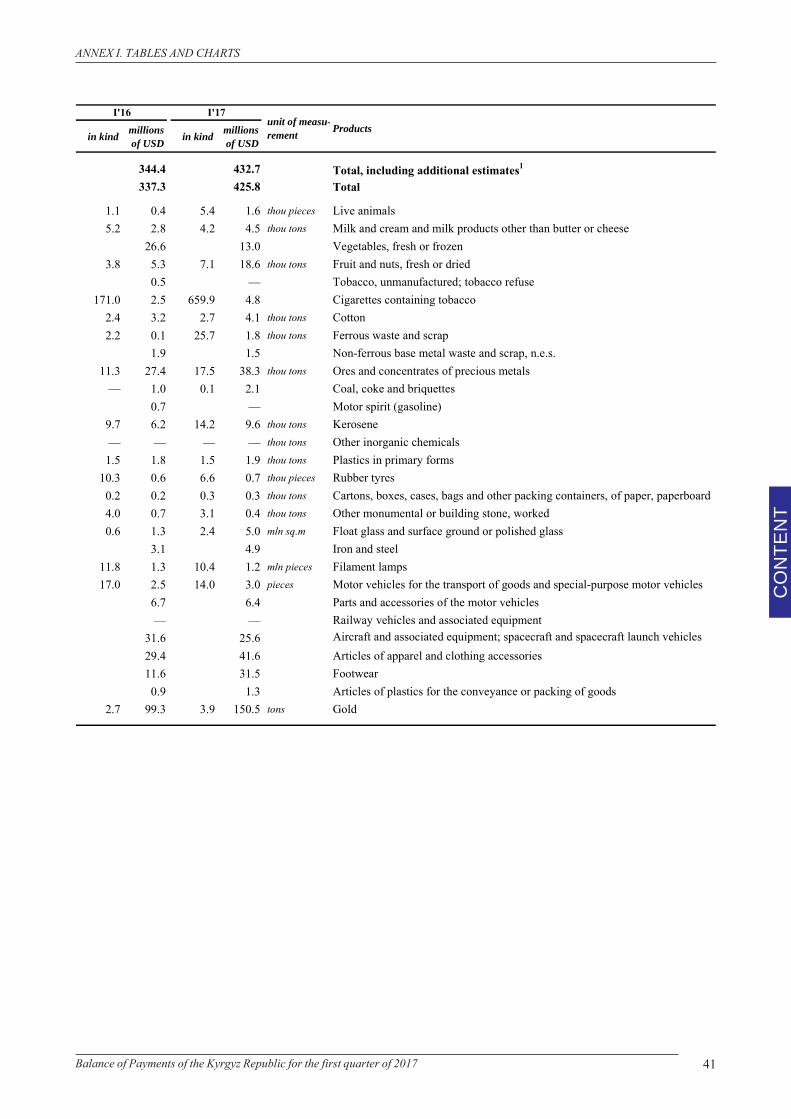
41Balance of Payments of the Kyrgyz Republic for the first quarter of 2017
CO
NTE
NT
ANNEX I. TABLES AND CHARTS
in kind millions of USD in kind millions
of USD
344.4 432.7 Total, including additional estimates1
337.3 425.8 Total
1.1 0.4 5.4 1.6 thou pieces Live animals5.2 2.8 4.2 4.5 thou tons Milk and cream and milk products other than butter or cheese
26.6 13.0 Vegetables, fresh or frozen3.8 5.3 7.1 18.6 thou tons Fruit and nuts, fresh or dried
0.5 — Tobacco, unmanufactured; tobacco refuse171.0 2.5 659.9 4.8 Cigarettes containing tobacco
2.4 3.2 2.7 4.1 thou tons Cotton2.2 0.1 25.7 1.8 thou tons Ferrous waste and scrap
1.9 1.5 Non-ferrous base metal waste and scrap, n.e.s.11.3 27.4 17.5 38.3 thou tons Ores and concentrates of precious metals
— 1.0 0.1 2.1 Coal, coke and briquettes0.7 — Motor spirit (gasoline)
9.7 6.2 14.2 9.6 thou tons Kerosene— — — — thou tons Other inorganic chemicals
1.5 1.8 1.5 1.9 thou tons Plastics in primary forms10.3 0.6 6.6 0.7 thou pieces Rubber tyres
0.2 0.2 0.3 0.3 thou tons Cartons, boxes, cases, bags and other packing containers, of paper, paperboard4.0 0.7 3.1 0.4 thou tons Other monumental or building stone, worked0.6 1.3 2.4 5.0 mln sq.m Float glass and surface ground or polished glass
3.1 4.9 Iron and steel11.8 1.3 10.4 1.2 mln pieces Filament lamps 17.0 2.5 14.0 3.0 pieces Motor vehicles for the transport of goods and special-purpose motor vehicles
6.7 6.4 Parts and accessories of the motor vehicles— — Railway vehicles and associated equipment
31.6 25.6 Aircraft and associated equipment; spacecraft and spacecraft launch vehicles29.4 41.6 Articles of apparel and clothing accessories11.6 31.5 Footwear0.9 1.3 Articles of plastics for the conveyance or packing of goods
2.7 99.3 3.9 150.5 tons Gold
I'17unit of measu-rement Products
I'16
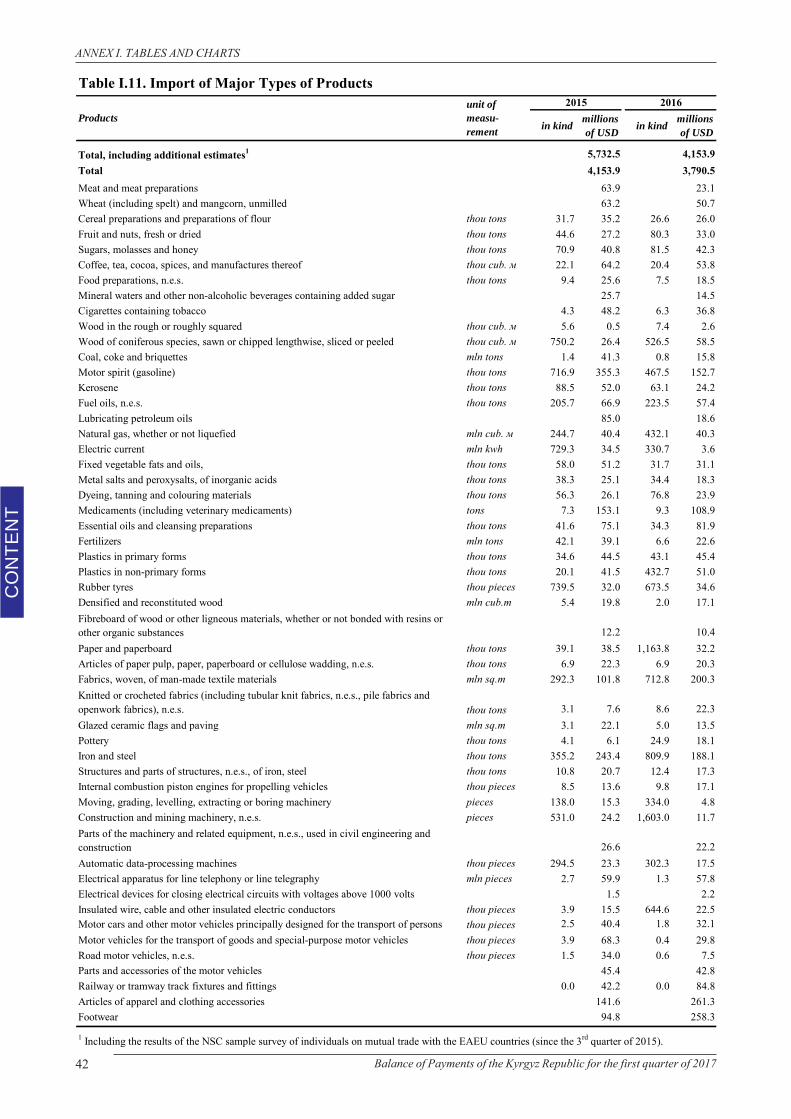
42 Balance of Payments of the Kyrgyz Republic for the first quarter of 2017
CO
NTE
NT
ANNEX I. TABLES AND CHARTS
Table I.11. Import of Major Types of Products
in kind millions of USD in kind millions
of USD
Total, including additional estimates1 5,732.5 4,153.9Total 4,153.9 3,790.5Meat and meat preparations 63.9 23.1Wheat (including spelt) and mangcorn, unmilled 63.2 50.7Cereal preparations and preparations of flour thou tons 31.7 35.2 26.6 26.0Fruit and nuts, fresh or dried thou tons 44.6 27.2 80.3 33.0Sugars, molasses and honey thou tons 70.9 40.8 81.5 42.3Coffee, tea, cocoa, spices, and manufactures thereof thou cub. м 22.1 64.2 20.4 53.8Food preparations, n.e.s. thou tons 9.4 25.6 7.5 18.5Mineral waters and other non-alcoholic beverages containing added sugar 25.7 14.5Cigarettes containing tobacco 4.3 48.2 6.3 36.8Wood in the rough or roughly squared thou cub. м 5.6 0.5 7.4 2.6Wood of coniferous species, sawn or chipped lengthwise, sliced or peeled thou cub. м 750.2 26.4 526.5 58.5Coal, coke and briquettes mln tons 1.4 41.3 0.8 15.8Motor spirit (gasoline) thou tons 716.9 355.3 467.5 152.7Kerosene thou tons 88.5 52.0 63.1 24.2Fuel oils, n.e.s. thou tons 205.7 66.9 223.5 57.4Lubricating petroleum oils 85.0 18.6Natural gas, whether or not liquefied mln cub. м 244.7 40.4 432.1 40.3Electric current mln kwh 729.3 34.5 330.7 3.6Fixed vegetable fats and oils, thou tons 58.0 51.2 31.7 31.1Metal salts and peroxysalts, of inorganic acids thou tons 38.3 25.1 34.4 18.3Dyeing, tanning and colouring materials thou tons 56.3 26.1 76.8 23.9Medicaments (including veterinary medicaments) tons 7.3 153.1 9.3 108.9Essential oils and cleansing preparations thou tons 41.6 75.1 34.3 81.9Fertilizers mln tons 42.1 39.1 6.6 22.6Plastics in primary forms thou tons 34.6 44.5 43.1 45.4Plastics in non-primary forms thou tons 20.1 41.5 432.7 51.0Rubber tyres thou pieces 739.5 32.0 673.5 34.6Densified and reconstituted wood mln cub.m 5.4 19.8 2.0 17.1Fibreboard of wood or other ligneous materials, whether or not bonded with resins or other organic substances 12.2 10.4Paper and paperboard thou tons 39.1 38.5 1,163.8 32.2Articles of paper pulp, paper, paperboard or cellulose wadding, n.e.s. thou tons 6.9 22.3 6.9 20.3Fabrics, woven, of man-made textile materials mln sq.m 292.3 101.8 712.8 200.3Knitted or crocheted fabrics (including tubular knit fabrics, n.e.s., pile fabrics and openwork fabrics), n.e.s. thou tons 3.1 7.6 8.6 22.3Glazed ceramic flags and paving mln sq.m 3.1 22.1 5.0 13.5Pottery thou tons 4.1 6.1 24.9 18.1Iron and steel thou tons 355.2 243.4 809.9 188.1Structures and parts of structures, n.e.s., of iron, steel thou tons 10.8 20.7 12.4 17.3Internal combustion piston engines for propelling vehicles thou pieces 8.5 13.6 9.8 17.1Moving, grading, levelling, extracting or boring machinery pieces 138.0 15.3 334.0 4.8Construction and mining machinery, n.e.s. pieces 531.0 24.2 1,603.0 11.7Parts of the machinery and related equipment, n.e.s., used in civil engineering and construction 26.6 22.2Automatic data-processing machines thou pieces 294.5 23.3 302.3 17.5Electrical apparatus for line telephony or line telegraphy mln pieces 2.7 59.9 1.3 57.8Electrical devices for closing electrical circuits with voltages above 1000 volts 1.5 2.2Insulated wire, cable and other insulated electric conductors thou pieces 3.9 15.5 644.6 22.5Motor cars and other motor vehicles principally designed for the transport of persons thou pieces 2.5 40.4 1.8 32.1Motor vehicles for the transport of goods and special-purpose motor vehicles thou pieces 3.9 68.3 0.4 29.8Road motor vehicles, n.e.s. thou pieces 1.5 34.0 0.6 7.5Parts and accessories of the motor vehicles 45.4 42.8Railway or tramway track fixtures and fittings 0.0 42.2 0.0 84.8Articles of apparel and clothing accessories 141.6 261.3Footwear 94.8 258.3
1 Including the results of the NSC sample survey of individuals on mutual trade with the EAEU countries (since the 3rd quarter of 2015).
2015 2016Products
unit of measu-rement
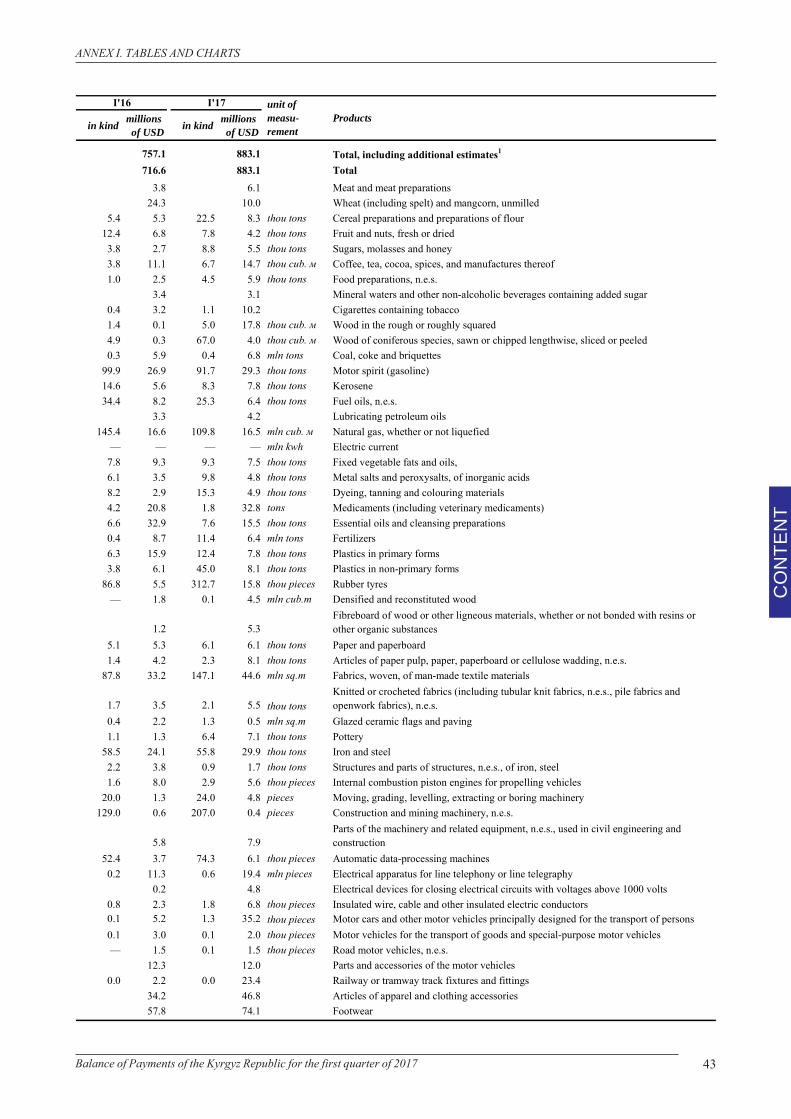
43Balance of Payments of the Kyrgyz Republic for the first quarter of 2017
CO
NTE
NT
ANNEX I. TABLES AND CHARTS
in kind millions of USD in kind millions
of USD
757.1 883.1 Total, including additional estimates1
716.6 883.1 Total3.8 6.1 Meat and meat preparations
24.3 10.0 Wheat (including spelt) and mangcorn, unmilled5.4 5.3 22.5 8.3 thou tons Cereal preparations and preparations of flour
12.4 6.8 7.8 4.2 thou tons Fruit and nuts, fresh or dried3.8 2.7 8.8 5.5 thou tons Sugars, molasses and honey3.8 11.1 6.7 14.7 thou cub. м Coffee, tea, cocoa, spices, and manufactures thereof1.0 2.5 4.5 5.9 thou tons Food preparations, n.e.s.
3.4 3.1 Mineral waters and other non-alcoholic beverages containing added sugar0.4 3.2 1.1 10.2 Cigarettes containing tobacco1.4 0.1 5.0 17.8 thou cub. м Wood in the rough or roughly squared4.9 0.3 67.0 4.0 thou cub. м Wood of coniferous species, sawn or chipped lengthwise, sliced or peeled0.3 5.9 0.4 6.8 mln tons Coal, coke and briquettes
99.9 26.9 91.7 29.3 thou tons Motor spirit (gasoline)14.6 5.6 8.3 7.8 thou tons Kerosene34.4 8.2 25.3 6.4 thou tons Fuel oils, n.e.s.
3.3 4.2 Lubricating petroleum oils 145.4 16.6 109.8 16.5 mln cub. м Natural gas, whether or not liquefied
— — — — mln kwh Electric current7.8 9.3 9.3 7.5 thou tons Fixed vegetable fats and oils, 6.1 3.5 9.8 4.8 thou tons Metal salts and peroxysalts, of inorganic acids8.2 2.9 15.3 4.9 thou tons Dyeing, tanning and colouring materials4.2 20.8 1.8 32.8 tons Medicaments (including veterinary medicaments)6.6 32.9 7.6 15.5 thou tons Essential oils and cleansing preparations0.4 8.7 11.4 6.4 mln tons Fertilizers 6.3 15.9 12.4 7.8 thou tons Plastics in primary forms3.8 6.1 45.0 8.1 thou tons Plastics in non-primary forms
86.8 5.5 312.7 15.8 thou pieces Rubber tyres— 1.8 0.1 4.5 mln cub.m Densified and reconstituted wood
1.2 5.3Fibreboard of wood or other ligneous materials, whether or not bonded with resins or other organic substances
5.1 5.3 6.1 6.1 thou tons Paper and paperboard1.4 4.2 2.3 8.1 thou tons Articles of paper pulp, paper, paperboard or cellulose wadding, n.e.s.
87.8 33.2 147.1 44.6 mln sq.m Fabrics, woven, of man-made textile materials
1.7 3.5 2.1 5.5 thou tonsKnitted or crocheted fabrics (including tubular knit fabrics, n.e.s., pile fabrics and openwork fabrics), n.e.s.
0.4 2.2 1.3 0.5 mln sq.m Glazed ceramic flags and paving1.1 1.3 6.4 7.1 thou tons Pottery
58.5 24.1 55.8 29.9 thou tons Iron and steel2.2 3.8 0.9 1.7 thou tons Structures and parts of structures, n.e.s., of iron, steel1.6 8.0 2.9 5.6 thou pieces Internal combustion piston engines for propelling vehicles
20.0 1.3 24.0 4.8 pieces Moving, grading, levelling, extracting or boring machinery129.0 0.6 207.0 0.4 pieces Construction and mining machinery, n.e.s.
5.8 7.9Parts of the machinery and related equipment, n.e.s., used in civil engineering and construction
52.4 3.7 74.3 6.1 thou pieces Automatic data-processing machines0.2 11.3 0.6 19.4 mln pieces Electrical apparatus for line telephony or line telegraphy
0.2 4.8 Electrical devices for closing electrical circuits with voltages above 1000 volts0.8 2.3 1.8 6.8 thou pieces Insulated wire, cable and other insulated electric conductors0.1 5.2 1.3 35.2 thou pieces Motor cars and other motor vehicles principally designed for the transport of persons0.1 3.0 0.1 2.0 thou pieces Motor vehicles for the transport of goods and special-purpose motor vehicles— 1.5 0.1 1.5 thou pieces Road motor vehicles, n.e.s.
12.3 12.0 Parts and accessories of the motor vehicles0.0 2.2 0.0 23.4 Railway or tramway track fixtures and fittings
34.2 46.8 Articles of apparel and clothing accessories57.8 74.1 Footwear
I'16 I'17Products
unit of measu-rement
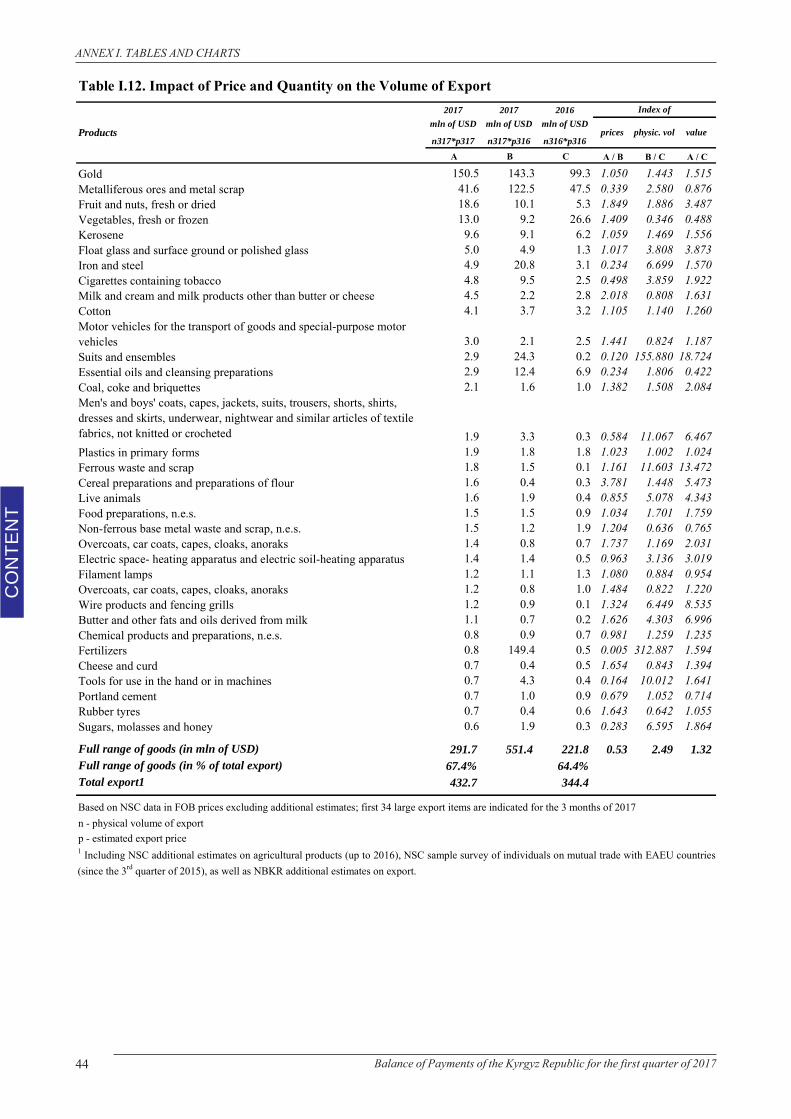
44 Balance of Payments of the Kyrgyz Republic for the first quarter of 2017
CO
NTE
NT
ANNEX I. TABLES AND CHARTS
Table I.12. Impact of Price and Quantity on the Volume of Export2017 2017 2016
mln of USD mln of USD mln of USD
n317*p317 n317*p316 n316*p316A B C A / B B / C A / C
Gold 150.5 143.3 99.3 1.050 1.443 1.515Metalliferous ores and metal scrap 41.6 122.5 47.5 0.339 2.580 0.876Fruit and nuts, fresh or dried 18.6 10.1 5.3 1.849 1.886 3.487Vegetables, fresh or frozen 13.0 9.2 26.6 1.409 0.346 0.488Kerosene 9.6 9.1 6.2 1.059 1.469 1.556Float glass and surface ground or polished glass 5.0 4.9 1.3 1.017 3.808 3.873Iron and steel 4.9 20.8 3.1 0.234 6.699 1.570Cigarettes containing tobacco 4.8 9.5 2.5 0.498 3.859 1.922Milk and cream and milk products other than butter or cheese 4.5 2.2 2.8 2.018 0.808 1.631Cotton 4.1 3.7 3.2 1.105 1.140 1.260Motor vehicles for the transport of goods and special-purpose motor vehicles 3.0 2.1 2.5 1.441 0.824 1.187Suits and ensembles 2.9 24.3 0.2 0.120 155.880 18.724Essential oils and cleansing preparations 2.9 12.4 6.9 0.234 1.806 0.422Coal, coke and briquettes 2.1 1.6 1.0 1.382 1.508 2.084Men's and boys' coats, capes, jackets, suits, trousers, shorts, shirts, dresses and skirts, underwear, nightwear and similar articles of textile fabrics, not knitted or crocheted 1.9 3.3 0.3 0.584 11.067 6.467Plastics in primary forms 1.9 1.8 1.8 1.023 1.002 1.024Ferrous waste and scrap 1.8 1.5 0.1 1.161 11.603 13.472Cereal preparations and preparations of flour 1.6 0.4 0.3 3.781 1.448 5.473Live animals 1.6 1.9 0.4 0.855 5.078 4.343Food preparations, n.e.s. 1.5 1.5 0.9 1.034 1.701 1.759Non-ferrous base metal waste and scrap, n.e.s. 1.5 1.2 1.9 1.204 0.636 0.765Overcoats, car coats, capes, cloaks, anoraks 1.4 0.8 0.7 1.737 1.169 2.031Electric space- heating apparatus and electric soil-heating apparatus 1.4 1.4 0.5 0.963 3.136 3.019Filament lamps 1.2 1.1 1.3 1.080 0.884 0.954Overcoats, car coats, capes, cloaks, anoraks 1.2 0.8 1.0 1.484 0.822 1.220Wire products and fencing grills 1.2 0.9 0.1 1.324 6.449 8.535Butter and other fats and oils derived from milk 1.1 0.7 0.2 1.626 4.303 6.996Chemical products and preparations, n.e.s. 0.8 0.9 0.7 0.981 1.259 1.235Fertilizers 0.8 149.4 0.5 0.005 312.887 1.594Cheese and curd 0.7 0.4 0.5 1.654 0.843 1.394Tools for use in the hand or in machines 0.7 4.3 0.4 0.164 10.012 1.641Portland cement 0.7 1.0 0.9 0.679 1.052 0.714Rubber tyres 0.7 0.4 0.6 1.643 0.642 1.055Sugars, molasses and honey 0.6 1.9 0.3 0.283 6.595 1.864
Full range of goods (in mln of USD) 291.7 551.4 221.8 0.53 2.49 1.32Full range of goods (in % of total export) 67.4% 64.4%Total export1 432.7 344.4
n - physical volume of exportp - estimated export price
physic. vol valueprices
Index of
Based on NSC data in FOB prices excluding additional estimates; first 34 large export items are indicated for the 3 months of 2017
1 Including NSC additional estimates on agricultural products (up to 2016), NSC sample survey of individuals on mutual trade with EAEU countries(since the 3rd quarter of 2015), as well as NBKR additional estimates on export.
Products
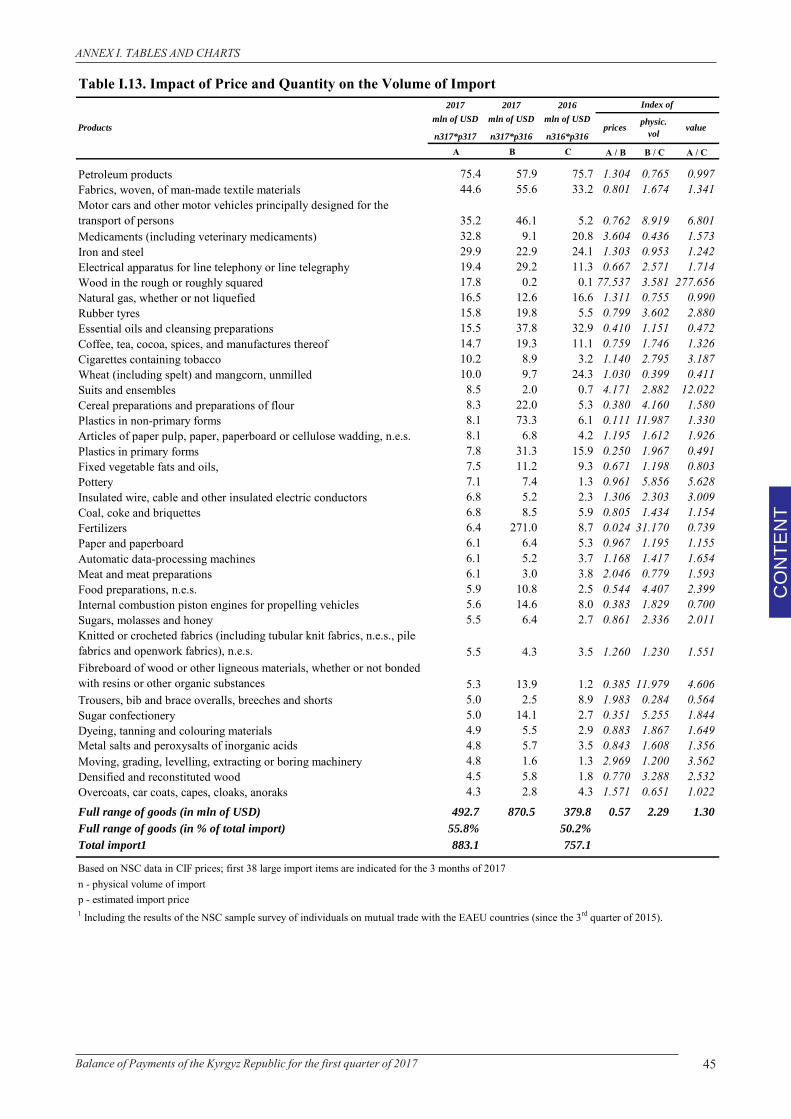
45Balance of Payments of the Kyrgyz Republic for the first quarter of 2017
CO
NTE
NT
ANNEX I. TABLES AND CHARTS
Table I.13. Impact of Price and Quantity on the Volume of Import2017 2017 2016
mln of USD mln of USD mln of USD
n317*p317 n317*p316 n316*p316A B C A / B B / C A / C
Petroleum products 75.4 57.9 75.7 1.304 0.765 0.997Fabrics, woven, of man-made textile materials 44.6 55.6 33.2 0.801 1.674 1.341Motor cars and other motor vehicles principally designed for the transport of persons 35.2 46.1 5.2 0.762 8.919 6.801Medicaments (including veterinary medicaments) 32.8 9.1 20.8 3.604 0.436 1.573Iron and steel 29.9 22.9 24.1 1.303 0.953 1.242Electrical apparatus for line telephony or line telegraphy 19.4 29.2 11.3 0.667 2.571 1.714Wood in the rough or roughly squared 17.8 0.2 0.1 77.537 3.581 277.656Natural gas, whether or not liquefied 16.5 12.6 16.6 1.311 0.755 0.990Rubber tyres 15.8 19.8 5.5 0.799 3.602 2.880Essential oils and cleansing preparations 15.5 37.8 32.9 0.410 1.151 0.472Coffee, tea, cocoa, spices, and manufactures thereof 14.7 19.3 11.1 0.759 1.746 1.326Cigarettes containing tobacco 10.2 8.9 3.2 1.140 2.795 3.187Wheat (including spelt) and mangcorn, unmilled 10.0 9.7 24.3 1.030 0.399 0.411Suits and ensembles 8.5 2.0 0.7 4.171 2.882 12.022Cereal preparations and preparations of flour 8.3 22.0 5.3 0.380 4.160 1.580Plastics in non-primary forms 8.1 73.3 6.1 0.111 11.987 1.330Articles of paper pulp, paper, paperboard or cellulose wadding, n.e.s. 8.1 6.8 4.2 1.195 1.612 1.926Plastics in primary forms 7.8 31.3 15.9 0.250 1.967 0.491Fixed vegetable fats and oils, 7.5 11.2 9.3 0.671 1.198 0.803Pottery 7.1 7.4 1.3 0.961 5.856 5.628Insulated wire, cable and other insulated electric conductors 6.8 5.2 2.3 1.306 2.303 3.009Coal, coke and briquettes 6.8 8.5 5.9 0.805 1.434 1.154Fertilizers 6.4 271.0 8.7 0.024 31.170 0.739Paper and paperboard 6.1 6.4 5.3 0.967 1.195 1.155Automatic data-processing machines 6.1 5.2 3.7 1.168 1.417 1.654Meat and meat preparations 6.1 3.0 3.8 2.046 0.779 1.593Food preparations, n.e.s. 5.9 10.8 2.5 0.544 4.407 2.399Internal combustion piston engines for propelling vehicles 5.6 14.6 8.0 0.383 1.829 0.700Sugars, molasses and honey 5.5 6.4 2.7 0.861 2.336 2.011Knitted or crocheted fabrics (including tubular knit fabrics, n.e.s., pile fabrics and openwork fabrics), n.e.s. 5.5 4.3 3.5 1.260 1.230 1.551Fibreboard of wood or other ligneous materials, whether or not bonded with resins or other organic substances 5.3 13.9 1.2 0.385 11.979 4.606Trousers, bib and brace overalls, breeches and shorts 5.0 2.5 8.9 1.983 0.284 0.564Sugar confectionery 5.0 14.1 2.7 0.351 5.255 1.844Dyeing, tanning and colouring materials 4.9 5.5 2.9 0.883 1.867 1.649Metal salts and peroxysalts of inorganic acids 4.8 5.7 3.5 0.843 1.608 1.356Moving, grading, levelling, extracting or boring machinery 4.8 1.6 1.3 2.969 1.200 3.562Densified and reconstituted wood 4.5 5.8 1.8 0.770 3.288 2.532Overcoats, car coats, capes, cloaks, anoraks 4.3 2.8 4.3 1.571 0.651 1.022
Full range of goods (in mln of USD) 492.7 870.5 379.8 0.57 2.29 1.30Full range of goods (in % of total import) 55.8% 50.2%Total import1 883.1 757.1
n - physical volume of importp - estimated import price
Based on NSC data in CIF prices; first 38 large import items are indicated for the 3 months of 2017
prices physic. vol
value
1 Including the results of the NSC sample survey of individuals on mutual trade with the EAEU countries (since the 3rd quarter of 2015).
Products
Index of
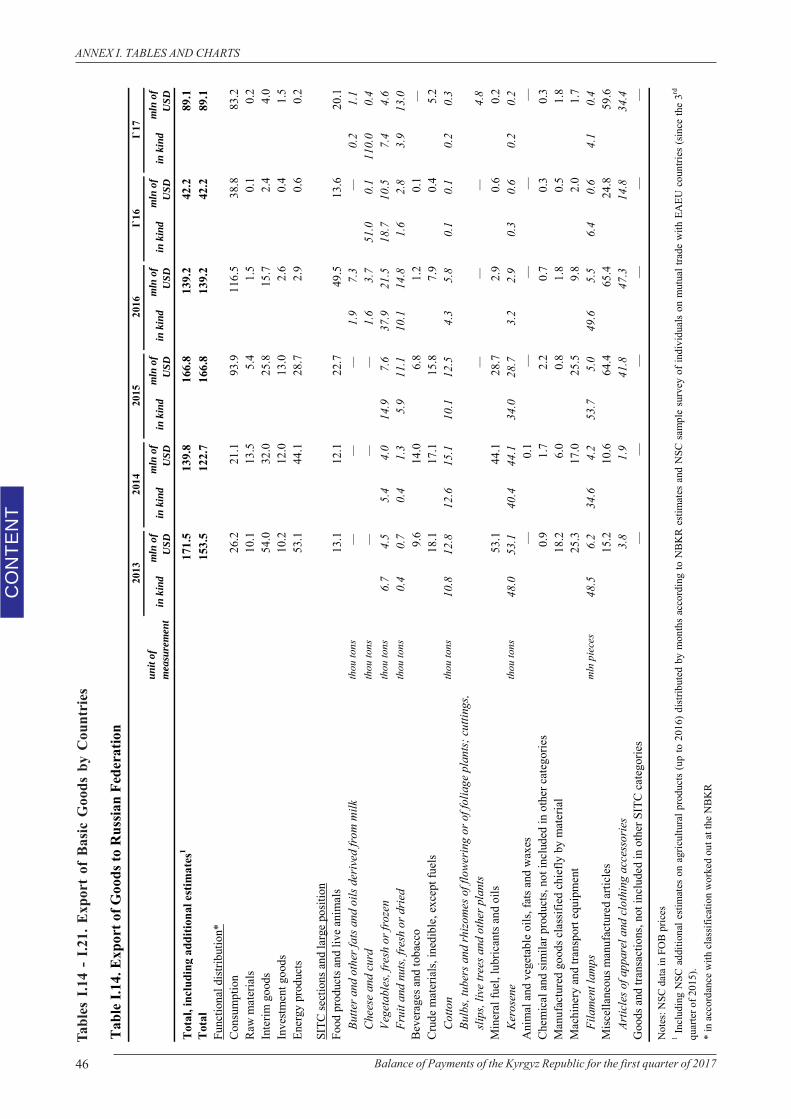
46 Balance of Payments of the Kyrgyz Republic for the first quarter of 2017
CO
NTE
NT
ANNEX I. TABLES AND CHARTS
Tabl
es I
.14
- I.2
1. E
xpor
t of
Bas
ic G
oods
by
Cou
ntri
es
Tabl
e I.1
4. E
xpor
t of G
oods
to R
ussia
n Fe
dera
tion
unit
of
mea
sure
men
tin
kin
dm
ln o
f U
SDin
kin
dm
ln o
f U
SDin
kin
dm
ln o
f U
SDin
kin
dm
ln o
f U
SDin
kin
dm
ln o
f U
SDin
kin
dm
ln o
f U
SD
Tota
l, in
clud
ing
addi
tiona
l est
imat
es1
171.
513
9.8
166.
813
9.2
42.2
89.1
Tota
l15
3.5
122.
716
6.8
139.
242
.289
.1Fu
nctio
nal d
istrib
utio
n*Co
nsum
ptio
n26
.221
.193
.911
6.5
38.8
83.2
Raw
mat
eria
ls10
.113
.55.
41.
50.
10.
2In
terim
goo
ds54
.032
.025
.815
.72.
44.
0In
vestm
ent g
oods
10.2
12.0
13.0
2.6
0.4
1.5
Ener
gy p
rodu
cts
53.1
44.1
28.7
2.9
0.6
0.2
SITC
sect
ions
and
larg
e po
sitio
nFo
od p
rodu
cts a
nd li
ve a
nim
als
13.1
12.1
22.7
49.5
13.6
20.1
Butte
r and
oth
er fa
ts a
nd o
ils d
eriv
ed fr
om m
ilkth
ou to
ns—
——
1.9
7.3
—0.
21.
1C
hees
e an
d cu
rdth
ou to
ns—
——
1.6
3.7
51.0
0.1
110.
00.
4Ve
geta
bles
, fre
sh o
r fro
zen
thou
tons
6.7
4.5
5.4
4.0
14.9
7.6
37.9
21.5
18.7
10.5
7.4
4.6
Frui
t and
nut
s, fr
esh
or d
ried
thou
tons
0.4
0.7
0.4
1.3
5.9
11.1
10.1
14.8
1.6
2.8
3.9
13.0
Beve
rage
s and
toba
cco
9.6
14.0
6.8
1.2
0.1
—Cr
ude
mat
eria
ls, in
edib
le, e
xcep
t fue
ls18
.117
.115
.87.
90.
45.
2C
otto
nth
ou to
ns10
.812
.812
.615
.110
.112
.54.
35.
80.
10.
10.
20.
3Bu
lbs,
tube
rs a
nd rh
izom
es o
f flo
wer
ing
or o
f fol
iage
pla
nts;
cut
tings
, sl
ips,
live
tree
s and
oth
er p
lant
s—
——
4.8
Min
eral
fuel
, lub
rican
ts an
d oi
ls53
.144
.128
.72.
90.
60.
2Ke
rose
neth
ou to
ns48
.053
.140
.444
.134
.028
.73.
22.
90.
30.
60.
20.
2A
nim
al a
nd v
eget
able
oils
, fat
s and
wax
es—
0.1
——
——
Chem
ical
and
sim
ilar p
rodu
cts,
not i
nclu
ded
in o
ther
cat
egor
ies
0.9
1.7
2.2
0.7
0.3
0.3
Man
ufac
ture
d go
ods c
lass
ified
chi
efly
by
mat
eria
l18
.26.
00.
81.
80.
51.
8M
achi
nery
and
tran
spor
t equ
ipm
ent
25.3
17.0
25.5
9.8
2.0
1.7
Fila
men
t lam
ps
mln
pie
ces
48.5
6.2
34.6
4.2
53.7
5.0
49.6
5.5
6.4
0.6
4.1
0.4
Misc
ella
neou
s man
ufac
ture
d ar
ticle
s15
.210
.664
.465
.424
.859
.6Ar
ticle
s of a
ppar
el a
nd c
loth
ing
acce
ssor
ies
3.8
1.9
41.8
47.3
14.8
34.4
Goo
ds a
nd tr
ansa
ctio
ns, n
ot in
clud
ed in
oth
er S
ITC
cate
gorie
s—
——
——
—
Not
es: N
SC d
ata
in F
OB
pric
es
* in
acc
orda
nce
with
cla
ssifi
catio
n w
orke
d ou
t at t
he N
BK
R
I`17
2013
2014
1In
clud
ing
NSC
addi
tiona
lest
imat
eson
agric
ultu
ralp
rodu
cts
(up
to20
16)d
istrib
uted
bym
onth
sac
cord
ing
toN
BKR
estim
ates
and
NSC
sam
ple
surv
eyof
indi
vidu
als
onm
utua
ltra
dew
ithEA
EUco
untri
es(s
ince
the
3rd
quar
ter o
f 201
5).
2015
2016
I`16
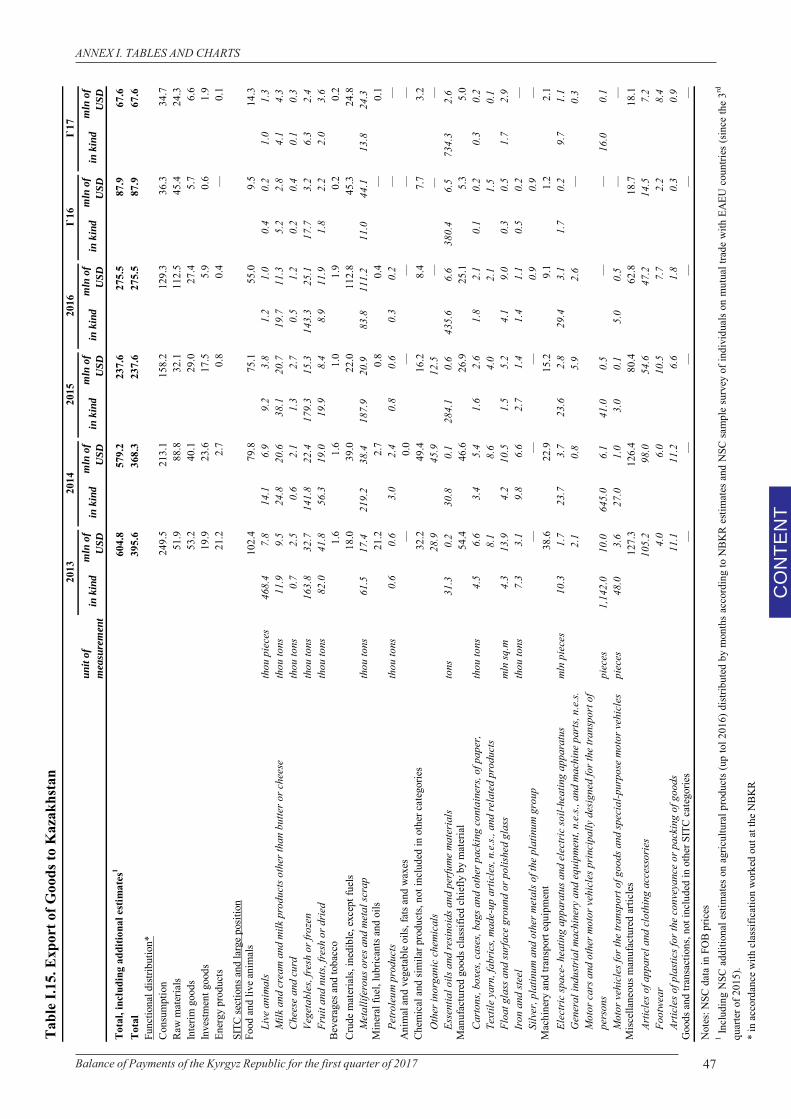
47Balance of Payments of the Kyrgyz Republic for the first quarter of 2017
CO
NTE
NT
ANNEX I. TABLES AND CHARTSTa
ble
I.15.
Exp
ort o
f Goo
ds to
Kaz
akhs
tan
unit
of
mea
sure
men
tin
kin
dm
ln o
f U
SDin
kin
dm
ln o
f U
SDin
kin
dm
ln o
f U
SDin
kin
dm
ln o
f U
SDin
kin
dm
ln o
f U
SDin
kin
dm
ln o
f U
SD
Tota
l, in
clud
ing
addi
tiona
l est
imat
es1
604.
857
9.2
237.
627
5.5
87.9
67.6
Tota
l39
5.6
368.
323
7.6
275.
587
.967
.6Fu
nctio
nal d
istrib
utio
n*Co
nsum
ptio
n24
9.5
213.
115
8.2
129.
336
.334
.7Ra
w m
ater
ials
51.9
88.8
32.1
112.
545
.424
.3In
terim
goo
ds53
.240
.129
.027
.45.
76.
6In
vestm
ent g
oods
19.9
23.6
17.5
5.9
0.6
1.9
Ener
gy p
rodu
cts
21.2
2.7
0.8
0.4
—0.
1SI
TC se
ctio
ns a
nd la
rge
posit
ion
Food
and
live
ani
mal
s10
2.4
79.8
75.1
55.0
9.5
14.3
Live
ani
mal
sth
ou p
iece
s46
8.4
7.8
14.1
6.9
9.2
3.8
1.2
1.0
0.4
0.2
1.0
1.3
Milk
and
cre
am a
nd m
ilk p
rodu
cts o
ther
than
but
ter o
r che
ese
thou
tons
11.9
9.5
24.8
20.6
38.1
20.7
19.7
11.3
5.2
2.8
4.1
4.3
Che
ese
and
curd
thou
tons
0.7
2.5
0.6
2.1
1.3
2.7
0.5
1.2
0.2
0.4
0.1
0.3
Vege
tabl
es, f
resh
or f
roze
nth
ou to
ns16
3.8
32.7
141.
822
.417
9.3
15.3
143.
325
.117
.73.
26.
32.
4Fr
uit a
nd n
uts,
fres
h or
dri
edth
ou to
ns82
.041
.856
.319
.019
.98.
48.
911
.91.
82.
22.
03.
6Be
vera
ges a
nd to
bacc
o1.
61.
61.
01.
90.
20.
2Cr
ude
mat
eria
ls, in
edib
le, e
xcep
t fue
ls18
.039
.022
.011
2.8
45.3
24.8
Met
allif
erou
s ore
s and
met
al sc
rap
thou
tons
61.5
17.4
219.
238
.418
7.9
20.9
83.8
111.
211
.044
.113
.824
.3M
iner
al fu
el, l
ubric
ants
and
oils
21.2
2.7
0.8
0.4
—0.
1Pe
trol
eum
pro
duct
sth
ou to
ns0.
60.
63.
02.
40.
80.
60.
30.
2—
—A
nim
al a
nd v
eget
able
oils
, fat
s and
wax
es—
0.0
——
——
Chem
ical
and
sim
ilar p
rodu
cts,
not i
nclu
ded
in o
ther
cat
egor
ies
32.2
49.4
16.2
8.4
7.7
3.2
Oth
er in
orga
nic
chem
ical
s28
.945
.912
.5—
——
Esse
ntia
l oils
and
resi
noid
s and
per
fum
e m
ater
ials
tons
31.3
0.2
30.8
0.1
284.
10.
643
5.6
6.6
380.
46.
573
4.3
2.6
Man
ufac
ture
d go
ods c
lass
ified
chi
efly
by
mat
eria
l54
.446
.626
.925
.15.
35.
0C
arto
ns, b
oxes
, cas
es, b
ags a
nd o
ther
pac
king
con
tain
ers,
of p
aper
, th
ou to
ns4.
56.
63.
45.
41.
62.
61.
82.
10.
10.
20.
30.
2Te
xtile
yar
n, fa
bric
s, m
ade-
up a
rtic
les,
n.e.
s., a
nd re
late
d pr
oduc
ts8.
18.
64.
02.
11.
50.
1Fl
oat g
lass
and
surf
ace
grou
nd o
r pol
ishe
d gl
ass
mln
sq.m
4.3
13.9
4.2
10.5
1.5
5.2
4.1
9.0
0.3
0.5
1.7
2.9
Iron
and
stee
lth
ou to
ns7.
33.
19.
86.
62.
71.
41.
41.
10.
50.
2—
Silv
er, p
latin
um a
nd o
ther
met
als o
f the
pla
tinum
gro
up—
——
0.9
0.9
—M
achi
nery
and
tran
spor
t equ
ipm
ent
38.6
22.9
15.2
9.1
1.2
2.1
Elec
tric
spac
e- h
eatin
g ap
para
tus a
nd e
lect
ric
soil-
heat
ing
appa
ratu
sm
ln p
iece
s10
.31.
723
.73.
723
.62.
829
.43.
11.
70.
29.
71.
1G
ener
al in
dust
rial
mac
hine
ry a
nd e
quip
men
t, n.
e.s.,
and
mac
hine
par
ts, n
.e.s.
2.1
0.8
5.9
2.6
—0.
3M
otor
car
s and
oth
er m
otor
veh
icle
s pri
ncip
ally
des
igne
d fo
r the
tran
spor
t of
pers
ons
piec
es1,
142.
010
.064
5.0
6.1
41.0
0.5
——
16.0
0.1
Mot
or v
ehic
les f
or th
e tr
ansp
ort o
f goo
ds a
nd sp
ecia
l-pur
pose
mot
or v
ehic
les
piec
es48
.03.
627
.01.
03.
00.
15.
00.
5—
—M
isce
llane
ous m
anuf
actu
red
artic
les
127.
312
6.4
80.4
62.8
18.7
18.1
Artic
les o
f app
arel
and
clo
thin
g ac
cess
orie
s10
5.2
98.0
54.6
47.2
14.5
7.2
Foot
wea
r4.
06.
010
.57.
72.
28.
4Ar
ticle
s of p
last
ics f
or th
e co
nvey
ance
or p
acki
ng o
f goo
ds11
.111
.26.
61.
80.
30.
9G
oods
and
tran
sact
ions
, not
incl
uded
in o
ther
SIT
C ca
tego
ries
——
——
——
Not
es: N
SC d
ata
in F
OB
pric
es
* in
acc
orda
nce
with
cla
ssifi
catio
n w
orke
d ou
t at t
he N
BKR
1In
clud
ing
NSC
addi
tiona
lesti
mat
eson
agric
ultu
ralp
rodu
cts(
upto
l201
6)di
strib
uted
bym
onth
sac
cord
ing
toN
BKR
estim
ates
and
NSC
sam
ple
surv
eyof
indi
vidu
also
nm
utua
ltra
dew
ithEA
EUco
untri
es(s
ince
the
3rd
quar
ter o
f 201
5).
2013
2015
I`16
I`17
2016
2014
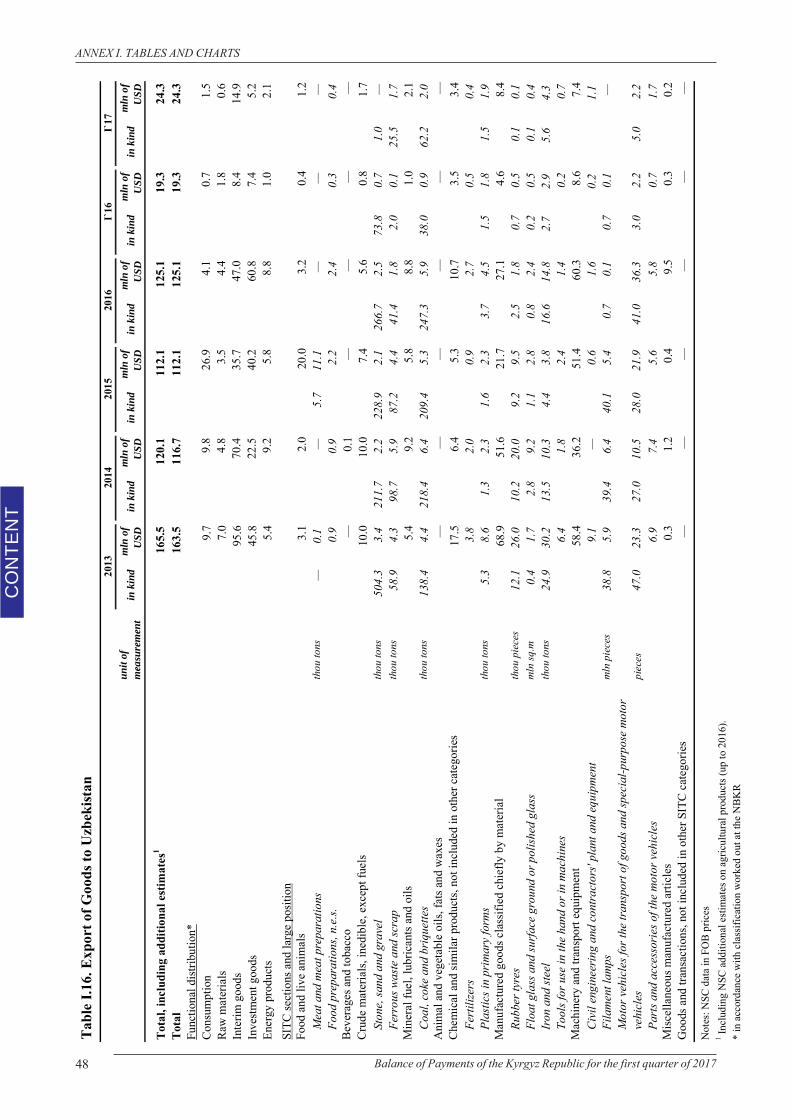
48 Balance of Payments of the Kyrgyz Republic for the first quarter of 2017
CO
NTE
NT
ANNEX I. TABLES AND CHARTS
Tabl
e I.1
6. E
xpor
t of G
oods
to U
zbek
istan
unit
of
mea
sure
men
tin
kin
dm
ln o
f U
SDin
kin
dm
ln o
f U
SDin
kin
dm
ln o
f U
SDin
kin
dm
ln o
f U
SDin
kin
dm
ln o
f U
SDin
kin
dm
ln o
f U
SD
Tota
l, in
clud
ing
addi
tiona
l est
imat
es1
165.
512
0.1
112.
112
5.1
19.3
24.3
Tota
l16
3.5
116.
711
2.1
125.
119
.324
.3Fu
nctio
nal d
istrib
utio
n*Co
nsum
ptio
n9.
79.
826
.94.
10.
71.
5Ra
w m
ater
ials
7.0
4.8
3.5
4.4
1.8
0.6
Inte
rim g
oods
95.6
70.4
35.7
47.0
8.4
14.9
Inve
stmen
t goo
ds45
.822
.540
.260
.87.
45.
2En
ergy
pro
duct
s5.
49.
25.
88.
81.
02.
1SI
TC se
ctio
ns a
nd la
rge
posit
ion
Food
and
live
ani
mal
s3.
12.
020
.03.
20.
41.
2M
eat a
nd m
eat p
repa
ratio
nsth
ou to
ns—
0.1
—5.
711
.1—
——
Food
pre
para
tions
, n.e
.s.0.
90.
92.
22.
40.
30.
4Be
vera
ges a
nd to
bacc
o—
0.1
——
——
Crud
e m
ater
ials,
ined
ible
, exc
ept f
uels
10.0
10.0
7.4
5.6
0.8
1.7
Ston
e, sa
nd a
nd g
rave
lth
ou to
ns50
4.3
3.4
211.
72.
222
8.9
2.1
266.
72.
573
.80.
71.
0—
Ferr
ous w
aste
and
scra
pth
ou to
ns58
.94.
398
.75.
987
.24.
441
.41.
82.
00.
125
.51.
7M
iner
al fu
el, l
ubric
ants
and
oils
5.4
9.2
5.8
8.8
1.0
2.1
Coa
l, co
ke a
nd b
riqu
ette
sth
ou to
ns13
8.4
4.4
218.
46.
420
9.4
5.3
247.
35.
938
.00.
962
.22.
0A
nim
al a
nd v
eget
able
oils
, fat
s and
wax
es—
——
——
—Ch
emic
al a
nd si
mila
r pro
duct
s, no
t inc
lude
d in
oth
er c
ateg
orie
s17
.56.
45.
310
.73.
53.
4Fe
rtili
zers
3.
82.
00.
92.
70.
50.
4Pl
astic
s in
prim
ary
form
sth
ou to
ns5.
38.
61.
32.
31.
62.
33.
74.
51.
51.
81.
51.
9M
anuf
actu
red
good
s cla
ssifi
ed c
hief
ly b
y m
ater
ial
68.9
51.6
21.7
27.1
4.6
8.4
Rubb
er ty
res
thou
pie
ces
12.1
26.0
10.2
20.0
9.2
9.5
2.5
1.8
0.7
0.5
0.1
0.1
Floa
t gla
ss a
nd su
rface
gro
und
or p
olis
hed
glas
sm
ln sq
.m0.
41.
72.
89.
21.
12.
80.
82.
40.
20.
50.
10.
4Ir
on a
nd st
eel
thou
tons
24.9
30.2
13.5
10.3
4.4
3.8
16.6
14.8
2.7
2.9
5.6
4.3
Tool
s for
use
in th
e ha
nd o
r in
mac
hine
s6.
41.
82.
41.
40.
20.
7M
achi
nery
and
tran
spor
t equ
ipm
ent
58.4
36.2
51.4
60.3
8.6
7.4
Civ
il en
gine
erin
g an
d co
ntra
ctor
s' pl
ant a
nd e
quip
men
t9.
1—
0.6
1.6
0.2
1.1
Fila
men
t lam
ps
mln
pie
ces
38.8
5.9
39.4
6.4
40.1
5.4
0.7
0.1
0.7
0.1
—M
otor
veh
icle
s for
the
tran
spor
t of g
oods
and
spec
ial-p
urpo
se m
otor
ve
hicl
espi
eces
47.0
23.3
27.0
10.5
28.0
21.9
41.0
36.3
3.0
2.2
5.0
2.2
Part
s and
acc
esso
ries
of t
he m
otor
veh
icle
s6.
97.
45.
65.
80.
71.
7M
iscel
lane
ous m
anuf
actu
red
artic
les
0.3
1.2
0.4
9.5
0.3
0.2
Goo
ds a
nd tr
ansa
ctio
ns, n
ot in
clud
ed in
oth
er S
ITC
cate
gorie
s—
——
——
—
Not
es: N
SC d
ata
in F
OB
pric
es
* in
acc
orda
nce
with
cla
ssifi
catio
n w
orke
d ou
t at t
he N
BKR
1 Incl
udin
g N
SC a
dditi
onal
esti
mat
es o
n ag
ricul
tura
l pro
duct
s (up
to 2
016)
.
I`16
I`17
2016
2014
2015
2013
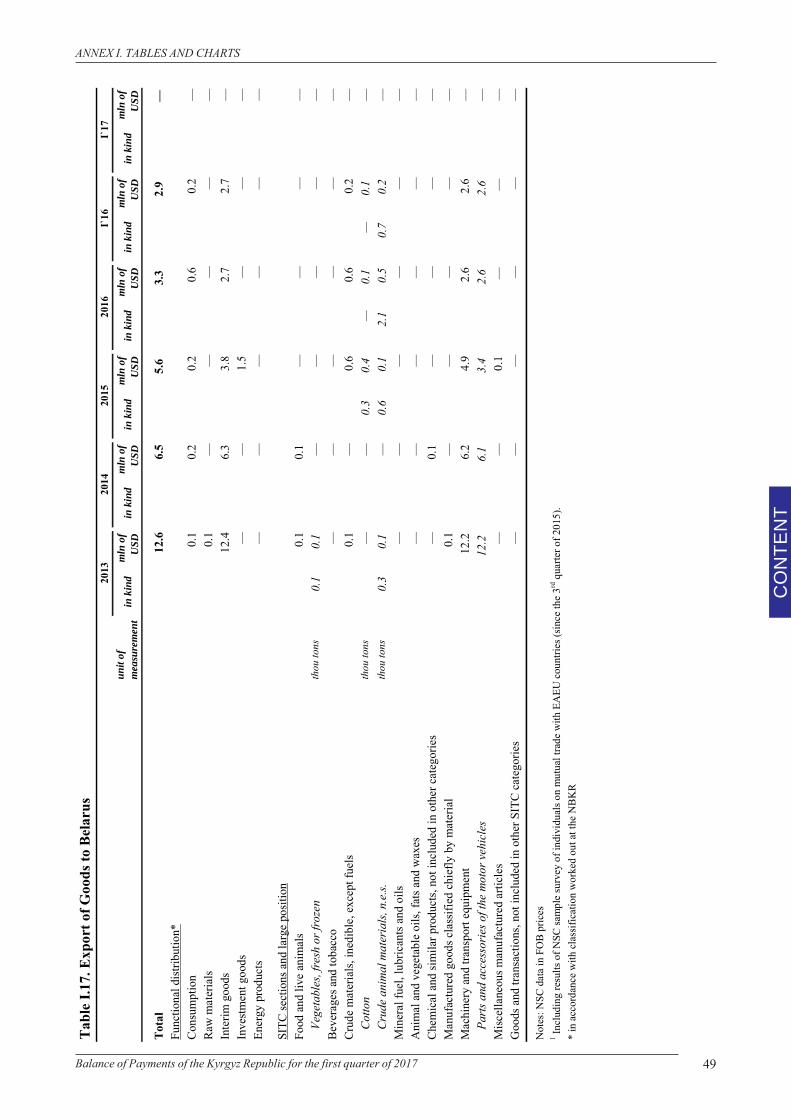
49Balance of Payments of the Kyrgyz Republic for the first quarter of 2017
CO
NTE
NT
ANNEX I. TABLES AND CHARTS
Tabl
e I.1
7. E
xpor
t of G
oods
to B
elar
us
unit
of
mea
sure
men
tin
kin
dm
ln o
f U
SDin
kin
dm
ln o
f U
SDin
kin
dm
ln o
f U
SDin
kin
dm
ln o
f U
SDin
kin
dm
ln o
f U
SDin
kin
dm
ln o
f U
SD
Tota
l12
.66.
55.
63.
32.
9—
Func
tiona
l dist
ribut
ion*
Cons
umpt
ion
0.1
0.2
0.2
0.6
0.2
—Ra
w m
ater
ials
0.1
——
——
—In
terim
goo
ds12
.46.
33.
82.
72.
7—
Inve
stmen
t goo
ds—
—1.
5—
——
Ener
gy p
rodu
cts
——
——
——
SITC
sect
ions
and
larg
e po
sitio
nFo
od a
nd li
ve a
nim
als
0.1
0.1
——
——
Vege
tabl
es, f
resh
or f
roze
nth
ou to
ns0.
10.
1—
——
——
Beve
rage
s and
toba
cco
——
——
——
Crud
e m
ater
ials,
ined
ible
, exc
ept f
uels
0.1
—0.
60.
60.
2—
Cot
ton
thou
tons
——
0.3
0.4
—0.
1—
0.1
—C
rude
ani
mal
mat
eria
ls, n
.e.s.
thou
tons
0.3
0.1
—0.
60.
12.
10.
50.
70.
2—
Min
eral
fuel
, lub
rican
ts an
d oi
ls—
——
——
—A
nim
al a
nd v
eget
able
oils
, fat
s and
wax
es—
——
——
—Ch
emic
al a
nd si
mila
r pro
duct
s, no
t inc
lude
d in
oth
er c
ateg
orie
s—
0.1
——
——
Man
ufac
ture
d go
ods c
lass
ified
chi
efly
by
mat
eria
l0.
1—
——
——
Mac
hine
ry a
nd tr
ansp
ort e
quip
men
t12
.26.
24.
92.
62.
6—
Parts
and
acc
esso
ries o
f the
mot
or v
ehic
les
12.2
6.1
3.4
2.6
2.6
—M
iscel
lane
ous m
anuf
actu
red
artic
les
——
0.1
——
—G
oods
and
tran
sact
ions
, not
incl
uded
in o
ther
SIT
C ca
tego
ries
——
——
——
Not
es: N
SC d
ata
in F
OB
pric
es1 In
clud
ing
resu
lts o
f NSC
sam
ple
surv
ey o
f ind
ivid
uals
on
mut
ual t
rade
with
EA
EU c
ount
ries (
sinc
e th
e 3rd
qua
rter o
f 201
5).
* in
acc
orda
nce
with
cla
ssifi
catio
n w
orke
d ou
t at t
he N
BK
R
I`17
2014
2013
2016
2015
I`16
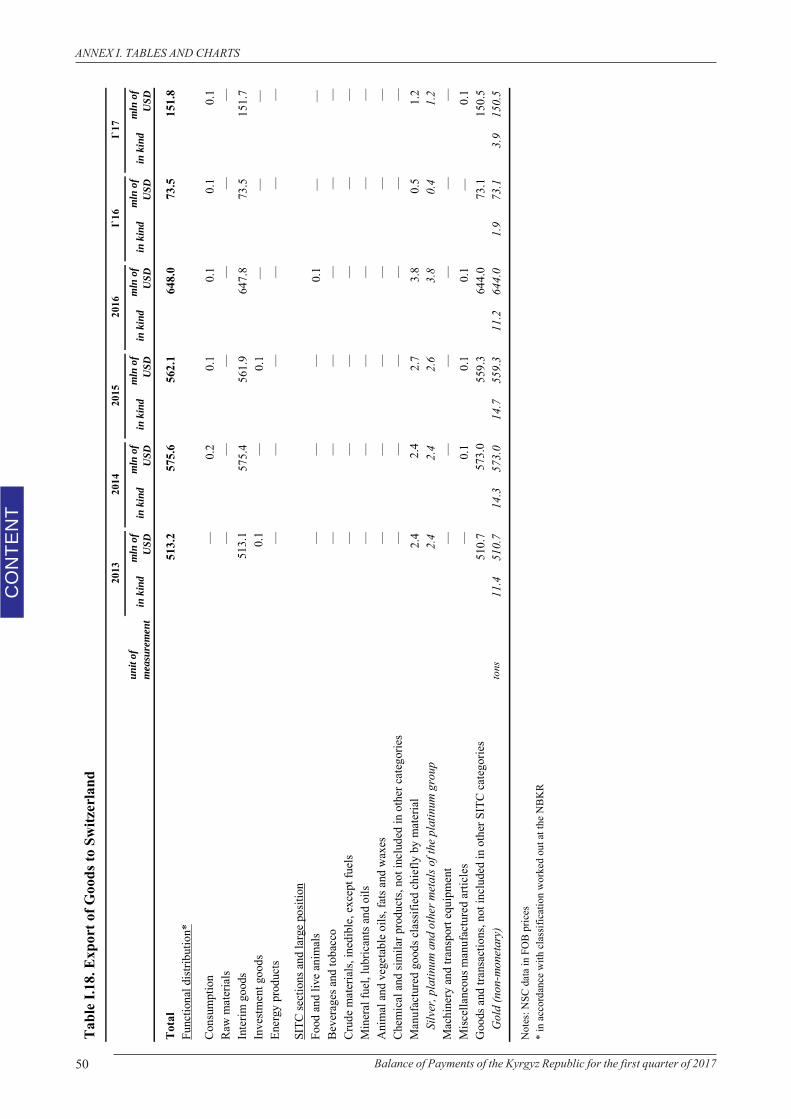
50 Balance of Payments of the Kyrgyz Republic for the first quarter of 2017
CO
NTE
NT
ANNEX I. TABLES AND CHARTS
Tabl
e I.1
8. E
xpor
t of G
oods
to S
witz
erla
nd
unit
of
mea
sure
men
tin
kin
dm
ln o
f U
SDin
kin
dm
ln o
f U
SDin
kin
dm
ln o
f U
SDin
kin
dm
ln o
f U
SDin
kin
dm
ln o
f U
SDin
kin
dm
ln o
f U
SD
Tota
l51
3.2
575.
656
2.1
648.
073
.515
1.8
Func
tiona
l dist
ribut
ion*
Cons
umpt
ion
—0.
20.
10.
10.
10.
1Ra
w m
ater
ials
——
——
——
Inte
rim g
oods
513.
157
5.4
561.
964
7.8
73.5
151.
7In
vestm
ent g
oods
0.1
—0.
1—
——
Ener
gy p
rodu
cts
——
——
——
SITC
sect
ions
and
larg
e po
sitio
nFo
od a
nd li
ve a
nim
als
——
—0.
1—
—Be
vera
ges a
nd to
bacc
o—
——
——
—Cr
ude
mat
eria
ls, in
edib
le, e
xcep
t fue
ls—
——
——
—M
iner
al fu
el, l
ubric
ants
and
oils
——
——
——
Ani
mal
and
veg
etab
le o
ils, f
ats a
nd w
axes
——
——
——
Chem
ical
and
sim
ilar p
rodu
cts,
not i
nclu
ded
in o
ther
cat
egor
ies
——
——
——
Man
ufac
ture
d go
ods c
lass
ified
chi
efly
by
mat
eria
l2.
42.
42.
73.
80.
51.
2Si
lver
, pla
tinum
and
oth
er m
etal
s of t
he p
latin
um g
roup
2.4
2.4
2.6
3.8
0.4
1.2
Mac
hine
ry a
nd tr
ansp
ort e
quip
men
t—
——
——
—M
iscel
lane
ous m
anuf
actu
red
artic
les
—0.
10.
10.
1—
0.1
Goo
ds a
nd tr
ansa
ctio
ns, n
ot in
clud
ed in
oth
er S
ITC
cate
gorie
s51
0.7
573.
055
9.3
644.
073
.115
0.5
Gol
d (n
on-m
onet
ary)
tons
11.4
510.
714
.357
3.0
14.7
559.
311
.264
4.0
1.9
73.1
3.9
150.
5
Not
es: N
SC d
ata
in F
OB
pric
es*
in a
ccor
danc
e w
ith c
lass
ifica
tion
wor
ked
out a
t the
NB
KR
I`17
2016
2015
2013
2014
I`16
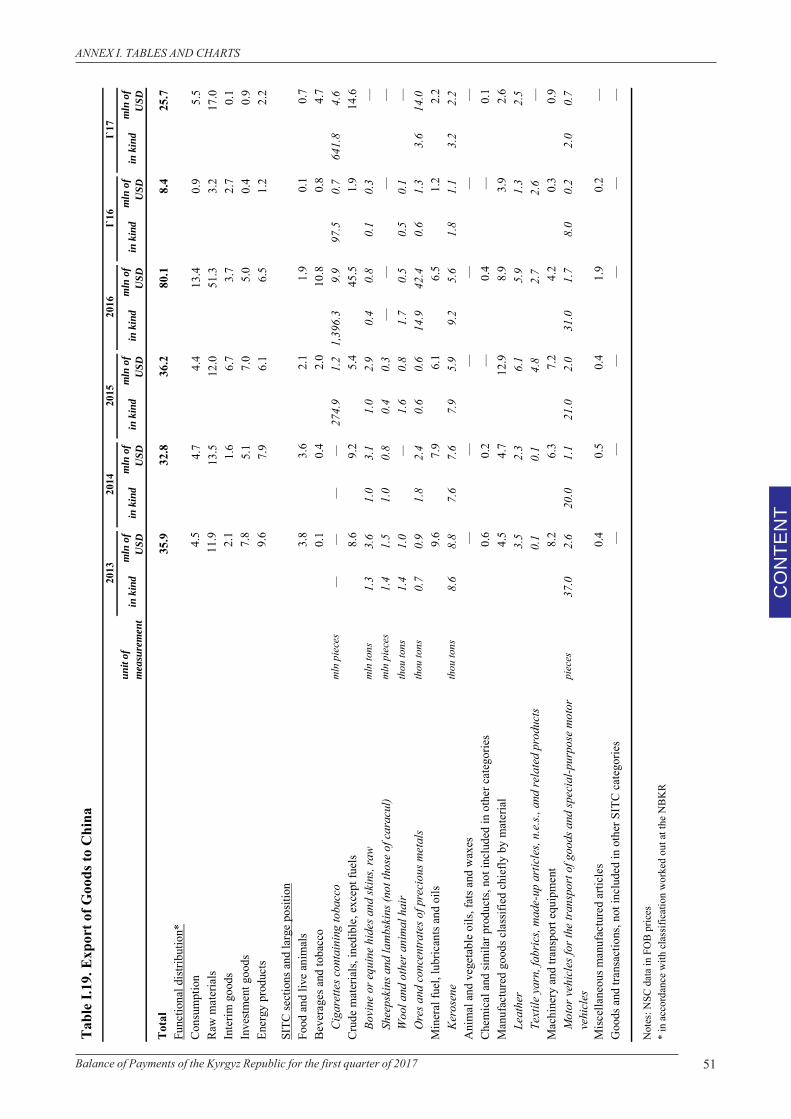
51Balance of Payments of the Kyrgyz Republic for the first quarter of 2017
CO
NTE
NT
ANNEX I. TABLES AND CHARTS
Tabl
e I.1
9. E
xpor
t of G
oods
to C
hina
unit
of
mea
sure
men
tin
kin
dm
ln o
f U
SDin
kin
dm
ln o
f U
SDin
kin
dm
ln o
f U
SDin
kin
dm
ln o
f U
SDin
kin
dm
ln o
f U
SDin
kin
dm
ln o
f U
SD
Tota
l35
.932
.836
.280
.18.
425
.7Fu
nctio
nal d
istrib
utio
n*Co
nsum
ptio
n4.
54.
74.
413
.40.
95.
5Ra
w m
ater
ials
11.9
13.5
12.0
51.3
3.2
17.0
Inte
rim g
oods
2.1
1.6
6.7
3.7
2.7
0.1
Inve
stmen
t goo
ds7.
85.
17.
05.
00.
40.
9En
ergy
pro
duct
s9.
67.
96.
16.
51.
22.
2
SITC
sect
ions
and
larg
e po
sitio
nFo
od a
nd li
ve a
nim
als
3.8
3.6
2.1
1.9
0.1
0.7
Beve
rage
s and
toba
cco
0.1
0.4
2.0
10.8
0.8
4.7
Cig
aret
tes c
onta
inin
g to
bacc
om
ln p
iece
s—
——
—27
4.9
1.2
1,39
6.3
9.9
97.5
0.7
641.
84.
6Cr
ude
mat
eria
ls, in
edib
le, e
xcep
t fue
ls8.
69.
25.
445
.51.
914
.6Bo
vine
or e
quin
e hi
des a
nd sk
ins,
raw
mln
tons
1.3
3.6
1.0
3.1
1.0
2.9
0.4
0.8
0.1
0.3
—Sh
eeps
kins
and
lam
bski
ns (n
ot th
ose
of c
arac
ul)
mln
pie
ces
1.4
1.5
1.0
0.8
0.4
0.3
——
——
Woo
l and
oth
er a
nim
al h
air
thou
tons
1.4
1.0
—1.
60.
81.
70.
50.
50.
1—
Ore
s and
con
cent
rate
s of p
reci
ous m
etal
sth
ou to
ns0.
70.
91.
82.
40.
60.
614
.942
.40.
61.
33.
614
.0M
iner
al fu
el, l
ubric
ants
and
oils
9.6
7.9
6.1
6.5
1.2
2.2
Kero
sene
thou
tons
8.6
8.8
7.6
7.6
7.9
5.9
9.2
5.6
1.8
1.1
3.2
2.2
Ani
mal
and
veg
etab
le o
ils, f
ats a
nd w
axes
——
——
——
Chem
ical
and
sim
ilar p
rodu
cts,
not i
nclu
ded
in o
ther
cat
egor
ies
0.6
0.2
—0.
4—
0.1
Man
ufac
ture
d go
ods c
lass
ified
chi
efly
by
mat
eria
l4.
54.
712
.98.
93.
92.
6Le
athe
r3.
52.
36.
15.
91.
32.
5Te
xtile
yar
n, fa
bric
s, m
ade-
up a
rtic
les,
n.e.
s., a
nd re
late
d pr
oduc
ts0.
10.
14.
82.
72.
6—
Mac
hine
ry a
nd tr
ansp
ort e
quip
men
t8.
26.
37.
24.
20.
30.
9M
otor
veh
icle
s for
the
tran
spor
t of g
oods
and
spec
ial-p
urpo
se m
otor
ve
hicl
espi
eces
37.0
2.6
20.0
1.1
21.0
2.0
31.0
1.7
8.0
0.2
2.0
0.7
Misc
ella
neou
s man
ufac
ture
d ar
ticle
s0.
40.
50.
41.
90.
2—
Goo
ds a
nd tr
ansa
ctio
ns, n
ot in
clud
ed in
oth
er S
ITC
cate
gorie
s—
——
——
—
Not
es: N
SC d
ata
in F
OB
pric
es*
in a
ccor
danc
e w
ith c
lass
ifica
tion
wor
ked
out a
t the
NB
KR
2013
I`16
I`17
2016
2015
2014
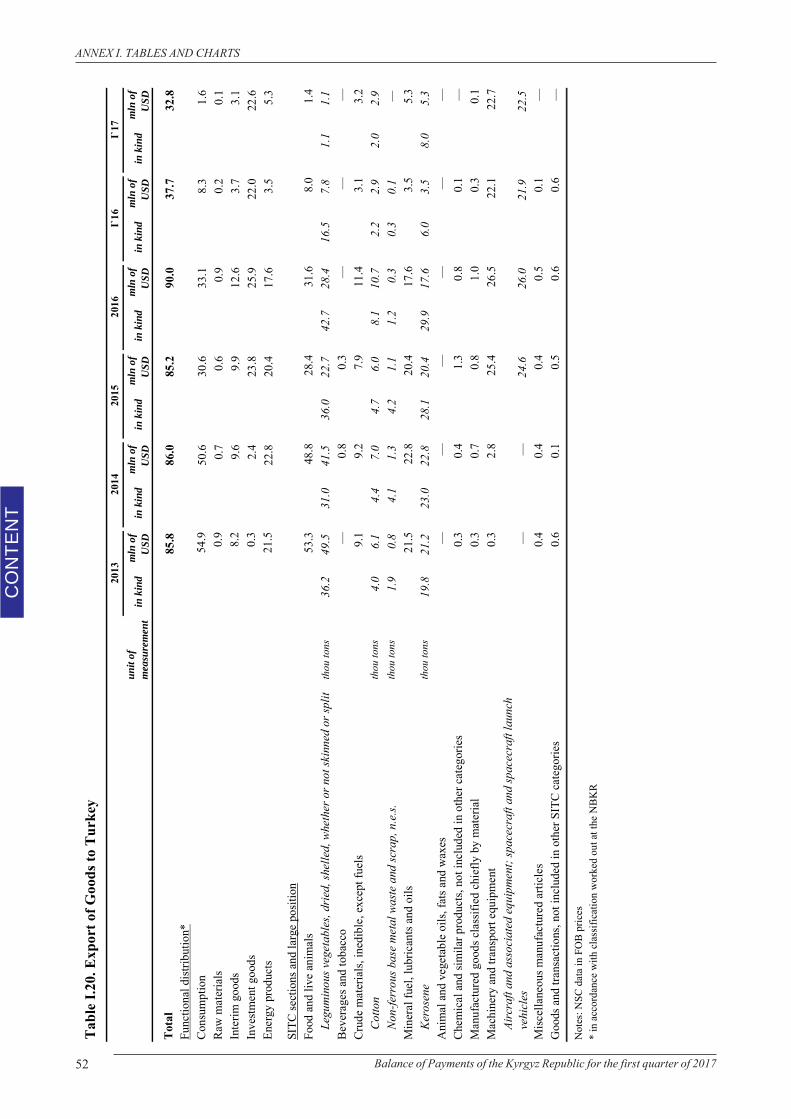
52 Balance of Payments of the Kyrgyz Republic for the first quarter of 2017
CO
NTE
NT
ANNEX I. TABLES AND CHARTS
Tabl
e I.2
0. E
xpor
t of G
oods
to T
urke
y
unit
of
mea
sure
men
tin
kin
dm
ln o
f U
SDin
kin
dm
ln o
f U
SDin
kin
dm
ln o
f U
SDin
kin
dm
ln o
f U
SDin
kin
dm
ln o
f U
SDin
kin
dm
ln o
f U
SD
Tota
l85
.886
.085
.290
.037
.732
.8Fu
nctio
nal d
istrib
utio
n*Co
nsum
ptio
n54
.950
.630
.633
.18.
31.
6Ra
w m
ater
ials
0.9
0.7
0.6
0.9
0.2
0.1
Inte
rim g
oods
8.2
9.6
9.9
12.6
3.7
3.1
Inve
stmen
t goo
ds0.
32.
423
.825
.922
.022
.6En
ergy
pro
duct
s21
.522
.820
.417
.63.
55.
3
SITC
sect
ions
and
larg
e po
sitio
nFo
od a
nd li
ve a
nim
als
53.3
48.8
28.4
31.6
8.0
1.4
Legu
min
ous v
eget
able
s, dr
ied,
shel
led,
whe
ther
or n
ot sk
inne
d or
split
thou
tons
36.2
49.5
31.0
41.5
36.0
22.7
42.7
28.4
16.5
7.8
1.1
1.1
Beve
rage
s and
toba
cco
—0.
80.
3—
——
Crud
e m
ater
ials,
ined
ible
, exc
ept f
uels
9.1
9.2
7.9
11.4
3.1
3.2
Cot
ton
thou
tons
4.0
6.1
4.4
7.0
4.7
6.0
8.1
10.7
2.2
2.9
2.0
2.9
Non-
ferr
ous b
ase
met
al w
aste
and
scra
p, n
.e.s.
thou
tons
1.9
0.8
4.1
1.3
4.2
1.1
1.2
0.3
0.3
0.1
—M
iner
al fu
el, l
ubric
ants
and
oils
21.5
22.8
20.4
17.6
3.5
5.3
Kero
sene
thou
tons
19.8
21.2
23.0
22.8
28.1
20.4
29.9
17.6
6.0
3.5
8.0
5.3
Ani
mal
and
veg
etab
le o
ils, f
ats a
nd w
axes
——
——
——
Chem
ical
and
sim
ilar p
rodu
cts,
not i
nclu
ded
in o
ther
cat
egor
ies
0.3
0.4
1.3
0.8
0.1
—M
anuf
actu
red
good
s cla
ssifi
ed c
hief
ly b
y m
ater
ial
0.3
0.7
0.8
1.0
0.3
0.1
Mac
hine
ry a
nd tr
ansp
ort e
quip
men
t0.
32.
825
.426
.522
.122
.7Ai
rcra
ft an
d as
soci
ated
equ
ipm
ent;
spac
ecra
ft an
d sp
acec
raft
laun
ch
vehi
cles
——
24.6
26.0
21.9
22.5
Misc
ella
neou
s man
ufac
ture
d ar
ticle
s0.
40.
40.
40.
50.
1—
Goo
ds a
nd tr
ansa
ctio
ns, n
ot in
clud
ed in
oth
er S
ITC
cate
gorie
s0.
60.
10.
50.
60.
6—
Not
es: N
SC d
ata
in F
OB
pric
es*
in a
ccor
danc
e w
ith c
lass
ifica
tion
wor
ked
out a
t the
NB
KR
2014
2015
2013
I`16
I`17
2016
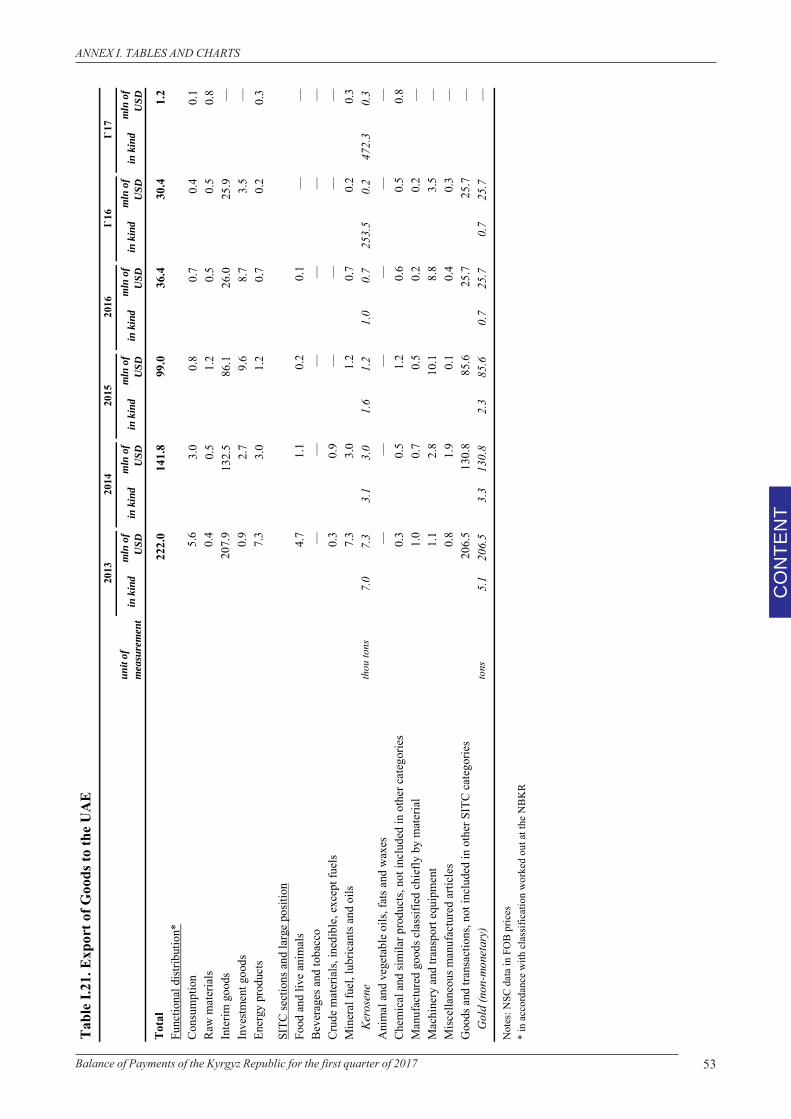
53Balance of Payments of the Kyrgyz Republic for the first quarter of 2017
CO
NTE
NT
ANNEX I. TABLES AND CHARTS
Tabl
e I.2
1. E
xpor
t of G
oods
to th
e UA
E
unit
of
mea
sure
men
tin
kin
dm
ln o
f U
SDin
kin
dm
ln o
f U
SDin
kin
dm
ln o
f U
SDin
kin
dm
ln o
f U
SDin
kin
dm
ln o
f U
SDin
kin
dm
ln o
f U
SD
Tota
l22
2.0
141.
899
.036
.430
.41.
2Fu
nctio
nal d
istrib
utio
n*Co
nsum
ptio
n5.
63.
00.
80.
70.
40.
1Ra
w m
ater
ials
0.4
0.5
1.2
0.5
0.5
0.8
Inte
rim g
oods
207.
913
2.5
86.1
26.0
25.9
—In
vestm
ent g
oods
0.9
2.7
9.6
8.7
3.5
—En
ergy
pro
duct
s7.
33.
01.
20.
70.
20.
3
SITC
sect
ions
and
larg
e po
sitio
nFo
od a
nd li
ve a
nim
als
4.7
1.1
0.2
0.1
——
Beve
rage
s and
toba
cco
——
——
——
Crud
e m
ater
ials,
ined
ible
, exc
ept f
uels
0.3
0.9
——
——
Min
eral
fuel
, lub
rican
ts an
d oi
ls7.
33.
01.
20.
70.
20.
3Ke
rose
neth
ou to
ns7.
07.
33.
13.
01.
61.
21.
00.
725
3.5
0.2
472.
30.
3A
nim
al a
nd v
eget
able
oils
, fat
s and
wax
es—
——
——
—Ch
emic
al a
nd si
mila
r pro
duct
s, no
t inc
lude
d in
oth
er c
ateg
orie
s0.
30.
51.
20.
60.
50.
8M
anuf
actu
red
good
s cla
ssifi
ed c
hief
ly b
y m
ater
ial
1.0
0.7
0.5
0.2
0.2
—M
achi
nery
and
tran
spor
t equ
ipm
ent
1.1
2.8
10.1
8.8
3.5
—M
iscel
lane
ous m
anuf
actu
red
artic
les
0.8
1.9
0.1
0.4
0.3
—G
oods
and
tran
sact
ions
, not
incl
uded
in o
ther
SIT
C ca
tego
ries
206.
513
0.8
85.6
25.7
25.7
—G
old
(non
-mon
etar
y)to
ns5.
120
6.5
3.3
130.
82.
385
.60.
725
.70.
725
.7—
Not
es: N
SC d
ata
in F
OB
pric
es*
in a
ccor
danc
e w
ith c
lass
ifica
tion
wor
ked
out a
t the
NB
KR
I`17
2013
2016
2014
2015
I`16
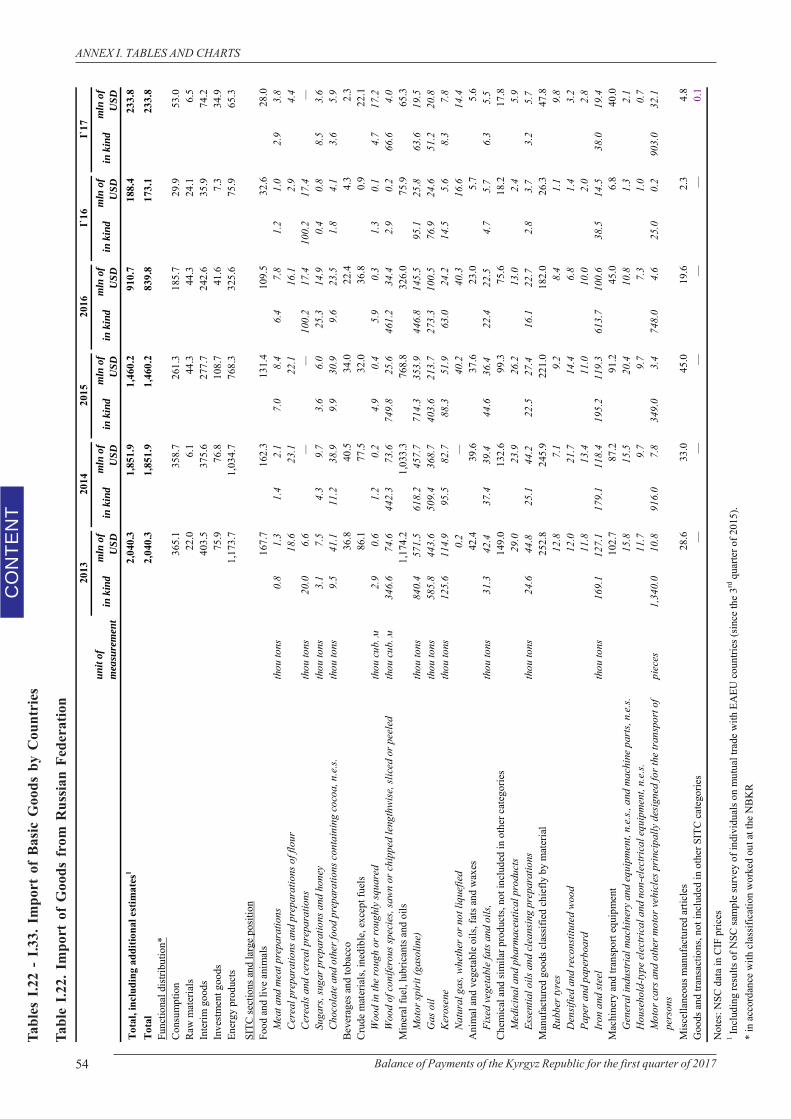
54 Balance of Payments of the Kyrgyz Republic for the first quarter of 2017
CO
NTE
NT
ANNEX I. TABLES AND CHARTS
Tabl
es I
.22
- I.3
3. I
mpo
rt o
f Ba
sic G
oods
by
Cou
ntri
es
Tabl
e I.2
2. I
mpo
rt o
f G
oods
fro
m R
ussia
n Fe
dera
tion
unit
of
mea
sure
men
tin
kin
dm
ln o
f U
SDin
kin
dm
ln o
f U
SDin
kin
dm
ln o
f U
SDin
kin
dm
ln o
f U
SDin
kin
dm
ln o
f U
SDin
kin
dm
ln o
f U
SD
Tota
l, in
clud
ing
addi
tiona
l est
imat
es1
2,04
0.3
1,85
1.9
1,46
0.2
910.
718
8.4
233.
8To
tal
2,04
0.3
1,85
1.9
1,46
0.2
839.
817
3.1
233.
8Fu
nctio
nal d
istri
butio
n*Co
nsum
ptio
n36
5.1
358.
726
1.3
185.
729
.953
.0Ra
w m
ater
ials
22.0
6.1
44.3
44.3
24.1
6.5
Inte
rim g
oods
403.
537
5.6
277.
724
2.6
35.9
74.2
Inve
stm
ent g
oods
75.9
76.8
108.
741
.67.
334
.9En
ergy
pro
duct
s1,
173.
71,
034.
776
8.3
325.
675
.965
.3SI
TC se
ctio
ns a
nd la
rge
posi
tion
Food
and
live
ani
mal
s16
7.7
162.
313
1.4
109.
532
.628
.0M
eat a
nd m
eat p
repa
ratio
nsth
ou to
ns0.
81.
31.
42.
17.
08.
46.
47.
81.
21.
02.
93.
8Ce
real
pre
para
tions
and
pre
para
tions
of f
lour
18.6
23.1
22.1
16.1
2.9
4.4
Cere
als a
nd c
erea
l pre
para
tions
thou
tons
20.0
6.6
——
100.
217
.410
0.2
17.4
—Su
gars
, sug
ar p
repa
ratio
ns a
nd h
oney
thou
tons
3.1
7.5
4.3
9.7
3.6
6.0
25.3
14.9
0.4
0.8
8.5
3.6
Choc
olat
e an
d ot
her f
ood
prep
arat
ions
con
tain
ing
coco
a, n
.e.s.
thou
tons
9.5
41.1
11.2
38.9
9.9
30.9
9.6
23.5
1.8
4.1
3.6
5.9
Beve
rage
s and
toba
cco
36.8
40.5
34.0
22.4
4.3
2.3
Crud
e m
ater
ials
, ine
dibl
e, e
xcep
t fue
ls86
.177
.532
.036
.80.
922
.1W
ood
in th
e ro
ugh
or ro
ughl
y sq
uare
dth
ou c
ub. м
2.9
0.6
1.2
0.2
4.9
0.4
5.9
0.3
1.3
0.1
4.7
17.2
Woo
d of
con
ifero
us sp
ecie
s, sa
wn
or c
hipp
ed le
ngth
wise
, slic
ed o
r pee
led
thou
cub
. м34
6.6
74.6
442.
373
.674
9.8
25.6
461.
234
.42.
90.
266
.64.
0M
iner
al fu
el, l
ubric
ants
and
oils
1,17
4.2
1,03
3.3
768.
832
6.0
75.9
65.3
Mot
or sp
irit (
gaso
line)
thou
tons
840.
457
1.5
618.
245
7.7
714.
335
3.9
446.
814
5.5
95.1
25.8
63.6
19.5
Gas
oil
thou
tons
585.
844
3.6
509.
436
8.7
403.
621
3.7
273.
310
0.5
76.9
24.6
51.2
20.8
Kero
sene
thou
tons
125.
611
4.9
95.5
82.7
88.3
51.9
63.0
24.2
14.5
5.6
8.3
7.8
Natu
ral g
as, w
heth
er o
r not
liqu
efie
d0.
2—
40.2
40.3
16.6
14.4
Ani
mal
and
veg
etab
le o
ils, f
ats a
nd w
axes
42.4
39.6
37.6
23.0
5.7
5.6
Fixe
d ve
geta
ble
fats
and
oils
, th
ou to
ns31
.342
.437
.439
.444
.636
.422
.422
.54.
75.
76.
35.
5Ch
emic
al a
nd si
mila
r pro
duct
s, no
t inc
lude
d in
oth
er c
ateg
orie
s14
9.0
132.
699
.375
.618
.217
.8M
edic
inal
and
pha
rmac
eutic
al p
rodu
cts
29.0
23.9
26.2
13.0
2.4
5.9
Esse
ntia
l oils
and
cle
ansi
ng p
repa
ratio
nsth
ou to
ns24
.644
.825
.144
.222
.527
.416
.122
.72.
83.
73.
25.
7M
anuf
actu
red
good
s cla
ssifi
ed c
hief
ly b
y m
ater
ial
252.
824
5.9
221.
018
2.0
26.3
47.8
Rubb
er ty
res
12.8
7.1
9.2
8.4
1.1
9.8
Den
sifie
d an
d re
cons
titut
ed w
ood
12.0
21.7
14.4
6.8
1.4
3.2
Pape
r and
pap
erbo
ard
11.8
13.4
11.0
10.0
2.0
2.8
Iron
and
stee
lth
ou to
ns16
9.1
127.
117
9.1
118.
419
5.2
119.
361
3.7
100.
638
.514
.538
.019
.4M
achi
nery
and
tran
spor
t equ
ipm
ent
102.
787
.291
.245
.06.
840
.0G
ener
al in
dustr
ial m
achi
nery
and
equ
ipm
ent,
n.e.
s., a
nd m
achi
ne p
arts
, n.e
.s.15
.815
.520
.410
.81.
32.
1H
ouse
hold
-type
ele
ctri
cal a
nd n
on-e
lect
rica
l equ
ipm
ent,
n.e.
s.11
.79.
79.
77.
31.
00.
7M
otor
car
s and
oth
er m
otor
veh
icle
s pri
ncip
ally
des
igne
d fo
r the
tran
spor
t of
pers
ons
piec
es1,
340.
010
.891
6.0
7.8
349.
03.
474
8.0
4.6
25.0
0.2
903.
032
.1
Misc
ella
neou
s man
ufac
ture
d ar
ticle
s28
.633
.045
.019
.62.
34.
8G
oods
and
tran
sact
ions
, not
incl
uded
in o
ther
SIT
C ca
tego
ries
——
——
—0.
1
Not
es: N
SC d
ata
in C
IF p
rices
1 Incl
udin
g re
sults
of N
SC sa
mpl
e su
rvey
of i
ndiv
idua
ls o
n m
utua
l tra
de w
ith E
AEU
cou
ntrie
s (si
nce
the
3rd q
uarte
r of 2
015)
.*
in a
ccor
danc
e w
ith c
lass
ifica
tion
wor
ked
out a
t the
NB
KR
I`17
2015
2016
2013
2014
I`16
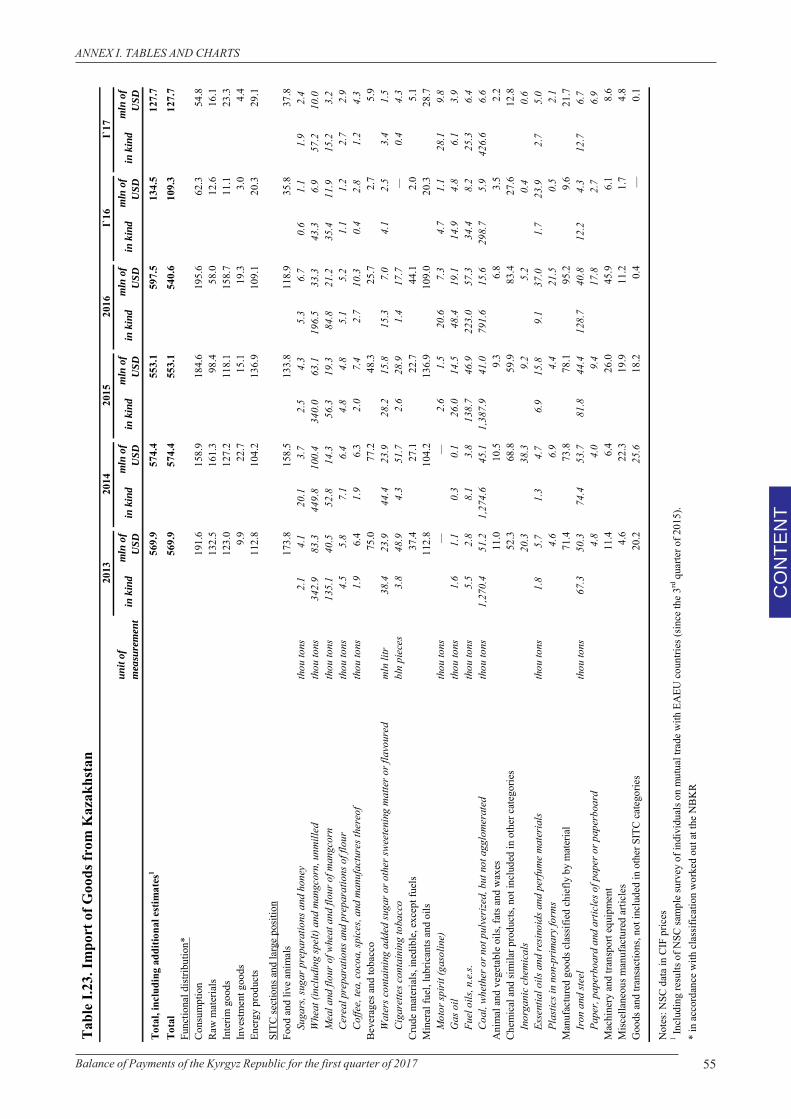
55Balance of Payments of the Kyrgyz Republic for the first quarter of 2017
CO
NTE
NT
ANNEX I. TABLES AND CHARTS
Tabl
e I.2
3. Im
port
of G
oods
from
Kaz
akhs
tan
unit
of
mea
sure
men
tin
kin
dm
ln o
f U
SDin
kin
dm
ln o
f U
SDin
kin
dm
ln o
f U
SDin
kin
dm
ln o
f U
SDin
kin
dm
ln o
f U
SDin
kin
dm
ln o
f U
SD
Tota
l, in
clud
ing
addi
tiona
l est
imat
es1
569.
957
4.4
553.
159
7.5
134.
512
7.7
Tota
l56
9.9
574.
455
3.1
540.
610
9.3
127.
7Fu
nctio
nal d
istri
butio
n*Co
nsum
ptio
n19
1.6
158.
918
4.6
195.
662
.354
.8Ra
w m
ater
ials
132.
516
1.3
98.4
58.0
12.6
16.1
Inte
rim g
oods
123.
012
7.2
118.
115
8.7
11.1
23.3
Inve
stm
ent g
oods
9.9
22.7
15.1
19.3
3.0
4.4
Ener
gy p
rodu
cts
112.
810
4.2
136.
910
9.1
20.3
29.1
SITC
sect
ions
and
larg
e po
sitio
nFo
od a
nd li
ve a
nim
als
173.
815
8.5
133.
811
8.9
35.8
37.8
Suga
rs, s
ugar
pre
para
tions
and
hon
eyth
ou to
ns2.
14.
120
.13.
72.
54.
35.
36.
70.
61.
11.
92.
4W
heat
(inc
ludi
ng sp
elt)
and
man
gcor
n, u
nmill
edth
ou to
ns34
2.9
83.3
449.
810
0.4
340.
063
.119
6.5
33.3
43.3
6.9
57.2
10.0
Mea
l and
flou
r of w
heat
and
flou
r of m
angc
orn
thou
tons
135.
140
.552
.814
.356
.319
.384
.821
.235
.411
.915
.23.
2Ce
real
pre
para
tions
and
pre
para
tions
of f
lour
thou
tons
4.5
5.8
7.1
6.4
4.8
4.8
5.1
5.2
1.1
1.2
2.7
2.9
Coffe
e, te
a, c
ocoa
, spi
ces,
and
man
ufac
ture
s the
reof
thou
tons
1.9
6.4
1.9
6.3
2.0
7.4
2.7
10.3
0.4
2.8
1.2
4.3
Beve
rage
s and
toba
cco
75.0
77.2
48.3
25.7
2.7
5.9
Wat
ers c
onta
inin
g ad
ded
suga
r or o
ther
swee
teni
ng m
atte
r or f
lavo
ured
mln
litr
38.4
23.9
44.4
23.9
28.2
15.8
15.3
7.0
4.1
2.5
3.4
1.5
Ciga
rette
s con
tain
ing
toba
cco
bln
piec
es3.
848
.94.
351
.72.
628
.91.
417
.7—
0.4
4.3
Crud
e m
ater
ials
, ine
dibl
e, e
xcep
t fue
ls37
.427
.122
.744
.12.
05.
1M
iner
al fu
el, l
ubric
ants
and
oils
112.
810
4.2
136.
910
9.0
20.3
28.7
Mot
or sp
irit (
gaso
line)
thou
tons
——
2.6
1.5
20.6
7.3
4.7
1.1
28.1
9.8
Gas
oil
thou
tons
1.6
1.1
0.3
0.1
26.0
14.5
48.4
19.1
14.9
4.8
6.1
3.9
Fuel
oils
, n.e
.s.th
ou to
ns5.
52.
88.
13.
813
8.7
46.9
223.
057
.334
.48.
225
.36.
4Co
al, w
heth
er o
r not
pul
veri
zed,
but
not
agg
lom
erat
edth
ou to
ns1,
270.
451
.21,
274.
645
.11,
387.
941
.079
1.6
15.6
298.
75.
942
6.6
6.6
Ani
mal
and
veg
etab
le o
ils, f
ats a
nd w
axes
11.0
10.5
9.3
6.8
3.5
2.2
Chem
ical
and
sim
ilar p
rodu
cts,
not i
nclu
ded
in o
ther
cat
egor
ies
52.3
68.8
59.9
83.4
27.6
12.8
Inor
gani
c ch
emic
als
20.3
38.3
9.2
5.2
0.4
0.6
Esse
ntia
l oils
and
resi
noid
s and
per
fum
e m
ater
ials
thou
tons
1.8
5.7
1.3
4.7
6.9
15.8
9.1
37.0
1.7
23.9
2.7
5.0
Plas
tics i
n no
n-pr
imar
y fo
rms
4.6
6.9
4.4
21.5
0.5
2.1
Man
ufac
ture
d go
ods c
lass
ified
chi
efly
by
mat
eria
l71
.473
.878
.195
.29.
621
.7Ir
on a
nd st
eel
thou
tons
67.3
50.3
74.4
53.7
81.8
44.4
128.
740
.812
.24.
312
.76.
7Pa
per,
pape
rboa
rd a
nd a
rtic
les o
f pap
er o
r pap
erbo
ard
4.8
4.0
9.4
17.8
2.7
6.9
Mac
hine
ry a
nd tr
ansp
ort e
quip
men
t11
.46.
426
.045
.96.
18.
6M
iscel
lane
ous m
anuf
actu
red
artic
les
4.6
22.3
19.9
11.2
1.7
4.8
Goo
ds a
nd tr
ansa
ctio
ns, n
ot in
clud
ed in
oth
er S
ITC
cate
gorie
s20
.225
.618
.20.
4—
0.1
Not
es: N
SC d
ata
in C
IF p
rices
1 Incl
udin
g re
sults
of N
SC sa
mpl
e su
rvey
of i
ndiv
idua
ls o
n m
utua
l tra
de w
ith E
AEU
cou
ntrie
s (si
nce
the
3rd q
uarte
r of 2
015)
.*
in a
ccor
danc
e w
ith c
lass
ifica
tion
wor
ked
out a
t the
NB
KR
2013
I`16
I`17
2016
2014
2015
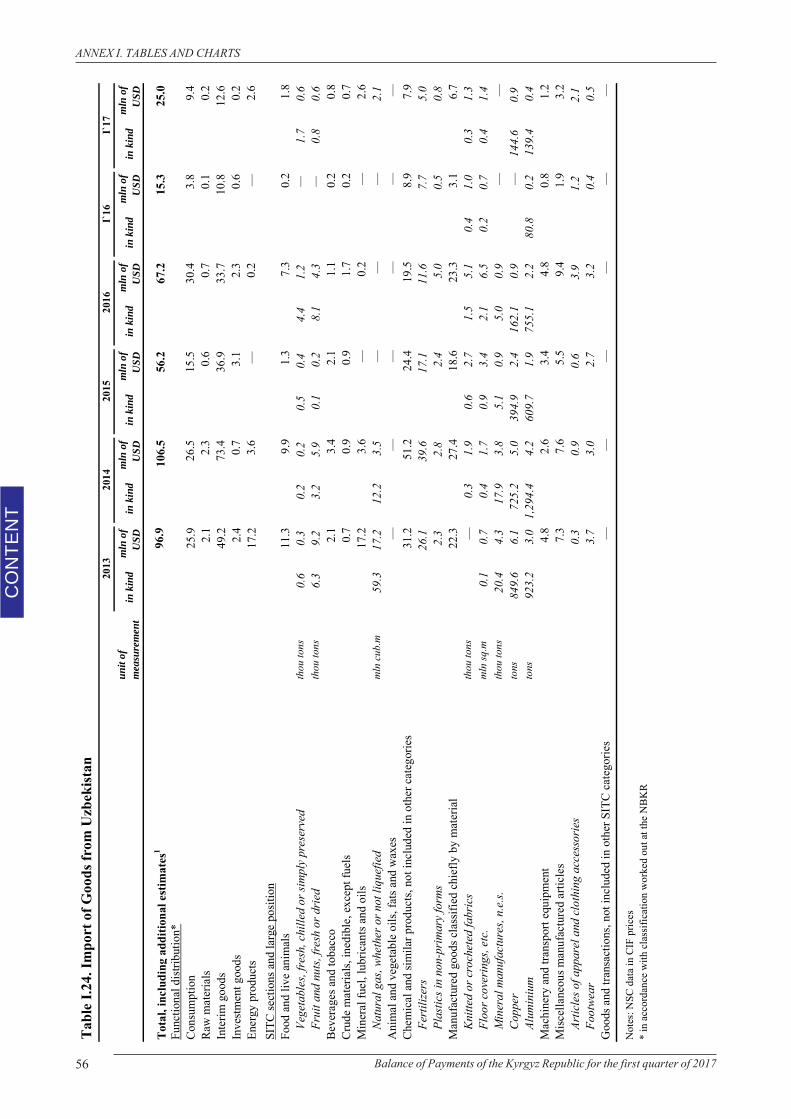
56 Balance of Payments of the Kyrgyz Republic for the first quarter of 2017
CO
NTE
NT
ANNEX I. TABLES AND CHARTS
Tabl
e I.2
4. Im
port
of G
oods
from
Uzb
ekist
an
unit
of
mea
sure
men
tin
kin
dm
ln o
f U
SDin
kin
dm
ln o
f U
SDin
kin
dm
ln o
f U
SDin
kin
dm
ln o
f U
SDin
kin
dm
ln o
f U
SDin
kin
dm
ln o
f U
SD
Tota
l, in
clud
ing
addi
tiona
l est
imat
es1
96.9
106.
556
.267
.215
.325
.0Fu
nctio
nal d
istrib
utio
n*Co
nsum
ptio
n25
.926
.515
.530
.43.
89.
4Ra
w m
ater
ials
2.1
2.3
0.6
0.7
0.1
0.2
Inte
rim g
oods
49.2
73.4
36.9
33.7
10.8
12.6
Inve
stmen
t goo
ds2.
40.
73.
12.
30.
60.
2En
ergy
pro
duct
s17
.23.
6—
0.2
—2.
6SI
TC se
ctio
ns a
nd la
rge
posit
ion
Food
and
live
ani
mal
s11
.39.
91.
37.
30.
21.
8Ve
geta
bles
, fre
sh, c
hille
d or
sim
ply
pres
erve
dth
ou to
ns0.
60.
30.
20.
20.
50.
44.
41.
2—
1.7
0.6
Frui
t and
nut
s, fr
esh
or d
ried
thou
tons
6.3
9.2
3.2
5.9
0.1
0.2
8.1
4.3
—0.
80.
6Be
vera
ges a
nd to
bacc
o2.
13.
42.
11.
10.
20.
8Cr
ude
mat
eria
ls, in
edib
le, e
xcep
t fue
ls0.
70.
90.
91.
70.
20.
7M
iner
al fu
el, l
ubric
ants
and
oils
17.2
3.6
—0.
2—
2.6
Nat
ural
gas
, whe
ther
or n
ot li
quef
ied
mln
cub
.m59
.317
.212
.23.
5—
——
2.1
Ani
mal
and
veg
etab
le o
ils, f
ats a
nd w
axes
——
——
——
Chem
ical
and
sim
ilar p
rodu
cts,
not i
nclu
ded
in o
ther
cat
egor
ies
31.2
51.2
24.4
19.5
8.9
7.9
Fert
ilize
rs
26.1
39.6
17.1
11.6
7.7
5.0
Plas
tics i
n no
n-pr
imar
y fo
rms
2.3
2.8
2.4
5.0
0.5
0.8
Man
ufac
ture
d go
ods c
lass
ified
chi
efly
by
mat
eria
l22
.327
.418
.623
.33.
16.
7K
nitte
d or
cro
chet
ed fa
bric
s th
ou to
ns—
0.3
1.9
0.6
2.7
1.5
5.1
0.4
1.0
0.3
1.3
Floo
r cov
erin
gs, e
tc.
mln
sq.m
0.1
0.7
0.4
1.7
0.9
3.4
2.1
6.5
0.2
0.7
0.4
1.4
Min
eral
man
ufac
ture
s, n.
e.s.
thou
tons
20.4
4.3
17.9
3.8
5.1
0.9
5.0
0.9
——
Cop
per
tons
849.
66.
172
5.2
5.0
394.
92.
416
2.1
0.9
—14
4.6
0.9
Alum
iniu
mto
ns92
3.2
3.0
1,29
4.4
4.2
609.
71.
975
5.1
2.2
80.8
0.2
139.
40.
4M
achi
nery
and
tran
spor
t equ
ipm
ent
4.8
2.6
3.4
4.8
0.8
1.2
Misc
ella
neou
s man
ufac
ture
d ar
ticle
s7.
37.
65.
59.
41.
93.
2Ar
ticle
s of a
ppar
el a
nd c
loth
ing
acce
ssor
ies
0.3
0.9
0.6
3.9
1.2
2.1
Foot
wea
r3.
73.
02.
73.
20.
40.
5G
oods
and
tran
sact
ions
, not
incl
uded
in o
ther
SIT
C ca
tego
ries
——
——
——
Not
es: N
SC d
ata
in C
IF p
rices
* in
acc
orda
nce
with
cla
ssifi
catio
n w
orke
d ou
t at t
he N
BK
R
I`16
I`17
2016
2014
2015
2013
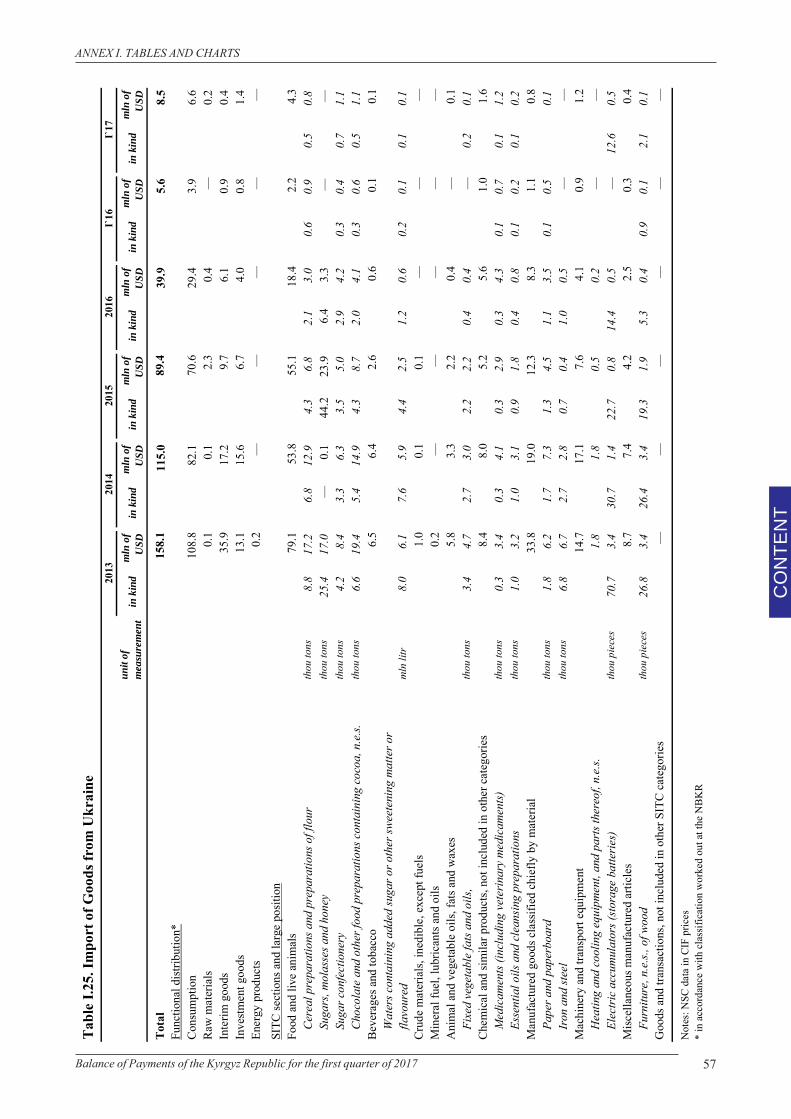
57Balance of Payments of the Kyrgyz Republic for the first quarter of 2017
CO
NTE
NT
ANNEX I. TABLES AND CHARTS
Tabl
e I.2
5. Im
port
of G
oods
from
Ukr
aine
unit
of
mea
sure
men
tin
kin
dm
ln o
f U
SDin
kin
dm
ln o
f U
SDin
kin
dm
ln o
f U
SDin
kin
dm
ln o
f U
SDin
kin
dm
ln o
f U
SDin
kin
dm
ln o
f U
SD
Tota
l15
8.1
115.
089
.439
.95.
68.
5Fu
nctio
nal d
istrib
utio
n*Co
nsum
ptio
n10
8.8
82.1
70.6
29.4
3.9
6.6
Raw
mat
eria
ls0.
10.
12.
30.
4—
0.2
Inte
rim g
oods
35.9
17.2
9.7
6.1
0.9
0.4
Inve
stmen
t goo
ds13
.115
.66.
74.
00.
81.
4En
ergy
pro
duct
s0.
2—
——
——
SITC
sect
ions
and
larg
e po
sitio
nFo
od a
nd li
ve a
nim
als
79.1
53.8
55.1
18.4
2.2
4.3
Cer
eal p
repa
ratio
ns a
nd p
repa
ratio
ns o
f flo
urth
ou to
ns8.
817
.26.
812
.94.
36.
82.
13.
00.
60.
90.
50.
8Su
gars
, mol
asse
s and
hon
eyth
ou to
ns25
.417
.0—
0.1
44.2
23.9
6.4
3.3
——
Suga
r con
fect
ione
ryth
ou to
ns4.
28.
43.
36.
33.
55.
02.
94.
20.
30.
40.
71.
1C
hoco
late
and
oth
er fo
od p
repa
ratio
ns c
onta
inin
g co
coa,
n.e
.s.th
ou to
ns6.
619
.45.
414
.94.
38.
72.
04.
10.
30.
60.
51.
1Be
vera
ges a
nd to
bacc
o6.
56.
42.
60.
60.
10.
1W
ater
s con
tain
ing
adde
d su
gar o
r oth
er sw
eete
ning
mat
ter o
r fla
vour
edm
ln li
tr8.
06.
17.
65.
94.
42.
51.
20.
60.
20.
10.
10.
1Cr
ude
mat
eria
ls, in
edib
le, e
xcep
t fue
ls1.
00.
10.
1—
——
Min
eral
fuel
, lub
rican
ts an
d oi
ls0.
2—
——
——
Ani
mal
and
veg
etab
le o
ils, f
ats a
nd w
axes
5.8
3.3
2.2
0.4
—0.
1Fi
xed
vege
tabl
e fa
ts a
nd o
ils,
thou
tons
3.4
4.7
2.7
3.0
2.2
2.2
0.4
0.4
—0.
20.
1Ch
emic
al a
nd si
mila
r pro
duct
s, no
t inc
lude
d in
oth
er c
ateg
orie
s8.
48.
05.
25.
61.
01.
6M
edic
amen
ts (in
clud
ing
vete
rinar
y m
edic
amen
ts)th
ou to
ns0.
33.
40.
34.
10.
32.
90.
34.
30.
10.
70.
11.
2Es
sent
ial o
ils a
nd c
lean
sing
pre
para
tions
thou
tons
1.0
3.2
1.0
3.1
0.9
1.8
0.4
0.8
0.1
0.2
0.1
0.2
Man
ufac
ture
d go
ods c
lass
ified
chi
efly
by
mat
eria
l33
.819
.012
.38.
31.
10.
8Pa
per a
nd p
aper
boar
dth
ou to
ns1.
86.
21.
77.
31.
34.
51.
13.
50.
10.
50.
1Ir
on a
nd st
eel
thou
tons
6.8
6.7
2.7
2.8
0.7
0.4
1.0
0.5
——
Mac
hine
ry a
nd tr
ansp
ort e
quip
men
t14
.717
.17.
64.
10.
91.
2H
eatin
g an
d co
olin
g eq
uipm
ent,
and
parts
ther
eof,
n.e.
s.1.
81.
80.
50.
2—
—El
ectr
ic a
ccum
ulat
ors (
stor
age
batte
ries
)th
ou p
iece
s70
.73.
430
.71.
422
.70.
814
.40.
5—
12.6
0.5
Misc
ella
neou
s man
ufac
ture
d ar
ticle
s8.
77.
44.
22.
50.
30.
4Fu
rnitu
re, n
.e.s.
, of w
ood
thou
pie
ces
26.8
3.4
26.4
3.4
19.3
1.9
5.3
0.4
0.9
0.1
2.1
0.1
Goo
ds a
nd tr
ansa
ctio
ns, n
ot in
clud
ed in
oth
er S
ITC
cate
gorie
s—
——
——
—
Not
es: N
SC d
ata
in C
IF p
rices
* in
acc
orda
nce
with
cla
ssifi
catio
n w
orke
d ou
t at t
he N
BK
R
I`16
I`17
2016
2014
2013
2015
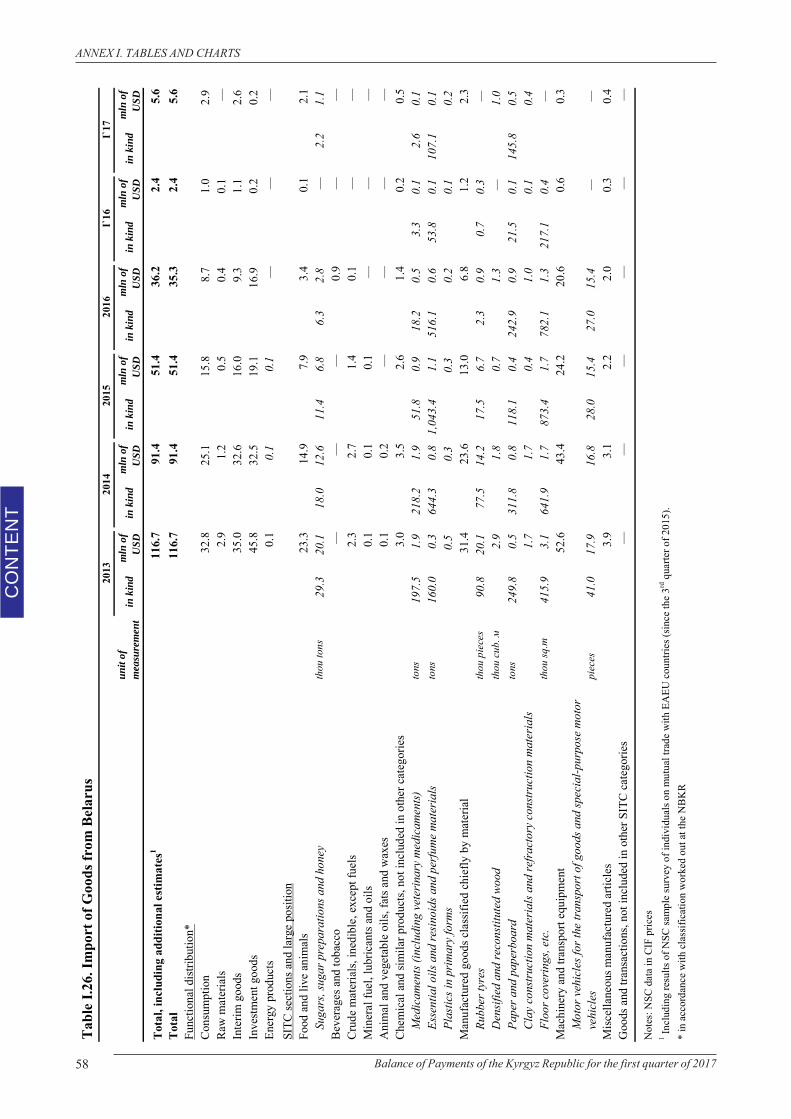
58 Balance of Payments of the Kyrgyz Republic for the first quarter of 2017
CO
NTE
NT
ANNEX I. TABLES AND CHARTS
Tabl
e I.2
6. Im
port
of G
oods
from
Bel
arus
unit
of
mea
sure
men
tin
kin
dm
ln o
f U
SDin
kin
dm
ln o
f U
SDin
kin
dm
ln o
f U
SDin
kin
dm
ln o
f U
SDin
kin
dm
ln o
f U
SDin
kin
dm
ln o
f U
SD
Tota
l, in
clud
ing
addi
tiona
l est
imat
es1
116.
791
.451
.436
.22.
45.
6To
tal
116.
791
.451
.435
.32.
45.
6Fu
nctio
nal d
istrib
utio
n*Co
nsum
ptio
n32
.825
.115
.88.
71.
02.
9Ra
w m
ater
ials
2.9
1.2
0.5
0.4
0.1
—In
terim
goo
ds35
.032
.616
.09.
31.
12.
6In
vestm
ent g
oods
45.8
32.5
19.1
16.9
0.2
0.2
Ener
gy p
rodu
cts
0.1
0.1
0.1
——
—SI
TC se
ctio
ns a
nd la
rge
posit
ion
Food
and
live
ani
mal
s23
.314
.97.
93.
40.
12.
1Su
gars
, sug
ar p
repa
ratio
ns a
nd h
oney
thou
tons
29.3
20.1
18.0
12.6
11.4
6.8
6.3
2.8
—2.
21.
1Be
vera
ges a
nd to
bacc
o—
——
0.9
——
Crud
e m
ater
ials,
ined
ible
, exc
ept f
uels
2.3
2.7
1.4
0.1
——
Min
eral
fuel
, lub
rican
ts an
d oi
ls0.
10.
10.
1—
——
Ani
mal
and
veg
etab
le o
ils, f
ats a
nd w
axes
0.1
0.2
——
——
Chem
ical
and
sim
ilar p
rodu
cts,
not i
nclu
ded
in o
ther
cat
egor
ies
3.0
3.5
2.6
1.4
0.2
0.5
Med
icam
ents
(incl
udin
g ve
terin
ary
med
icam
ents)
tons
197.
51.
921
8.2
1.9
51.8
0.9
18.2
0.5
3.3
0.1
2.6
0.1
Esse
ntia
l oils
and
resi
noid
s and
per
fum
e m
ater
ials
tons
160.
00.
364
4.3
0.8
1,04
3.4
1.1
516.
10.
653
.80.
110
7.1
0.1
Plas
tics i
n pr
imar
y fo
rms
0.5
0.3
0.3
0.2
0.1
0.2
Man
ufac
ture
d go
ods c
lass
ified
chi
efly
by
mat
eria
l31
.423
.613
.06.
81.
22.
3Ru
bber
tyre
sth
ou p
iece
s90
.820
.177
.514
.217
.56.
72.
30.
90.
70.
3—
Den
sifie
d an
d re
cons
titut
ed w
ood
thou
cub
. м2.
91.
80.
71.
3—
1.0
Pape
r and
pap
erbo
ard
tons
249.
80.
531
1.8
0.8
118.
10.
424
2.9
0.9
21.5
0.1
145.
80.
5C
lay
cons
truc
tion
mat
eria
ls a
nd re
frac
tory
con
stru
ctio
n m
ater
ials
1.7
1.7
0.4
1.0
0.1
0.4
Floo
r cov
erin
gs, e
tc.
thou
sq.m
415.
93.
164
1.9
1.7
873.
41.
778
2.1
1.3
217.
10.
4—
Mac
hine
ry a
nd tr
ansp
ort e
quip
men
t52
.643
.424
.220
.60.
60.
3M
otor
veh
icle
s for
the
tran
spor
t of g
oods
and
spec
ial-p
urpo
se m
otor
ve
hicl
espi
eces
41.0
17.9
16.8
28.0
15.4
27.0
15.4
——
Misc
ella
neou
s man
ufac
ture
d ar
ticle
s3.
93.
12.
22.
00.
30.
4G
oods
and
tran
sact
ions
, not
incl
uded
in o
ther
SIT
C ca
tego
ries
——
——
——
Not
es: N
SC d
ata
in C
IF p
rices
1 Incl
udin
g re
sults
of N
SC sa
mpl
e su
rvey
of i
ndiv
idua
ls o
n m
utua
l tra
de w
ith E
AEU
cou
ntrie
s (si
nce
the
3rd q
uarte
r of 2
015)
.*
in a
ccor
danc
e w
ith c
lass
ifica
tion
wor
ked
out a
t the
NB
KR
I`16
I`17
2013
2014
2016
2015
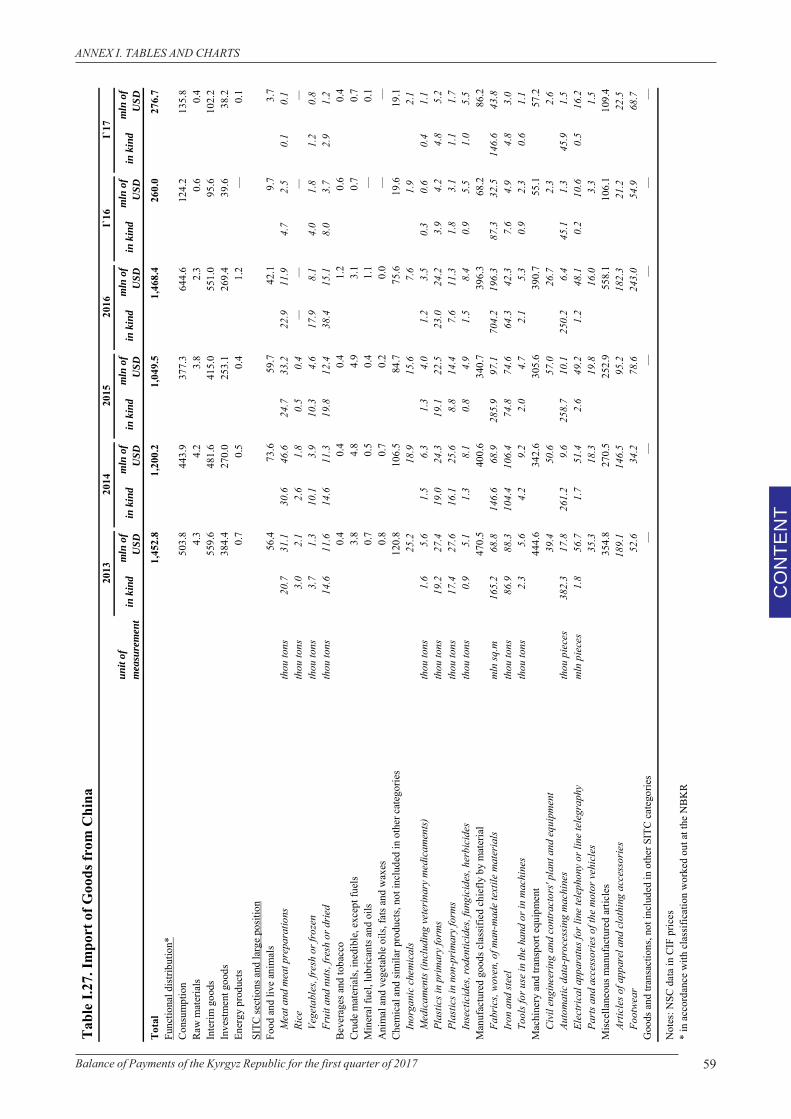
59Balance of Payments of the Kyrgyz Republic for the first quarter of 2017
CO
NTE
NT
ANNEX I. TABLES AND CHARTS
Tabl
e I.2
7. Im
port
of G
oods
from
Chi
na
unit
of
mea
sure
men
tin
kin
dm
ln o
f U
SDin
kin
dm
ln o
f U
SDin
kin
dm
ln o
f U
SDin
kin
dm
ln o
f U
SDin
kin
dm
ln o
f U
SDin
kin
dm
ln o
f U
SD
Tota
l1,
452.
81,
200.
21,
049.
51,
468.
426
0.0
276.
7Fu
nctio
nal d
istrib
utio
n*Co
nsum
ptio
n50
3.8
443.
937
7.3
644.
612
4.2
135.
8Ra
w m
ater
ials
4.3
4.2
3.8
2.3
0.6
0.4
Inte
rim g
oods
559.
648
1.6
415.
055
1.0
95.6
102.
2In
vest
men
t goo
ds38
4.4
270.
025
3.1
269.
439
.638
.2En
ergy
pro
duct
s0.
70.
50.
41.
2—
0.1
SITC
sect
ions
and
larg
e po
sitio
nFo
od a
nd li
ve a
nim
als
56.4
73.6
59.7
42.1
9.7
3.7
Mea
t and
mea
t pre
para
tions
thou
tons
20.7
31.1
30.6
46.6
24.7
33.2
22.9
11.9
4.7
2.5
0.1
0.1
Rice
thou
tons
3.0
2.1
2.6
1.8
0.5
0.4
——
——
Vege
tabl
es, f
resh
or f
roze
nth
ou to
ns3.
71.
310
.13.
910
.34.
617
.98.
14.
01.
81.
20.
8Fr
uit a
nd n
uts,
fres
h or
drie
dth
ou to
ns14
.611
.614
.611
.319
.812
.438
.415
.18.
03.
72.
91.
2Be
vera
ges a
nd to
bacc
o0.
40.
40.
41.
20.
60.
4Cr
ude
mat
eria
ls, in
edib
le, e
xcep
t fue
ls3.
84.
84.
93.
10.
70.
7M
iner
al fu
el, l
ubric
ants
and
oils
0.7
0.5
0.4
1.1
—0.
1A
nim
al a
nd v
eget
able
oils
, fat
s and
wax
es0.
80.
70.
20.
0—
—Ch
emic
al a
nd si
mila
r pro
duct
s, no
t inc
lude
d in
oth
er c
ateg
orie
s12
0.8
106.
584
.775
.619
.619
.1In
orga
nic
chem
ical
s25
.218
.915
.67.
61.
92.
1M
edic
amen
ts (in
clud
ing
vete
rinar
y m
edic
amen
ts)th
ou to
ns1.
65.
61.
56.
31.
34.
01.
23.
50.
30.
60.
41.
1Pl
astic
s in
prim
ary
form
sth
ou to
ns19
.227
.419
.024
.319
.122
.523
.024
.23.
94.
24.
85.
2Pl
astic
s in
non-
prim
ary
form
sth
ou to
ns17
.427
.616
.125
.68.
814
.47.
611
.31.
83.
11.
11.
7In
sect
icid
es, r
oden
ticid
es, f
ungi
cide
s, he
rbic
ides
thou
tons
0.9
5.1
1.3
8.1
0.8
4.9
1.5
8.4
0.9
5.5
1.0
5.5
Man
ufac
ture
d go
ods c
lass
ified
chi
efly
by
mat
eria
l47
0.5
400.
634
0.7
396.
368
.286
.2Fa
bric
s, w
oven
, of m
an-m
ade
text
ile m
ater
ials
m
ln sq
.m16
5.2
68.8
146.
668
.928
5.9
97.1
704.
219
6.3
87.3
32.5
146.
643
.8Ir
on a
nd st
eel
thou
tons
86.9
88.3
104.
410
6.4
74.8
74.6
64.3
42.3
7.6
4.9
4.8
3.0
Tool
s for
use
in th
e ha
nd o
r in
mac
hine
sth
ou to
ns2.
35.
64.
29.
22.
04.
72.
15.
30.
92.
30.
61.
1M
achi
nery
and
tran
spor
t equ
ipm
ent
444.
634
2.6
305.
639
0.7
55.1
57.2
Civi
l eng
inee
ring
and
cont
ract
ors'
plan
t and
equ
ipm
ent
39.4
50.6
57.0
26.7
2.3
2.6
Auto
mat
ic d
ata-
proc
essin
g m
achi
nes
thou
pie
ces
382.
317
.826
1.2
9.6
258.
710
.125
0.2
6.4
45.1
1.3
45.9
1.5
Elec
trica
l app
arat
us fo
r lin
e te
leph
ony
or li
ne te
legr
aphy
mln
pie
ces
1.8
56.7
1.7
51.4
2.6
49.2
1.2
48.1
0.2
10.6
0.5
16.2
Parts
and
acc
esso
ries o
f the
mot
or v
ehic
les
35.3
18.3
19.8
16.0
3.3
1.5
Misc
ella
neou
s man
ufac
ture
d ar
ticle
s35
4.8
270.
525
2.9
558.
110
6.1
109.
4Ar
ticle
s of a
ppar
el a
nd c
loth
ing
acce
ssor
ies
189.
114
6.5
95.2
182.
321
.222
.5Fo
otwe
ar52
.634
.278
.624
3.0
54.9
68.7
Goo
ds a
nd tr
ansa
ctio
ns, n
ot in
clud
ed in
oth
er S
ITC
cate
gorie
s—
——
——
—
Not
es: N
SC d
ata
in C
IF p
rices
* in
acc
orda
nce
with
cla
ssifi
catio
n w
orke
d ou
t at t
he N
BK
R
2014
2015
2013
I`16
I`17
2016
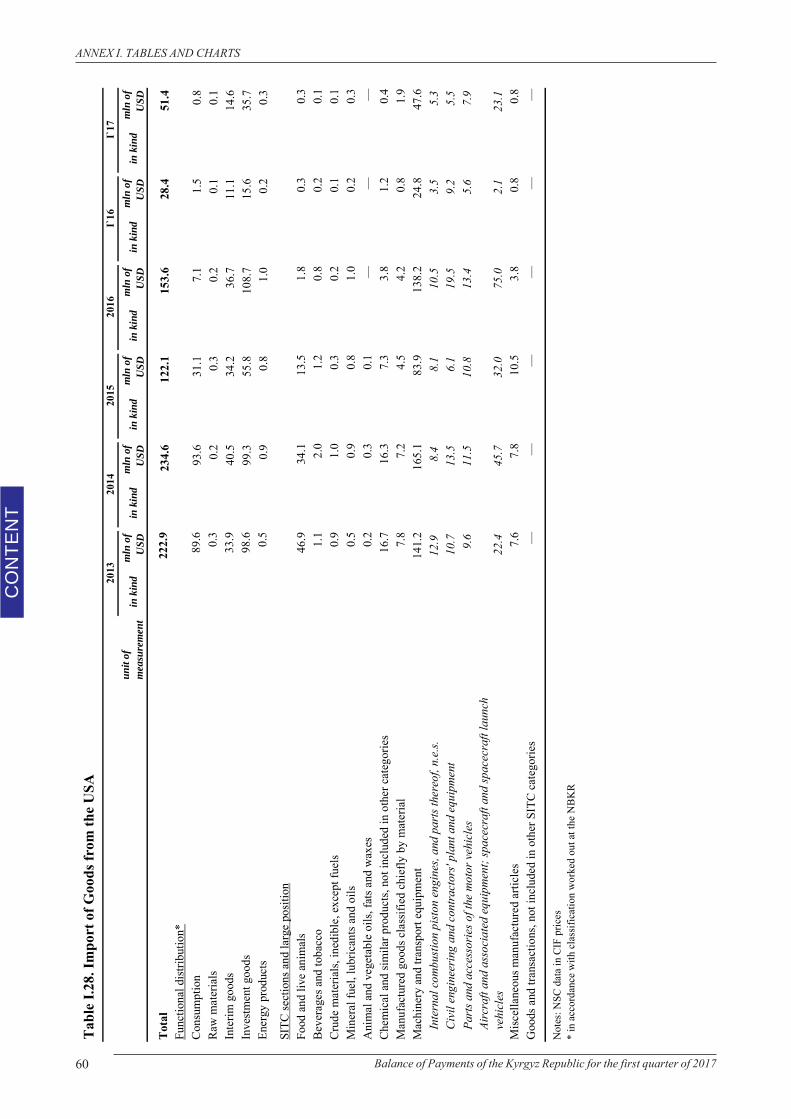
60 Balance of Payments of the Kyrgyz Republic for the first quarter of 2017
CO
NTE
NT
ANNEX I. TABLES AND CHARTS
Tabl
e I.2
8. Im
port
of G
oods
from
the U
SA
unit
of
mea
sure
men
tin
kin
dm
ln o
f U
SDin
kin
dm
ln o
f U
SDin
kin
dm
ln o
f U
SDin
kin
dm
ln o
f U
SDin
kin
dm
ln o
f U
SDin
kin
dm
ln o
f U
SD
Tota
l22
2.9
234.
612
2.1
153.
628
.451
.4Fu
nctio
nal d
istrib
utio
n*Co
nsum
ptio
n89
.693
.631
.17.
11.
50.
8Ra
w m
ater
ials
0.3
0.2
0.3
0.2
0.1
0.1
Inte
rim g
oods
33.9
40.5
34.2
36.7
11.1
14.6
Inve
stmen
t goo
ds98
.699
.355
.810
8.7
15.6
35.7
Ener
gy p
rodu
cts
0.5
0.9
0.8
1.0
0.2
0.3
SITC
sect
ions
and
larg
e po
sitio
nFo
od a
nd li
ve a
nim
als
46.9
34.1
13.5
1.8
0.3
0.3
Beve
rage
s and
toba
cco
1.1
2.0
1.2
0.8
0.2
0.1
Crud
e m
ater
ials,
ined
ible
, exc
ept f
uels
0.9
1.0
0.3
0.2
0.1
0.1
Min
eral
fuel
, lub
rican
ts an
d oi
ls0.
50.
90.
81.
00.
20.
3A
nim
al a
nd v
eget
able
oils
, fat
s and
wax
es0.
20.
30.
1—
——
Chem
ical
and
sim
ilar p
rodu
cts,
not i
nclu
ded
in o
ther
cat
egor
ies
16.7
16.3
7.3
3.8
1.2
0.4
Man
ufac
ture
d go
ods c
lass
ified
chi
efly
by
mat
eria
l7.
87.
24.
54.
20.
81.
9M
achi
nery
and
tran
spor
t equ
ipm
ent
141.
216
5.1
83.9
138.
224
.847
.6In
tern
al c
ombu
stion
pist
on e
ngin
es, a
nd p
arts
ther
eof,
n.e.
s.12
.98.
48.
110
.53.
55.
3C
ivil
engi
neer
ing
and
cont
ract
ors'
plan
t and
equ
ipm
ent
10.7
13.5
6.1
19.5
9.2
5.5
Parts
and
acc
esso
ries o
f the
mot
or v
ehic
les
9.6
11.5
10.8
13.4
5.6
7.9
Airc
raft
and
asso
ciat
ed e
quip
men
t; sp
acec
raft
and
spac
ecra
ft la
unch
ve
hicl
es22
.445
.732
.075
.02.
123
.1M
iscel
lane
ous m
anuf
actu
red
artic
les
7.6
7.8
10.5
3.8
0.8
0.8
Goo
ds a
nd tr
ansa
ctio
ns, n
ot in
clud
ed in
oth
er S
ITC
cate
gorie
s—
——
——
—
Not
es: N
SC d
ata
in C
IF p
rices
* in
acc
orda
nce
with
cla
ssifi
catio
n w
orke
d ou
t at t
he N
BK
R
2013
I`16
I`17
2016
2015
2014
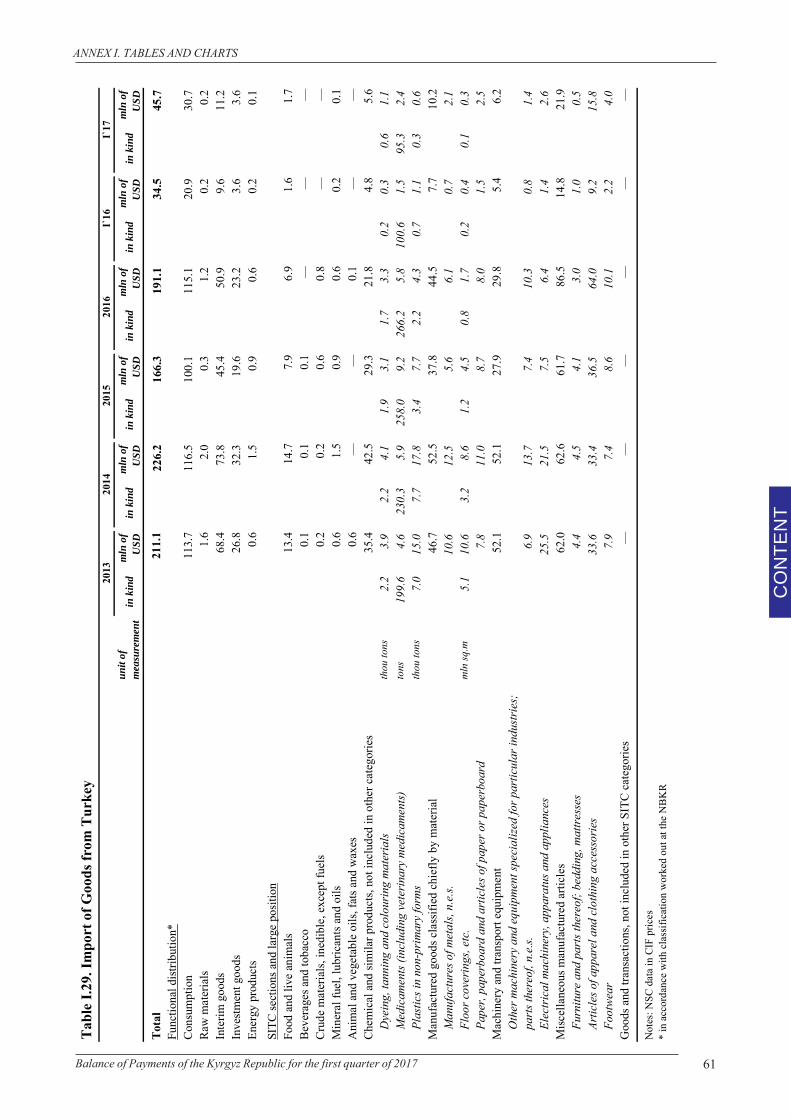
61Balance of Payments of the Kyrgyz Republic for the first quarter of 2017
CO
NTE
NT
ANNEX I. TABLES AND CHARTS
Tabl
e I.2
9. Im
port
of G
oods
from
Tur
key
unit
of
mea
sure
men
tin
kin
dm
ln o
f U
SDin
kin
dm
ln o
f U
SDin
kin
dm
ln o
f U
SDin
kin
dm
ln o
f U
SDin
kin
dm
ln o
f U
SDin
kin
dm
ln o
f U
SD
Tota
l21
1.1
226.
216
6.3
191.
134
.545
.7Fu
nctio
nal d
istrib
utio
n*Co
nsum
ptio
n11
3.7
116.
510
0.1
115.
120
.930
.7Ra
w m
ater
ials
1.6
2.0
0.3
1.2
0.2
0.2
Inte
rim g
oods
68.4
73.8
45.4
50.9
9.6
11.2
Inve
stmen
t goo
ds26
.832
.319
.623
.23.
63.
6En
ergy
pro
duct
s0.
61.
50.
90.
60.
20.
1SI
TC se
ctio
ns a
nd la
rge
posit
ion
Food
and
live
ani
mal
s13
.414
.77.
96.
91.
61.
7Be
vera
ges a
nd to
bacc
o0.
10.
10.
1—
——
Crud
e m
ater
ials,
ined
ible
, exc
ept f
uels
0.2
0.2
0.6
0.8
——
Min
eral
fuel
, lub
rican
ts an
d oi
ls0.
61.
50.
90.
60.
20.
1A
nim
al a
nd v
eget
able
oils
, fat
s and
wax
es0.
6—
—0.
1—
—Ch
emic
al a
nd si
mila
r pro
duct
s, no
t inc
lude
d in
oth
er c
ateg
orie
s35
.442
.529
.321
.84.
85.
6D
yein
g, ta
nnin
g an
d co
lour
ing
mat
eria
lsth
ou to
ns2.
23.
92.
24.
11.
93.
11.
73.
30.
20.
30.
61.
1M
edic
amen
ts (in
clud
ing
vete
rinar
y m
edic
amen
ts)to
ns19
9.6
4.6
230.
35.
925
8.0
9.2
266.
25.
810
0.6
1.5
95.3
2.4
Plas
tics i
n no
n-pr
imar
y fo
rms
thou
tons
7.0
15.0
7.7
17.8
3.4
7.7
2.2
4.3
0.7
1.1
0.3
0.6
Man
ufac
ture
d go
ods c
lass
ified
chi
efly
by
mat
eria
l46
.752
.537
.844
.57.
710
.2M
anuf
actu
res o
f met
als,
n.e.
s.10
.612
.55.
66.
10.
72.
1Fl
oor c
over
ings
, etc
.m
ln sq
.m5.
110
.63.
28.
61.
24.
50.
81.
70.
20.
40.
10.
3Pa
per,
pape
rboa
rd a
nd a
rtic
les o
f pap
er o
r pap
erbo
ard
7.8
11.0
8.7
8.0
1.5
2.5
Mac
hine
ry a
nd tr
ansp
ort e
quip
men
t52
.152
.127
.929
.85.
46.
2O
ther
mac
hine
ry a
nd e
quip
men
t spe
cial
ized
for p
artic
ular
indu
stri
es;
parts
ther
eof,
n.e.
s.6.
913
.77.
410
.30.
81.
4El
ectr
ical
mac
hine
ry, a
ppar
atus
and
app
lianc
es25
.521
.57.
56.
41.
42.
6M
iscel
lane
ous m
anuf
actu
red
artic
les
62.0
62.6
61.7
86.5
14.8
21.9
Furn
iture
and
par
ts th
ereo
f; be
ddin
g, m
attr
esse
s4.
44.
54.
13.
01.
00.
5Ar
ticle
s of a
ppar
el a
nd c
loth
ing
acce
ssor
ies
33.6
33.4
36.5
64.0
9.2
15.8
Foot
wea
r7.
97.
48.
610
.12.
24.
0G
oods
and
tran
sact
ions
, not
incl
uded
in o
ther
SIT
C ca
tego
ries
——
——
——
Not
es: N
SC d
ata
in C
IF p
rices
* in
acc
orda
nce
with
cla
ssifi
catio
n w
orke
d ou
t at t
he N
BK
R
I`17
2013
2016
2015
2014
I`16
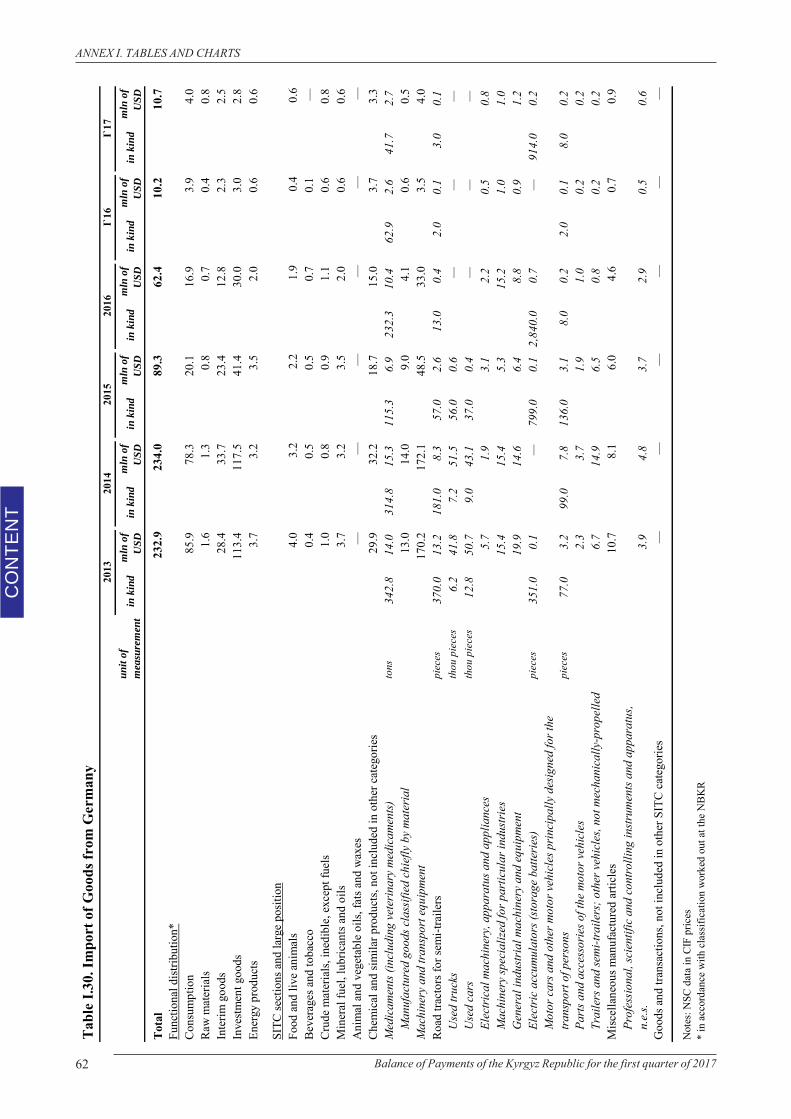
62 Balance of Payments of the Kyrgyz Republic for the first quarter of 2017
CO
NTE
NT
ANNEX I. TABLES AND CHARTS
Tabl
e I.3
0. Im
port
of G
oods
from
Ger
man
y
unit
of
mea
sure
men
tin
kin
dm
ln o
f U
SDin
kin
dm
ln o
f U
SDin
kin
dm
ln o
f U
SDin
kin
dm
ln o
f U
SDin
kin
dm
ln o
f U
SDin
kin
dm
ln o
f U
SD
Tota
l23
2.9
234.
089
.362
.410
.210
.7Fu
nctio
nal d
istrib
utio
n*Co
nsum
ptio
n85
.978
.320
.116
.93.
94.
0Ra
w m
ater
ials
1.6
1.3
0.8
0.7
0.4
0.8
Inte
rim g
oods
28.4
33.7
23.4
12.8
2.3
2.5
Inve
stmen
t goo
ds11
3.4
117.
541
.430
.03.
02.
8En
ergy
pro
duct
s3.
73.
23.
52.
00.
60.
6
SITC
sect
ions
and
larg
e po
sitio
nFo
od a
nd li
ve a
nim
als
4.0
3.2
2.2
1.9
0.4
0.6
Beve
rage
s and
toba
cco
0.4
0.5
0.5
0.7
0.1
—Cr
ude
mat
eria
ls, in
edib
le, e
xcep
t fue
ls1.
00.
80.
91.
10.
60.
8M
iner
al fu
el, l
ubric
ants
and
oils
3.7
3.2
3.5
2.0
0.6
0.6
Ani
mal
and
veg
etab
le o
ils, f
ats a
nd w
axes
——
——
——
Chem
ical
and
sim
ilar p
rodu
cts,
not i
nclu
ded
in o
ther
cat
egor
ies
29.9
32.2
18.7
15.0
3.7
3.3
Med
icam
ents
(inc
ludi
ng v
eter
inar
y m
edic
amen
ts)to
ns34
2.8
14.0
314.
815
.311
5.3
6.9
232.
310
.462
.92.
641
.72.
7M
anuf
actu
red
good
s cla
ssifi
ed c
hief
ly b
y m
ater
ial
13.0
14.0
9.0
4.1
0.6
0.5
Mac
hine
ry a
nd tr
ansp
ort e
quip
men
t17
0.2
172.
148
.533
.03.
54.
0Ro
ad tr
acto
rs fo
r sem
i-tra
ilers
piec
es37
0.0
13.2
181.
08.
357
.02.
613
.00.
42.
00.
13.
00.
1U
sed
truc
ksth
ou p
iece
s6.
241
.87.
251
.556
.00.
6—
——
Use
d ca
rsth
ou p
iece
s12
.850
.79.
043
.137
.00.
4—
——
Elec
tric
al m
achi
nery
, app
arat
us a
nd a
pplia
nces
5.7
1.9
3.1
2.2
0.5
0.8
Mac
hine
ry sp
ecia
lized
for p
artic
ular
indu
stri
es15
.415
.45.
315
.21.
01.
0G
ener
al in
dust
rial
mac
hine
ry a
nd e
quip
men
t19
.914
.66.
48.
80.
91.
2El
ectr
ic a
ccum
ulat
ors (
stor
age
batte
ries
)pi
eces
351.
00.
1—
799.
00.
12,
840.
00.
7—
914.
00.
2M
otor
car
s and
oth
er m
otor
veh
icle
s pri
ncip
ally
des
igne
d fo
r the
tr
ansp
ort o
f per
sons
piec
es77
.03.
299
.07.
813
6.0
3.1
8.0
0.2
2.0
0.1
8.0
0.2
Parts
and
acc
esso
ries o
f the
mot
or v
ehic
les
2.3
3.7
1.9
1.0
0.2
0.2
Trai
lers
and
sem
i-tra
ilers
; oth
er v
ehic
les,
not m
echa
nica
lly-p
rope
lled
6.7
14.9
6.5
0.8
0.2
0.2
Misc
ella
neou
s man
ufac
ture
d ar
ticle
s10
.78.
16.
04.
60.
70.
9Pr
ofes
sion
al, s
cien
tific
and
con
trol
ling
inst
rum
ents
and
app
arat
us,
n.e.
s.3.
94.
83.
72.
90.
50.
6G
oods
and
tran
sact
ions
, not
incl
uded
in o
ther
SIT
C ca
tego
ries
——
——
——
Not
es: N
SC d
ata
in C
IF p
rices
* in
acc
orda
nce
with
cla
ssifi
catio
n w
orke
d ou
t at t
he N
BKR
2013
I`16
I`17
2016
2015
2014
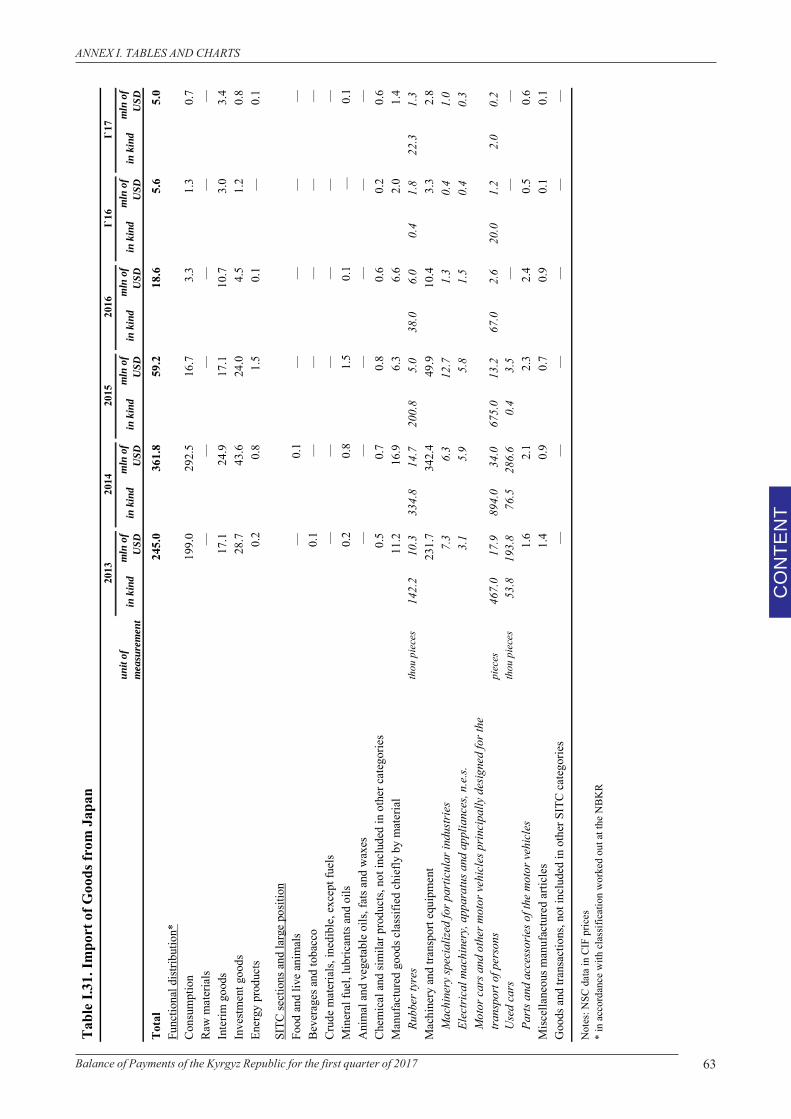
63Balance of Payments of the Kyrgyz Republic for the first quarter of 2017
CO
NTE
NT
ANNEX I. TABLES AND CHARTS
Tabl
e I.3
1. Im
port
of G
oods
from
Jap
an
unit
of
mea
sure
men
tin
kin
dm
ln o
f U
SDin
kin
dm
ln o
f U
SDin
kin
dm
ln o
f U
SDin
kin
dm
ln o
f U
SDin
kin
dm
ln o
f U
SDin
kin
dm
ln o
f U
SD
Tota
l24
5.0
361.
859
.218
.65.
65.
0Fu
nctio
nal d
istrib
utio
n*Co
nsum
ptio
n19
9.0
292.
516
.73.
31.
30.
7Ra
w m
ater
ials
——
——
——
Inte
rim g
oods
17.1
24.9
17.1
10.7
3.0
3.4
Inve
stmen
t goo
ds28
.743
.624
.04.
51.
20.
8En
ergy
pro
duct
s0.
20.
81.
50.
1—
0.1
SITC
sect
ions
and
larg
e po
sitio
nFo
od a
nd li
ve a
nim
als
—0.
1—
——
—Be
vera
ges a
nd to
bacc
o0.
1—
——
——
Crud
e m
ater
ials,
ined
ible
, exc
ept f
uels
——
——
——
Min
eral
fuel
, lub
rican
ts an
d oi
ls0.
20.
81.
50.
1—
0.1
Ani
mal
and
veg
etab
le o
ils, f
ats a
nd w
axes
——
——
——
Chem
ical
and
sim
ilar p
rodu
cts,
not i
nclu
ded
in o
ther
cat
egor
ies
0.5
0.7
0.8
0.6
0.2
0.6
Man
ufac
ture
d go
ods c
lass
ified
chi
efly
by
mat
eria
l11
.216
.96.
36.
62.
01.
4Ru
bber
tyre
sth
ou p
iece
s14
2.2
10.3
334.
814
.720
0.8
5.0
38.0
6.0
0.4
1.8
22.3
1.3
Mac
hine
ry a
nd tr
ansp
ort e
quip
men
t23
1.7
342.
449
.910
.43.
32.
8M
achi
nery
spec
ializ
ed fo
r par
ticul
ar in
dust
ries
7.3
6.3
12.7
1.3
0.4
1.0
Elec
tric
al m
achi
nery
, app
arat
us a
nd a
pplia
nces
, n.e
.s.3.
15.
95.
81.
50.
40.
3M
otor
car
s and
oth
er m
otor
veh
icle
s prin
cipa
lly d
esig
ned
for t
he
tran
spor
t of p
erso
nspi
eces
467.
017
.989
4.0
34.0
675.
013
.267
.02.
620
.01.
22.
00.
2U
sed
cars
thou
pie
ces
53.8
193.
876
.528
6.6
0.4
3.5
——
—Pa
rts a
nd a
cces
sorie
s of t
he m
otor
veh
icle
s1.
62.
12.
32.
40.
50.
6M
iscel
lane
ous m
anuf
actu
red
artic
les
1.4
0.9
0.7
0.9
0.1
0.1
Goo
ds a
nd tr
ansa
ctio
ns, n
ot in
clud
ed in
oth
er S
ITC
cate
gorie
s—
——
——
—
Not
es: N
SC d
ata
in C
IF p
rices
* in
acc
orda
nce
with
cla
ssifi
catio
n w
orke
d ou
t at t
he N
BK
R
I`16
I`17
2016
2014
2013
2015
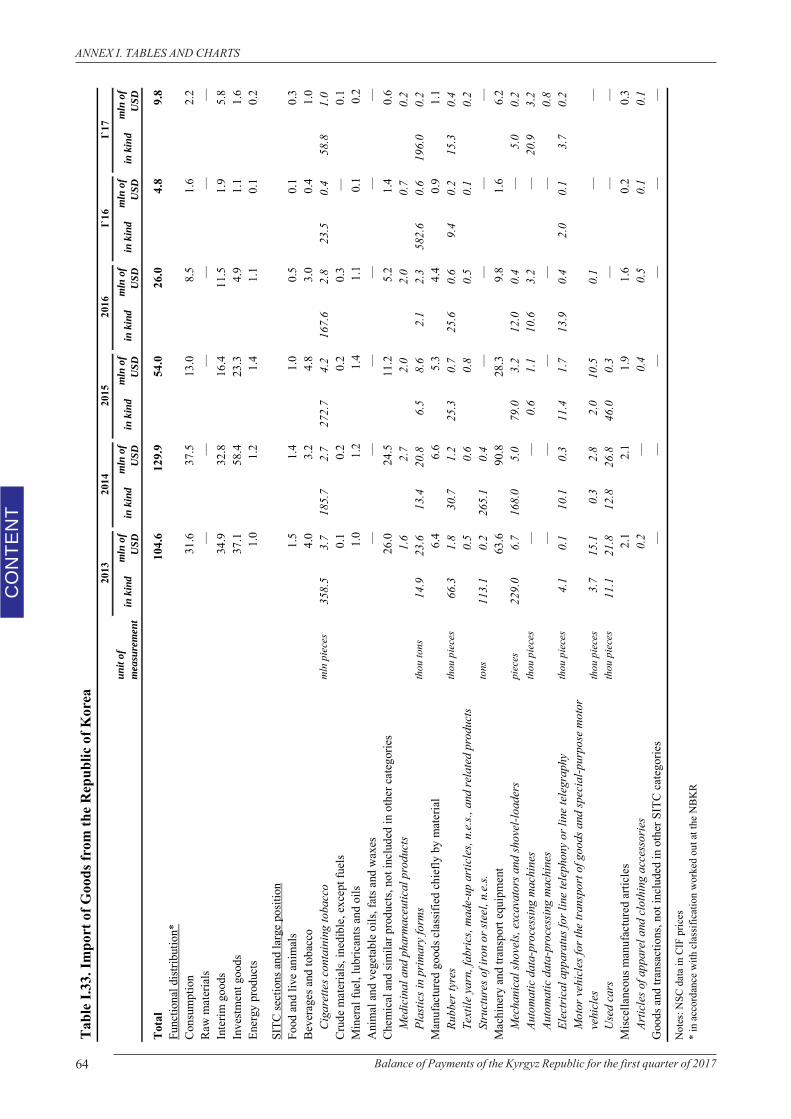
64 Balance of Payments of the Kyrgyz Republic for the first quarter of 2017
CO
NTE
NT
ANNEX I. TABLES AND CHARTS
Tabl
e I.3
3. Im
port
of G
oods
from
the R
epub
lic o
f Kor
ea
unit
of
mea
sure
men
tin
kin
dm
ln o
f U
SDin
kin
dm
ln o
f U
SDin
kin
dm
ln o
f U
SDin
kin
dm
ln o
f U
SDin
kin
dm
ln o
f U
SDin
kin
dm
ln o
f U
SD
Tota
l10
4.6
129.
954
.026
.04.
89.
8Fu
nctio
nal d
istrib
utio
n*Co
nsum
ptio
n31
.637
.513
.08.
51.
62.
2Ra
w m
ater
ials
——
——
——
Inte
rim g
oods
34.9
32.8
16.4
11.5
1.9
5.8
Inve
stmen
t goo
ds37
.158
.423
.34.
91.
11.
6En
ergy
pro
duct
s1.
01.
21.
41.
10.
10.
2
SITC
sect
ions
and
larg
e po
sitio
nFo
od a
nd li
ve a
nim
als
1.5
1.4
1.0
0.5
0.1
0.3
Beve
rage
s and
toba
cco
4.0
3.2
4.8
3.0
0.4
1.0
Cig
aret
tes c
onta
inin
g to
bacc
om
ln p
iece
s35
8.5
3.7
185.
72.
727
2.7
4.2
167.
62.
823
.50.
458
.81.
0Cr
ude
mat
eria
ls, in
edib
le, e
xcep
t fue
ls0.
10.
20.
20.
3—
0.1
Min
eral
fuel
, lub
rican
ts an
d oi
ls1.
01.
21.
41.
10.
10.
2A
nim
al a
nd v
eget
able
oils
, fat
s and
wax
es—
——
——
—Ch
emic
al a
nd si
mila
r pro
duct
s, no
t inc
lude
d in
oth
er c
ateg
orie
s26
.024
.511
.25.
21.
40.
6M
edic
inal
and
pha
rmac
eutic
al p
rodu
cts
1.6
2.7
2.0
2.0
0.7
0.2
Plas
tics i
n pr
imar
y fo
rms
thou
tons
14.9
23.6
13.4
20.8
6.5
8.6
2.1
2.3
582.
60.
619
6.0
0.2
Man
ufac
ture
d go
ods c
lass
ified
chi
efly
by
mat
eria
l6.
46.
65.
34.
40.
91.
1Ru
bber
tyre
sth
ou p
iece
s66
.31.
830
.71.
225
.30.
725
.60.
69.
40.
215
.30.
4Te
xtile
yar
n, fa
bric
s, m
ade-
up a
rtic
les,
n.e.
s., a
nd re
late
d pr
oduc
ts0.
50.
60.
80.
50.
10.
2St
ruct
ures
of i
ron
or st
eel,
n.e.
s.to
ns11
3.1
0.2
265.
10.
4—
——
—M
achi
nery
and
tran
spor
t equ
ipm
ent
63.6
90.8
28.3
9.8
1.6
6.2
Mec
hani
cal s
hove
ls, e
xcav
ator
s and
shov
el-lo
ader
spi
eces
229.
06.
716
8.0
5.0
79.0
3.2
12.0
0.4
—5.
00.
2Au
tom
atic
dat
a-pr
oces
sing
mac
hine
sth
ou p
iece
s—
—0.
61.
110
.63.
2—
20.9
3.2
Auto
mat
ic d
ata-
proc
essin
g m
achi
nes
——
——
—0.
8El
ectr
ical
app
arat
us fo
r lin
e te
leph
ony
or li
ne te
legr
aphy
thou
pie
ces
4.1
0.1
10.1
0.3
11.4
1.7
13.9
0.4
2.0
0.1
3.7
0.2
Mot
or v
ehic
les f
or th
e tr
ansp
ort o
f goo
ds a
nd sp
ecia
l-pur
pose
mot
or
vehi
cles
thou
pie
ces
3.7
15.1
0.3
2.8
2.0
10.5
0.1
——
Use
d ca
rsth
ou p
iece
s11
.121
.812
.826
.846
.00.
3—
——
Misc
ella
neou
s man
ufac
ture
d ar
ticle
s2.
12.
11.
91.
60.
20.
3Ar
ticle
s of a
ppar
el a
nd c
loth
ing
acce
ssor
ies
0.2
—0.
40.
50.
10.
1G
oods
and
tran
sact
ions
, not
incl
uded
in o
ther
SIT
C ca
tego
ries
——
——
——
Not
es: N
SC d
ata
in C
IF p
rices
* in
acc
orda
nce
with
cla
ssifi
catio
n w
orke
d ou
t at t
he N
BK
R
I`16
I`17
2016
2015
2014
2013
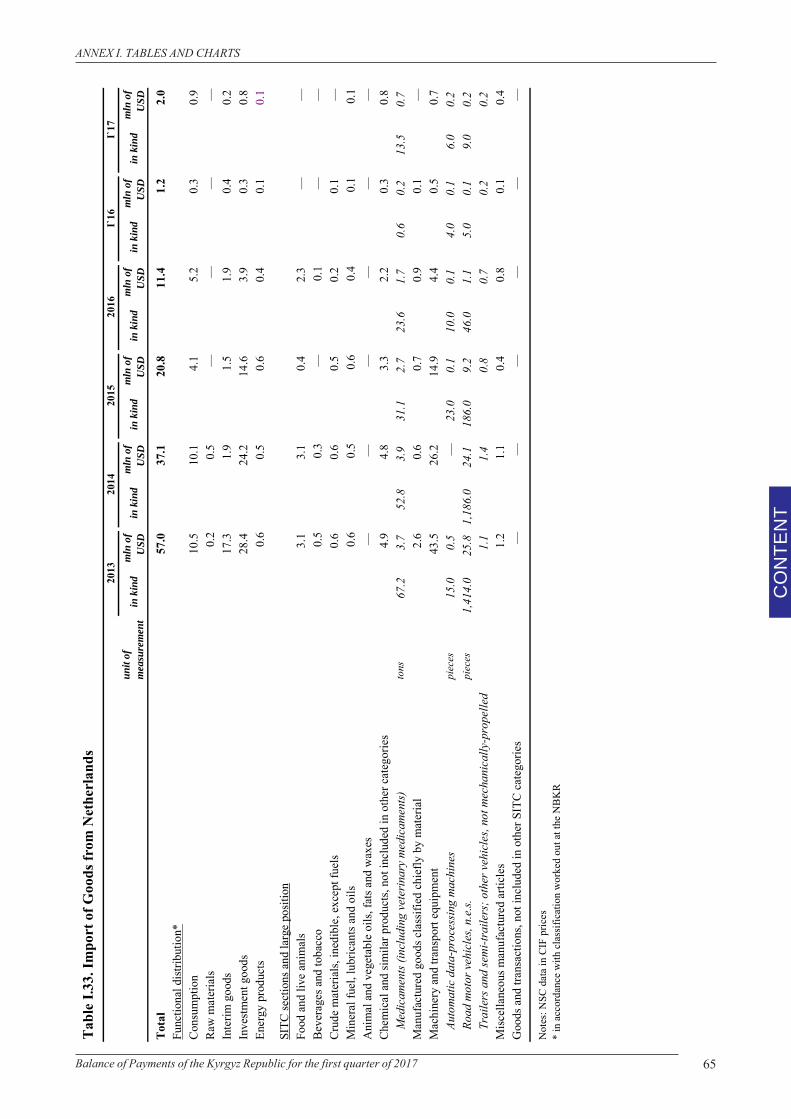
65Balance of Payments of the Kyrgyz Republic for the first quarter of 2017
CO
NTE
NT
ANNEX I. TABLES AND CHARTS
Tabl
e I.3
3. Im
port
of G
oods
from
Net
herl
ands
unit
of
mea
sure
men
tin
kin
dm
ln o
f U
SDin
kin
dm
ln o
f U
SDin
kin
dm
ln o
f U
SDin
kin
dm
ln o
f U
SDin
kin
dm
ln o
f U
SDin
kin
dm
ln o
f U
SD
Tota
l57
.037
.120
.811
.41.
22.
0Fu
nctio
nal d
istrib
utio
n*Co
nsum
ptio
n10
.510
.14.
15.
20.
30.
9Ra
w m
ater
ials
0.2
0.5
——
——
Inte
rim g
oods
17.3
1.9
1.5
1.9
0.4
0.2
Inve
stmen
t goo
ds28
.424
.214
.63.
90.
30.
8En
ergy
pro
duct
s0.
60.
50.
60.
40.
10.
1
SITC
sect
ions
and
larg
e po
sitio
nFo
od a
nd li
ve a
nim
als
3.1
3.1
0.4
2.3
——
Beve
rage
s and
toba
cco
0.5
0.3
—0.
1—
—Cr
ude
mat
eria
ls, in
edib
le, e
xcep
t fue
ls0.
60.
60.
50.
20.
1—
Min
eral
fuel
, lub
rican
ts an
d oi
ls0.
60.
50.
60.
40.
10.
1A
nim
al a
nd v
eget
able
oils
, fat
s and
wax
es—
——
——
—Ch
emic
al a
nd si
mila
r pro
duct
s, no
t inc
lude
d in
oth
er c
ateg
orie
s4.
94.
83.
32.
20.
30.
8M
edic
amen
ts (in
clud
ing
vete
rinar
y m
edic
amen
ts)to
ns67
.23.
752
.83.
931
.12.
723
.61.
70.
60.
213
.50.
7M
anuf
actu
red
good
s cla
ssifi
ed c
hief
ly b
y m
ater
ial
2.6
0.6
0.7
0.9
0.1
—M
achi
nery
and
tran
spor
t equ
ipm
ent
43.5
26.2
14.9
4.4
0.5
0.7
Auto
mat
ic d
ata-
proc
essin
g m
achi
nes
piec
es15
.00.
5—
23.0
0.1
10.0
0.1
4.0
0.1
6.0
0.2
Road
mot
or v
ehic
les,
n.e.
s.pi
eces
1,41
4.0
25.8
1,18
6.0
24.1
186.
09.
246
.01.
15.
00.
19.
00.
2Tr
aile
rs a
nd se
mi-t
raile
rs; o
ther
veh
icle
s, no
t mec
hani
cally
-pro
pelle
d1.
11.
40.
80.
70.
20.
2M
iscel
lane
ous m
anuf
actu
red
artic
les
1.2
1.1
0.4
0.8
0.1
0.4
Goo
ds a
nd tr
ansa
ctio
ns, n
ot in
clud
ed in
oth
er S
ITC
cate
gorie
s—
——
——
—
Not
es: N
SC d
ata
in C
IF p
rices
* in
acc
orda
nce
with
cla
ssifi
catio
n w
orke
d ou
t at t
he N
BK
R
I`17
2014
2016
2015
2013
I`16
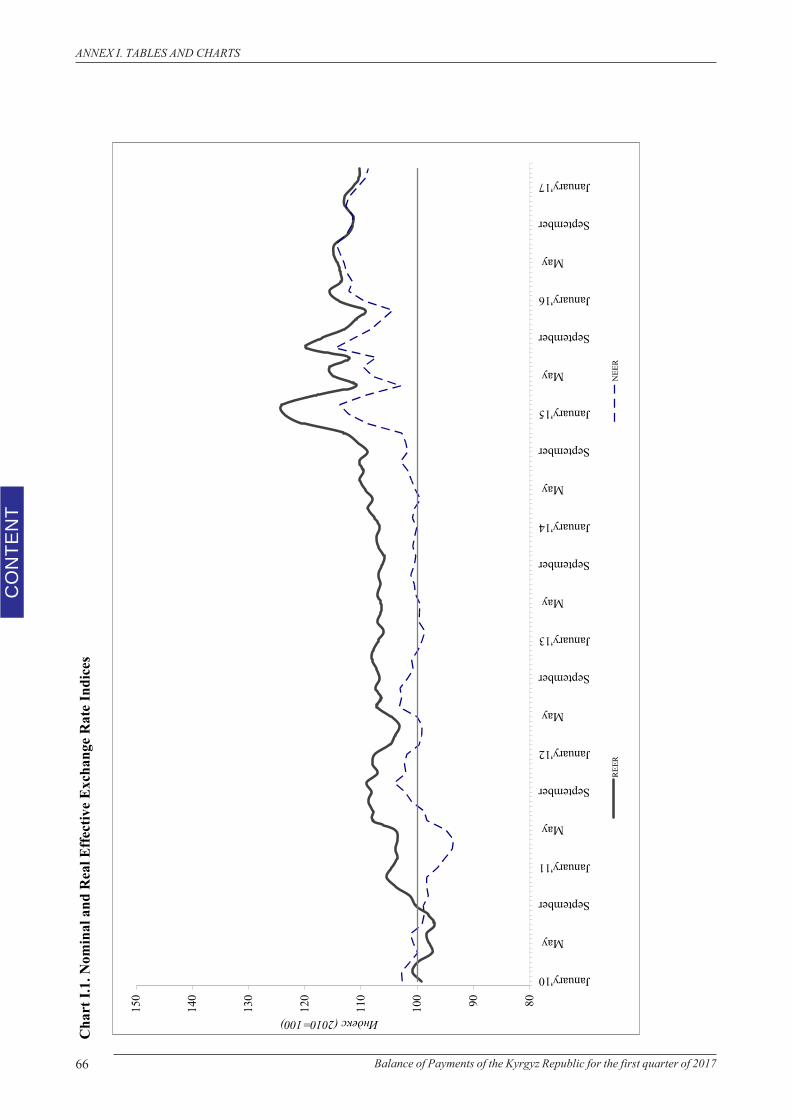
66 Balance of Payments of the Kyrgyz Republic for the first quarter of 2017
CO
NTE
NT
ANNEX I. TABLES AND CHARTS
Cha
rt I.
1. N
omin
al a
nd R
eal E
ffect
ive
Exch
ange
Rat
e In
dice
s
8090100
110
120
130
140
150
January'10
May
September
January'11
May
September
January'12
May
September
January'13
May
September
January'14
May
September
January'15
May
September
January'16
May
September
January'17
Индекс (2010=100)
REER
NEE
R
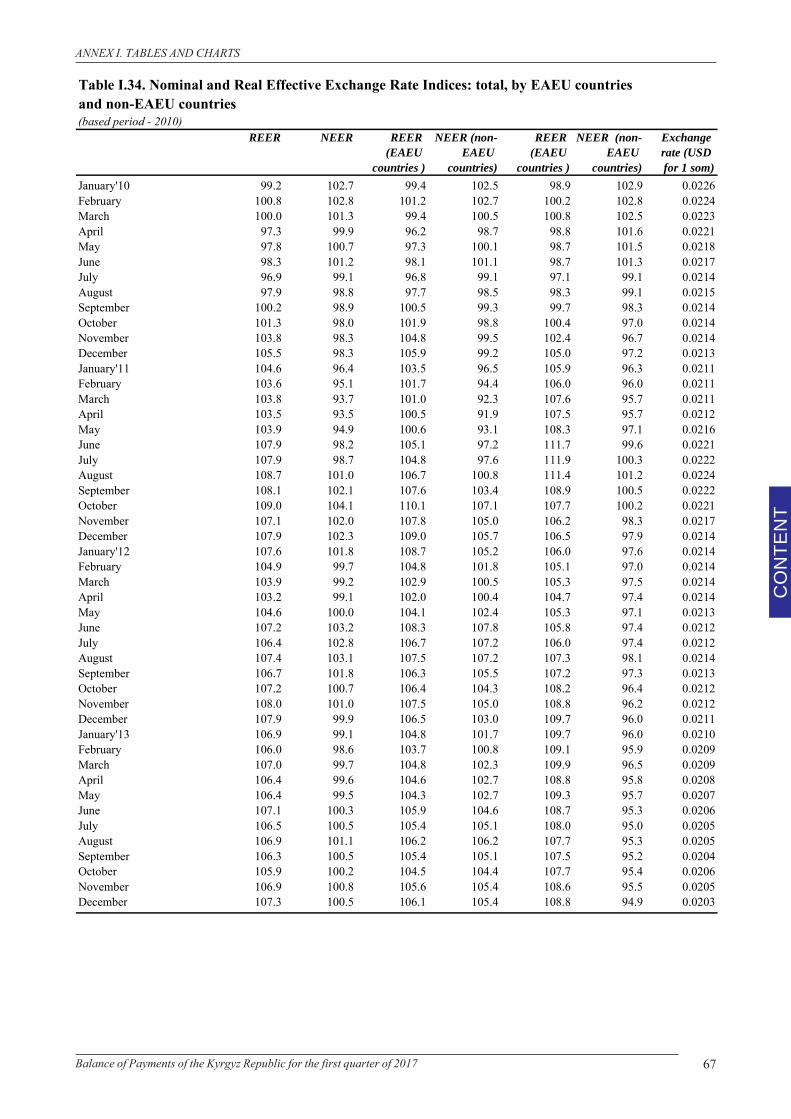
67Balance of Payments of the Kyrgyz Republic for the first quarter of 2017
CO
NTE
NT
ANNEX I. TABLES AND CHARTS
Table I.34. Nominal and Real Effective Exchange Rate Indices: total, by EAEU countriesand non-EAEU countries(based period - 2010)
REER NEER REER (EAEU
countries )
NEER (non-EAEU
countries)
REER (EAEU
countries )
NEER (non-EAEU
countries)
Exchange rate (USD for 1 som)
January'10 99.2 102.7 99.4 102.5 98.9 102.9 0.0226February 100.8 102.8 101.2 102.7 100.2 102.8 0.0224March 100.0 101.3 99.4 100.5 100.8 102.5 0.0223April 97.3 99.9 96.2 98.7 98.8 101.6 0.0221May 97.8 100.7 97.3 100.1 98.7 101.5 0.0218June 98.3 101.2 98.1 101.1 98.7 101.3 0.0217July 96.9 99.1 96.8 99.1 97.1 99.1 0.0214August 97.9 98.8 97.7 98.5 98.3 99.1 0.0215September 100.2 98.9 100.5 99.3 99.7 98.3 0.0214October 101.3 98.0 101.9 98.8 100.4 97.0 0.0214November 103.8 98.3 104.8 99.5 102.4 96.7 0.0214December 105.5 98.3 105.9 99.2 105.0 97.2 0.0213January'11 104.6 96.4 103.5 96.5 105.9 96.3 0.0211February 103.6 95.1 101.7 94.4 106.0 96.0 0.0211March 103.8 93.7 101.0 92.3 107.6 95.7 0.0211April 103.5 93.5 100.5 91.9 107.5 95.7 0.0212May 103.9 94.9 100.6 93.1 108.3 97.1 0.0216June 107.9 98.2 105.1 97.2 111.7 99.6 0.0221July 107.9 98.7 104.8 97.6 111.9 100.3 0.0222August 108.7 101.0 106.7 100.8 111.4 101.2 0.0224September 108.1 102.1 107.6 103.4 108.9 100.5 0.0222October 109.0 104.1 110.1 107.1 107.7 100.2 0.0221November 107.1 102.0 107.8 105.0 106.2 98.3 0.0217December 107.9 102.3 109.0 105.7 106.5 97.9 0.0214January'12 107.6 101.8 108.7 105.2 106.0 97.6 0.0214February 104.9 99.7 104.8 101.8 105.1 97.0 0.0214March 103.9 99.2 102.9 100.5 105.3 97.5 0.0214April 103.2 99.1 102.0 100.4 104.7 97.4 0.0214May 104.6 100.0 104.1 102.4 105.3 97.1 0.0213June 107.2 103.2 108.3 107.8 105.8 97.4 0.0212July 106.4 102.8 106.7 107.2 106.0 97.4 0.0212August 107.4 103.1 107.5 107.2 107.3 98.1 0.0214September 106.7 101.8 106.3 105.5 107.2 97.3 0.0213October 107.2 100.7 106.4 104.3 108.2 96.4 0.0212November 108.0 101.0 107.5 105.0 108.8 96.2 0.0212December 107.9 99.9 106.5 103.0 109.7 96.0 0.0211January'13 106.9 99.1 104.8 101.7 109.7 96.0 0.0210February 106.0 98.6 103.7 100.8 109.1 95.9 0.0209March 107.0 99.7 104.8 102.3 109.9 96.5 0.0209April 106.4 99.6 104.6 102.7 108.8 95.8 0.0208May 106.4 99.5 104.3 102.7 109.3 95.7 0.0207June 107.1 100.3 105.9 104.6 108.7 95.3 0.0206July 106.5 100.5 105.4 105.1 108.0 95.0 0.0205August 106.9 101.1 106.2 106.2 107.7 95.3 0.0205September 106.3 100.5 105.4 105.1 107.5 95.2 0.0204October 105.9 100.2 104.5 104.4 107.7 95.4 0.0206November 106.9 100.8 105.6 105.4 108.6 95.5 0.0205December 107.3 100.5 106.1 105.4 108.8 94.9 0.0203
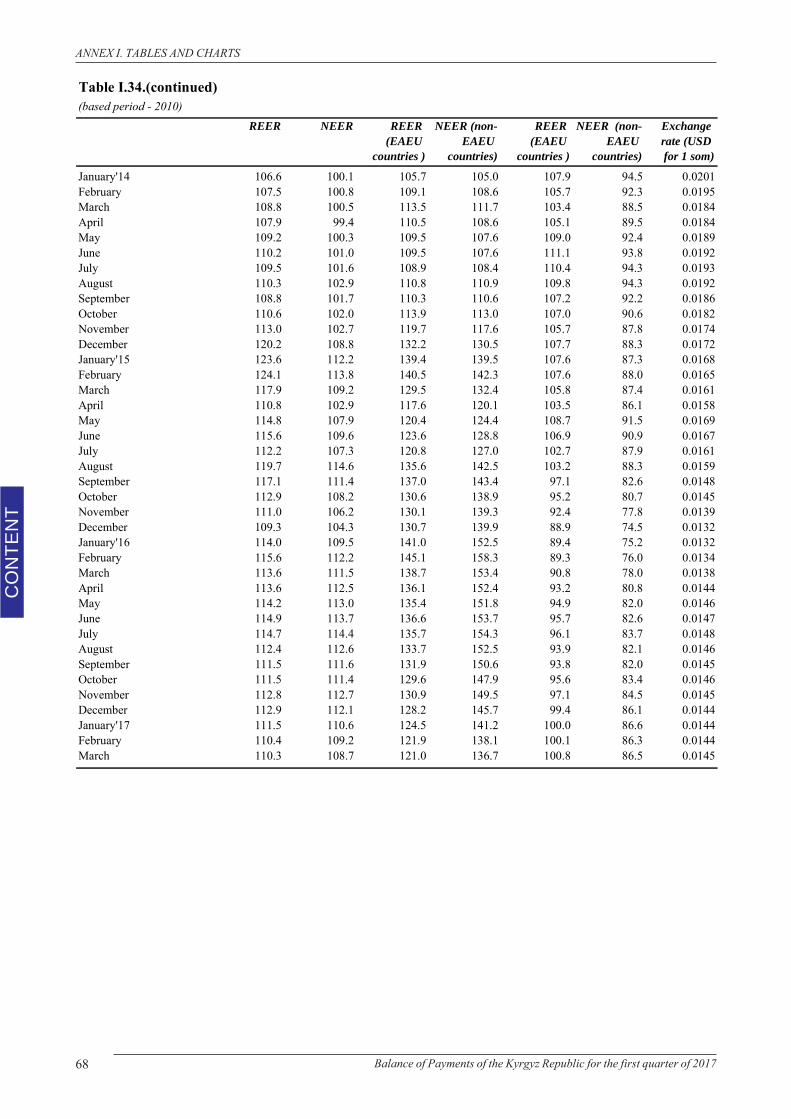
68 Balance of Payments of the Kyrgyz Republic for the first quarter of 2017
CO
NTE
NT
ANNEX I. TABLES AND CHARTS
(based period - 2010)REER NEER REER
(EAEU countries )
NEER (non-EAEU
countries)
REER (EAEU
countries )
NEER (non-EAEU
countries)
Exchange rate (USD for 1 som)
January'14 106.6 100.1 105.7 105.0 107.9 94.5 0.0201February 107.5 100.8 109.1 108.6 105.7 92.3 0.0195March 108.8 100.5 113.5 111.7 103.4 88.5 0.0184April 107.9 99.4 110.5 108.6 105.1 89.5 0.0184May 109.2 100.3 109.5 107.6 109.0 92.4 0.0189June 110.2 101.0 109.5 107.6 111.1 93.8 0.0192July 109.5 101.6 108.9 108.4 110.4 94.3 0.0193August 110.3 102.9 110.8 110.9 109.8 94.3 0.0192September 108.8 101.7 110.3 110.6 107.2 92.2 0.0186October 110.6 102.0 113.9 113.0 107.0 90.6 0.0182November 113.0 102.7 119.7 117.6 105.7 87.8 0.0174December 120.2 108.8 132.2 130.5 107.7 88.3 0.0172January'15 123.6 112.2 139.4 139.5 107.6 87.3 0.0168February 124.1 113.8 140.5 142.3 107.6 88.0 0.0165March 117.9 109.2 129.5 132.4 105.8 87.4 0.0161April 110.8 102.9 117.6 120.1 103.5 86.1 0.0158May 114.8 107.9 120.4 124.4 108.7 91.5 0.0169June 115.6 109.6 123.6 128.8 106.9 90.9 0.0167July 112.2 107.3 120.8 127.0 102.7 87.9 0.0161August 119.7 114.6 135.6 142.5 103.2 88.3 0.0159September 117.1 111.4 137.0 143.4 97.1 82.6 0.0148October 112.9 108.2 130.6 138.9 95.2 80.7 0.0145November 111.0 106.2 130.1 139.3 92.4 77.8 0.0139December 109.3 104.3 130.7 139.9 88.9 74.5 0.0132January'16 114.0 109.5 141.0 152.5 89.4 75.2 0.0132February 115.6 112.2 145.1 158.3 89.3 76.0 0.0134March 113.6 111.5 138.7 153.4 90.8 78.0 0.0138April 113.6 112.5 136.1 152.4 93.2 80.8 0.0144May 114.2 113.0 135.4 151.8 94.9 82.0 0.0146June 114.9 113.7 136.6 153.7 95.7 82.6 0.0147July 114.7 114.4 135.7 154.3 96.1 83.7 0.0148August 112.4 112.6 133.7 152.5 93.9 82.1 0.0146September 111.5 111.6 131.9 150.6 93.8 82.0 0.0145October 111.5 111.4 129.6 147.9 95.6 83.4 0.0146November 112.8 112.7 130.9 149.5 97.1 84.5 0.0145December 112.9 112.1 128.2 145.7 99.4 86.1 0.0144January'17 111.5 110.6 124.5 141.2 100.0 86.6 0.0144February 110.4 109.2 121.9 138.1 100.1 86.3 0.0144March 110.3 108.7 121.0 136.7 100.8 86.5 0.0145
Table I.34.(continued)
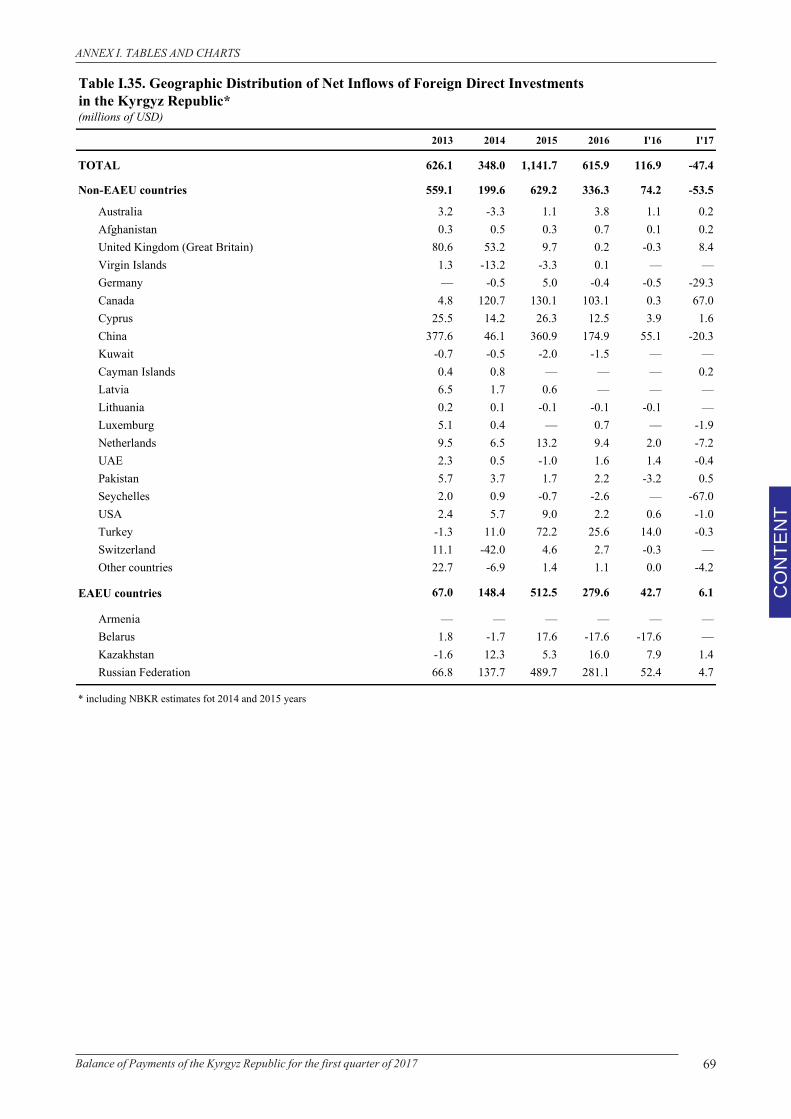
69Balance of Payments of the Kyrgyz Republic for the first quarter of 2017
CO
NTE
NT
ANNEX I. TABLES AND CHARTS
Table I.35. Geographic Distribution of Net Inflows of Foreign Direct Investments in the Kyrgyz Republic*(millions of USD)
2013 2014 2015 2016 I'16 I'17
TOTAL 626.1 348.0 1,141.7 615.9 116.9 -47.4
Non-EAEU countries 559.1 199.6 629.2 336.3 74.2 -53.5
Australia 3.2 -3.3 1.1 3.8 1.1 0.2Afghanistan 0.3 0.5 0.3 0.7 0.1 0.2United Kingdom (Great Britain) 80.6 53.2 9.7 0.2 -0.3 8.4Virgin Islands 1.3 -13.2 -3.3 0.1 — —Germany — -0.5 5.0 -0.4 -0.5 -29.3Canada 4.8 120.7 130.1 103.1 0.3 67.0Cyprus 25.5 14.2 26.3 12.5 3.9 1.6China 377.6 46.1 360.9 174.9 55.1 -20.3Kuwait -0.7 -0.5 -2.0 -1.5 — —Cayman Islands 0.4 0.8 — — — 0.2Latvia 6.5 1.7 0.6 — — —Lithuania 0.2 0.1 -0.1 -0.1 -0.1 —Luxemburg 5.1 0.4 — 0.7 — -1.9Netherlands 9.5 6.5 13.2 9.4 2.0 -7.2UAE 2.3 0.5 -1.0 1.6 1.4 -0.4Pakistan 5.7 3.7 1.7 2.2 -3.2 0.5Seychelles 2.0 0.9 -0.7 -2.6 — -67.0USA 2.4 5.7 9.0 2.2 0.6 -1.0Turkey -1.3 11.0 72.2 25.6 14.0 -0.3Switzerland 11.1 -42.0 4.6 2.7 -0.3 —Other countries 22.7 -6.9 1.4 1.1 0.0 -4.2
EAEU countries 67.0 148.4 512.5 279.6 42.7 6.1
Armenia — — — — — —Belarus 1.8 -1.7 17.6 -17.6 -17.6 —Kazakhstan -1.6 12.3 5.3 16.0 7.9 1.4Russian Federation 66.8 137.7 489.7 281.1 52.4 4.7
* including NBKR estimates fot 2014 and 2015 years
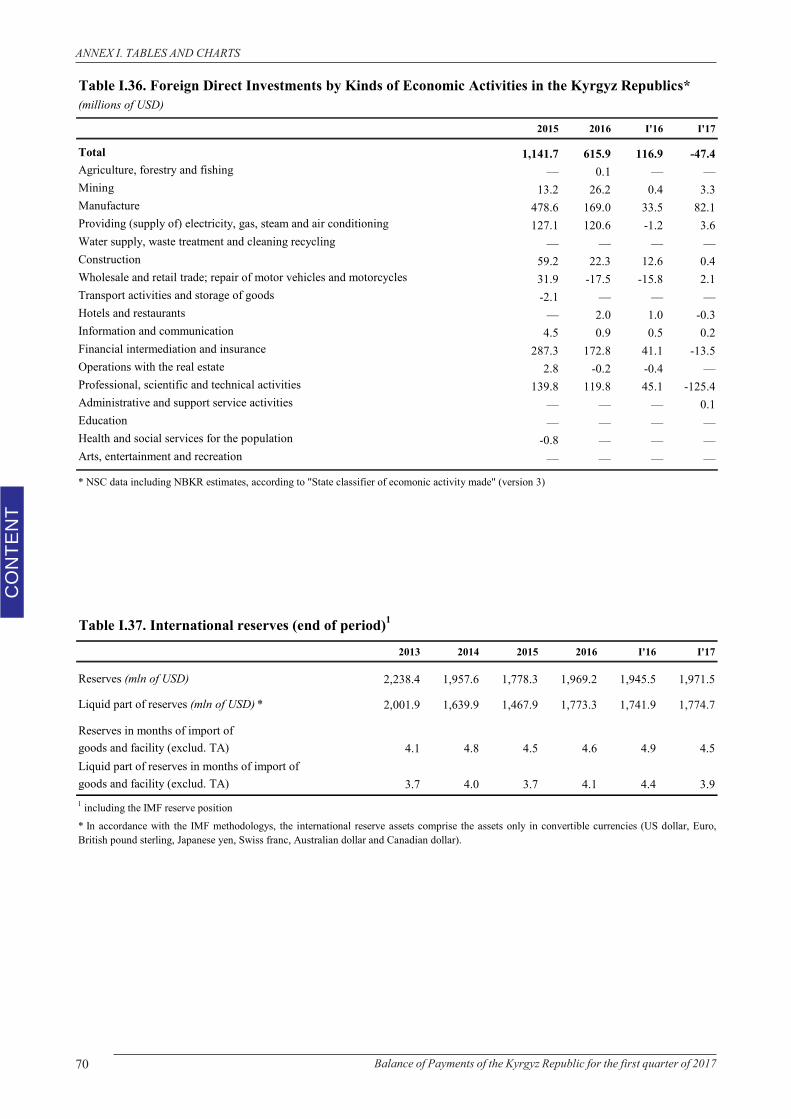
70 Balance of Payments of the Kyrgyz Republic for the first quarter of 2017
CO
NTE
NT
ANNEX I. TABLES AND CHARTS
Table I.36. Foreign Direct Investments by Kinds of Economic Activities in the Kyrgyz Republics*(millions of USD)
2015 2016 I'16 I'17
Total 1,141.7 615.9 116.9 -47.4Agriculture, forestry and fishing — 0.1 — —Mining 13.2 26.2 0.4 3.3Manufacture 478.6 169.0 33.5 82.1
127.1 120.6 -1.2 3.6Water supply, waste treatment and cleaning recycling — — — —Construction 59.2 22.3 12.6 0.4
31.9 -17.5 -15.8 2.1Transport activities and storage of goods -2.1 — — —Hotels and restaurants — 2.0 1.0 -0.3Information and communication 4.5 0.9 0.5 0.2Financial intermediation and insurance 287.3 172.8 41.1 -13.5Operations with the real estate 2.8 -0.2 -0.4 —Professional, scientific and technical activities 139.8 119.8 45.1 -125.4Administrative and support service activities — — — 0.1Education — — — —Health and social services for the population -0.8 — — —Arts, entertainment and recreation — — — —
* NSC data including NBKR estimates, according to "State classifier of ecomonic activity made" (version 3)
Wholesale and retail trade; repair of motor vehicles and motorcycles
Providing (supply of) electricity, gas, steam and air conditioning
Table I.37. International reserves (end of period)1
2013 2014 2015 2016 I'16 I'17
Reserves (mln of USD) 2,238.4 1,957.6 1,778.3 1,969.2 1,945.5 1,971.5
Liquid part of reserves (mln of USD) * 2,001.9 1,639.9 1,467.9 1,773.3 1,741.9 1,774.7
Reserves in months of import ofgoods and facility (exclud. TA) 4.1 4.8 4.5 4.6 4.9 4.5Liquid part of reserves in months of import ofgoods and facility (exclud. TA) 3.7 4.0 3.7 4.1 4.4 3.91 including the IMF reserve position* In accordance with the IMF methodologys, the international reserve assets comprise the assets only in convertible currencies (US dollar, Euro,British pound sterling, Japanese yen, Swiss franc, Australian dollar and Canadian dollar).
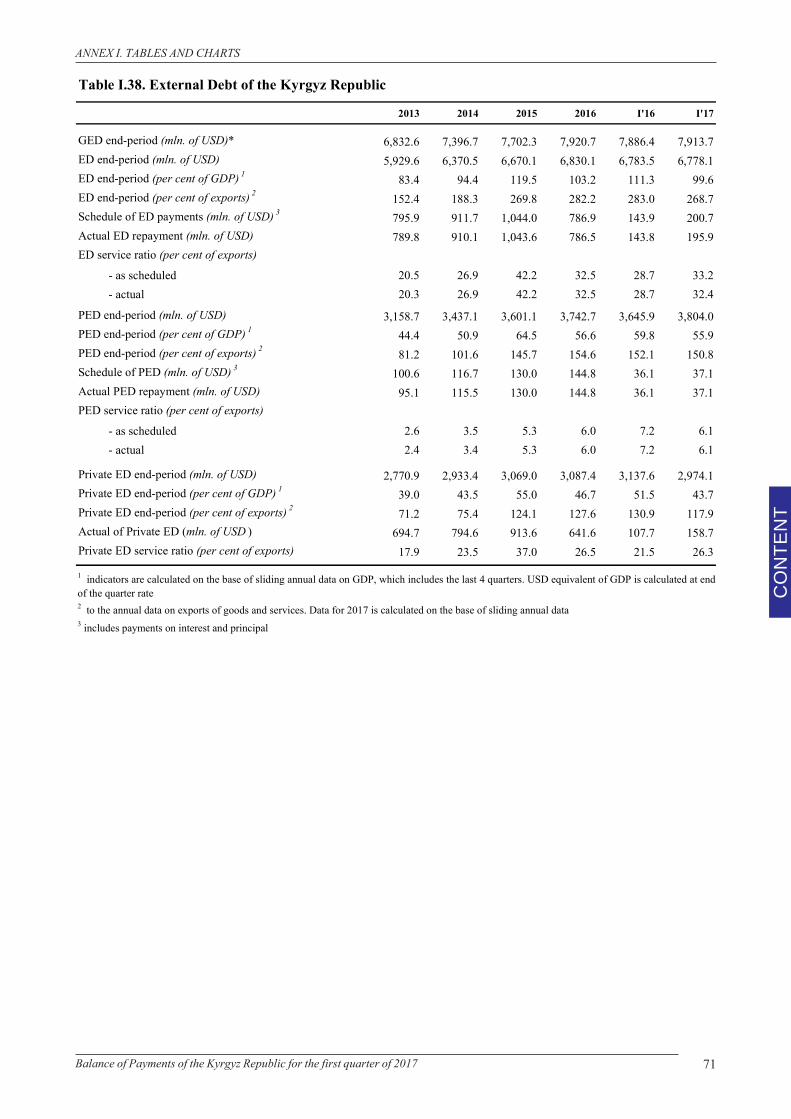
71Balance of Payments of the Kyrgyz Republic for the first quarter of 2017
CO
NTE
NT
ANNEX I. TABLES AND CHARTS
Table I.38. External Debt of the Kyrgyz Republic
2013 2014 2015 2016 I'16 I'17
GED end-period (mln. of USD)* 6,832.6 7,396.7 7,702.3 7,920.7 7,886.4 7,913.7ED end-period (mln. of USD) 5,929.6 6,370.5 6,670.1 6,830.1 6,783.5 6,778.1ED end-period (per cent of GDP) 1 83.4 94.4 119.5 103.2 111.3 99.6ED end-period (per cent of exports) 2 152.4 188.3 269.8 282.2 283.0 268.7Schedule of ED payments (mln. of USD) 3 795.9 911.7 1,044.0 786.9 143.9 200.7Actual ED repayment (mln. of USD) 789.8 910.1 1,043.6 786.5 143.8 195.9ED service ratio (per cent of exports)
- as scheduled 20.5 26.9 42.2 32.5 28.7 33.2 - actual 20.3 26.9 42.2 32.5 28.7 32.4
PED end-period (mln. of USD) 3,158.7 3,437.1 3,601.1 3,742.7 3,645.9 3,804.0PED end-period (per cent of GDP) 1 44.4 50.9 64.5 56.6 59.8 55.9PED end-period (per cent of exports) 2 81.2 101.6 145.7 154.6 152.1 150.8Schedule of PED (mln. of USD) 3 100.6 116.7 130.0 144.8 36.1 37.1Actual PED repayment (mln. of USD) 95.1 115.5 130.0 144.8 36.1 37.1PED service ratio (per cent of exports)
- as scheduled 2.6 3.5 5.3 6.0 7.2 6.1 - actual 2.4 3.4 5.3 6.0 7.2 6.1
Private ED end-period (mln. of USD) 2,770.9 2,933.4 3,069.0 3,087.4 3,137.6 2,974.1Private ED end-period (per cent of GDP) 1 39.0 43.5 55.0 46.7 51.5 43.7Private ED end-period (per cent of exports) 2 71.2 75.4 124.1 127.6 130.9 117.9Actual of Private ED (mln. of USD ) 694.7 794.6 913.6 641.6 107.7 158.7Private ED service ratio (per cent of exports) 17.9 23.5 37.0 26.5 21.5 26.3
2 to the annual data on exports of goods and services. Data for 2017 is calculated on the base of sliding annual data3 includes payments on interest and principal
1 indicators are calculated on the base of sliding annual data on GDP, which includes the last 4 quarters. USD equivalent of GDP is calculated at endof the quarter rate
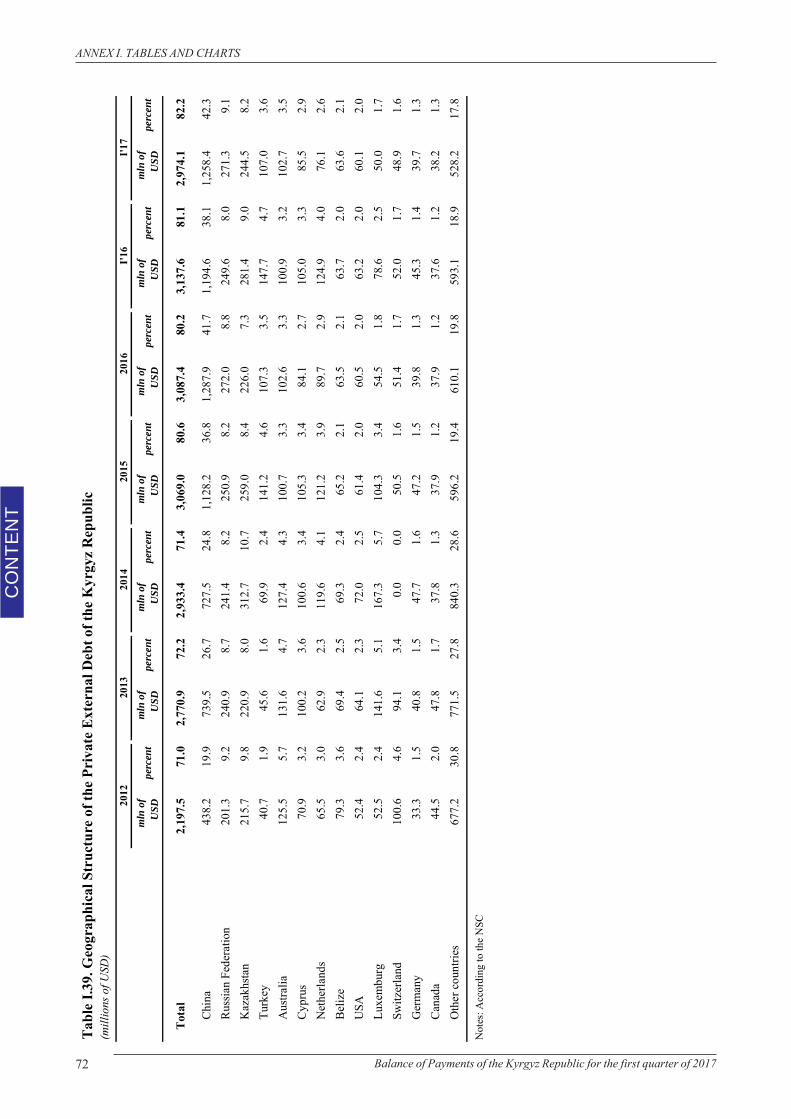
72 Balance of Payments of the Kyrgyz Republic for the first quarter of 2017
CO
NTE
NT
ANNEX I. TABLES AND CHARTS
(mill
ions
of U
SD)
mln
of
USD
perc
ent
mln
of
USD
perc
ent
mln
of
USD
perc
ent
mln
of
USD
perc
ent
mln
of
USD
perc
ent
mln
of
USD
perc
ent
mln
of
USD
perc
ent
Tota
l2,
197.
571
.02,
770.
972
.22,
933.
471
.43,
069.
080
.63,
087.
480
.23,
137.
681
.12,
974.
182
.2
Chin
a43
8.2
19.9
739.
526
.772
7.5
24.8
1,12
8.2
36.8
1,28
7.9
41.7
1,19
4.6
38.1
1,25
8.4
42.3
Russ
ian
Fede
ratio
n 20
1.3
9.2
240.
98.
724
1.4
8.2
250.
98.
227
2.0
8.8
249.
68.
027
1.3
9.1
Kaz
akhs
tan
215.
79.
822
0.9
8.0
312.
710
.725
9.0
8.4
226.
07.
328
1.4
9.0
244.
58.
2Tu
rkey
40.7
1.9
45.6
1.6
69.9
2.4
141.
24.
610
7.3
3.5
147.
74.
710
7.0
3.6
Aus
tralia
125.
55.
713
1.6
4.7
127.
44.
310
0.7
3.3
102.
63.
310
0.9
3.2
102.
73.
5Cy
prus
70.9
3.2
100.
23.
610
0.6
3.4
105.
33.
484
.12.
710
5.0
3.3
85.5
2.9
Net
herla
nds
65.5
3.0
62.9
2.3
119.
64.
112
1.2
3.9
89.7
2.9
124.
94.
076
.12.
6Be
lize
79.3
3.6
69.4
2.5
69.3
2.4
65.2
2.1
63.5
2.1
63.7
2.0
63.6
2.1
USA
52.4
2.4
64.1
2.3
72.0
2.5
61.4
2.0
60.5
2.0
63.2
2.0
60.1
2.0
Luxe
mbu
rg52
.52.
414
1.6
5.1
167.
35.
710
4.3
3.4
54.5
1.8
78.6
2.5
50.0
1.7
Switz
erla
nd10
0.6
4.6
94.1
3.4
0.0
0.0
50.5
1.6
51.4
1.7
52.0
1.7
48.9
1.6
Ger
man
y33
.31.
540
.81.
547
.71.
647
.21.
539
.81.
345
.31.
439
.71.
3Ca
nada
44.5
2.0
47.8
1.7
37.8
1.3
37.9
1.2
37.9
1.2
37.6
1.2
38.2
1.3
Oth
er c
ount
ries
677.
230
.877
1.5
27.8
840.
328
.659
6.2
19.4
610.
119
.859
3.1
18.9
528.
217
.8
Not
es: A
ccor
ding
to th
e N
SC
2016
I'16
Tabl
e I.3
9. G
eogr
aphi
cal S
truc
ture
of t
he P
riva
te E
xter
nal D
ebt o
f the
Kyr
gyz R
epub
lic
I'17
2014
2015
2012
2013
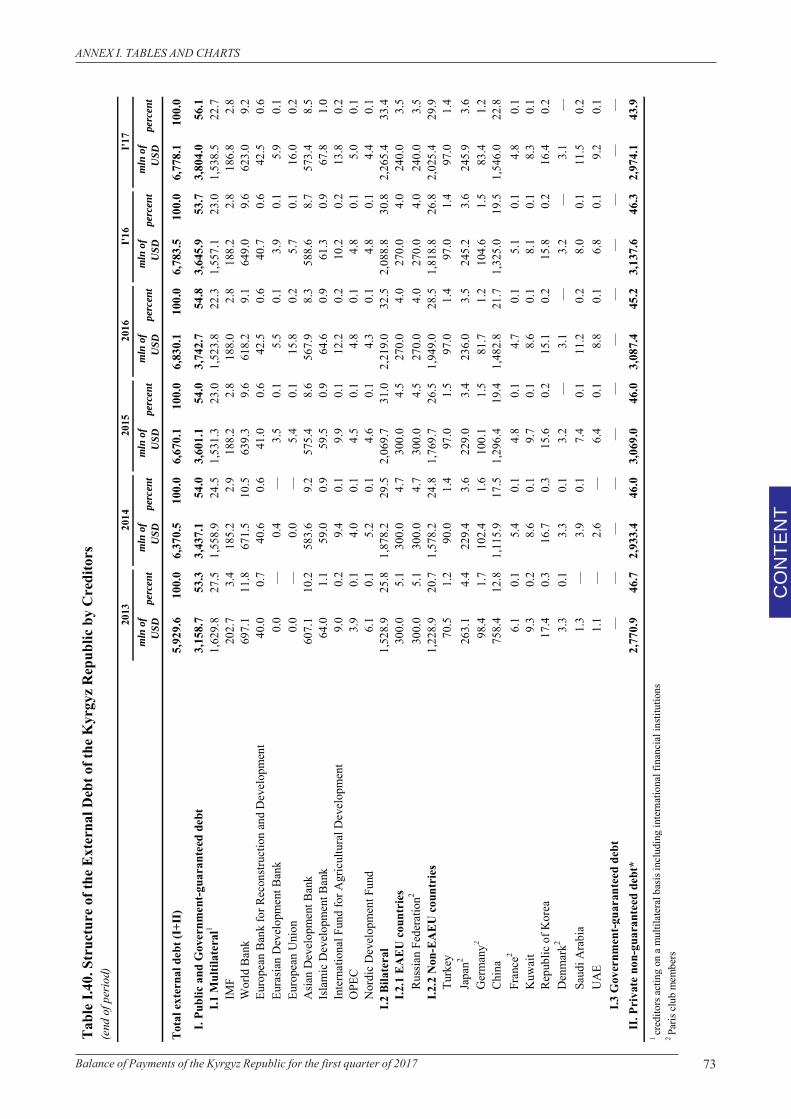
73Balance of Payments of the Kyrgyz Republic for the first quarter of 2017
CO
NTE
NT
ANNEX I. TABLES AND CHARTS
Тabl
e I.4
0. S
truc
ture
of t
he E
xter
nal D
ebt o
f the
Kyr
gyz R
epub
lic b
y C
redi
tors
(end
of p
erio
d)
mln
of
USD
perc
ent
mln
of
USD
perc
ent
mln
of
USD
perc
ent
mln
of
USD
perc
ent
mln
of
USD
perc
ent
mln
of
USD
perc
ent
Tota
l ext
erna
l deb
t (I+
II)
5,92
9.6
100.
06,
370.
510
0.0
6,67
0.1
100.
06,
830.
110
0.0
6,78
3.5
100.
06,
778.
110
0.0
I. Pu
blic
and
Gov
ernm
ent-g
uara
ntee
d de
bt3,
158.
753
.33,
437.
154
.03,
601.
154
.03,
742.
754
.83,
645.
953
.73,
804.
056
.1I.1
Mul
tilat
eral
11,
629.
827
.51,
558.
924
.51,
531.
323
.01,
523.
822
.31,
557.
123
.01,
538.
522
.7IM
F20
2.7
3.4
185.
22.
918
8.2
2.8
188.
02.
818
8.2
2.8
186.
82.
8W
orld
Ban
k69
7.1
11.8
671.
510
.563
9.3
9.6
618.
29.
164
9.0
9.6
623.
09.
2Eu
rope
an B
ank
for R
econ
struc
tion
and
Dev
elop
men
t40
.00.
740
.60.
641
.00.
642
.50.
640
.70.
642
.50.
6Eu
rasia
n D
evel
opm
ent B
ank
0.0
—0.
4—
3.5
0.1
5.5
0.1
3.9
0.1
5.9
0.1
Euro
pean
Uni
on0.
0—
0.0
—5.
40.
115
.80.
25.
70.
116
.00.
2A
sian
Dev
elop
men
t Ban
k60
7.1
10.2
583.
69.
257
5.4
8.6
567.
98.
358
8.6
8.7
573.
48.
5Is
lam
ic D
evel
opm
ent B
ank
64.0
1.1
59.0
0.9
59.5
0.9
64.6
0.9
61.3
0.9
67.8
1.0
Inte
rnat
iona
l Fun
d fo
r Agr
icul
tura
l Dev
elop
men
t9.
00.
29.
40.
19.
90.
112
.20.
210
.20.
213
.80.
2O
PEC
3.9
0.1
4.0
0.1
4.5
0.1
4.8
0.1
4.8
0.1
5.0
0.1
Nor
dic
Dev
elop
men
t Fun
d6.
10.
15.
20.
14.
60.
14.
30.
14.
80.
14.
40.
1I.2
Bila
tera
l1,
528.
925
.81,
878.
229
.52,
069.
731
.02,
219.
032
.52,
088.
830
.82,
265.
433
.4I.2
.1 E
AEU
cou
ntri
es30
0.0
5.1
300.
04.
730
0.0
4.5
270.
04.
027
0.0
4.0
240.
03.
5Ru
ssia
n Fe
dera
tion2
300.
05.
130
0.0
4.7
300.
04.
527
0.0
4.0
270.
04.
024
0.0
3.5
I.2.2
Non
-EA
EU c
ount
ries
1,
228.
920
.71,
578.
224
.81,
769.
726
.51,
949.
028
.51,
818.
826
.82,
025.
429
.9Tu
rkey
70.5
1.2
90.0
1.4
97.0
1.5
97.0
1.4
97.0
1.4
97.0
1.4
Japa
n226
3.1
4.4
229.
43.
622
9.0
3.4
236.
03.
524
5.2
3.6
245.
93.
6G
erm
any2
98.4
1.7
102.
41.
610
0.1
1.5
81.7
1.2
104.
61.
583
.41.
2Ch
ina
758.
412
.81,
115.
917
.51,
296.
419
.41,
482.
821
.71,
325.
019
.51,
546.
022
.8Fr
ance
26.
10.
15.
40.
14.
80.
14.
70.
15.
10.
14.
80.
1K
uwai
t9.
30.
28.
60.
19.
70.
18.
60.
18.
10.
18.
30.
1Re
publ
ic o
f Kor
ea17
.40.
316
.70.
315
.60.
215
.10.
215
.80.
216
.40.
2D
enm
ark2
3.3
0.1
3.3
0.1
3.2
—3.
1—
3.2
—3.
1—
Saud
i Ara
bia
1.3
—3.
90.
17.
40.
111
.20.
28.
00.
111
.50.
2U
AE
1.1
—2.
6—
6.4
0.1
8.8
0.1
6.8
0.1
9.2
0.1
I.3 G
over
nmen
t-gua
rant
eed
debt
——
——
——
——
——
——
II. P
riva
te n
on-g
uara
ntee
d de
bt*
2,77
0.9
46.7
2,93
3.4
46.0
3,06
9.0
46.0
3,08
7.4
45.2
3,13
7.6
46.3
2,97
4.1
43.9
1 сr
edito
rs a
ctin
g on
a m
ultil
ater
al b
asis
incl
udin
g in
tern
atio
nal f
inan
cial
insti
tutio
ns2
Paris
clu
b m
embe
rs
I'17
I'16
2013
2015
2014
2016
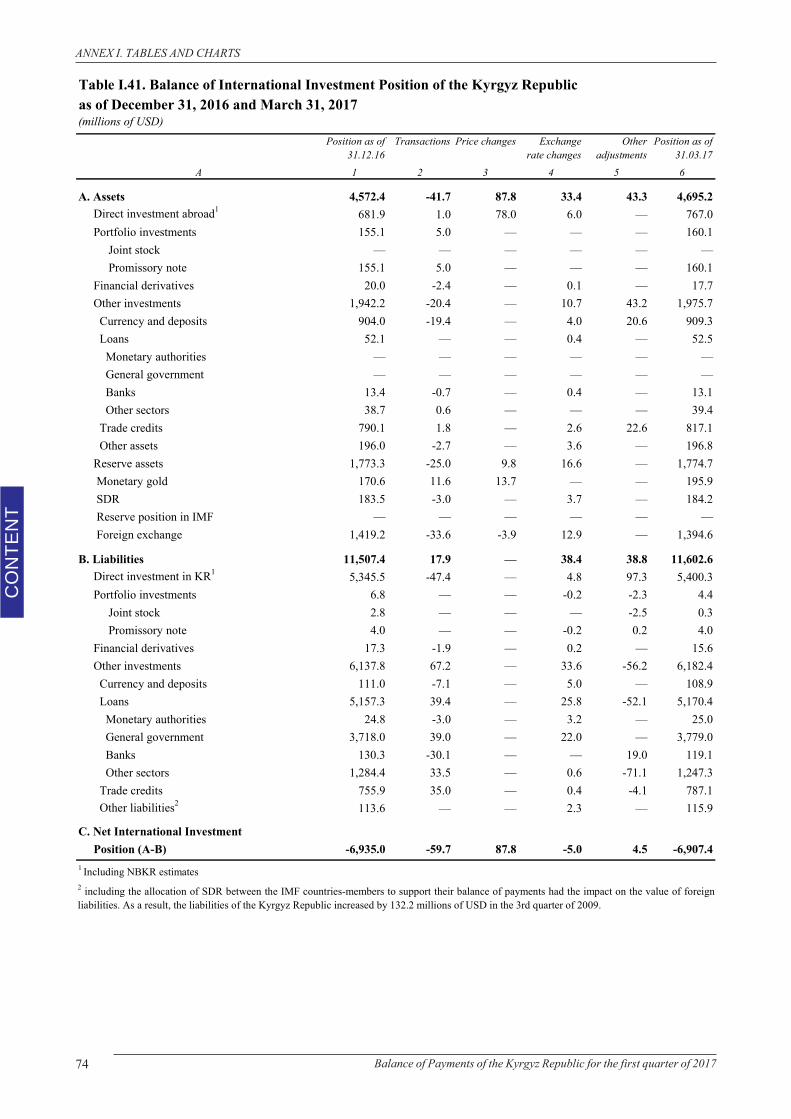
74 Balance of Payments of the Kyrgyz Republic for the first quarter of 2017
CO
NTE
NT
ANNEX I. TABLES AND CHARTS
Table I.41. Balance of International Investment Position of the Kyrgyz Republic as of December 31, 2016 and March 31, 2017(millions of USD)
Position as of 31.12.16
Transactions Price changes Exchange rate changes
Other adjustments
Position as of 31.03.17
A 1 2 3 4 5 6
A. Assets 4,572.4 -41.7 87.8 33.4 43.3 4,695.2 Direct investment abroad1 681.9 1.0 78.0 6.0 — 767.0 Portfolio investments 155.1 5.0 — — — 160.1
Joint stock — — — — — —Promissory note 155.1 5.0 — — — 160.1
Financial derivatives 20.0 -2.4 — 0.1 — 17.7 Other investments 1,942.2 -20.4 — 10.7 43.2 1,975.7 Currency and deposits 904.0 -19.4 — 4.0 20.6 909.3 Loans 52.1 — — 0.4 — 52.5 Monetary authorities — — — — — — General government — — — — — — Banks 13.4 -0.7 — 0.4 — 13.1 Other sectors 38.7 0.6 — — — 39.4 Trade credits 790.1 1.8 — 2.6 22.6 817.1 Other assets 196.0 -2.7 — 3.6 — 196.8 Reserve assets 1,773.3 -25.0 9.8 16.6 — 1,774.7 Monetary gold 170.6 11.6 13.7 — — 195.9 SDR 183.5 -3.0 — 3.7 — 184.2 Reserve position in IMF — — — — — — Foreign exchange 1,419.2 -33.6 -3.9 12.9 — 1,394.6
B. Liabilities 11,507.4 17.9 — 38.4 38.8 11,602.6 Direct investment in KR1 5,345.5 -47.4 — 4.8 97.3 5,400.3 Portfolio investments 6.8 — — -0.2 -2.3 4.4
Joint stock 2.8 — — — -2.5 0.3Promissory note 4.0 — — -0.2 0.2 4.0
Financial derivatives 17.3 -1.9 — 0.2 — 15.6 Other investments 6,137.8 67.2 — 33.6 -56.2 6,182.4 Currency and deposits 111.0 -7.1 — 5.0 — 108.9 Loans 5,157.3 39.4 — 25.8 -52.1 5,170.4 Monetary authorities 24.8 -3.0 — 3.2 — 25.0 General government 3,718.0 39.0 — 22.0 — 3,779.0 Banks 130.3 -30.1 — — 19.0 119.1 Other sectors 1,284.4 33.5 — 0.6 -71.1 1,247.3 Trade credits 755.9 35.0 — 0.4 -4.1 787.1 Other liabilities2 113.6 — — 2.3 — 115.9
C. Net International Investment Position (A-B) -6,935.0 -59.7 87.8 -5.0 4.5 -6,907.41 Including NBKR estimates2 including the allocation of SDR between the IMF countries-members to support their balance of payments had the impact on the value of foreignliabilities. As a result, the liabilities of the Kyrgyz Republic increased by 132.2 millions of USD in the 3rd quarter of 2009.
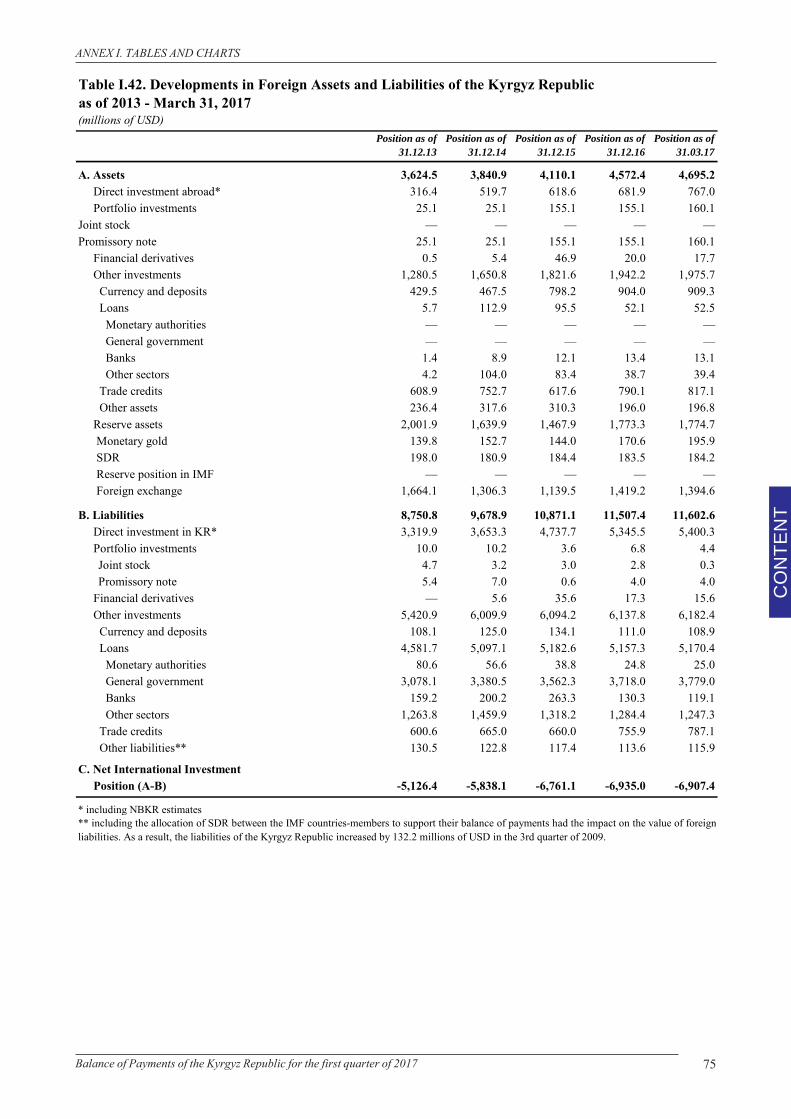
75Balance of Payments of the Kyrgyz Republic for the first quarter of 2017
CO
NTE
NT
ANNEX I. TABLES AND CHARTS
Table I.42. Developments in Foreign Assets and Liabilities of the Kyrgyz Republicas of 2013 - March 31, 2017(millions of USD)
Position as of 31.12.13
Position as of 31.12.14
Position as of 31.12.15
Position as of 31.12.16
Position as of 31.03.17
A. Assets 3,624.5 3,840.9 4,110.1 4,572.4 4,695.2 Direct investment abroad* 316.4 519.7 618.6 681.9 767.0 Portfolio investments 25.1 25.1 155.1 155.1 160.1Joint stock — — — — —Promissory note 25.1 25.1 155.1 155.1 160.1 Financial derivatives 0.5 5.4 46.9 20.0 17.7 Other investments 1,280.5 1,650.8 1,821.6 1,942.2 1,975.7 Currency and deposits 429.5 467.5 798.2 904.0 909.3 Loans 5.7 112.9 95.5 52.1 52.5 Monetary authorities — — — — — General government — — — — — Banks 1.4 8.9 12.1 13.4 13.1 Other sectors 4.2 104.0 83.4 38.7 39.4 Trade credits 608.9 752.7 617.6 790.1 817.1 Other assets 236.4 317.6 310.3 196.0 196.8 Reserve assets 2,001.9 1,639.9 1,467.9 1,773.3 1,774.7 Monetary gold 139.8 152.7 144.0 170.6 195.9 SDR 198.0 180.9 184.4 183.5 184.2 Reserve position in IMF — — — — — Foreign exchange 1,664.1 1,306.3 1,139.5 1,419.2 1,394.6
B. Liabilities 8,750.8 9,678.9 10,871.1 11,507.4 11,602.6 Direct investment in KR* 3,319.9 3,653.3 4,737.7 5,345.5 5,400.3 Portfolio investments 10.0 10.2 3.6 6.8 4.4
Joint stock 4.7 3.2 3.0 2.8 0.3Promissory note 5.4 7.0 0.6 4.0 4.0
Financial derivatives — 5.6 35.6 17.3 15.6 Other investments 5,420.9 6,009.9 6,094.2 6,137.8 6,182.4 Currency and deposits 108.1 125.0 134.1 111.0 108.9 Loans 4,581.7 5,097.1 5,182.6 5,157.3 5,170.4 Monetary authorities 80.6 56.6 38.8 24.8 25.0 General government 3,078.1 3,380.5 3,562.3 3,718.0 3,779.0 Banks 159.2 200.2 263.3 130.3 119.1 Other sectors 1,263.8 1,459.9 1,318.2 1,284.4 1,247.3 Trade credits 600.6 665.0 660.0 755.9 787.1 Other liabilities** 130.5 122.8 117.4 113.6 115.9
C. Net International Investment Position (A-B) -5,126.4 -5,838.1 -6,761.1 -6,935.0 -6,907.4
* including NBKR estimates** including the allocation of SDR between the IMF countries-members to support their balance of payments had the impact on the value of foreignliabilities. As a result, the liabilities of the Kyrgyz Republic increased by 132.2 millions of USD in the 3rd quarter of 2009.
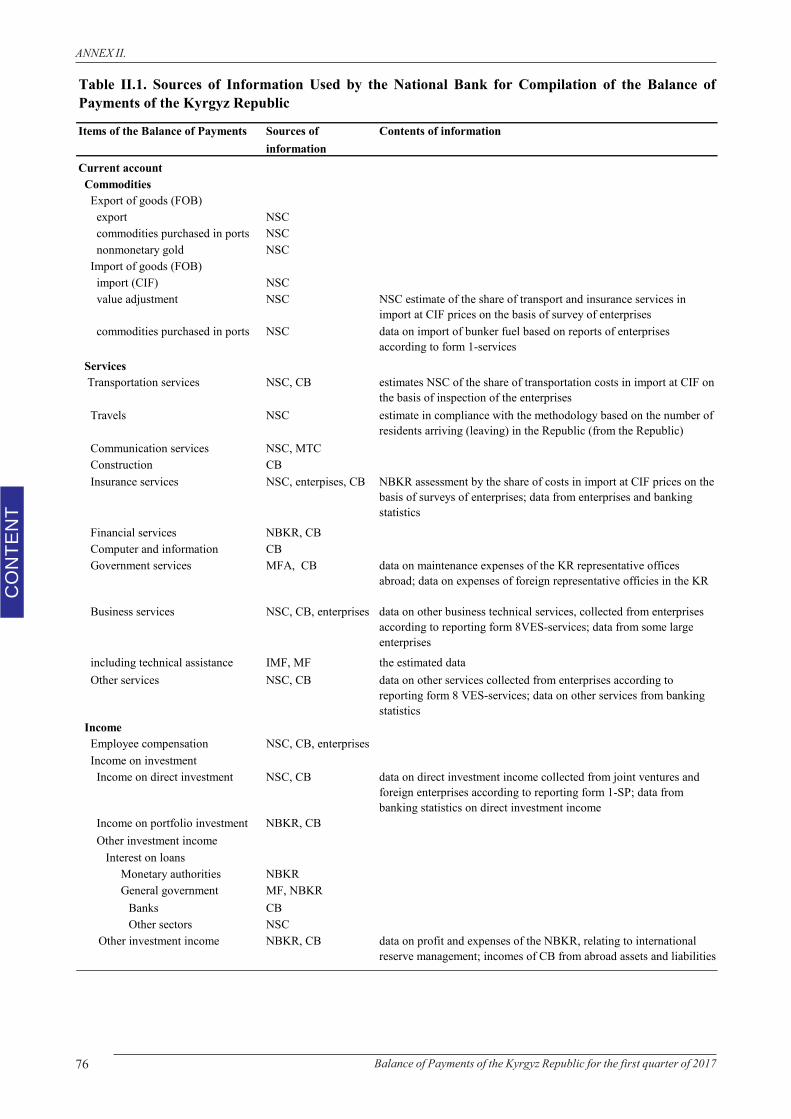
76 Balance of Payments of the Kyrgyz Republic for the first quarter of 2017
CO
NTE
NT
ANNEX II.
Items of the Balance of Payments Sources of information
Contents of information
Current account Commodities Export of goods (FOB) export NSC commodities purchased in ports NSC nonmonetary gold NSC Import of goods (FOB) import (CIF) NSC value adjustment NSC NSC estimate of the share of transport and insurance services in
import at CIF prices on the basis of survey of enterprises commodities purchased in ports NSC data on import of bunker fuel based on reports of enterprises
according to form 1-services Services Transportation services NSC, CB estimates NSC of the share of transportation costs in import at CIF on
the basis of inspection of the enterprises Travels NSC estimate in compliance with the methodology based on the number of
residents arriving (leaving) in the Republic (from the Republic) Communication services NSC, MTC Construction CB Insurance services NSC, enterpises, CB NBKR assessment by the share of costs in import at CIF prices on the
basis of surveys of enterprises; data from enterprises and banking statistics
Financial services NBKR, CB Computer and information CB Government services MFA, CB data on maintenance expenses of the KR representative offices
abroad; data on expenses of foreign representative officies in the KR
Business services NSC, CB, enterprises data on other business technical services, collected from enterprises according to reporting form 8VES-services; data from some large enterprises
including technical assistance IMF, MF the estimated data Other services NSC, CB data on other services collected from enterprises according to
reporting form 8 VES-services; data on other services from banking statistics
Income Employee compensation NSC, CB, enterprises Income on investment Income on direct investment NSC, CB data on direct investment income collected from joint ventures and
foreign enterprises according to reporting form 1-SP; data from banking statistics on direct investment income
Income on portfolio investment NBKR, CB Other investment income Interest on loans Monetary authorities NBKR General government MF, NBKR
Banks CBOther sectors NSC
Other investment income NBKR, CB data on profit and expenses of the NBKR, relating to international reserve management; incomes of CB from abroad assets and liabilities
Table II.1. Sources of Information Used by the National Bank for Compilation of the Balance ofPayments of the Kyrgyz Republic
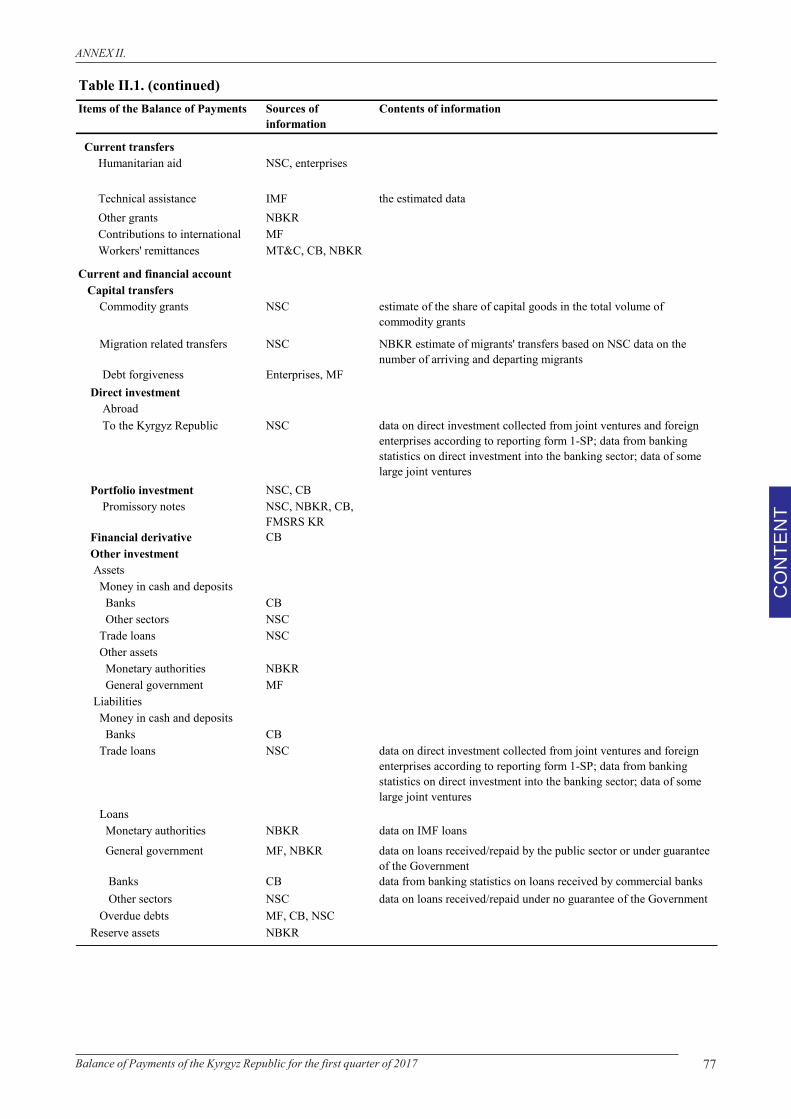
77Balance of Payments of the Kyrgyz Republic for the first quarter of 2017
CO
NTE
NT
ANNEX II.
Table II.1. (continued)Items of the Balance of Payments Sources of
informationContents of information
Current transfersHumanitarian aid NSC, enterprises
Technical assistance IMF the estimated data Other grants NBKR Contributions to international MFWorkers' remittances MT&C, CB, NBKR
Current and financial account Capital transfers Commodity grants NSC estimate of the share of capital goods in the total volume of
commodity grants
Migration related transfers NSC NBKR estimate of migrants' transfers based on NSC data on the number of arriving and departing migrants
Debt forgiveness Enterprises, MF Direct investment Abroad To the Kyrgyz Republic NSC data on direct investment collected from joint ventures and foreign
enterprises according to reporting form 1-SP; data from banking statistics on direct investment into the banking sector; data of some large joint ventures
Portfolio investment NSC, CB Promissory notes NSC, NBKR, CB,
FMSRS KR Financial derivative CB Other investment Assets Money in cash and deposits Banks CB Other sectors NSC Trade loans NSC Other assets Monetary authorities NBKR General government MF Liabilities Money in cash and deposits Banks CB Trade loans NSC data on direct investment collected from joint ventures and foreign
enterprises according to reporting form 1-SP; data from banking statistics on direct investment into the banking sector; data of some large joint ventures
Loans Monetary authorities NBKR data on IMF loans General government MF, NBKR data on loans received/repaid by the public sector or under guarantee
of the Government Banks CB data from banking statistics on loans received by commercial banks Other sectors NSC data on loans received/repaid under no guarantee of the Government Overdue debts MF, CB, NSC Reserve assets NBKR