kyrgyz-republic-public-expenditure-review-creating-fiscal
TRANSCRIPT
Report No. AUS0002107
Kyrgyz Republic
Public Expenditure Review
Creating fiscal space for inclusive growth
February 2020
Pub
lic D
iscl
osur
e A
utho
rized
Pub
lic D
iscl
osur
e A
utho
rized
Pub
lic D
iscl
osur
e A
utho
rized
Pub
lic D
iscl
osur
e A
utho
rized

THE KYRGYZ REPUBLIC
GOVERNMENT FISCAL YEAR
January 1 – December 31
CURRENCY EQUIVALENTS
(Exchange Rate Effective as of January 31, 2021) Currency Unit: Kyrgyz Republic Som (KGS)
US$1.00 = KGS 84.80
Regional Vice President: Anna Bjerde
Country Director: Lilia Burunciuc
Regional Director: Lalita Moorty
Practice Manager: Sandeep Mahajan
Lead Economist: Ivailo Izvorski
Task Team Leaders: Appolenia Mbowe, Bakyt Dubashov, Ahya Ihsan
ABBREVIATIONS AND ACRONYMS
AO Aiyl Okmotu CAB Cyclically Adjusted Fiscal Balance CAD Cyclically Adjusted Fiscal Deficit CAPEX Capital Expenditure CHP Combined Heat and Power Plant CIS Commonwealth of Independent States CIT Corporate Income Tax CSO Civil Society Organization DSA Debt Sustainability Analysis LTGM Long-Term Growth Model ECA Europe and Central Asia EEU Eurasian Economic Union EIA Environmental Impact Assessment EITI Extractives Industry Transparency
Initiative FDI Foreign Direct Investment FSU Former Soviet Union GDP Gross Domestic Product GNI Gross National Income HR Human Resources HRMIS
Human Resources Management Information System
ICOR Incremental Capital Output Ratio IDA
International Development Organization
IFC International Finance Corporation IFI International Financial Institution IMF International Monetary Fund ILO International Labour Organization ICOSOE Interdepartmental Commission for
Optimization of the State-Owned Enterprises
LIC Low-Income Country (World Bank classification)
LMIC Lower Middle-Income Country (World Bank classification)
MBLF Monthly Benefit for Low-Income Families Program
MDAs
Ministries, Departments, and Agencies
MoE Ministry of the Economy MoF Ministry of Finance NBKR National Bank of the Kyrgyz Republic NSC National Statistics Committee
OECD Organisation for Economic Co-operation and Development
OPEX Operating Expenses PBB Program-Based Budgeting PEFA Public Expenditure and Financial
Accountability PER Public Expenditure Review PFM Public Financial Management PIM PIP
Public Investment Management Public Investment Program
PISA Programme for International Student Assessment
PIT Personal Income Tax PPL Public Procurement Law PV Present Value QFA Quasi-Fiscal Activity QFD Quasi-Fiscal Deficit RKDF Russian-Kyrgyz Development Fund SFR Statement of Fiscal Risks SOE State-Owned Enterprise SME Small and Medium Enterprise TA Technical Assistance TV Taxable Value TFP Total Factor Productivity VAT Value-Added Tax WDI World Development Indicators WEO World Economic Outlook
TABLE OF CONTENTS
Acknowledgments ..................................................................................................................... 7
Executive Summary .................................................................................................................. 8
The Stance of Fiscal Policy .................................................................................. 18
Context ................................................................................................................................................ 18
Introduction ........................................................................................................................................ 18
Fiscal Policy Performance ................................................................................................................. 19
The Sustainability of Fiscal Policy ................................................................................................... 23
The Impact of Fiscal Policy on Cyclical Macroeconomic Volatility ........................................... 28
The Institutional Framework for Macroeconomic Policy in the Kyrgyz Republic .................. 31
Recommendations ............................................................................................................................. 34
Government Expenditure Performance and Budget Reforms ............................ 37
Context ................................................................................................................................................ 37
Introduction ........................................................................................................................................ 37
Program-Based Budgeting and the Medium-Term Expenditure Framework .......................... 48
Public Investment Management Reforms ...................................................................................... 53
Recommendations ............................................................................................................................. 56
Tax Policy and Tax Administration ..................................................................... 57
Context ................................................................................................................................................ 57
Introduction ........................................................................................................................................ 58
Trending in Tax Collection and Revenue Performance ............................................................... 59
Assessment of Tax Policies .............................................................................................................. 61
Assessment of Tax Administration and the Impact of the Tax System on Doing Business . 69
Policy Implications and Recommendations ................................................................................... 71
Recommendations for Tax Policy Reforms (time frame: two years with periodic review) .... 72
State-Owned Enterprises: Governance and Fiscal Performance ......................... 79
Context ................................................................................................................................................ 79
Introduction ........................................................................................................................................ 79
Overview of State Ownership and the SOE Landscape in the Kyrgyz Republic .................... 79
Quasi-Fiscal Deficit and Fiscal Risks Stemming from SOEs ...................................................... 84
Key Features of the Legislative and Institutional Framework .................................................... 90
Recommendations ............................................................................................................................. 92
Fiscal Decentralization and Subnational Public Finances .................................. 94
Context ................................................................................................................................................ 94
Introduction ........................................................................................................................................ 94
Expenditure Responsibilities ............................................................................................................ 95
Revenue Assignment ......................................................................................................................... 97
Recommendations ........................................................................................................................... 111
Managing the Wage Bill ...................................................................................... 114
Context .............................................................................................................................................. 114

Introduction ...................................................................................................................................... 116
Challenges in Managing the Public Wage Bill and International Experiences ........................ 116
Public Employment ......................................................................................................................... 124
Recommendations ........................................................................................................................... 129
References 132
Annexes 136
List of Figures Figure 1.1. Nominal and Present Value of Public Debt, 2010–18, and 2019–23 Projections .......................... 22 Figure 1.2. Estimates of the Output Gap and Fiscal Impulses, 2008–18 ............................................................. 30 Figure 1.3. Annual Consumer Price Inflation and the Change in the Annual Average, 2000–18 .................... 30 Figure 3.1. Kyrgyz Revenue Performance Has Been Robust ................................................................................ 59 Figure 3.2. Kyrgyz Tax-to-GDP Ratio Is Above the Average of Peers (2017) ................................................... 59 Figure 3.3. PIT Collection in Regional Comparison ............................................................................................... 65 Figure 3.4. Trends of CIT Revenue Collection in the Kyrgyz Republic and Regional Comparators .............. 65 Figure 3.5. CIT Productivity in Selected Countries ................................................................................................. 65 Figure 3.6. VAT Collection in Regional Comparison ............................................................................................. 66 Figure 3.7. Kyrgyz VAT Productivity and C-Efficiency ......................................................................................... 66 Figure 3.8. Lower Middle-Income Countries (LMIC) VAT Productivity and C-Efficiency ............................. 67 Figure 3.9. Kyrgyz Sales Tax ....................................................................................................................................... 67 Figure 3.10. Excise Collection Below Average and Volatile .................................................................................. 68 Figure 3.11. Composition of Excise Tax, 2018 ........................................................................................................ 68 Figure 3.12. Estimated Revenue Loss Due to Tax Expenditures, 2016–18 ........................................................ 69 Figure 3.13. Kyrgyz Cost of Revenue Collection, 2013–18 ................................................................................... 70 Figure 3.14. International Comparison of Cost of Revenue Collection, 2019 .................................................... 70 Figure 3.15. International Comparison of Post-Filing Index ................................................................................. 71 Figure 3.16. International Comparison of “Ease of Paying Taxes” ...................................................................... 71 Figure 4.1. Total Employment and SOE Employment in the Kyrgyz Republic, 2018 ...................................... 82 Figure 4.2. Distribution of SOEs Assets by Sector ................................................................................................. 83 Figure 4.3. Profitability by Sector ............................................................................................................................... 84 Figure 4.4. Debt Accumulation by Energy Sector SOEs........................................................................................ 87 Figure 5.1. Local Government Expenditures by Sector, 2018 ............................................................................... 96 Figure 5.2. Sources of Local Revenues, 2018 ........................................................................................................... 96 Figure 5.3. Trends in Local Government Revenues .............................................................................................. 101 Figure 5.4. Trends in Own Source Revenues ......................................................................................................... 101 Figure 5.5. Trends in Local Government Expenditures ....................................................................................... 101 Figure 5.6. Variation in Per Capita Revenues ......................................................................................................... 103 Figure 5.7. Variations in Per Capita Revenues ....................................................................................................... 103 Figure 5.8. Spending on General Public Services .................................................................................................. 107 Figure 5.9. Local Expenditures on General Public Services, European and Central Asian Comparators .... 107 Figure 5.10. Changes in Local Spending on General Public Services, European Consolidators .................... 109 Figure 5.11. Average Population of Local Governments, European Comparators ......................................... 110 Figure 6.1. Recommendations of Recent Wage Bill Studies and KG Reform Program................................. 115 Figure 6.2. Projected Compensation of Employees in the Medium Term ........................................................ 116 Figure 6.3. General Government Wage Bill of Selected Comparator Countries, 2005–16 ............................. 117 Figure 6.4. Average Monthly Salary and Allowances in Selected Ministries and Agencies, 2019 ................... 119 Figure 6.5. Proportion of Salary and Allowances in Total Compensation ......................................................... 120 Figure 6.6. Proportion of Teachers’ Base Pay and Allowances in Total Compensation, 2016–18 ................ 121 Figure 6.7. Growth of Salary and Allowances for Administrative Management Personnel, 2016–18 ........... 122 Figure 6.8. Share of Allowances in Total Compensation for Doctors and Nurses, 2016–18 ......................... 123 Figure 6.9. Wage Fund Growth in Bishkek City and Talas Oblast, 2016–18 .................................................... 123 Figure 6.10. Public Employment as Percentage of Total Employment in Selected Comparator Countries 124 Figure 6.11. Share of Core and Non-Core Employees in Ministries, Departments, and State Bodies, 2019 126 Figure 6.12. Medium-Term HRM Policy Needs of Kyrgyz Public Sector ......................................................... 127
Figure 6.13. Teacher-to-Support Staff Ratio by Type of Institution, 2016–18 ................................................. 128 Figure 6.14. Medical Staff-to-Support Staff Ratio in Health Organizations in Bishkek City, 2016–18 ......... 129 Figure 6.15. Professional Medical Personnel-to-Administrative Management Staff Ratio .............................. 129 List of Tables
Table 1.1. Fiscal Outturns, 2011–18, and Projections, 2019–21 ........................................................................... 20 Table 1.2. Overall Fiscal Balances and Public Debt in Former Soviet Union Countries in Central Asia and the Caucasus .................................................................................................................................................................. 22 Table 1.3. Cash Balances of the Energy Sector, 2014–18, and 2019–23 Projections ......................................... 26 Table 1.4. Total Public Debt and External Public Debt Sustainability Indicators: Thresholds, 2018 Outturns, and Baseline Projections .............................................................................................................................................. 28 Table 1.5. Output Gap, Fiscal Balance, Cyclically Adjusted Fiscal Balance, and Fiscal Impulse, 2007–18 .... 29 Table 2.1. General Government Expenditure, 2011–18......................................................................................... 39 Table 2.2. General Government Expenditures in Low- and Middle-Income Economies of the Former Soviet Union, 2016–17 Averages ............................................................................................................................... 39 Table 2.3. Functional Classification of the Budgeted State Budget Expenditures, 2013–18............................. 42 Table 2.4. Functional Classification of the Outturns of State Budget Expenditures, 2013–18 ........................ 43 Table 2.5. Economic Classification of the Budgeted State Budget Expenditures, 2013–18 ............................. 44 Table 2.6. Economic Classification of the Outturns of State Budget Expenditures, 2013–18 ......................... 45 Table 2.7. Expenditure Outturns of Planned Budget: State Budget Economic Classification, 2013–18 ........ 46 Table 2.8. Deviations between Outturns and Budget for Expenditures and Revenues and Grants: State Budget, 2014–18 ........................................................................................................................................................... 47 Table 2.9. Expenditure Outturns of Planned Budget: State Budget Economic Classification, 2013–18 ........ 49 Table 3.1. Responsiveness of Revenues to GDP Growth (Buoyancy by Tax Type), 2000–17 ........................ 60 Table 3.2. Kyrgyz Republic’s Tax Regimes ............................................................................................................... 61 Table 3.3. Key Milestones in Income Tax and Goods & Services Tax Reform ................................................. 62 Table 3.4. Statutory Rates of Major Taxes from Regional and Global Perspectives .......................................... 63 Table 3.5. Social Contributions Rates in Selected Countries.................................................................................. 63 Table 3.6. PIT Productivity ......................................................................................................................................... 65 Table 3.7. Excise Rates, VAT, and Cigarette Prices ................................................................................................ 75 Table 4.1. Number of SOEs ....................................................................................................................................... 80 Table 4.2. SOEs in Operation by Sector ................................................................................................................... 80 Table 4.3. Financial Position of the SOE Sector ..................................................................................................... 81 Table 4.4. SOE Contributions to the State Budget, 2018 ....................................................................................... 85 Table 4.5. Total Subsidies to All Forms of SOEs Paid in 2018 ............................................................................. 85 Table 4.6. SOE Budgetary Lending by Sectors, end-2018...................................................................................... 86 Table 4.7. The “Ladder” of Financial Viability in Utility Sector............................................................................ 88 Table 4.8. Forecasted QFD from Domestic Electricity Consumption ................................................................ 89 Table 5.1. Financial Performance of Bishkek and Osh Water Companies, 2018 ............................................. 111 Table 6.1. Wage Fund Composition in State and Republican Budgets, 2016–18 ............................................. 117 Table 6.2. Base Salary of Health Care Workers, 2018 ........................................................................................... 122
List of Boxes
Box 1.1. Methodology for Estimating Cyclically Adjusted Fiscal Balances ......................................................... 22 Box 1.2. Estimating the Maximum Fiscal Deficit Compatible with a Non-Increasing Public Debt-to-GDP Ratio ................................................................................................................................................................................ 24 Box 1.3. The Proposed Fiscal Rule ............................................................................................................................ 33 Box 2.1. Difficulties of Comparing General Government Expenditure Data Across Countries ..................... 40 Box 3.1 Key Features of Income Tax in the Kyrgyz Republic .............................................................................. 64 Box 3.2 Key Features of VAT Tax in the Kyrgyz Republic ................................................................................... 66 Box 5.1. Regulations on the Building and Land Taxes ........................................................................................... 98 Box 5.2. The Equalization Transfer ........................................................................................................................... 99 Box 5.3. Serbia: A Simple Formula for Reducing Revenue Disparities .............................................................. 105 Box 5.4. The Law on State Civil Service and Municipal Service ......................................................................... 108 Box 5.5. The Size of Local Governments: European Comparisons ................................................................... 110
7
Acknowledgments
This report, phase 1 of the Kyrgyz Republic Programmatic Public Expenditure Review (PER1), was prepared by a team of World Bank staff and consultants led by Appolenia Mbowe (Senior Economist), Bakyt Dubashov (Senior Economist), and Ahya Ihsan (Senior Economist). Zhypara Azhykanova (Team Assistant) and Sarah Babirye (Program Assistant) provided technical and administrative supports. The preparation of each chapter was led by:
• The Stance of Fiscal Policy: Appolenia Mbowe (Senior Economist), Martin Brownbridge (Consultant);
• Government Expenditure Performance and Budget Reforms: Bakyt Dubashov (Senior Economist), Martin Brownbridge (Consultant);
• Tax Policy and Tax Administration: Tuan Minh Le (Lead Economist), Ahya Ihsan (Senior Economist), Waewnet Sukkasem (Consultant);
• State-Owned Enterprises: Governance and Fiscal Performance: Natalia Manuilova (Senior Financial Management Specialist), Katharina Gassner (Senior Energy Economist), Vladimir Krivenkov (Consultant);
• Fiscal Decentralization and Subnational Public Finances: William Dillinger (Consultant);
• Managing the Wage Bill: Alex Appiah-Koranteng (Senior Public Sector Specialist).
The team would like to express its gratitude to authorities of the Government of the Kyrgyz Republic for the close collaboration and contributions from the ministries, departments, and agencies. These included the Ministry of Finance, Ministry of the Economy, Ministry of Health, Ministry of Education and Science and Technology, National Bank of Kyrgyz Republic, State Tax Services, State Personnel Service, Social Fund, State Property Management Fund, Investment Promotion Agency, Chamber of Commerce and Industry, Chamber of Tax Consultants, International Monetary Fund, Ministry of Roads and Transport, National Statistics Committee, and Office of the Bishkek Mayor.
The team received overall guidance from Sandeep Mahajan (Practice Manager, EEMC1), with substantive technical inputs and guidance from Ivailo Izvorski (Lead Economist, EEMC1). The team appreciates the overall leadership of Lilia Buruncuic (Country Director, ECCCA) and the support received from Naveed Hassan Naqvi (Country Manager, ECCKG), and Bolormaa Amgaabazar (former Country Manager, ECCKG). The team benefited significantly from the advice and substantive inputs of colleagues from the World Bank. The team also benefited from the advice and contributions of peer reviewers: Naoko C. Kojo (Senior Economist, EMFTX), Fernando Blanco (Principal Economist, CCER2), Anders Hjorth Agerskov (Lead Public Sector Specialist, EMFTX), Serdar Yilmaz (Lead Public Sector Specialist), and Andrei Busuioc (Senior Financial Management Specialist, EPSPF).
8
Executive Summary
1. The Kyrgyz Republic is a lower middle-income country (LMC) whose real GDP growth
weakened slightly to 4.2 percent over the past five years (2014-19) compared to the average since 2000.
Similarly, real GDP per capita growth narrowed to 2.1 percent during 2014–19. Moreover, the per capita GDP
growth in the Kyrgyz Republic was weaker than that of its peers in the region. Specifically, the average real
GDP growth and the average real GDP growth per capita during 2014-18 for the former Soviet Union
countries of Central Asia and the Caucasus, and the average for lower-middle-income countries were slightly
higher, except for Azerbaijan and Kazakhstan.
2. The Kyrgyz Republic is facing challenges in addressing inclusive growth and in providing
access to quality services, especially for the poor despite the high level of Government spending. The
burden of adjustment is usually on government-financed capital and recurrent expenditures, which together
account for about 88 percent of total expenditures. Pressure on public expenditures is typically driven by two
factors: election cycles and external shocks such as terms of trade. Drivers of fiscal pressures also include the
wage bill averaging 8.8 percent of GDP, subsidized electricity characterized by inefficient electricity
consumption levels with very low energy tariffs, and poorly managed capital investment (8.0 percent of GDP).
Thus, the need to create the much-needed fiscal space for investing in human capital and physical
infrastructure while improving expenditure management and budgetary institutions.
3. This Public Expenditure Review (PER) of the Kyrgyz Republic is part of the programmatic
PER, which aims to help the government strengthen macro-fiscal policies and enhance the
effectiveness and efficiency of public spending. To this end, this PER builds on progresses made since
2014 PER and identifies further areas for improvement. It also identifies efficiency-enhancing fiscal measures
that can help create the much-needed fiscal space to meet the country's competing development needs in
addressing human capital and infrastructure gaps. This PER-1 (phase 1 of the PER) focuses on macro-fiscal
and overarching public expenditure management and cross-cutting policy issues by examining the country’s
(1) stance of fiscal policy, (2) public expenditure management, (3) tax policy and administration, (4) fiscal and
quasi-fiscal operations of state-owned enterprises (SOEs), (5) inter-governmental transfers and subnational
finances, and (6) wage bill management. Phase 2 of the PER focused on efficiency and effectiveness issues in
health, education, and sustainability of the pension system.
The Stance of Fiscal Policy
4. The role of the fiscal policy is to promote growth over the long term and its ability to act
effectively as a countercyclical instrument. While the fiscal policy was broadly cyclically neutral in most
part of the first half of the 2010s, it appeared to be countercyclical in at least three of the past four years since
2014. One of the criticisms leveled at fiscal policy in the Kyrgyz Republic in 2012 was that it was insufficiently
countercyclical and thus, by implication, it was not used optimally to stabilize shocks to the economy and
thereby dampen volatility in output and inflation. In analyzing the cyclically adjusted fiscal deficit (CAD), little
evidence of a narrowing of the fiscal deficit of about 2–2.5 percent of GDP is displayed. Output gaps, a
deviation of an economy’s output from its potential level, has been small since 2012, averaging only 0.5 percent
of GDP and only exceeding 1 percent of GDP in 2013. The CAD was 4.3 percent of GDP in 2012, and the
average since then through 2018 was only marginally lower, despite the 2018 outturn. The small deficit of 1.6
9
percent of GDP in 2018 was somewhat of an anomaly in that the capital expenditures in the Public Investment
Program (PIP) underperformed by more than 2.5 percentage points compared with their average in 2014-18.
Using the fiscal stance to measure the overall impact of the budget on aggregate demand entails offsetting
changes in other aggregate demand components to prevent them from generating instability.
5. The weak fiscal outcomes in recent years have resulted in the erosion of the fiscal space and
the accumulation of external debt, which could hamper the country’s ability to absorb economic
shocks. The fiscal deficit softened to 0.3 percent of GDP in 2018 and 0.6 percent of GDP in 2019, vis-à-vis
a deficit of 3.5 percent in 2017, on-lending excluded. The fiscal deficit averaged 4 percent of GDP during
2014-2018, much higher than the proposed fiscal rule threshold and at the maximum average level of cyclically
adjusted deficit, which prevented the public debt-to-GDP ratio from rising above 56 percent of GDP in 2018
to 52 percent of GDP in 2019. With the COVID-19 outbreak, the public debt is projected to increase to 68
percent of GDP in 2020, with limited fiscal space to accommodate larger fiscal deficits without exerting
upward pressure on public debt-to-GDP ratios.
6. Over the medium to long term, fiscal deficits should be consistent with public debt-to-GDP
ratios, which are well within debt sustainability thresholds, so that there is fiscal space to respond to
adverse fiscal shocks without risking public debt sustainability. The nominal public debt-to-GDP ratio
is the highest among the former Soviet Union countries of Central Asia and the Caucasus. Fiscal policy should
aim to hold the public debt-to-GDP ratio over the medium to long term at 60 percent of GDP, which is
slightly lower than the current ratio, to ensure that there are sufficiently large fiscal buffers to absorb adverse
fiscal shocks without threatening debt sustainability. The quality of public spending will become more salient
if hydropower exports were to grow. Thus, the need for stricter scrutiny of public projects financed from
government resources. In addition, the scope for increasing tax efforts further is limited, given the country’s
tax-to-GDP ratio is already higher than that of the lower middle-income countries (LMICs).
7. There are potentially large fiscal risks, especially from quasi-fiscal deficits in the energy
sector, which could undermine fiscal sustainability. The energy SOEs’ cash deficits will increase over the
medium term to 1 percent of GDP by 2023 and will certainly have to be funded from the budget. Subsidized
electricity continues to support inefficient levels of electricity consumption; this could be reduced significantly
without hurting growth or welfare. Also, it is not clear whether public investment from the government’s
resources is well considered. The issue of the quality of public spending would become more salient if
hydropower exports were to grow. Therefore, there is a need for stricter scrutiny of public projects financed
from government resources.
8. Pressures on the budget also emanates from pension provision, although these pressures are
long term rather than medium term. Funding for the basic pension was transferred in full to the state
budget in 2014 and currently amounts to 3.5 percent of GDP. This is projected to increase to 5.2 percent of
GDP by 2050, as the population covered by the basic pension ages and reaches retirement age. The basic
pension for those who will reach retirement age and claim social pension over the long term is projected to
cost 1 percent of GDP in the budget by 2050. Hence, the total burden of pension to the state budget will rise
10
to 6.2 percent of GDP by 2050, as the population covered by the basic pension retires, although most of the
increase will take place after 2030.1
9. The most feasible approach to creating the fiscal space for additional spending in the priority
social and infrastructure sectors that is consistent with fiscal sustainability is by reallocating
government resources within the budget and by improving technical efficiency in spending across
all sectors. Subsidized electricity supports inefficient electricity consumption levels; this could be reduced
significantly without hurting growth or welfare. Budgetary resources need to be reallocated from low priority
areas such as public administration by better managing the government wage bill and cutting subsidies that
are not well targeted at poverty alleviation, thus the need for prudence in fiscal management to maintain
control over fiscal deficits and build fiscal buffers to absorb economic and health shocks.
10. The effectiveness of fiscal policymaking may be hindered by the fragmentation of
responsibilities for fiscal policy between the Ministry of Finance (MoF) and Ministry of the Economy
(MoE). Responsibility for fiscal policy is divided between the MoF and the MoE. The MoF is responsible
for the recurrent budget, domestically financed capital expenditures, tax collection, and public debt
management, while the MoE is responsible for tax policy. Both ministries have responsibility for distinct
aspects of externally financed investment projects. Therefore, budgets should be formulated in a holistic
manner, with the planning of all the different components undertaken jointly to best meet the strategic
objectives of fiscal policy. As such, it would be preferable to concentrate responsibility for all aspects of fiscal
policy—budget expenditures including capital investment projects, revenue and taxation, and public
borrowing—within the MoF, as is the case in most countries around the world. The MoE would then focus
on the non-fiscal-related aspects of public policy, such as regulation and preparing macroeconomic forecasts.
Government Expenditure and Budgetary Reforms
11. The economy of the Kyrgyz Republic remains heavily tilted towards the public sector,
characterized by high government spending. The large amount of government spending can crowd out
private investment at the same time it can slow economic growth and lead to an unsustainable fiscal trajectory.
In 2012, total government spending stood at 40 percent of GDP, but averaged about 37 percent of GDP
during 2014-18, well above the 25–28 percent average for countries with similar levels of income per capita
and LMICs. There has been fiscal consolidation focusing on recurrent expenditure since 2012, driven
primarily by a reduction in spending on wages, and goods and services, but excluding capital expenditure.
Improved tax revenue performance has supported the country’s progress in fiscal consolidation in recent
years, complementing efforts to rationalize expenditure. This coincided with the phasing out of the sales tax,
which weakened revenue effort at the time. Capital expenditure has been broadly stable, at about 8 percent of
GDP, except under execution in 2018. Therefore, the CAD has remained largely unchanged, at about 4
percent of GDP, since 2012.
12. Key challenges preventing the government from fully realizing its ability to reallocate limited
budget resources by improving allocative and technical efficiency, among others. The quality of public
spending–defined by the objectives of supporting growth and addressing the needs of the poor and the
1 These projections are from the Pensions Policy Note in the World Bank 2014 Public Expenditure Review.
11
vulnerable–appears to be weak. This is especially so given much higher spending on wages and salaries than
in comparable countries: 8.8 percent of GDP in the Kyrgyz Republic versus about 5 percent of GDP in the
Caucasus and 4 percent of GDP in Kazakhstan; similarly, spending on goods and services is high in relative
terms. A reduction in the wage bill could be achieved through a functional review to identify gaps as through
natural attrition and a freeze on hiring staff. The lack of availability of comprehensive and comparable cross-
country data on general government expenditure remains a challenge. Notwithstanding, the World Bank
World Development Indicators provide data on central government expenses.
13. The implementation of the approved budget has been continually erratic, and the planned
reallocations of budget resources are not fully realized. On average, there was a 3 percent shortfall in
current expenditure outturn relative to the approved budget and a 15 percent shortfall in capital expenditure
during 2013–18. Some important functions, notably economic affairs, suffered even larger shortfalls. The
main reason for the underperformance of expenditures was not a shortfall of budgetary resources: over the
period, in only one year, in 2016, did revenues and grants fall short of the budgeted levels. The poor
implementation of budgeted expenditures reveals weaknesses in expenditure planning and management,
especially in public investment management (PIM). The experience of 2014-18 points to the major weakness
of budgetary system in the Kyrgyz Republic, which is the inability to implement capital investment projects
both budgeted and fully funded. The overall public finance management (PFM) system (budget preparation,
execution, and control) remains weak, while the quality of expenditure is low.
14. The economic losses of the energy sector, including its large capital investment needs and
the contingent liabilities, pose major risks to fiscal sustainability over the medium to long term.
Currently, the government budget is the only source of finance for the cash deficits of the energy sector.
About 45 percent of the capital assets used for power generation are beyond their useful life, and in the
distribution system, electricity towers and underground cables are in urgent need of replacement. Equipment
failures caused serious interruptions to the supply of both electricity and heat in early 2018. Unfortunately,
the magnitude of contingent liabilities remains unknown since most of the SOEs do not disclose in their
financial statements estimates of their contingent liabilities.
15. The budgeting processes for public investment projects remains fragmented, governed by
different regimes depending on funding sources. This has, in turn, weakened the coherence between
investment projects and national strategic objectives in the absence of a rigorous framework for selecting and
screening projects. Since 2015, the government has been developing a framework for the economic rationale
for Public Investment Projects (PIP)s with a view to better align them with the fiscal consolidation plan. In
2019, the government approved the regulation on PIM, which seeks to establish a unified approach to the
procedures for initiation, evaluation, selection, approval, and implementation of public investment projects
for executive agencies, authorized bodies, and other relevant parties.
16. The introduction of the program-based budgeting (PBB) in the Kyrgyz Republic has proved
to be challenging for the government to implement. PBB requires both radical changes to the way in
which budgets are planned and skills for budget planning that are in short supply in the government. Since
the implementation of PBB reforms more than a decade ago, limited progress has been made so far. However,
in 2019, two pilot ministries—Health, and Roads and Transport—began to implement further PBB reforms,
but the actual changes to the pilot ministries’ budget operations are limited. If well implemented, PBB could
12
improve the allocation and efficiency of public spending, but the difficulties of implementing PBB in a
meaningful manner should not be underestimated.
Tax Policy and Administration
17. The Government has made commendable efforts to simplify the overall structure of the tax
regimes and major taxes. During 2008–18, tax policy and tax administration reforms contributed to a
significant improvement in revenue performance. Tax revenues rose steadily from 11.7 percent of GDP in
2000 to 19.1 percent of GDP in 2008, on the back of a commodity super cycle. Tax collection moderated
slightly since 2013, but recovered to 20.9 percent of GDP in 2018, driven by higher import tax collection. The
country’s tax-to-GDP ratio is higher than that of selected regional income level peers such as Turkey,
Turkmenistan, and Uzbekistan and higher among LMICs.
18. Enhanced revenue mobilization is essential for anchoring spending decisions, creating fiscal
space, and safeguarding credible budget execution. Since 2012, revenues have declined by just over 1
percentage point of GDP. Most of the decline in the revenue-to-GDP ratio since 2012 can be attributed to
the phasing out of sales tax, which has fallen from a peak of 1.8 percent of GDP in 2013–14 to only 0.8
percent of GDP in 2018. The widespread tax exemptions may also have contributed to a weakening of the
tax effort. On the expenditure side of the budget, there has been a consolidation of current expenditures,
mainly as a result of a reduction in spending, as a percentage of GDP, on wages and especially on goods and
services, the latter falling sharply in 2018.
19. While the country’s tax effort has been robust and rising over the past decade, there is still
room for improving efficiency and equity of the tax system. With the tax-to-GDP ratio hovering at 21
percent of GDP, the country stood out in the collection of taxes compared with its regional and global peers.
However, notable weaknesses in policy design across major taxes— corporate income tax (CIT), personal
income tax (PIT), value-added tax (VAT), and excise tax—and tax administration compromise the
achievement of desirable features of a sound tax system, specifically efficiency, equity, and stability of revenue
performance. The Tax Code allows for multiple tax expenditure provisions throughout all major national
taxes. Better tax policy design could reduce unwanted issues in terms of efficiency, equity, and environment
as well as public health. Improvements in tax administration (through measures to enhance the quality of VAT
refund and the key administration functions) would deepen the culture of voluntary compliance and reduce
the collection costs. Furthermore, reforms should focus on the dual objectives of improving efficiency while
maintaining the robust level of collection.
20. The current setting of VAT refund includes an extensive list of exemptions that may imply a
certain degree of cascading. The legislative reforms are consistent with the aim of inducing more
investments while preserving the level of tax intakes. Tax expenditures are, however, embedded in the
different major taxes, notably income taxes and VAT. The estimated revenue forgone due to tax exemption
is sizable and steadily increased during 2016–18 in the range of 3.5–3.7 percent of GDP. Potential losses are
contributed largely to income value-added and sales tax, specifically to support agriculture sector.
21. The Kyrgyz Republic’s statutory income tax rates are low, and social contributions make the
overall tax burden on labor relatively high. The social contributions are levied on formal labor income at
13
the rate of 27.3 percent of gross salary, of which 10 percent is contributed by employers and 17.3 percent is
covered by employees. At 10 percent, the statutory tax rates for CIT and PIT are among the lowest compared
with countries in the Eurasian Economic Union (EAEU) and the regional average. Social insurance
contribution rates are not excessive compared with the average for the Europe and Central Asia (ECA) region,
but they are still perceived by the private sector as an excessive burden in terms of the amount and compliance
procedures.
22. To strengthen the Kyrgyz Republic’s tax collection effort, further reforms should focus on the
dual objectives of improving the efficiency of the tax system while maintaining the robust level of
collection. A tax policy review could be conducted in parallel with measures to enhance voluntary compliance
in administration. The reform measures could be centered around the following strategic areas: (1) enhancing
the efficiency of the overall tax system through rebalancing the tax mix (in tax policy design) and voluntary
compliance (in tax administration); (2) reducing the tax compliance burden as part of the effort to lower tax-
induced distortions to investment; and (3) improving the equity of the taxation system (especially the redesign
of PIT policy).
State-Owned Enterprises: Fiscal Risks and Governance
23. The energy SOEs’ debt is unsustainable, meaning that the state budget will have to absorb
their debt obligations eventually. Presently, these obligations are rolled over from year to year, only delaying
the scheduled repayments. The risk of the energy SOEs’ not being able to repay their debts is quite high. The
biggest SOEs remain in strategic or economically important sectors of the Kyrgyz economy—energy, mining,
transport, and banking—all with significant capital needs and large infrastructure requirements. SOEs can
also be a major source of budget revenue for the country. In 2018, they contributed KGS 5.3 billion, or 1
percent of GDP, to the state budget via tax and dividend contributions.
24. SOEs are not operating at their optimal efficiency and profitability levels and thus are raising
concerns about their ability to generate dividends and taxes and increasing debts and expenses. Many
SOEs consume significant direct subsidies from the state budget, with the total amount reaching KGS 4.5
billion in 2018 and with much higher implicit subsidies that cannot be accurately estimated. The explicit
subsidies to SOEs in the Kyrgyz Republic are paid from both republican and local budgets. While direct
central budget support to the energy SOEs is not high, at KGS 2.2 billion, when combined with local level
subsidies of another KGS 2.3 billion, all added to KGS 4.5 billion, or 0.8 percent of the country’s GDP, in
2018.
25. The energy sector is the main source of fiscal risks and budgetary transfers. The energy SOEs
are not able to cover production costs, due to low energy tariffs and suboptimal cost efficiency, which are
unable to generate enough funds for infrastructure maintenance, much less expansion. The poor state of the
sector’s assets, driven by chronic underspending on maintenance and capital improvements, leads to
increasing energy losses and operating losses of the energy sector SOEs. While the amount of quasi-fiscal
deficit of the energy SOEs seems to be manageable, at 0.8 percent of GDP, it represents a worrying deficit
based on the cash-based recovery model, which is built on three components: (1) less-than-cost recovery
tariffs; (2) under-collection of revenue; and (3) excessive technical losses. Hence, the Kyrgyz energy sector is
14
unable to cover its cash-based expenses, while no savings can be made in the near future to invest in the new
infrastructure or to sustain other non-cash expenses.
26. The cash deficits of the heating industry are stable in the region of KGS 1 billion per annum,
but those of the electricity industry exhibit greater variance. This variance is caused by the impact of
hydrological factors, which follow a cyclical pattern. In years of abundant rainfall, the electricity industry,
which depends on hydropower for generation, generates electricity surpluses. The surpluses can be exported
(to Kazakhstan and Uzbekistan) at prices that exceed production costs and therefore yield cash surpluses. In
dry years, when hydropower generation is reduced, not only is there no surplus power for export, but fuel
imports are needed to meet domestic demand, which raises the cost of supply to the domestic market.
27. In 2018 the electricity industry earned a small cash surplus of KGS 0.4 billion, partly because
of good rainfall, which enabled a surplus to be exported, but also because capital expenditures were
not implemented as planned. However, 2019 marked the start of a drier phase in the hydrological cycle,
which is expected to last several years, and this will drive up the cash deficits of the electricity industry. Unless
there is an adjustment in tariffs for power and heat, by 2023 the electricity industry is projected to incur a cash
deficit of KGS 6.8 billion, while the heating industry’s cash deficit is projected at KGS 1.1 billion.
Intergovernmental Relations
28. Strengthening the incentives of subnational government (SNG) is crucial for their
contribution toward the public expenditures. The SNG plays a vital role in the country’s expenditure
system as the provider of public services including water and sewerage, local roads, and solid waste
management sectors. It also plays a role in the maintenance of school buildings and specific social programs.
While the current local financing system has improved, utilization of resources, especially at the local level,
remains a challenge. The current system of local finance has improved, but there is still room for improvement
in the way existing resources are used at the local level.
29. Deficiencies in the provision of local government services are typically in the form of
suboptimal quality and quantity of services, for example, inadequate solid waste collection coverage.
Others include intermittent piped water supply outside the capital, outdated and inefficient equipment with
lengthy downtimes for repairs, insufficient sanitary conditions, and communal collection sites. The functions
that consume most of the local government expenditures include the general equalization approach, which
included salaries of staff in mayors’ offices and council accounting for 22 percent of the total local budget in
2018. The third and largest category of local expenditures is education, accounting for 30 percent of total
budgetary expenditures in 2018, which presents the cost of operating and maintaining school buildings and
providing student meals. Meanwhile, the central government pays the salaries of teachers, except those in
Bishkek, whose spending on education is large.
30. Local governments derive their revenues from shared taxes, locally administered taxes, and
transfers from the central government, with little control over the level of their revenues. Personal
income tax (PIT), the largest single shared tax, accounted for 25 percent of local revenues in 2018, imposed
at a flat rate of 10 percent. Patent-based taxes are administered by the central government and distributed
based on origin, whereas 100 percent of patent tax revenues goes to local governments. The third major
15
category of local revenues is the transfer (equalization and targeted). Local governments derived about 16
percent of their revenues from non-tax charges and fees in 2018. The third major category of local revenues
is intergovernmental transfers to local governments: levelling (equalization) transfers and targeted transfers,
which accounted for 11 percent in 2018, with the equalization transfer accounting for 9 percent in 2018.
31. The current equalization formula has accomplished only a modest degree of equalization.
The degree of equalization is in contrast with the complexity of the approach. The lack of equalization can be
due to several things. First, the pool of funds for equalization may be too small relative to subnational budgets.
Second, the formula used could be flawed and, as such, fail to equalize properly. And third, there may be other
reasons, such as that all or most subnational governments get an equalization grant as opposed to only the
neediest or deserving units. Currently, it would at least appear that the scale of the transfers to local
governments in the oblasts is too small to have a significant impact. While small, the impact is not negligible.
The average per capita revenues of the more prosperous municipality in the rayons are about 2.4 times that
of the poorest (without equalization transfer, the ratio would have been 4:1). Therefore, there is a need to
evaluate the equalization transfer to ensure improved efficiency and equity of outcomes.
Wage Bill Management
32. The public sector in the Kyrgyz Republic is the largest employer and its wage bill is the single
largest item in public spending. Wage levels are relatively high compared with the majority of ECA
countries. The government wage bill increased from 9.2 percent of GDP in 2005 to 10.4 percent of GDP in
2014 and continued an upward trend to about 11 percent of GDP in 2015. During 2011–15, growth in wage
bill spending was about 70 percent, with overall government spending on wage bill of 12 percent of GDP and
38 percent of total expenditure in 2016.
33. The public sector wage bill is a major concern to the Government, given the elevated levels
of the wage bill, if not managed, could pose fiscal sustainability challenges. The wage bill of the Kyrgyz
Republic averaged about 8.8 percent of GDP in 2012–18, higher than that of selected neighboring countries
such as Armenia, Georgia, and Tajikistan (at 6 percent of GDP). The increasing trend of the public wage bill
contributed to fiscal stress experienced during 2008-11, when outlays on wages grew faster than the economy.
In 2010 alone, the health wage bill doubled, and the education sector wage bill increased by two thirds. After
social benefits, wage spending has been the largest contributor to primary expenditure growth of about 33
percent.
34. The government has since made commendable progress in the introduction of important
compensation and human resources management reforms in 2016. However, the impact is yet to be
reflected on the wage bill reduction in general government spending. Significant effort is still needed to
improve on wage bill management systems to create additional fiscal space, while at the same time improving
the quality and targeting of public goods such as education, health, and social assistance.
35. The absence of a comprehensive centralized database of public employees remains a concern
with some level of reluctance to embark on the Human Resources Management Information System
(HRMIS) and other important reforms. The urgency is to: (1) create a central registry for public sector
16
employees; (2) reform the outdated norms to set the number of staff positions; (3) automatize routine tasks;
(4) conduct functional reviews to identify structural gaps; and (5) reform the wage-setting framework.
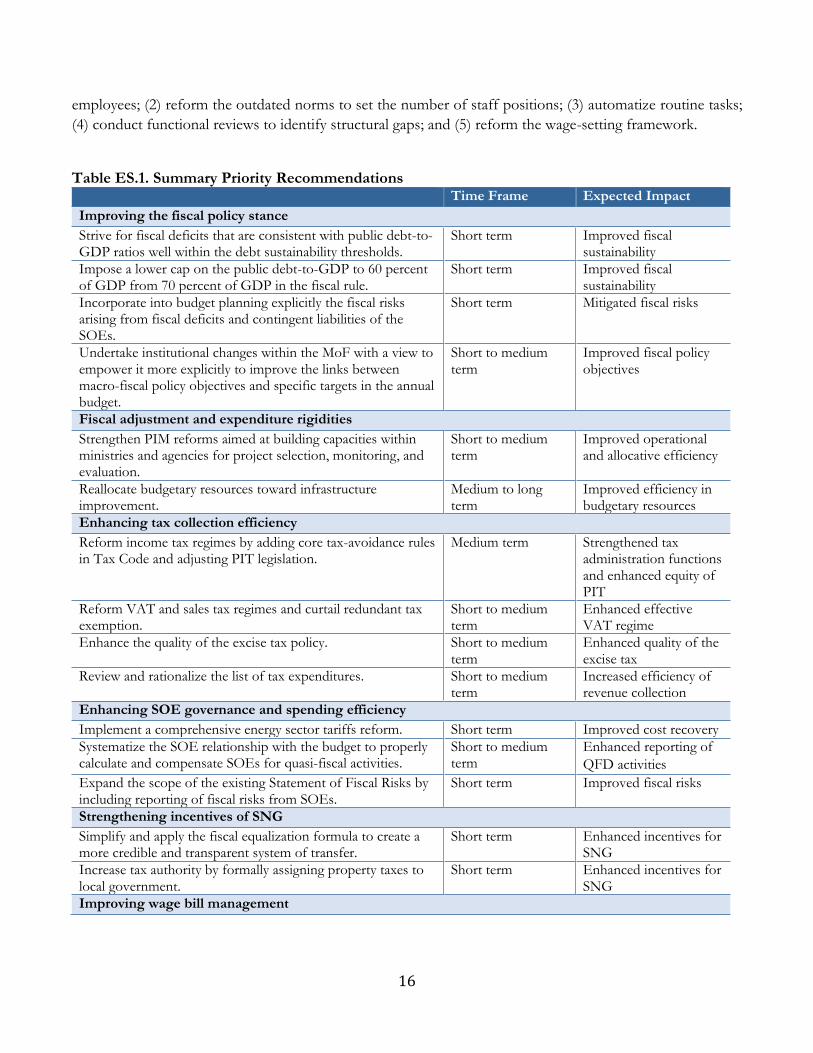
Table ES.1. Summary Priority Recommendations Time Frame Expected Impact
Improving the fiscal policy stance
Strive for fiscal deficits that are consistent with public debt-to-GDP ratios well within the debt sustainability thresholds.
Short term Improved fiscal sustainability
Impose a lower cap on the public debt-to-GDP to 60 percent of GDP from 70 percent of GDP in the fiscal rule.
Short term Improved fiscal sustainability
Incorporate into budget planning explicitly the fiscal risks arising from fiscal deficits and contingent liabilities of the SOEs.
Short term Mitigated fiscal risks
Undertake institutional changes within the MoF with a view to empower it more explicitly to improve the links between macro-fiscal policy objectives and specific targets in the annual budget.
Short to medium term
Improved fiscal policy objectives
Fiscal adjustment and expenditure rigidities
Strengthen PIM reforms aimed at building capacities within ministries and agencies for project selection, monitoring, and evaluation.
Short to medium term
Improved operational and allocative efficiency
Reallocate budgetary resources toward infrastructure improvement.
Medium to long term
Improved efficiency in budgetary resources
Enhancing tax collection efficiency
Reform income tax regimes by adding core tax-avoidance rules in Tax Code and adjusting PIT legislation.
Medium term Strengthened tax administration functions and enhanced equity of PIT
Reform VAT and sales tax regimes and curtail redundant tax exemption.
Short to medium term
Enhanced effective VAT regime
Enhance the quality of the excise tax policy. Short to medium term
Enhanced quality of the excise tax
Review and rationalize the list of tax expenditures. Short to medium term
Increased efficiency of revenue collection
Enhancing SOE governance and spending efficiency
Implement a comprehensive energy sector tariffs reform. Short term Improved cost recovery
Systematize the SOE relationship with the budget to properly calculate and compensate SOEs for quasi-fiscal activities.
Short to medium term
Enhanced reporting of
QFD activities
Expand the scope of the existing Statement of Fiscal Risks by including reporting of fiscal risks from SOEs.
Short term Improved fiscal risks
Strengthening incentives of SNG
Simplify and apply the fiscal equalization formula to create a more credible and transparent system of transfer.
Short term Enhanced incentives for SNG
Increase tax authority by formally assigning property taxes to local government.
Short term Enhanced incentives for SNG
Improving wage bill management

17
Complete the establishment of the HRMIS modules and link the payroll module and other compensation-related HR data electronically to the treasury system.
Short term Improved wage bill management
Conduct functional review and HR audit to establish credible public sector employment data.
Short term Improved wage bill management
18
The Stance of Fiscal Policy
Context
Over the past two decades, the real GDP of the Kyrgyz economy has been volatile. Some of the volatility emanated from the very eruptive nature of gold production and the political instability. Although part of the macroeconomic stability improvement was attributed to the absence of major supply-side shocks to the economy since 2012, fiscal policy also contributed to becoming less pro-cyclical during the 2010s. The country therefore observed a small consolidation of current expenditure accompanied by a weakening of the revenue effort, partly because of tax policy changes such as phasing out the sales tax. In contrast, capital expenditures have not been reduced (other than in 2018, when the implementation of public investment projects underperformed). The cyclically adjusted fiscal deficit has remained unchanged at around 4 percent of GDP since 2012. The weak fiscal outcomes in recent years have resulted in the erosion of the fiscal space and accumulation of external debt. The fiscal space is very limited to accommodate larger fiscal deficits without exerting upward pressure on public debt-to-GDP ratios. The scope for increasing tax efforts is also limited. The only feasible approach to creating fiscal space for additional spending in the priority social and infrastructure sectors, consistent with fiscal sustainability, is through a reallocation of resources within the government budget and by improving technical efficiency in all sectors of the budget. Over the medium to long term, fiscal deficits should be consistent with public debt-to-GDP ratios, which are well within debt sustainability thresholds. There are spending pressures that are likely to emerge over the medium term, which might mean that fiscal deficits could become more extensive than planned. The effectiveness of fiscal policymaking may be hindered by the fragmentation of the fiscal policy’s responsibilities between the Ministry of Finance (MoF) and the Ministry of Economy (MoE). The continued squeeze on current expenditures in the medium-term fiscal framework may not be sustainable. There are potentially large fiscal risks, especially from quasi-fiscal deficits of the energy sector; SOEs pose significant medium to long-term fiscal risks, which could undermine fiscal sustainability. Going forward, the Kyrgyz Government should rebuild fiscal buffers and support the structural transformation and diversify the economy. This chapter makes the following recommendations:
• Over the medium to long term, strive for fiscal deficits consistent with public debt-to-GDP ratios, which are well within debt sustainability thresholds.
• Include a comprehensive assessment of the fiscal risks entailed in the economic infrastructure deficits and contingent liabilities of the SOEs (Section 4.D) in the annual Explanatory Notes to the Budget.
• Tariff reform in the energy sector is essential if the energy sector SOEs’ economic losses are not to translate into substantial demands on the government budget, not only to cover operational losses but also for the investment to rehabilitate energy.
• The fiscal rule included in the Budget Code amendments can help ensure fiscal sustainability in the Kyrgyz Republic. Lower the public debt-to-GDP ceiling in the fiscal rule from the proposed 70 percent to about 60 percent.
• Empower the MoF to articulate the links more explicitly between fiscal policy objectives, such as maintaining macroeconomic stability and fiscal sustainability, and the specific targets in the annual budget, for example, for the fiscal deficit.
Introduction
1.1. This chapter evaluates the fiscal policy in the Kyrgyz Republic. It addresses the concerns raised
in the 2014 Public Expenditure Review (PER) and the 2018 Systematic Country Diagnostic regarding the
sustainability of fiscal policy, and thus the need for fiscal consolidation, and the lack of a countercyclical fiscal
stance. Fiscal policy has a profound impact on the macro-economy and can be a major cause of
19
macroeconomic instability if designed and implemented poorly. Hence a sound macro-fiscal policy is a
prerequisite for macroeconomic stability.
1.2. The chapter is organized as follows: Section C provides a brief overview of the performance
of the fiscal policy. Section D examines the trends in the main fiscal aggregates and the drivers of these
trends. It also discusses the planned medium-term fiscal stance. Section E addresses the issue of whether fiscal
policy is sustainable by examining the size of fiscal deficits and medium- to long-term pressures on the budget
while analysing the recent public debt sustainability analysis (DSA). The issue of whether fiscal policy is
countercyclical or pro-cyclical, that is, whether it stabilizes short-term macroeconomic volatility or exacerbates
it, is addressed in Section F. The macroeconomic and fiscal policy framework in the Kyrgyz Republic, which
comprises the institutional framework for macroeconomic and fiscal policy and the policy objectives, is
discussed in Section G. Section H provides recommendations.
Fiscal Policy Performance
Fiscal Performance
1.3. The analysis of the 2014 PER pointed to unsustainable fiscal trends (that is, in 2012)
associated with spending commitments, which could not be funded from the (then current) tax
policy regime. Further, the structural deficit was too large, leaving little fiscal space to respond to future
shocks.2 The 2014 PER argued that the challenge for fiscal policy was not only to consolidate the fiscal
position, but also to ensure that the fiscal consolidation did not affect economic activity while allocating more
resources for modern technology and infrastructure spending.
1.4. The main goal of the fiscal policy is to achieve and maintain full employment, reach high rate
of economic growth, and keep prices and wages stable. Since 2012 there has been considerable annual
variance in fiscal deficits as a share of GDP. The small deficit of 1.6 percent of GDP in 2018 was somewhat
of an anomaly in that the capital expenditures in the Public Investment Program (PIP) underperformed by
more than 2.5 percentage points of GDP compared to their average in recent years.3 In the CADs, there is
little evidence of a narrowing of the fiscal deficit. This is because, in 2012, real output was below its estimated
potential by 4.6 percent of GDP, and so the CAD was narrower than the overall deficit by one percentage
point of GDP. The CAD was 4.3 percent of GDP in 2012, and the average since then was only marginally
lower, despite the 2018 outturn. Hence if the 2018 outturn is discounted as an anomaly that is unlikely to be
repeated, for the reasons noted earlier, there is little evidence of fiscal consolidation over the past six years.
2 2014 PER, Strategic Settings, pages 12 and 15. 3 The PIP projects performed at only 40 percent of their budgeted amounts in 2018, compared with the usual level of about 70 percent. All the PIP projects are donor funded, although some involve a small share of counterpart funding from domestic budget resources.
20
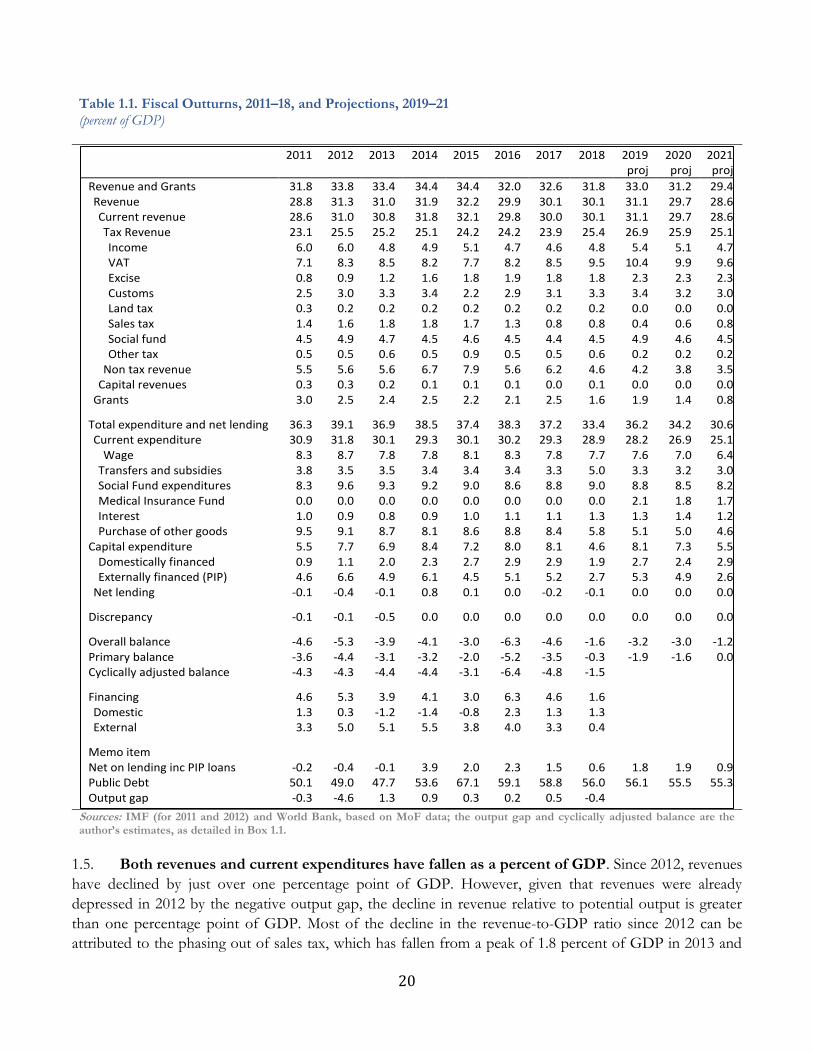
Table 1.1. Fiscal Outturns, 2011–18, and Projections, 2019–21 (percent of GDP)
Sources: IMF (for 2011 and 2012) and World Bank, based on MoF data; the output gap and cyclically adjusted balance are the author’s estimates, as detailed in Box 1.1.
1.5. Both revenues and current expenditures have fallen as a percent of GDP. Since 2012, revenues
have declined by just over one percentage point of GDP. However, given that revenues were already
depressed in 2012 by the negative output gap, the decline in revenue relative to potential output is greater
than one percentage point of GDP. Most of the decline in the revenue-to-GDP ratio since 2012 can be
attributed to the phasing out of sales tax, which has fallen from a peak of 1.8 percent of GDP in 2013 and
2011 2012 2013 2014 2015 2016 2017 2018 2019 2020 2021
proj proj proj
Revenue and Grants 31.8 33.8 33.4 34.4 34.4 32.0 32.6 31.8 33.0 31.2 29.4 Revenue 28.8 31.3 31.0 31.9 32.2 29.9 30.1 30.1 31.1 29.7 28.6 Current revenue 28.6 31.0 30.8 31.8 32.1 29.8 30.0 30.1 31.1 29.7 28.6 Tax Revenue 23.1 25.5 25.2 25.1 24.2 24.2 23.9 25.4 26.9 25.9 25.1 Income 6.0 6.0 4.8 4.9 5.1 4.7 4.6 4.8 5.4 5.1 4.7 VAT 7.1 8.3 8.5 8.2 7.7 8.2 8.5 9.5 10.4 9.9 9.6 Excise 0.8 0.9 1.2 1.6 1.8 1.9 1.8 1.8 2.3 2.3 2.3 Customs 2.5 3.0 3.3 3.4 2.2 2.9 3.1 3.3 3.4 3.2 3.0 Land tax 0.3 0.2 0.2 0.2 0.2 0.2 0.2 0.2 0.0 0.0 0.0 Sales tax 1.4 1.6 1.8 1.8 1.7 1.3 0.8 0.8 0.4 0.6 0.8 Social fund 4.5 4.9 4.7 4.5 4.6 4.5 4.4 4.5 4.9 4.6 4.5 Other tax 0.5 0.5 0.6 0.5 0.9 0.5 0.5 0.6 0.2 0.2 0.2
Non tax revenue 5.5 5.6 5.6 6.7 7.9 5.6 6.2 4.6 4.2 3.8 3.5 Capital revenues 0.3 0.3 0.2 0.1 0.1 0.1 0.0 0.1 0.0 0.0 0.0
Grants 3.0 2.5 2.4 2.5 2.2 2.1 2.5 1.6 1.9 1.4 0.8
Total expenditure and net lending 36.3 39.1 36.9 38.5 37.4 38.3 37.2 33.4 36.2 34.2 30.6 Current expenditure 30.9 31.8 30.1 29.3 30.1 30.2 29.3 28.9 28.2 26.9 25.1
Wage 8.3 8.7 7.8 7.8 8.1 8.3 7.8 7.7 7.6 7.0 6.4 Transfers and subsidies 3.8 3.5 3.5 3.4 3.4 3.4 3.3 5.0 3.3 3.2 3.0 Social Fund expenditures 8.3 9.6 9.3 9.2 9.0 8.6 8.8 9.0 8.8 8.5 8.2 Medical Insurance Fund 0.0 0.0 0.0 0.0 0.0 0.0 0.0 0.0 2.1 1.8 1.7 Interest 1.0 0.9 0.8 0.9 1.0 1.1 1.1 1.3 1.3 1.4 1.2 Purchase of other goods 9.5 9.1 8.7 8.1 8.6 8.8 8.4 5.8 5.1 5.0 4.6
Capital expenditure 5.5 7.7 6.9 8.4 7.2 8.0 8.1 4.6 8.1 7.3 5.5 Domestically financed 0.9 1.1 2.0 2.3 2.7 2.9 2.9 1.9 2.7 2.4 2.9 Externally financed (PIP) 4.6 6.6 4.9 6.1 4.5 5.1 5.2 2.7 5.3 4.9 2.6
Net lending -0.1 -0.4 -0.1 0.8 0.1 0.0 -0.2 -0.1 0.0 0.0 0.0
Discrepancy -0.1 -0.1 -0.5 0.0 0.0 0.0 0.0 0.0 0.0 0.0 0.0
Overall balance -4.6 -5.3 -3.9 -4.1 -3.0 -6.3 -4.6 -1.6 -3.2 -3.0 -1.2 Primary balance -3.6 -4.4 -3.1 -3.2 -2.0 -5.2 -3.5 -0.3 -1.9 -1.6 0.0 Cyclically adjusted balance -4.3 -4.3 -4.4 -4.4 -3.1 -6.4 -4.8 -1.5 Financing 4.6 5.3 3.9 4.1 3.0 6.3 4.6 1.6 Domestic 1.3 0.3 -1.2 -1.4 -0.8 2.3 1.3 1.3 External 3.3 5.0 5.1 5.5 3.8 4.0 3.3 0.4
Memo item Net on lending inc PIP loans -0.2 -0.4 -0.1 3.9 2.0 2.3 1.5 0.6 1.8 1.9 0.9 Public Debt 50.1 49.0 47.7 53.6 67.1 59.1 58.8 56.0 56.1 55.5 55.3 Output gap -0.3 -4.6 1.3 0.9 0.3 0.2 0.5 -0.4
21
2014 to only 0.8 percent of GDP in 2018. The widespread tax exemptions may also have contributed to a
weakening of the tax effort. In addition, the budget has suffered a fall of one percentage point of GDP in
non-tax revenue since 2012. On the expenditure side of the budget, there has been a consolidation of current
expenditures, mainly because of a reduction in spending, as a percentage of GDP, on wages and especially on
goods and services, the latter falling sharply in 2018. Except for 2018, when the PIP expenditures
underperformed, capital expenditures have been constant since 2012, at around 8 percent of GDP.
1.6. In summary, the government has achieved some current expenditure consolidation while
protecting investment expenditures. However, the steep cut in spending on other goods and services in
2018 may not be sustainable without damaging the quality of public services. Unfortunately, the efforts to
curtail expenditures have been offset by a weaker revenue effort, which is at least partly attributable to revenue
policy decisions. This has left the fiscal deficit, adjusted for the effects of the economic cycle, and the one-off
under-performance of PIP expenditures in 2018 unchanged over the past seven years.
1.7. The projections in the Government’s medium-term fiscal framework indicate a tightening of
the fiscal stance during 2019–21. Revenues and grants are projected to be lower in 2021 than in 2018 by 2.4
percent of GDP, mainly because of a combination of lower non-tax revenue and grants. Current expenditures
are projected to fall by 3.9 percent of GDP in this period, while capital expenditures are projected to increase
from their historically unusually low level in 2018 by 0.9 percent of GDP. Consequently, the overall fiscal
deficit was projected to be about 3 percent of GDP in 2019 and 2020 and to fall to 1.2 percent of GDP in
2021. However, the realism of some of these expenditure projections must be questionable, especially in 2021,
when the steepest falls in expenditure as a percent of GDP occur because they imply that spending on wages,
transfers, and subsidies and purchases of goods and services will fall in real terms over the medium term. The
scope for cutting spending on wages and purchases of goods and services in real terms without damaging the
quality of public services must be limited.
1.8. Public debt as a percent of GDP is projected to stabilize over the medium term. The trends in
public debt are depicted in Figure 1.1. The nominal value of public debt as a share of GDP rose sharply in
2015 to peak at 67 percent, but then fell back to 59 percent at the end of the following year. Most of the
volatility in the public debt-to-GDP ratio in this period is attributable to exchange rate movements.4 Since
2016, public debt has gradually declined to 56 percent of GDP at the end of 2018 and is projected to remain
in the region of 55 percent of GDP through 2023. The present value of public debt was estimated at 44
percent of GDP in 2018 and is projected to remain at that level through 2023.5 Hence, since 2016, public debt
has stabilized as a share of GDP and is projected to remain at levels well within both the thresholds for public
debt sustainability set out in the Debt Sustainability Framework, as discussed in section 5.4, and the cap on
nominal public debt of 70 percent of GDP, which is stipulated in the proposed fiscal rule currently before
Parliament.
1.9. The Kyrgyz Republic had a higher nominal public debt as a percentage of GDP than other
former Soviet Union (FSU) countries in Central Asia and the Caucasus. It has also recorded larger fiscal
deficits than its peers, except for Armenia and Tajikistan (Table 1.2). However, Kyrgyz public debt-to-GDP
4 The nominal KGS-USD exchange rate depreciated by 29 percent in 2015 and appreciated by 9 percent in 2016, since last it was stable. 5 The projections are from the 2019 Debt Sustainability Analysis, discussed in Section 5.4.

22
ratios are not out of line with the average for all emerging markets and developing economies of 60 percent
of GDP or the average for emerging and developing Asia of 66 percent of GDP.
Figure 1.1. Nominal and Present Value of Public Debt, 2010–18, and 2019–23 Projections (percent of GDP)
Table 1.2. Overall Fiscal Balances and Public Debt in Former Soviet Union Countries in Central Asia and the Caucasus (percent of GDP)
Overall fiscal balance/GDP
%, average 2015–17
Public debt/GDP %
2018
Armenia -5.0 48.5
Azerbaijan -0.8 19.4
Georgia -2.9 44.5
Kazakhstan -2.2 21.9
Kyrgyz Republic
-3.0 56.0
Tajikistan -7.3 47.9
Uzbekistan 0.1 23.5
Sources: World Bank and IMF. Note: Dashed lines are projections.
Sources: Fiscal balances, Asian Development Bank; public debt, IMF. Note: Overall fiscal balance data for Kazakhstan and Tajikistan pertain to 2014–16 average.
Box 1.1. Methodology for Estimating Cyclically Adjusted Fiscal Balances
Cyclically adjusted fiscal balances (CABs) are derived by adjusting the data on the overall fiscal balance to take account of the automatic effect of the cyclical state of the economy on those components of the budget that are sensitive to economic activity. Hence the first step in this exercise is to estimate the cyclical components of output. To do this, we apply a Hodrick-Prescott (H-P) filter to the log of real GDP from 1998 to 2018 to obtain the trend. This trend is as an estimate of potential output, with deviations of actual output from the H-P trend as cyclical fluctuations around potential output, that is, estimates of the output gap. The estimated output gap derived in this manner is shown in the top row of Table 1.4.6
This approach has two potential drawbacks. First, H-P filter estimates, which are at, or close to, time series end points, are known to be suboptimal (Mise and others 2003). Hence the 2018 estimate of the output gap may not be reliable. Second, the notion of an output gap assumes that potential output is relatively stable and that cyclical fluctuations in output are caused only by volatility in aggregate demand. Over the short term, this drives actual output above or below its potential. In a well-diversified, industrialized economy, the assumption may be valid, but it may be less so in developing economies, which are subject to supply side shocks because they are more agrarian and less diversified. Consequently, some of the cyclical volatility in actual output may be the result of shocks to aggregate supply (for example, a bad harvest) rather than a result of volatile aggregate demand. This poses major difficulties for macroeconomic stabilization policy. Nevertheless, there is no obvious feasible and better method for estimating potential output from the available data.
We then derive estimates of the CAB. The concept of the CAB is because the fiscal outcomes of some budget components are the consequence of both discretionary fiscal policy decisions and the impact of the economy itself
6 Page 17.
30
35
40
45
50
55
60
65
70
2010
2011
2012
2013
2014
2015
2016
2017
2018
2019
2020
2021
2022
2023
Nominal Public Debt
PV
23
on fiscal outcomes for a given set of fiscal policies.7 The latter is relevant for tax and many non-tax revenues; holding fiscal policies (for example, tax rates and tax thresholds) constant, the amount of revenue collected will depend on the level of economic activity. The CAB is estimated by adjusting the applicable components of the budget to take account of the economic cycle. Hence the CAB is an estimate of what the overall fiscal deficit would have been in any year, given the actual fiscal policies (for example, spending decisions, tax policies) that prevailed in that year, if output in the economy had been in line with its potential in that year. The CAB is lower than the overall balance (that is, the deficit is larger) when output is above potential and vice versa.
To estimate the CAB, we need to adjust revenue based on the estimated elasticity of revenue growth with respect to output growth. But to do that accurately requires isolating, from the revenue data, the effects of revenue policy changes. This is necessary because the observed revenue growth during any period is the result of both growth in the revenue base and changes in revenue policy. Over 2007–18, current revenue grew 19 percent faster than GDP growth. Current revenues in real terms grew at an annual average rate of 5.1 percent compared with 4.3 percent for real GDP: that is a measure of the buoyancy of the revenue system. What we do not know is precisely how much of this revenue buoyancy is attributable to revenue policy changes and how much to the natural elasticity of the revenue base. However, revenue-raising revenue policy reforms during 2007–18 have been limited. There have been some reforms to tax and customs administration strengthened revenue mobilization, but there was also the phasing out of sales tax in 2016, which reduced revenue. Hence, we assume that most of the revenue buoyancy observed over the period was attributable to the elasticity of the revenue base with respect to GDP rather than to tax policy changes. As such, we assume an elasticity of revenue-to-GDP of 1.15. We do not adjust capital revenues for the cyclicality of output, as these revenues are one-off receipts with no link to the state of the economy. Similarly, we make no adjustment in grants.
On the expenditure side of the budget, most components are not automatically affected by the economic cycle. In principle, some of the subsidies, transfers, and social payments could be inversely related to the economic cycle, if they are causally linked to income or employment status in any given period. This does not seem to be the case for most of these payments in the Kyrgyz budget, however; for example, pensions account for more than half of these expenditures. Consequently, we make no cyclical adjustment of expenditures. Our CAB is therefore derived by summing together cyclically adjusted current revenue with actual capital revenue and grants and subtracting actual total expenditures and net lending. The CAB and the overall fiscal deficit are shown in Tables 1.1 and 1.5.
The Sustainability of Fiscal Policy
Approaches to the Evaluation of Fiscal Sustainability
1.10. Fiscal sustainability is usually defined in terms of a government’s ability to maintain its
current set of fiscal policies (for example, tax rates and expenditure commitments) indefinitely while
remaining solvent. Solvency means that a government can fully service its debts without recourse to printing
money.8 There are two basic approaches to the empirical evaluation of fiscal sustainability.
1.11. The first approach focuses on the above-the-line components of the budget—revenues and
expenditures and what these imply for fiscal balances. This approach assesses whether the fiscal balance
implied by current fiscal policies is consistent with long-term fiscal sustainability. The commonly used, if
arbitrary, benchmark for fiscal sustainability in this approach is a non-increasing ratio of public debt to income,
provided that the current level of public debt-to-GDP is within thresholds that are regarded as sustainable
(Chalk and Hemming 2000). A long-term trajectory of non-increasing public debt-to-GDP is a prerequisite
7 See Burnside and Meshcheryakova (2005) for a discussion of cyclically adjusted fiscal balances. 8 Burnside 2005, pages 11–12.
24
for fiscal sustainability, although it may not, by itself, be sufficient for fiscal sustainability, because the
characteristics of the debt (maturity, interest rates, currency composition, and so on) also matter. The
advantage of focusing on the above-the-line components of the budget is that it allows for autonomous
changes in budget components (for example, changes in pension expenditures due to demographic shifts) to
be considered. In this section, we consider whether the CAB implied by current fiscal policies is consistent
with non-increasing public debt. In section 4.3, we examine potential spending pressures that might emerge
over the medium to long term and widen the fiscal deficit—unless there are offsetting changes in other
components of the budget.
1.12. The second approach, known as Debt Sustainability Analysis (DSA), focuses on the below-
the-line components of the budget―the financing of the budget. This approach involves forecasting the
evolution of public debt over a medium- to long-term horizon, comparing these forecasts with a set of
thresholds for debt sustainability and subjecting the forecasts to shocks. The advantage of this approach over
the first approach is that it provides a more comprehensive set of criteria for evaluating whether public debt
is sustainable and can also incorporate factors that affect the stock value of debt, such as exchange rate
movements. A DSA was conducted in April 2019 by staff of the IMF and the International Development
Association (IDA); a summary of the findings and conclusions is in Section 4.4.
Are the Fiscal Balances Implied by Current Fiscal Policy Consistent with a Non-Increasing Debt-to-GDP Ratio?
1.13. There are two steps to the approach followed in this subsection: first compute the CAB, which
is consistent with a non-increasing ratio of public debt-to-GDP, and then compare this with the CAB
implied by current fiscal policies. If the latter is narrower than the former, the current fiscal stance can be
considered sustainable; however, that does not mean it will remain sustainable indefinitely, as a future negative
fiscal shock could lead to the fiscal deficit widening to the extent that it is no longer consistent with a non-
increasing public debt-to-GDP ratio. The first step is straightforward, but the second is less so, because it
involves making judgments about the current and future stance of fiscal policy and its implications for the
size of the fiscal deficit. The methodology for the first step in this exercise is described in Box 1.2.
Box 1.2. Estimating the Maximum Fiscal Deficit Compatible with a Non-Increasing Public Debt-to-GDP Ratio
This analysis focuses on the deficits and borrowing of the general Government. Although in principle we should also include other public entities, such as SOEs, the debts of these entities are almost entirely owed to the general Government, except for a small amount of short-term credit from commercial banks to SOEs. Also, as noted in Section D, we include on-lending by the government to SOEs as an above-the-line item of the general government budget. Hence for practical purposes, it is the net borrowing of the general government that determines the evolution of public debt in the Kyrgyz Republic.
The formula to compute the overall fiscal deficit consistent with non-increasing public debt: certified
cab = D(-g/(1+g)
25
where cab denotes the cyclically adjusted balance as a percent of GDP, D denotes the current level of nominal public debt as a percent of GDP, and g denotes the long run sustainable growth of nominal GDP, all expressed as a fraction of 1.
The nominal level of public debt was 56 percent of GDP at the end of 2018, and we take this as the level that should not increase. The average annual growth of nominal GDP over 2014–18 was 9.4 percent. The projected average growth of nominal GDP in the Government’s MDFP 2019-21 is 9.7 percent. A nominal growth rate of between 9 and 10 percent is consistent with the current rate of potential GDP growth of 4.4 percent, estimated using the HP filter described in Box 1.1 and the NBKR’s target for annual inflation of 5–7 percent. Hence, we assume that the long run average nominal GDP growth will be 9.4 percent. This assumption means that a CAD of 4.8 percent of GDP would stabilize the public debt-to-GDP ratio, abstracting from any valuation effects, such as those arising from real exchange rate movements. These conclusions do not change radically even if we assume lower average nominal GDP growth in the long term; for example, if real GDP growth fell to 3 percent per annum and nominal GDP growth to 8.0 percent, a CAD of 4.2 percent of GDP would stabilize the public debt-to-GDP ratio at 56 percent.
As noted, this analysis does not take into consideration revaluation effects. The most important of these are the effects of real exchange rate changes on the ratio of external public debt-to-GDP. Its nominal value was 48 percent at the end of 2018. Most of the external public debt is denominated in US dollars, so the relevant real exchange rate change is that of the real bilateral KGS/US$ exchange rate. The historical trends of this exchange rate have been erratic. Since 2010 it has depreciated by 12 percent, or an average of 1.5 percent a year, but if we take 2000 as the starting point, it has appreciated by about 33 percent. If we take a prudent view and factor in a real depreciation over the long term in line with the average of 2010–18 of 1.5 percent per annum, this will raise the value of external public debt as a share of GDP by 0.75 percent per annum. This implies that CADs would have to be narrower than the 4.8 percent of GDP computed above by 0.75 percentage points, so that the CAD consistent with a non-increasing public debt-to-GDP ratio would be about 4 percent of GDP.
1.14. The maximum average cyclically adjusted deficit over the medium to long term—which is
consistent with preventing public debt-to-GDP from rising above its current level of 56 percent—is
about 4 percent (Box 1.2). The next question to consider is what level of CAD is implied by current fiscal
policy. A starting point is the average CAD recorded in recent years. The average for the past three years was
4.2 percent of GDP, which is just consistent with the size of deficit required to avoid an increasing public
debt-to-GDP ratio. However, there was a large variance in CADs in the past three years, suggesting that one-
off factors (such as the under-performance of the PIP projects in 2018) may have distorted underlying trends.
Thus, these outturns may not provide an accurate reflection of the current fiscal policy.
1.15. A second approach involves looking at the forecast fiscal deficits in the Government’s
medium-term fiscal program. We do not have forecast CADs, but the forecast GDP growth, which
averages 4.2 percent per annum, is close to the estimated growth of potential output. If these growth rates are
realized, then the output gap is likely to be small and hence the CAD will not differ by much from the actual
deficit. The average projected overall fiscal deficit for 2019–21 in the medium-term fiscal framework is 2.5
percent of GDP. This is clearly well within the size of deficit needed to stabilize the public debt-to-GDP ratio.
However, as discussed in Section D, these projections entail a substantial consolidation of current
expenditures, which may not be realistic.
Potential Pressures on the Budget in the Medium Term Given Current Fiscal Policies
1.16. The evaluation of fiscal sustainability must also consider budget pressures that may emerge
in the future given current fiscal policies, because of factors autonomous to the budget. The quasi-
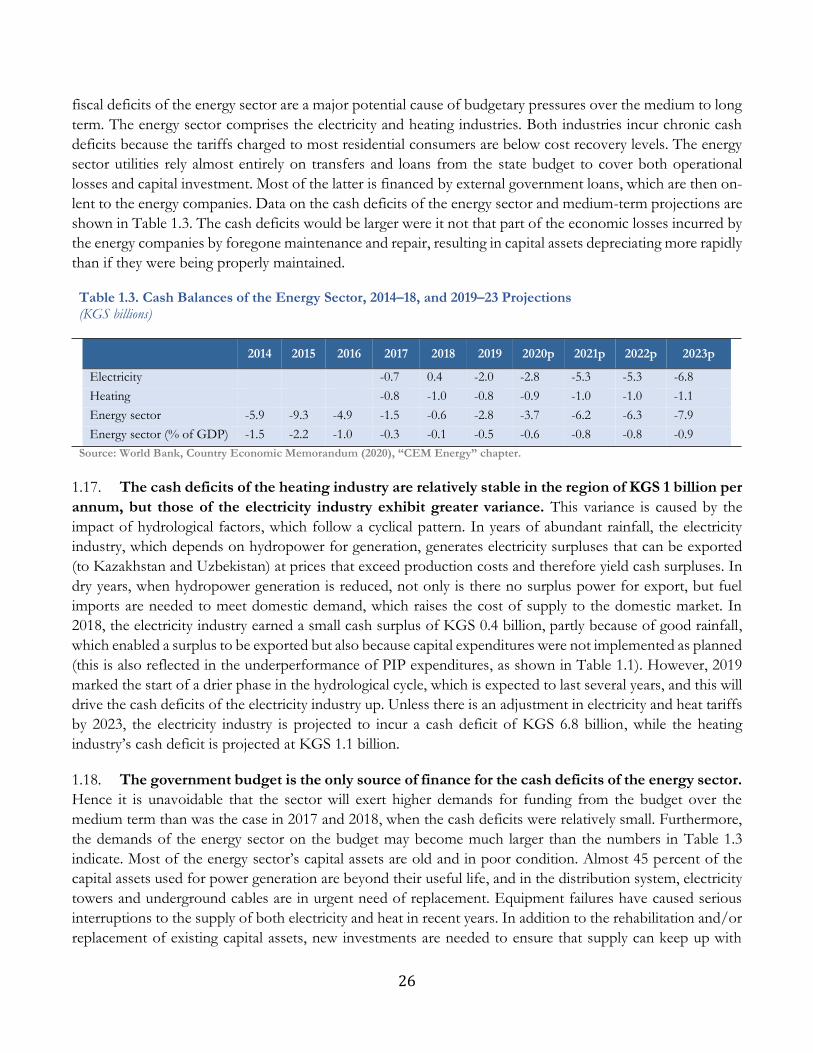
26
fiscal deficits of the energy sector are a major potential cause of budgetary pressures over the medium to long
term. The energy sector comprises the electricity and heating industries. Both industries incur chronic cash
deficits because the tariffs charged to most residential consumers are below cost recovery levels. The energy
sector utilities rely almost entirely on transfers and loans from the state budget to cover both operational
losses and capital investment. Most of the latter is financed by external government loans, which are then on-
lent to the energy companies. Data on the cash deficits of the energy sector and medium-term projections are
shown in Table 1.3. The cash deficits would be larger were it not that part of the economic losses incurred by
the energy companies by foregone maintenance and repair, resulting in capital assets depreciating more rapidly
than if they were being properly maintained.
Table 1.3. Cash Balances of the Energy Sector, 2014–18, and 2019–23 Projections (KGS billions)
2014 2015 2016 2017 2018 2019 2020p 2021p 2022p 2023p
Electricity -0.7 0.4 -2.0 -2.8 -5.3 -5.3 -6.8
Heating -0.8 -1.0 -0.8 -0.9 -1.0 -1.0 -1.1
Energy sector -5.9 -9.3 -4.9 -1.5 -0.6 -2.8 -3.7 -6.2 -6.3 -7.9
Energy sector (% of GDP) -1.5 -2.2 -1.0 -0.3 -0.1 -0.5 -0.6 -0.8 -0.8 -0.9
Source: World Bank, Country Economic Memorandum (2020), “CEM Energy” chapter.
1.17. The cash deficits of the heating industry are relatively stable in the region of KGS 1 billion per
annum, but those of the electricity industry exhibit greater variance. This variance is caused by the
impact of hydrological factors, which follow a cyclical pattern. In years of abundant rainfall, the electricity
industry, which depends on hydropower for generation, generates electricity surpluses that can be exported
(to Kazakhstan and Uzbekistan) at prices that exceed production costs and therefore yield cash surpluses. In
dry years, when hydropower generation is reduced, not only is there no surplus power for export, but fuel
imports are needed to meet domestic demand, which raises the cost of supply to the domestic market. In
2018, the electricity industry earned a small cash surplus of KGS 0.4 billion, partly because of good rainfall,
which enabled a surplus to be exported but also because capital expenditures were not implemented as planned
(this is also reflected in the underperformance of PIP expenditures, as shown in Table 1.1). However, 2019
marked the start of a drier phase in the hydrological cycle, which is expected to last several years, and this will
drive the cash deficits of the electricity industry up. Unless there is an adjustment in electricity and heat tariffs
by 2023, the electricity industry is projected to incur a cash deficit of KGS 6.8 billion, while the heating
industry’s cash deficit is projected at KGS 1.1 billion.
1.18. The government budget is the only source of finance for the cash deficits of the energy sector.
Hence it is unavoidable that the sector will exert higher demands for funding from the budget over the
medium term than was the case in 2017 and 2018, when the cash deficits were relatively small. Furthermore,
the demands of the energy sector on the budget may become much larger than the numbers in Table 1.3
indicate. Most of the energy sector’s capital assets are old and in poor condition. Almost 45 percent of the
capital assets used for power generation are beyond their useful life, and in the distribution system, electricity
towers and underground cables are in urgent need of replacement. Equipment failures have caused serious
interruptions to the supply of both electricity and heat in recent years. In addition to the rehabilitation and/or
replacement of existing capital assets, new investments are needed to ensure that supply can keep up with
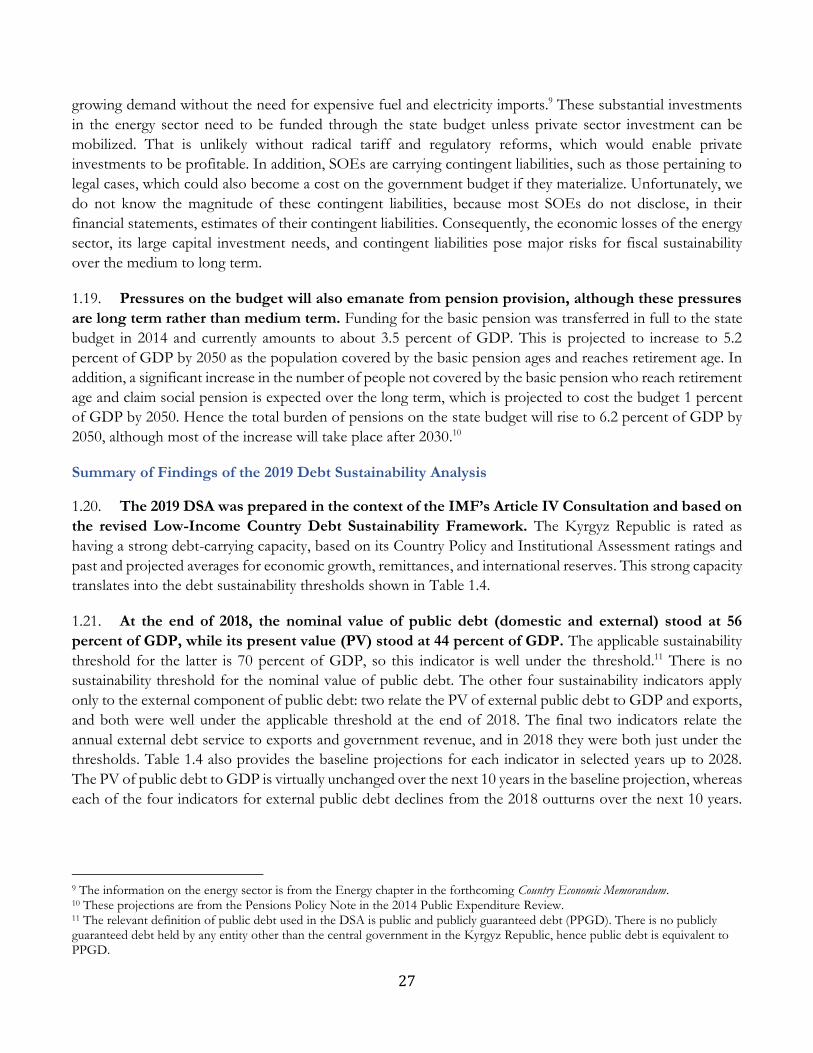
27
growing demand without the need for expensive fuel and electricity imports.9 These substantial investments
in the energy sector need to be funded through the state budget unless private sector investment can be
mobilized. That is unlikely without radical tariff and regulatory reforms, which would enable private
investments to be profitable. In addition, SOEs are carrying contingent liabilities, such as those pertaining to
legal cases, which could also become a cost on the government budget if they materialize. Unfortunately, we
do not know the magnitude of these contingent liabilities, because most SOEs do not disclose, in their
financial statements, estimates of their contingent liabilities. Consequently, the economic losses of the energy
sector, its large capital investment needs, and contingent liabilities pose major risks for fiscal sustainability
over the medium to long term.
1.19. Pressures on the budget will also emanate from pension provision, although these pressures
are long term rather than medium term. Funding for the basic pension was transferred in full to the state
budget in 2014 and currently amounts to about 3.5 percent of GDP. This is projected to increase to 5.2
percent of GDP by 2050 as the population covered by the basic pension ages and reaches retirement age. In
addition, a significant increase in the number of people not covered by the basic pension who reach retirement
age and claim social pension is expected over the long term, which is projected to cost the budget 1 percent
of GDP by 2050. Hence the total burden of pensions on the state budget will rise to 6.2 percent of GDP by
2050, although most of the increase will take place after 2030.10
Summary of Findings of the 2019 Debt Sustainability Analysis
1.20. The 2019 DSA was prepared in the context of the IMF’s Article IV Consultation and based on
the revised Low-Income Country Debt Sustainability Framework. The Kyrgyz Republic is rated as
having a strong debt-carrying capacity, based on its Country Policy and Institutional Assessment ratings and
past and projected averages for economic growth, remittances, and international reserves. This strong capacity
translates into the debt sustainability thresholds shown in Table 1.4.
1.21. At the end of 2018, the nominal value of public debt (domestic and external) stood at 56
percent of GDP, while its present value (PV) stood at 44 percent of GDP. The applicable sustainability
threshold for the latter is 70 percent of GDP, so this indicator is well under the threshold.11 There is no
sustainability threshold for the nominal value of public debt. The other four sustainability indicators apply
only to the external component of public debt: two relate the PV of external public debt to GDP and exports,
and both were well under the applicable threshold at the end of 2018. The final two indicators relate the
annual external debt service to exports and government revenue, and in 2018 they were both just under the
thresholds. Table 1.4 also provides the baseline projections for each indicator in selected years up to 2028.
The PV of public debt to GDP is virtually unchanged over the next 10 years in the baseline projection, whereas
each of the four indicators for external public debt declines from the 2018 outturns over the next 10 years.
9 The information on the energy sector is from the Energy chapter in the forthcoming Country Economic Memorandum. 10 These projections are from the Pensions Policy Note in the 2014 Public Expenditure Review. 11 The relevant definition of public debt used in the DSA is public and publicly guaranteed debt (PPGD). There is no publicly guaranteed debt held by any entity other than the central government in the Kyrgyz Republic, hence public debt is equivalent to PPGD.
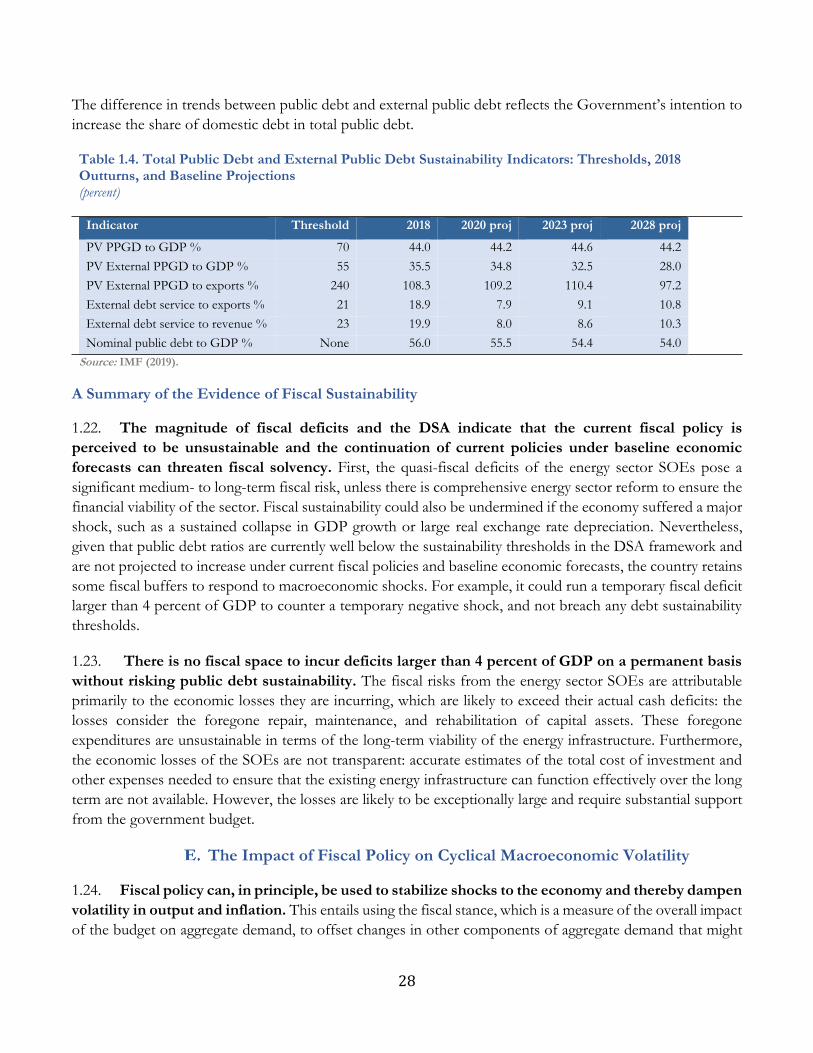
28
The difference in trends between public debt and external public debt reflects the Government’s intention to
increase the share of domestic debt in total public debt.
Table 1.4. Total Public Debt and External Public Debt Sustainability Indicators: Thresholds, 2018 Outturns, and Baseline Projections (percent)
Indicator Threshold 2018 2020 proj 2023 proj 2028 proj
PV PPGD to GDP % 70 44.0 44.2 44.6 44.2
PV External PPGD to GDP % 55 35.5 34.8 32.5 28.0
PV External PPGD to exports % 240 108.3 109.2 110.4 97.2
External debt service to exports % 21 18.9 7.9 9.1 10.8
External debt service to revenue % 23 19.9 8.0 8.6 10.3
Nominal public debt to GDP % None 56.0 55.5 54.4 54.0
Source: IMF (2019).
A Summary of the Evidence of Fiscal Sustainability
1.22. The magnitude of fiscal deficits and the DSA indicate that the current fiscal policy is
perceived to be unsustainable and the continuation of current policies under baseline economic
forecasts can threaten fiscal solvency. First, the quasi-fiscal deficits of the energy sector SOEs pose a
significant medium- to long-term fiscal risk, unless there is comprehensive energy sector reform to ensure the
financial viability of the sector. Fiscal sustainability could also be undermined if the economy suffered a major
shock, such as a sustained collapse in GDP growth or large real exchange rate depreciation. Nevertheless,
given that public debt ratios are currently well below the sustainability thresholds in the DSA framework and
are not projected to increase under current fiscal policies and baseline economic forecasts, the country retains
some fiscal buffers to respond to macroeconomic shocks. For example, it could run a temporary fiscal deficit
larger than 4 percent of GDP to counter a temporary negative shock, and not breach any debt sustainability
thresholds.
1.23. There is no fiscal space to incur deficits larger than 4 percent of GDP on a permanent basis
without risking public debt sustainability. The fiscal risks from the energy sector SOEs are attributable
primarily to the economic losses they are incurring, which are likely to exceed their actual cash deficits: the
losses consider the foregone repair, maintenance, and rehabilitation of capital assets. These foregone
expenditures are unsustainable in terms of the long-term viability of the energy infrastructure. Furthermore,
the economic losses of the SOEs are not transparent: accurate estimates of the total cost of investment and
other expenses needed to ensure that the existing energy infrastructure can function effectively over the long
term are not available. However, the losses are likely to be exceptionally large and require substantial support
from the government budget.
The Impact of Fiscal Policy on Cyclical Macroeconomic Volatility
1.24. Fiscal policy can, in principle, be used to stabilize shocks to the economy and thereby dampen
volatility in output and inflation. This entails using the fiscal stance, which is a measure of the overall impact
of the budget on aggregate demand, to offset changes in other components of aggregate demand that might
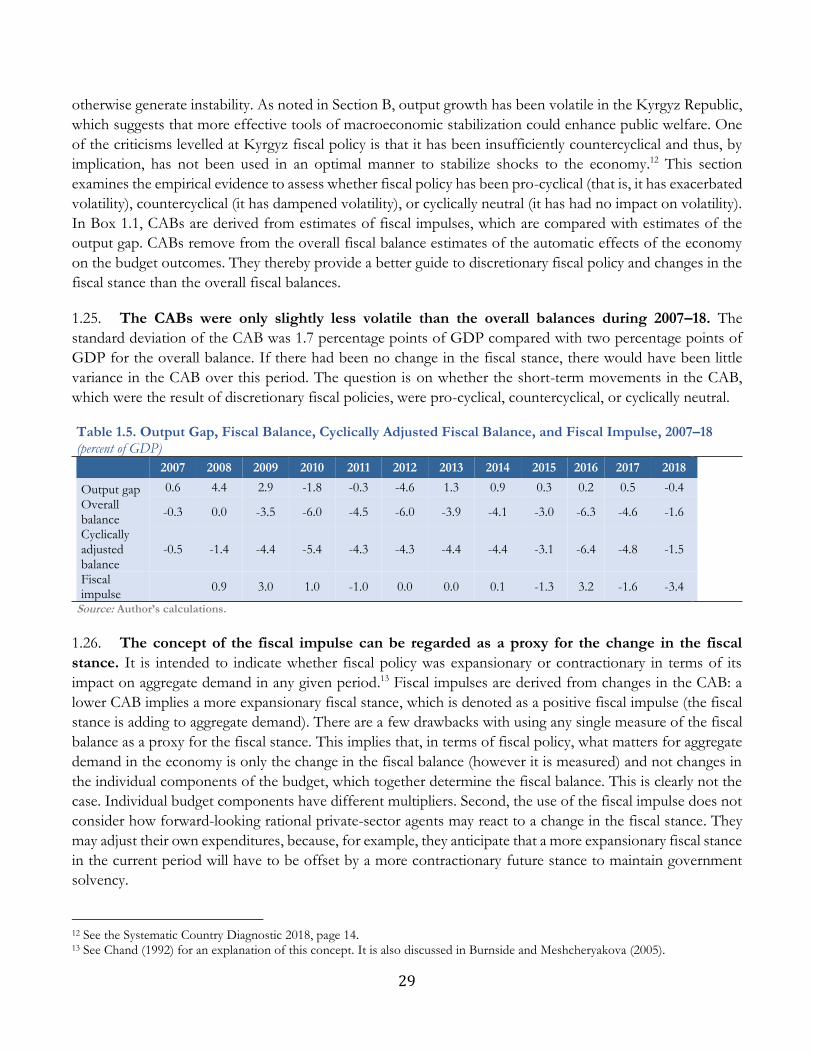
29
otherwise generate instability. As noted in Section B, output growth has been volatile in the Kyrgyz Republic,
which suggests that more effective tools of macroeconomic stabilization could enhance public welfare. One
of the criticisms levelled at Kyrgyz fiscal policy is that it has been insufficiently countercyclical and thus, by
implication, has not been used in an optimal manner to stabilize shocks to the economy.12 This section
examines the empirical evidence to assess whether fiscal policy has been pro-cyclical (that is, it has exacerbated
volatility), countercyclical (it has dampened volatility), or cyclically neutral (it has had no impact on volatility).
In Box 1.1, CABs are derived from estimates of fiscal impulses, which are compared with estimates of the
output gap. CABs remove from the overall fiscal balance estimates of the automatic effects of the economy
on the budget outcomes. They thereby provide a better guide to discretionary fiscal policy and changes in the
fiscal stance than the overall fiscal balances.
1.25. The CABs were only slightly less volatile than the overall balances during 2007–18. The
standard deviation of the CAB was 1.7 percentage points of GDP compared with two percentage points of
GDP for the overall balance. If there had been no change in the fiscal stance, there would have been little
variance in the CAB over this period. The question is on whether the short-term movements in the CAB,
which were the result of discretionary fiscal policies, were pro-cyclical, countercyclical, or cyclically neutral.
Table 1.5. Output Gap, Fiscal Balance, Cyclically Adjusted Fiscal Balance, and Fiscal Impulse, 2007–18 (percent of GDP)
2007 2008 2009 2010 2011 2012 2013 2014 2015 2016 2017 2018
Output gap 0.6 4.4 2.9 -1.8 -0.3 -4.6 1.3 0.9 0.3 0.2 0.5 -0.4
Overall balance
-0.3 0.0 -3.5 -6.0 -4.5 -6.0 -3.9 -4.1 -3.0 -6.3 -4.6 -1.6
Cyclically adjusted balance
-0.5 -1.4 -4.4 -5.4 -4.3 -4.3 -4.4 -4.4 -3.1 -6.4 -4.8 -1.5
Fiscal impulse
0.9 3.0 1.0 -1.0 0.0 0.0 0.1 -1.3 3.2 -1.6 -3.4
Source: Author’s calculations.
1.26. The concept of the fiscal impulse can be regarded as a proxy for the change in the fiscal
stance. It is intended to indicate whether fiscal policy was expansionary or contractionary in terms of its
impact on aggregate demand in any given period.13 Fiscal impulses are derived from changes in the CAB: a
lower CAB implies a more expansionary fiscal stance, which is denoted as a positive fiscal impulse (the fiscal
stance is adding to aggregate demand). There are a few drawbacks with using any single measure of the fiscal
balance as a proxy for the fiscal stance. This implies that, in terms of fiscal policy, what matters for aggregate
demand in the economy is only the change in the fiscal balance (however it is measured) and not changes in
the individual components of the budget, which together determine the fiscal balance. This is clearly not the
case. Individual budget components have different multipliers. Second, the use of the fiscal impulse does not
consider how forward-looking rational private-sector agents may react to a change in the fiscal stance. They
may adjust their own expenditures, because, for example, they anticipate that a more expansionary fiscal stance
in the current period will have to be offset by a more contractionary future stance to maintain government
solvency.
12 See the Systematic Country Diagnostic 2018, page 14. 13 See Chand (1992) for an explanation of this concept. It is also discussed in Burnside and Meshcheryakova (2005).
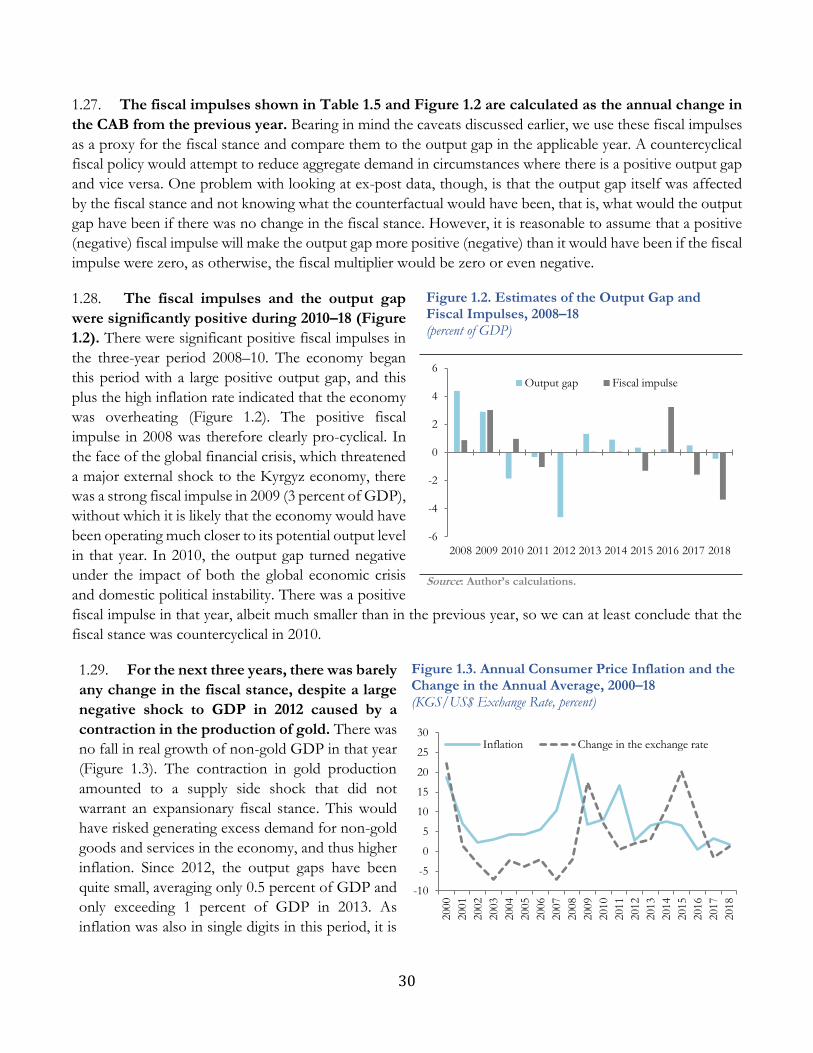
30
1.27. The fiscal impulses shown in Table 1.5 and Figure 1.2 are calculated as the annual change in
the CAB from the previous year. Bearing in mind the caveats discussed earlier, we use these fiscal impulses
as a proxy for the fiscal stance and compare them to the output gap in the applicable year. A countercyclical
fiscal policy would attempt to reduce aggregate demand in circumstances where there is a positive output gap
and vice versa. One problem with looking at ex-post data, though, is that the output gap itself was affected
by the fiscal stance and not knowing what the counterfactual would have been, that is, what would the output
gap have been if there was no change in the fiscal stance. However, it is reasonable to assume that a positive
(negative) fiscal impulse will make the output gap more positive (negative) than it would have been if the fiscal
impulse were zero, as otherwise, the fiscal multiplier would be zero or even negative.
1.28. The fiscal impulses and the output gap
were significantly positive during 2010–18 (Figure
1.2). There were significant positive fiscal impulses in
the three-year period 2008–10. The economy began
this period with a large positive output gap, and this
plus the high inflation rate indicated that the economy
was overheating (Figure 1.2). The positive fiscal
impulse in 2008 was therefore clearly pro-cyclical. In
the face of the global financial crisis, which threatened
a major external shock to the Kyrgyz economy, there
was a strong fiscal impulse in 2009 (3 percent of GDP),
without which it is likely that the economy would have
been operating much closer to its potential output level
in that year. In 2010, the output gap turned negative
under the impact of both the global economic crisis
and domestic political instability. There was a positive
fiscal impulse in that year, albeit much smaller than in the previous year, so we can at least conclude that the
fiscal stance was countercyclical in 2010.
1.29. For the next three years, there was barely
any change in the fiscal stance, despite a large
negative shock to GDP in 2012 caused by a
contraction in the production of gold. There was
no fall in real growth of non-gold GDP in that year
(Figure 1.3). The contraction in gold production
amounted to a supply side shock that did not
warrant an expansionary fiscal stance. This would
have risked generating excess demand for non-gold
goods and services in the economy, and thus higher
inflation. Since 2012, the output gaps have been
quite small, averaging only 0.5 percent of GDP and
only exceeding 1 percent of GDP in 2013. As
inflation was also in single digits in this period, it is
Figure 1.3. Annual Consumer Price Inflation and the Change in the Annual Average, 2000–18 (KGS/US$ Exchange Rate, percent)
-10
-5
0
5
10
15
20
25
30
2000
2001
2002
2003
2004
2005
2006
2007
2008
2009
2010
2011
2012
2013
2014
2015
2016
2017
2018
Inflation Change in the exchange rate
Figure 1.2. Estimates of the Output Gap and Fiscal Impulses, 2008–18 (percent of GDP)
Source: Author’s calculations.
-6
-4
-2
0
2
4
6
2008 2009 2010 2011 2012 2013 2014 2015 2016 2017 2018
Output gap Fiscal impulse
31
reasonable to conclude that the economy was
operating at close to its potential level throughout
most of 2014–18. In the past four years, the fiscal
impulses have been much larger than the output
gaps: the former was positive in 2016 and negative
in 2014, 2017, and 2018.
Source: World Bank World Development Indicators (WDI). Note: A rise in the exchange rate is depreciation.
1.30. The fiscal impulses were countercyclical in 2015 and 2017. They were negative, while the output
gaps were slightly positive, so that if the fiscal impulses had been zero in those two years, the positive output
gaps would have been larger. In 2016 there was a substantial positive fiscal impulse (3.3 percent of GDP),
while the output gap was positive but exceedingly small. It is reasonable to conclude that the output gap would
have been negative and much larger in absolute size than it was in 2016 without the large fiscal impulse (unless
the fiscal multiplier is small); hence the fiscal stance may also have been countercyclical in 2016. In 2018 the
fiscal impulse was negative and large (3.4 percent of GDP) while the output gap shifted from positive to
negative, although the absolute size remained quite small. Given the large size of the fiscal impulse, the output
gap would have been positive in 2018, but whether it would have been larger in absolute terms is difficult to
judge.14
1.31. What can we conclude as to whether fiscal policy has helped to stabilize the economy? Toward
the end of the 2000s, before the full impact of the global financial crisis struck the economy, fiscal policy was
pro-cyclical and exacerbated the overheating of the economy. It was broadly cyclically neutral in most of the
first half of the 2010s and appears to have been countercyclical in at least three of the past four years since
2014. Hence, in terms of macroeconomic stabilization, there has been an improvement in the conduct of
fiscal policy over the past 10 years. That is also borne out by the improved macroeconomic performance
recorded in the past few years, as discussed in Section C, although other factors may have also contributed to
this improvement.
The Institutional Framework for Macroeconomic Policy in the Kyrgyz Republic
1.32. Responsibility for determining the macroeconomic policies of the Kyrgyz Republic currently
lies primarily with two institutions. These are the Ministry of Finance (MoF) and the NBKR, together with
interagency committees, notably the Macroeconomic and Investment Policy Coordination Council, which is
chaired by the Prime Minister and includes the Ministries of Finance and the Economy. Responsibility for
fiscal policy is divided between the MoF and the MoE. The former has responsibility for the recurrent budget,
domestically financed capital expenditure, tax collection, and public debt management. The later has
responsibility for tax policy, while both ministries have responsibility for various aspects of externally financed
investment projects.
1.33. The MoF, with assistance from the MoE, prepares an annual document titled “Main
Directions of Fiscal Policy.” This document provides medium-term macroeconomic and fiscal projections
including three-year expenditure ceilings, alongside a description of the fiscal policy strategy, objectives and
14 This assessment is further impeded because the estimate of the output gap in 2018 may not be accurate, given the problems entailed in H-P filter estimates at the end point of time series noted in Box 1.1.
32
targets. The proposed policies in “Main Directions of Fiscal Policy” are guided by the National Development
Plan and the Development Program of the Kyrgyz Republic for the period 2018–22. “Main Directions of
Fiscal Policy” is approved by the Macroeconomic and Investment Policy Coordination Council, and this
document provides the parameters for the formulation of the following year’s state budget. The MoF also
publishes an Explanatory Note to the 2019 draft budget that provides extensive details on the fiscal objectives
and planned budgets for the medium term. Much of the note covers similar ground as the fiscal policy
document. The objectives of macroeconomic policy are also described in an annual “Joint Statement of the
Government of the Kyrgyz Republic and the National Bank of the Kyrgyz Republic on the Main Directions
of the Economic Policy.”15
1.34. Fiscal sustainability is a priority of fiscal policy. The MDFP 2019–21 states, “The aim of medium-term fiscal policy is to ensure stable economic growth and preservation of the stability of the state budget.”16 The stability of the budget means its sustainability, as the MDFP 2019–21 refers to the need to implement measures to reduce fiscal deficits “in order to strengthen the financial stability of the budget system” and to implement the fiscal rule, currently set out in a bill before Parliament that caps the overall fiscal deficit and nominal public debt at 3 percent and 70 percent of GDP, respectively.17 The proposed fiscal rule is discussed in Box 1.3. Government policy is not to borrow from the central bank to finance the budget, and this policy has been followed in recent years.18 Government policy is to have a minimum level of 35 percent concessionally of new external borrowing.19
1.35. The overall objective of the activity of the National Bank of the Kyrgyz Republic is to achieve
and maintain stability of prices by implementing an appropriate monetary policy. The NBKR is
preparing for the adoption of an inflation targeting monetary policy framework, with an inflation target of 5–
7 percent, and sets a policy interest rate. The website also states that “monetary policy will be built further on
the principles of a floating exchange rate policy. …”
1.36. What is missing from all the policy documents mentioned is a clear analysis of how the fiscal
policy objectives, which are clearly stated, translate into the specific fiscal stance proposed in these
documents. The MDFP 2019–21 identified stable economic growth and preservation of the stability of the
state budget as the medium-term objectives of fiscal policy. However, it does not discuss how these objectives
can be best realized in terms of targets for the fiscal deficit over the medium term, or any other macro-fiscal
aggregate, nor does it discuss any trade-offs between these two objectives. The MDFP 2019–21 does not
assess whether the economy is likely to require an expansionary or contractionary fiscal stance in the coming
fiscal year, given the macroeconomic forecasts in the document, or whether this was even taken into
consideration in the design of the budget. It also does not discuss what specific magnitudes of fiscal balances
are required to preserve the stability of the state budget (or the reasoning behind such conclusions) beyond
15 The most recent edition of this joint statement, available on the NBKR website, is dated February 2018. 16 MDFP 2019–21, page 31. 17 MDFP 2019–21, page 31. 18 The general government had a positive net balance of KGS 14.7 billion on the combination of all its accounts in the NBKR as of June 2019. That balance has not been negative since 2009. Furthermore, the gross loans of the NBKR to the government, comprising holdings of government securities and loans in foreign currency, have declined every year since 2011. However, although the net balance has been positive for the past 10 years, in some of those years the change in the balance was negative, mainly because the government drew down its deposits in the NBKR. Hence, in those years there was positive financing from the central bank to the budget (data from the Central Bank Survey on the NBKR website). 19 (MDFP 19–21, page 44)
33
referring to the proposed fiscal rule. The Explanatory Note to the draft budget for 2019 states that “work will
continue to consolidate the budget in order to reduce the budget deficit and preserve debt sustainability”,20
but it provides no explanation of why consolidation of the budget is needed or to what level the budget deficit
should be reduced to preserve debt sustainability.
1.37. Greater clarity as to how budget formulation is linked to fiscal objectives would be beneficial.
It would enhance public understanding of fiscal policy and of macroeconomic management in general if
documents such as the MDFP and Explanatory Note (1) provided an analysis of how the proposed budget
and medium-term fiscal framework are expected to help achieve the main objectives of fiscal policy; and (2)
explained how the specific macro-fiscal targets have been determined. Preparing such an analysis for these
documents would also help clarify the macro-fiscal issues for the policymakers involved in formulating the
budget.
1.38. The fragmentation of responsibilities for the fiscal policy between the MoF and MoE could
be problematic. Budgets should be formulated in a holistic manner, with planning of all the different
components undertaken jointly to best meet the strategic objectives of fiscal policy. For example, decisions
about tax policy cannot be taken independently of consideration of their impact on the budget resource
envelope and thus the consequences for expenditure or borrowing. Decisions about capital investment
projects cannot be taken without adequate consideration of the long-term operating costs of these projects
and how these costs will be funded within the future budget resource envelopes. There are risks that holistic
budget planning would be impeded by the division of responsibilities for budget policy making between to
separate ministries. As such, it would be preferable to concentrate responsibility for all aspects of fiscal
policy—budget expenditures including capital investment projects, revenue and taxation, and public
borrowing—within the MoF, as is the case in most countries around the world. The MoE would then focus
on the non-fiscal related aspects of public policy, such as regulation and preparation of macroeconomic
forecasts.
Box 1.3. The Proposed Fiscal Rule
The proposed fiscal rule limits the fiscal deficit of the general Government to 3 percent of GDP and the nominal value of public debt to 70 percent of GDP. The proposals are contained in the Kyrgyz Republic Budget Code amendments, which have been submitted to Parliament by the Prime Minister. The objective of the fiscal rule is to ensure fiscal sustainability through legal constraints on the size of fiscal deficits and public debt. Several other countries have adopted fiscal rules of this nature, including Armenia and Georgia, in the Central Asia and Caucasus region.
The Budget Code amendments also include provisions for an adjustment plan in the event the fiscal deficit and public debt ceilings are breached. The adjustment plan, which needs to include measures and annual targets, must eliminate the deviations from the fiscal deficit and public debt ceilings within five years.
A few points about the proposed fiscal rule from the Budget Code amendments are worth mentioning. First, the cap on the nominal value of public debt of 70 percent of GDP is high by comparison with rules in other countries
20 (page 12)
34
(both Armenia and Georgia have public debt ceilings of 60 percent of GDP, as does the European Union).21 The danger with setting a legislative ceiling as high as 70 percent of GDP is that the legislators then believe that public debt can prudently be allowed to increase to this level. But if public debt were to reach 70 percent of GDP, there would be no fiscal space left to accommodate adverse shocks (such as real exchange rate depreciation) without breaching debt sustainability thresholds, which would place the economy at a considerable risk of debt distress. Hence it would be more prudent for the legislation to impose a lower ceiling on the nominal value of public debt. Furthermore, to command credibility with the markets and the public, the Kyrgyz Republic should not set a public debt ceiling higher than that imposed by most other developing countries that have such rules. In the 2019 Article IV Report, the IMF recommends that the fiscal rule should impose a ceiling of 60–65 percent of GDP for public debt.
Second, the value of a cap on the fiscal deficit as a means of ensuring fiscal sustainability depends on the proper measurement of the fiscal deficit. The Budget Code amendments do not specify the methodology for calculating the general Government deficit. The Government currently measures the fiscal deficit in official documents by excluding on-lending to SOEs and other entities. This on-lending is treated as a below-the-line financing item rather than an above-the-line expenditure, which would be in accord with the government Finance Statistics Manual (GFSM). By excluding on-lending from expenditures and treating it instead as a financing item, the fiscal deficit, as measured by the Government, is smaller than it would be if measured in accord with the GFSM. The former also fails to capture the full impact of fiscal operations on public debt.
As shown in Table 1.1, net on-lending to SOEs has been quite large, averaging 2 percent of GDP during 2014–18. Consequently, the fiscal deficit measured by the government will be, on average, two percentage points smaller than the deficit as measured in accord with the GFSM. As noted, the motivation for the fiscal rule is to safeguard fiscal sustainability. Hence it is imperative that the measurement of the fiscal deficit used in the fiscal rule is fully consistent with the impact of fiscal operations on public debt. That means that the GFSM definition of the fiscal deficit should be used to operationalize the fiscal rule.
Third, it is optimal to allow some flexibility for breaches of the fiscal deficit ceiling in the event of a negative shock to the budget. This is because a too rigid fiscal rule impedes the use of fiscal policy as a tool of macroeconomic stabilization and could impart a pro-cyclical bias to fiscal policy if the deficit ceiling binds continuously. However, the proposals set in the Budget Code amendments, which pertain to the adjustment plan, have several shortcomings. They do not specify the circumstances in which an annual deviation from the deficit and debt ceilings is permissible; instead, they imply that deviations are permissible regardless of the circumstances, provided that the deviations are followed by an adjustment plan to rectify them within five years. It would be preferable for the legislation to clearly state that deviations are only permissible in the event of specific adverse shocks, such as a fall in real growth or a state of emergency requiring public resources. Furthermore, the period for rectifying deviations from the deficit and debt ceilings, which is effectively five years, appears extremely long to rectify deviations in most circumstances. Also, it is not clear whether “to eliminate the deviation” means simply to lower a fiscal deficit back to 3 percent of GDP, or instead to reduce it temporarily below 3 percent of GDP so that the average deficit over the medium term, including the year in which the deviation occurred, is no higher than 3 percent of GDP. If it is the former, it would effectively mean that the government could run fiscal deficits higher than 3 percent of GDP continuously.
Recommendations
1.39. Make raising productivity growth a priority objective for public policy. The key development
challenge for the Kyrgyz Republic is to raise per capita real GDP in a sustainable manner over the long term.
21 IMF (2017) lists 20 emerging-market and developing countries that have statutory public debt ceilings independent of those imposed as part of a monetary union. Of these 20 countries, 11 have a public debt ceiling of 60 percent of GDP, while the other nine have ceilings that range from 30 to 55 percent of GDP. In some countries the ceilings are targets to be reached at a specified future date through a reduction of debt.
35
For this to be sustainable, it must be based on strong productivity growth, which in turn means mobilizing
more private investment in industries that create high productivity employment; so far, this has occurred only
on a limited scale. Fiscal policy can help strengthen the supply side of the economy over the medium to long
term, especially by providing public goods and services that are complementary to private sector investment,
and therefore strengthen incentives for private investment. The competitiveness of the Kyrgyz economy is
impeded by large infrastructure gaps, and their closing will require more public investment and resources for
repair and maintenance of infrastructure.
1.40. Although the current and planned fiscal stance appears to be consistent with fiscal
sustainability, there is still need for prudence going forward to maintain control over fiscal deficits.
Over the medium to long term, fiscal deficits should be consistent with public debt–to-GDP ratios that are
well within debt sustainability thresholds, so that there is fiscal space to respond to adverse fiscal shocks
without risking public debt sustainability. The nominal public debt-to-GDP ratio is the highest among the
FSU countries of Central Asia and the Caucasus. Fiscal policy should be designed to ensure that public debt
ratios do not increase any further over the medium to long term. The experience of the volatility of the Kyrgyz
economy over the past two decades demonstrates that adverse shocks, such as sharp real exchange rate
depreciation, can drive up public debt ratios quickly (as occurred between 2013 and 2015). Hence it is
imperative to maintain substantial fiscal buffers. Fiscal policy should aim to hold the public debt-to-GDP
ratio over the medium to long term at 60 percent of GDP, which is slightly lower than the current ratio, to
ensure that there are sufficiently large fiscal buffers to absorb negative fiscal shocks without threatening debt
sustainability.
1.41. Explicitly incorporate into budget planning the fiscal risks arising from the economic deficits
and contingent liabilities of the SOEs, especially in the energy sector. The fiscal risks section in the
annual explanatory notes to the draft budget should include a comprehensive assessment of the projected
economic losses and the contingent liabilities of the SOEs over the medium term. The section should also
include a realistic estimate of the demands on the budget under a base case scenario, together with the
maximum budget requirements if a worst-case scenario were to materialize. Comprehensive reforms to the
energy sector, including tariff reform, as discussed in Chapter 4, are a prerequisite for the eventual elimination
of fiscal risks posed by the sector.
1.42. Given the constraints on the effectiveness of monetary policy in a shallow and highly
dollarized financial system, there is a role for fiscal policy to play in short-term macroeconomic
stabilization. However, to do this effectively and consistently, the MoF will need to strengthen its technical
capacities for formulating macro-fiscal policy. The creation of a macro-fiscal policy department within the
MoF could contribute to this objective.
1.43. Enlist the MoF to articulate the links more explicitly between macro-fiscal policy objectives,
such as maintaining macroeconomic stability and fiscal sustainability, and the specific targets in the
annual budget, for example, the fiscal deficit. So, clearer and precise language should be used in
documents such as “Main Directions of Fiscal Policy” and the explanatory notes to the draft budget. This
would enhance the clarity and transparency of macro-fiscal policy and ensure that the details of macro-fiscal
issues attract greater consideration from policymakers during the formulation of the budget.
36
1.44. The fiscal rule included in the amendments to the Budget Code, which have been submitted
to Parliament, can help ensure fiscal sustainability in the Kyrgyz Republic. However, the measurement
of the fiscal deficit should be in accord with the GFSM definition so that all on-lending for policy purposes
is treated as an above-the-line expenditure that contributes to the fiscal balance. It would be prudent to lower
the public debt-to-GDP ceiling in the fiscal rule from the proposed 70 percent to about 60 percent. A level
of 60 percent of GDP would provide a reasonable fiscal buffer between the statutory debt ceiling and the
level at which the Kyrgyz Republic would be deemed debt distressed. It would also be in line with the level
adopted most frequently by emerging market and developing countries with statutory public debt ceilings,
including Armenia and Georgia, in the Central Asia and Caucasus region. There is also a need for more clarity
in the adjustment plan in case deviations from the deficit and debt ceilings occur. It is necessary to allow some
flexibility in the fiscal rule to avoid imparting a pro-cyclical bias to fiscal policy. Allowing the fiscal deficit to
deviate from the ceiling during economic downturns, which reduce budget revenues, can help mitigate this
problem, but the fiscal rule needs to be carefully drafted to achieve this. The fiscal rule should restrict the
circumstances in which such deviations can occur to clearly specified adverse shocks. When deviations from
the fiscal deficit ceiling occur, the adjustment plan should ensure that in the future, they are offset by deficits
lower than the 3 percent of the GDP ceiling. This would make certain that the average fiscal deficit, measured
over a medium-term horizon, does not exceed 3 percent of GDP.
1.45. The quality of fiscal policy might benefit from institutional changes within the MoF. The MoF
should place greater emphasis on policy analysis and formulation. Dedicated departments for macro-fiscal
policy and expenditure policy should be established.
37
Government Expenditure Performance and Budget Reforms
Context
The Kyrgyz Republic economy remains heavily tilted toward the public sector, characterized by high government spending.
Implementing the approved budget has been consistently erratic and highlights the weak budgetary system characterized by
insufficient budgeted expenditure. On average, there was a 3 percent shortfall in current expenditure outturn relative to the
approved budget and a 15 percent shortfall in capital expenditure over 2013–18. The efficiency of public spending can be improved
through the allocation of limited resources, among others. Key challenges preventing the government from fully realizing its ability
to reallocate budget resources toward physical capital needs to be addressed. The budgeting processes for public investment projects
are fragmented, governed by different regimes depending on funding sources. Public investment management (PIM) is characterized
by weak planning, implementation, monitoring, and evaluation cycle, which seriously impedes the efficiency of the public investment.
The energy sector’s economic losses, including its large capital investment needs and contingent liabilities, pose significant risks to
fiscal sustainability over the medium to long term. The economic affairs function received a significant increase in its share of
budgeted resources in the state budget, allocated for investment with gains made in 2013–17, but were mostly reversed in 2018
because of underperformance of capital expenditure. The introduction of program-based budgeting (PBB) in the 2000s has proved
challenging for the government to implement, as it requires radical changes in which budgets are planned. However, the skills for
budget planning are in short supply throughout the Government. Progress has not been substantial. In 2019, two pilot
ministries―Health, and Roads and Transport―were launched, but the pilot ministries’ budget operations’ actual changes are
limited.
This chapter makes the following recommendations:
• Continue the effort to reallocate budgetary resources toward public investment to make the budget more supportive of economic growth.
• Persevere with PBB implementation even though it is a long-term project that places great demands on the Government's scarce human resources (HR).
• Develop the PBB strategy to implement more substantial and meaningful reforms in the two pilot ministries and learn how to best implement PBB from experience before extending the pilot to more ministries.
• If PBB is meaningful, capital and current expenditures must be determined together by each sector within its overall expenditure ceiling.
• The proposed PIM reforms are potentially crucial for ensuring better quality investment projects through improved project selection, monitoring, and evaluation.
Introduction
2.1 The 2014 Public Expenditure Review concluded that the overall level, composition, and efficiency of government expenditure were serious causes of concern. The PER found that the government expenditure-to-GDP ratio was high (close to 40 percent in 2012) compared to LICs and LMICs and that the composition of expenditure was not conducive to economic growth. Insufficient budgetary resources were allocated to the building and maintenance of public infrastructure. As a result, infrastructure was depleted and suffered from a large maintenance backlog. In contrast, government expenditures on wages and transfers were higher than regional averages, although this had not prevented an increase in poverty levels from 2008 to 2012.
38
2.2 This chapter assesses the progress made since the 2014 PER in improving the allocation and implementation of government expenditures and in introducing reforms to budget planning and management. This section looks at the size of the general government expenditures and compares this with other FSU countries. Section C discusses the strategic expenditure priorities of the government and what this implies for the composition of the budget. Section D reviews the allocation of state budget expenditures in terms of their functional and economic classification to assess whether there has been any progress toward a more growth-oriented budget and whether greater priority has been accorded to physical and human capital investment. Section E examines the implementation of the budget in terms of the consistency between planned budgets and budget outturns. Sections F and G address qualitative aspects of budget planning and management, notably the introduction of program-based budgeting and public investment management reforms. Section H provides conclusions and recommendations.
The Size of the General Government
2.3 This section examines the trends in the overall size of the general government expenditure and its major components in the Kyrgyz Republic and compares the size of the general government with that of other FSU countries. The general government budget consists of the state budget and the Social Security Fund. The state budget consists of the republican budget, which includes expenditures allocated by the central government, and the budgets of the local governments; the former comprises 90 percent of the state budget. To derive general government budget expenditures, state budget expenditures minus transfers from the state budget to the Social Security Fund are added to Social Security Fund expenditures.
2.4 Our interest in the overall size of the general government largely arises from issues related to efficiency, the type of goods and services provided by the government, and the overall tax burden the funding of expenditures requires. General government expenditures are funded by government revenues and are not subject to competition in the marketplace. The government should restrict its activities to public goods and services, which cannot be supplied optimally by the market. Furthermore, if these comprise too large a share of the economy, it is possible that the overall efficiency of the economy might be undermined, both because of the absence of competitive pressures in large parts of the economy and because of the large tax and non-tax revenue burden imposed on the economy to finance an elevated level of government expenditure. The Kyrgyz Government provides few marketable goods and services through the budget, except for the loans it makes to SOEs, which averaged 1.5 percent of GDP over the past three years. General government expenditure is quite high in the Kyrgyz Republic (Table 2.1), in part because of spending on social security payments, which averaged 9 percent of GDP over the past three years.
2.5 Between 2011–13 and 2016–18, only a small decline in the share of the general government in the economy was observed. Although there has been a decline in total general government expenditure as a share of GDP between 2012 and 2018, which were anomalous years for varied reasons. The former was a year in which the economy suffered a negative output gap of 5 percent of GDP (see Chapter 1), and the latter was a year in which externally financed capital expenditures underperformed compared to budgeted levels to a much greater extent than has been typical in recent years (see Section 4). If we look at three-year averages, total expenditure averaged 37.4 percent of GDP during 2011–13 and 36.3 percent of GDP during 2016–18; hence the downward trend in total expenditures as a percent of GDP has been small. However, the very modest decline that did occur was attributable to lower current expenditures, with capital expenditures unchanged despite their underperformance in 2018.
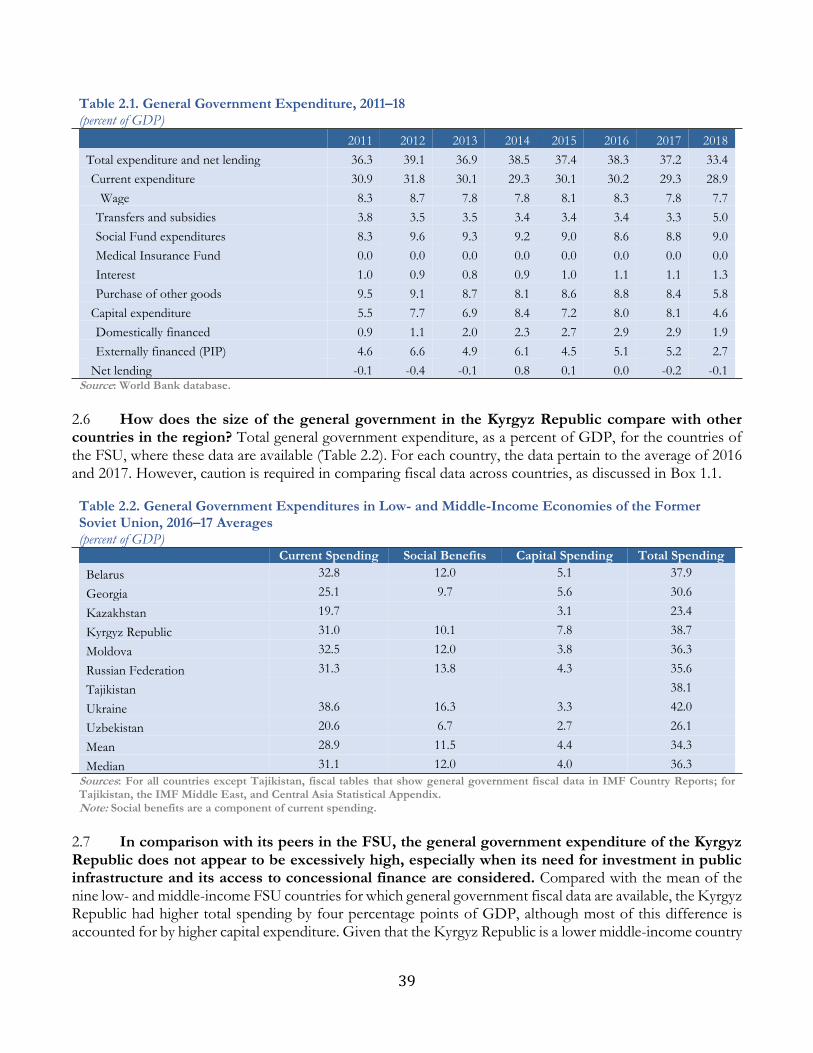
39
Table 2.1. General Government Expenditure, 2011–18 (percent of GDP)
2011 2012 2013 2014 2015 2016 2017 2018
Total expenditure and net lending 36.3 39.1 36.9 38.5 37.4 38.3 37.2 33.4
Current expenditure 30.9 31.8 30.1 29.3 30.1 30.2 29.3 28.9
Wage 8.3 8.7 7.8 7.8 8.1 8.3 7.8 7.7
Transfers and subsidies 3.8 3.5 3.5 3.4 3.4 3.4 3.3 5.0
Social Fund expenditures 8.3 9.6 9.3 9.2 9.0 8.6 8.8 9.0
Medical Insurance Fund 0.0 0.0 0.0 0.0 0.0 0.0 0.0 0.0
Interest 1.0 0.9 0.8 0.9 1.0 1.1 1.1 1.3
Purchase of other goods 9.5 9.1 8.7 8.1 8.6 8.8 8.4 5.8
Capital expenditure 5.5 7.7 6.9 8.4 7.2 8.0 8.1 4.6
Domestically financed 0.9 1.1 2.0 2.3 2.7 2.9 2.9 1.9
Externally financed (PIP) 4.6 6.6 4.9 6.1 4.5 5.1 5.2 2.7
Net lending -0.1 -0.4 -0.1 0.8 0.1 0.0 -0.2 -0.1
Source: World Bank database.
2.6 How does the size of the general government in the Kyrgyz Republic compare with other countries in the region? Total general government expenditure, as a percent of GDP, for the countries of the FSU, where these data are available (Table 2.2). For each country, the data pertain to the average of 2016 and 2017. However, caution is required in comparing fiscal data across countries, as discussed in Box 1.1.
Table 2.2. General Government Expenditures in Low- and Middle-Income Economies of the Former Soviet Union, 2016–17 Averages (percent of GDP)
Current Spending Social Benefits Capital Spending Total Spending
Belarus 32.8 12.0 5.1 37.9
Georgia 25.1 9.7 5.6 30.6
Kazakhstan 19.7 3.1 23.4
Kyrgyz Republic 31.0 10.1 7.8 38.7
Moldova 32.5 12.0 3.8 36.3
Russian Federation 31.3 13.8 4.3 35.6
Tajikistan 38.1
Ukraine 38.6 16.3 3.3 42.0
Uzbekistan 20.6 6.7 2.7 26.1
Mean 28.9 11.5 4.4 34.3
Median 31.1 12.0 4.0 36.3
Sources: For all countries except Tajikistan, fiscal tables that show general government fiscal data in IMF Country Reports; for Tajikistan, the IMF Middle East, and Central Asia Statistical Appendix. Note: Social benefits are a component of current spending.
2.7 In comparison with its peers in the FSU, the general government expenditure of the Kyrgyz Republic does not appear to be excessively high, especially when its need for investment in public infrastructure and its access to concessional finance are considered. Compared with the mean of the nine low- and middle-income FSU countries for which general government fiscal data are available, the Kyrgyz Republic had higher total spending by four percentage points of GDP, although most of this difference is accounted for by higher capital expenditure. Given that the Kyrgyz Republic is a lower middle-income country
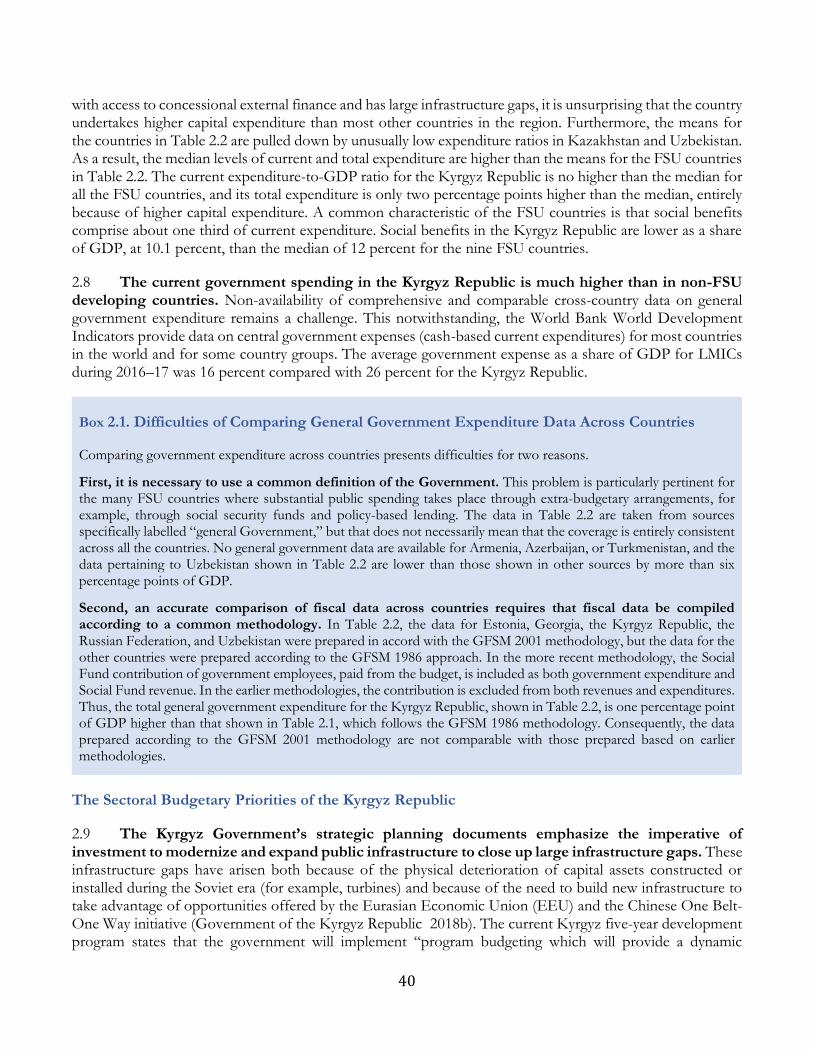
40
with access to concessional external finance and has large infrastructure gaps, it is unsurprising that the country undertakes higher capital expenditure than most other countries in the region. Furthermore, the means for the countries in Table 2.2 are pulled down by unusually low expenditure ratios in Kazakhstan and Uzbekistan. As a result, the median levels of current and total expenditure are higher than the means for the FSU countries in Table 2.2. The current expenditure-to-GDP ratio for the Kyrgyz Republic is no higher than the median for all the FSU countries, and its total expenditure is only two percentage points higher than the median, entirely because of higher capital expenditure. A common characteristic of the FSU countries is that social benefits comprise about one third of current expenditure. Social benefits in the Kyrgyz Republic are lower as a share of GDP, at 10.1 percent, than the median of 12 percent for the nine FSU countries.
2.8 The current government spending in the Kyrgyz Republic is much higher than in non-FSU developing countries. Non-availability of comprehensive and comparable cross-country data on general government expenditure remains a challenge. This notwithstanding, the World Bank World Development Indicators provide data on central government expenses (cash-based current expenditures) for most countries in the world and for some country groups. The average government expense as a share of GDP for LMICs during 2016–17 was 16 percent compared with 26 percent for the Kyrgyz Republic.
Box 2.1. Difficulties of Comparing General Government Expenditure Data Across Countries
Comparing government expenditure across countries presents difficulties for two reasons.
First, it is necessary to use a common definition of the Government. This problem is particularly pertinent for the many FSU countries where substantial public spending takes place through extra-budgetary arrangements, for example, through social security funds and policy-based lending. The data in Table 2.2 are taken from sources specifically labelled “general Government,” but that does not necessarily mean that the coverage is entirely consistent across all the countries. No general government data are available for Armenia, Azerbaijan, or Turkmenistan, and the data pertaining to Uzbekistan shown in Table 2.2 are lower than those shown in other sources by more than six percentage points of GDP.
Second, an accurate comparison of fiscal data across countries requires that fiscal data be compiled according to a common methodology. In Table 2.2, the data for Estonia, Georgia, the Kyrgyz Republic, the Russian Federation, and Uzbekistan were prepared in accord with the GFSM 2001 methodology, but the data for the other countries were prepared according to the GFSM 1986 approach. In the more recent methodology, the Social Fund contribution of government employees, paid from the budget, is included as both government expenditure and Social Fund revenue. In the earlier methodologies, the contribution is excluded from both revenues and expenditures. Thus, the total general government expenditure for the Kyrgyz Republic, shown in Table 2.2, is one percentage point of GDP higher than that shown in Table 2.1, which follows the GFSM 1986 methodology. Consequently, the data prepared according to the GFSM 2001 methodology are not comparable with those prepared based on earlier methodologies.
The Sectoral Budgetary Priorities of the Kyrgyz Republic
2.9 The Kyrgyz Government’s strategic planning documents emphasize the imperative of investment to modernize and expand public infrastructure to close up large infrastructure gaps. These infrastructure gaps have arisen both because of the physical deterioration of capital assets constructed or installed during the Soviet era (for example, turbines) and because of the need to build new infrastructure to take advantage of opportunities offered by the Eurasian Economic Union (EEU) and the Chinese One Belt-One Way initiative (Government of the Kyrgyz Republic 2018b). The current Kyrgyz five-year development program states that the government will implement “program budgeting which will provide a dynamic
41
transition from social to investment orientation of the budget for the development of the real sector of the economy. …”22 The word social in this sentence appears to pertain to current expenditures in general rather than expenditures specifically on social services, because the development program also stresses that priority will be given to the provision of social services. For example, the program states, “The guiding principle of the government will be the creation and improvement of the necessary conditions for every citizen of the Republic to receive a decent, competitive education, quality health care and the necessary social support” (page 42).
2.10 The contention that the economy faces large infrastructure gaps, especially in the transport and energy sectors, and that these gaps constitute a constraint on the competitiveness of the economy, is soundly based. The Kyrgyz Republic ranked 113 out of 138 countries in the infrastructure sub-index of the World Economic Forum’s 2016–17 Global Competitiveness Index, and only 130 on the transport infrastructure sub-component of that index. It ranked 146 out of 160 countries on the Logistics Performance Index, and its evaluation for that index includes a score of only 1.9 out of 5 for trade and transport related infrastructure. On all components of the Logistic Performance Index, the Kyrgyz Republic scored worse than the average for both central Asian and landlocked countries.23 Road and rail densities are low and lag regional peers, and the quality of much of the road network is poor. The deficiencies of the transport infrastructure impede growth in the rural areas and the development of export industries (World Bank 2018).
2.11 Although the Kyrgyz Republic scores better in terms of access to electricity than transport infrastructure, the energy sector requires major capital investments to rehabilitate or replace ageing capital assets. Many capital assets are far older than their normal service life and have thus become prone to frequent breakdowns that disrupt power and heating supplies. Consequently, 35 percent of firms in the BEEPs (Business Environment and Enterprise Performance Survey) identify electricity as a major constraint on their operations and the quality of service delivery is often poor. Furthermore, the expansion of electricity generating capacity is not keeping pace with the growth of domestic demand, necessitating increasing electricity imports during the winter.24
2.12 Strengthening public infrastructure could boost GDP growth. As discussed in Chapter 1, the Kyrgyz economy has suffered from weak GDP growth per capita over the past 10 years. Given the convincing evidence cited earlier that infrastructure gaps are a constraint on the economy’s competitiveness, there is a compelling argument that higher investment in public infrastructure would enhance the productivity and the competitiveness of the private sector and thus bolster GDP growth over the medium to long term. Better transport infrastructure will be essential if the Kyrgyz Republic is to successfully pursue an export-oriented growth strategy, which is the only feasible way to achieve sustainable development given the small size of the domestic market.
2.13 Bridging these gaps has major implications for the allocation of budgetary resources. The IMF provides estimates of the additional spending required to achieve the Sustainable Development Goals (SDGs) in five sectors over the period 2019–30 (IMF 2019). Three infrastructure sectors―roads, water, and electricity—require additional expenditure amounting to 63 percent of 2018 GDP (nearly two thirds of which is accounted for by investment in roads), while the health and education sectors require additional expenditures of 18 and 25 percent of 2018 GDP, respectively. If we assume average annual real GDP growth of 4.5 percent during 2019–30, the total additional expenditure required by these five sectors to meet the
22 Government of the Kyrgyz Republic 2018b, page 21. 23 These rankings and scores are derived from the findings of BEEPS. 24 See the Energy chapter in the forthcoming Country Economic Memorandum.
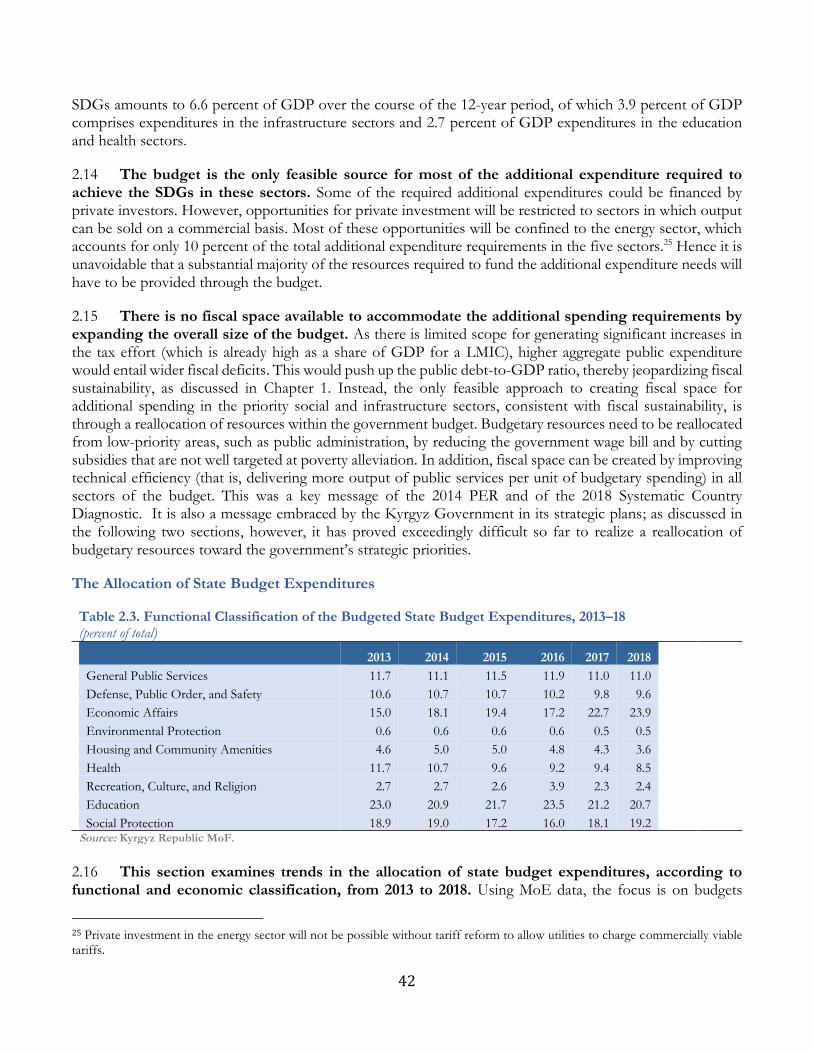
42
SDGs amounts to 6.6 percent of GDP over the course of the 12-year period, of which 3.9 percent of GDP comprises expenditures in the infrastructure sectors and 2.7 percent of GDP expenditures in the education and health sectors.
2.14 The budget is the only feasible source for most of the additional expenditure required to achieve the SDGs in these sectors. Some of the required additional expenditures could be financed by private investors. However, opportunities for private investment will be restricted to sectors in which output can be sold on a commercial basis. Most of these opportunities will be confined to the energy sector, which accounts for only 10 percent of the total additional expenditure requirements in the five sectors.25 Hence it is unavoidable that a substantial majority of the resources required to fund the additional expenditure needs will have to be provided through the budget.
2.15 There is no fiscal space available to accommodate the additional spending requirements by expanding the overall size of the budget. As there is limited scope for generating significant increases in the tax effort (which is already high as a share of GDP for a LMIC), higher aggregate public expenditure would entail wider fiscal deficits. This would push up the public debt-to-GDP ratio, thereby jeopardizing fiscal sustainability, as discussed in Chapter 1. Instead, the only feasible approach to creating fiscal space for additional spending in the priority social and infrastructure sectors, consistent with fiscal sustainability, is through a reallocation of resources within the government budget. Budgetary resources need to be reallocated from low-priority areas, such as public administration, by reducing the government wage bill and by cutting subsidies that are not well targeted at poverty alleviation. In addition, fiscal space can be created by improving technical efficiency (that is, delivering more output of public services per unit of budgetary spending) in all sectors of the budget. This was a key message of the 2014 PER and of the 2018 Systematic Country Diagnostic. It is also a message embraced by the Kyrgyz Government in its strategic plans; as discussed in the following two sections, however, it has proved exceedingly difficult so far to realize a reallocation of budgetary resources toward the government’s strategic priorities.
The Allocation of State Budget Expenditures
Table 2.3. Functional Classification of the Budgeted State Budget Expenditures, 2013–18 (percent of total)
2013 2014 2015 2016 2017 2018
General Public Services 11.7 11.1 11.5 11.9 11.0 11.0
Defense, Public Order, and Safety 10.6 10.7 10.7 10.2 9.8 9.6
Economic Affairs 15.0 18.1 19.4 17.2 22.7 23.9
Environmental Protection 0.6 0.6 0.6 0.6 0.5 0.5
Housing and Community Amenities 4.6 5.0 5.0 4.8 4.3 3.6
Health 11.7 10.7 9.6 9.2 9.4 8.5
Recreation, Culture, and Religion 2.7 2.7 2.6 3.9 2.3 2.4
Education 23.0 20.9 21.7 23.5 21.2 20.7
Social Protection 18.9 19.0 17.2 16.0 18.1 19.2
Source: Kyrgyz Republic MoF.
2.16 This section examines trends in the allocation of state budget expenditures, according to functional and economic classification, from 2013 to 2018. Using MoE data, the focus is on budgets
25 Private investment in the energy sector will not be possible without tariff reform to allow utilities to charge commercially viable tariffs.
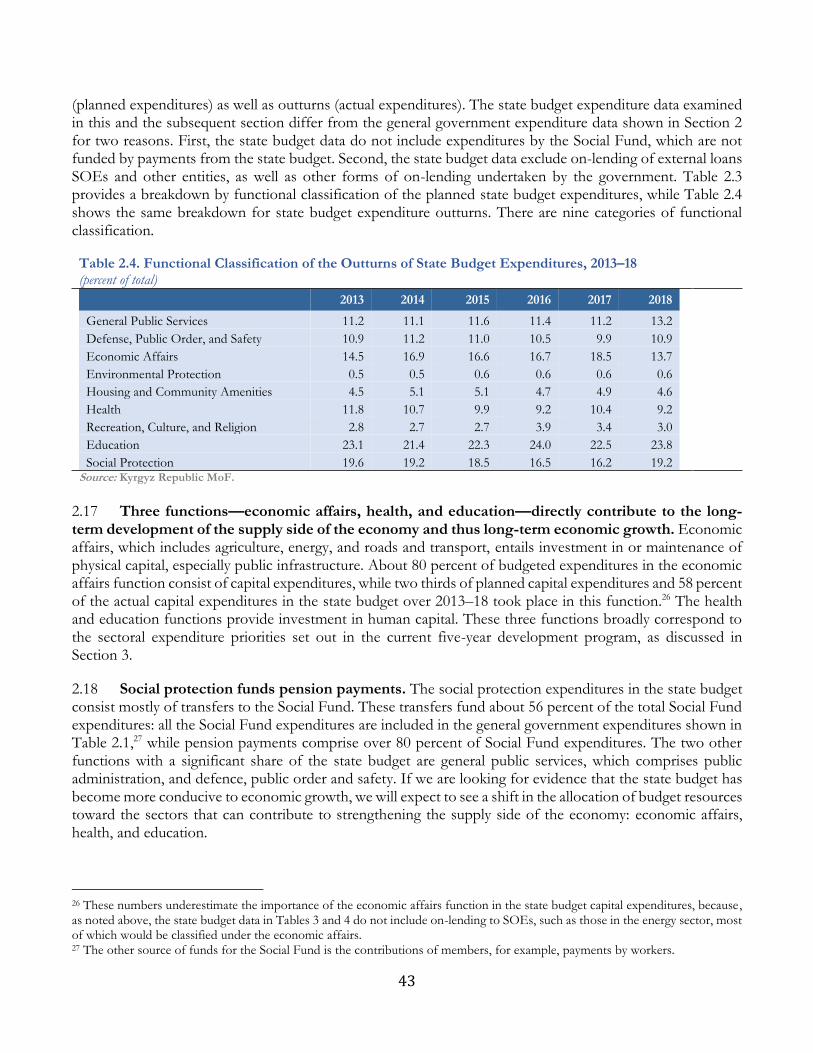
43
(planned expenditures) as well as outturns (actual expenditures). The state budget expenditure data examined in this and the subsequent section differ from the general government expenditure data shown in Section 2 for two reasons. First, the state budget data do not include expenditures by the Social Fund, which are not funded by payments from the state budget. Second, the state budget data exclude on-lending of external loans SOEs and other entities, as well as other forms of on-lending undertaken by the government. Table 2.3 provides a breakdown by functional classification of the planned state budget expenditures, while Table 2.4 shows the same breakdown for state budget expenditure outturns. There are nine categories of functional classification.
Table 2.4. Functional Classification of the Outturns of State Budget Expenditures, 2013–18 (percent of total)
2013 2014 2015 2016 2017 2018
General Public Services 11.2 11.1 11.6 11.4 11.2 13.2
Defense, Public Order, and Safety 10.9 11.2 11.0 10.5 9.9 10.9
Economic Affairs 14.5 16.9 16.6 16.7 18.5 13.7
Environmental Protection 0.5 0.5 0.6 0.6 0.6 0.6
Housing and Community Amenities 4.5 5.1 5.1 4.7 4.9 4.6
Health 11.8 10.7 9.9 9.2 10.4 9.2
Recreation, Culture, and Religion 2.8 2.7 2.7 3.9 3.4 3.0
Education 23.1 21.4 22.3 24.0 22.5 23.8
Social Protection 19.6 19.2 18.5 16.5 16.2 19.2
Source: Kyrgyz Republic MoF.
2.17 Three functions—economic affairs, health, and education—directly contribute to the long-term development of the supply side of the economy and thus long-term economic growth. Economic affairs, which includes agriculture, energy, and roads and transport, entails investment in or maintenance of physical capital, especially public infrastructure. About 80 percent of budgeted expenditures in the economic affairs function consist of capital expenditures, while two thirds of planned capital expenditures and 58 percent of the actual capital expenditures in the state budget over 2013–18 took place in this function.26 The health and education functions provide investment in human capital. These three functions broadly correspond to the sectoral expenditure priorities set out in the current five-year development program, as discussed in Section 3.
2.18 Social protection funds pension payments. The social protection expenditures in the state budget consist mostly of transfers to the Social Fund. These transfers fund about 56 percent of the total Social Fund expenditures: all the Social Fund expenditures are included in the general government expenditures shown in Table 2.1,27 while pension payments comprise over 80 percent of Social Fund expenditures. The two other functions with a significant share of the state budget are general public services, which comprises public administration, and defence, public order and safety. If we are looking for evidence that the state budget has become more conducive to economic growth, we will expect to see a shift in the allocation of budget resources toward the sectors that can contribute to strengthening the supply side of the economy: economic affairs, health, and education.
26 These numbers underestimate the importance of the economic affairs function in the state budget capital expenditures, because, as noted above, the state budget data in Tables 3 and 4 do not include on-lending to SOEs, such as those in the energy sector, most of which would be classified under the economic affairs. 27 The other source of funds for the Social Fund is the contributions of members, for example, payments by workers.
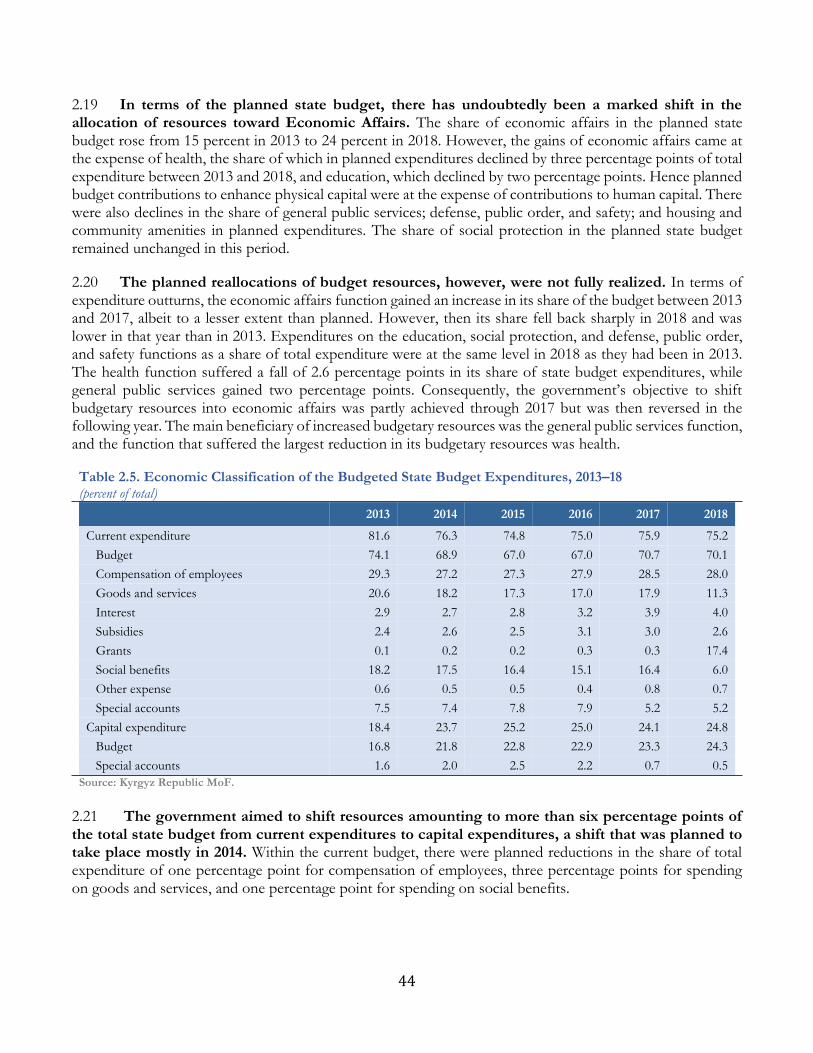
44
2.19 In terms of the planned state budget, there has undoubtedly been a marked shift in the allocation of resources toward Economic Affairs. The share of economic affairs in the planned state budget rose from 15 percent in 2013 to 24 percent in 2018. However, the gains of economic affairs came at the expense of health, the share of which in planned expenditures declined by three percentage points of total expenditure between 2013 and 2018, and education, which declined by two percentage points. Hence planned budget contributions to enhance physical capital were at the expense of contributions to human capital. There were also declines in the share of general public services; defense, public order, and safety; and housing and community amenities in planned expenditures. The share of social protection in the planned state budget remained unchanged in this period.
2.20 The planned reallocations of budget resources, however, were not fully realized. In terms of expenditure outturns, the economic affairs function gained an increase in its share of the budget between 2013 and 2017, albeit to a lesser extent than planned. However, then its share fell back sharply in 2018 and was lower in that year than in 2013. Expenditures on the education, social protection, and defense, public order, and safety functions as a share of total expenditure were at the same level in 2018 as they had been in 2013. The health function suffered a fall of 2.6 percentage points in its share of state budget expenditures, while general public services gained two percentage points. Consequently, the government’s objective to shift budgetary resources into economic affairs was partly achieved through 2017 but was then reversed in the following year. The main beneficiary of increased budgetary resources was the general public services function, and the function that suffered the largest reduction in its budgetary resources was health.
Table 2.5. Economic Classification of the Budgeted State Budget Expenditures, 2013–18 (percent of total)
2013 2014 2015 2016 2017 2018
Current expenditure 81.6 76.3 74.8 75.0 75.9 75.2
Budget 74.1 68.9 67.0 67.0 70.7 70.1
Compensation of employees 29.3 27.2 27.3 27.9 28.5 28.0
Goods and services 20.6 18.2 17.3 17.0 17.9 11.3
Interest 2.9 2.7 2.8 3.2 3.9 4.0
Subsidies 2.4 2.6 2.5 3.1 3.0 2.6
Grants 0.1 0.2 0.2 0.3 0.3 17.4
Social benefits 18.2 17.5 16.4 15.1 16.4 6.0
Other expense 0.6 0.5 0.5 0.4 0.8 0.7
Special accounts 7.5 7.4 7.8 7.9 5.2 5.2
Capital expenditure 18.4 23.7 25.2 25.0 24.1 24.8
Budget 16.8 21.8 22.8 22.9 23.3 24.3
Special accounts 1.6 2.0 2.5 2.2 0.7 0.5
Source: Kyrgyz Republic MoF.
2.21 The government aimed to shift resources amounting to more than six percentage points of the total state budget from current expenditures to capital expenditures, a shift that was planned to take place mostly in 2014. Within the current budget, there were planned reductions in the share of total expenditure of one percentage point for compensation of employees, three percentage points for spending on goods and services, and one percentage point for spending on social benefits.
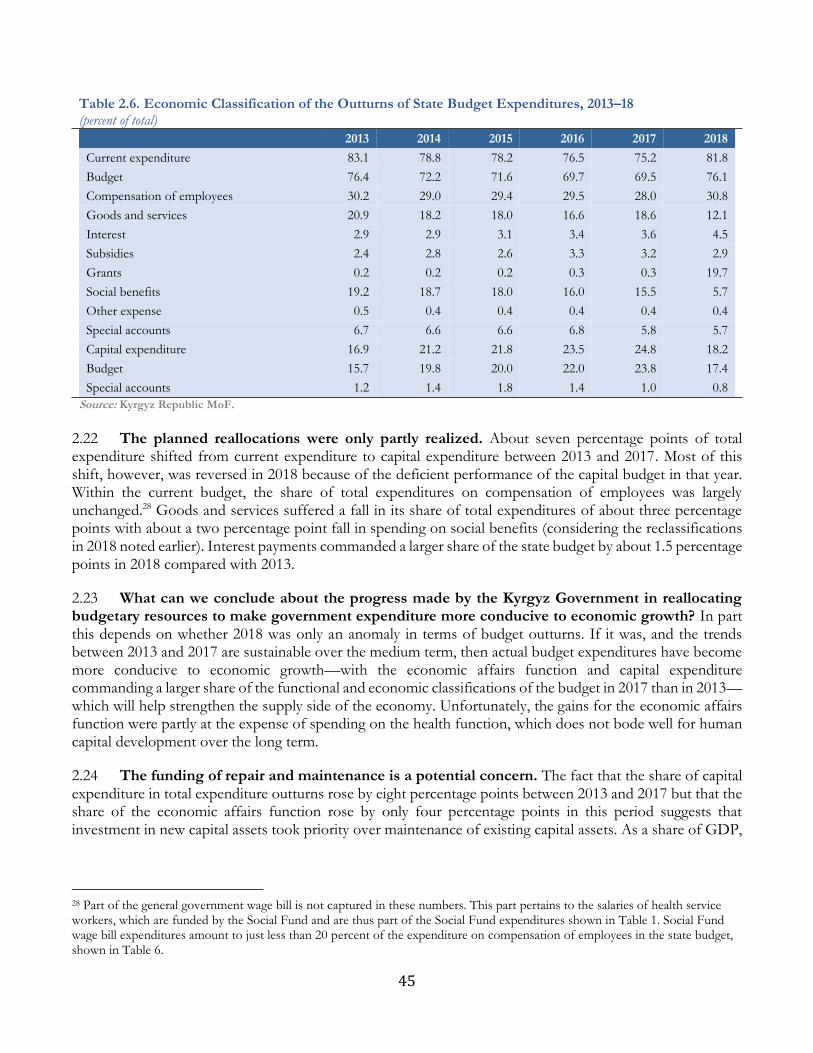
45
Table 2.6. Economic Classification of the Outturns of State Budget Expenditures, 2013–18 (percent of total)
2013 2014 2015 2016 2017 2018
Current expenditure 83.1 78.8 78.2 76.5 75.2 81.8
Budget 76.4 72.2 71.6 69.7 69.5 76.1
Compensation of employees 30.2 29.0 29.4 29.5 28.0 30.8
Goods and services 20.9 18.2 18.0 16.6 18.6 12.1
Interest 2.9 2.9 3.1 3.4 3.6 4.5
Subsidies 2.4 2.8 2.6 3.3 3.2 2.9
Grants 0.2 0.2 0.2 0.3 0.3 19.7
Social benefits 19.2 18.7 18.0 16.0 15.5 5.7
Other expense 0.5 0.4 0.4 0.4 0.4 0.4
Special accounts 6.7 6.6 6.6 6.8 5.8 5.7
Capital expenditure 16.9 21.2 21.8 23.5 24.8 18.2
Budget 15.7 19.8 20.0 22.0 23.8 17.4
Special accounts 1.2 1.4 1.8 1.4 1.0 0.8
Source: Kyrgyz Republic MoF.
2.22 The planned reallocations were only partly realized. About seven percentage points of total expenditure shifted from current expenditure to capital expenditure between 2013 and 2017. Most of this shift, however, was reversed in 2018 because of the deficient performance of the capital budget in that year. Within the current budget, the share of total expenditures on compensation of employees was largely unchanged.28 Goods and services suffered a fall in its share of total expenditures of about three percentage points with about a two percentage point fall in spending on social benefits (considering the reclassifications in 2018 noted earlier). Interest payments commanded a larger share of the state budget by about 1.5 percentage points in 2018 compared with 2013.
2.23 What can we conclude about the progress made by the Kyrgyz Government in reallocating budgetary resources to make government expenditure more conducive to economic growth? In part this depends on whether 2018 was only an anomaly in terms of budget outturns. If it was, and the trends between 2013 and 2017 are sustainable over the medium term, then actual budget expenditures have become more conducive to economic growth—with the economic affairs function and capital expenditure commanding a larger share of the functional and economic classifications of the budget in 2017 than in 2013—which will help strengthen the supply side of the economy. Unfortunately, the gains for the economic affairs function were partly at the expense of spending on the health function, which does not bode well for human capital development over the long term.
2.24 The funding of repair and maintenance is a potential concern. The fact that the share of capital expenditure in total expenditure outturns rose by eight percentage points between 2013 and 2017 but that the share of the economic affairs function rose by only four percentage points in this period suggests that investment in new capital assets took priority over maintenance of existing capital assets. As a share of GDP,
28 Part of the general government wage bill is not captured in these numbers. This part pertains to the salaries of health service workers, which are funded by the Social Fund and are thus part of the Social Fund expenditures shown in Table 1. Social Fund wage bill expenditures amount to just less than 20 percent of the expenditure on compensation of employees in the state budget, shown in Table 6.
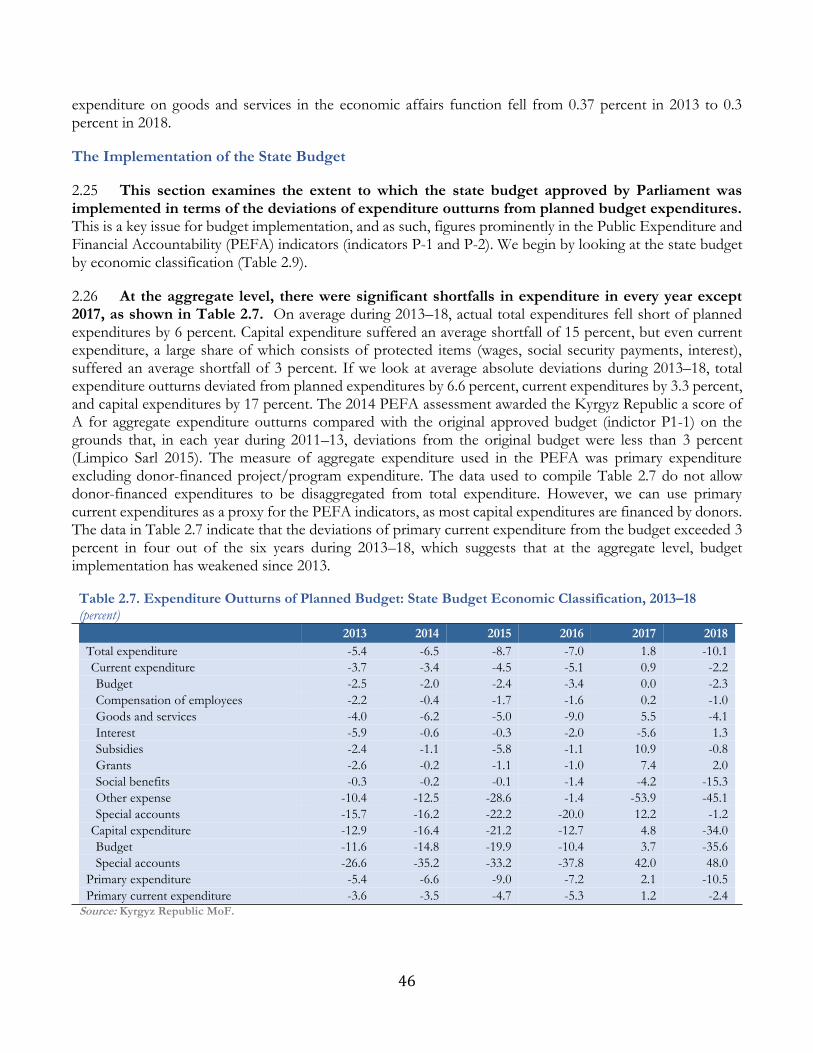
46
expenditure on goods and services in the economic affairs function fell from 0.37 percent in 2013 to 0.3 percent in 2018.
The Implementation of the State Budget
2.25 This section examines the extent to which the state budget approved by Parliament was implemented in terms of the deviations of expenditure outturns from planned budget expenditures. This is a key issue for budget implementation, and as such, figures prominently in the Public Expenditure and Financial Accountability (PEFA) indicators (indicators P-1 and P-2). We begin by looking at the state budget by economic classification (Table 2.9).
2.26 At the aggregate level, there were significant shortfalls in expenditure in every year except 2017, as shown in Table 2.7. On average during 2013–18, actual total expenditures fell short of planned expenditures by 6 percent. Capital expenditure suffered an average shortfall of 15 percent, but even current expenditure, a large share of which consists of protected items (wages, social security payments, interest), suffered an average shortfall of 3 percent. If we look at average absolute deviations during 2013–18, total expenditure outturns deviated from planned expenditures by 6.6 percent, current expenditures by 3.3 percent, and capital expenditures by 17 percent. The 2014 PEFA assessment awarded the Kyrgyz Republic a score of A for aggregate expenditure outturns compared with the original approved budget (indictor P1-1) on the grounds that, in each year during 2011–13, deviations from the original budget were less than 3 percent (Limpico Sarl 2015). The measure of aggregate expenditure used in the PEFA was primary expenditure excluding donor-financed project/program expenditure. The data used to compile Table 2.7 do not allow donor-financed expenditures to be disaggregated from total expenditure. However, we can use primary current expenditures as a proxy for the PEFA indicators, as most capital expenditures are financed by donors. The data in Table 2.7 indicate that the deviations of primary current expenditure from the budget exceeded 3 percent in four out of the six years during 2013–18, which suggests that at the aggregate level, budget implementation has weakened since 2013.
Table 2.7. Expenditure Outturns of Planned Budget: State Budget Economic Classification, 2013–18 (percent)
2013 2014 2015 2016 2017 2018
Total expenditure -5.4 -6.5 -8.7 -7.0 1.8 -10.1
Current expenditure -3.7 -3.4 -4.5 -5.1 0.9 -2.2
Budget -2.5 -2.0 -2.4 -3.4 0.0 -2.3
Compensation of employees -2.2 -0.4 -1.7 -1.6 0.2 -1.0
Goods and services -4.0 -6.2 -5.0 -9.0 5.5 -4.1
Interest -5.9 -0.6 -0.3 -2.0 -5.6 1.3
Subsidies -2.4 -1.1 -5.8 -1.1 10.9 -0.8
Grants -2.6 -0.2 -1.1 -1.0 7.4 2.0
Social benefits -0.3 -0.2 -0.1 -1.4 -4.2 -15.3
Other expense -10.4 -12.5 -28.6 -1.4 -53.9 -45.1
Special accounts -15.7 -16.2 -22.2 -20.0 12.2 -1.2
Capital expenditure -12.9 -16.4 -21.2 -12.7 4.8 -34.0
Budget -11.6 -14.8 -19.9 -10.4 3.7 -35.6
Special accounts -26.6 -35.2 -33.2 -37.8 42.0 48.0
Primary expenditure -5.4 -6.6 -9.0 -7.2 2.1 -10.5
Primary current expenditure -3.6 -3.5 -4.7 -5.3 1.2 -2.4
Source: Kyrgyz Republic MoF.
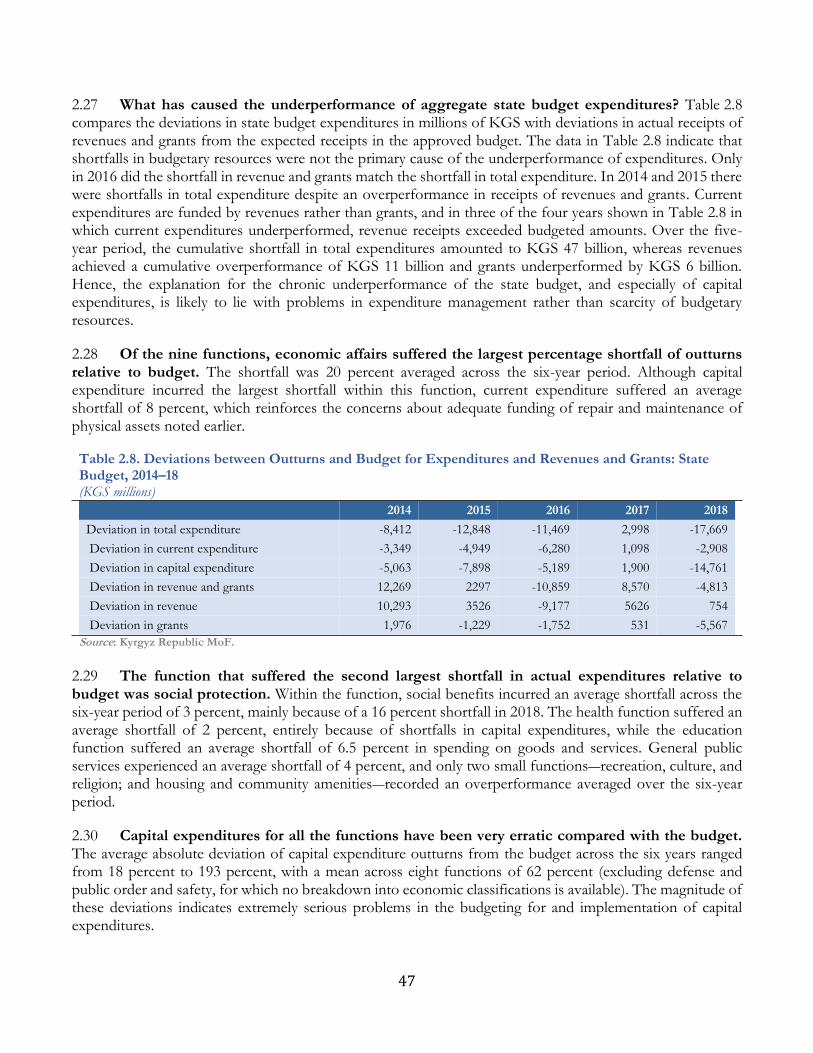
47
2.27 What has caused the underperformance of aggregate state budget expenditures? Table 2.8 compares the deviations in state budget expenditures in millions of KGS with deviations in actual receipts of revenues and grants from the expected receipts in the approved budget. The data in Table 2.8 indicate that shortfalls in budgetary resources were not the primary cause of the underperformance of expenditures. Only in 2016 did the shortfall in revenue and grants match the shortfall in total expenditure. In 2014 and 2015 there were shortfalls in total expenditure despite an overperformance in receipts of revenues and grants. Current expenditures are funded by revenues rather than grants, and in three of the four years shown in Table 2.8 in which current expenditures underperformed, revenue receipts exceeded budgeted amounts. Over the five-year period, the cumulative shortfall in total expenditures amounted to KGS 47 billion, whereas revenues achieved a cumulative overperformance of KGS 11 billion and grants underperformed by KGS 6 billion. Hence, the explanation for the chronic underperformance of the state budget, and especially of capital expenditures, is likely to lie with problems in expenditure management rather than scarcity of budgetary resources.
2.28 Of the nine functions, economic affairs suffered the largest percentage shortfall of outturns relative to budget. The shortfall was 20 percent averaged across the six-year period. Although capital expenditure incurred the largest shortfall within this function, current expenditure suffered an average shortfall of 8 percent, which reinforces the concerns about adequate funding of repair and maintenance of physical assets noted earlier.
Table 2.8. Deviations between Outturns and Budget for Expenditures and Revenues and Grants: State Budget, 2014–18 (KGS millions)
2014 2015 2016 2017 2018
Deviation in total expenditure -8,412 -12,848 -11,469 2,998 -17,669
Deviation in current expenditure -3,349 -4,949 -6,280 1,098 -2,908
Deviation in capital expenditure -5,063 -7,898 -5,189 1,900 -14,761
Deviation in revenue and grants 12,269 2297 -10,859 8,570 -4,813
Deviation in revenue 10,293 3526 -9,177 5626 754
Deviation in grants 1,976 -1,229 -1,752 531 -5,567
Source: Kyrgyz Republic MoF.
2.29 The function that suffered the second largest shortfall in actual expenditures relative to budget was social protection. Within the function, social benefits incurred an average shortfall across the six-year period of 3 percent, mainly because of a 16 percent shortfall in 2018. The health function suffered an average shortfall of 2 percent, entirely because of shortfalls in capital expenditures, while the education function suffered an average shortfall of 6.5 percent in spending on goods and services. General public services experienced an average shortfall of 4 percent, and only two small functions―recreation, culture, and religion; and housing and community amenities―recorded an overperformance averaged over the six-year period.
2.30 Capital expenditures for all the functions have been very erratic compared with the budget. The average absolute deviation of capital expenditure outturns from the budget across the six years ranged from 18 percent to 193 percent, with a mean across eight functions of 62 percent (excluding defense and public order and safety, for which no breakdown into economic classifications is available). The magnitude of these deviations indicates extremely serious problems in the budgeting for and implementation of capital expenditures.
48
Program-Based Budgeting and the Medium-Term Expenditure Framework
Introduction
2.31 PBB and the associated Medium-Term Expenditure Framework (MTEF) is a tool for improving the allocative efficiency of public spending. It enables scarce budget resources to be better focused on priority objectives. This tool also can provide incentives to improve the technical efficiency of spending by linking spending allocations with programs with clearly defined performance indicators and targets. A MTEF is an essential complement to PBB because most spending programs involve multi-year activities. Planning such programs requires a predictable medium-term resource envelope.
2.32 A meaningful PBB approach entails the following components:
• An institutional mechanism for deciding strategic national priorities for public spending and the translation of these into sectoral allocations in the budget;
• Based on the above and forecasts of the budget resource envelope, a realistic set of medium-term expenditure ceilings for each sector of the budget;
• Sector development plans drawn up by line ministries that identify sector spending priorities consistent with their medium-term expenditure ceilings as well as translate these priorities into a set of budget programs including performance indicators and targets;
• Line ministries must have the freedom to allocate the budget resources within their sector ceilings in an optimal manner to achieve their performance targets; and
• Line ministries must receive, over a medium-term period, budget allocations that are consistent with the expenditure ceilings they used to plan their programs; otherwise, the implementation of the programs will be derailed by insufficient funds, which will in turn erode incentives for budget planning.
2.33 In budget systems such as those of the Kyrgyz Republic (and in the FSU states in general), the introduction of PBB is ambitious. This is because it entails radical changes to the way government institutions operate, with line ministries taking much greater responsibility for decision making within their sectors. In the traditional Kyrgyz budgeting system, budgets are prepared based on detailed allocations to line items of expenditure, with historical allocations with various norms and regulations covering the size of structures, and the provision of services holding a major influence on the budget. Notwithstanding, there is no meaningful link between these items of expenditure and outputs or targets of public spending. The Kyrgyz budgeting system is complex, and rigid and it provides only limited opportunities for spending agencies to make decisions about the allocation of budget resources. Strategic budget planning, in which scarce resources are reallocated toward clearly defined priorities, is difficult in such a system. The difficulties are exacerbated by a shortage of the requisite analytical skills throughout the Kyrgyz Government some of it is related to high turnover rate and the brain drain. Several FSU states have attempted to introduce PBB and MTEF reforms over the past two decades, with only limited success.29
29 See, for example, Dale and others (2018) for an assessment of PBB in the health sector in Armenia and Grynchuk (2019) for
budgeting reforms in Ukraine.
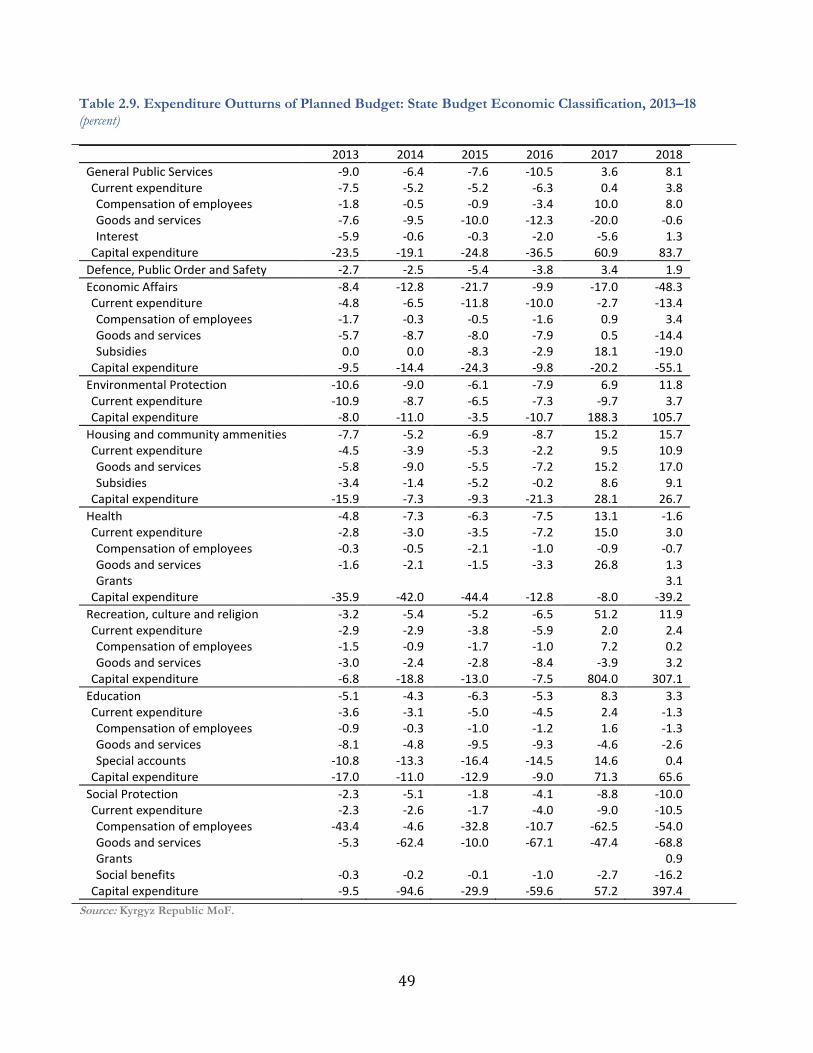
49
Table 2.9. Expenditure Outturns of Planned Budget: State Budget Economic Classification, 2013–18 (percent)
Source: Kyrgyz Republic MoF.
2013 2014 2015 2016 2017 2018
General Public Services -9.0 -6.4 -7.6 -10.5 3.6 8.1 Current expenditure -7.5 -5.2 -5.2 -6.3 0.4 3.8 Compensation of employees -1.8 -0.5 -0.9 -3.4 10.0 8.0 Goods and services -7.6 -9.5 -10.0 -12.3 -20.0 -0.6 Interest -5.9 -0.6 -0.3 -2.0 -5.6 1.3
Capital expenditure -23.5 -19.1 -24.8 -36.5 60.9 83.7
Defence, Public Order and Safety -2.7 -2.5 -5.4 -3.8 3.4 1.9
Economic Affairs -8.4 -12.8 -21.7 -9.9 -17.0 -48.3 Current expenditure -4.8 -6.5 -11.8 -10.0 -2.7 -13.4 Compensation of employees -1.7 -0.3 -0.5 -1.6 0.9 3.4 Goods and services -5.7 -8.7 -8.0 -7.9 0.5 -14.4 Subsidies 0.0 0.0 -8.3 -2.9 18.1 -19.0
Capital expenditure -9.5 -14.4 -24.3 -9.8 -20.2 -55.1
Environmental Protection -10.6 -9.0 -6.1 -7.9 6.9 11.8 Current expenditure -10.9 -8.7 -6.5 -7.3 -9.7 3.7 Capital expenditure -8.0 -11.0 -3.5 -10.7 188.3 105.7
Housing and community ammenities -7.7 -5.2 -6.9 -8.7 15.2 15.7 Current expenditure -4.5 -3.9 -5.3 -2.2 9.5 10.9 Goods and services -5.8 -9.0 -5.5 -7.2 15.2 17.0 Subsidies -3.4 -1.4 -5.2 -0.2 8.6 9.1
Capital expenditure -15.9 -7.3 -9.3 -21.3 28.1 26.7
Health -4.8 -7.3 -6.3 -7.5 13.1 -1.6 Current expenditure -2.8 -3.0 -3.5 -7.2 15.0 3.0 Compensation of employees -0.3 -0.5 -2.1 -1.0 -0.9 -0.7 Goods and services -1.6 -2.1 -1.5 -3.3 26.8 1.3 Grants 3.1
Capital expenditure -35.9 -42.0 -44.4 -12.8 -8.0 -39.2
Recreation, culture and religion -3.2 -5.4 -5.2 -6.5 51.2 11.9 Current expenditure -2.9 -2.9 -3.8 -5.9 2.0 2.4 Compensation of employees -1.5 -0.9 -1.7 -1.0 7.2 0.2 Goods and services -3.0 -2.4 -2.8 -8.4 -3.9 3.2
Capital expenditure -6.8 -18.8 -13.0 -7.5 804.0 307.1
Education -5.1 -4.3 -6.3 -5.3 8.3 3.3 Current expenditure -3.6 -3.1 -5.0 -4.5 2.4 -1.3 Compensation of employees -0.9 -0.3 -1.0 -1.2 1.6 -1.3 Goods and services -8.1 -4.8 -9.5 -9.3 -4.6 -2.6 Special accounts -10.8 -13.3 -16.4 -14.5 14.6 0.4
Capital expenditure -17.0 -11.0 -12.9 -9.0 71.3 65.6
Social Protection -2.3 -5.1 -1.8 -4.1 -8.8 -10.0 Current expenditure -2.3 -2.6 -1.7 -4.0 -9.0 -10.5 Compensation of employees -43.4 -4.6 -32.8 -10.7 -62.5 -54.0 Goods and services -5.3 -62.4 -10.0 -67.1 -47.4 -68.8 Grants 0.9 Social benefits -0.3 -0.2 -0.1 -1.0 -2.7 -16.2
Capital expenditure -9.5 -94.6 -29.9 -59.6 57.2 397.4
50
Efforts to Introduce PBB and the MTEF in the Kyrgyz Republic
2.34 The first efforts to introduce PBB and MTEFs in the Kyrgyz Republic began in the mid-2000s, but only limited meaningful progress in transforming the way in which budgets are prepared has been made since then. A Program Budgeting Rulebook was adopted in 2007; in 2012, methodological guidelines for Medium-Term Expenditure Strategies were introduced; and instructions for submitting budget performance reports were issued in 2013. Since 2013, spending agencies have had to prepare their budget submissions to the MoF in accordance with a program classification of expenditures, for which new budget codes were introduced. Since 2014, 75 line ministries and other spending agencies have submitted program budgets for the following year’s budget, and the MoF claimed in 2017 that 87 percent of the budget was classified according to program budget codes.30
2.35 However, budget submissions are also prepared according to the traditional line-item format, and it is the budget in this format that is approved by Parliament and that determines actual expenditure allocations. The budget prepared in accordance with the program codes is simply an annex to the main budget. In essence, the program budgeting classification of the budget is a parallel budget system that has little real impact on the planning or implementation of the budget, although program budget codes are required to make payments. In 2018 a requirement for spending agencies to report on budget implementation by program was issued and a module was installed in the Treasury IT (information technology) system, with support from the European Union, to facilitate this. The MoF is drafting instructions to the line ministries covering the preparation of performance reports and their submission to the Treasury.
2.36 The MoF prepares a three-year MTEF, with expenditure ceilings for each spending agency. The aggregate budget resource envelope in the MTEF is derived from economic forecasts prepared by the MoE. The sector expenditure ceilings are based on the two previous years’ budget allocations, with some adjustment for new spending initiatives in line with government priorities. The draft ceilings are sent to the spending agencies to prepare their budget submissions. The MTEF is included in the Main Directions of Fiscal Policy 2019–21, which is submitted to the State Coordination Council on Macroeconomic and Investment Policies and which may transfer resources within the budget, thus revising the ceilings. In principle, the State Coordination Council can determine intersectoral budget allocations in accord with national development priorities, such as those set out in the National Development Strategy.
2.37 Intrasectoral allocations have improved in some sectors. After it has been agreed by the State Coordination Council, the Main Direction of Fiscal Policy is approved by government resolution and provides the basis for the formulation of the next year’s budget. However, the Parliament only approves a single year’s budget and the ceilings for the outer years cannot be guaranteed for each spending agency. Sector expenditure plans are prepared by 20 line ministries, and the realization of these plans has improved, according to the MoF, with plans now better aligned with the expenditure ceilings in the MTEF.31 Moreover, in at least some sectors, the sector development plans appear to have had some influence on shifting intrasectoral allocations over the medium term; for example, the Ministry of Labour and Social Development has shifted a greater share of its budget toward targeted social assistance in line with its sector development plan.32
30 Kyrgyz Republic MoF (2017). 31 The 2015 PEFA concluded that “the sector investment plans included in the MTBF documents have not so far proved to be consistent with the expenditure ceilings subsequently issued by the MOF in the context of the preparation of the actual budgets” (Linpico Sarl 2015). 32 The provision of sector budget support has also facilitated the shift in the composition of expenditures within this sector.
51
2.38 In summary, some of the basic foundations of PBB have been put in place, including the preparation of a three-year MTEF and sector development plans and the introduction of program budget codes. The way in which PBB has been adopted over the past five years, however, has increased the administrative workload for spending agencies―without giving them much greater freedom or incentives to allocate scarce budget resources to improve spending efficiency. Traditional line-item budgeting, with its lack of flexibility and minimal links to broader policy objectives, has retained its dominance.
2.39 The Main Direction Fiscal Policy 2019–21 acknowledges that implementing PBB is difficult and identifies the following reasons for this: (1) the lack of automated public financial management; (2) the fact that the implementation of the budget is still carried out in the traditional format, that is, based on the cost of funding existing networks without monitoring the results and quality of public services; (3) insufficient capacity of individual specialists in ministries and departments associated partly with constant staff turnover, despite regular training events; (4) a weak monitoring system for the achievement of performance indicators in state bodies; and (5) the lack of a reliable database of performance indicators.33 Unfortunately, there is no discussion in the MDFP 2019–21 about how the difficulties might be overcome. Moreover, the difficulties are not all primarily structural or exogenous; they can be overcome with the appropriate policy reforms. For example, the MoF can shift away from preparing budgets based online-item expenditures. This is a policy choice, not an exogenous constraint, although it would undoubtedly take time to fully implement.
The PBB Pilot Program in 2019
2.40 The efforts to introduce PBB were revived in 2018, with two-line ministries—the Ministry of Health (MoH) and the Ministry of Transport and Roads (MoTR)—chosen as pilots for the 2019 budget year. Article 18 of the Budget Law for 2019 details the requirements of the line ministries. They must provide quarterly reports on the achievement of their performance indicators. A list of their budget programs and sub-programs along with the three-year expenditure allocations to them is included in an annex to the budget.
2.41 Under the pilot program, the two-line ministries will have more freedom to manage their wage bills. Under the existing system, the personnel structure of ministries and agencies is determined by standards and norms set out in a government resolution. The two pilot ministries will have scope to reduce (but not increase) staffing levels below those specified by the standards and norms, although any changes must be agreed to by the MoF. If the pilot line ministries realize any wage bill savings due to a reduction in staff or unfilled posts, they can use the savings to pay staff bonuses if performance targets identified in their program-based budgets are met. Under the existing system, savings made in the wage bill are retained by the Treasury. The pilot line ministries will also have the authority to shift their staff between budget programs.
2.42 In virtually all other respects, the budgeting system applied to the two pilot ministries will be unchanged from the existing system. Budget resources will still be allocated on the basis of on-line items of expenditure. The pilot ministries will have some, rather limited, incentives to improve their performance in order to achieve program targets (paying the staff bonuses from wage bill savings due to a reduction in staff or unfilled posts. They can use the savings to pay staff bonuses from the wage bill savings). However, the pilot ministries are not being given the tools to achieve any substantial improvement in performance; specifically, they will not be offered the opportunity to reallocate their budget resources in a more optimal manner.
33 MDFP, (pages 30–31)
52
2.43 The MoF appears reluctant to move beyond these limited reforms to the budget process. The MoF argues that there is need to improve the quality of performance indicators and that time required to evaluate if those targets are being met. The introduction of PBB is intended to enable targets to be met. Therefore, it is difficult to envisage how targets can be met without PBB being implemented in a meaningful manner—unless attaining the targets is independent of PBB implementation. The way the pilot program is being introduced, with such minimal changes to the existing budget process, means that significant improvements in budget outcomes are unlikely to be realized, which in turn risks eroding support for PBB reforms.
The Way Forward for PBB
2.44 Introducing PBB in a meaningful way in the Kyrgyz Republic faces major challenges. This means that genuine progress in improving the way resources are allocated and used almost inevitably will be slow. The challenges include the following:
2.45 First, the line ministries do not directly control all public expenditure within their own specific sector. They control expenditures within the republican budget, but not the expenditures of the local budgets or the externally financed investment projects.34 In the health sector, most expenditures take place outside of the state budget, through the Social Fund, hence the MoH directly controls only about a fifth of total spending in the health sector. This obviously weakens the link between budget planning and resource allocation by the line ministries and the realization of sector-wide targets.35
2.46 Second, a large share of the state budget is comprised of protected items including salaries and wages, social transfer payments, and utilities. In the health sector, almost all the budget controlled by the MoH consists of protected items. The large share of protected items circumscribes the room for line ministries to allocate resources, optimally to meet sector spending objectives. Consequently, effecting significant reallocations of budget resources will only be possible over the long term, by allocating the incremental increases in sector budgets to the priority programs.
2.47 Third, even if line ministries are afforded greater freedom to allocate budget resources within their own sectors, their officials may be reluctant to exercise this freedom. There is a weak culture of independent decision making in the public service. Furthermore, within line ministries, the technical capacities for planning budgets and linking resources with sector objectives and targets are weak. Consequently, there is a need for substantial training of officials to support the implementation of PBB.
2.48 Nevertheless, these challenges do not signal that no progress can be made in better aligning budget allocations with strategic spending priorities. For example, even where line ministries such as the MoH do not directly control all expenditures within their sector, they can coordinate with local authorities and with the Social Fund and Medical Insurance Fund to ensure that spending allocations in the health sector are consistent with national priorities. Over time, even protected items should not be an insurmountable constraint for budget reallocation if there is a revision of personnel structures within the sectors.
2.49 It is worth pursuing with the gradual introduction of PBB in the Kyrgyz Republic while remaining realistic about how quickly progress can be made. The introduction of PBB should be implemented cautiously, with reforms to the budget system introduced only after the implementing agencies
34 In 2019, the local budgets comprised 8 percent of the total state budget, and the externally financed projects in the Public Investment Program comprised 10 percent of the state budget. 35 For this reason, the MoH was probably not the best choice of ministry to participate in the pilot program.
53
have built up the human capacities to carry them out effectively. There is a danger that support for PBB among government ministers and the public will be eroded by a lack of tangible benefits in the short term. A genuine transformation of the way budgets are prepared and implemented will require a long-term horizon. Rather than extending the current pilot program to all line ministries, it would be more effective to focus on the two existing pilot ministries—and one additional ministry—in order to make PBB in these pilot ministries more meaningful. Line-item budgeting in the pilot ministries should be discontinued and the ministries should be given more scope for reallocating budget funds, along with the requirement to prepare reports on transparent program implementation.
2.50 The introduction of PBB in the pilot ministries will involve trial and error to discover ways to make PBB work effectively in the institutional environment of the Kyrgyz Republic, as well as training for ministry staff. Development partners should fund resident technical assistance (TA) from sector budget specialists to train ministry staff and develop systems for planning and implementing program budgets. Once tangible progress has been achieved in the pilot ministries and lessons have been learned about how to best implement PBB in the Kyrgyz Republic, PBB can be gradually extended to other ministries.
Public Investment Management Reforms
2.51 This section discusses the weaknesses in public investment management and the proposed reforms designed to rectify some of these weaknesses. Public investment spending in the Kyrgyz Republic is designed as a component of the state budget and comprises investment that is externally financed and domestically financed as well as stimulatory (or matching) grants.36 In the medium-term fiscal framework projections for 2019–21, just over 60 percent of total capital expenditure is externally financed and just over a third of the external project finance is on-lent to SOEs, local authorities, or private sector companies for capital investment.
2.52 The budgeting processes for public investment projects are fragmented, as they are governed by several different regimes, depending on the funding source. This fragmentation weakens the coherence between investment projects and national strategic objectives, between the current and investment components of the budget, and between national and regional investment objectives. There is no single rigorous framework for selecting and screening investment projects in use across all government agencies. Further, there is no methodology that can ensure that all planned projects follow basic minimum criteria, such as relevance to national and sectoral strategic plans, minimum social rates of return, and so on.
2.53 Externally financed investment projects are included in the PIP. The current practice is for line ministries, in consultation with donors, to draw up project proposals and supporting documentation for externally financed projects and submit them to the MoF and MoE for analysis. Responsibility for the PIP is currently under MoF, which are evaluated based on various aspects of projects. The MoE submits project proposals to the Macroeconomic and Investment Coordination Council. The council is responsible for approving all appraised PIP projects before they can be included in the budget.
2.54 The links between public investment priorities put forth in national strategic planning documents, such as the five-year development program, and budget planning for the PIP are weak. This is in part because the strategic planning documents themselves do not adequately prioritize and cost investment projects, which reduces their value to the budget process; it is also because of the characteristics
36 These are grants awarded to local governments to partly finance small capital projects, alongside locally mobilized resources: they are a relatively small share of the state budget.
54
of the budget planning process for PIP projects. Rather than a coherent set of high-priority projects selected to be consistent with expenditure ceilings and budget resource constraints, the PIP is, in effect, a collection of donor-driven projects that do not automatically accord with national priorities. Furthermore, there is no clear link between (1) budgeting for the investment costs of PIP projects, which is funded by donor project grants and loans; and (2) budgeting for the subsequent operating and maintenance costs of the assets created by the projects, which has to be funded from domestic budgetary resources (that is, revenues and non-earmarked grants and loans). Unsurprisingly, the latter is often inadequately funded in the budget, given that demands for expenditure far outstrip budgetary resources, which reduces the long-term efficiency of these projects and leads to deterioration in the quality of capital assets.37
2.55 In the Kyrgyz Budget Code, externally financed and domestically financed investment projects are subject to different pieces of legislation and they are subject to different procedures for selection. For domestically financed projects, line ministries and other agencies send project proposals to the MoF. Criteria for project selection are contained in a government resolution. The MoF creates a list of projects that is consistent with the expenditure ceilings of spending agencies and submits this to the government office for approval by the Prime Minister before it is included in the budget.38 However, budgeting for the domestically financed investment projects is conducted on a single-year basis only, even for projects scheduled to take more than one year to complete. Hence adequate budget funding cannot be guaranteed for the entire time needed to implement the projects.
2.56 There is also fragmentation between national and regional planning for investment projects, both domestically and externally financed. This is partly due to weak cooperation and exchange of information between local governments and the territorial branches of line ministries at the rayon (district) level. This leads to inconsistencies between sectoral and regional investment plans. In some cases, PIP projects duplicate existing projects already being implemented in the same region.
2.57 There are also serious deficiencies in the monitoring and evaluation of public investment projects. This applies to both the investment phase of the project and the post investment operational phase. Line ministries and agencies do not have their own systems for monitoring all their projects or the capacity for doing this. Consequently, most project monitoring and evaluation activities are carried out and funded as part of the specific PIP project to which they apply.
2.58 The MoF is making proposals for reforms to strengthen the allocation and management of externally financed capital investment. According to these proposals, the MoE prepares a list of priority investment projects, as well as the concepts and outlines of individual projects consistent with the National Development Strategy. The MoE submit the list of priority projects to the Macroeconomic and Investment Coordination Council for approval. Hence only proposals for projects included on the list will be considered by the council. Line ministries and development partners, therefore, must restrict their proposed projects to
37 The findings of the 2015 PEFA with respect to the investment budget planning remained broadly valid in 2019. The PEFA stated: “Investment planning remains divided, with different sections of MOF responsible depending on whether investments are financed from domestic or external sources. The choice of projects for the Public Investment Program (PIP) from the list included in the National Development Strategy 2013–17 depends on the interests of donors in financing investments sectors. Neither externally nor domestically financed investment is consistently integrated into sector strategies across the whole government which are consistent with prospectively available resources as set out in each year’s budget” (Linpico Sarl 2015). The 2015 PEFA awarded a score of D for linkages between investment budgets and forward expenditure estimates. 38 Unlike with the externally financed projects, the MoF plays no role as gatekeeper for the domestically financed projects.
55
those that have been included on the approved list. Line ministries can seek financing from development partners for projects in their sectors that are on the approved list.
2.59 The MoE developing a public investment strategy to help identify priority sectors and a methodology for determining whether projects should be included on the list of priority projects. Line ministries will be able to submit proposals to the MoE for specific projects to be included on the list. In effect, this will mean a shift from a bottom-up approach to project selection, initiated by the line ministries, to a more top-down approach, in which central ministries (the MoF and MoE) have greater influence. These changes are intended to ensure that investment expenditures are better aligned with the development priorities of the Government.39
2.60 The MoF has drafted a set of guidelines for project proposals and project management, which include project appraisal, monitoring, and post-project evaluation. Under the guidelines, the implementing agencies are responsible for preparation project feasibility studies, including a cost benefit analysis, and estimates of the recurrent cost implications. This information is submitted to the MoF and MoE for evaluation. Implementing agencies are also responsible for project monitoring and post-project evaluation and must submit project reports to the Macroeconomic and Investment Coordination Council. The agencies currently lack adequate technical capacity to carry out all the functions stipulated in the guidelines but training for their staff is being organized with the assistance of the MoF and the World Bank.
2.61 In parallel with these reforms, the MoE, with the assistance of the World Bank, prepared a set of guidance notes for modernizing the public investment management framework. These notes, which apply to the PIP projects but not the domestically financed projects, cover project pre-screening, project appraisal and feasibility studies, project prioritization and selection, portfolio monitoring, and project monitoring and evaluation.
2.62 The proposed PIM reforms are potentially especially important in ensuring a better quality of investment projects, and they are also essential in streamlining procedures and reducing budget fragmentation. It was necessary to harmonize the proposed guidelines of the MoF for the PIP projects. It would be desirable to apply the same guidelines to the domestically financed projects, with exemptions for small projects for which lengthy and costly appraisal and monitoring procedures would not be worthwhile. Furthermore, implementing the proposals effectively will require strengthening capacities for PIM in both central ministries and spending agencies.
2.63 The PIM reforms need to be harmonized with efforts to introduce PBB. If program-based budgeting is to be meaningful, capital, and current expenditures together must be determined by each sector within its overall expenditure ceiling. The sectors need to make trade-offs between current and capital expenditures depending on their priorities. Hence the process for selecting projects must take place primarily within the sectors, and the gatekeeper role of the central ministries should be restricted to ensuring that basic criteria (for example, for project appraisal and consistency with external financing policy) are met. The MoF proposals to give the central ministries more control over project selection, thus, are potentially problematic for the implementation of PBB.
39 MDFP 2019–21 refers to “the annual development of a list of priority investment projects of the Republican budget for three years, as part of a medium-term plan of socio-economic development, which will serve as the basis for the development of the national budget, in terms of determining the list and volume of budget financing of development programs” (page 51).
56
Recommendations
2.64 The Kyrgyz Government should continue with its efforts to reallocate budgetary resources toward public investment in order to make the budget more supportive of economic growth. However, scaling up public investment should be done gradually and in line with strengthening PIM; otherwise, planned investments will not be realized or will be implemented inefficiently. Greater priority should be given to properly funding the maintenance and repair of existing capital assets. In addition, increasing funding for investment in physical capital should not be at the expense of funding for health. Fiscal space must be created for additional public investment in physical and human capital by realizing budgetary savings from the wage bill, from public administration expenditures and from subsidies not targeted at poverty alleviation.
2.65 The implementation of PBB is worth pursuing even though it is a long-term project; it will take years to transform the budget system and deliver tangible results. Hence, the government should proceed cautiously to avoid overstretching capacities in the implementing agencies. It is necessary to carefully match the introduction of reforms with the strengthening of capacities within its agencies to implement PBB. However, progress will not be possible until there is a genuine change in the way budgets are formulated and implemented. In the two pilot ministries, line-item budgeting should be discontinued, and program budgets should be used instead. The pilot line ministries should be given much more freedom to reallocate their resources to implement their programs within their overall expenditure ceilings.
2.66 Adjust the PBB strategy going forward to implement more substantial and meaningful reforms in the two pilot ministries and learn from experience useful lessons about how to best implement PBB before extending the pilot to more ministries. The pilot ministries should seek long-term TA from development partners to help transform the ministries’ budget systems into PBB. PBB places the onus on the sectors, and especially the lead ministries in the sectors, to effectively plan and implement expenditures. As such, the feasibility of PBB requires strong technical capacities in the line ministries.
2.67 If PBB is to be meaningful, capital, and current expenditures must be determined together by each sector within its overall sector expenditure ceiling. The sectors need to make trade-offs between current and capital expenditures depending on their priorities. Hence the process for selecting projects must take place primarily within the sectors, and the gatekeeper role of the central ministries should be restricted to ensuring that basic criteria (for example, for project appraisal and consistency with external financing policy) are met.
2.68 The proposed PIM reforms are potentially important in ensuring better quality investment projects through improved project selection and the monitoring and evaluation of projects. However, the PIM reforms should be broadened to include strengthening capacities within ministries and agencies for implementing on schedule those projects that have been included in the budget and are funded. It will be necessary to harmonize the proposed guidelines of the MoF and MoE for the PIP projects. It would be desirable to apply the same guidelines to the domestically financed projects, with exemptions for small projects for which lengthy and costly appraisal and monitoring procedures would not be worthwhile. Furthermore, as with PBB, there is a need for major strengthening of PIM capacities within the government, for which TA from development partners could make an important contribution.
57
Tax Policy and Tax Administration
Context
The government has made commendable efforts to simplify the overall structure of the tax regimes and major taxes. Tax revenue is the main source of finance for the country’s development and investment needs. It has accounted for three quarters of total revenue (social contributions included), or 61 percent (excluding social contributions), between 2014 and 2018. Enhanced revenue mobilization is key for anchoring spending decisions, creating fiscal space and safeguarding credible budget execution. Improved tax revenue performance has supported the Kyrgyz Republic’s fiscal consolidation progress and complementing efforts to rationalize expenditure. While the country’s tax effort has been robust and rising over the past decade, there is still room for improving efficiency and equity of the tax system. The current setting of value-added tax (VAT) refund includes an extensive list of exemptions that may imply a certain degree of cascading. While the Kyrgyz Republic’s statutory income tax rates are low, social contributions make the overall tax burden on labor high. To strengthen the country’s tax collection effort, further reforms should focus on the dual objectives of improving the efficiency of the tax system while maintaining the robust level of collection. Over the medium term, maintaining the level of tax intakes while rationalizing public expenditures is critical for creating fiscal space for investment and development needs in line with the fiscal rule. Efficiency enhancement in taxation is the impetus for further growth and poverty reduction. The Kyrgyz Republic has made commendable progress in simplifying the overall structure of tax regimes and major taxes and in improving tax administration over the past decade, but there is still room for improvement. The reforms focus on the dual objectives of improving the tax system’s efficiency while maintaining a robust level of collection. This chapter assesses the performance and effectiveness of major national tax policies and tax administration in the Kyrgyz Republic while drawing implications for reforms.
The chapter makes the following recommendations:
Tax policy reforms (time frame: two years with periodic review)
• Review and restructure overall tax policies. Refine the segmentation of taxpayers (small/medium and large)
by setting the criteria for establishing the new micro-taxpayer group. This process will take place simultaneously by
simplifying the structure of special regimes.
• Reform income tax regimes. Key reform actions include: (1) adding core tax-avoidance rules to the Tax Code; and (2) adjusting the personal income tax (PIT) legislation (with the focus on raising the exempt threshold in PIT and increasing the highest marginal rate for the top income group).
• Reform VAT and sales tax regimes. The VAT regime aims to: (1) make the VAT refund widely available while ensuring an effective VAT refund audit and severe punitive penalties for frauds; (2) refine the zero rating and exemptions list; (3) introduce a reverse charge mechanism; and (4) eliminate the sales tax.
• Enhance the quality of excise tax policy. Key reform actions include: (1) increasing excises for alcoholic products, tobacco, and fuel, given the current low excise rates; and (2) expanding the base (the prime target would be introducing the excise on motor vehicles).
• Review and rationalize the list of tax expenditures (time frame: three years).
Tax administration reforms (time frame: four years with periodic review)
• Extend the scope and effectiveness of e-filing. Significant benefits of the investment in e-filing can be attained only with full or near-100 percent compliance.
• Improve business process and further institutional development. This set of reform activities will focus on:
58
o Business process reengineering. In addition to the need to extend the scope of e-filing, the State Tax Service would consider strengthening the other key functions of tax administration, specifically, taxpayer registration, taxpayer service, auditing, arrears management, and tax appeal.
o In-house capacity enhancement. The objectives that need the most attention within the next two- to three-year time frame are: (1) to enhance analytical capacity to support risk-based auditing; (2) to forecast revenues and estimate revenue forgone due to tax expenditures; and (3) to measure tax gaps.
Introduction
3.1 Efficiency enhancement in taxation becomes the impetus for further growth and poverty reduction in the Kyrgyz Republic. The country’s tax effort has been robust and rising over the past decade, following the introduction of the 2009 Tax Code, which simplified the tax regimes and enhanced tax administration. With the tax-to-GDP ratio hovering at 21 percent of GDP, the country stands out in collection of taxes compared with its regional and global peers. However, improving the efficiency and equity of the tax system remains challenging. Better tax policy design could reduce unwanted issues in terms of efficiency (through reducing tax expenditures, for example), equity (primarily with a better structured PIT regime), and environment as well as public health (with improved excise tax policy). Improvements in tax administration (through measures to enhance the quality of VAT refund and the key administration functions) would deepen the culture of voluntary compliance and reduce the collection costs. Further reforms should focus on the dual objectives of (1) improving the efficiency while (2) maintaining the robust level of collection. The first would help restructure the tax mix, enhance equity, and lower compliance costs. The second would be critical for fiscal consolidation and for adequate fiscal space for financing development needs—while resisting the temptation to raise revenue with no regard for its negative impact on growth.
3.2 Tax revenue is the main source of finance for the Kyrgyz Republic’s development and investment needs to boost growth and reduce poverty. It accounted for three quarters of total revenue (including social contributions), or 61 percent of total revenue (excluding social contribution), between 2014 and 2018. Improved tax revenue performance has supported the country’s progress in fiscal consolidation in recent years, complementing efforts to rationalize expenditure. During 2014–18, fiscal deficit levels averaged above the proposed fiscal rule threshold, at 4 percent of GDP. Over the medium term, maintaining the level of tax intakes while rationalizing public expenditures will be critical to create fiscal space for investment and development needs should the proposed fiscal rule40 be adopted.
3.3 This chapter aims to assess the major tax policies and tax administration and to draw implications for reforms. The study investigates the issues in tax policy design and administration from the perspective of revenue performance and efficiency. The analysis of tax policies focuses on the key national taxes: the direct (corporate and personal income) and indirect taxes (VAT, sales tax, and excise). While the chapter presents a snapshot of the fiscal regimes in the mining sector, it does not present further detailed analysis, as it has been covered comprehensively in recent literature.41
40 The proposed fiscal rule is currently being discussed in Parliament. The fiscal rule seeks to limit the fiscal deficit of the general government to 3 percent of GDP and public debt to 70 percent of GDP. 41 David Manley and Nazgul Kulova (2018). “Should the Government of the Kyrgyz Republic Impose a Tax on Gold Ores and Concentrates?” Natural Resource Governance Institute.
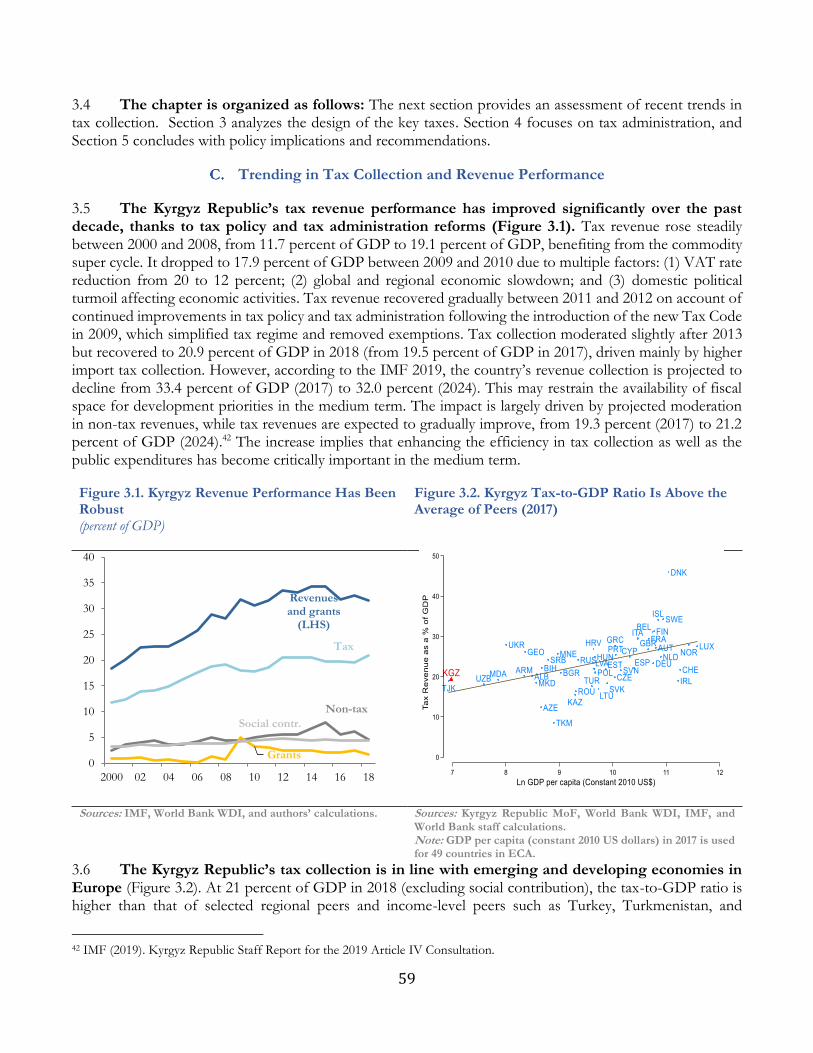
59
3.4 The chapter is organized as follows: The next section provides an assessment of recent trends in tax collection. Section 3 analyzes the design of the key taxes. Section 4 focuses on tax administration, and Section 5 concludes with policy implications and recommendations.
Trending in Tax Collection and Revenue Performance
3.5 The Kyrgyz Republic’s tax revenue performance has improved significantly over the past decade, thanks to tax policy and tax administration reforms (Figure 3.1). Tax revenue rose steadily between 2000 and 2008, from 11.7 percent of GDP to 19.1 percent of GDP, benefiting from the commodity super cycle. It dropped to 17.9 percent of GDP between 2009 and 2010 due to multiple factors: (1) VAT rate reduction from 20 to 12 percent; (2) global and regional economic slowdown; and (3) domestic political turmoil affecting economic activities. Tax revenue recovered gradually between 2011 and 2012 on account of continued improvements in tax policy and tax administration following the introduction of the new Tax Code in 2009, which simplified tax regime and removed exemptions. Tax collection moderated slightly after 2013 but recovered to 20.9 percent of GDP in 2018 (from 19.5 percent of GDP in 2017), driven mainly by higher import tax collection. However, according to the IMF 2019, the country’s revenue collection is projected to decline from 33.4 percent of GDP (2017) to 32.0 percent (2024). This may restrain the availability of fiscal space for development priorities in the medium term. The impact is largely driven by projected moderation in non-tax revenues, while tax revenues are expected to gradually improve, from 19.3 percent (2017) to 21.2 percent of GDP (2024).42 The increase implies that enhancing the efficiency in tax collection as well as the public expenditures has become critically important in the medium term.
Figure 3.1. Kyrgyz Revenue Performance Has Been Robust (percent of GDP)
Figure 3.2. Kyrgyz Tax-to-GDP Ratio Is Above the Average of Peers (2017)
Sources: IMF, World Bank WDI, and authors’ calculations. Sources: Kyrgyz Republic MoF, World Bank WDI, IMF, and World Bank staff calculations. Note: GDP per capita (constant 2010 US dollars) in 2017 is used for 49 countries in ECA.
3.6 The Kyrgyz Republic’s tax collection is in line with emerging and developing economies in Europe (Figure 3.2). At 21 percent of GDP in 2018 (excluding social contribution), the tax-to-GDP ratio is higher than that of selected regional peers and income-level peers such as Turkey, Turkmenistan, and
42 IMF (2019). Kyrgyz Republic Staff Report for the 2019 Article IV Consultation.
Tax
Non-tax
Grants
Social contr.
Revenues and grants
(LHS)
0
5
10
15
20
25
30
35
40
2000 02 04 06 08 10 12 14 16 18
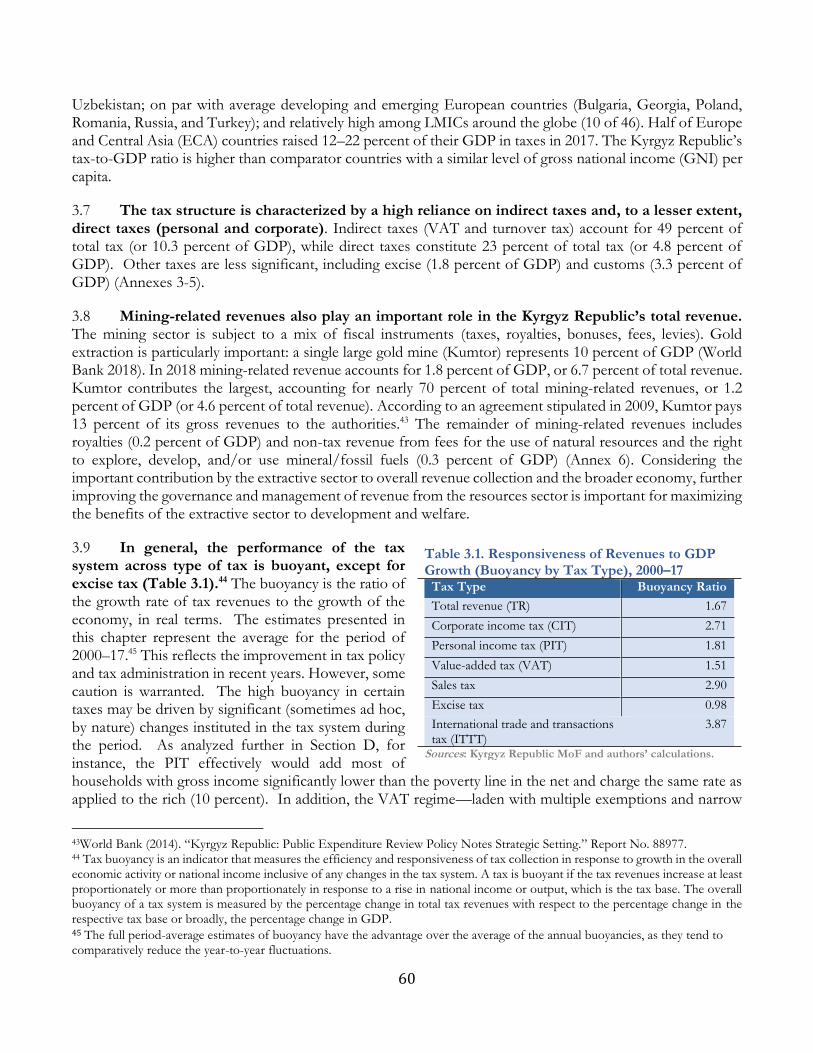
60
Uzbekistan; on par with average developing and emerging European countries (Bulgaria, Georgia, Poland, Romania, Russia, and Turkey); and relatively high among LMICs around the globe (10 of 46). Half of Europe and Central Asia (ECA) countries raised 12–22 percent of their GDP in taxes in 2017. The Kyrgyz Republic’s tax-to-GDP ratio is higher than comparator countries with a similar level of gross national income (GNI) per capita.
3.7 The tax structure is characterized by a high reliance on indirect taxes and, to a lesser extent, direct taxes (personal and corporate). Indirect taxes (VAT and turnover tax) account for 49 percent of total tax (or 10.3 percent of GDP), while direct taxes constitute 23 percent of total tax (or 4.8 percent of GDP). Other taxes are less significant, including excise (1.8 percent of GDP) and customs (3.3 percent of GDP) (Annexes 3-5).
3.8 Mining-related revenues also play an important role in the Kyrgyz Republic’s total revenue. The mining sector is subject to a mix of fiscal instruments (taxes, royalties, bonuses, fees, levies). Gold extraction is particularly important: a single large gold mine (Kumtor) represents 10 percent of GDP (World Bank 2018). In 2018 mining-related revenue accounts for 1.8 percent of GDP, or 6.7 percent of total revenue. Kumtor contributes the largest, accounting for nearly 70 percent of total mining-related revenues, or 1.2 percent of GDP (or 4.6 percent of total revenue). According to an agreement stipulated in 2009, Kumtor pays 13 percent of its gross revenues to the authorities.43 The remainder of mining-related revenues includes royalties (0.2 percent of GDP) and non-tax revenue from fees for the use of natural resources and the right to explore, develop, and/or use mineral/fossil fuels (0.3 percent of GDP) (Annex 6). Considering the important contribution by the extractive sector to overall revenue collection and the broader economy, further improving the governance and management of revenue from the resources sector is important for maximizing the benefits of the extractive sector to development and welfare.
3.9 In general, the performance of the tax system across type of tax is buoyant, except for excise tax (Table 3.1).44 The buoyancy is the ratio of the growth rate of tax revenues to the growth of the economy, in real terms. The estimates presented in this chapter represent the average for the period of 2000–17.45 This reflects the improvement in tax policy and tax administration in recent years. However, some caution is warranted. The high buoyancy in certain taxes may be driven by significant (sometimes ad hoc, by nature) changes instituted in the tax system during the period. As analyzed further in Section D, for instance, the PIT effectively would add most of households with gross income significantly lower than the poverty line in the net and charge the same rate as applied to the rich (10 percent). In addition, the VAT regime—laden with multiple exemptions and narrow
43World Bank (2014). “Kyrgyz Republic: Public Expenditure Review Policy Notes Strategic Setting.” Report No. 88977. 44 Tax buoyancy is an indicator that measures the efficiency and responsiveness of tax collection in response to growth in the overall economic activity or national income inclusive of any changes in the tax system. A tax is buoyant if the tax revenues increase at least proportionately or more than proportionately in response to a rise in national income or output, which is the tax base. The overall buoyancy of a tax system is measured by the percentage change in total tax revenues with respect to the percentage change in the respective tax base or broadly, the percentage change in GDP. 45 The full period-average estimates of buoyancy have the advantage over the average of the annual buoyancies, as they tend to comparatively reduce the year-to-year fluctuations.
Table 3.1. Responsiveness of Revenues to GDP Growth (Buoyancy by Tax Type), 2000–17
Tax Type Buoyancy Ratio
Total revenue (TR) 1.67
Corporate income tax (CIT) 2.71
Personal income tax (PIT) 1.81
Value-added tax (VAT) 1.51
Sales tax 2.90
Excise tax 0.98
International trade and transactions tax (ITTT)
3.87
Sources: Kyrgyz Republic MoF and authors’ calculations.
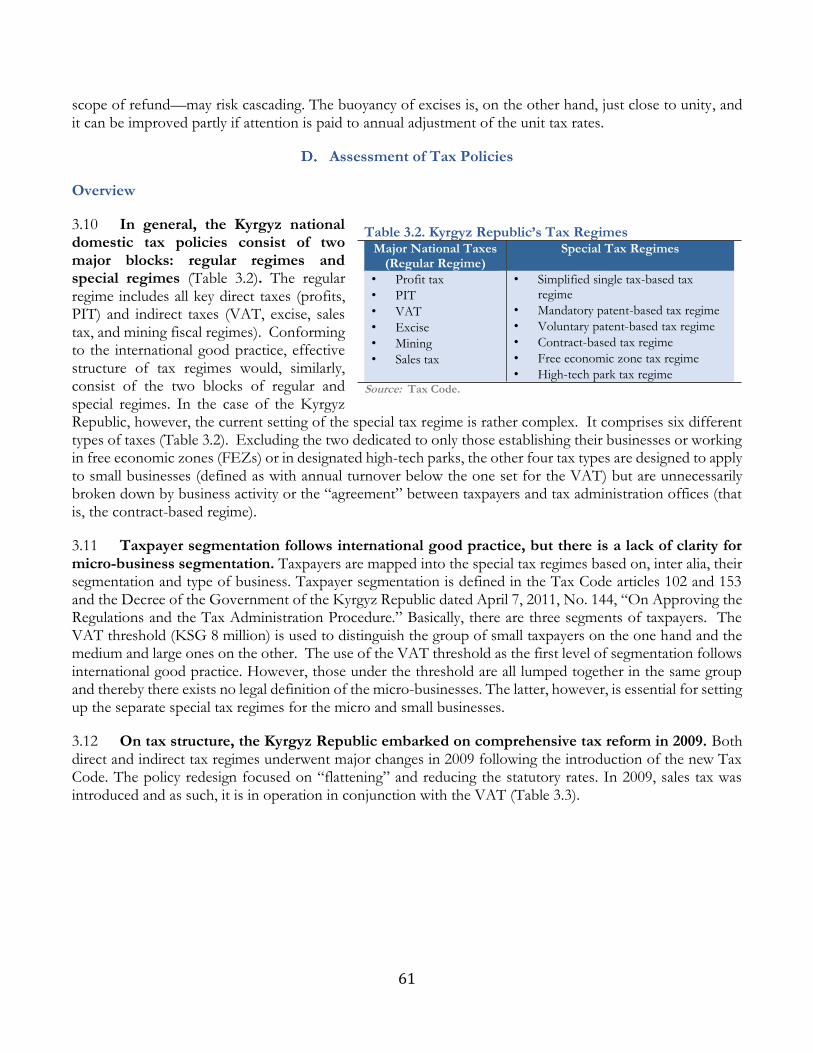
61
scope of refund—may risk cascading. The buoyancy of excises is, on the other hand, just close to unity, and it can be improved partly if attention is paid to annual adjustment of the unit tax rates.
Assessment of Tax Policies
Overview
3.10 In general, the Kyrgyz national domestic tax policies consist of two major blocks: regular regimes and special regimes (Table 3.2). The regular regime includes all key direct taxes (profits, PIT) and indirect taxes (VAT, excise, sales tax, and mining fiscal regimes). Conforming to the international good practice, effective structure of tax regimes would, similarly, consist of the two blocks of regular and special regimes. In the case of the Kyrgyz Republic, however, the current setting of the special tax regime is rather complex. It comprises six different types of taxes (Table 3.2). Excluding the two dedicated to only those establishing their businesses or working in free economic zones (FEZs) or in designated high-tech parks, the other four tax types are designed to apply to small businesses (defined as with annual turnover below the one set for the VAT) but are unnecessarily broken down by business activity or the “agreement” between taxpayers and tax administration offices (that is, the contract-based regime).
3.11 Taxpayer segmentation follows international good practice, but there is a lack of clarity for micro-business segmentation. Taxpayers are mapped into the special tax regimes based on, inter alia, their segmentation and type of business. Taxpayer segmentation is defined in the Tax Code articles 102 and 153 and the Decree of the Government of the Kyrgyz Republic dated April 7, 2011, No. 144, “On Approving the Regulations and the Tax Administration Procedure.” Basically, there are three segments of taxpayers. The VAT threshold (KSG 8 million) is used to distinguish the group of small taxpayers on the one hand and the medium and large ones on the other. The use of the VAT threshold as the first level of segmentation follows international good practice. However, those under the threshold are all lumped together in the same group and thereby there exists no legal definition of the micro-businesses. The latter, however, is essential for setting up the separate special tax regimes for the micro and small businesses.
3.12 On tax structure, the Kyrgyz Republic embarked on comprehensive tax reform in 2009. Both direct and indirect tax regimes underwent major changes in 2009 following the introduction of the new Tax Code. The policy redesign focused on “flattening” and reducing the statutory rates. In 2009, sales tax was introduced and as such, it is in operation in conjunction with the VAT (Table 3.3).
Table 3.2. Kyrgyz Republic’s Tax Regimes Major National Taxes
(Regular Regime) Special Tax Regimes
• Profit tax
• PIT
• VAT
• Excise
• Mining
• Sales tax
• Simplified single tax-based tax regime
• Mandatory patent-based tax regime
• Voluntary patent-based tax regime
• Contract-based tax regime
• Free economic zone tax regime
• High-tech park tax regime
Source: Tax Code.
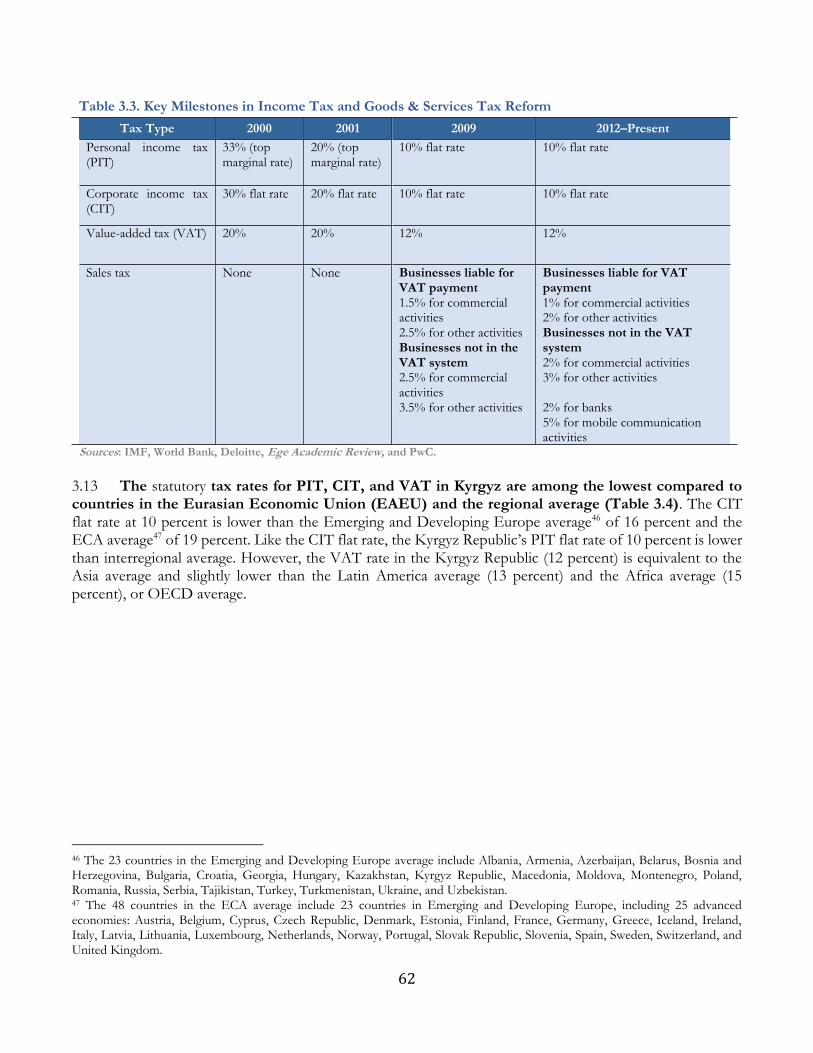
62
Table 3.3. Key Milestones in Income Tax and Goods & Services Tax Reform
Tax Type 2000 2001 2009 2012–Present
Personal income tax (PIT)
33% (top marginal rate)
20% (top marginal rate)
10% flat rate 10% flat rate
Corporate income tax (CIT)
30% flat rate 20% flat rate 10% flat rate 10% flat rate
Value-added tax (VAT) 20% 20% 12% 12%
Sales tax None None Businesses liable for VAT payment 1.5% for commercial activities 2.5% for other activities Businesses not in the VAT system 2.5% for commercial activities 3.5% for other activities
Businesses liable for VAT payment 1% for commercial activities 2% for other activities Businesses not in the VAT system 2% for commercial activities 3% for other activities 2% for banks 5% for mobile communication activities
Sources: IMF, World Bank, Deloitte, Ege Academic Review, and PwC.
3.13 The statutory tax rates for PIT, CIT, and VAT in Kyrgyz are among the lowest compared to countries in the Eurasian Economic Union (EAEU) and the regional average (Table 3.4). The CIT flat rate at 10 percent is lower than the Emerging and Developing Europe average46 of 16 percent and the ECA average47 of 19 percent. Like the CIT flat rate, the Kyrgyz Republic’s PIT flat rate of 10 percent is lower than interregional average. However, the VAT rate in the Kyrgyz Republic (12 percent) is equivalent to the Asia average and slightly lower than the Latin America average (13 percent) and the Africa average (15 percent), or OECD average.
46 The 23 countries in the Emerging and Developing Europe average include Albania, Armenia, Azerbaijan, Belarus, Bosnia and Herzegovina, Bulgaria, Croatia, Georgia, Hungary, Kazakhstan, Kyrgyz Republic, Macedonia, Moldova, Montenegro, Poland, Romania, Russia, Serbia, Tajikistan, Turkey, Turkmenistan, Ukraine, and Uzbekistan. 47 The 48 countries in the ECA average include 23 countries in Emerging and Developing Europe, including 25 advanced economies: Austria, Belgium, Cyprus, Czech Republic, Denmark, Estonia, Finland, France, Germany, Greece, Iceland, Ireland, Italy, Latvia, Lithuania, Luxembourg, Netherlands, Norway, Portugal, Slovak Republic, Slovenia, Spain, Sweden, Switzerland, and United Kingdom.
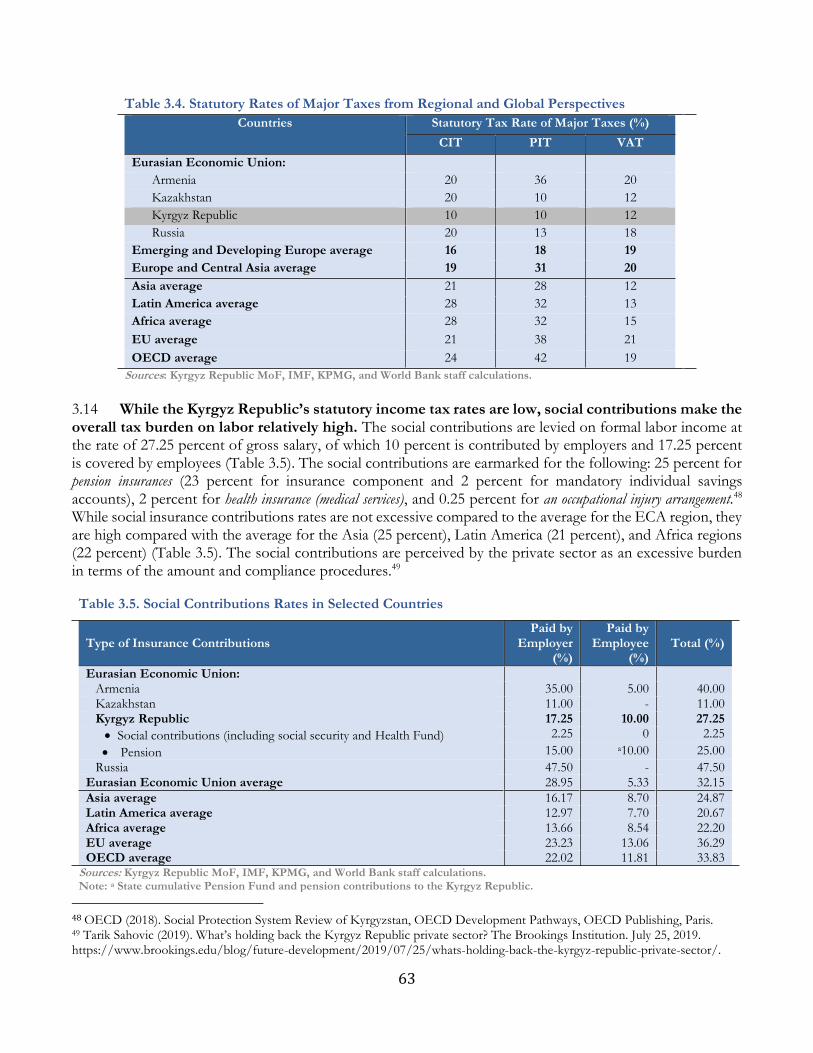
63
Table 3.4. Statutory Rates of Major Taxes from Regional and Global Perspectives
Countries Statutory Tax Rate of Major Taxes (%)
CIT PIT VAT
Eurasian Economic Union:
Armenia 20 36 20
Kazakhstan 20 10 12
Kyrgyz Republic 10 10 12
Russia 20 13 18
Emerging and Developing Europe average 16 18 19
Europe and Central Asia average 19 31 20
Asia average 21 28 12
Latin America average 28 32 13
Africa average 28 32 15
EU average 21 38 21
OECD average 24 42 19
Sources: Kyrgyz Republic MoF, IMF, KPMG, and World Bank staff calculations.
3.14 While the Kyrgyz Republic’s statutory income tax rates are low, social contributions make the overall tax burden on labor relatively high. The social contributions are levied on formal labor income at the rate of 27.25 percent of gross salary, of which 10 percent is contributed by employers and 17.25 percent is covered by employees (Table 3.5). The social contributions are earmarked for the following: 25 percent for pension insurances (23 percent for insurance component and 2 percent for mandatory individual savings accounts), 2 percent for health insurance (medical services), and 0.25 percent for an occupational injury arrangement.48 While social insurance contributions rates are not excessive compared to the average for the ECA region, they are high compared with the average for the Asia (25 percent), Latin America (21 percent), and Africa regions (22 percent) (Table 3.5). The social contributions are perceived by the private sector as an excessive burden in terms of the amount and compliance procedures.49
Table 3.5. Social Contributions Rates in Selected Countries
Type of Insurance Contributions Paid by
Employer (%)
Paid by Employee
(%) Total (%)
Eurasian Economic Union: Armenia 35.00 5.00 40.00 Kazakhstan 11.00 - 11.00 Kyrgyz Republic 17.25 10.00 27.25
• Social contributions (including social security and Health Fund) 2.25 0 2.25
• Pension 15.00 a10.00 25.00
Russia 47.50 - 47.50 Eurasian Economic Union average 28.95 5.33 32.15
Asia average 16.17 8.70 24.87 Latin America average 12.97 7.70 20.67 Africa average 13.66 8.54 22.20 EU average 23.23 13.06 36.29 OECD average 22.02 11.81 33.83
Sources: Kyrgyz Republic MoF, IMF, KPMG, and World Bank staff calculations. Note: a State cumulative Pension Fund and pension contributions to the Kyrgyz Republic.
48 OECD (2018). Social Protection System Review of Kyrgyzstan, OECD Development Pathways, OECD Publishing, Paris. 49 Tarik Sahovic (2019). What’s holding back the Kyrgyz Republic private sector? The Brookings Institution. July 25, 2019. https://www.brookings.edu/blog/future-development/2019/07/25/whats-holding-back-the-kyrgyz-republic-private-sector/.
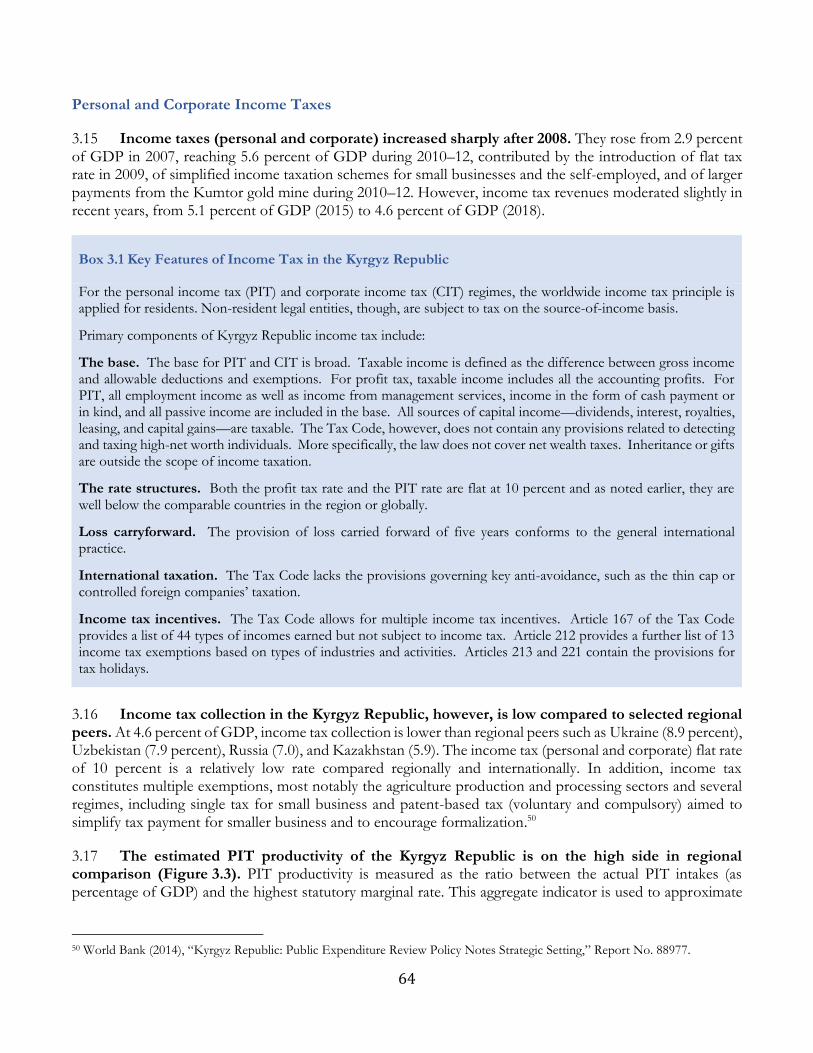
64
Personal and Corporate Income Taxes
3.15 Income taxes (personal and corporate) increased sharply after 2008. They rose from 2.9 percent of GDP in 2007, reaching 5.6 percent of GDP during 2010–12, contributed by the introduction of flat tax rate in 2009, of simplified income taxation schemes for small businesses and the self-employed, and of larger payments from the Kumtor gold mine during 2010–12. However, income tax revenues moderated slightly in recent years, from 5.1 percent of GDP (2015) to 4.6 percent of GDP (2018).
Box 3.1 Key Features of Income Tax in the Kyrgyz Republic
For the personal income tax (PIT) and corporate income tax (CIT) regimes, the worldwide income tax principle is applied for residents. Non-resident legal entities, though, are subject to tax on the source-of-income basis.
Primary components of Kyrgyz Republic income tax include:
The base. The base for PIT and CIT is broad. Taxable income is defined as the difference between gross income and allowable deductions and exemptions. For profit tax, taxable income includes all the accounting profits. For PIT, all employment income as well as income from management services, income in the form of cash payment or in kind, and all passive income are included in the base. All sources of capital income—dividends, interest, royalties, leasing, and capital gains—are taxable. The Tax Code, however, does not contain any provisions related to detecting and taxing high-net worth individuals. More specifically, the law does not cover net wealth taxes. Inheritance or gifts are outside the scope of income taxation.
The rate structures. Both the profit tax rate and the PIT rate are flat at 10 percent and as noted earlier, they are well below the comparable countries in the region or globally.
Loss carryforward. The provision of loss carried forward of five years conforms to the general international practice.
International taxation. The Tax Code lacks the provisions governing key anti-avoidance, such as the thin cap or controlled foreign companies’ taxation.
Income tax incentives. The Tax Code allows for multiple income tax incentives. Article 167 of the Tax Code provides a list of 44 types of incomes earned but not subject to income tax. Article 212 provides a further list of 13 income tax exemptions based on types of industries and activities. Articles 213 and 221 contain the provisions for tax holidays.
3.16 Income tax collection in the Kyrgyz Republic, however, is low compared to selected regional peers. At 4.6 percent of GDP, income tax collection is lower than regional peers such as Ukraine (8.9 percent), Uzbekistan (7.9 percent), Russia (7.0), and Kazakhstan (5.9). The income tax (personal and corporate) flat rate of 10 percent is a relatively low rate compared regionally and internationally. In addition, income tax constitutes multiple exemptions, most notably the agriculture production and processing sectors and several regimes, including single tax for small business and patent-based tax (voluntary and compulsory) aimed to simplify tax payment for smaller business and to encourage formalization.50
3.17 The estimated PIT productivity of the Kyrgyz Republic is on the high side in regional comparison (Figure 3.3). PIT productivity is measured as the ratio between the actual PIT intakes (as percentage of GDP) and the highest statutory marginal rate. This aggregate indicator is used to approximate
50 World Bank (2014), “Kyrgyz Republic: Public Expenditure Review Policy Notes Strategic Setting,” Report No. 88977.
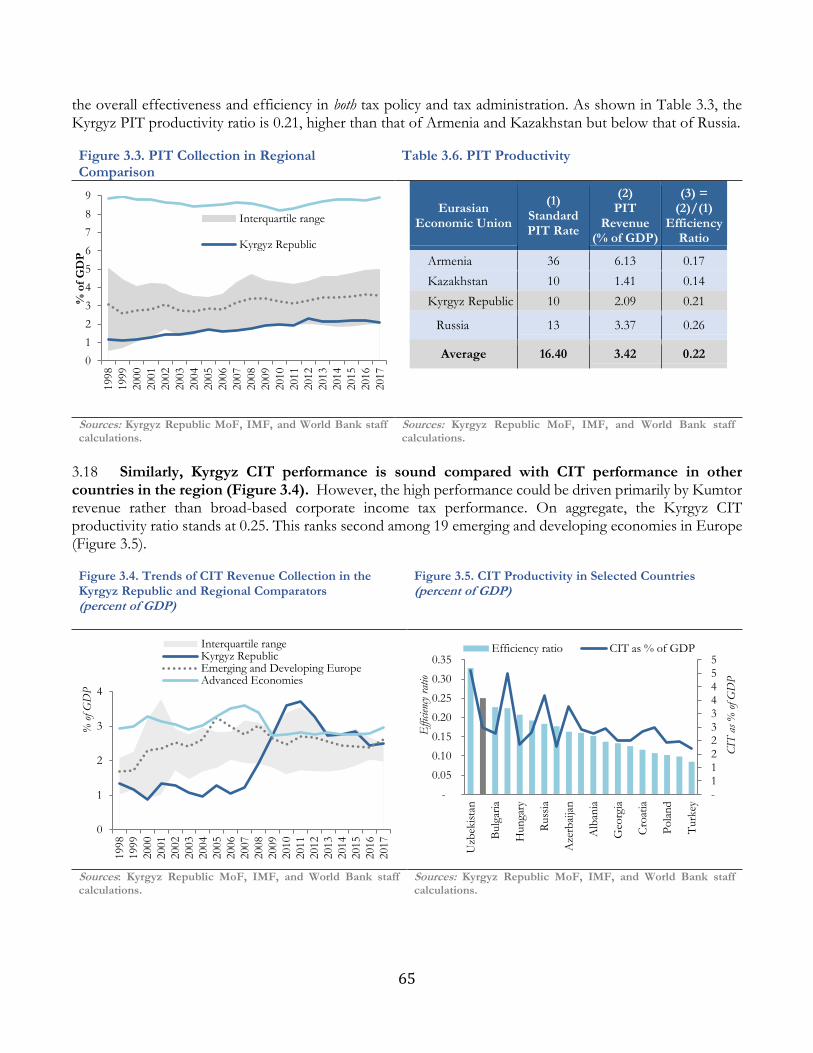
65
the overall effectiveness and efficiency in both tax policy and tax administration. As shown in Table 3.3, the Kyrgyz PIT productivity ratio is 0.21, higher than that of Armenia and Kazakhstan but below that of Russia.
Figure 3.3. PIT Collection in Regional Comparison
Table 3.6. PIT Productivity
Eurasian Economic Union
(1) Standard PIT Rate
(2) PIT
Revenue (% of GDP)
(3) = (2)/(1)
Efficiency Ratio
Armenia 36 6.13 0.17
Kazakhstan 10 1.41 0.14
Kyrgyz Republic 10 2.09 0.21
Russia 13 3.37 0.26
Average 16.40 3.42 0.22
Sources: Kyrgyz Republic MoF, IMF, and World Bank staff calculations.
Sources: Kyrgyz Republic MoF, IMF, and World Bank staff calculations.
3.18 Similarly, Kyrgyz CIT performance is sound compared with CIT performance in other countries in the region (Figure 3.4). However, the high performance could be driven primarily by Kumtor revenue rather than broad-based corporate income tax performance. On aggregate, the Kyrgyz CIT productivity ratio stands at 0.25. This ranks second among 19 emerging and developing economies in Europe (Figure 3.5).
Figure 3.4. Trends of CIT Revenue Collection in the Kyrgyz Republic and Regional Comparators (percent of GDP)
Figure 3.5. CIT Productivity in Selected Countries (percent of GDP)
Sources: Kyrgyz Republic MoF, IMF, and World Bank staff calculations.
Sources: Kyrgyz Republic MoF, IMF, and World Bank staff calculations.
0
1
2
3
4
5
6
7
8
9
1998
1999
2000
2001
2002
2003
2004
2005
2006
2007
2008
2009
2010
2011
2012
2013
2014
2015
2016
2017
% o
f G
DP
Interquartile range
Kyrgyz Republic
0
1
2
3
4
1998
1999
2000
2001
2002
2003
2004
2005
2006
2007
2008
2009
2010
2011
2012
2013
2014
2015
2016
2017
% o
f G
DP
Interquartile rangeKyrgyz RepublicEmerging and Developing EuropeAdvanced Economies
- 1 1 2 2 3 3 4 4 5 5
-
0.05
0.10
0.15
0.20
0.25
0.30
0.35
Uzb
ekis
tan
Bulg
aria
Hun
gary
Russ
ia
Aze
rbai
jan
Alb
ania
Geo
rgia
Cro
atia
Po
lan
d
Turk
ey
CIT
as
% o
f GD
P
Effi
cien
cy r
atio
Efficiency ratio CIT as % of GDP
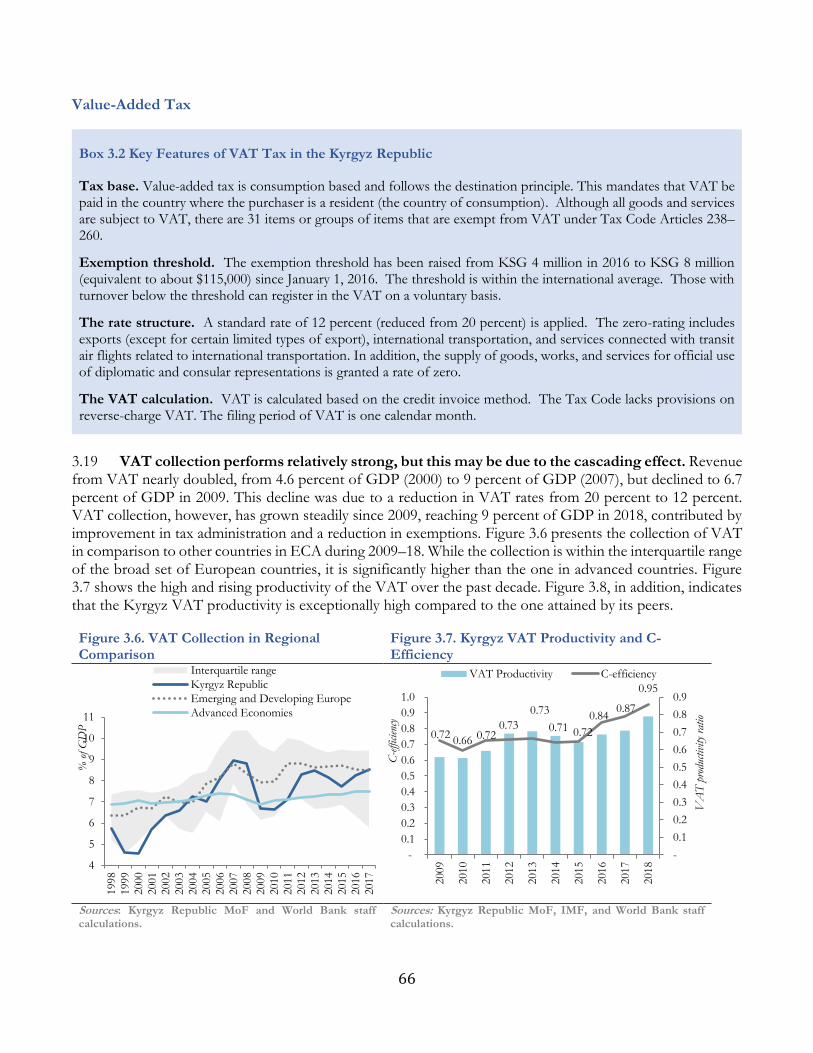
66
Value-Added Tax
Box 3.2 Key Features of VAT Tax in the Kyrgyz Republic
Tax base. Value-added tax is consumption based and follows the destination principle. This mandates that VAT be paid in the country where the purchaser is a resident (the country of consumption). Although all goods and services are subject to VAT, there are 31 items or groups of items that are exempt from VAT under Tax Code Articles 238–260.
Exemption threshold. The exemption threshold has been raised from KSG 4 million in 2016 to KSG 8 million (equivalent to about $115,000) since January 1, 2016. The threshold is within the international average. Those with turnover below the threshold can register in the VAT on a voluntary basis.
The rate structure. A standard rate of 12 percent (reduced from 20 percent) is applied. The zero-rating includes exports (except for certain limited types of export), international transportation, and services connected with transit air flights related to international transportation. In addition, the supply of goods, works, and services for official use of diplomatic and consular representations is granted a rate of zero.
The VAT calculation. VAT is calculated based on the credit invoice method. The Tax Code lacks provisions on reverse-charge VAT. The filing period of VAT is one calendar month.
3.19 VAT collection performs relatively strong, but this may be due to the cascading effect. Revenue from VAT nearly doubled, from 4.6 percent of GDP (2000) to 9 percent of GDP (2007), but declined to 6.7 percent of GDP in 2009. This decline was due to a reduction in VAT rates from 20 percent to 12 percent. VAT collection, however, has grown steadily since 2009, reaching 9 percent of GDP in 2018, contributed by improvement in tax administration and a reduction in exemptions. Figure 3.6 presents the collection of VAT in comparison to other countries in ECA during 2009–18. While the collection is within the interquartile range of the broad set of European countries, it is significantly higher than the one in advanced countries. Figure 3.7 shows the high and rising productivity of the VAT over the past decade. Figure 3.8, in addition, indicates that the Kyrgyz VAT productivity is exceptionally high compared to the one attained by its peers.
Figure 3.6. VAT Collection in Regional Comparison
Figure 3.7. Kyrgyz VAT Productivity and C-Efficiency
Sources: Kyrgyz Republic MoF and World Bank staff calculations.
Sources: Kyrgyz Republic MoF, IMF, and World Bank staff calculations.
4
5
6
7
8
9
10
11
1998
1999
2000
2001
2002
2003
2004
2005
2006
2007
2008
2009
2010
2011
2012
2013
2014
2015
2016
2017
% o
f G
DP
Interquartile range
Kyrgyz Republic
Emerging and Developing Europe
Advanced Economies
0.720.66 0.72
0.73
0.73
0.71 0.72
0.840.87
0.95
-
0.1
0.2
0.3
0.4
0.5
0.6
0.7
0.8
0.9
-
0.1
0.2
0.3
0.4
0.5
0.6
0.7
0.8
0.9
1.0
2009
2010
2011
2012
2013
2014
2015
2016
2017
2018
VA
T p
rodu
ctiv
ity
ratio
C-e
fficien
cy
VAT Productivity C-efficiency
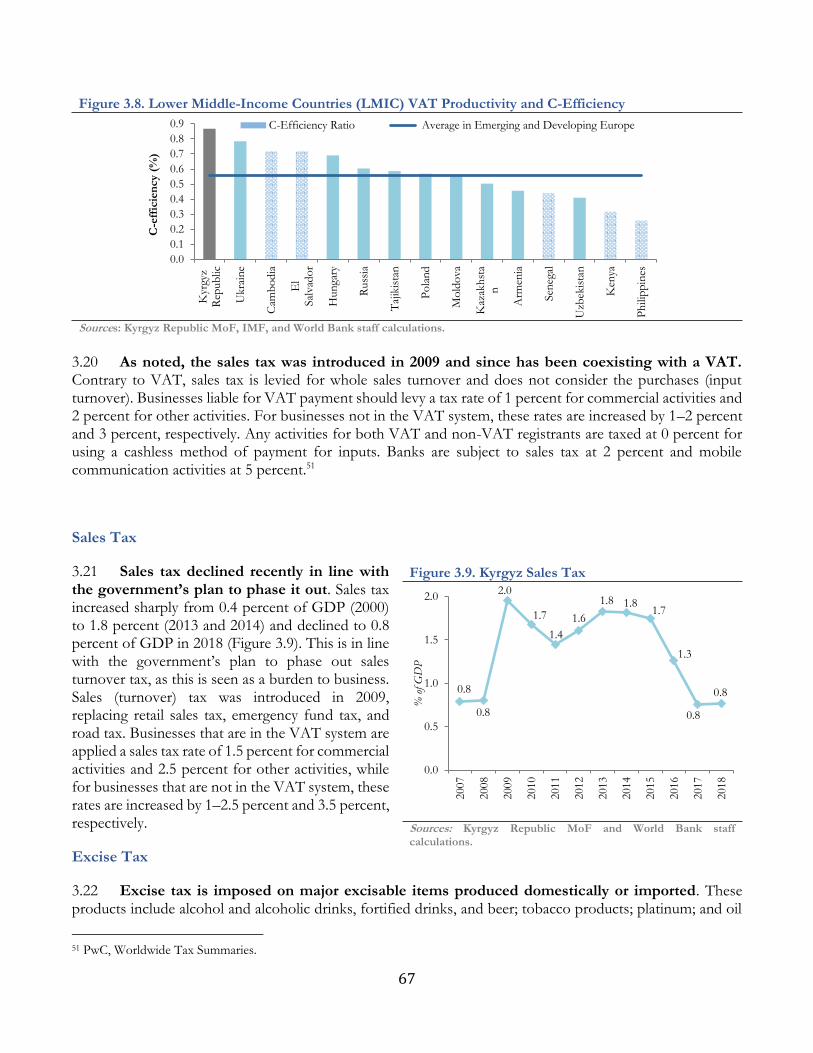
67
Figure 3.8. Lower Middle-Income Countries (LMIC) VAT Productivity and C-Efficiency
Sources: Kyrgyz Republic MoF, IMF, and World Bank staff calculations.
3.20 As noted, the sales tax was introduced in 2009 and since has been coexisting with a VAT. Contrary to VAT, sales tax is levied for whole sales turnover and does not consider the purchases (input turnover). Businesses liable for VAT payment should levy a tax rate of 1 percent for commercial activities and 2 percent for other activities. For businesses not in the VAT system, these rates are increased by 1–2 percent and 3 percent, respectively. Any activities for both VAT and non-VAT registrants are taxed at 0 percent for using a cashless method of payment for inputs. Banks are subject to sales tax at 2 percent and mobile communication activities at 5 percent.51
Sales Tax
3.21 Sales tax declined recently in line with the government’s plan to phase it out. Sales tax increased sharply from 0.4 percent of GDP (2000) to 1.8 percent (2013 and 2014) and declined to 0.8 percent of GDP in 2018 (Figure 3.9). This is in line with the government’s plan to phase out sales turnover tax, as this is seen as a burden to business. Sales (turnover) tax was introduced in 2009, replacing retail sales tax, emergency fund tax, and road tax. Businesses that are in the VAT system are applied a sales tax rate of 1.5 percent for commercial activities and 2.5 percent for other activities, while for businesses that are not in the VAT system, these rates are increased by 1–2.5 percent and 3.5 percent, respectively.
Excise Tax
3.22 Excise tax is imposed on major excisable items produced domestically or imported. These products include alcohol and alcoholic drinks, fortified drinks, and beer; tobacco products; platinum; and oil
51 PwC, Worldwide Tax Summaries.
0.0
0.1
0.2
0.3
0.4
0.5
0.6
0.7
0.8
0.9
Kyr
gyz
Rep
ub
lic
Ukra
ine
Cam
bo
dia
El
Sal
vad
or
Hun
gary
Russ
ia
Taj
ikis
tan
Po
lan
d
Mo
ldo
va
Kaz
akh
sta
n
Arm
enia
Sen
egal
Uzb
ekis
tan
Ken
ya
Ph
ilip
pin
es
C-e
ffic
ien
cy (
%)
C-Efficiency Ratio Average in Emerging and Developing Europe
Figure 3.9. Kyrgyz Sales Tax
Sources: Kyrgyz Republic MoF and World Bank staff calculations.
0.8
0.8
2.0
1.7
1.4
1.6
1.8 1.81.7
1.3
0.8
0.8
0.0
0.5
1.0
1.5
2.0
2007
2008
2009
2010
2011
2012
2013
2014
2015
2016
2017
2018
% o
f G
DP
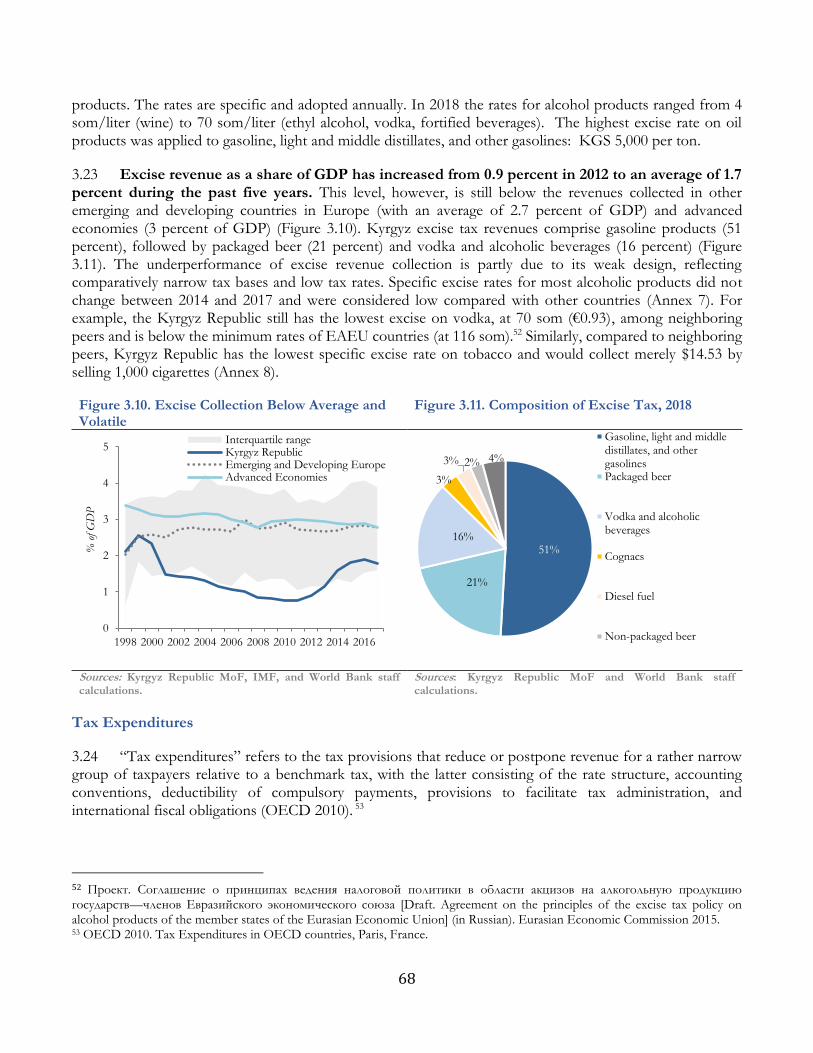
68
products. The rates are specific and adopted annually. In 2018 the rates for alcohol products ranged from 4 som/liter (wine) to 70 som/liter (ethyl alcohol, vodka, fortified beverages). The highest excise rate on oil products was applied to gasoline, light and middle distillates, and other gasolines: KGS 5,000 per ton.
3.23 Excise revenue as a share of GDP has increased from 0.9 percent in 2012 to an average of 1.7 percent during the past five years. This level, however, is still below the revenues collected in other emerging and developing countries in Europe (with an average of 2.7 percent of GDP) and advanced economies (3 percent of GDP) (Figure 3.10). Kyrgyz excise tax revenues comprise gasoline products (51 percent), followed by packaged beer (21 percent) and vodka and alcoholic beverages (16 percent) (Figure 3.11). The underperformance of excise revenue collection is partly due to its weak design, reflecting comparatively narrow tax bases and low tax rates. Specific excise rates for most alcoholic products did not change between 2014 and 2017 and were considered low compared with other countries (Annex 7). For example, the Kyrgyz Republic still has the lowest excise on vodka, at 70 som (€0.93), among neighboring peers and is below the minimum rates of EAEU countries (at 116 som).52 Similarly, compared to neighboring peers, Kyrgyz Republic has the lowest specific excise rate on tobacco and would collect merely $14.53 by selling 1,000 cigarettes (Annex 8).
Figure 3.10. Excise Collection Below Average and Volatile
Figure 3.11. Composition of Excise Tax, 2018
Sources: Kyrgyz Republic MoF, IMF, and World Bank staff calculations.
Sources: Kyrgyz Republic MoF and World Bank staff calculations.
Tax Expenditures
3.24 “Tax expenditures” refers to the tax provisions that reduce or postpone revenue for a rather narrow group of taxpayers relative to a benchmark tax, with the latter consisting of the rate structure, accounting conventions, deductibility of compulsory payments, provisions to facilitate tax administration, and international fiscal obligations (OECD 2010). 53
52 Проект. Соглашение о принципах ведения налоговой политики в области акцизов на алкогольную продукцию государств—членов Евразийского экономического союза [Draft. Agreement on the principles of the excise tax policy on alcohol products of the member states of the Eurasian Economic Union] (in Russian). Eurasian Economic Commission 2015. 53 OECD 2010. Tax Expenditures in OECD countries, Paris, France.
0
1
2
3
4
5
1998 2000 2002 2004 2006 2008 2010 2012 2014 2016
% o
f G
DP
Interquartile rangeKyrgyz RepublicEmerging and Developing EuropeAdvanced Economies
51%
21%
16%
3%
3% 2% 4%
Gasoline, light and middledistillates, and othergasolinesPackaged beer
Vodka and alcoholicbeverages
Cognacs
Diesel fuel
Non-packaged beer
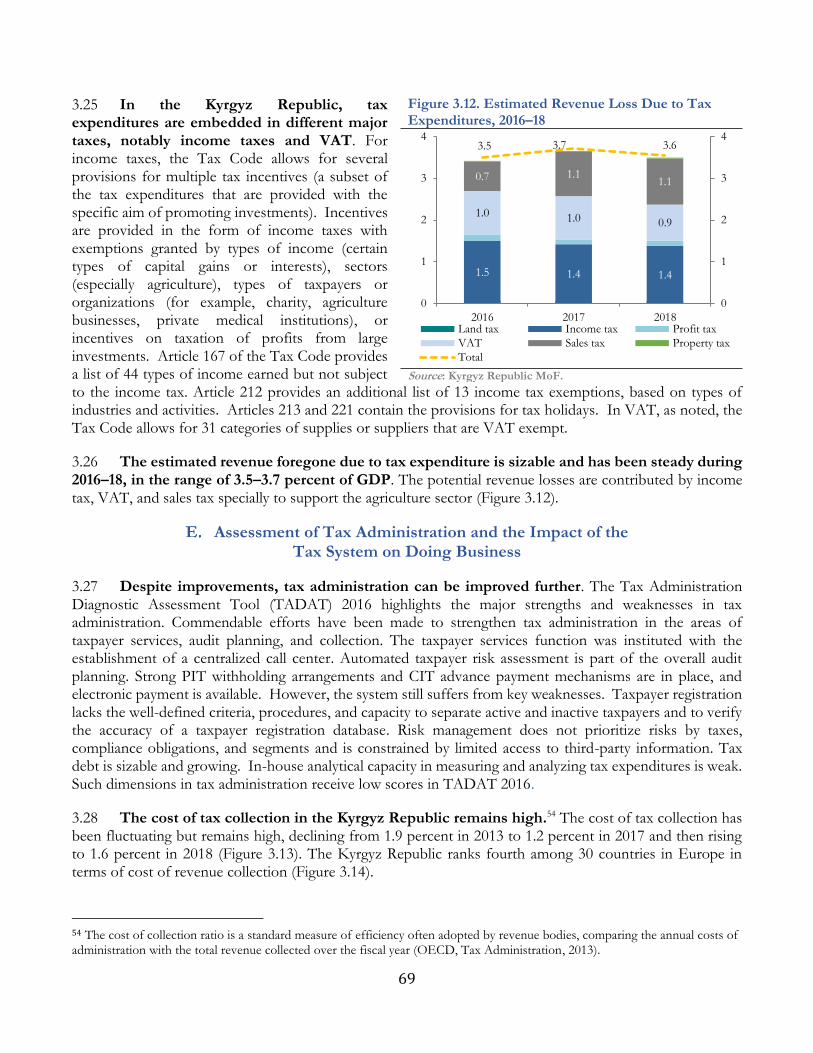
69
3.25 In the Kyrgyz Republic, tax expenditures are embedded in different major taxes, notably income taxes and VAT. For income taxes, the Tax Code allows for several provisions for multiple tax incentives (a subset of the tax expenditures that are provided with the specific aim of promoting investments). Incentives are provided in the form of income taxes with exemptions granted by types of income (certain types of capital gains or interests), sectors (especially agriculture), types of taxpayers or organizations (for example, charity, agriculture businesses, private medical institutions), or incentives on taxation of profits from large investments. Article 167 of the Tax Code provides a list of 44 types of income earned but not subject to the income tax. Article 212 provides an additional list of 13 income tax exemptions, based on types of industries and activities. Articles 213 and 221 contain the provisions for tax holidays. In VAT, as noted, the Tax Code allows for 31 categories of supplies or suppliers that are VAT exempt.
3.26 The estimated revenue foregone due to tax expenditure is sizable and has been steady during 2016–18, in the range of 3.5–3.7 percent of GDP. The potential revenue losses are contributed by income tax, VAT, and sales tax specially to support the agriculture sector (Figure 3.12).
Assessment of Tax Administration and the Impact of the Tax System on Doing Business
3.27 Despite improvements, tax administration can be improved further. The Tax Administration Diagnostic Assessment Tool (TADAT) 2016 highlights the major strengths and weaknesses in tax administration. Commendable efforts have been made to strengthen tax administration in the areas of taxpayer services, audit planning, and collection. The taxpayer services function was instituted with the establishment of a centralized call center. Automated taxpayer risk assessment is part of the overall audit planning. Strong PIT withholding arrangements and CIT advance payment mechanisms are in place, and electronic payment is available. However, the system still suffers from key weaknesses. Taxpayer registration lacks the well-defined criteria, procedures, and capacity to separate active and inactive taxpayers and to verify the accuracy of a taxpayer registration database. Risk management does not prioritize risks by taxes, compliance obligations, and segments and is constrained by limited access to third-party information. Tax debt is sizable and growing. In-house analytical capacity in measuring and analyzing tax expenditures is weak. Such dimensions in tax administration receive low scores in TADAT 2016.
3.28 The cost of tax collection in the Kyrgyz Republic remains high.54 The cost of tax collection has been fluctuating but remains high, declining from 1.9 percent in 2013 to 1.2 percent in 2017 and then rising to 1.6 percent in 2018 (Figure 3.13). The Kyrgyz Republic ranks fourth among 30 countries in Europe in terms of cost of revenue collection (Figure 3.14).
54 The cost of collection ratio is a standard measure of efficiency often adopted by revenue bodies, comparing the annual costs of administration with the total revenue collected over the fiscal year (OECD, Tax Administration, 2013).
Figure 3.12. Estimated Revenue Loss Due to Tax Expenditures, 2016–18
Source: Kyrgyz Republic MoF.
1.5 1.4 1.4
1.0 1.0 0.9
0.7 1.11.1
3.5 3.7 3.6
0
1
2
3
4
0
1
2
3
4
2016 2017 2018Land tax Income tax Profit tax
VAT Sales tax Property tax
Total
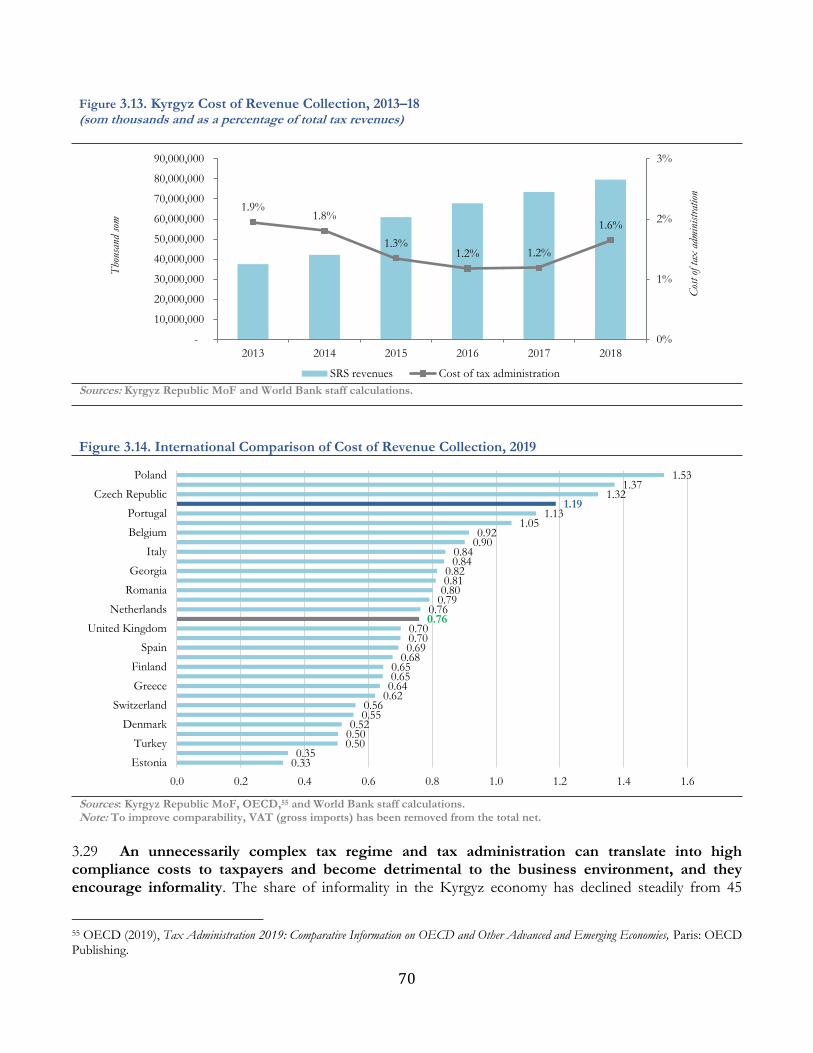
70
Figure 3.13. Kyrgyz Cost of Revenue Collection, 2013–18 (som thousands and as a percentage of total tax revenues)
Sources: Kyrgyz Republic MoF and World Bank staff calculations.
Figure 3.14. International Comparison of Cost of Revenue Collection, 2019
Sources: Kyrgyz Republic MoF, OECD,55 and World Bank staff calculations. Note: To improve comparability, VAT (gross imports) has been removed from the total net.
3.29 An unnecessarily complex tax regime and tax administration can translate into high compliance costs to taxpayers and become detrimental to the business environment, and they encourage informality. The share of informality in the Kyrgyz economy has declined steadily from 45
55 OECD (2019), Tax Administration 2019: Comparative Information on OECD and Other Advanced and Emerging Economies, Paris: OECD Publishing.
1.9%1.8%
1.3%1.2% 1.2%
1.6%
0%
1%
2%
3%
-
10,000,000
20,000,000
30,000,000
40,000,000
50,000,000
60,000,000
70,000,000
80,000,000
90,000,000
2013 2014 2015 2016 2017 2018
Cos
t of
tax
adm
inis
trat
ion
Tho
usan
d so
m
SRS revenues Cost of tax administration
0.330.35
0.500.500.52
0.550.56
0.620.640.650.65
0.680.690.700.70
0.760.76
0.790.800.810.82
0.840.84
0.900.92
1.051.13
1.191.32
1.371.53
0.0 0.2 0.4 0.6 0.8 1.0 1.2 1.4 1.6
Estonia
Turkey
Denmark
Switzerland
Greece
Finland
Spain
United Kingdom
Netherlands
Romania
Georgia
Italy
Belgium
Portugal
Czech Republic
Poland
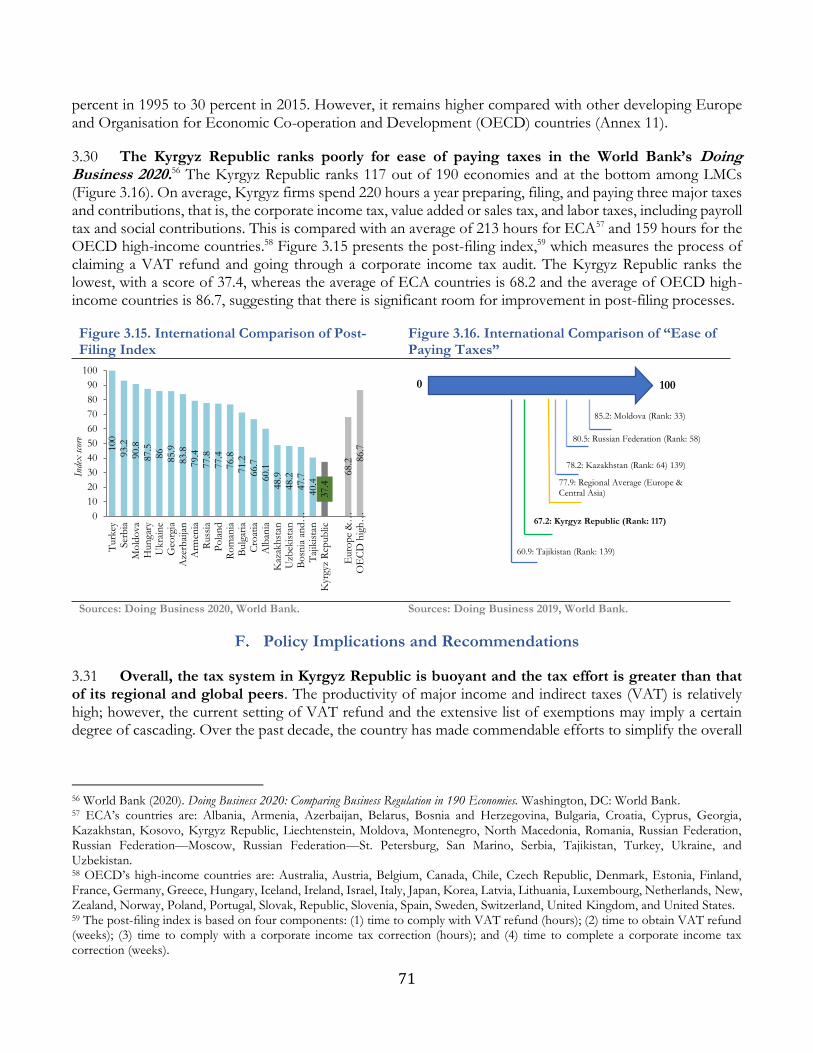
71
60.9: Tajikistan (Rank: 139)
67.2: Kyrgyz Republic (Rank: 117)
77.9: Regional Average (Europe & Central Asia)
85.2: Moldova (Rank: 33)
78.2: Kazakhstan (Rank: 64) 139)
80.5: Russian Federation (Rank: 58)
0 100
percent in 1995 to 30 percent in 2015. However, it remains higher compared with other developing Europe and Organisation for Economic Co-operation and Development (OECD) countries (Annex 11).
3.30 The Kyrgyz Republic ranks poorly for ease of paying taxes in the World Bank’s Doing Business 2020.56 The Kyrgyz Republic ranks 117 out of 190 economies and at the bottom among LMCs (Figure 3.16). On average, Kyrgyz firms spend 220 hours a year preparing, filing, and paying three major taxes and contributions, that is, the corporate income tax, value added or sales tax, and labor taxes, including payroll tax and social contributions. This is compared with an average of 213 hours for ECA57 and 159 hours for the OECD high-income countries.58 Figure 3.15 presents the post-filing index,59 which measures the process of claiming a VAT refund and going through a corporate income tax audit. The Kyrgyz Republic ranks the lowest, with a score of 37.4, whereas the average of ECA countries is 68.2 and the average of OECD high-income countries is 86.7, suggesting that there is significant room for improvement in post-filing processes.
Figure 3.15. International Comparison of Post-Filing Index
Figure 3.16. International Comparison of “Ease of Paying Taxes”
Sources: Doing Business 2020, World Bank. Sources: Doing Business 2019, World Bank.
Policy Implications and Recommendations
3.31 Overall, the tax system in Kyrgyz Republic is buoyant and the tax effort is greater than that of its regional and global peers. The productivity of major income and indirect taxes (VAT) is relatively high; however, the current setting of VAT refund and the extensive list of exemptions may imply a certain degree of cascading. Over the past decade, the country has made commendable efforts to simplify the overall
56 World Bank (2020). Doing Business 2020: Comparing Business Regulation in 190 Economies. Washington, DC: World Bank. 57 ECA’s countries are: Albania, Armenia, Azerbaijan, Belarus, Bosnia and Herzegovina, Bulgaria, Croatia, Cyprus, Georgia, Kazakhstan, Kosovo, Kyrgyz Republic, Liechtenstein, Moldova, Montenegro, North Macedonia, Romania, Russian Federation, Russian Federation—Moscow, Russian Federation—St. Petersburg, San Marino, Serbia, Tajikistan, Turkey, Ukraine, and Uzbekistan. 58 OECD’s high-income countries are: Australia, Austria, Belgium, Canada, Chile, Czech Republic, Denmark, Estonia, Finland, France, Germany, Greece, Hungary, Iceland, Ireland, Israel, Italy, Japan, Korea, Latvia, Lithuania, Luxembourg, Netherlands, New, Zealand, Norway, Poland, Portugal, Slovak, Republic, Slovenia, Spain, Sweden, Switzerland, United Kingdom, and United States. 59 The post-filing index is based on four components: (1) time to comply with VAT refund (hours); (2) time to obtain VAT refund (weeks); (3) time to comply with a corporate income tax correction (hours); and (4) time to complete a corporate income tax correction (weeks).
100
93.2
90.8
87.5
86
85.9
83.8
79.4
77.8
77.4
76.8
71.2
66.7
60.1
48.9
48.2
47.7
40.4
37.4
68.2 8
6.7
0
10
20
30
40
50
60
70
80
90
100
Turk
eySer
bia
Mo
ldo
va
Hun
gary
Ukra
ine
Geo
rgia
Aze
rbai
jan
Arm
enia
Russ
iaP
ola
nd
Ro
man
iaB
ulg
aria
Cro
atia
Alb
ania
Kaz
akh
stan
Uzb
ekis
tan
Bo
snia
an
d…
Taj
ikis
tan
Kyr
gyz
Rep
ub
lic
Euro
pe
&…
OE
CD
hig
h…
Inde
x s
core
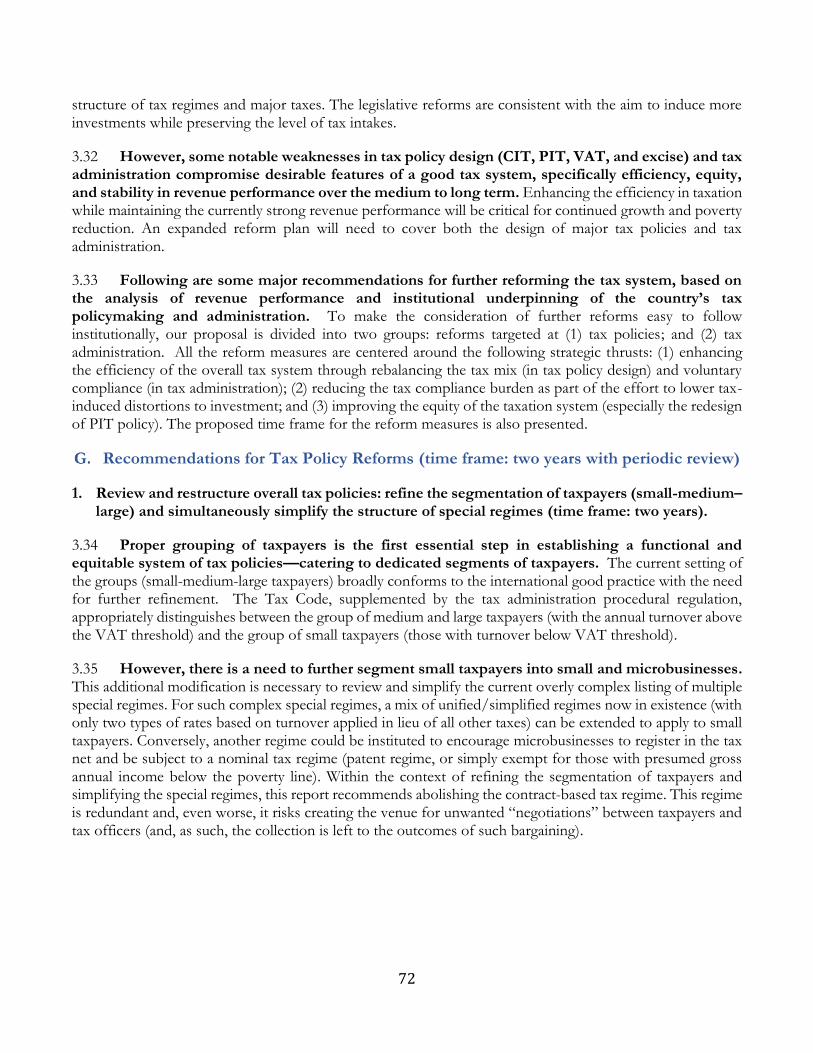
72
structure of tax regimes and major taxes. The legislative reforms are consistent with the aim to induce more investments while preserving the level of tax intakes.
3.32 However, some notable weaknesses in tax policy design (CIT, PIT, VAT, and excise) and tax administration compromise desirable features of a good tax system, specifically efficiency, equity, and stability in revenue performance over the medium to long term. Enhancing the efficiency in taxation while maintaining the currently strong revenue performance will be critical for continued growth and poverty reduction. An expanded reform plan will need to cover both the design of major tax policies and tax administration.
3.33 Following are some major recommendations for further reforming the tax system, based on the analysis of revenue performance and institutional underpinning of the country’s tax policymaking and administration. To make the consideration of further reforms easy to follow institutionally, our proposal is divided into two groups: reforms targeted at (1) tax policies; and (2) tax administration. All the reform measures are centered around the following strategic thrusts: (1) enhancing the efficiency of the overall tax system through rebalancing the tax mix (in tax policy design) and voluntary compliance (in tax administration); (2) reducing the tax compliance burden as part of the effort to lower tax-induced distortions to investment; and (3) improving the equity of the taxation system (especially the redesign of PIT policy). The proposed time frame for the reform measures is also presented.
Recommendations for Tax Policy Reforms (time frame: two years with periodic review)
1. Review and restructure overall tax policies: refine the segmentation of taxpayers (small-medium–large) and simultaneously simplify the structure of special regimes (time frame: two years).
3.34 Proper grouping of taxpayers is the first essential step in establishing a functional and equitable system of tax policies—catering to dedicated segments of taxpayers. The current setting of the groups (small-medium-large taxpayers) broadly conforms to the international good practice with the need for further refinement. The Tax Code, supplemented by the tax administration procedural regulation, appropriately distinguishes between the group of medium and large taxpayers (with the annual turnover above the VAT threshold) and the group of small taxpayers (those with turnover below VAT threshold).
3.35 However, there is a need to further segment small taxpayers into small and microbusinesses. This additional modification is necessary to review and simplify the current overly complex listing of multiple special regimes. For such complex special regimes, a mix of unified/simplified regimes now in existence (with only two types of rates based on turnover applied in lieu of all other taxes) can be extended to apply to small taxpayers. Conversely, another regime could be instituted to encourage microbusinesses to register in the tax net and be subject to a nominal tax regime (patent regime, or simply exempt for those with presumed gross annual income below the poverty line). Within the context of refining the segmentation of taxpayers and simplifying the special regimes, this report recommends abolishing the contract-based tax regime. This regime is redundant and, even worse, it risks creating the venue for unwanted “negotiations” between taxpayers and tax officers (and, as such, the collection is left to the outcomes of such bargaining).
73
2. Reform income tax regimes (1) introduce core tax-avoidance rules in the Tax Code; and (2) adjust PIT legislation (time frame: two years).
i. Introduce core tax-avoidance rules in the Tax Code.
3.36 Globalization strongly impacts the way taxes effectively function. The emerging Base Erosion and Profit Shifting agenda is designed to counter such revenue-depressing problems. The Kyrgyz Republic is considering filling in the gap in the Tax Code and legislation to deal with tax avoidance caused by the complexity of international tax issues. The initial key step would be to introduce the rules of thin capitalization and controlled foreign corporation (CFC).
ii. Adjust PIT legislation to raise the exempt threshold in PIT and raise tax rates for the top income bracket.
3.37 There are two aspects of amending the PIT regime to consider: first, raise the exempt threshold in the PIT. At the current stage, the exempt threshold is too low, pushing low-income taxpayers or even those below the poverty line into the tax net. The annual deduction is set at KSG 7,800 (monthly KSG 650), equivalent to about $112.60 This pales in comparison with the country’s GDP per capita of $1,070 or even the international poverty threshold of $1.90/day. The statistics show that the PIT exempt income accounts for about 10 percent of the GDP per capita, or 16 percent of the international poverty line. This extremely low level of exemption threshold tends to make the PIT regime less progressive and serves to unfairly punish the low wage earners.61
3.38 Second, the current PIT regime, with a low and flat tax rate of 10 percent—which is similar to profit tax—tends to favor the rich. In the medium term, it is recommended that the tax rates for those in the top personal income bracket be adjusted upward to ensure harmonization between capital and PIT structures. Combined with raising the PIT exempt threshold, such a policy measure will effectively shift the flat PIT rate structure to one with graduated rates by income brackets. Raising the highest marginal rates on the high-income earners would help compensate for potential revenue loss from a higher exemption threshold.
3. Reform VAT and sales tax regimes (time frame: two years).
i. Make VAT refund widely available and simultaneously ensure effective VAT refund audits and punitive penalties for frauds.
3.39 Even though the overall VAT structure conforms to the international good practice, one key observation is worth noting: while the standard rate is low, the revenue collection is exceptionally robust. This fact is paired with the highly restricted VAT refund—granted only to major exporters but just allowing others to offset against other tax obligations. The mechanism as applied to those outside the “major exports” tax group would risk falling into the cascading issue in VAT, similar to the inefficiency impact inherent in a turnover tax, and would risk burdening businesses with cash flow problems; therefore, the refund mechanism would function as a disincentive for investment. To enhance efficiency in VAT, it is essential that the Tax Code redefine the rules of the refund, making it available to all taxpayers but subjecting it to rigorous risk-
60 At the exchange rate of KSG 69.85/USD 1, accessed at https://www.xe.com/currencyconverter/ on November 25, 2019. 61 One could argue that equity is best attained from the public expenditures side while relieving the tax system to focus on the main objectives of raising revenues. However, this argument cannot be considered in isolation, without a country-specific context, particularly in countries where the reform of expenditures is faced with both political and institutional difficulties. For progressivity of the entire tax system, PIT is the main instrument to serve the purpose in the most efficient way (this would alleviate the need to tinker with unnecessary efficiency-depressing interventions in other tax types, most prominently VAT).
74
based refund administration to handle the higher volume of refunds and mitigate the risk of frauds. It is also worth noting that once the refund functions properly—and more efficiently—the VAT collection may go down and thus will need to be compensated from other tax instruments (particularly rationalization of the incentive structure in major direct income taxes and VAT).
ii. Refine the zero-rating and exemptions list.
3.40 The zero rating is provided to exports and international transport. This is necessary to preserve the destination principle. The list of exemptions is long, however, and requires comprehensive review and rationalization. Some further adjustments, as follow, are needed to ensure the efficiency and the destination principle of VAT.
• Services related to the power supply needed to pump irrigation and drinking water, for example, are currently zero rated. This item needs to be made an exemption to reduce its impact on the refund system.
• Conversely, some items need to be removed from the exemptions list and zero rated, in particular:
o the supply and export of metal-containing ores, concentrates, alloys, and refined metals (to improve competitiveness); and
o The supply of jet fuel for refueling aircraft engaged in international air transport (to reduce the barrier to international service).
iii. Introduce reverse charge mechanism.
3.41 As part of anti-avoidance and equitable treatment in the VAT regime, introduce reverse charge for non-residents for services. This mechanism is typically applicable to non-VAT registrants that supply the services. As the suppliers are not part of the VAT system, the VAT is reverse-charged to the client, who must account for any VAT due.
iv. Eliminate the sales tax.
3.42 The revenue loss due to eliminating the sales tax is low and could be easily compensated with enhanced compliance measures in administering the VAT. The coexistence of this sales tax regime with the VAT raises the effective tax burden on consumption and more critically discourages small traders to voluntarily join the VAT net.
4. Enhance the quality of the excise tax policy (time frame: two years).
3.43 The policy reform is to target both revenue enhancement and achievement of multiple objectives for an excise (including public health, environment, internalization of negative externality in production and consumption). There are two key areas of reforms worth highlighting. First, increase excises for alcoholic products, tobacco, and fuel, provided the current low excise rates. The analysis shows that excise rates for beer and wine are relatively low, and rates adjustment can bring in significant additional revenues. However, measures to increase excise tax rates should be accompanied by efforts to reduce the illicit alcohol market and tax avoidance. Second, the Kyrgyz Republic may explore possibilities to expand the base. In this case, the prime focus is on introducing the excise on motor vehicles in addition to incorporating other potential candidates for excise (for example, sugary contents in food manufacturing). Such policy measures would lead to higher revenue collection and become beneficial to the environment and public health.
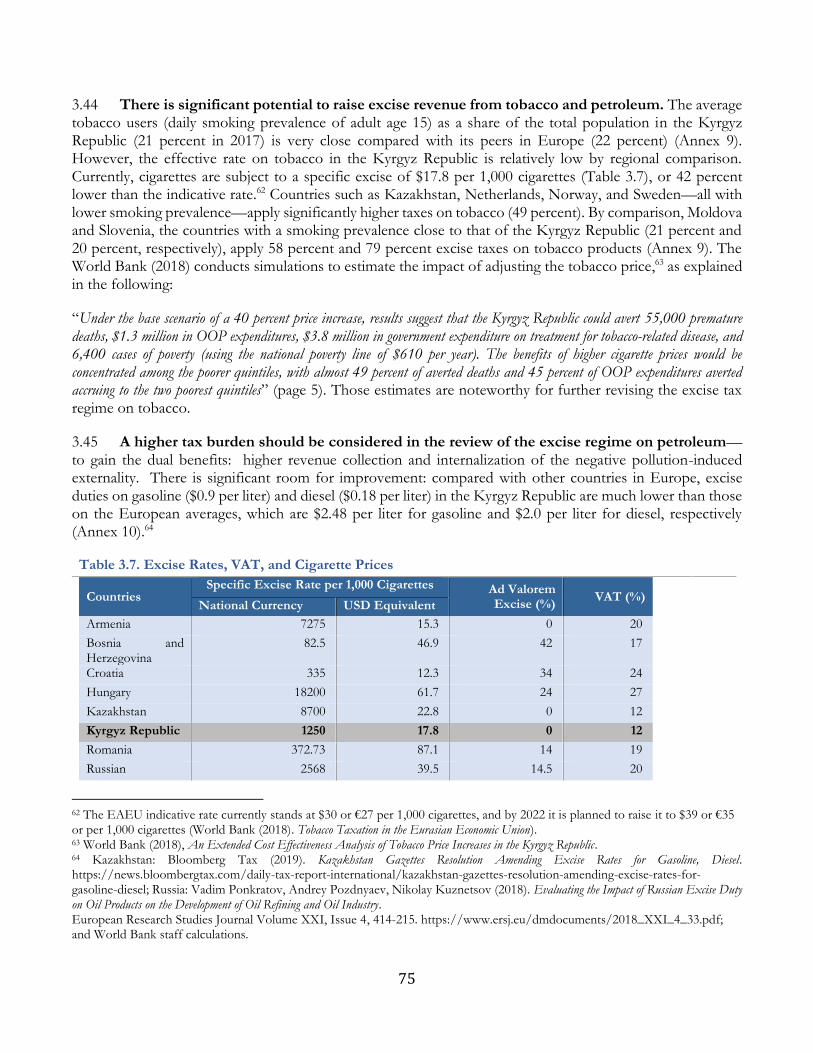
75
3.44 There is significant potential to raise excise revenue from tobacco and petroleum. The average tobacco users (daily smoking prevalence of adult age 15) as a share of the total population in the Kyrgyz Republic (21 percent in 2017) is very close compared with its peers in Europe (22 percent) (Annex 9). However, the effective rate on tobacco in the Kyrgyz Republic is relatively low by regional comparison. Currently, cigarettes are subject to a specific excise of $17.8 per 1,000 cigarettes (Table 3.7), or 42 percent lower than the indicative rate.62 Countries such as Kazakhstan, Netherlands, Norway, and Sweden—all with lower smoking prevalence—apply significantly higher taxes on tobacco (49 percent). By comparison, Moldova and Slovenia, the countries with a smoking prevalence close to that of the Kyrgyz Republic (21 percent and 20 percent, respectively), apply 58 percent and 79 percent excise taxes on tobacco products (Annex 9). The World Bank (2018) conducts simulations to estimate the impact of adjusting the tobacco price,63 as explained in the following:
“Under the base scenario of a 40 percent price increase, results suggest that the Kyrgyz Republic could avert 55,000 premature deaths, $1.3 million in OOP expenditures, $3.8 million in government expenditure on treatment for tobacco-related disease, and 6,400 cases of poverty (using the national poverty line of $610 per year). The benefits of higher cigarette prices would be concentrated among the poorer quintiles, with almost 49 percent of averted deaths and 45 percent of OOP expenditures averted accruing to the two poorest quintiles” (page 5). Those estimates are noteworthy for further revising the excise tax regime on tobacco.
3.45 A higher tax burden should be considered in the review of the excise regime on petroleum—to gain the dual benefits: higher revenue collection and internalization of the negative pollution-induced externality. There is significant room for improvement: compared with other countries in Europe, excise duties on gasoline ($0.9 per liter) and diesel ($0.18 per liter) in the Kyrgyz Republic are much lower than those on the European averages, which are $2.48 per liter for gasoline and $2.0 per liter for diesel, respectively (Annex 10).64
Table 3.7. Excise Rates, VAT, and Cigarette Prices
Countries Specific Excise Rate per 1,000 Cigarettes Ad Valorem
Excise (%) VAT (%)
National Currency USD Equivalent
Armenia 7275 15.3 0 20
Bosnia and Herzegovina
82.5 46.9 42 17
Croatia 335 12.3 34 24
Hungary 18200 61.7 24 27
Kazakhstan 8700 22.8 0 12
Kyrgyz Republic 1250 17.8 0 12
Romania 372.73 87.1 14 19
Russian 2568 39.5 14.5 20
62 The EAEU indicative rate currently stands at $30 or €27 per 1,000 cigarettes, and by 2022 it is planned to raise it to $39 or €35 or per 1,000 cigarettes (World Bank (2018). Tobacco Taxation in the Eurasian Economic Union). 63 World Bank (2018), An Extended Cost Effectiveness Analysis of Tobacco Price Increases in the Kyrgyz Republic. 64 Kazakhstan: Bloomberg Tax (2019). Kazakhstan Gazettes Resolution Amending Excise Rates for Gasoline, Diesel. https://news.bloombergtax.com/daily-tax-report-international/kazakhstan-gazettes-resolution-amending-excise-rates-for-gasoline-diesel; Russia: Vadim Ponkratov, Andrey Pozdnyaev, Nikolay Kuznetsov (2018). Evaluating the Impact of Russian Excise Duty on Oil Products on the Development of Oil Refining and Oil Industry. European Research Studies Journal Volume XXI, Issue 4, 414-215. https://www.ersj.eu/dmdocuments/2018_XXI_4_33.pdf; and World Bank staff calculations.
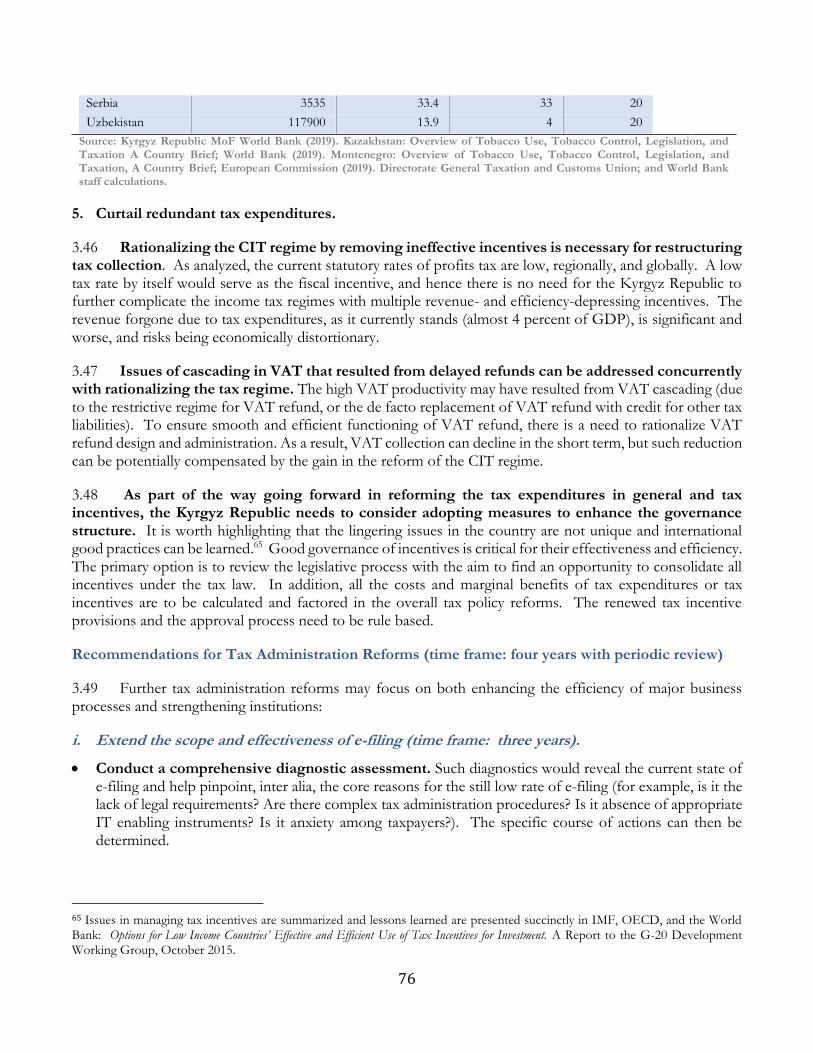
76
Serbia 3535 33.4 33 20
Uzbekistan 117900 13.9 4 20
Source: Kyrgyz Republic MoF World Bank (2019). Kazakhstan: Overview of Tobacco Use, Tobacco Control, Legislation, and Taxation A Country Brief; World Bank (2019). Montenegro: Overview of Tobacco Use, Tobacco Control, Legislation, and Taxation, A Country Brief; European Commission (2019). Directorate General Taxation and Customs Union; and World Bank staff calculations.
5. Curtail redundant tax expenditures.
3.46 Rationalizing the CIT regime by removing ineffective incentives is necessary for restructuring tax collection. As analyzed, the current statutory rates of profits tax are low, regionally, and globally. A low tax rate by itself would serve as the fiscal incentive, and hence there is no need for the Kyrgyz Republic to further complicate the income tax regimes with multiple revenue- and efficiency-depressing incentives. The revenue forgone due to tax expenditures, as it currently stands (almost 4 percent of GDP), is significant and worse, and risks being economically distortionary.
3.47 Issues of cascading in VAT that resulted from delayed refunds can be addressed concurrently with rationalizing the tax regime. The high VAT productivity may have resulted from VAT cascading (due to the restrictive regime for VAT refund, or the de facto replacement of VAT refund with credit for other tax liabilities). To ensure smooth and efficient functioning of VAT refund, there is a need to rationalize VAT refund design and administration. As a result, VAT collection can decline in the short term, but such reduction can be potentially compensated by the gain in the reform of the CIT regime.
3.48 As part of the way going forward in reforming the tax expenditures in general and tax incentives, the Kyrgyz Republic needs to consider adopting measures to enhance the governance structure. It is worth highlighting that the lingering issues in the country are not unique and international good practices can be learned.65 Good governance of incentives is critical for their effectiveness and efficiency. The primary option is to review the legislative process with the aim to find an opportunity to consolidate all incentives under the tax law. In addition, all the costs and marginal benefits of tax expenditures or tax incentives are to be calculated and factored in the overall tax policy reforms. The renewed tax incentive provisions and the approval process need to be rule based.
Recommendations for Tax Administration Reforms (time frame: four years with periodic review)
3.49 Further tax administration reforms may focus on both enhancing the efficiency of major business processes and strengthening institutions:
i. Extend the scope and effectiveness of e-filing (time frame: three years).
• Conduct a comprehensive diagnostic assessment. Such diagnostics would reveal the current state of e-filing and help pinpoint, inter alia, the core reasons for the still low rate of e-filing (for example, is it the lack of legal requirements? Are there complex tax administration procedures? Is it absence of appropriate IT enabling instruments? Is it anxiety among taxpayers?). The specific course of actions can then be determined.
65 Issues in managing tax incentives are summarized and lessons learned are presented succinctly in IMF, OECD, and the World Bank: Options for Low Income Countries’ Effective and Efficient Use of Tax Incentives for Investment. A Report to the G-20 Development Working Group, October 2015.
77
• Plan and sequence mandatory e-filing. E-filing can only be done in proper sequencing with process reengineering (with particular focus on streamlining and simplifying the administration procedures for better compliance) and continued IT development (online capacities and necessary software and tools supporting the underlying tax administration functions, including e-filing). With the diagnostic assessments, the authorities would be able to bring about the targeted changes and modifications in the Tax Code as well as relevant tax legislation to establish the firm legal basis for e-filing obligations. Mandatory e-filing should be planned in phases: (1) apply e-filing to large taxpayers, starting with a specific tax type (naturally, the VAT); (2) ensure full mandatory compliance of large taxpayers; and (3) roll out mandatory e-filling to all taxpayers. Even within a VAT, a phased-in approach can also be followed. For example, in the UK, the e-filing for VAT was split into the pilot stage in 2010, and then rolled out in 2012.
• It is worth highlighting that e-filing cannot succeed with halfway reform measures. The rate of return on investment of e-filing is dependent on the critical mass. A study by McKinsey (2009) shows that the full benefits of e-filing can only be attained when the e-filing level is close to 100 percent. The Kyrgyz Republic has taken the necessary legal steps for e-filing with appropriate timing and sequencing. The recent requirement for mandatory e-filing imposed on registered VAT payers (and others involved in the import and/or export) began July 2018. Further amendments to the Tax Code envision making e-filing mandatory, effectively applied to all legal entities beginning January 2021, and to be rolled out to individual taxpayers in 2022.
ii. Improve the business process and further institutional development (time frame: three to four years with continued periodic review).
• Reengineer the business process. In addition to the need for extending the scope of e-filing, the State Tax Service (STS) may consider strengthening the other key functions of tax administration, specifically taxpayer registration, taxpayer service, auditing, arrears management, and tax appeal. Voluntary compliance management would rely on balancing effective enforcement measures (auditing, collection, and arrears management) with enhanced taxpayer service. Improving risk-based auditing and the application to the VAT refund audit would serve dual objectives: (1) to control fraudulent refund claims and thereby protect the revenue; and (2) to mitigate the negative impact on businesses’ cash flows and minimize cascading. On the other hand, the tax appeal function should be reviewed to ensure fairness. Fully and accurately detecting new taxpayers and effectively verifying the legitimacy of deregistration are the key foundations for building a reliable, consolidated taxpayer database. Reliability is one of the first conditions necessary for better tax accounting, auditing, collection, and arrears management.
• Enhance in-house capacity. As assessed in TADAT 2016, the STS will need to make extra efforts to build capacity. The areas that need the most attention within the next two years are (1) enhancing analytical capacity to support risk-based auditing; (2) forecasting revenues and estimating revenue forgone due to tax expenditures; and (3) measuring tax gaps. The latter cannot be considered lightly, as tax gaps are one of the major institutional weaknesses. Establishing this critical capacity requires careful human resources planning, including a retention policy to maintain capacity building. This will be especially important as the Kyrgyz Republic continues to provide multiple tax incentives and tax expenditure provisions, and then needs to account for the revenue loss by tax type, sector, and major taxpayer.
3.50 The IMF (2018) estimates that combined tax administration measures will generate the additional revenues in the order of 0.5–0.7 percent of GDP.66 In addition to the revenue gain,
66 IMF (2018). Kyrgyz Republic: Fourth and Fifth Reviews under the Three-Year Arrangements under the Extended Credit Facility, Staff Report. Report No. 18/53; and “Request for Modification of Performance Criteria,” press release.

78
reengineered tax administration functions will attribute to lowering both the administrative and compliance costs and better the equity in treatment of taxpayers.
79
State-Owned Enterprises: Governance and Fiscal Performance
Context
The Kyrgyz Republic’s state-owned enterprises (SOEs) play a crucial role in the country’s economic and social development through their contributions toward budget revenues. The large SOEs remain in strategic or economically important sectors of the Kyrgyz economy—energy, mining, transport, and banking—all with significant capital needs and large infrastructure requirements. SOEs can be a substantial source of budget revenue but are not operating at their optimal efficiency and profitability levels, raising concerns about their ability to generate dividends and tax, and increasing debts and expenses. While the amount of quasi-fiscal deficit of the energy SOEs seems to be manageable, at 0.8 percent of GDP, this number represents a worrying deficit based on the cash-based recovery model. Hence, the Kyrgyz energy sector cannot cover its cash-based expenses with no savings to invest in the new infrastructure or sustain other non-cash expenses. The energy SOEs’ debt is unsustainable, meaning that the state budget will eventually absorb their debt obligations. Presently these obligations are rolled over from year to year, only delaying the scheduled repayments. The risk of the energy SOEs’ not being able to repay their debts is relatively high. The energy sector is the primary source of fiscal risks and budgetary transfers. The energy SOEs cannot cover production costs due to low energy tariffs and suboptimal cost efficiency, which are unable to generate enough funds for infrastructure maintenance, much less expansion. The explicit subsidies to SOEs in the Kyrgyz Republic are paid from both republican and local budgets. The SOEs can only borrow funds via the Ministry of Finance (MoF), thus obtaining preferred credit terms from the international organizations while following strict fiscal risk monitoring by the MoF.
This chapter makes the following recommendations:
• Implement a comprehensive energy sector tariffs reform; full cost-recovery may be achieved over time.
• Strengthen corporate governance and introduce rigorous monitoring of SOEs’ financial reporting, key performance indicators (KPIs), and operational expenses to improve efficiency and reduce costs.
• Systematize the SOE relationship with the budget to calculate and compensate SOEs for their quasi-fiscal activities correctly.
• Bring energy SOE debt to a sustainable level. The existing SOE debt load is unmanageable and needs to be eased to render it financially viable.
• The uniform financial key performance indicators (KPIs) introduced by the State Property Management Fund (SPMF) should apply to all SOEs regardless of which agency exercises the shareholder’s rights on behalf of the state.
• Expand the scope of the existing fiscal risks (SFR) statement by including reporting on fiscal risks from SOEs.
• Undertake a full-scale reclassification exercise of the state enterprise (SEs) to strengthen reporting and disclosure requirements. The correct classification of SEs to an appropriate institutional sector, using the Government Financial Statistics Manual 2014 (GFSM 2014) criteria for a public corporation, will substantially impact their corporate governance, reporting, and accounting procedures.
Introduction
4.1 The chapter is organized as follows: The next section, Section C, presents an overview of the SOE landscape in the Kyrgyz Republic and describes the state ownership function. Section D examines the quasi-fiscal deficit and the fiscal risks stemming from SOEs. The key features of the legislative and institutional framework are outlined in Section E, and Section F offers recommendations.
Overview of State Ownership and the SOE Landscape in the Kyrgyz Republic
4.2 From the 1990s through the early 2000s, the Kyrgyz Republic privatized many of its state-owned entities, significantly reducing the State footprint in the economy. Presently the biggest SOEs
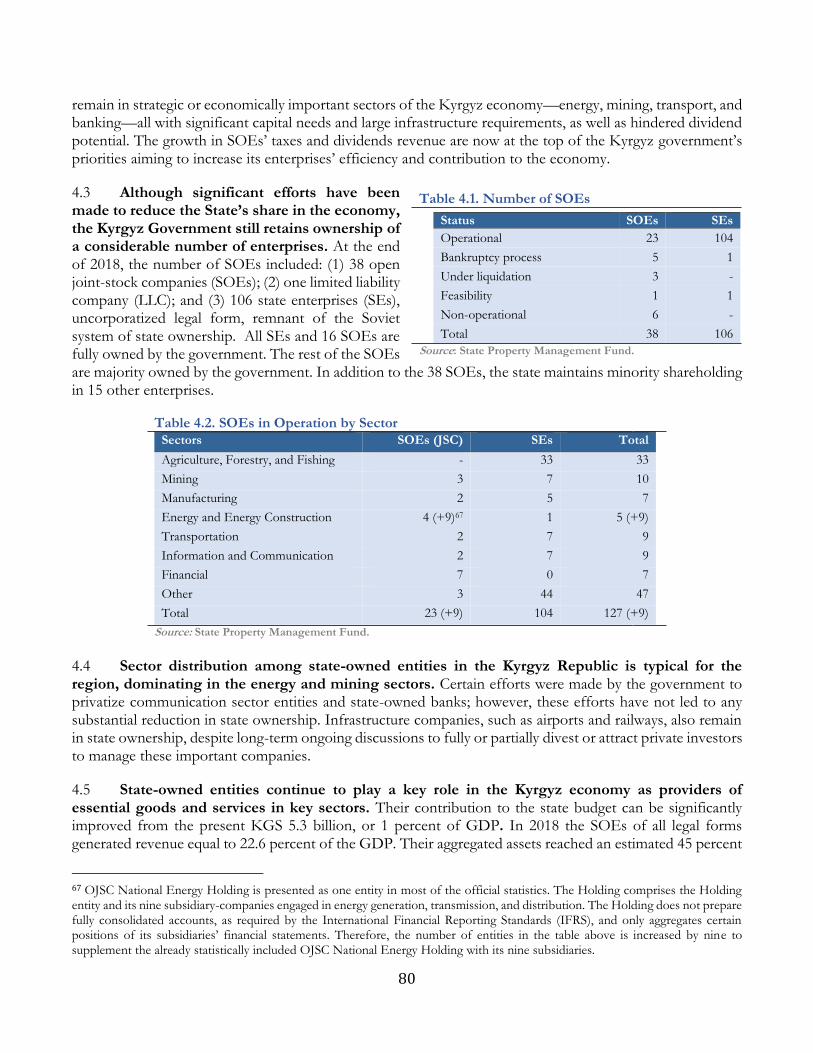
80
remain in strategic or economically important sectors of the Kyrgyz economy—energy, mining, transport, and banking—all with significant capital needs and large infrastructure requirements, as well as hindered dividend potential. The growth in SOEs’ taxes and dividends revenue are now at the top of the Kyrgyz government’s priorities aiming to increase its enterprises’ efficiency and contribution to the economy.
4.3 Although significant efforts have been made to reduce the State’s share in the economy, the Kyrgyz Government still retains ownership of a considerable number of enterprises. At the end of 2018, the number of SOEs included: (1) 38 open joint-stock companies (SOEs); (2) one limited liability company (LLC); and (3) 106 state enterprises (SEs), uncorporatized legal form, remnant of the Soviet system of state ownership. All SEs and 16 SOEs are fully owned by the government. The rest of the SOEs are majority owned by the government. In addition to the 38 SOEs, the state maintains minority shareholding in 15 other enterprises.
Table 4.2. SOEs in Operation by Sector Sectors SOEs (JSC) SEs Total
Agriculture, Forestry, and Fishing - 33 33
Mining 3 7 10
Manufacturing 2 5 7
Energy and Energy Construction 4 (+9)67 1 5 (+9)
Transportation 2 7 9
Information and Communication 2 7 9
Financial 7 0 7
Other 3 44 47
Total 23 (+9) 104 127 (+9)
Source: State Property Management Fund.
4.4 Sector distribution among state-owned entities in the Kyrgyz Republic is typical for the region, dominating in the energy and mining sectors. Certain efforts were made by the government to privatize communication sector entities and state-owned banks; however, these efforts have not led to any substantial reduction in state ownership. Infrastructure companies, such as airports and railways, also remain in state ownership, despite long-term ongoing discussions to fully or partially divest or attract private investors to manage these important companies.
4.5 State-owned entities continue to play a key role in the Kyrgyz economy as providers of essential goods and services in key sectors. Their contribution to the state budget can be significantly improved from the present KGS 5.3 billion, or 1 percent of GDP. In 2018 the SOEs of all legal forms generated revenue equal to 22.6 percent of the GDP. Their aggregated assets reached an estimated 45 percent
67 OJSC National Energy Holding is presented as one entity in most of the official statistics. The Holding comprises the Holding entity and its nine subsidiary-companies engaged in energy generation, transmission, and distribution. The Holding does not prepare fully consolidated accounts, as required by the International Financial Reporting Standards (IFRS), and only aggregates certain positions of its subsidiaries’ financial statements. Therefore, the number of entities in the table above is increased by nine to supplement the already statistically included OJSC National Energy Holding with its nine subsidiaries.
Table 4.1. Number of SOEs
Status SOEs SEs
Operational 23 104
Bankruptcy process 5 1
Under liquidation 3 -
Feasibility 1 1
Non-operational 6 -
Total 38 106
Source: State Property Management Fund.
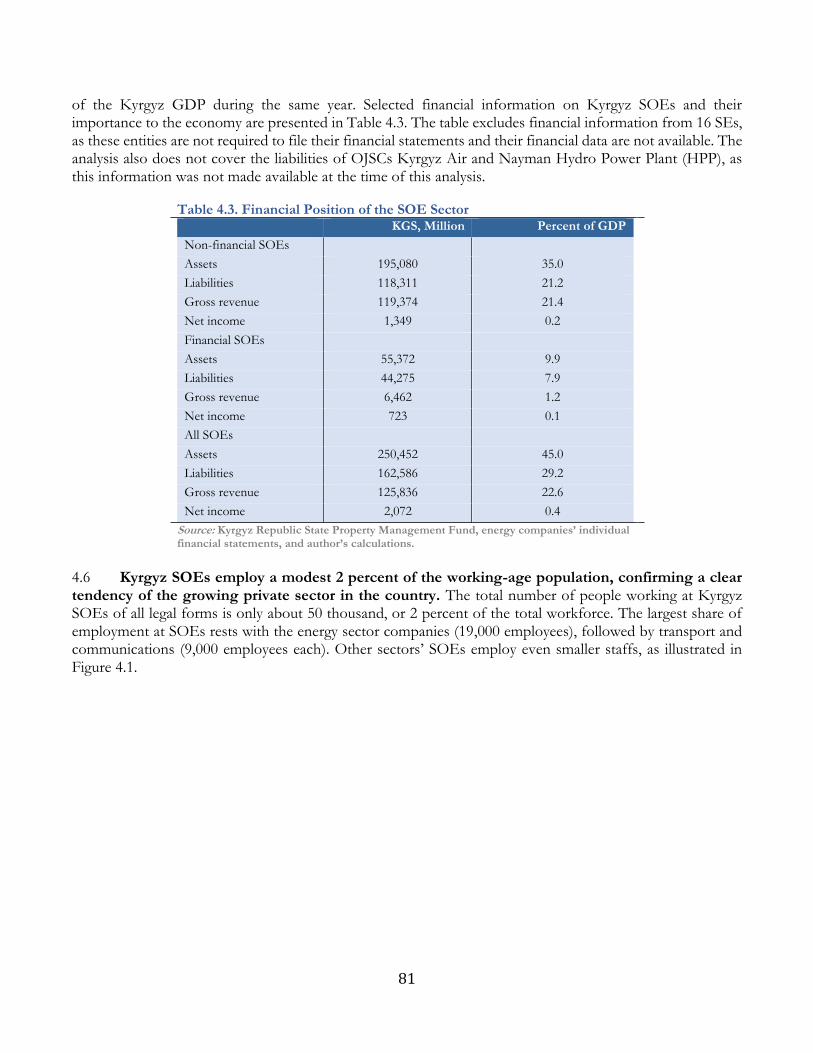
81
of the Kyrgyz GDP during the same year. Selected financial information on Kyrgyz SOEs and their importance to the economy are presented in Table 4.3. The table excludes financial information from 16 SEs, as these entities are not required to file their financial statements and their financial data are not available. The analysis also does not cover the liabilities of OJSCs Kyrgyz Air and Nayman Hydro Power Plant (HPP), as this information was not made available at the time of this analysis.
Table 4.3. Financial Position of the SOE Sector KGS, Million Percent of GDP
Non-financial SOEs
Assets 195,080 35.0
Liabilities 118,311 21.2
Gross revenue 119,374 21.4
Net income 1,349 0.2
Financial SOEs
Assets 55,372 9.9
Liabilities 44,275 7.9
Gross revenue 6,462 1.2
Net income 723 0.1
All SOEs
Assets 250,452 45.0
Liabilities 162,586 29.2
Gross revenue 125,836 22.6
Net income 2,072 0.4
Source: Kyrgyz Republic State Property Management Fund, energy companies’ individual financial statements, and author’s calculations.
4.6 Kyrgyz SOEs employ a modest 2 percent of the working-age population, confirming a clear tendency of the growing private sector in the country. The total number of people working at Kyrgyz SOEs of all legal forms is only about 50 thousand, or 2 percent of the total workforce. The largest share of employment at SOEs rests with the energy sector companies (19,000 employees), followed by transport and communications (9,000 employees each). Other sectors’ SOEs employ even smaller staffs, as illustrated in Figure 4.1.
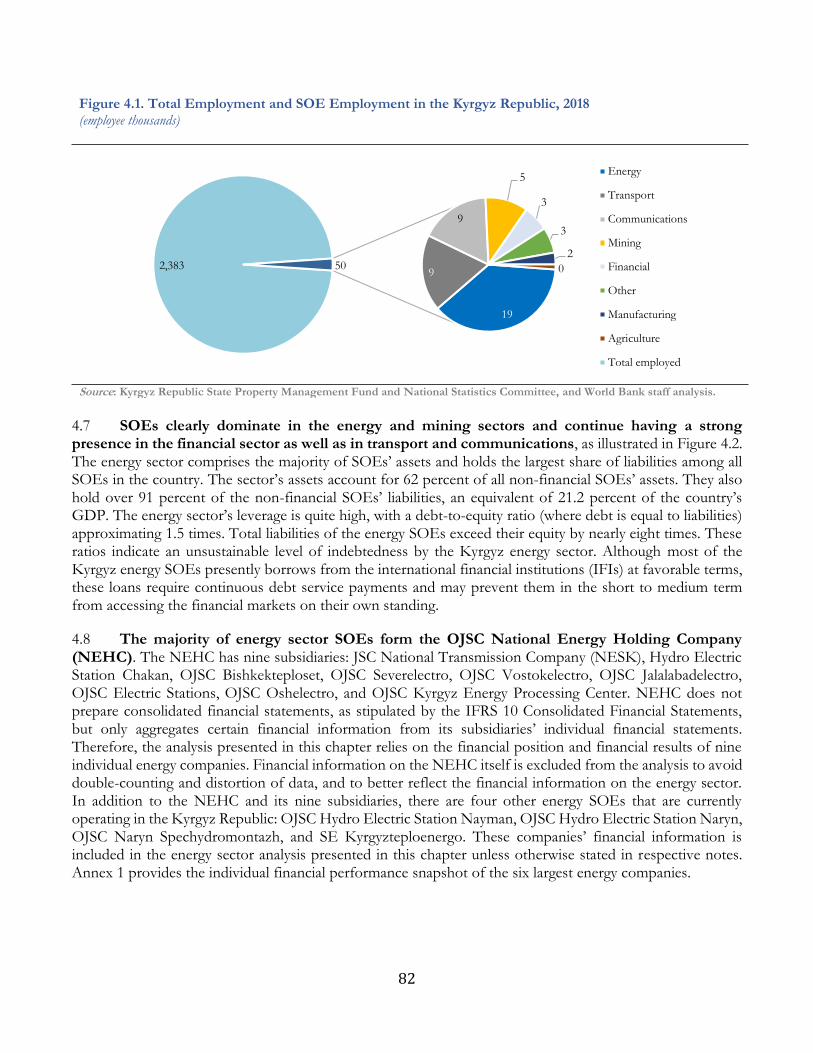
82
Figure 4.1. Total Employment and SOE Employment in the Kyrgyz Republic, 2018 (employee thousands)
Source: Kyrgyz Republic State Property Management Fund and National Statistics Committee, and World Bank staff analysis.
4.7 SOEs clearly dominate in the energy and mining sectors and continue having a strong presence in the financial sector as well as in transport and communications, as illustrated in Figure 4.2. The energy sector comprises the majority of SOEs’ assets and holds the largest share of liabilities among all SOEs in the country. The sector’s assets account for 62 percent of all non-financial SOEs’ assets. They also hold over 91 percent of the non-financial SOEs’ liabilities, an equivalent of 21.2 percent of the country’s GDP. The energy sector’s leverage is quite high, with a debt-to-equity ratio (where debt is equal to liabilities) approximating 1.5 times. Total liabilities of the energy SOEs exceed their equity by nearly eight times. These ratios indicate an unsustainable level of indebtedness by the Kyrgyz energy sector. Although most of the Kyrgyz energy SOEs presently borrows from the international financial institutions (IFIs) at favorable terms, these loans require continuous debt service payments and may prevent them in the short to medium term from accessing the financial markets on their own standing.
4.8 The majority of energy sector SOEs form the OJSC National Energy Holding Company (NEHC). The NEHC has nine subsidiaries: JSC National Transmission Company (NESK), Hydro Electric Station Chakan, OJSC Bishkekteploset, OJSC Severelectro, OJSC Vostokelectro, OJSC Jalalabadelectro, OJSC Electric Stations, OJSC Oshelectro, and OJSC Kyrgyz Energy Processing Center. NEHC does not prepare consolidated financial statements, as stipulated by the IFRS 10 Consolidated Financial Statements, but only aggregates certain financial information from its subsidiaries’ individual financial statements. Therefore, the analysis presented in this chapter relies on the financial position and financial results of nine individual energy companies. Financial information on the NEHC itself is excluded from the analysis to avoid double-counting and distortion of data, and to better reflect the financial information on the energy sector. In addition to the NEHC and its nine subsidiaries, there are four other energy SOEs that are currently operating in the Kyrgyz Republic: OJSC Hydro Electric Station Nayman, OJSC Hydro Electric Station Naryn, OJSC Naryn Spechydromontazh, and SE Kyrgyzteploenergo. These companies’ financial information is included in the energy sector analysis presented in this chapter unless otherwise stated in respective notes. Annex 1 provides the individual financial performance snapshot of the six largest energy companies.
19
9
9
5
3
3
2
02,383 50
Energy
Transport
Communications
Mining
Financial
Other
Manufacturing
Agriculture
Total employed
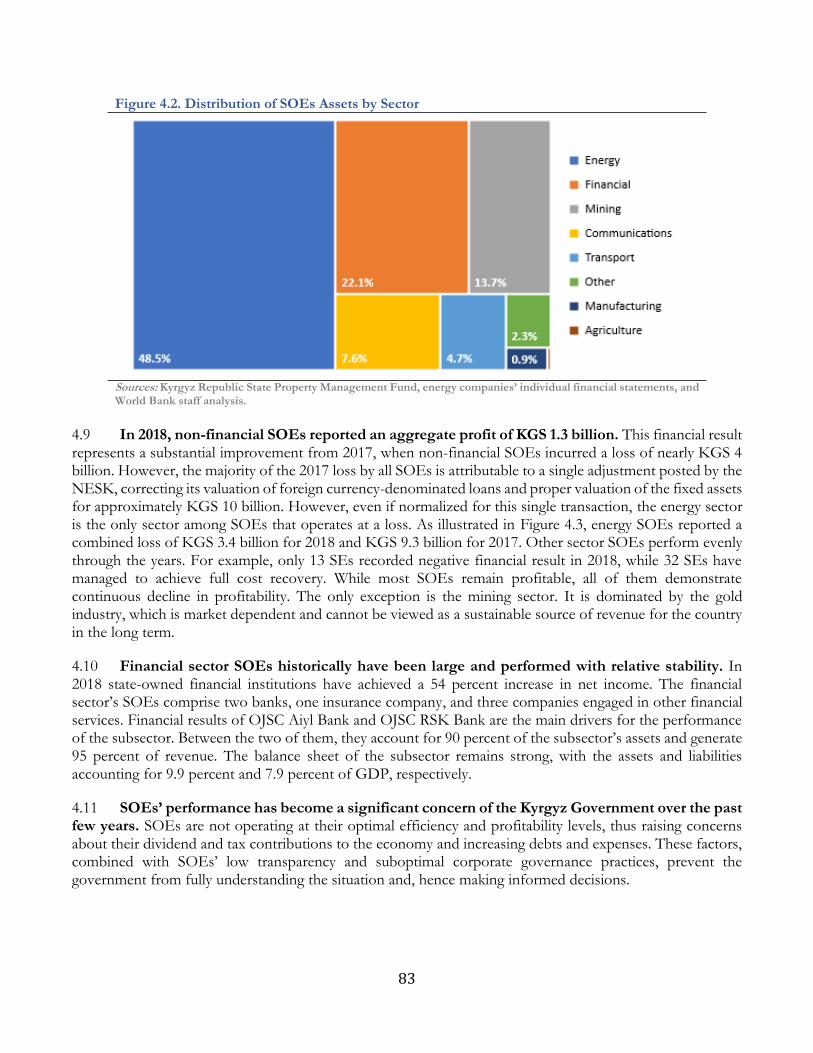
83
Figure 4.2. Distribution of SOEs Assets by Sector
Sources: Kyrgyz Republic State Property Management Fund, energy companies’ individual financial statements, and World Bank staff analysis.
4.9 In 2018, non-financial SOEs reported an aggregate profit of KGS 1.3 billion. This financial result represents a substantial improvement from 2017, when non-financial SOEs incurred a loss of nearly KGS 4 billion. However, the majority of the 2017 loss by all SOEs is attributable to a single adjustment posted by the NESK, correcting its valuation of foreign currency-denominated loans and proper valuation of the fixed assets for approximately KGS 10 billion. However, even if normalized for this single transaction, the energy sector is the only sector among SOEs that operates at a loss. As illustrated in Figure 4.3, energy SOEs reported a combined loss of KGS 3.4 billion for 2018 and KGS 9.3 billion for 2017. Other sector SOEs perform evenly through the years. For example, only 13 SEs recorded negative financial result in 2018, while 32 SEs have managed to achieve full cost recovery. While most SOEs remain profitable, all of them demonstrate continuous decline in profitability. The only exception is the mining sector. It is dominated by the gold industry, which is market dependent and cannot be viewed as a sustainable source of revenue for the country in the long term.
4.10 Financial sector SOEs historically have been large and performed with relative stability. In 2018 state-owned financial institutions have achieved a 54 percent increase in net income. The financial sector’s SOEs comprise two banks, one insurance company, and three companies engaged in other financial services. Financial results of OJSC Aiyl Bank and OJSC RSK Bank are the main drivers for the performance of the subsector. Between the two of them, they account for 90 percent of the subsector’s assets and generate 95 percent of revenue. The balance sheet of the subsector remains strong, with the assets and liabilities accounting for 9.9 percent and 7.9 percent of GDP, respectively.
4.11 SOEs’ performance has become a significant concern of the Kyrgyz Government over the past few years. SOEs are not operating at their optimal efficiency and profitability levels, thus raising concerns about their dividend and tax contributions to the economy and increasing debts and expenses. These factors, combined with SOEs’ low transparency and suboptimal corporate governance practices, prevent the government from fully understanding the situation and, hence making informed decisions.
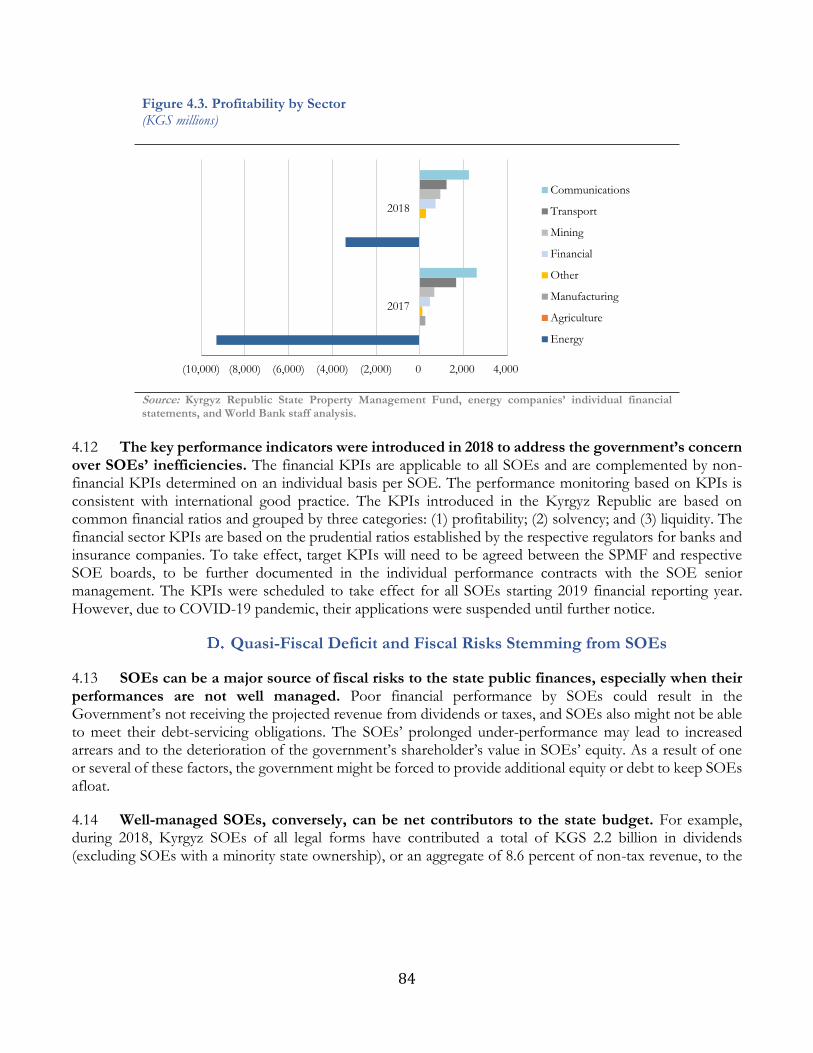
84
Figure 4.3. Profitability by Sector (KGS millions)
Source: Kyrgyz Republic State Property Management Fund, energy companies’ individual financial statements, and World Bank staff analysis.
4.12 The key performance indicators were introduced in 2018 to address the government’s concern over SOEs’ inefficiencies. The financial KPIs are applicable to all SOEs and are complemented by non-financial KPIs determined on an individual basis per SOE. The performance monitoring based on KPIs is consistent with international good practice. The KPIs introduced in the Kyrgyz Republic are based on common financial ratios and grouped by three categories: (1) profitability; (2) solvency; and (3) liquidity. The financial sector KPIs are based on the prudential ratios established by the respective regulators for banks and insurance companies. To take effect, target KPIs will need to be agreed between the SPMF and respective SOE boards, to be further documented in the individual performance contracts with the SOE senior management. The KPIs were scheduled to take effect for all SOEs starting 2019 financial reporting year. However, due to COVID-19 pandemic, their applications were suspended until further notice.
Quasi-Fiscal Deficit and Fiscal Risks Stemming from SOEs
4.13 SOEs can be a major source of fiscal risks to the state public finances, especially when their performances are not well managed. Poor financial performance by SOEs could result in the Government’s not receiving the projected revenue from dividends or taxes, and SOEs also might not be able to meet their debt-servicing obligations. The SOEs’ prolonged under-performance may lead to increased arrears and to the deterioration of the government’s shareholder’s value in SOEs’ equity. As a result of one or several of these factors, the government might be forced to provide additional equity or debt to keep SOEs afloat.
4.14 Well-managed SOEs, conversely, can be net contributors to the state budget. For example, during 2018, Kyrgyz SOEs of all legal forms have contributed a total of KGS 2.2 billion in dividends (excluding SOEs with a minority state ownership), or an aggregate of 8.6 percent of non-tax revenue, to the
(10,000) (8,000) (6,000) (4,000) (2,000) 0 2,000 4,000
2017
2018
Communications
Transport
Mining
Financial
Other
Manufacturing
Agriculture
Energy
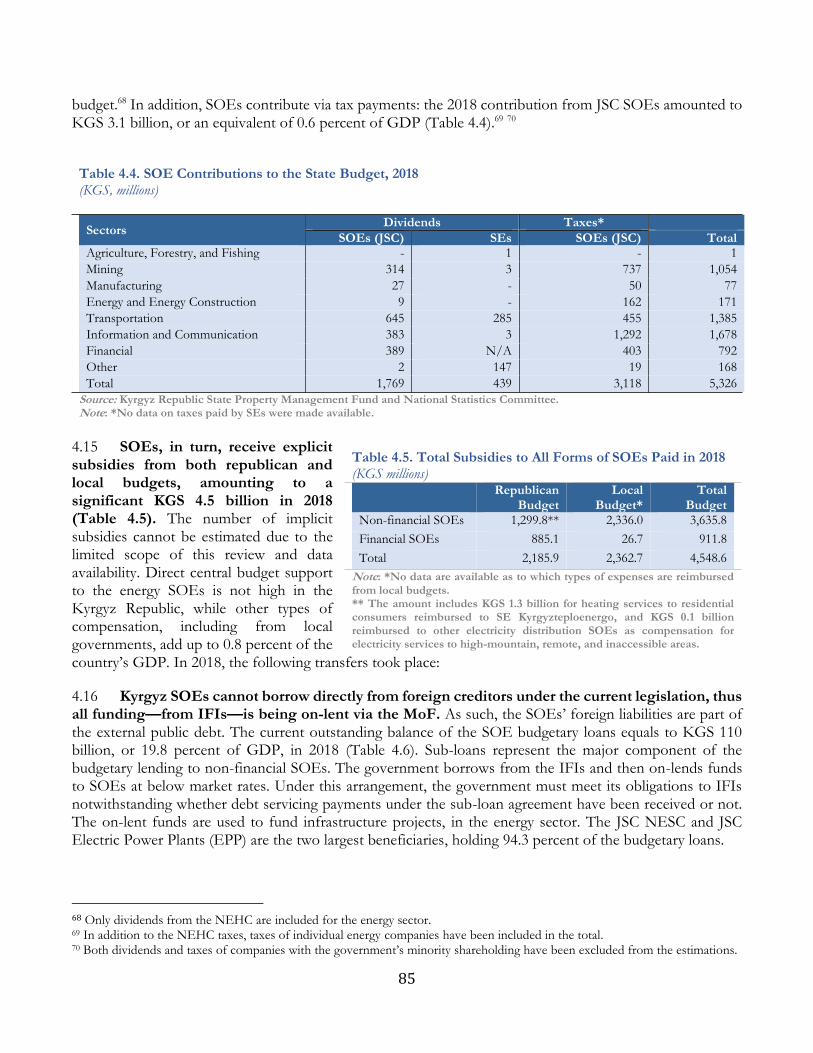
85
budget.68 In addition, SOEs contribute via tax payments: the 2018 contribution from JSC SOEs amounted to KGS 3.1 billion, or an equivalent of 0.6 percent of GDP (Table 4.4).69 70
Table 4.4. SOE Contributions to the State Budget, 2018 (KGS, millions)
Sectors Dividends Taxes*
SOEs (JSC) SEs SOEs (JSC) Total Agriculture, Forestry, and Fishing - 1 - 1
Mining 314 3 737 1,054
Manufacturing 27 - 50 77
Energy and Energy Construction 9 - 162 171
Transportation 645 285 455 1,385
Information and Communication 383 3 1,292 1,678
Financial 389 N/A 403 792
Other 2 147 19 168
Total 1,769 439 3,118 5,326
Source: Kyrgyz Republic State Property Management Fund and National Statistics Committee. Note: *No data on taxes paid by SEs were made available.
4.15 SOEs, in turn, receive explicit subsidies from both republican and local budgets, amounting to a significant KGS 4.5 billion in 2018 (Table 4.5). The number of implicit subsidies cannot be estimated due to the limited scope of this review and data availability. Direct central budget support to the energy SOEs is not high in the Kyrgyz Republic, while other types of compensation, including from local governments, add up to 0.8 percent of the country’s GDP. In 2018, the following transfers took place:
4.16 Kyrgyz SOEs cannot borrow directly from foreign creditors under the current legislation, thus all funding—from IFIs—is being on-lent via the MoF. As such, the SOEs’ foreign liabilities are part of the external public debt. The current outstanding balance of the SOE budgetary loans equals to KGS 110 billion, or 19.8 percent of GDP, in 2018 (Table 4.6). Sub-loans represent the major component of the budgetary lending to non-financial SOEs. The government borrows from the IFIs and then on-lends funds to SOEs at below market rates. Under this arrangement, the government must meet its obligations to IFIs notwithstanding whether debt servicing payments under the sub-loan agreement have been received or not. The on-lent funds are used to fund infrastructure projects, in the energy sector. The JSC NESC and JSC Electric Power Plants (EPP) are the two largest beneficiaries, holding 94.3 percent of the budgetary loans.
68 Only dividends from the NEHC are included for the energy sector. 69 In addition to the NEHC taxes, taxes of individual energy companies have been included in the total. 70 Both dividends and taxes of companies with the government’s minority shareholding have been excluded from the estimations.
Table 4.5. Total Subsidies to All Forms of SOEs Paid in 2018 (KGS millions)
Republican Budget
Local Budget*
Total Budget
Non-financial SOEs 1,299.8** 2,336.0 3,635.8
Financial SOEs 885.1 26.7 911.8
Total 2,185.9 2,362.7 4,548.6
Note: *No data are available as to which types of expenses are reimbursed from local budgets. ** The amount includes KGS 1.3 billion for heating services to residential consumers reimbursed to SE Kyrgyzteploenergo, and KGS 0.1 billion reimbursed to other electricity distribution SOEs as compensation for electricity services to high-mountain, remote, and inaccessible areas.
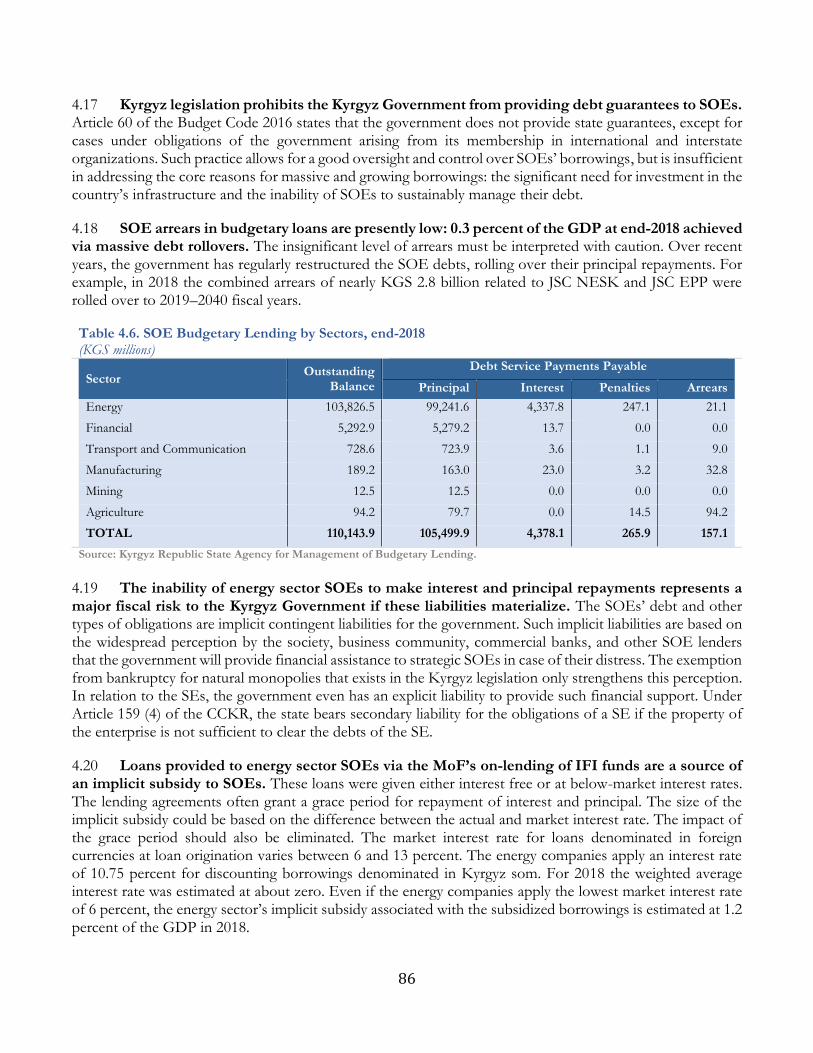
86
4.17 Kyrgyz legislation prohibits the Kyrgyz Government from providing debt guarantees to SOEs. Article 60 of the Budget Code 2016 states that the government does not provide state guarantees, except for cases under obligations of the government arising from its membership in international and interstate organizations. Such practice allows for a good oversight and control over SOEs’ borrowings, but is insufficient in addressing the core reasons for massive and growing borrowings: the significant need for investment in the country’s infrastructure and the inability of SOEs to sustainably manage their debt.
4.18 SOE arrears in budgetary loans are presently low: 0.3 percent of the GDP at end-2018 achieved via massive debt rollovers. The insignificant level of arrears must be interpreted with caution. Over recent years, the government has regularly restructured the SOE debts, rolling over their principal repayments. For example, in 2018 the combined arrears of nearly KGS 2.8 billion related to JSC NESK and JSC EPP were rolled over to 2019–2040 fiscal years.
Table 4.6. SOE Budgetary Lending by Sectors, end-2018 (KGS millions)
Sector Outstanding
Balance
Debt Service Payments Payable
Principal Interest Penalties Arrears
Energy 103,826.5 99,241.6 4,337.8 247.1 21.1
Financial 5,292.9 5,279.2 13.7 0.0 0.0
Transport and Communication 728.6 723.9 3.6 1.1 9.0
Manufacturing 189.2 163.0 23.0 3.2 32.8
Mining 12.5 12.5 0.0 0.0 0.0
Agriculture 94.2 79.7 0.0 14.5 94.2
TOTAL 110,143.9 105,499.9 4,378.1 265.9 157.1
Source: Kyrgyz Republic State Agency for Management of Budgetary Lending.
4.19 The inability of energy sector SOEs to make interest and principal repayments represents a major fiscal risk to the Kyrgyz Government if these liabilities materialize. The SOEs’ debt and other types of obligations are implicit contingent liabilities for the government. Such implicit liabilities are based on the widespread perception by the society, business community, commercial banks, and other SOE lenders that the government will provide financial assistance to strategic SOEs in case of their distress. The exemption from bankruptcy for natural monopolies that exists in the Kyrgyz legislation only strengthens this perception. In relation to the SEs, the government even has an explicit liability to provide such financial support. Under Article 159 (4) of the CCKR, the state bears secondary liability for the obligations of a SE if the property of the enterprise is not sufficient to clear the debts of the SE.
4.20 Loans provided to energy sector SOEs via the MoF’s on-lending of IFI funds are a source of an implicit subsidy to SOEs. These loans were given either interest free or at below-market interest rates. The lending agreements often grant a grace period for repayment of interest and principal. The size of the implicit subsidy could be based on the difference between the actual and market interest rate. The impact of the grace period should also be eliminated. The market interest rate for loans denominated in foreign currencies at loan origination varies between 6 and 13 percent. The energy companies apply an interest rate of 10.75 percent for discounting borrowings denominated in Kyrgyz som. For 2018 the weighted average interest rate was estimated at about zero. Even if the energy companies apply the lowest market interest rate of 6 percent, the energy sector’s implicit subsidy associated with the subsidized borrowings is estimated at 1.2 percent of the GDP in 2018.
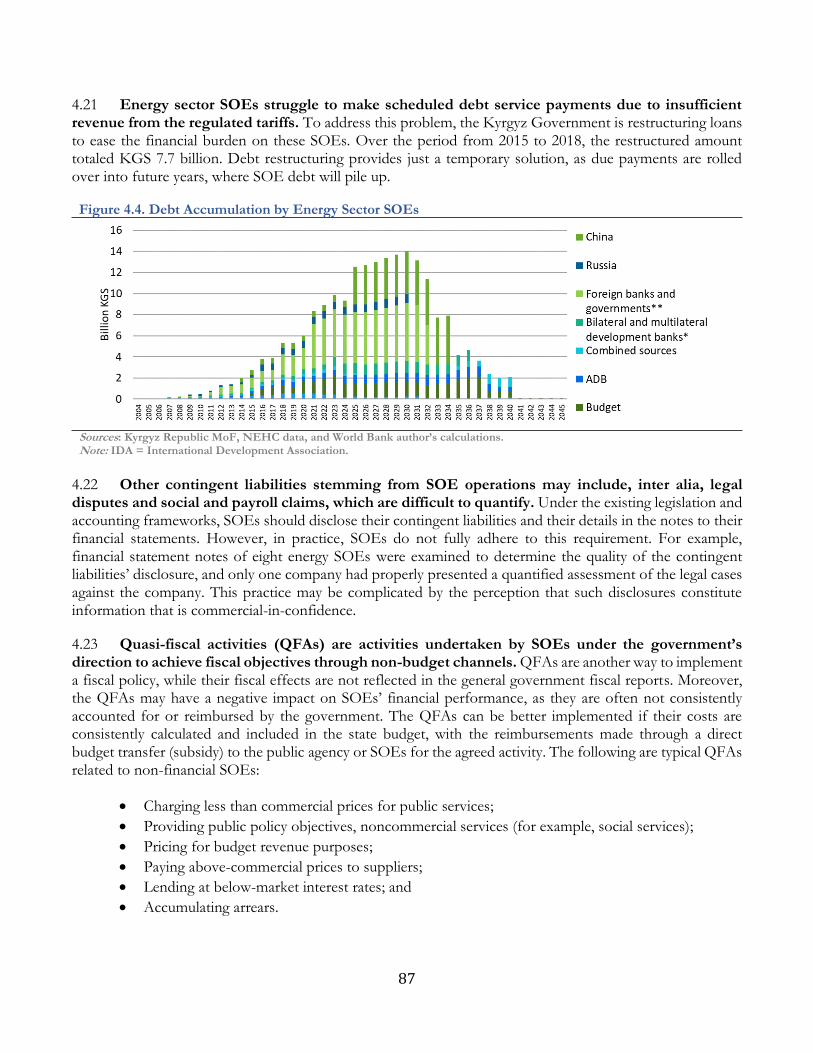
87
4.21 Energy sector SOEs struggle to make scheduled debt service payments due to insufficient revenue from the regulated tariffs. To address this problem, the Kyrgyz Government is restructuring loans to ease the financial burden on these SOEs. Over the period from 2015 to 2018, the restructured amount totaled KGS 7.7 billion. Debt restructuring provides just a temporary solution, as due payments are rolled over into future years, where SOE debt will pile up.
Figure 4.4. Debt Accumulation by Energy Sector SOEs
Sources: Kyrgyz Republic MoF, NEHC data, and World Bank author’s calculations. Note: IDA = International Development Association.
4.22 Other contingent liabilities stemming from SOE operations may include, inter alia, legal disputes and social and payroll claims, which are difficult to quantify. Under the existing legislation and accounting frameworks, SOEs should disclose their contingent liabilities and their details in the notes to their financial statements. However, in practice, SOEs do not fully adhere to this requirement. For example, financial statement notes of eight energy SOEs were examined to determine the quality of the contingent liabilities’ disclosure, and only one company had properly presented a quantified assessment of the legal cases against the company. This practice may be complicated by the perception that such disclosures constitute information that is commercial-in-confidence.
4.23 Quasi-fiscal activities (QFAs) are activities undertaken by SOEs under the government’s direction to achieve fiscal objectives through non-budget channels. QFAs are another way to implement a fiscal policy, while their fiscal effects are not reflected in the general government fiscal reports. Moreover, the QFAs may have a negative impact on SOEs’ financial performance, as they are often not consistently accounted for or reimbursed by the government. The QFAs can be better implemented if their costs are consistently calculated and included in the state budget, with the reimbursements made through a direct budget transfer (subsidy) to the public agency or SOEs for the agreed activity. The following are typical QFAs related to non-financial SOEs:
• Charging less than commercial prices for public services;
• Providing public policy objectives, noncommercial services (for example, social services);
• Pricing for budget revenue purposes;
• Paying above-commercial prices to suppliers;
• Lending at below-market interest rates; and
• Accumulating arrears.
88
4.24 The most common type of QFA in the Kyrgyz Republic is a loss-making operation in an energy sector SOE, resulting from regulated tariffs that do not cover cost of service or operating expenses (OPEX). The cost of service for a supply of electricity has various definitions, depending on the size and development stage of an economy. For the purposes of this analysis, the following classifications were used:
4.25 Presently electricity SOEs in the Kyrgyz Republic are operating below their cash recovery rate. This implies that tariffs are based on cost recovery for OPEX in cash-only form, including: (1) cost of energy purchased; (2) operating materials, that is, inventory and fuel; (3) payroll and related taxes; (4) financing costs; (5) repairs and maintenance; and (6) other cash expenses necessary to sustain interrupted service.
4.26 It is important to note that existing tariff methodology does not cover depreciation of the existing fixed assets and infrastructure that are considered an integral part of OPEX. Therefore, accrual-based financial information was adjusted to reflect cash expenses of the electricity SOEs. The following non-cash categories are excluded from the following calculation: (1) depreciation and amortization; (2) foreign exchange losses; (3) provision for doubtful debts; and (4) other accruals and expenses unrelated to production of electricity that were ruled out from the cost of service. Under normal circumstances, such expense categories should be included in the cost-recovery model of Level 1, as indicated in Table 4.7.
Table 4.7. The “Ladder” of Financial Viability in Utility Sector
Current electricity tariff based on cash-
recovery model already
generates quasi-fiscal deficit of 0.8% of GDP.
Level of Financial Viability Comment
Level 1: Utility does not cover existing OPEX. Financially unviable, loss-making utility
Level 2: Utility covers at least existing OPEX. Utility dependent on government for capital investments
Level 3: Utility covers existing OPEX plus concessional financing costs on existing assets.
Utility dependent on access to concessional financing
Level 4: Utility covers existing OPEX and full capital expenditures (CAPEX) for existing assets.
CAPEX based on new replacement value of assets
Level 5: Utility covers efficient OPEX and full CAPEX on existing and future assets.
Future assets based on a least-cost expansion plan
Level 6: Utility covers efficient OPEX and full CAPEX on existing and future assets plus environmental externalities.
Definition of financial viability that may be used in high-income economies
Source: World Bank (2017), Cost Recovery and Financial Viability of the Power Sector in Developing Countries.
4.27 Considering the limitations on the use of the cash recovery method, the Kyrgyz Republic energy sector’s quasi-fiscal deficit from the sale of electricity in the domestic market is estimated at 0.8 percent of the GDP. The deficit has been assessed using the “end-product” approach71 and calculated as the sum of losses resulting from the following three components: (1) less than cost recovery tariffs; (2) under-collection of revenue; and (3) excessive technical losses. The loss from the under-recovery of costs has been determined as the difference between the actual revenue from end-users in the domestic market and revenue at cost-recovery tariff for the same volume of electricity consumption. The under-collection of revenues has been estimated by adjusting revenue of the distribution companies for collection rate and weighted by theoretical revenue. The collection rate has been approximated as a ratio of revenue to the sum of revenue and accounts receivable. The excessive technical losses have been measured as the difference between the
71 Camos, D., A. Estache, and M.M. Hamid, 2016. “Quasi-Fiscal Deficits in the Electricity Sector of the Middle East and North Africa Sources and Sizes,” World Bank Policy Research Working Paper 8280. Washington, DC: World Bank.
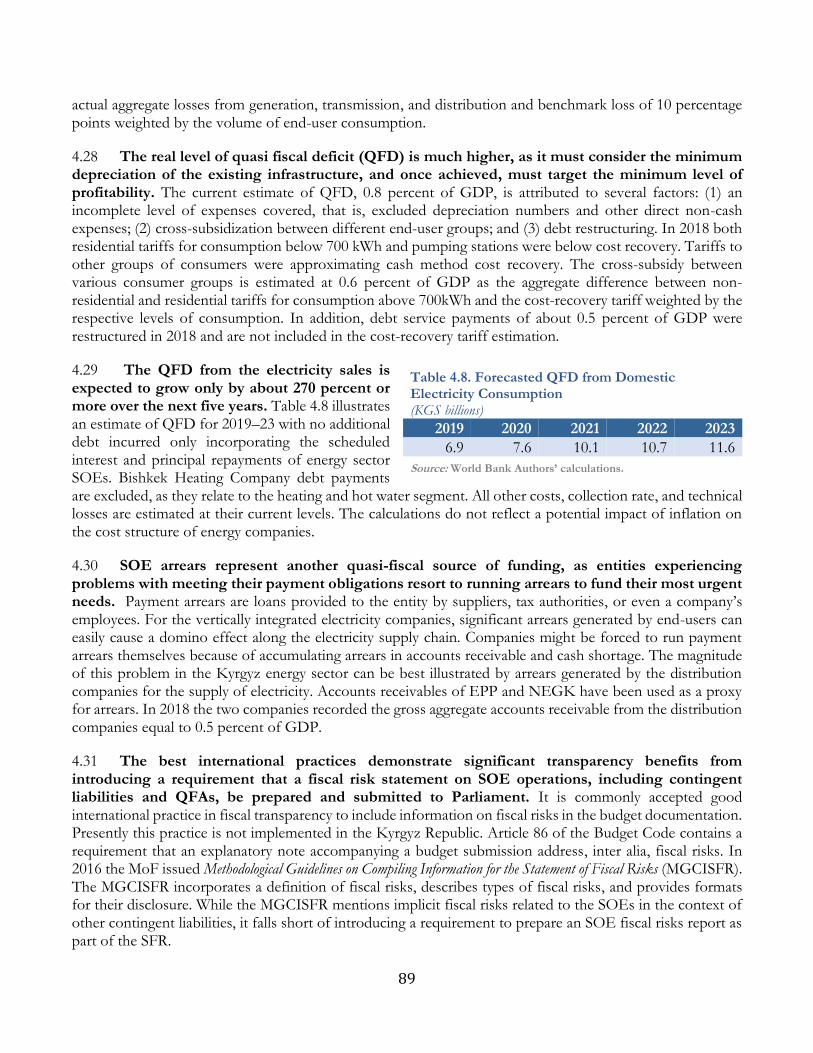
89
actual aggregate losses from generation, transmission, and distribution and benchmark loss of 10 percentage points weighted by the volume of end-user consumption.
4.28 The real level of quasi fiscal deficit (QFD) is much higher, as it must consider the minimum depreciation of the existing infrastructure, and once achieved, must target the minimum level of profitability. The current estimate of QFD, 0.8 percent of GDP, is attributed to several factors: (1) an incomplete level of expenses covered, that is, excluded depreciation numbers and other direct non-cash expenses; (2) cross-subsidization between different end-user groups; and (3) debt restructuring. In 2018 both residential tariffs for consumption below 700 kWh and pumping stations were below cost recovery. Tariffs to other groups of consumers were approximating cash method cost recovery. The cross-subsidy between various consumer groups is estimated at 0.6 percent of GDP as the aggregate difference between non-residential and residential tariffs for consumption above 700kWh and the cost-recovery tariff weighted by the respective levels of consumption. In addition, debt service payments of about 0.5 percent of GDP were restructured in 2018 and are not included in the cost-recovery tariff estimation.
4.29 The QFD from the electricity sales is expected to grow only by about 270 percent or more over the next five years. Table 4.8 illustrates an estimate of QFD for 2019–23 with no additional debt incurred only incorporating the scheduled interest and principal repayments of energy sector SOEs. Bishkek Heating Company debt payments are excluded, as they relate to the heating and hot water segment. All other costs, collection rate, and technical losses are estimated at their current levels. The calculations do not reflect a potential impact of inflation on the cost structure of energy companies.
4.30 SOE arrears represent another quasi-fiscal source of funding, as entities experiencing problems with meeting their payment obligations resort to running arrears to fund their most urgent needs. Payment arrears are loans provided to the entity by suppliers, tax authorities, or even a company’s employees. For the vertically integrated electricity companies, significant arrears generated by end-users can easily cause a domino effect along the electricity supply chain. Companies might be forced to run payment arrears themselves because of accumulating arrears in accounts receivable and cash shortage. The magnitude of this problem in the Kyrgyz energy sector can be best illustrated by arrears generated by the distribution companies for the supply of electricity. Accounts receivables of EPP and NEGK have been used as a proxy for arrears. In 2018 the two companies recorded the gross aggregate accounts receivable from the distribution companies equal to 0.5 percent of GDP.
4.31 The best international practices demonstrate significant transparency benefits from introducing a requirement that a fiscal risk statement on SOE operations, including contingent liabilities and QFAs, be prepared and submitted to Parliament. It is commonly accepted good international practice in fiscal transparency to include information on fiscal risks in the budget documentation. Presently this practice is not implemented in the Kyrgyz Republic. Article 86 of the Budget Code contains a requirement that an explanatory note accompanying a budget submission address, inter alia, fiscal risks. In 2016 the MoF issued Methodological Guidelines on Compiling Information for the Statement of Fiscal Risks (MGCISFR). The MGCISFR incorporates a definition of fiscal risks, describes types of fiscal risks, and provides formats for their disclosure. While the MGCISFR mentions implicit fiscal risks related to the SOEs in the context of other contingent liabilities, it falls short of introducing a requirement to prepare an SOE fiscal risks report as part of the SFR.
Table 4.8. Forecasted QFD from Domestic Electricity Consumption (KGS billions)
2019 2020 2021 2022 2023
6.9 7.6 10.1 10.7 11.6
Source: World Bank Authors’ calculations.
90
Key Features of the Legislative and Institutional Framework
4.32 The Kyrgyz legislation for SOE ownership, oversight, and operations is fragmented and regulated by numerous legal acts, regulations, and resolutions, sometimes conflicting with each other. SOEs are currently regulated by different legal acts from various branches of law (civil, labor, land, tax, administrative, and so on). The primary laws governing SOEs include: the Constitution (2010), the Constitutional Law on Government of the Kyrgyz Republic, the Civil Code of the Kyrgyz Republic 1996, the Law on Joint Stock Companies 2003, the Law Business Partnerships and Companies 1996, and the Law on Bankruptcy 1997. Further, the Law on the National Bank of Kyrgyz Republic, Banks and Banking Activities and the Law on Organization of Insurance in Kyrgyz Republic 1998 apply to the relevant financial sector SOEs. In addition to these SOE-related laws, there are numerous normative acts of secondary legislation (resolutions of the President of the Kyrgyz Republic, regulations of the Government of the Kyrgyz Republic, internal acts of ministries and agencies), which regulate specific issues related to SOE establishment and operation.
4.33 The Kyrgyz legislation enables SOEs to be established in a variety of legal forms. The legislation does not define in what cases which types of SOEs should be established. The following legal forms of SOEs operate in the country: (1) SEs that function based on the right of economic management72 or based on the right operational management;73 (2) JSC, where the government may own any stake—from 100 percent to a minority share; and (3) other types of commercial entities, limited liability companies.
4.34 The Civil Code is a foundational legislative framework for all types of legal entities in the country, including SEs. The Civil Code defines different types of legal entities, both commercial and non-profit. It sets out rights and obligations of their participants and establishes the procedure for their establishment and management. The Civil Code is the only legal instrument that explicitly defines the state property rights and SEs.
4.35 The Civil Code defines SEs as legal entities, where all assets remain in direct state ownership while assigned to an enterprise for delivering under the specific mandate. Such entities are entirely owned by the state and are not corporate entities. The government (respective line minister or SPMF) exercises control over the proper use and maintenance of the property assigned to the enterprise and is entitled to a part of the profit received from the use of this property. SEs may not sell, lease, or invest their fixed assets without owner consent. The government is not liable for SEs’ obligations. At the same time, the government bears the secondary liability on SEs’ obligations if their property is not sufficient to clear their debts.
4.36 Incorporated SOEs, or joint stock entities, are governed by the Law on Joint Stock Companies. This law establishes the procedure for the incorporation, reorganization, liquidation, legal status of joint stock companies, and rights and obligations of their shareholders and protects the rights and interests of shareholders. SOEs also fall under the general company legislation applicable to private sector entities, such as accounting and audit legislation, while corporate governance norms are regulated by special government decrees, such as “On Increasing Effectiveness of Corporate Governance in Joint Stock
72 Civil Code of the Kyrgyz Republic (1996), Article 158: “State enterprises based on the right of economic management is a legal entity which property and profit are owned by the state and are assigned to such enterprise in order to carry out its business activities.” 73 Article159: “State Enterprises based on the right of operative management carrying out operative management of the property assigned to it, may be formed based on the state property.”
91
Companies with State Share,” dated August 18, 2003, No. 525.74 Though in practice, despite having similar footing in the legislative frameworks with their private sector peers, corporate SOEs generally fall behind private sector companies in applying the legislative requirements and implementing better practices in their operations.
4.37 SOEs still enjoy preferential bankruptcy protection, impacting the competition environment and bearing potential fiscal implications for the state budget. While SOEs are not fully excluded from the bankruptcy procedures, they are eligible for preferential treatment. The Law on Bankruptcy contains an indirect definition of an SOE, where the legal entities with the majority state ownership might be subject to special bankruptcy procedures. Moreover, the existing legislation protects SOEs that are natural monopolies from the bankruptcy proceedings, as the Law on Bankruptcy does not apply to natural monopolies.
4.38 While many companies have been corporatized by the Kyrgyz Government, many maintain SE legal status. SEs have a lower level of accountability, as they are not required to publish their regular financial statements or undergo regular independent audit, and they lack corporate governance requirements. SEs are typically managed by general directors, who handle day-to-day operations but do not have as much managerial and financial accountability or oversight as their counterparts in JSCs. Lack of proper corporate governance arrangements that provide sufficient oversight over SE operations can adversely affect operational performance, financial discipline, and competitiveness.
4.39 The Kyrgyz Government is proceeding with rationalization of the state-owned entities—over the past few years, certain concrete steps were taken. The Interdepartmental Commission for Optimization of the State-Owned Enterprises (ICOSOE) was established for the purpose of facilitating SOE efficiency by improving management organization. The ICOSOE has successfully initiated the SE consolidation exercise, under which 46 SEs were reorganized under a merger, 90 were transformed into state institutions, and 10 were liquidated. However, as of this analysis, 104 SEs remain to be reformed, reorganized, or liquidated.
4.40 The current SOE oversight system in the Kyrgyz Republic is classified as a dual system, where oversight and governance functions are split between the State Property Management Fund and respective line ministries. The SOE ownership function has been strengthened since 2012, when the State Property Management Fund was established. The SPMF acts as the shareholder of legal entities on behalf of the state and exercises its shareholder rights in SOEs’ corporate governance, performance monitoring, and financial oversight. The line ministries are responsible for respective industry policies and sometimes exercise other functions that may duplicate or contradict the SPMF’s objectives.
4.41 The NEHC was established in 2016, absorbing control over most of the energy sector SOEs. The SPMF transferred shares of nine energy companies to the NEHC engaged in generation, transmission, distribution, heating, and services. The NEHC is structured as a holding entity, which is designed to govern subsidiary energy companies via unified decision making. This process is based on energy sector strategy developed by the government, applying robust corporate governance structure, and streamlined financial reporting practices.
4.42 Since the NEHC was established, the energy sector has gained the clear division of authority that separates the ownership, policy, and regulatory functions. The NEHC performs the ownership
74 Government Resolution “On Increasing Effectiveness of Corporate Governance in Joint Stock Companies with State Share,” dated August 18, 2003, No. 525, ceased to be in force and effect by the Government Resolution of August 14, 2009, No. 532.

92
function. The State Committee on Industry, Energy, and Subsoil oversees developing and overseeing implementation of the energy policy. The State Regulatory Agency for Energy and Fuel (SRAEF) handles licensing, determines tariffs, and monitors the performance of the framework for energy companies.
4.43 Until 2019, the NEHC reported to the SPMF with its aggregated financial statements, which included only partial data on its subsidiary energy companies. This streamlined reporting process is principally in line with the good international practices, if NEHC would fully consolidate its subsidiaries’ financial statements, as promulgated by the IFRS. However, as the consolidation process is not yet fully implemented by the NEHC, such reporting creates certain gaps in the centralized information flow from individual energy SOEs to the SPMF and the government, as an ultimate owner of these SOEs. As a result, aggregate financial information presently prepared by the NEHC does not provide a complete view of the energy sector SOEs. In March 2021, the oversight of NEHC was transferred from the SPMF to the newly established Ministry of Energy. While this transfer would complicate the government’s centralized oversight over SOE portfolio, it is too early to say if it this change would impact NEHC corporate governance and performance.
4.44 The uniform set of KPIs introduced in the Kyrgyz Republic in 2018 applies only to the NEHC as a holding entity of nine energy sector SOEs. However, it is uncertain whether the NEHC cascades these KPIs down to its subsidiaries, as is typically done in holding-type structures. In parallel, the SRAEF developed a comprehensive set of industry specific KPIs that target operational efficiency, quality of energy supply, and other important aspects of energy sector operational performance. The uniform approach to the KPIs that are applicable to the holding entity and to all its subsidiaries is an integral part of the proper functioning of the holding structure, strategic orientation toward improved profitability, and maximizing of shareholder value. Hence it is important that all entities in a holding-type structure have a clear set of indicators to achieve and are held accountable against these objectives.
Recommendations
4.45 Implement a comprehensive tariff reform to improve cost recovery and reduce the QFD in the energy sector. The current level of tariffs, incorporating implicit subsidy to certain categories of consumers, is not sustainable in the long run. The complex approach to full cost recovery has already been formulated by World Bank staff (“Analysis of the Kyrgyz Republic’s Energy Sector,” World Bank, May 2017): “If costs are to be fully recovered by 2021 (which should be the goal of the new MTTP), one option is to reduce the social tariff consumption threshold and increase tariffs both above and below that threshold.”
4.46 Improve efficiency and reduce costs by subjecting all SOEs to rigorous monitoring of their activities, financial reporting, KPIs, and operational expenses. Strong corporate governance practices will contribute to this. Implementation of professional boards of directors charged with the authority to enforce consistent financial reporting, audit, and cost-efficiency requirements will increase the accountability of SOEs. This also will allow the government to improve the financial standing of all SOEs, including those in the energy sector, contributing to their financial sustainability.
4.47 Given the current and projected levels of the energy sector debt burden, the tariff reform alone might not be enough to achieve the full cost recovery by the energy SOEs. It appears unlikely that the energy SOEs will be able to repay these loans. In this context, the government faces being caught in a perpetual debt rollover exercise. The debt load on the SOEs needs to be eased to render them financially viable. The government should extinguish a part of the energy SOEs’ financial liability with a debt-to-equity swap. The
93
manageable level of the SOE borrowings could be determined once the new tariff structure and proposed timeline for its implementation have been approved.
4.48 The set of KPIs introduced by the SPMF should apply to all SOEs regardless of which agency exercises the shareholder’s rights on behalf of the state. All SOEs should have the ultimate objective to maximize value for the state and should be evaluated on that regularly. While the KPI reporting was suspended due to COVID pandemic until further notice by the Government, their application should be resumed promptly to take regular measure of SOEs financial health. In the energy sector, the KPIs currently apply only to the NEHC on a standalone basis. Once the NEHC produces the consolidated financial statements, all energy sector SOEs in its portfolio will be presented as a single economic entity. Then, applying the SPMF KPIs to the NEHC only will enable monitoring the financial efficiency of all relevant energy companies. However, until then, the uniform financial KPIs should be agreed and monitored for nine subsidiaries of the NEHC on an individual basis.
4.49 There is a clear need for the SE reclassification exercise. The correct classification of SEs in an appropriate institutional sector, using GFSM 2014 criteria for a public corporation, will have a substantial impact on their reporting and accounting procedures. Those entities identified as SOEs (or public corporations according to GFSM 2014) should be more closely monitored by the SPMF and comply with commercial (private) sector accounting standards, while those entities found not to meet the criteria for public corporations should be regarded as central government entities and follow public sector accounting rules. Application of the uniform financial KPIs should be limited to those entities that were classified as SOEs.
4.50 Systematize the SOE relationship with the budget to properly calculate and compensate SOEs for quasi-fiscal activities. SOEs in the Kyrgyz Republic carry out many activities, including energy distribution, that are subsidized—implicitly and explicitly—by the state budget. These SOEs cannot become profitable operations unless they are duly compensated for below-cost recovery revenue with direct budget subsidies.
4.51 Include fiscal space in the state budget to absorb risks resulting from SOEs’ inability to meet their excessive debt obligations. The energy SOEs’ debt is unsustainable, meaning that the state budget will need to absorb their debt obligations eventually. Presently, these obligations are rolled over from year to year. The risk of non-payment is high; thus, the Kyrgyz Government should estimate and include provisions in the budget to be prepared to absorb the debt.
4.52 Expand the scope of the existing SFRs by including reporting on fiscal risks from SOEs. SFR should incorporate information on the aggregate SOE performance and financial position broken down by key sectors, including energy, as well as by SOE contingent liabilities and quasi-fiscal activities. This information is an essential part of the budget documentation to ensure a comprehensive disclosure of major fiscal risks. As the first step, the energy sector QFD should be disclosed. To enhance transparency and accountability, the SFRs could be published as part of the budget documentation, commencing with the 2021 budget.
94
Fiscal Decentralization and Subnational Public Finances
Context
Local governments are critical public services providers in the Kyrgyz Republic, particularly in the water and sewerage, local roads, and solid waste management sectors. They also play a crucial role in the maintenance of school buildings and specific social programs. This chapter examines how local governments finance these services. Strengthening the incentives of subnational government (SNG) is imperative for their contribution toward the public expenditures. The 2014 PER identified significant design problems, including the not well-defined division of functional responsibilities between the central government and local governments. The division of operational responsibilities between the central and local governments appears to be much more straightforward than in past studies. The largest central-to-local transfer is formula-based, and the system of shared taxes is stable. Local government derives its revenues from shared taxes, locally administered taxes, and transfers from the central government. To improve local governments’ ability to respond to downturns in other revenue sources and local demands for service improvements, the government could consider giving local governments more discretion over these taxes’ rates. While the Bishkek municipality is far more affluent in per capita revenue terms, this disparity is justified by the broader range of functions than other municipalities in the country. Anecdotal evidence suggests that small municipalities have excessive numbers of professional and administrative staff; their low salaries offset the cost of employing them. Deficiencies in the provision of local government services are typically in the form of suboptimal quality and quantity of services. Local governments devote nearly a quarter of their budgets to public services rather than specific sectoral functions. Recurrent subsidies to enterprises do not present large claims on local budgets, and the current system of local government finance does not require major, urgent reforms. In the short term, however, several modest improvements bear consideration. The current equalization formula has accomplished only a modest degree of equalization.
This chapter makes the following recommendations:
• Allow local governments to impose higher tax rates on their constituents.
• Simplify the equalization transfer system.
• Over time, the government may wish to examine its local government personnel policies—concerning staffing levels and wages—and examine alternative financing sources for local capital investments.
Introduction
5.1 The current structure of the subnational government in the Kyrgyz Republic consists of only a single tier, containing the cities of Bishkek and Osh, 29 other officially designated cities, and 450 rural local governments. Each local government has an elected council (which in turn elects a mayor). The functions and revenue sources of local governments are set out in the municipal law (except in the cases of Bishkek and Osh, each of which has its own law). The structure nevertheless bears the imprint of the multi-tier structure inherited from the Soviet era. At independence, the structure of subnational administration consisted of three tiers. At the top tier, the national territory was divided into seven regions, or oblasts, and two oblast-level cities: Bishkek and Osh. The oblasts were further divided into 40 districts, or rayons, and 12 rayon-level cities. Rayons, in turn, were divided into roughly 450 districts (aiyl okmotus) and 11 district-level cities. Each district contained several settlements, but these had no separate legal status. With the adoption of the 2010 Constitution, the 2011 Local Self-Government Act,75 and subsequent legislation, oblasts and rayons lost their status as autonomous levels of government. At present, they have no separate taxing or budgeting powers. Their executives are appointed by the central government, and therefore they function as arms of the central government. In 2018 local governments accounted for about 12 percent of total
75 Law No. 101 of 2011 (Articles 43 and 49).
95
government spending and about 3.5 percent of GDP.
5.2 Bishkek (2019 population of approximately 1.03 million) and Osh (approximately 300,000) are by far the largest local governments in the Kyrgyz Republic. Together they account for about 20 percent of the country’s population. The populations of the cities (of which there are now 29) range from approximately 6,100 to 119,000, with an average of 33,000. The average population of an aiyl okmotu is approximately 4,800.76
5.3 The chapter is organized as follows: Section C explores the role of the Kyrgyz Republic’s central administration as it relates to local governments. Section D identifies sources of local revenue and cites recent trends. Recommendations are displayed in Section E.
Expenditure Responsibilities
5.4 The legal framework in the Kyrgyz Republic (Law on Local Self-Government 101 of 2011 as amended through August 8, 2019) sets out a respective role of central and local governments. Separate but similar legislation defines the roles of Bishkek and Osh, respectively. Article 10 of the 2011 law defines the powers of the central government with respect to local government. These include the “adoption of laws in the field of local self-government and ensuring their uniform implementation, transferring to them separate state powers in accordance with the law, along with the material and financial resources needed to implement these state powers, and establishing, combining, or eliminating administrative units.” It also includes two specific sectoral functions. The first is education, including the provision of preschool education, schooling, and vocational training.77 The second is the provision of healthcare. Article 10 also gives the central government control over the activity of enterprises, organizations, institutions, and other business entities for the implementation of environmental legislation, the use of land and natural resources, the observance of the norms and rules of urban planning and architecture, and sanitary norms.
5.5 Article 18 of the local government law sets out the functions of local governments (specifically, the functions on which local governments are authorized to legislate). Twenty-five such functions are listed, of which the most important (in terms of their budgetary implications) are:
• Supply of drinking water, maintenance of sewerage systems and treatment plants;
• Maintenance of the municipal roads in settlements;
• Organization of collection, removal, and disposal of municipal waste; and
• Ensuring the functioning of public transport within the boundaries of settlements.
5.6 The list also includes the management of municipal property, formation, approval, and execution of local budgets; the enforcement of the rules of urban planning and architecture; and the economic development of the territory as well as attracting investment and grants.
5.7 Article 20 of the law sets out a list of functions that the central administration may delegate to local governments. There are myriad administrative functions (issuance of citizen identity documents, military registration, collection of fees and social insurance premiums) as well as certain specific agricultural services (assistance in organizing the timely conduct of veterinary and breeding work in animal husbandry and
76 Kyrgyz Republic National Statistics Committee, 2019 estimates. 77 Note that Article 20 authorizes the central government to delegate the “provision of buildings and other objects for providing services in the sphere of school, pre-school, and vocational education and healthcare to the local level.”
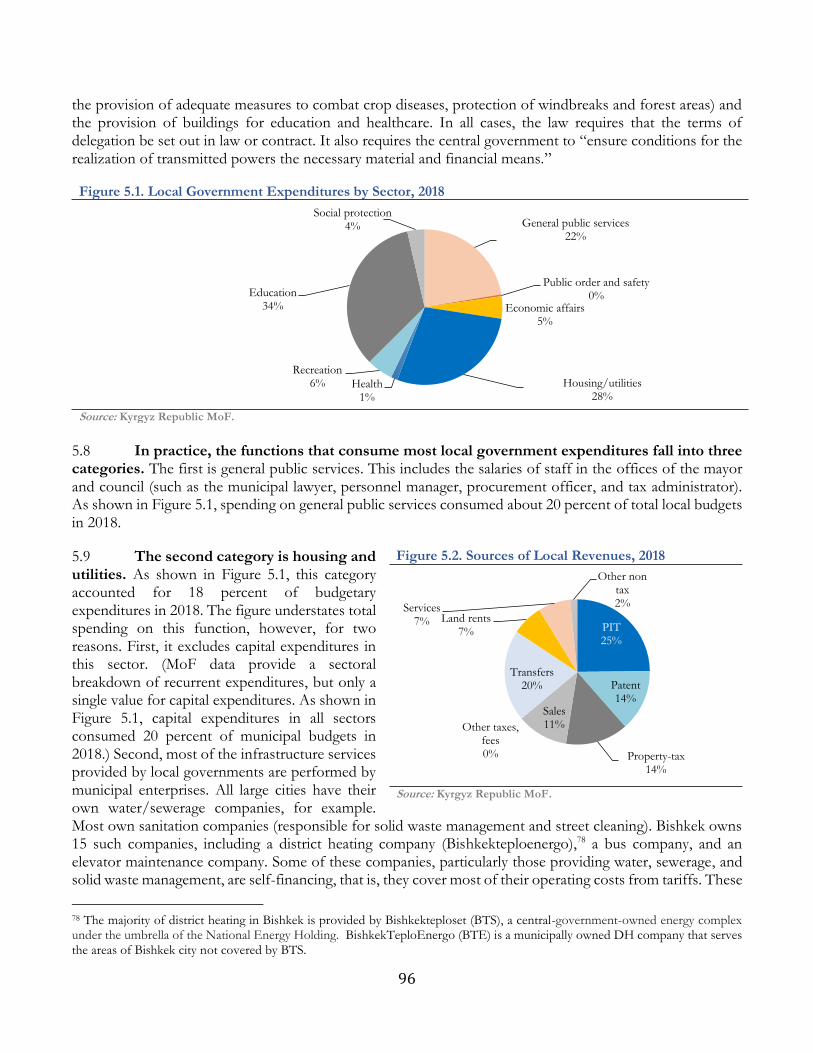
96
the provision of adequate measures to combat crop diseases, protection of windbreaks and forest areas) and the provision of buildings for education and healthcare. In all cases, the law requires that the terms of delegation be set out in law or contract. It also requires the central government to “ensure conditions for the realization of transmitted powers the necessary material and financial means.”
Figure 5.1. Local Government Expenditures by Sector, 2018
Source: Kyrgyz Republic MoF.
5.8 In practice, the functions that consume most local government expenditures fall into three categories. The first is general public services. This includes the salaries of staff in the offices of the mayor and council (such as the municipal lawyer, personnel manager, procurement officer, and tax administrator). As shown in Figure 5.1, spending on general public services consumed about 20 percent of total local budgets in 2018.
5.9 The second category is housing and utilities. As shown in Figure 5.1, this category accounted for 18 percent of budgetary expenditures in 2018. The figure understates total spending on this function, however, for two reasons. First, it excludes capital expenditures in this sector. (MoF data provide a sectoral breakdown of recurrent expenditures, but only a single value for capital expenditures. As shown in Figure 5.1, capital expenditures in all sectors consumed 20 percent of municipal budgets in 2018.) Second, most of the infrastructure services provided by local governments are performed by municipal enterprises. All large cities have their own water/sewerage companies, for example. Most own sanitation companies (responsible for solid waste management and street cleaning). Bishkek owns 15 such companies, including a district heating company (Bishkekteploenergo),78 a bus company, and an elevator maintenance company. Some of these companies, particularly those providing water, sewerage, and solid waste management, are self-financing, that is, they cover most of their operating costs from tariffs. These
78 The majority of district heating in Bishkek is provided by Bishkekteploset (BTS), a central-government-owned energy complex under the umbrella of the National Energy Holding. BishkekTeploEnergo (BTE) is a municipally owned DH company that serves the areas of Bishkek city not covered by BTS.
General public services22%
Public order and safety0%
Economic affairs5%
Housing/utilities28%
Health1%
Recreation6%
Education34%
Social protection4%
Figure 5.2. Sources of Local Revenues, 2018
Source: Kyrgyz Republic MoF.
PIT25%
Patent14%
Property-tax14%
Sales11%Other taxes,
fees0%
Transfers20%
Land rents7%
Services7%
Other non tax2%
97
tariff revenues do not enter the municipal budget nor do the expenditures they finance. In Bishkek, one third of on-budget spending in the housing and utilities sector is devoted to subsidies to the various companies that are not supported by tariffs (for example, companies responsible for park maintenance and street cleaning, and municipal construction companies). Another 30 percent is devoted to capital works, including the construction of roads and water supply systems.
5.10 The third—and largest—category of local expenditures is education. As shown in Figure 5.1, education accounted for 30 percent of total budgetary expenditures in 2018. In most local governments—in fact, in all of them except Bishkek—this represents the costs of operating and maintaining school buildings and providing student meals. In all those jurisdictions, the central government pays the salaries of teachers; again, Bishkek is the exception. There, teachers’ salaries are paid from the general revenues of the city and consume 40 percent of the city’s budget. Because Bishkek’s spending on education is so large, it distorts the aggregate figures on education spending among local governments in the Kyrgyz Republic as a whole.79
Revenue Assignment
5.11 Local governments derive their revenues from three major sources: (1) shared taxes; (2) locally administered taxes; and (3) transfers from the central government. The term “shared” refers to taxes that are collected by the central government (although local governments may be involved in their administration), with fixed shares of the proceeds transferred to local governments based on origin, that is, according to the jurisdiction where the tax was collected.
5.12 The largest single shared tax is the personal income tax (PIT). As shown in Figure 5.2, the PIT accounted for 25 percent of local revenues in 2018. It is presently imposed at a flat rate of 10 percent. The proportion of the PIT that is shared with local governments is subject to change. Prior to 2019, 50 percent of PIT revenues were shared with local governments;80 in 2019, that proportion was increased to 70 percent. According to the 2019 government budget, that proportion is to be increased to 85 percent in 2020, and then to 100 percent in 2021.
5.13 Local governments also derive considerable revenues from so-called patent-based taxes.81 They are a form of business tax that is directed at firms that fall below the threshold for value-added tax (VAT) liability. Like the PIT, patent-based taxes are administered by the central government and distributed on the basis of origin. Unlike the PIT, 100 percent of patent tax revenues are transferred to local governments.
5.14 Proceeds from the retail sales tax are also shared. (The Kyrgyz Republic has both a VAT and a retail sales tax.) The latter is imposed on the gross value of goods and services (other than agricultural products) but at low rates.82 Half of the proceeds of the sales tax are currently shared with local governments.
79 It should be noted that the proportion of education spending is high, but the cost is largely due to the number of students population in the country’s largest city. 80 “Origin” in this case refers to the location where the employee works, not where the company withholding the tax is located. 81 A patent is a document issued by a tax authority and certifying the taxpayer’s right to carry out a certain type of activity and pay taxes and confirming receipt of income during the patent period. The code distinguishes between voluntary and involuntary patent-based taxes. Article 348 states that the mandatory patent tax shall be paid by businesses engaged in: (1) services of saunas and bathhouses; (2) billiard services; (3) services on providing game machines; (4) casino services; (5) services of exchange bureaus; (6) services of disco clubs; and (7) services of parking lots open 24 hours. Organizations and individual entrepreneurs paying tax in the form of a mandatory patent are exempt from the profit tax, the sales tax, and VAT. 82 According to the 2009 Tax Code, the sales tax is payable regardless of whether the taxpayer also pays VAT. For the sale of goods, works, or services by VAT payers and for the sale of goods, works, or services exempt from VAT, the rate is: (1) 1% for trading
98
According to the 2019 government budget, that proportion will increase to 75 percent in 2020 and 100 percent in 2021.
5.15 Local taxes. Local governments are authorized to impose their own taxes on various forms of property, specifically, buildings, land, and vehicles. The rules governing the administration of all three taxes are set out in considerable detail in the Tax Code and the organic budget law. As described in Box 5.1, these rules leave little discretion to local governments. In the case of the taxes on buildings and land, both assessment methodologies and tax rates are centrally determined, leaving local governments the option only to fine-tune the distribution of tax burden among neighborhoods within their respective territories. Regulations on the property tax on vehicles are similarly tight. In the case of vehicles powered by combustion engines, for example, the rate is based on the age, type of vehicle, and engine size. The rate on an automobile that is less than five years old is 0.9 soms per cubic meter of engine size. The rate on a tractor at least 10 years old is 0.15 soms per cubic meter of engine size.
5.16 Non-tax revenues. Local governments derived about 16 percent of their revenues from non-tax charges and fees in 2018. Half of this was derived from the rent or lease of land owned by the local government. The other half was derived from fees, the most important of which were administrative fees and fees (paid by parents) for preschools.
Box 5.1. Regulations on the Building and Land Taxes
The building tax is imposed on both residential and non-residential buildings. The formula for determining the taxable value (TV) of a specific building is: TV = V x (A +A1) x Кi x К1 x К2 x К3, where:
V is the value per square meter of the property (expressed in soms). The code sets out the methodology for determining the value of V, based on the material used for the construction of walls and the building’s age. Thus, a brick building less than five years old is valued at KGS 20,000 per square meter; a concrete block building over 30 years old is valued at KGS 8,000 per square meter, and so on.
A and A1 are the area of the building expressed in square meters.
Ki is an inflation factor.
K1 reduces the value of buildings in rayons and cities other than Bishkek. The assessed value of property in the city of Osh, for example, is reduced by 10 percent, and certain rayons near Bishkek, by 20–30 percent. Assessed values in other cities and rayons are reduced by 40–90 percent.
K2 provides for further adjustment in assessed values within each city and rayon, within a range of 0.3–1.5. These adjustments (along with the zones they apply to) may be proposed by the local council but must be approved by the central government. (This is the only discretion a local government has over property tax assessments.)
K3 adjusts valuations on commercial and industrial property on the basis of sector, within a range of 0.3–1.6.
The rate of the building tax is set out in the code. It is 0.35 percent for residential property and 1 percent for buildings used for industrial and commercial purposes. (Owner-occupied residential buildings receive a KGS 5,000 deduction off the top.) In principle, the tax liabilities of high-end buildings are quite high. The annual tax on a new, 100 m2, brick housing unit in an average neighborhood in Bishkek would be $10. (The tax on the land under it (assuming 200 m2) would be only $8.) But tax liabilities fall quite steeply outside of Bishkek and Osh. As a result, property tax
activities and industrial processing of agricultural products; (2) 2% for other activities aside from trading and industrial processing of agricultural products; and (3) 5% for mobile communication activities. For the sale of goods, works, or services by non-VAT payers, if such sale of goods, works, or services is not a VAT-exempt supply, the rate is 2% for trading activities and 3% for non-trading activities.
99
revenues beyond those two cities are quite low. Excluding Bishkek and Osh, the average per capita yield of the property tax in 2018 was only KGS 318, or $4.57.
The land tax is imposed on both urban (residential, industrial, commercial) and agricultural land. The Tax Code sets out the assessment levels for various categories of land, distinguishing among uses and locations within the country. In the case of agricultural land, the code stipulates different rates for land in each rayon according to its use, distinguishing among irrigated arable land, non-irrigated arable land, perennial plantations, hayfields, and pastures. The assessments for irrigated arable land, for example, range from KGS 189 ($2.70) per hectare in Suusamyr (in Chui oblast) to KGS 453 ($6.47) per hectare in Nooken Rayon (in Jalalabad oblast).
The Tax Code provides separate assessment tables for (1) urban land (referred to as “land of settlements”); and (2) “homestead land” and garden plots. Assessments on urban land vary according to: (1) the population size of the settlement; (2) the oblast in which it is located; (3) the economic/planning zone within the settlement where the land is located; and (4) the particular use of the land in question.
Tax liability (T) is calculated as: R x A х К1 х К2, where:
A is the area of the property, expressed in square meters.
R is the base rate, expressed in som/m2, and varying according to the population of the settlement and the oblast where it is located. Base rates on land vary from KGS 0.9/m2 (in settlements with less than 5,000 inhabitants in Batken oblast) to KGS 2.9 /m2 (in settlements with more than 500,000 inhabitants in Chui Oblast and in Bishkek).
K1 is an adjustment factor reflecting “specific features” of the economic and planning zones within the settlement. The local council has the authority to set the boundaries of these zones and determine the values of the coefficients in each zone if they average out to 1.0.
K2 is an adjustment factor reflecting the use of the land. It is 1.0 in the case of residential land. It varies for commercial and industrial land, with the highest coefficient (22.5) assigned to shops of less than 10 m2 (about the area of an apartment bedroom) in size. The coefficient on large shops (50 m2 (about twice the area of a parking space) and above) is only 6. The coefficient for hotels is 7. The coefficient for land used for “industry, transport, construction and communication and energy establishment” is 0.5.
The rate on garden plots ranges from KGS 0.1 per m2 in rural settlements to 1.5/m2 in Bishkek and Osh.
5.17 Transfers. The third major category of local revenues is transfers. The legal basis for the system of intergovernmental transfers is provided by the organic budget law (2016; Article 52). It envisions two types of transfers to local governments: leveling (equalization) transfers and targeted transfers.
Box 5.2. The Equalization Transfer
According to the organic budget law (Section 54), the equalization transfer is intended to “cover the financial gap between the level of income and the needs of local budgets.” The methodology for distributing the equalization transfer is set out in Government Decree 321 (dated 2011) as subsequently amended. (The most recent version, Decree 18, dates from 2018.) The methodology is extremely complicated, with the English translation running eight pages.
To simplify the methodology begins with a calculation of the “revenue capacity” of each jurisdiction. Revenues for this purpose include both shared taxes (the PIT, sales tax, and patent-based taxes) and local taxes on property (including taxes on land, buildings, and vehicles) as well as revenue from the rental of municipal land. For this purpose, jurisdictions are classified into four groups: (1) Bishkek and Osh; (2) oblast-level cities; (3) rayon-level cities; and (4) aiyl okmotus. The potential yield of each revenue source is determined by the MoF, based on a representative jurisdiction in each group.
100
At the same time, the expenditure needs of each jurisdiction are calculated. These are based on a range of factors that affect the costs of four core public services: (1) “general public services”; (2) preschool education; (3) housing and communal services; and (4) sports and cultural activities. The factors include the population of the jurisdiction and factors affecting the costs of each core function. In the case of preschool education, for example, these include the number of children between ages 0 and 6 and the number of children attending preschools in each jurisdiction. Special top-ups are included for jurisdictions in mountainous and remote areas. Again, expenditure needs are calculated based on a representative jurisdiction in each group.
The amount of the equalization transfer is based on the resulting fiscal gap—specifically, the amount required to bring the needed spending level of each jurisdiction (net of potential revenues) up to the average of the group it belongs to. At present, the formula also includes a transition element, intended to temporarily compensate jurisdictions that would otherwise suffer large revenue losses when the current system was first introduced. Although the current system has been in effect for eight years, the transition element continues to exist.
5.18 As described in Box 5.2, the methodology for calculating the equalization transfer is extremely complicated. In principle, it is intended to reduce the gap between the revenues and expenditure needs of each jurisdiction. For this purpose, local governments are classified into groups. Separate calculations of expenditure needs, and potential revenues are made for each group. Equalization transfers account for a relatively small share of aggregate local revenues—about 9 percent in 2018—although their importance is greater in poorer and in smaller jurisdictions.
5.19 Targeted transfers account for a slightly larger share of local revenues—about 11 percent in 2018. According to the current budget code, targeted transfers may be used to: (1) compensate local governments for revenue losses or expenditure increases arising from regulatory legal acts of the central government during the budget year; or (2) to finance the costs of delegated state functions. In the past, targeted transfers were used to compensate local governments for centrally dictated increases in civil service salaries, as well as unexpected shortfalls in revenues. They were also used to help local governments clear arrears and pay utility bills. More recent data on the use of targeted transfers are not available.
5.20 Capital receipts. According to published budget data, local governments generate very little money from the sale of assets or from borrowing. In 2018, proceeds from the sale of assets (principally non-agricultural land) constituted only 0.3 percent of total local receipts. Proceeds from borrowing were even more limited. Under the current budget code, local governments are prohibited from borrowing if their debt service obligations, including those on proposed new borrowing, would exceed 20 percent of their annual revenues, net of intergovernmental transfers. They are further prohibited from issuing guarantees and are required to keep records in accordance with the register of debt obligations specified by the central government. It is unlikely that these restrictions are binding on most local governments. In aggregate, local spending on debt service was equal to only 0.7 percent of non-transfer revenues in 2018. It should be noted that some local governments do benefit indirectly from donor financing–either in the form of loans to their municipal enterprises (for example, water utilities) or loans to the central government that finance capital works undertaken on behalf of local governments. Local governments in the Issyk Kul region also benefit from a special regional development fund financed by a gold-mining enterprise.
5.21 Trends. Aggregate local revenues appear to have undergone remarkable fluctuations over the past 10 years. As shown in Figure 5.3, aggregate revenues increased between 2010 and 2012, and then fell even more dramatically between 2012 and 2014. In fact, most of the variance is attributed to fluctuations in transfer revenues, which are explained by changes in the system of education financing. Prior to 2014, teachers’ salaries were paid through local government budgets. These costs were financed through earmarked transfers from the central government. The government dramatically increased teachers’ salaries between 2010
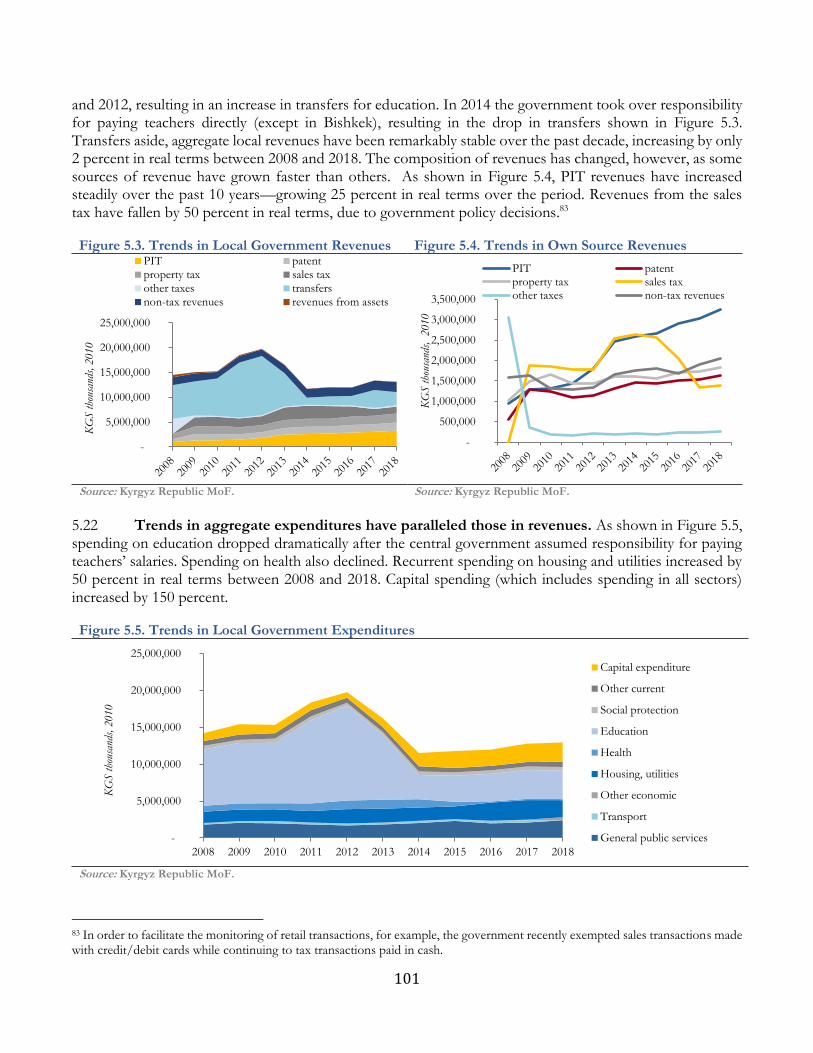
101
and 2012, resulting in an increase in transfers for education. In 2014 the government took over responsibility for paying teachers directly (except in Bishkek), resulting in the drop in transfers shown in Figure 5.3. Transfers aside, aggregate local revenues have been remarkably stable over the past decade, increasing by only 2 percent in real terms between 2008 and 2018. The composition of revenues has changed, however, as some sources of revenue have grown faster than others. As shown in Figure 5.4, PIT revenues have increased steadily over the past 10 years—growing 25 percent in real terms over the period. Revenues from the sales tax have fallen by 50 percent in real terms, due to government policy decisions.83
Figure 5.3. Trends in Local Government Revenues Figure 5.4. Trends in Own Source Revenues
Source: Kyrgyz Republic MoF. Source: Kyrgyz Republic MoF.
5.22 Trends in aggregate expenditures have paralleled those in revenues. As shown in Figure 5.5, spending on education dropped dramatically after the central government assumed responsibility for paying teachers’ salaries. Spending on health also declined. Recurrent spending on housing and utilities increased by 50 percent in real terms between 2008 and 2018. Capital spending (which includes spending in all sectors) increased by 150 percent.
Figure 5.5. Trends in Local Government Expenditures
Source: Kyrgyz Republic MoF.
83 In order to facilitate the monitoring of retail transactions, for example, the government recently exempted sales transactions made with credit/debit cards while continuing to tax transactions paid in cash.
-
5,000,000
10,000,000
15,000,000
20,000,000
25,000,000
KG
S tho
usan
ds, 2010
PIT patentproperty tax sales taxother taxes transfersnon-tax revenues revenues from assets
-
500,000
1,000,000
1,500,000
2,000,000
2,500,000
3,000,000
3,500,000
KG
S tho
usan
ds, 2
010
PIT patentproperty tax sales taxother taxes non-tax revenues
-
5,000,000
10,000,000
15,000,000
20,000,000
25,000,000
2008 2009 2010 2011 2012 2013 2014 2015 2016 2017 2018
KG
S tho
usan
ds, 2010
Capital expenditure
Other current
Social protection
Education
Health
Housing, utilities
Other economic
Transport
General public services
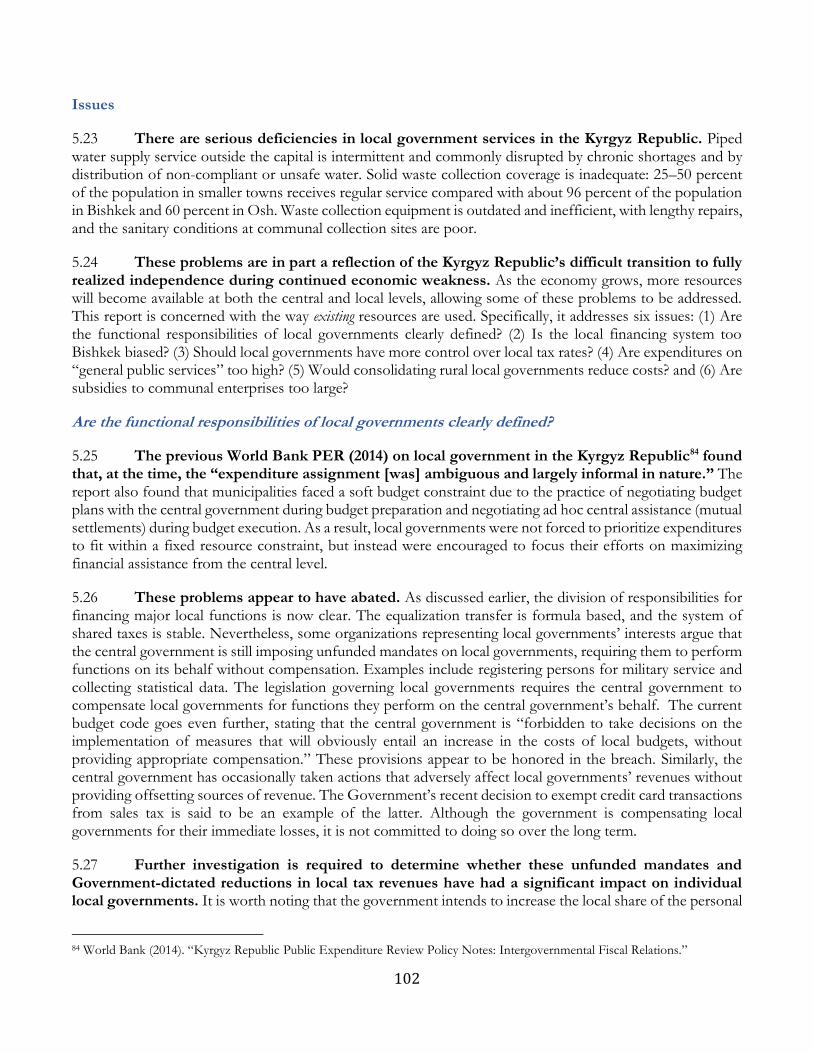
102
Issues
5.23 There are serious deficiencies in local government services in the Kyrgyz Republic. Piped water supply service outside the capital is intermittent and commonly disrupted by chronic shortages and by distribution of non-compliant or unsafe water. Solid waste collection coverage is inadequate: 25–50 percent of the population in smaller towns receives regular service compared with about 96 percent of the population in Bishkek and 60 percent in Osh. Waste collection equipment is outdated and inefficient, with lengthy repairs, and the sanitary conditions at communal collection sites are poor.
5.24 These problems are in part a reflection of the Kyrgyz Republic’s difficult transition to fully realized independence during continued economic weakness. As the economy grows, more resources will become available at both the central and local levels, allowing some of these problems to be addressed. This report is concerned with the way existing resources are used. Specifically, it addresses six issues: (1) Are the functional responsibilities of local governments clearly defined? (2) Is the local financing system too Bishkek biased? (3) Should local governments have more control over local tax rates? (4) Are expenditures on “general public services” too high? (5) Would consolidating rural local governments reduce costs? and (6) Are subsidies to communal enterprises too large?
Are the functional responsibilities of local governments clearly defined?
5.25 The previous World Bank PER (2014) on local government in the Kyrgyz Republic84 found that, at the time, the “expenditure assignment [was] ambiguous and largely informal in nature.” The report also found that municipalities faced a soft budget constraint due to the practice of negotiating budget plans with the central government during budget preparation and negotiating ad hoc central assistance (mutual settlements) during budget execution. As a result, local governments were not forced to prioritize expenditures to fit within a fixed resource constraint, but instead were encouraged to focus their efforts on maximizing financial assistance from the central level.
5.26 These problems appear to have abated. As discussed earlier, the division of responsibilities for financing major local functions is now clear. The equalization transfer is formula based, and the system of shared taxes is stable. Nevertheless, some organizations representing local governments’ interests argue that the central government is still imposing unfunded mandates on local governments, requiring them to perform functions on its behalf without compensation. Examples include registering persons for military service and collecting statistical data. The legislation governing local governments requires the central government to compensate local governments for functions they perform on the central government’s behalf. The current budget code goes even further, stating that the central government is “forbidden to take decisions on the implementation of measures that will obviously entail an increase in the costs of local budgets, without providing appropriate compensation.” These provisions appear to be honored in the breach. Similarly, the central government has occasionally taken actions that adversely affect local governments’ revenues without providing offsetting sources of revenue. The Government’s recent decision to exempt credit card transactions from sales tax is said to be an example of the latter. Although the government is compensating local governments for their immediate losses, it is not committed to doing so over the long term.
5.27 Further investigation is required to determine whether these unfunded mandates and Government-dictated reductions in local tax revenues have had a significant impact on individual local governments. It is worth noting that the government intends to increase the local share of the personal
84 World Bank (2014). “Kyrgyz Republic Public Expenditure Review Policy Notes: Intergovernmental Fiscal Relations.”
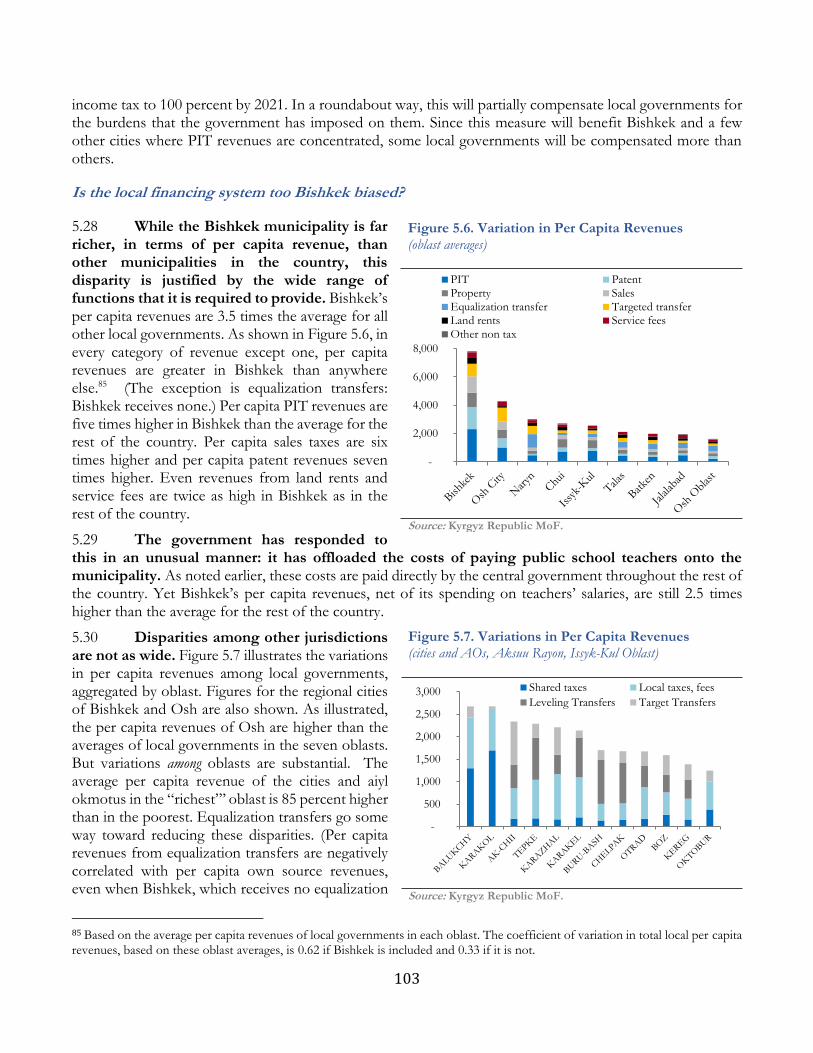
103
income tax to 100 percent by 2021. In a roundabout way, this will partially compensate local governments for the burdens that the government has imposed on them. Since this measure will benefit Bishkek and a few other cities where PIT revenues are concentrated, some local governments will be compensated more than others.
Is the local financing system too Bishkek biased?
5.28 While the Bishkek municipality is far richer, in terms of per capita revenue, than other municipalities in the country, this disparity is justified by the wide range of functions that it is required to provide. Bishkek’s per capita revenues are 3.5 times the average for all other local governments. As shown in Figure 5.6, in every category of revenue except one, per capita revenues are greater in Bishkek than anywhere else.85 (The exception is equalization transfers: Bishkek receives none.) Per capita PIT revenues are five times higher in Bishkek than the average for the rest of the country. Per capita sales taxes are six times higher and per capita patent revenues seven times higher. Even revenues from land rents and service fees are twice as high in Bishkek as in the rest of the country.
5.29 The government has responded to this in an unusual manner: it has offloaded the costs of paying public school teachers onto the municipality. As noted earlier, these costs are paid directly by the central government throughout the rest of the country. Yet Bishkek’s per capita revenues, net of its spending on teachers’ salaries, are still 2.5 times higher than the average for the rest of the country.
5.30 Disparities among other jurisdictions are not as wide. Figure 5.7 illustrates the variations in per capita revenues among local governments, aggregated by oblast. Figures for the regional cities of Bishkek and Osh are also shown. As illustrated, the per capita revenues of Osh are higher than the averages of local governments in the seven oblasts. But variations among oblasts are substantial. The average per capita revenue of the cities and aiyl okmotus in the “richest”’ oblast is 85 percent higher than in the poorest. Equalization transfers go some way toward reducing these disparities. (Per capita revenues from equalization transfers are negatively correlated with per capita own source revenues, even when Bishkek, which receives no equalization
85 Based on the average per capita revenues of local governments in each oblast. The coefficient of variation in total local per capita revenues, based on these oblast averages, is 0.62 if Bishkek is included and 0.33 if it is not.
Figure 5.6. Variation in Per Capita Revenues (oblast averages)
Source: Kyrgyz Republic MoF.
Figure 5.7. Variations in Per Capita Revenues (cities and AOs, Aksuu Rayon, Issyk-Kul Oblast)
Source: Kyrgyz Republic MoF.
-
2,000
4,000
6,000
8,000
PIT PatentProperty SalesEqualization transfer Targeted transferLand rents Service feesOther non tax
-
500
1,000
1,500
2,000
2,500
3,000 Shared taxes Local taxes, fees
Leveling Transfers Target Transfers
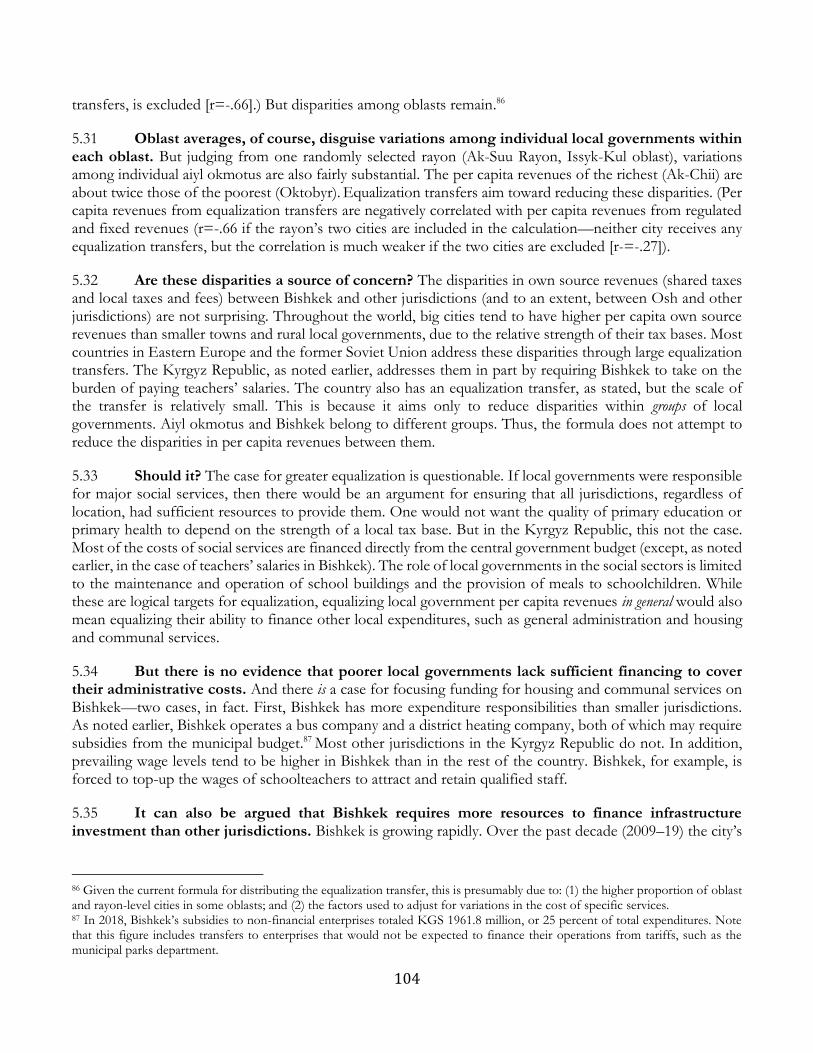
104
transfers, is excluded [r=-.66].) But disparities among oblasts remain.86
5.31 Oblast averages, of course, disguise variations among individual local governments within each oblast. But judging from one randomly selected rayon (Ak-Suu Rayon, Issyk-Kul oblast), variations among individual aiyl okmotus are also fairly substantial. The per capita revenues of the richest (Ak-Chii) are about twice those of the poorest (Oktobyr). Equalization transfers aim toward reducing these disparities. (Per capita revenues from equalization transfers are negatively correlated with per capita revenues from regulated and fixed revenues (r=-.66 if the rayon’s two cities are included in the calculation—neither city receives any equalization transfers, but the correlation is much weaker if the two cities are excluded [r-=-.27]).
5.32 Are these disparities a source of concern? The disparities in own source revenues (shared taxes and local taxes and fees) between Bishkek and other jurisdictions (and to an extent, between Osh and other jurisdictions) are not surprising. Throughout the world, big cities tend to have higher per capita own source revenues than smaller towns and rural local governments, due to the relative strength of their tax bases. Most countries in Eastern Europe and the former Soviet Union address these disparities through large equalization transfers. The Kyrgyz Republic, as noted earlier, addresses them in part by requiring Bishkek to take on the burden of paying teachers’ salaries. The country also has an equalization transfer, as stated, but the scale of the transfer is relatively small. This is because it aims only to reduce disparities within groups of local governments. Aiyl okmotus and Bishkek belong to different groups. Thus, the formula does not attempt to reduce the disparities in per capita revenues between them.
5.33 Should it? The case for greater equalization is questionable. If local governments were responsible for major social services, then there would be an argument for ensuring that all jurisdictions, regardless of location, had sufficient resources to provide them. One would not want the quality of primary education or primary health to depend on the strength of a local tax base. But in the Kyrgyz Republic, this not the case. Most of the costs of social services are financed directly from the central government budget (except, as noted earlier, in the case of teachers’ salaries in Bishkek). The role of local governments in the social sectors is limited to the maintenance and operation of school buildings and the provision of meals to schoolchildren. While these are logical targets for equalization, equalizing local government per capita revenues in general would also mean equalizing their ability to finance other local expenditures, such as general administration and housing and communal services.
5.34 But there is no evidence that poorer local governments lack sufficient financing to cover their administrative costs. And there is a case for focusing funding for housing and communal services on Bishkek—two cases, in fact. First, Bishkek has more expenditure responsibilities than smaller jurisdictions. As noted earlier, Bishkek operates a bus company and a district heating company, both of which may require subsidies from the municipal budget.87 Most other jurisdictions in the Kyrgyz Republic do not. In addition, prevailing wage levels tend to be higher in Bishkek than in the rest of the country. Bishkek, for example, is forced to top-up the wages of schoolteachers to attract and retain qualified staff.
5.35 It can also be argued that Bishkek requires more resources to finance infrastructure investment than other jurisdictions. Bishkek is growing rapidly. Over the past decade (2009–19) the city’s
86 Given the current formula for distributing the equalization transfer, this is presumably due to: (1) the higher proportion of oblast and rayon-level cities in some oblasts; and (2) the factors used to adjust for variations in the cost of specific services. 87 In 2018, Bishkek’s subsidies to non-financial enterprises totaled KGS 1961.8 million, or 25 percent of total expenditures. Note that this figure includes transfers to enterprises that would not be expected to finance their operations from tariffs, such as the municipal parks department.
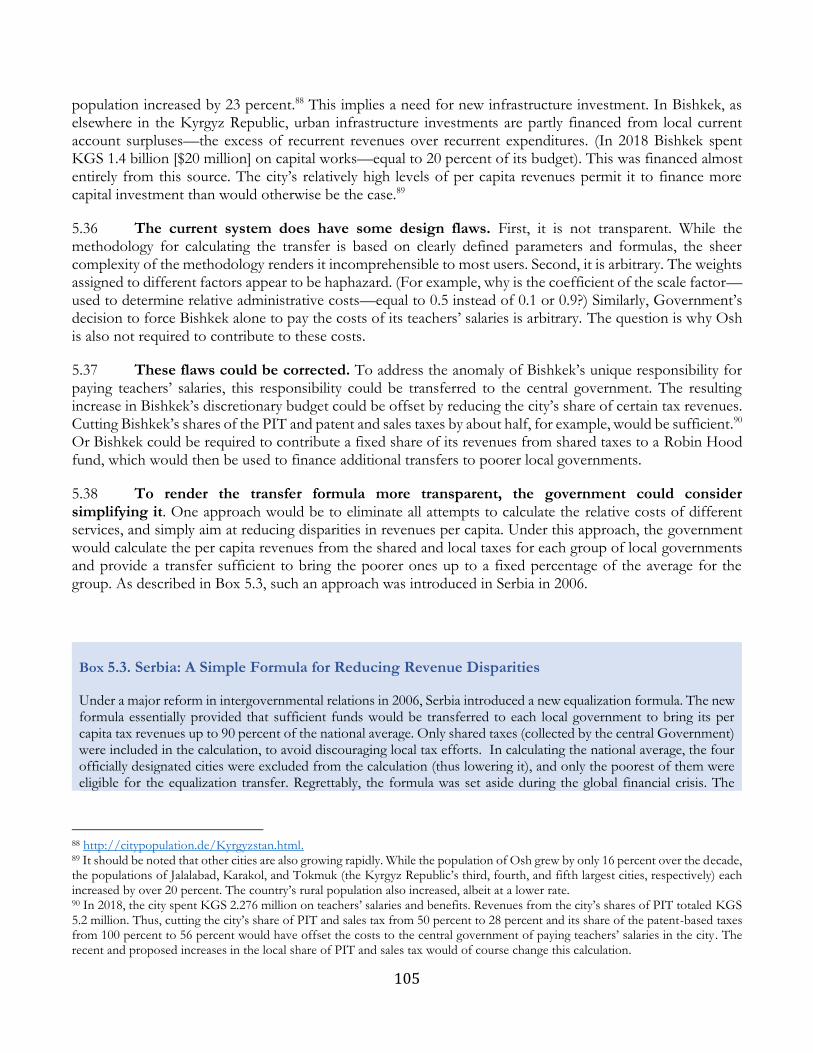
105
population increased by 23 percent.88 This implies a need for new infrastructure investment. In Bishkek, as elsewhere in the Kyrgyz Republic, urban infrastructure investments are partly financed from local current account surpluses—the excess of recurrent revenues over recurrent expenditures. (In 2018 Bishkek spent KGS 1.4 billion [$20 million] on capital works—equal to 20 percent of its budget). This was financed almost entirely from this source. The city’s relatively high levels of per capita revenues permit it to finance more capital investment than would otherwise be the case.89
5.36 The current system does have some design flaws. First, it is not transparent. While the methodology for calculating the transfer is based on clearly defined parameters and formulas, the sheer complexity of the methodology renders it incomprehensible to most users. Second, it is arbitrary. The weights assigned to different factors appear to be haphazard. (For example, why is the coefficient of the scale factor—used to determine relative administrative costs—equal to 0.5 instead of 0.1 or 0.9?) Similarly, Government’s decision to force Bishkek alone to pay the costs of its teachers’ salaries is arbitrary. The question is why Osh is also not required to contribute to these costs.
5.37 These flaws could be corrected. To address the anomaly of Bishkek’s unique responsibility for paying teachers’ salaries, this responsibility could be transferred to the central government. The resulting increase in Bishkek’s discretionary budget could be offset by reducing the city’s share of certain tax revenues. Cutting Bishkek’s shares of the PIT and patent and sales taxes by about half, for example, would be sufficient.90 Or Bishkek could be required to contribute a fixed share of its revenues from shared taxes to a Robin Hood fund, which would then be used to finance additional transfers to poorer local governments.
5.38 To render the transfer formula more transparent, the government could consider simplifying it. One approach would be to eliminate all attempts to calculate the relative costs of different services, and simply aim at reducing disparities in revenues per capita. Under this approach, the government would calculate the per capita revenues from the shared and local taxes for each group of local governments and provide a transfer sufficient to bring the poorer ones up to a fixed percentage of the average for the group. As described in Box 5.3, such an approach was introduced in Serbia in 2006.
Box 5.3. Serbia: A Simple Formula for Reducing Revenue Disparities
Under a major reform in intergovernmental relations in 2006, Serbia introduced a new equalization formula. The new formula essentially provided that sufficient funds would be transferred to each local government to bring its per capita tax revenues up to 90 percent of the national average. Only shared taxes (collected by the central Government) were included in the calculation, to avoid discouraging local tax efforts. In calculating the national average, the four officially designated cities were excluded from the calculation (thus lowering it), and only the poorest of them were eligible for the equalization transfer. Regrettably, the formula was set aside during the global financial crisis. The
88 http://citypopulation.de/Kyrgyzstan.html. 89 It should be noted that other cities are also growing rapidly. While the population of Osh grew by only 16 percent over the decade, the populations of Jalalabad, Karakol, and Tokmuk (the Kyrgyz Republic’s third, fourth, and fifth largest cities, respectively) each increased by over 20 percent. The country’s rural population also increased, albeit at a lower rate. 90 In 2018, the city spent KGS 2.276 million on teachers’ salaries and benefits. Revenues from the city’s shares of PIT totaled KGS 5.2 million. Thus, cutting the city’s share of PIT and sales tax from 50 percent to 28 percent and its share of the patent-based taxes from 100 percent to 56 percent would have offset the costs to the central government of paying teachers’ salaries in the city . The recent and proposed increases in the local share of PIT and sales tax would of course change this calculation.
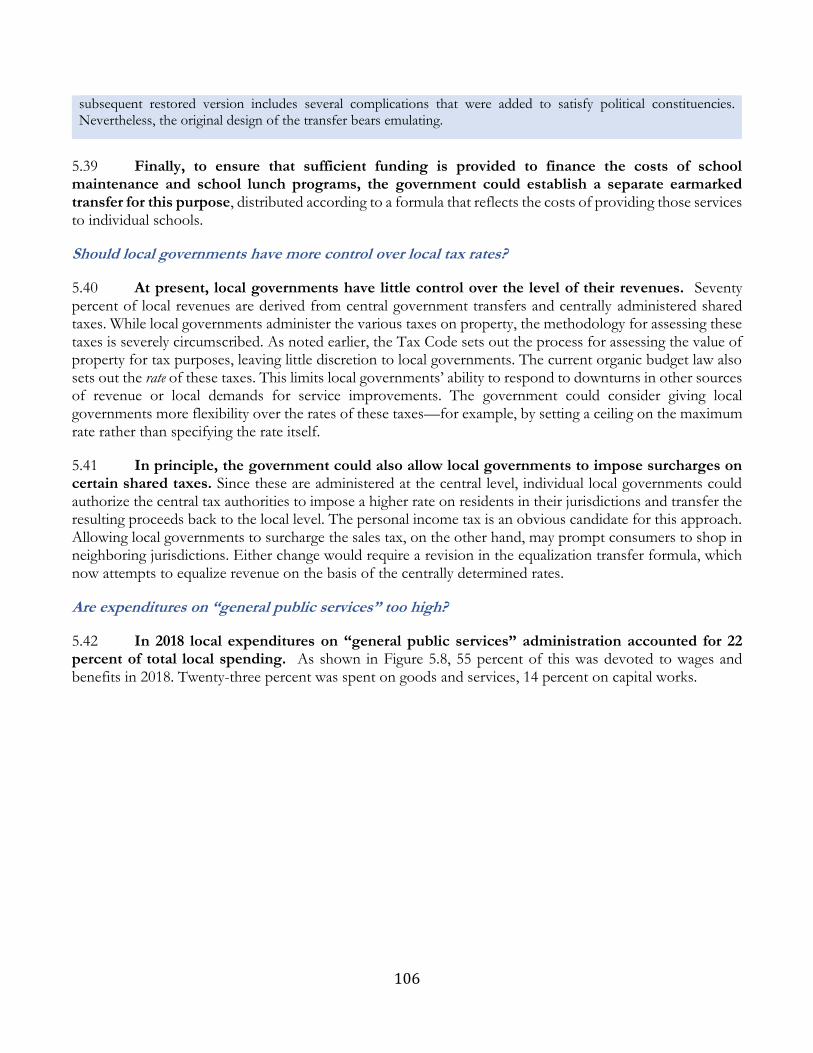
106
subsequent restored version includes several complications that were added to satisfy political constituencies. Nevertheless, the original design of the transfer bears emulating.
5.39 Finally, to ensure that sufficient funding is provided to finance the costs of school maintenance and school lunch programs, the government could establish a separate earmarked transfer for this purpose, distributed according to a formula that reflects the costs of providing those services to individual schools.
Should local governments have more control over local tax rates?
5.40 At present, local governments have little control over the level of their revenues. Seventy percent of local revenues are derived from central government transfers and centrally administered shared taxes. While local governments administer the various taxes on property, the methodology for assessing these taxes is severely circumscribed. As noted earlier, the Tax Code sets out the process for assessing the value of property for tax purposes, leaving little discretion to local governments. The current organic budget law also sets out the rate of these taxes. This limits local governments’ ability to respond to downturns in other sources of revenue or local demands for service improvements. The government could consider giving local governments more flexibility over the rates of these taxes—for example, by setting a ceiling on the maximum rate rather than specifying the rate itself.
5.41 In principle, the government could also allow local governments to impose surcharges on certain shared taxes. Since these are administered at the central level, individual local governments could authorize the central tax authorities to impose a higher rate on residents in their jurisdictions and transfer the resulting proceeds back to the local level. The personal income tax is an obvious candidate for this approach. Allowing local governments to surcharge the sales tax, on the other hand, may prompt consumers to shop in neighboring jurisdictions. Either change would require a revision in the equalization transfer formula, which now attempts to equalize revenue on the basis of the centrally determined rates.
Are expenditures on “general public services” too high?
5.42 In 2018 local expenditures on “general public services” administration accounted for 22 percent of total local spending. As shown in Figure 5.8, 55 percent of this was devoted to wages and benefits in 2018. Twenty-three percent was spent on goods and services, 14 percent on capital works.
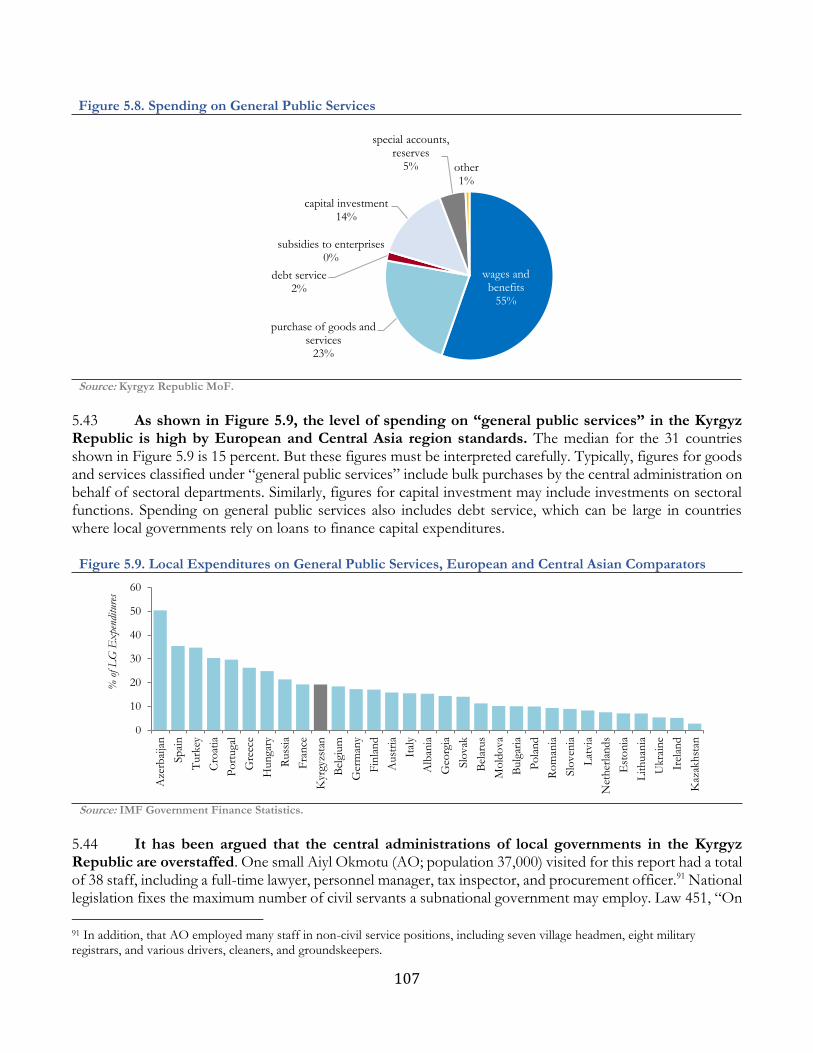
107
5.43 As shown in Figure 5.9, the level of spending on “general public services” in the Kyrgyz Republic is high by European and Central Asia region standards. The median for the 31 countries shown in Figure 5.9 is 15 percent. But these figures must be interpreted carefully. Typically, figures for goods and services classified under “general public services” include bulk purchases by the central administration on behalf of sectoral departments. Similarly, figures for capital investment may include investments on sectoral functions. Spending on general public services also includes debt service, which can be large in countries where local governments rely on loans to finance capital expenditures.
5.44 It has been argued that the central administrations of local governments in the Kyrgyz Republic are overstaffed. One small Aiyl Okmotu (AO; population 37,000) visited for this report had a total of 38 staff, including a full-time lawyer, personnel manager, tax inspector, and procurement officer.91 National legislation fixes the maximum number of civil servants a subnational government may employ. Law 451, “On
91 In addition, that AO employed many staff in non-civil service positions, including seven village headmen, eight military registrars, and various drivers, cleaners, and groundskeepers.
Figure 5.8. Spending on General Public Services
Source: Kyrgyz Republic MoF.
Figure 5.9. Local Expenditures on General Public Services, European and Central Asian Comparators
Source: IMF Government Finance Statistics.
wages and benefits
55%
purchase of goods and services
23%
debt service2%
subsidies to enterprises0%
capital investment14%
special accounts, reserves
5% other1%
0
10
20
30
40
50
60
Aze
rbai
jan
Sp
ain
Turk
ey
Cro
atia
Po
rtuga
l
Gre
ece
Hun
gary
Russ
ia
Fra
nce
Kyr
gyzs
tan
Bel
gium
Ger
man
y
Fin
lan
d
Aust
ria
Ital
y
Alb
ania
Geo
rgia
Slo
vak
Bel
arus
Mo
ldo
va
Bulg
aria
Po
lan
d
Ro
man
ia
Slo
ven
ia
Lat
via
Net
her
lan
ds
Est
on
ia
Lit
huan
ia
Ukra
ine
Irel
and
Kaz
akh
stan
% o
f L
G E
xpe
nditur
es
108
Approval of the Standard Structure and Staffing of the Executive Body of Local Self Governments of the Kyrgyz Republic” (as revised), sets out staffing ceilings for cities and AOs. Inter alia, it sets a ceiling on the number of executive-body staff in AOs (ranging from 9 to 24, based on the population of the AO) and authorizes an additional full-time position for the chief of each village (aiyl bashchysy) with a salary equal to that of a lead specialist according to the population. It also sets a ceiling on the number of executive-body staff in rayon-level cities (ranging from 18 to 24 depending on population) and oblast-level cities (ranging from 10 to 24, with individual ceilings set for each jurisdiction. (Separate legislation sets out the framework for personnel management and remuneration. See Box 5.4.)
5.45 The mission preparing this report did not have an opportunity to determine whether the existing ceilings are appropriate or whether they are observed in practice. In addition, it was not possible to investigate whether similar restrictions apply to non-civil positions and whether salaries are too low or too high. In the small AO referred to, the cost of paying the 38 staff was offset by the low salaries they receive. But to make ends meet, staff are forced to rely on secondary sources of income, such as small farm jobs or informal jobs (for example, as taxi drivers). At some future date, it would be useful to investigate local staffing and wage issues in detail. Such an investigation could take the form of: (1) a functional review, to determine whether staffing levels (both de jure and de facto) are appropriate; and (2) a pay and grading review, to determine whether wage levels are high enough to attract and retain qualified staff, but no higher than necessary.
Box 5.4. The Law on State Civil Service and Municipal Service
The Law on State Civil Service and Municipal Service (Law 162/2017 as amended by Laws 48/2019 and 109/2019) governs the terms of employment of civil servants holding administrative positions in local governments. Inter alia, it calls for:
The establishment of (1) a Council of State for Civil Service and Municipal Services, responsible for policymaking; (2) a civil service commission (referred to as “the authorized state body on affairs of state civil service and municipal service” to oversee the implementation of personnel policies; and (3) within each local government, a chief of staff or executive secretary (in the case of AOs), responsible for managing personnel within that jurisdiction;
A common grading system for municipal service positions, consisting of 10 grades ranging from junior inspector to first-class municipal advisor or municipal services;
A remuneration system based on that grading system, with individual salaries calculated on the basis of a single basic rate and multipliers based on grade and performance; and
The general procedures to be used in recruiting, evaluating, and terminating employees.
Would consolidating rural local governments reduce costs?
5.46 The government is considering consolidating rural local governments into larger units, with the expectation that this will reduce the unit costs of local services by allowing local governments to take advantage of economies of scale. As noted earlier, the Kyrgyz Republic now has roughly 450 rural local aiyl okmotus, with an average population of 4,800.
5.47 This argument must be evaluated skeptically. It is not clear whether consolidation will in fact
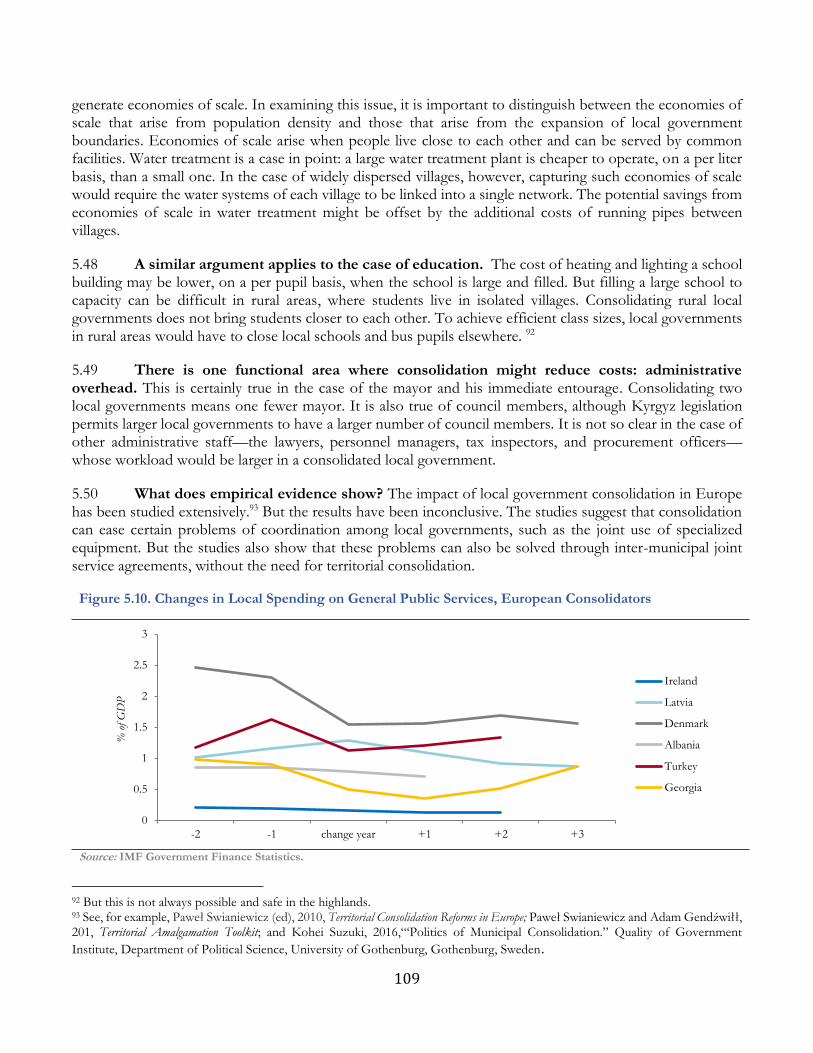
109
generate economies of scale. In examining this issue, it is important to distinguish between the economies of scale that arise from population density and those that arise from the expansion of local government boundaries. Economies of scale arise when people live close to each other and can be served by common facilities. Water treatment is a case in point: a large water treatment plant is cheaper to operate, on a per liter basis, than a small one. In the case of widely dispersed villages, however, capturing such economies of scale would require the water systems of each village to be linked into a single network. The potential savings from economies of scale in water treatment might be offset by the additional costs of running pipes between villages.
5.48 A similar argument applies to the case of education. The cost of heating and lighting a school building may be lower, on a per pupil basis, when the school is large and filled. But filling a large school to capacity can be difficult in rural areas, where students live in isolated villages. Consolidating rural local governments does not bring students closer to each other. To achieve efficient class sizes, local governments in rural areas would have to close local schools and bus pupils elsewhere. 92
5.49 There is one functional area where consolidation might reduce costs: administrative overhead. This is certainly true in the case of the mayor and his immediate entourage. Consolidating two local governments means one fewer mayor. It is also true of council members, although Kyrgyz legislation permits larger local governments to have a larger number of council members. It is not so clear in the case of other administrative staff—the lawyers, personnel managers, tax inspectors, and procurement officers—whose workload would be larger in a consolidated local government.
5.50 What does empirical evidence show? The impact of local government consolidation in Europe has been studied extensively.93 But the results have been inconclusive. The studies suggest that consolidation can ease certain problems of coordination among local governments, such as the joint use of specialized equipment. But the studies also show that these problems can also be solved through inter-municipal joint service agreements, without the need for territorial consolidation.
Figure 5.10. Changes in Local Spending on General Public Services, European Consolidators
Source: IMF Government Finance Statistics.
92 But this is not always possible and safe in the highlands. 93 See, for example, Paweł Swianiewicz (ed), 2010, Territorial Consolidation Reforms in Europe; Paweł Swianiewicz and Adam Gendzwiłł, 201, Territorial Amalgamation Toolkit; and Kohei Suzuki, 2016,“‘Politics of Municipal Consolidation.” Quality of Government
Institute, Department of Political Science, University of Gothenburg, Gothenburg, Sweden.
0
0.5
1
1.5
2
2.5
3
-2 -1 change year +1 +2 +3
% o
f G
DP
Ireland
Latvia
Denmark
Albania
Turkey
Georgia
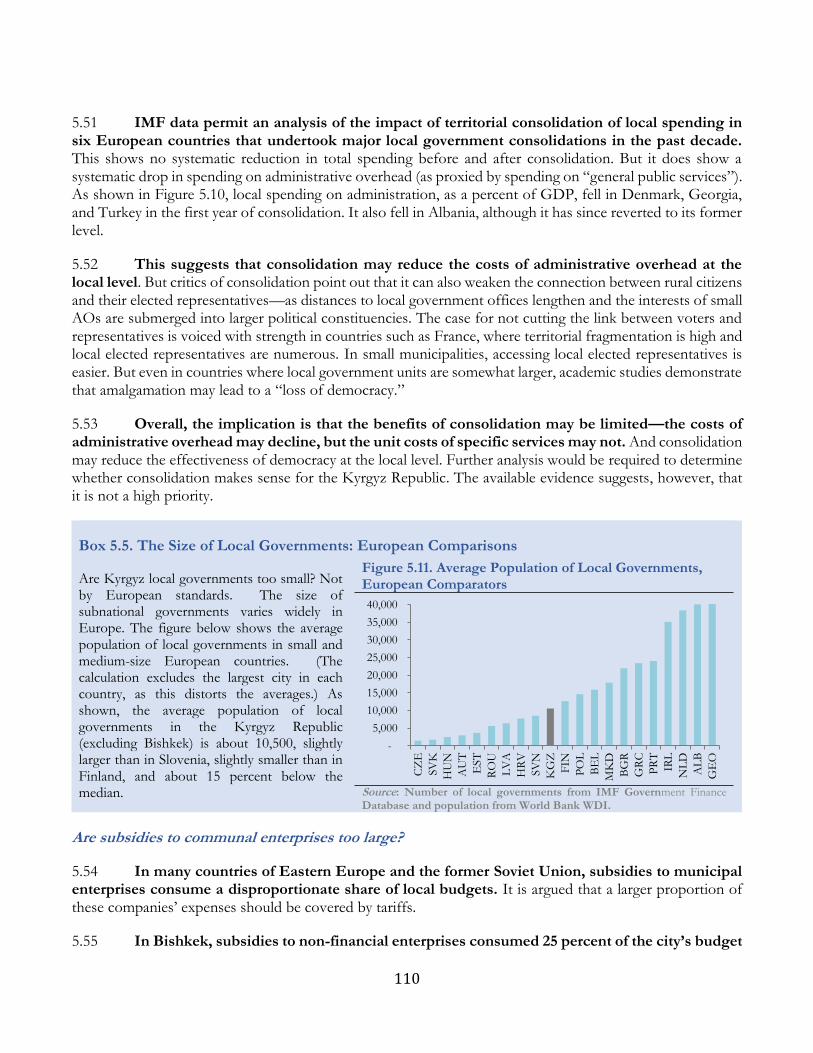
110
5.51 IMF data permit an analysis of the impact of territorial consolidation of local spending in six European countries that undertook major local government consolidations in the past decade. This shows no systematic reduction in total spending before and after consolidation. But it does show a systematic drop in spending on administrative overhead (as proxied by spending on “general public services”). As shown in Figure 5.10, local spending on administration, as a percent of GDP, fell in Denmark, Georgia, and Turkey in the first year of consolidation. It also fell in Albania, although it has since reverted to its former level.
5.52 This suggests that consolidation may reduce the costs of administrative overhead at the local level. But critics of consolidation point out that it can also weaken the connection between rural citizens and their elected representatives—as distances to local government offices lengthen and the interests of small AOs are submerged into larger political constituencies. The case for not cutting the link between voters and representatives is voiced with strength in countries such as France, where territorial fragmentation is high and local elected representatives are numerous. In small municipalities, accessing local elected representatives is easier. But even in countries where local government units are somewhat larger, academic studies demonstrate that amalgamation may lead to a “loss of democracy.”
5.53 Overall, the implication is that the benefits of consolidation may be limited—the costs of administrative overhead may decline, but the unit costs of specific services may not. And consolidation may reduce the effectiveness of democracy at the local level. Further analysis would be required to determine whether consolidation makes sense for the Kyrgyz Republic. The available evidence suggests, however, that it is not a high priority.
Box 5.5. The Size of Local Governments: European Comparisons
Are Kyrgyz local governments too small? Not by European standards. The size of subnational governments varies widely in Europe. The figure below shows the average population of local governments in small and medium-size European countries. (The calculation excludes the largest city in each country, as this distorts the averages.) As shown, the average population of local governments in the Kyrgyz Republic (excluding Bishkek) is about 10,500, slightly larger than in Slovenia, slightly smaller than in Finland, and about 15 percent below the median.
Figure 5.11. Average Population of Local Governments, European Comparators
Source: Number of local governments from IMF Government Finance Database and population from World Bank WDI.
Are subsidies to communal enterprises too large?
5.54 In many countries of Eastern Europe and the former Soviet Union, subsidies to municipal enterprises consume a disproportionate share of local budgets. It is argued that a larger proportion of these companies’ expenses should be covered by tariffs.
5.55 In Bishkek, subsidies to non-financial enterprises consumed 25 percent of the city’s budget
-
5,000
10,000
15,000
20,000
25,000
30,000
35,000
40,000
CZ
E
SV
K
HU
N
AU
T
EST
RO
U
LV
A
HR
V
SV
N
KG
Z
FIN
PO
L
BE
L
MK
D
BG
R
GR
C
PR
T
IRL
NL
D
AL
B
GE
O
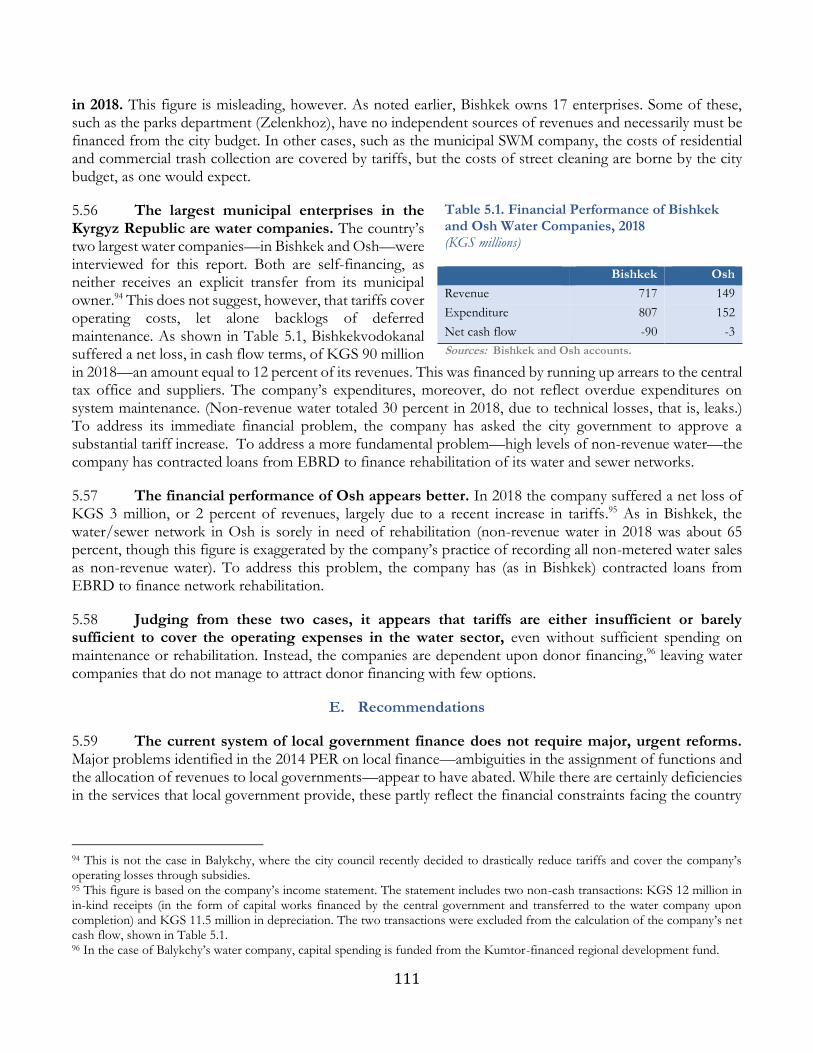
111
in 2018. This figure is misleading, however. As noted earlier, Bishkek owns 17 enterprises. Some of these, such as the parks department (Zelenkhoz), have no independent sources of revenues and necessarily must be financed from the city budget. In other cases, such as the municipal SWM company, the costs of residential and commercial trash collection are covered by tariffs, but the costs of street cleaning are borne by the city budget, as one would expect.
5.56 The largest municipal enterprises in the Kyrgyz Republic are water companies. The country’s two largest water companies—in Bishkek and Osh—were interviewed for this report. Both are self-financing, as neither receives an explicit transfer from its municipal owner.94 This does not suggest, however, that tariffs cover operating costs, let alone backlogs of deferred maintenance. As shown in Table 5.1, Bishkekvodokanal suffered a net loss, in cash flow terms, of KGS 90 million in 2018—an amount equal to 12 percent of its revenues. This was financed by running up arrears to the central tax office and suppliers. The company’s expenditures, moreover, do not reflect overdue expenditures on system maintenance. (Non-revenue water totaled 30 percent in 2018, due to technical losses, that is, leaks.) To address its immediate financial problem, the company has asked the city government to approve a substantial tariff increase. To address a more fundamental problem—high levels of non-revenue water—the company has contracted loans from EBRD to finance rehabilitation of its water and sewer networks.
5.57 The financial performance of Osh appears better. In 2018 the company suffered a net loss of KGS 3 million, or 2 percent of revenues, largely due to a recent increase in tariffs.95 As in Bishkek, the water/sewer network in Osh is sorely in need of rehabilitation (non-revenue water in 2018 was about 65 percent, though this figure is exaggerated by the company’s practice of recording all non-metered water sales as non-revenue water). To address this problem, the company has (as in Bishkek) contracted loans from EBRD to finance network rehabilitation.
5.58 Judging from these two cases, it appears that tariffs are either insufficient or barely sufficient to cover the operating expenses in the water sector, even without sufficient spending on maintenance or rehabilitation. Instead, the companies are dependent upon donor financing,96 leaving water companies that do not manage to attract donor financing with few options.
Recommendations
5.59 The current system of local government finance does not require major, urgent reforms. Major problems identified in the 2014 PER on local finance—ambiguities in the assignment of functions and the allocation of revenues to local governments—appear to have abated. While there are certainly deficiencies in the services that local government provide, these partly reflect the financial constraints facing the country
94 This is not the case in Balykchy, where the city council recently decided to drastically reduce tariffs and cover the company’s operating losses through subsidies. 95 This figure is based on the company’s income statement. The statement includes two non-cash transactions: KGS 12 million in in-kind receipts (in the form of capital works financed by the central government and transferred to the water company upon completion) and KGS 11.5 million in depreciation. The two transactions were excluded from the calculation of the company’s net cash flow, shown in Table 5.1. 96 In the case of Balykchy’s water company, capital spending is funded from the Kumtor-financed regional development fund.
Table 5.1. Financial Performance of Bishkek and Osh Water Companies, 2018 (KGS millions)
Bishkek Osh
Revenue 717 149
Expenditure 807 152
Net cash flow -90 -3
Sources: Bishkek and Osh accounts.
112
as a whole and will partly dissipate as the economy grows.
5.60 In the short term, however, several modest improvements bear consideration. First, allow local governments to impose higher tax rates on their constituents. One approach is to allow local governments more discretion in determining the rate of the property tax. As noted earlier, the central government now fixes the tax rate throughout the country (for residential property) at 0.35 percent. It also mandates an exemption of KSG 5,000 for owner-occupied properties, as well as reductions in assessments for properties not located in Bishkek. Instead of imposing a universal rate of 0.35 percent, permit local governments to impose a rate within a range—say, 0.35–1 percent—and remove the mandatory reduction for properties not located in Bishkek. An alternative is to allow local governments to impose a surcharge on the PIT. The PIT is now imposed by the central government, as stated, at a flat rate of 10 percent, with 50 percent of the proceeds shared with the local governments on the basis of origin (as of 2018). The government proposes to increase the local share of the PIT until it reaches 100 percent in 2021. In principle, local governments could be permitted to impose a higher rate within their jurisdictions, for example, up to 15 percent.97 Note that either measure is likely to benefit Bishkek more than other jurisdictions, as property values and incomes subject to the PIT are higher in Bishkek than elsewhere.
5.61 Second, simplify the transfer system. Although the current formula is successful in reducing disparities in per capita revenues among local governments, it is far from transparent. A similar outcome could be achieved with a simpler formula. For example, the government could refrain from adjusting the amount of the transfer to reflect variations in the cost of providing specific services and focus only on narrowing disparities in per capita revenues. Similarly, it could refrain from calculating the potential revenues from various sources and simply rely on historical data. The government could also narrow the number of taxes that enter the revenue calculation. Rather than including both centrally and locally administered taxes, the equalization transfer could aim to reduce disparities only in taxes administered by the central government. This would have the additional benefit of encouraging local governments to exploit the taxes they administer, since increasing revenues from such sources would not reduce the number of transfers received. Under this overall approach, the amount of the transfer to a given jurisdiction could be based on the size of the gap between its per capita revenues from centrally administered taxes (the PIT, sales tax, patent-based taxes) and the average for its group (that is, oblast-level cities, rayon-level cities, and AOs). In calculating the amount of the transfer, the government could either (1) undertake to bring all jurisdictions with below-average revenues up to a fixed percentage of the average for their group; or (2) allocate a fixed amount according to the size of each jurisdiction’s fiscal gap.
5.62 Over time, the government may wish to examine several issues that could not be addressed in detail by this report. These include local government personnel policies, particularly with respect to staffing levels and wages. To this end, the government could commission functional reviews to assess staffing levels. In addition, a pay and grading review would determine whether the current local pay levels are sufficient—but no more than sufficient—to attract and retain qualified staff. It should be noted that both exercises can be politically controversial. One of the aims of a functional review is to identify positions that should be eliminated. Such results will not be welcomed by the current occupants of such positions. The government (or the local governments) will need to offer generous severance payments to persuade affected staff to leave voluntarily—or will need to wait until the staff retire. Pay and grading reforms can also generate controversy. Some positions may turn out to be over-graded or overpaid, in which case salary reductions would be called for. At the same time, some positions may be under-graded or underpaid, in which case costly
97 More precisely, a local government could be permitted to authorize the central government to impose a higher rate and remit the amount to that local government.

113
increases in the wage bill may be required. Before undertaking such exercises, the government will have to be sure that it is willing to bear the political costs of implementing them.
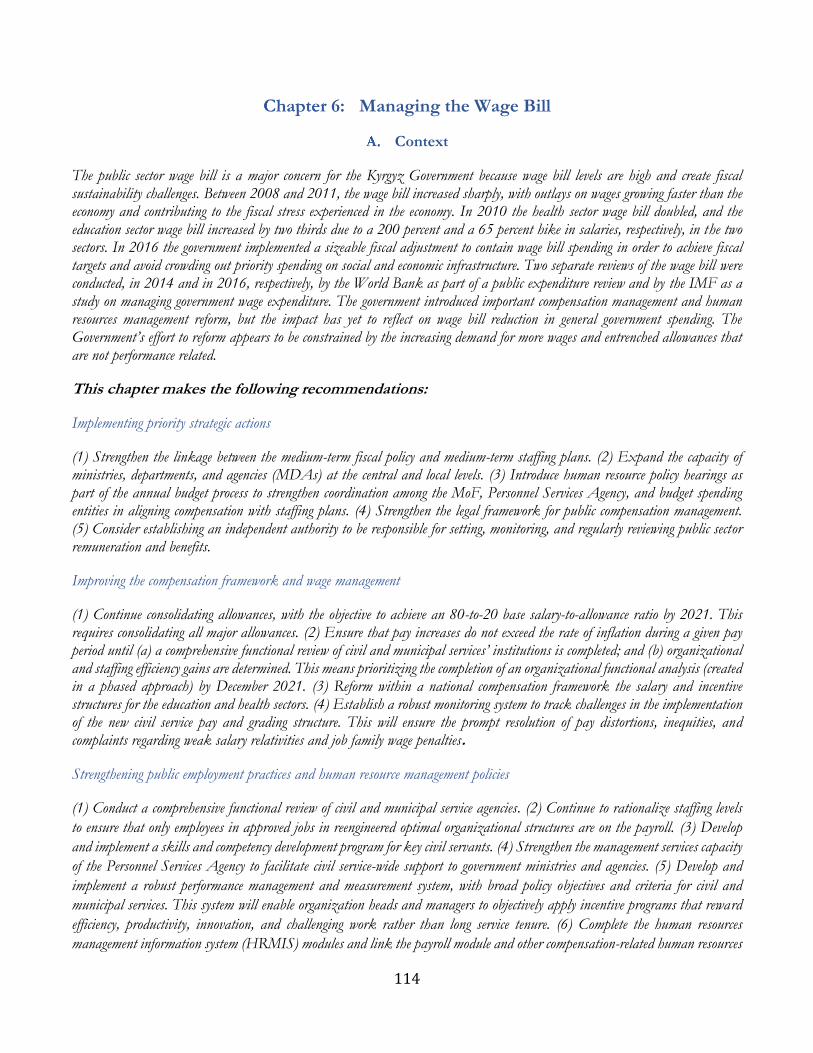
114
Managing the Wage Bill
Context
The public sector wage bill is a major concern for the Kyrgyz Government because wage bill levels are high and create fiscal sustainability challenges. Between 2008 and 2011, the wage bill increased sharply, with outlays on wages growing faster than the economy and contributing to the fiscal stress experienced in the economy. In 2010 the health sector wage bill doubled, and the education sector wage bill increased by two thirds due to a 200 percent and a 65 percent hike in salaries, respectively, in the two sectors. In 2016 the government implemented a sizeable fiscal adjustment to contain wage bill spending in order to achieve fiscal targets and avoid crowding out priority spending on social and economic infrastructure. Two separate reviews of the wage bill were conducted, in 2014 and in 2016, respectively, by the World Bank as part of a public expenditure review and by the IMF as a study on managing government wage expenditure. The government introduced important compensation management and human resources management reform, but the impact has yet to reflect on wage bill reduction in general government spending. The Government’s effort to reform appears to be constrained by the increasing demand for more wages and entrenched allowances that are not performance related.
This chapter makes the following recommendations:
Implementing priority strategic actions
(1) Strengthen the linkage between the medium-term fiscal policy and medium-term staffing plans. (2) Expand the capacity of ministries, departments, and agencies (MDAs) at the central and local levels. (3) Introduce human resource policy hearings as part of the annual budget process to strengthen coordination among the MoF, Personnel Services Agency, and budget spending entities in aligning compensation with staffing plans. (4) Strengthen the legal framework for public compensation management. (5) Consider establishing an independent authority to be responsible for setting, monitoring, and regularly reviewing public sector remuneration and benefits.
Improving the compensation framework and wage management
(1) Continue consolidating allowances, with the objective to achieve an 80-to-20 base salary-to-allowance ratio by 2021. This requires consolidating all major allowances. (2) Ensure that pay increases do not exceed the rate of inflation during a given pay period until (a) a comprehensive functional review of civil and municipal services’ institutions is completed; and (b) organizational and staffing efficiency gains are determined. This means prioritizing the completion of an organizational functional analysis (created in a phased approach) by December 2021. (3) Reform within a national compensation framework the salary and incentive structures for the education and health sectors. (4) Establish a robust monitoring system to track challenges in the implementation of the new civil service pay and grading structure. This will ensure the prompt resolution of pay distortions, inequities, and complaints regarding weak salary relativities and job family wage penalties.
Strengthening public employment practices and human resource management policies
(1) Conduct a comprehensive functional review of civil and municipal service agencies. (2) Continue to rationalize staffing levels
to ensure that only employees in approved jobs in reengineered optimal organizational structures are on the payroll. (3) Develop
and implement a skills and competency development program for key civil servants. (4) Strengthen the management services capacity
of the Personnel Services Agency to facilitate civil service-wide support to government ministries and agencies. (5) Develop and
implement a robust performance management and measurement system, with broad policy objectives and criteria for civil and
municipal services. This system will enable organization heads and managers to objectively apply incentive programs that reward
efficiency, productivity, innovation, and challenging work rather than long service tenure. (6) Complete the human resources
management information system (HRMIS) modules and link the payroll module and other compensation-related human resources
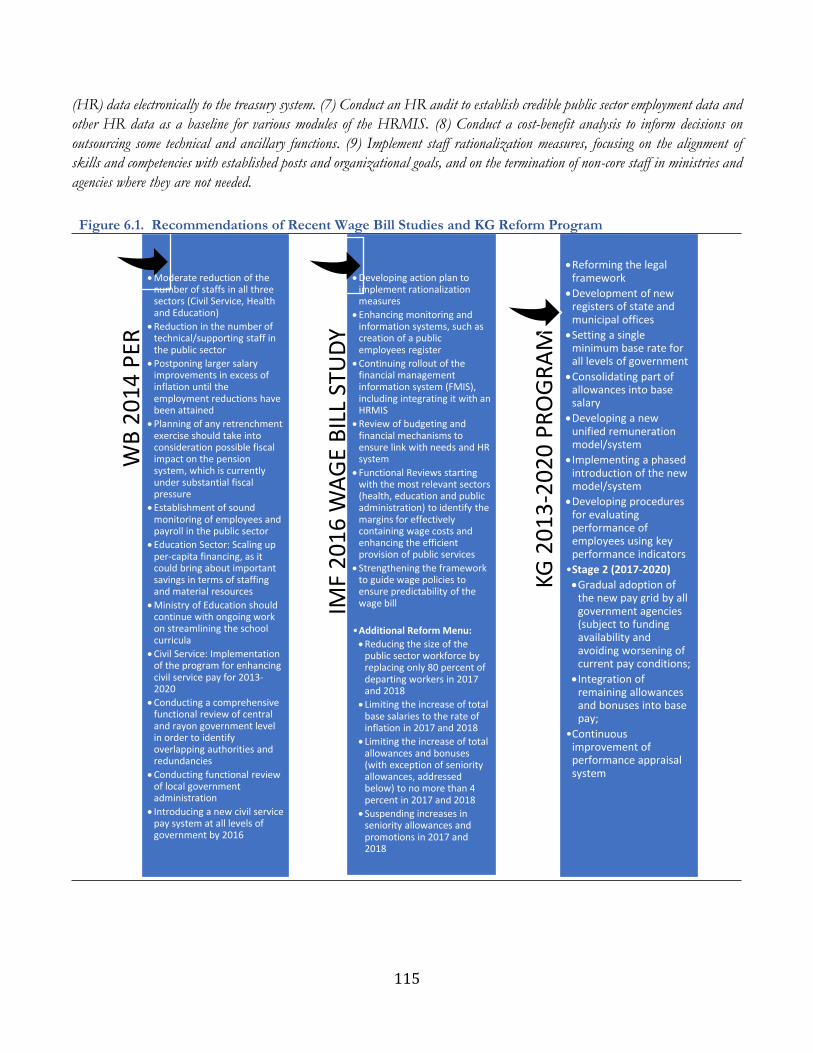
115
(HR) data electronically to the treasury system. (7) Conduct an HR audit to establish credible public sector employment data and
other HR data as a baseline for various modules of the HRMIS. (8) Conduct a cost-benefit analysis to inform decisions on
outsourcing some technical and ancillary functions. (9) Implement staff rationalization measures, focusing on the alignment of
skills and competencies with established posts and organizational goals, and on the termination of non-core staff in ministries and
agencies where they are not needed.
Figure 6.1. Recommendations of Recent Wage Bill Studies and KG Reform Program
WB
20
14
PER
•Moderate reduction of the number of staffs in all three sectors (Civil Service, Health and Education)
•Reduction in the number of technical/supporting staff in the public sector
•Postponing larger salary improvements in excess of inflation until the employment reductions have been attained
•Planning of any retrenchment exercise should take into consideration possible fiscal impact on the pension system, which is currently under substantial fiscal pressure
•Establishment of sound monitoring of employees and payroll in the public sector
•Education Sector: Scaling up per-capita financing, as it could bring about important savings in terms of staffing and material resources
•Ministry of Education should continue with ongoing work on streamlining the school curricula
•Civil Service: Implementation of the program for enhancing civil service pay for 2013-2020
•Conducting a comprehensive functional review of central and rayon government level in order to identify overlapping authorities and redundancies
•Conducting functional review of local government administration
• Introducing a new civil service pay system at all levels of government by 2016
IMF
20
16
WA
GE
BIL
L ST
UD
Y
•Developing action plan to implement rationalization measures
•Enhancing monitoring and information systems, such as creation of a public employees register
•Continuing rollout of the financial management information system (FMIS), including integrating it with an HRMIS
•Review of budgeting and financial mechanisms to ensure link with needs and HR system
•Functional Reviews starting with the most relevant sectors (health, education and public administration) to identify the margins for effectively containing wage costs and enhancing the efficient provision of public services
•Strengthening the framework to guide wage policies to ensure predictability of the wage bill
•Additional Reform Menu:
•Reducing the size of the public sector workforce by replacing only 80 percent of departing workers in 2017 and 2018
•Limiting the increase of total base salaries to the rate of inflation in 2017 and 2018
•Limiting the increase of total allowances and bonuses (with exception of seniority allowances, addressed below) to no more than 4 percent in 2017 and 2018
•Suspending increases in seniority allowances and promotions in 2017 and 2018
KG 2
01
3-2
02
0 P
RO
GR
AM
•Reforming the legal framework
•Development of new registers of state and municipal offices
•Setting a single minimum base rate for all levels of government
•Consolidating part of allowances into base salary
•Developing a new unified remuneration model/system
•Implementing a phased introduction of the new model/system
•Developing procedures for evaluating performance of employees using key performance indicators
•Stage 2 (2017-2020)
•Gradual adoption of the new pay grid by all government agencies (subject to funding availability and avoiding worsening of current pay conditions;
•Integration of remaining allowances and bonuses into base pay;
•Continuous improvement of performance appraisal system
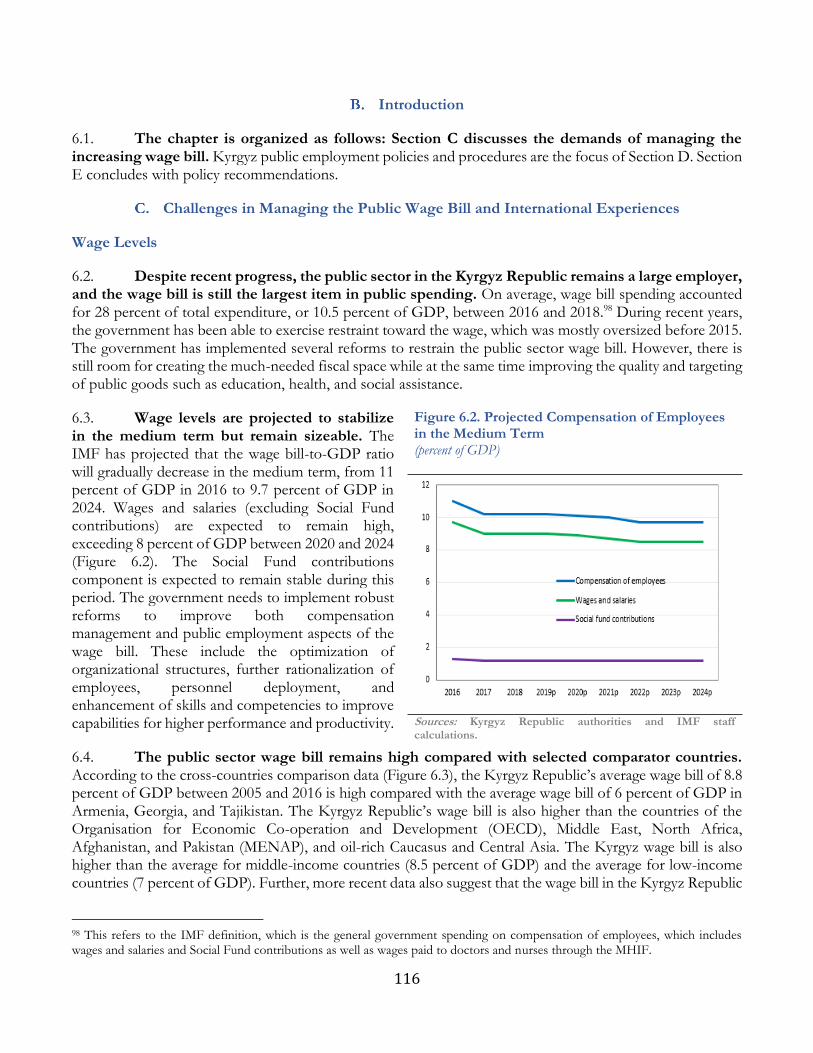
116
Introduction
6.1. The chapter is organized as follows: Section C discusses the demands of managing the increasing wage bill. Kyrgyz public employment policies and procedures are the focus of Section D. Section E concludes with policy recommendations.
Challenges in Managing the Public Wage Bill and International Experiences
Wage Levels
6.2. Despite recent progress, the public sector in the Kyrgyz Republic remains a large employer, and the wage bill is still the largest item in public spending. On average, wage bill spending accounted for 28 percent of total expenditure, or 10.5 percent of GDP, between 2016 and 2018.98 During recent years, the government has been able to exercise restraint toward the wage, which was mostly oversized before 2015. The government has implemented several reforms to restrain the public sector wage bill. However, there is still room for creating the much-needed fiscal space while at the same time improving the quality and targeting of public goods such as education, health, and social assistance.
6.3. Wage levels are projected to stabilize in the medium term but remain sizeable. The IMF has projected that the wage bill-to-GDP ratio will gradually decrease in the medium term, from 11 percent of GDP in 2016 to 9.7 percent of GDP in 2024. Wages and salaries (excluding Social Fund contributions) are expected to remain high, exceeding 8 percent of GDP between 2020 and 2024 (Figure 6.2). The Social Fund contributions component is expected to remain stable during this period. The government needs to implement robust reforms to improve both compensation management and public employment aspects of the wage bill. These include the optimization of organizational structures, further rationalization of employees, personnel deployment, and enhancement of skills and competencies to improve capabilities for higher performance and productivity.
6.4. The public sector wage bill remains high compared with selected comparator countries. According to the cross-countries comparison data (Figure 6.3), the Kyrgyz Republic’s average wage bill of 8.8 percent of GDP between 2005 and 2016 is high compared with the average wage bill of 6 percent of GDP in Armenia, Georgia, and Tajikistan. The Kyrgyz Republic’s wage bill is also higher than the countries of the Organisation for Economic Co-operation and Development (OECD), Middle East, North Africa, Afghanistan, and Pakistan (MENAP), and oil-rich Caucasus and Central Asia. The Kyrgyz wage bill is also higher than the average for middle-income countries (8.5 percent of GDP) and the average for low-income countries (7 percent of GDP). Further, more recent data also suggest that the wage bill in the Kyrgyz Republic
98 This refers to the IMF definition, which is the general government spending on compensation of employees, which includes wages and salaries and Social Fund contributions as well as wages paid to doctors and nurses through the MHIF.
Figure 6.2. Projected Compensation of Employees in the Medium Term (percent of GDP)
Sources: Kyrgyz Republic authorities and IMF staff calculations.
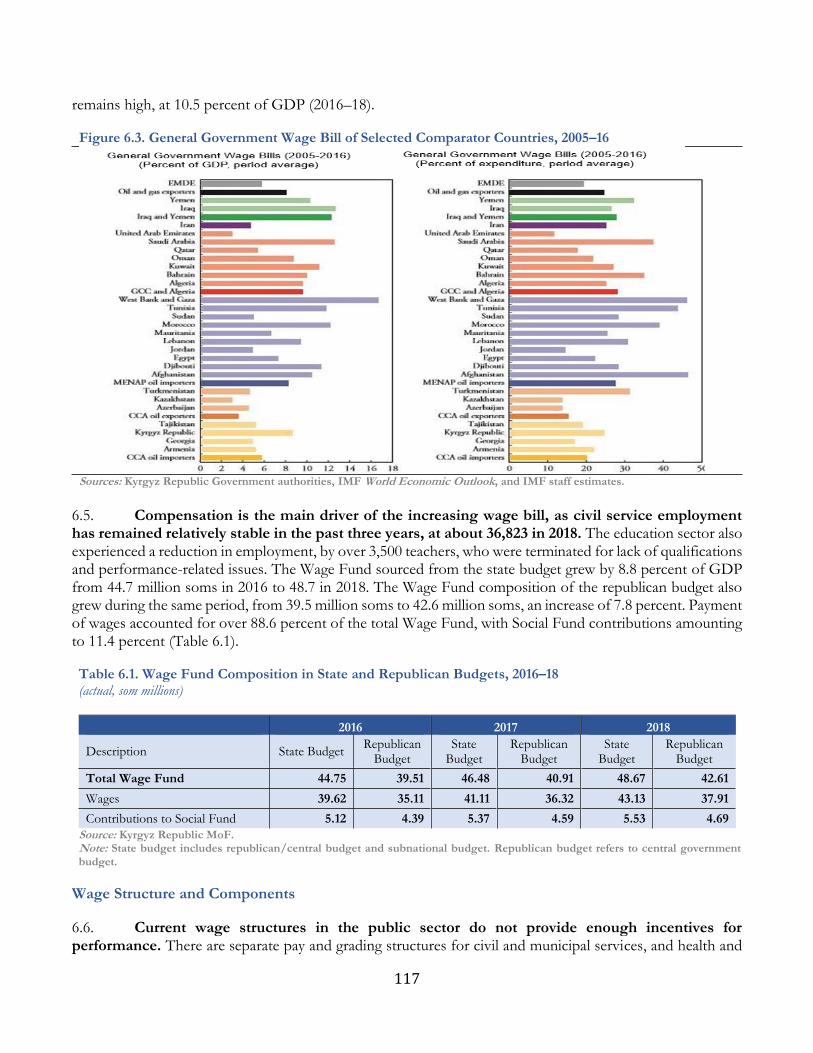
117
remains high, at 10.5 percent of GDP (2016–18).
Figure 6.3. General Government Wage Bill of Selected Comparator Countries, 2005–16
Sources: Kyrgyz Republic Government authorities, IMF World Economic Outlook, and IMF staff estimates.
6.5. Compensation is the main driver of the increasing wage bill, as civil service employment has remained relatively stable in the past three years, at about 36,823 in 2018. The education sector also experienced a reduction in employment, by over 3,500 teachers, who were terminated for lack of qualifications and performance-related issues. The Wage Fund sourced from the state budget grew by 8.8 percent of GDP from 44.7 million soms in 2016 to 48.7 in 2018. The Wage Fund composition of the republican budget also grew during the same period, from 39.5 million soms to 42.6 million soms, an increase of 7.8 percent. Payment of wages accounted for over 88.6 percent of the total Wage Fund, with Social Fund contributions amounting to 11.4 percent (Table 6.1).
Table 6.1. Wage Fund Composition in State and Republican Budgets, 2016–18 (actual, som millions)
2016 2017 2018
Description State Budget Republican
Budget State
Budget Republican
Budget State
Budget Republican
Budget
Total Wage Fund 44.75 39.51 46.48 40.91 48.67 42.61
Wages 39.62 35.11 41.11 36.32 43.13 37.91
Contributions to Social Fund 5.12 4.39 5.37 4.59 5.53 4.69
Source: Kyrgyz Republic MoF. Note: State budget includes republican/central budget and subnational budget. Republican budget refers to central government budget.
Wage Structure and Components
6.6. Current wage structures in the public sector do not provide enough incentives for performance. There are separate pay and grading structures for civil and municipal services, and health and
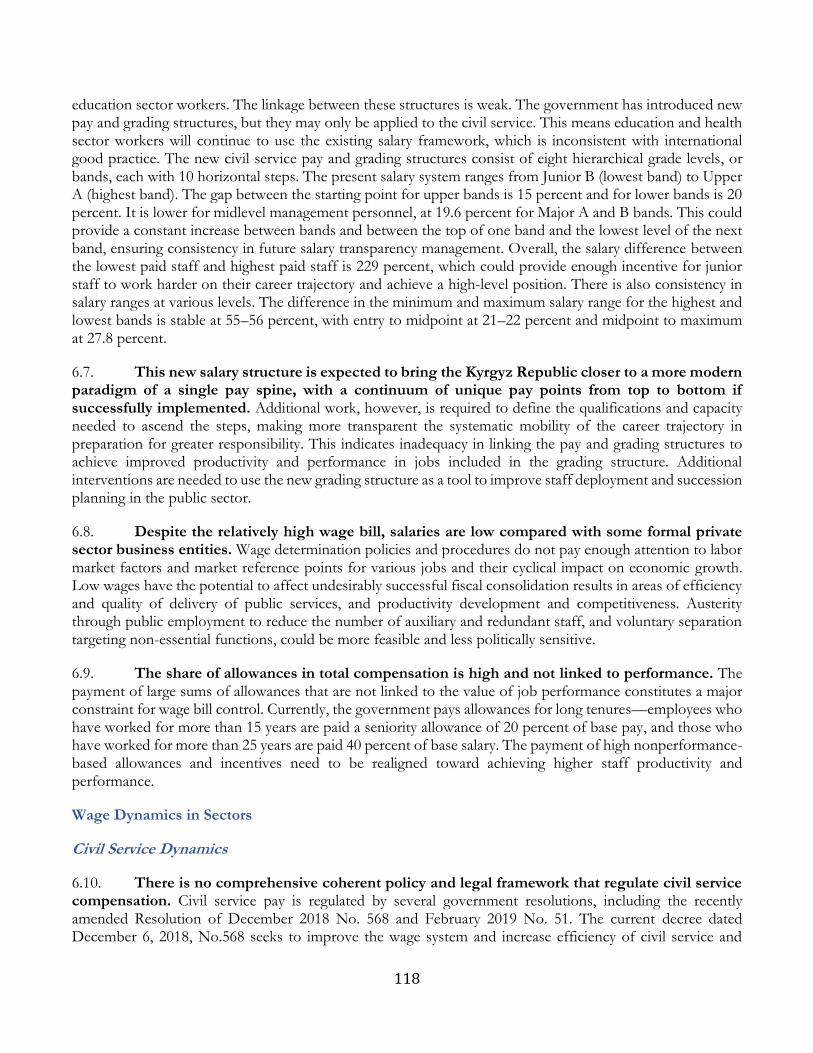
118
education sector workers. The linkage between these structures is weak. The government has introduced new pay and grading structures, but they may only be applied to the civil service. This means education and health sector workers will continue to use the existing salary framework, which is inconsistent with international good practice. The new civil service pay and grading structures consist of eight hierarchical grade levels, or bands, each with 10 horizontal steps. The present salary system ranges from Junior B (lowest band) to Upper A (highest band). The gap between the starting point for upper bands is 15 percent and for lower bands is 20 percent. It is lower for midlevel management personnel, at 19.6 percent for Major A and B bands. This could provide a constant increase between bands and between the top of one band and the lowest level of the next band, ensuring consistency in future salary transparency management. Overall, the salary difference between the lowest paid staff and highest paid staff is 229 percent, which could provide enough incentive for junior staff to work harder on their career trajectory and achieve a high-level position. There is also consistency in salary ranges at various levels. The difference in the minimum and maximum salary range for the highest and lowest bands is stable at 55–56 percent, with entry to midpoint at 21–22 percent and midpoint to maximum at 27.8 percent.
6.7. This new salary structure is expected to bring the Kyrgyz Republic closer to a more modern paradigm of a single pay spine, with a continuum of unique pay points from top to bottom if successfully implemented. Additional work, however, is required to define the qualifications and capacity needed to ascend the steps, making more transparent the systematic mobility of the career trajectory in preparation for greater responsibility. This indicates inadequacy in linking the pay and grading structures to achieve improved productivity and performance in jobs included in the grading structure. Additional interventions are needed to use the new grading structure as a tool to improve staff deployment and succession planning in the public sector.
6.8. Despite the relatively high wage bill, salaries are low compared with some formal private sector business entities. Wage determination policies and procedures do not pay enough attention to labor market factors and market reference points for various jobs and their cyclical impact on economic growth. Low wages have the potential to affect undesirably successful fiscal consolidation results in areas of efficiency and quality of delivery of public services, and productivity development and competitiveness. Austerity through public employment to reduce the number of auxiliary and redundant staff, and voluntary separation targeting non-essential functions, could be more feasible and less politically sensitive.
6.9. The share of allowances in total compensation is high and not linked to performance. The payment of large sums of allowances that are not linked to the value of job performance constitutes a major constraint for wage bill control. Currently, the government pays allowances for long tenures—employees who have worked for more than 15 years are paid a seniority allowance of 20 percent of base pay, and those who have worked for more than 25 years are paid 40 percent of base salary. The payment of high nonperformance-based allowances and incentives need to be realigned toward achieving higher staff productivity and performance.
Wage Dynamics in Sectors
Civil Service Dynamics
6.10. There is no comprehensive coherent policy and legal framework that regulate civil service compensation. Civil service pay is regulated by several government resolutions, including the recently amended Resolution of December 2018 No. 568 and February 2019 No. 51. The current decree dated December 6, 2018, No.568 seeks to improve the wage system and increase efficiency of civil service and
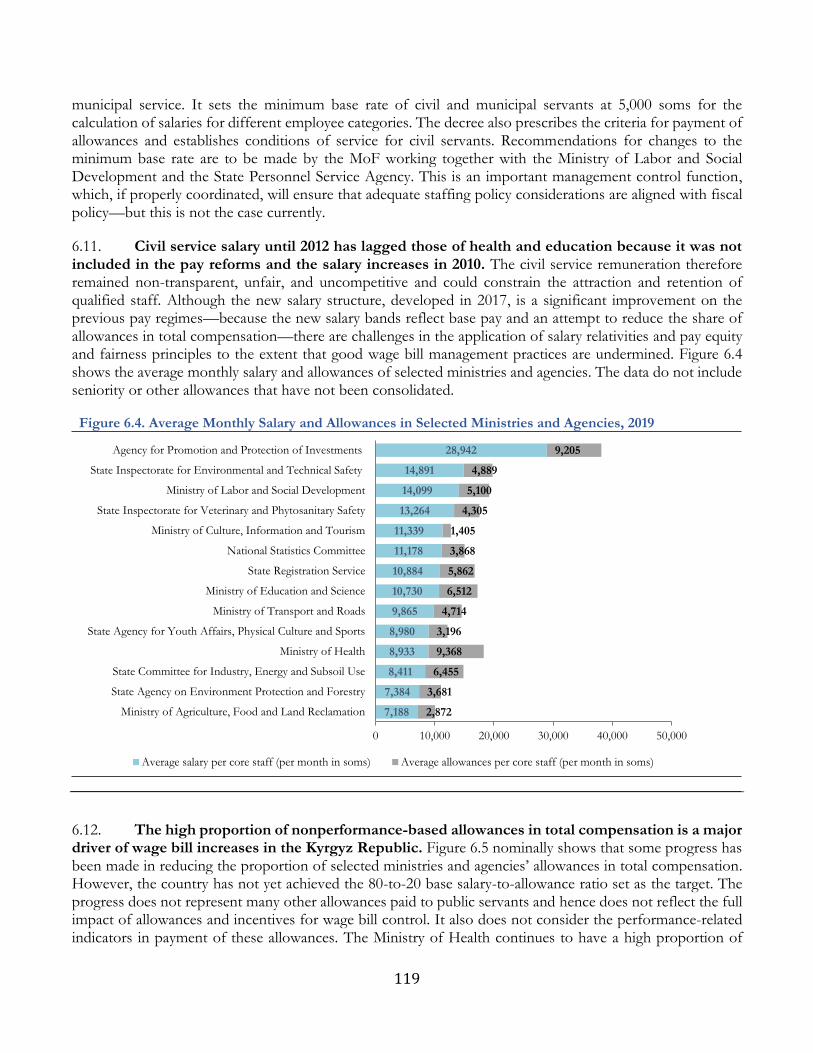
119
municipal service. It sets the minimum base rate of civil and municipal servants at 5,000 soms for the calculation of salaries for different employee categories. The decree also prescribes the criteria for payment of allowances and establishes conditions of service for civil servants. Recommendations for changes to the minimum base rate are to be made by the MoF working together with the Ministry of Labor and Social Development and the State Personnel Service Agency. This is an important management control function, which, if properly coordinated, will ensure that adequate staffing policy considerations are aligned with fiscal policy—but this is not the case currently.
6.11. Civil service salary until 2012 has lagged those of health and education because it was not included in the pay reforms and the salary increases in 2010. The civil service remuneration therefore remained non-transparent, unfair, and uncompetitive and could constrain the attraction and retention of qualified staff. Although the new salary structure, developed in 2017, is a significant improvement on the previous pay regimes—because the new salary bands reflect base pay and an attempt to reduce the share of allowances in total compensation—there are challenges in the application of salary relativities and pay equity and fairness principles to the extent that good wage bill management practices are undermined. Figure 6.4 shows the average monthly salary and allowances of selected ministries and agencies. The data do not include seniority or other allowances that have not been consolidated.
Figure 6.4. Average Monthly Salary and Allowances in Selected Ministries and Agencies, 2019
6.12. The high proportion of nonperformance-based allowances in total compensation is a major driver of wage bill increases in the Kyrgyz Republic. Figure 6.5 nominally shows that some progress has been made in reducing the proportion of selected ministries and agencies’ allowances in total compensation. However, the country has not yet achieved the 80-to-20 base salary-to-allowance ratio set as the target. The progress does not represent many other allowances paid to public servants and hence does not reflect the full impact of allowances and incentives for wage bill control. It also does not consider the performance-related indicators in payment of these allowances. The Ministry of Health continues to have a high proportion of
7,188
7,384
8,411
8,933
8,980
9,865
10,730
10,884
11,178
11,339
13,264
14,099
14,891
28,942
2,872
3,681
6,455
9,368
3,196
4,714
6,512
5,862
3,868
1,405
4,305
5,100
4,889
9,205
0 10,000 20,000 30,000 40,000 50,000
Ministry of Agriculture, Food and Land Reclamation
State Agency on Environment Protection and Forestry
State Committee for Industry, Energy and Subsoil Use
Ministry of Health
State Agency for Youth Affairs, Physical Culture and Sports
Ministry of Transport and Roads
Ministry of Education and Science
State Registration Service
National Statistics Committee
Ministry of Culture, Information and Tourism
State Inspectorate for Veterinary and Phytosanitary Safety
Ministry of Labor and Social Development
State Inspectorate for Environmental and Technical Safety
Agency for Promotion and Protection of Investments
Average salary per core staff (per month in soms) Average allowances per core staff (per month in soms)
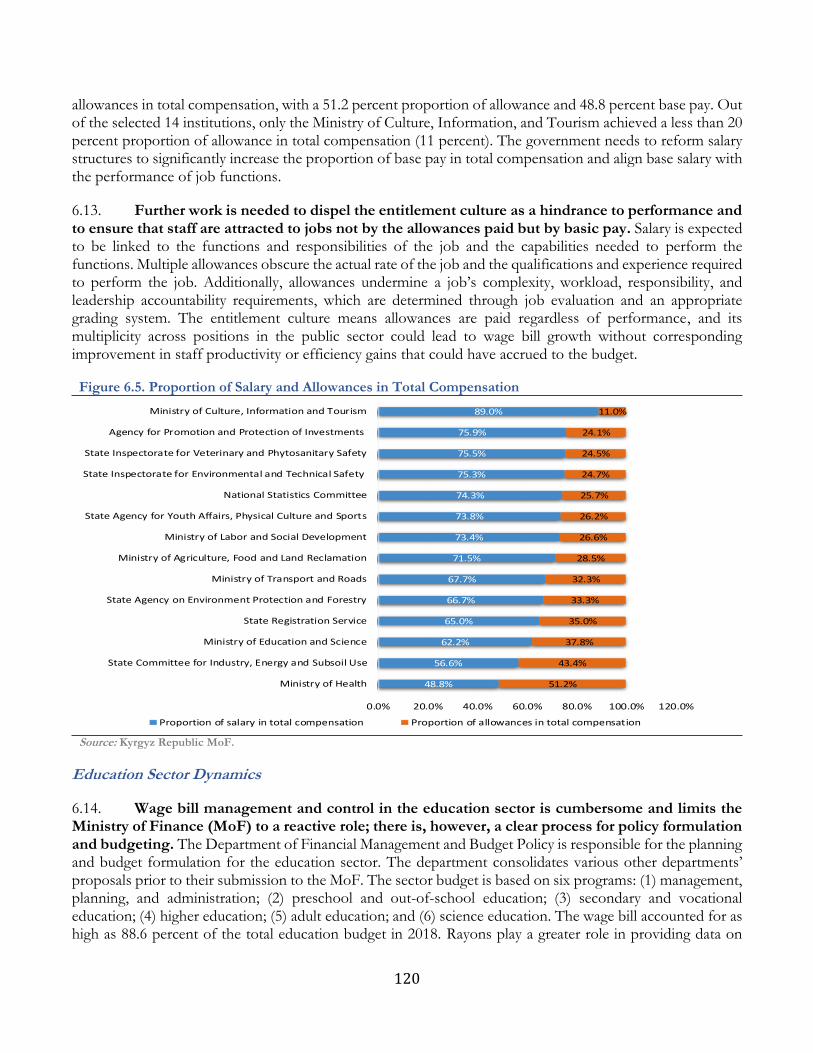
120
allowances in total compensation, with a 51.2 percent proportion of allowance and 48.8 percent base pay. Out of the selected 14 institutions, only the Ministry of Culture, Information, and Tourism achieved a less than 20 percent proportion of allowance in total compensation (11 percent). The government needs to reform salary structures to significantly increase the proportion of base pay in total compensation and align base salary with the performance of job functions.
6.13. Further work is needed to dispel the entitlement culture as a hindrance to performance and to ensure that staff are attracted to jobs not by the allowances paid but by basic pay. Salary is expected to be linked to the functions and responsibilities of the job and the capabilities needed to perform the functions. Multiple allowances obscure the actual rate of the job and the qualifications and experience required to perform the job. Additionally, allowances undermine a job’s complexity, workload, responsibility, and leadership accountability requirements, which are determined through job evaluation and an appropriate grading system. The entitlement culture means allowances are paid regardless of performance, and its multiplicity across positions in the public sector could lead to wage bill growth without corresponding improvement in staff productivity or efficiency gains that could have accrued to the budget.
Figure 6.5. Proportion of Salary and Allowances in Total Compensation
Source: Kyrgyz Republic MoF.
Education Sector Dynamics
6.14. Wage bill management and control in the education sector is cumbersome and limits the Ministry of Finance (MoF) to a reactive role; there is, however, a clear process for policy formulation and budgeting. The Department of Financial Management and Budget Policy is responsible for the planning and budget formulation for the education sector. The department consolidates various other departments’ proposals prior to their submission to the MoF. The sector budget is based on six programs: (1) management, planning, and administration; (2) preschool and out-of-school education; (3) secondary and vocational education; (4) higher education; (5) adult education; and (6) science education. The wage bill accounted for as high as 88.6 percent of the total education budget in 2018. Rayons play a greater role in providing data on
48.8%
56.6%
62.2%
65.0%
66.7%
67.7%
71.5%
73.4%
73.8%
74.3%
75.3%
75.5%
75.9%
89.0%
51.2%
43.4%
37.8%
35.0%
33.3%
32.3%
28.5%
26.6%
26.2%
25.7%
24.7%
24.5%
24.1%
11.0%
0.0% 20.0% 40.0% 60.0% 80.0% 100.0% 120.0%
Ministry of Health
State Committee for Industry, Energy and Subsoil Use
Ministry of Education and Science
State Registration Service
State Agency on Environment Protection and Forestry
Ministry of Transport and Roads
Ministry of Agriculture, Food and Land Reclamation
Ministry of Labor and Social Development
State Agency for Youth Affairs, Physical Culture and Sports
National Statistics Committee
State Inspectorate for Environmental and Technical Safety
State Inspectorate for Veterinary and Phytosanitary Safety
Agency for Promotion and Protection of Investments
Ministry of Culture, Information and Tourism
Proportion of salary in total compensation Proportion of allowances in total compensation
121
personnel and hours of work by staff. The estimates are agreed on with the director and Trade Union Committee and approved by the rayon’s Education Department. The wage bill control function is exercised by the Ministry of Education and Science, which is expected to prove the credibility of estimated personnel and financial data to the MoF. The process is systematic and moves from the level of oblast to rayon and then to the ministry before the budget request reaches the MoF. The internal audit and inspectorate function is currently being strengthened to improve wage bill control, but it will require accelerated capacity building to cope with its preventive control function.
6.15. The legal framework for managing the wage bill in the education sector includes a decree that limits teacher workload and sets a minimum threshold of teaching hours. There is, however, no established base pay for teachers, because pay is determined based on hourly rate calculations in addition to multiple allowances and incentives, which are partly regulated by government resolutions. Distribution of working hours among teachers is conducted by a special working group that includes the head of education, school principal, and teachers. Teachers who show less interest in teaching are sanctioned.
6.16. Recent reform in the education sector has led to improvement in the share of base pay in total compensation. Available data indicate that the average salary-to-allowance ratio for teachers is within international standards, with base salary accounting for 87 percent and allowances 13 percent of total compensation. Allowances are, however, higher, at 21 percent for higher education. Figure 6.6 shows the proportion of teachers’ base salary and allowances in total compensation by type of institution for 2016–18.
Figure 6.6. Proportion of Teachers’ Base Pay and Allowances in Total Compensation, 2016–18
Source: Kyrgyz Republic Ministry of Education and Science (MES).
6.17. Salaries and allowances of administrative management personnel continued to increase in 2016–18. Figure 6.7 shows the steady increase in salaries of administrative personnel, from 12,607 in 2016 to 14,293 in 2018. Allowances grew correspondingly from 3,151 in 2016 to 3,573 in 2018, an increase of 13.4 percent for preschool, secondary school, and continuing secondary education. The percentage growth in allowances in branch offices at the subnational level, however, was excessive, at 79 percent between 2017 and 2018. The reasons behind this high increase in growth, though not clear, are not influenced by productivity or performance improvement. The government needs to investigate the source and implement measures to halt the trend and reduce the share of allowances in total compensation.
87.0% 87.0% 87.0%78.7%
13.0% 13.0% 13.0%21.3%
0%
20%
40%
60%
80%
100%
120%
Preschool education Secondary education Continuing secondary education Higher education
Proportion of allowances in total compensation by type of institution
Proportion of salary in total compensation by type of institution
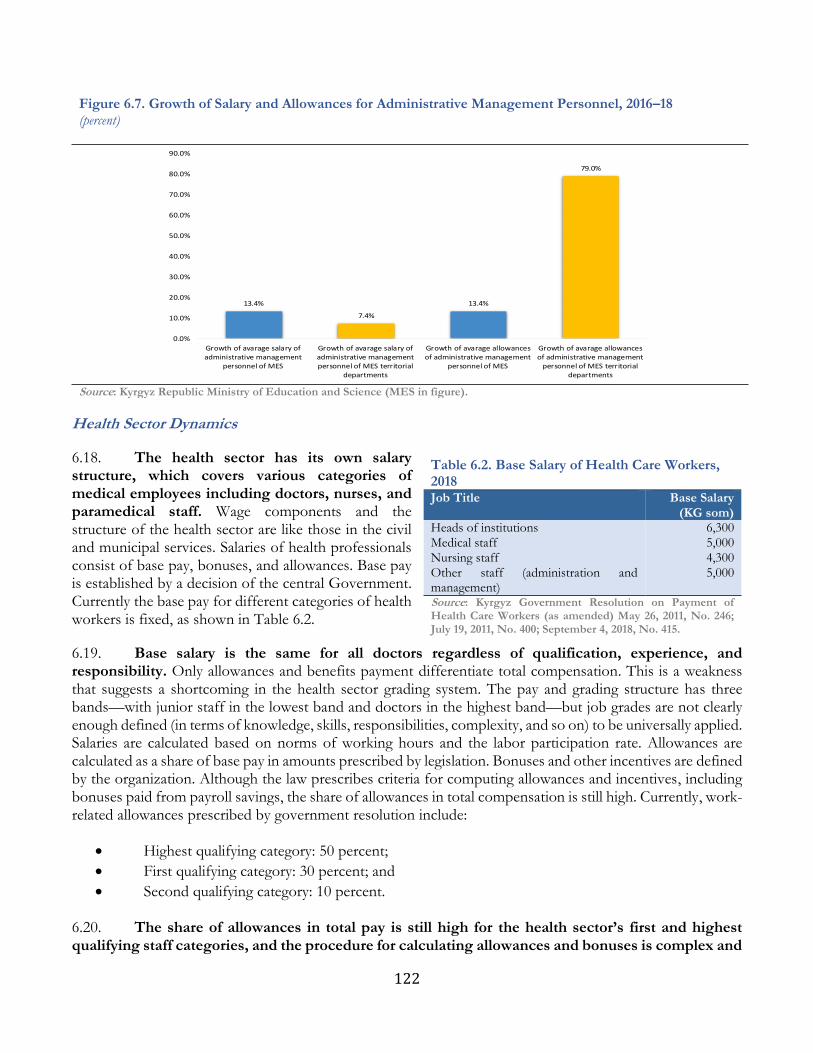
122
Figure 6.7. Growth of Salary and Allowances for Administrative Management Personnel, 2016–18 (percent)
Source: Kyrgyz Republic Ministry of Education and Science (MES in figure).
Health Sector Dynamics
6.18. The health sector has its own salary structure, which covers various categories of medical employees including doctors, nurses, and paramedical staff. Wage components and the structure of the health sector are like those in the civil and municipal services. Salaries of health professionals consist of base pay, bonuses, and allowances. Base pay is established by a decision of the central Government. Currently the base pay for different categories of health workers is fixed, as shown in Table 6.2.
6.19. Base salary is the same for all doctors regardless of qualification, experience, and responsibility. Only allowances and benefits payment differentiate total compensation. This is a weakness that suggests a shortcoming in the health sector grading system. The pay and grading structure has three bands—with junior staff in the lowest band and doctors in the highest band—but job grades are not clearly enough defined (in terms of knowledge, skills, responsibilities, complexity, and so on) to be universally applied. Salaries are calculated based on norms of working hours and the labor participation rate. Allowances are calculated as a share of base pay in amounts prescribed by legislation. Bonuses and other incentives are defined by the organization. Although the law prescribes criteria for computing allowances and incentives, including bonuses paid from payroll savings, the share of allowances in total compensation is still high. Currently, work-related allowances prescribed by government resolution include:
• Highest qualifying category: 50 percent;
• First qualifying category: 30 percent; and
• Second qualifying category: 10 percent. 6.20. The share of allowances in total pay is still high for the health sector’s first and highest qualifying staff categories, and the procedure for calculating allowances and bonuses is complex and
13.4%
7.4%
13.4%
79.0%
0.0%
10.0%
20.0%
30.0%
40.0%
50.0%
60.0%
70.0%
80.0%
90.0%
Growth of avarage salary ofadministrative management
personnel of MES
Growth of avarage salary ofadministrative managementpersonnel of MES territorial
departments
Growth of avarage allowancesof administrative management
personnel of MES
Growth of avarage allowancesof administrative management
personnel of MES territorialdepartments
Table 6.2. Base Salary of Health Care Workers, 2018 Job Title Base Salary
(KG som) Heads of institutions 6,300 Medical staff 5,000 Nursing staff 4,300 Other staff (administration and management)
5,000
Source: Kyrgyz Government Resolution on Payment of Health Care Workers (as amended) May 26, 2011, No. 246; July 19, 2011, No. 400; September 4, 2018, No. 415.
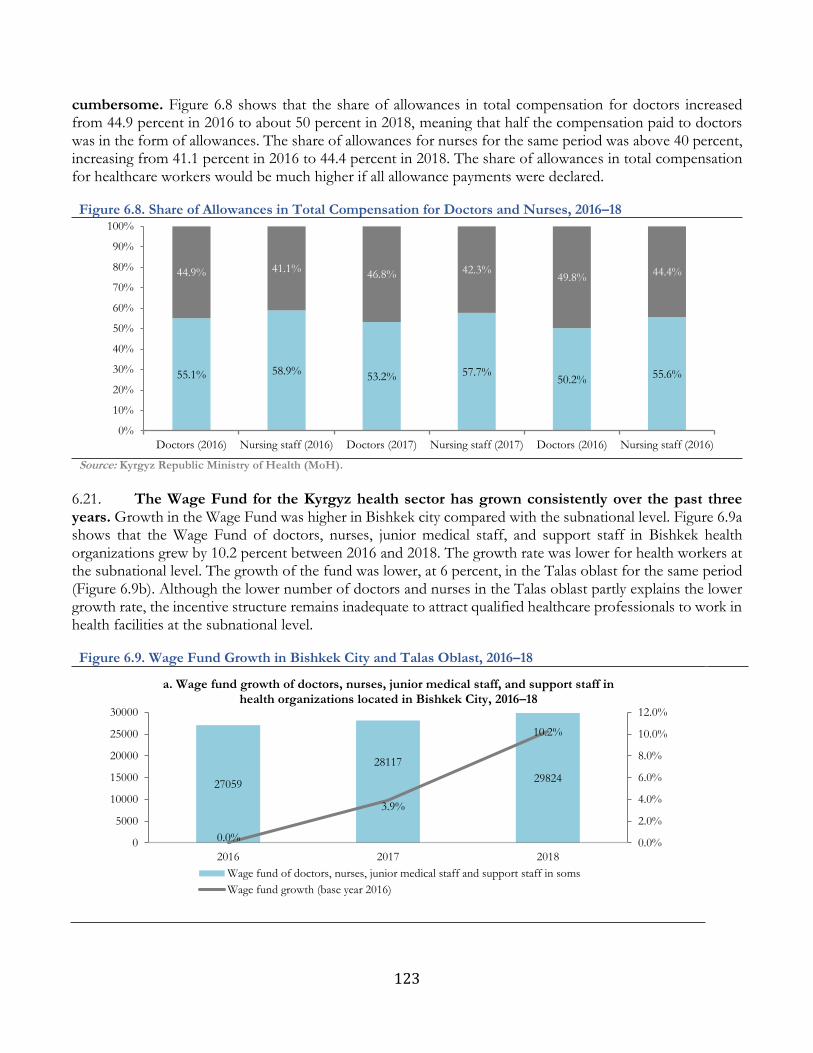
123
cumbersome. Figure 6.8 shows that the share of allowances in total compensation for doctors increased from 44.9 percent in 2016 to about 50 percent in 2018, meaning that half the compensation paid to doctors was in the form of allowances. The share of allowances for nurses for the same period was above 40 percent, increasing from 41.1 percent in 2016 to 44.4 percent in 2018. The share of allowances in total compensation for healthcare workers would be much higher if all allowance payments were declared.
Figure 6.8. Share of Allowances in Total Compensation for Doctors and Nurses, 2016–18
Source: Kyrgyz Republic Ministry of Health (MoH).
6.21. The Wage Fund for the Kyrgyz health sector has grown consistently over the past three years. Growth in the Wage Fund was higher in Bishkek city compared with the subnational level. Figure 6.9a shows that the Wage Fund of doctors, nurses, junior medical staff, and support staff in Bishkek health organizations grew by 10.2 percent between 2016 and 2018. The growth rate was lower for health workers at the subnational level. The growth of the fund was lower, at 6 percent, in the Talas oblast for the same period (Figure 6.9b). Although the lower number of doctors and nurses in the Talas oblast partly explains the lower growth rate, the incentive structure remains inadequate to attract qualified healthcare professionals to work in health facilities at the subnational level.
Figure 6.9. Wage Fund Growth in Bishkek City and Talas Oblast, 2016–18
55.1% 58.9%53.2% 57.7%
50.2% 55.6%
44.9% 41.1%46.8% 42.3%
49.8%44.4%
0%
10%
20%
30%
40%
50%
60%
70%
80%
90%
100%
Doctors (2016) Nursing staff (2016) Doctors (2017) Nursing staff (2017) Doctors (2016) Nursing staff (2016)
27059
28117
29824
0.0%
3.9%
10.2%
0.0%
2.0%
4.0%
6.0%
8.0%
10.0%
12.0%
0
5000
10000
15000
20000
25000
30000
2016 2017 2018
a. Wage fund growth of doctors, nurses, junior medical staff, and support staff in health organizations located in Bishkek City, 2016–18
Wage fund of doctors, nurses, junior medical staff and support staff in soms
Wage fund growth (base year 2016)
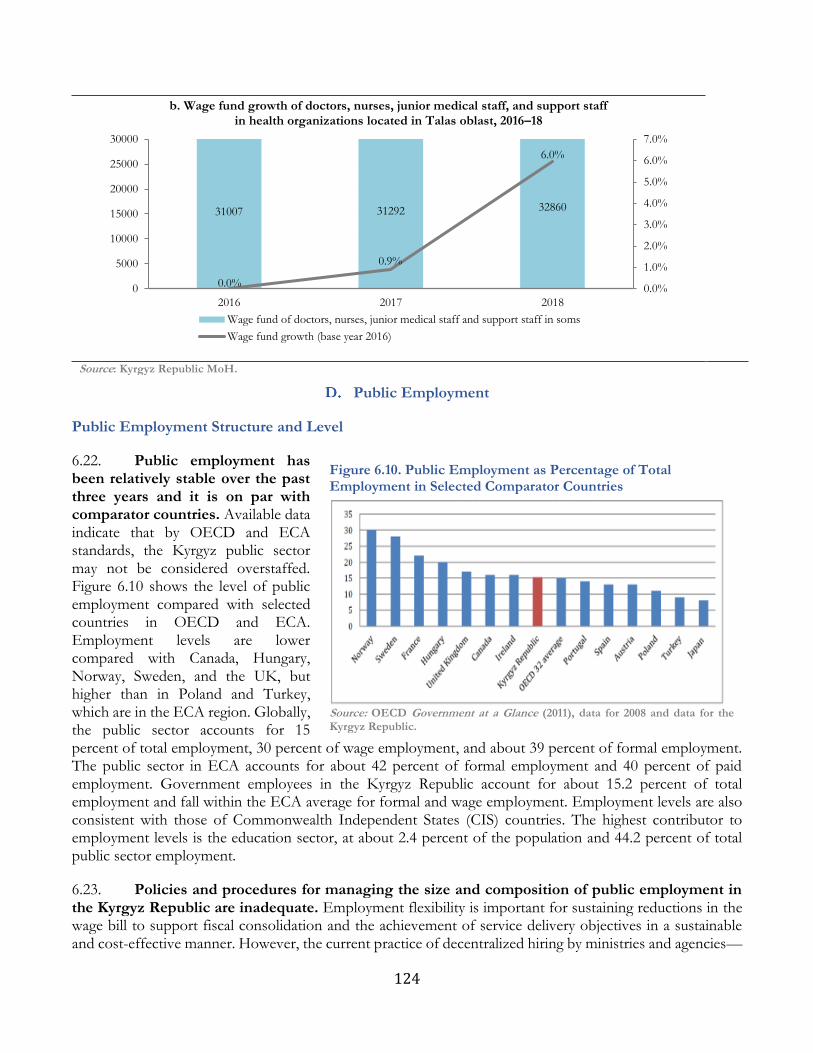
124
Source: Kyrgyz Republic MoH.
Public Employment
Public Employment Structure and Level
6.22. Public employment has been relatively stable over the past three years and it is on par with comparator countries. Available data indicate that by OECD and ECA standards, the Kyrgyz public sector may not be considered overstaffed. Figure 6.10 shows the level of public employment compared with selected countries in OECD and ECA. Employment levels are lower compared with Canada, Hungary, Norway, Sweden, and the UK, but higher than in Poland and Turkey, which are in the ECA region. Globally, the public sector accounts for 15 percent of total employment, 30 percent of wage employment, and about 39 percent of formal employment. The public sector in ECA accounts for about 42 percent of formal employment and 40 percent of paid employment. Government employees in the Kyrgyz Republic account for about 15.2 percent of total employment and fall within the ECA average for formal and wage employment. Employment levels are also consistent with those of Commonwealth Independent States (CIS) countries. The highest contributor to employment levels is the education sector, at about 2.4 percent of the population and 44.2 percent of total public sector employment.
6.23. Policies and procedures for managing the size and composition of public employment in the Kyrgyz Republic are inadequate. Employment flexibility is important for sustaining reductions in the wage bill to support fiscal consolidation and the achievement of service delivery objectives in a sustainable and cost-effective manner. However, the current practice of decentralized hiring by ministries and agencies—
31007 31292 32860
0.0%
0.9%
6.0%
0.0%
1.0%
2.0%
3.0%
4.0%
5.0%
6.0%
7.0%
0
5000
10000
15000
20000
25000
30000
2016 2017 2018
b. Wage fund growth of doctors, nurses, junior medical staff, and support staff in health organizations located in Talas oblast, 2016–18
Wage fund of doctors, nurses, junior medical staff and support staff in soms
Wage fund growth (base year 2016)
Figure 6.10. Public Employment as Percentage of Total Employment in Selected Comparator Countries
Source: OECD Government at a Glance (2011), data for 2008 and data for the Kyrgyz Republic.
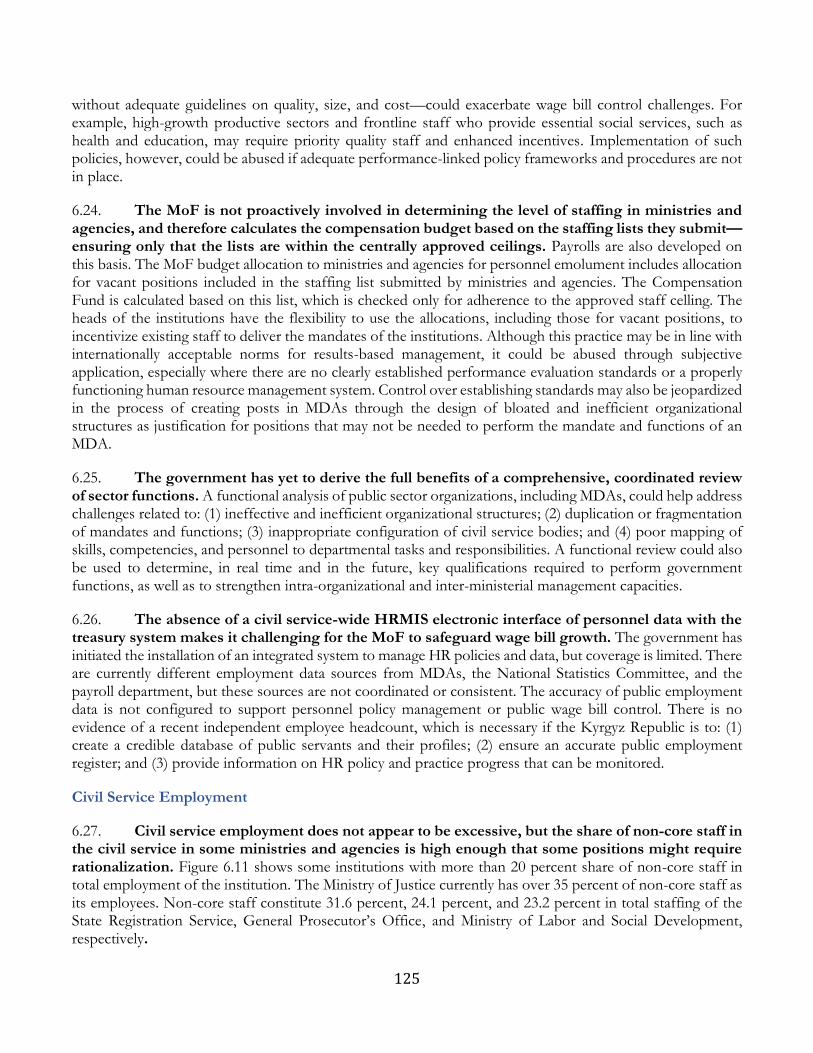
125
without adequate guidelines on quality, size, and cost—could exacerbate wage bill control challenges. For example, high-growth productive sectors and frontline staff who provide essential social services, such as health and education, may require priority quality staff and enhanced incentives. Implementation of such policies, however, could be abused if adequate performance-linked policy frameworks and procedures are not in place.
6.24. The MoF is not proactively involved in determining the level of staffing in ministries and agencies, and therefore calculates the compensation budget based on the staffing lists they submit—ensuring only that the lists are within the centrally approved ceilings. Payrolls are also developed on this basis. The MoF budget allocation to ministries and agencies for personnel emolument includes allocation for vacant positions included in the staffing list submitted by ministries and agencies. The Compensation Fund is calculated based on this list, which is checked only for adherence to the approved staff celling. The heads of the institutions have the flexibility to use the allocations, including those for vacant positions, to incentivize existing staff to deliver the mandates of the institutions. Although this practice may be in line with internationally acceptable norms for results-based management, it could be abused through subjective application, especially where there are no clearly established performance evaluation standards or a properly functioning human resource management system. Control over establishing standards may also be jeopardized in the process of creating posts in MDAs through the design of bloated and inefficient organizational structures as justification for positions that may not be needed to perform the mandate and functions of an MDA.
6.25. The government has yet to derive the full benefits of a comprehensive, coordinated review of sector functions. A functional analysis of public sector organizations, including MDAs, could help address challenges related to: (1) ineffective and inefficient organizational structures; (2) duplication or fragmentation of mandates and functions; (3) inappropriate configuration of civil service bodies; and (4) poor mapping of skills, competencies, and personnel to departmental tasks and responsibilities. A functional review could also be used to determine, in real time and in the future, key qualifications required to perform government functions, as well as to strengthen intra-organizational and inter-ministerial management capacities.
6.26. The absence of a civil service-wide HRMIS electronic interface of personnel data with the treasury system makes it challenging for the MoF to safeguard wage bill growth. The government has initiated the installation of an integrated system to manage HR policies and data, but coverage is limited. There are currently different employment data sources from MDAs, the National Statistics Committee, and the payroll department, but these sources are not coordinated or consistent. The accuracy of public employment data is not configured to support personnel policy management or public wage bill control. There is no evidence of a recent independent employee headcount, which is necessary if the Kyrgyz Republic is to: (1) create a credible database of public servants and their profiles; (2) ensure an accurate public employment register; and (3) provide information on HR policy and practice progress that can be monitored.
Civil Service Employment
6.27. Civil service employment does not appear to be excessive, but the share of non-core staff in the civil service in some ministries and agencies is high enough that some positions might require rationalization. Figure 6.11 shows some institutions with more than 20 percent share of non-core staff in total employment of the institution. The Ministry of Justice currently has over 35 percent of non-core staff as its employees. Non-core staff constitute 31.6 percent, 24.1 percent, and 23.2 percent in total staffing of the State Registration Service, General Prosecutor’s Office, and Ministry of Labor and Social Development, respectively.
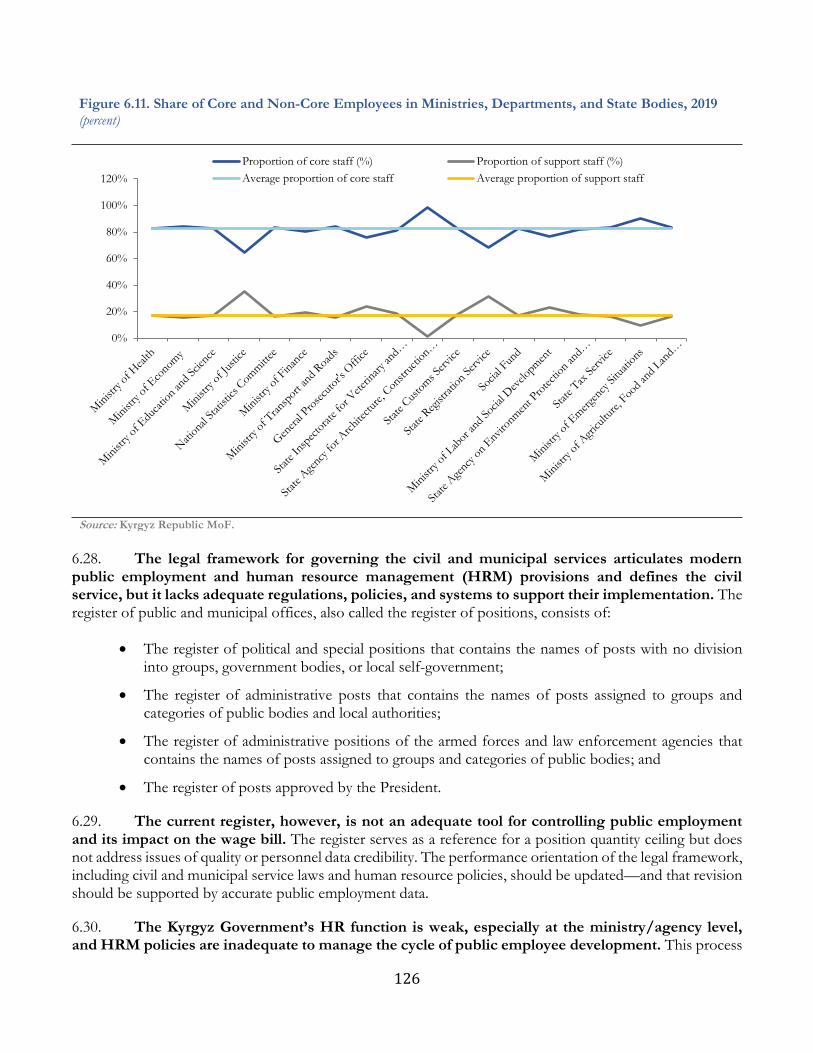
126
Figure 6.11. Share of Core and Non-Core Employees in Ministries, Departments, and State Bodies, 2019 (percent)
Source: Kyrgyz Republic MoF.
6.28. The legal framework for governing the civil and municipal services articulates modern public employment and human resource management (HRM) provisions and defines the civil service, but it lacks adequate regulations, policies, and systems to support their implementation. The register of public and municipal offices, also called the register of positions, consists of:
• The register of political and special positions that contains the names of posts with no division into groups, government bodies, or local self-government;
• The register of administrative posts that contains the names of posts assigned to groups and categories of public bodies and local authorities;
• The register of administrative positions of the armed forces and law enforcement agencies that contains the names of posts assigned to groups and categories of public bodies; and
• The register of posts approved by the President.
6.29. The current register, however, is not an adequate tool for controlling public employment and its impact on the wage bill. The register serves as a reference for a position quantity ceiling but does not address issues of quality or personnel data credibility. The performance orientation of the legal framework, including civil and municipal service laws and human resource policies, should be updated—and that revision should be supported by accurate public employment data.
6.30. The Kyrgyz Government’s HR function is weak, especially at the ministry/agency level, and HRM policies are inadequate to manage the cycle of public employee development. This process
0%
20%
40%
60%
80%
100%
120%
Proportion of core staff (%) Proportion of support staff (%)
Average proportion of core staff Average proportion of support staff
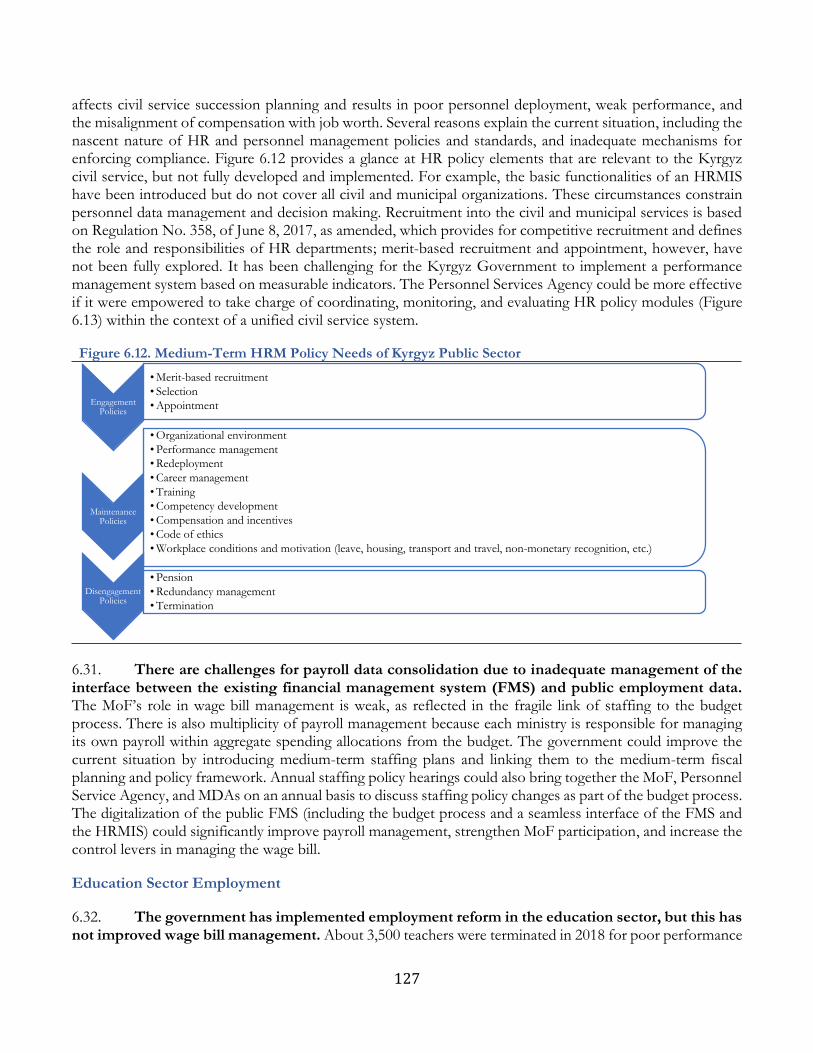
127
affects civil service succession planning and results in poor personnel deployment, weak performance, and the misalignment of compensation with job worth. Several reasons explain the current situation, including the nascent nature of HR and personnel management policies and standards, and inadequate mechanisms for enforcing compliance. Figure 6.12 provides a glance at HR policy elements that are relevant to the Kyrgyz civil service, but not fully developed and implemented. For example, the basic functionalities of an HRMIS have been introduced but do not cover all civil and municipal organizations. These circumstances constrain personnel data management and decision making. Recruitment into the civil and municipal services is based on Regulation No. 358, of June 8, 2017, as amended, which provides for competitive recruitment and defines the role and responsibilities of HR departments; merit-based recruitment and appointment, however, have not been fully explored. It has been challenging for the Kyrgyz Government to implement a performance management system based on measurable indicators. The Personnel Services Agency could be more effective if it were empowered to take charge of coordinating, monitoring, and evaluating HR policy modules (Figure 6.13) within the context of a unified civil service system.
Figure 6.12. Medium-Term HRM Policy Needs of Kyrgyz Public Sector
6.31. There are challenges for payroll data consolidation due to inadequate management of the interface between the existing financial management system (FMS) and public employment data. The MoF’s role in wage bill management is weak, as reflected in the fragile link of staffing to the budget process. There is also multiplicity of payroll management because each ministry is responsible for managing its own payroll within aggregate spending allocations from the budget. The government could improve the current situation by introducing medium-term staffing plans and linking them to the medium-term fiscal planning and policy framework. Annual staffing policy hearings could also bring together the MoF, Personnel Service Agency, and MDAs on an annual basis to discuss staffing policy changes as part of the budget process. The digitalization of the public FMS (including the budget process and a seamless interface of the FMS and the HRMIS) could significantly improve payroll management, strengthen MoF participation, and increase the control levers in managing the wage bill.
Education Sector Employment
6.32. The government has implemented employment reform in the education sector, but this has not improved wage bill management. About 3,500 teachers were terminated in 2018 for poor performance
Engagement Policies
• Merit-based recruitment
• Selection
• Appointment
Maintenance Policies
• Organizational environment
• Performance management
• Redeployment
• Career management
• Training
• Competency development
• Compensation and incentives
• Code of ethics
• Workplace conditions and motivation (leave, housing, transport and travel, non-monetary recognition, etc.)
Disengagement Policies
• Pension
• Redundancy management
• Termination
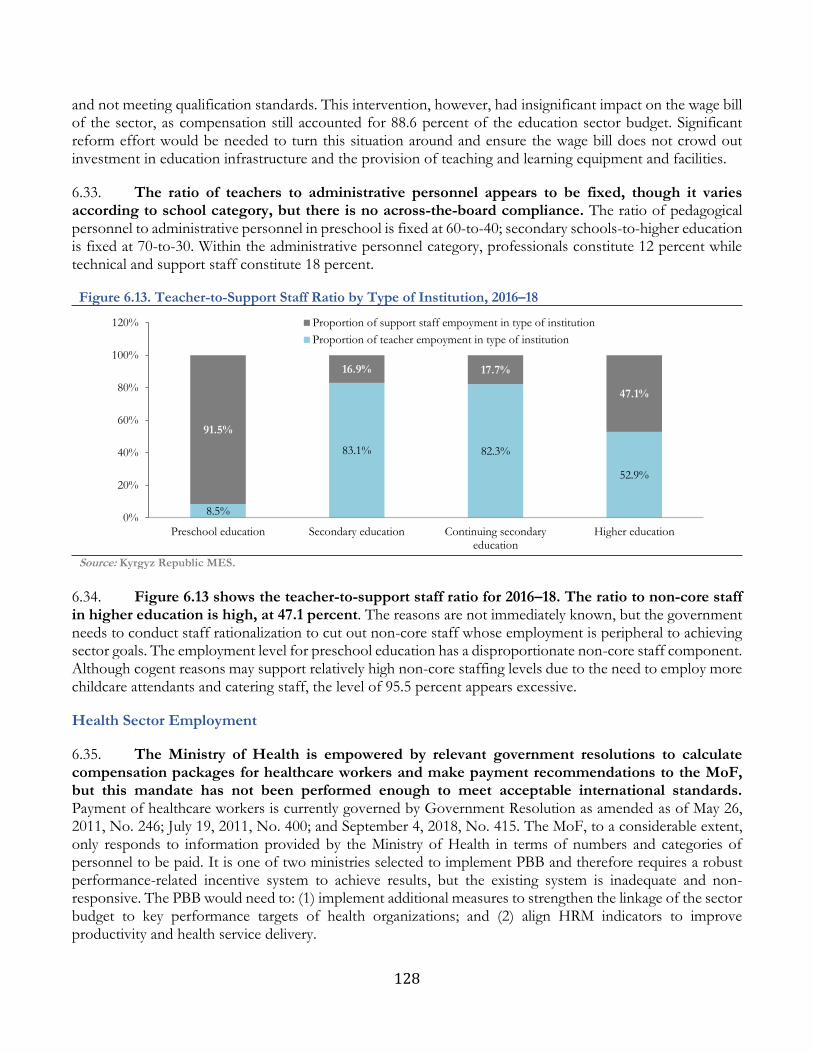
128
and not meeting qualification standards. This intervention, however, had insignificant impact on the wage bill of the sector, as compensation still accounted for 88.6 percent of the education sector budget. Significant reform effort would be needed to turn this situation around and ensure the wage bill does not crowd out investment in education infrastructure and the provision of teaching and learning equipment and facilities.
6.33. The ratio of teachers to administrative personnel appears to be fixed, though it varies according to school category, but there is no across-the-board compliance. The ratio of pedagogical personnel to administrative personnel in preschool is fixed at 60-to-40; secondary schools-to-higher education is fixed at 70-to-30. Within the administrative personnel category, professionals constitute 12 percent while technical and support staff constitute 18 percent.
Figure 6.13. Teacher-to-Support Staff Ratio by Type of Institution, 2016–18
Source: Kyrgyz Republic MES.
6.34. Figure 6.13 shows the teacher-to-support staff ratio for 2016–18. The ratio to non-core staff in higher education is high, at 47.1 percent. The reasons are not immediately known, but the government needs to conduct staff rationalization to cut out non-core staff whose employment is peripheral to achieving sector goals. The employment level for preschool education has a disproportionate non-core staff component. Although cogent reasons may support relatively high non-core staffing levels due to the need to employ more childcare attendants and catering staff, the level of 95.5 percent appears excessive.
Health Sector Employment
6.35. The Ministry of Health is empowered by relevant government resolutions to calculate compensation packages for healthcare workers and make payment recommendations to the MoF, but this mandate has not been performed enough to meet acceptable international standards. Payment of healthcare workers is currently governed by Government Resolution as amended as of May 26, 2011, No. 246; July 19, 2011, No. 400; and September 4, 2018, No. 415. The MoF, to a considerable extent, only responds to information provided by the Ministry of Health in terms of numbers and categories of personnel to be paid. It is one of two ministries selected to implement PBB and therefore requires a robust performance-related incentive system to achieve results, but the existing system is inadequate and non-responsive. The PBB would need to: (1) implement additional measures to strengthen the linkage of the sector budget to key performance targets of health organizations; and (2) align HRM indicators to improve productivity and health service delivery.
8.5%
83.1% 82.3%
52.9%
91.5%
16.9% 17.7%
47.1%
0%
20%
40%
60%
80%
100%
120%
Preschool education Secondary education Continuing secondaryeducation
Higher education
Proportion of support staff empoyment in type of institution
Proportion of teacher empoyment in type of institution
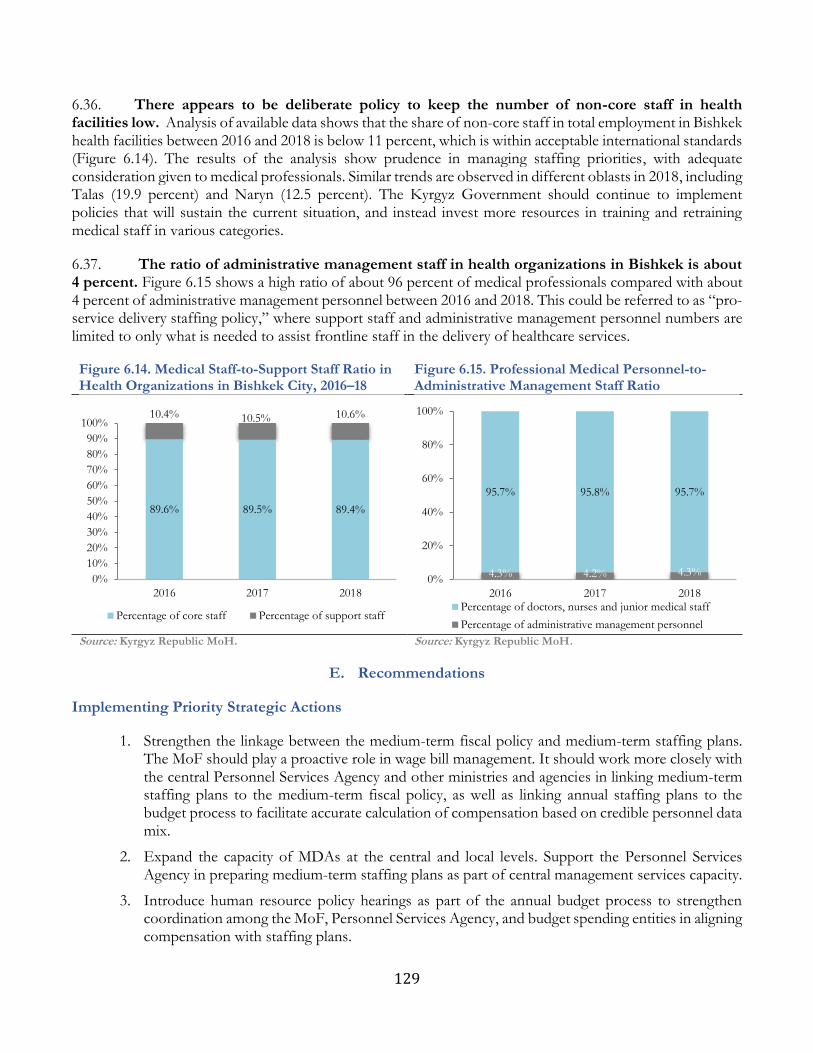
129
6.36. There appears to be deliberate policy to keep the number of non-core staff in health facilities low. Analysis of available data shows that the share of non-core staff in total employment in Bishkek health facilities between 2016 and 2018 is below 11 percent, which is within acceptable international standards (Figure 6.14). The results of the analysis show prudence in managing staffing priorities, with adequate consideration given to medical professionals. Similar trends are observed in different oblasts in 2018, including Talas (19.9 percent) and Naryn (12.5 percent). The Kyrgyz Government should continue to implement policies that will sustain the current situation, and instead invest more resources in training and retraining medical staff in various categories.
6.37. The ratio of administrative management staff in health organizations in Bishkek is about 4 percent. Figure 6.15 shows a high ratio of about 96 percent of medical professionals compared with about 4 percent of administrative management personnel between 2016 and 2018. This could be referred to as “pro-service delivery staffing policy,” where support staff and administrative management personnel numbers are limited to only what is needed to assist frontline staff in the delivery of healthcare services.
Figure 6.14. Medical Staff-to-Support Staff Ratio in Health Organizations in Bishkek City, 2016–18
Figure 6.15. Professional Medical Personnel-to-Administrative Management Staff Ratio
Source: Kyrgyz Republic MoH. Source: Kyrgyz Republic MoH.
Recommendations
Implementing Priority Strategic Actions
1. Strengthen the linkage between the medium-term fiscal policy and medium-term staffing plans. The MoF should play a proactive role in wage bill management. It should work more closely with the central Personnel Services Agency and other ministries and agencies in linking medium-term staffing plans to the medium-term fiscal policy, as well as linking annual staffing plans to the budget process to facilitate accurate calculation of compensation based on credible personnel data mix.
2. Expand the capacity of MDAs at the central and local levels. Support the Personnel Services Agency in preparing medium-term staffing plans as part of central management services capacity.
3. Introduce human resource policy hearings as part of the annual budget process to strengthen coordination among the MoF, Personnel Services Agency, and budget spending entities in aligning compensation with staffing plans.
89.6% 89.5% 89.4%
10.4% 10.5% 10.6%
0%
10%
20%
30%
40%
50%
60%
70%
80%
90%
100%
2016 2017 2018
Percentage of core staff Percentage of support staff
4.3% 4.2% 4.3%
95.7% 95.8% 95.7%
0%
20%
40%
60%
80%
100%
2016 2017 2018Percentage of doctors, nurses and junior medical staff
Percentage of administrative management personnel
130
4. Begin to shift the Government’s focus toward achieving efficiency gains through increased employee productivity and performance at the strategic level.
5. Strengthen the legal framework for public compensation management. Consider establishing an independent authority to be responsible for setting, monitoring, and regularly reviewing public sector remuneration and benefits.
Improving the Compensation Framework and Wage Management
1. Continue consolidating allowances, with the objective to achieve an 80-to-20 base salary-to-allowance ratio by 2021. This requires consolidating all major allowances.
2. Ensure that pay increases do not exceed the rate of inflation during a given pay period until (1) a comprehensive functional review of civil and municipal services’ institutions is completed; and (2) organizational and staffing efficiency gains are determined. This means prioritizing the completion of an organizational functional analysis (created in a phased approach) by December 2021.
3. Reform within a national compensation framework salary and incentive structures for the education and health sectors.
4. Establish a robust monitoring system to track challenges in the implementation of the new civil service pay and grading structure. This will ensure the prompt resolution of pay distortions, inequities, and complaints regarding weak salary relativities and job family wage penalties.
Strengthening Public Employment Practices and Human Resource Management Policies
1. Conduct a comprehensive functional review of civil and municipal service agencies, starting with selected priority sectors, including health, education, and large budget spending entities. This will improve efficiency margins in alignment with staff skills and competencies according in line with strategic organizational goals and objectives.
2. Continue to rationalize staffing levels to ensure that only employees in approved jobs in reengineered optimal organizational structures are on the payroll. Initiate an update of the public employment register based on final validated data from an HR audit and functional review.
3. Develop and implement a skills and competency development program for key civil servants. The proposed program is based on gaps identified by the HR audit and functional review and aims to enhance staff productivity and performance.
4. Strengthen the management services capacity of the Personnel Services Agency to facilitate civil service-wide support to government ministries and agencies. This will improve organizational development and skills- and personnel-mix policy choices.
5. Develop and implement a robust performance management and measurement system, with broad policy objectives and criteria for civil and municipal services. This system will enable organization heads and managers to objectively apply incentive programs that reward efficiency, productivity, and innovation rather than long service tenure.
6. Complete the HRMIS modules and link the payroll module and other compensation-related HR data electronically to the treasury system. This will ensure a seamless integration of a credible personnel database with a functioning financial management information system, which will facilitate more accurate calculation of compensation.
131
7. Conduct an HR audit to establish credible public sector employment data and other HR data as a baseline for various modules of the HRMIS. This activity is important for addressing public employment data inconsistencies and inaccuracies and for ensuring that government institutions can make evidence-based decisions on the public wage bill.
8. Conduct a cost-benefit analysis to inform decisions on outsourcing some technical and ancillary functions (electrical, plumbing, catering, cleaning/janitorial services, and so on) to the private sector.
9. Implement staff rationalization measures, focusing on the alignment of skills and competencies with established posts and organizational goals, and on the termination of non-core staff in ministries and agencies where they are not needed.
132
References
Chapter 1: The Stance of Fiscal Policy Burnside, C. 2005. “Theoretical Prerequisites for Fiscal Sustainability Analysis,” in C. Burnside (ed.), Fiscal
Sustainability in Theory and Practice: A Handbook, 11-34. Washington, DC: World Bank. ―――, and Y. Meshcheryakova. 2005. “Cyclical Adjustment of the Budget Surplus: Concepts and
Measurement Issues,” in C. Burnside (ed.), Fiscal Sustainability in Theory and Practice: A Handbook, 113-32. Washington, DC: World Bank.
Chalk, N., and R. Hemming. 2000. “Assessing Fiscal Sustainability in Theory and Practice.” IMF Working
Paper, WP/00/81. Washington, DC: International Monetary Fund. Dale, E., and others. 2019. “Budget Structure Reforms and Transition to Program Budgeting in Health:
Lessons from Armenia.” Health Financing Case Study No. 12, Budgeting in Health. World Health Organization.
Government of the Kyrgyz Republic. 2018a. Main Directions of Fiscal Policy for the Years 2019–21. ―――. 2018b. Development Program of the Kyrgyz Republic for the Period 2018-22: “Unity, Trust,
Creation.” ―――. 2018c. Explanatory Note to the 2019 Budget. Grynchuk, N. 2019. “Performance-Based Program Budgeting in Ukraine (with a Focus on the Local Budget
Level),” in M.S. de Vries, J. Nemec, and D. Špaček (eds.), Performance-Based Budgeting in the Public Sector, Springer, 177-93.
IMF. 2017. “Fiscal Rules at a Glance,” Background Note. Washington, DC: International Monetary Fund. ―――. 2019. “Kyrgyz Republic: Staff Report for the 2019 Article IV Consultation.” Country Report No.
19/208. Linpico, S. 2015. “Kyrgyz Republic PEFA Assessment Report, 2014.” Ministry of Finance of the Kyrgyz Republic. 2017. “Program Budgeting in the Kyrgyz Republic.” Unpublished
Presentation. Mise, E., T. Hwan Kim, and P. Newbold. 2005., “On Sub-Optimality of the Hodrick-Prescott Filter at Time
Series Endpoints.” Journal of Macroeconomics 27: 53-67. National Bank of the Kyrgyz Republic/Government of the Kyrgyz Republic. 2018. Joint Statement of the
Government of the Kyrgyz Republic and the National Bank of the Kyrgyz Republic on the Main Directions of Economic Policy for 2018, February 27, 2018 (available on the website of the NBKR).
133
World Bank. 2014. Kyrgyz Republic: Public Expenditure Review. ―――. 2018. Kyrgyz Republic: Systematic Country Diagnosis. ―――. 2019. Kyrgyz Republic: Economic Update. ――― .Forthcoming. Kyrgyz Republic: Country Economic Memorandum. Chapter 2 Government Expenditure Performance and Budget Reforms Dale, E., A. Kyurumyan, and others. 2019. “Budget Structure Reforms and Transition to Program Budgeting
in Health: Lessons from Armenia.” Health Financing Case Study No. 12. Budgeting in Health. World Health
Organization.
Government of the Kyrgyz Republic. 2018a. Main Directions of Fiscal Policy for the Years 2019–21. ―――. 2018b. Development Program of the Kyrgyz Republic for the Period 2018–22: “Unity, Trust,
Creation.” ―――. 2018c. Explanatory Notes to the 2019 Budget. Grynchuk, N. 2019. “Performance-Based Program Budgeting in Ukraine (with a Focus on the Local Budget
Level),” in M.S. de Vries, J. Nemec, and D. Špaček (eds.), Performance-Based Budgeting in the Public Sector, Springer, 177-93.
IMF. 2019. “Kyrgyz Republic: Staff Report for the 2019 Article IV Consultation.” Country Report No.
19/208. Washington, DC: International Monetary Fund.
Linpico, S. 2015. Kyrgyz Republic PEFA Assessment Report, 2014.
Ministry of Finance of the Kyrgyz Republic. 2017. “Program Budgeting in the Kyrgyz Republic,” unpublished
presentation.
World Bank. 2014. Kyrgyz Republic: Public Expenditure Review. Washington, DC: World Bank.
―――. 2018. Kyrgyz Republic: Systematic Country Diagnosis. Washington, DC: World Bank.
―――. 2020. Kyrgyz Republic: Country Economic Memorandum. Washington, DC: World Bank.
Chapter 3 Tax Policy and Tax Administration Bloomberg Tax. 2019.
IMF. 2018. “Kyrgyz Republic: Fourth and Fifth Reviews under the Three-Year Arrangement.” Staff Report
No. 18/53. Washington, DC: International Monetary System.
134
———. 2019. “Kyrgyz Republic.” Staff Report for the 2019 Article IV Consultation. Washington, DC:
International Monetary System. Washington, DC: International Monetary System.
OECD. 2010. “Tax Expenditures in OECD Countries.” Paris: OECD Publishing.
―――. 2018. “Social Protection System Review of Kyrgyzstan.” OECD Development Pathways. Paris: OECD
Publishing.
―――. 2019. “Tax Administration 2019: Comparative Information on OECD and Other Advanced and
Emerging Economies.” Paris: OECD Publishing.
Price Waterhouse Coppers (PWC) (xx). Worldwide Tax Summaries.
Sahovic, T. 2019. “What’s Holding Back the Kyrgyz Republic Private Sector? The Brookings Institution.
World Bank. 2014. “Kyrgyz Republic Public Expenditure Review, Policy Notes Strategic Setting.”
Washington, DC: World Bank.
―――. 2020. Doing Business 2020: Comparing Business Regulation in 190 Economies. Washington, DC: World Bank.
―――. 2018, An Extended Cost Effectiveness Analysis of Tobacco Price Increases in the Kyrgyz Republic. Washington,
DC: World Bank.
Chapter 4: State-Owned Enterprises: Governance and Fiscal Performance Camos D., A. Estache, and M.M. Hamid. 2016. “Quasi-Fiscal Deficits in the Electricity Sector of the Middle East and North Africa: Sources and Sizes.” Policy Research Working Paper 8280. Washington, DC : World Bank.
Huenteler J., I. Dobozi, A. Balabanyan, and others. 2017. “Cost Recovery and Financial Viability of the Power
Sector in Developing Countries.” Policy Research Working Paper 8287. Washington, DC : World Bank.
IMF. 2014. Government Financial Statistics Manual. Washington, DC: International Monetary Fund.
Kyrgyz Republic. Budget Code. 2016.
———. Civil Code. 1996.
———. Civil Code. Article 158. 1996: State enterprises based on the right of economic management is a legal entity which property and profit are owned by the state and are assigned to such enterprise in order to carry out its business activities.
135
———. Civil Code. Article 159. State Enterprises based on the right of operative management, carrying out operative management of the property assigned to it, may be formed based on the state property. ———. Constitution. 2010.
———. Law On Business Partnerships and Companies. 1996.
———. Law On Bankruptcy. 1997.
———. Law On Organization of Insurance in Kyrgyz Republic. 1998.
———. Law On Joint Stock Companies. 2003.
———. Law On Constitutional Government of the Kyrgyz Republic. 2012.
National Bank of Kyrgyz Republic. 2016. Banks and Banking Activities.
Resolution of the Government of Kyrgyz Republic. August 14, 2009. On Increasing Effectiveness of
Corporate Governance in Joint Stock Companies with State Share. No. 532.
———. On Increasing Effectiveness of Corporate Governance in Joint Stock Companies with State Share. August 18, 2003. No. 525; ceased to be in force and effect by the Government Resolution of August 14, 2009, No. 532.
Ministry of Economy Finance of the Kyrgyz Republic. 2016. Methodological Guidelines on Compiling Information
for the Statement of Fiscal Risks.
Petri, M., G. Taube, and A. Tsyvinski. 2002. “Energy Sector Quasi-Fiscal Activities in the Countries of the
Former Soviet Union.” IMF Working Paper WP/02/60. Washington, DC: International Monetary Fund.
Trimble C., M. Kojima, I.P. Arroyo, and others. 2016. “Financial Viability of Electricity Sectors in Sub-Saharan
Africa : Quasi-Fiscal Deficits and Hidden Costs.” Policy Research Working Paper 7788. Washington, DC:
World Bank.
World Bank. 2017. “Analysis of the Kyrgyz Republic’s Energy Sector.” Washington, DC: World Bank.
Chapter 5: Fiscal Decentralization and Subnational Public Finances Kyrgyz Republic. 2011. Law No. 101, Articles 43 and 49.
———. 2019. National Statistical Committee.
Suzuki, K., P. Swianiewicz (eds.). 2010. Territorial Consolidation Reform in Europe.
Swianiewicz, P., and A. Gendzwill. 2017. Territorial Amalgamation Toolkit.
World Bank. 2014. “Kyrgyz Republic Expenditure Review Policy Notes: Intergovernmental Relations.”
Washington, DC: World Bank.
136
Annexes
Annex 1. Fiscal and Quasi-Fiscal Operations of the Energy Sector: Company Analysis
This annex illustrates the individual financial performance of the six major companies of the Kyrgyz energy sector:
• Generation: JSC Electric Power Plants (EPP);
• Transmission: JSC National Transmission Company (NESK); and
• Four regional distribution companies.
These entities are part of the National Energy Holding Company (NEHC), established in 2016 to centralize the ownership and management of the Kyrgyz energy sector. The following financial analysis is based on company financial reports covering 2016–18 or 2017–18, depending on data availability. Respectively, the financial analysis is limited by the completeness, accuracy, and consistency of the information contained in financial reports. The analysis includes several key ratios measuring: (1) profitability; (2) solvency; and (3) liquidity of enterprises. Some adjustments were made to selected reported figures prior to ratio calculations to ensure homogeneity in both reported information and ratios. Return on equity and debt-to-equity ratios were not calculated, due to the substantial losses posted by a few companies, which depleted or significantly reduced their shareholder equity.
As detailed below, Kyrgyz energy sector companies are overleveraged and undercapitalized. Given the current and projected levels of the energy sector debt burden, the tariff reform alone might not be enough to achieve the full cost-recovery soon. Low equity and high external debts combined with insufficient operational cash flows make it highly unlikely for energy SOEs to become financially viable, without additional measures to increase capitalization of this strategic sector. Such measures may include but are not being limited to: (1) alleviation of certain part of the energy SOEs’ financial liabilities; (2) exploring a debt-to-equity swap; and (3) injecting new capital into energy sector SOEs.
OJSC Electric Power Plants (EPP)
EPP is the leading electric power-generating company in the Kyrgyz Republic, producing 98 percent of electricity in the country. EPP’s mandate is to generate electricity through the development, management, and operation of power plants. The company also produces heat and hot water. EPP operates seven hydropower plants (HPP) and two heat and power production plants. The Kyrgyz Government owns 99.66 percent of EPP’s shareholder equity via National Energy Holding Company.
137
Table A1. Financial Position and Financial Performance EPP (KGS, million)
Table A2. Key Financial Ratios for EPP
2016 2017 2018 2018/2017 Change
Revenue 8,994 10,523 10,618 0.9% Net income 2,171 3,874 -273 -107.0% Non-current assets 37,066 47,900 49,460 3.3% Current assets 5,305 6,498 6,475 -0.4% Total assets 42,371 54,398 55,934 2.8% Equity 224 1,140 726 -36.3% Non-current liabilities 38,958 48,426 51,176 5.7% Current liabilities 3,190 4,832 4,032 -16.6% Total Liabilities 42,148 53,258 55,209 3.7% Operating cash flow 824 3,055 2,584 -15.4%
2016 2017 2018 2018/2017 Change
Profitability Return on assets 5.1% 7.1% 0.5% -106.8% Operating ratio 1.06 1.39 1.12 -19.6% Solvency Liabilities to assets 99.5% 97.9% 98.7% 0.8%
Debt to equity
188.33
46.71
76.08 62.9% Liquidity Current ratio 1.7 1.3 1.6 19.4%
Source: EPP financial statements 2017–18. Source: World Bank staff calculations.
EPP profitability is extremely volatile and significantly depends on foreign exchange fluctuations. During 2016–17, EPP’s profits were strengthened by a substantial foreign exchange gain from growing electricity exports to neighboring countries, specifically to Uzbekistan, contributing KGS 1.2 billion in 2016 and another KGS 2 billion in 2017. In 2018, export proceeds slightly declined but still accounted for 9.4 percent of total revenue. However, combined with the currency fluctuation, foreign exchange loss contributed a KGS 0.5 billion loss in 2018, resulting in a significant drop in profitability and a net loss of KGS 272.5 million. Revenue from the sale of heat remains relatively stable, at about 10 percent of EPP’s total turnover. During 2018, operating expenses grew by 24.7 percent, also impacting EPP’s net result. This increase was caused by two factors: (1) 2017 results were improved by the collection of previously written-off debts in the amount of KGS 757 million; and (2) the 2018 increase in depreciation and maintenance expenses of 17 percent. This change in operating expenses affected the operating ratio that declined from 1.39 in 2017 to 1.12 in 2018.
EPP is highly leveraged and significantly depends on external debt financing. During 2016–18, the liability-to-assets ratio fluctuated around 100 percent, meaning that all entire company operations are covered by external liabilities—debt or accounts payable. At year-end 2018, the financial debt accounted for the largest portion of EPP’s liabilities: 82.7 percent. The other two main components of EPP’s liabilities are deferred revenues and accounts payable. The company’s equity is low compared with total liabilities, resulting in high debt-to-equity ratios of 76.1 (2018) and 46.7 (2017). Typically, the debt-to-equity ratio in the utilities sector fluctuates at around 1.0 for good practice prudent companies,99 with some industry leaders keeping the ratio
99 Moody’s report on utility companies (various).
138
under 10.100 Net profits generated by EPP during 2016–18 slightly strengthened the company’s equity, which was negative at the beginning of 2016, but a lot remains to be done to improve EPP’s financial standing.
EPP struggles with servicing its current debt load. Strong operational cash flows during 2017–18 enabled EPP to meet its combined interest and principal repayments of KGS 1.6 billion (2017) and KGS 1.4 billion (2018). However, own cash flows remain insufficient to cover the existing debt obligations. For EPP to repay its loans and interest, several large debt restructurings were carried out during 2016–2018—amounting to a massive KGS 5.8 billion—out of which the largest amount of KGS 3.2 billion was restructured during 2016. Without these debt restructurings, EPP would not have been able to meet its debt repayment obligations under the original repayment schedule. During 2019, EPP scheduled to repay KGS 2.4 billion to the Kyrgyz Government under the existing loan agreements. Given EPP’s current financial standing, it is possible that further restructuring may be needed to revise the debt repayment schedule.
EPP discloses information about its contingent liabilities in the notes to financial statements. During its operations, EPP enters various legal disputes that represent potential (contingent) liabilities to the company in case the legal case court is lost. EPP’s most significant contingent liability relates to ongoing litigation approximating KGS 4.5 billion with respect to construction of the Bishkek heat and electricity plant (HEP), where NGEK is considered an affected party. The outcome of this lawsuit is difficult to predict, but its results may have material effect on EPP’s asset valuation, future depreciation expenses, and profitability. EPP is also involved in the legal dispute with the State Tax Office over the accrued land tax of KGS 1.6 billion for the period 2011–14.
JSC National Transmission Company (NESK)
NESK is a high-voltage transmission company operating the national grid and responsible for electricity transmission within the Kyrgyz Republic. NESK’s high-voltage grid delivers electricity from producers of electric power to energy distribution companies and major production facilities and sells electric power directly to several major consumers in the country. The company is also responsible for transmitting imported and exported electricity. NESK operates through its head office in Bishkek, six regional branches, and its training center. The government owns 93.65 percent of NESK equity via the NEHC.
100 AES Corporation annual reports (multiple years) and ratios analysis https://www.macrotrends.net/stocks/charts/AES/aes/financial-ratios; Wiener Energy management reports (multiple years) https://www.wienenergie.at/eportal3/ep/channelView.do/pageTypeId/67860/channelId/-51877.
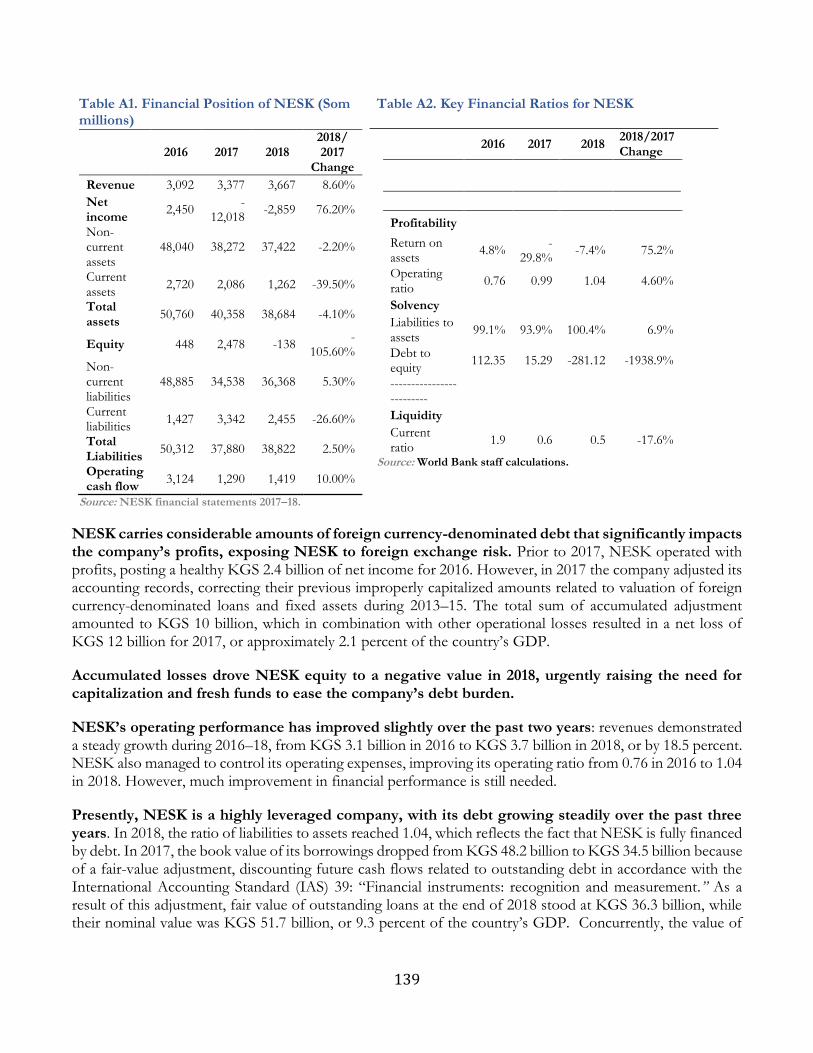
139
Table A1. Financial Position of NESK (Som millions)
Table A2. Key Financial Ratios for NESK
2016 2017 2018 2018/ 2017
Change
Revenue 3,092 3,377 3,667 8.60%
Net income
2,450 -
12,018 -2,859 76.20%
Non-current assets
48,040 38,272 37,422 -2.20%
Current assets
2,720 2,086 1,262 -39.50%
Total assets
50,760 40,358 38,684 -4.10%
Equity 448 2,478 -138 -
105.60% Non-current liabilities
48,885 34,538 36,368 5.30%
Current liabilities
1,427 3,342 2,455 -26.60%
Total Liabilities
50,312 37,880 38,822 2.50%
Operating cash flow
3,124 1,290 1,419 10.00%
Source: NESK financial statements 2017–18.
2016 2017 2018 2018/2017 Change
Profitability
Return on assets
4.8% -
29.8% -7.4% 75.2%
Operating ratio
0.76 0.99 1.04 4.60%
Solvency
Liabilities to assets
99.1% 93.9% 100.4% 6.9%
Debt to equity
112.35 15.29 -281.12 -1938.9%
-------------------------
Liquidity
Current ratio
1.9 0.6 0.5 -17.6%
Source: World Bank staff calculations.
NESK carries considerable amounts of foreign currency-denominated debt that significantly impacts the company’s profits, exposing NESK to foreign exchange risk. Prior to 2017, NESK operated with profits, posting a healthy KGS 2.4 billion of net income for 2016. However, in 2017 the company adjusted its accounting records, correcting their previous improperly capitalized amounts related to valuation of foreign currency-denominated loans and fixed assets during 2013–15. The total sum of accumulated adjustment amounted to KGS 10 billion, which in combination with other operational losses resulted in a net loss of KGS 12 billion for 2017, or approximately 2.1 percent of the country’s GDP.
Accumulated losses drove NESK equity to a negative value in 2018, urgently raising the need for capitalization and fresh funds to ease the company’s debt burden.
NESK’s operating performance has improved slightly over the past two years: revenues demonstrated a steady growth during 2016–18, from KGS 3.1 billion in 2016 to KGS 3.7 billion in 2018, or by 18.5 percent. NESK also managed to control its operating expenses, improving its operating ratio from 0.76 in 2016 to 1.04 in 2018. However, much improvement in financial performance is still needed.
Presently, NESK is a highly leveraged company, with its debt growing steadily over the past three years. In 2018, the ratio of liabilities to assets reached 1.04, which reflects the fact that NESK is fully financed by debt. In 2017, the book value of its borrowings dropped from KGS 48.2 billion to KGS 34.5 billion because of a fair-value adjustment, discounting future cash flows related to outstanding debt in accordance with the International Accounting Standard (IAS) 39: “Financial instruments: recognition and measurement.” As a result of this adjustment, fair value of outstanding loans at the end of 2018 stood at KGS 36.3 billion, while their nominal value was KGS 51.7 billion, or 9.3 percent of the country’s GDP. Concurrently, the value of
140
assets also decreased, by KGS 10 billion, once the company derecognized foreign exchange differences from its balance sheet.
NESK’s current level of debt is unsustainable and should be approached from a strategic angle. While the company consistently generates positive cash flow from operating activities, it is only capable of partially meeting its debt servicing charges. Over the past few years, the government regularly restructured the debt repayment schedule and other terms of NESK loans to prevent the company from defaulting on its obligations. During 2016–18, the restructured amounts reached KGS 3.4 billion, with NESK’s debt repayment arrears rolling over to future years, thus resolving only immediate financial difficulties. In 2019 already, additional restructuring may be required for NESK to meet its budgeted debt servicing obligations of KGS 2.8 billion. In the future, annual payments are forecasted to grow over the next 12 years and reach a massive KGS 7.3 billion by 2030.101 The estimation is based on the historical operating cash flows and new debt repayment schedule, which enables one to approximate further buildup of repayment arrears of about KGS 1 billion under the best-case scenario.
NESK’s liquidity dropped significantly below good standing, with its current ratio falling from 1.9 (2016) to 0.5 (2018). It is an indication of a company’s going concern when the current ratio is at or above 1.0.102 This dramatic decline in NESK’s liquidity is attributable to two factors: (1) the current portion of the long-term debt tripled during 2018 in comparison with 2016; and (2) current assets decreased due to the KGS 1 billion provision booked for doubtful accounts receivable in 2018. These events affect the current ratio from both sides by significantly increasing current liabilities and reducing current assets. In addition, the provision for accounts receivable confirms that NESK experiences difficulties with collecting overdue payments, including from the energy distribution companies that account for a substantial portion of the arrears.
JSC Severelectro (SE)
SE is the largest energy distribution company in Kyrgyz Republic, distributing and selling 51 percent of all electricity in the domestic market. The company operates in the metropolitan area of the capital, Bishkek City, located within the borders of Chuy and Talas regions. SE operates and maintains air, cable, high-voltage and low-voltage networks, and power equipment in this geographical area, as well as the purchase, distribution, and sale of electricity through its 20 regional branches. The government owns 93.65 percent of the company shares via NEHC.
101 Source: World Bank staff estimates. 102 Sources: Analysts’ reports (multiple), AES Corporation annual reports (multiple years), and ratios analysis https://www.macrotrends.net/stocks/charts/AES/aes/financial-ratios; Wiener Energy management reports (multiple years) https://www.wienenergie.at/eportal3/ep/channelView.do/pageTypeId/67860/channelId/-51877.
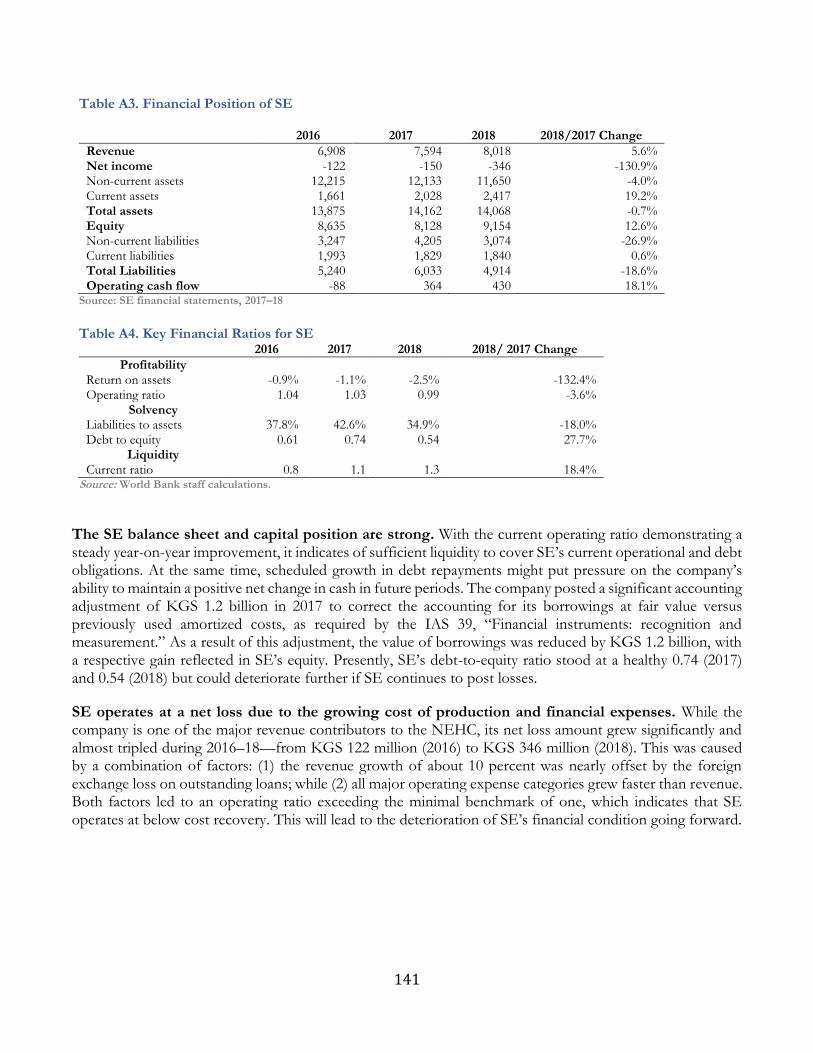
141
Table A3. Financial Position of SE
2016 2017 2018 2018/2017 Change
Revenue 6,908 7,594 8,018 5.6% Net income -122 -150 -346 -130.9% Non-current assets 12,215 12,133 11,650 -4.0% Current assets 1,661 2,028 2,417 19.2% Total assets 13,875 14,162 14,068 -0.7% Equity 8,635 8,128 9,154 12.6% Non-current liabilities 3,247 4,205 3,074 -26.9% Current liabilities 1,993 1,829 1,840 0.6% Total Liabilities 5,240 6,033 4,914 -18.6% Operating cash flow -88 364 430 18.1%
Source: SE financial statements, 2017–18
Table A4. Key Financial Ratios for SE
2016 2017 2018 2018/ 2017 Change
Profitability Return on assets -0.9% -1.1% -2.5% -132.4% Operating ratio 1.04 1.03 0.99 -3.6%
Solvency Liabilities to assets 37.8% 42.6% 34.9% -18.0% Debt to equity 0.61 0.74 0.54 27.7%
Liquidity Current ratio 0.8 1.1 1.3 18.4%
Source: World Bank staff calculations.
The SE balance sheet and capital position are strong. With the current operating ratio demonstrating a steady year-on-year improvement, it indicates of sufficient liquidity to cover SE’s current operational and debt obligations. At the same time, scheduled growth in debt repayments might put pressure on the company’s ability to maintain a positive net change in cash in future periods. The company posted a significant accounting adjustment of KGS 1.2 billion in 2017 to correct the accounting for its borrowings at fair value versus previously used amortized costs, as required by the IAS 39, “Financial instruments: recognition and measurement.” As a result of this adjustment, the value of borrowings was reduced by KGS 1.2 billion, with a respective gain reflected in SE’s equity. Presently, SE’s debt-to-equity ratio stood at a healthy 0.74 (2017) and 0.54 (2018) but could deteriorate further if SE continues to post losses.
SE operates at a net loss due to the growing cost of production and financial expenses. While the company is one of the major revenue contributors to the NEHC, its net loss amount grew significantly and almost tripled during 2016–18—from KGS 122 million (2016) to KGS 346 million (2018). This was caused by a combination of factors: (1) the revenue growth of about 10 percent was nearly offset by the foreign exchange loss on outstanding loans; while (2) all major operating expense categories grew faster than revenue. Both factors led to an operating ratio exceeding the minimal benchmark of one, which indicates that SE operates at below cost recovery. This will lead to the deterioration of SE’s financial condition going forward.
142
JSC Vostokelectro (VE)
VE is a distribution company responsible for electricity distribution and sale in the eastern part of the Kyrgyz Republic. The company operates in the Issyk Kul and Naryn regions, also covering part of the Jalalabad region. VE implements its activities through seven regional branches. The government owns 93.65 percent of the company via NEHC.
Table A5. Financial Position of VE
2016 2017 2018 2018/2017 Change
Revenue 1,572 1,768 1,822 3.0% Net income -71 98 108 10.0% Non-current assets 697 790 883 11.9% Current assets 448 323 313 -3.0% Total Assets 1,145 1,112 1,197 7.6% Equity -338 -240 -137 42.9% Non-current liabilities 237 214 207 -3.1% Current liabilities 1,247 1,138 1,126 -1.1% Total Liabilities 1,483 1,352 1,334 -1.4% Operating cash flow 57 52 60 15.4%
Source: VE financial statements 2017–18.
Table A6. Key Financial Ratios for VE
2016 2017 2018 2018/2017 Change
Profitability Return on assets -6.2% 8.8% 9.0% 2.2%
Operating ratio 0.95 1.06 1.07 0.7%
Solvency Liabilities to assets 129.6% 121.6% 111.5% -8.3%
Liquidity Current ratio 0.4 0.3 0.3 -2.0%
Source: World Bank staff calculations. VE’s profits improved during 2016–18, yet not enough to compensate for the negative equity created from the prior year’s accumulated losses. During 2016–18, the company was able to turn around its losses of KGS 71 million (2016) to a net profit of KGS 108.1 million (2018). This was possible in part due to growing revenues of electricity consumption that increased by 15.9 percent, but also due to a lower increase in associated expenses, which only grew at a yearly rate of 3 percent. VE’s finance costs decreased because of a steady reduction in the current portion of loans. While the company incurred a foreign exchange loss in 2017, it did not have a substantial impact on VE’s net profit, as the amount of outstanding loans denominated in foreign currencies is insignificant—14.3 percent of total liabilities.
VE’s balance sheet had been overstretched for several years, with negative equity and liabilities exceeding assets. VE had fully depleted its equity and was funding its operations entirely with borrowed funds and arrears to its suppliers. Improved operational effectiveness should improve capital position of the company if the profit-generating trend continues to reach a positive equity position in two to three years’
143
time—though additional equity injections by the NEHC may be needed to support much needed maintenance.
VE is primarily financed by short-term accounts payable to its suppliers, including arrears to EEP and NESK. In 2018 the financial debt accounted for only 14.3 percent of total liabilities. While the company was able to reduce its accounts payable, they still formed 64.9 percent of VE’s total liabilities and exceeded accounts receivable by five times. Effectively, VE extensively uses accounts payable, including payments in arrears, as a core source for financing its activities. This mechanism creates an intercompany settlement of arrears from VE to NESK and EEP. The funding pattern causes VE’s current ratio plummet to unsafely low levels, of 0.3 versus 1.0, for a well-balanced current liquidity position. The current ratio below 1.0 raises significant doubts for the company to continue as a going concern. This also means that soon VE will experience problems with repaying its accumulated accounts payable for its energy supply.
JSC Oshelectro (OE)
OE is an electricity distribution company in the southern region of the Kyrgyz Republic. The company operates in the Osh and Batken regions, implementing its activities through 13 regional branches and one wholesaler. The company is also responsible for repair and operational maintenance of the distribution electricity network in those regions. The government owns 93.65 percent of the company shares via NEHC.
Table A7. Financial Position of OE 2017 2018 2018/2017 Change
Revenue 2,621 2,796 6.7%
Net income -122 -28 76.9%
Non-current assets 3,980 3,686 -7.4%
Current assets 615 583 -5.2%
Total Assets 4,594.7 4,268.8 -7.1%
Equity 2,524.1 2,258.4 -10.5%
Non-current liabilities 896.2 919.5 2.6%
Current liabilities 1,174.4 1,090.9 -7.1%
Total Liabilities 2,070.6 2,010.4 -2.9%
Operating cash flow 84.0 48.0 -43.3% Source: OE financial statements.
Table A8. Key Financial Ratios for OE 2017 2018 2018/2017 Change
Profitability Return on assets -2.7% -0.7% 75.1%
Operating ratio 0.96 0.99 3.4%
Solvency Liabilities to assets 45.1% 47.1% 4.5%
Debt to equity 0.82 0.89 8.5%
Current ratio 0.5 0.5 2.0% Source: World Bank staff calculations.

144
OE operates at a net loss with a growing cost of production and financial expenses. During 2017–18, the company was able to reduce its loss by KGS 94 million. This was possible in part due to growing revenues of electricity consumption that increased by 6.7 percent, but also due to a lower increase in associated expenses that only increased at a yearly rate of 4.4 percent. The operating results narrowly improved, but the operating ratio was still below the minimum prudent level of 1.0, indicating that OE operates at below cost-recovery. This may lead to the deterioration of its financial condition going forward.
Despite its losses, OE maintains a strong equity position and low leverage structure. The debt-to-equity ratio stands at a healthy 0.89 (2018) and 0.82 (2017), with external loans accounting for 25 percent of OE liabilities. While the company was able to reduce its accounts payable, they still formed 38 percent of OE total liabilities, including arrears to its main suppliers.
OE uses accounts payable and arrears as part of the funding mechanism, which is reflected in OE’s current ratio, fluctuating as low as 0.5 versus 1.0 for a well-balanced current liquidity position. While during 2018 OE continued making interest and principal payments on its loans, repaying some arrears, and acquiring equipment, its current ratio of 0.5 raises significant doubts that the company can continue as a going concern. This also means that OE’s liquidity risk remains high and that OE may experience problems with repaying its accumulated accounts payable for the energy supply. SC Jalalabadelectro (JE)
JE is the distribution company operating in the western part of the Kyrgyz Republic. The company operates in Jalalabad region through 13 regional branches and one wholesaler. The company is also responsible for repair and operational maintenance of its distribution electricity network. The government owns 93.65 percent of the company via NEHC.
Table A9. Financial Position of JE 2017 2018 2018/2017 Change
Revenue 1,717 1,785 4.0%
Net income 19 54 194.1%
Non-current assets 757 818 8.0%
Current assets 294 302 2.7%
Total Assets 1,052 1,120 6.5%
Equity -69 -19 72.7%
Non-current liabilities 499 474 -5.0%
Current liabilities 621 665 7.1%
Total Liabilities 1,120 1,139 1.7%
Operating cash flow 28 62 117.3%
Source: JE financial statements 2017–18.
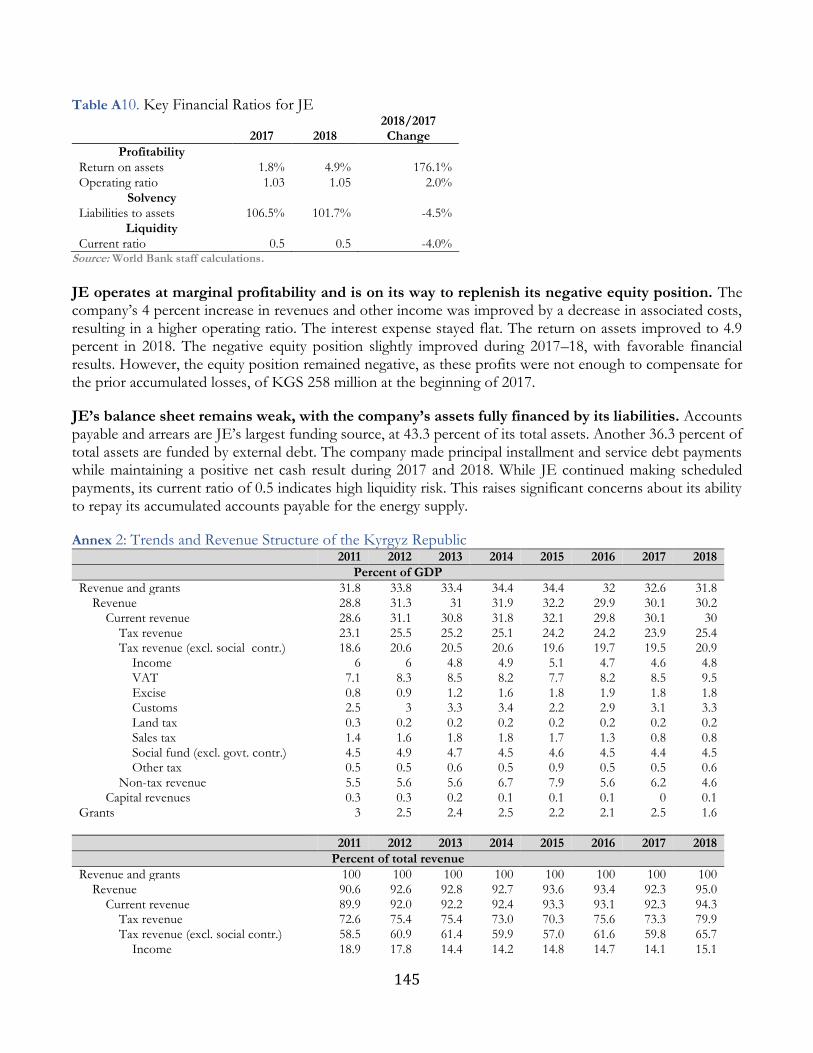
145
Table A10. Key Financial Ratios for JE
2017 2018 2018/2017 Change
Profitability Return on assets 1.8% 4.9% 176.1%
Operating ratio 1.03 1.05 2.0%
Solvency Liabilities to assets 106.5% 101.7% -4.5%
Liquidity Current ratio 0.5 0.5 -4.0%
Source: World Bank staff calculations. JE operates at marginal profitability and is on its way to replenish its negative equity position. The company’s 4 percent increase in revenues and other income was improved by a decrease in associated costs, resulting in a higher operating ratio. The interest expense stayed flat. The return on assets improved to 4.9 percent in 2018. The negative equity position slightly improved during 2017–18, with favorable financial results. However, the equity position remained negative, as these profits were not enough to compensate for the prior accumulated losses, of KGS 258 million at the beginning of 2017.
JE’s balance sheet remains weak, with the company’s assets fully financed by its liabilities. Accounts payable and arrears are JE’s largest funding source, at 43.3 percent of its total assets. Another 36.3 percent of total assets are funded by external debt. The company made principal installment and service debt payments while maintaining a positive net cash result during 2017 and 2018. While JE continued making scheduled payments, its current ratio of 0.5 indicates high liquidity risk. This raises significant concerns about its ability to repay its accumulated accounts payable for the energy supply.
Annex 2: Trends and Revenue Structure of the Kyrgyz Republic 2011 2012 2013 2014 2015 2016 2017 2018
Percent of GDP
Revenue and grants 31.8 33.8 33.4 34.4 34.4 32 32.6 31.8 Revenue 28.8 31.3 31 31.9 32.2 29.9 30.1 30.2
Current revenue 28.6 31.1 30.8 31.8 32.1 29.8 30.1 30 Tax revenue 23.1 25.5 25.2 25.1 24.2 24.2 23.9 25.4 Tax revenue (excl. social contr.) 18.6 20.6 20.5 20.6 19.6 19.7 19.5 20.9
Income 6 6 4.8 4.9 5.1 4.7 4.6 4.8 VAT 7.1 8.3 8.5 8.2 7.7 8.2 8.5 9.5 Excise 0.8 0.9 1.2 1.6 1.8 1.9 1.8 1.8 Customs 2.5 3 3.3 3.4 2.2 2.9 3.1 3.3 Land tax 0.3 0.2 0.2 0.2 0.2 0.2 0.2 0.2 Sales tax 1.4 1.6 1.8 1.8 1.7 1.3 0.8 0.8 Social fund (excl. govt. contr.) 4.5 4.9 4.7 4.5 4.6 4.5 4.4 4.5 Other tax 0.5 0.5 0.6 0.5 0.9 0.5 0.5 0.6
Non-tax revenue 5.5 5.6 5.6 6.7 7.9 5.6 6.2 4.6 Capital revenues 0.3 0.3 0.2 0.1 0.1 0.1 0 0.1
Grants 3 2.5 2.4 2.5 2.2 2.1 2.5 1.6
2011 2012 2013 2014 2015 2016 2017 2018
Percent of total revenue
Revenue and grants 100 100 100 100 100 100 100 100 Revenue 90.6 92.6 92.8 92.7 93.6 93.4 92.3 95.0
Current revenue 89.9 92.0 92.2 92.4 93.3 93.1 92.3 94.3 Tax revenue 72.6 75.4 75.4 73.0 70.3 75.6 73.3 79.9 Tax revenue (excl. social contr.) 58.5 60.9 61.4 59.9 57.0 61.6 59.8 65.7
Income 18.9 17.8 14.4 14.2 14.8 14.7 14.1 15.1
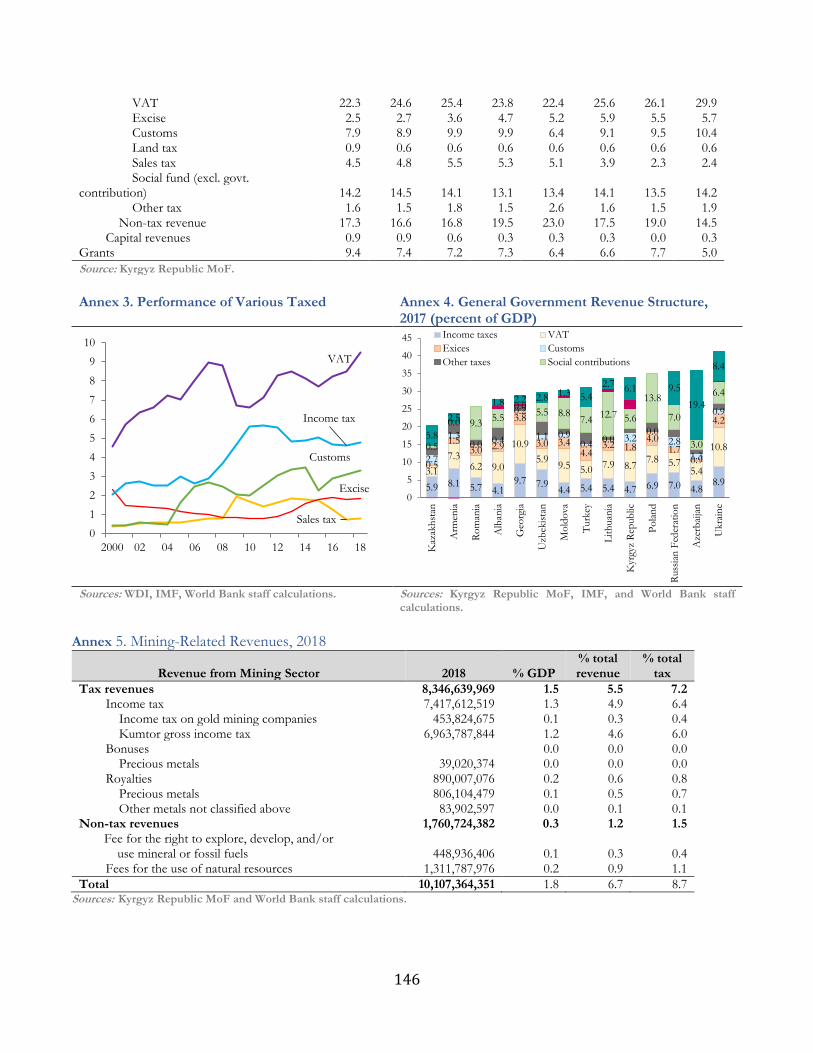
146
VAT 22.3 24.6 25.4 23.8 22.4 25.6 26.1 29.9 Excise 2.5 2.7 3.6 4.7 5.2 5.9 5.5 5.7 Customs 7.9 8.9 9.9 9.9 6.4 9.1 9.5 10.4 Land tax 0.9 0.6 0.6 0.6 0.6 0.6 0.6 0.6 Sales tax 4.5 4.8 5.5 5.3 5.1 3.9 2.3 2.4 Social fund (excl. govt.
contribution) 14.2 14.5 14.1 13.1 13.4 14.1 13.5 14.2 Other tax 1.6 1.5 1.8 1.5 2.6 1.6 1.5 1.9
Non-tax revenue 17.3 16.6 16.8 19.5 23.0 17.5 19.0 14.5 Capital revenues 0.9 0.9 0.6 0.3 0.3 0.3 0.0 0.3
Grants 9.4 7.4 7.2 7.3 6.4 6.6 7.7 5.0
Source: Kyrgyz Republic MoF.
Annex 3. Performance of Various Taxed Annex 4. General Government Revenue Structure,
2017 (percent of GDP)
Sources: WDI, IMF, World Bank staff calculations. Sources: Kyrgyz Republic MoF, IMF, and World Bank staff
calculations.
Annex 5. Mining-Related Revenues, 2018
Revenue from Mining Sector 2018 % GDP % total revenue
% total tax
Tax revenues 8,346,639,969 1.5 5.5 7.2 Income tax 7,417,612,519 1.3 4.9 6.4
Income tax on gold mining companies 453,824,675 0.1 0.3 0.4 Kumtor gross income tax 6,963,787,844 1.2 4.6 6.0
Bonuses 0.0 0.0 0.0 Precious metals 39,020,374 0.0 0.0 0.0
Royalties 890,007,076 0.2 0.6 0.8 Precious metals 806,104,479 0.1 0.5 0.7 Other metals not classified above 83,902,597 0.0 0.1 0.1
Non-tax revenues 1,760,724,382 0.3 1.2 1.5 Fee for the right to explore, develop, and/or
use mineral or fossil fuels 448,936,406 0.1 0.3 0.4 Fees for the use of natural resources 1,311,787,976 0.2 0.9 1.1
Total 10,107,364,351 1.8 6.7 8.7 Sources: Kyrgyz Republic MoF and World Bank staff calculations.
VAT
Sales tax
Excise
Customs
Income tax
0
1
2
3
4
5
6
7
8
9
10
2000 02 04 06 08 10 12 14 16 18
5.9 8.1 5.7 4.19.7 7.9
4.4 5.4 5.4 4.7 6.9 7.0 4.88.9
3.1
7.36.2 9.0
10.9
5.99.5 5.0
7.9 8.77.8 5.7
5.4
10.8
0.5
1.53.0 2.9
3.8
3.0 3.44.4
3.2 1.84.0
1.70.9
4.2
2.7
1.30.0 0.4
0.2
1.1 0.90.4
0.0 3.20.0
2.8
1.3
0.9
0.5
0.0 9.35.5
0.05.5 8.8
7.412.7 5.6
13.8
7.0
3.0
6.4
5.8
2.5
1.8 2.2 2.8 1.3 5.4
2.7 6.1 9.5
19.4
8.4
0
5
10
15
20
25
30
35
40
45
Kaz
akh
stan
Arm
enia
Ro
man
ia
Alb
ania
Geo
rgia
Uzb
ekis
tan
Mo
ldo
va
Turk
ey
Lit
huan
ia
Kyr
gyz
Rep
ub
lic
Po
lan
d
Russ
ian
Fed
erat
ion
Aze
rbai
jan
Ukra
ine
Income taxes VAT
Exices Customs
Other taxes Social contributions
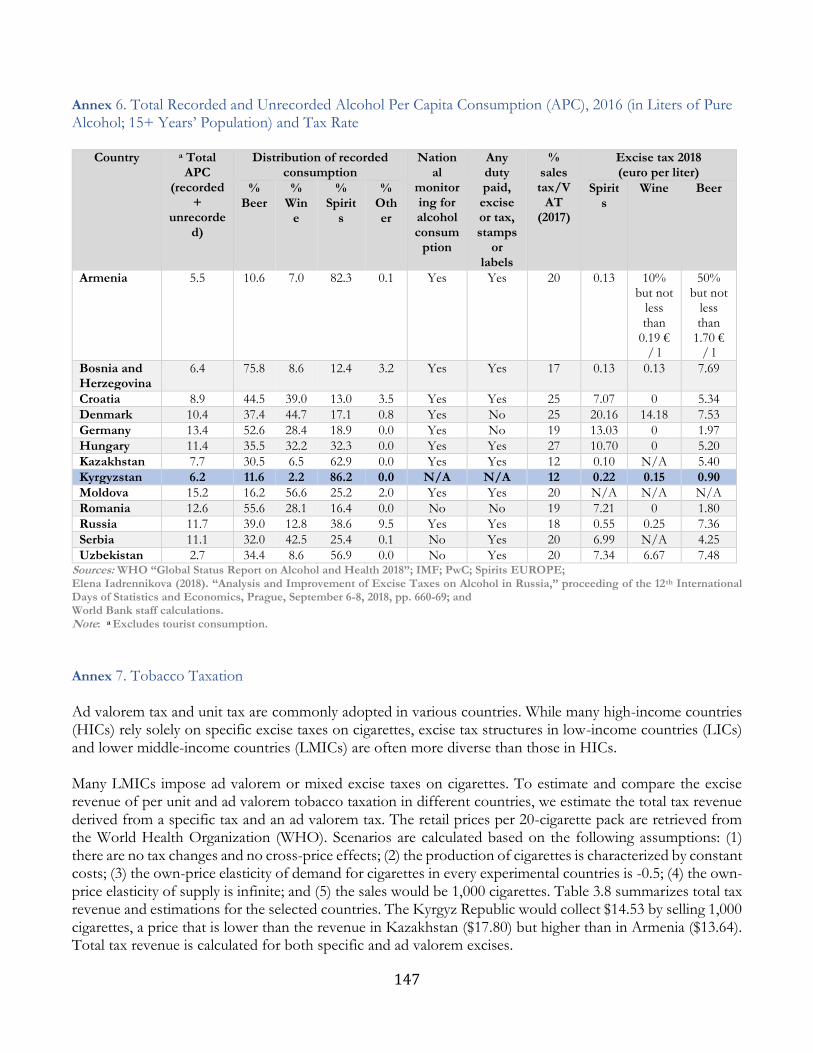
147
Annex 6. Total Recorded and Unrecorded Alcohol Per Capita Consumption (APC), 2016 (in Liters of Pure Alcohol; 15+ Years’ Population) and Tax Rate
Country a Total
APC (recorded
+ unrecorde
d)
Distribution of recorded consumption
National
monitoring for alcohol consum
ption
Any duty paid, excise or tax, stamps
or labels
% sales tax/V
AT (2017)
Excise tax 2018 (euro per liter)
% Beer
% Win
e
% Spirit
s
% Other
Spirits
Wine Beer
Armenia 5.5 10.6 7.0 82.3 0.1 Yes Yes 20 0.13 10% but not
less than
0.19 € / l
50% but not
less than
1.70 € / l
Bosnia and Herzegovina
6.4 75.8 8.6 12.4 3.2 Yes Yes 17 0.13 0.13 7.69
Croatia 8.9 44.5 39.0 13.0 3.5 Yes Yes 25 7.07 0 5.34
Denmark 10.4 37.4 44.7 17.1 0.8 Yes No 25 20.16 14.18 7.53
Germany 13.4 52.6 28.4 18.9 0.0 Yes No 19 13.03 0 1.97
Hungary 11.4 35.5 32.2 32.3 0.0 Yes Yes 27 10.70 0 5.20
Kazakhstan 7.7 30.5 6.5 62.9 0.0 Yes Yes 12 0.10 N/A 5.40
Kyrgyzstan 6.2 11.6 2.2 86.2 0.0 N/A N/A 12 0.22 0.15 0.90
Moldova 15.2 16.2 56.6 25.2 2.0 Yes Yes 20 N/A N/A N/A
Romania 12.6 55.6 28.1 16.4 0.0 No No 19 7.21 0 1.80
Russia 11.7 39.0 12.8 38.6 9.5 Yes Yes 18 0.55 0.25 7.36
Serbia 11.1 32.0 42.5 25.4 0.1 No Yes 20 6.99 N/A 4.25
Uzbekistan 2.7 34.4 8.6 56.9 0.0 No Yes 20 7.34 6.67 7.48 Sources: WHO “Global Status Report on Alcohol and Health 2018”; IMF; PwC; Spirits EUROPE; Elena Iadrennikova (2018). “Analysis and Improvement of Excise Taxes on Alcohol in Russia,” proceeding of the 12th International Days of Statistics and Economics, Prague, September 6-8, 2018, pp. 660-69; and World Bank staff calculations. Note: a Excludes tourist consumption.
Annex 7. Tobacco Taxation Ad valorem tax and unit tax are commonly adopted in various countries. While many high-income countries (HICs) rely solely on specific excise taxes on cigarettes, excise tax structures in low-income countries (LICs) and lower middle-income countries (LMICs) are often more diverse than those in HICs. Many LMICs impose ad valorem or mixed excise taxes on cigarettes. To estimate and compare the excise revenue of per unit and ad valorem tobacco taxation in different countries, we estimate the total tax revenue derived from a specific tax and an ad valorem tax. The retail prices per 20-cigarette pack are retrieved from the World Health Organization (WHO). Scenarios are calculated based on the following assumptions: (1) there are no tax changes and no cross-price effects; (2) the production of cigarettes is characterized by constant costs; (3) the own-price elasticity of demand for cigarettes in every experimental countries is -0.5; (4) the own-price elasticity of supply is infinite; and (5) the sales would be 1,000 cigarettes. Table 3.8 summarizes total tax revenue and estimations for the selected countries. The Kyrgyz Republic would collect $14.53 by selling 1,000 cigarettes, a price that is lower than the revenue in Kazakhstan ($17.80) but higher than in Armenia ($13.64). Total tax revenue is calculated for both specific and ad valorem excises.
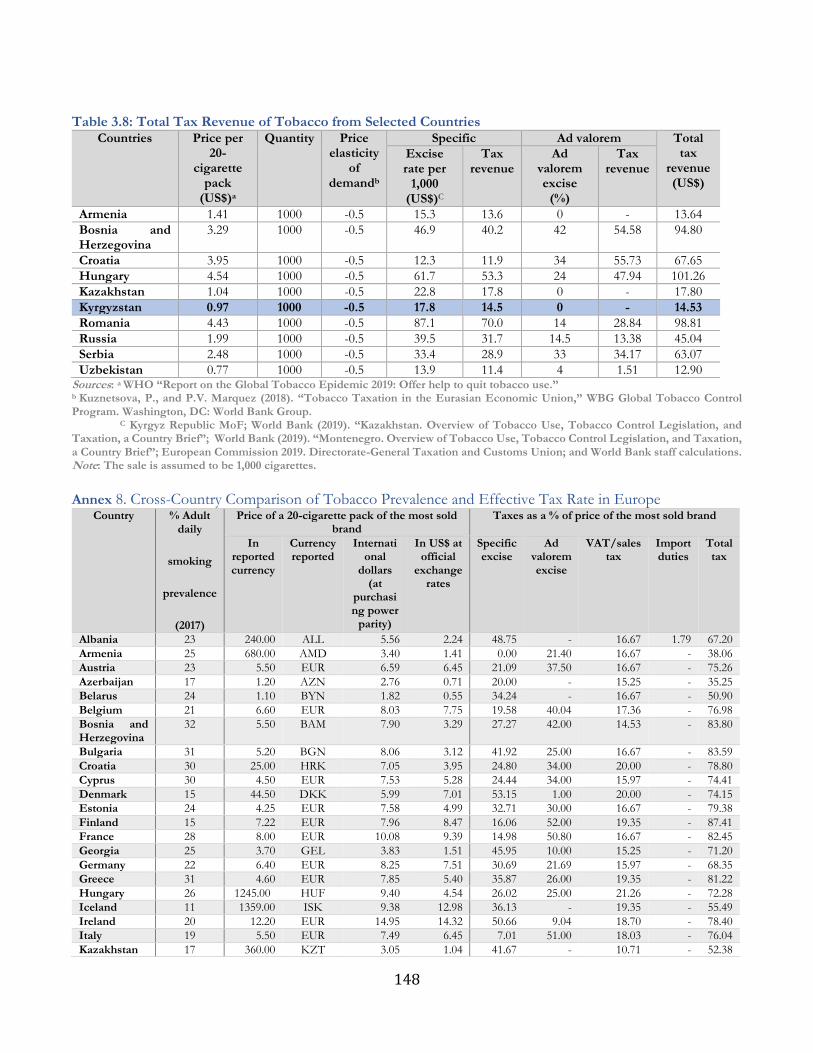
148
Table 3.8: Total Tax Revenue of Tobacco from Selected Countries
Countries Price per 20-
cigarette pack
(US$)a
Quantity Price elasticity
of demandb
Specific Ad valorem Total tax
revenue (US$)
Excise rate per
1,000 (US$)C
Tax revenue
Ad valorem excise
(%)
Tax revenue
Armenia 1.41 1000 -0.5 15.3 13.6 0 - 13.64
Bosnia and Herzegovina
3.29 1000 -0.5 46.9 40.2 42 54.58 94.80
Croatia 3.95 1000 -0.5 12.3 11.9 34 55.73 67.65
Hungary 4.54 1000 -0.5 61.7 53.3 24 47.94 101.26
Kazakhstan 1.04 1000 -0.5 22.8 17.8 0 - 17.80
Kyrgyzstan 0.97 1000 -0.5 17.8 14.5 0 - 14.53
Romania 4.43 1000 -0.5 87.1 70.0 14 28.84 98.81
Russia 1.99 1000 -0.5 39.5 31.7 14.5 13.38 45.04
Serbia 2.48 1000 -0.5 33.4 28.9 33 34.17 63.07
Uzbekistan 0.77 1000 -0.5 13.9 11.4 4 1.51 12.90 Sources: a WHO “Report on the Global Tobacco Epidemic 2019: Offer help to quit tobacco use.” b Kuznetsova, P., and P.V. Marquez (2018). “Tobacco Taxation in the Eurasian Economic Union,” WBG Global Tobacco Control Program. Washington, DC: World Bank Group. C Kyrgyz Republic MoF; World Bank (2019). “Kazakhstan. Overview of Tobacco Use, Tobacco Control Legislation, and Taxation, a Country Brief”; World Bank (2019). “Montenegro. Overview of Tobacco Use, Tobacco Control Legislation, and Taxation, a Country Brief”; European Commission 2019. Directorate-General Taxation and Customs Union; and World Bank staff calculations. Note: The sale is assumed to be 1,000 cigarettes.
Annex 8. Cross-Country Comparison of Tobacco Prevalence and Effective Tax Rate in Europe
Country % Adult daily
smoking
prevalence
(2017)
Price of a 20-cigarette pack of the most sold brand
Taxes as a % of price of the most sold brand
In reported currency
Currency reported
International
dollars (at
purchasing power
parity)
In US$ at official
exchange rates
Specific excise
Ad valorem excise
VAT/sales tax
Import duties
Total tax
Albania 23 240.00 ALL 5.56 2.24 48.75 - 16.67 1.79 67.20
Armenia 25 680.00 AMD 3.40 1.41 0.00 21.40 16.67 - 38.06
Austria 23 5.50 EUR 6.59 6.45 21.09 37.50 16.67 - 75.26
Azerbaijan 17 1.20 AZN 2.76 0.71 20.00 - 15.25 - 35.25
Belarus 24 1.10 BYN 1.82 0.55 34.24 - 16.67 - 50.90
Belgium 21 6.60 EUR 8.03 7.75 19.58 40.04 17.36 - 76.98
Bosnia and Herzegovina
32 5.50 BAM 7.90 3.29 27.27 42.00 14.53 - 83.80
Bulgaria 31 5.20 BGN 8.06 3.12 41.92 25.00 16.67 - 83.59
Croatia 30 25.00 HRK 7.05 3.95 24.80 34.00 20.00 - 78.80
Cyprus 30 4.50 EUR 7.53 5.28 24.44 34.00 15.97 - 74.41
Denmark 15 44.50 DKK 5.99 7.01 53.15 1.00 20.00 - 74.15
Estonia 24 4.25 EUR 7.58 4.99 32.71 30.00 16.67 - 79.38
Finland 15 7.22 EUR 7.96 8.47 16.06 52.00 19.35 - 87.41
France 28 8.00 EUR 10.08 9.39 14.98 50.80 16.67 - 82.45
Georgia 25 3.70 GEL 3.83 1.51 45.95 10.00 15.25 - 71.20
Germany 22 6.40 EUR 8.25 7.51 30.69 21.69 15.97 - 68.35
Greece 31 4.60 EUR 7.85 5.40 35.87 26.00 19.35 - 81.22
Hungary 26 1245.00 HUF 9.40 4.54 26.02 25.00 21.26 - 72.28
Iceland 11 1359.00 ISK 9.38 12.98 36.13 - 19.35 - 55.49
Ireland 20 12.20 EUR 14.95 14.32 50.66 9.04 18.70 - 78.40
Italy 19 5.50 EUR 7.49 6.45 7.01 51.00 18.03 - 76.04
Kazakhstan 17 360.00 KZT 3.05 1.04 41.67 - 10.71 - 52.38
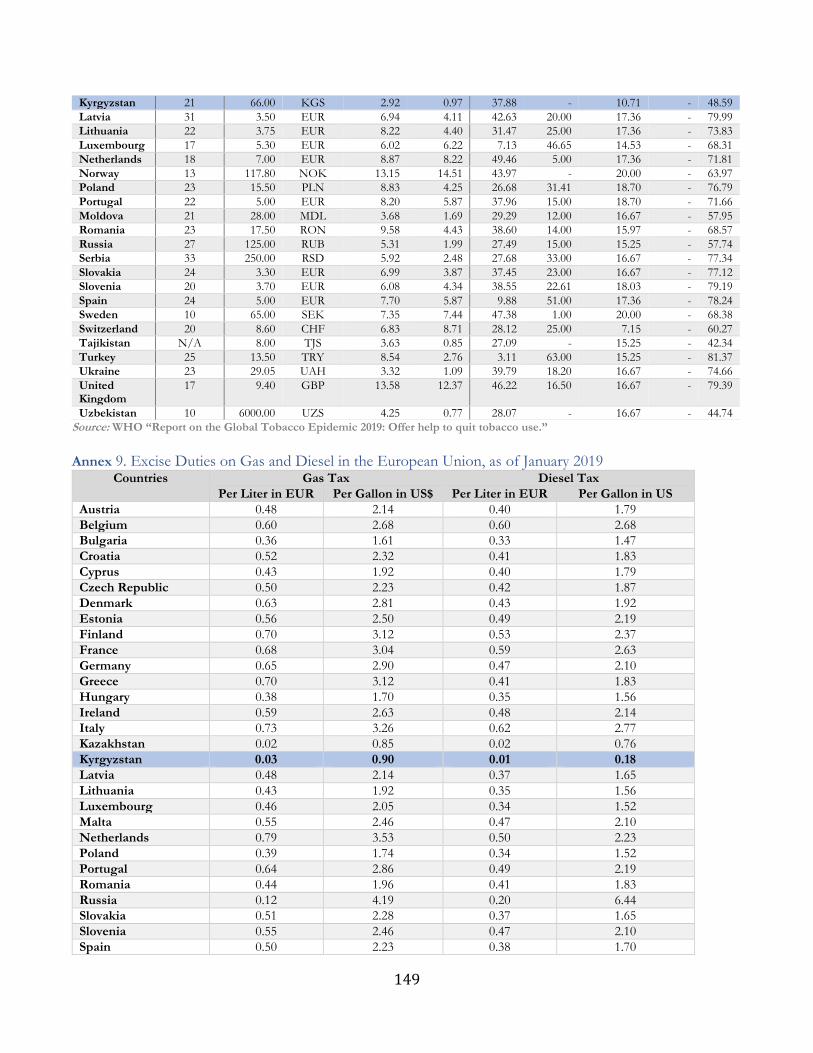
149
Source: WHO “Report on the Global Tobacco Epidemic 2019: Offer help to quit tobacco use.” Annex 9. Excise Duties on Gas and Diesel in the European Union, as of January 2019
Countries Gas Tax Diesel Tax
Per Liter in EUR Per Gallon in US$ Per Liter in EUR Per Gallon in US
Austria 0.48 2.14 0.40 1.79
Belgium 0.60 2.68 0.60 2.68
Bulgaria 0.36 1.61 0.33 1.47
Croatia 0.52 2.32 0.41 1.83
Cyprus 0.43 1.92 0.40 1.79
Czech Republic 0.50 2.23 0.42 1.87
Denmark 0.63 2.81 0.43 1.92
Estonia 0.56 2.50 0.49 2.19
Finland 0.70 3.12 0.53 2.37
France 0.68 3.04 0.59 2.63
Germany 0.65 2.90 0.47 2.10
Greece 0.70 3.12 0.41 1.83
Hungary 0.38 1.70 0.35 1.56
Ireland 0.59 2.63 0.48 2.14
Italy 0.73 3.26 0.62 2.77
Kazakhstan 0.02 0.85 0.02 0.76
Kyrgyzstan 0.03 0.90 0.01 0.18
Latvia 0.48 2.14 0.37 1.65
Lithuania 0.43 1.92 0.35 1.56
Luxembourg 0.46 2.05 0.34 1.52
Malta 0.55 2.46 0.47 2.10
Netherlands 0.79 3.53 0.50 2.23
Poland 0.39 1.74 0.34 1.52
Portugal 0.64 2.86 0.49 2.19
Romania 0.44 1.96 0.41 1.83
Russia 0.12 4.19 0.20 6.44
Slovakia 0.51 2.28 0.37 1.65
Slovenia 0.55 2.46 0.47 2.10
Spain 0.50 2.23 0.38 1.70
Kyrgyzstan 21 66.00 KGS 2.92 0.97 37.88 - 10.71 - 48.59
Latvia 31 3.50 EUR 6.94 4.11 42.63 20.00 17.36 - 79.99
Lithuania 22 3.75 EUR 8.22 4.40 31.47 25.00 17.36 - 73.83
Luxembourg 17 5.30 EUR 6.02 6.22 7.13 46.65 14.53 - 68.31
Netherlands 18 7.00 EUR 8.87 8.22 49.46 5.00 17.36 - 71.81
Norway 13 117.80 NOK 13.15 14.51 43.97 - 20.00 - 63.97
Poland 23 15.50 PLN 8.83 4.25 26.68 31.41 18.70 - 76.79
Portugal 22 5.00 EUR 8.20 5.87 37.96 15.00 18.70 - 71.66
Moldova 21 28.00 MDL 3.68 1.69 29.29 12.00 16.67 - 57.95
Romania 23 17.50 RON 9.58 4.43 38.60 14.00 15.97 - 68.57
Russia 27 125.00 RUB 5.31 1.99 27.49 15.00 15.25 - 57.74
Serbia 33 250.00 RSD 5.92 2.48 27.68 33.00 16.67 - 77.34
Slovakia 24 3.30 EUR 6.99 3.87 37.45 23.00 16.67 - 77.12
Slovenia 20 3.70 EUR 6.08 4.34 38.55 22.61 18.03 - 79.19
Spain 24 5.00 EUR 7.70 5.87 9.88 51.00 17.36 - 78.24
Sweden 10 65.00 SEK 7.35 7.44 47.38 1.00 20.00 - 68.38
Switzerland 20 8.60 CHF 6.83 8.71 28.12 25.00 7.15 - 60.27
Tajikistan N/A 8.00 TJS 3.63 0.85 27.09 - 15.25 - 42.34
Turkey 25 13.50 TRY 8.54 2.76 3.11 63.00 15.25 - 81.37
Ukraine 23 29.05 UAH 3.32 1.09 39.79 18.20 16.67 - 74.66
United Kingdom
17 9.40 GBP 13.58 12.37 46.22 16.50 16.67 - 79.39
Uzbekistan 10 6000.00 UZS 4.25 0.77 28.07 - 16.67 - 44.74
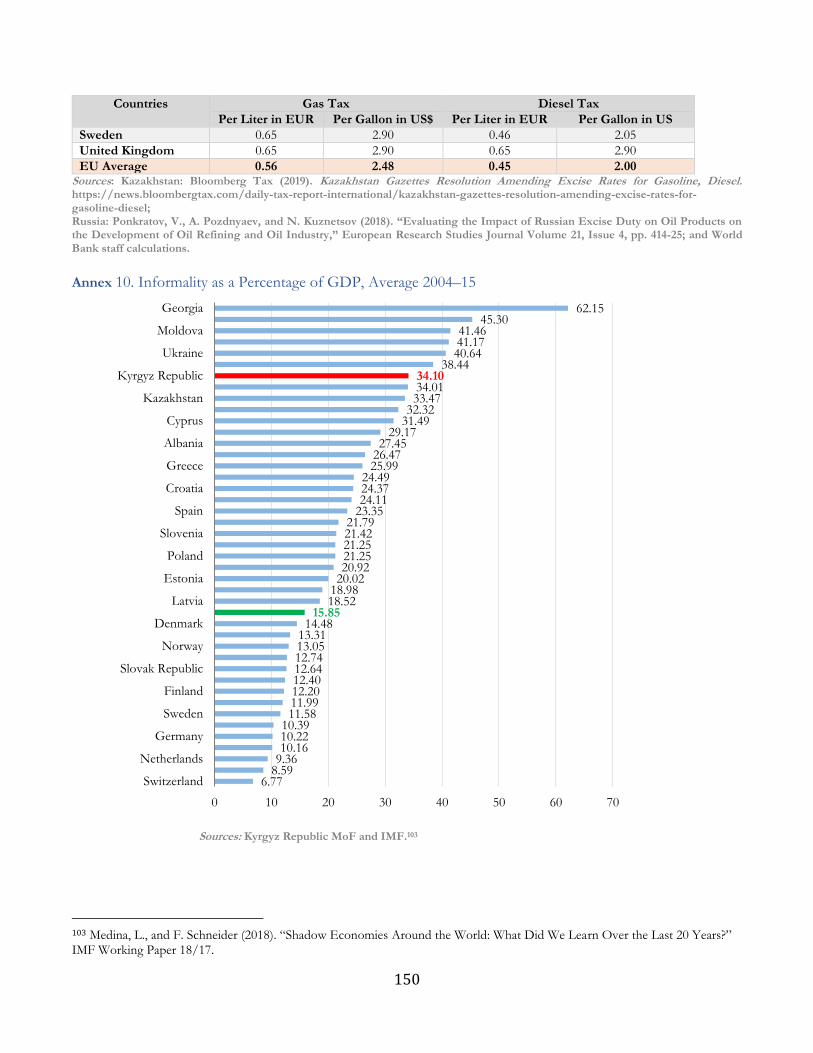
150
Countries Gas Tax Diesel Tax
Per Liter in EUR Per Gallon in US$ Per Liter in EUR Per Gallon in US
Sweden 0.65 2.90 0.46 2.05
United Kingdom 0.65 2.90 0.65 2.90
EU Average 0.56 2.48 0.45 2.00 Sources: Kazakhstan: Bloomberg Tax (2019). Kazakhstan Gazettes Resolution Amending Excise Rates for Gasoline, Diesel. https://news.bloombergtax.com/daily-tax-report-international/kazakhstan-gazettes-resolution-amending-excise-rates-for-gasoline-diesel; Russia: Ponkratov, V., A. Pozdnyaev, and N. Kuznetsov (2018). “Evaluating the Impact of Russian Excise Duty on Oil Products on the Development of Oil Refining and Oil Industry,” European Research Studies Journal Volume 21, Issue 4, pp. 414-25; and World Bank staff calculations.
Annex 10. Informality as a Percentage of GDP, Average 2004–15
Sources: Kyrgyz Republic MoF and IMF.103
103 Medina, L., and F. Schneider (2018). “Shadow Economies Around the World: What Did We Learn Over the Last 20 Years?” IMF Working Paper 18/17.
6.778.599.3610.1610.2210.39
11.5811.9912.2012.4012.6412.7413.0513.31
14.4815.85
18.5218.9820.0220.9221.2521.2521.4221.79
23.3524.1124.3724.49
25.9926.4727.45
29.1731.4932.3233.4734.0134.10
38.4440.6441.1741.46
45.3062.15
0 10 20 30 40 50 60 70
Switzerland
Netherlands
Germany
Sweden
Finland
Slovak Republic
Norway
Denmark
Latvia
Estonia
Poland
Slovenia
Spain
Croatia
Greece
Albania
Cyprus
Kazakhstan
Kyrgyz Republic
Ukraine
Moldova
Georgia