a participatory framework for conservation payments
TRANSCRIPT
A
MC
a
ARRA
KPPPCSP
I
mmmbo12We2t
0d
Land Use Policy 28 (2011) 423–433
Contents lists available at ScienceDirect
Land Use Policy
journa l homepage: www.e lsev ier .com/ locate / landusepol
participatory framework for conservation payments
aría Mánez Costa ∗
limate Service Centre, Helmholtz Zentrum Geesthacht, Bundesstrasse 45 a, 20146 Hamburg, Germany
r t i c l e i n f o
rticle history:eceived 14 July 2009eceived in revised form 9 September 2010ccepted 14 September 2010
eywords:articipatory modelingayments for environmental servicesricing schemesonservation agreementstakeholder involvementoverty reduction
a b s t r a c t
This paper describes a participatory framework used in Alta Verapaz, Guatemala to analyze the futureviability of different conservation measures in a cloud forest area. It presents how in the case of conserva-tion initiatives, participatory developed instruments could provide the incentive for farmers to reinforceor introduce conservation measures in their farming systems to preserve habitats, reduce species disrup-tions and alleviate poverty. A model’s architecture was created with stakeholders of different settings ofthe region of study. Together, baseline-scenarios and policy-scenarios on land use and income generationwere developed. The paper investigates the potential impacts of different policy measures for conserva-tion and poverty reduction through the instrument “payments for environmental services”. Aim was tointegrate social, economic and environmental aspects.
In the paper, (1) farming systems’ characteristics are described; (2) conservation activities are definedand standardized; and (3) policy recommendations out of different scenarios are given. The paper dis-cusses the possibilities of compensating farmers for the affecting costs of already existing conservationactivities by introducing a participatory developed policy instrument that captures the needs of the differ-ent farming systems. I suggest that acceptance or rejection of these payments is related to the farm-levelstrategies for coping with risk. I presuppose that if farmers see an advantage in producing environmentalservices because it signified an increase in their income and a decrease of risk, they will adopt and aug-
ment conservation techniques in their farming systems (Herrador and Dimas, 2000, 2001). Main findingsshow that the amount of on-farm production is very significant for the classification of farming systems.Further, scenario for land use and income changes were seen as main drivers for conservation.The paper concludes showing that including in the modeling the economic disparities of the differentfarming systems and the active participation of stakeholders supports the acceptance and implemen-tation of this policy instrument to promote agricultural landscapes with biodiversity and watershed
ttiMMRtdtc
conservation.
ntroduction
In the last decades, the literature on payments for environ-ental services has generated different visions on the creation ofarket-based mechanisms that could practically address environ-ental, economic and social policy concerns. Some efforts have
een made to apply market mechanisms to give a certain degreef marketability to environmental services (Deininger and Minten,999; Angelsen et al., 1999; Curtis, 2000; Burstein, 2000; Aylward,002a, 2002b, 2002c; Landell-Mills and Porras, 2002; Scherr and
hite, 2002; Alix-Garcia and Janvry, 2003; Chomitz, 2004; Chomitzt al., 2007; Pagiola et al., 2004; Pagiola, 2008; Wunder, 2006,007). This paper follows the vision that proposes to conceptualisehose policy measures at the local level. The research objective it
∗ Corresponding author Tel.: +49 40 226338 408.E-mail address: [email protected].
d
ribtaa
264-8377/$ – see front matter © 2010 Elsevier Ltd. All rights reserved.oi:10.1016/j.landusepol.2010.09.003
© 2010 Elsevier Ltd. All rights reserved.
o assure the co-design of this environmental policy instrumenthrough service agreements, including public participation andncome disparities in their conception (Van den Hove, 2000; De
archi and Ravetz, 2001; Ferraro and Kiss, 2002; Pahl-Wostl, 2002;cIntyre-Mills, 2003; Hare et al., 2004; Pahl-Wostl and Hare, 2004;
enn, 2006; Santos et al., 2006). One strong argument for that ishe effectiveness of locally conceived conservation work and co-esign of conservation measures. This argument is supported byhe rejection rate observed by many service providers in manyonservation payments schemes developed by governments andonors.
One way of overcoming the problems that occur when envi-onmental, social, and economic policies are developed in isolation
s to engage a range of key stakeholders involved in and affectedy those policies. However, although payment for environmen-al services has been increasingly recognized in the last decade askey way of internalizing environmental externalities, schemesre usually developed by academics or policy elites, with little
4 se Po
ctddomstfttbs2
mst
C
iwttinC
cId2mcmedat(qpto
aRthmee2s(tw
rteo
M
ttccmbnsltsalaettcepsmti(a
eiblmmaoa
P
lamiaiwi
uwccomtt
24 M. Mánez Costa / Land U
onsultation with the local communities that will be not onlyhe primary recipients of such an initiative but also the “pro-ucers” of environmental benefits. Through a participatory policyesign approach, the co-construction of a shared representationf reality might be possible (Daniell and Ferrand, 2005). Thisight include the transdisciplinary description of environmental
ervices, conservation efforts and governance structure. To date,his sort of integration has not been extensively done. There-ore, the aim of this research has been to develop a participatoryransdisciplinary scheme, where land users are compensated forhe conservation efforts they do as an appropriate way to reim-urse them for the perceived benefits of agro-forestry productionystems to conservation (Grieg-Gran et al., 2005; Mánez Costa,004).
In the next sections I introduce the case study followed by theethodological framework and the results. Further, in the “Discus-
ion” section I discuss the results and in the last section I presenthe conclusions.
ase study description
The mountains of Mestelá are part of an important biolog-cal corridor of cloudy mountains in Mesoamerica. The micro
atershed belongs to an eco-region that has a high priority forhe conservation of regional biodiversity and for the conserva-ion of habitats for migrant species (Renner, 2004). Thus, themportance of the river basin Mestelá goes beyond the local sig-ificance of simply being a water reservoir for the nearby city ofobán.
The farmers of Mestelá apply different re-vegetation and soilonservation measures to protect their parcels against rain erosion.n a parallel study in Mestelá, it was shown that rainfall-erosionepends on ground cover and canopy (Markussen and Renner,005). Based on this evidence, it is assumed that the re-vegetationeasures and soil conservation measures of the farmers of Mestelá
ontribute to the reduction of erosion and therefore to the improve-ent of water quantity and quality. Besides having beneficial
ffects on the watershed, such measures result generally in moreiverse agro-ecological landscapes (Bruijnzeel, 1990; Bruijnzeelnd Veneklaas, 1998; Nasi et al., 2002). Furthermore, the vegeta-ion cover is the habitat of different important bird migrant speciesRenner, 2004). Thus, the conservation of the water quality anduantity, the reduction of sediments in the water flow and thereservation of bird habitats are the main environmental serviceshat the Mestelá watershed forest and agricultural ecosystemsffer.
Over the last years and due to economic depletion, the researchrea witnessed the following: (1) forest degrading activities in theiver basin Mestelá have caused forest decline and a reduction inhe perennial vegetation. The distribution of vegetation range waseavily dependent on the proximity to the river and the top ofountains. About 47.4% of the total surface of the basin is cat-
gorized as being over-utilized. (2) Since 1994, the water flowxperienced a reduction from an initial water flow of 70–32 l/s in000. Due to the agricultural management of Mestelá, a kind ofustainability has been reached that enables the citizens of Cobándownstream users) to still have access to water. However, duringhe dry season Cobán experiences frequent irregularities in its tapater supply.
For this research, a number of communities were chosen in theegion of Mestelá. Important criteria for selecting the communi-ies were the high levels of diversity of their forests, the increasingndangerment of vegetated and forested areas and their pressuren the water catchment’s points of Cobán.
ctwtc
licy 28 (2011) 423–433
ethodological framework
Developing a participatory framework is about making assump-ions on the behavior of the participants to have a starting point inhe process. In my case, I assumed that the farming system will nothange, i.e. they will not supply more land (and labor) for theseonservation measures if farmers do not see a benefit on imple-enting them (including also societal benefits, not only economic
enefits). Therefore, to know the opportunity costs of a measure isot information enough to give a price to this conservation mea-ure. Although economists sometimes argue that the cost of oneand management decision can be accurately assessed by looking athe opportunity costs of other management options, in reality site-pecific factors (such as cultural, social or even historical issues)lso influence a farmer when he or she decides what to do. As such,ocal input is necessary when designing payment schemes thatre supposed to compensate land managers for promoting “good”nvironmental management. To solicit this input, this participa-ory scheme had two ex-ante stages: The first stage was to bringhe participants to the conclusion that models they were going toreate just represent our understanding of the world and that mod-ls will be used to survey new ways, to sustain decision-makingrocesses, and to smooth the progress of developing the paymentschemes. The second stage was to understand that full involve-ent in all phases of the process is necessary for the adoption of
he new instruments or as Standa-Gunda et al. (2003) pointed outs a more reliable path to adoption of new policy instruments. Stave2002) suggested that participatory processes might even encour-ge changes in decision.
In this paper, taking the case of the Mestelá watershed as anmpirical example, a methodological participatory approach wasmplemented (1) to categorize existing farming systems and theirehavior towards conservation efforts, (2) to quantify the income
osses incurred by farmers when practicing different conservationeasures, (3) to model changes in behavior when introducing pay-ents schemes in the research area, and (4) to test acceptance by
ll stakeholders. Fig. 1 describes the two phases of the method-logical approach. Both phases are divided in different steps thatre explained in the following section.
hase 1: Creation of a baseline scenario
Main steps of this phase were the classification of land cover andand use, and the classification of farming systems as key economicgents in the area. After that, the identification of main environ-ental phenomena was done like conservation measures (e.g. trees
n intercropping) and/or disruption measures (e.g. deforestation)ssociated to farming systems. During this phase, participatory val-dation exercises and village mapping exercises were implemented
ith the aim of contrasting obtained socio-economic and biophys-cal data with farmers’ perception.
For classifying land use and land cover two sources weresed: (1) official governmental data and (2) data gathered by andith farmers through a participatory village mapping activity. The
lassification of land was used as the basis for farming systemategorization. Different land use categories might bring differentpportunity costs of this land when applying payments. An agree-ent on land use categories was necessary to establish a basis for
he modeling exercise. The next step started with the approval ofhe baseline scenario for modeling in another workshop. The exer-
ise included the participation of the same stakeholders. Duringhis first workshop, commonly described scenarios for land useere developed (see Fig. 1 – phase 1A). In this session, the par-icipants were able to draw together their perception on landscapeover and land use (for more information see Mánez Costa, 2004).
M. Mánez Costa / Land Use Policy 28 (2011) 423–433 425
y mod
dvfwdqstsiseMiawtctacNw(a(ttt
miB
stmlrufMnCaw
mmiToict
Fig. 1. Participator
The data collection phase for defining farming systems wasivided into three steps: (1) I conducted semi-structured inter-iews at the village level. These interviews were guided by a flexiblerame, which ensured that the interview focused on the topic, butas conversational enough to allow participants to introduce andiscuss issues that they deemed relevant (Mánez Costa, 2004). Theuestions focused on four areas of interest: land, demographictructure, livestock and productive processes. Discussions withhe villagers helped to identify households concerned with water-hed conservation. Information obtained from the semi-structurednterviews provided primary data on the current socio-economictatus and land use practices of Mestelá. Additionally, socio-conomic data were gathered from interviews with the mayors ofestelá and from the town council. (2) I developed a standard-
zed questionnaire to collect data on all economic activities of therea. Of the 420 households living in Mestelá, a random sampleas taken together with whom the detailed standardized ques-
ionnaires were implemented. These data were crucial for definingosts, inputs and outputs of different production activities as well ashe constraints for labor, capital and land. (3) I identified, designednd classified the farming systems of Mestelá using mathemati-al programming and the data of the previous phases (Hazell andorton, 1986). Basis for the classification of the farming systemsas Nakajima’s subjective equilibrium theory of farming system
1986) that gives special attention to the linking of consumption
nd production. Using the farm household’s model of Chayanov1986), Nakajima classified households depending on the propor-ion of family labor input, the proportion of output consumed andhe proportion of output sold. An additional validation exercise withhe same stakeholders resulted in the agreement about an opti-lsoio
eling framework.
um set of activities under the given restrictions, e.g. optimal laborncome and the optimal production structure (see Fig. 1 – phase).
The next step of this modeling framework was to see which con-ervation measures farmers already apply in their land-plots andhe cost of them (see Fig. 1 – phase D). The costs of the conservation
easures were calculated depending on the opportunity costs ofabor for every conservation measure per land unit per year, landent and budget constraints of a farming system and the technologysed (see Fig. 1 – phase C). For the calculation of the incurred costsor conservation measures comparable studies from El Salvador,
éxico and Brazil were consulted because for this region there iso compilation of conservation measures and their costs (Barry anduéllar, 1997; Born and Campbell, 2000; Burstein, 2000; Herradornd Dimas, 2000, 2001; Rosa et al., 1999). Further secondary dataere collected (see Mánez Costa, 2004).
After defining the farming systems, describing the conservationeasures implemented and fixing the costs for those conservationeasures and cash crops, baseline scenarios for the different farm-
ng systems were produced with the help of linear programming.o validate the results of the linear programming, a workshop wasrganized (see Fig. 1 – phase 1). The intention was to do a compar-son between the results obtained, the primary and secondary dataollected and the perception of farmers. The scenarios produced byhe mathematical programming were discussed with farmers and
ocal stakeholders of Mestelá with the objective of defining con-traints for the model. The purpose was to reasonably replicate thebserved and real cropping pattern, amount of crop sales, seasonalncome disparities and allocation of family labor between on andff-farm activities.
4 se Policy 28 (2011) 423–433
P
aocow(TtpsttlmcI
ismtoftoddTtttips(oi
R
ieattss
I
tf
L
hflac
sc(
veceo
F
uoetdtsystems and to formulate, if necessary, new ones or to change theexisting ones. Farmers were organized in small groups includingrepresentatives of every farming system. Once the farmers werecomfortable with the criteria for classifying farming systems, the
26 M. Mánez Costa / Land U
hase 2: Creation of policy scenarios
The first part of this phase started with the calculation of themount of payments for every conservation measure dependingn their farming system. Based on a finite imaginary budget foronservation measures in Mestelá, a session with stakeholders wasrganized in which a pilot bidding game for conservation outcomesas played (see Fig. 1 – phase 2.2). In this game, 20 participants
only farmers) representing the four farming systems were playing.he main aim was to create an appropriate level of payments forhe different conservation measures and to come out with properayment schemes alternatives. The bidding game consistent on aequence of payment offers for a particular environmental measureo all participants. Participating farmers had the possibility to reacto the offer or not as it would be in the real market. An opportuneevel of payments was commonly defined depending on a particular
arket situation, location specific, adapted to the farm systemsonstraints and to the political constraints (see Fig. 1 – phase 2.3).n that way payment scheme alternatives were commonly defined.
After defining the payment schemes depending on every farm-ng system, the group modeling for land-use and income changestarted (see Fig. 1 – phase 2.4). The aim of this step was the develop-ent of projections on what would happen to the area of Mestelá in
he case payments occur or not occur (mainly looking at the effectsf payments on income and land use changes and the amount oforested hectares that would remain or would disappear). Duringhis step of the modeling, the participating farmers used the resultsf a linear programming model as the basis for discussion andecision making. During the modeling session participants wereivided into four groups representing the four farming systems.hey played a hypothetical 10-years round. Every year they hado decide on the amount of capital, land and human resources thathey would invest in their farming system. The results were fed intohe linear programming model that calculated on a yearly basis thencome obtained. Prices for cash products were obtained by com-aring the historical price development for the area. The resultingcenarios were validated in a final workshop with all stakeholderssee Fig. 1 – phase 2). During the modeling session the possibilityf re-starting the gaming was given in the case participants neededt (see Fig. 1 – phase 2 – last file indication).
esults
The participatory process in Mestelá lasted 10 months andnvolved many stakeholders of the region. Stakeholders were farm-rs from the area, NGO representatives working on environmentalnd agricultural issues, regional government representatives forhe agricultural, environmental and water sector and majors fromhe villages of the area. In the first phase, the participatory ses-ion counted with 45–50 stakeholders per workshop, while in theecond phase the process was limited to 20 representatives.
nformation baseline
This phase’s main objective was to create the baseline for phasewo. This phase was divided in four steps that are presented in theollowing sections (see Fig. 1).
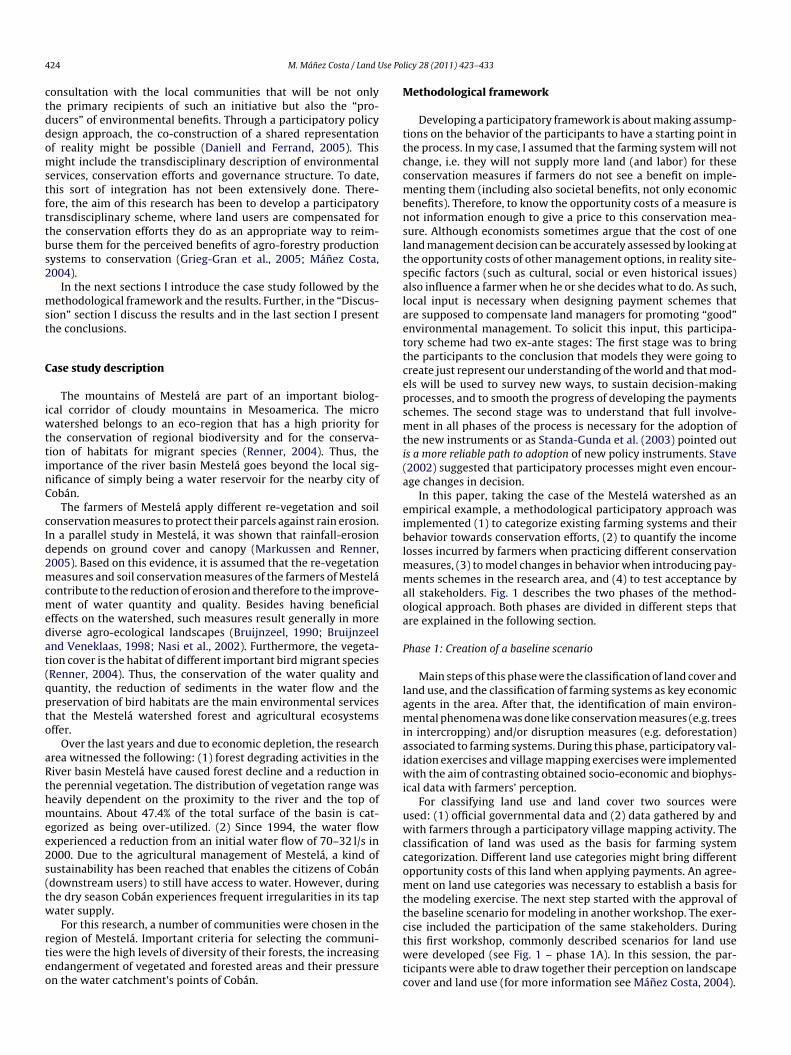
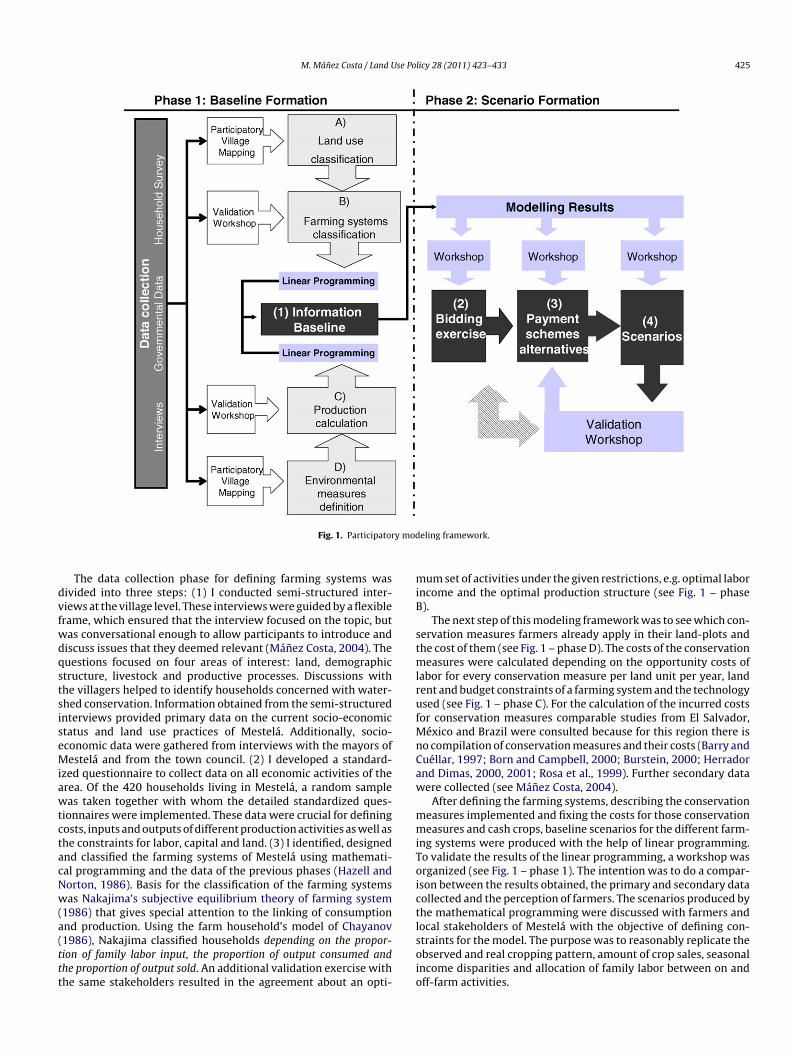
and use classification (A)The distribution of land uses differed significantly between the
ard data obtained from the government and the data comingrom the interviews. Farmers divided their land just into the fol-owing categories: cultivated land (including pasture), vegetatednd forested land (under continuous extractive use for energy andonstruction purposes) and primary forest. Governmental sources
Fig. 2. Land distribution according to farmers’ land use categories.
howed a different classification (see Figs. 2 and 3). Land classifi-ation is very important for the categorization of farming systemssee Table 2).
As represented in Fig. 1 (phase 1A) through a participatoryillage mapping exercise in which farmers representatives, gov-rnmental representatives and NGO’s representatives participated,lassification and definition for land uses was agreed: primary for-st, forested area (trees under 15 years), pasture, agriculture andthers (including roads and houses).
arming systems classification (B)The farming systems classification was done as a desk exercise
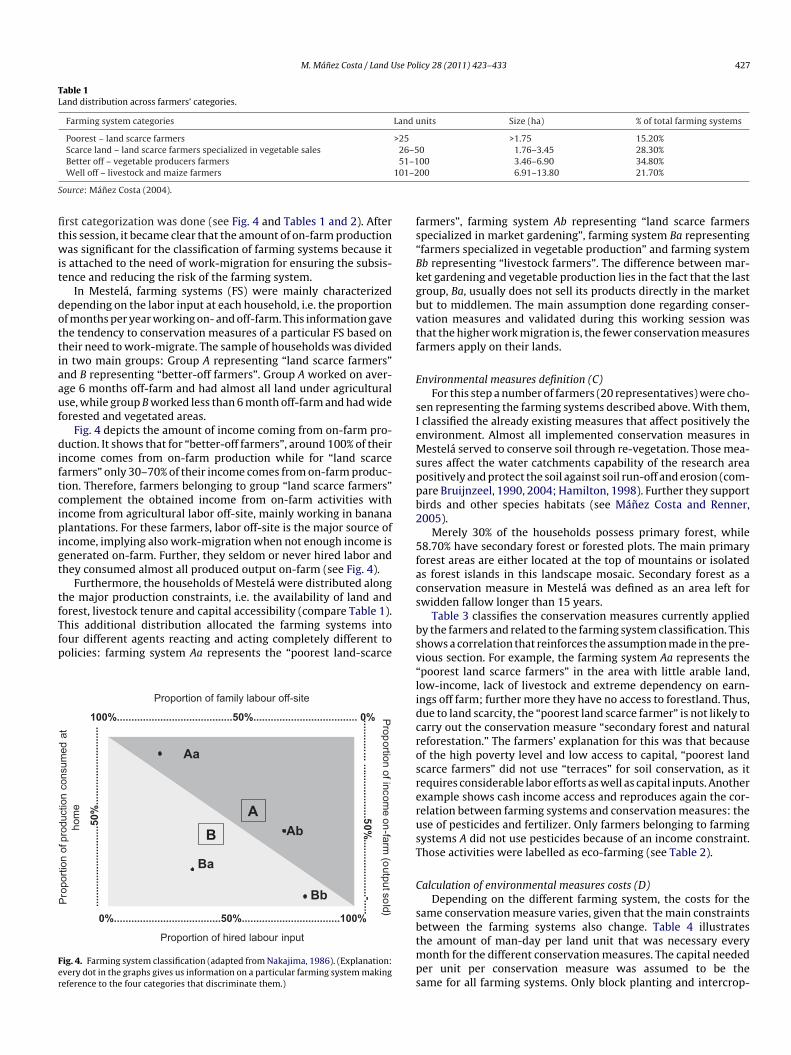
sing the data obtained from the interviews (see Section “Method-logical framework” and Mánez Costa, 2004). The results werexpressed in box diagram after Nakajima (1986). This first pro-otype for farm system’s definition was presented to the farmersuring a workshop session (see Fig. 4). During this session, the par-icipating farmers were asked to validate the developed farming
Fig. 3. Land distribution according to government land use categories.
M. Mánez Costa / Land Use Policy 28 (2011) 423–433 427
Table 1Land distribution across farmers’ categories.
Farming system categories Land units Size (ha) % of total farming systems
Poorest – land scarce farmers >25 >1.75 15.20%Scarce land – land scarce farmers specialized in vegetable sales 26–50 1.76–3.45 28.30%
51–1101–2
S
fitwit
dottiaauf
diftcipigt
tfTfp
Fer
fs“Bkgbvtf
E
sIeMsppb2
5facs
Better off – vegetable producers farmersWell off – livestock and maize farmers
ource: Mánez Costa (2004).
rst categorization was done (see Fig. 4 and Tables 1 and 2). Afterhis session, it became clear that the amount of on-farm productionas significant for the classification of farming systems because it
s attached to the need of work-migration for ensuring the subsis-ence and reducing the risk of the farming system.
In Mestelá, farming systems (FS) were mainly characterizedepending on the labor input at each household, i.e. the proportionf months per year working on- and off-farm. This information gavehe tendency to conservation measures of a particular FS based onheir need to work-migrate. The sample of households was dividedn two main groups: Group A representing “land scarce farmers”nd B representing “better-off farmers”. Group A worked on aver-ge 6 months off-farm and had almost all land under agriculturalse, while group B worked less than 6 month off-farm and had wideorested and vegetated areas.
Fig. 4 depicts the amount of income coming from on-farm pro-uction. It shows that for “better-off farmers”, around 100% of their
ncome comes from on-farm production while for “land scarcearmers” only 30–70% of their income comes from on-farm produc-ion. Therefore, farmers belonging to group “land scarce farmers”omplement the obtained income from on-farm activities withncome from agricultural labor off-site, mainly working in bananalantations. For these farmers, labor off-site is the major source of
ncome, implying also work-migration when not enough income isenerated on-farm. Further, they seldom or never hired labor andhey consumed almost all produced output on-farm (see Fig. 4).
Furthermore, the households of Mestelá were distributed alonghe major production constraints, i.e. the availability of land and
orest, livestock tenure and capital accessibility (compare Table 1).his additional distribution allocated the farming systems intoour different agents reacting and acting completely different toolicies: farming system Aa represents the “poorest land-scarce0%.....................................50%..................................100%
inputlabourProportion of hired
Proportion of family labour off-site
100%........................................50%.................................... 0%
Pro
port
ion
ofpr
oduc
tion
cons
umed
atho
me
......
......
......
......
....5
0%...
......
......
......
......
Prop
ort ionofincom
eon
-farm(o
utputsold )
............. ............ ........50%
............ ........ -.... .
B
AAb
Bb
Aa
Ba
ig. 4. Farming system classification (adapted from Nakajima, 1986). (Explanation:very dot in the graphs gives us information on a particular farming system makingeference to the four categories that discriminate them.)
bsv“lidcrosrerusT
C
sbtmps
00 3.46–6.90 34.80%00 6.91–13.80 21.70%
armers”, farming system Ab representing “land scarce farmerspecialized in market gardening”, farming system Ba representingfarmers specialized in vegetable production” and farming systemb representing “livestock farmers”. The difference between mar-et gardening and vegetable production lies in the fact that the lastroup, Ba, usually does not sell its products directly in the marketut to middlemen. The main assumption done regarding conser-ation measures and validated during this working session washat the higher work migration is, the fewer conservation measuresarmers apply on their lands.
nvironmental measures definition (C)For this step a number of farmers (20 representatives) were cho-
en representing the farming systems described above. With them,classified the already existing measures that affect positively thenvironment. Almost all implemented conservation measures inestelá served to conserve soil through re-vegetation. Those mea-
ures affect the water catchments capability of the research areaositively and protect the soil against soil run-off and erosion (com-are Bruijnzeel, 1990, 2004; Hamilton, 1998). Further they supportirds and other species habitats (see Mánez Costa and Renner,005).
Merely 30% of the households possess primary forest, while8.70% have secondary forest or forested plots. The main primaryorest areas are either located at the top of mountains or isolateds forest islands in this landscape mosaic. Secondary forest as aonservation measure in Mestelá was defined as an area left forwidden fallow longer than 15 years.
Table 3 classifies the conservation measures currently appliedy the farmers and related to the farming system classification. Thishows a correlation that reinforces the assumption made in the pre-ious section. For example, the farming system Aa represents thepoorest land scarce farmers” in the area with little arable land,ow-income, lack of livestock and extreme dependency on earn-ngs off farm; further more they have no access to forestland. Thus,ue to land scarcity, the “poorest land scarce farmer” is not likely toarry out the conservation measure “secondary forest and naturaleforestation.” The farmers’ explanation for this was that becausef the high poverty level and low access to capital, “poorest landcarce farmers” did not use “terraces” for soil conservation, as itequires considerable labor efforts as well as capital inputs. Anotherxample shows cash income access and reproduces again the cor-elation between farming systems and conservation measures: these of pesticides and fertilizer. Only farmers belonging to farmingystems A did not use pesticides because of an income constraint.hose activities were labelled as eco-farming (see Table 2).
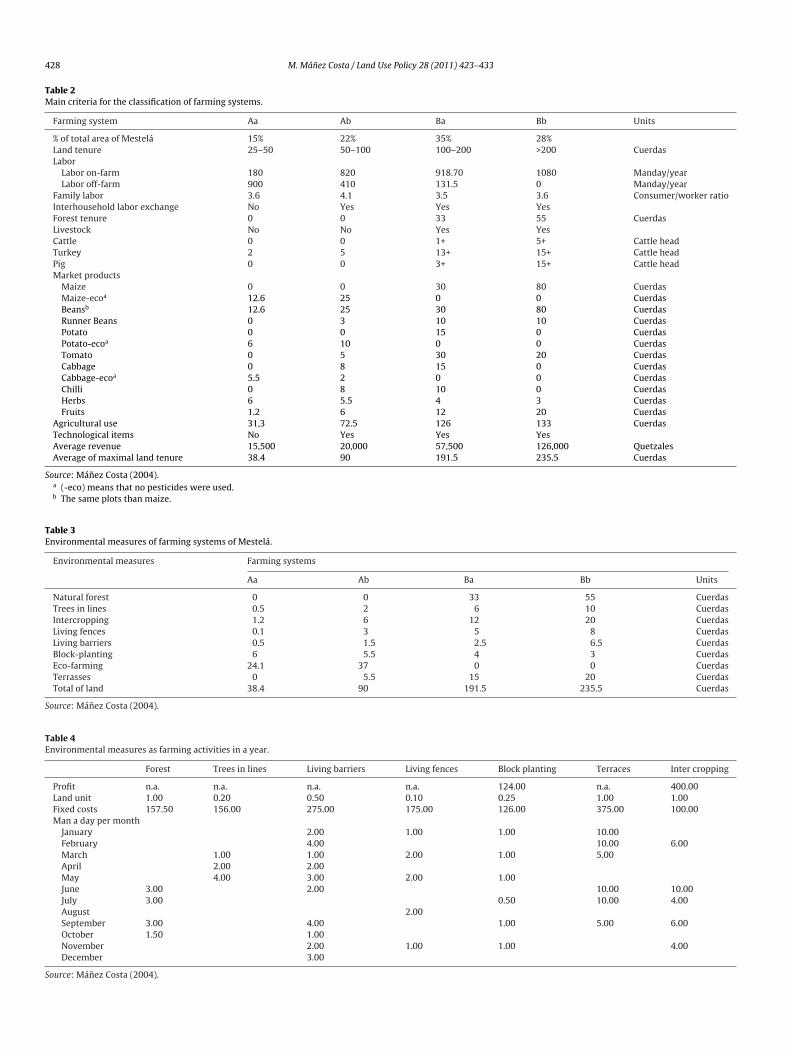
alculation of environmental measures costs (D)Depending on the different farming system, the costs for the
ame conservation measure varies, given that the main constraints
etween the farming systems also change. Table 4 illustrateshe amount of man-day per land unit that was necessary everyonth for the different conservation measures. The capital neededer unit per conservation measure was assumed to be theame for all farming systems. Only block planting and intercrop-
428 M. Mánez Costa / Land Use Policy 28 (2011) 423–433
Table 2Main criteria for the classification of farming systems.
Farming system Aa Ab Ba Bb Units
% of total area of Mestelá 15% 22% 35% 28%Land tenure 25–50 50–100 100–200 >200 CuerdasLabor
Labor on-farm 180 820 918.70 1080 Manday/yearLabor off-farm 900 410 131.5 0 Manday/year
Family labor 3.6 4.1 3.5 3.6 Consumer/worker ratioInterhousehold labor exchange No Yes Yes YesForest tenure 0 0 33 55 CuerdasLivestock No No Yes YesCattle 0 0 1+ 5+ Cattle headTurkey 2 5 13+ 15+ Cattle headPig 0 0 3+ 15+ Cattle headMarket products
Maize 0 0 30 80 CuerdasMaize-ecoa 12.6 25 0 0 CuerdasBeansb 12.6 25 30 80 CuerdasRunner Beans 0 3 10 10 CuerdasPotato 0 0 15 0 CuerdasPotato-ecoa 6 10 0 0 CuerdasTomato 0 5 30 20 CuerdasCabbage 0 8 15 0 CuerdasCabbage-ecoa 5.5 2 0 0 CuerdasChilli 0 8 10 0 CuerdasHerbs 6 5.5 4 3 CuerdasFruits 1.2 6 12 20 Cuerdas
Agricultural use 31,3 72.5 126 133 CuerdasTechnological items No Yes Yes YesAverage revenue 15,500 20,000 57,500 126,000 QuetzalesAverage of maximal land tenure 38.4 90 191.5 235.5 Cuerdas
Source: Mánez Costa (2004).a (-eco) means that no pesticides were used.b The same plots than maize.
Table 3Environmental measures of farming systems of Mestelá.
Environmental measures Farming systems
Aa Ab Ba Bb Units
Natural forest 0 0 33 55 CuerdasTrees in lines 0.5 2 6 10 CuerdasIntercropping 1.2 6 12 20 CuerdasLiving fences 0.1 3 5 8 CuerdasLiving barriers 0.5 1.5 2.5 6.5 CuerdasBlock-planting 6 5.5 4 3 CuerdasEco-farming 24.1 37 0 0 CuerdasTerrasses 0 5.5 15 20 CuerdasTotal of land 38.4 90 191.5 235.5 Cuerdas
Source: Mánez Costa (2004).
Table 4Environmental measures as farming activities in a year.
Forest Trees in lines Living barriers Living fences Block planting Terraces Inter cropping
Profit n.a. n.a. n.a. n.a. 124.00 n.a. 400.00Land unit 1.00 0.20 0.50 0.10 0.25 1.00 1.00Fixed costs 157.50 156.00 275.00 175.00 126.00 375.00 100.00Man a day per month
January 2.00 1.00 1.00 10.00February 4.00 10.00 6.00March 1.00 1.00 2.00 1.00 5.00April 2.00 2.00May 4.00 3.00 2.00 1.00June 3.00 2.00 10.00 10.00July 3.00 0.50 10.00 4.00August 2.00September 3.00 4.00 1.00 5.00 6.00October 1.50 1.00November 2.00 1.00 1.00 4.00December 3.00
Source: Mánez Costa (2004).
M. Mánez Costa / Land Use Policy 28 (2011) 423–433 429
1421
537
367
198
1632
937
1301
499
378
517
3001
1040
1965
113
1673
672
472
242
3483
1238
1320
1200
1249
560
230
1120
2576
1771
920
40003000200010000
2nd forest
Fruit trees
Trees in lines
Living barriers
Living fences
Block planting
Ecofarming
Terraces
En
viro
nm
enta
l Mea
sure
s
ney
Aa Ab Ba Bb
he farm
pv
ssi(mebsstit“smwaseblnsstshlir(t
Ga
b
watamaom
•
•
•
•
•
•
Mo
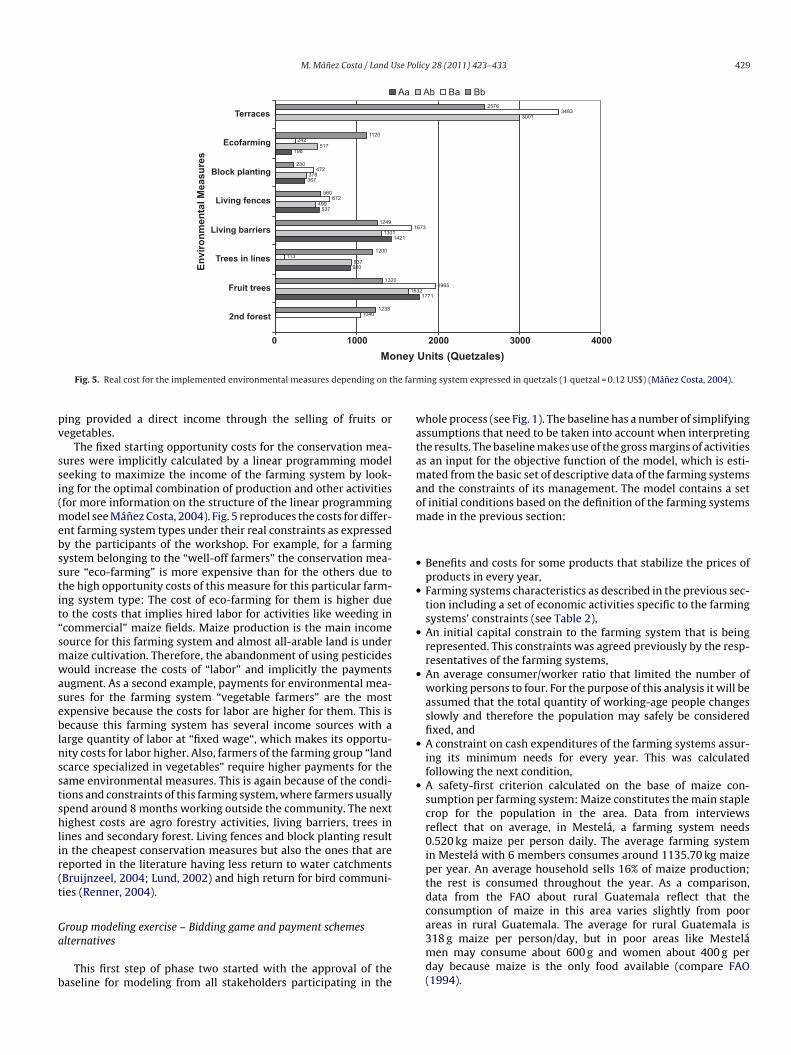
Fig. 5. Real cost for the implemented environmental measures depending on t
ing provided a direct income through the selling of fruits oregetables.
The fixed starting opportunity costs for the conservation mea-ures were implicitly calculated by a linear programming modeleeking to maximize the income of the farming system by look-ng for the optimal combination of production and other activitiesfor more information on the structure of the linear programming
odel see Mánez Costa, 2004). Fig. 5 reproduces the costs for differ-nt farming system types under their real constraints as expressedy the participants of the workshop. For example, for a farmingystem belonging to the “well-off farmers” the conservation mea-ure “eco-farming” is more expensive than for the others due tohe high opportunity costs of this measure for this particular farm-ng system type: The cost of eco-farming for them is higher dueo the costs that implies hired labor for activities like weeding incommercial” maize fields. Maize production is the main incomeource for this farming system and almost all-arable land is underaize cultivation. Therefore, the abandonment of using pesticidesould increase the costs of “labor” and implicitly the payments
ugment. As a second example, payments for environmental mea-ures for the farming system “vegetable farmers” are the mostxpensive because the costs for labor are higher for them. This isecause this farming system has several income sources with a
arge quantity of labor at “fixed wage“, which makes its opportu-ity costs for labor higher. Also, farmers of the farming group “landcarce specialized in vegetables” require higher payments for theame environmental measures. This is again because of the condi-ions and constraints of this farming system, where farmers usuallypend around 8 months working outside the community. The nextighest costs are agro forestry activities, living barriers, trees in
ines and secondary forest. Living fences and block planting resultn the cheapest conservation measures but also the ones that areeported in the literature having less return to water catchmentsBruijnzeel, 2004; Lund, 2002) and high return for bird communi-ies (Renner, 2004).
roup modeling exercise – Bidding game and payment schemeslternatives
This first step of phase two started with the approval of theaseline for modeling from all stakeholders participating in the
Units (Quetzales)
ing system expressed in quetzals (1 quetzal = 0.12 US$) (Mánez Costa, 2004).
hole process (see Fig. 1). The baseline has a number of simplifyingssumptions that need to be taken into account when interpretinghe results. The baseline makes use of the gross margins of activitiess an input for the objective function of the model, which is esti-ated from the basic set of descriptive data of the farming systems
nd the constraints of its management. The model contains a setf initial conditions based on the definition of the farming systemsade in the previous section:
Benefits and costs for some products that stabilize the prices ofproducts in every year,Farming systems characteristics as described in the previous sec-tion including a set of economic activities specific to the farmingsystems’ constraints (see Table 2),An initial capital constrain to the farming system that is beingrepresented. This constraints was agreed previously by the resp-resentatives of the farming systems,An average consumer/worker ratio that limited the number ofworking persons to four. For the purpose of this analysis it will beassumed that the total quantity of working-age people changesslowly and therefore the population may safely be consideredfixed, andA constraint on cash expenditures of the farming systems assur-ing its minimum needs for every year. This was calculatedfollowing the next condition,A safety-first criterion calculated on the base of maize con-sumption per farming system: Maize constitutes the main staplecrop for the population in the area. Data from interviewsreflect that on average, in Mestelá, a farming system needs0.520 kg maize per person daily. The average farming systemin Mestelá with 6 members consumes around 1135.70 kg maizeper year. An average household sells 16% of maize production;the rest is consumed throughout the year. As a comparison,data from the FAO about rural Guatemala reflect that theconsumption of maize in this area varies slightly from poor
areas in rural Guatemala. The average for rural Guatemala is318 g maize per person/day, but in poor areas like Mestelámen may consume about 600 g and women about 400 g perday because maize is the only food available (compare FAO(1994).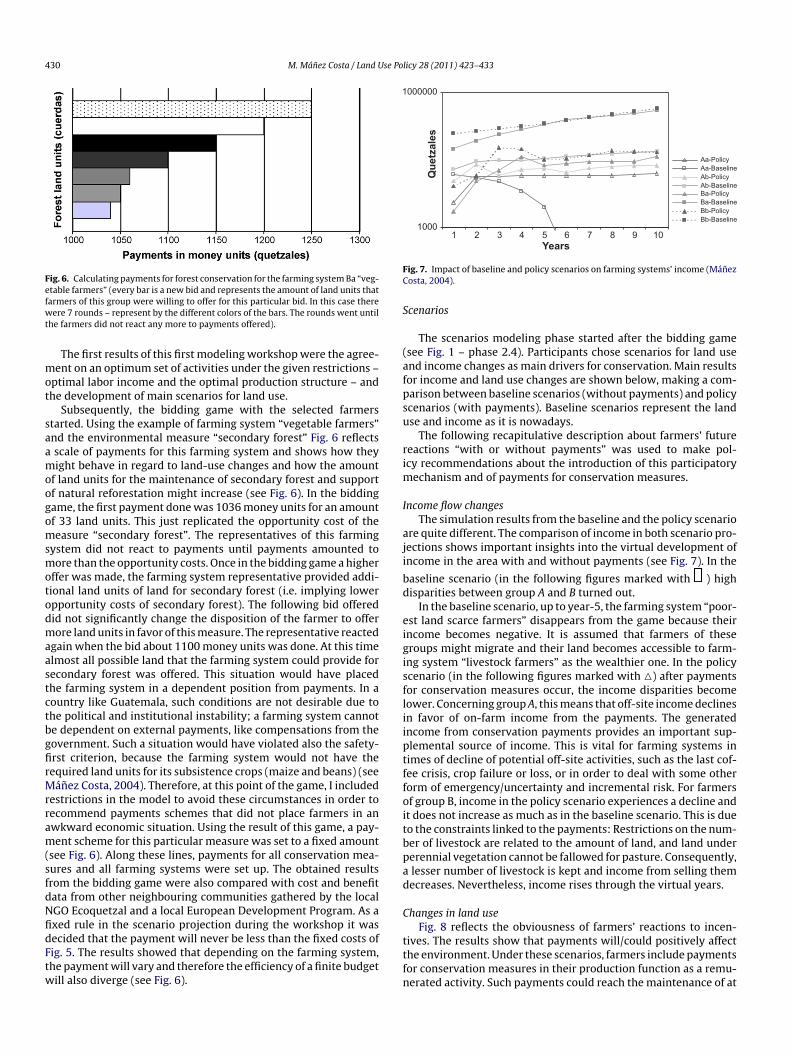
430 M. Mánez Costa / Land Use Policy 28 (2011) 423–433
Fig. 6. Calculating payments for forest conservation for the farming system Ba “veg-efwt
mot
saamoogomsmotodmaastctbgfirMrram(sfdNfidFtw
1000
1000000
10987654321
Qu
etza
les
Aa-Policy Aa-BaselineAb-PolicyAb-BaselineBa-PolicyBa-BaselineBb-PolicyBb-Baseline
FC
S
(afpsu
rim
I
aji
bd
eigisfliiptffoitbpad
C
table farmers” (every bar is a new bid and represents the amount of land units thatarmers of this group were willing to offer for this particular bid. In this case thereere 7 rounds – represent by the different colors of the bars. The rounds went until
he farmers did not react any more to payments offered).
The first results of this first modeling workshop were the agree-ent on an optimum set of activities under the given restrictions –
ptimal labor income and the optimal production structure – andhe development of main scenarios for land use.
Subsequently, the bidding game with the selected farmerstarted. Using the example of farming system “vegetable farmers”nd the environmental measure “secondary forest” Fig. 6 reflectsscale of payments for this farming system and shows how theyight behave in regard to land-use changes and how the amount
f land units for the maintenance of secondary forest and supportf natural reforestation might increase (see Fig. 6). In the biddingame, the first payment done was 1036 money units for an amountf 33 land units. This just replicated the opportunity cost of theeasure “secondary forest”. The representatives of this farming
ystem did not react to payments until payments amounted toore than the opportunity costs. Once in the bidding game a higher
ffer was made, the farming system representative provided addi-ional land units of land for secondary forest (i.e. implying lowerpportunity costs of secondary forest). The following bid offeredid not significantly change the disposition of the farmer to offerore land units in favor of this measure. The representative reacted
gain when the bid about 1100 money units was done. At this timelmost all possible land that the farming system could provide forecondary forest was offered. This situation would have placedhe farming system in a dependent position from payments. In aountry like Guatemala, such conditions are not desirable due tohe political and institutional instability; a farming system cannote dependent on external payments, like compensations from theovernment. Such a situation would have violated also the safety-rst criterion, because the farming system would not have theequired land units for its subsistence crops (maize and beans) (seeánez Costa, 2004). Therefore, at this point of the game, I included
estrictions in the model to avoid these circumstances in order toecommend payments schemes that did not place farmers in anwkward economic situation. Using the result of this game, a pay-ent scheme for this particular measure was set to a fixed amount
see Fig. 6). Along these lines, payments for all conservation mea-ures and all farming systems were set up. The obtained resultsrom the bidding game were also compared with cost and benefitata from other neighbouring communities gathered by the localGO Ecoquetzal and a local European Development Program. As a
xed rule in the scenario projection during the workshop it wasecided that the payment will never be less than the fixed costs ofig. 5. The results showed that depending on the farming system,he payment will vary and therefore the efficiency of a finite budgetill also diverge (see Fig. 6).ttfn
Years
ig. 7. Impact of baseline and policy scenarios on farming systems’ income (Mánezosta, 2004).
cenarios
The scenarios modeling phase started after the bidding gamesee Fig. 1 – phase 2.4). Participants chose scenarios for land usend income changes as main drivers for conservation. Main resultsor income and land use changes are shown below, making a com-arison between baseline scenarios (without payments) and policycenarios (with payments). Baseline scenarios represent the landse and income as it is nowadays.
The following recapitulative description about farmers’ futureeactions “with or without payments” was used to make pol-cy recommendations about the introduction of this participatory
echanism and of payments for conservation measures.
ncome flow changesThe simulation results from the baseline and the policy scenario
re quite different. The comparison of income in both scenario pro-ections shows important insights into the virtual development ofncome in the area with and without payments (see Fig. 7). In the
aseline scenario (in the following figures marked with ) highisparities between group A and B turned out.
In the baseline scenario, up to year-5, the farming system “poor-st land scarce farmers” disappears from the game because theirncome becomes negative. It is assumed that farmers of theseroups might migrate and their land becomes accessible to farm-ng system “livestock farmers” as the wealthier one. In the policycenario (in the following figures marked with �) after paymentsor conservation measures occur, the income disparities becomeower. Concerning group A, this means that off-site income declinesn favor of on-farm income from the payments. The generatedncome from conservation payments provides an important sup-lemental source of income. This is vital for farming systems inimes of decline of potential off-site activities, such as the last cof-ee crisis, crop failure or loss, or in order to deal with some otherorm of emergency/uncertainty and incremental risk. For farmersf group B, income in the policy scenario experiences a decline andt does not increase as much as in the baseline scenario. This is dueo the constraints linked to the payments: Restrictions on the num-er of livestock are related to the amount of land, and land undererennial vegetation cannot be fallowed for pasture. Consequently,lesser number of livestock is kept and income from selling themecreases. Nevertheless, income rises through the virtual years.
hanges in land use
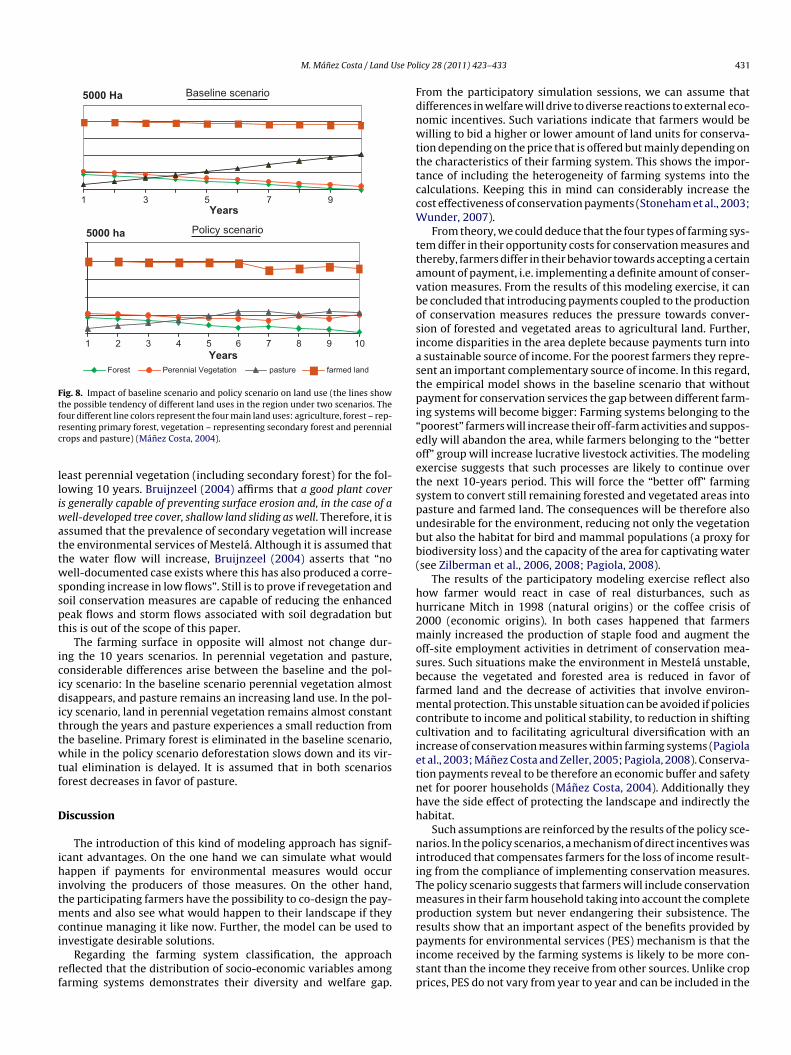
Fig. 8 reflects the obviousness of farmers’ reactions to incen-ives. The results show that payments will/could positively affecthe environment. Under these scenarios, farmers include paymentsor conservation measures in their production function as a remu-erated activity. Such payments could reach the maintenance of at
M. Mánez Costa / Land Use Po
97531Years
5000 Ha
10987654321Years
5000 ha
Forest Perennial Vegetation pasture farmed land
Baseline scenario
Policy scenario
Fig. 8. Impact of baseline scenario and policy scenario on land use (the lines showthe possible tendency of different land uses in the region under two scenarios. Thefrc
lliwattwsspt
icidittwtf
D
ihitmci
rf
FdnwtttccW
ttavbosiastpi“eoetspubb(
hh2mosbfmccietnhh
niiTmpresults show that an important aspect of the benefits provided by
our different line colors represent the four main land uses: agriculture, forest – rep-esenting primary forest, vegetation – representing secondary forest and perennialrops and pasture) (Mánez Costa, 2004).
east perennial vegetation (including secondary forest) for the fol-owing 10 years. Bruijnzeel (2004) affirms that a good plant covers generally capable of preventing surface erosion and, in the case of aell-developed tree cover, shallow land sliding as well. Therefore, it is
ssumed that the prevalence of secondary vegetation will increasehe environmental services of Mestelá. Although it is assumed thathe water flow will increase, Bruijnzeel (2004) asserts that “noell-documented case exists where this has also produced a corre-
ponding increase in low flows”. Still is to prove if revegetation andoil conservation measures are capable of reducing the enhancedeak flows and storm flows associated with soil degradation buthis is out of the scope of this paper.
The farming surface in opposite will almost not change dur-ng the 10 years scenarios. In perennial vegetation and pasture,onsiderable differences arise between the baseline and the pol-cy scenario: In the baseline scenario perennial vegetation almostisappears, and pasture remains an increasing land use. In the pol-
cy scenario, land in perennial vegetation remains almost constanthrough the years and pasture experiences a small reduction fromhe baseline. Primary forest is eliminated in the baseline scenario,hile in the policy scenario deforestation slows down and its vir-
ual elimination is delayed. It is assumed that in both scenariosorest decreases in favor of pasture.
iscussion
The introduction of this kind of modeling approach has signif-cant advantages. On the one hand we can simulate what wouldappen if payments for environmental measures would occur
nvolving the producers of those measures. On the other hand,he participating farmers have the possibility to co-design the pay-
ents and also see what would happen to their landscape if theyontinue managing it like now. Further, the model can be used to
nvestigate desirable solutions.Regarding the farming system classification, the approacheflected that the distribution of socio-economic variables amongarming systems demonstrates their diversity and welfare gap.
pisp
licy 28 (2011) 423–433 431
rom the participatory simulation sessions, we can assume thatifferences in welfare will drive to diverse reactions to external eco-omic incentives. Such variations indicate that farmers would beilling to bid a higher or lower amount of land units for conserva-
ion depending on the price that is offered but mainly depending onhe characteristics of their farming system. This shows the impor-ance of including the heterogeneity of farming systems into thealculations. Keeping this in mind can considerably increase theost effectiveness of conservation payments (Stoneham et al., 2003;
under, 2007).From theory, we could deduce that the four types of farming sys-
em differ in their opportunity costs for conservation measures andhereby, farmers differ in their behavior towards accepting a certainmount of payment, i.e. implementing a definite amount of conser-ation measures. From the results of this modeling exercise, it cane concluded that introducing payments coupled to the productionf conservation measures reduces the pressure towards conver-ion of forested and vegetated areas to agricultural land. Further,ncome disparities in the area deplete because payments turn intosustainable source of income. For the poorest farmers they repre-
ent an important complementary source of income. In this regard,he empirical model shows in the baseline scenario that withoutayment for conservation services the gap between different farm-
ng systems will become bigger: Farming systems belonging to thepoorest” farmers will increase their off-farm activities and suppos-dly will abandon the area, while farmers belonging to the “betterff” group will increase lucrative livestock activities. The modelingxercise suggests that such processes are likely to continue overhe next 10-years period. This will force the “better off” farmingystem to convert still remaining forested and vegetated areas intoasture and farmed land. The consequences will be therefore alsondesirable for the environment, reducing not only the vegetationut also the habitat for bird and mammal populations (a proxy foriodiversity loss) and the capacity of the area for captivating watersee Zilberman et al., 2006, 2008; Pagiola, 2008).
The results of the participatory modeling exercise reflect alsoow farmer would react in case of real disturbances, such asurricane Mitch in 1998 (natural origins) or the coffee crisis of000 (economic origins). In both cases happened that farmersainly increased the production of staple food and augment the
ff-site employment activities in detriment of conservation mea-ures. Such situations make the environment in Mestelá unstable,ecause the vegetated and forested area is reduced in favor ofarmed land and the decrease of activities that involve environ-
ental protection. This unstable situation can be avoided if policiesontribute to income and political stability, to reduction in shiftingultivation and to facilitating agricultural diversification with anncrease of conservation measures within farming systems (Pagiolat al., 2003; Mánez Costa and Zeller, 2005; Pagiola, 2008). Conserva-ion payments reveal to be therefore an economic buffer and safetyet for poorer households (Mánez Costa, 2004). Additionally theyave the side effect of protecting the landscape and indirectly theabitat.
Such assumptions are reinforced by the results of the policy sce-arios. In the policy scenarios, a mechanism of direct incentives was
ntroduced that compensates farmers for the loss of income result-ng from the compliance of implementing conservation measures.he policy scenario suggests that farmers will include conservationeasures in their farm household taking into account the complete
roduction system but never endangering their subsistence. The
ayments for environmental services (PES) mechanism is that thencome received by the farming systems is likely to be more con-tant than the income they receive from other sources. Unlike croprices, PES do not vary from year to year and can be included in the
4 se Po
yislpfs
pdcaIC
ftpurnafIif
C
mssvtlotalcaCttt
iicpnscrhbt
iovcA
echpir
ptssormfoa
A
toeFr
R
A
A
A
A
A
B
B
B
B
B
B
C
C
C
C
D
32 M. Mánez Costa / Land U
early cost calculation reducing risk. This constancy might havemportant welfare benefits for many farming systems. The resultsuggest that on the average, farmers might be better off. The incomeevels from the different farming systems tend to converge therebyossibly reducing inequality. In any case, we may keep in mind thator a country like Guatemala first institutional and political stabilityhould be assured.
In regard to conservation the result suggests that through theayments, at least the perennial vegetation in the area will notecrease significantly. If this happens, it can be assumed that theonservation of secondary perennial vegetation will be achievednd implicitly the preservation of habitats, e.g. for bird populations.n this way, biodiversity levels might be conserved (see Mánezosta and Renner, 2005).
The outcomes of the ex post evaluation show the ability ofarmers to project the impact of their activities in the future. Fur-her, the analysis of the participatory processes illustrated that therovision of information gradually helped stakeholders to betternderstand the interactions between different representations ofeality and supported them to vision the impacts of different eco-omic decisions. Through the process, modifications of perceptionsnd behaviors were observed. In some occasions, the expectancyor changes was very high mixing the modeling exercise and reality.n summary farmers were positive to every suggestion for increas-ng their income, reducing the work off-farm and the risk in theirarming systems.
onclusions
The characteristics of the farming systems of Mestelá affectany environmental variables, particularly water quality and flow,
oil quality and movement, natural vegetative cover and biodiver-ity, at a local, but also at regional and international scales. Suchariables are the location of a landscape with high slope, type andiming of cultivation, agrochemical input use, field burning and fal-ow use, and livestock practices. The design of policies that focusn economic development as an overall description of environmen-al sustainability and poverty alleviation are needed for this areand also for other river basins in Guatemala in order to reach aevel of sustainability that allow the poor and the environment too-develop in the long term. Conservation payments reveal to ben economic buffer and safety net for poorer households (Mánezosta, 2004). Additionally they have the side effect of protectinghe landscape and indirectly the habitat. Furthermore, practice onhe field has shown that farmers will only accept new measures ifhey see themselves involved in the process of co-developing them.
It must be noted that even knowing the potential of using partic-patory methods to target environmental payment schemes, theres no warrant that instruments developed in multi-stakeholder pro-esses will be comparable or better that the ones conceived byolitical leaders (Daniell and Ferrand, 2005). Because of the localature of this paper, it might not be useful in other real worldituations, but it can give consistent indications of the effects ononservation connected to farm management decisions. Additionalesearch and evaluations of case study examples of this kind andow this was organized are required from all around the world toetter understand and meet the challenge of environmental pro-ection in poor areas.
The outcomes of this paper are constraint in the follow-
ng aspects: only the value of small marginal changes has beenbserved, because the exact size and nature of environmental ser-ices are not entirely known. Further, the social and environmentalosts of habitat losses are also not included in the calculation.long-term study would be necessary for determining whether
D
D
F
licy 28 (2011) 423–433
nvironmental services such as forest and perennial vegetationonservation are required. In any case the methodology presentedas the flexibility to become adapted to various settings. It alsorovides an open space for integrated policy design, promot-
ng learning processes, integrating different knowledge levels andeflecting on the effects of different policies into conservation goals.
In summary, it can be concluded that (1) the amount of on-farmroduction and consumption is very significant for the classifica-ion of farming systems; (2) the differentiation between farmingystems is a precondition for designing payments; (3) the use oftep by step developed policy measures facilitates the processesf understanding the impact of individual actions on the envi-onment; (4) land use changes and income changes are seen asain drivers for conservation; and (5) participatory frameworks
or developing policy measures can contribute to the conservationf environmental important settings and to the economic sustain-bility of an area.
cknowledgments
I thank Sebastian Loubier and Kathleen Schwerdtner Mánez forheir comments and fruitful discussions that led to the formulationf some of the ideas discussed in this article. Grateful acknowl-dgement for their comments and corrections goes to Evan D.G.raser, Klaus Hubacek, Vanessa Pérez-Cirera and two anonymouseviewers that helped to considerably improve an earlier version.
eferences
lix-Garcia, J., Janvry, A.d., 2003. A Tale of Two Communities: Explaining Deforesta-tion in Mexico. CUDARE Working Papers 964.
ngelsen, A., Shitindi, E.F.K., Aaarrestad, J., 1999. Why do farmers expand their landinto forests? Theories and evidence from Tanzania. Environment and Develop-ment Economics 4-03, 313–331.
ylward, B., 2002a. Environmental Services in the Guatemalan Context: Rele-vance and Market Potential. Project on the Integrated Management of NaturalResources and the Environmental in the Western Highlands of Guatemala(MIRNA). MIRNA, Guatemala.
ylward, B., 2002b. Land-Use, Hydrological Function and Economic Valuation.UNESCO Symposium/Workshop to be published by Cambridge University Press.
ylward, B., 2002c. Mecanismos de mercado y Servicios Ambientales:Planteamiento Conceptual y Revisión de Experiencias Internacionales.MIRNA, Guatemala.
arry, D., Cuéllar, N., 1997. El agro salvadoreno y los servicios ambientales: Haciauna estrategia de revegetación. In: PRISMA 26.
orn, R.H., Campbell, A.C., 2000. Pago por Servicios Ambientales en Brasil. PRISMA,San Salvador.
ruijnzeel, L.A., 1990. Hydrology of Moist Tropical Forest and Effects of Conversion:a State of Knowledge Review. UNESCO, Paris and Vrije Universiteit, Amsterdam,The Netherlands.
ruijnzeel, L.A., 2004. Tropical forest and environmental services: not seeing the soilfor the trees? Agriculture, Ecosystems & Environment 104 (1), 185–228.
ruijnzeel, L.A., Veneklaas, E., 1998. Climatic conditions and tropical montane forestproductivity: the fog has not lifted yet. Ecology 78, 3–9.
urstein, J., 2000. Pago por Servicios Ambientales en México. “Pago por ServiciosAmbientales en América Latina. PRISMA-Fundación Ford, San Salvador.
hayanov, A.V., 1986. The Theory of Peasant Economy. University of Wisconsin Press,Madison, Wisconsin.
homitz, K.M., Buys, P., et al., 2007. At Loggerheads? Agricultural Expansion, PovertyReduction and Environment in the Tropical Forests. A World Bank PolicyResearch Report. World Bank, Washington.
homitz, K.M., 2004. Transferable development rights and forest protection: anexploratory analysis. International Regional Science Review 27 (3), 348–373.
urtis, R.V., 2000. Payment for Environmental Services The Case for GuatemalaManejo Integrado de Recursos Naturales – MIRNA. Division of Environmen-tal and Social Sustainable Development & Committee for Natural ResourcesGovernment of Guatemala, World Bank, Washington.
aniell, K., Ferrand, N., 2005. In: Project, A. (Ed.), Participatory Modelling for WaterResources Management and Planning. Cemagref, Montpellier.
eininger, K., Minten, B., 1999. Poverty, policies and deforestation: the case of Mex-ico. Economic Development and Cultural Change 47, 313–344.
e Marchi, B., Ravetz, J., 2001. Participatory Approaches to Environmental Policy.Page 20. Policy Research Brief. Environmental Valuation in Europe. CambridgeResearch for the Environment, Cambridge.
AO, 1994. Food and Nutrition. FAO, Rome.
se Po
F
G
H
H
H
H
H
L
L
M
M
M
M
M
N
N
P
P
P
P
P
R
R
R
S
S
S
S
S
V
W
Wconservation. Conservation Biology 21, 48–58.
Zilberman, D., Lipper, L., McCarthy, N., 2006. When are Payments for Environmental
M. Mánez Costa / Land U
erraro, P.J., Kiss, A., 2002. Direct payments to conserve biodiversity. Science 298,1718–1719.
rieg-Gran, M., Porras, I., Wunder, S., 2005. How can market mechanisms for forestenvironmental services help the poor? Preliminary lessons from Latin America.World Development 33 (9), 1511–1527.
amilton, G., 1998. Co-learning tools: powerful instruments of change in SouthernQueensland, Australia. In: Röling, N.G., Wagemakers, M.A.E. (Eds.), FacilitatingSustainable Agriculture. Participatory Learning and Adaptive Management inTimes of Environmental Uncertainty. Cambridge University Press, Cambridge,pp. 172–188.
are, M., Letcher, R.A., Jakeman, A.J., 2004. Participatory natural resource manage-ment: a comparison of four case studies. Integrated Assessment 4, 62–72.
azell, P.B.R., Norton, R.B., 1986. Mathematical Programming for Economic Analysisin Agriculture. MacMillan Publishing Company, Berkeley.
errador, D., Dimas, L., 2000. Aportes y limitaciones de la valoración económica enla implementación de esquemas de pago por servicios ambientales. In: PRISMA41.
errador, D., Dimas, L., 2001. Valoración Económica del Agua para el Area Metropoli-tana de San Salvador. PRISMA, San Salvador.
andell-Mills, N., Porras, I., 2002. Silver Bullet or Fool’s Gold? A Global Review of Mar-kets for Forest Environmental Services. International Institute for Environmentand Development, London.
und, H., 2002. Definitions of Forest, Deforestation, Afforestation and Reforestation.Forest Information Services, Virginia.
ánez Costa, M., 2004. The integration of incentives for environmental protectionin farm households. A case study of Guatemala. Dissertation. de Verlag, Berlin.
ánez Costa, M., Renner, S.C., 2005. Direct payments for conservation. The impor-tance of environmental measures in farm households for bird populations in afragmented landscape. In: Markussen, M., Buse, R., Garrelts, H., Mánez Costa,M., Menzel, S., Marggraf, R. (Eds.), Valuation and Conservation of Biodiversity.Springer, Berlin-Heidelberg, pp. 343–356.
ánez Costa, M.A., Zeller, M., 2005. Calculating incentives for watershed protection.A case study in Guatemala. In: Markussen, M., Buse, R., Garrelts, H., Mánez Costa,M.A., Menzel, S., Marggraf, R. (Eds.), Valuation and Conservation of Biodiver-sity – Interdisciplinary Perspectives on the Convention on Biological Diversity.Springer, Berlin, Heidelberg.
arkussen, M., Renner, S.C., 2005. Land use changes and abiotic aspects as basicconditions for conservation of biodiversity in a tropical montane cloud forest(Guatemala). In: Markussen, M., Buse, R., Garrelts, H., Mánez Costa, M.A., Menzel,S., Marggraf, R. (Eds.), Valuation and Conservation of Biodiversity – Interdisci-plinary Perspectives on the Convention on Biological Diversity. Springer, Berlin,Heidelberg.
cIntyre-Mills, J., 2003. Critical Systematic Praxis for Social and EnvironmentalJustice. Participatory Policy Design and Governance for a Global Age. Springer,
Netherlands, Amsterdam.akajima, C., 1986. Subjective Equilibrium Theory of Farm Household. Elsevier Sci-ence Publishers, B.V., Amsterdam.
asi, R., Wunder, S., J.J. Campos A., 2002. Forest Ecosystem Services: Can They PayOur Way Out of Deforestation. CIFOR for the Global Environmental Facility (GEF),Bogor, Indonesia.
Z
licy 28 (2011) 423–433 433
agiola, S., 2008. Payments for environmental services in Costa Rica. EcologicalEconomics 65, 714–721.
agiola, S., Arcenas, A., Platais, G., 2003. Ensuring that the poor benefit from pay-ments for environmental services. In: Workshop on Reconciling Rural PovertyReduction and Resource Conservation: Identifying Relationships and Remedies,Washington.
agiola, S., Arcenas, A., Platais, G., 2004. Can payment for environmental serviceshelp reduces poverty? An exploration of issues and the evidence to date fromLatin America. World Development 33, 237–253.
ahl-Wostl, C., 2002. Participative and stakeholder-based policy design, evaluationand modeling processes. Integrated Assessment 3, 3–14.
ahl-Wostl, C., Hare, M., 2004. Processes of social learning in integratedresources management. Journal of Community & Applied Social Psychology 14,193–206.
enn, O., 2006. Participatory processes for designing environmental policies. LandUse Policy (January), 34–43.
enner, S.C., 2004. Human impact on bird diversity and community structurein a tropical montane cloud forest in Alta Verapaz, Guatemala, with specialreference to the Quetzal (Pharomachrus mocinno). Zentrum für Naturschutz.Georg-August Universität, Göttingen.
osa, H., Herrador, D., González, M.E., 1999. Valoración y pago por servicios ambi-entales: Las experiencias de Costa Rica y El Salvador. In: PRISMA 35.
antos, R., Antunes, P., Baptista, G., Mateus, P., Madruga, L., 2006. Stakeholder partic-ipation in the design of environmental policy mixes. Ecological Economics 60,100–110.
cherr, S., White, A., 2002. A New Agenda for Forest Conservation and PovertyReduction. Forest Trends, Washington.
tanda-Gunda, W., Mutimukuru, T., Nyirenda, R., Prahbu, R., Haggith, M., Vanclay,J.K., 2003. Participatory modelling to enhance social learning, collective actionand mobilization among users of the Mafungautsi forest, Zimbabwe. Small-scaleForest Economics, Management and Policy 2 (2), 313–326.
tave, K., 2002. Using system dynamics to improve public participation in environ-mental decisions. System Dynamics Review 18, 139–167.
toneham, I.L., Eigenraam, M., Ridley, A., Barr, N., 2003. The application of sustain-ability concepts to Australian agriculture: an overview. Australian Journal ofExperimental Agriculture 43, 195–203.
an den Hove, S., 2000. Participatory approaches to environmental policy-making:the European Commission Climate Policy Process as a case study. EcologicalEconomics 33, 457–472.
under, S., 2006. Are direct payments for environmental services spelling doom forsustainable forest management in the tropics? Ecology and Society 11, 23.
under, S., 2007. The efficiency of payments for environmental services in tropical
Services Beneficial to the Poor? ESA Working Papers 06-64:41.ilberman, D., Lipper, L., McCarthy, N., 2008. When could payments for environ-
mental services benefit the poor? Environment and Development Economics13, 255–278.