payments discourage coordination in ecosystem services
TRANSCRIPT
Payments discourage coordination in ecosystem services provision: evidence from behavioral experiments in Southeast
Asia
Citation Bell, Andrew R.; Zhang, Wei. Payments discourage coordination in ecosystem services provision: Evidence from behavioral experiments in Southeast Asia. Environmental Research Letters. Available online November 16, 2016. http://dx.doi.org/10.1088/1748-9326/11/11/114024
DOI http://dx.doi.org/10.1088/1748-9326/11/11/114024 Access through IFPRI e-brary
http://ebrary.ifpri.org/cdm/ref/collection/p15738coll5/id/5567
Terms of Use
IFPRI uploaded the final published version to the institutional repository and is made available under the copyright law of the United States (Title 17, United States Code) which governs "fair use" or the making of photocopies or other reproductions of copyrighted material. Photocopy or reproduction is not to be “used for any purpose other than private study, scholarship, or research.”
Permitted Re-Use
Permitted re-use of this open access article is determined by the author’s choice of user license.
e-Access to IFPRI Research
IFPRI has made this article openly available. If this access benefits you or your community share your story with [email protected].
This content has been downloaded from IOPscience. Please scroll down to see the full text.
Download details:
IP Address: 193.253.209.214
This content was downloaded on 16/11/2016 at 22:49
Please note that terms and conditions apply.
Payments discourage coordination in ecosystem services provision: evidence from behavioral
experiments in Southeast Asia
View the table of contents for this issue, or go to the journal homepage for more
2016 Environ. Res. Lett. 11 114024
(http://iopscience.iop.org/1748-9326/11/11/114024)
Home Search Collections Journals About Contact us My IOPscience
Environ. Res. Lett. 11 (2016) 114024 doi:10.1088/1748-9326/11/11/114024
LETTER
Payments discourage coordination in ecosystem services provision:evidence from behavioral experiments in Southeast Asia
AndrewBell1 andWei Zhang2
1 Department of Environmental Studies, NewYorkUniversity, 285Mercer St., NewYork, NY, 10003,USA2 Environment and ProductionTechnologyDivision, International Food Policy Research Institute, 2033K St.NW,Washington, DC,
20006,USA
E-mail: [email protected]
Keywords: ecosystem services, natural pest control, Southeast Asia, coordination game, incentives
Supplementarymaterial for this article is available online
AbstractThe contribution of synthetic pesticides to closing yield gaps around theworld is undeniable; however,their use is also a classic double-edged sword. Beyond thewell-recognized social costs (e.g., pollutionto soil andwater, and health effects both on consumers and other species) there are also privatecosts on farmers beyond the direct costs of inputs, associatedwith elevated risks of both acute andchronic damage to farmers’ health, andwith the destruction of populations of beneficial organisms.Managing agricultural land use to enhance natural pest control services (also calledmobile agent-based ecosystem services orMABES)holds promise to reduce this growing reliance on pesticides,though it too carries costs. In particular, uncertainty in crop yield due to pest damages, as well as theneed to coordinate pesticide usewith neighboring farms, can be important obstacles to establishingthe longer-termpublic good of natural pest regulation. Current thinking on promoting ecosystemservices suggests that payments or other economic incentives are a good fit for the promotion ofpublic good ecosystem services such asMABES.We undertook a framedfield experiment toexamine the role of subsidies for non-crop habitat in improving insect-based ecosystem services intwo separate samples in Southeast Asia—Cambodia andVietnam.Our central finding is that thesetwo contexts are not poised equally to benefit from incentives promotingMABES, and in factmaybe left worse off by payments schemes. As the study and practice of payments for ecosystem servicesprograms grows, thisfinding provides an important qualifier on recent theory supporting the useof payments to promote public good ecosystem services—where the nature of the coordinationproblem is complex and nonlinear, farm systems can bemadeworse off by being encouraged toattempt it.
Introduction
The contribution of synthetic pesticides to maintain-ing crop yields and closing yield gaps around theworldis undeniable. However, their use (let alone misuse oroveruse, which are not uncommon—e.g., Dasguptaet al 2007, Xu et al 2008, Laary 2012, Ikpesu andAriyo 2013) is also a classic double-edged sword.Looking to Southeast Asia, which is the focus ofthis study, beyond the well-recognized social and
environmental costs—e.g., pollution to soil and water(Nishina et al 2010, Toan et al 2013), and health effectsboth on consumers (e.g., Na et al 2006) and otherspecies (e.g., Klemick and Lichtenberg 2008)—thereare also private costs on farmers beyond the costs ofpurchase and labor for application. They include costsassociated with elevated risks of both acute andchronic damage to farmers’ health (Jensen et al 2011,Pham et al 2011), and costs associated with thedestruction of populations of beneficial organisms
OPEN ACCESS
RECEIVED
18 February 2016
REVISED
13October 2016
ACCEPTED FOR PUBLICATION
25October 2016
PUBLISHED
16November 2016
Original content from thisworkmay be used underthe terms of the CreativeCommonsAttribution 3.0licence.
Any further distribution ofthis workmustmaintainattribution to theauthor(s) and the title ofthework, journal citationandDOI.
© 2016 IOPPublishing Ltd
(e.g., pollinators, natural enemy arthropods or birds).The latter means generally a loss of biodiversity(Tscharntke et al 2005), and more specifically thecollapse of natural defense systems that keep pestpopulations in check (Bianchi et al 2006, Gardineret al 2009).
Managing agricultural land use to enhance naturalpest control services (also called mobile agent-basedecosystem services or, hereon, MABES, Kremenet al 2007) holds promise to reduce this growing reli-ance on pesticides while preserving farm livelihoodsand food security (Barbosa 1998, Landis et al 2000)though it too carries costs. In particular, the potentialfor pest-related crop damage, as well as the need tocoordinate pesticide use with neighboring farms, canbe important obstacles to establishing the longer-termpublic good of natural pest regulation. Given thispotential for costs to potentially outweigh benefits inthe short term, the question of appropriate policy toovercome such early hurdles (Bell et al 2016a) and pro-mote ecosystem-compatible management approachesin agriculture becomes important. Current thinkingon promoting ecosystem services suggests that pay-ments or other economic incentives are a good fit forthe promotion of public good ecosystem services(Kemkes et al 2010), and might play a role in improv-ing MABES provision, but here effectiveness varieswith context, including the institutional environment.For example, national organic standards have beensuccessful in Thailand and Laos (Schreinemacherset al 2015), yet a lack of regulatory framework in Cam-bodia or Vietnammeans that local efforts at providingstandards—such as Vietnam’s ‘safe vegetable’ stan-dard (VanHoi et al 2009)—do not necessarily garner amarket premium.
As a potential alternative encouragement, wedevelop a framed field experiment to consider a sub-sidy on the provision of non-crop habitat—landwithin the agricultural landscape set aside and leftundisturbed to promote natural insect enemy popula-tions (Landis et al 2000)—as an example of an eco-nomic incentive tied to an easily observed action andthus potentially feasible as an instrument to promoteecosystem-based management in smallholder land-scapes. Framed field experiments can extendmore tra-ditional survey approaches by eliciting hypotheticalresponses to a carefully controlled decision environ-ment, representing conditions that (i) may not yethave analogs in past experience and (ii)would be diffi-cult to construct via pilot study or impact evaluationdue to costs or confounding effects such as environ-mental variation (e.g., Alpizar et al 2011). Specifically,we applied a coordination game framed around theland-use decisions that promote or discourageMABES, as part of a larger examination of the poten-tial forMABES provision in the neighboring SoutheastAsian nations of Cambodia and Vietnam. These two
contexts share a similar reliance on rice productionacross both wet and dry seasons, but differ greatly intheir usage and access to pesticides and pesticideknowledge. Per-hectare pesticide usage in Vietnamrose from 6 to 16 kg ha–1 over the period 2003 2012,with most imported from China, Cambodian pesti-cide use was close to nil as late as 2008 but rosequickly to 3 kg ha–1 by 2012, with most imports fromThailand orVietnam (Schreinemachers et al 2015) andlabeling rarely translated to Khmer script legible toCambodian farmers (Jensen et al 2011). Our centralfinding is that these two contexts are not poisedequally to benefit from incentives promoting MABES,and in fact may be left worse off by payments schemes.The findings have broader implications on policies onsustainable agricultural intensification, and highlighthow policy outcomes can be significantly shaped bycontext.
Methods
NonCropShare—a coordination game for insect-based ecosystem servicesWe applied a version of the published gameNonCrop-Share (Bell et al 2013, 2016b), a symmetric, turn-basedcoordination game for the provision of insect-basedecosystem services played on tablet computers linkedvia a mobile hotspot. In NonCropShare, each of thefour players takes responsibility for land use decisionson a 3×3 grid-cell section (farm) of a 6×6 grid-cellagricultural landscape (figure 1). There are fourdifferent land-use choices available to players (plant-ing crop without spraying, ‘noSpray’; plantingcrop+light spray, ‘lightSpray’; planting cro-p+heavy spray, ‘heavySpray’; adopting non-crophabitat, ‘nonCrop’), each with a different distributionof costs and benefits (table 1). In each game turn,players select land use by cycling through land optionsfor each cell (by tapping repeatedly on the cell), andend their turn by ‘confirming’ their choices when theyare ready. Once all players have confirmed theirchoices, the turn ends, and the ‘score’ (i.e., the totalpoints earned) is calculated for each cell based onwhatchoices were made in and around the cell, and theprocess is repeated in the next round. The coordina-tion problem emerges from the interaction of non-Crop and heavySpray: nonCrop cells provide abonus of +2 to the yield of cells in a Mooreneighborhood (vertical, horizontal, and diagonaldirections) of 2 cells around them, including acrossplayer boundaries (i.e., up to 24 cells potentiallyaffected, depending on the location); heavySpray cellscancel out any benefits from nonCrop in a Mooreneighborhood of 1 cell around them (up to 8 cellspotentially affected). Thus, nonCrop cells placed alongshared boundaries will also have maximally shared
2
Environ. Res. Lett. 11 (2016) 114024
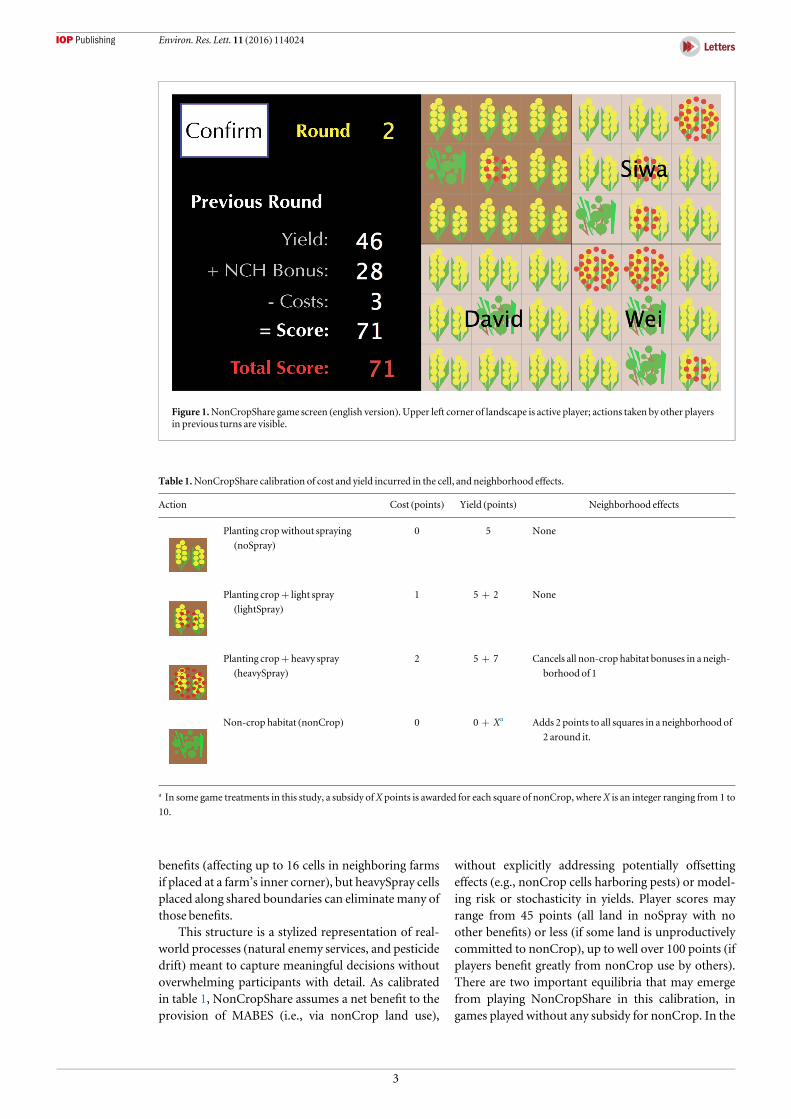
benefits (affecting up to 16 cells in neighboring farmsif placed at a farm’s inner corner), but heavySpray cellsplaced along shared boundaries can eliminate many ofthose benefits.
This structure is a stylized representation of real-world processes (natural enemy services, and pesticidedrift) meant to capture meaningful decisions withoutoverwhelming participants with detail. As calibratedin table 1, NonCropShare assumes a net benefit to theprovision of MABES (i.e., via nonCrop land use),
without explicitly addressing potentially offsettingeffects (e.g., nonCrop cells harboring pests) or model-ing risk or stochasticity in yields. Player scores mayrange from 45 points (all land in noSpray with noother benefits) or less (if some land is unproductivelycommitted to nonCrop), up to well over 100 points (ifplayers benefit greatly from nonCrop use by others).There are two important equilibria that may emergefrom playing NonCropShare in this calibration, ingames played without any subsidy for nonCrop. In the
Figure 1.NonCropShare game screen (english version). Upper left corner of landscape is active player; actions taken by other playersin previous turns are visible.
Table 1.NonCropShare calibration of cost and yield incurred in the cell, and neighborhood effects.
Action Cost (points) Yield (points) Neighborhood effects
Planting cropwithout spraying
(noSpray)0 5 None
Planting crop+ light spray
(lightSpray)1 5+2 None
Planting crop+ heavy spray
(heavySpray)2 5+7 Cancels all non-crop habitat bonuses in a neigh-
borhood of 1
Non-crop habitat (nonCrop) 0 0+Xa Adds 2 points to all squares in a neighborhood of
2 around it.
a In some game treatments in this study, a subsidy ofX points is awarded for each square of nonCrop, whereX is an integer ranging from 1 to
10.
3
Environ. Res. Lett. 11 (2016) 114024
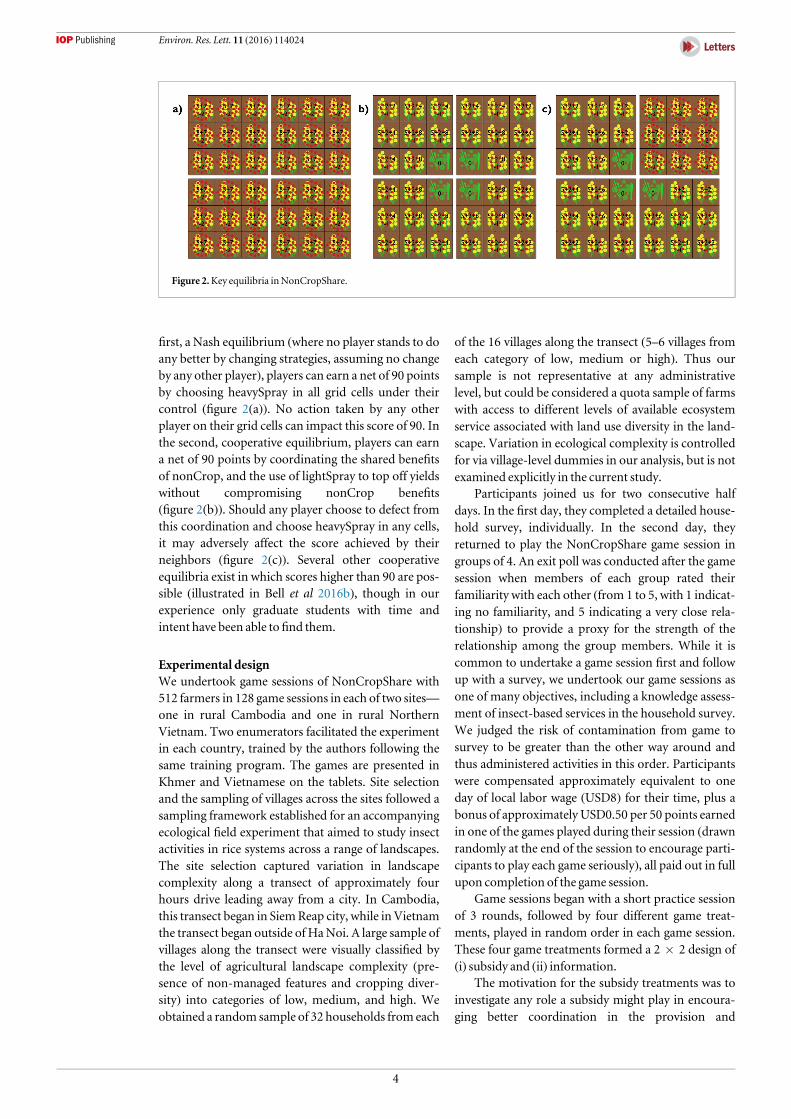
first, a Nash equilibrium (where no player stands to doany better by changing strategies, assuming no changeby any other player), players can earn a net of 90 pointsby choosing heavySpray in all grid cells under theircontrol (figure 2(a)). No action taken by any otherplayer on their grid cells can impact this score of 90. Inthe second, cooperative equilibrium, players can earna net of 90 points by coordinating the shared benefitsof nonCrop, and the use of lightSpray to top off yieldswithout compromising nonCrop benefits(figure 2(b)). Should any player choose to defect fromthis coordination and choose heavySpray in any cells,it may adversely affect the score achieved by theirneighbors (figure 2(c)). Several other cooperativeequilibria exist in which scores higher than 90 are pos-sible (illustrated in Bell et al 2016b), though in ourexperience only graduate students with time andintent have been able tofind them.
Experimental designWe undertook game sessions of NonCropShare with512 farmers in 128 game sessions in each of two sites—one in rural Cambodia and one in rural NorthernVietnam. Two enumerators facilitated the experimentin each country, trained by the authors following thesame training program. The games are presented inKhmer and Vietnamese on the tablets. Site selectionand the sampling of villages across the sites followed asampling framework established for an accompanyingecological field experiment that aimed to study insectactivities in rice systems across a range of landscapes.The site selection captured variation in landscapecomplexity along a transect of approximately fourhours drive leading away from a city. In Cambodia,this transect began in SiemReap city, while in Vietnamthe transect began outside of HaNoi. A large sample ofvillages along the transect were visually classified bythe level of agricultural landscape complexity (pre-sence of non-managed features and cropping diver-sity) into categories of low, medium, and high. Weobtained a random sample of 32 households from each
of the 16 villages along the transect (5–6 villages fromeach category of low, medium or high). Thus oursample is not representative at any administrativelevel, but could be considered a quota sample of farmswith access to different levels of available ecosystemservice associated with land use diversity in the land-scape. Variation in ecological complexity is controlledfor via village-level dummies in our analysis, but is notexamined explicitly in the current study.
Participants joined us for two consecutive halfdays. In the first day, they completed a detailed house-hold survey, individually. In the second day, theyreturned to play the NonCropShare game session ingroups of 4. An exit poll was conducted after the gamesession when members of each group rated theirfamiliarity with each other (from 1 to 5, with 1 indicat-ing no familiarity, and 5 indicating a very close rela-tionship) to provide a proxy for the strength of therelationship among the group members. While it iscommon to undertake a game session first and followup with a survey, we undertook our game sessions asone of many objectives, including a knowledge assess-ment of insect-based services in the household survey.We judged the risk of contamination from game tosurvey to be greater than the other way around andthus administered activities in this order. Participantswere compensated approximately equivalent to oneday of local labor wage (USD8) for their time, plus abonus of approximately USD0.50 per 50 points earnedin one of the games played during their session (drawnrandomly at the end of the session to encourage parti-cipants to play each game seriously), all paid out in fullupon completion of the game session.
Game sessions began with a short practice sessionof 3 rounds, followed by four different game treat-ments, played in random order in each game session.These four game treatments formed a 2×2 design of(i) subsidy and (ii) information.
The motivation for the subsidy treatments was toinvestigate any role a subsidy might play in encoura-ging better coordination in the provision and
Figure 2.Key equilibria inNonCropShare.
4
Environ. Res. Lett. 11 (2016) 114024
utilization of MABES, besides to encourage adoptionof nonCrop land use. The calibration of NonCrop-Share in this study allows players to do equivalentlywell either by playing selfishly (equilibrium 1), orcoordinating (equilibrium 2); the addition of a subsidyallows an evaluation of how much more valuable thecoordination equilibrium must be in order to encou-rage farmers to adopt nonCrop land and the coordina-tion strategy. In games 1 and 2, no subsidies wereoffered to participants for the adoption of nonCrop; ingames 3 and 4, a subsidy from 1 to 10 points (drawnrandomly at the beginning of the game and held con-stant during the game) was offered to participants foreach cell of nonCrop.
The interest in information was to verify whether(beyond what kind of long-term interactions arefound in a repeated game) leadership helped improvecooperative outcomes. That is, did the ability toobserve others’ choices in advance of making one’sown decisions increase the level of coordination? Ingames 1 and 3, NonCropShare did not reveal the choi-ces of any player during a round until all players hadcompleted their turn (clicked ‘Confirm’). In games 2and 4, NonCropShare revealed players’ choices toother players immediately upon those choices beingconfirmed by the player.
Players were able to communicate freely regardingany topic throughout the entire game session, includ-ing strategy for the game. Players did not receive anystrategic advice from the game session leader, with allquestions being answered via restatement of the rele-vant game rules. A complete game protocol is includedas appendix A.
Data analysisWe examined four main game outcomes measured atthe group (or ‘landscape’) level (i.e., the four neighbor-ing ‘farms’): (i) total net production (i.e., yields minusspray cost minus subsidy spending) in the landscape,(ii) total production attributable to nonCrop in thelandscape (as an indicator of ES provision), (iii) thefraction of nonCrop-attributable production accruingto properties neighboring the property in whichnonCrop was adopted (as an indicator of sharedbenefits), and (iv) the potential nonCrop-attributableproduction that was canceled by heavySpray squares(as an indicator of issues in coordinating). To explorepossible subsidy effects, we looked at other gameoutcome indicators including counts of heavySprayand nonCrop cells, and diversity in land use strategies.To disentangle within-player from between-playerdissimilarities, and following Jost (2006), we measurethree different diversities: Alpha diversity (averagediversity in choices made by individual players), Betadiversity (diversity between players) and Gammadiversity (diversity across landscape), based on themixof heavySpray and nonCrop choices. Because thesetwo land uses are direct indicators of the ‘Nash’ and
‘coordination’ strategies, respectively, and ought notappear together, these calculations reflect diversity instrategies, rather than simply diversity in land use3.Thusly, they provide a lens into the scale (player,landscape) at which coherent land-use approaches areappearing; Alpha and Gamma diversities D are calcu-lated directly from land use choices by:
å= ⋅ ( )⎛⎝⎜
⎞⎠⎟D p pexp ln ,
ii i
where pi is the proportion of cells in land use i(nonCrop or heavySpray) across the farm or land-scape. Beta diversity is then available by the relation-ship:
⋅=
( ) ( )Alpha Diversity Beta Diversity
Gamma Diversity.
Definitions and statistical summary for variablesused in the regressions are reported in table 2. Allresponse and explanatory variables are standardized(expressed as z-scores), with the exception of dummyvariables to enable the comparison of magnitudes ofestimated coefficients withinmodels.
We conducted two complementary regressionanalyses. First, we ran a panel (longitudinal) data ana-lysis with both Tobit random-effect (RE) and linearfixed-effect (FE) estimators (Woolridge 2010) to iden-tify the causal effects of exogenous treatment variables,both with and without interacting the treatments ofsubsidy and information. Variables represent game-level data summed over 8 rounds within each game.The experimental dataset is panel data in nature inwhich the behavior of groups are observed acrossrounds (with treatment conditions the same within agame) and games, across which only the randomlyassigned treatment changes (and not observable orunobservable player and group characteristics). Theinformation treatment is represented by a binary vari-able for whether or not information is revealed uponconfirmation of choices. For the subsidy treatment,the analysis considers both binary (whether or not asubsidy is given) and discrete random variables (sub-sidy rate per nonCrop cell, ranging from zero to ten),as participants may respond differently going fromzero to non-zero subsidy as compared to getting oneunit increase in subsidy rate. We also controlled forrounds (in the entire game session) to capture anylearning effect.
Second, we turn to Tobit regressions on the pooledround-level data for group-averaged variables for eachcountry to explore the associations between theobserved factors (drawn from the household survey)and the experiment outcomes. The nonlinear regres-sions are censored on both sides and allow forintragroup correlation. Variables represent group-
3Diversity calculations based on all four land uses (noSpray,
lightSpray, heavySpray, and nonCrop) would not unambiguouslyshowdifferences in strategy.
5
Environ. Res. Lett. 11 (2016) 114024
Table 2.Definition and statistical summary for the response (round-level) and explanatory variables.
Rawdata Z-scores
Cambodia Vietnam Cambodia Vietnam
Description Mean SD Mean SD Mean SD Mean SD
Net production (yield less costs less subsidies) for the cur-rent round
286.51 42.52 296.07 41.44 −0.12 1.01 0.11 0.98
Production attributable to benefits fromnonCrop for the
current round
30.25 53.05 102.45 76.95 −0.5 0.7 0.46 1.02
Share of nonCrop-attributable production on properties
other than the property nonCropwas planted on for the
current round
0.19 0.27 0.35 0.21 −0.34 1.06 0.31 0.83
Potential nonCrop-attributable production that was can-
celed in the turn due toHeavySpray squares for the cur-
rent round
37.78 46.49 33.15 44.41 0.05 1.02 −0.05 0.98
Number of heavySpray cells 16.56 11.61 5.84 9.38 0.48 0.98 −0.43 0.80
Number of nonCrop cells 2.88 3.63 5.61 3.36 −0.38 0.97 0.35 0.90
Beta diversity 1.20 0.27 1.19 0.25 0.03 1.03 −0.02 0 .97
Alpha diversity 1.12 0.17 1.13 0.18 −0.01 0.96 0.02 1.03
Gammadiversity 1.35 0.37 1.35 0.38 0.004 0.99 −0.004 1.01
Average fraction of farms owned across group 0.42 0.24 0.91 0.12 −0.84 0.77 0.76 0.39
Average farmholding size across group 2.58 3.1 13.22 24.15 −0.3 0.17 0.28 1.31
Average fraction of crops sold (bymass) across group 30.84 18.33 27.29 20.6 0.09 0.93 −0.09 1.05
Fraction of group using chemical fertilizers 0.69 0.33 0.998 0.02 −0.59 1.19 0.54 0.08
Fraction of group using pesticides 0.29 0.28 0.85 0.27 −0.74 0.72 0.68 0.69
Fraction of the group that is female 0.46 0.29 0.45 0.26 0.02 1.05 −0.01 0.96
Average age across group 43.22 6.69 49.24 7.16 −0.42 0.88 0.38 0.95
Average years of formal education across group 2.19 0.66 3.94 0.57 −0.86 0.61 0.78 0.54
Fraction of group received instruction on pesticides 0.21 0.23 0.83 0.21 −0.85 0.6 0.78 0.56
Fraction of group aware of pesticide hazards 0.63 0.24 0.97 0.08 −0.73 0.99 0.66 0.31
Average (self-reported, scale of 1–5) relationship acrossgroup
3.75 0.74 4.17 0.69 −0.29 0.99 0.27 0.93
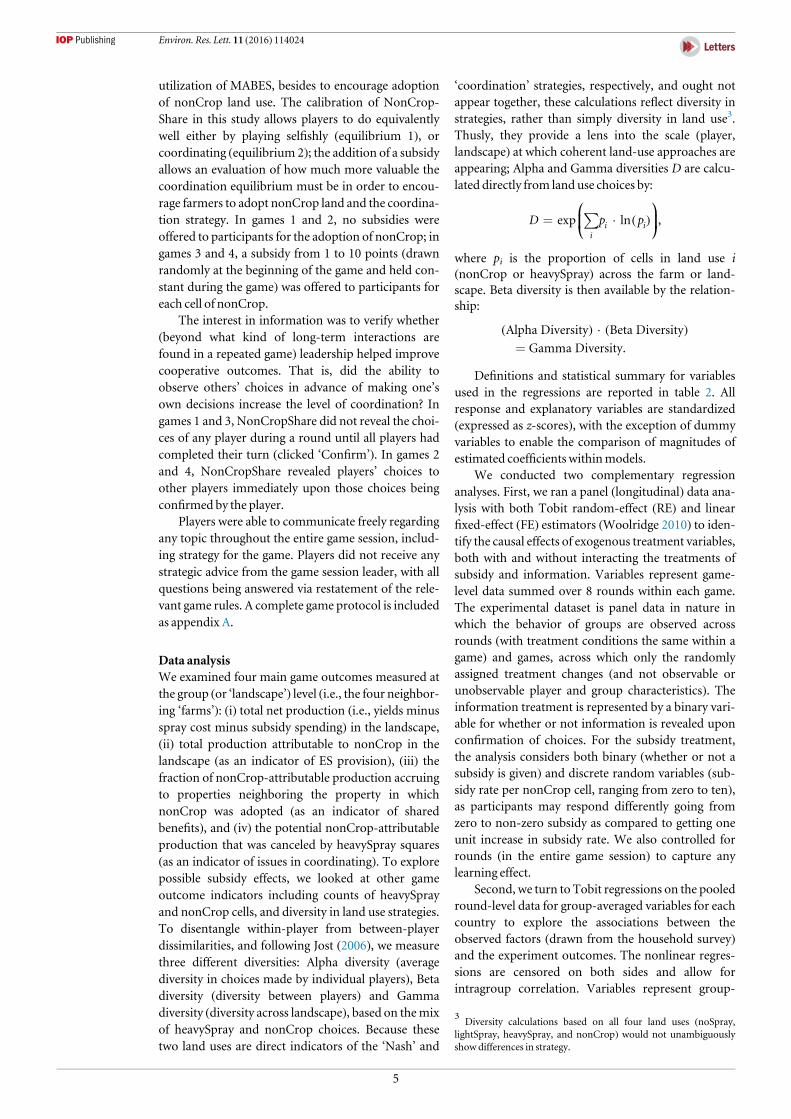
Figure 3.Pooled landscape level outcomes across all turns in all games in (a)Vietnam and (b)Cambodia.Meannet levels for thelandscape and heavySpray squares in the landscape indicated by the larger red dot.Mean values for net production aswell as thenumber of heavySpray squares differ betweenCambodia andVietnamat p<0.001 byKolmogorov–Smirnov andMann–Whitneytests.
6
Environ. Res. Lett. 11 (2016) 114024
level data averaged across four participants per groupand pooled across all rounds in the entire game ses-sion. Comparing regression estimates across coun-tries, we are able to identify clear differences and whatfactorsmay have contributed to those differences.
Results
We introduce our findings through two birds-eyecomparisons of the datasets from the two countries.First, figure 3 plots the outcome of net production(yields minus pesticide spending minus subsidies)against the number of heavySpray cells in the land-scape in a given turn, pooling across all turns from allgames in each country (see appendix C for compar-isons across games). Data points to the right (moreheavySpray) in each panel show rounds where playersapproached the strong Nash equilibrium of relianceon heavySpray, while points toward the left (lessheavySpray) in each panel show rounds where playersattempted to reach the cooperative equilibrium ofreliance on nonCrop and lightSpray. The skewedU-shape of each plot contrasts the stability of returnsfrom heavySpray, with the difficulty (steep slope) in
earning points from the cooperative approach ifplayers do not all agree to forgo all or most of theirheavySpray use. On average, farmers in our Vietna-mese sample (figure 3(a)) chose significantly lessheavySpray, and had significantly higher net produc-tion (by KS and MW tests at α=0.001) thanCambodia (figure 3(b))—293 points on average,versus 284, for a difference of 9. If we consider the all-noSpray case as a baseline (all 36 cells having 5 pointsfor production of 180), then this represents about 9%of gains made by crop management (via lightSpray,heavySpray, or nonCrop).
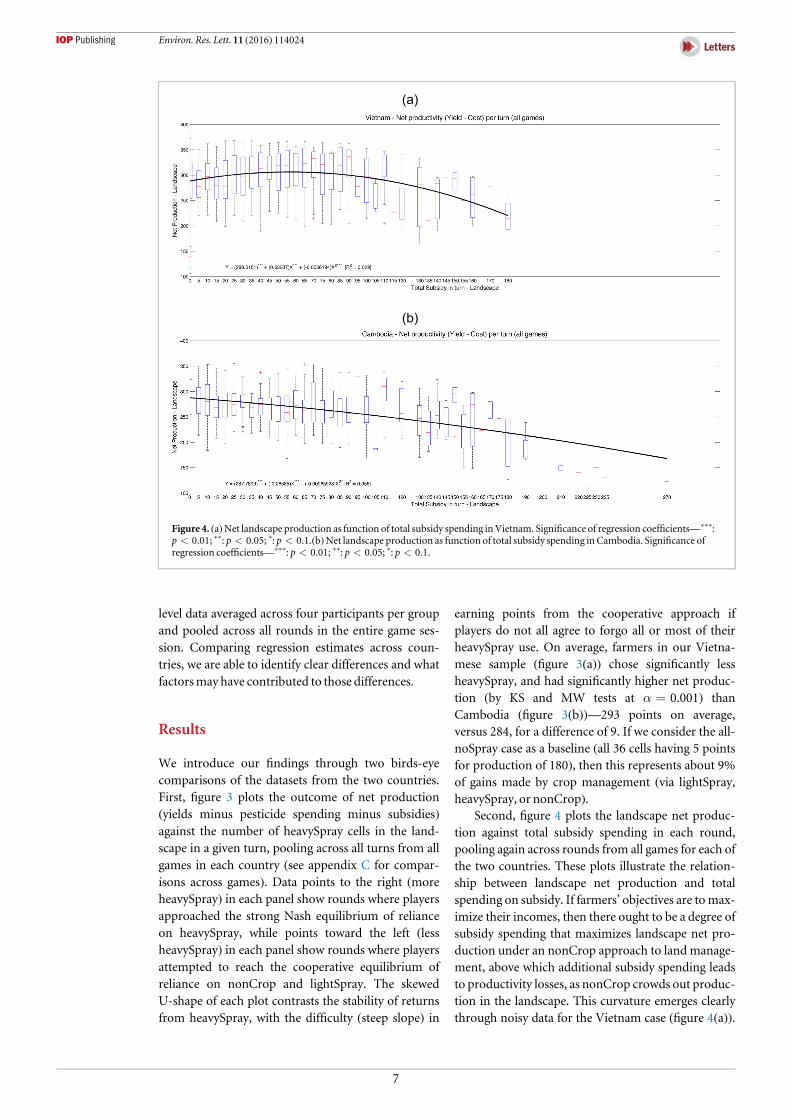
Second, figure 4 plots the landscape net produc-tion against total subsidy spending in each round,pooling again across rounds from all games for each ofthe two countries. These plots illustrate the relation-ship between landscape net production and totalspending on subsidy. If farmers’ objectives are tomax-imize their incomes, then there ought to be a degree ofsubsidy spending that maximizes landscape net pro-duction under an nonCrop approach to land manage-ment, above which additional subsidy spending leadsto productivity losses, as nonCrop crowds out produc-tion in the landscape. This curvature emerges clearlythrough noisy data for the Vietnam case (figure 4(a)).
Figure 4. (a)Net landscape production as function of total subsidy spending inVietnam. Significance of regression coefficients—***:p<0.01; **: p<0.05; *: p<0.1.(b)Net landscape production as function of total subsidy spending in Cambodia. Significance ofregression coefficients—***: p<0.01; **: p<0.05; *: p<0.1.
7
Environ. Res. Lett. 11 (2016) 114024
Landscape net production seems to be maximized, onaverage, when subsidy spending is around 56. In con-trast, landscape net production seems to decline withany non-zero spending on subsidies in the Cambodiacase (figure 4(b)).
To try to explain the differences in observed out-comes across the two different samples, we turn toregression analysis of key game outcomes on gamestructure and characteristics of game players.
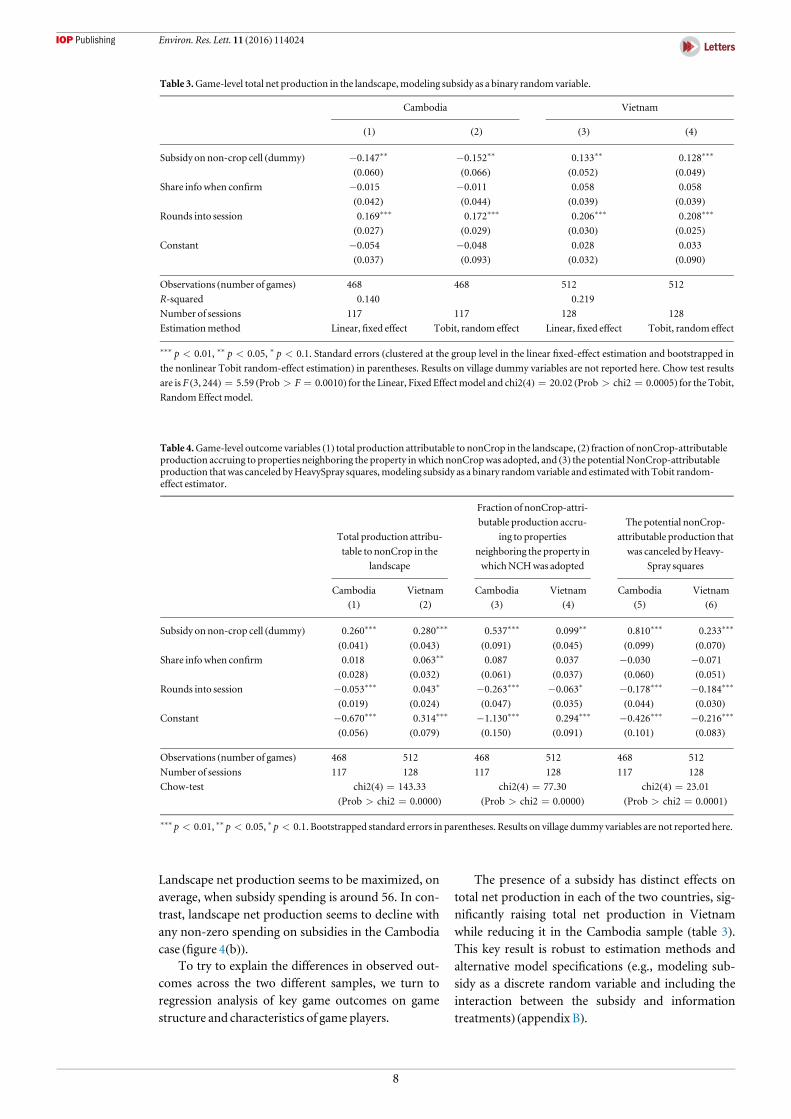
The presence of a subsidy has distinct effects ontotal net production in each of the two countries, sig-nificantly raising total net production in Vietnamwhile reducing it in the Cambodia sample (table 3).This key result is robust to estimation methods andalternative model specifications (e.g., modeling sub-sidy as a discrete random variable and including theinteraction between the subsidy and informationtreatments) (appendix B).
Table 3.Game-level total net production in the landscape,modeling subsidy as a binary randomvariable.
Cambodia Vietnam
(1) (2) (3) (4)
Subsidy on non-crop cell (dummy) −0.147** −0.152** 0.133** 0.128***
(0.060) (0.066) (0.052) (0.049)Share infowhen confirm −0.015 −0.011 0.058 0.058
(0.042) (0.044) (0.039) (0.039)Rounds into session 0.169*** 0.172*** 0.206*** 0.208***
(0.027) (0.029) (0.030) (0.025)Constant −0.054 −0.048 0.028 0.033
(0.037) (0.093) (0.032) (0.090)
Observations (number of games) 468 468 512 512
R-squared 0.140 0.219
Number of sessions 117 117 128 128
Estimationmethod Linear, fixed effect Tobit, random effect Linear, fixed effect Tobit, random effect
*** p<0.01, ** p<0.05, * p<0.1. Standard errors (clustered at the group level in the linear fixed-effect estimation and bootstrapped in
the nonlinear Tobit random-effect estimation) in parentheses. Results on village dummy variables are not reported here. Chow test results
are is F (3, 244)=5.59 (Prob>F=0.0010) for the Linear, Fixed Effectmodel and chi2(4)=20.02 (Prob>chi2=0.0005) for the Tobit,RandomEffectmodel.
Table 4.Game-level outcome variables (1) total production attributable to nonCrop in the landscape, (2) fraction of nonCrop-attributableproduction accruing to properties neighboring the property inwhich nonCropwas adopted, and (3) the potential NonCrop-attributableproduction that was canceled byHeavySpray squares,modeling subsidy as a binary randomvariable and estimatedwith Tobit random-effect estimator.
Total production attribu-
table to nonCrop in the
landscape
Fraction of nonCrop-attri-
butable production accru-
ing to properties
neighboring the property in
whichNCHwas adopted
The potential nonCrop-
attributable production that
was canceled byHeavy-
Spray squares
Cambodia Vietnam Cambodia Vietnam Cambodia Vietnam
(1) (2) (3) (4) (5) (6)
Subsidy on non-crop cell (dummy) 0.260*** 0.280*** 0.537*** 0.099** 0.810*** 0.233***
(0.041) (0.043) (0.091) (0.045) (0.099) (0.070)Share infowhen confirm 0.018 0.063** 0.087 0.037 −0.030 −0.071
(0.028) (0.032) (0.061) (0.037) (0.060) (0.051)Rounds into session −0.053*** 0.043* −0.263*** −0.063* −0.178*** −0.184***
(0.019) (0.024) (0.047) (0.035) (0.044) (0.030)Constant −0.670*** 0.314*** −1.130*** 0.294*** −0.426*** −0.216***
(0.056) (0.079) (0.150) (0.091) (0.101) (0.083)
Observations (number of games) 468 512 468 512 468 512
Number of sessions 117 128 117 128 117 128
Chow-test chi2(4)=143.33(Prob>chi2=0.0000)
chi2(4)=77.30(Prob>chi2=0.0000)
chi2(4)=23.01(Prob>chi2=0.0001)
*** p<0.01, ** p<0.05, * p<0.1. Bootstrapped standard errors in parentheses. Results on village dummy variables are not reported here.
8
Environ. Res. Lett. 11 (2016) 114024
We observe at the game level a significant learningeffect for all 4 outcomes (measured by regressingagainst the round number associated with each game,where we again emphasize that the order of the four8-round games was randomized across participants)(tables 3 and 4). As participants played more roundsinto the entire game session, they improved overalllandscape net production while simultaneously redu-cing losses due to coordination problems (throughreduced cancelled nonCrop points) in both countries.Sharing of nonCrop benefits also decreased overall asthe session progressed for both Cambodia and Viet-nam. The key difference in learning appears to be thatin Vietnam, players tended toward higher benefitsattributable to nonCrop in the landscape (seeappendix C for comparison of heavySpray versus non-Crop by game), whereas the opposite impact wasobserved for Cambodia. Finally, we note little obser-vable effect of the information treatment on the fourobserved outcomes, with the exception of a positiveeffect on benefits attributable to nonCrop in the land-scape in Vietnam (Column 2 in table 4). This supportsthe other observations that the Vietnam sample wasbetter able to use available information to coordinatenonCrop benefits.
To understand how the provision of subsidy onnonCrop cells resulted in lower total net productionfor the Cambodia sample while doing the opposite inVietnam, we first examine how subsidy affected gameoutcomes that capture key sources of gains and losses(table 4). Providing a subsidy raised benefits attribu-table to nonCrop in the landscape in both countriesby similar degrees (i.e., 0.26–0.28 standard deviations,on average). Further, the subsidy encourages both(i) more sharing of nonCrop benefits (i.e., morebenefits from one farmer’s nonCrop accruing toneighboring farms) as well as (ii) more cancellationof potential nonCrop benefits (from heavySpraysquares, reflecting a failure in coordination) inboth countries. However, the average effect sizesare much greater for Cambodia than for Vietnam—
greater levels of sharing, but also greater coordinationfailure accruing to the presence of a subsidy (columns3–6 in table 4). These results are generally robust toestimation methods and model specifications(appendix B).
Pooled round-wise Tobit regression results showthat, while subsidy indeed reduced the number of hea-vySpray cells and increased the number of nonCropcells in both countries (columns 3–6 in table 5) asexpected, the subsidy failed to provide sufficientincentives to turn around the dynamics in land usechoices for Cambodia. Moreover, by encouragingmore nonCrop cells, inefficiency increased (as cap-tured by a large increase in cancelled potential non-Crop benefits (appendix D)) as a result of poorcoordination, reducing the total net production for
Cambodia (column 1 in table 5). Pooled round-wiseTobit regression results on Alpha (within player), Beta(between player), and Gamma (overall) diversities fur-ther confirm that, on average the presence of a subsidysignificantly increasedmix-up of heavySpray and non-Crop cells within individual farms (or participants’ 3by 3 space), across farms, and across group (landscape)in Cambodia, but not in Vietnam (columns 7–12 intable 5). This suggests again that the subsidy leads theCambodia sample to coordinate poorly amongthemselves.
The pooled round-level Tobit regression analysisshows additional explanatory factors for game out-comes beyond the game treatments (table 5), withclear differences in the set of factors explaining out-comes across the two sites. Groups with older partici-pants or more female participants tended to achievelower total net production in the Cambodia sample,while these factors did not appear to have an effect inVietnam. The use of pesticides and chemical fertilizersin their own farms reduced investment in nonCropbenefits and shared nonCrop benefits while increasingcancellation of potential nonCrop benefits for theVietnam sample, but this effect was not observed forthe Cambodia sample (where input use is much loweroverall) (appendixD).
Perhaps most interestingly, the strength of rela-tionships in the group (the average measure of howwell players in the game know each other) encouragesnonCrop benefits in both countries (appendix D), butwhile it corresponds to significantly higher net pro-duction inVietnam, it is associatedwith lower net pro-duction in Cambodia (columns 1 and 2 in table 5).That is to say, groups with better relationships inCambodia used more nonCrop and less heavySpray(columns 3 and 5 in table 5), but did not have anygreater success in solving the coordination problem.In contrast, better relationships boosted nonCropbenefits in Vietnam (appendix D) without sig-nificantly changing the numbers of cells allocated toheavySpray or nonCrop (columns 4 and 6 in table 5).These imply that groups with better relationshipscoordinated better on where and with whom to adoptnonCrop in Vietnam than Cambodia. Another hint isthat the information treatment helped the Vietnamsample to improve nonCrop benefits (column 2 intable 4) but had no significant impact on the Cambo-dia sample, suggesting lower influence from peerbehavior than inVietnam.
Discussion
We find that the subsidy on non-crop cells, whilechanging land use behavior among the Cambodianparticipants, failed to provide sufficient incentives forthe groups to solve the coordination problem,
9
Environ. Res. Lett. 11 (2016) 114024
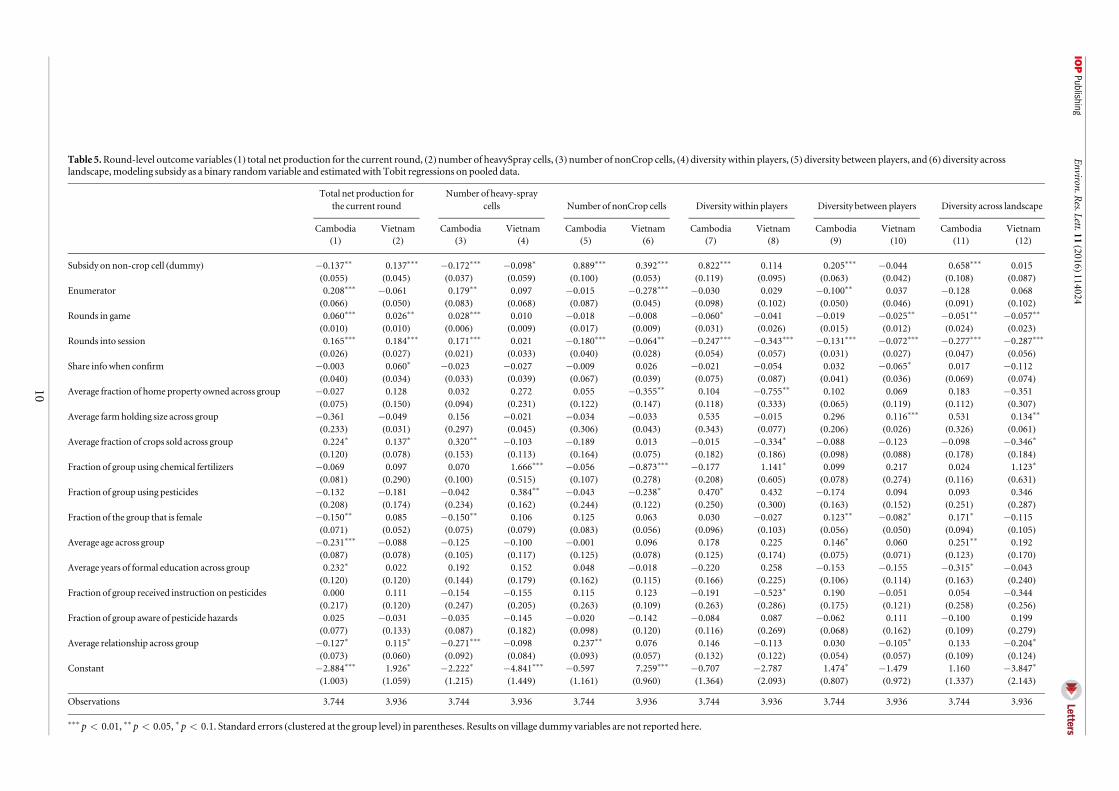
Table 5.Round-level outcome variables (1) total net production for the current round, (2)number of heavySpray cells, (3)number of nonCrop cells, (4)diversity within players, (5)diversity between players, and (6) diversity acrosslandscape,modeling subsidy as a binary randomvariable and estimatedwith Tobit regressions on pooled data.
Total net production forthe current round
Number of heavy-spraycells Number of nonCrop cells Diversity within players Diversity between players Diversity across landscape
Cambodia Vietnam Cambodia Vietnam Cambodia Vietnam Cambodia Vietnam Cambodia Vietnam Cambodia Vietnam(1) (2) (3) (4) (5) (6) (7) (8) (9) (10) (11) (12)
Subsidy on non-crop cell (dummy) −0.137** 0.137*** −0.172*** −0.098* 0.889*** 0.392*** 0.822*** 0.114 0.205*** −0.044 0.658*** 0.015(0.055) (0.045) (0.037) (0.059) (0.100) (0.053) (0.119) (0.095) (0.063) (0.042) (0.108) (0.087)
Enumerator 0.208*** −0.061 0.179** 0.097 −0.015 −0.278*** −0.030 0.029 −0.100** 0.037 −0.128 0.068(0.066) (0.050) (0.083) (0.068) (0.087) (0.045) (0.098) (0.102) (0.050) (0.046) (0.091) (0.102)
Rounds in game 0.060*** 0.026** 0.028*** 0.010 −0.018 −0.008 −0.060* −0.041 −0.019 −0.025** −0.051** −0.057**
(0.010) (0.010) (0.006) (0.009) (0.017) (0.009) (0.031) (0.026) (0.015) (0.012) (0.024) (0.023)Rounds into session 0.165*** 0.184*** 0.171*** 0.021 −0.180*** −0.064** −0.247*** −0.343*** −0.131*** −0.072*** −0.277*** −0.287***
(0.026) (0.027) (0.021) (0.033) (0.040) (0.028) (0.054) (0.057) (0.031) (0.027) (0.047) (0.056)Share infowhen confirm −0.003 0.060* −0.023 −0.027 −0.009 0.026 −0.021 −0.054 0.032 −0.065* 0.017 −0.112
(0.040) (0.034) (0.033) (0.039) (0.067) (0.039) (0.075) (0.087) (0.041) (0.036) (0.069) (0.074)Average fraction of home property owned across group −0.027 0.128 0.032 0.272 0.055 −0.355** 0.104 −0.755** 0.102 0.069 0.183 −0.351
(0.075) (0.150) (0.094) (0.231) (0.122) (0.147) (0.118) (0.333) (0.065) (0.119) (0.112) (0.307)Average farmholding size across group −0.361 −0.049 0.156 −0.021 −0.034 −0.033 0.535 −0.015 0.296 0.116*** 0.531 0.134**
(0.233) (0.031) (0.297) (0.045) (0.306) (0.043) (0.343) (0.077) (0.206) (0.026) (0.326) (0.061)Average fraction of crops sold across group 0.224* 0.137* 0.320** −0.103 −0.189 0.013 −0.015 −0.334* −0.088 −0.123 −0.098 −0.346*
(0.120) (0.078) (0.153) (0.113) (0.164) (0.075) (0.182) (0.186) (0.098) (0.088) (0.178) (0.184)Fraction of group using chemical fertilizers −0.069 0.097 0.070 1.666*** −0.056 −0.873*** −0.177 1.141* 0.099 0.217 0.024 1.123*
(0.081) (0.290) (0.100) (0.515) (0.107) (0.278) (0.208) (0.605) (0.078) (0.274) (0.116) (0.631)Fraction of group using pesticides −0.132 −0.181 −0.042 0.384** −0.043 −0.238* 0.470* 0.432 −0.174 0.094 0.093 0.346
(0.208) (0.174) (0.234) (0.162) (0.244) (0.122) (0.250) (0.300) (0.163) (0.152) (0.251) (0.287)Fraction of the group that is female −0.150** 0.085 −0.150** 0.106 0.125 0.063 0.030 −0.027 0.123** −0.082* 0.171* −0.115
(0.071) (0.052) (0.075) (0.079) (0.083) (0.056) (0.096) (0.103) (0.056) (0.050) (0.094) (0.105)Average age across group −0.231*** −0.088 −0.125 −0.100 −0.001 0.096 0.178 0.225 0.146* 0.060 0.251** 0.192
(0.087) (0.078) (0.105) (0.117) (0.125) (0.078) (0.125) (0.174) (0.075) (0.071) (0.123) (0.170)Average years of formal education across group 0.232* 0.022 0.192 0.152 0.048 −0.018 −0.220 0.258 −0.153 −0.155 −0.315* −0.043
(0.120) (0.120) (0.144) (0.179) (0.162) (0.115) (0.166) (0.225) (0.106) (0.114) (0.163) (0.240)Fraction of group received instruction on pesticides 0.000 0.111 −0.154 −0.155 0.115 0.123 −0.191 −0.523* 0.190 −0.051 0.054 −0.344
(0.217) (0.120) (0.247) (0.205) (0.263) (0.109) (0.263) (0.286) (0.175) (0.121) (0.258) (0.256)Fraction of group aware of pesticide hazards 0.025 −0.031 −0.035 −0.145 −0.020 −0.142 −0.084 0.087 −0.062 0.111 −0.100 0.199
(0.077) (0.133) (0.087) (0.182) (0.098) (0.120) (0.116) (0.269) (0.068) (0.162) (0.109) (0.279)Average relationship across group −0.127* 0.115* −0.271*** −0.098 0.237** 0.076 0.146 −0.113 0.030 −0.105* 0.133 −0.204*
(0.073) (0.060) (0.092) (0.084) (0.093) (0.057) (0.132) (0.122) (0.054) (0.057) (0.109) (0.124)Constant −2.884*** 1.926* −2.222* −4.841*** −0.597 7.259*** −0.707 −2.787 1.474* −1.479 1.160 −3.847*
(1.003) (1.059) (1.215) (1.449) (1.161) (0.960) (1.364) (2.093) (0.807) (0.972) (1.337) (2.143)
Observations 3.744 3.936 3.744 3.936 3.744 3.936 3.744 3.936 3.744 3.936 3.744 3.936
*** p<0.01, ** p<0.05, * p<0.1. Standard errors (clustered at the group level) in parentheses. Results on village dummy variables are not reported here.
10
Environ.R
es.Lett.11(2016)114024
resulting in lower total net production than the case inwhich no subsidy is offered. In contrast, the Vietnamsample showed a tendency to coordinate and thepresence of a subsidy served as additional incentive toboost coordinated action. A natural next question is,why did the different samples behave so differently?Though our experiment was not designed to fullydisentangle behavioral causes, we discuss severalpossible causes.
One possibility is that the two samples were coa-ched differently by their enumerators. This is unlikelybecause the same experiment protocol was employedin both sites and all four enumerators (two ineach country) were trained by the authors directly.Even after controlling for the enumerator effectin the pooled Tobit regressions, the land usechoices made by each sample still differ significantlyon average. Nevertheless, it is possible that there aresome other influences induced by the enumeratorsthat are unobservable to us, which merits follow upresearch.
A second possibility is to attribute the findings tothe underlying behavioral differences in risk pre-ferences and coordination capacity. The two samplesdiffer in many socio-economic factors, including landownership, farming holding size, use of moderninputs (e.g., chemical fertilizers and pesticides),education, agricultural advisory support, etc (table 2),which may affect people’s attitude toward risk as wellas ability to coordinate. However, it should beacknowledged that there may well exist factors that areeither unobservable to researchers or beyond whathousehold survey or behavioral experiments were ableto capture. A better understanding of the institutional
environments in which people operate is alsowarranted.
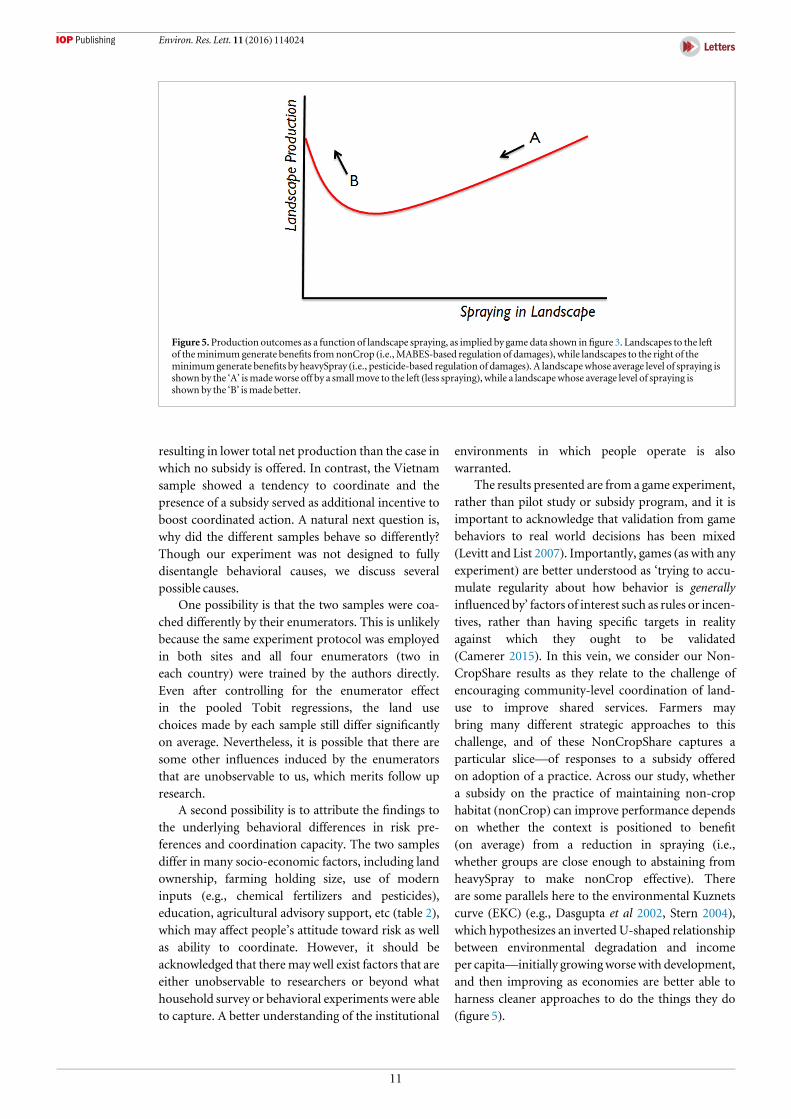
The results presented are from a game experiment,rather than pilot study or subsidy program, and it isimportant to acknowledge that validation from gamebehaviors to real world decisions has been mixed(Levitt and List 2007). Importantly, games (as with anyexperiment) are better understood as ‘trying to accu-mulate regularity about how behavior is generallyinfluenced by’ factors of interest such as rules or incen-tives, rather than having specific targets in realityagainst which they ought to be validated(Camerer 2015). In this vein, we consider our Non-CropShare results as they relate to the challenge ofencouraging community-level coordination of land-use to improve shared services. Farmers maybring many different strategic approaches to thischallenge, and of these NonCropShare captures aparticular slice—of responses to a subsidy offeredon adoption of a practice. Across our study, whethera subsidy on the practice of maintaining non-crophabitat (nonCrop) can improve performance dependson whether the context is positioned to benefit(on average) from a reduction in spraying (i.e.,whether groups are close enough to abstaining fromheavySpray to make nonCrop effective). Thereare some parallels here to the environmental Kuznetscurve (EKC) (e.g., Dasgupta et al 2002, Stern 2004),which hypothesizes an inverted U-shaped relationshipbetween environmental degradation and incomeper capita—initially growingworsewith development,and then improving as economies are better able toharness cleaner approaches to do the things they do(figure 5).
Figure 5.Production outcomes as a function of landscape spraying, as implied by game data shown in figure 3. Landscapes to the leftof theminimumgenerate benefits fromnonCrop (i.e.,MABES-based regulation of damages), while landscapes to the right of theminimumgenerate benefits by heavySpray (i.e., pesticide-based regulation of damages). A landscapewhose average level of spraying isshown by the ‘A’ ismadeworse off by a smallmove to the left (less spraying), while a landscapewhose average level of spraying isshown by the ‘B’ ismade better.
11
Environ. Res. Lett. 11 (2016) 114024
The opposing effects of the subsidy in the twocountries—encouraging attempts to coordinate (andgenerate nonCrop benefits) but only successfullyboosting total net production in one of them—high-light the very different contexts into which any realsubsidy program would be launched. The nature ofthis particular coordination problem—outlined in theU-shaped curve of both panels of figure 3, with non-Crop benefits dropping off sharply withheavy spraying—means that the same nudge thatimproves conditions in one region (e.g., landscape B infigure 5) could make things worse in another (e.g.,landscape A in figure 5). Production outcomes coulddecline, dealing a loss either to the subsidy provider(if it is continued) or passed along to the farmer(if it is not).
More broadly, our findings are an example of thechallenges of improving provision of a particular eco-system service (the control of crop damage from pestsvia natural enemies) while simultaneously discoura-ging the use of synthetic pesticides via the encourage-ment of a specific, measurable practice (themaintenance of natural enemy habitat). As in manysuch situations, more is often but not always better;the balance of nonCrop and cropland that maximizesbenefits is not obvious from the outset, nor is theappropriate level of encouragement to achieve it.Rather, this ‘appropriate encouragement’ appearsfromour data to be context specific (for our Cambodiasample, it appears not to be appropriate at all). Thereal-world variability in MABES provision that Non-CropShare omits—namely the complicated interplayamong pest and predator populations enabled bymore- and less-disturbed habitats in agricultural sys-tems—could reasonably obscure this appropriate bal-ance further.
On its own, this finding is not new—in reviewingUS experiences with market-based policy instrumentsincluding subsidies, Stavins (1998) concluded thatwhich instrument is best in any given situationdepends upon a variety of characteristics of the envir-onmental problem, and the social, political, and eco-nomic context in which it is being regulated. Similarly,Tscharntke et al (2005) suggested that subsidies andagri-environment incentives should better adapt tolandscape type, because management changes do nothave the same impact on biodiversity and ecosystemservices in different landscapes.
Our study identifies an additional twist to the chal-lenge of developing appropriate market-based instru-ments when the objective is to improve provision of anecosystem service whose supply is non-trivially linkedto a particular practice. ‘More’ of something is com-paratively easy to measure and incentivize, but in thecase of MABES provision, ‘more’ nonCrop is onlyhelpful to a degree, and then only when coordinatedcarefully with pesticide practice. Similarly in the
problem of managing sediment loading to surfacewaters in agricultural areas, not all ground cover con-tributes equally to managing the problem (Jacket al 2008); in the challenge of improving biodiversity,‘more’ habitat often matters only if it means greatercontiguity (e.g., Parkhurst et al 2002), among otherfeatures that support biodiversity. In these latter con-texts, there is a body of research examining spatialincentives whose value can change with location orproximity to other land-uses (e.g., Drechsler et al 2007,Parkhurst and Shogren 2007), but to date we are notaware of such approaches being applied at scale. Suchprograms in practice will suffer just as much as othersfrom the challenge of choosing appropriate incentivelevels, with the additional political challenge thataccrues when those incentives are heterogeneous (andthus one party might stand to gain more than his orher neighbor).
With global ecosystem services in decline, there isan increasing demand for payments for environ-mental services (PES) schemes, yet this work has onlyrecently begun to be documented comprehensively(Engel et al 2008). Recent work has suggested that pro-vision of ecosystem services that behave as publicgoods (such as biodiversity and in our case, MABES)can be improved using payments (Kemkes et al 2010).To the extent that games can provide a lens into real-world choices, our study adds an empirical qualifier tothis literature by highlighting a clear case where thePES incentive can have perverse effects—where thenature of the coordination problem is complex andnonlinear, farming systems (and possibly farmersthemselves) can be made worse off by being encour-aged to attempt it.
Acknowledgements
Thisworkwas undertakenwith financial support fromthe CGIAR Research Program on Water, Land, andEcosystems (WLE) and the CGIAR Research Programon Policies, Institutions, and Markets (PIM). Wegratefully acknowledge field support from Mr IvPhirun, Dr Keosothea Nou, Dr Leang Hak Khun, DrMai Van Trinh, and Dr Vu Dinh Tuan; as well asdesign input from Dr Wopke van der Werf and DrFelix Bianchi.
AppendixA.NonCropShare game sessionprotocol
Appendix A is available as online supplementarymaterial at stacks.iop.org/ERL/11/114024/mmedia.
12
Environ. Res. Lett. 11 (2016) 114024
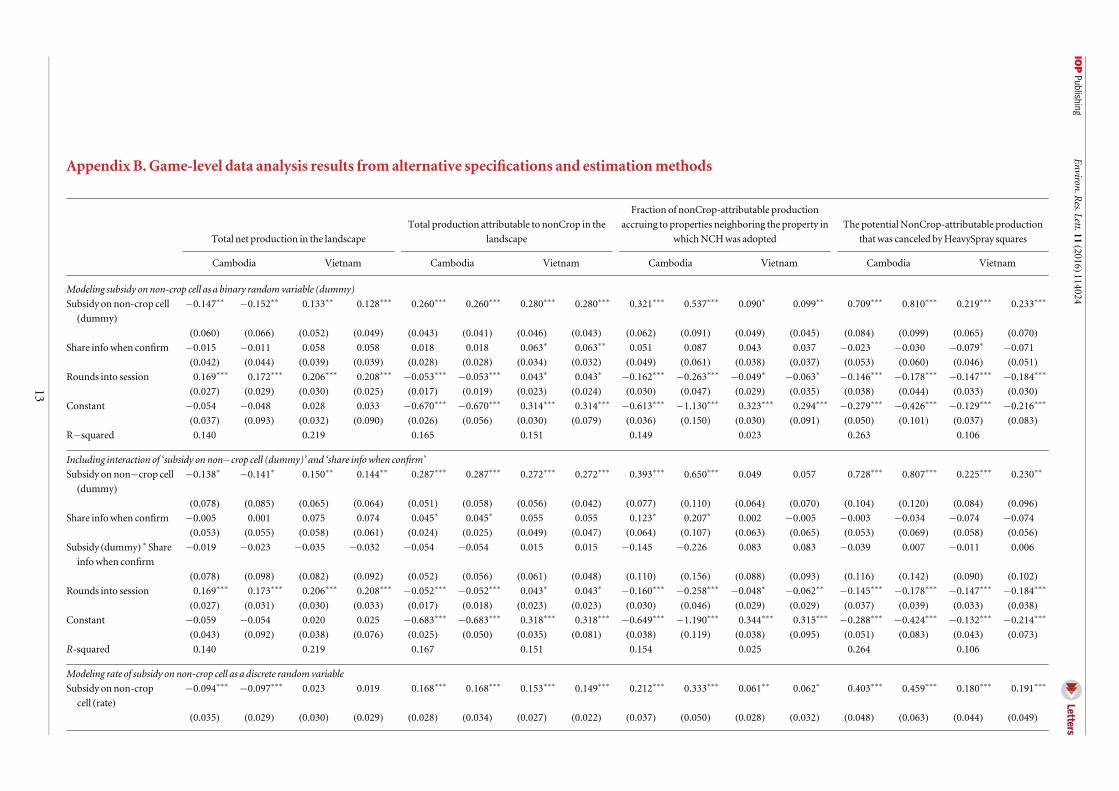
Appendix B.Game-level data analysis results fromalternative specifications and estimationmethods
Total net production in the landscape
Total production attributable to nonCrop in the
landscape
Fraction of nonCrop-attributable production
accruing to properties neighboring the property in
whichNCHwas adopted
The potential NonCrop-attributable production
that was canceled byHeavySpray squares
Cambodia Vietnam Cambodia Vietnam Cambodia Vietnam Cambodia Vietnam
Modeling subsidy on non-crop cell as a binary random variable (dummy)
Subsidy on non-crop cell
(dummy)−0.147** −0.152** 0.133** 0.128*** 0.260*** 0.260*** 0.280*** 0.280*** 0.321*** 0.537*** 0.090* 0.099** 0.709*** 0.810*** 0.219*** 0.233***
(0.060) (0.066) (0.052) (0.049) (0.043) (0.041) (0.046) (0.043) (0.062) (0.091) (0.049) (0.045) (0.084) (0.099) (0.065) (0.070)Share infowhen confirm −0.015 −0.011 0.058 0.058 0.018 0.018 0.063* 0.063** 0.051 0.087 0.043 0.037 −0.023 −0.030 −0.079* −0.071
(0.042) (0.044) (0.039) (0.039) (0.028) (0.028) (0.034) (0.032) (0.049) (0.061) (0.038) (0.037) (0.053) (0.060) (0.046) (0.051)Rounds into session 0.169*** 0.172*** 0.206*** 0.208*** −0.053*** −0.053*** 0.043* 0.043* −0.162*** −0.263*** −0.049* −0.063* −0.146*** −0.178*** −0.147*** −0.184***
(0.027) (0.029) (0.030) (0.025) (0.017) (0.019) (0.023) (0.024) (0.030) (0.047) (0.029) (0.035) (0.038) (0.044) (0.033) (0.030)Constant −0.054 −0.048 0.028 0.033 −0.670*** −0.670*** 0.314*** 0.314*** −0.613*** −1.130*** 0.323*** 0.294*** −0.279*** −0.426*** −0.129*** −0.216***
(0.037) (0.093) (0.032) (0.090) (0.026) (0.056) (0.030) (0.079) (0.036) (0.150) (0.030) (0.091) (0.050) (0.101) (0.037) (0.083)R−squared 0.140 0.219 0.165 0.151 0.149 0.023 0.263 0.106
Including interaction of ‘subsidy on non−crop cell (dummy)’ and ‘share info when confirm’
Subsidy on non−crop cell
(dummy)−0.138* −0.141* 0.150** 0.144** 0.287*** 0.287*** 0.272*** 0.272*** 0.393*** 0.650*** 0.049 0.057 0.728*** 0.807*** 0.225*** 0.230**
(0.078) (0.085) (0.065) (0.064) (0.051) (0.058) (0.056) (0.042) (0.077) (0.110) (0.064) (0.070) (0.104) (0.120) (0.084) (0.096)Share infowhen confirm −0.005 0.001 0.075 0.074 0.045* 0.045* 0.055 0.055 0.123* 0.207* 0.002 −0.005 −0.003 −0.034 −0.074 −0.074
(0.053) (0.055) (0.058) (0.061) (0.024) (0.025) (0.049) (0.047) (0.064) (0.107) (0.063) (0.065) (0.053) (0.069) (0.058) (0.056)Subsidy (dummy) * Shareinfowhen confirm
−0.019 −0.023 −0.035 −0.032 −0.054 −0.054 0.015 0.015 −0.145 −0.226 0.083 0.083 −0.039 0.007 −0.011 0.006
(0.078) (0.098) (0.082) (0.092) (0.052) (0.056) (0.061) (0.048) (0.110) (0.156) (0.088) (0.093) (0.116) (0.142) (0.090) (0.102)Rounds into session 0.169*** 0.173*** 0.206*** 0.208*** −0.052*** −0.052*** 0.043* 0.043* −0.160*** −0.258*** −0.048* −0.062** −0.145*** −0.178*** −0.147*** −0.184***
(0.027) (0.031) (0.030) (0.033) (0.017) (0.018) (0.023) (0.023) (0.030) (0.046) (0.029) (0.029) (0.037) (0.039) (0.033) (0.038)Constant −0.059 −0.054 0.020 0.025 −0.683*** −0.683*** 0.318*** 0.318*** −0.649*** −1.190*** 0.344*** 0.315*** −0.288*** −0.424*** −0.132*** −0.214***
(0.043) (0.092) (0.038) (0.076) (0.025) (0.050) (0.035) (0.081) (0.038) (0.119) (0.038) (0.095) (0.051) (0.083) (0.043) (0.073)R-squared 0.140 0.219 0.167 0.151 0.154 0.025 0.264 0.106
Modeling rate of subsidy on non-crop cell as a discrete random variable
Subsidy on non-crop
cell (rate)−0.094*** −0.097*** 0.023 0.019 0.168*** 0.168*** 0.153*** 0.149*** 0.212*** 0.333*** 0.061** 0.062* 0.403*** 0.459*** 0.180*** 0.191***
(0.035) (0.029) (0.030) (0.029) (0.028) (0.034) (0.027) (0.022) (0.037) (0.050) (0.028) (0.032) (0.048) (0.063) (0.044) (0.049)
13
Environ.R
es.Lett.11(2016)114024
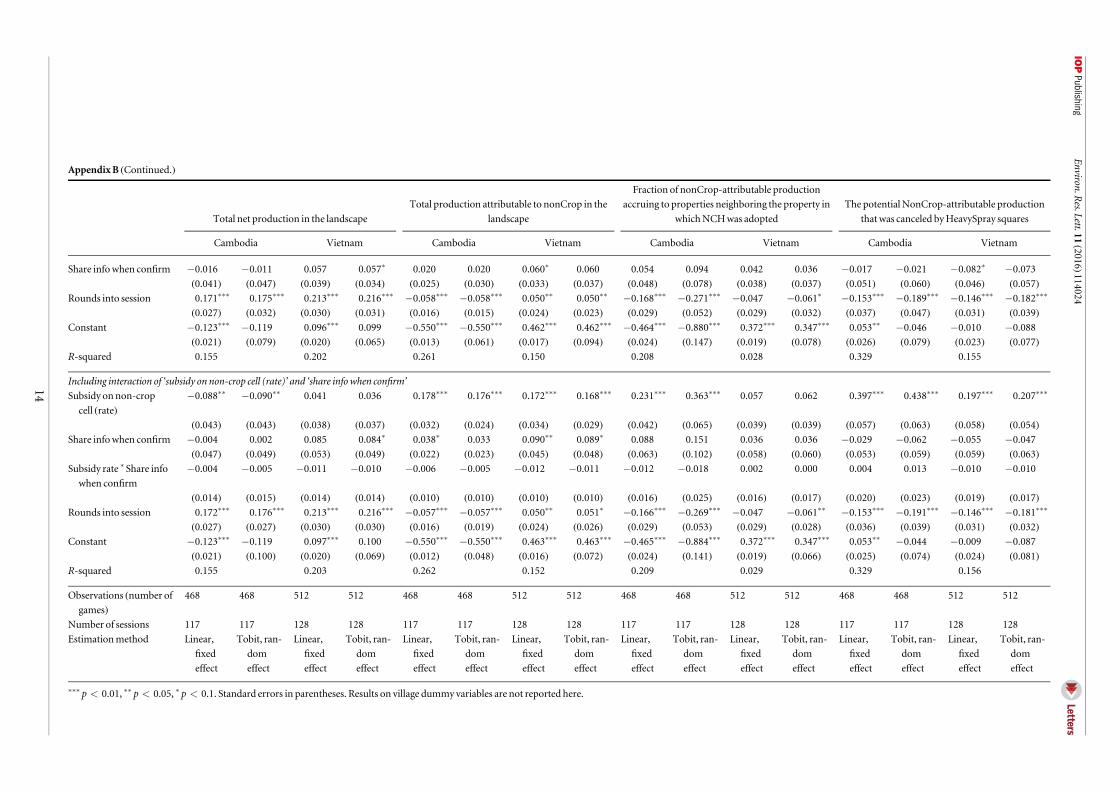
AppendixB (Continued.)
Total net production in the landscape
Total production attributable to nonCrop in the
landscape
Fraction of nonCrop-attributable production
accruing to properties neighboring the property in
whichNCHwas adopted
The potential NonCrop-attributable production
that was canceled byHeavySpray squares
Cambodia Vietnam Cambodia Vietnam Cambodia Vietnam Cambodia Vietnam
Share infowhen confirm −0.016 −0.011 0.057 0.057* 0.020 0.020 0.060* 0.060 0.054 0.094 0.042 0.036 −0.017 −0.021 −0.082* −0.073
(0.041) (0.047) (0.039) (0.034) (0.025) (0.030) (0.033) (0.037) (0.048) (0.078) (0.038) (0.037) (0.051) (0.060) (0.046) (0.057)Rounds into session 0.171*** 0.175*** 0.213*** 0.216*** −0.058*** −0.058*** 0.050** 0.050** −0.168*** −0.271*** −0.047 −0.061* −0.153*** −0.189*** −0.146*** −0.182***
(0.027) (0.032) (0.030) (0.031) (0.016) (0.015) (0.024) (0.023) (0.029) (0.052) (0.029) (0.032) (0.037) (0.047) (0.031) (0.039)Constant −0.123*** −0.119 0.096*** 0.099 −0.550*** −0.550*** 0.462*** 0.462*** −0.464*** −0.880*** 0.372*** 0.347*** 0.053** −0.046 −0.010 −0.088
(0.021) (0.079) (0.020) (0.065) (0.013) (0.061) (0.017) (0.094) (0.024) (0.147) (0.019) (0.078) (0.026) (0.079) (0.023) (0.077)R-squared 0.155 0.202 0.261 0.150 0.208 0.028 0.329 0.155
Including interaction of ‘subsidy on non-crop cell (rate)’ and ‘share info when confirm’
Subsidy on non-crop
cell (rate)−0.088** −0.090** 0.041 0.036 0.178*** 0.176*** 0.172*** 0.168*** 0.231*** 0.363*** 0.057 0.062 0.397*** 0.438*** 0.197*** 0.207***
(0.043) (0.043) (0.038) (0.037) (0.032) (0.024) (0.034) (0.029) (0.042) (0.065) (0.039) (0.039) (0.057) (0.063) (0.058) (0.054)Share infowhen confirm −0.004 0.002 0.085 0.084* 0.038* 0.033 0.090** 0.089* 0.088 0.151 0.036 0.036 −0.029 −0.062 −0.055 −0.047
(0.047) (0.049) (0.053) (0.049) (0.022) (0.023) (0.045) (0.048) (0.063) (0.102) (0.058) (0.060) (0.053) (0.059) (0.059) (0.063)Subsidy rate * Share info
when confirm
−0.004 −0.005 −0.011 −0.010 −0.006 −0.005 −0.012 −0.011 −0.012 −0.018 0.002 0.000 0.004 0.013 −0.010 −0.010
(0.014) (0.015) (0.014) (0.014) (0.010) (0.010) (0.010) (0.010) (0.016) (0.025) (0.016) (0.017) (0.020) (0.023) (0.019) (0.017)Rounds into session 0.172*** 0.176*** 0.213*** 0.216*** −0.057*** −0.057*** 0.050** 0.051* −0.166*** −0.269*** −0.047 −0.061** −0.153*** −0.191*** −0.146*** −0.181***
(0.027) (0.027) (0.030) (0.030) (0.016) (0.019) (0.024) (0.026) (0.029) (0.053) (0.029) (0.028) (0.036) (0.039) (0.031) (0.032)Constant −0.123*** −0.119 0.097*** 0.100 −0.550*** −0.550*** 0.463*** 0.463*** −0.465*** −0.884*** 0.372*** 0.347*** 0.053** −0.044 −0.009 −0.087
(0.021) (0.100) (0.020) (0.069) (0.012) (0.048) (0.016) (0.072) (0.024) (0.141) (0.019) (0.066) (0.025) (0.074) (0.024) (0.081)R-squared 0.155 0.203 0.262 0.152 0.209 0.029 0.329 0.156
Observations (number of
games)468 468 512 512 468 468 512 512 468 468 512 512 468 468 512 512
Number of sessions 117 117 128 128 117 117 128 128 117 117 128 128 117 117 128 128
Estimationmethod Linear,
fixed
effect
Tobit, ran-
dom
effect
Linear,
fixed
effect
Tobit, ran-
dom
effect
Linear,
fixed
effect
Tobit, ran-
dom
effect
Linear,
fixed
effect
Tobit, ran-
dom
effect
Linear,
fixed
effect
Tobit, ran-
dom
effect
Linear,
fixed
effect
Tobit, ran-
dom
effect
Linear,
fixed
effect
Tobit, ran-
dom
effect
Linear,
fixed
effect
Tobit, ran-
dom
effect
*** p<0.01, ** p<0.05, * p<0.1. Standard errors in parentheses. Results on village dummy variables are not reported here.
14
Environ.R
es.Lett.11(2016)114024
AppendixC. Land choices by game andcountry
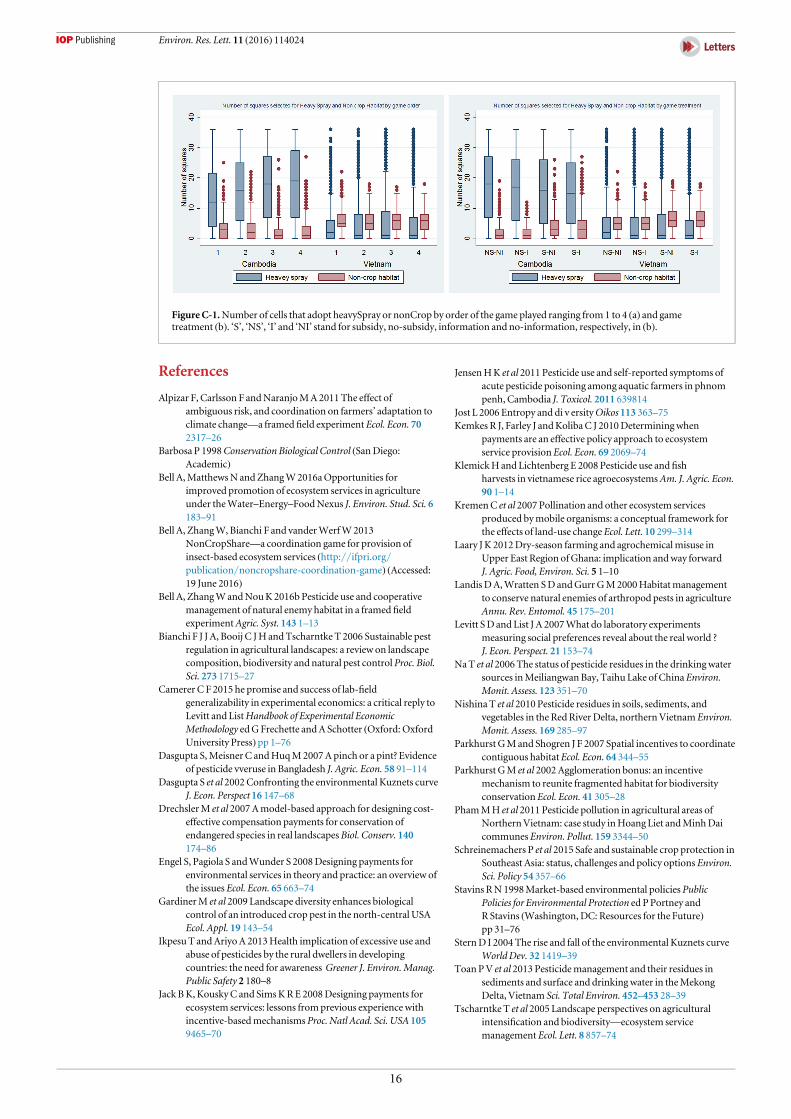
Participants of the two samples adopted sharplydifferent strategies, judging by the number of cells thatadopted heavySpray versus nonCrop (figure C-1).Overall, sessions in Cambodia on average madesignificantly more heavySpray choices (p<.000) and
less nonCrop choices (p< .000) than theirVietnamesecounterparts, regardless of the order of games played(figure C-1(a)) or game treatments (figure C-1(b)).Tellingly, participants in Cambodia adopted muchhigher number of heavySpray cells from the on-set ofthe session (i.e., games played in order 1 in figure C-1(a)), whereas the Vietnam sample showed a tendencyto coordinate from the beginning.
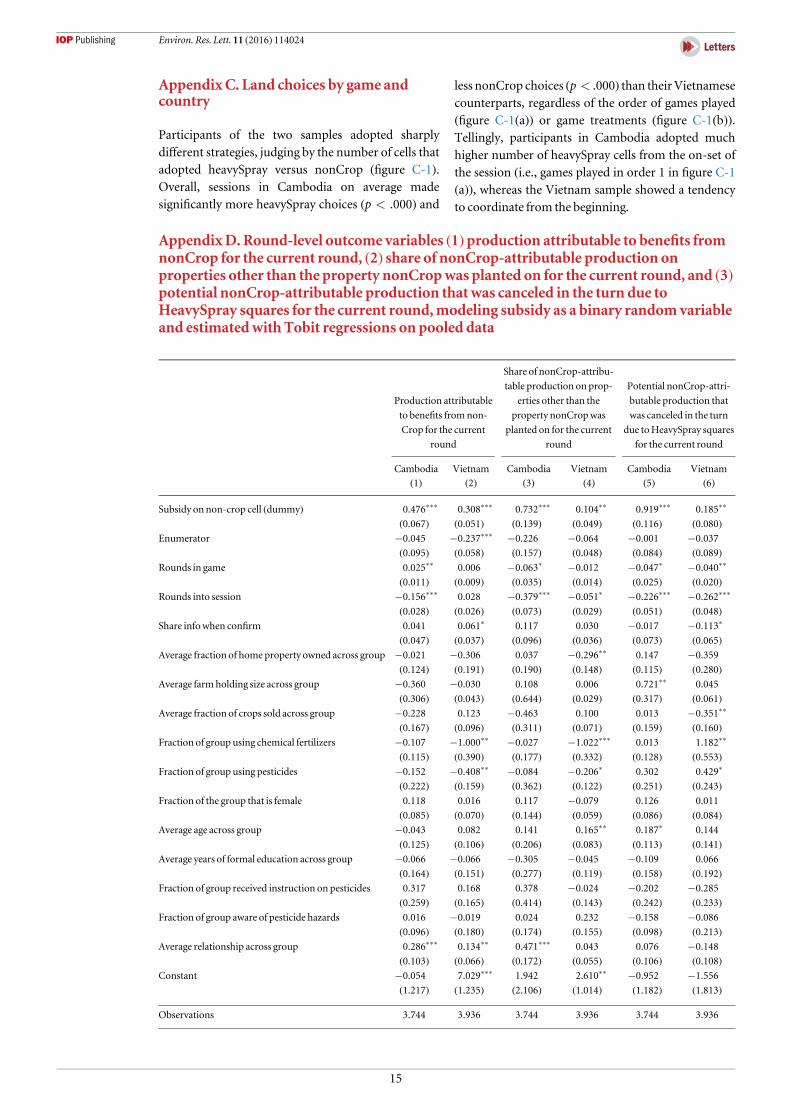
AppendixD. Round-level outcome variables (1)production attributable to benefits fromnonCrop for the current round, (2) share of nonCrop-attributable production onproperties other than the property nonCropwas planted on for the current round, and (3)potential nonCrop-attributable production thatwas canceled in the turn due toHeavySpray squares for the current round,modeling subsidy as a binary randomvariableand estimatedwith Tobit regressions on pooled data
Production attributable
to benefits fromnon-
Crop for the current
round
Share of nonCrop-attribu-
table production on prop-
erties other than the
property nonCropwas
planted on for the current
round
Potential nonCrop-attri-
butable production that
was canceled in the turn
due toHeavySpray squares
for the current round
Cambodia Vietnam Cambodia Vietnam Cambodia Vietnam
(1) (2) (3) (4) (5) (6)
Subsidy on non-crop cell (dummy) 0.476*** 0.308*** 0.732*** 0.104** 0.919*** 0.185**
(0.067) (0.051) (0.139) (0.049) (0.116) (0.080)Enumerator −0.045 −0.237*** −0.226 −0.064 −0.001 −0.037
(0.095) (0.058) (0.157) (0.048) (0.084) (0.089)Rounds in game 0.025** 0.006 −0.063* −0.012 −0.047* −0.040**
(0.011) (0.009) (0.035) (0.014) (0.025) (0.020)Rounds into session −0.156*** 0.028 −0.379*** −0.051* −0.226*** −0.262***
(0.028) (0.026) (0.073) (0.029) (0.051) (0.048)Share infowhen confirm 0.041 0.061* 0.117 0.030 −0.017 −0.113*
(0.047) (0.037) (0.096) (0.036) (0.073) (0.065)Average fraction of home property owned across group −0.021 −0.306 0.037 −0.296** 0.147 −0.359
(0.124) (0.191) (0.190) (0.148) (0.115) (0.280)Average farmholding size across group −0.360 −0.030 0.108 0.006 0.721** 0.045
(0.306) (0.043) (0.644) (0.029) (0.317) (0.061)Average fraction of crops sold across group −0.228 0.123 −0.463 0.100 0.013 −0.351**
(0.167) (0.096) (0.311) (0.071) (0.159) (0.160)Fraction of group using chemical fertilizers −0.107 −1.000** −0.027 −1.022*** 0.013 1.182**
(0.115) (0.390) (0.177) (0.332) (0.128) (0.553)Fraction of group using pesticides −0.152 −0.408** −0.084 −0.206* 0.302 0.429*
(0.222) (0.159) (0.362) (0.122) (0.251) (0.243)Fraction of the group that is female 0.118 0.016 0.117 −0.079 0.126 0.011
(0.085) (0.070) (0.144) (0.059) (0.086) (0.084)Average age across group −0.043 0.082 0.141 0.165** 0.187* 0.144
(0.125) (0.106) (0.206) (0.083) (0.113) (0.141)Average years of formal education across group −0.066 −0.066 −0.305 −0.045 −0.109 0.066
(0.164) (0.151) (0.277) (0.119) (0.158) (0.192)Fraction of group received instruction on pesticides 0.317 0.168 0.378 −0.024 −0.202 −0.285
(0.259) (0.165) (0.414) (0.143) (0.242) (0.233)Fraction of group aware of pesticide hazards 0.016 −0.019 0.024 0.232 −0.158 −0.086
(0.096) (0.180) (0.174) (0.155) (0.098) (0.213)Average relationship across group 0.286*** 0.134** 0.471*** 0.043 0.076 −0.148
(0.103) (0.066) (0.172) (0.055) (0.106) (0.108)Constant −0.054 7.029*** 1.942 2.610** −0.952 −1.556
(1.217) (1.235) (2.106) (1.014) (1.182) (1.813)
Observations 3.744 3.936 3.744 3.936 3.744 3.936
15
Environ. Res. Lett. 11 (2016) 114024
References
Alpizar F, Carlsson F andNaranjoMA2011The effect ofambiguous risk, and coordination on farmers’ adaptation toclimate change—a framed field experiment Ecol. Econ. 702317–26
Barbosa P 1998Conservation Biological Control (SanDiego:Academic)
Bell A,MatthewsN andZhangW2016aOpportunities forimproved promotion of ecosystem services in agricultureunder theWater–Energy–FoodNexus J. Environ. Stud. Sci. 6183–91
Bell A, ZhangW, Bianchi F and vanderWerfW2013NonCropShare—a coordination game for provision ofinsect-based ecosystem services (http://ifpri.org/publication/noncropshare-coordination-game) (Accessed:19 June 2016)
Bell A, ZhangWandNouK2016b Pesticide use and cooperativemanagement of natural enemy habitat in a framed fieldexperimentAgric. Syst. 143 1–13
Bianchi F J J A, Booij C JH andTscharntke T 2006 Sustainable pestregulation in agricultural landscapes: a review on landscapecomposition, biodiversity and natural pest controlProc. Biol.Sci. 273 1715–27
Camerer C F 2015 he promise and success of lab-fieldgeneralizability in experimental economics: a critical reply toLevitt and ListHandbook of Experimental EconomicMethodology edGFrechette andA Schotter (Oxford: OxfordUniversity Press) pp 1–76
Dasgupta S,MeisnerC andHuqM2007Apinch or a pint? Evidenceof pesticide vveruse in Bangladesh J. Agric. Econ. 58 91–114
Dasgupta S et al 2002Confronting the environmental Kuznets curveJ. Econ. Perspect 16 147–68
DrechslerM et al 2007Amodel-based approach for designing cost-effective compensation payments for conservation ofendangered species in real landscapesBiol. Conserv. 140174–86
Engel S, Pagiola S andWunder S 2008Designing payments forenvironmental services in theory and practice: an overview ofthe issues Ecol. Econ. 65 663–74
GardinerM et al 2009 Landscape diversity enhances biologicalcontrol of an introduced crop pest in the north-central USAEcol. Appl. 19 143–54
IkpesuT andAriyoA 2013Health implication of excessive use andabuse of pesticides by the rural dwellers in developingcountries: the need for awareness Greener J. Environ.Manag.Public Safety 2 180–8
Jack BK,KouskyC and SimsKRE 2008Designing payments forecosystem services: lessons fromprevious experience withincentive-basedmechanisms Proc. Natl Acad. Sci. USA 1059465–70
JensenHK et al 2011 Pesticide use and self-reported symptoms ofacute pesticide poisoning among aquatic farmers in phnompenh, Cambodia J. Toxicol. 2011 639814
Jost L 2006 Entropy and di v ersityOikos 113 363–75Kemkes R J, Farley J andKolibaC J 2010Determiningwhen
payments are an effective policy approach to ecosystemservice provisionEcol. Econ. 69 2069–74
KlemickH and Lichtenberg E 2008 Pesticide use and fishharvests in vietnamese rice agroecosystemsAm. J. Agric. Econ.90 1–14
KremenC et al 2007 Pollination and other ecosystem servicesproduced bymobile organisms: a conceptual framework forthe effects of land-use change Ecol. Lett. 10 299–314
Laary J K 2012Dry-season farming and agrochemicalmisuse inUpper East Region ofGhana: implication andway forwardJ. Agric. Food, Environ. Sci. 5 1–10
LandisDA,Wratten SD andGurrGM2000Habitatmanagementto conserve natural enemies of arthropod pests in agricultureAnnu. Rev. Entomol. 45 175–201
Levitt SD and List J A 2007What do laboratory experimentsmeasuring social preferences reveal about the real world ?J. Econ. Perspect. 21 153–74
NaT et al 2006The status of pesticide residues in the drinkingwatersources inMeiliangwanBay, Taihu Lake of ChinaEnviron.Monit. Assess. 123 351–70
Nishina T et al 2010 Pesticide residues in soils, sediments, andvegetables in the RedRiver Delta, northernVietnam Environ.Monit. Assess. 169 285–97
Parkhurst GMand Shogren J F 2007 Spatial incentives to coordinatecontiguous habitatEcol. Econ. 64 344–55
Parkhurst GM et al 2002Agglomeration bonus: an incentivemechanism to reunite fragmented habitat for biodiversityconservationEcol. Econ. 41 305–28
PhamMH et al 2011 Pesticide pollution in agricultural areas ofNorthernVietnam: case study inHoang Liet andMinhDaicommunesEnviron. Pollut. 159 3344–50
Schreinemachers P et al 2015 Safe and sustainable crop protection inSoutheast Asia: status, challenges and policy options Environ.Sci. Policy 54 357–66
Stavins RN1998Market-based environmental policies PublicPolicies for Environmental Protection ed PPortney andR Stavins (Washington, DC: Resources for the Future)pp 31–76
SternD I 2004The rise and fall of the environmental Kuznets curveWorldDev. 32 1419–39
ToanPV et al 2013 Pesticidemanagement and their residues insediments and surface and drinking water in theMekongDelta, Vietnam Sci. Total Environ. 452–453 28–39
Tscharntke T et al 2005 Landscape perspectives on agriculturalintensification and biodiversity—ecosystem servicemanagement Ecol. Lett. 8 857–74
FigureC-1.Number of cells that adopt heavySpray or nonCrop by order of the game played ranging from1 to 4 (a) and gametreatment (b). ‘S’, ‘NS’, ‘I’ and ‘NI’ stand for subsidy, no-subsidy, information and no-information, respectively, in (b).
16
Environ. Res. Lett. 11 (2016) 114024
VanHoi P,Mol AP J andOosterveer P JM2009Market governancefor safe food in developing countries: the case of low-pesticide vegetables inVietnam J. Environ.Manage.91 380–8
Woolridge J 2010Econometric Analysis of Cross section and PanelData 2nd edn (Cambridge,MA:MITUniversity Press)
XuR et al 2008 Factors contributing to overuse of pesticides inwesternChinaEnviron. Sci. 5 235–49
17
Environ. Res. Lett. 11 (2016) 114024