financial resource flows to agriculture a review of data on government spending, official...
TRANSCRIPT
Financial resource flows to agriculture A review of data on government spending, official development assistance and foreign direct investment
Sarah K. Lowder and Brian Carisma
ESA Working paper No. 11-19
December 2011
Agricultural Development Economics Division
Food and Agriculture Organization of the United Nations
www.fao.org/economic/esa

Financial resource flows to agriculture: A review of data on government expenditures, official development assistance and
foreign direct investment
Sarah K. Lowder and Brian Carisma 1
Abstract This paper reviews four international datasets and one regional dataset which allow us to consider the magnitude of and trends in government spending on, official development assistance (ODA) to and foreign direct investment (FDI) in agriculture, forestry and fishing and, in some cases, other relevant sectors. These datasets represent the most current and comprehensive data available on resource flows to agriculture. Two of the datasets have not yet been made freely available to the public. Although the existing data do not permit consideration of several important issues, they do allow us to better understand trends in resource flows to agriculture and we are able to draw some conclusions including the following. Spending on agriculture is mainly financed through domestic sources of finance (levels of government spending are larger than ODA and FDI). For developing countries as a whole, the three types of spending on agriculture (total levels and levels per population working in agriculture) have increased. Although increases have been recorded for FDI, we find some evidence that FDI may have increased less than previously claimed. Trends in indicators of government spending on, ODA to and FDI in agriculture are discouraging for Sub-Saharan Africa. The paper concludes with suggestions of areas for future research. JEL Codes: F35, F21, O19, Q14 and Q18 Keywords: Agricultural finance, government expenditures on agriculture, official development assistance to agriculture and foreign direct investment in agriculture
1 Sarah K. Lowder and Brian Carisma are with the Agricultural Development Economics Division of the Food and Agriculture Organization of the United Nations. For any questions or comments, please contact [email protected]. The views presented in this paper are those of the authors and do not necessarily represent the official view of FAO or its member countries.

Acknowledgements This paper was prepared as background material for The State of Food and Agriculture 2012 which will be devoted to Investment in Agriculture. The authors are grateful for the provision of datasets by the Financial Times, IFPRI, IMF, OECD, ReSAKKS and UNCTAD. Several individuals provided comments and answered questions regarding datasets during the preparation of this document. In particular, the authors wish to thank Nienke Beintema, Sam Benin, Sangeetha Malaiyandi, Tewodaj Mogues, Gert-Jan Stads, and Bingxin Yu (IFPRI), Yasmin Ahmad, Joanna Komorowoska and Nicol William (OECD), Masataka Fujita (UNCTAD), Gustavo Anríquez, Jean Balié, Dominic Ballayan, Andre Croppenstedt, Carola Fabi, Ilio Fornasero, Amanda Gordon, Massimo Iafrate, Suffyan Koroma , Pascal Liu, Ira Matuschke, Robert Mayo, Masahiro Miyazako, Terri Raney, Jakob Skoet, Saifullah Syed, and Keith Wiebe (FAO). Finally, particularly useful assistance was provided by Lauren Edwards and Tiantian Zha (Princeton University) who helped with initial analysis of data.

Contents I. Introduction and relative importance of different types of spending on and investment in agriculture ......................................................................................................... 5
II. Domestic government spending on agriculture ............................................................. 8
A. IFPRI Statistics of Public Expenditure for Economic Development database ........ 8
B. ReSAKSS estimates of the agricultural share of government spending in African countries. .......................................................................................................................... 16
C. Comparison among different estimates of the agricultural share of government spending ........................................................................................................................... 18
III. Official Development Assistance to Agriculture ......................................................... 20
A. The OECD Creditor Reporting System on Official Development Assistance ...... 21
IV. Foreign Direct Investment ............................................................................................. 29
A. UNCTAD data on Foreign direct investment ........................................................ 29
B. Financial Times FDI Market Online Database ...................................................... 33
V. Key Messages and Research Needs ............................................................................... 37
References ............................................................................................................................... 38
Abbreviations and Acronyms AOI - Agricultural Orientation Index CAADP - Comprehensive Africa Agriculture Development Programme CGIAR - Consultative Group on International Agricultural Research EAP - East Asia and the Pacific ECA - Europe and Central Asia FDI - Foreign Direct Investment IFPRI - International Food Policy Research Institute IMF - International Monetary Fund LAC - Latin America and the Caribbean MENA - Middle East and North Africa NEPAD - New Partnership for Africa's Development ODA - Official Development Assistance OECD - Organization for Economic Cooperation and Development ReSAKSS - Regional Strategic Analysis and Knowledge Support System SPEED - Statistics of Public Expenditure for Economic Development SSA - Sub-Saharan Africa UNCTAD - United Nations Conference on Trade and Development
I. Introduction and relative importance of different types of spending on and investment in agriculture
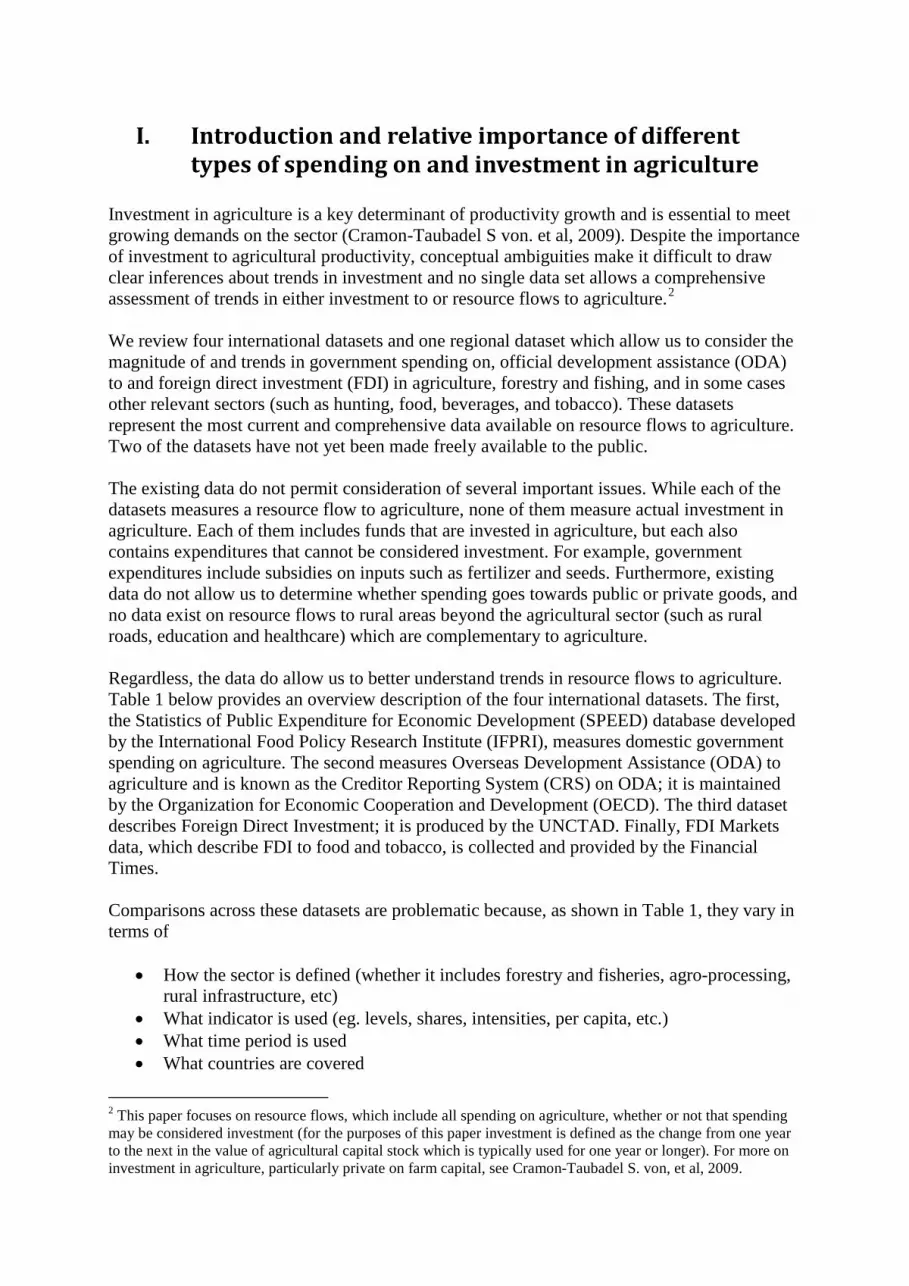
Investment in agriculture is a key determinant of productivity growth and is essential to meet growing demands on the sector (Cramon-Taubadel S von. et al, 2009). Despite the importance of investment to agricultural productivity, conceptual ambiguities make it difficult to draw clear inferences about trends in investment and no single data set allows a comprehensive assessment of trends in either investment to or resource flows to agriculture.2 We review four international datasets and one regional dataset which allow us to consider the magnitude of and trends in government spending on, official development assistance (ODA) to and foreign direct investment (FDI) in agriculture, forestry and fishing, and in some cases other relevant sectors (such as hunting, food, beverages, and tobacco). These datasets represent the most current and comprehensive data available on resource flows to agriculture. Two of the datasets have not yet been made freely available to the public. The existing data do not permit consideration of several important issues. While each of the datasets measures a resource flow to agriculture, none of them measure actual investment in agriculture. Each of them includes funds that are invested in agriculture, but each also contains expenditures that cannot be considered investment. For example, government expenditures include subsidies on inputs such as fertilizer and seeds. Furthermore, existing data do not allow us to determine whether spending goes towards public or private goods, and no data exist on resource flows to rural areas beyond the agricultural sector (such as rural roads, education and healthcare) which are complementary to agriculture. Regardless, the data do allow us to better understand trends in resource flows to agriculture. Table 1 below provides an overview description of the four international datasets. The first, the Statistics of Public Expenditure for Economic Development (SPEED) database developed by the International Food Policy Research Institute (IFPRI), measures domestic government spending on agriculture. The second measures Overseas Development Assistance (ODA) to agriculture and is known as the Creditor Reporting System (CRS) on ODA; it is maintained by the Organization for Economic Cooperation and Development (OECD). The third dataset describes Foreign Direct Investment; it is produced by the UNCTAD. Finally, FDI Markets data, which describe FDI to food and tobacco, is collected and provided by the Financial Times. Comparisons across these datasets are problematic because, as shown in Table 1, they vary in terms of
• How the sector is defined (whether it includes forestry and fisheries, agro-processing, rural infrastructure, etc)
• What indicator is used (eg. levels, shares, intensities, per capita, etc.) • What time period is used • What countries are covered
2 This paper focuses on resource flows, which include all spending on agriculture, whether or not that spending may be considered investment (for the purposes of this paper investment is defined as the change from one year to the next in the value of agricultural capital stock which is typically used for one year or longer). For more on investment in agriculture, particularly private on farm capital, see Cramon-Taubadel S. von, et al, 2009.
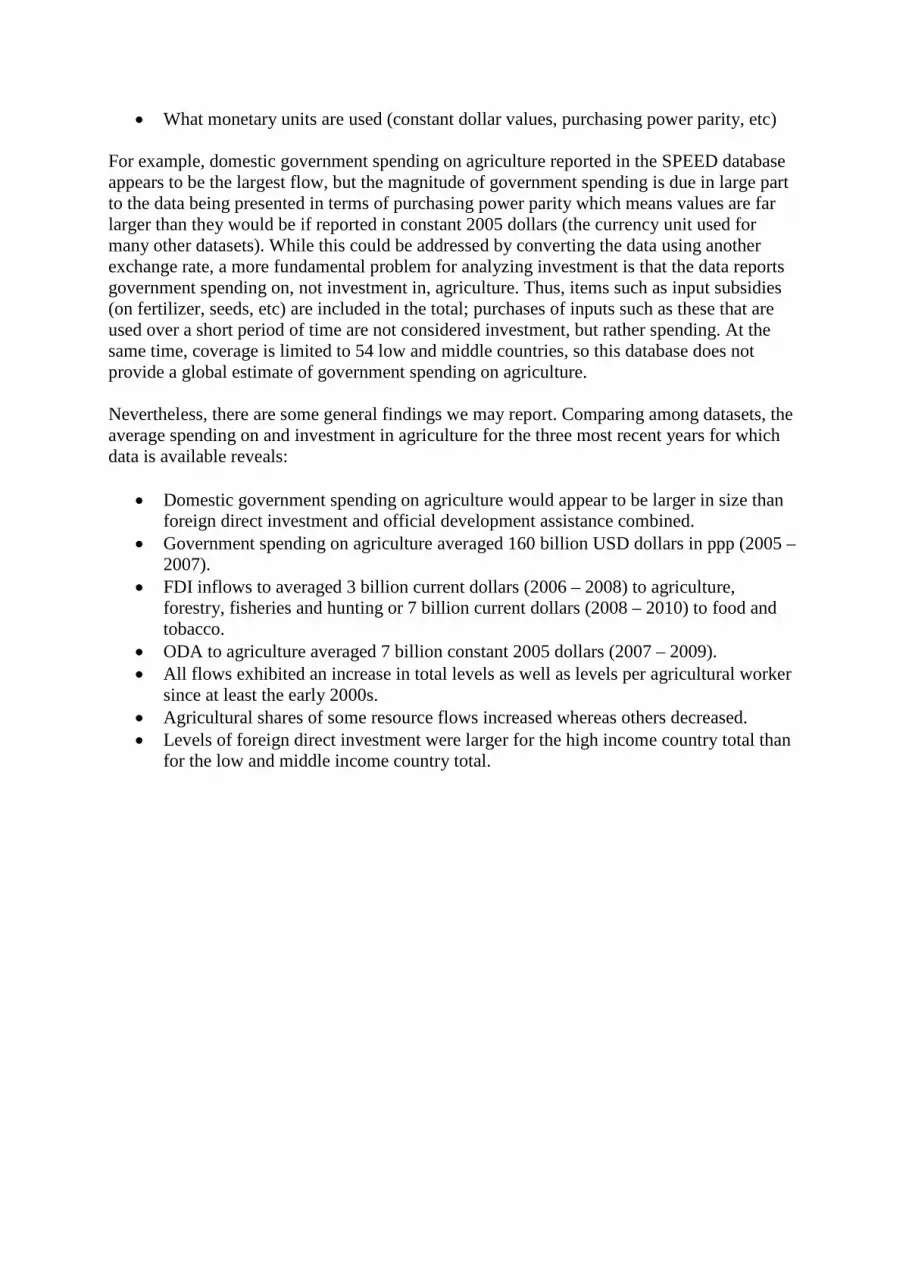
• What monetary units are used (constant dollar values, purchasing power parity, etc) For example, domestic government spending on agriculture reported in the SPEED database appears to be the largest flow, but the magnitude of government spending is due in large part to the data being presented in terms of purchasing power parity which means values are far larger than they would be if reported in constant 2005 dollars (the currency unit used for many other datasets). While this could be addressed by converting the data using another exchange rate, a more fundamental problem for analyzing investment is that the data reports government spending on, not investment in, agriculture. Thus, items such as input subsidies (on fertilizer, seeds, etc) are included in the total; purchases of inputs such as these that are used over a short period of time are not considered investment, but rather spending. At the same time, coverage is limited to 54 low and middle countries, so this database does not provide a global estimate of government spending on agriculture. Nevertheless, there are some general findings we may report. Comparing among datasets, the average spending on and investment in agriculture for the three most recent years for which data is available reveals:
• Domestic government spending on agriculture would appear to be larger in size than foreign direct investment and official development assistance combined.
• Government spending on agriculture averaged 160 billion USD dollars in ppp (2005 – 2007).
• FDI inflows to averaged 3 billion current dollars (2006 – 2008) to agriculture, forestry, fisheries and hunting or 7 billion current dollars (2008 – 2010) to food and tobacco.
• ODA to agriculture averaged 7 billion constant 2005 dollars (2007 – 2009). • All flows exhibited an increase in total levels as well as levels per agricultural worker
since at least the early 2000s. • Agricultural shares of some resource flows increased whereas others decreased. • Levels of foreign direct investment were larger for the high income country total than
for the low and middle income country total.

Table 1: Comparison among key international datasets on foreign, domestic, private and public spending on agriculture
Domestic Foreign Public Private
Government Expenditures
Official Development Assistance (ODA)
Foreign Direct Investment
IFPRI SPEED OECD CRS UNCTAD Financial Times FDI Markets
Average annual amount low & middle income 160 billion (2005 - 2007) 7 billion (2007 - 2009) 3 billion (2006 - 2008) 7 billion (2008 - 2010) high income countries 28 billion (2005-2007) na 1.5 billion (2006 - 2008) 10 billion (2008 - 2010) Global trend levels Increased from 1980 to
2007. At peak in 1980s; decreased during 90s & increased in recent years. Remains lower than in the 80s.
Increased from 1990 to 2007; largely as result of increase in number of countries reporting.
Increase from 2003 - 2011.
shares Decreased from 1980 to 2007.
Same as above. Increased from 1990 -
2008. Increased from 2003 - Q1 &
Q2 2011. per economically active in agriculture
Increased from 1980 to 2007.
agricultural orientation index
Neither increased not decreased
Decreased since 1980s
Definition of sector Agriculture, forestry & fisheries
Agriculture, forestry & fisheries
Agriculture, Forestry, Fisheries & Hunting
Primary agriculture as well as food processing and business services.
Time span 1980 - 2007 1973 - 2009 1990 - 2008 2003 - 2010 Country coverage low & middle income 54 153 50 in most recent years 35 - 55 destination
countries high income countries 13 na 36 in most recent years 25 - 35 destination
countries Monetary units Constant 2005 dollars, PPP Constant 2005 dollars Current US Dollars Current US Dollars

The following describes these data in detail.
II. Domestic government spending on agriculture Information regarding government expenditures on agriculture in the developing world is limited despite the recognition that such spending is crucial for economic growth and poverty reduction in developing countries. No international dataset provides information on the extent to which spending on social services and on other sectors is rural. A database providing such information for multiple countries would be very useful. The International Monetary Fund has traditionally been the source for information on government spending by sector, however IMF data is of limited use for comparative analysis because it is measured in national currency and because it is an unbalanced panel (some countries are missing observations in some years) (IMF, 2009). IFPRI has undertaken work to convert IMF data to dollar values which are comparable across countries and supplemented it with country level sources as appropriate. Such work has shown that levels of total3 spending on agriculture have increased globally from 1980 to 2002, particularly as a result of growth in Asia and Africa, whereas agricultural spending decreased in Latin America and the Caribbean over the same time period. Worldwide, government spending on agriculture per rural population likewise increased over that period (Fan, 2008). As a share of total government spending, government spending on agriculture has shown a different trend; Fan and other sources explain that the agricultural share of government spending exhibits stagnation in more recent years and is far lower than the shares observed in the 1980s and early 1990s. Shares tend to be smaller in developing countries (less than 10% usually) and higher in developed countries (greater than 20%) (Fan, 2008; World Bank, 2007). Most recently IFPRI has compiled and released the Statistics of Public Expenditure for Economic Development (SPEED) database which provides more current information on public spending on agriculture. A general description of the data as well as levels and trends in the data follow.
A. IFPRI Statistics of Public Expenditure for Economic Development database
SPEED was compiled primarily using the IMF Government Financial Statistics Yearbook, supplemented with information from country publications from the IMF, Public Expenditure Reviews by the World Bank and Country publications from various government agencies. The database provides observations for every year for each country, thus it is, with the exception of some newly formed countries, a balanced panel dataset. It also provides information not only in national currency but also in comparable monetary units so that regional averages may be reported.
3 It is important to note that totals do not refer to global totals, but rather totals for all countries for which data is available.
9
SPEED provides levels of government spending for seven sectors which correspond to those used by the IMF. They are agriculture (including forestry, fishing and hunting), defense, education, health, social protection, transportation and communication and others. The agricultural sector includes, in so far as possible, the categories considered by the IMF. These are:
• Administration of agricultural affairs and services • Conservation, reclamation or expansion of arable land • Agrarian reform and land settlement • Supervision and regulation of the agricultural industry • Construction or operation of flood control, irrigation and drainage systems, including
grants, loans or subsidies for such works • Operation or support of programs or schemes to stabilize or improve farm prices and
farm incomes • Operation or support of extension services or veterinary services to farmers, pest
control services, crop inspection services and crop grading services • Production and dissemination of general information, technical documentation and
statistics on agricultural affairs and services • Compensation, grants, loans or subsidies to farmers in connection with agricultural
activities, including payments for restricting or encouraging output of a particular crop or for allowing land to remain uncultivated
(IMF, 2002) Development projects and programmes that serve multiple purposes, including agricultural development, are excluded from the definition of the agricultural sector. The database covers 67 countries4; 13 of these are High income Non-OECD countries and 54 are classified as low or middle income countries. Among the low and middle income countries, 15 are in Asia, 9 in ECA, 11 in LAC, 7 in MENA and 12 in Sub-Saharan Africa. In the years 2000 and 2007 the total population of the countries included in the database represented 82% of the population of the developing world, with 92% of the population of Asia and the Pacific represented, 76% of ECA, 68% of Latin America and the Caribbean and only 50% of Africa’s population represented. Countries were included based on the availability of a minimum amount of information on government expenditures. The data span the years 1980 to 2007, with the exception, of course, of some countries in ECA for which data is only available from 1995 to 2007. The database reports expenditures in various monetary units. For our analysis we use 2005 international dollars in PPP. Overview Trends may be summarized as follows:
• Levels of total government spending (all sectors and 67 countries) have increased from 1980 to 2007.
• Levels of spending on agriculture have increased from 1980 to 2007. 4 Unless otherwise noted, the country classifications used in this paper are those established by the World Bank; they are presented in the Annex.

• The share of total expenditure going to agriculture has declined globally; this is true for all regions except ECA.
• Spending on agriculture per agricultural population5 has increased in all regions except Latin America and the Caribbean and Sub-Saharan Africa.
• There is a wide intra-regional variation in government expenditures on agriculture per capita working in agriculture.
• The Agricultural Orientation Index for government spending has neither shown a clear increasing nor decreasing trend with the exception of SSA and LAC where it has decreased.
• Trends in government spending for countries in Sub-Saharan Africa are discouraging. A more detailed discussion of the trends follows. Levels of total government spending (all sectors and 67 countries) have increased from 1980 to 2007 Figure 1 shows that total government expenditures on all sectors by all 67 countries included in the database were about 4.8 trillion in the year 2007. All sectors examined experienced growth in spending, particularly the other category and social protection and health. In recent years most of the spending went to the other category which includes mining, manufacturing and construction, fuel and energy, general administration, etc. Government spending was also allocated to the following, listed in decreasing order of magnitude: education, social protection, defense, health, agriculture and infrastructure (transportation and communication). Figure 1: Public expenditures by sector, 1980 – 2007
Source: Authors’calculations using IFPRI, 2010.
5 Agricultural population is used in this paper to refer to the population economically active in agriculture.
-
2
4
6
8
10
-
1 000
2 000
3 000
4 000
5 000
1980 1983 1986 1989 1992 1995 1998 2001 2004 2007
Billi
on d
olla
rs U
SD 2
005
PPP
Other Defense Education Social protection Agriculture Health Transportation and communication % Agriculture to total spending
Agr
i sha
re t
o pu
blic
spe
ndin
g (P
erce
nt)

11
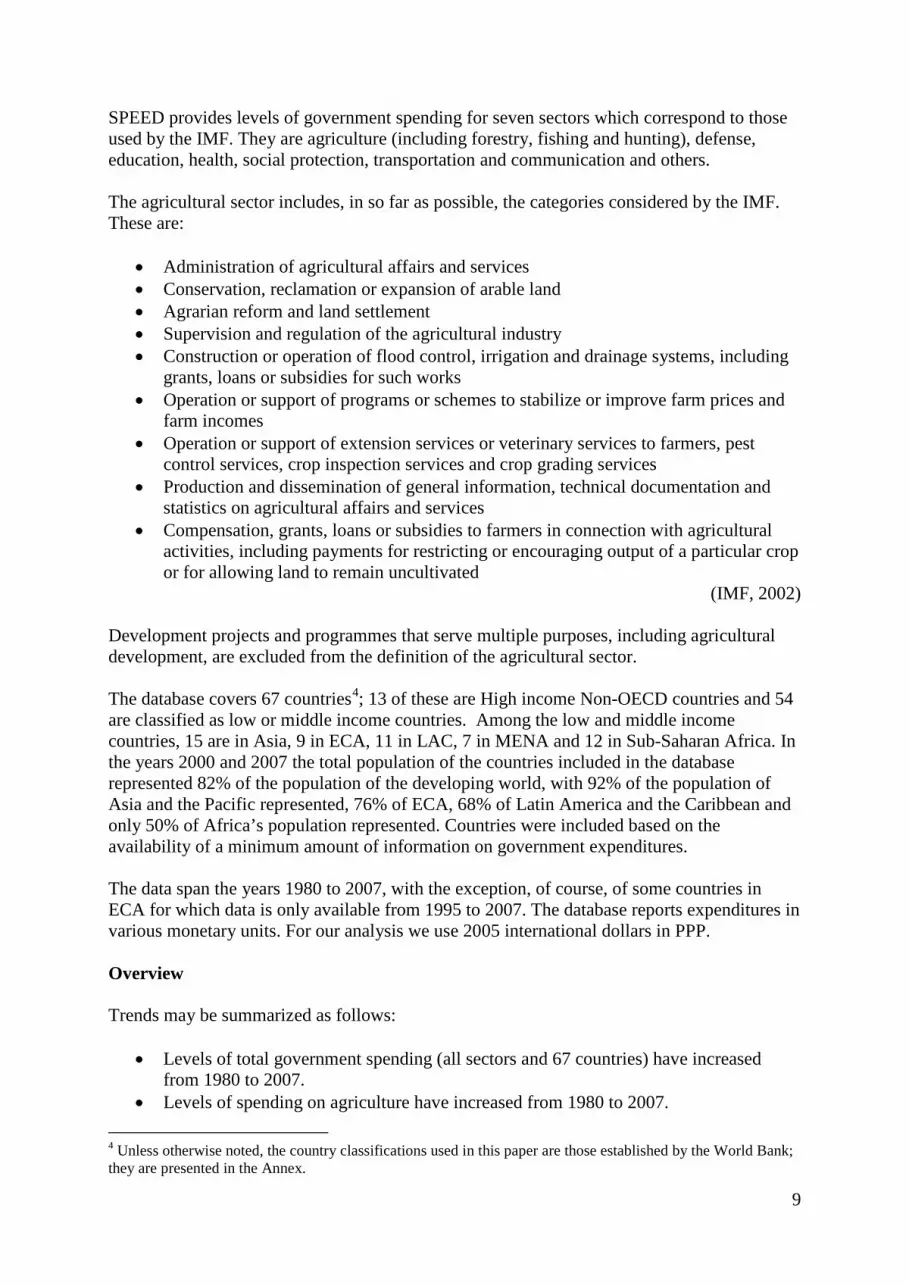
Levels of spending on agriculture have increased from 1980 to 2007 Levels of expenditures on agriculture (for all countries included in SPEED whether low, middle or high income) have increased from 55 billion in 1980 to 205 billion (Figure 2a). The majority of spending on agriculture (60% in recent years) and most of the increase in levels of spending on agriculture (as well as other sectors) is attributable to increased spending by countries located in Asia. Most of the spending by Asian countries was that of China, where spending on agriculture increased dramatically over the time period and in recent years has represented 70% of the expenditures made by the 15 Asian countries included in the sample (Figures 2a and 2b). Spending on agriculture likewise increased in South Asia excluding and including India, but did not increase until after 2003 in countries of East Asia and the Pacific, excluding China. Increases in total levels of spending on agriculture are, to a minor extent, attributable to the addition of Eastern European countries to the database in 1995. The regions of Sub-Saharan Africa and Latin America and the Caribbean have experienced only minor increases in levels spent on agriculture. A few high income countries are included in the database. Total spending on agriculture for those countries is shown in Figure 2a. Because the total is small and the countries are not representative of high income countries as a whole, the remainder of our analysis focuses on the 54 countries included in SPEED which fall in the World Bank’s low and middle income country categories. The share of total expenditure going to agriculture has decreased in all regions except Europe and Central Asia Expenditures on agriculture as a share of total public expenditure have decreased in all regions except ECA from 1980 to 2007; this is due to increases in the total amounts of spending allocated for health, social protection and education exceeding those of spending on agriculture. From 2004 to 2007 the shares have been highest in Asia, followed by Sub-Saharan Africa, MENA, ECA and finally Latin America and the Caribbean (Figure 2c). In countries of Sub-Saharan Africa the share was about 3 – 6% in most recent years (2003 to 2007); it increased substantially from 2004 – 2005 and decreased slightly from 2005 – 2007. Regardless, it was only during the 1980s that the share was close to the target of 10% to which African Governments agreed in 2003 through the signing of the Maputo Declaration. Spending on agriculture per agricultural population has increased in all regions except Latin America and the Caribbean and Sub-Saharan Africa Spending on agriculture per agricultural population in the 54 countries increased from about 70 to 160 dollars per person from 1980 to 2007 (Figure 3a). The levels of spending per population working in agriculture were highest and increasing for ECA and MENA. The next largest was seen in LAC followed by Asia. The amounts were lowest in Sub-Saharan Africa. The amounts increased in all regions except LAC and Sub-Saharan Africa. In LAC per capita amounts were already quite high, so that a decrease may even have been optimal, but in the 12 Sub-Saharan African countries they have always been quite low so that a decrease over the period may have been quite problematic. In Sub-Saharan Africa they did not show a clear increasing or decreasing trend from 1980 to 2007 and they even declined

from 2005 to 2007. This is, of course, due to population growth being rapid and increases in spending being relatively slow. The increase in spending on agriculture per agricultural capita in Asia appears rapid in large part due to the trend in China (increases in spending on agriculture coupled with relatively slow population growth and migration from rural to urban areas). The region’s low level of per capita spending on agriculture largely reflects the fact that Asia is highly populous and much of its agriculture is, by nature, labor intensive (Figure 3b). There is a wide intra-regional variation in government expenditures on agriculture per capita working in agriculture There is a large degree of variation among countries in terms of the amount spent on agriculture divided by the population active in agriculture. In most cases less developed nations have more agricultural populations and smaller budgets for public spending; therefore they spend less on agriculture per agricultural capita than do more affluent countries. Furthermore, sparsely populated countries such as island states appear to have spent a large amount per capita even if their budget for agriculture is quite small. As such, the countries with the largest per capita spending on agriculture include the more affluent nations and a few island states covered by the database (eg. European countries, the Republic of Korea, Singapore, Middle Eastern countries such as Kuwait and Bahrain as well as a few less affluent island states). Most countries among those experiencing the fastest rates of growth in this measure (from 2001 – 2007) are located in developing Europe; exceptions include Pakistan, Ethiopia, the Maldives and Costa Rica. The countries spending the least on agriculture per population working in agriculture tend to be the countries in the lower levels of economic development; many but not all of them are located in Sub Saharan Africa. Those experiencing the sharpest decline from 2001 to 2007 in spending on agriculture per agricultural capita are representative of all regions considered and four of them are located in Africa. The most dramatic decline was exhibited by Zimbabwe where the measure has declined by 1% annually from 2000 to 2007; of course data for that country may be unreliable or atypical due to its situation. The Agricultural Orientation Index for government spending is lowest in SSA and South Asia; it has decreased in SSA and LAC The Agricultural Orientation Index (AOI) for government spending is calculated as the agricultural share of government spending divided by the agricultural share of GDP. An AOI less than one indicates that government spending on agriculture represents smaller share of total government spending than agriculture represents in the total economy. As shown in Figure 3c, the average AOI for government spending in low and middle income countries has been a little over 0.4 globally over the period. It was less than one in all regions and years, with the exception of LAC in the early 1980s, and of EAP excluding China in 1994. Historically it was highest in LAC, although since 2004 it has been largest in Asia (reflecting a high AOI in China), followed by LAC and ECA, MENA and finally it is by far the lowest in SSA. Values for Asia excluding China are quite low, especially in South Asia excluding India (Figure 3d). It has decreased in SSA and LAC; in all other regions it has shown no clear increasing nor decreasing trend.

13
Trends in government spending for countries in Sub-Saharan Africa indicate that in that region government budgets have afforded less priority to agriculture than have governments of other regions Trends for the 12 countries in Sub-Saharan Africa differ from those observed for low and middle income countries as a whole. They are discouraging in that they indicate a failure of government budgets to prioritize agriculture
• Levels spent have only increased slightly; this differs from the significant increases seen in other regions.
• Spending on agriculture per person active in agriculture has decreased (as opposed to the increase observed for the 54 country average).
• Shares of spending going to agriculture have decreased substantially from the 1980s when they were among the highest observed in the 54 low and middle income countries.
• The agricultural shares of government spending in African countries have always been smaller than 10% (except in the year 1986) and, since 2005, the share for that region has, in fact, decreased.
• The AOI of government spending for Sub-Saharan Africa has decreased dramatically over the time period 1980 to 2007.
This lack of emphasis on agriculture in African countries seems inconsistent with the recognition of the importance of government spending on agriculture by African Heads of State as evidenced by their joint signing of the Maputo Declaration in 2003. We explore this further in the following section.
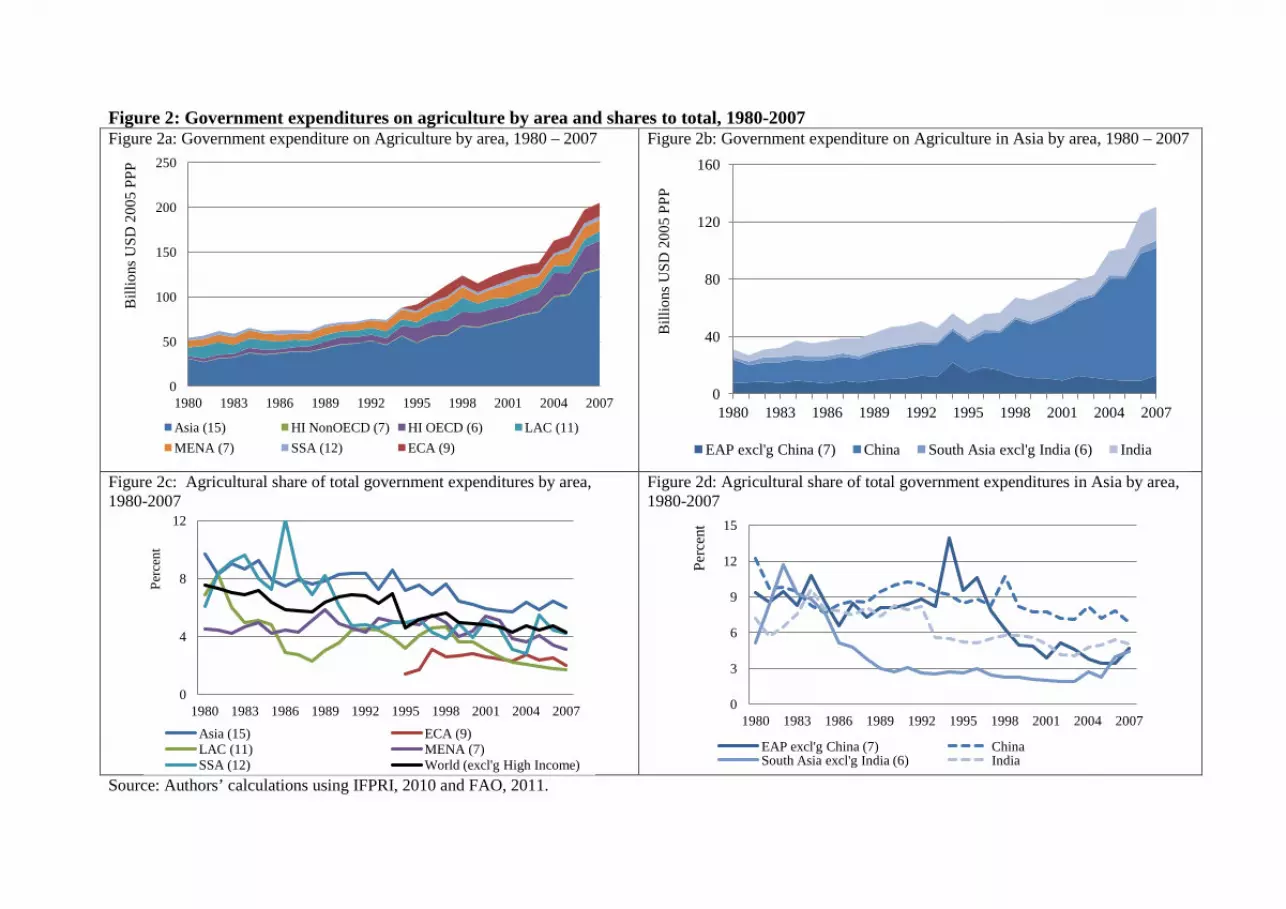
Figure 2: Government expenditures on agriculture by area and shares to total, 1980-2007 Figure 2a: Government expenditure on Agriculture by area, 1980 – 2007
Figure 2b: Government expenditure on Agriculture in Asia by area, 1980 – 2007
Figure 2c: Agricultural share of total government expenditures by area, 1980-2007
Figure 2d: Agricultural share of total government expenditures in Asia by area, 1980-2007
Source: Authors’ calculations using IFPRI, 2010 and FAO, 2011.
0
50
100
150
200
250
1980 1983 1986 1989 1992 1995 1998 2001 2004 2007
Asia (15) HI NonOECD (7) HI OECD (6) LAC (11) MENA (7) SSA (12) ECA (9)
Bill
ions
USD
200
5 PP
P
0
40
80
120
160
1980 1983 1986 1989 1992 1995 1998 2001 2004 2007
EAP excl'g China (7) China South Asia excl'g India (6) India
Bill
ions
USD
200
5 PP
P
0
4
8
12
1980 1983 1986 1989 1992 1995 1998 2001 2004 2007 Asia (15) ECA (9) LAC (11) MENA (7) SSA (12) World (excl'g High Income)
Perc
ent
0
3
6
9
12
15
1980 1983 1986 1989 1992 1995 1998 2001 2004 2007
EAP excl'g China (7) China South Asia excl'g India (6) India
Perc
ent

15
Figure 3: Government expenditures on agriculture per capita and Agricultural Orientation Index, 1980-2007 Figure 3a: Per agricultural capita government expenditure on agriculture by area, 1980 – 2007
Figure 3b: Per agricultural capita government expenditure on agriculture in Asia by area, 1980 – 2007
Figure 3c: Agricultural Orientation Index for government expenditures by area, 1980 – 2007
Figure 3d: Agricultural Orientation Index for government expenditures in Asia by area, 1980 – 2007
Source: Authors’ calculations using IFPRI, 2010b; FAO, 2011 and World Bank, 2011a.
0
200
400
600
800
1980 1983 1986 1989 1992 1995 1998 2001 2004 2007
Asia (15) ECA (9) LAC (11) MENA (7) SSA (12) World (excl'g High Income)
US
Dol
lars
0
100
200
300
1980 1983 1986 1989 1992 1995 1998 2001 2004 2007 EAP excl'g China (7) China South Asia excl'g India (6) India
US
Dol
lars
0.0
0.5
1.0
1.5
2.0
1980 1983 1986 1989 1992 1995 1998 2001 2004 2007 Asia (15) ECA (9) LAC (11) MENA (7) SSA (12) World (excl'g High Income)
Rat
io
0.0
0.4
0.8
1.2
1980 1983 1986 1989 1992 1995 1998 2001 2004 2007 EAP excl'g China (7) China SA excl'g India (6) India
Rat
io

B. ReSAKSS estimates of the agricultural share of government spending in African countries.
The importance of government spending on agriculture for economic growth and poverty reduction in developing countries was perhaps most evident when, at a 2003 assembly of the African Union in Maputo, Mozambique, African Heads of State signed a declaration recognizing the importance of agriculture to the continent’s economies. The Maputo declaration established the Comprehensive Africa Agriculture Development Programme (CAADP) for agricultural development. Two targets were established as part of the CAADP; these were:
• to increase agricultural productivity by 6% annually through 2015 • to increase the percentage of public expenditure devoted to agriculture to 10% in each
member-state within a 5 year period The declaration also established the Regional Strategic Analysis and Knowledge Support System (ReSAKSS), an Africa-wide network that provides analytical tools to help policy-makers use factual evidence in their decision-making and to evaluate work done towards the CAADP goals. ReSAKSS is housed in the CGIAR system (African Union, 2003). ReSAKSS compiles data on government spending on agriculture for African countries; it is used as the most official source of information for monitoring the Maputo Declaration. As shown in Figure 4a below, in recent years, only 10 of 45 of the African countries covered by the dataset attained the 10% target agreed upon by African ministers through the Maputo Declaration. Among the countries that have not attained the target in recent years, over the 3 most recent years, 12 countries exhibit an increase in the share of government spending on agriculture, 15 show a decrease and no clear increase nor decrease was evident for 8 of the countries (Figures 4b – 4d) (see also Benin, S et al, 2010).
17
Figure 4: Agricultural share of government expenditures in African countries Figure 4a: Share in African countries that have recently met the 10% target
Figure 4b: African countries that have exhibited an increase in shares in the three most recent years
Figure 4c: Share in countries exhibiting a decrease in the three most recent years
Figure 4d: Share in countries exhibiting neither a clear increase nor decrease in the three most recent years
Source: Benin, S, 2010.
0
5
10
15
20
25
2004
2005
2006
2007
2008
Perc
ent
0
5
10
2004 2005 2006 2007 2008
Perc
ent
0
5
10
2004 2005 2006 2007 2008
Perc
ent
0
2.5
5
2004
2005
2006
2007
2008
Perc
ent

C. Comparison among different estimates of the agricultural share of government spending
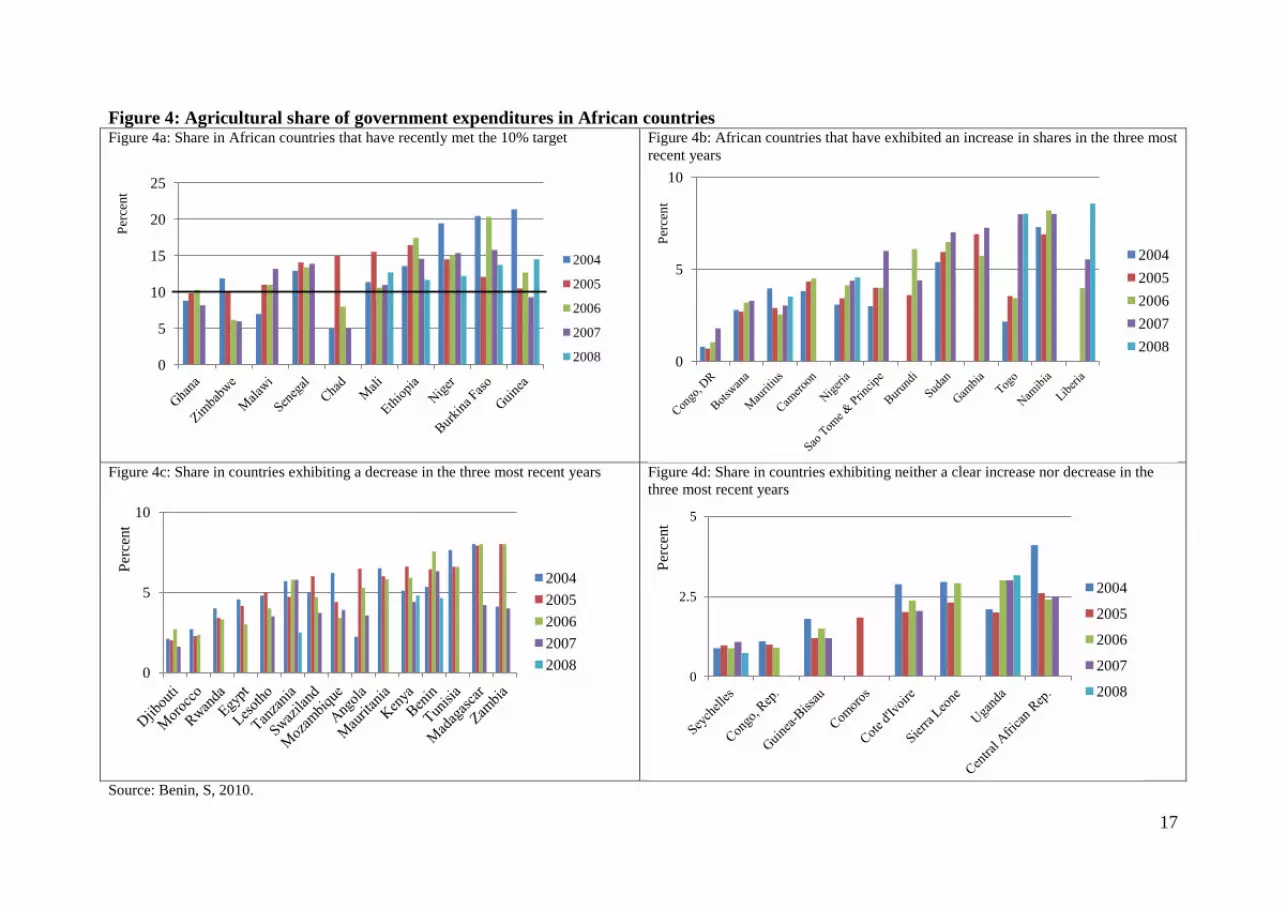
Estimates of the agricultural share of government spending in African countries vary greatly among sources of information. Figure 5 below presents estimates for the African countries included in the SPEED database; the values are taken from various sources. Shares are sorted in decreasing order from left to right according to the estimate provided by the SPEED. It is evident that among these sources of information there is little consensus regarding the magnitude of such shares. Variation is particularly pronounced for Ghana, Malawi, and Zambia. This figure suggests there is little consensus regarding what share of government spending actually goes towards agriculture in these countries. There is also a wide variation among these sources of information in terms of country and year coverage. It would seem that there is room for increased knowledge sharing and collaboration among the international community and governments in order to improve the coverage and consistency of estimates of agricultural shares of government spending.
19
Figure 5: The Agricultural share of government spending by African governments in 2006, comparison among estimates provided by four sources
Note: The figure only presents observations for 2006 as available from the various datasets. Sources: IFPRI, 2010b; Benin, S. et al, 2010; IMF, 2009; and NEPAD, 2010.
0 10 20 30
Ghana
Nigeria
Morocco
Lesotho
Kenya
Botswana
Egypt, Arab Rep.
Mauritius
Swaziland
Uganda
Malawi
Tunisia
Zambia
Ethiopia
IFPRI SPEED data
ReSAKSS data
IMF government finance statistics
NEPAD publication
Percent
Research Needs There are numerous datasets with contradictory messages regarding levels and trends in various indicators of government spending on agriculture. There is a need to harmonize efforts and possibly create one international dataset on government expenditures on agriculture. The IFPRI SPEED dataset is currently the most complete source of data on government expenditures on agriculture in countries of the developing world. As with all research there is a need to elaborate and expand upon this solid foundation. African countries and countries in Oceania are under-represented by the database; it would be useful to expand coverage from these regions. Observations for some years in some countries are erratic due to economic crisis, hyper inflation or other unusual events. This needs further attention, although there is no clear cut solution to addressing the problem. Future work to convert the measures to a comparable unit (e.g. 2005 constant dollars) will facilitate comparisons of government spending with other measures of investment in agriculture such as FDI and ODA. Due to the benefits to agriculture of improvements in rural education, health and other services, a rural-urban breakdown of government spending is indispensible for having a more complete understanding of its impact on agricultural and rural development. This type of information is available in country case studies and in some Public Expenditure Reviews carried out by the World Bank; it would be useful to create a database that assembles the information for several countries.
III. Official Development Assistance to Agriculture Since the food price crisis of 2008, issues of food security have moved to the forefront of the international agenda, notably at the July 2009 meeting of member nations of the G8 in L’Aquila, Italy. The resulting Joint Statement on Global Food Security recognized consistent underinvestment in agriculture, combined with economic instability, as partial reasons for the persistence of food insecurity. It claimed that ODA to agriculture has been decreasing and that the trend must be reversed. The G8 member nations reaffirmed their commitment to improve food security and pledged 20 billion USD in assistance to developing countries over the following three years (G8, 2009). The 20 billion USD pledge has come under sharp criticism. It was not clearly specified whether the pledged funds were additional to existing levels of ODA or not and neither the definition of aid nor that of agriculture was clearly specified. We can estimate an upper bound amount by which ODA might increase if we assume the L’Aquila pledge were completely additional and that the aid is consistent with definitions used by the OECD. According to CRS data on ODA, levels of bilateral and multilateral commitments to agriculture averaged 7 billion annually from 2007 - 2009; therefore the L’Aquila pledge could mean as much as a doubling of levels of ODA to agriculture over the three year period in question.
21
Within the context of the follow up to the L’Aquila meeting a crucial question is to what extent ODA to agriculture has increased since the 2009 summit. Unfortunately the most complete and detailed international datasets available to date only cover assistance through the year 2009, at best, and it is thus not possible to use them in order to answer this question. Some work has been undertaken to determine the level of delivery on the L’Aquila pledge; this is outside of the scope of this paper6. Literature finds that levels of ODA to agriculture increased from the 1970s to 1980s at which point they peaked; they then decreased from the late 1980s to mid 2000s, and have increased in more recent years, reaching about 6 billion USD in 2008 (Coppard, 2010; Hearn, 2010; OECD, 2009; World Bank, 2007; UNCTAD, 2009). The share of ODA allocated to agriculture decreased from 1983 to 2003; it remains far lower than it was in the 1980s, but has begun to increase in 2007 (Coppard, 2010; Hearn et al, 2010; OECD, 2009; World Bank, 2007). The OECD provides two main datasets describing official development assistance to agriculture. The OECD DAC provides information on ODA, however, for sectoral ODA; available data were limited to DAC member countries and EU Institutions. We therefore do not consider the DAC dataset in this paper. We rather look at the OECD Creditor Reporting System which affords us the opportunity to consider allocation of assistance to agriculture as well as other sectors by recipient country and region.
A. The OECD Creditor Reporting System on Official Development Assistance
The Creditor Reporting System is a database which records official development assistance at the project level. CRS data allow us to look at aid to agriculture as well as aid to all other sectors. Not all donors are included, but the number has increased and in 2008 they included all of the member states of the OECD’s Development Assistance Committee (DAC) except Republic of Korea as well as some 14 multilateral organizations7. CRS does not include data on assistance from the People’s Republic of China (OECD, 2009). ODA data collected by the OECD is not directly comparable to estimates of Chinese assistance, since the OECD and PRC define aid differently with the former using a more narrow definition. PRC ODA to Africa is many times larger than US, French or British contributions to SSA and it increased from ’02 to ’07. PRC ODA to Africa does not appear to include much spending on agriculture (Lum, T, 2009). CRS includes several sectors, such as: social infrastructure and services, production sectors (including agriculture, forestry and fishing), multisector/ cross-cutting and economic infrastructure and services. ODA to agriculture includes agricultural production and agricultural policies, agriculture education/ research/ services, agricultural water resources, forestry, fisheries and agricultural inputs. The definition therefore excludes rural development (classified as multi-sector aid), agro and forest industries (industry), developmental food aid (general programme assistance) and emergency food aid (humanitarian assistance) (OECD, 2009).
6 For more information see G8, 2011 and ONE, 2011. 7 The number of multilaterals included has increased in recent years; in 2008 they were: AfDF, AsDF, GAVI, GEF, Global Fund, IDA, IDB Sp.Fund, IFAD, UNAIDS, UNDP, UNECE, UNFPA, UNICEF and WFP.
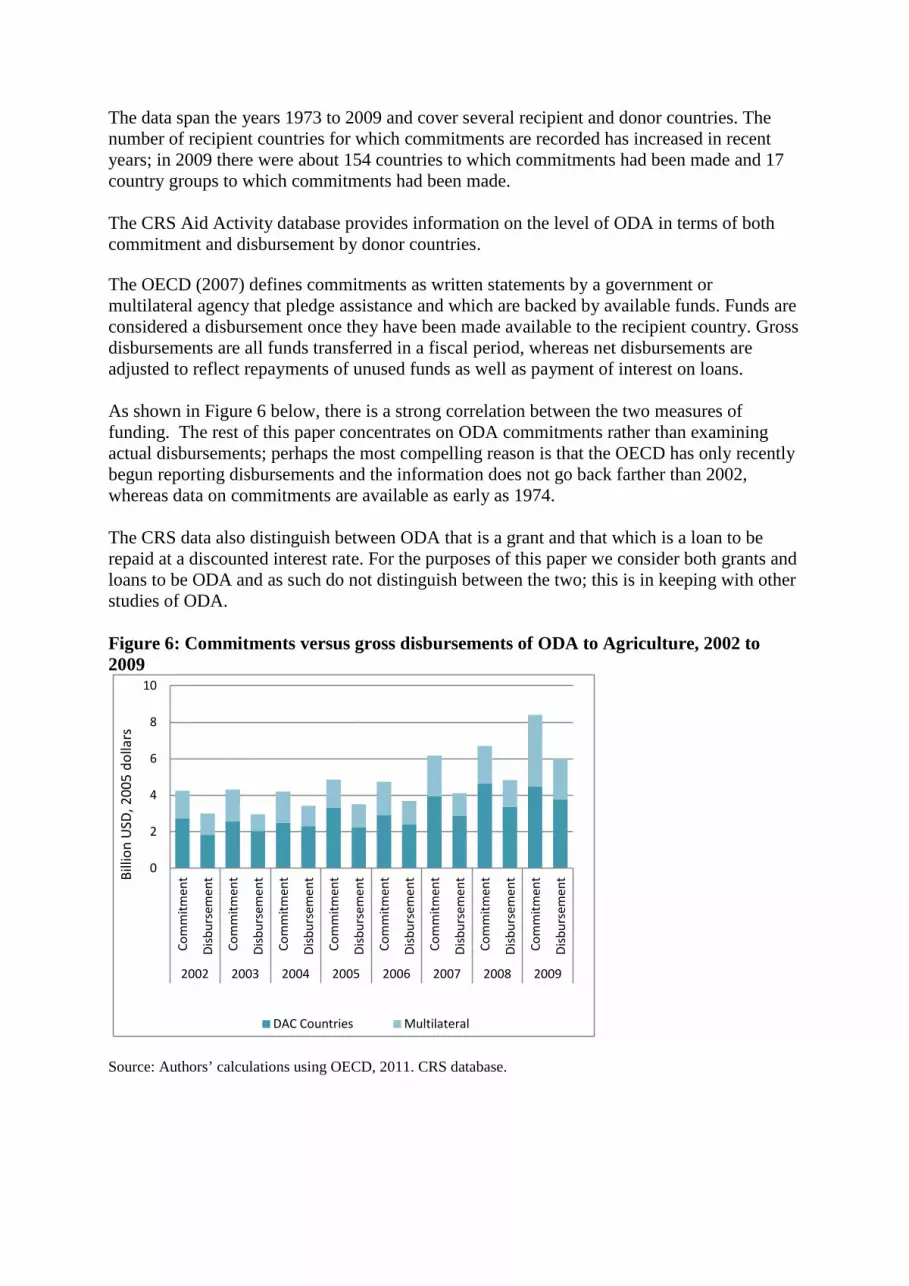
The data span the years 1973 to 2009 and cover several recipient and donor countries. The number of recipient countries for which commitments are recorded has increased in recent years; in 2009 there were about 154 countries to which commitments had been made and 17 country groups to which commitments had been made. The CRS Aid Activity database provides information on the level of ODA in terms of both commitment and disbursement by donor countries. The OECD (2007) defines commitments as written statements by a government or multilateral agency that pledge assistance and which are backed by available funds. Funds are considered a disbursement once they have been made available to the recipient country. Gross disbursements are all funds transferred in a fiscal period, whereas net disbursements are adjusted to reflect repayments of unused funds as well as payment of interest on loans. As shown in Figure 6 below, there is a strong correlation between the two measures of funding. The rest of this paper concentrates on ODA commitments rather than examining actual disbursements; perhaps the most compelling reason is that the OECD has only recently begun reporting disbursements and the information does not go back farther than 2002, whereas data on commitments are available as early as 1974. The CRS data also distinguish between ODA that is a grant and that which is a loan to be repaid at a discounted interest rate. For the purposes of this paper we consider both grants and loans to be ODA and as such do not distinguish between the two; this is in keeping with other studies of ODA. Figure 6: Commitments versus gross disbursements of ODA to Agriculture, 2002 to 2009
Source: Authors’ calculations using OECD, 2011. CRS database.
0
2
4
6
8
10
Com
mitm
ent
Dis
burs
emen
t
Com
mitm
ent
Dis
burs
emen
t
Com
mitm
ent
Dis
burs
emen
t
Com
mitm
ent
Dis
burs
emen
t
Com
mitm
ent
Dis
burs
emen
t
Com
mitm
ent
Dis
burs
emen
t
Com
mitm
ent
Dis
burs
emen
t
Com
mitm
ent
Dis
burs
emen
t
2002 2003 2004 2005 2006 2007 2008 2009
DAC Countries Multilateral
Billi
on U
SD, 2
005
dolla
rs
23
Overview CRS data show that
• Total ODA to all sectors increased from 1973 to 2009; as a result the agricultural share of ODA decreased until 2005 after which point it increased
• ODA commitments to agriculture have primarily gone to agricultural policy formulation and agricultural production activities
• Globally, levels of ODA committed to agriculture were highest during the 1980s, decreased from 1991 to 2002 and increased in recent years, but have not returned to levels observed in the 1980s
• In recent years the share of ODA committed to agriculture globally has been far lower than it was in the 1980s; it declined from the 1980s to 2006, but has increased in all regions since 2006
• Per capita ODA to agriculture decreased from the late 1980s to mid 2000s and has increased since, but remains far lower than it was during the late 1980s
• The agricultural orientation index for ODA has been less than 1 in most regions; it decreased from 1973 to 2006 and has increased since
• By some measures, donor commitments have not emphasized agriculture in the areas with the highest rural poverty and greatest agricultural share of GDP (in SSA and India as well as the rest of South Asia)
These findings are described in more detail in the following pages. Total ODA to all sectors increased from 1973 to 2009 and the agricultural share of ODA decreased until 2005 after which point it increased Total ODA Commitments have increased dramatically from 1973 to 2009 from about 30 billion USD in the early 1970s to 140 billion USD in 2009. This is largely due to increases in commitments to social infrastructure (education, health, etc.), which has received the largest share of official development assistance in recent years (Figure 7a). In recent years the second largest share of ODA is currently allocated to the other sector; it increased somewhat over the period. The other category consists mostly of commodity aid (which encompasses food security and food aid for development), debt relief and humanitarian aid (Figure 7b). Humanitarian assistance, which includes emergency food aid, has increased greatly since the 1970s. Economic infrastructure and services also constitute a large share of ODA; commitments to this sector increased over the period. This includes rural roads and other infrastructure which are of course complementary to the agricultural sector. Levels of aid to agriculture and other production sectors were small in comparison and did not increase (Figure 7a). As a result of the massive increase in total ODA and modest increase in commitments to agriculture, the agricultural share of total ODA decreased from peaks as high as 20% during the 1980s to a mere 4% during the mid 2000s, but it has increased since reaching about 6% in 2009 (Figure 7a).

ODA commitments to agriculture have primarily gone to agricultural policy formulation and agricultural production activities As shown in Figure 7c most ODA to agriculture is committed for the purposes of improving agricultural production and agricultural policies. Furthermore, commitments to these two areas have increased since 2006. A large share also goes to agricultural education/ research/ services and to a smaller extent to agricultural water resources. The smallest shares are committed to forestry, fisheries and agricultural inputs. Globally, levels of ODA committed to agriculture were highest during the 1980s, decreased from 1991 to 2002 and increased in recent years, but have not returned to levels observed in the 1980s
According to CRS data, annual Official Development Assistance commitments to agriculture, as shown in Figure 8a below, were about 3 billion USD in 1973. They increased to higher levels during the 1980s fluctuating between 6 and 10 billion, reaching a peak of nearly 10 billion in 1988. During the 1990s they decreased dramatically and levelled off at about 4 billion during the latter part of the decade. In recent years (since 2006) they have increased reaching about 8 billion dollars in 2009; despite the increase the level is below the volumes seen in the 1980s. Most of the recent increase in levels of ODA to agriculture has occurred in Sub-Saharan Africa as well as in South Asian countries other than India. Although Non-OECD High Income countries are eligible to receive ODA, they are receiving negligible amounts. The flow of ODA to High Income region mainly occurred prior to these countries were elevated to a high income status. In recent years the share of ODA committed to agriculture globally has been far lower than it was in the 1980s; it declined from the 1980s to 2006, but has increased in all regions since 2006 As shown in Figure 8c, since the mid 1980s the share of total assistance committed to agriculture decreased in all regions; the decrease in the share can largely be attributed to increases in overall official development assistance to all sectors, most of which is aid to the social sector (health, education, etc). However, the trend changed in the late 2000s and an increase was recorded from 2005 to 2009 for all areas except in areas of Asia other than India (Figure 8d). Although global shares have increased in recent years, the share remains far lower than it was during the 1980s. This may not be detrimental to agriculture or rural poverty reduction; it may in fact be preferable for donors to invest in rural education or health rather than spending money directly on agriculture. Average shares for the years 2007 – 2009 were lowest in MENA and China (about 4%) and highest in LAC (about 8%) and India (nearly 10%). Agricultural shares of ODA going to Europe & Central Asia, Sub-Saharan Africa, South Asia excluding India and East Asia and the Pacific excluding China have ranged from a moderate 5 to 6%.

25
ODA to agriculture per agricultural population decreased from the late 1980s to mid 2000s and has increased since, but remains far lower than it was during the late 1980s Globally, ODA to agriculture per population economically active in agriculture (Figure 9) decreased from as much as 10 dollars per capita during the 1980s to about 3 dollars per capita from 2000 to 2006 and increased to reach 5 dollars per capita in 2009. The amounts per agricultural worker vary greatly among regions, and largely reflect the size of the population in the region considered. From 2007 – 2009, per capita amounts of ODA to agriculture were highest in MENA ($22), followed by LAC ($14), ECA ($12) and Sub-Saharan Africa ($12), South Asia excluding India ($9), EAP excluding China ($5) , India ($2) and China ($0.20). The agricultural orientation index for ODA has been less than 1 in most regions; it decreased from 1973 to 2006 and has increased since The agricultural orientation index (AOI) for ODA equals the agricultural share of ODA divided by the agricultural share of GDP (value added). An AOI less than one indicates that ODA allocated to agriculture represents less of a share of total ODA than agriculture represents in the total economy. Interestingly, as shown in Figure 9c, although the AOI for ODA is volatile from year to year, it shows a clear decreasing trend in nearly all regions from the 1970s to 2006 and has increased since then. This is the result of several factors including growth in non-agricultural sectors of the economy. The decrease is also due to the rapid increase in ODA to sectors other than agriculture, particularly that of social services which is complementary to agriculture. Through the 1990s and 2000s the AOI has been less than one in all areas except China and Latin America and the Caribbean. During the 2000s it has been lowest in Sub-Saharan Africa and South Asia excluding India, two areas of the developing world where rural poverty is highest and where most of the poor are farmers. By some measures, donor commitments have not emphasized agriculture in the areas with the highest rural poverty and greatest agricultural share of GDP (in SSA and India as well as the rest of South Asia) In Sub-Saharan Africa, levels of ODA committed to agriculture have increased in the late 2000s, returning to the levels seen during the 1980s. However, the agricultural share of total ODA, and ODA to agriculture per agricultural capita have been moderate in comparison with the share and per capita amounts in other regions. Although they have both increased in recent years, they have not returned to levels seen in the 1980s. From 1973 to 2009 the AOI for Sub-Saharan Africa has been lower than that of the developing world as a whole; it decreased from the 1980s to 2006, but has increased since. In India levels have not increased, but in the rest of South Asia they have. Shares have been high but volatile relative to other regions and neither increased nor decreased during the second half of the 2000s. Per capita amounts are low in India as well as the rest of South Asia; in recent years they have not increased in India, whereas they have increased in the rest of South Asia. In recent years the AOI has been extremely low in South Asia excluding India as well as in India; it has shown little if any increase in recent years.

Figure 7: ODA Commitments, 1973-2009 Figure 7a: ODA Commitment to all sectors & agricultural share of ODA 1973 – 2009
Figure 7b: Other ODA Commitments by type, 1995 – 2009
Figure 7c: CRS Aid to Agriculture by purpose code, 1973 to 2009
Source: Authors’ calculations using OECD, 2011. CRS database. All dollar values for CRS ODA (this figure and anywhere else that CRS data is described in this paper) were converted to constant prices, base year 2005 using the OECD DAC deflator.
-
5
10
15
20
25
0
20
40
60
80
100
120
140
1973 1977 1981 1985 1989 1993 1997 2001 2005 2009
Multisector/ cross-cutting
Agriculture, forestry & fishing
Production sectors (excl'g agriculture, forestry & fishing)
Economic infrastructure & services
Social infrastructure & services
Others (including unallocable)
Agricultural share of total ODA
Bill
ion
of U
S do
llars
0
20
40
60
1995 1997 1999 2001 2003 2005 2007 2009
Unallocated
Refugees in donor countries Support to NGOs
Donors' administrative costs Humanitarian aid
Debt relief
Commodity aid & general*
Bill
ion
of U
S do
llars
0
2
4
6
8
10
1973 1977 1981 1985 1989 1993 1997 2001 2005 2009
Bill
ion
of U
S do
llars
Forestry
Fishing
Agricultural water resources Agricultural production Agricultural policy
Agricultural inputs
Agricultural education /research /services

27
Figure 8: Levels and shares of ODA Commitment by region, 1973-2009 Figure 8a: Levels of ODA Commitment by region, 1973 – 2009
Figure 8b: Levels of ODA Commitment to agriculture in Asia by area, 1973 –2009
Figure 8c: Agricultural share of ODA by region, 1973 to 2009
Figure 8d: Agricultural share of ODA to Asia by area, 1973 to 2009
Source: Authors’ calculations using OECD, 2011. CRS database.
0
2
4
6
8
10
1973 1977 1981 1985 1989 1993 1997 2001 2005 2009
SSA
LAC
MENA
Asia
High Income*
ECA
Bilateral, unspecified
Bill
ions
of U
S do
llars
0
2
4
6
1973 1977 1981 1985 1989 1993 1997 2001 2005 2009
EAP excl'g China
China
South Asia excl'g India
India
Bill
ions
of d
olla
rs
0
10
20
30
1973 1977 1981 1985 1989 1993 1997 2001 2005 2009
Asia
ECA
LAC
MENA
SSA
World
Perc
ent
0
10
20
30
40
50
60
1973 1977 1981 1985 1989 1993 1997 2001 2005 2009
EAP excl'g China
China
South Asia excl'g India India
Perc
ent
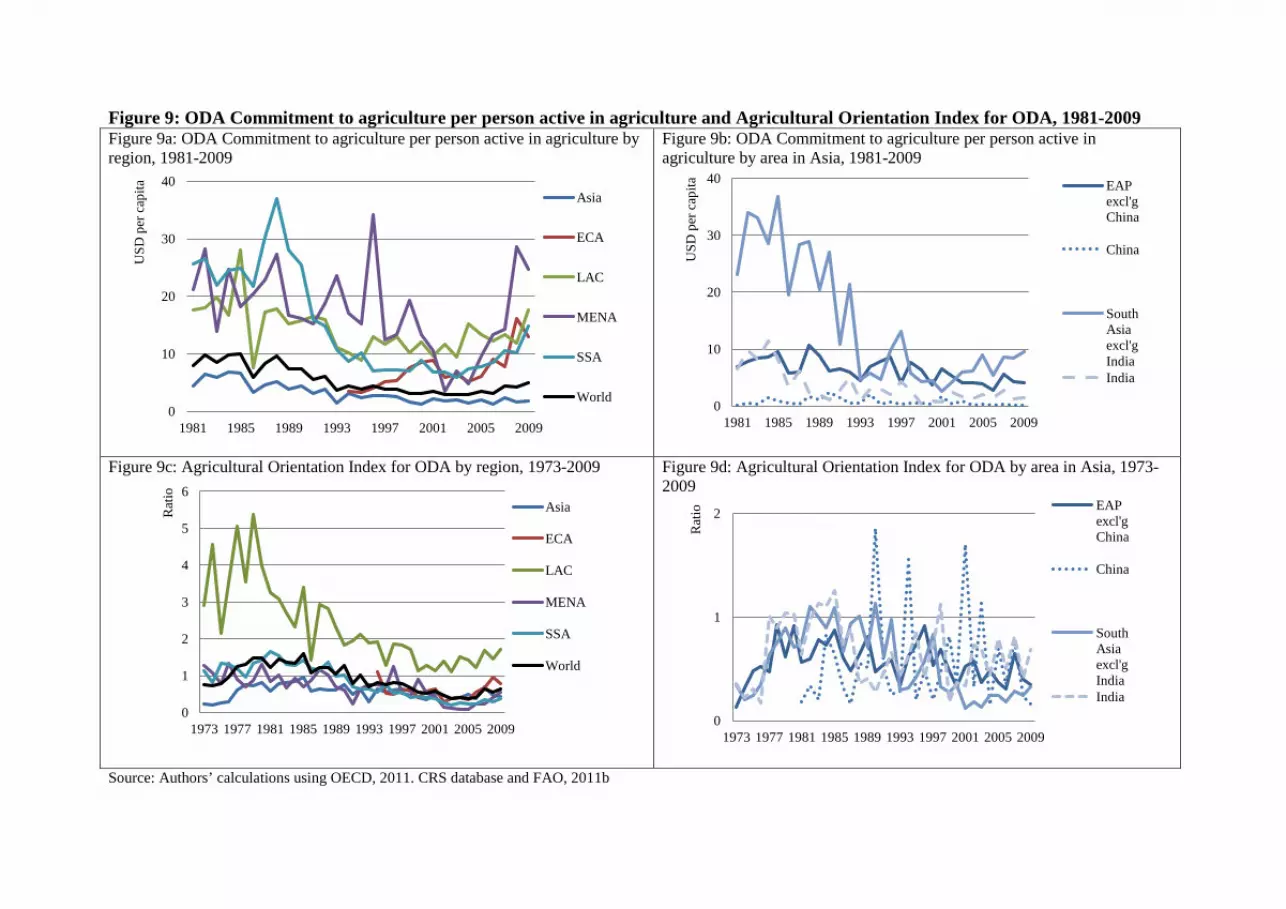
Figure 9: ODA Commitment to agriculture per person active in agriculture and Agricultural Orientation Index for ODA, 1981-2009 Figure 9a: ODA Commitment to agriculture per person active in agriculture by region, 1981-2009
Figure 9b: ODA Commitment to agriculture per person active in agriculture by area in Asia, 1981-2009
Figure 9c: Agricultural Orientation Index for ODA by region, 1973-2009
Figure 9d: Agricultural Orientation Index for ODA by area in Asia, 1973-2009
Source: Authors’ calculations using OECD, 2011. CRS database and FAO, 2011b
0
10
20
30
40
1981 1985 1989 1993 1997 2001 2005 2009
Asia
ECA
LAC
MENA
SSA
World
USD
per
cap
ita
0
10
20
30
40
1981 1985 1989 1993 1997 2001 2005 2009
EAP excl'g China
China
South Asia excl'g India India
USD
per
cap
ita
0
1
2
3
4
5
6
1973 1977 1981 1985 1989 1993 1997 2001 2005 2009
Asia
ECA
LAC
MENA
SSA
World
Rat
io
0
1
2
1973 1977 1981 1985 1989 1993 1997 2001 2005 2009
EAP excl'g China
China
South Asia excl'g India India
Rat
io
29
Future research CRS data provide only a partial estimate of ODA to agriculture because they do not include all donors; many multilaterals are excluded as are emerging donors such as China. There is a need for a more comprehensive dataset describing development assistance to agriculture. For several years FAO has provided the international community with more complete estimates of ODA to agriculture; it is known as the External Assistance to Agriculture (EAA) data. This data has shown that assistance to agriculture is more voluminous than reported by CRS (FAO, 2009). An updated version of the EAA covering assistance to agriculture through 2009 is forthcoming. It would be useful to have estimates of how much aid to social infrastructure and services was rural and how much was urban as well as how much assistance was committed for public goods as opposed to subsidies of private goods such as fertilizer or other farm-level inputs. Future research may wish to focus on compilation of such information.
IV. Foreign Direct Investment Foreign direct investment may be an increasingly important source of finance for agricultural development. FAO has recognized its importance and, together with member governments and several other international organizations, it is establishing Principles for Responsible Investment in Agriculture (FAO, 2011). Unfortunately, we know very little about the levels of FDI being made in agriculture. This may be because there is no commitment made by private enterprises that is analogous to commitments made by policy makers regarding public spending and ODA (such as the Maputo Declaration and the L’Aquila Agreement). Another possible explanation is that information disclosure regarding types of and locations of FDI is not in the profit making interest of private investors. Here we review two datasets which provide some information on FDI to agriculture and relevant sectors.
A. UNCTAD data on Foreign direct investment The UN Conference on Trade and Development provides the international community with comprehensive data on foreign direct investment (FDI) to all sectors; it is available through the online platform, UNCTADstat8. Unfortunately this data on FDI to all sectors does not provide a sectoral breakdown of FDI. FDI by sector is provided through another UNCTAD dataset (which is not disseminated through the organization’s website); we will refer to this as the sectoral FDI dataset. This data is often cited as evidence of a major increase in FDI to agriculture (UNCTAD, 2009). However, the degree of the increase is grossly overstated for years prior to 2000.
8 The data show that FDI inflows to all sectors of the economy peaked at about 2.1 trillion current USD in 2007; during the financial crisis they decreased sharply to about 1.1 trillion current USD in 2009. They are expected to total more than 1.2 trillion USD for 2010 and to continue increasing to reach a total of between 1.6 and 2 trillion by 2012 (UNCTAD, 2010).

The sectoral FDI dataset classifies FDI as either investment in production, secondary or tertiary sectors as well as designating it by subsector, (for example, agriculture is a subsector of production activities). The dataset runs from 1980 through 2008. Overview Generally, the data show:
• Levels of FDI to all sectors, as well as to food and beverages and agriculture have increased, but the increase is due largely to an increase in the number of countries reporting FDI
• FDI inflows to food and beverages are much larger than inflows of FDI to agriculture
We now describe the trends in more detail. Levels of FDI to all sectors have increased, but the increase is due largely to an increase in the number of countries reporting FDI The sectoral dataset reports that FDI to all sectors increased from 140 billion dollars in the early 1980s to a peak of 1.6 trillion in 2007 and decreased to 1.2 trillion in 2008. However, it is important to use caution when interpreting this data. Much of the apparent upward trend in total FDI (as well as FDI to sectors discussed below) is in reality due to an increase in the number of countries receiving FDI that are included in the dataset (from about 30 to 70). The increase in FDI over time is further exaggerated because the data are reported in current dollar values, rather than constant dollar values which have been adjusted for inflation. FDI inflows to food and beverages are much larger than inflows of FDI to agriculture; levels to both sectors have increased, but the increase is due largely to an increase in the number of countries reporting FDI Figure 10 shows that levels of FDI reported to the food and beverage sector are substantially more voluminous than levels going to agriculture. In 1991 FDI inflows to food and beverages totaled 5 billion US current dollars; by the year 2008 it had increased nearly twentyfold and totaled 85 billion. However, we also see from the figure that the number of countries with observations increased from about 20 in the early 90s to about 40 in more recent years. Reports of FDI to Agriculture, hunting, forestry and fishing (hereafter referred to as FDI to agriculture) are much less voluminous than FDI to food and beverages. In 1991 they were .2 billion USD and by 2008 they had increased to 5 billion USD. We are confident in stating that increases in FDI to agriculture over time have been exaggerated, due to the increase in the number of countries over the same time period and because data is reported in current dollars. As shown in Figures 11a and 11b below, data is not available for both the year 2000 and 2008 for many countries. For those countries attracting the largest amounts of FDI (Figure 11a) we see there was a large increase in ODA to agriculture in China, Russian Federation, Brazil, Uruguay and Costa Rica. Assuming that from 2000 to 2008 there was not a decrease in levels of FDI to the major host countries for which information is missing (eg. Indonesia, Romania, or Argentina) and assuming there were no large flows that were unreported, we may conclude

31
that inflows of FDI to agriculture have increased in low and middle income countries as a whole from 2000 to 2008. Figure 10: FDI inflows to the Food, beverage and tobacco sector as well as to Agriculture, forestry, fishing and hunting, and number of countries for which observations are available, 1980 to 2008
Source: Authors calculations using data from UNCTAD.
0
20
40
60
80
100
-
20
40
60
80
100
1980 1984 1988 1992 1996 2000 2004 2008
Total Food, beverages & tobacco Agriculture, hunting, forestry & fishing Number of country with FDI on ag Number of country with FDI on food and bev
Bill
ion
USD
, cur
rent
pric
es
Num
ber o
f cou
ntri
es

Figure 11: Levels of FDI to Agriculture attracting the largest amount and attracting less than 100 million USD, 2000 and 2008 Figure 11a: Levels of FDI to Agriculture in countries attracting the largest amounts of FDI to agriculture, 2000 and 2008
Figure 11b: Levels of FDI to Agriculture in countries attracting less than 100 million USD FDI to agriculture, 2000 and 2008
Note: * denotes actual is 2001, ** 2006 and *** 2007 Source: Authors calculations using data from UNCTAD.
-400
0
400
800
1200
Indo
nesi
a
Chin
a
Rom
ania
Russ
ian
Fed
Mex
ico
Chile
Arg
entin
a
Braz
il*
Uru
guay
^
Cost
a Ri
ca
Asia ECA LAC
2000 2008
Mill
ion
USD
-20
0
20
40
60
80
100
Mau
ritiu
s*
Moz
ambi
que*
Et
hiop
ia
Tanz
ania
M
adag
asca
r V
anua
tu
Paki
stan
Th
aila
nd
Fiji
Cam
bodi
a M
yanm
ar
Laos
Ba
ngla
desh
V
iet N
am
Mal
aysi
a Ph
ilipp
ines
La
tvia
Bu
lgar
ia
Mac
edon
ia
Arm
enia
* Li
thua
nia
Kaza
khst
an
Kyrg
yzst
an
Turk
ey
Alba
nia*
* M
oldo
va
Serb
ia
Colo
mbi
a El
Sal
vado
r***
Ec
uado
r Pe
ru**
* N
icar
agua
**
Para
guay
H
ondu
ras
Beliz
e Bo
livia
M
oroc
co
Tuni
sia
Egyp
t Sa
udi A
rabi
a Sy
ria
Africa Asia ECA LAC MENA
2000 2008
Mill
ion
USD

33
B. Financial Times FDI Market Online Database The Financial Times produces and disseminates the FDI Markets database which reports cross border direct investment projects. This data is quite useful to our understanding of investment flows throughout the world; indeed it is a key dataset used in UNCTAD’s World Investment Report 2011. Description of database For each investment project the FDI Markets database provides a summary of the scope of the project, along with the country, state, and city of both the source and the destination. Projects are divided into industry sectors according to the core business of the company; they are subdivided into industry clusters, and further delineated according to specific business activities such as sales, marketing or accounting. The FDI Markets data is updated daily; here we consider data on planned investment projects from 2003 through 2010. During this period, the number of countries included in the dataset has increased slightly. For total FDI, in 2010, there were 113 source countries, 170 destination countries, and 172 countries in total. The number of countries reporting FDI to food and beverages was much smaller; ranging from 40 – 50 source countries and 70 - 80 destination countries. The database provides indicators such as the number of investment projects, the total amount to be invested, and the number of jobs created. Investment amounts are reported in US Dollars. The database reports investments by sectors, including three sectors that are relevant to agriculture. These are: Food and Tobacco, Beverages and Alternative/ Renewable Energy. Projects in the Food and Tobacco sector are most relevant for our purposes. They include manufacturing and processing, packaging, shipping, and business functions such as establishing a headquarters or a sales office. Investments in beverages include manufacturing and processing plants, and business activities. Alternative/ renewable energies include crops grown to produce biofuel as well as other activities such as building wind farms or manufacturing solar panels. Advantages and disadvantages of using FDI Markets Data FDI Markets is frequently updated and provides detailed coverage of FDI, however it is not useful for historical analysis since data are not available for years prior to 2003. It allows for the analysis of sectoral trends, and descriptions accompanying the projects offer further information on the nature of the investment. However, the database does not specifically report data on agriculture and farming, but rather on sectors such as Food and Tobacco, Beverages, and Alternative/ renewable energy; such sectors would include business activities that may be considered engaging in primary agriculture but they also include non-agricultural activities. Another challenge of using this dataset is that it comes with little accompanying metadata and documentation of the methodology used. For example, it is unclear what measure of dollars is used to measure the amount invested in any project; for the purposes of this paper we assume that amounts are provided in current dollars.
Overview In summary this dataset shows the following:
• Levels of FDI to all sectors peaked in 2008, and have decreased since. • Levels of FDI to Alternative/ Renewable Energy and to Food and Tobacco increased
from 2003 to 2010. • The share of Alternative/ Renewable Energy has increased greatly; that is not the case
for beverages or food and tobacco. • FDI to food and tobacco was most voluminous in 2009 and decreased in 2010. • From 2003 to 2010 high income countries followed by EAP have been both making
the most and attracting the most FDI in food and tobacco. • Most FDI to food and tobacco has been made in high income countries, EAP or intra-
regionally; very little FDI to food and tobacco is made in SSA. Levels of FDI to all sectors peaked in 2008, and have decreased since. Levels of FDI to all sectors increased from 2003 through 2008, doubling from about $700 billion to $1.4 trillion. Following that peak, it decreased to about $750 billion in 2010 (Table 2). It is, however, important to recognize that the degree of the increase is somewhat exaggerated because there is a small increase in the number of countries included from 2003 to 2010 and the values presented are most likely in current dollar values. Levels of FDI to Alternative/ Renewable Energy, Food and Tobacco increased from 2003 to 2010. At least three sectors reported by FDI Markets include projects involving primary agriculture; these are: Alternative/ Renewable Energy, Food and Tobacco and Beverages. Among those three sectors investments in alternative and renewable energy are by far the most voluminous and they have increased dramatically from 2005 to 2009; such flows decreased in 2010. FDI to food and tobacco as well as to the beverages sector has been far less voluminous and shown only a small increase especially once adjusted for inflation (Table 3). The share of Alternative/ Renewable Energy has increased greatly; that is not the case for beverages or food and tobacco. The share of total FDI invested in alternative/ renewable energy has increased markedly in recent years, but the share allocated to food and tobacco and that allocated to beverages has shown less of an increasing trend over the time period (Table 3). FDI to food and tobacco is the type of FDI that is the most similar to FDI to primary agriculture; the rest of this discussion therefore focuses on FDI to food and tobacco. FDI to food and tobacco peaked in 2009 and decreased in 2010 FDI to food and tobacco peaked in 2009 totalling about 22 billion USD in 2009 and it decreased to about 12 billion in 2010; this decrease was likely due to the financial crisis (Table 2).

35
From 2003 to 2010 high income countries followed by EAP have been both making the most and attracting the most FDI in food and tobacco. From 2003 – 2011 the vast majority of FDI in Food and Tobacco was made by high income countries; EAP made the next largest investments followed by other regions. Investment by all income/ region groups (with the exception of SSA and MENA) decreased in 2010 (Table 4). Table 5 shows where such investments have been made geographically. From 2003 to 2010 most investment in food and tobacco was made in high income countries; most other investment was made in EAP and ECA with other low or middle income country regions attracting only small amounts of investment. From 2007 to 2010 investment in Food and Tobacco in high income countries showed only a small, but steady decrease from 2007 to 2010; in other regions it increased until 2009 and finally diminished in 2010 in most low and middle income country groupings (with the exception of South Asia, LAC and MENA). Over the period very little investment was made in that sector in SSA, South Asia, and MENA (Table 5). Interestingly, it does seem to have shown an increasing trend in SSA with the exception of the very small amounts attracted by the region in 2009. Closer examination of the data shows that, for all income level/ regional groupings, a large share of investment was made intra-regionally. Areas for future research Research is needed to examine the data at the project level to identify how much of the FDI to Alternative/ Renewable Energy, Food and Tobacco as well as Beverages is actually investment made in primary agriculture. Examination of which regions are investing where will likewise be helpful to further our understanding of foreign direct investment in agriculture. Table 2: Levels of FDI selected sectors relevant to agriculture and to all sectors, billion USD (current prices), 2003 - 2010 Sector 2003 2004 2005 2006 2007 2008 2009 2010 Alternative/ Renewable Energy 7.9 6 12.8 61.5 48.3 90.7 86.4 41.8 Beverages 4 3.3 2.7 3.8 3.3 6.4 12 4.1 Food & Tobacco 9.9 9.8 7 9.5 10.9 16.2 21.6 12.3 FDI to all sectors 711 660 665 824 896 1410 907 754
Source: Authors’ calculations using Financial Times, 2011. Table 3: Shares of FDI to selected sectors relevant to agriculture, 2003 - 2010 Sector 2003 2004 2005 2006 2007 2008 2009 2010 Alternative/Renewable Energy 1.1 0.9 1.9 7.5 5.4 6.4 9.5 5.5 Beverages 0.6 0.5 0.4 0.5 0.4 0.5 1.3 0.5 Food and Tobacco 1.4 1.5 1 1.2 1.2 1.2 2.4 1.6
Source: Authors’ calculations using Financial Times, 2011.

Table 4: Foreign Direct Investment in Food and tobacco by source (investing) country income grouping/ region, billion USD (current prices), 2003 – 2010 Region 2003 2004 2005 2006 2007 2008 2009 2010 EAP 0.4 0.2 0.2 0.8 0.3 1.3 5.3 1.2 ECA 0.2 0.2 0.1 0.2 0.1 0.4 0.9 0.2 High Income 9.1 9.0 6.4 8.3 10.0 13.9 14.8 10.3 LAC 0.1 0.2 0.2 0.3 0.4 0.1 0.5 0.4 MENA 0.0 0.1 0.1 0.1 0.0 0.0 0.0 0.0 South Asia 0.0 0.1 0.0 0.1 0.0 0.4 0.2 0.3 SSA 0.1 0.0 0.0 0.0 0.2 0.1 0.1 0.1 Total 9.9 9.8 7.0 9.7 10.9 16.2 21.7 12.4
Source: Authors’ calculations using Financial Times, 2011. Table 5: Foreign Direct Investment in Food and tobacco by host (destination) country income grouping/ region, billion USD (current prices), 2003 – 2010 Region 2003 2004 2005 2006 2007 2008 2009 2010 EAP 1.5 2.6 1.0 2.5 1.3 2.9 6.8 3.5 ECA 1.7 1.6 1.3 2.0 2.0 4.3 5.8 1.3 High Income 3.5 3.7 3.5 3.7 5.0 5.2 5.2 4.5 LAC 1.0 1.5 0.5 0.3 1.3 2.5 1.1 1.3 MENA 0.2 0.3 0.2 0.1 0.5 0.1 0.4 0.5 South Asia 0.6 0.2 0.2 0.7 0.3 0.6 0.4 0.5 SSA 1.4 0.1 0.4 0.4 0.6 0.7 1.9 0.9 Total 9.9 9.9 7.0 9.7 10.9 16.3 21.7 12.4
Source: Authors’ calculations using Financial Times, 2011.

37
V. Key Messages and Research Needs This paper has described the most current data on government spending on agriculture and ODA to agriculture as well as FDI in agriculture. There are important findings.
A. Key messages In summary, the evidence indicates the following.
1. With available data we are limited to considering levels of and trends in spending on, rather than investment in, agriculture (a component of spending may, of course, be considered investment).
2. Spending on agriculture is mainly financed through domestic sources of finance (levels of government spending are larger than ODA and FDI combined).
3. For developing countries as a whole, government spending on agriculture (total levels and per agricultural capita) has increased. As a share of total spending it has decreased. The AOI has shown neither a clear increasing nor decreasing trend over the period.
4. Official development assistance to agriculture has increased in recent years after a prolonged decline. However, it is still far from the levels of the 1980s in absolute amounts, as a share of total ODA and per worker as well as when compared to the agricultural share of value added (the AOI).
5. Increases have been recorded for FDI; but our analysis of UNCTAD data indicates that the increase reported by that dataset is due largely to an increase in the number of countries reporting FDI.
6. Trends in indicators of government spending on, ODA to, and FDI in agriculture are discouraging for Sub-Saharan Africa.
B. Research needs
The following summarizes areas identified as needing additional research
1. Existing data can be further examined to improve our understanding of spending on agriculture.
2. Although we can benefit from further analysis of existing data, there is a need to improve and expand upon available datasets, particularly in the areas of FDI in agriculture, more detailed breakdown of govt expenditures and more comprehensive measures of assistance to agriculture.
3. Information on spending on agriculture needs to be harmonized; several organizations
are working simultaneously on compiling relevant datasets. It may be beneficial for organizations to increase collaboration in an effort to prevent further duplication of work.
References African Union. 2003. Second Ordinary Session Maputo, MOZAMBIQUE. Assembly Declarations no. 11. July. Benin, S., Kennedy, A., Lambert, M., and McBride, L. 2010. Monitoring African agricultural development processes and performance: A comparative analysis. ReSAKSS Annual Trends and Outlook Report 2010. International Food Policy Research Institute (IFPRI). Available at: http://www.resakss.org/index.php?pdf=45486
Coppard, D. 2010. Agricultural development assistance: A summary review of trends and the challenges of monitoring progress. A Development Initiatives Report. 2010.
Cramon-Taubadel S von, Anríquez G, Haen H de, Nivyevskiy O. 2009. Investment in developing countries’ food and agriculture: Assessing agricultural capital stocks and their impact on productivity. Expert Meeting on How to Feed the World in 2050. Rome: Food and Agriculture Organization of the United Nations. Fan S. 2008. Public Expenditures, Growth and Poverty. Lessons from Developing Countries. Washington, DC: The Johns Hopkins University Press.
FAO, 2009. FAO Statistical Yearbook 2009. Available at http://www.fao.org/docrep/014/am079m/am079m00.htm#Contents_en FAO, 2011a. The Process of consultation on principles for responsible agricultural investment within the Committee on World Food Security (CFS). Committee on World Food Security (CFS), Thirty seventh Session, CFS 2011/13. Rome: Food and Agriculture Organization of the United Nations. Available at http://www.fao.org/docrep/meeting/023/mc063e.pdf FAO, 2011b. FAOSTAT. Available at http://faostat.fao.org/default.aspx
G8, 2009. Joint Statement on Global Food Security. Paris, G8. http://www.g8italia2009.it/static/G8_Allegato/LAquila_Joint_Statement_on_Global_Food_Security%5B1%5D,0.pdf G8, 2011. Deauville Accountability Report: G8 Commitments on Health and Food Security: State of Delivery and Results. Paris, G8. Available at http://www.g20-g8.com/g8-g20/root/bank_objects/Rapport_G8_GB.pdf Hearn, B., Koc, V., Piesse, J., and Thirtle, C. 2010. A Preliminary analysis of European assistance to agriculture in Sub-Saharan Africa. Available at http://www3.imperial.ac.uk/africanagriculturaldevelopment/resources/europeanactivity/donorfinancial/aiddataanalysis IFPRI, 2010a. A Database user manual for SPEED Statistics of Public Expenditure for Economic Development. Washington, DC, International Food Policy Research Institute.

39
IFPRI, 2010b. Public Expenditure Database: Statistics of Public Expenditure for Economic Development (SPEED). Washington, DC, International Food Policy Research Institute. Available at: http://www.ifpri.org/book-39/ourwork/programs/priorities-public-investment/speed-database
IFPRI, 2010c. Statistics of Public Expenditure for Economic Development Statistical Appendix. Washington, DC, International Food Policy Research Institute.
International Monetary Fund. 2001. Government Finance Statistics Manual 2001. Washington, DC, International Monetary Fund.
Lum. 2009. China’s Foreign Aid Activities. Washington, DC, Congressional Research Service. NEPAD, 2009. How are countries measuring up to the Maputo Declaration. CAADP Policy Brief. June 2009. Available at: http://www.nepad-caadp.net/pdf/How%20are%20countries%20measuring%20up%20to%20the%20Maputo%20declaration.pdf
OECD, 2007. Reporting directives for the Creditor Reporting System. Paris: OECD Publishing.
OECD, 2009. Creditor Reporting System Aid Activities in Support of Agriculture, 2002-2007. Paris: OECD Publishing.
OECD, 2011. CRS Aid Activity database. Available at http://stats.oecd.org/
ONE, 2011. Agriculture accountability: Holding donors to their L’Aquila promises. http://one.org.s3.amazonaws.com/pdfs/Agriculture_Accountability_Report_ENGLISH.pdf UNCTAD. 2009. World Investment Report 2009: Transnational Corporations, Agricultural Production and Development. New York and Geneva, United Nations. UNCTAD, 2011. World Investment Report 2011. New York and Geneva, United Nations. World Bank, 2011a. World Development Indicators. Available at http://data.worldbank.org/data-catalog/world-development-indicators/
World Bank, 2011b. Country and lending groups. Available at http://data.worldbank.org/about/country-classifications/country-and-lending-groups#IDA Accessed in April 2011. World Bank, 2007. World Development Report 2008. Agriculture for Development. Washington DC, World Bank.

Annex 1. Country classification High Income OECD Australia Austria Belgium Belgium-Luxembourg Canada Czech Republic Czechoslovakia Denmark Estonia Finland France Germany Greece Hungary Iceland Ireland Israel Italy Japan Luxembourg Netherlands New Zealand Norway Poland Portugal Republic of Korea Slovakia Slovenia Spain Sweden Switzerland United Kingdom United States of America
High Income Non-OECD Andorra Bahamas Bahrain Barbados Brunei Darussalam Croatia Cyprus Equatorial Guinea French Polynesia Greenland Guam Kuwait Latvia Liechtenstein Malta Netherlands Antilles New Caledonia Oman Puerto Rico Qatar Saudi Arabia Trinidad and Tobago United Arab Emirates US Virgin Islands

41
LOW AND MIDDLE INCOME COUNTRIES East Asia and the Pacific Cambodia China DPR Korea Fiji Indonesia Kiribati Lao People's Democratic Rep. Malaysia Marshall Islands Micronesia (Federated States of) Mongolia Myanmar Niue Palau Papua New Guinea Philippines Samoa Solomon Islands Thailand Timor-Leste Tonga Vanuatu Viet Nam Wallis and Futuna Islands
Europe and Central Asia Albania Armenia Azerbaijan Belarus Bosnia & Herzegovina Bulgaria Georgia Kazakhstan Kyrgyzstan Lithuania Montenegro Republic of Moldova Romania Russian Federation Serbia Serbia and Montenegro Tajikistan FYR Macedonia Turkey Turkmenistan Ukraine USSR Uzbekistan Yugoslav SFR
Latin America and the Caribbean Antigua and Barbuda Argentina Belize Bolivia (Plurinational State of) Brazil British Virgin Islands Chile Colombia Costa Rica Cuba Dominica Dominican Republic Ecuador El Salvador Falkland Islands (Malvinas) French Guiana Grenada Guadeloupe Guatemala Guyana Haiti Honduras Jamaica Martinique Mexico Nicaragua Panama Paraguay Peru Saint Kitts and Nevis Saint Lucia St. Vincent and the Grenadines Suriname
Uruguay Venezuela (Bolivarian Rep. of)
Middle East and North Africa Algeria Djibouti Egypt Iran (Islamic Republic of) Iraq Jordan Lebanon Libyan Arab Jamahiriya Morocco Occupied Palestinian Territory Syrian Arab Republic Tunisia Yemen
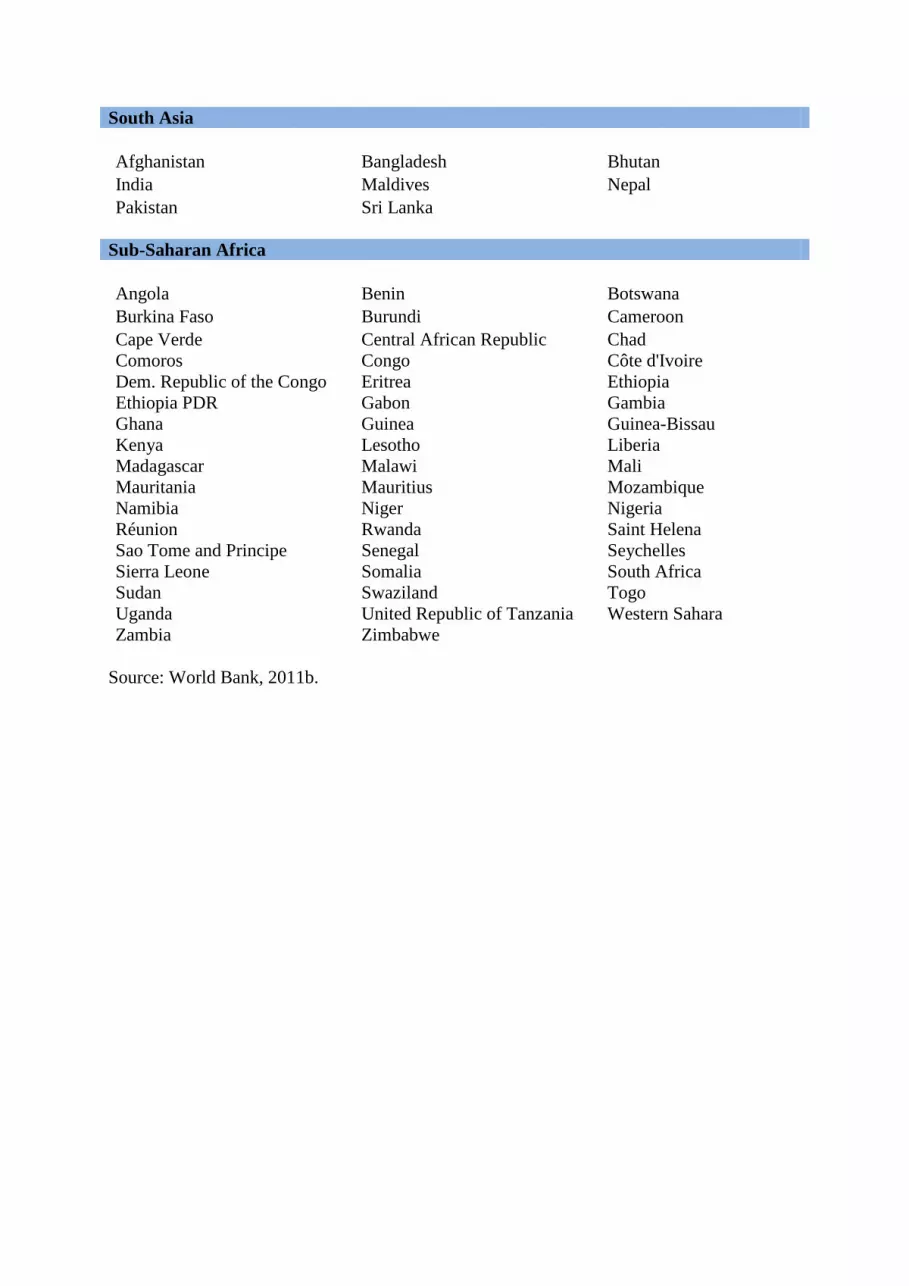
South Asia Afghanistan Bangladesh Bhutan India Maldives Nepal Pakistan Sri Lanka
Sub-Saharan Africa Angola Benin Botswana Burkina Faso Burundi Cameroon Cape Verde Central African Republic Chad Comoros Congo Côte d'Ivoire Dem. Republic of the Congo Eritrea Ethiopia Ethiopia PDR Gabon Gambia Ghana Guinea Guinea-Bissau Kenya Lesotho Liberia Madagascar Malawi Mali Mauritania Mauritius Mozambique Namibia Niger Nigeria Réunion Rwanda Saint Helena Sao Tome and Principe Senegal Seychelles Sierra Leone Somalia South Africa Sudan Swaziland Togo Uganda United Republic of Tanzania Western Sahara Zambia Zimbabwe
Source: World Bank, 2011b.
ESA Working Papers WORKING PAPERS The ESA Working Papers are produced by the Agricultural Development Economics
Division (ESA) of the Economic and Social Development Department of the Food
and Agriculture Organization of the United Nations (FAO). The series presents ESA’s
ongoing research. Working papers are circulated to stimulate discussion
and comments. They are made available to the public through the Division’s website.
The analysis and conclusions are those of the authors and do not indicate
concurrence by FAO.
AGRICULTURAL DEVELOPMENT ECONOMICS Agricultural Development Economics (ESA) is FAO’s focal point for economic
research and policy analysis on issues relating to world food security and sustainable
development. ESA contributes to the generation of knowledge and evolution of
scientific thought on hunger and poverty alleviation through its economic studies
publications which include this working paper series as well as periodic and
occasional publications.
Agricultural Development Economics (ESA)
The Food and Agriculture Organization of the United Nations Viale delle Terme di Caracalla
00153 Rome, Italy
Contact: Office of the Director
Telephone: +39 06 57054368 Facsimile: + 39 06 57055522
Website: www.fao.org/economic/esa e-mail: [email protected]