healthcare spending review ii
TRANSCRIPT
Healthcare spending review II Final report
This project has been supported by the European Social Fund
October 2019
One of the tasks of the Value for Money project is a spending review of public administration. This paper is
created by the Ministry of Finance of the Slovak Republic and the Ministry of Health of the Slovak Republic and
is an evaluation of healthcare expenses under a resolution of the Slovak government No. 202/2018, task B.6.
The evaluation was prepared by Štefan Kišš, Lucia Grajcarová, Daniel Kozák, Adam Marek and Kristína
Královičová from the Value for Money Division and Martin Smatana, Michal Štofko, Michaela Laktišová and Ján
Dudek from the Institute of Health Policies of the Ministry of Health of the Slovak Republic. Chapters 2.2 and
4.6 were prepared by Miriama Letovanec and Daniela Potočňáková from the Implementation Unit of the
Government Office of the Slovak Republic.
Acknowledgements
We would like to thank the official reviewers Zuzana Baťová (ŠÚKL), Michaela Černenko (IFP MF SR) and
Tomáš Szalay (HPI), also our colleagues from the Budgetary Policy Section of the Ministry of Finance,
Alexandra Bražinová (Faculty of Medicine of the Comenius University), Jozef Hašto (Teaching Hospital in
Trnava), Ľubomíra Izáková (SPsS SLS, University Hospital in Bratislava), Jana Ježíková (Bratislava Self-
governing Region), League for Mental Health, Zita Michlerová (SPS), Jozef Šuvada (Ministry of Health of the
SR), Tomáš Tesař (Faculty of Pharmacy of the Comenius University) and Katarína Harrison Tvarožková (Royal
London Hospital), as well as all participants of the workshop that as part of the review process, for their valuable
insights and comments during the preparation of this report.
The responsibility for mistakes and omissions lies with the authors.
Table of contents
List of tables and graphs .................................................................................................................................... 5
Introduction and summary .................................................................................................................................. 9
1 Outcomes and goals ................................................................................................................................ 13
2 Expenditures ............................................................................................................................................ 15
2.1 Expenses by area of healthcare ...................................................................................................... 17
2.2 Out-of-pocket payments for healthcare ........................................................................................... 17
3 Budget ..................................................................................................................................................... 20
3.1 No-policy-change expenses ............................................................................................................ 22
3.2 Policy-change expenses ................................................................................................................. 23
3.3 Cost-saving policy measures .......................................................................................................... 26
3.4 Expenses beyond PHI..................................................................................................................... 31
3.5 Unquantified measures and structural measures ............................................................................ 32
3.6 Better budgeting .............................................................................................................................. 33
3.7 Budget and actual expenses in 2019 .............................................................................................. 37
4 Inpatient care ........................................................................................................................................... 39
4.1 Inpatient care expenditure ............................................................................................................... 39
4.2 Quality, accessibility and effectiveness of inpatient care ................................................................ 40
4.3 Inpatient care reform – Hospital network stratification .................................................................... 40
4.4 Management of the largest hospitals .............................................................................................. 44
4.5 System of DRG reimbursements .................................................................................................... 47
4.6 Optimisation of selected operational (non-medical) expenses ........................................................ 49
4.7 Reimbursements from health insurance companies ....................................................................... 51
5 Outpatient Care ....................................................................................................................................... 52
5.1 Outpatient care expenditure ............................................................................................................ 52
5.2 Effectiveness and quality of outpatient care .................................................................................... 52
5.3 Effective primary care ..................................................................................................................... 56
5.4 One-day healthcare......................................................................................................................... 60
Additional funding of inpatient and outpatient care ...................................................................................... 62
6 Drug policy ............................................................................................................................................... 63
6.1 Total consumption of pharmaceuticals ............................................................................................ 64
6.2 Prices and reimbursement of pharmaceuticals ............................................................................... 67
6.3 Cost-effectiveness of pharmaceuticals ........................................................................................... 73
6.4 Redundant out-of-pocket payments ................................................................................................ 77
7 Common examination and treatment units .............................................................................................. 79
7.1 Laboratory examinations ................................................................................................................. 79
7.2 CT and MRI examinations ............................................................................................................... 80
8 Medical devices ....................................................................................................................................... 83
9 Special medical material .......................................................................................................................... 84
10 Waiting for healthcare .............................................................................................................................. 85
11 Staff ......................................................................................................................................................... 87
11.1 Staff remuneration........................................................................................................................... 87
11.2 Staff numbers .................................................................................................................................. 89
11.3 Increasing the attractiveness of general medicine and profession of nurses .................................. 91
11.4 Competences, staff mix................................................................................................................... 92
11.5 Remuneration mechanisms ............................................................................................................ 93
12 Standard diagnostic and treatment procedures ....................................................................................... 95
12.1 Case study – Procedures in mother and child care ......................................................................... 95
12.2 Inappropriate procedures before childbirth ..................................................................................... 97
12.3 During childbirth .............................................................................................................................. 97
12.4 After childbirth ................................................................................................................................. 99
13 Healthcare systems ............................................................................................................................... 100
13.1 Resources in healthcare ............................................................................................................... 101
13.2 Resource management ................................................................................................................. 102
13.3 Health system regulation ............................................................................................................... 106
13.4 Healthcare providers ..................................................................................................................... 106
14 Long-term care ...................................................................................................................................... 108
14.1 Expenses on long-term care ......................................................................................................... 108
14.2 Organisation of long-term care ...................................................................................................... 110
15 Disease prevention and health promotion ............................................................................................. 114
15.1 Outcomes in prevention and health promotion.............................................................................. 114
15.2 Expenses on prevention and health promotion ............................................................................. 115
15.3 Effective and cost-effective prevention and health promotion programmes .................................. 116
16 Mental health ......................................................................................................................................... 122
16.1 Mental illness burden .................................................................................................................... 122
16.2 Financial burden ........................................................................................................................... 123
16.3 Increase in accessibility and effectiveness of mental health care ................................................. 124
Annexes ......................................................................................................................................................... 129
References ..................................................................................................................................................... 163
List of abbreviations ........................................................................................................................................ 167
List of tables and graphs
List of tables
Table 1: Prevalence of diseases in population and treatable mortality (2017) ................................................. 14
Table 2: Public health insurance (PHI) expenses, 2018 ................................................................................... 17
Table 3: Budget in programme structure (in million euros) ............................................................................... 21
Table 4: 2020 budget and expenditure changes .............................................................................................. 22
Table 5: Expenditure changes compared to 2019 – PHI – no-policy-change (in million euros) ........................ 23
Table 6: Policy measures – changes in PHI compared to 2019 (in million euros) ............................................ 24
Table 7: Policy measures – PHI savings compared to 2019 (in million euros) ................................................. 27
Table 8: Policy measures – expenditure changes beyond PHI compared to 2019 – hospitals (in million euros)
......................................................................................................................................................................... 31
Table 9: PHI expenses in programme structure (in million euros) .................................................................... 35
Table 10: Example of programme structure – Inpatient Care programme ........................................................ 35
Table 11: Total PHI expenses (in million euros) ............................................................................................... 37
Table 12: Expenditure changes – PHI – no-policy-change (in million euros) ................................................... 37
Table 13: Expenditure changes – PHI – Value for Money policy changes (in million euros) ............................ 38
Table 14: Expenditure changes – PHI – cost-saving policy measures – Value for Money (in million euros) .... 38
Table 15: New budget items and savings not included in PHI budget (in million euros)................................... 38
Table 16: Overview of minimal volumes of selected procedures according to Leapfrog Group ....................... 42
Table 17: Division of hospitals according to level of HC – first suggestion from the study ............................... 44
Table 18: Obligations of 13 largest hospitals .................................................................................................... 45
Table 19: Revenues and expenses of 13 largest hospitals .............................................................................. 45
Table 20: Comparison of general hospitals according to case complexity ....................................................... 48
Table 21: Operational expenditure analysis in university and teaching hospitals in Review I. and Review II. .. 49
Table 22: Provision of selected operational services in university and teaching hospitals (2018) .................... 50
Table 23: Differences between health insurance companies in payments to hospitals* by DRG ..................... 51
Table 24: Number of doctor visits (2016) and prevalence of diseases (2017) .................................................. 54
Table 25: Savings thanks to less specialist visits ............................................................................................. 55
Table 26: Expenses and number of visits in selected SOC, 2017 .................................................................... 55
Table 27: Savings achieved by decrease in preventable hospital admissions to V3 level, 2015 ...................... 56
Table 28: Comparison of competences of general practitioners ....................................................................... 57
Table 29: Example of a medicament sold in an unfavourable package size which is not sold abroad ............. 67
Table 30: Compulsory lowering of prices when a new medicament is introduced and categorised, effective from
January 2019 .................................................................................................................................................... 70
Table 31: Thresholds to calculate cost-effectiveness of pharmaceuticals (2018) ............................................. 73
Table 32: Avoidable out-of-pocket payments by types of groups (in million euros, 2018) ................................ 78
Table 33: Overview of TOP 10 laboratory service providers in 2018 ................................................................ 80
Table 34: Example of waiting period variability for knee surgery according to facilities with the highest volume
of procedures.................................................................................................................................................... 86
Table 35: Average waiting period for a planned surgery according to health insurance companies (in days; 2018)
......................................................................................................................................................................... 86
Table 36: Total actual salary obtained by paramedical healthcare staff** in public inpatient/outpatient HC per
quarters ............................................................................................................................................................ 88
Table 37: Savings by eliminating redundant examinations during pregnancy, 2017 ........................................ 97
Table 38: Savings if the number of Caesarean sections (CS) is reduced to WHO-recommended level (10%),
2017 ................................................................................................................................................................. 98
Table 39: Cost-saving measures .................................................................................................................... 105
Table 40: Comparison of expenses on long-term care after adjustment by age structure.............................. 108
Table 41: Health promotion and prevention programmes per age group ....................................................... 125
Table 42: Development of OOP in the SR per capita (euros) ......................................................................... 130
Table 43: TOP 3 areas of inpatient and outpatient care in terms of OOP (2017) ........................................... 130
Table 44: Procedures which could be performed by general practitioners ..................................................... 133
Table 45: Comparison of basic packages, selected countries ........................................................................ 140
Table 46: Types of voluntary health insurance ............................................................................................... 140
Table 47: Imperfectly compensated patients .................................................................................................. 144
Table 48: Compensation of HIC (year) ........................................................................................................... 144
Table 49: Calculation of savings in power supply ........................................................................................... 146
Table 50: Calculation of savings in gas supply ............................................................................................... 146
Table 51: Calculation of savings in cleaning services .................................................................................... 147
Table 52: Calculation of savings in washing services ..................................................................................... 148
Table 53: Calculation of savings in catering services ..................................................................................... 148
Table 54: Calculation of savings in security services provided by employees ................................................ 149
Table 55: Calculation of savings in legal services .......................................................................................... 149
Table 56: Payment group U106 from July 1, 2019, to September 30, 2019, with a negative impact on PHI with
no added value. .............................................................................................................................................. 150
Table 57: Planned change of payment group U106 from October 1, 2019 .................................................... 150
Table 58: Advantages and disadvantages of traditional remuneration mechanisms ...................................... 154
Table 59: Number of Practising nurses in OECD countries, issues with data and solutions .......................... 158
Table 60: Programmes and sub-programmes of the proposed programme structure for PHI ........................ 162
List of graphs
Graph 1: Treatable mortality (per 100,000 citizens) ......................................................................................... 13
Graph 2: Life expectancy at birth in years ........................................................................................................ 13
Graph 3: Infant mortality (number of deaths in the first year of life per 1,000 live births) ................................. 14
Graph 4: Preventable mortality ......................................................................................................................... 14
Graph 5: Public expenditure on healthcare, 2018, %GDP ............................................................................... 15
Graph 6: Relation between the wealth of a country and healthcare expenditure, 2018 ................................... 15
Graph 7: Total expenditure on healthcare, 2018, per citizen in purchasing power parity, USD ........................ 16
Graph 8: Relation between population health and healthcare expenses, 2016 ................................................ 16
Graph 9: Healthcare expenditure (% GDP) ...................................................................................................... 16
Graph 10: Projection of age structure of the population ................................................................................... 16
Graph 11: OOP portion in overall healthcare expenditure in relation to GDP per citizen (2017) ...................... 18
Graph 12: OOP portion in overall healthcare expenditure (2017) .................................................................... 18
Graph 13: Share of households facing catastrophic health spending ............................................................... 18
Graph 14: Share of households facing impoverishing health spending ............................................................ 18
Graph 15: OOP components per type of healthcare (2015) ............................................................................. 19
Graph 16: Specialist nurse salary as a multiple of average salary, 2017 ......................................................... 20
Graph 17: Doctor salary as a multiple of average salary, 2017 ........................................................................ 20
Graph 18: Inpatient care expenditure, % of GDP ............................................................................................. 39
Graph 19: Inpatient care expenditure, % of healthcare expenditure................................................................. 39
Graph 20: Expenses per 1 bed-day, going PPP prices, 2017 .......................................................................... 40
Graph 21: Number of bed-days per 1 citizen, 2017 .......................................................................................... 40
Graph 22: Relation between quality and volume of healthcare ........................................................................ 41
Graph 23: Scope and median of volumes of oesophageal cancer resection per provider, 2014 – 2016 .......... 43
Graph 24: EBITDA of teaching and university hospitals, 2018 ......................................................................... 46
Graph 25: Revenues from health insurance companies and expenses of teaching and university hospitals ... 46
Graph 26: Proportion of selected operational expenses* in revenue from health insurance companies, 2018 46
Graph 27: Outpatient care expenditure, % of GDP, 2017 ................................................................................ 52
Graph 28: Outpatient care expenditure, portion of healthcare package, 2017 ................................................. 52
Graph 29: Number of doctor visits in offices per citizen, 2016.......................................................................... 53
Graph 30: Number of outpatient visits to GPs and specialists per 1 citizen, 2017* .......................................... 54
Graph 31: Total number of outpatient visits to GPs and specialists in millions, 2017* ..................................... 54
Graph 32: The ability of primary care in Europe to cover wide scope of practice ............................................. 57
Graph 33: Proportion of examinations without referral to specialist, 2017* ...................................................... 57
Graph 34: Share of population living in a municipality 10 or more km from the closest doctor’s office (%) ...... 58
Graph 35: One-day healthcare expenditure, % of GDP, 2017 ......................................................................... 60
Graph 36: One-day healthcare expenditure, proportion of healthcare package, 2017 ..................................... 60
Graph 37: Share of selected interventions performed in one-day care, 2017 .................................................. 61
Graph 38: Expenses on pharmaceuticals dispensed in pharmacies (2017) ..................................................... 63
Graph 39: Expenses on pharmaceuticals dispensed in pharmacies per person, going prices (in euros, 2017)48
......................................................................................................................................................................... 63
Graph 40: Overview of Slovak consumption of pharmaceuticals compared to EU countries with similar reporting
(per ATC groups, in daily defined doses – DDD, 2017) .................................................................................... 65
Graph 41: Total consumption of pharmaceuticals (groups from Graph 40, 2017, DDD per 1,000 citizens per
day) .................................................................................................................................................................. 65
Graph 42: Antibiotics consumption in 2017 (in DDD per 1,000 citizens/day; ATC group J01) ......................... 65
Graph 43: Share of generics in total consumption of pharmaceuticals reimbursed by PHI (%, 2017) ............. 70
Graph 44: Annual reimbursements for pharmaceuticals reimbursed in exceptional cases from PHI (in million
euros) ............................................................................................................................................................... 77
Graph 45: Reimbursements by HIC (in euros) for pharmaceuticals reimbursed in exceptional cases per 1,000
insured persons (for first half of the year) ......................................................................................................... 77
Graph 46: Distribution of out-of-pocket payments according to age (in million euros; 2018)............................ 78
Graph 47: Average out-of-pocket payments according to age (in euros; 2018)92 ............................................. 78
Graph 48: CETU expenses (public and private) to healthcare expenses ratio (%, 2017)................................. 79
Graph 49: Number of imaging examinations (per 1,000 citizens, 2017) ........................................................... 81
Graph 50: Comparison of standard profitability of revenues with private MRI providers (profit/revenues, %,
companies with revenues from 2 to 30 million euros in 2018) .......................................................................... 81
Graph 51: Comparison of head MRI prices ...................................................................................................... 82
Graph 52: Comparison of head CT prices99 ..................................................................................................... 82
Graph 53: Proportion of expenses on medical devices in total healthcare expenditure (%, 2017) ................... 83
Graph 54: expenses on medical devices (per citizen, in euros, 2017)101 .......................................................... 83
Graph 55: Average waiting period for joint replacement (in days, 2017) .......................................................... 85
Graph 56: Nurse salary as a multiple of average salary, 2017 ......................................................................... 87
Graph 57: Doctor salary as a multiple of average salary, 2017 ........................................................................ 87
Graph 58: Number of doctors (per 1,000 citizens), 2017 .................................................................................. 89
Graph 59: Number of doctors per specialisation .............................................................................................. 89
Graph 60: Age structure of physicians according to specialties ....................................................................... 89
Graph 61: Number of general practitioners per 100,000 citizens, 2017 ........................................................... 90
Graph 62: Number of lacking nurses according to statistical survey and MoH prognosis ................................ 91
Graph 63: Number of nurses adjusted by age structure of the population (per 1,000 citizens), 2017 .............. 91
Graph 64: Infant mortality – benchmark (number of deaths in the first year of life per 1,000 live births), 2016 96
Graf 65: Infant mortality – per population groups (number of deaths in the first year of life per 1,000 live births),
2016 ................................................................................................................................................................. 96
Graph 66: Average length of stay in hospital by type of delivery, in days, 2017 ............................................... 96
Graf 67: Relation of ALOS in case of spontaneous delivery and total infant mortality; 2017 ............................ 96
Graph 68: Proportion of Caesarean sections per 1,000 births ......................................................................... 98
Graph 69: Treatable mortality and total healthcare expenses per citizen in PPP ........................................... 100
Graph 70: Life expectancy at birth and total healthcare expenses per citizen in PPP .................................... 100
Graph 71: Development of the economic activity of VšZP ............................................................................. 104
Graph 72: Gain/loss of insured persons ......................................................................................................... 105
Graph 73: Change of average HC expenses per 1 insured person, adjusted by insurance portfolio ............. 105
Graph 74: Expenses on long-term care, % of GDP, 2016 .............................................................................. 108
Graph 75: Proportion of citizens aged 65+, 2016 ........................................................................................... 108
Graph 76: Necessary increase in expenses on long-term care, % of GDP .................................................... 109
Graph 77: Necessary increase in expenses on long-term care, in million euros ............................................ 109
Graph 78: Number of hospital admissions for a diagnosis which should be managed by home care, population
65+ ................................................................................................................................................................. 111
Graph 79: Preventable mortality, per 100,000 citizens, 2016 ......................................................................... 114
Graph 80: Disease burden including premature death (DALY) in Slovakia, % of the whole, 2017 ................. 114
Graph 81: Expenses on prevention*, % of GDP, 2017 ................................................................................... 115
Graph 82: Expenses on prevention*, % of overall healthcare expenditure, 2017 ........................................... 115
Graph 83: Measles vaccination rate ............................................................................................................... 117
Graph 84: Flu vaccination rate, % of population over 65, 2017 ...................................................................... 117
Graph 85: Proportion of women who underwent breast cancer screening (%), aged 50 – 79, 2017* ............ 117
Graph 86: Mortality of breast cancer, per 100,000 women, 2015 ................................................................... 117
Graph 87: Proportion of women (%) who underwent a routine check-up at their gynaecologist (cervix), aged
over 19 ........................................................................................................................................................... 118
Graph 88: Smoking* in 15 – 16 year olds, 2015 ............................................................................................. 119
Graph 89: Daily smoking in adults, 2016 ........................................................................................................ 119
Graph 90: Heavy episodic drinking* in 15 – 16 year olds, 2015 ..................................................................... 119
Graph 91: Alcohol consumption in adults, litres, 2016 .................................................................................... 119
Graph 92: Obesity in 7 – 8 year olds, 2017 .................................................................................................... 120
Graph 93: Obesity in adults, 2014 .................................................................................................................. 120
Graph 94: Mortality due to exposure to PM2.5 particles and ozone, 2016 ..................................................... 121
Graph 95: Difference in obesity by education, 2014 ....................................................................................... 121
Graph 96: Prevalence of diseases in population, 2017* ................................................................................. 122
Graph 97: Mental illness burden during lifetime, % of burden in life out of all diseases, SK, 2017 ................ 123
Graph 98: Proportion of untreated patients with a mental illness ................................................................... 123
Graph 99: Direct and indirect expenses related to mental disorders in Slovakia, in million euros .................. 124
Graph 100: Expenses on healthcare focused on mental disorders and total mental illness burden in DALY*124
Graph 101: Consumption of anxiety pharmaceuticals, DDD* per thousand citizens ...................................... 127
Graph 102: Consumption of antidepressants, DDD* per thousand citizens ................................................... 127
Graph 103: Increasing model performance by adding more parameters ....................................................... 145
9
Introduction and summary
Spending review is part of the government project Value for Money which aims to reform rules, optimise
processes and empower institutions to support good decision-making in the public interest and significantly
increase the value for money ratio in the Slovak public sector.
The fourth year of spending review evaluates expenses with an impact on social integration of groups at risk
of poverty and social exclusion, expenses on employment and remuneration in public administration,
expenses on agriculture and public expenses on healthcare. Interim reports identify areas with the biggest
room for improvement of effectiveness. Final reports then determine policy measures and an action plan for
their implementation.
Spending review evaluates the majority of public expenses during a term of office. The proposed policy
measures facilitate fiscal savings, better public services for citizens and/or reallocation of funds to the
government’s priorities. The review brings forward sustainable measures.
In developed countries, a spending review is a standard tool which helps governments find room for a more
efficient use of public funds in public policies as well as for savings necessary in order to fulfil national and
European fiscal obligations.
Healthcare is the second largest expenditure area in Slovak public finance after retirement pensions and it
has a huge potential to improve the health and overall quality of life of citizens.
The first healthcare spending review in 2016 identified potential savings of 363 million euros, of which the
government pledged to save 196 million euros per year by 2019.
Despite positive development in the recent years, there is still room for improvement of patients’ health by
increasing allocation efficiency. The government of the Slovak Republic thus mandated the Ministry of
Finance and Ministry of Health to carry out a second healthcare spending review in the same term of office.
On the one hand, the spending review identifies possible savings in areas where funds are not used
efficiently, on the other hand, it determines the areas to which to reallocate the saved funds.
Healthcare must be the priority of Slovak public administration due to its potential to improve well-being
of citizens, as well as due to the scale of the sector and its poor outcomes. Developed countries invest in
healthcare at a higher rate than their economies grow. Slovak healthcare expenditure is the second largest item
in public spending, but its results are far behind comparable countries.
Public healthcare expenditure is increasing and corresponds to the financial capacities. In 2020, the
expenses will reach 5.6 billion euros. In the last 10 years, they have increased by 44%, while GDP by 40%. Slovak
public healthcare expenditure equals 5.7% GDP, which is more than the average in V3 countries (5.1%) and less
than the average in EU15 countries (7.2%).
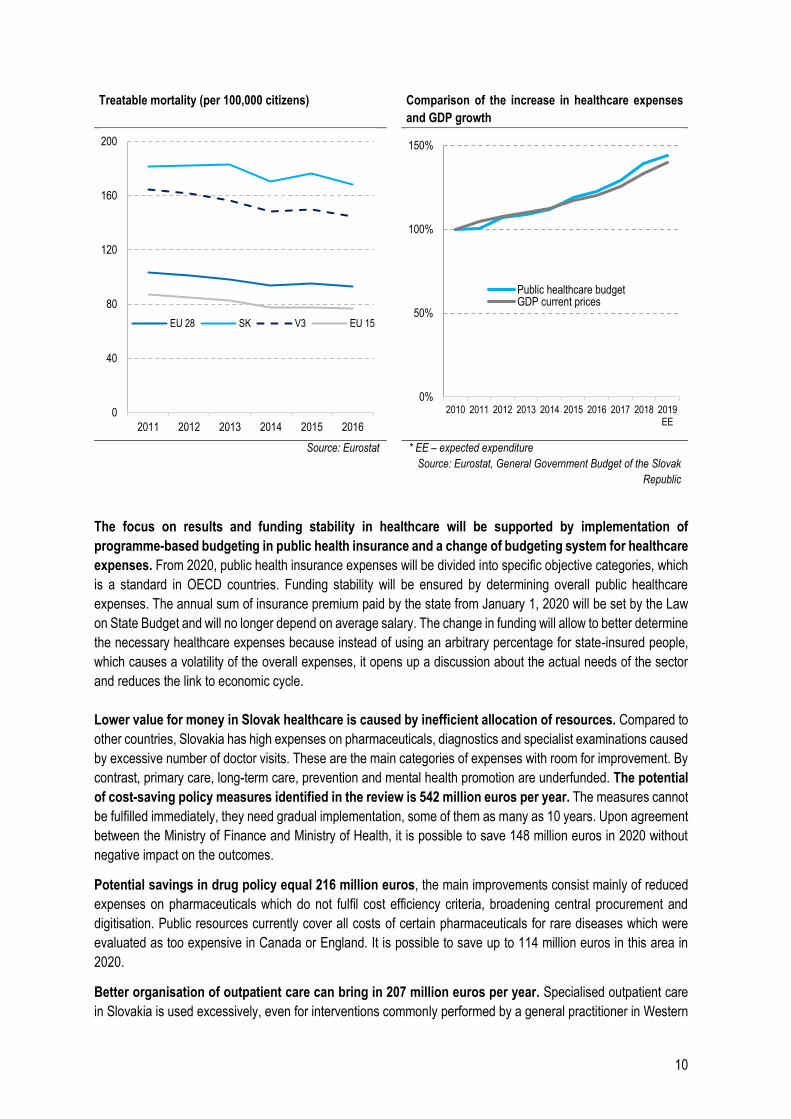
However, the outcomes of Slovak healthcare do not correspond to the expenses. Treatable mortality rate
in Slovakia is 168 deaths per 100 thousand citizens which could have been avoided by early and effective
healthcare. The annual rate in other V4 countries is 145 deaths per 100 thousand citizens. Life expectancy and
other outcome indicators lag behind in a similar fashion. The government of the Slovak Republic pledged to
reduce the number of treatable causes of death to the V3 level by 2025.
10
Treatable mortality (per 100,000 citizens) Comparison of the increase in healthcare expenses
and GDP growth
Source: Eurostat * EE – expected expenditure
Source: Eurostat, General Government Budget of the Slovak
Republic
The focus on results and funding stability in healthcare will be supported by implementation of
programme-based budgeting in public health insurance and a change of budgeting system for healthcare
expenses. From 2020, public health insurance expenses will be divided into specific objective categories, which
is a standard in OECD countries. Funding stability will be ensured by determining overall public healthcare
expenses. The annual sum of insurance premium paid by the state from January 1, 2020 will be set by the Law
on State Budget and will no longer depend on average salary. The change in funding will allow to better determine
the necessary healthcare expenses because instead of using an arbitrary percentage for state-insured people,
which causes a volatility of the overall expenses, it opens up a discussion about the actual needs of the sector
and reduces the link to economic cycle.
Lower value for money in Slovak healthcare is caused by inefficient allocation of resources. Compared to
other countries, Slovakia has high expenses on pharmaceuticals, diagnostics and specialist examinations caused
by excessive number of doctor visits. These are the main categories of expenses with room for improvement. By
contrast, primary care, long-term care, prevention and mental health promotion are underfunded. The potential
of cost-saving policy measures identified in the review is 542 million euros per year. The measures cannot
be fulfilled immediately, they need gradual implementation, some of them as many as 10 years. Upon agreement
between the Ministry of Finance and Ministry of Health, it is possible to save 148 million euros in 2020 without
negative impact on the outcomes.
Potential savings in drug policy equal 216 million euros, the main improvements consist mainly of reduced
expenses on pharmaceuticals which do not fulfil cost efficiency criteria, broadening central procurement and
digitisation. Public resources currently cover all costs of certain pharmaceuticals for rare diseases which were
evaluated as too expensive in Canada or England. It is possible to save up to 114 million euros in this area in
2020.
Better organisation of outpatient care can bring in 207 million euros per year. Specialised outpatient care
in Slovakia is used excessively, even for interventions commonly performed by a general practitioner in Western
0
40
80
120
160
200
2011 2012 2013 2014 2015 2016
EU 28 SK V3 EU 15
0%
50%
100%
150%
2010 2011 2012 2013 2014 2015 2016 2017 2018 2019EE
Public healthcare budgetGDP current prices
11
countries. This is caused by the highest number of doctor visits per citizen of all EU countries and a high rate of
referrals by general practitioners. To change this situation, it is necessary to broaden the competences and
number of general practitioners. The saved funds can be reallocated among the existing providers more
efficiently.
The potential of other cost-saving policy measures is 119 million euros. Other policy measures include
reduction of excessive use and unit prices of laboratory and imaging diagnostics, improvement of review
processes in public health insurance and more efficient purchasing of medical devices.
Resources saved by the cost-saving policy measures must be invested in underfunded areas with a
potential for better outcomes. A higher number of general practitioners along with broadening of their
competences would improve patient management and reduce the number of more expensive specialist visits,
according to best practice abroad. It is necessary to increase the salaries of nurses to international level and then
increase their number. Investments in prevention and mental health promotion reduce future burden on
healthcare and social systems and increase labour productivity. According to the experience in Western countries,
their return on investment can be very high. The value in healthcare is increased also by capital expenditure of
the Ministry of Health in hospitals amounting to 69 million euros in 2020 and 98 million euros per year in 2021
and 2022.
Population ageing and related long-term care present a huge challenge. There is a shortage of hospital and
community centre capacities and insufficient support of home care and integration of healthcare and social
services. This question will only gain more significance as the population ages. Investments in long-term care will
improve the quality of life for dependent people and their families and, at the same time, reduce the burden on
healthcare system because the necessary care will be transferred out of more expensive acute hospital beds.
In the previous years, spending review managed to save 115 million euros per year without negative
impact on citizens’ health, mainly by reducing overconsumption of pharmaceuticals, referencing prices of
special medical material to prices abroad and improving review processes in the public health insurance company.
All healthcare expenses are documented in a detailed fashion in the general government budget. The “no-
policy-change” scenario takes into consideration salary growth according to automatic salary increase
mechanism, inflation and increase in consumption of pharmaceuticals. Other expenses are divided into cost-
saving and value-increasing policy measures. The budget also takes into account population ageing, necessary
supplementary funding of the sector and introduction of new pharmaceuticals to the market. This is how
healthcare budget has been prepared since the start of the Value for Money project in 2016. The need for
supplementary funding during the year, which arose also in 2019, is caused by non-compliance with agreed
measures, new measures proposed during the year and bad management.
Expenses on salaries increase by 144 million euros year-on-year. The gravest personnel issue is not the
salary but shortage of nurses, age structure of doctors and nurses and distribution of doctors among
different specialisations. The salaries of Slovak doctors and nurses, calculated as a multiple of average salary
and thus taking into consideration the economic level of Slovakia, are comparable to other European countries.
They increase annually according to average salary in the economy thanks to automatic salary increase
mechanism. The specialist ratio is one general practitioner to three specialists, while there are only 60% more
specialists than GPs in Western countries. As much as 43% of general practitioners and 20% of nurses are more
than 60 years old. Slovakia lacks at least 3,600 nurses.
Hospital stratification will increase healthcare quality, shorten average hospital stay and increase resources
per admitted patient. Acute hospital beds freed up by the stratification will be transformed into follow-up care
capacities. University and teaching hospitals still generate losses. This could be resolved by their supplementary
funding and stratification.
12
Implementing and observing standard processes based on best practice abroad is another tool to
improve the quality of healthcare and save resources, but these are slow to be created in Slovakia.
Incorrect resource allocation in Slovak healthcare is well illustrated by obstetrics. Infant mortality in
Slovakia is higher than e.g. in Great Britain, even though British women go to fewer pre-natal examinations, the
majority of interventions and consultations is done by midwives instead of doctors, more births take place outside
of hospitals and hospital stay after giving birth is much shorter – 1.4 day compared to 4.7 in Slovakia.
Slovak citizens pay 1 billion euros extra in out-of-pocket payments for healthcare. The private to public
funds ratio is comparable to European countries but the Slovak system of patient OOP is chaotic and lacks clear
strategy. Co-payments for pharmaceuticals amount to 40% of private payments, the rest includes medical
devices, dental and residential care. Patients would save 66 million euros if they chose a generic medication
instead of the original medication every time this is possible.
Systemic reforms without direct financial impact, such as e-Health and DRG, are necessary in order to
improve Slovak healthcare. Medical records digitisation and e-prescriptions within e-Health reduce unwanted
overconsumption and improve doctors’ awareness of pharmaceuticals used by their patient, which in turn reduces
the number of adverse interactions. Sharing examination results among doctors will help avoid duplicate
examinations. Implementation of other changes related to DRG will increase transparency and fairness of
healthcare payments and has the potential to improve the efficiency of hospital management. Both policy
measures have achieved significant progress in 2019 but they are still not fully functional. This delay robs Slovak
healthcare of the expected benefits.
13
1 Outcomes and goals
Population health is to a great extent influenced by the functioning of healthcare system in the country.
The state should provide early and accessible healthcare to its citizens, resulting in saved lives, prevention,
diagnostics, treatment of illnesses and relief of their manifestations. According to OECD (2017), a well-functioning
healthcare system requires a correctly adjusted funding mechanism, educated and adequately paid medical staff,
policies and decisions based on reliable data and infrastructure corresponding to technological progress.
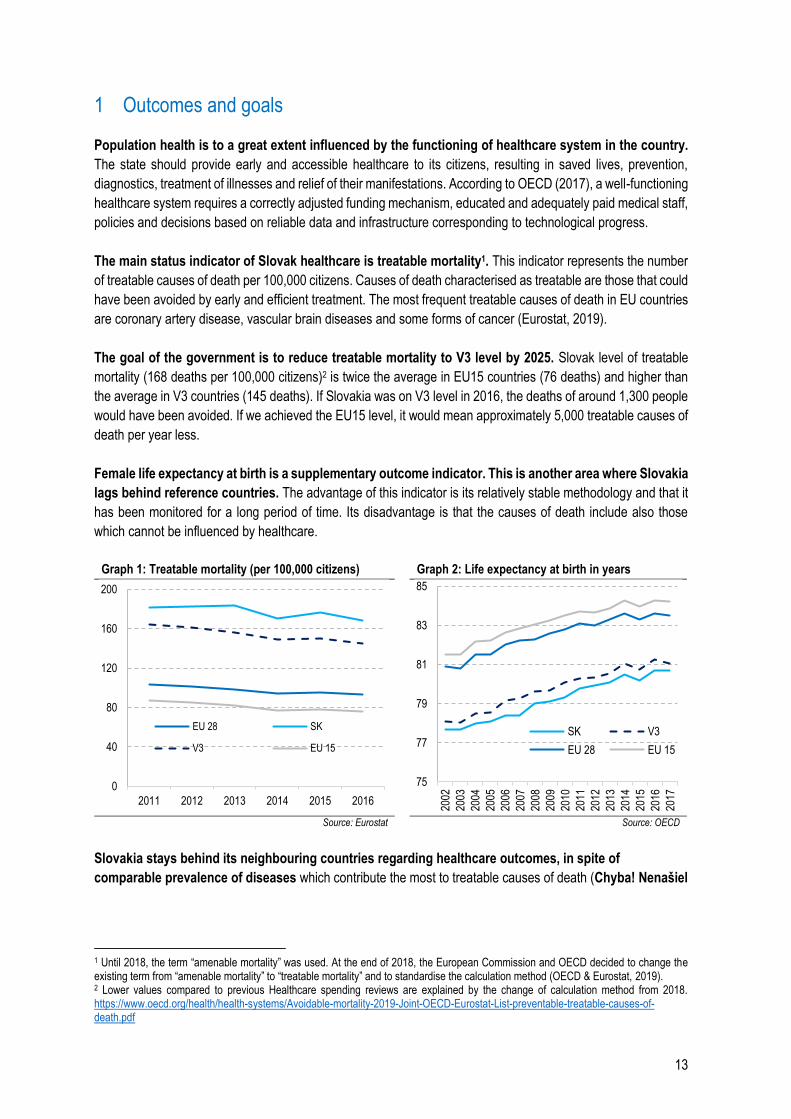
The main status indicator of Slovak healthcare is treatable mortality1. This indicator represents the number
of treatable causes of death per 100,000 citizens. Causes of death characterised as treatable are those that could
have been avoided by early and efficient treatment. The most frequent treatable causes of death in EU countries
are coronary artery disease, vascular brain diseases and some forms of cancer (Eurostat, 2019).
The goal of the government is to reduce treatable mortality to V3 level by 2025. Slovak level of treatable
mortality (168 deaths per 100,000 citizens)2 is twice the average in EU15 countries (76 deaths) and higher than
the average in V3 countries (145 deaths). If Slovakia was on V3 level in 2016, the deaths of around 1,300 people
would have been avoided. If we achieved the EU15 level, it would mean approximately 5,000 treatable causes of
death per year less.
Female life expectancy at birth is a supplementary outcome indicator. This is another area where Slovakia
lags behind reference countries. The advantage of this indicator is its relatively stable methodology and that it
has been monitored for a long period of time. Its disadvantage is that the causes of death include also those
which cannot be influenced by healthcare.
Graph 1: Treatable mortality (per 100,000 citizens) Graph 2: Life expectancy at birth in years
Source: Eurostat Source: OECD
Slovakia stays behind its neighbouring countries regarding healthcare outcomes, in spite of
comparable prevalence of diseases which contribute the most to treatable causes of death (Chyba! Nenašiel
1 Until 2018, the term “amenable mortality” was used. At the end of 2018, the European Commission and OECD decided to change the existing term from “amenable mortality” to “treatable mortality” and to standardise the calculation method (OECD & Eurostat, 2019). 2 Lower values compared to previous Healthcare spending reviews are explained by the change of calculation method from 2018. https://www.oecd.org/health/health-systems/Avoidable-mortality-2019-Joint-OECD-Eurostat-List-preventable-treatable-causes-of-death.pdf
0
40
80
120
160
200
2011 2012 2013 2014 2015 2016
EU 28 SK
V3 EU 15
75
77
79
81
83
85
2002
2003
2004
2005
2006
2007
2008
2009
2010
2011
2012
2013
2014
2015
2016
2017
SK V3
EU 28 EU 15
14
sa žiaden zdroj odkazov.). According to Institute for Health Metrics and Evaluation3, Slovakia even has a lower
prevalence of cardiovascular diseases, chronic respiratory diseases, diabetes and renal diseases.
Table 1: Prevalence of diseases in population and treatable mortality (2017)
Treatable mortality
100,000 citizens
Prevalence of diseases in population
Cardio- vascular
Chronic respiratory
Oncological Diabetes and renal
Neurological Digestive
SK 168 13% 10% 3% 17% 48% 30% V3 145 15% 13% 3% 21% 48% 30% EU15 76 12% 13% 4% 19% 51% 27%
Source: GBDCN, Eurostat
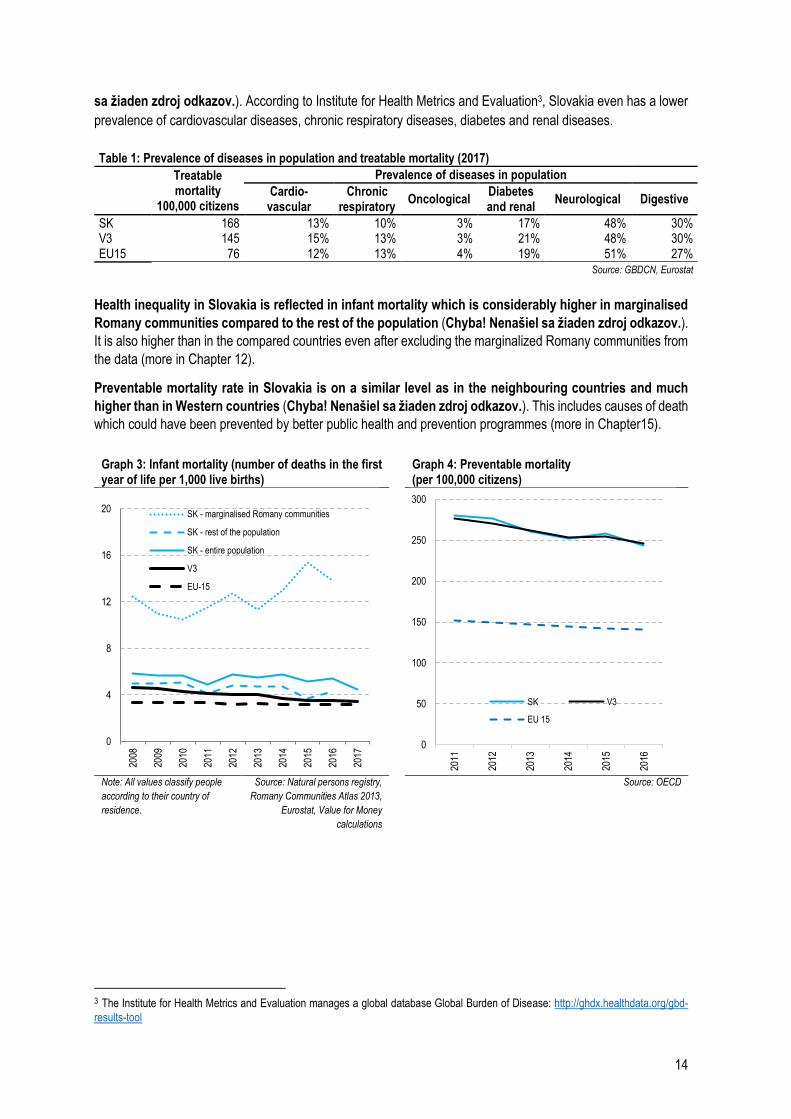
Health inequality in Slovakia is reflected in infant mortality which is considerably higher in marginalised
Romany communities compared to the rest of the population (Chyba! Nenašiel sa žiaden zdroj odkazov.).
It is also higher than in the compared countries even after excluding the marginalized Romany communities from
the data (more in Chapter 12).
Preventable mortality rate in Slovakia is on a similar level as in the neighbouring countries and much
higher than in Western countries (Chyba! Nenašiel sa žiaden zdroj odkazov.). This includes causes of death
which could have been prevented by better public health and prevention programmes (more in Chapter15).
Graph 3: Infant mortality (number of deaths in the first year of life per 1,000 live births)
Graph 4: Preventable mortality (per 100,000 citizens)
Note: All values classify people
according to their country of
residence.
Source: Natural persons registry,
Romany Communities Atlas 2013,
Eurostat, Value for Money
calculations
Source: OECD
3 The Institute for Health Metrics and Evaluation manages a global database Global Burden of Disease: http://ghdx.healthdata.org/gbd-
results-tool
0
4
8
12
16
20
2008
2009
2010
2011
2012
2013
2014
2015
2016
2017
SK - marginalised Romany communities
SK - rest of the population
SK - entire population
V3
EU-15
0
50
100
150
200
250
300
2011
2012
2013
2014
2015
2016
SK V3
EU 15
15
2 Expenditures
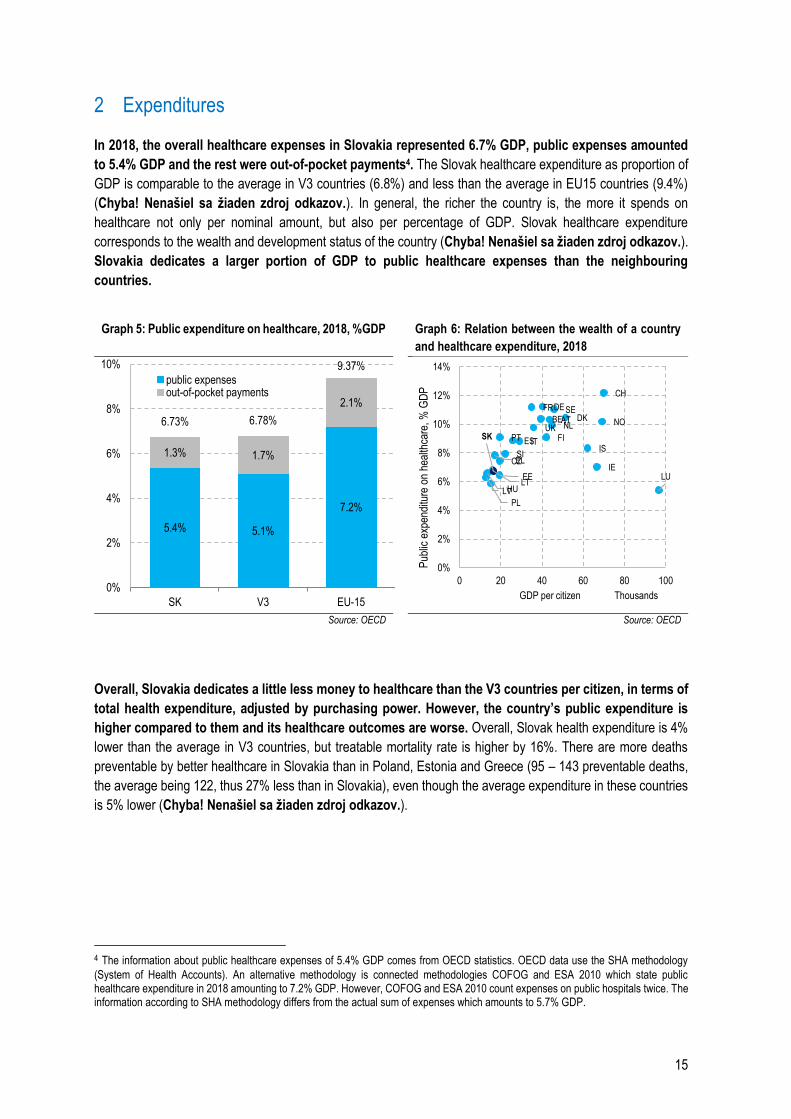
In 2018, the overall healthcare expenses in Slovakia represented 6.7% GDP, public expenses amounted
to 5.4% GDP and the rest were out-of-pocket payments4. The Slovak healthcare expenditure as proportion of
GDP is comparable to the average in V3 countries (6.8%) and less than the average in EU15 countries (9.4%)
(Chyba! Nenašiel sa žiaden zdroj odkazov.). In general, the richer the country is, the more it spends on
healthcare not only per nominal amount, but also per percentage of GDP. Slovak healthcare expenditure
corresponds to the wealth and development status of the country (Chyba! Nenašiel sa žiaden zdroj odkazov.).
Slovakia dedicates a larger portion of GDP to public healthcare expenses than the neighbouring
countries.
Graph 5: Public expenditure on healthcare, 2018, %GDP Graph 6: Relation between the wealth of a country
and healthcare expenditure, 2018
Source: OECD Source: OECD
Overall, Slovakia dedicates a little less money to healthcare than the V3 countries per citizen, in terms of
total health expenditure, adjusted by purchasing power. However, the country’s public expenditure is
higher compared to them and its healthcare outcomes are worse. Overall, Slovak health expenditure is 4%
lower than the average in V3 countries, but treatable mortality rate is higher by 16%. There are more deaths
preventable by better healthcare in Slovakia than in Poland, Estonia and Greece (95 – 143 preventable deaths,
the average being 122, thus 27% less than in Slovakia), even though the average expenditure in these countries
is 5% lower (Chyba! Nenašiel sa žiaden zdroj odkazov.).
4 The information about public healthcare expenses of 5.4% GDP comes from OECD statistics. OECD data use the SHA methodology
(System of Health Accounts). An alternative methodology is connected methodologies COFOG and ESA 2010 which state public healthcare expenditure in 2018 amounting to 7.2% GDP. However, COFOG and ESA 2010 count expenses on public hospitals twice. The information according to SHA methodology differs from the actual sum of expenses which amounts to 5.7% GDP.
5.4% 5.1%
7.2%
1.3% 1.7%
2.1%
6.73% 6.78%
9.37%
0%
2%
4%
6%
8%
10%
SK V3 EU-15
public expensesout-of-pocket payments
ATBE
CZ
DK
EE
FI
FRDE
EL
HU
IS
IE
IT
LVLT
LU
NL NO
PL
PTSK
SI
ES
SE
CH
UK
0%
2%
4%
6%
8%
10%
12%
14%
0 20 40 60 80 100
Pub
lic e
xpen
ditu
re o
n he
alth
care
, % G
DP
GDP per citizen Thousands
16
Graph 7: Total expenditure on healthcare, 2018, per
citizen in purchasing power parity, USD Graph 8: Relation between population health and
healthcare expenses, 2016
Source: OECD Source: OECD, Eurostat
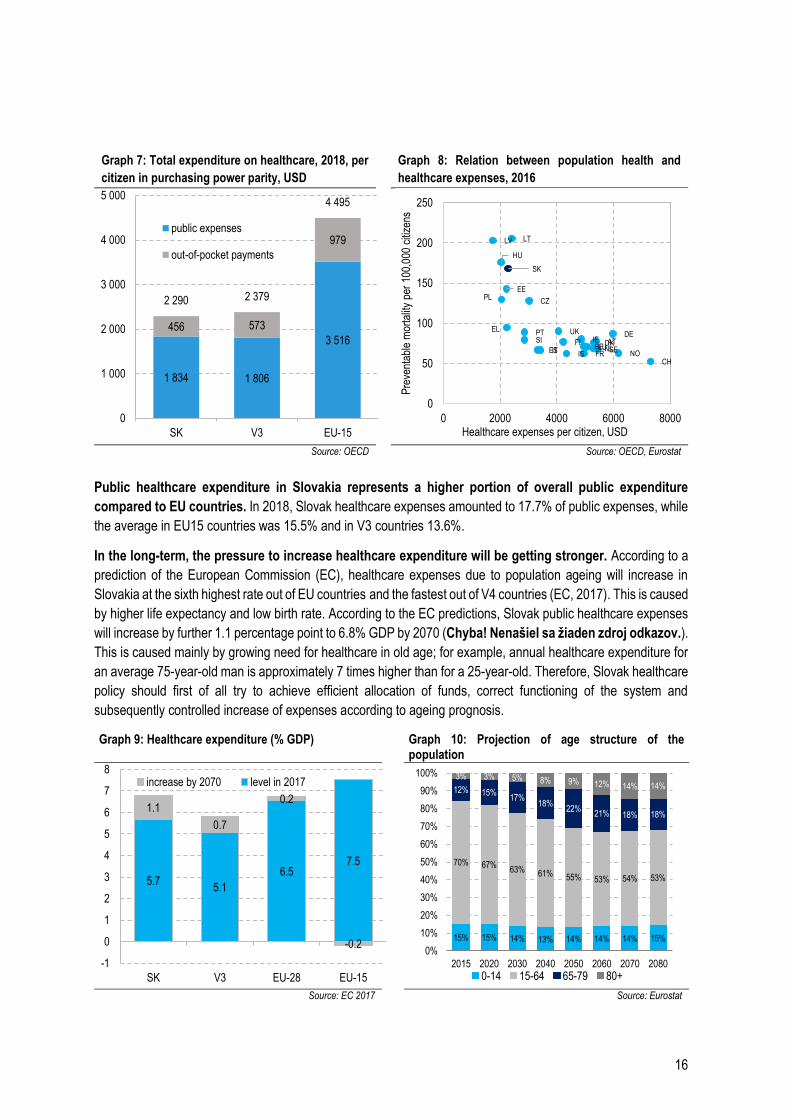
Public healthcare expenditure in Slovakia represents a higher portion of overall public expenditure
compared to EU countries. In 2018, Slovak healthcare expenses amounted to 17.7% of public expenses, while
the average in EU15 countries was 15.5% and in V3 countries 13.6%.
In the long-term, the pressure to increase healthcare expenditure will be getting stronger. According to a
prediction of the European Commission (EC), healthcare expenses due to population ageing will increase in
Slovakia at the sixth highest rate out of EU countries and the fastest out of V4 countries (EC, 2017). This is caused
by higher life expectancy and low birth rate. According to the EC predictions, Slovak public healthcare expenses
will increase by further 1.1 percentage point to 6.8% GDP by 2070 (Chyba! Nenašiel sa žiaden zdroj odkazov.).
This is caused mainly by growing need for healthcare in old age; for example, annual healthcare expenditure for
an average 75-year-old man is approximately 7 times higher than for a 25-year-old. Therefore, Slovak healthcare
policy should first of all try to achieve efficient allocation of funds, correct functioning of the system and
subsequently controlled increase of expenses according to ageing prognosis.
Graph 9: Healthcare expenditure (% GDP) Graph 10: Projection of age structure of the population
Source: EC 2017 Source: Eurostat
1 834 1 806
3 516456 573
979
2 290 2 379
4 495
0
1 000
2 000
3 000
4 000
5 000
SK V3 EU-15
public expenses
out-of-pocket payments
ATBE
CZ
DK
EE
FI
FR
DEEL
HU
IS
IE
IT
LV LT
LUNLNO
PL
PT
SK
SI
ES SE
CH
UK
0
50
100
150
200
250
0 2000 4000 6000 8000P
reve
ntab
le m
orta
lity
per
100,
000
citiz
ens
Healthcare expenses per citizen, USD
5.75.1
6.57.5
1.1
0.7
0.2
-0.2
-1
0
1
2
3
4
5
6
7
8
SK V3 EU-28 EU-15
increase by 2070 level in 2017
15% 15% 14% 13% 14% 14% 14% 15%
70% 67%63% 61% 55% 53% 54% 53%
12% 15%17%
18%22%
21% 18% 18%
3% 3% 5% 8% 9% 12% 14% 14%
0%
10%
20%
30%
40%
50%
60%
70%
80%
90%
100%
2015 2020 2030 2040 2050 2060 2070 2080
0-14 15-64 65-79 80+
17
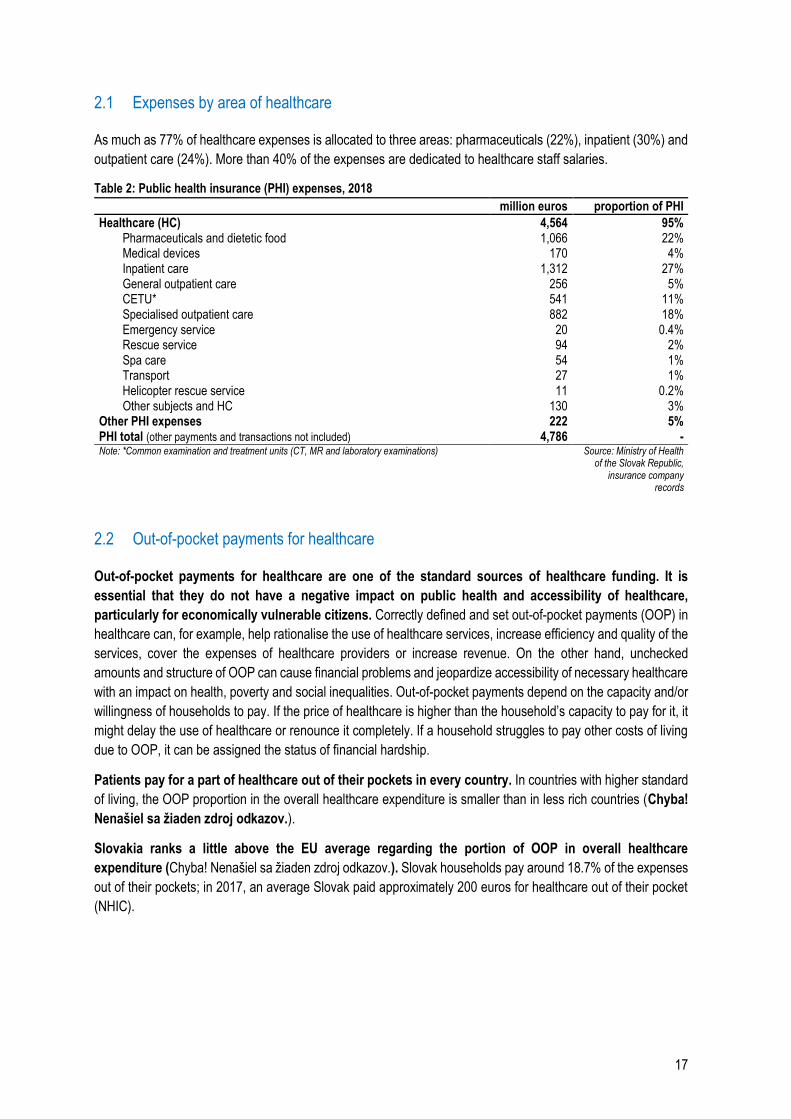
2.1 Expenses by area of healthcare
As much as 77% of healthcare expenses is allocated to three areas: pharmaceuticals (22%), inpatient (30%) and
outpatient care (24%). More than 40% of the expenses are dedicated to healthcare staff salaries.
Table 2: Public health insurance (PHI) expenses, 2018 million euros proportion of PHI
Healthcare (HC) 4,564 95% Pharmaceuticals and dietetic food 1,066 22% Medical devices 170 4% Inpatient care 1,312 27% General outpatient care 256 5% CETU* 541 11% Specialised outpatient care 882 18% Emergency service 20 0.4% Rescue service 94 2% Spa care 54 1% Transport 27 1% Helicopter rescue service 11 0.2% Other subjects and HC 130 3%
Other PHI expenses 222 5% PHI total (other payments and transactions not included) 4,786 - Note: *Common examination and treatment units (CT, MR and laboratory examinations)
Source: Ministry of Health of the Slovak Republic,
insurance company records
2.2 Out-of-pocket payments for healthcare
Out-of-pocket payments for healthcare are one of the standard sources of healthcare funding. It is
essential that they do not have a negative impact on public health and accessibility of healthcare,
particularly for economically vulnerable citizens. Correctly defined and set out-of-pocket payments (OOP) in
healthcare can, for example, help rationalise the use of healthcare services, increase efficiency and quality of the
services, cover the expenses of healthcare providers or increase revenue. On the other hand, unchecked
amounts and structure of OOP can cause financial problems and jeopardize accessibility of necessary healthcare
with an impact on health, poverty and social inequalities. Out-of-pocket payments depend on the capacity and/or
willingness of households to pay. If the price of healthcare is higher than the household’s capacity to pay for it, it
might delay the use of healthcare or renounce it completely. If a household struggles to pay other costs of living
due to OOP, it can be assigned the status of financial hardship.
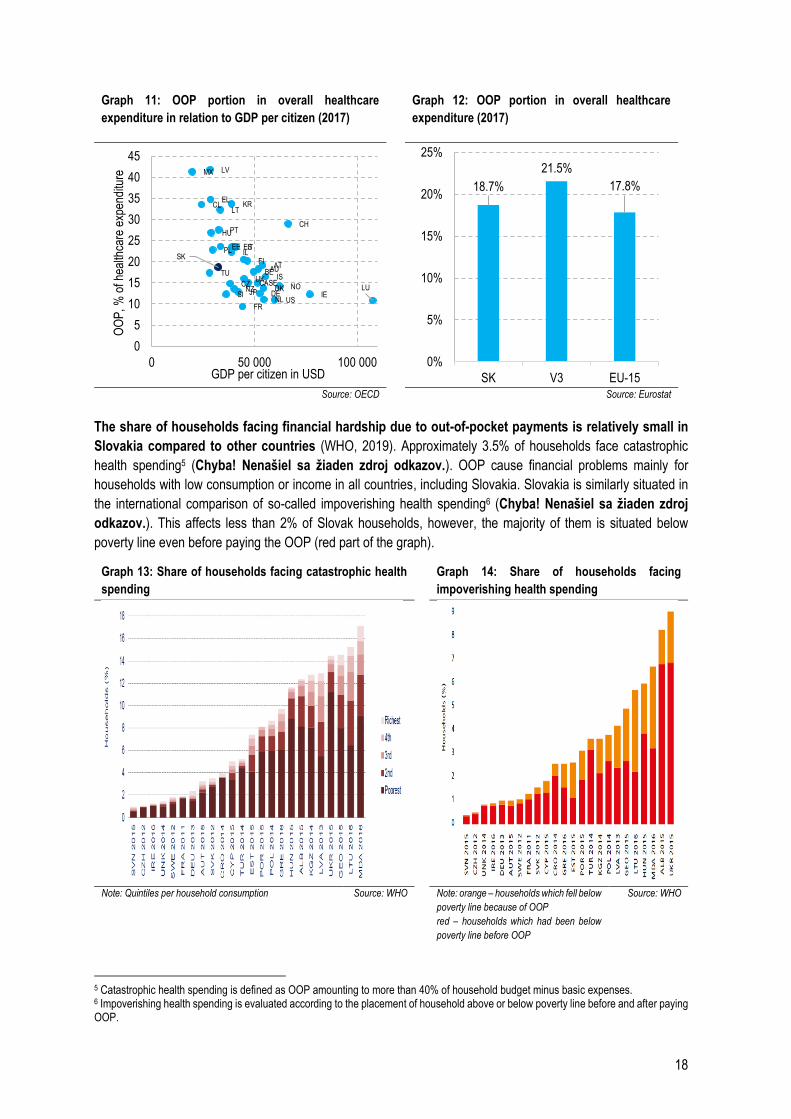
Patients pay for a part of healthcare out of their pockets in every country. In countries with higher standard
of living, the OOP proportion in the overall healthcare expenditure is smaller than in less rich countries (Chyba!
Nenašiel sa žiaden zdroj odkazov.).
Slovakia ranks a little above the EU average regarding the portion of OOP in overall healthcare
expenditure (Chyba! Nenašiel sa žiaden zdroj odkazov.). Slovak households pay around 18.7% of the expenses
out of their pockets; in 2017, an average Slovak paid approximately 200 euros for healthcare out of their pocket
(NHIC).
18
Graph 11: OOP portion in overall healthcare
expenditure in relation to GDP per citizen (2017) Graph 12: OOP portion in overall healthcare
expenditure (2017)
Source: OECD Source: Eurostat
The share of households facing financial hardship due to out-of-pocket payments is relatively small in
Slovakia compared to other countries (WHO, 2019). Approximately 3.5% of households face catastrophic
health spending5 (Chyba! Nenašiel sa žiaden zdroj odkazov.). OOP cause financial problems mainly for
households with low consumption or income in all countries, including Slovakia. Slovakia is similarly situated in
the international comparison of so-called impoverishing health spending6 (Chyba! Nenašiel sa žiaden zdroj
odkazov.). This affects less than 2% of Slovak households, however, the majority of them is situated below
poverty line even before paying the OOP (red part of the graph).
Graph 13: Share of households facing catastrophic health
spending
Graph 14: Share of households facing
impoverishing health spending
Note: Quintiles per household consumption Source: WHO Note: orange – households which fell below
poverty line because of OOP
red – households which had been below
poverty line before OOP
Source: WHO
5 Catastrophic health spending is defined as OOP amounting to more than 40% of household budget minus basic expenses. 6 Impoverishing health spending is evaluated according to the placement of household above or below poverty line before and after paying OOP.
FR
LU
USNLIESI DEJPNZ DK NOCZ CASE
UK ISTU BEAU
SKAT
FIILPL ITESEE
HUPTCH
LTCL KR
EL
MX LV
0
5
10
15
20
25
30
35
40
45
0 50 000 100 000
OO
P, %
of h
ealth
care
exp
endi
ture
GDP per citizen in USD
18.7%
21.5%
17.8%
0%
5%
10%
15%
20%
25%
SK V3 EU-15
19
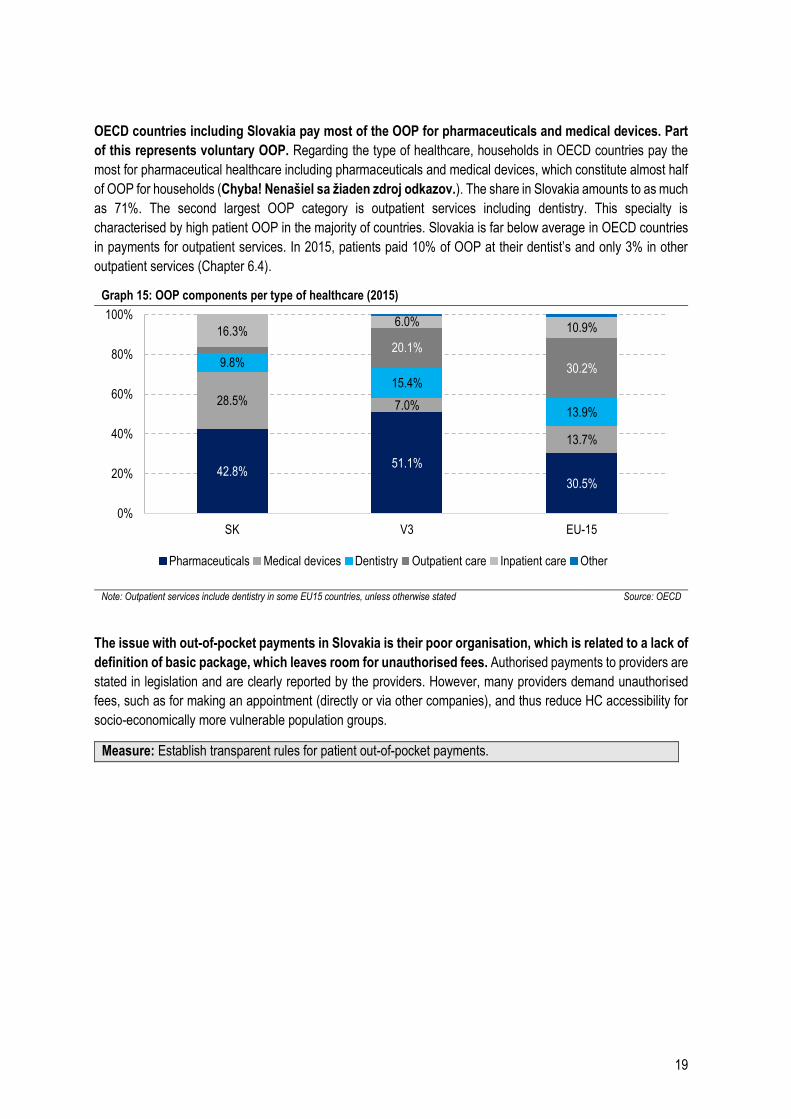
OECD countries including Slovakia pay most of the OOP for pharmaceuticals and medical devices. Part
of this represents voluntary OOP. Regarding the type of healthcare, households in OECD countries pay the
most for pharmaceutical healthcare including pharmaceuticals and medical devices, which constitute almost half
of OOP for households (Chyba! Nenašiel sa žiaden zdroj odkazov.). The share in Slovakia amounts to as much
as 71%. The second largest OOP category is outpatient services including dentistry. This specialty is
characterised by high patient OOP in the majority of countries. Slovakia is far below average in OECD countries
in payments for outpatient services. In 2015, patients paid 10% of OOP at their dentist’s and only 3% in other
outpatient services (Chapter 6.4).
Graph 15: OOP components per type of healthcare (2015)
Note: Outpatient services include dentistry in some EU15 countries, unless otherwise stated Source: OECD
The issue with out-of-pocket payments in Slovakia is their poor organisation, which is related to a lack of
definition of basic package, which leaves room for unauthorised fees. Authorised payments to providers are
stated in legislation and are clearly reported by the providers. However, many providers demand unauthorised
fees, such as for making an appointment (directly or via other companies), and thus reduce HC accessibility for
socio-economically more vulnerable population groups.
Measure: Establish transparent rules for patient out-of-pocket payments.
42.8%51.1%
30.5%
28.5% 7.0%
13.7%
9.8%
15.4%
13.9%
20.1%
30.2%
16.3%6.0% 10.9%
0%
20%
40%
60%
80%
100%
SK V3 EU-15
Pharmaceuticals Medical devices Dentistry Outpatient care Inpatient care Other
20
3 Budget
New budget for 2020 allocates 5.6 billion to healthcare, of which public health insurance represents 5,418
million euros. Beyond public health insurance resources, further 69 million euros will be invested in hospitals as
capital expenditure and the rest is intended for current expenditure of the Ministry of Health. Therefore, public
health insurance expenses will be 487 million euros higher compared to the 2019 budget.
The funds in the new budget will be used for priorities which will improve healthcare outcomes the most
and bring patients more value for money. In 2020, expenses on follow-up healthcare in hospitals or at home
will increase, which will in turn improve follow-up treatment and accessibility of professional care for chronically
ill patients, particularly the elderly. Investments in follow-up and long-term care are necessary in order to cover
the needs of fast-ageing population.
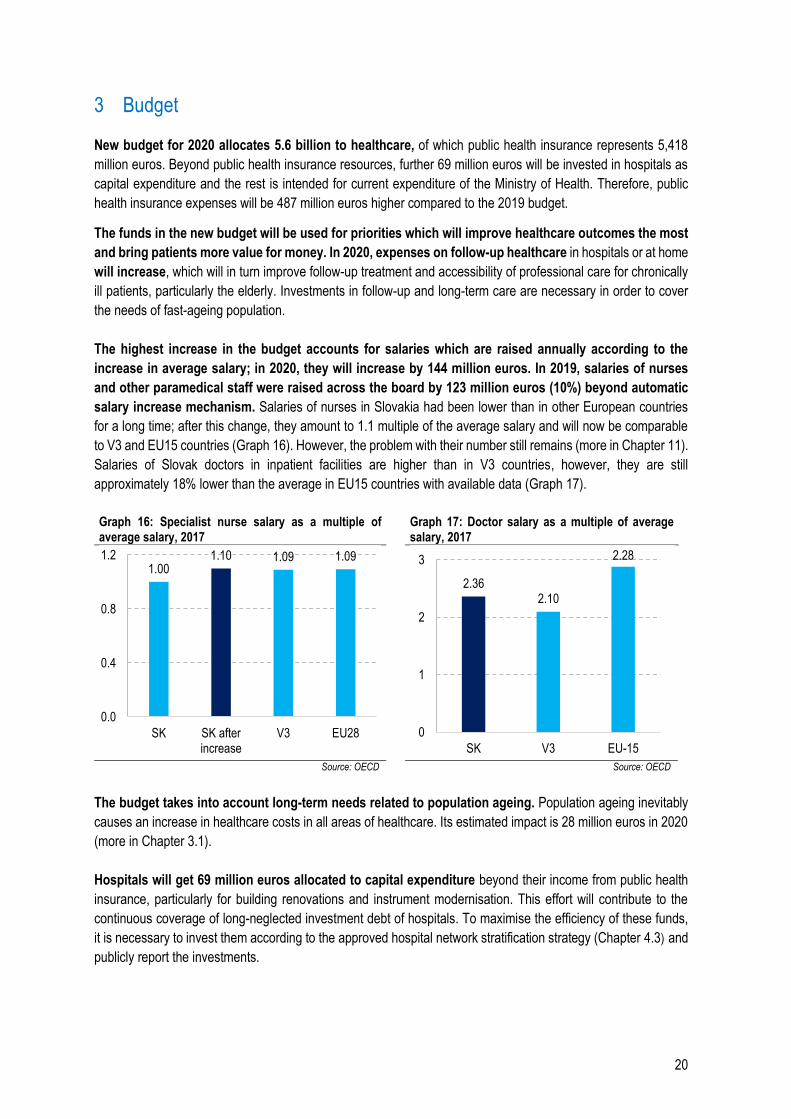
The highest increase in the budget accounts for salaries which are raised annually according to the
increase in average salary; in 2020, they will increase by 144 million euros. In 2019, salaries of nurses
and other paramedical staff were raised across the board by 123 million euros (10%) beyond automatic
salary increase mechanism. Salaries of nurses in Slovakia had been lower than in other European countries
for a long time; after this change, they amount to 1.1 multiple of the average salary and will now be comparable
to V3 and EU15 countries (Graph 16). However, the problem with their number still remains (more in Chapter 11).
Salaries of Slovak doctors in inpatient facilities are higher than in V3 countries, however, they are still
approximately 18% lower than the average in EU15 countries with available data (Graph 17).
Graph 16: Specialist nurse salary as a multiple of average salary, 2017
Graph 17: Doctor salary as a multiple of average salary, 2017
Source: OECD Source: OECD
The budget takes into account long-term needs related to population ageing. Population ageing inevitably
causes an increase in healthcare costs in all areas of healthcare. Its estimated impact is 28 million euros in 2020
(more in Chapter 3.1).
Hospitals will get 69 million euros allocated to capital expenditure beyond their income from public health
insurance, particularly for building renovations and instrument modernisation. This effort will contribute to the
continuous coverage of long-neglected investment debt of hospitals. To maximise the efficiency of these funds,
it is necessary to invest them according to the approved hospital network stratification strategy (Chapter 4.3) and
publicly report the investments.
1.001.10 1.09 1.09
0.0
0.4
0.8
1.2
SK SK afterincrease
V3 EU28
2.362.10
2.28
0
1
2
3
SK V3 EU-15
21
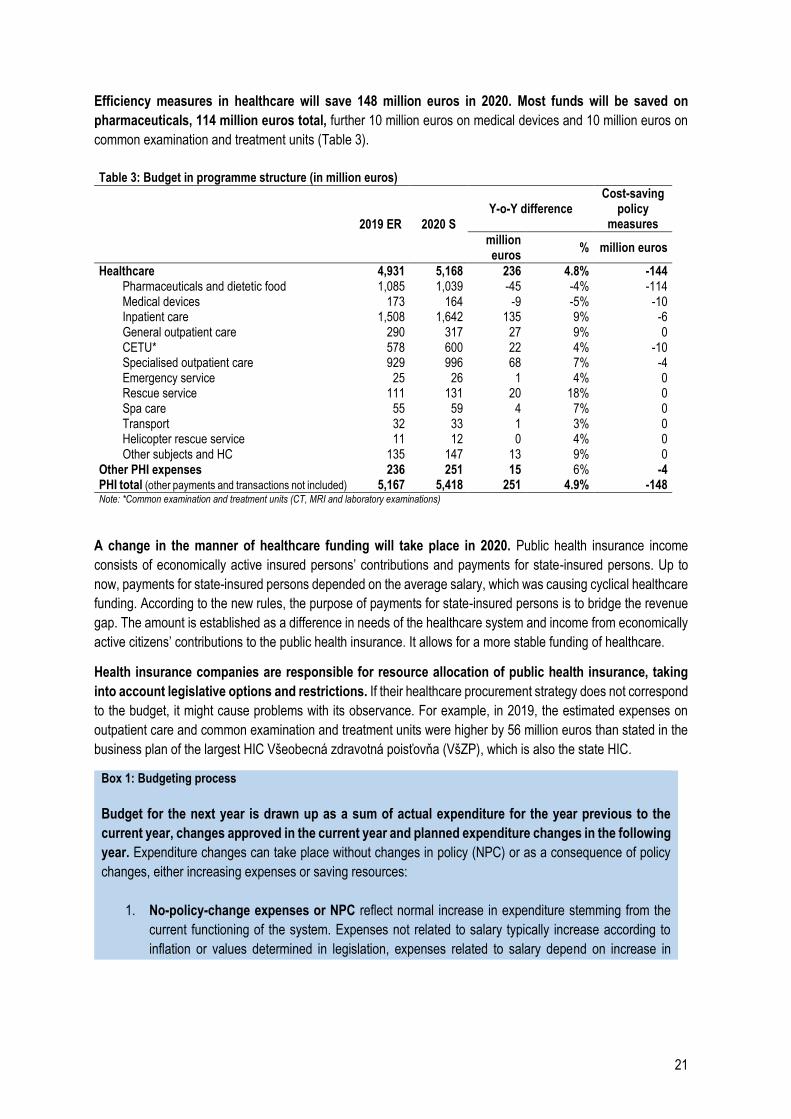
Efficiency measures in healthcare will save 148 million euros in 2020. Most funds will be saved on
pharmaceuticals, 114 million euros total, further 10 million euros on medical devices and 10 million euros on
common examination and treatment units (Table 3).
Table 3: Budget in programme structure (in million euros)
2019 ER 2020 S Y-o-Y difference
Cost-saving policy
measures
million euros
% million euros
Healthcare 4,931 5,168 236 4.8% -144 Pharmaceuticals and dietetic food 1,085 1,039 -45 -4% -114 Medical devices 173 164 -9 -5% -10 Inpatient care 1,508 1,642 135 9% -6 General outpatient care 290 317 27 9% 0 CETU* 578 600 22 4% -10 Specialised outpatient care 929 996 68 7% -4 Emergency service 25 26 1 4% 0 Rescue service 111 131 20 18% 0 Spa care 55 59 4 7% 0 Transport 32 33 1 3% 0 Helicopter rescue service 11 12 0 4% 0 Other subjects and HC 135 147 13 9% 0
Other PHI expenses 236 251 15 6% -4 PHI total (other payments and transactions not included) 5,167 5,418 251 4.9% -148 Note: *Common examination and treatment units (CT, MRI and laboratory examinations)
A change in the manner of healthcare funding will take place in 2020. Public health insurance income
consists of economically active insured persons’ contributions and payments for state-insured persons. Up to
now, payments for state-insured persons depended on the average salary, which was causing cyclical healthcare
funding. According to the new rules, the purpose of payments for state-insured persons is to bridge the revenue
gap. The amount is established as a difference in needs of the healthcare system and income from economically
active citizens’ contributions to the public health insurance. It allows for a more stable funding of healthcare.
Health insurance companies are responsible for resource allocation of public health insurance, taking
into account legislative options and restrictions. If their healthcare procurement strategy does not correspond
to the budget, it might cause problems with its observance. For example, in 2019, the estimated expenses on
outpatient care and common examination and treatment units were higher by 56 million euros than stated in the
business plan of the largest HIC Všeobecná zdravotná poisťovňa (VšZP), which is also the state HIC.
Box 1: Budgeting process
Budget for the next year is drawn up as a sum of actual expenditure for the year previous to the
current year, changes approved in the current year and planned expenditure changes in the following
year. Expenditure changes can take place without changes in policy (NPC) or as a consequence of policy
changes, either increasing expenses or saving resources:
1. No-policy-change expenses or NPC reflect normal increase in expenditure stemming from the
current functioning of the system. Expenses not related to salary typically increase according to
inflation or values determined in legislation, expenses related to salary depend on increase in
22
average salary and valid regulations (for example automatic salary increase mechanism7 in
inpatient care).
2. Policy-change expenses or PC represent an increase in expenses caused by value-increasing policy
measures or other measures. Value for Money value-increasing policy measures improve the quality
and accessibility of healthcare. They are a result of the spending review. Other changes in policies
increase expenditure as a result of approved legislation changes.
Current policy changes (PC) will become part of the no-policy-change (NPC) scenario when the next
budget is created since they will already be part of valid legislation for that year. A measure remains
classified as a policy change if it is implemented gradually over the course of several years.
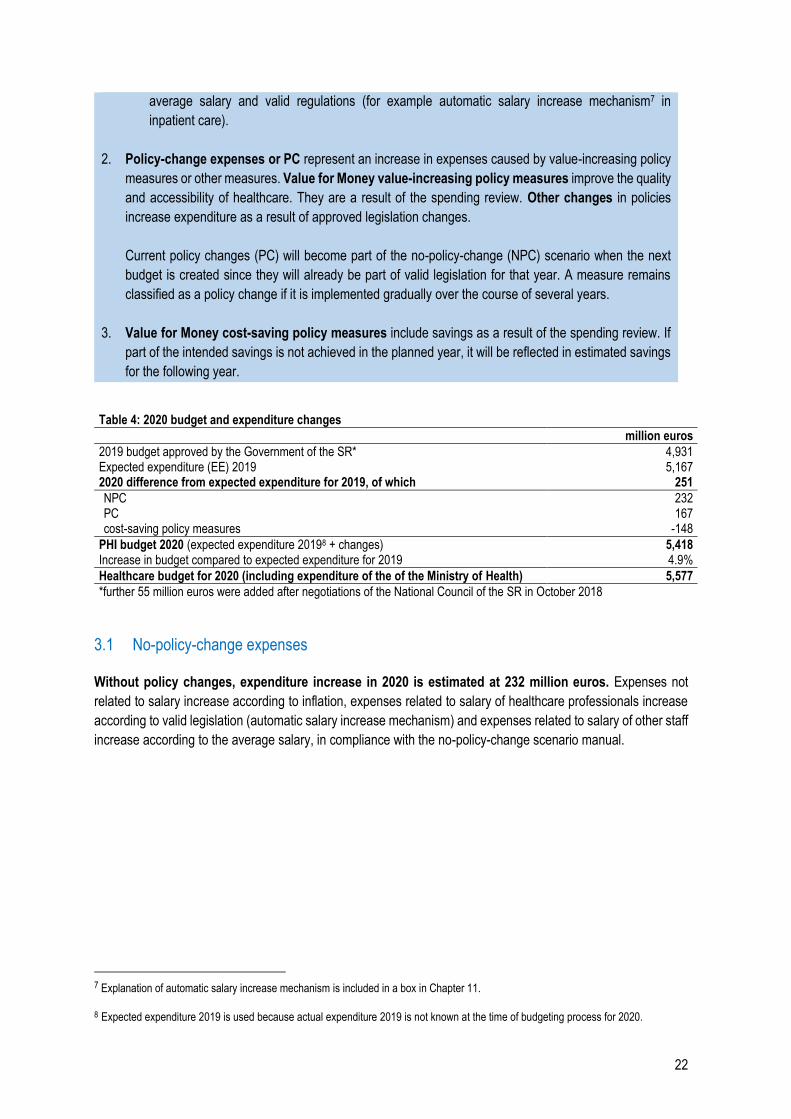
3. Value for Money cost-saving policy measures include savings as a result of the spending review. If
part of the intended savings is not achieved in the planned year, it will be reflected in estimated savings
for the following year.
Table 4: 2020 budget and expenditure changes million euros
2019 budget approved by the Government of the SR* 4,931 Expected expenditure (EE) 2019 5,167 2020 difference from expected expenditure for 2019, of which 251
NPC 232 PC 167 cost-saving policy measures -148
PHI budget 2020 (expected expenditure 20198 + changes) 5,418 Increase in budget compared to expected expenditure for 2019 4.9%
Healthcare budget for 2020 (including expenditure of the of the Ministry of Health) 5,577
*further 55 million euros were added after negotiations of the National Council of the SR in October 2018
3.1 No-policy-change expenses
Without policy changes, expenditure increase in 2020 is estimated at 232 million euros. Expenses not
related to salary increase according to inflation, expenses related to salary of healthcare professionals increase
according to valid legislation (automatic salary increase mechanism) and expenses related to salary of other staff
increase according to the average salary, in compliance with the no-policy-change scenario manual.
7 Explanation of automatic salary increase mechanism is included in a box in Chapter 11.
8 Expected expenditure 2019 is used because actual expenditure 2019 is not known at the time of budgeting process for 2020.
23
Table 5: Expenditure changes compared to 2019 – PHI – no-policy-change (in million euros)
No. 2020 2021 2022
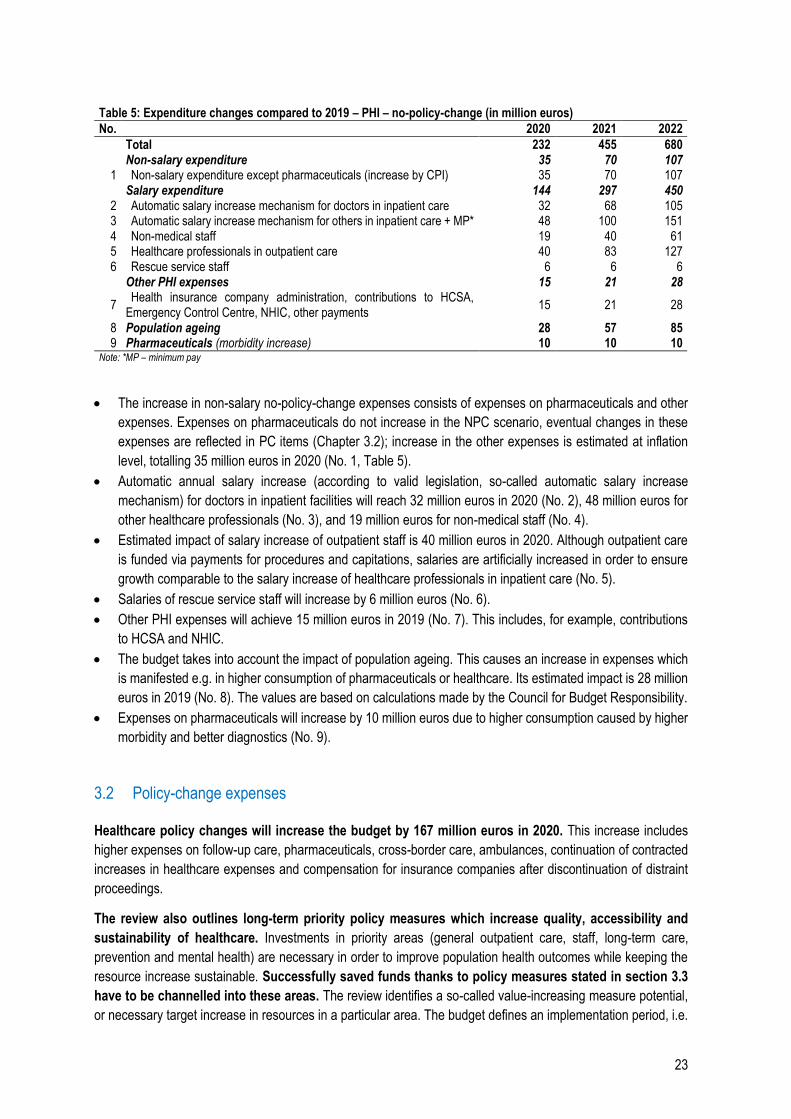
Total 232 455 680 Non-salary expenditure 35 70 107
1 Non-salary expenditure except pharmaceuticals (increase by CPI) 35 70 107 Salary expenditure 144 297 450
2 Automatic salary increase mechanism for doctors in inpatient care 32 68 105 3 Automatic salary increase mechanism for others in inpatient care + MP* 48 100 151 4 Non-medical staff 19 40 61 5 Healthcare professionals in outpatient care 40 83 127 6 Rescue service staff 6 6 6
Other PHI expenses 15 21 28
7 Health insurance company administration, contributions to HCSA,
Emergency Control Centre, NHIC, other payments 15 21 28
8 Population ageing 28 57 85 9 Pharmaceuticals (morbidity increase) 10 10 10
Note: *MP – minimum pay
The increase in non-salary no-policy-change expenses consists of expenses on pharmaceuticals and other
expenses. Expenses on pharmaceuticals do not increase in the NPC scenario, eventual changes in these
expenses are reflected in PC items (Chapter 3.2); increase in the other expenses is estimated at inflation
level, totalling 35 million euros in 2020 (No. 1, Table 5).
Automatic annual salary increase (according to valid legislation, so-called automatic salary increase
mechanism) for doctors in inpatient facilities will reach 32 million euros in 2020 (No. 2), 48 million euros for
other healthcare professionals (No. 3), and 19 million euros for non-medical staff (No. 4).
Estimated impact of salary increase of outpatient staff is 40 million euros in 2020. Although outpatient care
is funded via payments for procedures and capitations, salaries are artificially increased in order to ensure
growth comparable to the salary increase of healthcare professionals in inpatient care (No. 5).
Salaries of rescue service staff will increase by 6 million euros (No. 6).
Other PHI expenses will achieve 15 million euros in 2019 (No. 7). This includes, for example, contributions
to HCSA and NHIC.
The budget takes into account the impact of population ageing. This causes an increase in expenses which
is manifested e.g. in higher consumption of pharmaceuticals or healthcare. Its estimated impact is 28 million
euros in 2019 (No. 8). The values are based on calculations made by the Council for Budget Responsibility.
Expenses on pharmaceuticals will increase by 10 million euros due to higher consumption caused by higher
morbidity and better diagnostics (No. 9).
3.2 Policy-change expenses
Healthcare policy changes will increase the budget by 167 million euros in 2020. This increase includes
higher expenses on follow-up care, pharmaceuticals, cross-border care, ambulances, continuation of contracted
increases in healthcare expenses and compensation for insurance companies after discontinuation of distraint
proceedings.
The review also outlines long-term priority policy measures which increase quality, accessibility and
sustainability of healthcare. Investments in priority areas (general outpatient care, staff, long-term care,
prevention and mental health) are necessary in order to improve population health outcomes while keeping the
resource increase sustainable. Successfully saved funds thanks to policy measures stated in section 3.3
have to be channelled into these areas. The review identifies a so-called value-increasing measure potential,
or necessary target increase in resources in a particular area. The budget defines an implementation period, i.e.
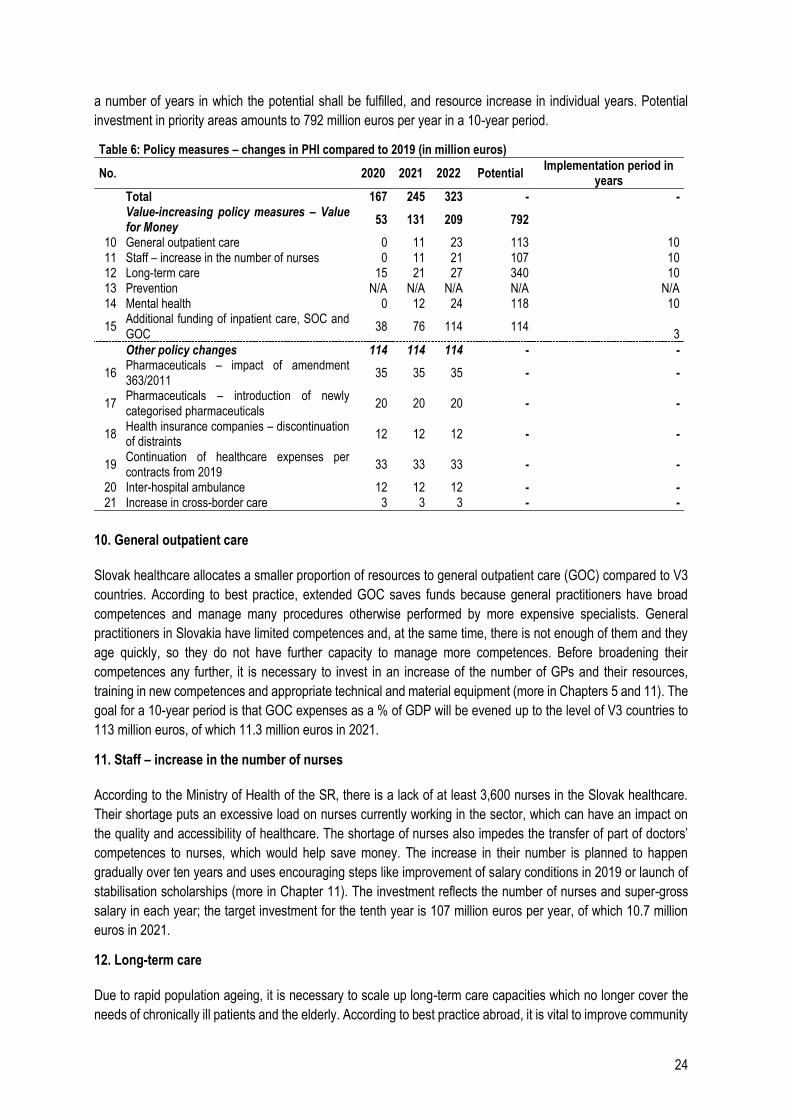
24
a number of years in which the potential shall be fulfilled, and resource increase in individual years. Potential
investment in priority areas amounts to 792 million euros per year in a 10-year period.
Table 6: Policy measures – changes in PHI compared to 2019 (in million euros)
No. 2020 2021 2022 Potential Implementation period in
years
Total 167 245 323 - -
Value-increasing policy measures – Value for Money
53 131 209 792
10 General outpatient care 0 11 23 113 10 11 Staff – increase in the number of nurses 0 11 21 107 10 12 Long-term care 15 21 27 340 10 13 Prevention N/A N/A N/A N/A N/A 14 Mental health 0 12 24 118 10
15 Additional funding of inpatient care, SOC and GOC
38 76 114 114 3
Other policy changes 114 114 114 - -
16 Pharmaceuticals – impact of amendment 363/2011
35 35 35 - -
17 Pharmaceuticals – introduction of newly categorised pharmaceuticals
20 20 20 - -
18 Health insurance companies – discontinuation of distraints
12 12 12 - -
19 Continuation of healthcare expenses per contracts from 2019
33 33 33 - -
20 Inter-hospital ambulance 12 12 12 - - 21 Increase in cross-border care 3 3 3 - -
10. General outpatient care
Slovak healthcare allocates a smaller proportion of resources to general outpatient care (GOC) compared to V3
countries. According to best practice, extended GOC saves funds because general practitioners have broad
competences and manage many procedures otherwise performed by more expensive specialists. General
practitioners in Slovakia have limited competences and, at the same time, there is not enough of them and they
age quickly, so they do not have further capacity to manage more competences. Before broadening their
competences any further, it is necessary to invest in an increase of the number of GPs and their resources,
training in new competences and appropriate technical and material equipment (more in Chapters 5 and 11). The
goal for a 10-year period is that GOC expenses as a % of GDP will be evened up to the level of V3 countries to
113 million euros, of which 11.3 million euros in 2021.
11. Staff – increase in the number of nurses
According to the Ministry of Health of the SR, there is a lack of at least 3,600 nurses in the Slovak healthcare.
Their shortage puts an excessive load on nurses currently working in the sector, which can have an impact on
the quality and accessibility of healthcare. The shortage of nurses also impedes the transfer of part of doctors’
competences to nurses, which would help save money. The increase in their number is planned to happen
gradually over ten years and uses encouraging steps like improvement of salary conditions in 2019 or launch of
stabilisation scholarships (more in Chapter 11). The investment reflects the number of nurses and super-gross
salary in each year; the target investment for the tenth year is 107 million euros per year, of which 10.7 million
euros in 2021.
12. Long-term care
Due to rapid population ageing, it is necessary to scale up long-term care capacities which no longer cover the
needs of chronically ill patients and the elderly. According to best practice abroad, it is vital to improve community
25
care, assisted living and home care in particular, along with inpatient follow-up care wards and health and social
care facilities. Broader long-term care saves funds in hospitals which currently care for chronically ill patients who
often take up more expensive acute care beds, prevents repeated hospital stays thanks to adequate follow-up
care and alleviates the burden for family members (more in Chapter 14). In a 10-year period, long-term care
expenses as a % of GDP will be evened up to the level of EU15 countries to 340 million euros, adjusted by age
structure. In 2020, the expenses on follow-up nursing services, residential hospice care, nursing homes and home
nursing agencies will be increased by an investment of 15 million euros.
13. Prevention
Slovakia has the sixth highest preventable mortality in the EU, i.e. causes of death which could have been
prevented by better lifestyle, more favourable influence of the environment, prevention and screenings. The
amount of expenses on prevention is not precisely calculated at the moment and, therefore, it is not possible to
determine whether it is higher or lower than in other countries. However, considering the bad outcomes, it is
probable that the expenses need to be increased significantly. Investments in prevention and health promotion
programmes are very cost-effective, some even more than treatment (more in Chapter 15).
14. Mental health
Slovak expenditure on mental health care lags behind other developed countries. Still, mental health issues have
an impact not only on the quality of life of the afflicted, but also put a huge load on the economy. Investments in
modern healthcare based mainly on strengthening community services and psychotherapy have a high return on
investment. Expenses will be increased similarly to an analogous reform in the Czech Republic – in a 10-year
period, the same package will be invested as in the Czech Republic, adjusted by number of inhabitants,
amounting to 118 million euros, of which 11.8 million euros in 2021 (more in Chapter 16).
15. Additional funding of inpatient and outpatient care
In 2020, resources for inpatient and outpatient care will be increased. University hospitals and teaching hospitals
are unprofitable every year, which reflects in growing debt. The fact that health insurance companies’ revenues
have not been high enough to cover the hospitals’ expenses on staff, pharmaceuticals, blood and medical material
for a long time also contributes to the losses. Even if hospitals had zero expenses for utilities (e.g. electricity,
heating, washing), the majority of them still could not cover the expenses on treatment only from public insurance.
In outpatient care, resources for selected specialties, including general medicine, will be increased in order to
strengthen general outpatient care (measure No. 10).
16. Pharmaceuticals – impact of amendment 363/2011 Coll.
An amendment of the Law on Pharmaceuticals and Medical Devices came into effect in 2018. It was intended to
give more patients with very rare diseases access to treatment reimbursed by the PHI. However, several
controversial changes of wording of the draft have taken place during the legislation process, which led to a
situation when a significantly higher number of pharmaceuticals with no proof of cost-effectiveness entered the
list of long-term reimbursed pharmaceuticals than originally intended. The resulting unintended increase will be
fully reflected in PHI budget from 2020 onward.
17. Pharmaceuticals – introduction of newly categorised pharmaceuticals
This policy measure reflects the expected increase in PHI expenses on reimbursed pharmaceuticals which were
introduced in Slovakia via standard authorisation process in 2018 and 2019 (they fulfilled the condition of cost-
effectiveness). The estimated impact on public finance is 20 million euros from 2020.
26
18. Discontinuation of distraint proceedings
In June 2019, the National Council of the SR approved Law No. 233/2019 Coll. on discontinuation of certain
distraint proceedings. This act provides that distraints whose material time of 5 years since the delivery of
authorisation of enforcement has expired shall be discontinued on January 1, 2020. Health insurance companies
face many distraint proceedings which comply with this condition, of which several have not yet been covered by
provisions. Costs of the “old” distraint proceedings were determined at 42 EUR / item incl. VAT.
The law provides that health insurance companies will be obliged to count the provisions in their revenue already
in 2019 and they will bear the costs of the discontinuation of these proceedings in 2020 – 2023. The expenses
on the discontinuation of almost 298 thousand old distraint proceedings are estimated at 12.1 million euros in
2020.
19. Continuation of past contracts from 2019
Health insurance companies do not have a universal date for negotiations about amendments to contracts; they
negotiate with associations and individual providers throughout the year. These time lags mean that healthcare
is contracted under certain conditions for several years. It has resulted in a situation where some expenses shift
in time and increases from 2018 partially overlap with 2019 and those from 2019 with 2020. This continuation has
been calculated at 32.7 million euros in 2020, which includes expenses on inpatient and outpatient care, CETU,
ambulances, spas and transport.
20. Inter-hospital ambulance
Inter-hospital ambulance rescue service (type “S”) is intended mainly for urgent transport of patients between
healthcare facilities if the patient’s condition requires healthcare to be provided during the transport.
21. Increase in cross-border care
Given the development in the last years, it can be expected that the amount of healthcare which people insured
in Slovak health insurance companies use abroad will increase. This phenomenon can be caused by more
frequent travelling, migration and medical tourism for types of healthcare which are not provided in Slovakia.
3.3 Cost-saving policy measures
Cost-saving policy measures in public health insurance amounting to 148 million euros will be implemented
in 2020.
Cost-saving policy measures will focus on the areas of healthcare with inefficient resource allocation.
Some savings are achieved by evening Slovak indicators up to foreign benchmarks (“top-down” approach), others
by specific changes of the system (“bottom-up” approach). Slovak citizens will get more for their money if it
is channelled to policy measures in priority areas described above (Chapter 3.2). This spending review
identifies a so-called potential, which is total annual savings achievable by the introduction of the measure. The
budget defines an implementation period in years in which the potential savings will be achieved and gradual
resource savings in individual years.
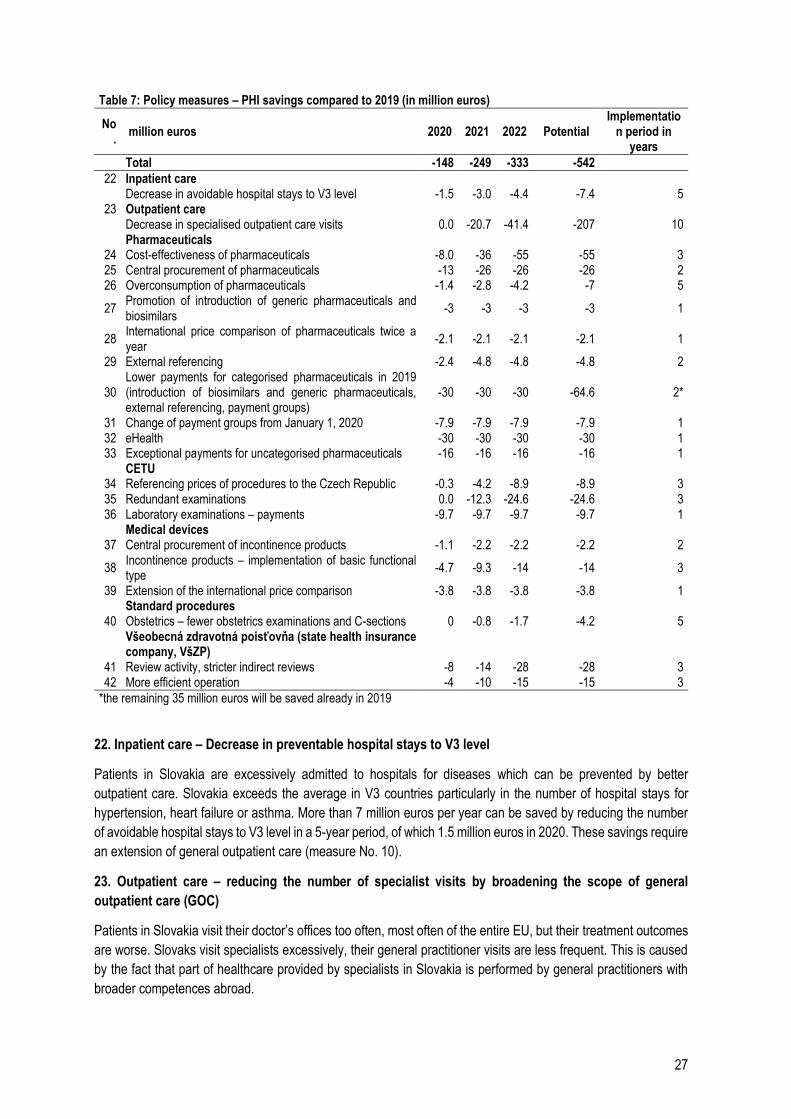
27
Table 7: Policy measures – PHI savings compared to 2019 (in million euros)
No.
million euros 2020 2021 2022 Potential Implementatio
n period in years
Total -148 -249 -333 -542
22 Inpatient care Decrease in avoidable hospital stays to V3 level -1.5 -3.0 -4.4 -7.4 5
23 Outpatient care Decrease in specialised outpatient care visits 0.0 -20.7 -41.4 -207 10 Pharmaceuticals
24 Cost-effectiveness of pharmaceuticals -8.0 -36 -55 -55 3 25 Central procurement of pharmaceuticals -13 -26 -26 -26 2 26 Overconsumption of pharmaceuticals -1.4 -2.8 -4.2 -7 5
27 Promotion of introduction of generic pharmaceuticals and biosimilars
-3 -3 -3 -3 1
28 International price comparison of pharmaceuticals twice a year
-2.1 -2.1 -2.1 -2.1 1
29 External referencing -2.4 -4.8 -4.8 -4.8 2
30 Lower payments for categorised pharmaceuticals in 2019 (introduction of biosimilars and generic pharmaceuticals, external referencing, payment groups)
-30 -30 -30 -64.6 2*
31 Change of payment groups from January 1, 2020 -7.9 -7.9 -7.9 -7.9 1 32 eHealth -30 -30 -30 -30 1 33 Exceptional payments for uncategorised pharmaceuticals -16 -16 -16 -16 1
CETU 34 Referencing prices of procedures to the Czech Republic -0.3 -4.2 -8.9 -8.9 3 35 Redundant examinations 0.0 -12.3 -24.6 -24.6 3 36 Laboratory examinations – payments -9.7 -9.7 -9.7 -9.7 1
Medical devices 37 Central procurement of incontinence products -1.1 -2.2 -2.2 -2.2 2
38 Incontinence products – implementation of basic functional type
-4.7 -9.3 -14 -14 3
39 Extension of the international price comparison -3.8 -3.8 -3.8 -3.8 1 Standard procedures
40 Obstetrics – fewer obstetrics examinations and C-sections 0 -0.8 -1.7 -4.2 5
Všeobecná zdravotná poisťovňa (state health insurance company, VšZP)
41 Review activity, stricter indirect reviews -8 -14 -28 -28 3 42 More efficient operation -4 -10 -15 -15 3
*the remaining 35 million euros will be saved already in 2019
22. Inpatient care – Decrease in preventable hospital stays to V3 level
Patients in Slovakia are excessively admitted to hospitals for diseases which can be prevented by better
outpatient care. Slovakia exceeds the average in V3 countries particularly in the number of hospital stays for
hypertension, heart failure or asthma. More than 7 million euros per year can be saved by reducing the number
of avoidable hospital stays to V3 level in a 5-year period, of which 1.5 million euros in 2020. These savings require
an extension of general outpatient care (measure No. 10).
23. Outpatient care – reducing the number of specialist visits by broadening the scope of general
outpatient care (GOC)
Patients in Slovakia visit their doctor’s offices too often, most often of the entire EU, but their treatment outcomes
are worse. Slovaks visit specialists excessively, their general practitioner visits are less frequent. This is caused
by the fact that part of healthcare provided by specialists in Slovakia is performed by general practitioners with
broader competences abroad.
28
If the number of specialist visits in Slovakia was reduced to V3 level, it would save 207 million euros, of which
20.7 million euros in 2020. Part of specialist visits will be transferred to general practitioners with broader
competences in order to even up the number of GOC visits to V3 level. Therefore, this scenario entails savings
in SOC and an increase of funding in GOC to V3 level (measure No. 10). However, in order to get to the V3 level,
it is necessary to reduce the overall number of doctor visits – some visits are currently completely unnecessary
(more in Chapter 5). The saved funds will be reallocated among existing providers and will be used to provide
higher salaries, broaden service portfolio or invest according to priorities identified in value-increasing policy
measures (No. 10 to 15).
24. Cost-effectiveness of pharmaceuticals
Establishing rules of cost-effectiveness also for pharmaceuticals for rare diseases and required
pharmacoeconomic analysis
Pharmaceuticals for rare diseases with a prevalence in population of less than 1:50,000 currently have an
exceptional status in the system and do not have to prove their value for money at all. As a result, pharmaceuticals
with 100x lower effectiveness than is the condition for standard pharmaceuticals are reimbursed from public funds.
Although it can be beneficial to give a certain advantage to pharmaceuticals for rare diseases, it is necessary to
establish clear rules. At the moment, Slovakia fully reimburses the price of pharmaceuticals whose price has been
deemed too high even by countries like Great Britain or Norway. Establishment of clear rules will bring in 2 million
euros in 2020 and has an annual savings potential of 10 million euros.
Re-evaluation of payments for pharmaceuticals which do not satisfy the rule of cost-effectiveness
This policy measure concerns mainly pharmaceuticals which used a temporary gap in the wording of Law No.
363/2011 Coll. in 2018 (Measure 16) and other less cost-effective pharmaceuticals which were introduced into
the system before 2011. The wrong wording of the law from 2018 has already been corrected but it still has a
negative impact on the budget, amounting to 39 million euros in 2019 and 74 million euros from 2020 onward.
Marketing authorisation holders have various options to adjust the prices of pharmaceuticals in order to fulfil the
current conditions of sufficient value for money. If they do not manage to do this, these pharmaceuticals should
be excluded from the list of reimbursed pharmaceuticals. Patients who are already taking these pharmaceuticals
should keep having them reimbursed. The annual savings potential for pharmaceuticals which used the temporary
gap in 2018 is 40 million euros, of which 4 million in 2020. Five million euros, of which 2 million euros in the first
year, can be saved in case of other pharmaceuticals.
25. Extension of central procurement of pharmaceuticals
Volume increase of central procurement from the current 13% to 25% would bring in savings of 26 million euros
to the PHI. This one-quarter share represents a situation where, for example, only all prescription pharmaceuticals
administered in hospitals and doctor’s offices (type of reimbursement “A” and “AS”) are procured centrally. The
example of Denmark shows that this goal is attainable. The measure has a savings potential of 26 million euros,
half of which in the first year.
26. Overconsumption of pharmaceuticals – antibiotics
Prescription of antibiotics when they are not necessary is connected to medical risks and needless financial
expenses. Due to high overconsumption of antibiotics, bacteria become resistant to treatment, which puts the
entire population at risk, not only the patient who overuses them. Slovak antibiotics consumption is considerably
higher than in Sweden which is one of the leaders in this area. Better doctor and patient awareness or compulsory
reimbursement of CRP examinations at general practitioners’ offices and accident and emergency wards can
help reduce the number of prescribed antibiotics significantly. The savings potential of the policy measure is 7
million euros with a 5-year onset (1.4 million in 2020).
29
27. Promotion of introduction of generic pharmaceuticals and biosimilars
Introduction of cheaper pharmaceuticals into the system requires an adjustment of payments for other
interchangeable pharmaceuticals. Since April 2019, there has been an insufficiently justified change of existing
practice and the adjustment of payments is currently only carried out 3 months later in some cases. The policy
measure has a savings potential of 3 million euros which can be achieved in 2020.
28. International price comparison of pharmaceuticals twice a year
The current legislation allows to compare the prices of pharmaceuticals which were introduced into the system in
the last 3 years with prices abroad twice a year. This option has not been used yet even though it can bring in
considerable savings. Achievable annual savings of the policy measure are 2.1 million from 2020.
29. External referencing
Slovakia maintains low prices of pharmaceuticals thanks to price comparison with foreign countries. The price of
a medication is determined as the average of three lowest prices in Europe. So far however, only the same
package sizes have been compared. Pharmaceuticals manufacturers took advantage of this rule in several cases
by importing a different package size to Slovakia than to other EU countries and thus avoiding the comparison.
For example, an injection medication available in other EU countries as a 1-piece package is imported to Slovakia
only in a 10-piece package. However, the price in Slovakia is 20 times higher. Unit price comparison of
problematic pharmaceuticals with foreign countries will put a stop to these speculations. The policy measure has
an annual savings potential of 4.8 million euros; half of this amount can be achieved in the first year.
30. Lower payments for categorised pharmaceuticals in 2019 (introduction of biosimilars and generic
pharmaceuticals, external referencing, payment groups)
In the course of 2019, several changes of payments for categorised pharmaceuticals took place mainly due to
the introduction of cheaper pharmaceuticals, international price comparisons and re-evaluation of payment
groups. Part of the savings has already reflected in 2019 expenditure, the rest has a positive impact on 2020
budget. These changes saved 34.6 million euros in 2019 and will bring in further 30 million to next year’s budget.
31. Change of payment groups from January 1, 2020
From the beginning of the next year, considerable re-evaluation of payments for pharmaceuticals will take place
as a result of major changes in payment groups. This change will save 7.9 million euros annually in public health
insurance from 2020.
32. Policy measure – eHealth
Expenses on pharmaceuticals are negatively affected by duplicate prescriptions and adverse drug interactions.
Implementation of electronic health modules in practice will help with this issue and save 30 million euros in 2020.
Relevant modules must be launched in time at the NHIC in order to achieve the savings.
33. Uncategorised pharmaceuticals reimbursed in exceptional cases
Exceptions allow health insurance companies to reimburse their patients for pharmaceuticals which are not
officially reimbursed in Slovakia (i.e. categorised). Currently, we do not have unified rules for authorising
exceptions, the authorisation process thus remains a question of individual evaluation of health insurance
companies.
Amendment of Law No. 363/2011 Coll. (policy change No. 16) was intended to completely cancel exceptional
reimbursements for pharmaceuticals and include some of them under categorised pharmaceuticals. Although this
amendment introduced pharmaceuticals for 75 million euros into the system without any proof of cost
30
effectiveness (of which 22 million euros were transferred from exceptional payments), overall expenses of health
insurance companies on exceptional payments keep increasing year-on-year. It causes a duplicate increase in
expenses and inefficiency in drug policy. Adjustment by volume of transferred pharmaceuticals originally
reimbursed in exceptional cases (after taking into account indication variability) will save 16 million euros from
2020.
34. Re-evaluation of payments for CT and MRI procedures compared to Czech prices
Slovakia pays for some medical procedures from public funds much more generously than the Czech Republic,
thanks to which private companies achieve extraordinarily high profit margins. The price re-evaluation has an
annual potential of 8.9 million euros, but because of valid past contracts, only 0.3 million will be saved in 2020.
35. Reducing redundant CETU examinations by standards and review activity
Part of Slovak CETU procedures can be duplicate and thus unhelpful to the patient. For example, Slovak patients
undergo considerably more CT and MRI examinations compared to neighbouring V4 countries. Many cases can
be seen in the system where one patient underwent at least 5 MRIs or at least 10 CT scans in one year. Setting
standard cases when it is not necessary to repeat examinations and more detailed review activity can bring in
PHI savings. The measure has a savings potential of 24.6 million euros, of which 12.3 million euros will be
achieved in 2021.
36. Laboratory examinations – payments
Currently, some laboratory examinations are performed even though a cheaper method exists; the payments for
selected examinations should amount to the cheapest method available. At the same time, launch of the “e-Lab”
module in the e-Health system can help eliminate duplicate examinations in laboratory diagnostics.
37. Central procurement of incontinence products
Expenditure Optimisation project in Všeobecná zdravotná poisťovňa has estimated a savings potential of central
procurement of nappies in VšZP at 1.7 – 2.6 million euros. Centrally procured nappies can be delivered to bulk
purchase sites (for example social service facilities). The measure has a savings potential of 2.2 million euros, of
which 1.1 million euros will be achieved in 2020.
38. Incontinence products – implementation of basic functional type
Savings potential of changes in payment system for selected medical devices amounts to 14 million euros. These
savings have been estimated by comparison with the Czech model which has different specifications of payment
parameters and also lower consumption. The measure has a three-year onset, savings of 4.7 million euros will
be achieved in 2020.
39. Extension of the international price comparison of medical devices
Similarly to pharmaceuticals, prices of medical devices are compared with foreign countries. However, the prices
are compared only to the Czech Republic at the moment due to insufficient interconnection of data to foreign
databases. Savings potential can be achieved by extending this comparison to other countries. The measure has
a savings potential of 3.8 million euros which will be achieved as soon as in 2020.
40. Standard procedures – improvement of processes in obstetrics
Slovakia lacks standard diagnostic and treatment procedures based on best practice and up-to-date knowledge.
Well-optimised and observed processes improve the quality of care and help avoid wasting resources on
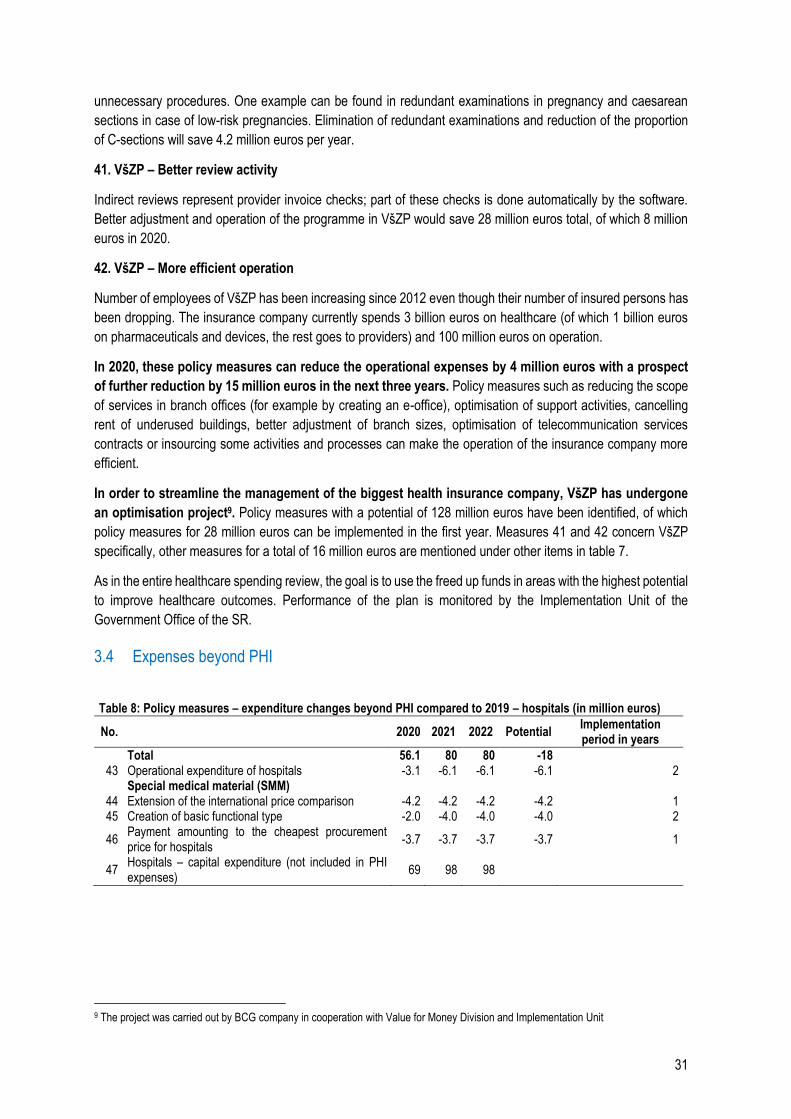
31
unnecessary procedures. One example can be found in redundant examinations in pregnancy and caesarean
sections in case of low-risk pregnancies. Elimination of redundant examinations and reduction of the proportion
of C-sections will save 4.2 million euros per year.
41. VšZP – Better review activity
Indirect reviews represent provider invoice checks; part of these checks is done automatically by the software.
Better adjustment and operation of the programme in VšZP would save 28 million euros total, of which 8 million
euros in 2020.
42. VšZP – More efficient operation
Number of employees of VšZP has been increasing since 2012 even though their number of insured persons has
been dropping. The insurance company currently spends 3 billion euros on healthcare (of which 1 billion euros
on pharmaceuticals and devices, the rest goes to providers) and 100 million euros on operation.
In 2020, these policy measures can reduce the operational expenses by 4 million euros with a prospect
of further reduction by 15 million euros in the next three years. Policy measures such as reducing the scope
of services in branch offices (for example by creating an e-office), optimisation of support activities, cancelling
rent of underused buildings, better adjustment of branch sizes, optimisation of telecommunication services
contracts or insourcing some activities and processes can make the operation of the insurance company more
efficient.
In order to streamline the management of the biggest health insurance company, VšZP has undergone
an optimisation project9. Policy measures with a potential of 128 million euros have been identified, of which
policy measures for 28 million euros can be implemented in the first year. Measures 41 and 42 concern VšZP
specifically, other measures for a total of 16 million euros are mentioned under other items in table 7.
As in the entire healthcare spending review, the goal is to use the freed up funds in areas with the highest potential
to improve healthcare outcomes. Performance of the plan is monitored by the Implementation Unit of the
Government Office of the SR.
3.4 Expenses beyond PHI
Table 8: Policy measures – expenditure changes beyond PHI compared to 2019 – hospitals (in million euros)
No. 2020 2021 2022 Potential Implementation period in years
Total 56.1 80 80 -18 43 Operational expenditure of hospitals -3.1 -6.1 -6.1 -6.1 2
Special medical material (SMM) 44 Extension of the international price comparison -4.2 -4.2 -4.2 -4.2 1 45 Creation of basic functional type -2.0 -4.0 -4.0 -4.0 2
46 Payment amounting to the cheapest procurement price for hospitals
-3.7 -3.7 -3.7 -3.7 1
47 Hospitals – capital expenditure (not included in PHI expenses)
69 98 98
9 The project was carried out by BCG company in cooperation with Value for Money Division and Implementation Unit
32
43. Operational expenditure of hospitals
It is possible to save 6.1 million euros by optimising unit prices of procured operational services in university
hospitals and teaching hospitals. The savings are based on a comparison of hospital contracts and real expenses
on electricity, gas, cleaning, catering, washing and security service in 2018.
44. Extension of the international price comparison
Similarly to medical devices, prices of special medical material are only compared to the Czech Republic in
practice. Savings can be achieved by extending this comparison to other countries. The measure has a savings
potential of 4.2 million euros which will be achieved as soon as in 2020.
45. Creation of basic functional type (new payment groups)
Unlike pharmaceuticals, the current division of SMM into groups is insufficiently related to the amount paid.
Various types of goods are included in the groups and the maximum amount to be paid in a group often does not
correspond to real prices. Creation of payment groups consisting of interchangeable SMM products and
determining maximum payment amounting to the cheapest product in the group would increase transparency of
pricing and patient entitlement. The measure has a savings potential of 4 million euros, of which 2 million euros
will be achieved in 2020.
46. Payment amounting to the cheapest procurement price for hospitals
Hospitals procure SMM on their own and get a reimbursement from health insurance companies when it is used
in patient care. If health insurance company reimbursement was set to the cheapest procurement price, it would
encourage hospitals to purchase efficiently. The measure has a savings potential of 3.7 million euros which will
be achieved from 2020 onward.
47. Hospitals – capital expenditure (not included in PHI expenses)
Hospitals will get 69 million euros per year allocated to capital expenditure, particularly to building renovations
and instrument modernisation. This effort will contribute to the continuous endeavour to resolve the long-
neglected investment debt of hospitals. To maximise the use of these funds, it is necessary to invest them
according to the approved strategy of hospital network stratification (Chapter 4.3) and publicly report the
investments. Part of the resources will be provided from EU funds.
3.5 Unquantified measures and structural measures
Policy measures without specified financial impact and structural measures without direct financial
impact have a considerable potential for efficiency improvement. These measures stem from
recommendations stated in relevant chapters of the review and correspond to quantified measures in Chapter
3.2 to 3.4. These measures include10:
Hospital network stratification focusing on quality improvement by required minimum number of
procedures and effectiveness improvement by shorter hospital stays and fewer hospital beds (Chapter
4.3).
Re-evaluation of the relative weights of DRG and implementation of payments to hospitals based
on DRG (Chapter 4.5).
Improvement of risk equalisation mechanism by implementing new parameters and ex-post
redistribution (Chapter 13.2.2).
Definition of basic healthcare package (Chapter 13.1.1).
10 Policy measures from this review are summarised in Tables 6, 7 and 8, in Chapter 3.5 and in the rest of the paper in separate boxes.
33
In outpatient care, support of gatekeeping before general practitioner visit (reduction of “administrative”
visits, phone consultation instead of visit, home treatment of viral infections), re-evaluation of funding
mechanism of doctor’s offices (capitation and payment per procedure), simpler entry of general
practitioners into the market and promotion of establishment of integrated general outpatient care
centres (Chapters 5 and 11).
In drug policy, strengthening capacities for cost-effectiveness analysis (health technology assessment,
HTA), promotion of further introduction of generic pharmaceuticals, strengthening awareness campaign
about unnecessary OOP for pharmaceuticals, re-evaluation of payment groups and improvement of
competitive environment in central procurement (Chapter 6).
Re-evaluation of staff remuneration in hospitals – so-called automatic salary increase
mechanism – connecting the increase of the salary package to average salary and giving hospitals the
flexibility to redistribute (Chapter 11.1).
In order to optimise selected operational expenses of hospitals, unification of parameters of
procurement contracts of state hospitals for better comparability, benchmarking the prices of services in
healthcare and public administration every 6 months and concluding contracts for at least one year.
As for staff policy measures, re-evaluation of the staff mix and their competences in all facilities
(Chapters 5 and 11).
In standard diagnostic and treatment procedures, acceleration of the approval process of the SDTPs.
According to a case study in this review, implementation of SDTPs in pregnancy and labour, earlier
release of mothers and children from the hospital, creation of capacities in home care and community
care for mothers and children (Chapter 12).
For health insurance companies, setting rules for the use of PHI resources which have not been used
for healthcare (Chapter 13.2.1).
Establishment of rules for patient out-of-pocket payments (Chapter 2.2).
Extension of data collection by most frequent situations when patient has to wait for healthcare.
As for prevention, investment in effective preventive policy measures and health promotion (Chapter
15).
In mental health, epidemiology research, removal of barriers preventing inclusion of psychotherapists
in healthcare, promotion of psychotherapy, setting correct processes for prescribing pharmaceuticals,
integration of psychological symptoms in physical disease diagnostics (Chapter 16).
3.6 Better budgeting
The HC spending review identifies three main budgeting tools which will allow for a more efficient move towards
fulfilling the targets in Slovak healthcare system while maintaining the current volume of expenses:
1. performance-based budgeting
2. change in the manner of funding
3. quantification of all healthcare policy measures, both value-increasing and cost-reducing, which can
help achieve the set goals in individual areas of healthcare
3.6.1 Programme-based budgeting
Performance-based budgeting in the form of programme-based budgeting will be implemented from 2020.
Performance-based budgeting is a modern system of public expenditure management used in practice by more
than two thirds of OECD countries (OECD, 2017b). It is considered more useful than the formerly used system
which only allocates money to expense categories in terms of accounting practice, for example salaries and
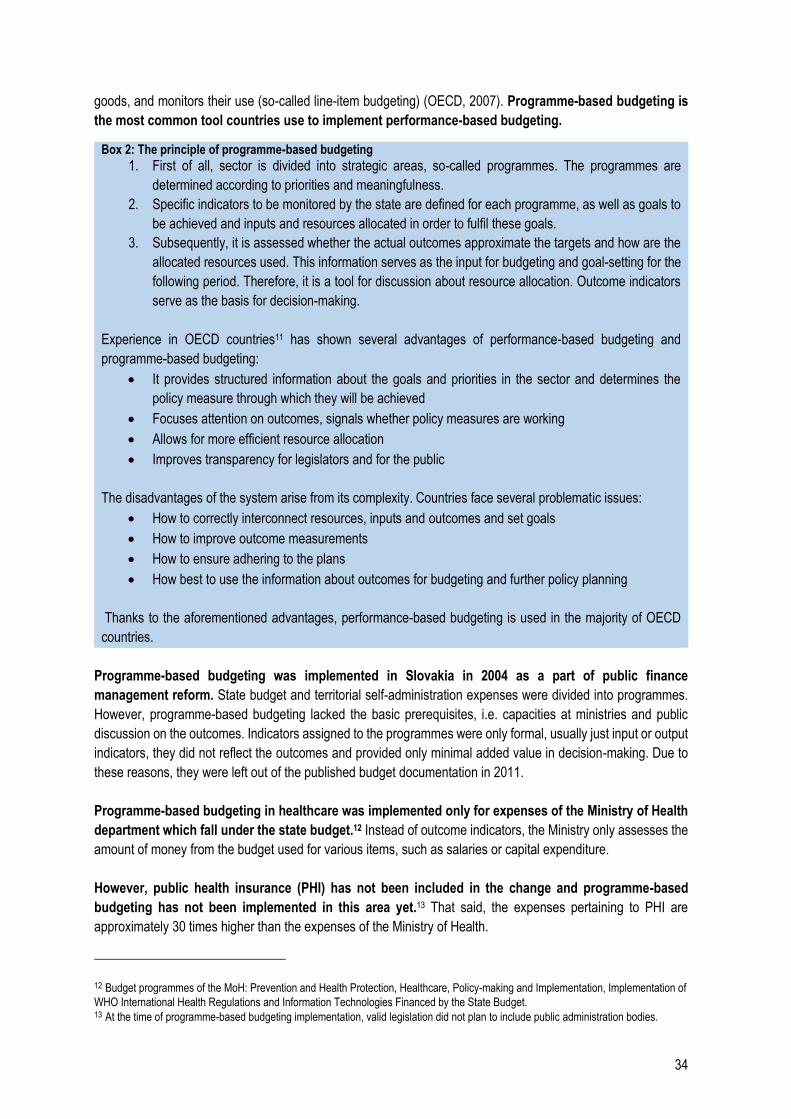
34
goods, and monitors their use (so-called line-item budgeting) (OECD, 2007). Programme-based budgeting is
the most common tool countries use to implement performance-based budgeting.
Box 2: The principle of programme-based budgeting
1. First of all, sector is divided into strategic areas, so-called programmes. The programmes are
determined according to priorities and meaningfulness.
2. Specific indicators to be monitored by the state are defined for each programme, as well as goals to
be achieved and inputs and resources allocated in order to fulfil these goals.
3. Subsequently, it is assessed whether the actual outcomes approximate the targets and how are the
allocated resources used. This information serves as the input for budgeting and goal-setting for the
following period. Therefore, it is a tool for discussion about resource allocation. Outcome indicators
serve as the basis for decision-making.
Experience in OECD countries11 has shown several advantages of performance-based budgeting and
programme-based budgeting:
It provides structured information about the goals and priorities in the sector and determines the
policy measure through which they will be achieved
Focuses attention on outcomes, signals whether policy measures are working
Allows for more efficient resource allocation
Improves transparency for legislators and for the public
The disadvantages of the system arise from its complexity. Countries face several problematic issues:
How to correctly interconnect resources, inputs and outcomes and set goals
How to improve outcome measurements
How to ensure adhering to the plans
How best to use the information about outcomes for budgeting and further policy planning
Thanks to the aforementioned advantages, performance-based budgeting is used in the majority of OECD
countries.
Programme-based budgeting was implemented in Slovakia in 2004 as a part of public finance
management reform. State budget and territorial self-administration expenses were divided into programmes.
However, programme-based budgeting lacked the basic prerequisites, i.e. capacities at ministries and public
discussion on the outcomes. Indicators assigned to the programmes were only formal, usually just input or output
indicators, they did not reflect the outcomes and provided only minimal added value in decision-making. Due to
these reasons, they were left out of the published budget documentation in 2011.
Programme-based budgeting in healthcare was implemented only for expenses of the Ministry of Health
department which fall under the state budget.12 Instead of outcome indicators, the Ministry only assesses the
amount of money from the budget used for various items, such as salaries or capital expenditure.
However, public health insurance (PHI) has not been included in the change and programme-based
budgeting has not been implemented in this area yet.13 That said, the expenses pertaining to PHI are
approximately 30 times higher than the expenses of the Ministry of Health.
12 Budget programmes of the MoH: Prevention and Health Protection, Healthcare, Policy-making and Implementation, Implementation of
WHO International Health Regulations and Information Technologies Financed by the State Budget. 13 At the time of programme-based budgeting implementation, valid legislation did not plan to include public administration bodies.
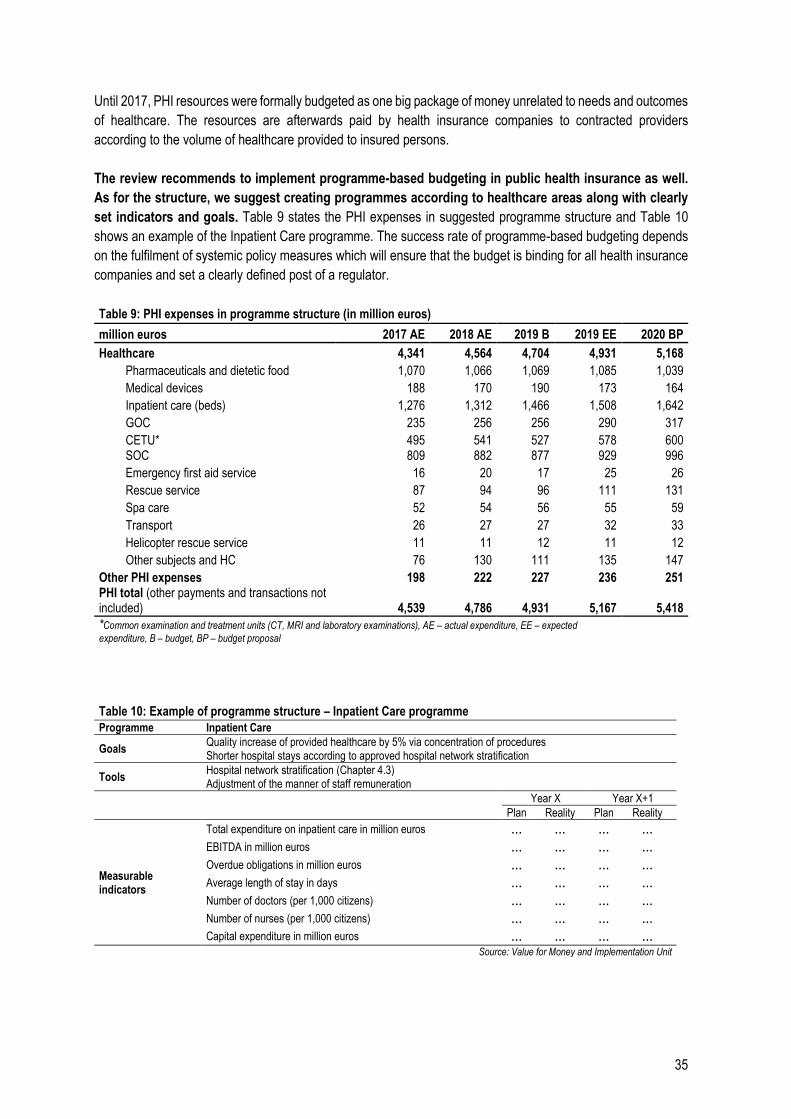
35
Until 2017, PHI resources were formally budgeted as one big package of money unrelated to needs and outcomes
of healthcare. The resources are afterwards paid by health insurance companies to contracted providers
according to the volume of healthcare provided to insured persons.
The review recommends to implement programme-based budgeting in public health insurance as well.
As for the structure, we suggest creating programmes according to healthcare areas along with clearly
set indicators and goals. Table 9 states the PHI expenses in suggested programme structure and Table 10
shows an example of the Inpatient Care programme. The success rate of programme-based budgeting depends
on the fulfilment of systemic policy measures which will ensure that the budget is binding for all health insurance
companies and set a clearly defined post of a regulator.
Table 9: PHI expenses in programme structure (in million euros)
million euros 2017 AE 2018 AE 2019 B 2019 EE 2020 BP
Healthcare 4,341 4,564 4,704 4,931 5,168
Pharmaceuticals and dietetic food 1,070 1,066 1,069 1,085 1,039
Medical devices 188 170 190 173 164
Inpatient care (beds) 1,276 1,312 1,466 1,508 1,642
GOC 235 256 256 290 317
CETU* 495 541 527 578 600 SOC 809 882 877 929 996
Emergency first aid service 16 20 17 25 26
Rescue service 87 94 96 111 131
Spa care 52 54 56 55 59
Transport 26 27 27 32 33
Helicopter rescue service 11 11 12 11 12
Other subjects and HC 76 130 111 135 147
Other PHI expenses 198 222 227 236 251 PHI total (other payments and transactions not included) 4,539 4,786 4,931 5,167 5,418
*Common examination and treatment units (CT, MRI and laboratory examinations), AE – actual expenditure, EE – expected
expenditure, B – budget, BP – budget proposal
Table 10: Example of programme structure – Inpatient Care programme Programme Inpatient Care
Goals Quality increase of provided healthcare by 5% via concentration of procedures Shorter hospital stays according to approved hospital network stratification
Tools Hospital network stratification (Chapter 4.3) Adjustment of the manner of staff remuneration
Year X Year X+1
Plan Reality Plan Reality
Measurable indicators
Total expenditure on inpatient care in million euros ... ... ... ... EBITDA in million euros ... ... ... ... Overdue obligations in million euros ... ... ... ... Average length of stay in days ... ... ... ... Number of doctors (per 1,000 citizens) ... ... ... ... Number of nurses (per 1,000 citizens) ... ... ... ... Capital expenditure in million euros ... ... ... ...
Source: Value for Money and Implementation Unit
36
3.6.2 Change in the manner of funding – contributions from economically active persons (EAP) and
state payments
Up to now, total healthcare package has not depended on the needs of the sector but on the performance
of the Slovak economy. It is because a major part of public health insurance is funded by contributions paid by
economically active insured persons and state payments for economically inactive insured persons (so-called
state-insured persons, for example children, students, the retired).14 State payment for state-insured persons is
an expense of the Ministry of Health and has depended on the average salary so far.15
A change in the manner of healthcare funding will take place in 2020. The budget will reflect total
necessary healthcare expenditure. In compliance with the principle of value for money and performance-based
budgeting, it is important that goal-setting is done in accordance with the decision-making about the size of the
package. Goals must correspond to budget limits and the budget should reflect the needs and goals of the sector.
First of all, total expected healthcare expenditure is determined and the amount of contributions collected by
health insurance companies from the EAP is estimated. The amount of annual insurance premium paid by the
state is afterwards determined as the difference between the expected expenditure and income from the EAP.
The annual sum of insurance premium paid by the state will be set by the Law on State Budget and will no longer
depend on average salary.
Determination of necessary expenses will increase transparency in budgeting. It is essential to quantify
influences such as inflation, salary increase and population ageing which take place without any changes in policy
measures introduced by the sector. This ensures that healthcare expenditure corresponds to economic and
demographic development. Subsequently, it is possible to add changes stemming from new legislation and
possible savings in the sector. Such a process can help prevent underfunding of the sector, ensure necessary
funding even in worse economic situation and also help prevent unchecked increase in spending, which has
happened in several developed countries.
The purpose of state payment is to bridge the revenue gap and it has a valid place in a solidary system
where contributions from the EAP cannot cover all healthcare expenses for all citizens. Therefore,
additional healthcare funding by the state can be legitimate for example if less money is collected from
contributions than expected when the budget was approved.
In worse case scenario, the state provides additional funding to healthcare because budget funds were
not allocated by health insurance companies as planned. After a budget is created, the resource package is
divided among health insurance companies which are free to choose how they buy healthcare from providers.
This can lead to a situation where, for instance, the budget increases funding of hospitals, but health insurance
company chooses to buy more healthcare from specialists or laboratories instead, which has not been taken into
account in the budget and company business plan. As a result, hospitals lack these funds and the state has to
provide them. This kind of additional funding is inefficient and biases motivation for proper use of funds
as allocated in the budget.
Health insurance companies’ allocation of funds according to the budget plan is also necessary in order
for the programme-based budgeting in public health insurance to work properly.
14 State-insured person is defined in Law No. 580/2004 on Health Insurance. 15 The payment is usually determined as 4% of the basis of assessment, i.e. average salary from two years ago (Law No. 580/2004 Coll.). Whether a 4% rate is sufficient has been discussed repeatedly and the rate has been adjusted several times.
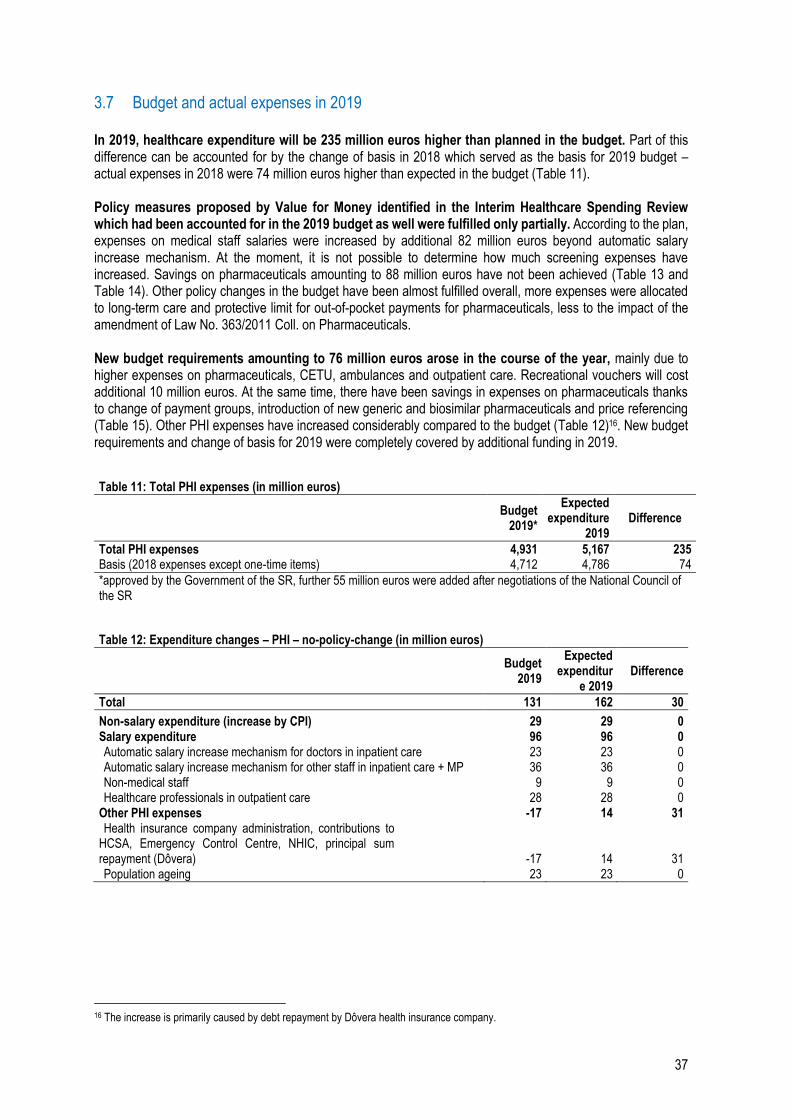
37
3.7 Budget and actual expenses in 2019
In 2019, healthcare expenditure will be 235 million euros higher than planned in the budget. Part of this difference can be accounted for by the change of basis in 2018 which served as the basis for 2019 budget – actual expenses in 2018 were 74 million euros higher than expected in the budget (Table 11). Policy measures proposed by Value for Money identified in the Interim Healthcare Spending Review which had been accounted for in the 2019 budget as well were fulfilled only partially. According to the plan, expenses on medical staff salaries were increased by additional 82 million euros beyond automatic salary increase mechanism. At the moment, it is not possible to determine how much screening expenses have increased. Savings on pharmaceuticals amounting to 88 million euros have not been achieved (Table 13 and Table 14). Other policy changes in the budget have been almost fulfilled overall, more expenses were allocated to long-term care and protective limit for out-of-pocket payments for pharmaceuticals, less to the impact of the amendment of Law No. 363/2011 Coll. on Pharmaceuticals. New budget requirements amounting to 76 million euros arose in the course of the year, mainly due to higher expenses on pharmaceuticals, CETU, ambulances and outpatient care. Recreational vouchers will cost additional 10 million euros. At the same time, there have been savings in expenses on pharmaceuticals thanks to change of payment groups, introduction of new generic and biosimilar pharmaceuticals and price referencing (Table 15). Other PHI expenses have increased considerably compared to the budget (Table 12)16. New budget requirements and change of basis for 2019 were completely covered by additional funding in 2019.
Table 11: Total PHI expenses (in million euros)
Budget 2019*
Expected expenditure
2019 Difference
Total PHI expenses 4,931 5,167 235 Basis (2018 expenses except one-time items) 4,712 4,786 74
*approved by the Government of the SR, further 55 million euros were added after negotiations of the National Council of the SR
Table 12: Expenditure changes – PHI – no-policy-change (in million euros)
Budget 2019
Expected expenditur
e 2019 Difference
Total 131 162 30
Non-salary expenditure (increase by CPI) 29 29 0 Salary expenditure 96 96 0 Automatic salary increase mechanism for doctors in inpatient care 23 23 0 Automatic salary increase mechanism for other staff in inpatient care + MP 36 36 0 Non-medical staff 9 9 0 Healthcare professionals in outpatient care 28 28 0
Other PHI expenses -17 14 31 Health insurance company administration, contributions to
HCSA, Emergency Control Centre, NHIC, principal sum repayment (Dôvera) -17 14 31 Population ageing 23 23 0
16 The increase is primarily caused by debt repayment by Dôvera health insurance company.
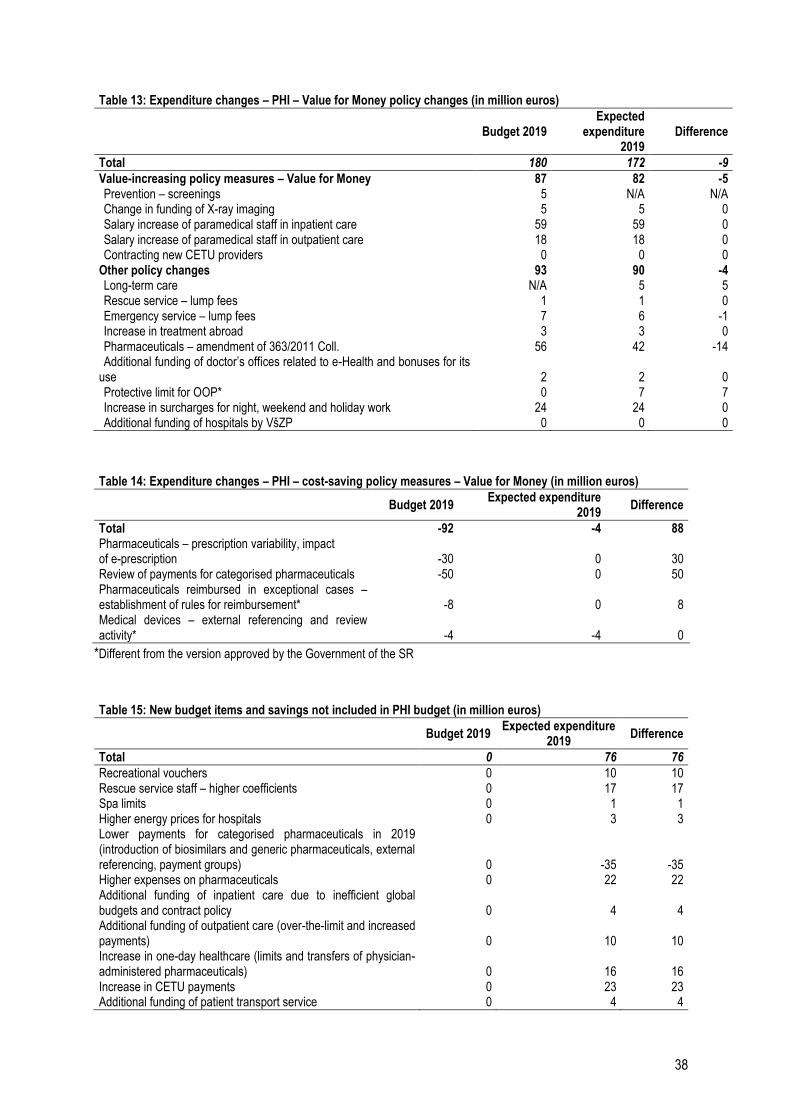
38
Table 13: Expenditure changes – PHI – Value for Money policy changes (in million euros)
Budget 2019 Expected
expenditure 2019
Difference
Total 180 172 -9
Value-increasing policy measures – Value for Money 87 82 -5 Prevention – screenings 5 N/A N/A Change in funding of X-ray imaging 5 5 0 Salary increase of paramedical staff in inpatient care 59 59 0 Salary increase of paramedical staff in outpatient care 18 18 0 Contracting new CETU providers 0 0 0
Other policy changes 93 90 -4 Long-term care N/A 5 5 Rescue service – lump fees 1 1 0 Emergency service – lump fees 7 6 -1 Increase in treatment abroad 3 3 0 Pharmaceuticals – amendment of 363/2011 Coll. 56 42 -14 Additional funding of doctor’s offices related to e-Health and bonuses for its
use 2 2 0 Protective limit for OOP* 0 7 7 Increase in surcharges for night, weekend and holiday work 24 24 0 Additional funding of hospitals by VšZP 0 0 0
Table 14: Expenditure changes – PHI – cost-saving policy measures – Value for Money (in million euros)
Budget 2019
Expected expenditure 2019
Difference
Total -92 -4 88 Pharmaceuticals – prescription variability, impact of e-prescription -30 0 30 Review of payments for categorised pharmaceuticals -50 0 50 Pharmaceuticals reimbursed in exceptional cases – establishment of rules for reimbursement* -8 0 8 Medical devices – external referencing and review activity* -4 -4 0
*Different from the version approved by the Government of the SR
Table 15: New budget items and savings not included in PHI budget (in million euros)
Budget 2019 Expected expenditure
2019 Difference
Total 0 76 76
Recreational vouchers 0 10 10 Rescue service staff – higher coefficients 0 17 17 Spa limits 0 1 1 Higher energy prices for hospitals 0 3 3 Lower payments for categorised pharmaceuticals in 2019 (introduction of biosimilars and generic pharmaceuticals, external referencing, payment groups) 0 -35 -35 Higher expenses on pharmaceuticals 0 22 22 Additional funding of inpatient care due to inefficient global budgets and contract policy 0 4 4 Additional funding of outpatient care (over-the-limit and increased payments) 0 10 10 Increase in one-day healthcare (limits and transfers of physician-administered pharmaceuticals) 0 16 16 Increase in CETU payments 0 23 23 Additional funding of patient transport service 0 4 4
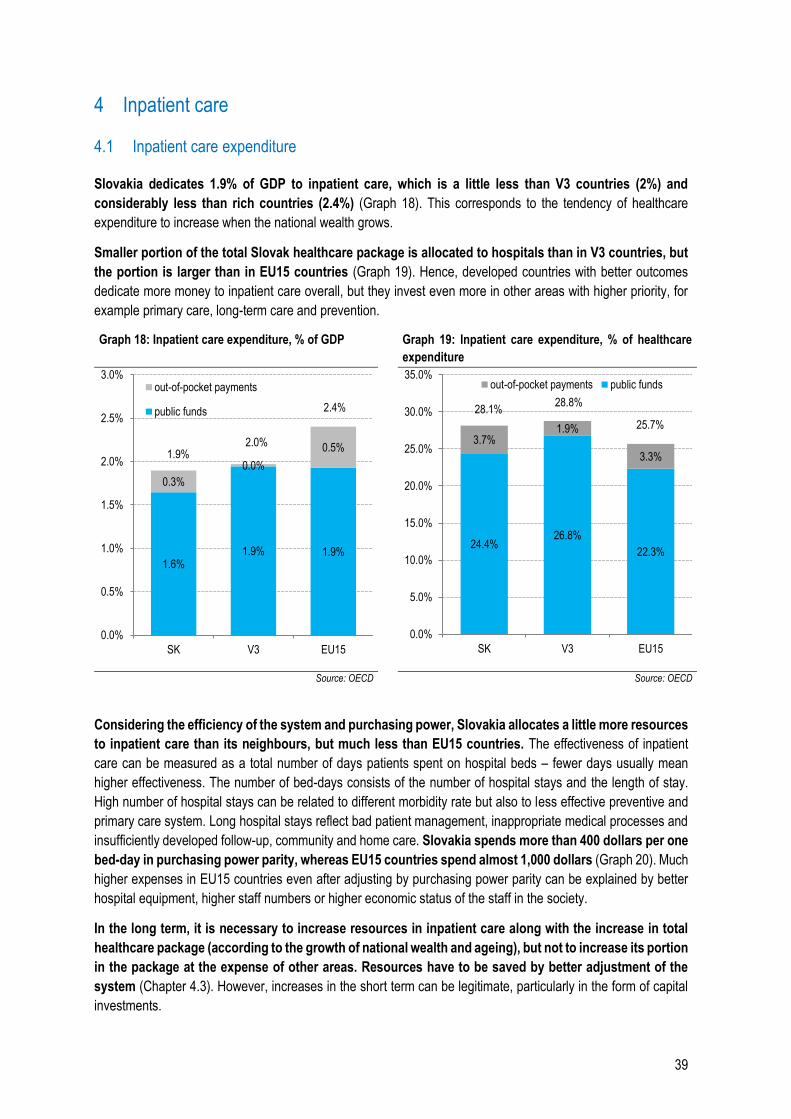
39
4 Inpatient care
4.1 Inpatient care expenditure
Slovakia dedicates 1.9% of GDP to inpatient care, which is a little less than V3 countries (2%) and
considerably less than rich countries (2.4%) (Graph 18). This corresponds to the tendency of healthcare
expenditure to increase when the national wealth grows.
Smaller portion of the total Slovak healthcare package is allocated to hospitals than in V3 countries, but
the portion is larger than in EU15 countries (Graph 19). Hence, developed countries with better outcomes
dedicate more money to inpatient care overall, but they invest even more in other areas with higher priority, for
example primary care, long-term care and prevention.
Graph 18: Inpatient care expenditure, % of GDP Graph 19: Inpatient care expenditure, % of healthcare
expenditure
Source: OECD Source: OECD
Considering the efficiency of the system and purchasing power, Slovakia allocates a little more resources
to inpatient care than its neighbours, but much less than EU15 countries. The effectiveness of inpatient
care can be measured as a total number of days patients spent on hospital beds – fewer days usually mean
higher effectiveness. The number of bed-days consists of the number of hospital stays and the length of stay.
High number of hospital stays can be related to different morbidity rate but also to less effective preventive and
primary care system. Long hospital stays reflect bad patient management, inappropriate medical processes and
insufficiently developed follow-up, community and home care. Slovakia spends more than 400 dollars per one
bed-day in purchasing power parity, whereas EU15 countries spend almost 1,000 dollars (Graph 20). Much
higher expenses in EU15 countries even after adjusting by purchasing power parity can be explained by better
hospital equipment, higher staff numbers or higher economic status of the staff in the society.
In the long term, it is necessary to increase resources in inpatient care along with the increase in total
healthcare package (according to the growth of national wealth and ageing), but not to increase its portion
in the package at the expense of other areas. Resources have to be saved by better adjustment of the
system (Chapter 4.3). However, increases in the short term can be legitimate, particularly in the form of capital
investments.
1.6%1.9% 1.9%
0.3%
0.0%
0.5%1.9%
2.0%
2.4%
0.0%
0.5%
1.0%
1.5%
2.0%
2.5%
3.0%
SK V3 EU15
out-of-pocket payments
public funds
24.4%26.8%
22.3%
3.7%1.9%
3.3%
28.1%28.8%
25.7%
0.0%
5.0%
10.0%
15.0%
20.0%
25.0%
30.0%
35.0%
SK V3 EU15
out-of-pocket payments public funds
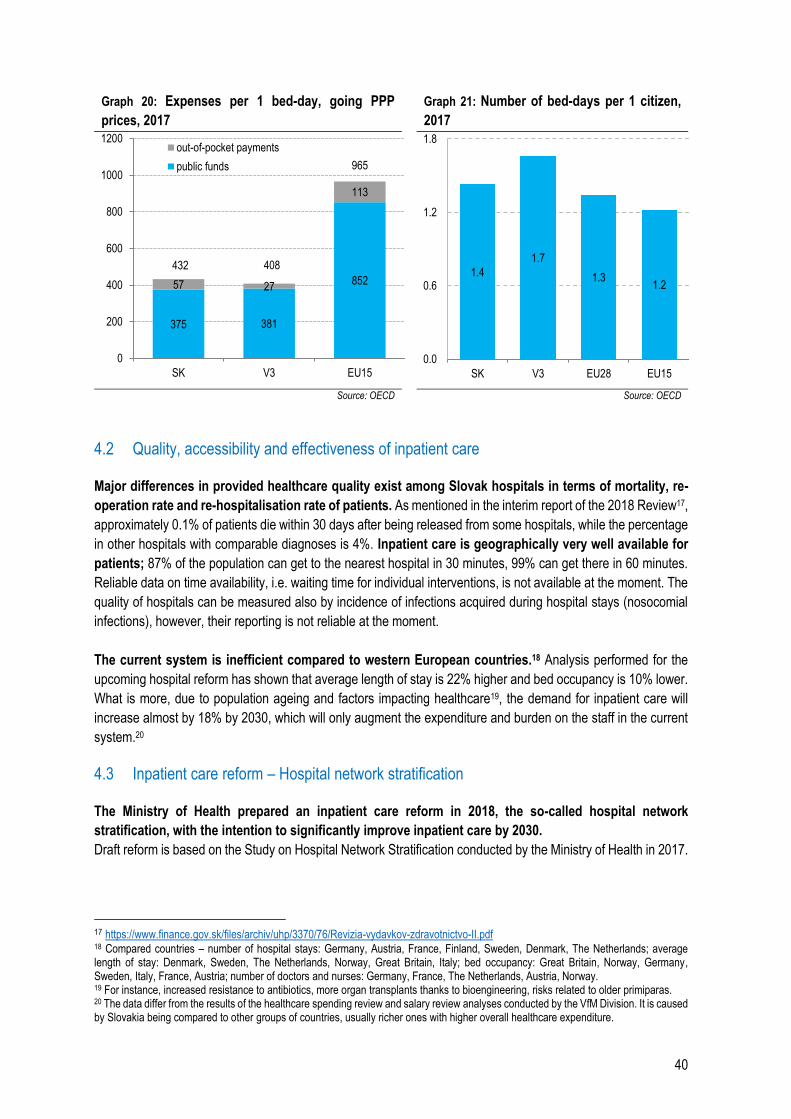
40
Graph 20: Expenses per 1 bed-day, going PPP
prices, 2017
Graph 21: Number of bed-days per 1 citizen,
2017
Source: OECD Source: OECD
4.2 Quality, accessibility and effectiveness of inpatient care
Major differences in provided healthcare quality exist among Slovak hospitals in terms of mortality, re-
operation rate and re-hospitalisation rate of patients. As mentioned in the interim report of the 2018 Review17,
approximately 0.1% of patients die within 30 days after being released from some hospitals, while the percentage
in other hospitals with comparable diagnoses is 4%. Inpatient care is geographically very well available for
patients; 87% of the population can get to the nearest hospital in 30 minutes, 99% can get there in 60 minutes.
Reliable data on time availability, i.e. waiting time for individual interventions, is not available at the moment. The
quality of hospitals can be measured also by incidence of infections acquired during hospital stays (nosocomial
infections), however, their reporting is not reliable at the moment.
The current system is inefficient compared to western European countries.18 Analysis performed for the
upcoming hospital reform has shown that average length of stay is 22% higher and bed occupancy is 10% lower.
What is more, due to population ageing and factors impacting healthcare19, the demand for inpatient care will
increase almost by 18% by 2030, which will only augment the expenditure and burden on the staff in the current
system.20
4.3 Inpatient care reform – Hospital network stratification
The Ministry of Health prepared an inpatient care reform in 2018, the so-called hospital network
stratification, with the intention to significantly improve inpatient care by 2030.
Draft reform is based on the Study on Hospital Network Stratification conducted by the Ministry of Health in 2017.
17 https://www.finance.gov.sk/files/archiv/uhp/3370/76/Revizia-vydavkov-zdravotnictvo-II.pdf 18 Compared countries – number of hospital stays: Germany, Austria, France, Finland, Sweden, Denmark, The Netherlands; average length of stay: Denmark, Sweden, The Netherlands, Norway, Great Britain, Italy; bed occupancy: Great Britain, Norway, Germany, Sweden, Italy, France, Austria; number of doctors and nurses: Germany, France, The Netherlands, Austria, Norway. 19 For instance, increased resistance to antibiotics, more organ transplants thanks to bioengineering, risks related to older primiparas. 20 The data differ from the results of the healthcare spending review and salary review analyses conducted by the VfM Division. It is caused by Slovakia being compared to other groups of countries, usually richer ones with higher overall healthcare expenditure.
375 381
85257 27
113
432 408
965
0
200
400
600
800
1000
1200
SK V3 EU15
out-of-pocket payments
public funds
1.4
1.7
1.31.2
0.0
0.6
1.2
1.8
SK V3 EU28 EU15
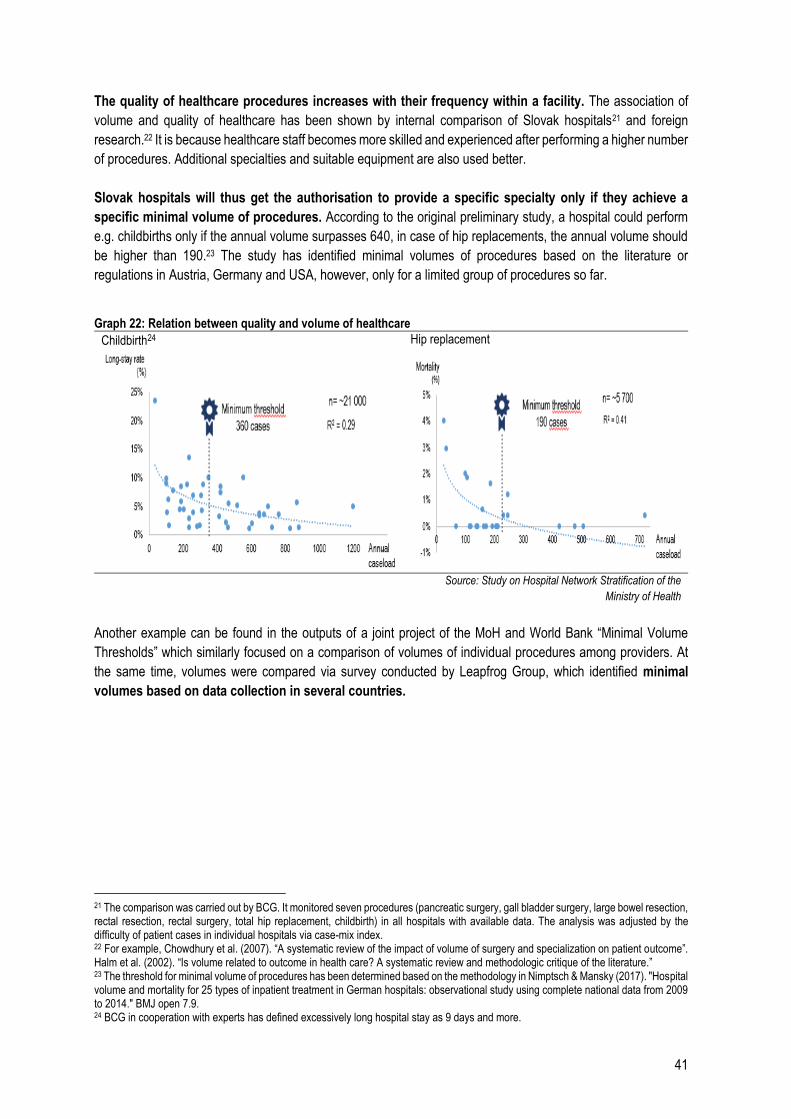
41
The quality of healthcare procedures increases with their frequency within a facility. The association of
volume and quality of healthcare has been shown by internal comparison of Slovak hospitals21 and foreign
research.22 It is because healthcare staff becomes more skilled and experienced after performing a higher number
of procedures. Additional specialties and suitable equipment are also used better.
Slovak hospitals will thus get the authorisation to provide a specific specialty only if they achieve a
specific minimal volume of procedures. According to the original preliminary study, a hospital could perform
e.g. childbirths only if the annual volume surpasses 640, in case of hip replacements, the annual volume should
be higher than 190.23 The study has identified minimal volumes of procedures based on the literature or
regulations in Austria, Germany and USA, however, only for a limited group of procedures so far.
Graph 22: Relation between quality and volume of healthcare
Childbirth24 Hip replacement
Source: Study on Hospital Network Stratification of the
Ministry of Health
Another example can be found in the outputs of a joint project of the MoH and World Bank “Minimal Volume
Thresholds” which similarly focused on a comparison of volumes of individual procedures among providers. At
the same time, volumes were compared via survey conducted by Leapfrog Group, which identified minimal
volumes based on data collection in several countries.
21 The comparison was carried out by BCG. It monitored seven procedures (pancreatic surgery, gall bladder surgery, large bowel resection, rectal resection, rectal surgery, total hip replacement, childbirth) in all hospitals with available data. The analysis was adjusted by the difficulty of patient cases in individual hospitals via case-mix index. 22 For example, Chowdhury et al. (2007). “A systematic review of the impact of volume of surgery and specialization on patient outcome”. Halm et al. (2002). “Is volume related to outcome in health care? A systematic review and methodologic critique of the literature.” 23 The threshold for minimal volume of procedures has been determined based on the methodology in Nimptsch & Mansky (2017). "Hospital volume and mortality for 25 types of inpatient treatment in German hospitals: observational study using complete national data from 2009 to 2014." BMJ open 7.9. 24 BCG in cooperation with experts has defined excessively long hospital stay as 9 days and more.
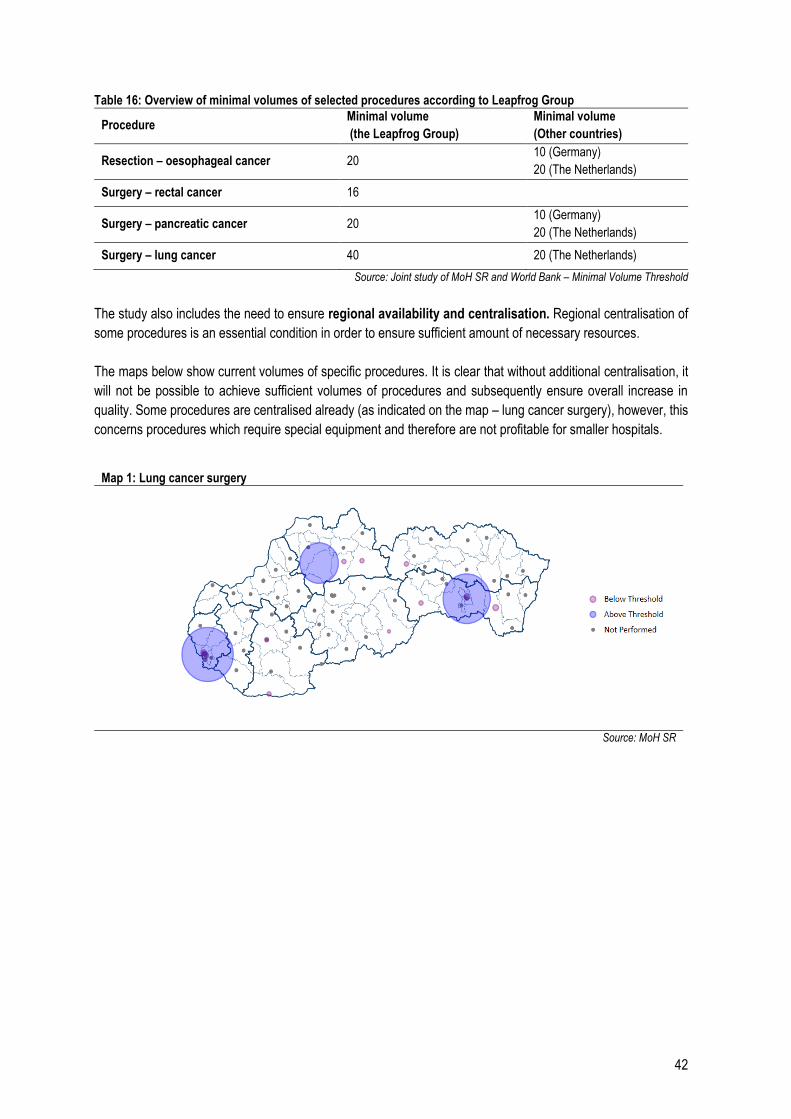
42
Table 16: Overview of minimal volumes of selected procedures according to Leapfrog Group
Procedure Minimal volume
(the Leapfrog Group)
Minimal volume
(Other countries)
Resection – oesophageal cancer 20 10 (Germany)
20 (The Netherlands)
Surgery – rectal cancer 16
Surgery – pancreatic cancer 20 10 (Germany)
20 (The Netherlands)
Surgery – lung cancer 40 20 (The Netherlands)
Source: Joint study of MoH SR and World Bank – Minimal Volume Threshold
The study also includes the need to ensure regional availability and centralisation. Regional centralisation of
some procedures is an essential condition in order to ensure sufficient amount of necessary resources.
The maps below show current volumes of specific procedures. It is clear that without additional centralisation, it
will not be possible to achieve sufficient volumes of procedures and subsequently ensure overall increase in
quality. Some procedures are centralised already (as indicated on the map – lung cancer surgery), however, this
concerns procedures which require special equipment and therefore are not profitable for smaller hospitals.
Map 1: Lung cancer surgery
Source: MoH SR
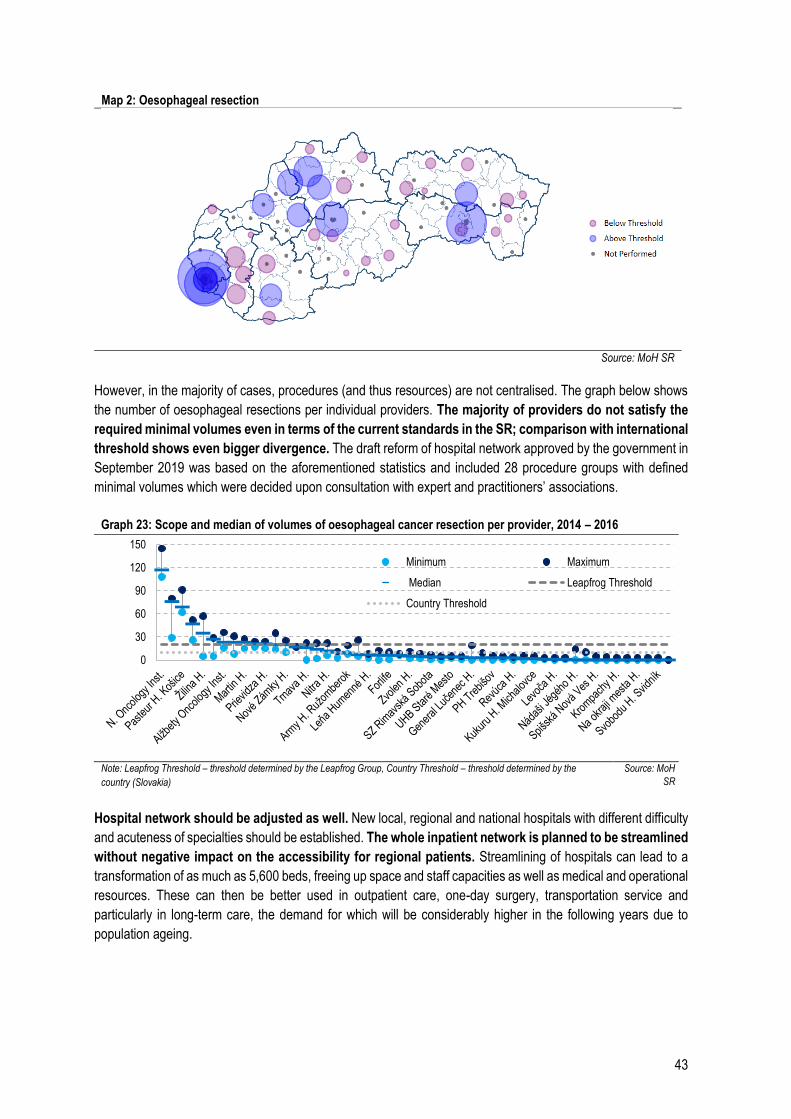
43
Map 2: Oesophageal resection
Source: MoH SR
However, in the majority of cases, procedures (and thus resources) are not centralised. The graph below shows
the number of oesophageal resections per individual providers. The majority of providers do not satisfy the
required minimal volumes even in terms of the current standards in the SR; comparison with international
threshold shows even bigger divergence. The draft reform of hospital network approved by the government in
September 2019 was based on the aforementioned statistics and included 28 procedure groups with defined
minimal volumes which were decided upon consultation with expert and practitioners’ associations.
Graph 23: Scope and median of volumes of oesophageal cancer resection per provider, 2014 – 2016
Note: Leapfrog Threshold – threshold determined by the Leapfrog Group, Country Threshold – threshold determined by the
country (Slovakia) Source: MoH
SR
Hospital network should be adjusted as well. New local, regional and national hospitals with different difficulty
and acuteness of specialties should be established. The whole inpatient network is planned to be streamlined
without negative impact on the accessibility for regional patients. Streamlining of hospitals can lead to a
transformation of as much as 5,600 beds, freeing up space and staff capacities as well as medical and operational
resources. These can then be better used in outpatient care, one-day surgery, transportation service and
particularly in long-term care, the demand for which will be considerably higher in the following years due to
population ageing.
0
30
60
90
120
150
Minimum Maximum
Median Leapfrog Threshold
Country Threshold
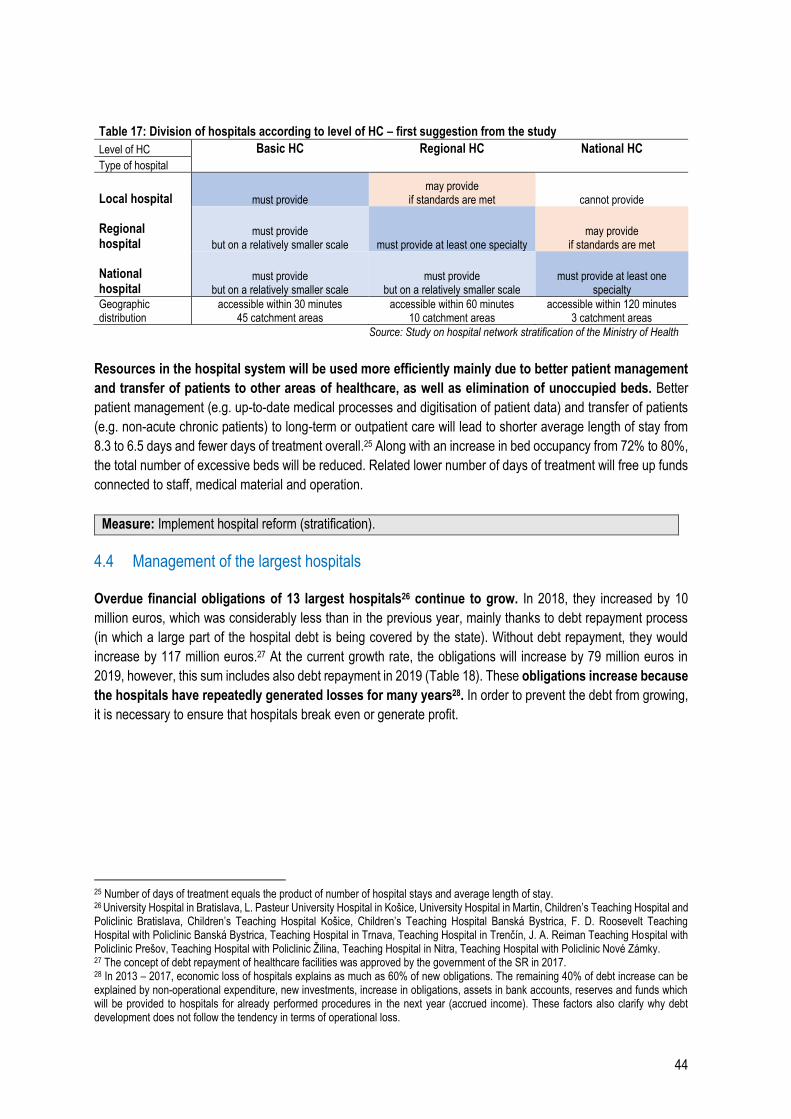
44
Table 17: Division of hospitals according to level of HC – first suggestion from the study
Level of HC Basic HC Regional HC National HC
Type of hospital
Local hospital must provide may provide
if standards are met cannot provide
Regional hospital
must provide but on a relatively smaller scale must provide at least one specialty
may provide if standards are met
National hospital
must provide but on a relatively smaller scale
must provide but on a relatively smaller scale
must provide at least one specialty
Geographic distribution
accessible within 30 minutes 45 catchment areas
accessible within 60 minutes 10 catchment areas
accessible within 120 minutes 3 catchment areas
Source: Study on hospital network stratification of the Ministry of Health
Resources in the hospital system will be used more efficiently mainly due to better patient management
and transfer of patients to other areas of healthcare, as well as elimination of unoccupied beds. Better
patient management (e.g. up-to-date medical processes and digitisation of patient data) and transfer of patients
(e.g. non-acute chronic patients) to long-term or outpatient care will lead to shorter average length of stay from
8.3 to 6.5 days and fewer days of treatment overall.25 Along with an increase in bed occupancy from 72% to 80%,
the total number of excessive beds will be reduced. Related lower number of days of treatment will free up funds
connected to staff, medical material and operation.
Measure: Implement hospital reform (stratification).
4.4 Management of the largest hospitals
Overdue financial obligations of 13 largest hospitals26 continue to grow. In 2018, they increased by 10
million euros, which was considerably less than in the previous year, mainly thanks to debt repayment process
(in which a large part of the hospital debt is being covered by the state). Without debt repayment, they would
increase by 117 million euros.27 At the current growth rate, the obligations will increase by 79 million euros in
2019, however, this sum includes also debt repayment in 2019 (Table 18). These obligations increase because
the hospitals have repeatedly generated losses for many years28. In order to prevent the debt from growing,
it is necessary to ensure that hospitals break even or generate profit.
25 Number of days of treatment equals the product of number of hospital stays and average length of stay. 26 University Hospital in Bratislava, L. Pasteur University Hospital in Košice, University Hospital in Martin, Children’s Teaching Hospital and Policlinic Bratislava, Children’s Teaching Hospital Košice, Children’s Teaching Hospital Banská Bystrica, F. D. Roosevelt Teaching Hospital with Policlinic Banská Bystrica, Teaching Hospital in Trnava, Teaching Hospital in Trenčín, J. A. Reiman Teaching Hospital with Policlinic Prešov, Teaching Hospital with Policlinic Žilina, Teaching Hospital in Nitra, Teaching Hospital with Policlinic Nové Zámky. 27 The concept of debt repayment of healthcare facilities was approved by the government of the SR in 2017. 28 In 2013 – 2017, economic loss of hospitals explains as much as 60% of new obligations. The remaining 40% of debt increase can be explained by non-operational expenditure, new investments, increase in obligations, assets in bank accounts, reserves and funds which will be provided to hospitals for already performed procedures in the next year (accrued income). These factors also clarify why debt development does not follow the tendency in terms of operational loss.
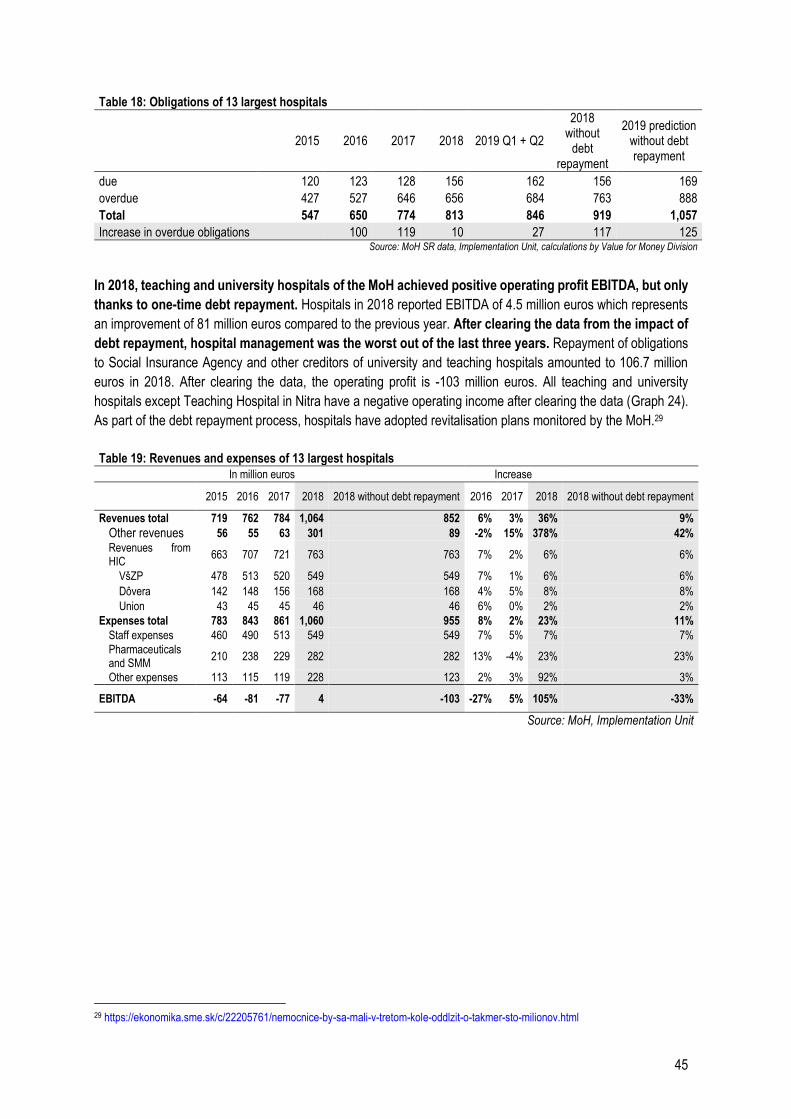
45
Table 18: Obligations of 13 largest hospitals
2015 2016 2017 2018 2019 Q1 + Q2
2018 without
debt repayment
2019 prediction without debt repayment
due 120 123 128 156 162 156 169
overdue 427 527 646 656 684 763 888
Total 547 650 774 813 846 919 1,057
Increase in overdue obligations 100 119 10 27 117 125 Source: MoH SR data, Implementation Unit, calculations by Value for Money Division
In 2018, teaching and university hospitals of the MoH achieved positive operating profit EBITDA, but only
thanks to one-time debt repayment. Hospitals in 2018 reported EBITDA of 4.5 million euros which represents
an improvement of 81 million euros compared to the previous year. After clearing the data from the impact of
debt repayment, hospital management was the worst out of the last three years. Repayment of obligations
to Social Insurance Agency and other creditors of university and teaching hospitals amounted to 106.7 million
euros in 2018. After clearing the data, the operating profit is -103 million euros. All teaching and university
hospitals except Teaching Hospital in Nitra have a negative operating income after clearing the data (Graph 24).
As part of the debt repayment process, hospitals have adopted revitalisation plans monitored by the MoH.29
Table 19: Revenues and expenses of 13 largest hospitals
In million euros Increase
2015 2016 2017 2018 2018 without debt repayment 2016 2017 2018 2018 without debt repayment
Revenues total 719 762 784 1,064 852 6% 3% 36% 9% Other revenues 56 55 63 301 89 -2% 15% 378% 42%
Revenues from HIC
663 707 721 763 763 7% 2% 6% 6%
VšZP 478 513 520 549 549 7% 1% 6% 6% Dôvera 142 148 156 168 168 4% 5% 8% 8% Union 43 45 45 46 46 6% 0% 2% 2%
Expenses total 783 843 861 1,060 955 8% 2% 23% 11%
Staff expenses 460 490 513 549 549 7% 5% 7% 7%
Pharmaceuticals and SMM
210 238 229 282 282 13% -4% 23% 23%
Other expenses 113 115 119 228 123 2% 3% 92% 3%
EBITDA -64 -81 -77 4 -103 -27% 5% 105% -33%
Source: MoH, Implementation Unit
29 https://ekonomika.sme.sk/c/22205761/nemocnice-by-sa-mali-v-tretom-kole-oddlzit-o-takmer-sto-milionov.html
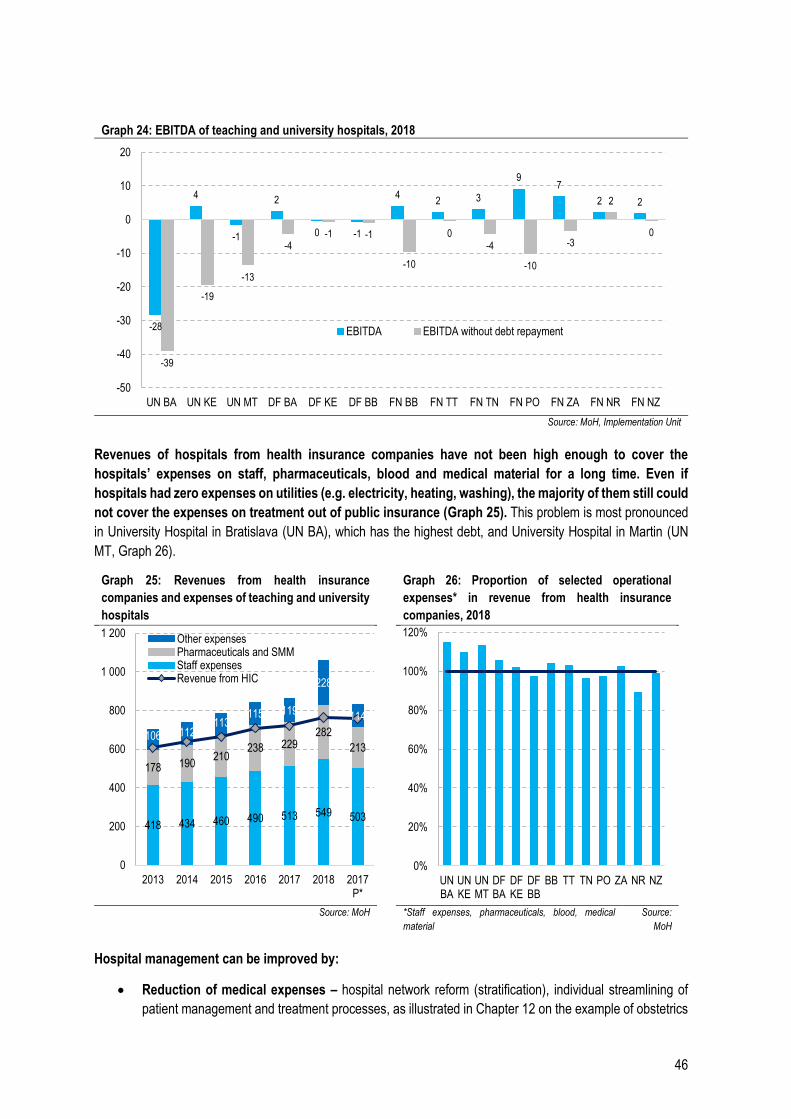
46
Graph 24: EBITDA of teaching and university hospitals, 2018
Source: MoH, Implementation Unit
Revenues of hospitals from health insurance companies have not been high enough to cover the
hospitals’ expenses on staff, pharmaceuticals, blood and medical material for a long time. Even if
hospitals had zero expenses on utilities (e.g. electricity, heating, washing), the majority of them still could
not cover the expenses on treatment out of public insurance (Graph 25). This problem is most pronounced
in University Hospital in Bratislava (UN BA), which has the highest debt, and University Hospital in Martin (UN
MT, Graph 26).
Graph 25: Revenues from health insurance
companies and expenses of teaching and university
hospitals
Graph 26: Proportion of selected operational
expenses* in revenue from health insurance
companies, 2018
Source: MoH *Staff expenses, pharmaceuticals, blood, medical
material
Source:
MoH
Hospital management can be improved by:
Reduction of medical expenses – hospital network reform (stratification), individual streamlining of
patient management and treatment processes, as illustrated in Chapter 12 on the example of obstetrics
-28
4
-1
2
0 -1
42 3
97
2 2
-39
-19
-13
-4-1 -1
-10
0-4
-10
-3
2
0
-50
-40
-30
-20
-10
0
10
20
UN BA UN KE UN MT DF BA DF KE DF BB FN BB FN TT FN TN FN PO FN ZA FN NR FN NZ
EBITDA EBITDA without debt repayment
418 434 460 490 513 549 503
178 190210
238 229282
213106 112
113115 119
228
114
0
200
400
600
800
1 000
1 200
2013 2014 2015 2016 2017 2018 2017P*
Other expensesPharmaceuticals and SMMStaff expensesRevenue from HIC
0%
20%
40%
60%
80%
100%
120%
UNBA
UNKE
UNMT
DFBA
DFKE
DFBB
BB TT TN PO ZA NR NZ
47
Reduction of operational expenditure – Chapter 4.6 below.
Improved functionality of DRG and better reimbursement mechanisms
Increase in revenue from health insurance companies – e.g. by unification of reimbursements to
hospitals for the same case (Chapter 4.7)
Increase in revenue beyond health insurance companies – e.g. letting own premises profitably
Measure: Optimise hospital expenditure and improve financial mechanisms.
Measure: Allocate capital expenditure amounting to 69 million euros in 2020 and 98 million euros in 2021 –
2022.
4.5 System of DRG reimbursements
Reimbursement mechanism based on DRG (Diagnosis Related Groups) should make hospital
management more efficient. DRG is a tool to group individual patient cases into homogeneous groups in terms
of clinical meaningfulness and costs. Homogeneous groups allow to compare the “performance” of healthcare
providers. If it is clear what type of cases a hospital manages, it is possible to reimburse them according to
standardised price-per case lists and there is no room for special agreements in contracts between individual
healthcare providers and health insurance companies. Reimbursement system based on DRG represents
payments which are unified for all cases included in a defined diagnostic group, regardless of length of stay or
department where the patient was treated. Research shows that in many cases, implementation of reimbursement
based on DRG shortened the average length of stay. On the other hand, it is challenging to set the system, price
the groups and report the cases correctly (Matthauer & Wittenbecher, 2013). Diagnostic groups in Slovakia are
inspired by the German model.
A five-year process of convergence of individual rates in hospitals began in 2018. The goal is to achieve
complete convergence into one reference base rate valid for all Slovakia. At the moment, DRG is primarily used
to report procedures, hospitals are not yet being reimbursed by this mechanism. Health insurance companies still
use reimbursement mechanism based on global budgets.
The main problem at the moment is particularly the obsolete case fee catalogue, which assigns relative
weights to individual diagnostic groups. The current relative weights do not take into account new medical
processes and changes in the ratio of individual expense groups – salaries, pharmaceuticals, SMM, procedures.
It is necessary to readjust the relative weights of the groups and then re-evaluate the case mix index (CMI) of
hospitals and base rates per group.
However, even full implementation of DRG will not solve financial issues of hospitals, mainly of the large
tertiary hospitals. Tertiary hospitals should provide healthcare for severe and complicated cases, but they also
serve as ordinary general hospitals. This arrangement means that the majority of cases are common and an
average case in a tertiary hospital is usually similar to hospitals in smaller towns, sometimes even less
complicated. For example, an average case in the University Hospital in Bratislava is less complicated than in
hospitals in Komárno or Lučenec (Table 20). After DRG rates are completely unified, tertiary hospitals should get
reimbursements for inpatient cases similar on average to normal (secondary) hospitals.
Nevertheless, part of the expenses of big hospitals is legitimately higher than in normal hospitals since they
employ leading experts and have extra equipment for solving complicated cases. However, since these
hospitals manage many regular cases, it is unclear whether they make use of these top specialists. It can
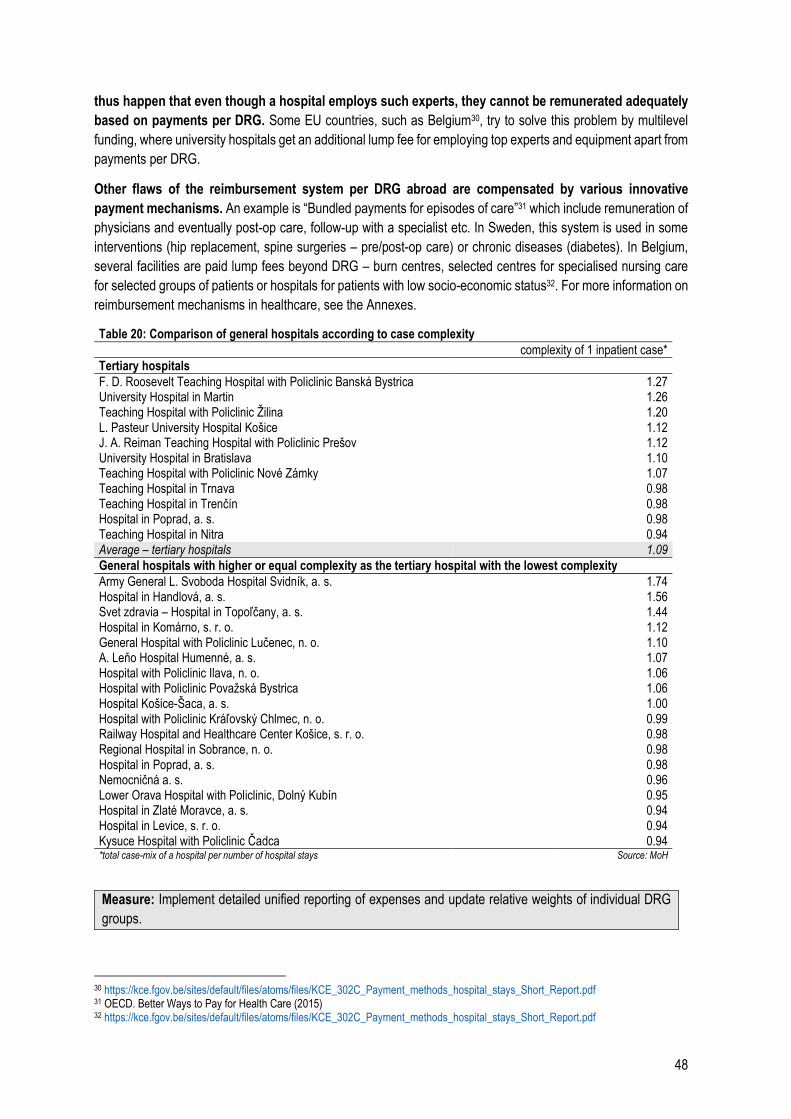
48
thus happen that even though a hospital employs such experts, they cannot be remunerated adequately
based on payments per DRG. Some EU countries, such as Belgium30, try to solve this problem by multilevel
funding, where university hospitals get an additional lump fee for employing top experts and equipment apart from
payments per DRG.
Other flaws of the reimbursement system per DRG abroad are compensated by various innovative
payment mechanisms. An example is “Bundled payments for episodes of care”31 which include remuneration of
physicians and eventually post-op care, follow-up with a specialist etc. In Sweden, this system is used in some
interventions (hip replacement, spine surgeries – pre/post-op care) or chronic diseases (diabetes). In Belgium,
several facilities are paid lump fees beyond DRG – burn centres, selected centres for specialised nursing care
for selected groups of patients or hospitals for patients with low socio-economic status32. For more information on
reimbursement mechanisms in healthcare, see the Annexes.
Table 20: Comparison of general hospitals according to case complexity complexity of 1 inpatient case*
Tertiary hospitals
F. D. Roosevelt Teaching Hospital with Policlinic Banská Bystrica 1.27 University Hospital in Martin 1.26 Teaching Hospital with Policlinic Žilina 1.20 L. Pasteur University Hospital Košice 1.12 J. A. Reiman Teaching Hospital with Policlinic Prešov 1.12 University Hospital in Bratislava 1.10 Teaching Hospital with Policlinic Nové Zámky 1.07 Teaching Hospital in Trnava 0.98 Teaching Hospital in Trenčín 0.98 Hospital in Poprad, a. s. 0.98 Teaching Hospital in Nitra 0.94 Average – tertiary hospitals 1.09
General hospitals with higher or equal complexity as the tertiary hospital with the lowest complexity
Army General L. Svoboda Hospital Svidník, a. s. 1.74 Hospital in Handlová, a. s. 1.56 Svet zdravia – Hospital in Topoľčany, a. s. 1.44 Hospital in Komárno, s. r. o. 1.12 General Hospital with Policlinic Lučenec, n. o. 1.10 A. Leňo Hospital Humenné, a. s. 1.07 Hospital with Policlinic Ilava, n. o. 1.06 Hospital with Policlinic Považská Bystrica 1.06 Hospital Košice-Šaca, a. s. 1.00 Hospital with Policlinic Kráľovský Chlmec, n. o. 0.99 Railway Hospital and Healthcare Center Košice, s. r. o. 0.98 Regional Hospital in Sobrance, n. o. 0.98 Hospital in Poprad, a. s. 0.98 Nemocničná a. s. 0.96 Lower Orava Hospital with Policlinic, Dolný Kubín 0.95 Hospital in Zlaté Moravce, a. s. 0.94 Hospital in Levice, s. r. o. 0.94 Kysuce Hospital with Policlinic Čadca 0.94 *total case-mix of a hospital per number of hospital stays Source: MoH
Measure: Implement detailed unified reporting of expenses and update relative weights of individual DRG
groups.
30 https://kce.fgov.be/sites/default/files/atoms/files/KCE_302C_Payment_methods_hospital_stays_Short_Report.pdf 31 OECD. Better Ways to Pay for Health Care (2015) 32 https://kce.fgov.be/sites/default/files/atoms/files/KCE_302C_Payment_methods_hospital_stays_Short_Report.pdf
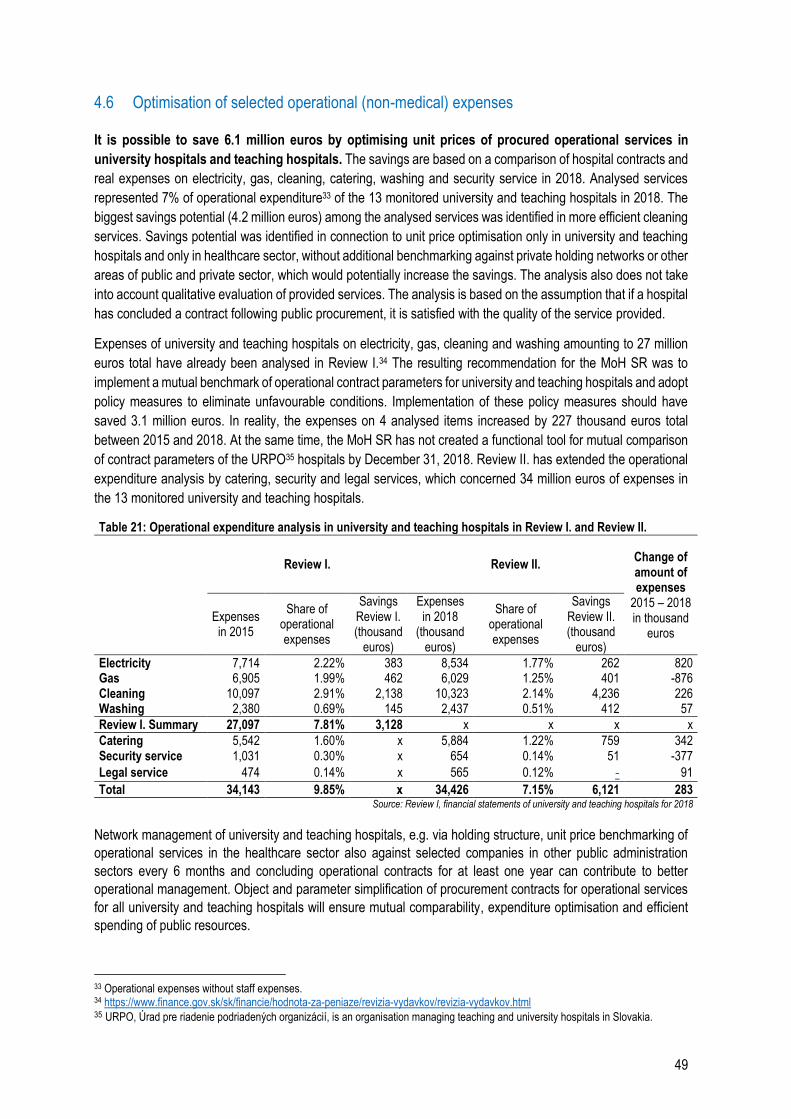
49
4.6 Optimisation of selected operational (non-medical) expenses
It is possible to save 6.1 million euros by optimising unit prices of procured operational services in
university hospitals and teaching hospitals. The savings are based on a comparison of hospital contracts and
real expenses on electricity, gas, cleaning, catering, washing and security service in 2018. Analysed services
represented 7% of operational expenditure33 of the 13 monitored university and teaching hospitals in 2018. The
biggest savings potential (4.2 million euros) among the analysed services was identified in more efficient cleaning
services. Savings potential was identified in connection to unit price optimisation only in university and teaching
hospitals and only in healthcare sector, without additional benchmarking against private holding networks or other
areas of public and private sector, which would potentially increase the savings. The analysis also does not take
into account qualitative evaluation of provided services. The analysis is based on the assumption that if a hospital
has concluded a contract following public procurement, it is satisfied with the quality of the service provided.
Expenses of university and teaching hospitals on electricity, gas, cleaning and washing amounting to 27 million
euros total have already been analysed in Review I.34 The resulting recommendation for the MoH SR was to
implement a mutual benchmark of operational contract parameters for university and teaching hospitals and adopt
policy measures to eliminate unfavourable conditions. Implementation of these policy measures should have
saved 3.1 million euros. In reality, the expenses on 4 analysed items increased by 227 thousand euros total
between 2015 and 2018. At the same time, the MoH SR has not created a functional tool for mutual comparison
of contract parameters of the URPO35 hospitals by December 31, 2018. Review II. has extended the operational
expenditure analysis by catering, security and legal services, which concerned 34 million euros of expenses in
the 13 monitored university and teaching hospitals.
Table 21: Operational expenditure analysis in university and teaching hospitals in Review I. and Review II.
Review I. Review II. Change of amount of expenses
2015 – 2018 in thousand
euros
Expenses in 2015
Share of operational expenses
Savings Review I. (thousand
euros)
Expenses in 2018
(thousand euros)
Share of operational expenses
Savings Review II. (thousand
euros)
Electricity 7,714 2.22% 383 8,534 1.77% 262 820 Gas 6,905 1.99% 462 6,029 1.25% 401 -876 Cleaning 10,097 2.91% 2,138 10,323 2.14% 4,236 226 Washing 2,380 0.69% 145 2,437 0.51% 412 57
Review I. Summary 27,097 7.81% 3,128 x x x x
Catering 5,542 1.60% x 5,884 1.22% 759 342 Security service 1,031 0.30% x 654 0.14% 51 -377
Legal service 474 0.14% x 565 0.12% - 91
Total 34,143 9.85% x 34,426 7.15% 6,121 283 Source: Review I, financial statements of university and teaching hospitals for 2018
Network management of university and teaching hospitals, e.g. via holding structure, unit price benchmarking of
operational services in the healthcare sector also against selected companies in other public administration
sectors every 6 months and concluding operational contracts for at least one year can contribute to better
operational management. Object and parameter simplification of procurement contracts for operational services
for all university and teaching hospitals will ensure mutual comparability, expenditure optimisation and efficient
spending of public resources.
33 Operational expenses without staff expenses. 34 https://www.finance.gov.sk/sk/financie/hodnota-za-peniaze/revizia-vydavkov/revizia-vydavkov.html 35 URPO, Úrad pre riadenie podriadených organizácií, is an organisation managing teaching and university hospitals in Slovakia.
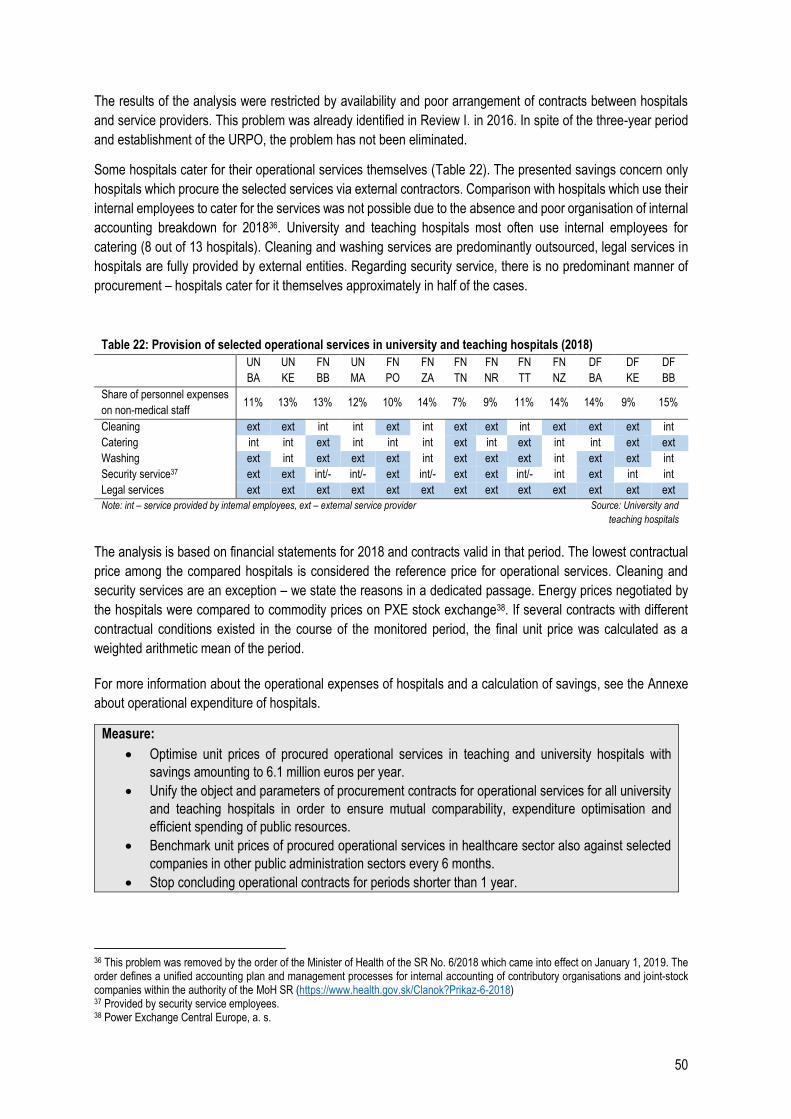
50
The results of the analysis were restricted by availability and poor arrangement of contracts between hospitals
and service providers. This problem was already identified in Review I. in 2016. In spite of the three-year period
and establishment of the URPO, the problem has not been eliminated.
Some hospitals cater for their operational services themselves (Table 22). The presented savings concern only
hospitals which procure the selected services via external contractors. Comparison with hospitals which use their
internal employees to cater for the services was not possible due to the absence and poor organisation of internal
accounting breakdown for 201836. University and teaching hospitals most often use internal employees for
catering (8 out of 13 hospitals). Cleaning and washing services are predominantly outsourced, legal services in
hospitals are fully provided by external entities. Regarding security service, there is no predominant manner of
procurement – hospitals cater for it themselves approximately in half of the cases.
Table 22: Provision of selected operational services in university and teaching hospitals (2018)
UN
BA
UN
KE
FN
BB
UN
MA
FN
PO
FN
ZA
FN
TN
FN
NR
FN
TT
FN
NZ
DF
BA
DF
KE
DF
BB
Share of personnel expenses
on non-medical staff 11% 13% 13% 12% 10% 14% 7% 9% 11% 14% 14% 9% 15%
Cleaning ext ext int int ext int ext ext int ext ext ext int
Catering int int ext int int int ext int ext int int ext ext
Washing ext int ext ext ext int ext ext ext int ext ext int
Security service37 ext ext int/- int/- ext int/- ext ext int/- int ext int int
Legal services ext ext ext ext ext ext ext ext ext ext ext ext ext
Note: int – service provided by internal employees, ext – external service provider Source: University and
teaching hospitals
The analysis is based on financial statements for 2018 and contracts valid in that period. The lowest contractual
price among the compared hospitals is considered the reference price for operational services. Cleaning and
security services are an exception – we state the reasons in a dedicated passage. Energy prices negotiated by
the hospitals were compared to commodity prices on PXE stock exchange38. If several contracts with different
contractual conditions existed in the course of the monitored period, the final unit price was calculated as a
weighted arithmetic mean of the period.
For more information about the operational expenses of hospitals and a calculation of savings, see the Annexe
about operational expenditure of hospitals.
Measure:
Optimise unit prices of procured operational services in teaching and university hospitals with
savings amounting to 6.1 million euros per year.
Unify the object and parameters of procurement contracts for operational services for all university
and teaching hospitals in order to ensure mutual comparability, expenditure optimisation and
efficient spending of public resources.
Benchmark unit prices of procured operational services in healthcare sector also against selected
companies in other public administration sectors every 6 months.
Stop concluding operational contracts for periods shorter than 1 year.
36 This problem was removed by the order of the Minister of Health of the SR No. 6/2018 which came into effect on January 1, 2019. The order defines a unified accounting plan and management processes for internal accounting of contributory organisations and joint-stock companies within the authority of the MoH SR (https://www.health.gov.sk/Clanok?Prikaz-6-2018) 37 Provided by security service employees. 38 Power Exchange Central Europe, a. s.
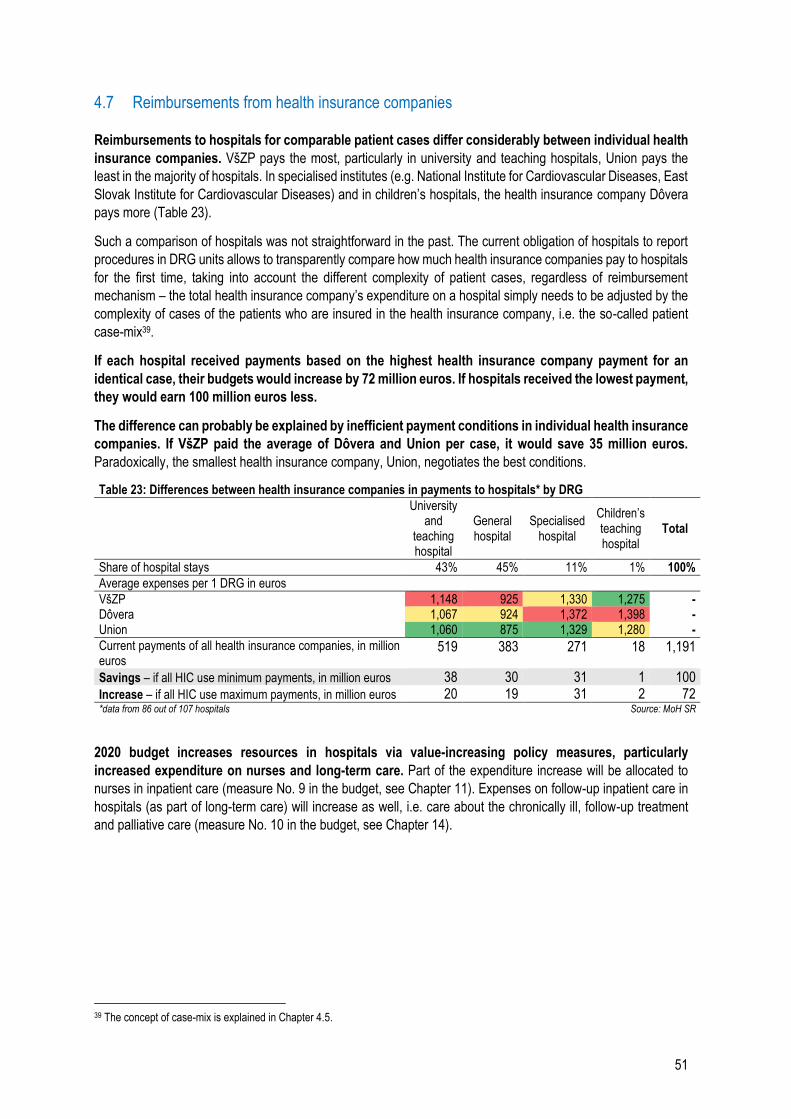
51
4.7 Reimbursements from health insurance companies
Reimbursements to hospitals for comparable patient cases differ considerably between individual health
insurance companies. VšZP pays the most, particularly in university and teaching hospitals, Union pays the
least in the majority of hospitals. In specialised institutes (e.g. National Institute for Cardiovascular Diseases, East
Slovak Institute for Cardiovascular Diseases) and in children’s hospitals, the health insurance company Dôvera
pays more (Table 23).
Such a comparison of hospitals was not straightforward in the past. The current obligation of hospitals to report
procedures in DRG units allows to transparently compare how much health insurance companies pay to hospitals
for the first time, taking into account the different complexity of patient cases, regardless of reimbursement
mechanism – the total health insurance company’s expenditure on a hospital simply needs to be adjusted by the
complexity of cases of the patients who are insured in the health insurance company, i.e. the so-called patient
case-mix39.
If each hospital received payments based on the highest health insurance company payment for an
identical case, their budgets would increase by 72 million euros. If hospitals received the lowest payment,
they would earn 100 million euros less.
The difference can probably be explained by inefficient payment conditions in individual health insurance
companies. If VšZP paid the average of Dôvera and Union per case, it would save 35 million euros.
Paradoxically, the smallest health insurance company, Union, negotiates the best conditions.
Table 23: Differences between health insurance companies in payments to hospitals* by DRG
University and
teaching hospital
General hospital
Specialised hospital
Children’s teaching hospital
Total
Share of hospital stays 43% 45% 11% 1% 100%
Average expenses per 1 DRG in euros
VšZP 1,148 925 1,330 1,275 - Dôvera 1,067 924 1,372 1,398 - Union 1,060 875 1,329 1,280 -
Current payments of all health insurance companies, in million euros
519 383 271 18 1,191
Savings – if all HIC use minimum payments, in million euros 38 30 31 1 100
Increase – if all HIC use maximum payments, in million euros 20 19 31 2 72 *data from 86 out of 107 hospitals Source: MoH SR
2020 budget increases resources in hospitals via value-increasing policy measures, particularly
increased expenditure on nurses and long-term care. Part of the expenditure increase will be allocated to
nurses in inpatient care (measure No. 9 in the budget, see Chapter 11). Expenses on follow-up inpatient care in
hospitals (as part of long-term care) will increase as well, i.e. care about the chronically ill, follow-up treatment
and palliative care (measure No. 10 in the budget, see Chapter 14).
39 The concept of case-mix is explained in Chapter 4.5.
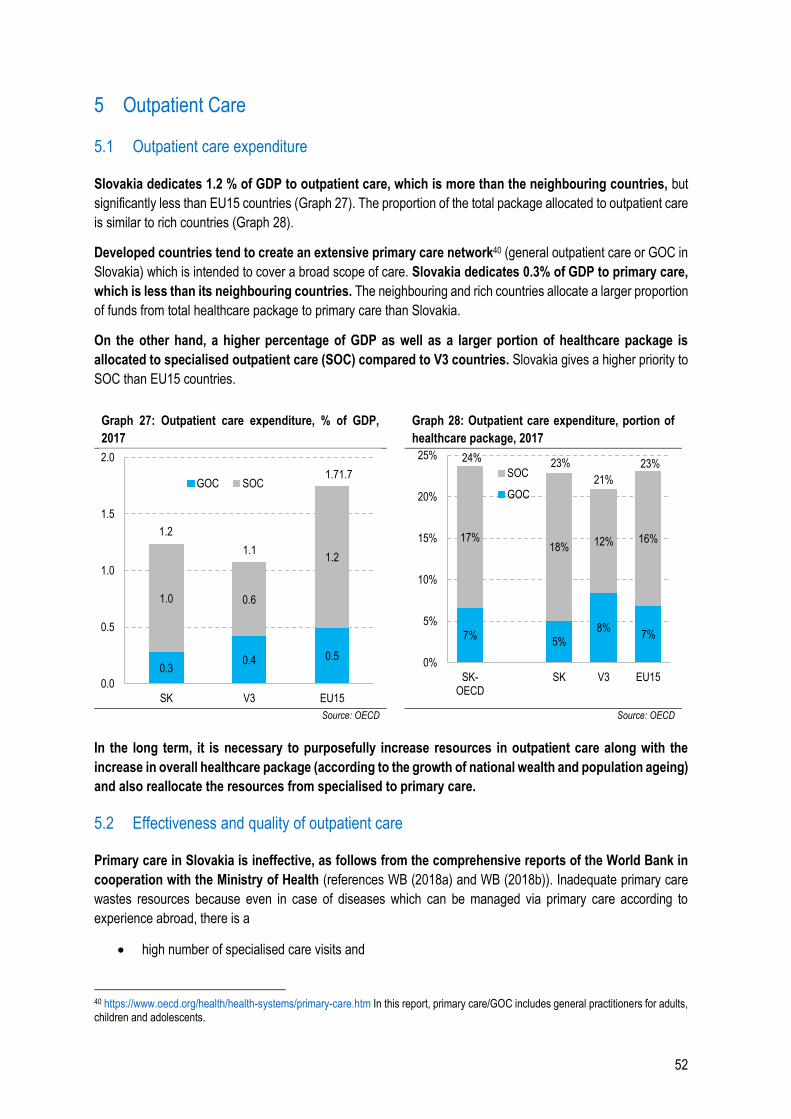
52
5 Outpatient Care
5.1 Outpatient care expenditure
Slovakia dedicates 1.2 % of GDP to outpatient care, which is more than the neighbouring countries, but
significantly less than EU15 countries (Graph 27). The proportion of the total package allocated to outpatient care
is similar to rich countries (Graph 28).
Developed countries tend to create an extensive primary care network40 (general outpatient care or GOC in
Slovakia) which is intended to cover a broad scope of care. Slovakia dedicates 0.3% of GDP to primary care,
which is less than its neighbouring countries. The neighbouring and rich countries allocate a larger proportion
of funds from total healthcare package to primary care than Slovakia.
On the other hand, a higher percentage of GDP as well as a larger portion of healthcare package is
allocated to specialised outpatient care (SOC) compared to V3 countries. Slovakia gives a higher priority to
SOC than EU15 countries.
Graph 27: Outpatient care expenditure, % of GDP,
2017 Graph 28: Outpatient care expenditure, portion of
healthcare package, 2017
Source: OECD Source: OECD
In the long term, it is necessary to purposefully increase resources in outpatient care along with the
increase in overall healthcare package (according to the growth of national wealth and population ageing)
and also reallocate the resources from specialised to primary care.
5.2 Effectiveness and quality of outpatient care
Primary care in Slovakia is ineffective, as follows from the comprehensive reports of the World Bank in
cooperation with the Ministry of Health (references WB (2018a) and WB (2018b)). Inadequate primary care
wastes resources because even in case of diseases which can be managed via primary care according to
experience abroad, there is a
high number of specialised care visits and
40 https://www.oecd.org/health/health-systems/primary-care.htm In this report, primary care/GOC includes general practitioners for adults, children and adolescents.
0.30.4 0.5
1.0 0.6
1.2
1.2
1.1
1.71.7
0.0
0.5
1.0
1.5
2.0
SK V3 EU15
GOC SOC
7%5%
8%7%
17%18%
12% 16%
24% 23%
21%
23%
0%
5%
10%
15%
20%
25%
SK-OECD
SK V3 EU15
SOC
GOC
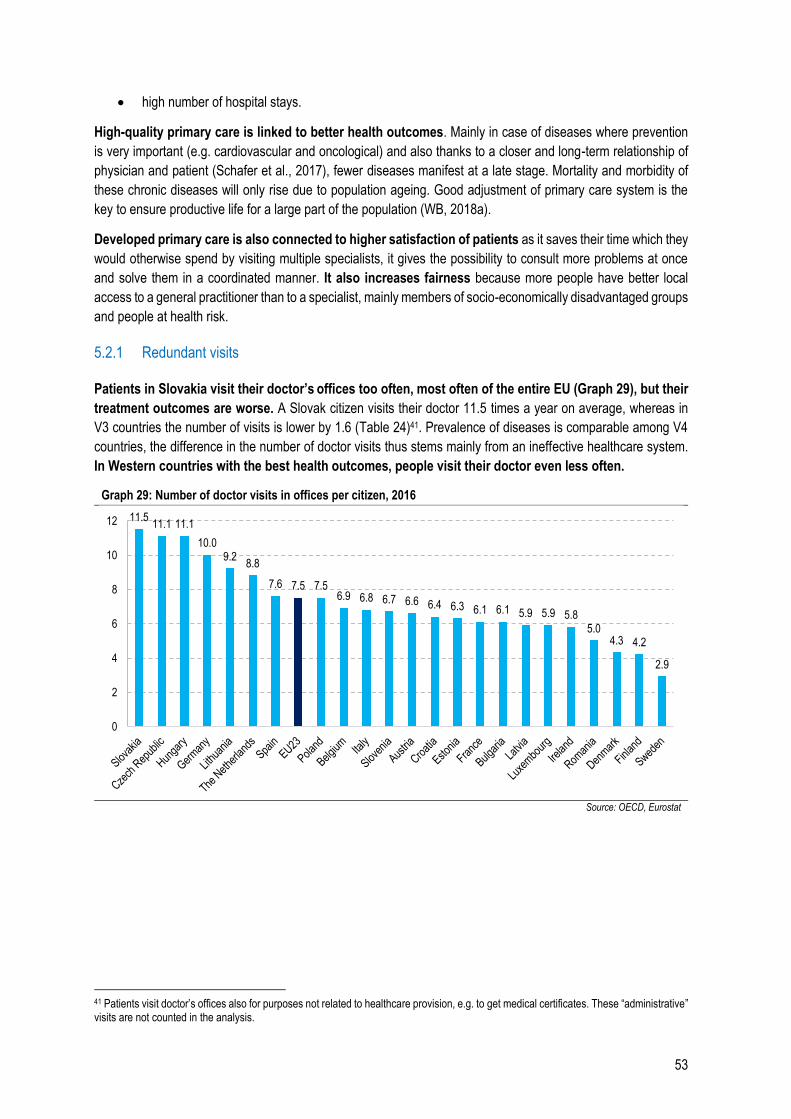
53
high number of hospital stays.
High-quality primary care is linked to better health outcomes. Mainly in case of diseases where prevention
is very important (e.g. cardiovascular and oncological) and also thanks to a closer and long-term relationship of
physician and patient (Schafer et al., 2017), fewer diseases manifest at a late stage. Mortality and morbidity of
these chronic diseases will only rise due to population ageing. Good adjustment of primary care system is the
key to ensure productive life for a large part of the population (WB, 2018a).
Developed primary care is also connected to higher satisfaction of patients as it saves their time which they
would otherwise spend by visiting multiple specialists, it gives the possibility to consult more problems at once
and solve them in a coordinated manner. It also increases fairness because more people have better local
access to a general practitioner than to a specialist, mainly members of socio-economically disadvantaged groups
and people at health risk.
5.2.1 Redundant visits
Patients in Slovakia visit their doctor’s offices too often, most often of the entire EU (Graph 29), but their
treatment outcomes are worse. A Slovak citizen visits their doctor 11.5 times a year on average, whereas in
V3 countries the number of visits is lower by 1.6 (Table 24)41. Prevalence of diseases is comparable among V4
countries, the difference in the number of doctor visits thus stems mainly from an ineffective healthcare system.
In Western countries with the best health outcomes, people visit their doctor even less often.
Graph 29: Number of doctor visits in offices per citizen, 2016
Source: OECD, Eurostat
41 Patients visit doctor’s offices also for purposes not related to healthcare provision, e.g. to get medical certificates. These “administrative” visits are not counted in the analysis.
11.511.1 11.1
10.09.2
8.8
7.6 7.5 7.56.9 6.8 6.7 6.6 6.4 6.3 6.1 6.1 5.9 5.9 5.8
5.04.3 4.2
2.9
0
2
4
6
8
10
12
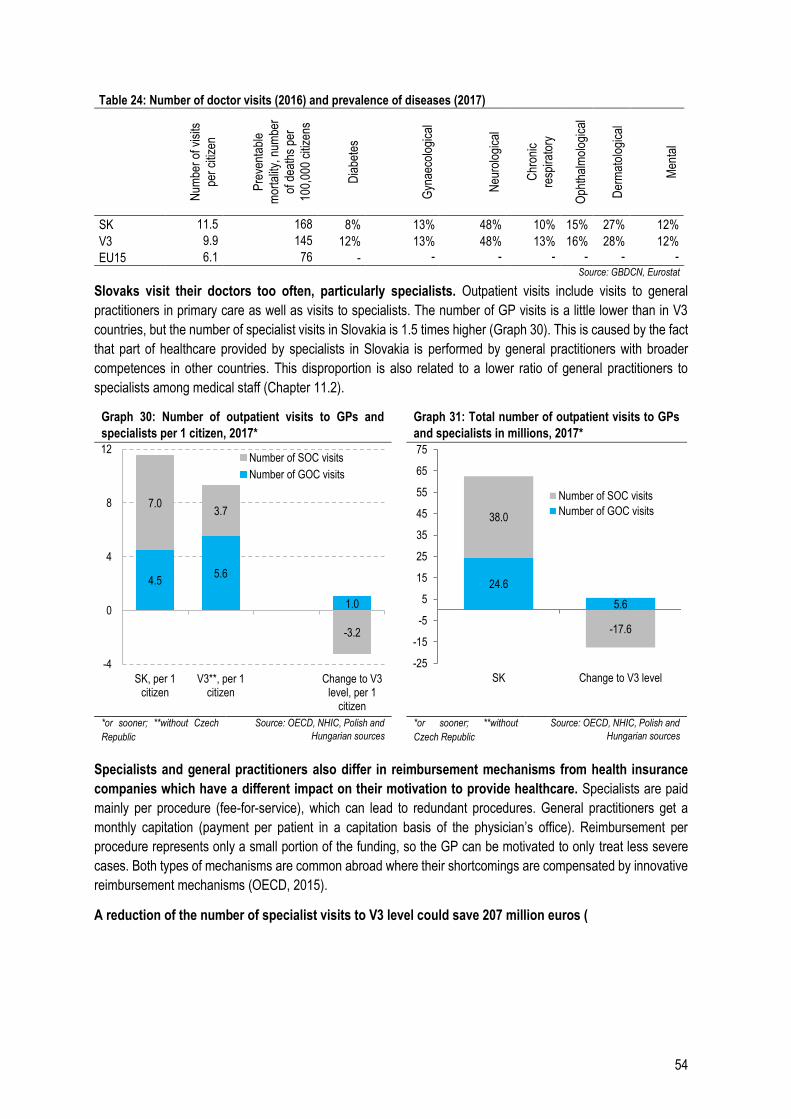
54
Table 24: Number of doctor visits (2016) and prevalence of diseases (2017)
N
umbe
r of
vis
its
per
citiz
en
Pre
vent
able
mor
talit
y, n
umbe
r
of d
eath
s pe
r
100,
000
citiz
ens
Dia
bete
s
Gyn
aeco
logi
cal
Neu
rolo
gica
l
Chr
onic
resp
irato
ry
Oph
thal
mol
ogic
al
Der
mat
olog
ical
Men
tal
SK 11.5 168 8% 13% 48% 10% 15% 27% 12%
V3 9.9 145 12% 13% 48% 13% 16% 28% 12%
EU15 6.1 76 - - - - - - - Source: GBDCN, Eurostat
Slovaks visit their doctors too often, particularly specialists. Outpatient visits include visits to general
practitioners in primary care as well as visits to specialists. The number of GP visits is a little lower than in V3
countries, but the number of specialist visits in Slovakia is 1.5 times higher (Graph 30). This is caused by the fact
that part of healthcare provided by specialists in Slovakia is performed by general practitioners with broader
competences in other countries. This disproportion is also related to a lower ratio of general practitioners to
specialists among medical staff (Chapter 11.2).
Graph 30: Number of outpatient visits to GPs and
specialists per 1 citizen, 2017* Graph 31: Total number of outpatient visits to GPs
and specialists in millions, 2017*
*or sooner; **without Czech
Republic
Source: OECD, NHIC, Polish and
Hungarian sources *or sooner; **without
Czech Republic
Source: OECD, NHIC, Polish and
Hungarian sources
Specialists and general practitioners also differ in reimbursement mechanisms from health insurance
companies which have a different impact on their motivation to provide healthcare. Specialists are paid
mainly per procedure (fee-for-service), which can lead to redundant procedures. General practitioners get a
monthly capitation (payment per patient in a capitation basis of the physician’s office). Reimbursement per
procedure represents only a small portion of the funding, so the GP can be motivated to only treat less severe
cases. Both types of mechanisms are common abroad where their shortcomings are compensated by innovative
reimbursement mechanisms (OECD, 2015).
A reduction of the number of specialist visits to V3 level could save 207 million euros (
4.55.6
1.0
7.03.7
-3.2
-4
0
4
8
12
SK, per 1citizen
V3**, per 1citizen
Change to V3level, per 1
citizen
Number of SOC visits
Number of GOC visits
24.6
5.6
38.0
-17.6
-25
-15
-5
5
15
25
35
45
55
65
75
SK Change to V3 level
Number of SOC visits
Number of GOC visits
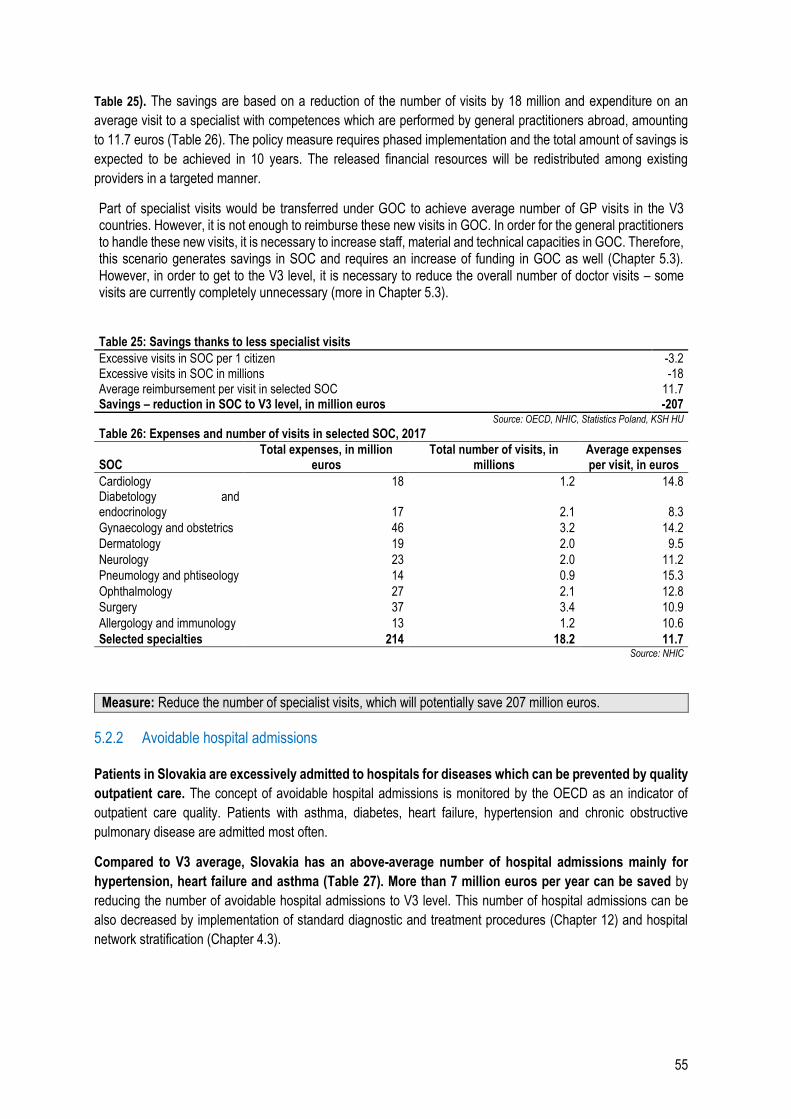
55
Table 25). The savings are based on a reduction of the number of visits by 18 million and expenditure on an
average visit to a specialist with competences which are performed by general practitioners abroad, amounting
to 11.7 euros (Table 26). The policy measure requires phased implementation and the total amount of savings is
expected to be achieved in 10 years. The released financial resources will be redistributed among existing
providers in a targeted manner.
Part of specialist visits would be transferred under GOC to achieve average number of GP visits in the V3 countries. However, it is not enough to reimburse these new visits in GOC. In order for the general practitioners to handle these new visits, it is necessary to increase staff, material and technical capacities in GOC. Therefore, this scenario generates savings in SOC and requires an increase of funding in GOC as well (Chapter 5.3). However, in order to get to the V3 level, it is necessary to reduce the overall number of doctor visits – some visits are currently completely unnecessary (more in Chapter 5.3). Table 25: Savings thanks to less specialist visits
Excessive visits in SOC per 1 citizen -3.2 Excessive visits in SOC in millions -18 Average reimbursement per visit in selected SOC 11.7 Savings – reduction in SOC to V3 level, in million euros -207
Source: OECD, NHIC, Statistics Poland, KSH HU Table 26: Expenses and number of visits in selected SOC, 2017
SOC Total expenses, in million
euros Total number of visits, in
millions Average expenses per visit, in euros
Cardiology 18 1.2 14.8 Diabetology and endocrinology 17 2.1 8.3
Gynaecology and obstetrics 46 3.2 14.2
Dermatology 19 2.0 9.5
Neurology 23 2.0 11.2
Pneumology and phtiseology 14 0.9 15.3
Ophthalmology 27 2.1 12.8
Surgery 37 3.4 10.9
Allergology and immunology 13 1.2 10.6
Selected specialties 214 18.2 11.7 Source: NHIC
Measure: Reduce the number of specialist visits, which will potentially save 207 million euros.
5.2.2 Avoidable hospital admissions
Patients in Slovakia are excessively admitted to hospitals for diseases which can be prevented by quality
outpatient care. The concept of avoidable hospital admissions is monitored by the OECD as an indicator of
outpatient care quality. Patients with asthma, diabetes, heart failure, hypertension and chronic obstructive
pulmonary disease are admitted most often.
Compared to V3 average, Slovakia has an above-average number of hospital admissions mainly for
hypertension, heart failure and asthma (Table 27). More than 7 million euros per year can be saved by
reducing the number of avoidable hospital admissions to V3 level. This number of hospital admissions can be
also decreased by implementation of standard diagnostic and treatment procedures (Chapter 12) and hospital
network stratification (Chapter 4.3).
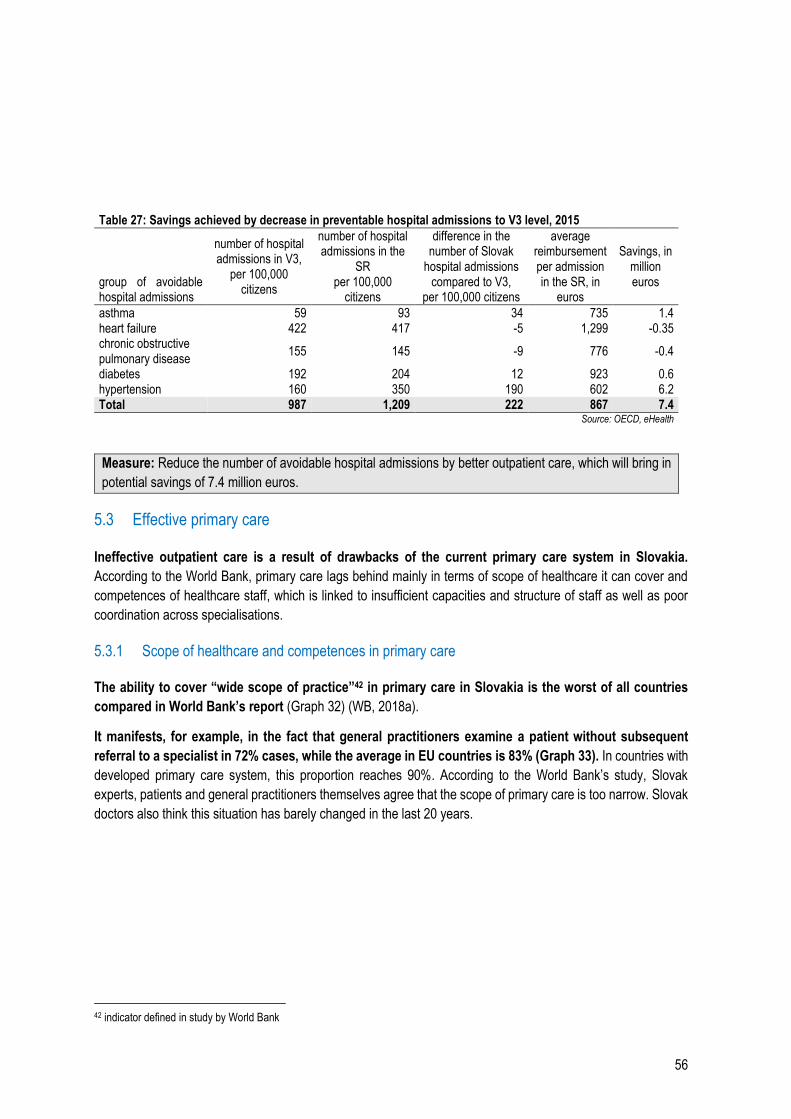
56
Table 27: Savings achieved by decrease in preventable hospital admissions to V3 level, 2015
group of avoidable hospital admissions
number of hospital admissions in V3,
per 100,000 citizens
number of hospital admissions in the
SR per 100,000
citizens
difference in the number of Slovak
hospital admissions compared to V3,
per 100,000 citizens
average reimbursement per admission in the SR, in
euros
Savings, in million euros
asthma 59 93 34 735 1.4 heart failure 422 417 -5 1,299 -0.35 chronic obstructive pulmonary disease
155 145 -9 776 -0.4
diabetes 192 204 12 923 0.6 hypertension 160 350 190 602 6.2 Total 987 1,209 222 867 7.4
Source: OECD, eHealth
Measure: Reduce the number of avoidable hospital admissions by better outpatient care, which will bring in
potential savings of 7.4 million euros.
5.3 Effective primary care
Ineffective outpatient care is a result of drawbacks of the current primary care system in Slovakia.
According to the World Bank, primary care lags behind mainly in terms of scope of healthcare it can cover and
competences of healthcare staff, which is linked to insufficient capacities and structure of staff as well as poor
coordination across specialisations.
5.3.1 Scope of healthcare and competences in primary care
The ability to cover “wide scope of practice”42 in primary care in Slovakia is the worst of all countries
compared in World Bank’s report (Graph 32) (WB, 2018a).
It manifests, for example, in the fact that general practitioners examine a patient without subsequent
referral to a specialist in 72% cases, while the average in EU countries is 83% (Graph 33). In countries with
developed primary care system, this proportion reaches 90%. According to the World Bank’s study, Slovak
experts, patients and general practitioners themselves agree that the scope of primary care is too narrow. Slovak
doctors also think this situation has barely changed in the last 20 years.
42 indicator defined in study by World Bank
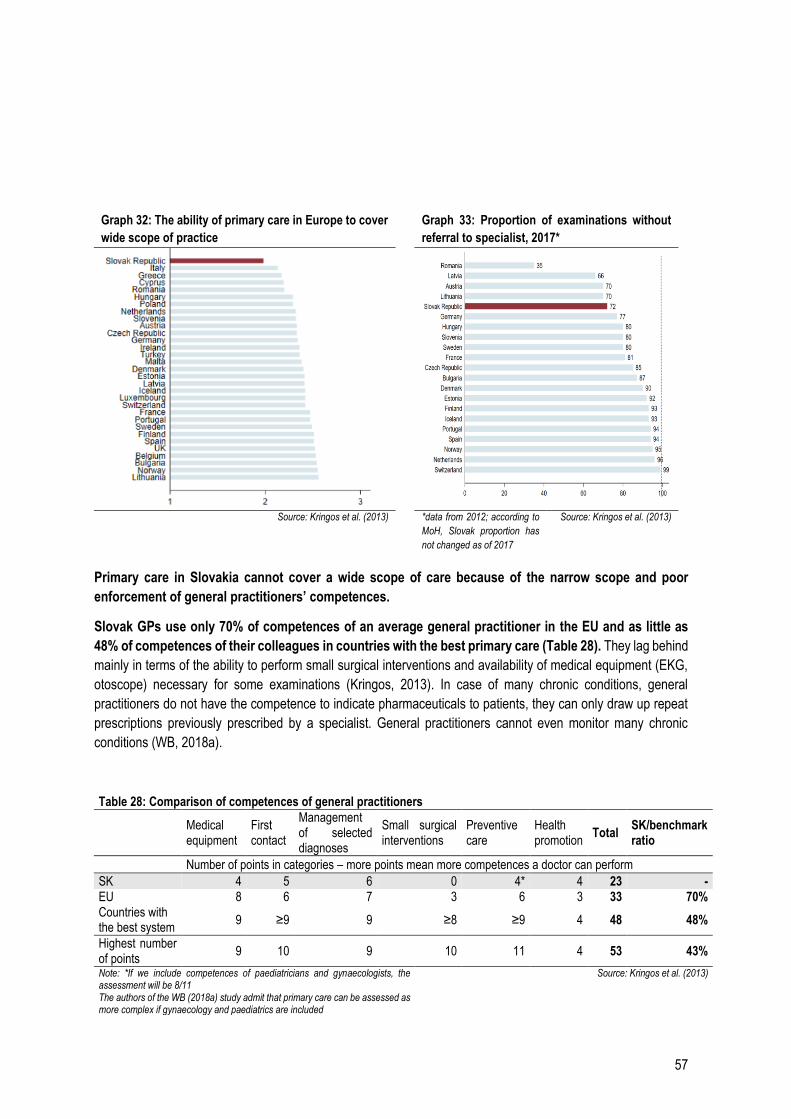
57
Graph 32: The ability of primary care in Europe to cover
wide scope of practice
Graph 33: Proportion of examinations without
referral to specialist, 2017*
Source: Kringos et al. (2013) *data from 2012; according to
MoH, Slovak proportion has
not changed as of 2017
Source: Kringos et al. (2013)
Primary care in Slovakia cannot cover a wide scope of care because of the narrow scope and poor
enforcement of general practitioners’ competences.
Slovak GPs use only 70% of competences of an average general practitioner in the EU and as little as
48% of competences of their colleagues in countries with the best primary care (Table 28). They lag behind
mainly in terms of the ability to perform small surgical interventions and availability of medical equipment (EKG,
otoscope) necessary for some examinations (Kringos, 2013). In case of many chronic conditions, general
practitioners do not have the competence to indicate pharmaceuticals to patients, they can only draw up repeat
prescriptions previously prescribed by a specialist. General practitioners cannot even monitor many chronic
conditions (WB, 2018a).
Table 28: Comparison of competences of general practitioners
Medical equipment
First contact
Management of selected diagnoses
Small surgical interventions
Preventive care
Health promotion
Total SK/benchmark ratio
Number of points in categories – more points mean more competences a doctor can perform
SK 4 5 6 0 4* 4 23 - EU 8 6 7 3 6 3 33 70% Countries with the best system
9 ≥9 9 ≥8 ≥9 4 48 48%
Highest number of points
9 10 9 10 11 4 53 43%
Note: *If we include competences of paediatricians and gynaecologists, the assessment will be 8/11 The authors of the WB (2018a) study admit that primary care can be assessed as more complex if gynaecology and paediatrics are included
Source: Kringos et al. (2013)
58
Box 3: What is considered as primary care in Slovakia
For the sake of this report, the following specialties of physicians are included in primary care:
General practitioner for adults
General practitioner for children and adolescents
First aid medical service – outpatient care for adults
First aid medical service – outpatient care for children and adolescents
In many countries, gynaecologists are considered part of primary care as well. Gynaecologists are
considered part of primary care in Slovakia in some regards; for example, they are paid by capitations,
patients do not need a referral from their GP to visit them and they provide complete gynaecological care
including preventive care.
World Bank recommends transferring part of competences of gynaecologists to general practitioners
to improve access to primary care. In countries with strong primary care, female patients visit mainly their
general practitioner; they visit a gynaecologist only in exceptional cases, for example in case of high-risk
pregnancy (WB, 2018b).
Since there are fewer gynaecologists than general practitioners in Slovakia, gynaecological care is
not available to part of the population as much as general care, particularly to disadvantaged groups
and rural population. According to the Marginalised Groups Spending Review by the Ministry of Finance of
the SR, the distance of healthcare facilities from place of residence is one of the reasons of low healthcare
consumption in disadvantaged Romany groups. In municipalities with the presence of marginalised Romany
communities, the portion of the Romany living 10 and more kilometres from the closest healthcare facility is
almost three times as high as the portion in majority population (Graph 34). The biggest problem concerns
the availability of gynaecologists’ offices – as much as a quarter of women in marginalised Romany
communities have to travel 10 or more kilometres.43
Graph 34: Share of population living in a municipality 10 or more km from the closest doctor’s office (%)
43 This comparison includes the entire Romany population included in Romany Communities Atlas, not only members of MRC.
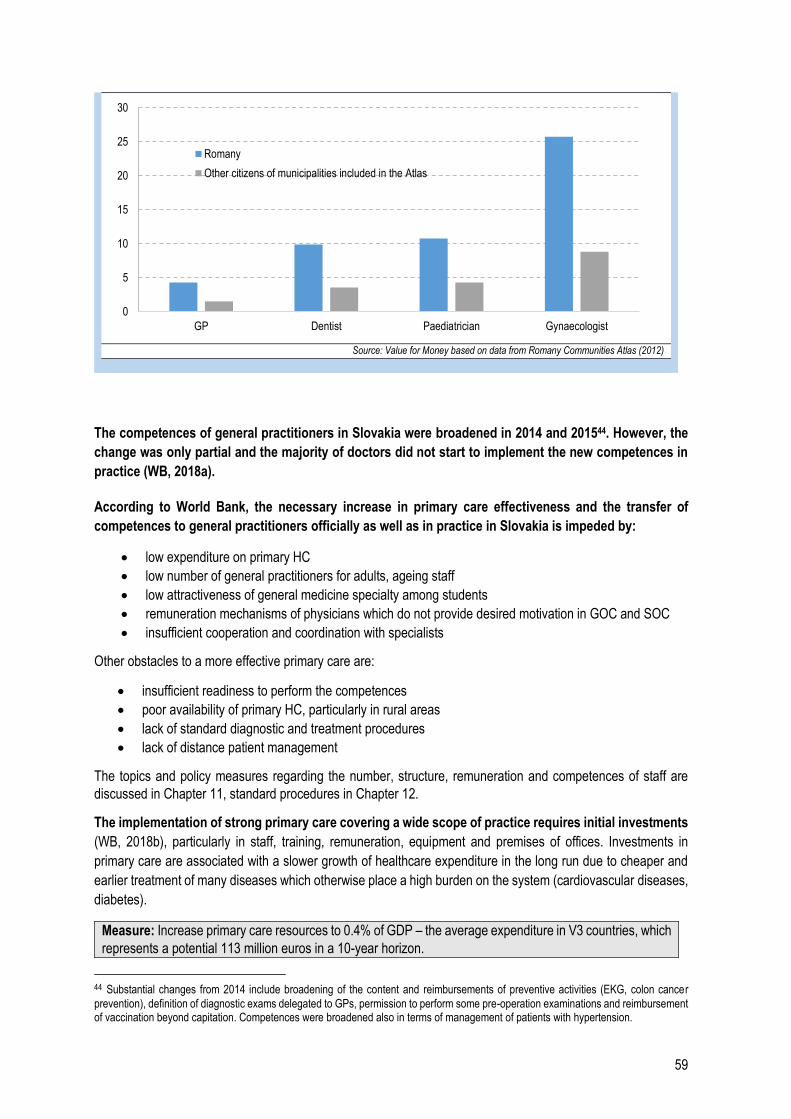
59
Source: Value for Money based on data from Romany Communities Atlas (2012)
The competences of general practitioners in Slovakia were broadened in 2014 and 201544. However, the
change was only partial and the majority of doctors did not start to implement the new competences in
practice (WB, 2018a).
According to World Bank, the necessary increase in primary care effectiveness and the transfer of
competences to general practitioners officially as well as in practice in Slovakia is impeded by:
low expenditure on primary HC
low number of general practitioners for adults, ageing staff
low attractiveness of general medicine specialty among students
remuneration mechanisms of physicians which do not provide desired motivation in GOC and SOC
insufficient cooperation and coordination with specialists
Other obstacles to a more effective primary care are:
insufficient readiness to perform the competences
poor availability of primary HC, particularly in rural areas
lack of standard diagnostic and treatment procedures
lack of distance patient management
The topics and policy measures regarding the number, structure, remuneration and competences of staff are
discussed in Chapter 11, standard procedures in Chapter 12.
The implementation of strong primary care covering a wide scope of practice requires initial investments
(WB, 2018b), particularly in staff, training, remuneration, equipment and premises of offices. Investments in
primary care are associated with a slower growth of healthcare expenditure in the long run due to cheaper and
earlier treatment of many diseases which otherwise place a high burden on the system (cardiovascular diseases,
diabetes).
Measure: Increase primary care resources to 0.4% of GDP – the average expenditure in V3 countries, which
represents a potential 113 million euros in a 10-year horizon.
44 Substantial changes from 2014 include broadening of the content and reimbursements of preventive activities (EKG, colon cancer
prevention), definition of diagnostic exams delegated to GPs, permission to perform some pre-operation examinations and reimbursement of vaccination beyond capitation. Competences were broadened also in terms of management of patients with hypertension.
0
5
10
15
20
25
30
GP Dentist Paediatrician Gynaecologist
Romany
Other citizens of municipalities included in the Atlas
60
One of the ways to free up the space for physicians to perform new competences is to remove redundant
visits.
In countries with strong primary care, patients with some less severe diseases do not even enter the
doctor’s office. One example are viral infections which can be treated mainly by sufficient rest – many patients
in Slovakia spend time in the physician’s room because of a viral infection and the doctor then prescribes them
unnecessary pharmaceuticals, very often antibiotics (more in Chapter 4).
Some countries have established telephone consultations as a form of first contact for such cases. A
nurse or a doctor consults the patient and assesses whether they need to come to the office. Besides filtering
diseases right from the beginning, it is possible to monitor the course of many diseases over the telephone and
thus prevent follow-up visits. This system has been implemented for example in doctor’s offices in England45.
Patients visit doctor’s offices also for purposes not related to healthcare provision, e.g. to get medical
certificates, which takes up even more of doctors’ capacities. Electronic medical certificates provided after
consultation with a doctor over the telephone can further eliminate redundant „administrative” visits.
Educating patients about the symptoms and nature of diseases can help prevent redundant visits, for
example in case of viral infections.
Measure:
Implement the option to consult the doctor over the telephone before a visit to the doctor’s office,
follow-up via telephone.
Reduce the number of “administrative” visits.
Educate patients about the need for prevention and home treatment.
5.4 One-day healthcare
Slovakia dedicates less money in terms of percentage of GDP and share of total healthcare budget to
one-day healthcare compared to neighbouring countries and EU15 members.
Graph 35: One-day healthcare expenditure, % of
GDP, 2017
Graph 36: One-day healthcare expenditure,
proportion of healthcare package, 2017
45http://www.primarycarefoundation.co.uk/images/PrimaryCareFoundation/Downloading_Reports/PCF_Press_Releases/Making-Time-in_General_Practice_FULL_REPORT_28_10_15.pdf
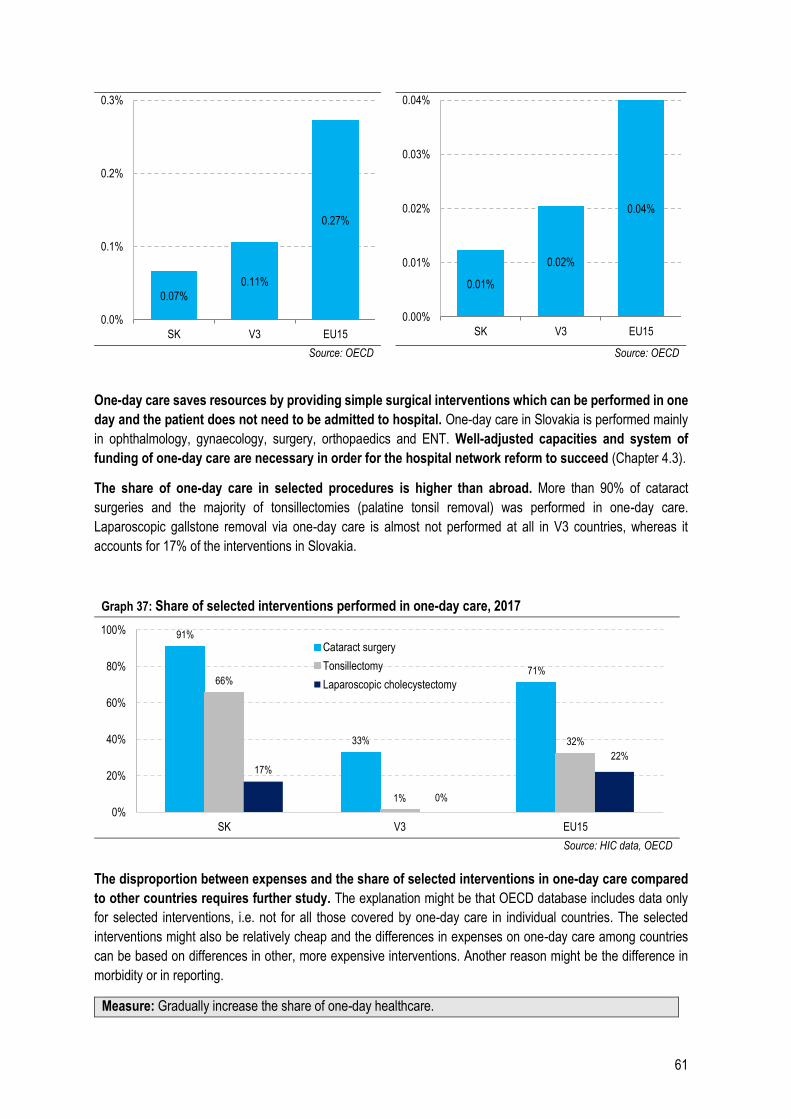
61
Source: OECD Source: OECD
One-day care saves resources by providing simple surgical interventions which can be performed in one
day and the patient does not need to be admitted to hospital. One-day care in Slovakia is performed mainly
in ophthalmology, gynaecology, surgery, orthopaedics and ENT. Well-adjusted capacities and system of
funding of one-day care are necessary in order for the hospital network reform to succeed (Chapter 4.3).
The share of one-day care in selected procedures is higher than abroad. More than 90% of cataract
surgeries and the majority of tonsillectomies (palatine tonsil removal) was performed in one-day care.
Laparoscopic gallstone removal via one-day care is almost not performed at all in V3 countries, whereas it
accounts for 17% of the interventions in Slovakia.
Graph 37: Share of selected interventions performed in one-day care, 2017
Source: HIC data, OECD
The disproportion between expenses and the share of selected interventions in one-day care compared
to other countries requires further study. The explanation might be that OECD database includes data only
for selected interventions, i.e. not for all those covered by one-day care in individual countries. The selected
interventions might also be relatively cheap and the differences in expenses on one-day care among countries
can be based on differences in other, more expensive interventions. Another reason might be the difference in
morbidity or in reporting.
Measure: Gradually increase the share of one-day healthcare.
0.07%
0.11%
0.27%
0.0%
0.1%
0.2%
0.3%
SK V3 EU15
0.01%
0.02%
0.04%
0.00%
0.01%
0.02%
0.03%
0.04%
SK V3 EU15
91%
33%
71%66%
1%
32%
17%
0%
22%
0%
20%
40%
60%
80%
100%
SK V3 EU15
Cataract surgery
Tonsillectomy
Laparoscopic cholecystectomy
62
Additional funding of inpatient and outpatient care
In 2020, resources for inpatient and outpatient care will be increased. University hospitals and teaching hospitals
are unprofitable every year, which reflects in growing debt. The fact that health insurance companies’ revenues
have not been high enough to cover the hospitals’ expenses on staff, pharmaceuticals, blood and medical material
for a long time also contributes to the losses. Even if hospitals had zero expenses on utilities (e.g. electricity,
heating, washing), the majority of them still could not cover the expenses on treatment out of public insurance. In
outpatient care, resources for selected specialties, including general medicine, will be increased in order to
strengthen general outpatient care.
Measure: Implement additional funding of inpatient and outpatient care.
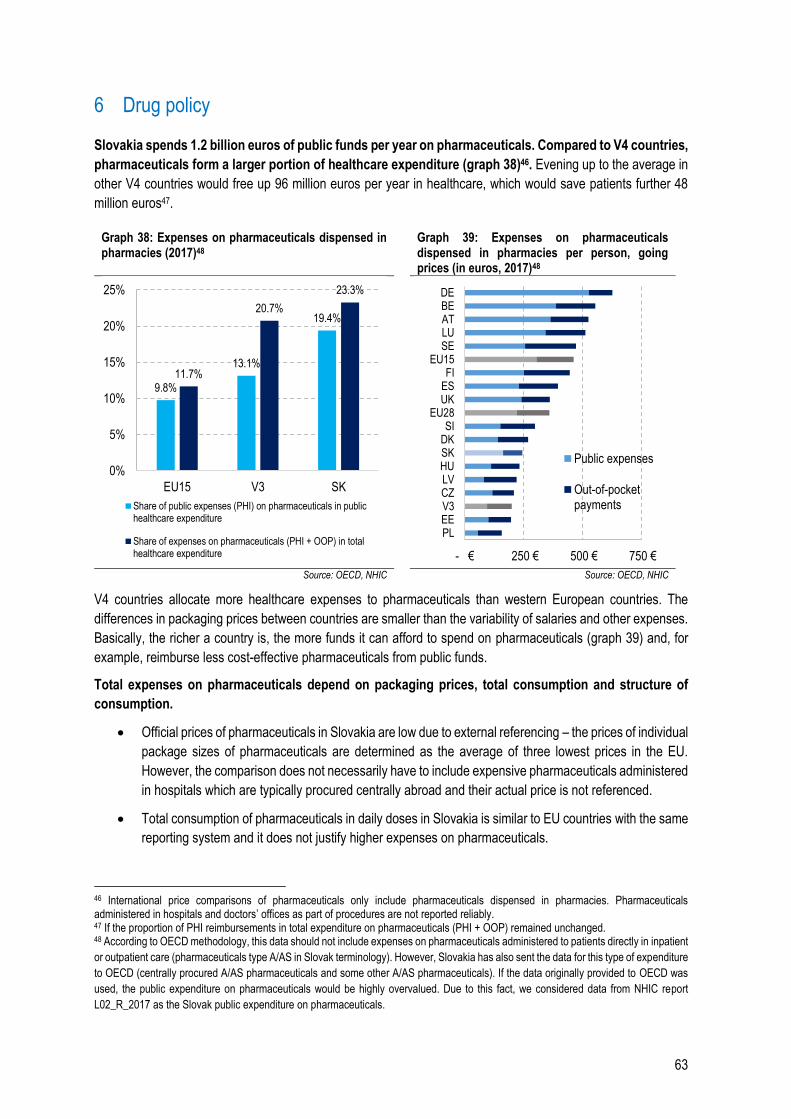
63
6 Drug policy
Slovakia spends 1.2 billion euros of public funds per year on pharmaceuticals. Compared to V4 countries,
pharmaceuticals form a larger portion of healthcare expenditure (graph 38)46. Evening up to the average in
other V4 countries would free up 96 million euros per year in healthcare, which would save patients further 48
million euros47.
Graph 38: Expenses on pharmaceuticals dispensed in pharmacies (2017)48
Graph 39: Expenses on pharmaceuticals dispensed in pharmacies per person, going prices (in euros, 2017)48
Source: OECD, NHIC Source: OECD, NHIC
V4 countries allocate more healthcare expenses to pharmaceuticals than western European countries. The
differences in packaging prices between countries are smaller than the variability of salaries and other expenses.
Basically, the richer a country is, the more funds it can afford to spend on pharmaceuticals (graph 39) and, for
example, reimburse less cost-effective pharmaceuticals from public funds.
Total expenses on pharmaceuticals depend on packaging prices, total consumption and structure of
consumption.
Official prices of pharmaceuticals in Slovakia are low due to external referencing – the prices of individual
package sizes of pharmaceuticals are determined as the average of three lowest prices in the EU.
However, the comparison does not necessarily have to include expensive pharmaceuticals administered
in hospitals which are typically procured centrally abroad and their actual price is not referenced.
Total consumption of pharmaceuticals in daily doses in Slovakia is similar to EU countries with the same
reporting system and it does not justify higher expenses on pharmaceuticals.
46 International price comparisons of pharmaceuticals only include pharmaceuticals dispensed in pharmacies. Pharmaceuticals administered in hospitals and doctors’ offices as part of procedures are not reported reliably. 47 If the proportion of PHI reimbursements in total expenditure on pharmaceuticals (PHI + OOP) remained unchanged. 48 According to OECD methodology, this data should not include expenses on pharmaceuticals administered to patients directly in inpatient
or outpatient care (pharmaceuticals type A/AS in Slovak terminology). However, Slovakia has also sent the data for this type of expenditure
to OECD (centrally procured A/AS pharmaceuticals and some other A/AS pharmaceuticals). If the data originally provided to OECD was
used, the public expenditure on pharmaceuticals would be highly overvalued. Due to this fact, we considered data from NHIC report
L02_R_2017 as the Slovak public expenditure on pharmaceuticals.
9.8%
13.1%
19.4%
11.7%
20.7%
23.3%
0%
5%
10%
15%
20%
25%
EU15 V3 SK
Share of public expenses (PHI) on pharmaceuticals in publichealthcare expenditure
Share of expenses on pharmaceuticals (PHI + OOP) in totalhealthcare expenditure - € 250 € 500 € 750 €
PLEEV3CZLVHUSKDKSI
EU28UKESFI
EU15SELUATBEDE
Public expenses
Out-of-pocketpayments
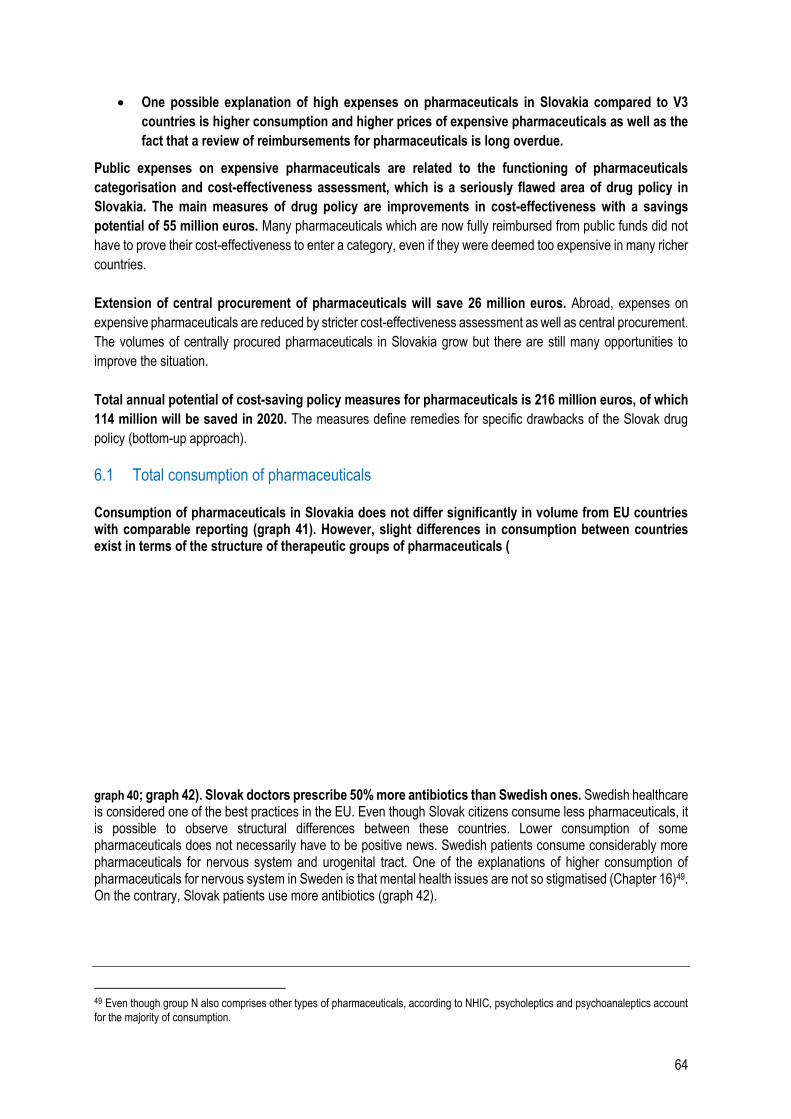
64
One possible explanation of high expenses on pharmaceuticals in Slovakia compared to V3
countries is higher consumption and higher prices of expensive pharmaceuticals as well as the
fact that a review of reimbursements for pharmaceuticals is long overdue.
Public expenses on expensive pharmaceuticals are related to the functioning of pharmaceuticals
categorisation and cost-effectiveness assessment, which is a seriously flawed area of drug policy in
Slovakia. The main measures of drug policy are improvements in cost-effectiveness with a savings
potential of 55 million euros. Many pharmaceuticals which are now fully reimbursed from public funds did not
have to prove their cost-effectiveness to enter a category, even if they were deemed too expensive in many richer
countries.
Extension of central procurement of pharmaceuticals will save 26 million euros. Abroad, expenses on
expensive pharmaceuticals are reduced by stricter cost-effectiveness assessment as well as central procurement.
The volumes of centrally procured pharmaceuticals in Slovakia grow but there are still many opportunities to
improve the situation.
Total annual potential of cost-saving policy measures for pharmaceuticals is 216 million euros, of which
114 million will be saved in 2020. The measures define remedies for specific drawbacks of the Slovak drug
policy (bottom-up approach).
6.1 Total consumption of pharmaceuticals
Consumption of pharmaceuticals in Slovakia does not differ significantly in volume from EU countries with comparable reporting (graph 41). However, slight differences in consumption between countries exist in terms of the structure of therapeutic groups of pharmaceuticals (
graph 40; graph 42). Slovak doctors prescribe 50% more antibiotics than Swedish ones. Swedish healthcare is considered one of the best practices in the EU. Even though Slovak citizens consume less pharmaceuticals, it is possible to observe structural differences between these countries. Lower consumption of some pharmaceuticals does not necessarily have to be positive news. Swedish patients consume considerably more pharmaceuticals for nervous system and urogenital tract. One of the explanations of higher consumption of pharmaceuticals for nervous system in Sweden is that mental health issues are not so stigmatised (Chapter 16)49. On the contrary, Slovak patients use more antibiotics (graph 42).
49 Even though group N also comprises other types of pharmaceuticals, according to NHIC, psycholeptics and psychoanaleptics account
for the majority of consumption.
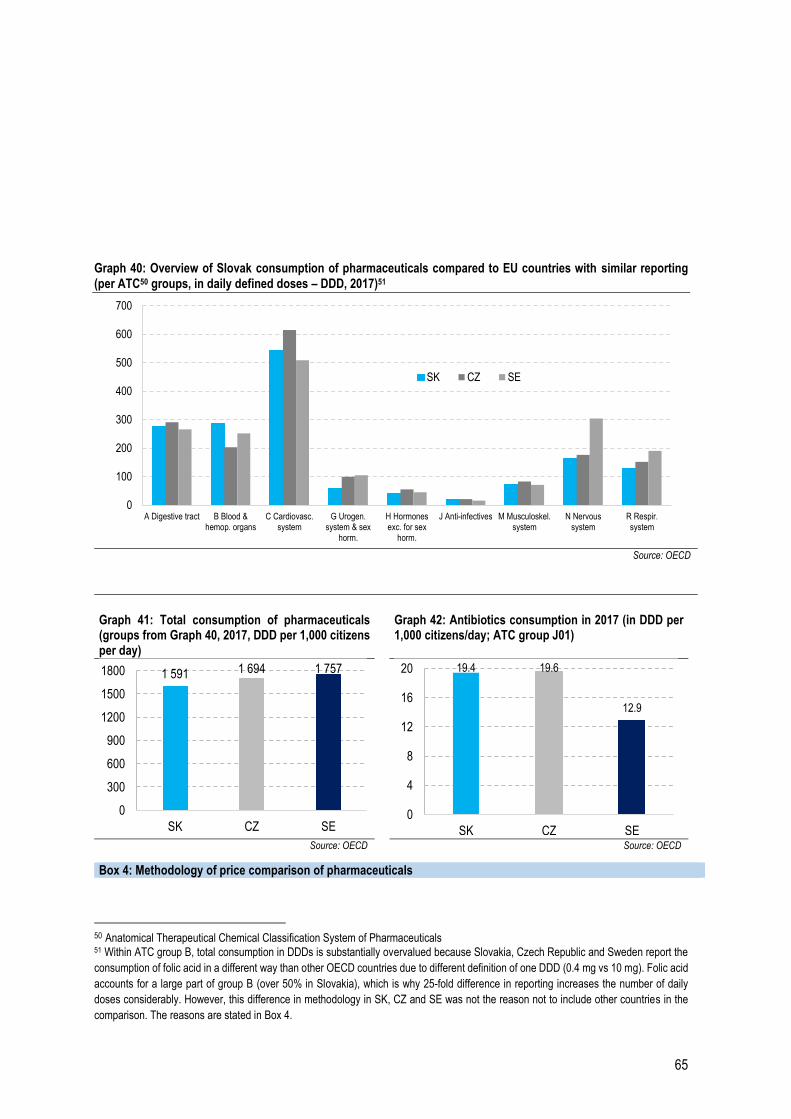
65
Graph 40: Overview of Slovak consumption of pharmaceuticals compared to EU countries with similar reporting (per ATC50 groups, in daily defined doses – DDD, 2017)51
Source: OECD
Graph 41: Total consumption of pharmaceuticals (groups from Graph 40, 2017, DDD per 1,000 citizens per day)
Graph 42: Antibiotics consumption in 2017 (in DDD per 1,000 citizens/day; ATC group J01)
Source: OECD Source: OECD
50 Anatomical Therapeutical Chemical Classification System of Pharmaceuticals 51 Within ATC group B, total consumption in DDDs is substantially overvalued because Slovakia, Czech Republic and Sweden report the
consumption of folic acid in a different way than other OECD countries due to different definition of one DDD (0.4 mg vs 10 mg). Folic acid
accounts for a large part of group B (over 50% in Slovakia), which is why 25-fold difference in reporting increases the number of daily
doses considerably. However, this difference in methodology in SK, CZ and SE was not the reason not to include other countries in the
comparison. The reasons are stated in Box 4.
0
100
200
300
400
500
600
700
A Digestive tract B Blood &hemop. organs
C Cardiovasc.system
G Urogen.system & sex
horm.
H Hormonesexc. for sex
horm.
J Anti-infectives M Musculoskel.system
N Nervoussystem
R Respir.system
SK CZ SE
1 591 1 694 1 757
0
300
600
900
1200
1500
1800
SK CZ SE
19.4 19.6
12.9
0
4
8
12
16
20
SK CZ SE
Box 4: Methodology of price comparison of pharmaceuticals
66
6.1.1 Overconsumption of antibiotics
Slovak antibiotics consumption is comparable to Czech Republic but considerably higher than the
consumption in Sweden which is one of the leaders in this area (graph 42)52,53,54.
Prescription of antibiotics when they are not necessary is connected to medical risks and needless
financial expenses. In 2018, patients were prescribed 5.1 million packages of antibiotics, while PHI expenses
on antibiotics represented 20 million euros and out-of-pocket payments 12 million euros55.
High consumption of antibiotics causes the bacteria to become resistant to treatment. Overconsumption
of antibiotics puts the entire population at risk, not only the patient who overuses them. There is a risk
that diseases which have been considered easily treatable for dozens of years will become severe again.56 Some
predictions warn that antimicrobial resistance can be a more frequent cause of death than cancer in 2050.57
Resistant bacteria spread in the free environment where other individuals can be infected. High resistance of
bacteria can endanger also the safety of surgeries and other medical interventions.
Antibiotics are most often prescribed by general practitioners for adults and children who prescribed
73% of packages in 2017. Individual doctors differ greatly in the quantities of prescribed antibiotics. Very
important deviations should be reviewed by health insurance companies for medical and financial
reasons. Even if the average proportion of prescribed antibiotics out of all prescriptions by general practitioners
for children and adolescents was 32%, there were some doctors among them who prescribed more than 60% of
antibiotics out of all their prescriptions. Relevance of results was ensured by only including doctors who drew up
prescriptions for at least 500 different patients in the analysed year.
CRP examinations are not normally reimbursed to general practitioners for adults by all health insurance
companies despite their possible benefits to reduce the volume of redundant antibiotics. CRP examination
consists of drawing a drop of blood from a finger and can immediately tell whether a disease is bacterial or viral
and if an antibiotic should be prescribed. All health insurance companies reimburse CRP examination for children,
amounting to approximately 4 euros. It is also necessary to strengthen the role of clinical pharmacologists in
inpatient care.
52 Comparison of year-on-year consumption is difficult because there have been changes in methodology of calculation of individual packaging consumption according to the latest WHO ATC definition of DDD. Slovakia does not retrospectively recalculate the consumption for previous years according to the latest methodology. 53 Sweden has one of the lowest consumptions of antibiotics in the EU, which follows from the analysis: European Centre for Disease Prevention and Control. Antimicrobial consumption.(2018) In: ECDC. Annual epidemiological report for 2017. Stockholm: ECDC 54 MÖLSTAD, Sigvard, et al. Lessons learnt during 20 years of the Swedish strategic programme against antibiotic resistance. Bulletin of the World Health Organization, 2017, 95.11: 764. 55 Source: NHIC reports for 2018 L02_R and L02_LA_R 56 European Commission. (2017). A European One Health Action Plan Against Antimicrobial Resistance (AMR). European Commission. 57 Review on Antimicrobial Resistance. (2016). Tackling drug-resistant infections globally: final report and recommendations. Review on Antimicrobial Resistance.
Within the international comparison, the volumes of consumed pharmaceuticals are recalculated from packages to
daily doses defined by the World Health Organisation. Data for Slovakia have been provided by NHIC since 2016.
The manner of data reporting differs significantly across countries; for example, some states publish data without
information from hospitals, eventually without over-the-counter pharmaceuticals. Another obstacle is that some
countries report the volumes of pharmaceuticals delivered to pharmacies and not the consumption.
In the interim report of the healthcare spending review II, comparable EU countries were Czech Republic, Denmark,
Estonia, Sweden and Italy. After more detailed analysis of data collection methodology regarding included
pharmaceuticals, only Czech Republic and Sweden were deemed comparable in terms of reporting.
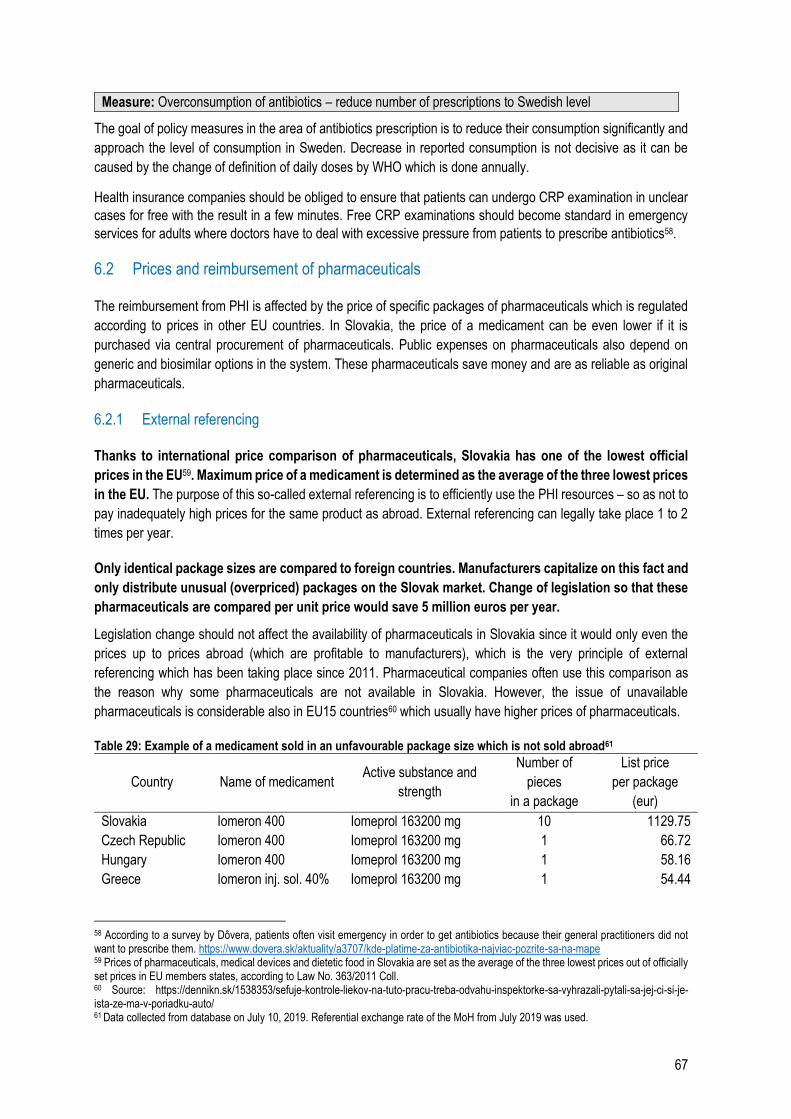
67
Measure: Overconsumption of antibiotics – reduce number of prescriptions to Swedish level
The goal of policy measures in the area of antibiotics prescription is to reduce their consumption significantly and
approach the level of consumption in Sweden. Decrease in reported consumption is not decisive as it can be
caused by the change of definition of daily doses by WHO which is done annually.
Health insurance companies should be obliged to ensure that patients can undergo CRP examination in unclear
cases for free with the result in a few minutes. Free CRP examinations should become standard in emergency
services for adults where doctors have to deal with excessive pressure from patients to prescribe antibiotics58.
6.2 Prices and reimbursement of pharmaceuticals
The reimbursement from PHI is affected by the price of specific packages of pharmaceuticals which is regulated
according to prices in other EU countries. In Slovakia, the price of a medicament can be even lower if it is
purchased via central procurement of pharmaceuticals. Public expenses on pharmaceuticals also depend on
generic and biosimilar options in the system. These pharmaceuticals save money and are as reliable as original
pharmaceuticals.
6.2.1 External referencing
Thanks to international price comparison of pharmaceuticals, Slovakia has one of the lowest official
prices in the EU59. Maximum price of a medicament is determined as the average of the three lowest prices
in the EU. The purpose of this so-called external referencing is to efficiently use the PHI resources – so as not to
pay inadequately high prices for the same product as abroad. External referencing can legally take place 1 to 2
times per year.
Only identical package sizes are compared to foreign countries. Manufacturers capitalize on this fact and
only distribute unusual (overpriced) packages on the Slovak market. Change of legislation so that these
pharmaceuticals are compared per unit price would save 5 million euros per year.
Legislation change should not affect the availability of pharmaceuticals in Slovakia since it would only even the
prices up to prices abroad (which are profitable to manufacturers), which is the very principle of external
referencing which has been taking place since 2011. Pharmaceutical companies often use this comparison as
the reason why some pharmaceuticals are not available in Slovakia. However, the issue of unavailable
pharmaceuticals is considerable also in EU15 countries60 which usually have higher prices of pharmaceuticals.
Table 29: Example of a medicament sold in an unfavourable package size which is not sold abroad61
Country Name of medicament Active substance and
strength
Number of
pieces
in a package
List price
per package
(eur)
Slovakia Iomeron 400 Iomeprol 163200 mg 10 1129.75
Czech Republic Iomeron 400 Iomeprol 163200 mg 1 66.72
Hungary Iomeron 400 Iomeprol 163200 mg 1 58.16
Greece Iomeron inj. sol. 40% Iomeprol 163200 mg 1 54.44
58 According to a survey by Dôvera, patients often visit emergency in order to get antibiotics because their general practitioners did not want to prescribe them. https://www.dovera.sk/aktuality/a3707/kde-platime-za-antibiotika-najviac-pozrite-sa-na-mape 59 Prices of pharmaceuticals, medical devices and dietetic food in Slovakia are set as the average of the three lowest prices out of officially set prices in EU members states, according to Law No. 363/2011 Coll. 60 Source: https://dennikn.sk/1538353/sefuje-kontrole-liekov-na-tuto-pracu-treba-odvahu-inspektorke-sa-vyhrazali-pytali-sa-jej-ci-si-je-ista-ze-ma-v-poriadku-auto/ 61 Data collected from database on July 10, 2019. Referential exchange rate of the MoH from July 2019 was used.
68
Source: International medicine price database EURIPID
Since the price of medicament directly influences the reimbursement from PHI, unit price comparison in
case of the medicament Iomeron 400 would save 1 million euros annually.62 Three cheapest 1-piece
packages in the EU are stated in the Table 29. The so-called list price is compared to foreign countries. It does
not include tax nor surcharges of the distributor and pharmacy which makes the prices well comparable across
countries. In case of the selected medicament, a 10-piece package is only distributed in Slovakia; a 1-piece
package is sold in the other 8 EU countries where it is available. If price in Slovakia was compared to foreign
countries per unit, Iomeron 400 could cost less than 600 euros at maximum. According to NHIC data, 1,792
packages of this medicament were used in Slovakia in 2018.63
Measure: Use external referencing per unit of packaging (potential 4.8 million euros).
The new system of external referencing also envisages comparisons of different package sizes if Slovak
packaging is not available in at least three other EU countries. This policy measure will prevent speculations
with the strongest influence on PHI. Legislation change of Law No. 363/2011 Coll. prepared by the Ministry of
Health is currently in the legislative process and should come into effect on January 1, 2020.
Measure: Perform price comparison of pharmaceuticals according to valid legislation as much as twice per
year.
The current legislation allows to compare the prices of pharmaceuticals which were introduced into the system in
the last 3 years with prices abroad twice a year. This option has not been used so far. For example, in case of
medicament Amgevita, further comparison from October 1, 2019 would save 2.1 million euros in the payment
group. However, second comparison is an option for other pharmaceuticals as well.
6.2.2 Central procurement of pharmaceuticals
Central procurement (CP) of pharmaceuticals by health insurance companies or the Ministry of Health
can achieve more favourable prices. It is often possible to use several active substances to treat one diagnosis.
If a health insurance company purchases a medicament centrally, patients are usually treated by this medicament.
Manufacturers are willing to compete because even if they offer a lower price than the official one, it does not
influence external referencing abroad (i.e. they will not have to lower the price abroad). Lower sale price of
pharmaceuticals can be compensated to the manufacturer by significantly higher sales.
The volume of centrally procured pharmaceuticals in Slovakia is low, it only represents 13% of the total
value of all prescription pharmaceuticals, 12% in case of VšZP. However, compared to previous years,
there has been a significant improvement and in the period from 2016 to 2018, VšZP increased the volume
of CP pharmaceuticals by one quarter. From the point of view of administering pharmaceuticals to patients, it
is easiest to purchase pharmaceuticals which are administered in inpatient care or need to be administered by a
healthcare professional (type A/AS). Centrally procured pharmaceuticals only represented 32% of these types of
pharmaceuticals in 2018. In Denmark, it is almost 100%.
The current central procurement system in Slovakia does not motivate manufacturers to lower their
prices because sales volumes are not guaranteed. Even if a manufacturer wins a VšZP tender to provide
pharmaceuticals and beats the competition with their price, it does not necessarily have to become the most used
medicament in the respective category.64 The legislation allows a competitive medicament to even up the winning
62 In reimbursement group, after recalculating list prices to final prices, according to categorisation from October 1, 2019. 63 The medicament is used as a contrast agent in diagnostics. 64 Source: Internal document of the Institute of Health Policies: Alternative solutions to guarantee contractual volumes in procurement of biosimilars and generic pharmaceuticals
69
price.65 In this case, the competition does not have to lower their official price of a medicament and still keeps the
sales volume. The pharmaceuticals which did not win are still used in hospitals. Even if the current system seems
favourable to public finance (savings due to lower price) and the patient (they do not get a different medicament,
even though with identical characteristics), it is not suitable in the long term because of decreased motivation of
manufacturers to come to Slovakia and offer a more competitive price.
Measure: Increase the volume of centrally procured pharmaceuticals to at least 25% of total expenditure on
pharmaceuticals66 (potential 26 million euros).
Volume increase of central procurement from the current 13% (in almost all health insurance companies)
to 25% would save 26 million euros from the PHI. This 25% share represents a situation where all prescription
pharmaceuticals administered in hospitals and doctors’ offices (type of reimbursement “A” and “AS”) are procured
centrally. The example of Denmark shows that this goal is attainable.
Measure: Improve competitive environment in central procurement
The MoH SR has issued a methodical guideline (in effect from November 1, 2019) which guarantees minimal
volumes of winning pharmaceuticals. This modification should increase the motivation of generics and biosimilars
manufacturers to come to the Slovak market and thus indirectly increase the competition in central procurement
of pharmaceuticals. Another measure of the MoH currently in preparation is the obligation of healthcare providers
to use pharmaceuticals which have won a CP tender.
6.2.3 Generics and biosimilars
Generics and biosimilars help save considerable amounts of public funds. In 2019, introduction of these
pharmaceuticals into the system saved at least 35 million euros per year, of which the majority will be
reflected in this year’s expenses.
67 Information taken from the website of Amgros institution – amgros.dk 68 Manner of how the medicament is released into the body
Box 5: Procurement of hospital pharmaceuticals in Denmark67
Denmark uses the public institution Amgros to procure almost all pharmaceuticals used in hospitals. This
authority represents individual Danish regions and closely cooperates with manufacturers to provide trainings
and necessary support with administration. Thanks to central procurement, Denmark achieves an average
discount from the official medicament price amounting to 37% in case of hospital pharmaceuticals. Since
Slovakia has lower official prices of pharmaceuticals than Denmark, slightly lower average savings can be
expected.
In central procurement in Denmark, Amgros determines the requirements for distributors, such as delivery times
and expiration date. Representatives of manufacturers then offer quotes online and the winner concludes a
contract to distribute pharmaceuticals to hospitals, typically for 12 months. Hospitals send the requirements for
necessary batches of a medicament directly to the winner, the process is automated. Amgros deals with
eventual failures to deliver pharmaceuticals by ensuring a replacement alternative; in case of problematic
pharmaceuticals, they store pharmaceuticals in their own premises.
Box 6: Generics and biosimilars
Generics are as effective and safe as original pharmaceuticals, but they are cheaper. After a patent
expires, other manufacturers can create an exact copy of the original medicament with the same characteristics,
a so-called generic. Generics manufacturers can set the sale price much lower since they did not have such
high expenses on R&D. However, they have to prove bioequivalence68 with the original medicament. They can
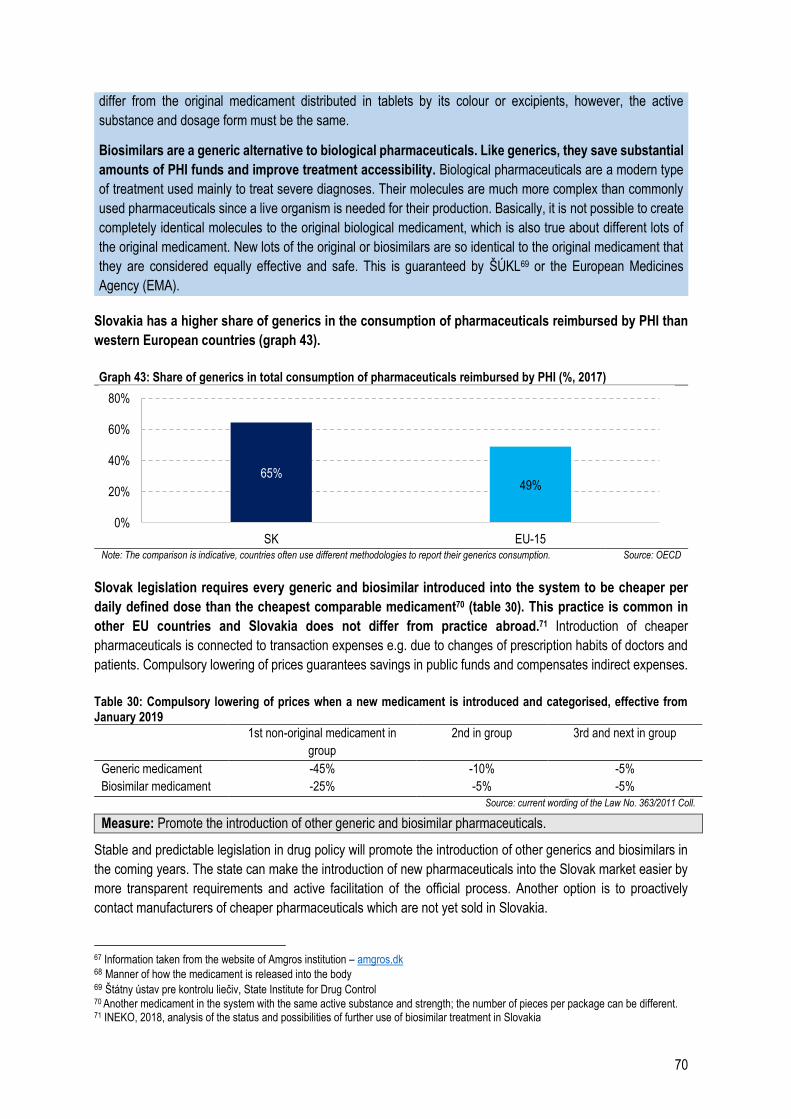
70
Slovakia has a higher share of generics in the consumption of pharmaceuticals reimbursed by PHI than
western European countries (graph 43).
Graph 43: Share of generics in total consumption of pharmaceuticals reimbursed by PHI (%, 2017)
Note: The comparison is indicative, countries often use different methodologies to report their generics consumption. Source: OECD
Slovak legislation requires every generic and biosimilar introduced into the system to be cheaper per
daily defined dose than the cheapest comparable medicament70 (table 30). This practice is common in
other EU countries and Slovakia does not differ from practice abroad.71 Introduction of cheaper
pharmaceuticals is connected to transaction expenses e.g. due to changes of prescription habits of doctors and
patients. Compulsory lowering of prices guarantees savings in public funds and compensates indirect expenses.
Table 30: Compulsory lowering of prices when a new medicament is introduced and categorised, effective from January 2019
1st non-original medicament in
group
2nd in group 3rd and next in group
Generic medicament -45% -10% -5%
Biosimilar medicament -25% -5% -5%
Source: current wording of the Law No. 363/2011 Coll.
Measure: Promote the introduction of other generic and biosimilar pharmaceuticals.
Stable and predictable legislation in drug policy will promote the introduction of other generics and biosimilars in
the coming years. The state can make the introduction of new pharmaceuticals into the Slovak market easier by
more transparent requirements and active facilitation of the official process. Another option is to proactively
contact manufacturers of cheaper pharmaceuticals which are not yet sold in Slovakia.
67 Information taken from the website of Amgros institution – amgros.dk 68 Manner of how the medicament is released into the body 69 Štátny ústav pre kontrolu liečiv, State Institute for Drug Control 70 Another medicament in the system with the same active substance and strength; the number of pieces per package can be different. 71 INEKO, 2018, analysis of the status and possibilities of further use of biosimilar treatment in Slovakia
65%49%
0%
20%
40%
60%
80%
SK EU-15
differ from the original medicament distributed in tablets by its colour or excipients, however, the active
substance and dosage form must be the same.
Biosimilars are a generic alternative to biological pharmaceuticals. Like generics, they save substantial
amounts of PHI funds and improve treatment accessibility. Biological pharmaceuticals are a modern type
of treatment used mainly to treat severe diagnoses. Their molecules are much more complex than commonly
used pharmaceuticals since a live organism is needed for their production. Basically, it is not possible to create
completely identical molecules to the original biological medicament, which is also true about different lots of
the original medicament. New lots of the original or biosimilars are so identical to the original medicament that
they are considered equally effective and safe. This is guaranteed by ŠÚKL69 or the European Medicines
Agency (EMA).
71
6.2.4 Quarterly review of reimbursements
Review of reimbursements from PHI and thus of out-of-pocket payments for reimbursed pharmaceuticals
takes place every three months. This re-evaluation (so-called review of reimbursements) concerns categorised
pharmaceuticals. The list of categorised pharmaceuticals (LCP)72 regulates pharmaceuticals which are
completely or partially reimbursed from PHI in Slovakia.
Categorised pharmaceuticals are organised in groups and reimbursed from public funds only up to the
price of the cheapest medicament in the group. If a patient decides to buy a more expensive medicament,
they have to pay the difference. This is how the state motivates patients to use cheaper pharmaceuticals of the
same quality and saves public funds. Each group of pharmaceuticals should consist of medically interchangeable
pharmaceuticals so that the patient can choose the medicament with the lowest out-of-pocket payment in the
group.
If the price of the cheapest medicament in the group is decreased, the next review will adjust the amount
reimbursed from PHI and save money. The price of the cheapest medicament is most significantly changed
when the first generic medicament is introduced into the group (more about generic pharmaceuticals in Chapter
6.2.3). The law obliges manufacturers to set the price to 55% (75% in case of biosimilars) of the price of the
original medicament (Table 30). External referencing also decreases the price of the cheapest pharmaceuticals
in many groups. Price modification can be caused also by competition among different manufacturers of cheaper
pharmaceuticals or with the manufacturer of the original medicament.
In the review of reimbursements from April 1, 2019, savings were delayed by 3 months after the
introduction of generics and biosimilars (box 7). PHI lost 1.8 million euros without added benefit in case
of just one active substance, lenalidomide. More losses continue.
Measure: Correct delayed reductions of reimbursements after the introduction of generics and biosimilars
(potential 3 million euros).
72 The list is updated monthly and published at the MoH website, more substantial changes are done quarterly. Reimbursements from PHI
are mostly modified by the introduction of generics and biosimilars, external referencing or re-evaluation of payment groups. The current LCP contains approximately 4,400 pharmaceuticals.
Box 7: Change of practice after introduction of generics/biosimilars
In practice, reimbursements in groups have been re-evaluated according to prices of cheaper pharmaceuticals,
even if they were introduced into LCP only from the date of the review. If a generic/biosimilar was introduced
into the list of categorised pharmaceuticals on April 1, 2019, PHI reimbursement for original pharmaceuticals
would be lowered according to the price of newly introduced pharmaceuticals as standard practice. This would
save PHI funds.
However, there has not been any modification of reimbursements in these cases in April. The modification was
performed only when the next review was carried out (on July 1, 2019). It means that more expensive
pharmaceuticals were fully reimbursed from public funds for 3 months longer. This change of practice continues,
for example, when the medicament Benepali 50 mg was introduced, the reduction of reimbursement in the
group was delayed from July to October, which cost PHI at least 0.5 million euros.
72
6.2.5 Change of structure of payment groups since July 2019
Since July 1, 2019, an extensive change of the structure of some groups of pharmaceuticals in LCP has
been introduced. It has changed the reimbursements and out-of-pocket payments for a large part of
pharmaceuticals. However, the change was performed in a questionable manner.
Since reimbursements are set according to the price of the cheapest medicament in the group73, the
amounts of reimbursements and out-of-pocket payments are substantially influenced by how the
pharmaceuticals are regrouped.
The decision process about payment groups was not transparent (lack of justification for the structure
of groups of pharmaceuticals) and changes created new problems in the system (box 8, more detailed in
Annexe 5). There have been more changes since October 1, 2019, and substantial modifications in payment
groups are planned from January 1, 2020. However, according to the current proposal, the main drawbacks will
not be removed.
Pharmaceuticals with different strengths have been compared at a larger scale since July, however, there is a
difference if the patient uses 10 mg or 25 mg pills. Sometimes the patient cannot avoid a higher OOP.
Comparisons within new groups in order to determine the payment are based on daily defined doses (DDD) which
are taken primarily from the WHO database. However, World Health Organisation does not recommend using
DDD to determine the amount to be paid.74
Measure: Change payment groups from January 1, 2020.
From the beginning of the next year, re-evaluation of payments for a large part of pharmaceuticals will take place
as a result of the latest changes in payment groups. 7.9 million euros will be saved annually on public health
73 Setting the reimbursements based on the cheapest medicament per default dose in a group is a correct practice, however, it is important
to only have interchangeable pharmaceuticals in one group. 74 Source: https://www.whocc.no/use_of_atc_ddd/
Box 8: Drawbacks of payment groups (change from July 1, 2019)
Types of issues with the change of payment groups:
Pharmaceuticals which are not interchangeable and have different strengths were included in
one group in order to determine the reimbursement, out-of-pocket payment for a medicament
with a more expensive strength increased and the patient has had no medically correct way to
avoid this increase. Even though the change has a positive financial impact on the PHI, it is the
patient who pays for it.
Higher prices of pharmaceuticals with a cheaper and fully interchangeable alternative are also
reimbursed from public resources. This situation can be much worse for the PHI than if the
group was not created at all (the problem is explained in Annexe 5 on the example of group U106
with annual negative impact on PHI amounting to 340 thousand euros with no added benefit for the
patient).
The situation is best visible if there are non-interchangeable pharmaceuticals with different strengths
in one payment group, but the payment is not determined according to the lowest price per DDD but
according to the second or third lowest. If there are generics in the group, it gives more expensive
manufacturers an unfair advantage against competition.
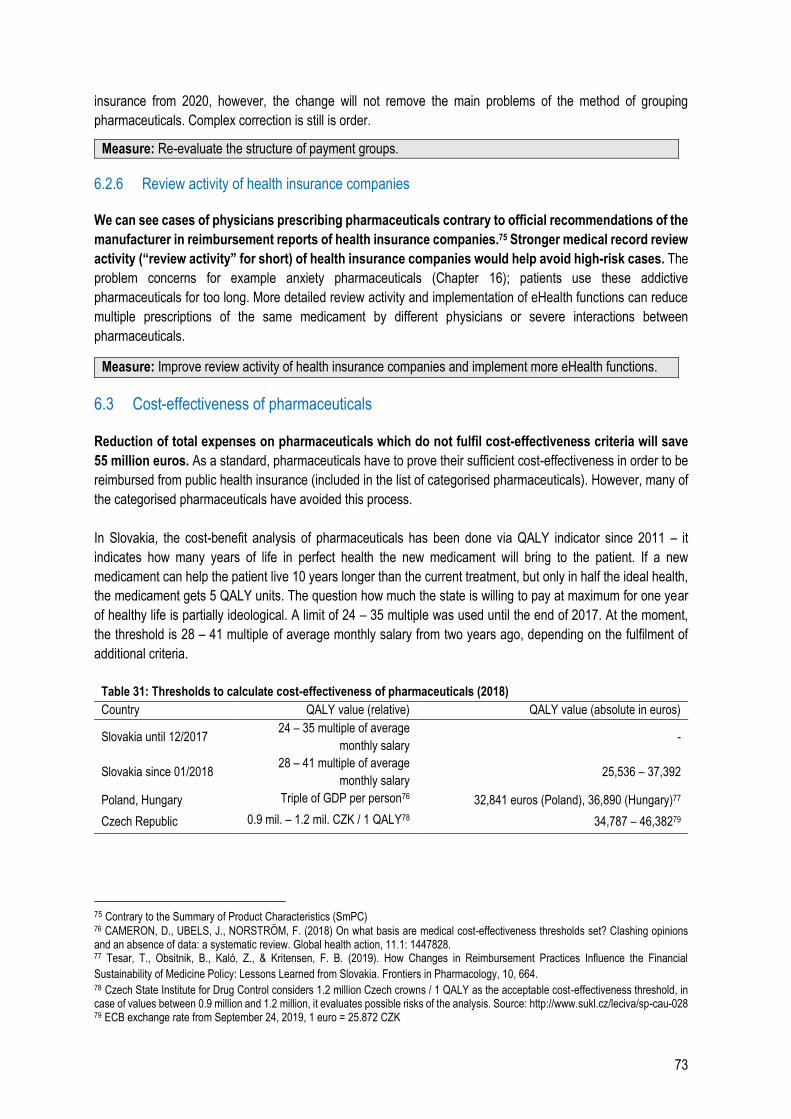
73
insurance from 2020, however, the change will not remove the main problems of the method of grouping
pharmaceuticals. Complex correction is still is order.
Measure: Re-evaluate the structure of payment groups.
6.2.6 Review activity of health insurance companies
We can see cases of physicians prescribing pharmaceuticals contrary to official recommendations of the
manufacturer in reimbursement reports of health insurance companies.75 Stronger medical record review
activity (“review activity” for short) of health insurance companies would help avoid high-risk cases. The
problem concerns for example anxiety pharmaceuticals (Chapter 16); patients use these addictive
pharmaceuticals for too long. More detailed review activity and implementation of eHealth functions can reduce
multiple prescriptions of the same medicament by different physicians or severe interactions between
pharmaceuticals.
Measure: Improve review activity of health insurance companies and implement more eHealth functions.
6.3 Cost-effectiveness of pharmaceuticals
Reduction of total expenses on pharmaceuticals which do not fulfil cost-effectiveness criteria will save
55 million euros. As a standard, pharmaceuticals have to prove their sufficient cost-effectiveness in order to be
reimbursed from public health insurance (included in the list of categorised pharmaceuticals). However, many of
the categorised pharmaceuticals have avoided this process.
In Slovakia, the cost-benefit analysis of pharmaceuticals has been done via QALY indicator since 2011 – it
indicates how many years of life in perfect health the new medicament will bring to the patient. If a new
medicament can help the patient live 10 years longer than the current treatment, but only in half the ideal health,
the medicament gets 5 QALY units. The question how much the state is willing to pay at maximum for one year
of healthy life is partially ideological. A limit of 24 – 35 multiple was used until the end of 2017. At the moment,
the threshold is 28 – 41 multiple of average monthly salary from two years ago, depending on the fulfilment of
additional criteria.
Table 31: Thresholds to calculate cost-effectiveness of pharmaceuticals (2018)
Country QALY value (relative) QALY value (absolute in euros)
Slovakia until 12/2017 24 – 35 multiple of average
monthly salary -
Slovakia since 01/2018 28 – 41 multiple of average
monthly salary 25,536 – 37,392
Poland, Hungary Triple of GDP per person76 32,841 euros (Poland), 36,890 (Hungary)77
Czech Republic 0.9 mil. – 1.2 mil. CZK / 1 QALY78 34,787 – 46,38279
75 Contrary to the Summary of Product Characteristics (SmPC) 76 CAMERON, D., UBELS, J., NORSTRÖM, F. (2018) On what basis are medical cost-effectiveness thresholds set? Clashing opinions and an absence of data: a systematic review. Global health action, 11.1: 1447828. 77 Tesar, T., Obsitnik, B., Kaló, Z., & Kritensen, F. B. (2019). How Changes in Reimbursement Practices Influence the Financial
Sustainability of Medicine Policy: Lessons Learned from Slovakia. Frontiers in Pharmacology, 10, 664. 78 Czech State Institute for Drug Control considers 1.2 million Czech crowns / 1 QALY as the acceptable cost-effectiveness threshold, in case of values between 0.9 million and 1.2 million, it evaluates possible risks of the analysis. Source: http://www.sukl.cz/leciva/sp-cau-028 79 ECB exchange rate from September 24, 2019, 1 euro = 25.872 CZK
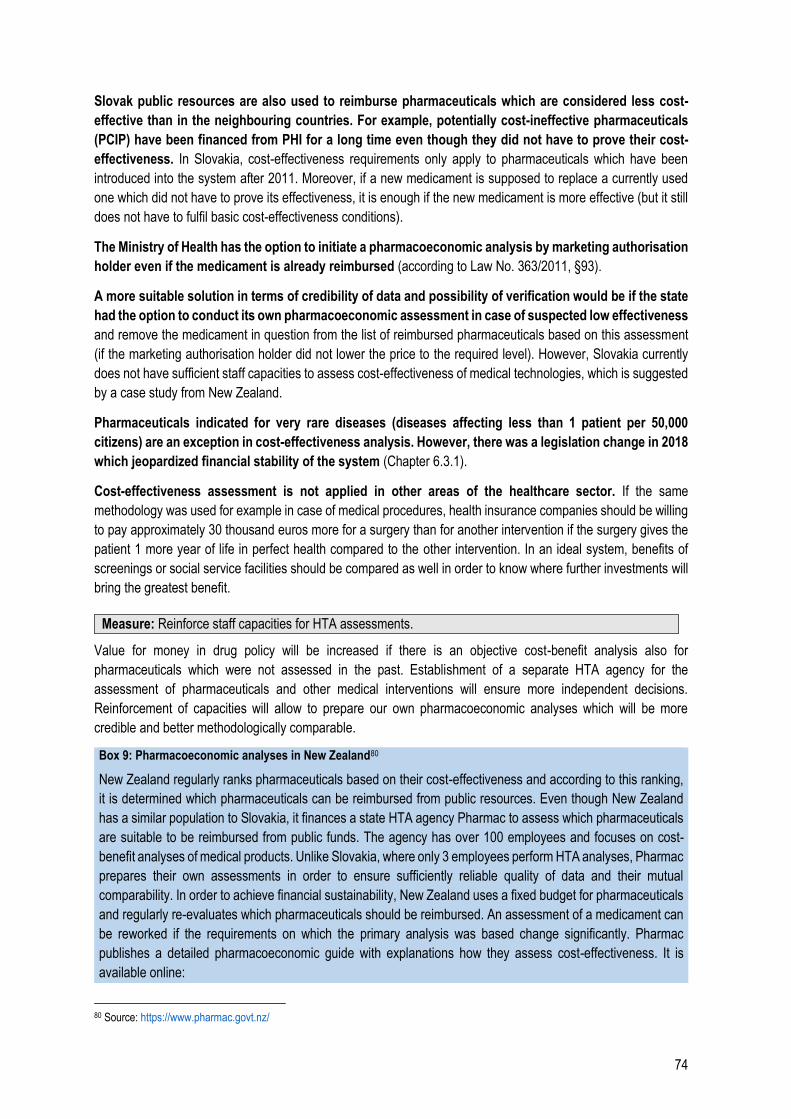
74
Slovak public resources are also used to reimburse pharmaceuticals which are considered less cost-
effective than in the neighbouring countries. For example, potentially cost-ineffective pharmaceuticals
(PCIP) have been financed from PHI for a long time even though they did not have to prove their cost-
effectiveness. In Slovakia, cost-effectiveness requirements only apply to pharmaceuticals which have been
introduced into the system after 2011. Moreover, if a new medicament is supposed to replace a currently used
one which did not have to prove its effectiveness, it is enough if the new medicament is more effective (but it still
does not have to fulfil basic cost-effectiveness conditions).
The Ministry of Health has the option to initiate a pharmacoeconomic analysis by marketing authorisation
holder even if the medicament is already reimbursed (according to Law No. 363/2011, §93).
A more suitable solution in terms of credibility of data and possibility of verification would be if the state
had the option to conduct its own pharmacoeconomic assessment in case of suspected low effectiveness
and remove the medicament in question from the list of reimbursed pharmaceuticals based on this assessment
(if the marketing authorisation holder did not lower the price to the required level). However, Slovakia currently
does not have sufficient staff capacities to assess cost-effectiveness of medical technologies, which is suggested
by a case study from New Zealand.
Pharmaceuticals indicated for very rare diseases (diseases affecting less than 1 patient per 50,000
citizens) are an exception in cost-effectiveness analysis. However, there was a legislation change in 2018
which jeopardized financial stability of the system (Chapter 6.3.1).
Cost-effectiveness assessment is not applied in other areas of the healthcare sector. If the same
methodology was used for example in case of medical procedures, health insurance companies should be willing
to pay approximately 30 thousand euros more for a surgery than for another intervention if the surgery gives the
patient 1 more year of life in perfect health compared to the other intervention. In an ideal system, benefits of
screenings or social service facilities should be compared as well in order to know where further investments will
bring the greatest benefit.
Measure: Reinforce staff capacities for HTA assessments.
Value for money in drug policy will be increased if there is an objective cost-benefit analysis also for
pharmaceuticals which were not assessed in the past. Establishment of a separate HTA agency for the
assessment of pharmaceuticals and other medical interventions will ensure more independent decisions.
Reinforcement of capacities will allow to prepare our own pharmacoeconomic analyses which will be more
credible and better methodologically comparable.
80 Source: https://www.pharmac.govt.nz/
Box 9: Pharmacoeconomic analyses in New Zealand80
New Zealand regularly ranks pharmaceuticals based on their cost-effectiveness and according to this ranking,
it is determined which pharmaceuticals can be reimbursed from public resources. Even though New Zealand
has a similar population to Slovakia, it finances a state HTA agency Pharmac to assess which pharmaceuticals
are suitable to be reimbursed from public funds. The agency has over 100 employees and focuses on cost-
benefit analyses of medical products. Unlike Slovakia, where only 3 employees perform HTA analyses, Pharmac
prepares their own assessments in order to ensure sufficiently reliable quality of data and their mutual
comparability. In order to achieve financial sustainability, New Zealand uses a fixed budget for pharmaceuticals
and regularly re-evaluates which pharmaceuticals should be reimbursed. An assessment of a medicament can
be reworked if the requirements on which the primary analysis was based change significantly. Pharmac
publishes a detailed pharmacoeconomic guide with explanations how they assess cost-effectiveness. It is
available online:
75
6.3.1 Cost-ineffective pharmaceuticals in the system
Because of an unsuitable definition of pharmaceuticals indicated for rare diseases valid in 2018,
pharmaceuticals with an annual impact of 74 million euros were introduced into the system of reimbursed
pharmaceuticals even though they did not have to prove their cost-effectiveness.
New amendment of the Law No. 363/2011 Coll. came into effect on January 1, 2018. It was intended to give more
patients with very rare diseases access to treatment reimbursed by the insurance. Manufacturers of some
pharmaceuticals for rare diseases (so-called ultra-orphans) thus do not have to prove standard cost-effectiveness
in order to have their pharmaceuticals reimbursed from public health insurance (i.e. included in the LCP).
Several substantial changes of wording of the draft have taken place during the legislation process,
which caused significantly more pharmaceuticals with no proof of cost-effectiveness to be classified as
reimbursed pharmaceuticals than intended (details in Annexe 6). The MoH corrected the definition of
pharmaceuticals for rare diseases in January 2019. The problem remains for pharmaceuticals introduced into the
system in 2018 without proof of their sufficient benefit which are still reimbursed from public resources.
It should be compulsory for each new medicament applying to be categorised to prove its cost-
effectiveness.81 Fair and transparent drug policy will increase cost-effectiveness thresholds also for
pharmaceuticals for rare diseases. The established criteria will need to be met also by pharmaceuticals which
have already been introduced into the system.
A solution for pharmaceuticals which do not fulfil the thresholds could be Managed Entry Agreements
(MEAs). Marketing authorisation holders can privately adjust their price to the required thresholds and
thus avoid changes in pricing abroad. MEAs are agreements between the payer (PHI, sometimes HIC) and
marketing authorisation holder to determine more favourable pricing terms or to reduce uncertainty related to the
introduction of a new medicament into the market. It is often done by determining maximum amount to be paid
for a time period, which serves as a safety measure for the payer. In case the agreed threshold is overdrawn due
to unexpectedly high consumption, the authorisation holder gives extra revenue back to the payer.
81 A medicament entering an already existing ATC group is not considered a new medicament in this case.
https://www.pharmac.govt.nz/medicines/how-medicines-are-funded/economic-analysis/pfpa/
Measure: Establish rules of cost-effectiveness also for pharmaceuticals for rare diseases (potential 10 million
euros).
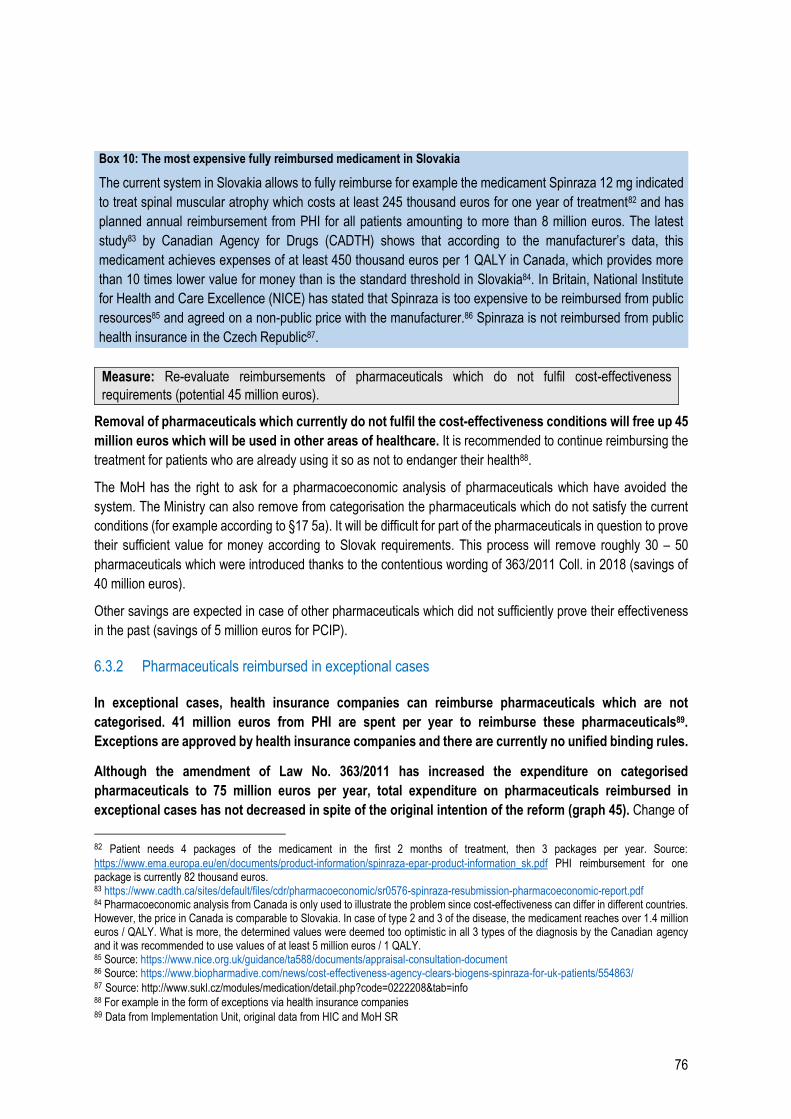
76
Measure: Re-evaluate reimbursements of pharmaceuticals which do not fulfil cost-effectiveness
requirements (potential 45 million euros).
Removal of pharmaceuticals which currently do not fulfil the cost-effectiveness conditions will free up 45
million euros which will be used in other areas of healthcare. It is recommended to continue reimbursing the
treatment for patients who are already using it so as not to endanger their health88.
The MoH has the right to ask for a pharmacoeconomic analysis of pharmaceuticals which have avoided the
system. The Ministry can also remove from categorisation the pharmaceuticals which do not satisfy the current
conditions (for example according to §17 5a). It will be difficult for part of the pharmaceuticals in question to prove
their sufficient value for money according to Slovak requirements. This process will remove roughly 30 – 50
pharmaceuticals which were introduced thanks to the contentious wording of 363/2011 Coll. in 2018 (savings of
40 million euros).
Other savings are expected in case of other pharmaceuticals which did not sufficiently prove their effectiveness
in the past (savings of 5 million euros for PCIP).
6.3.2 Pharmaceuticals reimbursed in exceptional cases
In exceptional cases, health insurance companies can reimburse pharmaceuticals which are not
categorised. 41 million euros from PHI are spent per year to reimburse these pharmaceuticals89.
Exceptions are approved by health insurance companies and there are currently no unified binding rules.
Although the amendment of Law No. 363/2011 has increased the expenditure on categorised
pharmaceuticals to 75 million euros per year, total expenditure on pharmaceuticals reimbursed in
exceptional cases has not decreased in spite of the original intention of the reform (graph 45). Change of
82 Patient needs 4 packages of the medicament in the first 2 months of treatment, then 3 packages per year. Source:
https://www.ema.europa.eu/en/documents/product-information/spinraza-epar-product-information_sk.pdf PHI reimbursement for one package is currently 82 thousand euros. 83 https://www.cadth.ca/sites/default/files/cdr/pharmacoeconomic/sr0576-spinraza-resubmission-pharmacoeconomic-report.pdf 84 Pharmacoeconomic analysis from Canada is only used to illustrate the problem since cost-effectiveness can differ in different countries. However, the price in Canada is comparable to Slovakia. In case of type 2 and 3 of the disease, the medicament reaches over 1.4 million euros / QALY. What is more, the determined values were deemed too optimistic in all 3 types of the diagnosis by the Canadian agency and it was recommended to use values of at least 5 million euros / 1 QALY. 85 Source: https://www.nice.org.uk/guidance/ta588/documents/appraisal-consultation-document 86 Source: https://www.biopharmadive.com/news/cost-effectiveness-agency-clears-biogens-spinraza-for-uk-patients/554863/ 87 Source: http://www.sukl.cz/modules/medication/detail.php?code=0222208&tab=info 88 For example in the form of exceptions via health insurance companies 89 Data from Implementation Unit, original data from HIC and MoH SR
Box 10: The most expensive fully reimbursed medicament in Slovakia
The current system in Slovakia allows to fully reimburse for example the medicament Spinraza 12 mg indicated
to treat spinal muscular atrophy which costs at least 245 thousand euros for one year of treatment82 and has
planned annual reimbursement from PHI for all patients amounting to more than 8 million euros. The latest
study83 by Canadian Agency for Drugs (CADTH) shows that according to the manufacturer’s data, this
medicament achieves expenses of at least 450 thousand euros per 1 QALY in Canada, which provides more
than 10 times lower value for money than is the standard threshold in Slovakia84. In Britain, National Institute
for Health and Care Excellence (NICE) has stated that Spinraza is too expensive to be reimbursed from public
resources85 and agreed on a non-public price with the manufacturer.86 Spinraza is not reimbursed from public
health insurance in the Czech Republic87.
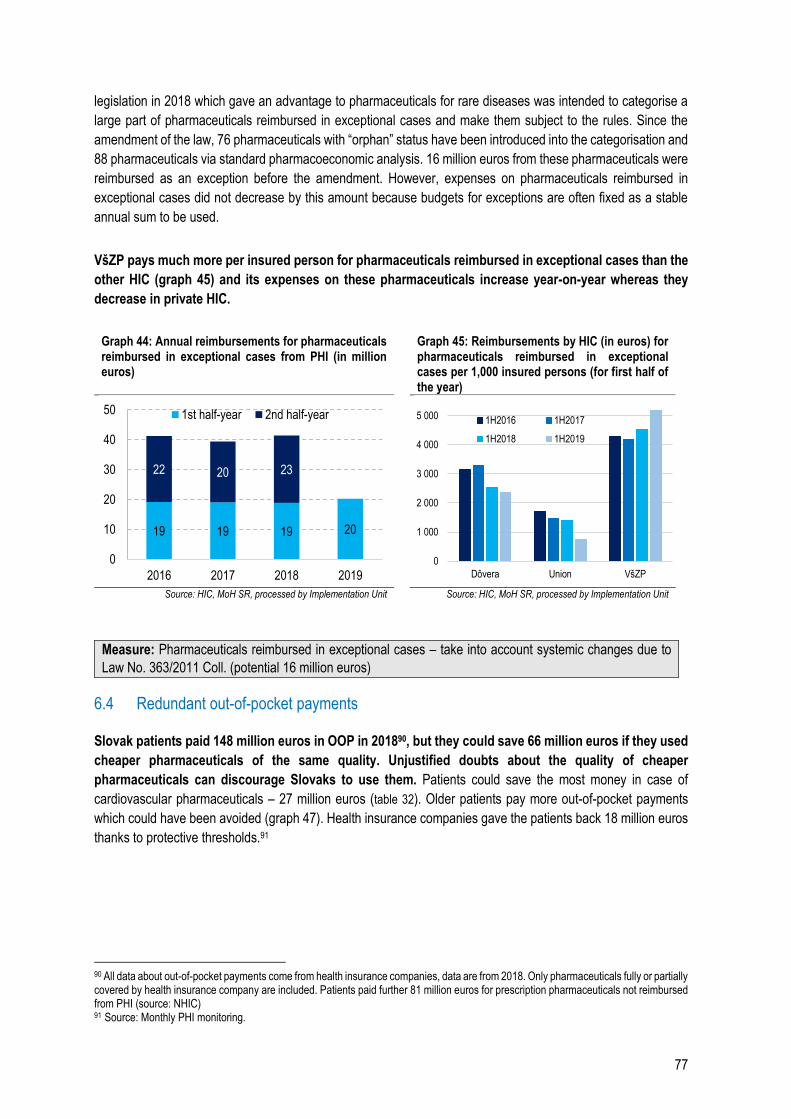
77
legislation in 2018 which gave an advantage to pharmaceuticals for rare diseases was intended to categorise a
large part of pharmaceuticals reimbursed in exceptional cases and make them subject to the rules. Since the
amendment of the law, 76 pharmaceuticals with “orphan” status have been introduced into the categorisation and
88 pharmaceuticals via standard pharmacoeconomic analysis. 16 million euros from these pharmaceuticals were
reimbursed as an exception before the amendment. However, expenses on pharmaceuticals reimbursed in
exceptional cases did not decrease by this amount because budgets for exceptions are often fixed as a stable
annual sum to be used.
VšZP pays much more per insured person for pharmaceuticals reimbursed in exceptional cases than the
other HIC (graph 45) and its expenses on these pharmaceuticals increase year-on-year whereas they
decrease in private HIC.
Graph 44: Annual reimbursements for pharmaceuticals reimbursed in exceptional cases from PHI (in million euros)
Graph 45: Reimbursements by HIC (in euros) for pharmaceuticals reimbursed in exceptional cases per 1,000 insured persons (for first half of the year)
Source: HIC, MoH SR, processed by Implementation Unit Source: HIC, MoH SR, processed by Implementation Unit
Measure: Pharmaceuticals reimbursed in exceptional cases – take into account systemic changes due to
Law No. 363/2011 Coll. (potential 16 million euros)
6.4 Redundant out-of-pocket payments
Slovak patients paid 148 million euros in OOP in 201890, but they could save 66 million euros if they used
cheaper pharmaceuticals of the same quality. Unjustified doubts about the quality of cheaper
pharmaceuticals can discourage Slovaks to use them. Patients could save the most money in case of
cardiovascular pharmaceuticals – 27 million euros (table 32). Older patients pay more out-of-pocket payments
which could have been avoided (graph 47). Health insurance companies gave the patients back 18 million euros
thanks to protective thresholds.91
90 All data about out-of-pocket payments come from health insurance companies, data are from 2018. Only pharmaceuticals fully or partially covered by health insurance company are included. Patients paid further 81 million euros for prescription pharmaceuticals not reimbursed from PHI (source: NHIC) 91 Source: Monthly PHI monitoring.
19 19 19 20
22 20 23
0
10
20
30
40
50
2016 2017 2018 2019
1st half-year 2nd half-year
0
1 000
2 000
3 000
4 000
5 000
Dôvera Union VšZP
1H2016 1H2017
1H2018 1H2019
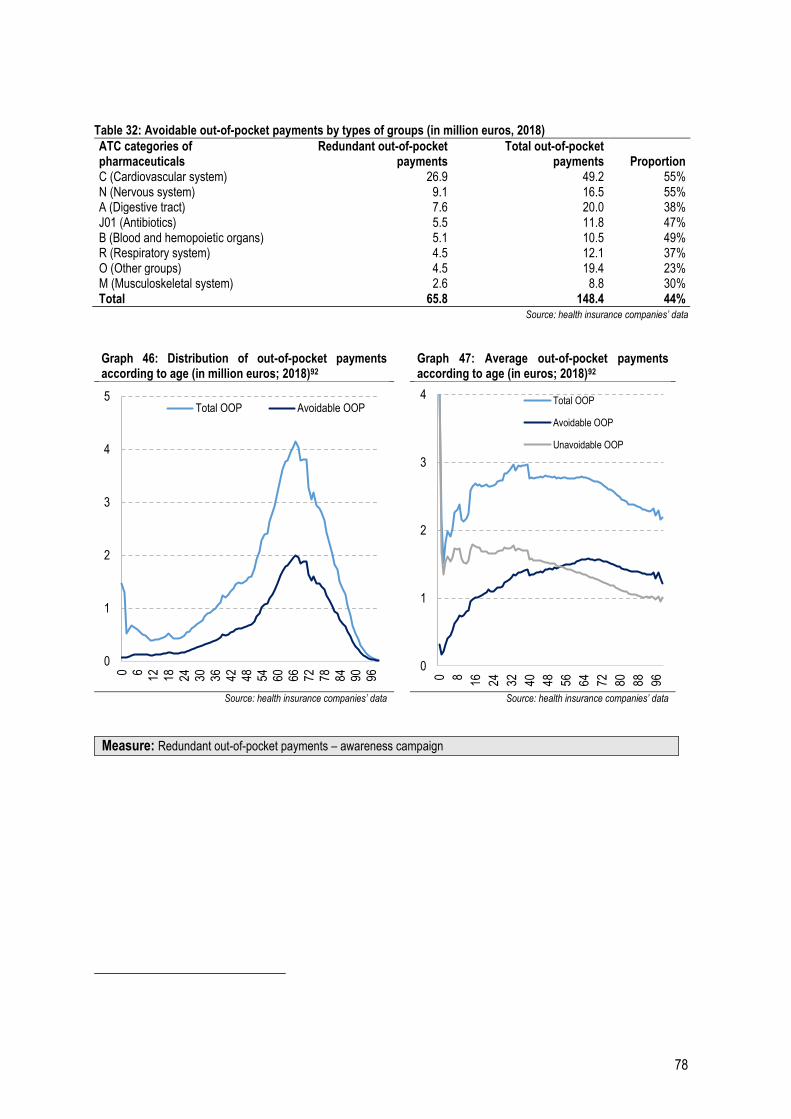
78
Table 32: Avoidable out-of-pocket payments by types of groups (in million euros, 2018)
ATC categories of pharmaceuticals
Redundant out-of-pocket payments
Total out-of-pocket payments Proportion
C (Cardiovascular system) 26.9 49.2 55% N (Nervous system) 9.1 16.5 55% A (Digestive tract) 7.6 20.0 38% J01 (Antibiotics) 5.5 11.8 47% B (Blood and hemopoietic organs) 5.1 10.5 49% R (Respiratory system) 4.5 12.1 37% O (Other groups) 4.5 19.4 23% M (Musculoskeletal system) 2.6 8.8 30% Total 65.8 148.4 44%
Source: health insurance companies’ data
Graph 46: Distribution of out-of-pocket payments according to age (in million euros; 2018)92
Graph 47: Average out-of-pocket payments according to age (in euros; 2018)92
Source: health insurance companies’ data Source: health insurance companies’ data
Measure: Redundant out-of-pocket payments – awareness campaign
0
1
2
3
4
5
0 6 12 18 24 30 36 42 48 54 60 66 72 78 84 90 96
Total OOP Avoidable OOP
0
1
2
3
4
0 8 16 24 32 40 48 56 64 72 80 88 96
Total OOP
Avoidable OOP
Unavoidable OOP
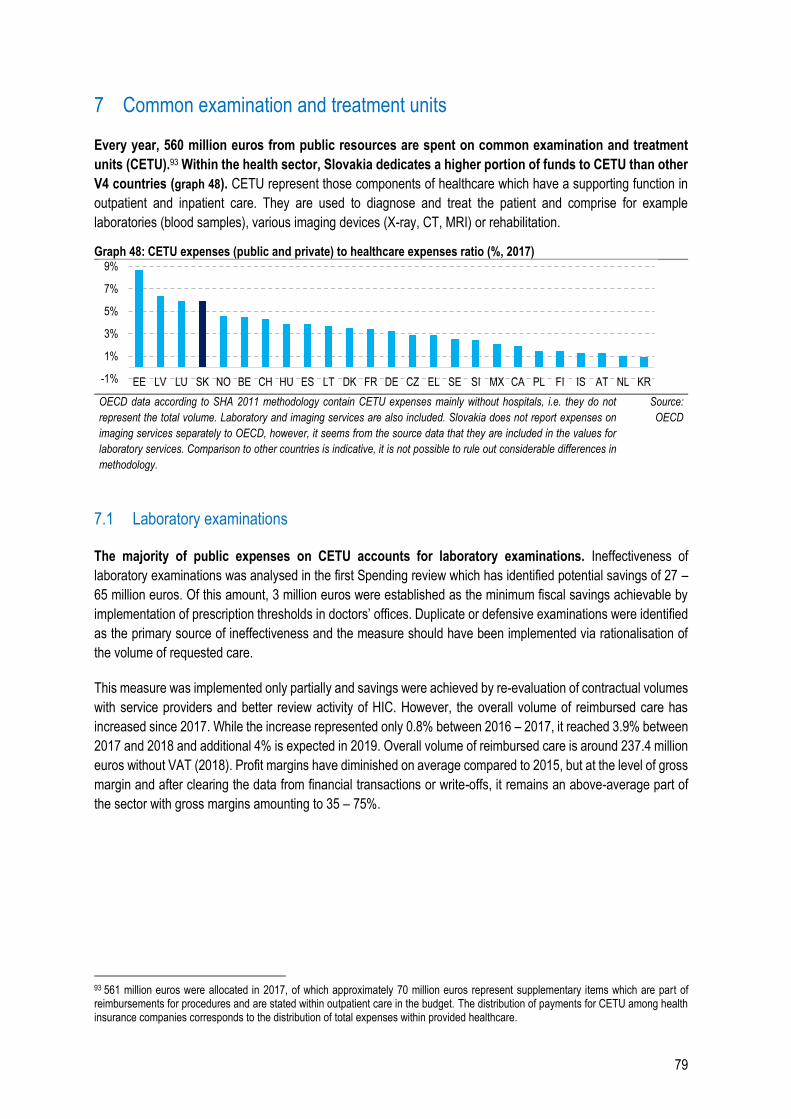
79
7 Common examination and treatment units
Every year, 560 million euros from public resources are spent on common examination and treatment
units (CETU).93 Within the health sector, Slovakia dedicates a higher portion of funds to CETU than other
V4 countries (graph 48). CETU represent those components of healthcare which have a supporting function in
outpatient and inpatient care. They are used to diagnose and treat the patient and comprise for example
laboratories (blood samples), various imaging devices (X-ray, CT, MRI) or rehabilitation.
Graph 48: CETU expenses (public and private) to healthcare expenses ratio (%, 2017)
OECD data according to SHA 2011 methodology contain CETU expenses mainly without hospitals, i.e. they do not
represent the total volume. Laboratory and imaging services are also included. Slovakia does not report expenses on
imaging services separately to OECD, however, it seems from the source data that they are included in the values for
laboratory services. Comparison to other countries is indicative, it is not possible to rule out considerable differences in
methodology.
Source:
OECD
7.1 Laboratory examinations
The majority of public expenses on CETU accounts for laboratory examinations. Ineffectiveness of
laboratory examinations was analysed in the first Spending review which has identified potential savings of 27 –
65 million euros. Of this amount, 3 million euros were established as the minimum fiscal savings achievable by
implementation of prescription thresholds in doctors’ offices. Duplicate or defensive examinations were identified
as the primary source of ineffectiveness and the measure should have been implemented via rationalisation of
the volume of requested care.
This measure was implemented only partially and savings were achieved by re-evaluation of contractual volumes
with service providers and better review activity of HIC. However, the overall volume of reimbursed care has
increased since 2017. While the increase represented only 0.8% between 2016 – 2017, it reached 3.9% between
2017 and 2018 and additional 4% is expected in 2019. Overall volume of reimbursed care is around 237.4 million
euros without VAT (2018). Profit margins have diminished on average compared to 2015, but at the level of gross
margin and after clearing the data from financial transactions or write-offs, it remains an above-average part of
the sector with gross margins amounting to 35 – 75%.
93 561 million euros were allocated in 2017, of which approximately 70 million euros represent supplementary items which are part of reimbursements for procedures and are stated within outpatient care in the budget. The distribution of payments for CETU among health insurance companies corresponds to the distribution of total expenses within provided healthcare.
-1%
1%
3%
5%
7%
9%
EE LV LU SK NO BE CH HU ES LT DK FR DE CZ EL SE SI MX CA PL FI IS AT NL KR
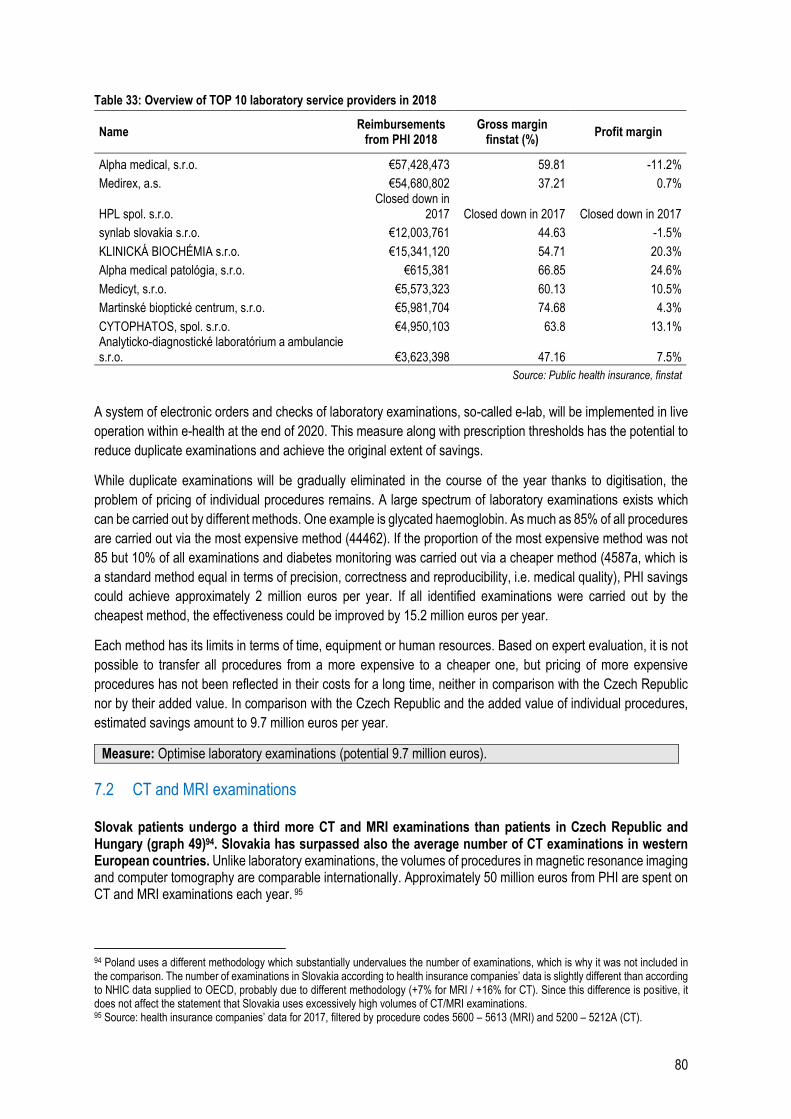
80
Table 33: Overview of TOP 10 laboratory service providers in 2018
Name Reimbursements
from PHI 2018 Gross margin
finstat (%) Profit margin
Alpha medical, s.r.o. €57,428,473 59.81 -11.2%
Medirex, a.s. €54,680,802 37.21 0.7%
HPL spol. s.r.o. Closed down in
2017 Closed down in 2017 Closed down in 2017
synlab slovakia s.r.o. €12,003,761 44.63 -1.5%
KLINICKÁ BIOCHÉMIA s.r.o. €15,341,120 54.71 20.3%
Alpha medical patológia, s.r.o. €615,381 66.85 24.6%
Medicyt, s.r.o. €5,573,323 60.13 10.5%
Martinské bioptické centrum, s.r.o. €5,981,704 74.68 4.3%
CYTOPHATOS, spol. s.r.o. €4,950,103 63.8 13.1% Analyticko-diagnostické laboratórium a ambulancie s.r.o. €3,623,398 47.16 7.5%
Source: Public health insurance, finstat
A system of electronic orders and checks of laboratory examinations, so-called e-lab, will be implemented in live
operation within e-health at the end of 2020. This measure along with prescription thresholds has the potential to
reduce duplicate examinations and achieve the original extent of savings.
While duplicate examinations will be gradually eliminated in the course of the year thanks to digitisation, the
problem of pricing of individual procedures remains. A large spectrum of laboratory examinations exists which
can be carried out by different methods. One example is glycated haemoglobin. As much as 85% of all procedures
are carried out via the most expensive method (44462). If the proportion of the most expensive method was not
85 but 10% of all examinations and diabetes monitoring was carried out via a cheaper method (4587a, which is
a standard method equal in terms of precision, correctness and reproducibility, i.e. medical quality), PHI savings
could achieve approximately 2 million euros per year. If all identified examinations were carried out by the
cheapest method, the effectiveness could be improved by 15.2 million euros per year.
Each method has its limits in terms of time, equipment or human resources. Based on expert evaluation, it is not
possible to transfer all procedures from a more expensive to a cheaper one, but pricing of more expensive
procedures has not been reflected in their costs for a long time, neither in comparison with the Czech Republic
nor by their added value. In comparison with the Czech Republic and the added value of individual procedures,
estimated savings amount to 9.7 million euros per year.
Measure: Optimise laboratory examinations (potential 9.7 million euros).
7.2 CT and MRI examinations
Slovak patients undergo a third more CT and MRI examinations than patients in Czech Republic and Hungary (graph 49)94. Slovakia has surpassed also the average number of CT examinations in western European countries. Unlike laboratory examinations, the volumes of procedures in magnetic resonance imaging and computer tomography are comparable internationally. Approximately 50 million euros from PHI are spent on CT and MRI examinations each year. 95
94 Poland uses a different methodology which substantially undervalues the number of examinations, which is why it was not included in the comparison. The number of examinations in Slovakia according to health insurance companies’ data is slightly different than according to NHIC data supplied to OECD, probably due to different methodology (+7% for MRI / +16% for CT). Since this difference is positive, it does not affect the statement that Slovakia uses excessively high volumes of CT/MRI examinations. 95 Source: health insurance companies’ data for 2017, filtered by procedure codes 5600 – 5613 (MRI) and 5200 – 5212A (CT).
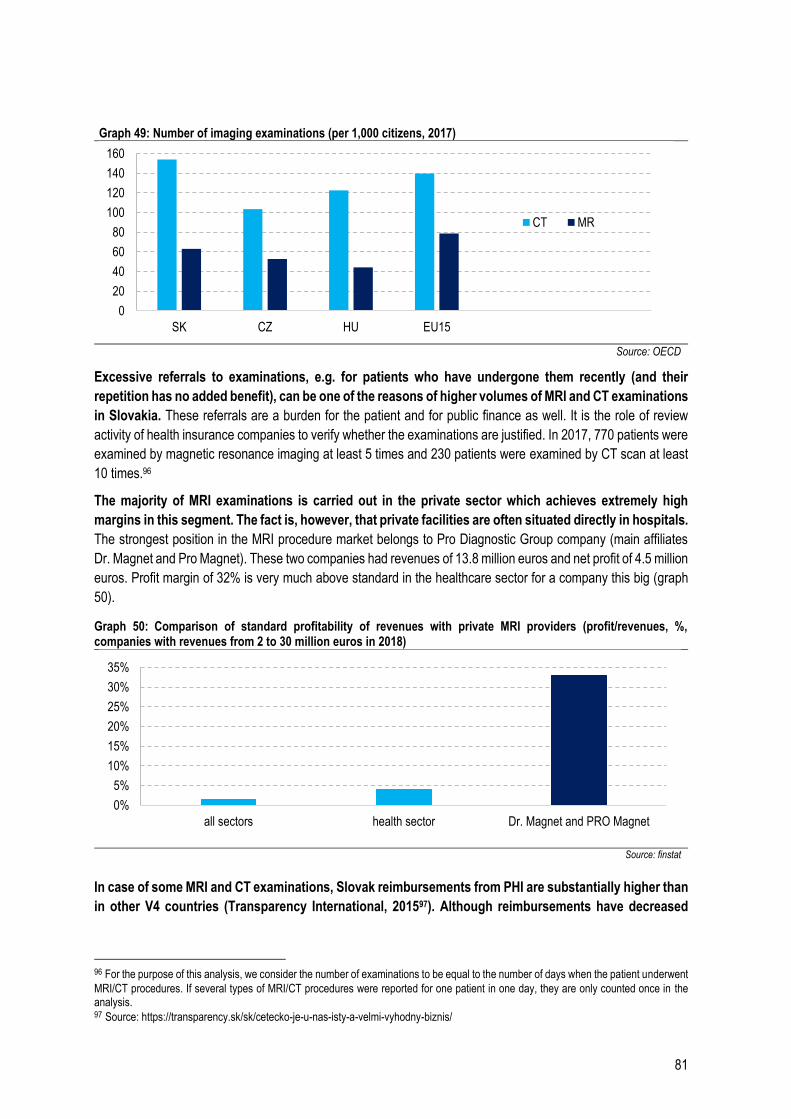
81
Graph 49: Number of imaging examinations (per 1,000 citizens, 2017)
Source: OECD
Excessive referrals to examinations, e.g. for patients who have undergone them recently (and their
repetition has no added benefit), can be one of the reasons of higher volumes of MRI and CT examinations
in Slovakia. These referrals are a burden for the patient and for public finance as well. It is the role of review
activity of health insurance companies to verify whether the examinations are justified. In 2017, 770 patients were
examined by magnetic resonance imaging at least 5 times and 230 patients were examined by CT scan at least
10 times.96
The majority of MRI examinations is carried out in the private sector which achieves extremely high
margins in this segment. The fact is, however, that private facilities are often situated directly in hospitals.
The strongest position in the MRI procedure market belongs to Pro Diagnostic Group company (main affiliates
Dr. Magnet and Pro Magnet). These two companies had revenues of 13.8 million euros and net profit of 4.5 million
euros. Profit margin of 32% is very much above standard in the healthcare sector for a company this big (graph
50).
Graph 50: Comparison of standard profitability of revenues with private MRI providers (profit/revenues, %, companies with revenues from 2 to 30 million euros in 2018)
Source: finstat
In case of some MRI and CT examinations, Slovak reimbursements from PHI are substantially higher than
in other V4 countries (Transparency International, 201597). Although reimbursements have decreased
96 For the purpose of this analysis, we consider the number of examinations to be equal to the number of days when the patient underwent
MRI/CT procedures. If several types of MRI/CT procedures were reported for one patient in one day, they are only counted once in the analysis. 97 Source: https://transparency.sk/sk/cetecko-je-u-nas-isty-a-velmi-vyhodny-biznis/
0
20
40
60
80
100
120
140
160
SK CZ HU EU15
CT MR
0%
5%
10%
15%
20%
25%
30%
35%
all sectors health sector Dr. Magnet and PRO Magnet
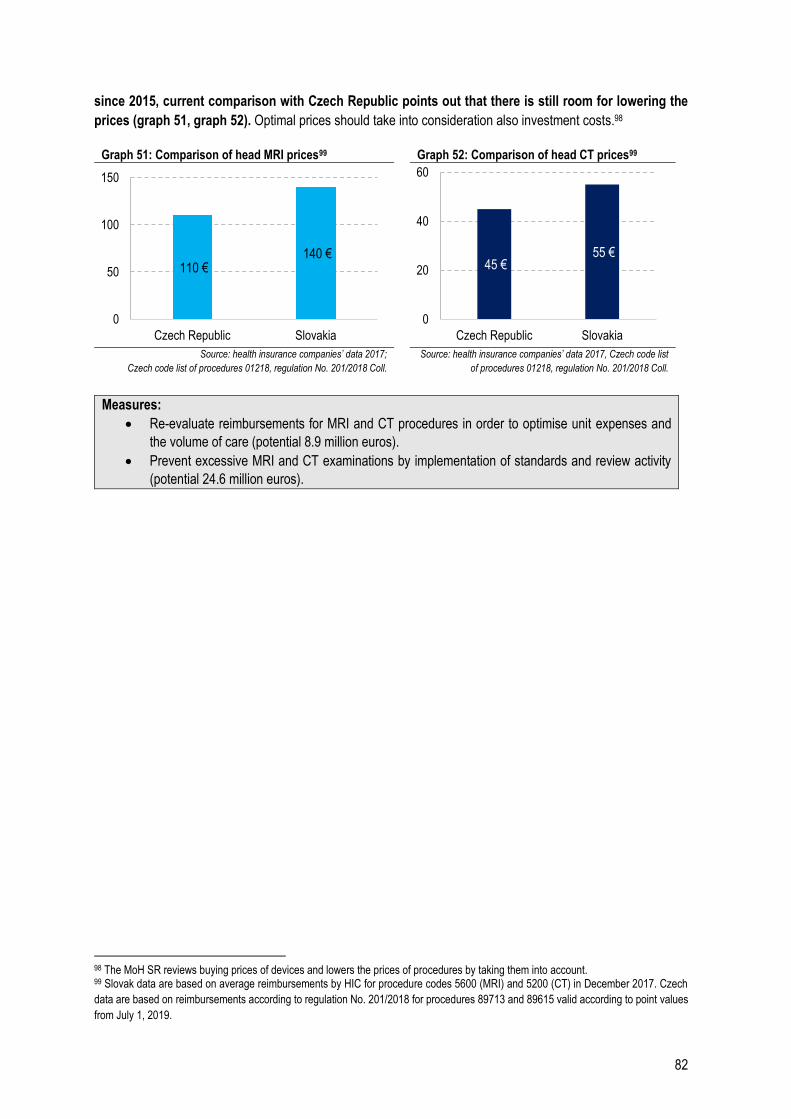
82
since 2015, current comparison with Czech Republic points out that there is still room for lowering the
prices (graph 51, graph 52). Optimal prices should take into consideration also investment costs.98
Graph 51: Comparison of head MRI prices99 Graph 52: Comparison of head CT prices99
Source: health insurance companies’ data 2017;
Czech code list of procedures 01218, regulation No. 201/2018 Coll.
Source: health insurance companies’ data 2017, Czech code list
of procedures 01218, regulation No. 201/2018 Coll.
Measures:
Re-evaluate reimbursements for MRI and CT procedures in order to optimise unit expenses and
the volume of care (potential 8.9 million euros).
Prevent excessive MRI and CT examinations by implementation of standards and review activity
(potential 24.6 million euros).
98 The MoH SR reviews buying prices of devices and lowers the prices of procedures by taking them into account. 99 Slovak data are based on average reimbursements by HIC for procedure codes 5600 (MRI) and 5200 (CT) in December 2017. Czech
data are based on reimbursements according to regulation No. 201/2018 for procedures 89713 and 89615 valid according to point values
from July 1, 2019.
110 €140 €
0
50
100
150
Czech Republic Slovakia
45 €55 €
0
20
40
60
Czech Republic Slovakia
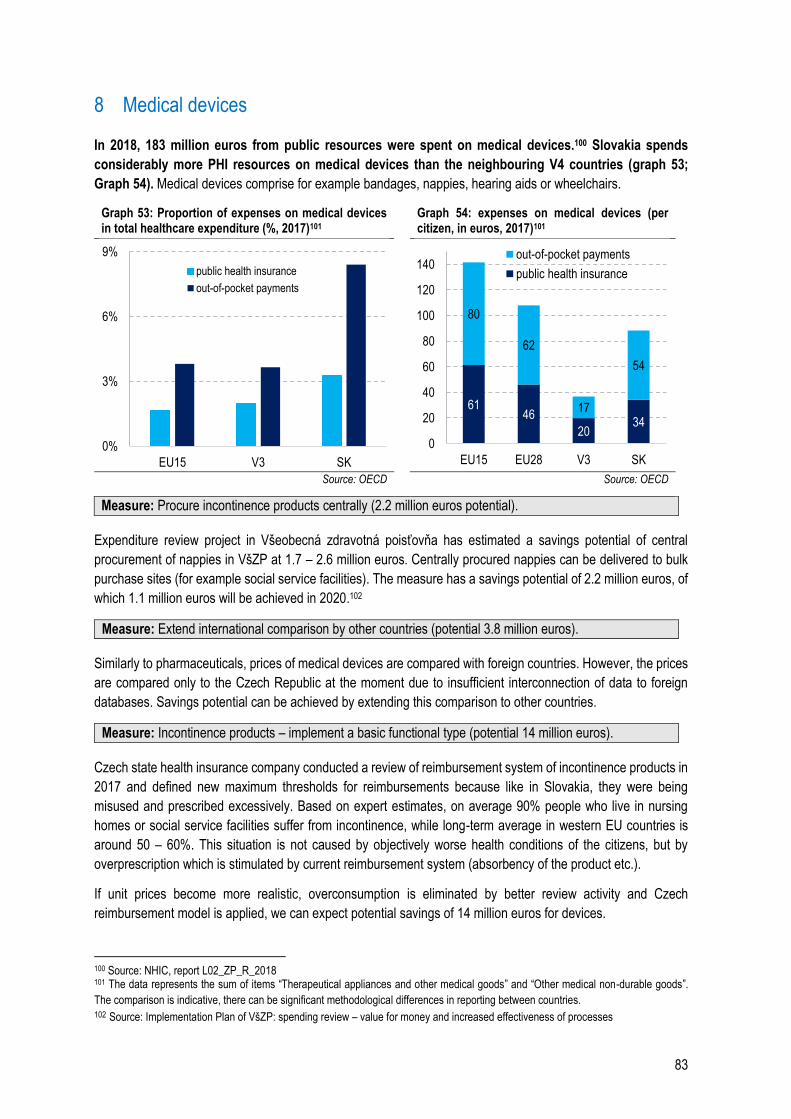
83
8 Medical devices
In 2018, 183 million euros from public resources were spent on medical devices.100 Slovakia spends
considerably more PHI resources on medical devices than the neighbouring V4 countries (graph 53;
Graph 54). Medical devices comprise for example bandages, nappies, hearing aids or wheelchairs.
Graph 53: Proportion of expenses on medical devices in total healthcare expenditure (%, 2017)101
Graph 54: expenses on medical devices (per citizen, in euros, 2017)101
Source: OECD Source: OECD
Measure: Procure incontinence products centrally (2.2 million euros potential).
Expenditure review project in Všeobecná zdravotná poisťovňa has estimated a savings potential of central
procurement of nappies in VšZP at 1.7 – 2.6 million euros. Centrally procured nappies can be delivered to bulk
purchase sites (for example social service facilities). The measure has a savings potential of 2.2 million euros, of
which 1.1 million euros will be achieved in 2020.102
Measure: Extend international comparison by other countries (potential 3.8 million euros).
Similarly to pharmaceuticals, prices of medical devices are compared with foreign countries. However, the prices
are compared only to the Czech Republic at the moment due to insufficient interconnection of data to foreign
databases. Savings potential can be achieved by extending this comparison to other countries.
Measure: Incontinence products – implement a basic functional type (potential 14 million euros).
Czech state health insurance company conducted a review of reimbursement system of incontinence products in
2017 and defined new maximum thresholds for reimbursements because like in Slovakia, they were being
misused and prescribed excessively. Based on expert estimates, on average 90% people who live in nursing
homes or social service facilities suffer from incontinence, while long-term average in western EU countries is
around 50 – 60%. This situation is not caused by objectively worse health conditions of the citizens, but by
overprescription which is stimulated by current reimbursement system (absorbency of the product etc.).
If unit prices become more realistic, overconsumption is eliminated by better review activity and Czech
reimbursement model is applied, we can expect potential savings of 14 million euros for devices.
100 Source: NHIC, report L02_ZP_R_2018 101 The data represents the sum of items “Therapeutical appliances and other medical goods” and “Other medical non-durable goods”.
The comparison is indicative, there can be significant methodological differences in reporting between countries. 102 Source: Implementation Plan of VšZP: spending review – value for money and increased effectiveness of processes
0%
3%
6%
9%
EU15 V3 SK
public health insurance
out-of-pocket payments
6146
2034
80
62
17
54
0
20
40
60
80
100
120
140
EU15 EU28 V3 SK
out-of-pocket payments
public health insurance
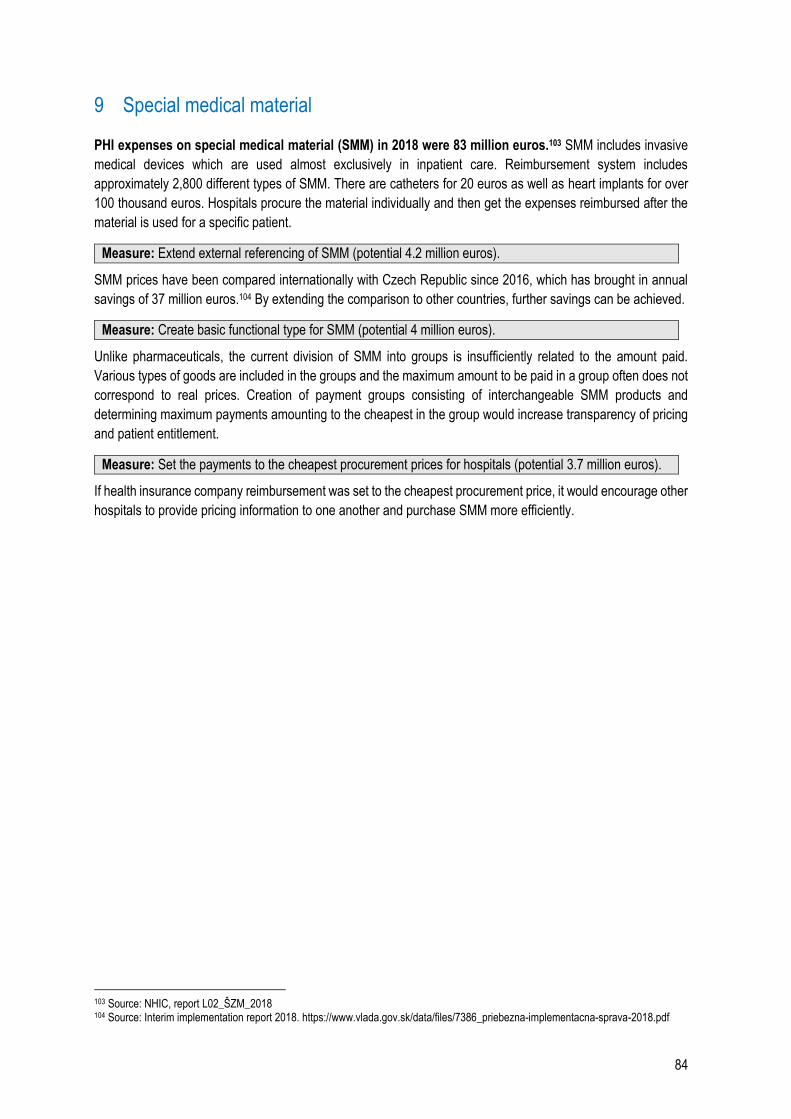
84
9 Special medical material
PHI expenses on special medical material (SMM) in 2018 were 83 million euros.103 SMM includes invasive
medical devices which are used almost exclusively in inpatient care. Reimbursement system includes
approximately 2,800 different types of SMM. There are catheters for 20 euros as well as heart implants for over
100 thousand euros. Hospitals procure the material individually and then get the expenses reimbursed after the
material is used for a specific patient.
Measure: Extend external referencing of SMM (potential 4.2 million euros).
SMM prices have been compared internationally with Czech Republic since 2016, which has brought in annual
savings of 37 million euros.104 By extending the comparison to other countries, further savings can be achieved.
Measure: Create basic functional type for SMM (potential 4 million euros).
Unlike pharmaceuticals, the current division of SMM into groups is insufficiently related to the amount paid.
Various types of goods are included in the groups and the maximum amount to be paid in a group often does not
correspond to real prices. Creation of payment groups consisting of interchangeable SMM products and
determining maximum payments amounting to the cheapest in the group would increase transparency of pricing
and patient entitlement.
Measure: Set the payments to the cheapest procurement prices for hospitals (potential 3.7 million euros).
If health insurance company reimbursement was set to the cheapest procurement price, it would encourage other
hospitals to provide pricing information to one another and purchase SMM more efficiently.
103 Source: NHIC, report L02_ŠZM_2018 104 Source: Interim implementation report 2018. https://www.vlada.gov.sk/data/files/7386_priebezna-implementacna-sprava-2018.pdf
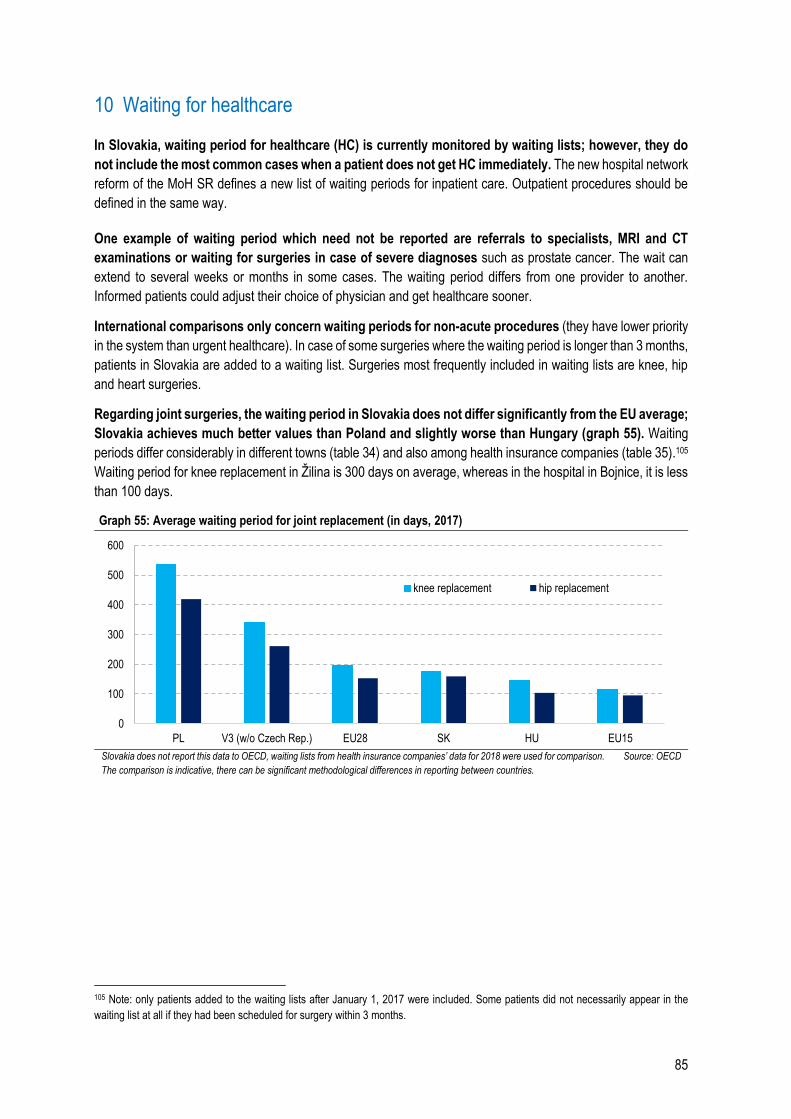
85
10 Waiting for healthcare
In Slovakia, waiting period for healthcare (HC) is currently monitored by waiting lists; however, they do
not include the most common cases when a patient does not get HC immediately. The new hospital network
reform of the MoH SR defines a new list of waiting periods for inpatient care. Outpatient procedures should be
defined in the same way.
One example of waiting period which need not be reported are referrals to specialists, MRI and CT
examinations or waiting for surgeries in case of severe diagnoses such as prostate cancer. The wait can
extend to several weeks or months in some cases. The waiting period differs from one provider to another.
Informed patients could adjust their choice of physician and get healthcare sooner.
International comparisons only concern waiting periods for non-acute procedures (they have lower priority
in the system than urgent healthcare). In case of some surgeries where the waiting period is longer than 3 months,
patients in Slovakia are added to a waiting list. Surgeries most frequently included in waiting lists are knee, hip
and heart surgeries.
Regarding joint surgeries, the waiting period in Slovakia does not differ significantly from the EU average;
Slovakia achieves much better values than Poland and slightly worse than Hungary (graph 55). Waiting
periods differ considerably in different towns (table 34) and also among health insurance companies (table 35).105
Waiting period for knee replacement in Žilina is 300 days on average, whereas in the hospital in Bojnice, it is less
than 100 days.
Graph 55: Average waiting period for joint replacement (in days, 2017)
Slovakia does not report this data to OECD, waiting lists from health insurance companies’ data for 2018 were used for comparison.
The comparison is indicative, there can be significant methodological differences in reporting between countries.
Source: OECD
105 Note: only patients added to the waiting lists after January 1, 2017 were included. Some patients did not necessarily appear in the
waiting list at all if they had been scheduled for surgery within 3 months.
0
100
200
300
400
500
600
PL V3 (w/o Czech Rep.) EU28 SK HU EU15
knee replacement hip replacement
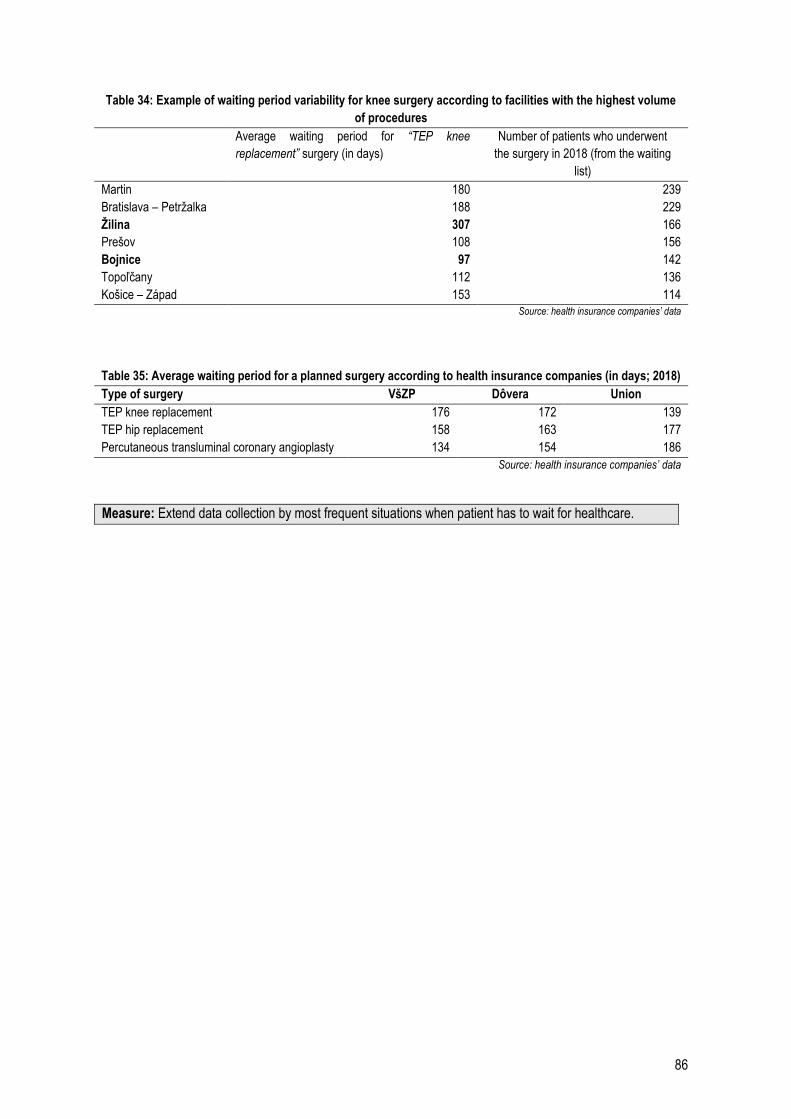
86
Table 34: Example of waiting period variability for knee surgery according to facilities with the highest volume
of procedures
Average waiting period for “TEP knee
replacement” surgery (in days)
Number of patients who underwent
the surgery in 2018 (from the waiting
list)
Martin 180 239
Bratislava – Petržalka 188 229
Žilina 307 166
Prešov 108 156
Bojnice 97 142
Topoľčany 112 136
Košice – Západ 153 114
Source: health insurance companies’ data
Table 35: Average waiting period for a planned surgery according to health insurance companies (in days; 2018)
Type of surgery VšZP Dôvera Union
TEP knee replacement 176 172 139
TEP hip replacement 158 163 177
Percutaneous transluminal coronary angioplasty 134 154 186
Source: health insurance companies’ data
Measure: Extend data collection by most frequent situations when patient has to wait for healthcare.
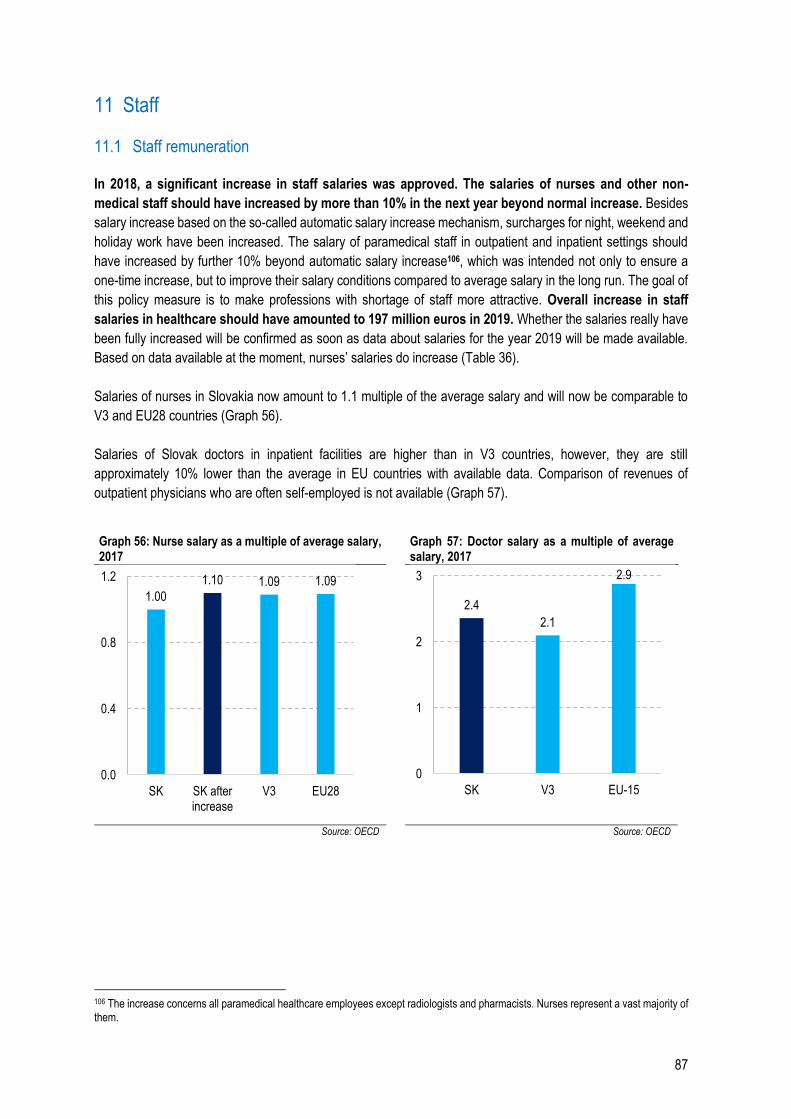
87
11 Staff
11.1 Staff remuneration
In 2018, a significant increase in staff salaries was approved. The salaries of nurses and other non-
medical staff should have increased by more than 10% in the next year beyond normal increase. Besides
salary increase based on the so-called automatic salary increase mechanism, surcharges for night, weekend and
holiday work have been increased. The salary of paramedical staff in outpatient and inpatient settings should
have increased by further 10% beyond automatic salary increase106, which was intended not only to ensure a
one-time increase, but to improve their salary conditions compared to average salary in the long run. The goal of
this policy measure is to make professions with shortage of staff more attractive. Overall increase in staff
salaries in healthcare should have amounted to 197 million euros in 2019. Whether the salaries really have
been fully increased will be confirmed as soon as data about salaries for the year 2019 will be made available.
Based on data available at the moment, nurses’ salaries do increase (Table 36).
Salaries of nurses in Slovakia now amount to 1.1 multiple of the average salary and will now be comparable to
V3 and EU28 countries (Graph 56).
Salaries of Slovak doctors in inpatient facilities are higher than in V3 countries, however, they are still
approximately 10% lower than the average in EU countries with available data. Comparison of revenues of
outpatient physicians who are often self-employed is not available (Graph 57).
Graph 56: Nurse salary as a multiple of average salary, 2017
Graph 57: Doctor salary as a multiple of average salary, 2017
Source: OECD Source: OECD
106 The increase concerns all paramedical healthcare employees except radiologists and pharmacists. Nurses represent a vast majority of them.
1.00
1.10 1.09 1.09
0.0
0.4
0.8
1.2
SK SK afterincrease
V3 EU28
2.4
2.1
2.9
0
1
2
3
SK V3 EU-15
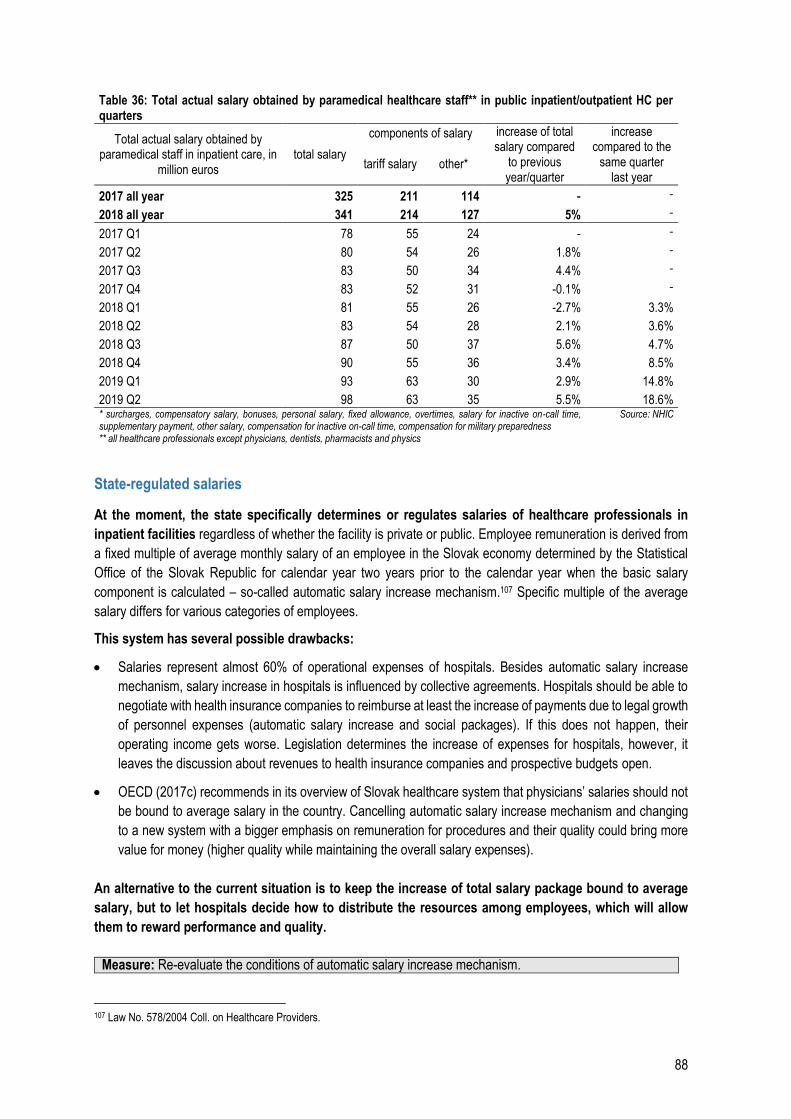
88
Table 36: Total actual salary obtained by paramedical healthcare staff** in public inpatient/outpatient HC per quarters
Total actual salary obtained by paramedical staff in inpatient care, in
million euros total salary
components of salary increase of total salary compared
to previous year/quarter
increase compared to the
same quarter last year
tariff salary other*
2017 all year 325 211 114 - -
2018 all year 341 214 127 5% -
2017 Q1 78 55 24 - -
2017 Q2 80 54 26 1.8% -
2017 Q3 83 50 34 4.4% -
2017 Q4 83 52 31 -0.1% -
2018 Q1 81 55 26 -2.7% 3.3%
2018 Q2 83 54 28 2.1% 3.6%
2018 Q3 87 50 37 5.6% 4.7%
2018 Q4 90 55 36 3.4% 8.5%
2019 Q1 93 63 30 2.9% 14.8%
2019 Q2 98 63 35 5.5% 18.6% * surcharges, compensatory salary, bonuses, personal salary, fixed allowance, overtimes, salary for inactive on-call time, supplementary payment, other salary, compensation for inactive on-call time, compensation for military preparedness ** all healthcare professionals except physicians, dentists, pharmacists and physics
Source: NHIC
State-regulated salaries
At the moment, the state specifically determines or regulates salaries of healthcare professionals in
inpatient facilities regardless of whether the facility is private or public. Employee remuneration is derived from
a fixed multiple of average monthly salary of an employee in the Slovak economy determined by the Statistical
Office of the Slovak Republic for calendar year two years prior to the calendar year when the basic salary
component is calculated – so-called automatic salary increase mechanism.107 Specific multiple of the average
salary differs for various categories of employees.
This system has several possible drawbacks:
Salaries represent almost 60% of operational expenses of hospitals. Besides automatic salary increase
mechanism, salary increase in hospitals is influenced by collective agreements. Hospitals should be able to
negotiate with health insurance companies to reimburse at least the increase of payments due to legal growth
of personnel expenses (automatic salary increase and social packages). If this does not happen, their
operating income gets worse. Legislation determines the increase of expenses for hospitals, however, it
leaves the discussion about revenues to health insurance companies and prospective budgets open.
OECD (2017c) recommends in its overview of Slovak healthcare system that physicians’ salaries should not
be bound to average salary in the country. Cancelling automatic salary increase mechanism and changing
to a new system with a bigger emphasis on remuneration for procedures and their quality could bring more
value for money (higher quality while maintaining the overall salary expenses).
An alternative to the current situation is to keep the increase of total salary package bound to average
salary, but to let hospitals decide how to distribute the resources among employees, which will allow
them to reward performance and quality.
Measure: Re-evaluate the conditions of automatic salary increase mechanism.
107 Law No. 578/2004 Coll. on Healthcare Providers.
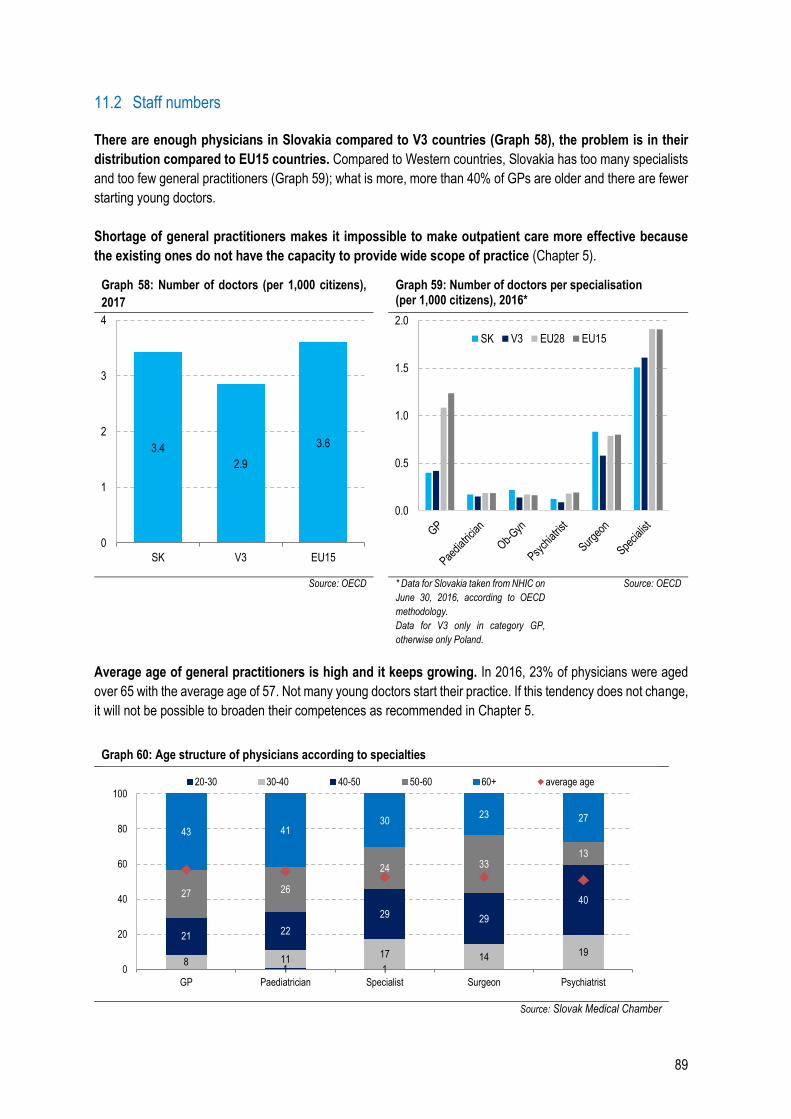
89
11.2 Staff numbers
There are enough physicians in Slovakia compared to V3 countries (Graph 58), the problem is in their
distribution compared to EU15 countries. Compared to Western countries, Slovakia has too many specialists
and too few general practitioners (Graph 59); what is more, more than 40% of GPs are older and there are fewer
starting young doctors.
Shortage of general practitioners makes it impossible to make outpatient care more effective because
the existing ones do not have the capacity to provide wide scope of practice (Chapter 5).
Graph 58: Number of doctors (per 1,000 citizens),
2017
Graph 59: Number of doctors per specialisation (per 1,000 citizens), 2016*
Source: OECD * Data for Slovakia taken from NHIC on
June 30, 2016, according to OECD
methodology.
Data for V3 only in category GP,
otherwise only Poland.
Source: OECD
Average age of general practitioners is high and it keeps growing. In 2016, 23% of physicians were aged
over 65 with the average age of 57. Not many young doctors start their practice. If this tendency does not change,
it will not be possible to broaden their competences as recommended in Chapter 5.
Graph 60: Age structure of physicians according to specialties
Source: Slovak Medical Chamber
3.4
2.9
3.6
0
1
2
3
4
SK V3 EU15
0.0
0.5
1.0
1.5
2.0
SK V3 EU28 EU15
1 18 11
17 14 19
2122
29 29
4027 26
24 3313
43 4130
23 27
0
20
40
60
80
100
GP Paediatrician Specialist Surgeon Psychiatrist
20-30 30-40 40-50 50-60 60+ average age
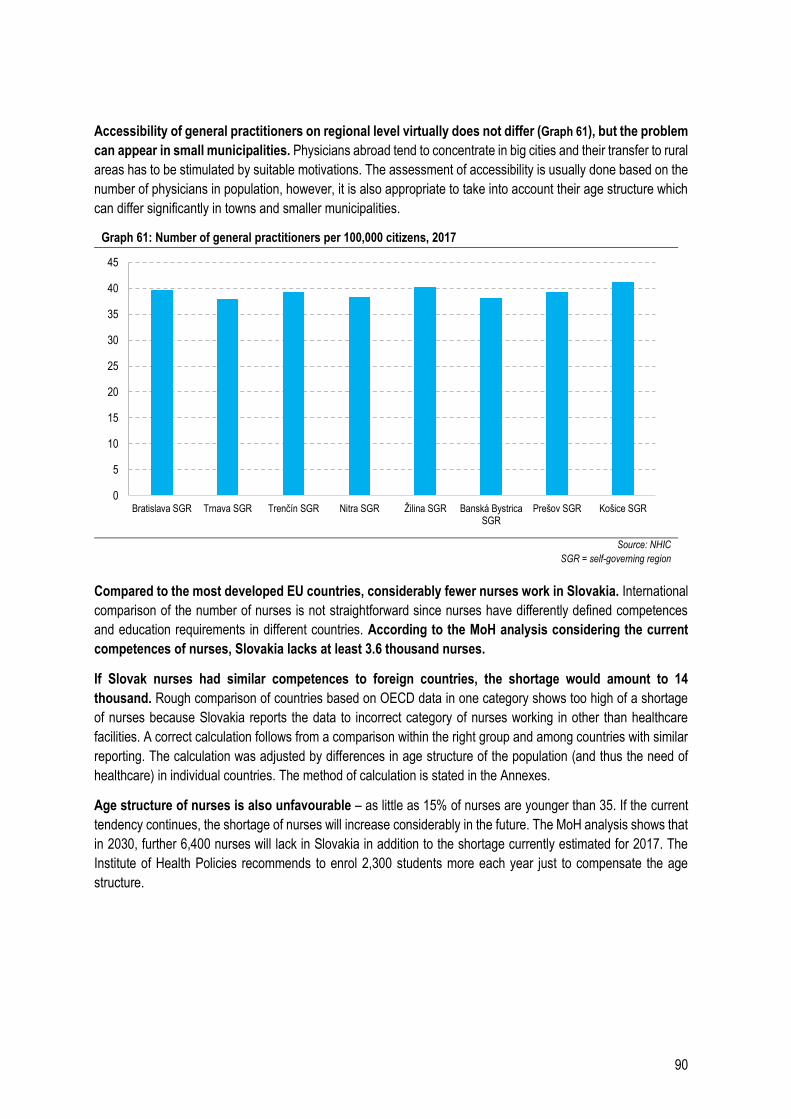
90
Accessibility of general practitioners on regional level virtually does not differ (Graph 61), but the problem
can appear in small municipalities. Physicians abroad tend to concentrate in big cities and their transfer to rural
areas has to be stimulated by suitable motivations. The assessment of accessibility is usually done based on the
number of physicians in population, however, it is also appropriate to take into account their age structure which
can differ significantly in towns and smaller municipalities.
Graph 61: Number of general practitioners per 100,000 citizens, 2017
Source: NHIC
SGR = self-governing region
Compared to the most developed EU countries, considerably fewer nurses work in Slovakia. International
comparison of the number of nurses is not straightforward since nurses have differently defined competences
and education requirements in different countries. According to the MoH analysis considering the current
competences of nurses, Slovakia lacks at least 3.6 thousand nurses.
If Slovak nurses had similar competences to foreign countries, the shortage would amount to 14
thousand. Rough comparison of countries based on OECD data in one category shows too high of a shortage
of nurses because Slovakia reports the data to incorrect category of nurses working in other than healthcare
facilities. A correct calculation follows from a comparison within the right group and among countries with similar
reporting. The calculation was adjusted by differences in age structure of the population (and thus the need of
healthcare) in individual countries. The method of calculation is stated in the Annexes.
Age structure of nurses is also unfavourable – as little as 15% of nurses are younger than 35. If the current
tendency continues, the shortage of nurses will increase considerably in the future. The MoH analysis shows that
in 2030, further 6,400 nurses will lack in Slovakia in addition to the shortage currently estimated for 2017. The
Institute of Health Policies recommends to enrol 2,300 students more each year just to compensate the age
structure.
0
5
10
15
20
25
30
35
40
45
Bratislava SGR Trnava SGR Trenčín SGR Nitra SGR Žilina SGR Banská BystricaSGR
Prešov SGR Košice SGR
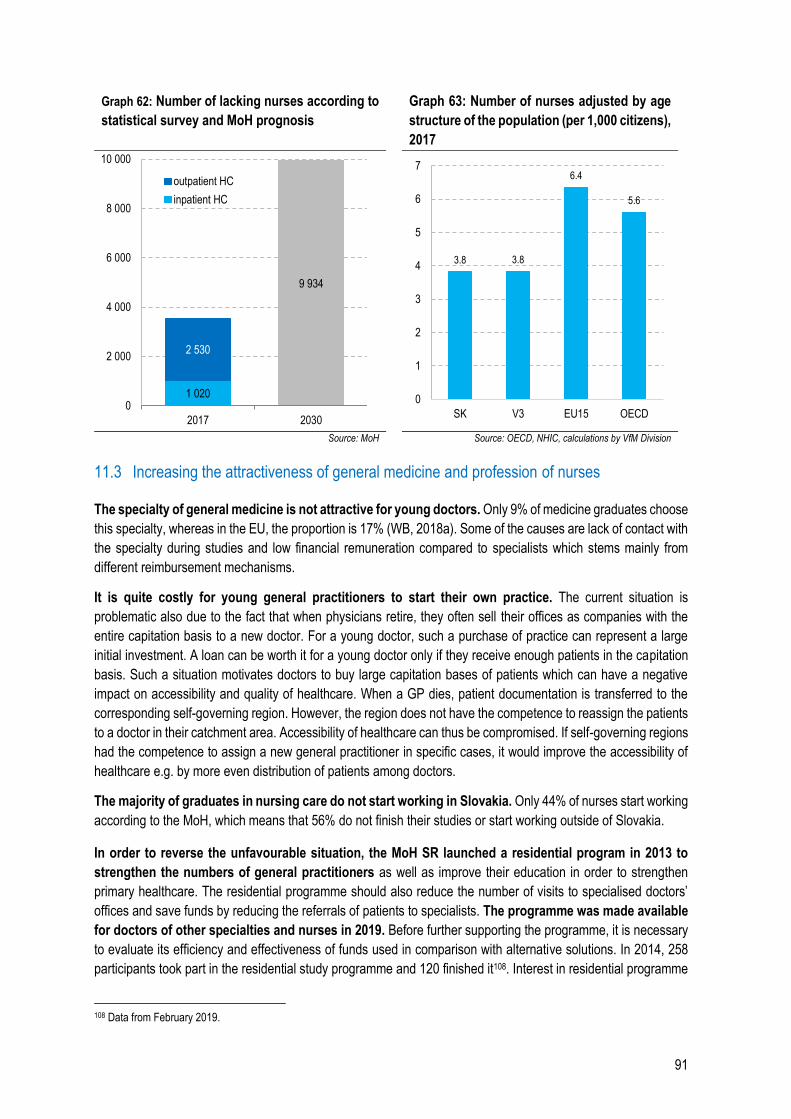
91
Graph 62: Number of lacking nurses according to
statistical survey and MoH prognosis
Graph 63: Number of nurses adjusted by age
structure of the population (per 1,000 citizens),
2017
Source: MoH Source: OECD, NHIC, calculations by VfM Division
11.3 Increasing the attractiveness of general medicine and profession of nurses
The specialty of general medicine is not attractive for young doctors. Only 9% of medicine graduates choose
this specialty, whereas in the EU, the proportion is 17% (WB, 2018a). Some of the causes are lack of contact with
the specialty during studies and low financial remuneration compared to specialists which stems mainly from
different reimbursement mechanisms.
It is quite costly for young general practitioners to start their own practice. The current situation is
problematic also due to the fact that when physicians retire, they often sell their offices as companies with the
entire capitation basis to a new doctor. For a young doctor, such a purchase of practice can represent a large
initial investment. A loan can be worth it for a young doctor only if they receive enough patients in the capitation
basis. Such a situation motivates doctors to buy large capitation bases of patients which can have a negative
impact on accessibility and quality of healthcare. When a GP dies, patient documentation is transferred to the
corresponding self-governing region. However, the region does not have the competence to reassign the patients
to a doctor in their catchment area. Accessibility of healthcare can thus be compromised. If self-governing regions
had the competence to assign a new general practitioner in specific cases, it would improve the accessibility of
healthcare e.g. by more even distribution of patients among doctors.
The majority of graduates in nursing care do not start working in Slovakia. Only 44% of nurses start working
according to the MoH, which means that 56% do not finish their studies or start working outside of Slovakia.
In order to reverse the unfavourable situation, the MoH SR launched a residential program in 2013 to
strengthen the numbers of general practitioners as well as improve their education in order to strengthen
primary healthcare. The residential programme should also reduce the number of visits to specialised doctors’
offices and save funds by reducing the referrals of patients to specialists. The programme was made available
for doctors of other specialties and nurses in 2019. Before further supporting the programme, it is necessary
to evaluate its efficiency and effectiveness of funds used in comparison with alternative solutions. In 2014, 258
participants took part in the residential study programme and 120 finished it108. Interest in residential programme
108 Data from February 2019.
1 020
9 934
2 530
0
2 000
4 000
6 000
8 000
10 000
2017 2030
outpatient HC
inpatient HC
3.8 3.8
6.4
5.6
0
1
2
3
4
5
6
7
SK V3 EU15 OECD
92
for paediatricians has been declining since the first year when 30 students applied. In 2018, only 7 applied. The
residential programme has strengthened the staff capacities of doctors in Slovakia only minimally in the 3 years
of its existence. The MoH SR estimates that approximately 1,500 physicians are still lacking.
The MoH SR suggested financial incentives for nurses in 2018 with the estimate that at least 188 more nurses
will start studying each year while the total number of student places will remain unchanged. A stabilisation
contribution would be reimbursed by the Slovak Education Support Fund (FNPV). The contribution was
determined as 2,000 euros per school year.
The shortage of general practitioners and nurses in offices can be partially solved by connecting offices
in more integrated health centres (Slovak – “policlinics”), which can simplify and coordinate patient treatment
(WB, 2018b). Although policlinics currently group general practitioners and specialists, they de facto work as
independent units. More integrated health centres can distribute tasks among doctors, distribute workload and
provide benefits thanks to their scale – for example, such a health centre can afford to buy a more expensive
machine. At the moment, almost each general practitioner works with one nurse. Integrated clinics can create
conditions in which one nurse can assist several doctors. Part of this adjustment could be the transfer of a portion
of nurses’ administrative duties to non-medical administrative staff (Chapter 11.4). This kind of system functions
for example in the United Kingdom.109
Measures: Increase in the number of nurses by the current shortage (3,600) in the next 10 years represents
an increase in expenses connected to salaries of 107 million euros per year, of which 10.7 million euros in the first year.
Include general medicine in the study of other selected medical specialties and in master’s degree
and strengthen the practice.
Support the creation of integrated health centres where doctors can join their capitation bases.
Adjust salary regulation of staff in inpatient care while keeping the redistribution of staff resources
up to hospitals.
11.4 Competences, staff mix
Transfer of competences to lower levels of healthcare staff helps better use resources and improve
healthcare. Several Western countries have transferred part of specialist duties to general practitioners, from
physicians to nurses, from gynaecologists to midwives and from nurses to nursing aides and orderlies. Such
policy measures increased the accessibility of healthcare, shortened waiting periods and improved the
satisfaction of patients all while having a positive or neutral impact on the expenses (OECD, 2017d).
Broadening of general practitioners’ competences was determined by the Ministry of Health to be one of
the key measures in primary care within the Strategic Healthcare Framework for 2014 – 2030, however,
the process stopped after 2015.
General practitioners could take over a part of specialist tasks in many other areas. These include more
complex examinations and treatment of diabetics, patients with thyroid diseases or ear infections. These
procedures currently cost over 9.7 million euros in specialist offices (calculation in the Annexes).
One serious problem that hinders the broadening of general practitioners’ competences is their shortage
(Chapter 11.4). Moreover, they also lack equipment to perform these broader competences. According to
109https://assets.publishing.service.gov.uk/government/uploads/system/uploads/attachment_data/file/507493/CfWI_GP_in-depth_review.pdf
93
World Bank, many doctors do not possess an ECG, respiratory monitor for asthma or equipment to perform small
surgical procedures. Because of these factors, patients with many acute or chronic diseases get referred to a
specialist.
What is more, general practitioners are not educated enough to perform broader competences. When the
residential programme was launched in 2013, new curriculum for general practitioners was introduced, stating
many skills a physician could use to perform broader competences. However, the World Bank has evaluated that
they are more focused on training of general practitioners working in hospitals and do not reflect the needs and
context of GPs working in independent outpatient offices. Yet, the majority of general practitioners work in an
independent office in a community. Furthermore, new curriculum was only introduced when the so-called
residential programme was launched, which is why it had not covered older physicians, who form the majority of
general practitioners. World Bank also states that the broadening of competences in 2014/2015 did not succeed
because particularly older general practitioners felt insecure about the new examinations.
The problem with low numbers of general practitioners can be resolved also by partial transfer of
competences to nurses. At the moment, nurses in Slovakia work as a physician’s assistant, while in Western
countries, they run community clinics on their own and provide preventive care and management of chronic
diseases. Slovakia is also one of the few European countries without a specialty of nurse in primary care or in
community (WB, 2018b). Before broadening competences, the number of nurses must be increased
(Chapter 11.2). Another option is to transfer the current competences and workload of nurses to non-medical
staff. As was already mentioned, nurses in general practitioners’ offices spend a lot of their time by administrative
tasks. Part of these activities could be transferred to administrative employees.
Measures:
Provide material and technical equipment by the state (direct purchase, grant, advantageous loan) Provide training and necessary practice in new competences for older physicians or regular tests
for everyone Re-evaluate staff mix, transfer competences from doctors to nurses and from nurses to
administrative staff
11.5 Remuneration mechanisms
The current situation regarding the majority of remuneration mechanisms of general practitioners does
not motivate them to perform new competences. General practitioners are paid per capitation, which does not
motivate them to provide care to more complex patients. On the other hand, specialists are paid per procedure
and are motivated to perform an excessive number of procedures.
World Bank (WB, 2018b) offers solutions to readjust the system more appropriately:
Doctors with more patients with chronic diseases or patients coming from disadvantaged groups in their
capitation basis should be remunerated more when providing complex care.
The portion of variable capitation in their revenue should be increased. However, at the moment, the
majority of payments (fixed capitation) only reflects the age distribution of registered patients.
The current system of fee-for-service can also promote an excessive volume of procedures performed
by specialists who can be motivated not to refer their patient back to their GP for a procedure. More in the
Annexe about remuneration mechanisms. At the same time, the transfer of competences in case of procedures
can face a backlash from specialists because they bring in large revenues.
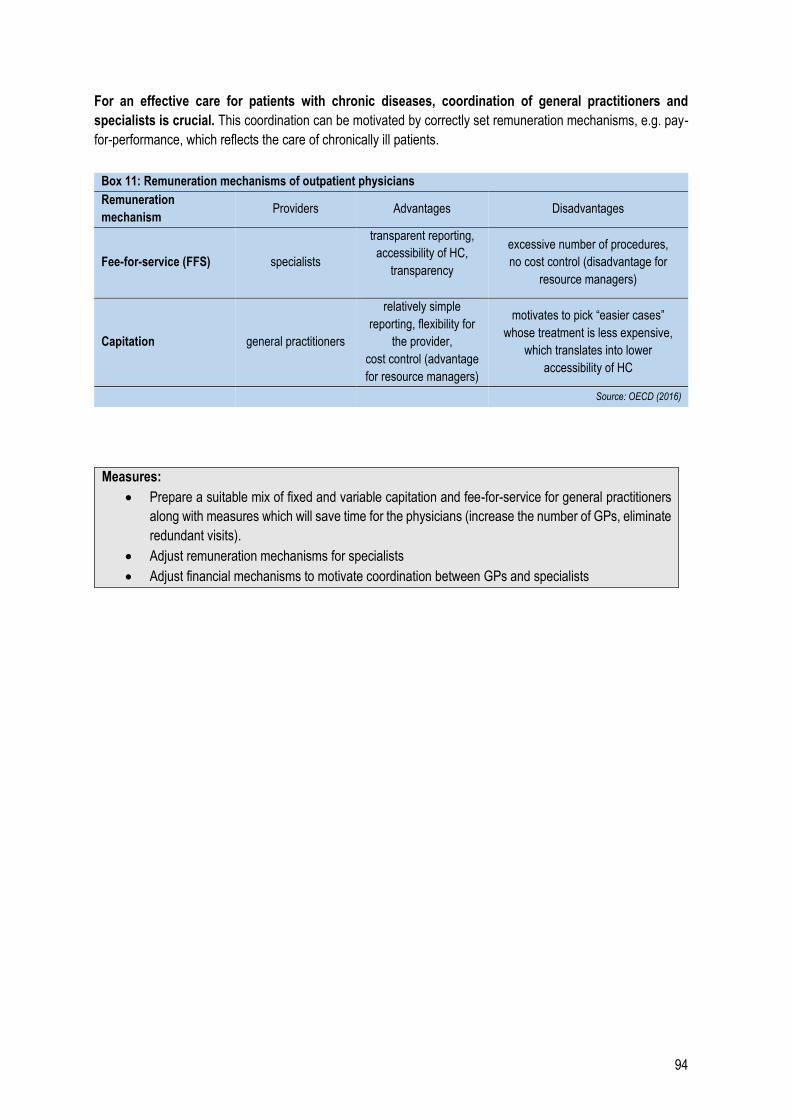
94
For an effective care for patients with chronic diseases, coordination of general practitioners and
specialists is crucial. This coordination can be motivated by correctly set remuneration mechanisms, e.g. pay-
for-performance, which reflects the care of chronically ill patients.
Measures:
Prepare a suitable mix of fixed and variable capitation and fee-for-service for general practitioners
along with measures which will save time for the physicians (increase the number of GPs, eliminate
redundant visits).
Adjust remuneration mechanisms for specialists
Adjust financial mechanisms to motivate coordination between GPs and specialists
Box 11: Remuneration mechanisms of outpatient physicians
Remuneration
mechanism Providers Advantages Disadvantages
Fee-for-service (FFS) specialists
transparent reporting,
accessibility of HC,
transparency
excessive number of procedures,
no cost control (disadvantage for
resource managers)
Capitation general practitioners
relatively simple
reporting, flexibility for
the provider,
cost control (advantage
for resource managers)
motivates to pick “easier cases”
whose treatment is less expensive,
which translates into lower
accessibility of HC
Source: OECD (2016)
95
12 Standard diagnostic and treatment procedures
Standard diagnostic and treatment procedures are one of the most effective tools in order to achieve
high-quality and cost-effective healthcare. General guidelines for evidence-based diagnostic and therapeutic
procedures and best practice are issued by WHO and many countries subsequently implement their own, more
detailed guidelines, such as the National Institute for Health and Care Excellence in the UK. According to WHO
(2007), quality standard guidelines have many advantages for HC providers, healthcare institutions and patients:
They increase safety and quality of treatment because clear guidelines for up-to-date procedures help healthcare staff avoid mistakes and prevent arbitrary choices of inappropriate and obsolete procedures.
They help keep expenses in check. WHO recommends using cost-effectiveness as one of the criteria for creation of procedures. When the procedures are followed, they help prevent waste of resources (e.g. excessive MRI examinations or simple examinations performed by a doctor instead of a nurse).
They promote efficient investments (e.g. in psychotherapy, which is the main type of treatment for mild depression).
They provide the basis for evaluation of correctness of procedures by regulators, health insurance companies and patients.
They improve the accessibility of quality HC by unifying the level of HC per various providers and in different regions.
They help improve resource planning, for example necessary pharmaceuticals, material, staff and premises according to the procedures.
Standard procedures were created slowly in Slovakia and their use was not stipulated by the law. After a
change of Law No. 576/2004 Coll. (from January 2018), healthcare is provided correctly if it is provided according
to standard procedures. The process of establishment of standards was launched in 2017 and procedures for 31
areas came into effect in 2019. Further 150 areas are planned110.
12.1 Case study – Procedures in mother and child care
The consequences of lack of standards and not taking into account up-to-date procedures are well illustrated by mother and child care during pregnancy, childbirth and after childbirth.
Poor outcomes of mother and child care in Slovakia are reflected in infant mortality which is one third higher than the average in V3 countries (Graph 64). High infant mortality rate in Slovak marginalised Romany communities accounts for a significant part of this difference, however, even in the rest of the Slovak population, there are still more infant deaths than in the neighbouring countries (Graf 65). Poor health outcomes in marginalised Romany communities are analysed in Spending Review regarding groups at risk of poverty111.
110 https://www.health.gov.sk/Clanok?standardne-diagnosticke-postupy 111 https://www.finance.gov.sk/sk/media/tlacove-spravy/uhp-revizia-vydavkov-skupiny-ohrozene-chudobou.html
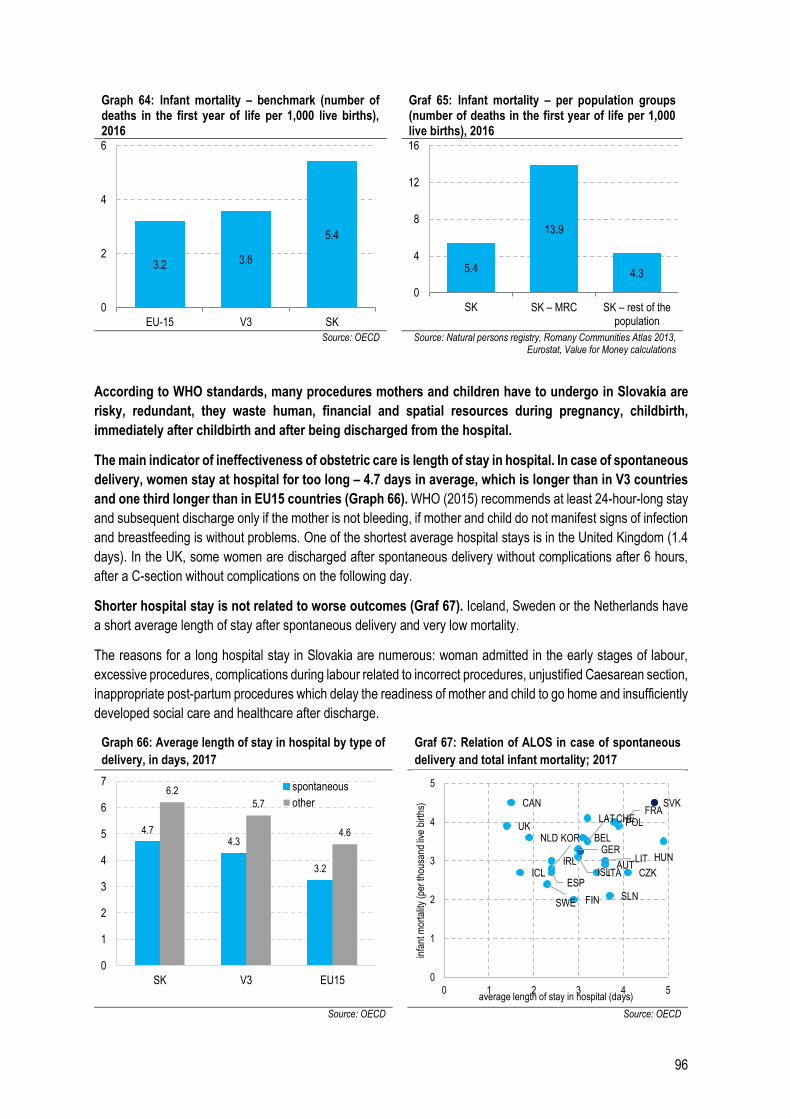
96
Graph 64: Infant mortality – benchmark (number of deaths in the first year of life per 1,000 live births), 2016
Graf 65: Infant mortality – per population groups (number of deaths in the first year of life per 1,000 live births), 2016
Source: OECD Source: Natural persons registry, Romany Communities Atlas 2013,
Eurostat, Value for Money calculations
According to WHO standards, many procedures mothers and children have to undergo in Slovakia are
risky, redundant, they waste human, financial and spatial resources during pregnancy, childbirth,
immediately after childbirth and after being discharged from the hospital.
The main indicator of ineffectiveness of obstetric care is length of stay in hospital. In case of spontaneous
delivery, women stay at hospital for too long – 4.7 days in average, which is longer than in V3 countries
and one third longer than in EU15 countries (Graph 66). WHO (2015) recommends at least 24-hour-long stay
and subsequent discharge only if the mother is not bleeding, if mother and child do not manifest signs of infection
and breastfeeding is without problems. One of the shortest average hospital stays is in the United Kingdom (1.4
days). In the UK, some women are discharged after spontaneous delivery without complications after 6 hours,
after a C-section without complications on the following day.
Shorter hospital stay is not related to worse outcomes (Graf 67). Iceland, Sweden or the Netherlands have
a short average length of stay after spontaneous delivery and very low mortality.
The reasons for a long hospital stay in Slovakia are numerous: woman admitted in the early stages of labour,
excessive procedures, complications during labour related to incorrect procedures, unjustified Caesarean section,
inappropriate post-partum procedures which delay the readiness of mother and child to go home and insufficiently
developed social care and healthcare after discharge.
Graph 66: Average length of stay in hospital by type of
delivery, in days, 2017 Graf 67: Relation of ALOS in case of spontaneous
delivery and total infant mortality; 2017
Source: OECD Source: OECD
3.2 3.6
5.4
0
2
4
6
EU-15 V3 SK
5.4
13.9
4.3
0
4
8
12
16
SK SK – MRC SK – rest of the population
4.74.3
3.2
6.2
5.7
4.6
0
1
2
3
4
5
6
7
SK V3 EU15
spontaneous
other
AUT
BEL
CAN
CZK
FIN
FRA
GERHUN
ICLIRL
ISLITA
KOR
LAT
LIT
NLD
POL
SVK
SLN
ESP
SWE
CHEUK
0
1
2
3
4
5
0 1 2 3 4 5
infa
nt m
orta
lity
(per
thou
sand
live
birt
hs)
average length of stay in hospital (days)
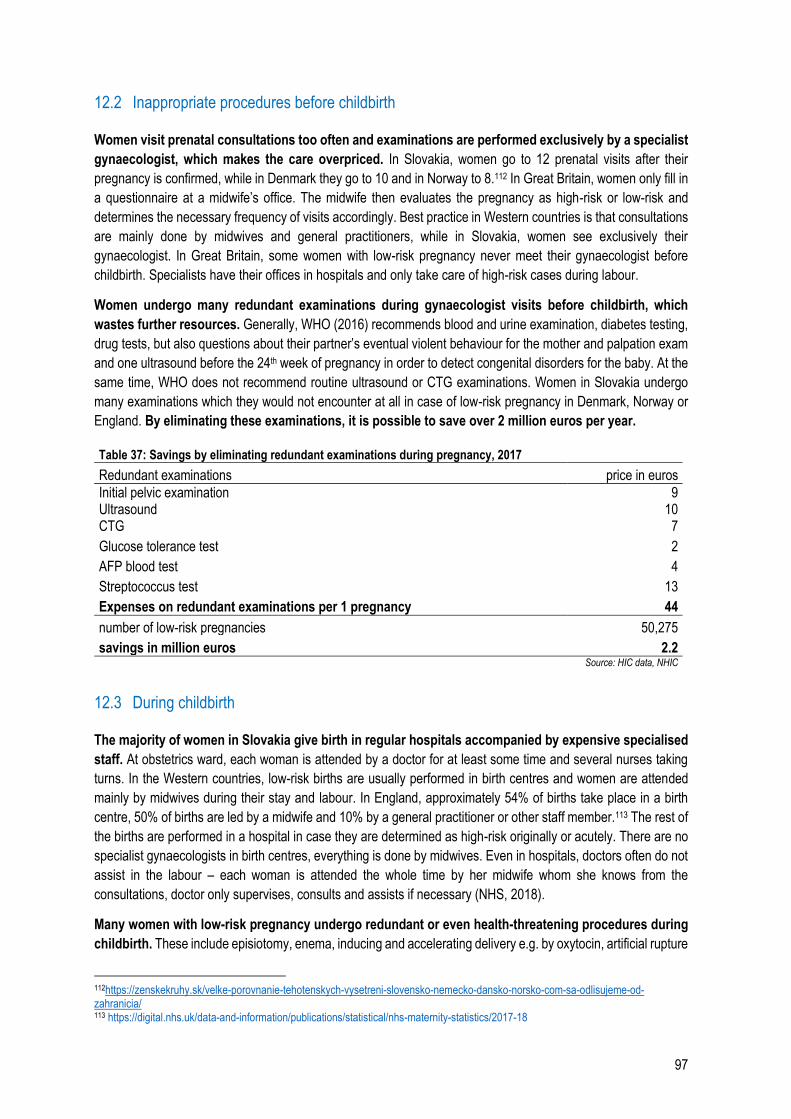
97
12.2 Inappropriate procedures before childbirth
Women visit prenatal consultations too often and examinations are performed exclusively by a specialist
gynaecologist, which makes the care overpriced. In Slovakia, women go to 12 prenatal visits after their
pregnancy is confirmed, while in Denmark they go to 10 and in Norway to 8.112 In Great Britain, women only fill in
a questionnaire at a midwife’s office. The midwife then evaluates the pregnancy as high-risk or low-risk and
determines the necessary frequency of visits accordingly. Best practice in Western countries is that consultations
are mainly done by midwives and general practitioners, while in Slovakia, women see exclusively their
gynaecologist. In Great Britain, some women with low-risk pregnancy never meet their gynaecologist before
childbirth. Specialists have their offices in hospitals and only take care of high-risk cases during labour.
Women undergo many redundant examinations during gynaecologist visits before childbirth, which
wastes further resources. Generally, WHO (2016) recommends blood and urine examination, diabetes testing,
drug tests, but also questions about their partner’s eventual violent behaviour for the mother and palpation exam
and one ultrasound before the 24th week of pregnancy in order to detect congenital disorders for the baby. At the
same time, WHO does not recommend routine ultrasound or CTG examinations. Women in Slovakia undergo
many examinations which they would not encounter at all in case of low-risk pregnancy in Denmark, Norway or
England. By eliminating these examinations, it is possible to save over 2 million euros per year.
Table 37: Savings by eliminating redundant examinations during pregnancy, 2017
Redundant examinations price in euros
Initial pelvic examination 9 Ultrasound 10 CTG 7
Glucose tolerance test 2
AFP blood test 4
Streptococcus test 13
Expenses on redundant examinations per 1 pregnancy 44
number of low-risk pregnancies 50,275
savings in million euros 2.2 Source: HIC data, NHIC
12.3 During childbirth
The majority of women in Slovakia give birth in regular hospitals accompanied by expensive specialised
staff. At obstetrics ward, each woman is attended by a doctor for at least some time and several nurses taking
turns. In the Western countries, low-risk births are usually performed in birth centres and women are attended
mainly by midwives during their stay and labour. In England, approximately 54% of births take place in a birth
centre, 50% of births are led by a midwife and 10% by a general practitioner or other staff member.113 The rest of
the births are performed in a hospital in case they are determined as high-risk originally or acutely. There are no
specialist gynaecologists in birth centres, everything is done by midwives. Even in hospitals, doctors often do not
assist in the labour – each woman is attended the whole time by her midwife whom she knows from the
consultations, doctor only supervises, consults and assists if necessary (NHS, 2018).
Many women with low-risk pregnancy undergo redundant or even health-threatening procedures during
childbirth. These include episiotomy, enema, inducing and accelerating delivery e.g. by oxytocin, artificial rupture
112https://zenskekruhy.sk/velke-porovnanie-tehotenskych-vysetreni-slovensko-nemecko-dansko-norsko-com-sa-odlisujeme-od-zahranicia/ 113 https://digital.nhs.uk/data-and-information/publications/statistical/nhs-maternity-statistics/2017-18
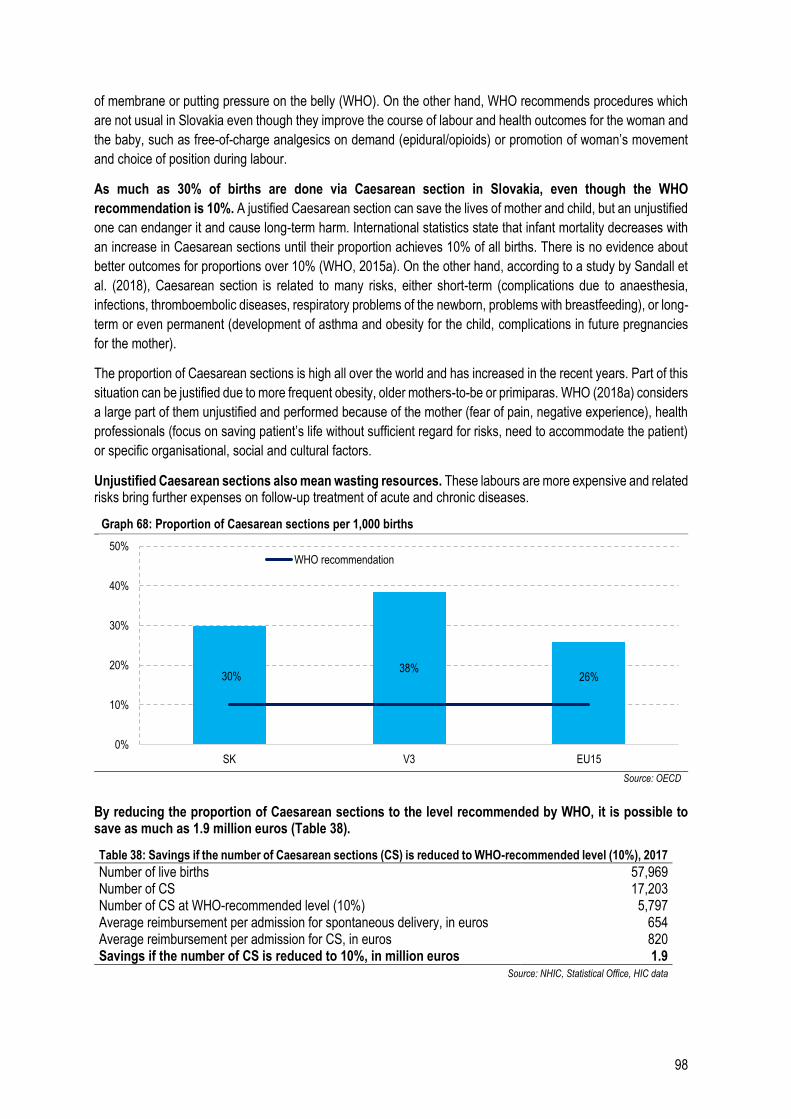
98
of membrane or putting pressure on the belly (WHO). On the other hand, WHO recommends procedures which
are not usual in Slovakia even though they improve the course of labour and health outcomes for the woman and
the baby, such as free-of-charge analgesics on demand (epidural/opioids) or promotion of woman’s movement
and choice of position during labour.
As much as 30% of births are done via Caesarean section in Slovakia, even though the WHO
recommendation is 10%. A justified Caesarean section can save the lives of mother and child, but an unjustified
one can endanger it and cause long-term harm. International statistics state that infant mortality decreases with
an increase in Caesarean sections until their proportion achieves 10% of all births. There is no evidence about
better outcomes for proportions over 10% (WHO, 2015a). On the other hand, according to a study by Sandall et
al. (2018), Caesarean section is related to many risks, either short-term (complications due to anaesthesia,
infections, thromboembolic diseases, respiratory problems of the newborn, problems with breastfeeding), or long-
term or even permanent (development of asthma and obesity for the child, complications in future pregnancies
for the mother).
The proportion of Caesarean sections is high all over the world and has increased in the recent years. Part of this
situation can be justified due to more frequent obesity, older mothers-to-be or primiparas. WHO (2018a) considers
a large part of them unjustified and performed because of the mother (fear of pain, negative experience), health
professionals (focus on saving patient’s life without sufficient regard for risks, need to accommodate the patient)
or specific organisational, social and cultural factors.
Unjustified Caesarean sections also mean wasting resources. These labours are more expensive and related risks bring further expenses on follow-up treatment of acute and chronic diseases.
Graph 68: Proportion of Caesarean sections per 1,000 births
Source: OECD
By reducing the proportion of Caesarean sections to the level recommended by WHO, it is possible to save as much as 1.9 million euros (Table 38).
Table 38: Savings if the number of Caesarean sections (CS) is reduced to WHO-recommended level (10%), 2017
Number of live births 57,969 Number of CS 17,203 Number of CS at WHO-recommended level (10%) 5,797 Average reimbursement per admission for spontaneous delivery, in euros 654 Average reimbursement per admission for CS, in euros 820 Savings if the number of CS is reduced to 10%, in million euros 1.9
Source: NHIC, Statistical Office, HIC data
30%38%
26%
0%
10%
20%
30%
40%
50%
SK V3 EU15
WHO recommendation
99
12.4 After childbirth
Up-to-date procedures in post-partum mother and child care have been introduced into the standards
only this year. Their lack up to now has been connected to health risks and waste of resources. One of
the main WHO recommendations (2018b) to promote health is the promotion of skin-to-skin contact of mother
and baby immediately after birth, at least within the first hour. If this contact is refused, it can delay the start of
breastfeeding, it worsens the baby’s thermoregulation and is related to a risk of more difficult bonding of mother
and child. This is why it is recommended to bathe the baby ideally not sooner than 6 hours after birth, best not
sooner than in 24 hours. Promotion of breastfeeding reduces the risk of mortality and morbidity, improves health
outcomes in this period and reduces the probability of the mother getting pregnant again too soon.
WHO recommends to keep the baby in the same room as the mother for at least the first 24 hours. In the UK,
they are together the whole time and the woman can have a close person with her to help her and the staff with
basic activities, such as bathing and weighing. The mother can create a bond with her child this way, she learns
how to care about the baby and reduces the workload of the staff by taking care of some of the procedures.
After discharge from hospital, Slovak mothers lack sufficient medical and social support in their community. WHO (2013) recommends checking the mother’s health condition, breastfeeding and healing of wounds, emotional status including symptoms of post-partum depression, atmosphere in the family, signs of domestic violence as well as problems with restarting painless sexual intercourse. In Great Britain, women after a short stay at hospital or birth centre are often visited at home in the first week by a midwife. Community centres and general practitioners are also available.
Measure – SDTP:
Prepare and approve standard diagnostic and treatment procedures. Measures – Pregnancy and childbirth:
Implement SDTP for pregnancy and childbirth
Eliminate redundant examinations during pregnancy
Monitor the observance of SDTP and update existing SDTP for post-partum care
Transfer competences from gynaecologists to midwives or general practitioners
Establish baby-friendly birth centres outside of regular hospitals
Demotivate Caesarean sections – educate women about the risks, implement the obligation to consult the risks with two physicians, unify reimbursements for physiologic childbirth and Caesarean section
Adjust procedures in order to accelerate discharge from hospitals, including engaging the mother and close people in the care of the newborn
Create capacities for home and community care after discharge
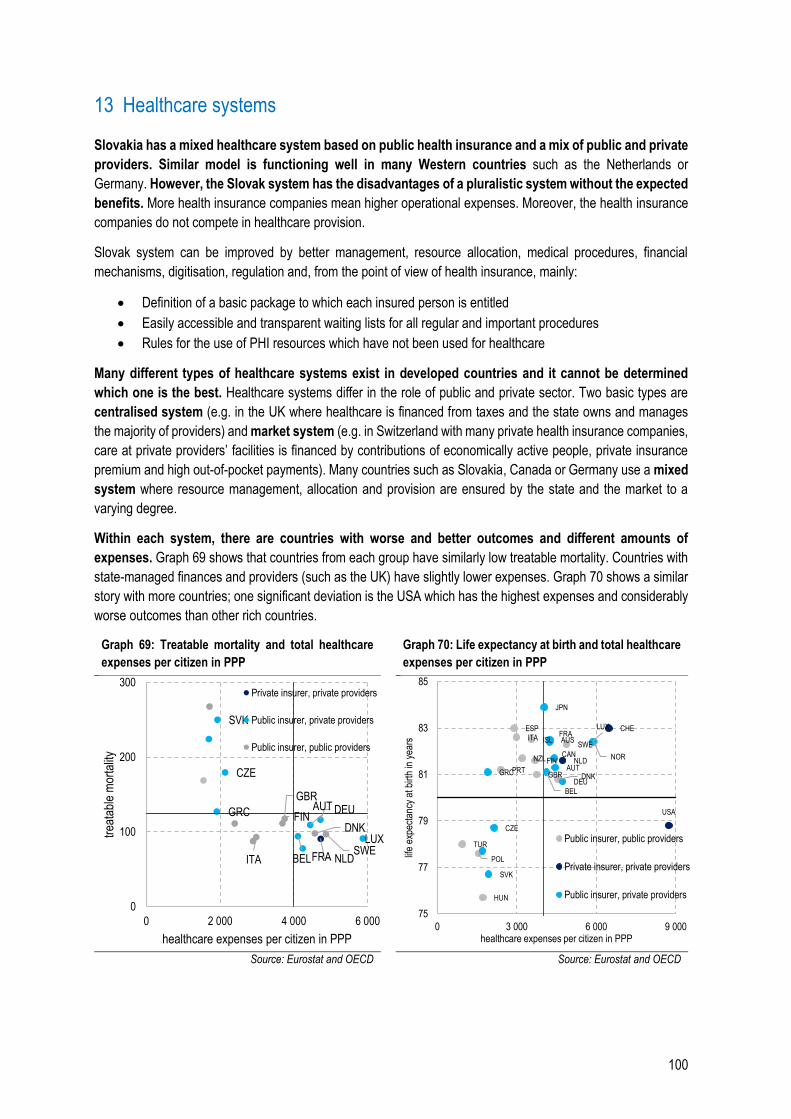
100
13 Healthcare systems
Slovakia has a mixed healthcare system based on public health insurance and a mix of public and private
providers. Similar model is functioning well in many Western countries such as the Netherlands or
Germany. However, the Slovak system has the disadvantages of a pluralistic system without the expected
benefits. More health insurance companies mean higher operational expenses. Moreover, the health insurance
companies do not compete in healthcare provision.
Slovak system can be improved by better management, resource allocation, medical procedures, financial
mechanisms, digitisation, regulation and, from the point of view of health insurance, mainly:
Definition of a basic package to which each insured person is entitled
Easily accessible and transparent waiting lists for all regular and important procedures
Rules for the use of PHI resources which have not been used for healthcare
Many different types of healthcare systems exist in developed countries and it cannot be determined
which one is the best. Healthcare systems differ in the role of public and private sector. Two basic types are
centralised system (e.g. in the UK where healthcare is financed from taxes and the state owns and manages
the majority of providers) and market system (e.g. in Switzerland with many private health insurance companies,
care at private providers’ facilities is financed by contributions of economically active people, private insurance
premium and high out-of-pocket payments). Many countries such as Slovakia, Canada or Germany use a mixed
system where resource management, allocation and provision are ensured by the state and the market to a
varying degree.
Within each system, there are countries with worse and better outcomes and different amounts of
expenses. Graph 69 shows that countries from each group have similarly low treatable mortality. Countries with
state-managed finances and providers (such as the UK) have slightly lower expenses. Graph 70 shows a similar
story with more countries; one significant deviation is the USA which has the highest expenses and considerably
worse outcomes than other rich countries.
Graph 69: Treatable mortality and total healthcare
expenses per citizen in PPP
Graph 70: Life expectancy at birth and total healthcare
expenses per citizen in PPP
Source: Eurostat and OECD Source: Eurostat and OECD
NLD
AUT
BEL
CZE
FRA
DEUGRC
LUX
SVK
DNKFIN
ITASWE
GBR
0
100
200
300
0 2 000 4 000 6 000
trea
tabl
e m
orta
lity
healthcare expenses per citizen in PPP
Private insurer, private providers
Public insurer, private providers
Public insurer, public providers
DNK
FIN
HUN
ISLITA
NZL NOR
POL
PRT
ESP
SWE
TUR
GBR
NLD
CHE
USA
AUS
AUT
BEL
CAN
CZE
FRA
DEUGRC
JPN
LUX
SVK
75
77
79
81
83
85
0 3 000 6 000 9 000
life
expe
ctan
cy a
t birt
h in
yea
rs
healthcare expenses per citizen in PPP
Public insurer, public providers
Private insurer, private providers
Public insurer, private providers
101
13.1 Resources in healthcare
In the majority of countries, the major part of healthcare resources comes from taxes or contributions of
economically active people (public health insurance). It is not possible to say which system brings better
health outcomes. Taxes are typically the resource in centralised systems and contributions of economically
active people in market systems with public health insurance. Differences in treatable mortality tend to follow the
volume of healthcare expenses; at the same time, countries with a tax system spend less money while maintaining
a comparable quality. Other resources are private health insurance and OOP (Chapter Chyba! Nenašiel sa
žiaden zdroj odkazov.).
Funding from taxes and contributions of the EAP is similar if the contributions are obligatory and
everyone is entitled to healthcare, as is the case in Slovakia. In this case, taxes and contributions are
used to create a system of solidarity. All working people are obliged to pay contributions or taxes from their
revenue which are added to the common resource package. This package then pays the care for all people, not
only those who have contributed actively. The contributions of the EAP are, like taxes, de facto public resources
and are a protective tool for everyone, particularly the vulnerable people, from high treatment expenses.
In many countries with public health insurance system like Slovakia, part of the health sector is co-funded
by taxes because the contributions of the EAP do not cover all expenses. In Slovakia, this includes state
payments for economically inactive citizens114. However, again, the resources for these payments come mainly
from economically active citizens and richer people who fund the healthcare for economically inactive people and
those prone to illness. An efficient “state payment” is thus a legitimate part of a solidary system with the
same approach to healthcare for all citizens.
The advantages and disadvantages of various tax and contribution systems and an example of market-focused
system of funding in the Netherlands can be found in the Annexes.
13.1.1 Basic healthcare package
The scope of healthcare to which a citizen is entitled from the public health insurance is defined very
broadly in Slovakia. According to the Constitution, “the citizens shall have the right to free healthcare and
medical equipment for disabilities under the terms to be provided by law”115. Legislative amendments116 further
define the types of care, diagnoses and procedures which are or are not reimbursed. However, these definitions
are stated in different laws and are sometimes relatively broad, sometimes too complicated. When reimbursing
certain diagnoses, it is not clear which procedures should be reimbursed and which should not.
Many countries, mainly those with a public health insurance system similar to Slovakia, have a definition
of a so-called basic healthcare package which clearly states what the patients are entitled to. The basic
package is similar across countries and differs in some conditions, e.g. the extent of OOP of insured persons in
case of specific benefits. The size of the package changes in various intervals and should ideally be determined
based on priorities and evidence about healthcare needs (for example, in the Netherlands, the package is
determined by a state healthcare institute, Zorginstitut Nederland, based on expert assessments117).
The important thing for an insured person is not only that their entitlement is defined by the law, but also
how simply they can understand it. For example, in Switzerland, the package is modified by several legislative
standards. The Federal Office of Public Health publishes a brief summary for insured persons with clearly stated
114 In the recent years, they have been defined as a percentage of average salary from two years ago (Law No. 580/2004 Coll.). From 2020, the whole state contribution package will bridge the revenue gap between collected contributions and necessary expenses. 115 Constitution of the Slovak Republic, Article 40 116 Law No. 577/2004, Government regulation No. 777/2004 117 https://www.zorginstituutnederland.nl/over-ons/taken/adviseren-over-en-verduidelijken-van-het-basispakket-aan-zorg
102
benefits and their reimbursement. The state thus considerably facilitates healthcare expenses planning and
decision-making about voluntary health insurance.
The unclear definition of healthcare entitlement from PHI in Slovakia has consequences on the healthcare
system in several areas:
1. Voluntary (private) health insurance – it is difficult to create a voluntary health insurance product which
would clearly reimburse HC beyond the basic package. Voluntary health insurance is most often used when an
insured person evaluates the volume or extent of healthcare reimbursed from public resources as insufficient.
Voluntary health insurance is a product of health insurance market whose features are determined by a system
of compulsory health insurance. If, for example, the state clearly defines which procedures and services are
reimbursed from public resources to every insured person (i.e. defines the basic package), health insurance
companies can prepare various supplementary insurance products and offer them only to specific groups of
insured persons (PHI has to be offered to everyone).
2. Out-of-pocket payments – it is considerably more difficult to have an overview of OOP which are
authorised, physicians can more easily claim too high or illegal payments.
3. Competition among health insurance companies – health insurance companies in a pluralist system cannot
compete with each other regarding their offer beyond basic package (more in Chapter 13.1.1).
Measure: Define a basic package to which each insured person is entitled from the PHI and present it in an
approachable way by the Ministry of Health, HCSA and health insurance companies.
13.2 Resource management
Public resources, whether taxes or contributions of the EAP, are managed and reimbursed to healthcare
providers either by one administrator – the state or the state insurance company (unitary system), or by
several state and private insurance companies (pluralistic system). The advantage of centralised resource
management compared to a system with many health insurance companies (HIC) is mainly operational savings.
If the state buys healthcare from providers, it has leverage when concluding contracts and can ensure, for
example, lower prices of procedures. On the other hand, more health insurance companies can offer various
packages of supplementary services and benefits and have the motivation to strive for a higher quality of HC for
their insured persons.
13.2.1 Health insurance companies in Slovakia
In Slovakia, the system of resource management and healthcare procurement combines the drawbacks
of a pluralist and unitary system. Resources are managed by three health insurance companies, one run by
state and the other two owned by private stakeholders (hereinafter referred to as “private health insurance
companies/private HIC”). State health insurance company Všeobecná zdravotná poisťovňa (VšZP) takes care of
approximately 60% of insured persons, Dôvera of 30% and Union of 10%.
In spite of the pluralist nature of the system, the HIC currently do not compete in their offers – they offer
the same product, public health insurance (PHI), usually have contracts with the same providers, do not offer
information about the quality and prices of providers to the insured persons and do not differ significantly in their
extra healthcare packages. In the recent years, the most intense competition among health insurance companies
has been taking place particularly regarding additional benefits not related directly to quality or scope of healthcare
for insured persons (more in Annexes).
103
On the other hand, the system does not take advantage of its scope, i.e. operational savings usually
brought in by a unitary system. If all health insurance companies were merged into one, it would save 15 million
euros annually, considering current legal thresholds of operational expenses.118
Another inefficient aspect of the current system is found in unclear spending rules for healthcare
resources. Between 2011 and 2018, private HIC paid their stakeholders 440 million euros total, of which Dôvera
paid 408 million euros and Union 32 million euros. This represents 223 euros per insured person. This money
could be alternatively used for example to ensure better accessibility of healthcare.
The largest insurance company does not use its favourable negotiating position when concluding
contracts with providers. On the contrary, the data on reimbursements in hospitals show that smaller HIC more
often manage to negotiate lower prices for the same procedures (see Chapter 4.7).
Measure: Establish rules for the use of PHI resources which have not been used for healthcare.
13.2.2 Risk equalisation among HIC
In a pluralist system, health insurance companies get money from PHI based on the number of insured
persons and their contributions. However, there is a risk that more costly insured persons will not be
redistributed evenly among the HIC – e.g. all patients prone to illness might be insured in one health insurance
company and all healthy patients in another. Therefore, the costs of treatment of these patients will not correspond
to the revenues, which will create losses for one HIC, while the other will have extra money left. Due to this
inequality in revenues and expenses, HIC may strive to get healthy insured persons and put the costly ones at
disadvantage.
In many countries, a fair redistribution of resources is ensured by a so-called risk equalisation
mechanism. It basically identifies the risk level of the insurance portfolio of each health insurance company and
subsequently transfers resources to HIC with more costly patients. When the system is set correctly, the HIC can
focus on effective treatment of patients with any risk profile since no group of patients is unprofitable for them in
the long term. Some type of risk equalisation mechanism is used by countries such as Belgium, Germany, the
Netherlands or Slovakia.
Slovakia uses a risk equalisation mechanism inspired by the Dutch model and is currently able to predict
“only” 24% of average expenses. This is the case of foreign models as well and it does not have to mean that the
redistribution is bad from a systemic point of view. The model is still partially responsible for an imperfect
redistribution of resources among health insurance companies. On the other hand, it is true that a part of the
differences in losses and profits can be explained by the ability of the HIC to manage their funds efficiently. An
efficiency analysis of VšZP from 2018 identified a large room for improvement in this area (Chapter 13.2.3).
The mechanism can be partially improved by taking into account other parameters (“patient
characteristics”) which are currently not included in the model mainly due to lack of quality data. It includes, for
example, use of medical devices or inclusion in a diagnostic group.
Another improvement can be done by an additional compensation for patients who are very costly even
after the redistribution (so-called ex-post redistribution). No model, albeit very good, cannot provide for all
patients; there are some with high expenses in the long term but the model does not assign them a high
redistribution factor, for example because they do not belong to any defined group of chronic diseases. One
example can be a patient with a very rare disease who uses very expensive pharmaceuticals for a long time and
is unprofitable for the HIC. Even just a few of such insured persons can influence the outcomes of a health
118 Calculation according to §6a 581/2004 Coll.
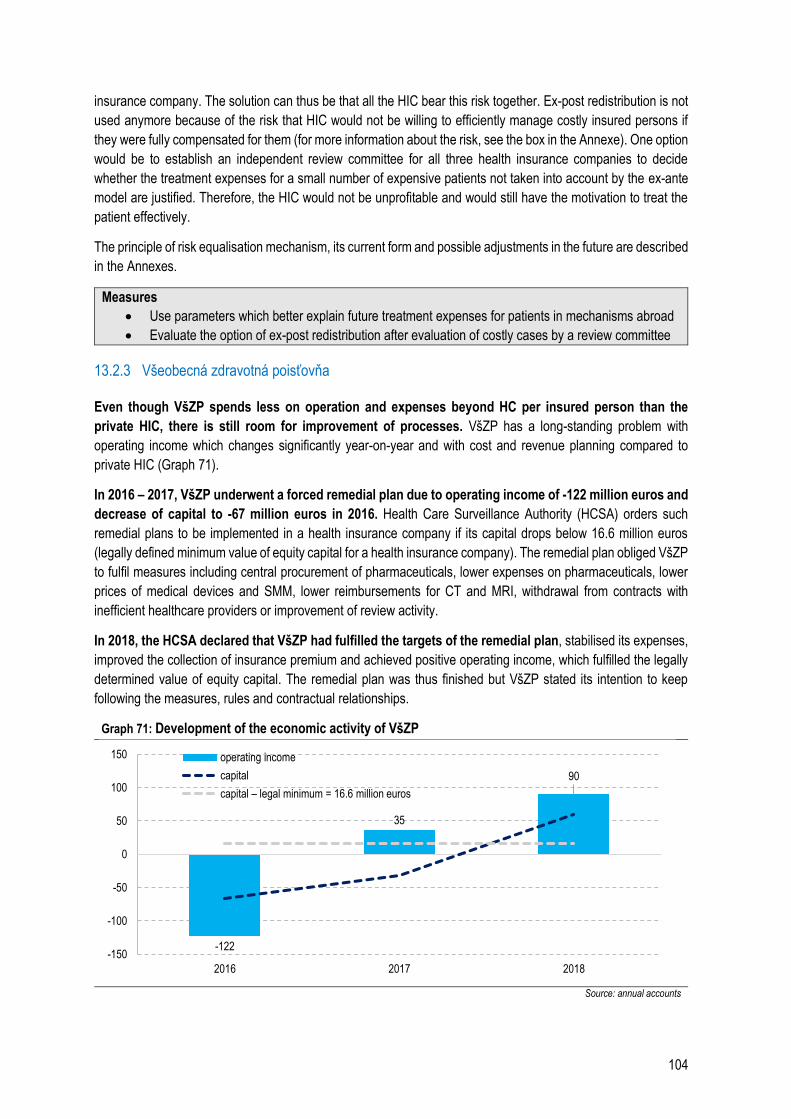
104
insurance company. The solution can thus be that all the HIC bear this risk together. Ex-post redistribution is not
used anymore because of the risk that HIC would not be willing to efficiently manage costly insured persons if
they were fully compensated for them (for more information about the risk, see the box in the Annexe). One option
would be to establish an independent review committee for all three health insurance companies to decide
whether the treatment expenses for a small number of expensive patients not taken into account by the ex-ante
model are justified. Therefore, the HIC would not be unprofitable and would still have the motivation to treat the
patient effectively.
The principle of risk equalisation mechanism, its current form and possible adjustments in the future are described
in the Annexes.
Measures
Use parameters which better explain future treatment expenses for patients in mechanisms abroad
Evaluate the option of ex-post redistribution after evaluation of costly cases by a review committee
13.2.3 Všeobecná zdravotná poisťovňa
Even though VšZP spends less on operation and expenses beyond HC per insured person than the
private HIC, there is still room for improvement of processes. VšZP has a long-standing problem with
operating income which changes significantly year-on-year and with cost and revenue planning compared to
private HIC (Graph 71).
In 2016 – 2017, VšZP underwent a forced remedial plan due to operating income of -122 million euros and
decrease of capital to -67 million euros in 2016. Health Care Surveillance Authority (HCSA) orders such
remedial plans to be implemented in a health insurance company if its capital drops below 16.6 million euros
(legally defined minimum value of equity capital for a health insurance company). The remedial plan obliged VšZP
to fulfil measures including central procurement of pharmaceuticals, lower expenses on pharmaceuticals, lower
prices of medical devices and SMM, lower reimbursements for CT and MRI, withdrawal from contracts with
inefficient healthcare providers or improvement of review activity.
In 2018, the HCSA declared that VšZP had fulfilled the targets of the remedial plan, stabilised its expenses,
improved the collection of insurance premium and achieved positive operating income, which fulfilled the legally
determined value of equity capital. The remedial plan was thus finished but VšZP stated its intention to keep
following the measures, rules and contractual relationships.
Graph 71: Development of the economic activity of VšZP
Source: annual accounts
-122
35
90
-150
-100
-50
0
50
100
150
2016 2017 2018
operating income
capital
capital – legal minimum = 16.6 million euros
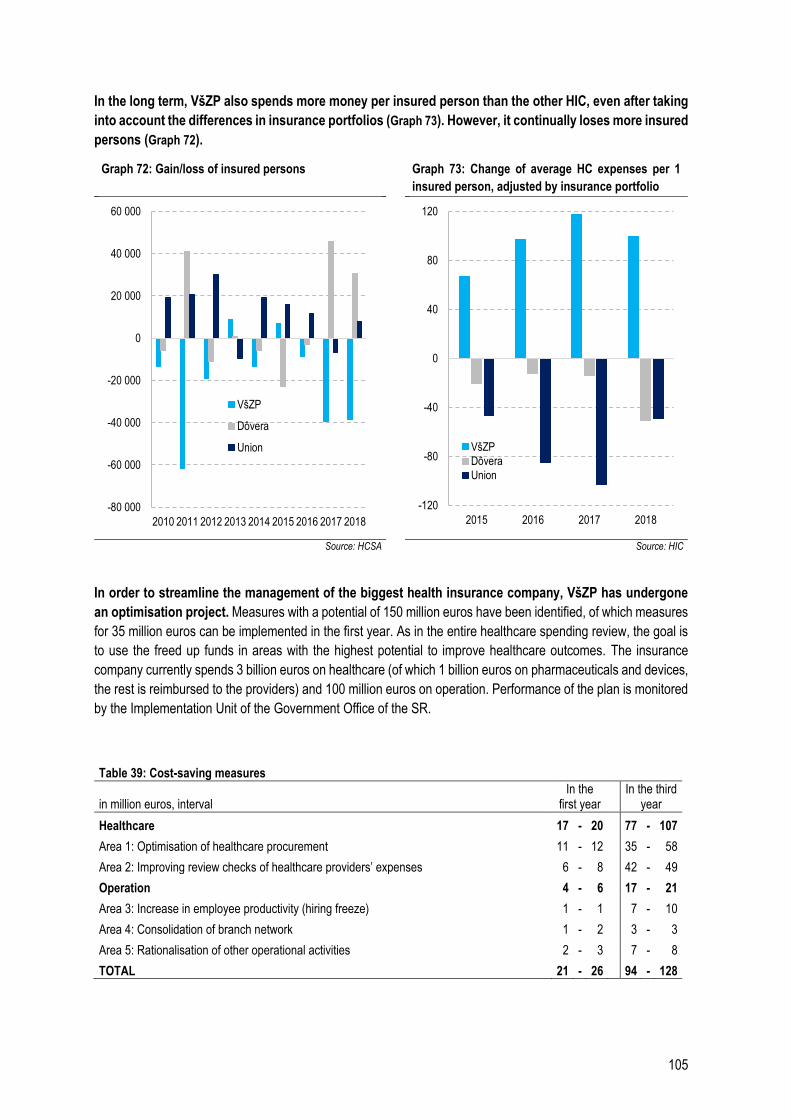
105
In the long term, VšZP also spends more money per insured person than the other HIC, even after taking
into account the differences in insurance portfolios (Graph 73). However, it continually loses more insured
persons (Graph 72).
Graph 72: Gain/loss of insured persons Graph 73: Change of average HC expenses per 1
insured person, adjusted by insurance portfolio
Source: HCSA Source: HIC
In order to streamline the management of the biggest health insurance company, VšZP has undergone
an optimisation project. Measures with a potential of 150 million euros have been identified, of which measures
for 35 million euros can be implemented in the first year. As in the entire healthcare spending review, the goal is
to use the freed up funds in areas with the highest potential to improve healthcare outcomes. The insurance
company currently spends 3 billion euros on healthcare (of which 1 billion euros on pharmaceuticals and devices,
the rest is reimbursed to the providers) and 100 million euros on operation. Performance of the plan is monitored
by the Implementation Unit of the Government Office of the SR.
Table 39: Cost-saving measures
in million euros, interval In the
first year In the third
year
Healthcare 17 - 20 77 - 107
Area 1: Optimisation of healthcare procurement 11 - 12 35 - 58
Area 2: Improving review checks of healthcare providers’ expenses 6 - 8 42 - 49
Operation 4 - 6 17 - 21
Area 3: Increase in employee productivity (hiring freeze) 1 - 1 7 - 10
Area 4: Consolidation of branch network 1 - 2 3 - 3
Area 5: Rationalisation of other operational activities 2 - 3 7 - 8
TOTAL 21 - 26 94 - 128
-80 000
-60 000
-40 000
-20 000
0
20 000
40 000
60 000
2010 2011 2012 2013 2014 2015 2016 2017 2018
VšZP
Dôvera
Union
-120
-80
-40
0
40
80
120
2015 2016 2017 2018
VšZP
Dôvera
Union
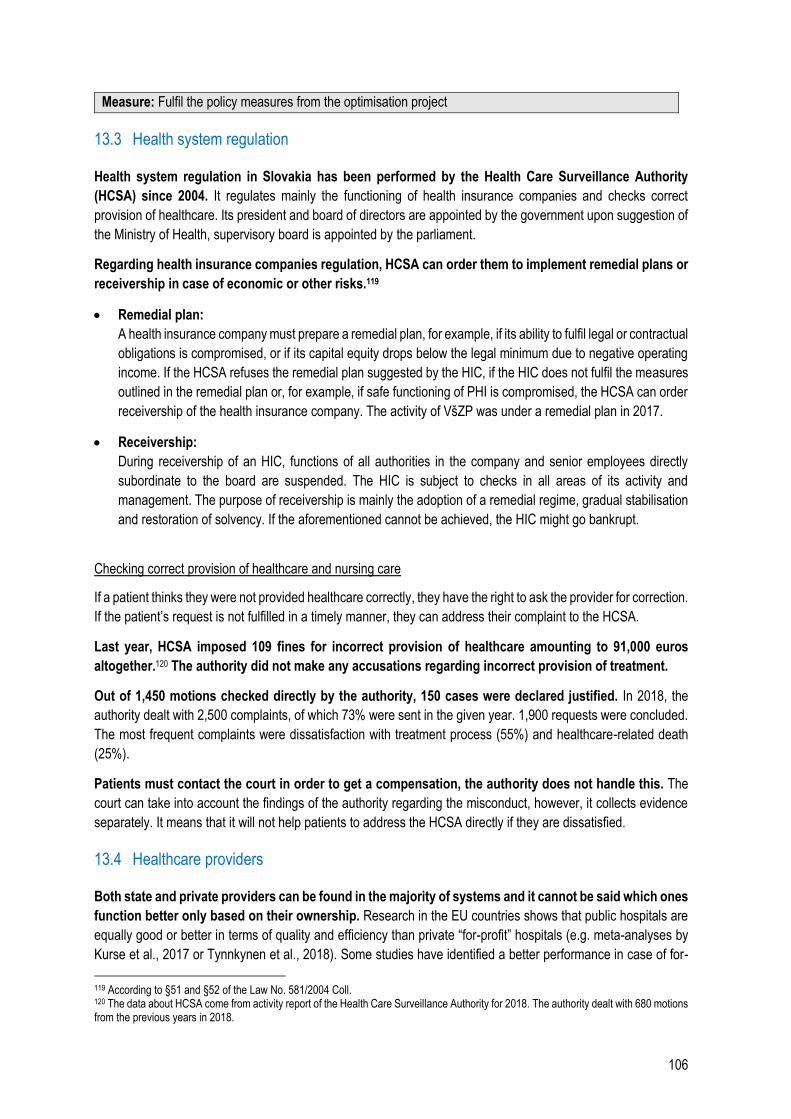
106
Measure: Fulfil the policy measures from the optimisation project
13.3 Health system regulation
Health system regulation in Slovakia has been performed by the Health Care Surveillance Authority
(HCSA) since 2004. It regulates mainly the functioning of health insurance companies and checks correct
provision of healthcare. Its president and board of directors are appointed by the government upon suggestion of
the Ministry of Health, supervisory board is appointed by the parliament.
Regarding health insurance companies regulation, HCSA can order them to implement remedial plans or
receivership in case of economic or other risks.119
Remedial plan:
A health insurance company must prepare a remedial plan, for example, if its ability to fulfil legal or contractual
obligations is compromised, or if its capital equity drops below the legal minimum due to negative operating
income. If the HCSA refuses the remedial plan suggested by the HIC, if the HIC does not fulfil the measures
outlined in the remedial plan or, for example, if safe functioning of PHI is compromised, the HCSA can order
receivership of the health insurance company. The activity of VšZP was under a remedial plan in 2017.
Receivership:
During receivership of an HIC, functions of all authorities in the company and senior employees directly
subordinate to the board are suspended. The HIC is subject to checks in all areas of its activity and
management. The purpose of receivership is mainly the adoption of a remedial regime, gradual stabilisation
and restoration of solvency. If the aforementioned cannot be achieved, the HIC might go bankrupt.
Checking correct provision of healthcare and nursing care
If a patient thinks they were not provided healthcare correctly, they have the right to ask the provider for correction.
If the patient’s request is not fulfilled in a timely manner, they can address their complaint to the HCSA.
Last year, HCSA imposed 109 fines for incorrect provision of healthcare amounting to 91,000 euros
altogether.120 The authority did not make any accusations regarding incorrect provision of treatment.
Out of 1,450 motions checked directly by the authority, 150 cases were declared justified. In 2018, the
authority dealt with 2,500 complaints, of which 73% were sent in the given year. 1,900 requests were concluded.
The most frequent complaints were dissatisfaction with treatment process (55%) and healthcare-related death
(25%).
Patients must contact the court in order to get a compensation, the authority does not handle this. The
court can take into account the findings of the authority regarding the misconduct, however, it collects evidence
separately. It means that it will not help patients to address the HCSA directly if they are dissatisfied.
13.4 Healthcare providers
Both state and private providers can be found in the majority of systems and it cannot be said which ones
function better only based on their ownership. Research in the EU countries shows that public hospitals are
equally good or better in terms of quality and efficiency than private “for-profit” hospitals (e.g. meta-analyses by
Kurse et al., 2017 or Tynnkynen et al., 2018). Some studies have identified a better performance in case of for-
119 According to §51 and §52 of the Law No. 581/2004 Coll. 120 The data about HCSA come from activity report of the Health Care Surveillance Authority for 2018. The authority dealt with 680 motions from the previous years in 2018.
107
profit hospitals, however, the differences between the types of hospitals stem mainly from institutional aspects of
the system (Barbetta et al., 2007). According to Kruse et al. (2017), the increasing share of private hospitals in
Europe in the recent years is not related to an improvement in their performance. Private hospitals have a higher
tendency to react to financial incentives. Therefore, the authors of the meta-analysis recommend the countries to
be careful when implementing financial tools and measures and, in general, when privatising hospitals.
Proper management is more important than the ownership of a hospital. Hospital manager should be
selected via transparent selection procedure and their subsequent activities should be subject to thorough checks.
A hospital should be managed strategically in terms of expenses and outcomes. The management of Slovak state
hospitals can be improved by centralised network management, e.g. via holding structure. The management of
teaching and university hospitals is currently supervised by the URPO121, but it does not have a managing function
nor the competence to impose sanctions. Hospital management has not improved significantly since the
establishment of the URPO.
121 See Chapter 4.6.
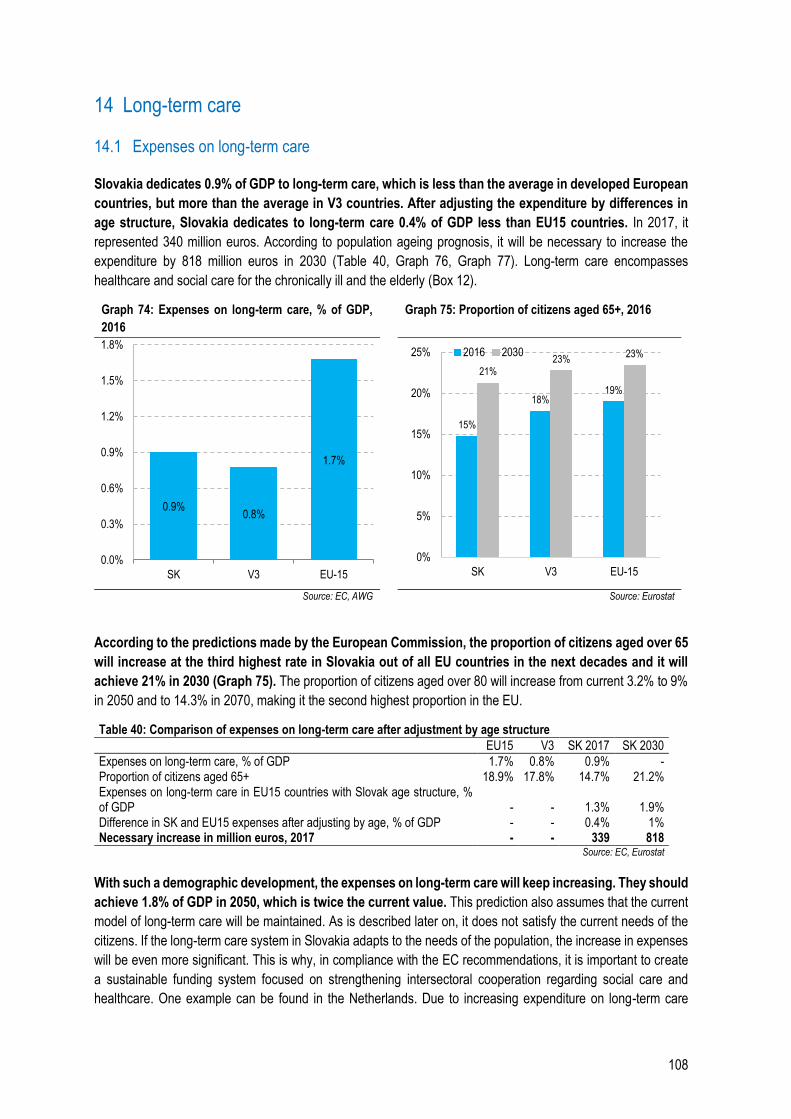
108
14 Long-term care
14.1 Expenses on long-term care
Slovakia dedicates 0.9% of GDP to long-term care, which is less than the average in developed European
countries, but more than the average in V3 countries. After adjusting the expenditure by differences in
age structure, Slovakia dedicates to long-term care 0.4% of GDP less than EU15 countries. In 2017, it
represented 340 million euros. According to population ageing prognosis, it will be necessary to increase the
expenditure by 818 million euros in 2030 (Table 40, Graph 76, Graph 77). Long-term care encompasses
healthcare and social care for the chronically ill and the elderly (Box 12).
Graph 74: Expenses on long-term care, % of GDP,
2016 Graph 75: Proportion of citizens aged 65+, 2016
Source: EC, AWG Source: Eurostat
According to the predictions made by the European Commission, the proportion of citizens aged over 65
will increase at the third highest rate in Slovakia out of all EU countries in the next decades and it will
achieve 21% in 2030 (Graph 75). The proportion of citizens aged over 80 will increase from current 3.2% to 9%
in 2050 and to 14.3% in 2070, making it the second highest proportion in the EU.
Table 40: Comparison of expenses on long-term care after adjustment by age structure
EU15 V3 SK 2017 SK 2030
Expenses on long-term care, % of GDP 1.7% 0.8% 0.9% - Proportion of citizens aged 65+ 18.9% 17.8% 14.7% 21.2% Expenses on long-term care in EU15 countries with Slovak age structure, % of GDP - - 1.3% 1.9% Difference in SK and EU15 expenses after adjusting by age, % of GDP - - 0.4% 1% Necessary increase in million euros, 2017 - - 339 818
Source: EC, Eurostat
With such a demographic development, the expenses on long-term care will keep increasing. They should
achieve 1.8% of GDP in 2050, which is twice the current value. This prediction also assumes that the current
model of long-term care will be maintained. As is described later on, it does not satisfy the current needs of the
citizens. If the long-term care system in Slovakia adapts to the needs of the population, the increase in expenses
will be even more significant. This is why, in compliance with the EC recommendations, it is important to create
a sustainable funding system focused on strengthening intersectoral cooperation regarding social care and
healthcare. One example can be found in the Netherlands. Due to increasing expenditure on long-term care
0.9%0.8%
1.7%
0.0%
0.3%
0.6%
0.9%
1.2%
1.5%
1.8%
SK V3 EU-15
15%
18%19%
21%23%
23%
0%
5%
10%
15%
20%
25%
SK V3 EU-15
2016 2030
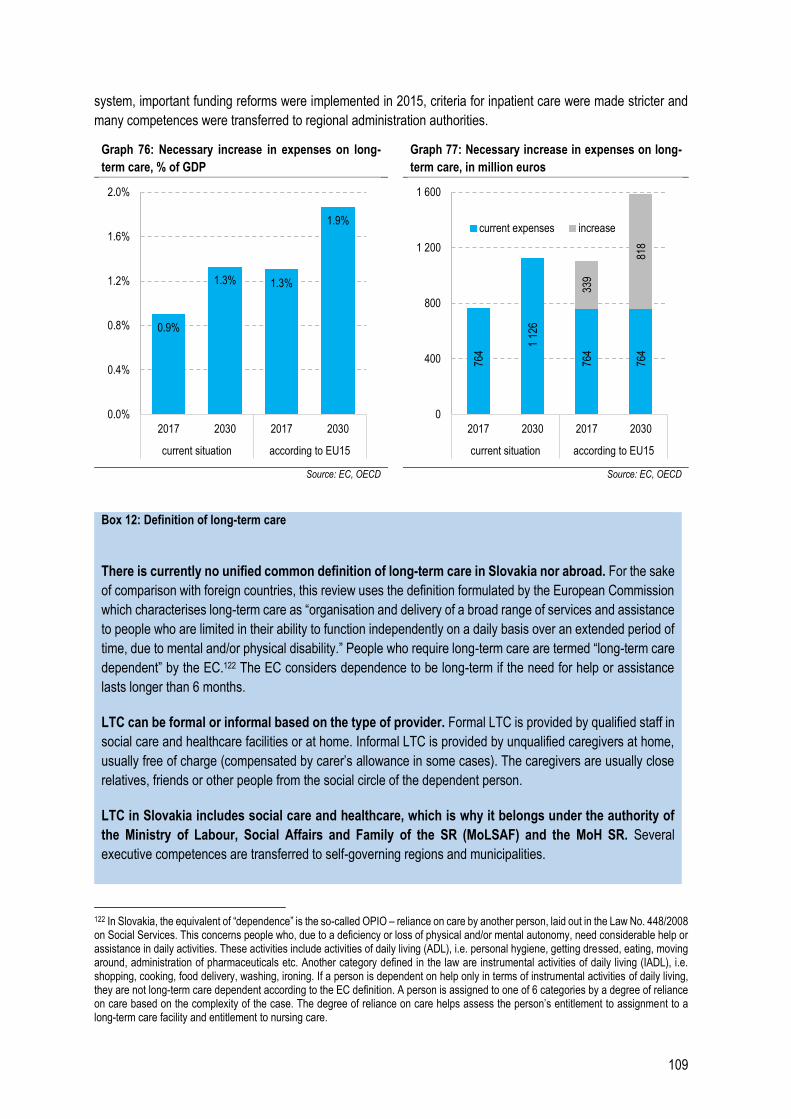
109
system, important funding reforms were implemented in 2015, criteria for inpatient care were made stricter and
many competences were transferred to regional administration authorities.
Graph 76: Necessary increase in expenses on long-
term care, % of GDP Graph 77: Necessary increase in expenses on long-
term care, in million euros
Source: EC, OECD Source: EC, OECD
Box 12: Definition of long-term care
There is currently no unified common definition of long-term care in Slovakia nor abroad. For the sake
of comparison with foreign countries, this review uses the definition formulated by the European Commission
which characterises long-term care as “organisation and delivery of a broad range of services and assistance
to people who are limited in their ability to function independently on a daily basis over an extended period of
time, due to mental and/or physical disability.” People who require long-term care are termed “long-term care
dependent” by the EC.122 The EC considers dependence to be long-term if the need for help or assistance
lasts longer than 6 months.
LTC can be formal or informal based on the type of provider. Formal LTC is provided by qualified staff in
social care and healthcare facilities or at home. Informal LTC is provided by unqualified caregivers at home,
usually free of charge (compensated by carer’s allowance in some cases). The caregivers are usually close
relatives, friends or other people from the social circle of the dependent person.
LTC in Slovakia includes social care and healthcare, which is why it belongs under the authority of
the Ministry of Labour, Social Affairs and Family of the SR (MoLSAF) and the MoH SR. Several
executive competences are transferred to self-governing regions and municipalities.
122 In Slovakia, the equivalent of “dependence” is the so-called OPIO – reliance on care by another person, laid out in the Law No. 448/2008 on Social Services. This concerns people who, due to a deficiency or loss of physical and/or mental autonomy, need considerable help or assistance in daily activities. These activities include activities of daily living (ADL), i.e. personal hygiene, getting dressed, eating, moving around, administration of pharmaceuticals etc. Another category defined in the law are instrumental activities of daily living (IADL), i.e. shopping, cooking, food delivery, washing, ironing. If a person is dependent on help only in terms of instrumental activities of daily living, they are not long-term care dependent according to the EC definition. A person is assigned to one of 6 categories by a degree of reliance on care based on the complexity of the case. The degree of reliance on care helps assess the person’s entitlement to assignment to a long-term care facility and entitlement to nursing care.
0.9%
1.3% 1.3%
1.9%
0.0%
0.4%
0.8%
1.2%
1.6%
2.0%
2017 2030 2017 2030
current situation according to EU15
764
1 12
6
764
764
339
818
0
400
800
1 200
1 600
2017 2030 2017 2030
current situation according to EU15
current expenses increase
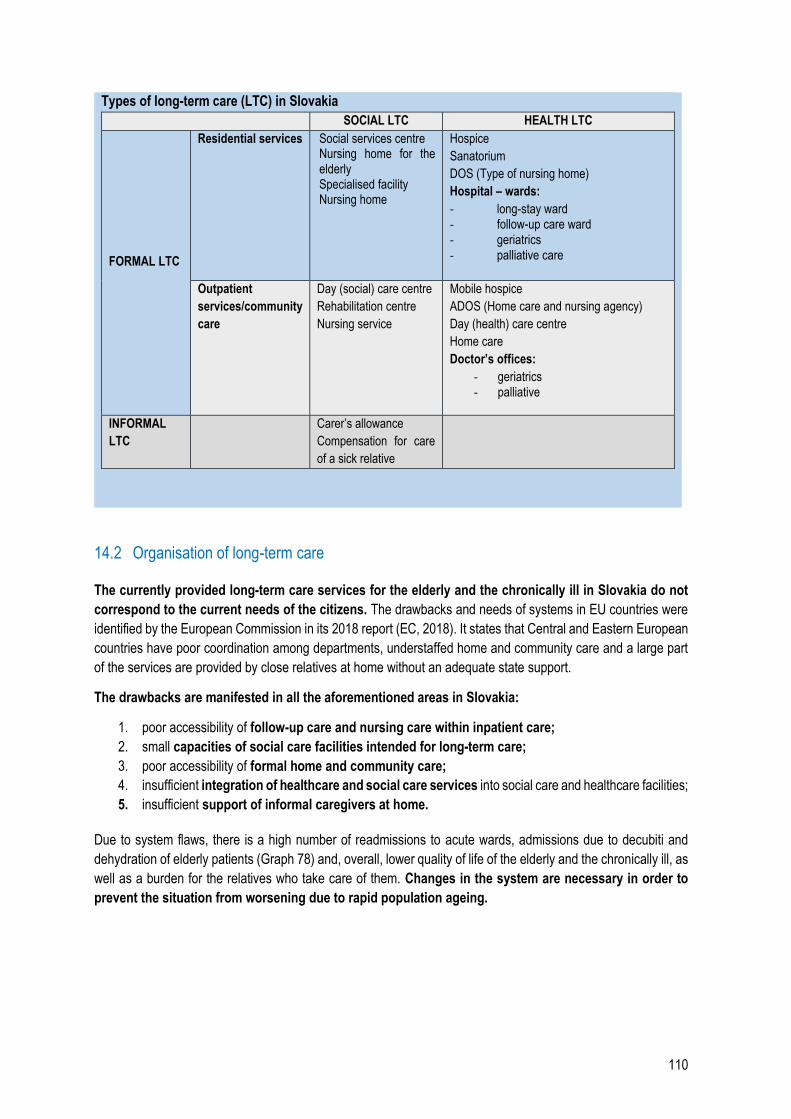
110
Types of long-term care (LTC) in Slovakia
SOCIAL LTC HEALTH LTC
FORMAL LTC
Residential services Social services centre Nursing home for the elderly Specialised facility Nursing home
Hospice
Sanatorium
DOS (Type of nursing home)
Hospital – wards:
- long-stay ward - follow-up care ward - geriatrics - palliative care
Outpatient
services/community
care
Day (social) care centre
Rehabilitation centre
Nursing service
Mobile hospice
ADOS (Home care and nursing agency)
Day (health) care centre
Home care
Doctor’s offices:
- geriatrics - palliative
INFORMAL
LTC
Carer’s allowance
Compensation for care
of a sick relative
14.2 Organisation of long-term care
The currently provided long-term care services for the elderly and the chronically ill in Slovakia do not
correspond to the current needs of the citizens. The drawbacks and needs of systems in EU countries were
identified by the European Commission in its 2018 report (EC, 2018). It states that Central and Eastern European
countries have poor coordination among departments, understaffed home and community care and a large part
of the services are provided by close relatives at home without an adequate state support.
The drawbacks are manifested in all the aforementioned areas in Slovakia:
1. poor accessibility of follow-up care and nursing care within inpatient care;
2. small capacities of social care facilities intended for long-term care;
3. poor accessibility of formal home and community care;
4. insufficient integration of healthcare and social care services into social care and healthcare facilities;
5. insufficient support of informal caregivers at home.
Due to system flaws, there is a high number of readmissions to acute wards, admissions due to decubiti and
dehydration of elderly patients (Graph 78) and, overall, lower quality of life of the elderly and the chronically ill, as
well as a burden for the relatives who take care of them. Changes in the system are necessary in order to
prevent the situation from worsening due to rapid population ageing.
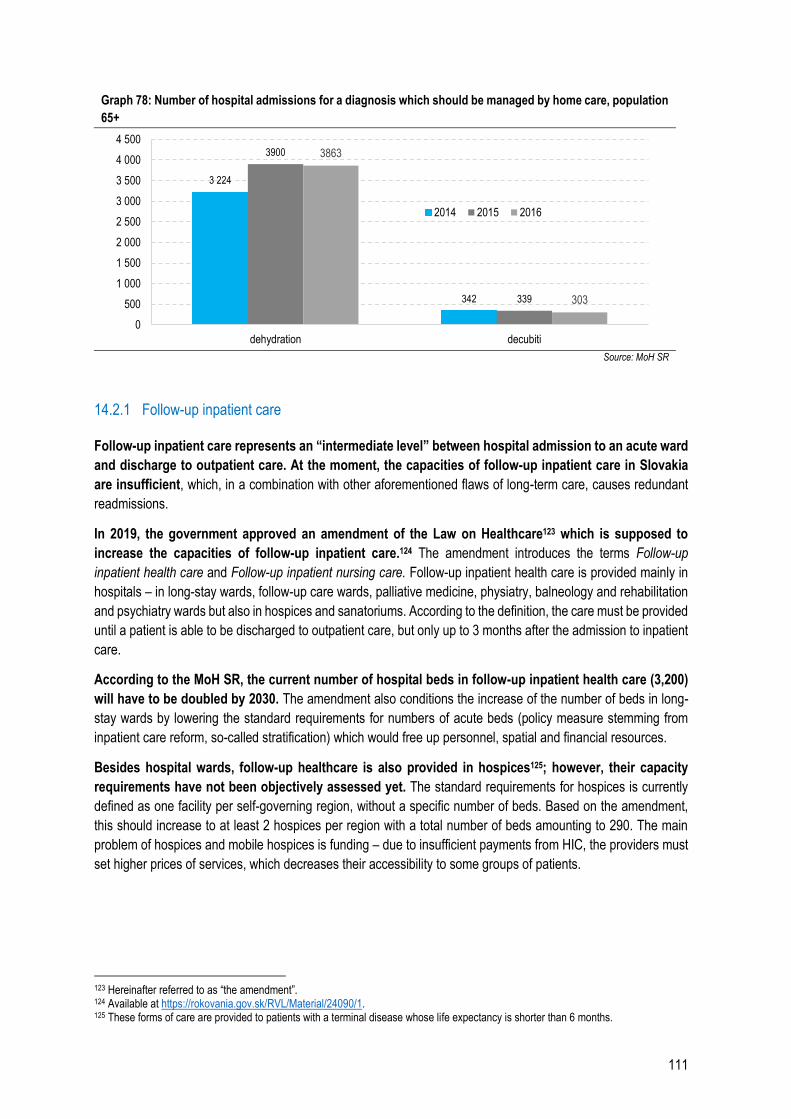
111
Graph 78: Number of hospital admissions for a diagnosis which should be managed by home care, population
65+
Source: MoH SR
14.2.1 Follow-up inpatient care
Follow-up inpatient care represents an “intermediate level” between hospital admission to an acute ward
and discharge to outpatient care. At the moment, the capacities of follow-up inpatient care in Slovakia
are insufficient, which, in a combination with other aforementioned flaws of long-term care, causes redundant
readmissions.
In 2019, the government approved an amendment of the Law on Healthcare123 which is supposed to
increase the capacities of follow-up inpatient care.124 The amendment introduces the terms Follow-up
inpatient health care and Follow-up inpatient nursing care. Follow-up inpatient health care is provided mainly in
hospitals – in long-stay wards, follow-up care wards, palliative medicine, physiatry, balneology and rehabilitation
and psychiatry wards but also in hospices and sanatoriums. According to the definition, the care must be provided
until a patient is able to be discharged to outpatient care, but only up to 3 months after the admission to inpatient
care.
According to the MoH SR, the current number of hospital beds in follow-up inpatient health care (3,200)
will have to be doubled by 2030. The amendment also conditions the increase of the number of beds in long-
stay wards by lowering the standard requirements for numbers of acute beds (policy measure stemming from
inpatient care reform, so-called stratification) which would free up personnel, spatial and financial resources.
Besides hospital wards, follow-up healthcare is also provided in hospices125; however, their capacity
requirements have not been objectively assessed yet. The standard requirements for hospices is currently
defined as one facility per self-governing region, without a specific number of beds. Based on the amendment,
this should increase to at least 2 hospices per region with a total number of beds amounting to 290. The main
problem of hospices and mobile hospices is funding – due to insufficient payments from HIC, the providers must
set higher prices of services, which decreases their accessibility to some groups of patients.
123 Hereinafter referred to as “the amendment”. 124 Available at https://rokovania.gov.sk/RVL/Material/24090/1. 125 These forms of care are provided to patients with a terminal disease whose life expectancy is shorter than 6 months.
3 224
342
3900
339
3863
303
0
500
1 000
1 500
2 000
2 500
3 000
3 500
4 000
4 500
dehydration decubiti
2014 2015 2016
112
Residential social care facilities, home and community care
Residential social care facilities do not have enough places; the number of people on waiting lists in
nursing homes for the elderly and in specialised facilities surpasses the number of available places by
30%, in social services centres by 13%. The largest number of places in residential social care facilities is
available in facilities for the elderly, intended for year-round residence of patients with higher degrees of reliance
on care. There are 18,500 beds available in 387 such facilities. The number of people on waiting lists in 2018 was
5,700. However, these facilities take care of people with higher degrees of reliance on care which makes home
care very difficult. As much as 20% of respondents in a survey126 by the Association for the Protection of Patients'
Rights in Slovakia (AOPP) waited for their dependent person to be placed in a social care facility for more than 1
year. Only 40% of the respondents were able to place the dependent person in a facility within 2 months. It can
help the patients on waiting lists to be provided other forms of the services, particularly home and
community care.
The tendency in long-term care abroad is to broaden home and community care (deinstitutionalisation).
These services are understaffed in Slovakia. These forms of care allow chronically ill patients and the elderly
to live in their natural social environment (family, friends) and take upon themselves a part of the tasks of the
informal caregivers, which alleviates economic and mental burden of the care. The amendment of the Law on
Healthcare reflects the necessary increase of capacities of home care and nursing agencies (ADOS) and mobile
hospices. It also increases the staffing norms of the number of nurses and amounts reimbursed. The EC states
that the number of day social care centres, day health care centres and coordinated group or individual assisted
living facilities can be increased as well.
Giving priority to home and community care does not mean that the capacities of residential facilities
should decrease considerably. There is no universal LTC model and the process of deinstitutionalisation should
reflect the demographic development of the population and related determinants. It is important that home and
community care are not regarded simply as a “cheap alternative” to residential facilities, but to base the LTC
model in the country on objective needs of the population.
Informal caregivers
The shortage of formal care capacities is replaced by informal caregivers, most often relatives and
friends. This form of care is not adequately supported and funded in Slovakia. At the end of the last year,
54,700 people received the financial compensation for a caregiver of a dependent person amounting on average
to 215 euros monthly per one dependent person. This type of contribution can be received only by caregivers of
people with severe disability. However, also people without an approved status of severely disabled person often
require complex care. As much as 71% of respondents of the AOPP survey provided long-term care to their
relative on their own but only 20% of them were entitled to a carer’s allowance. This system with insufficient
formal services has a negative economic impact on individuals, families and the society because many
people cannot work on the labour market but have to provide unpaid care.
Experts estimate that the real number of people in need of long-term care in Slovakia is much higher than
stated in social and health statistics. Approximately 120,000 people received long-term help in 2017 via various
forms of social care; 61,000 people were using long-term health care services. This represents 2.4% of the
126 The survey was conducted as a part of the project “Long-term care strategies.” Representatives of the Ministry of Health of the SR, Ministry of Labour, Social Affairs and Family of the SR and the Association for the Protection of Patients’ Rights in Slovakia have cooperated on the project under the auspices of the Government Office Plenipotentiary for Civil Society Development. https://aopp.sk/clanok/priplatky-nespokojnost-s-personalom-aj-nedostatok-kapacit-v-zariadeniach-aj-odhalil-prieskum-o-dlhodobej-starostlivosti
113
population above the age of six. An expert forum127 identified the number of people dependent on assistance as
5.7% of the population128 already in 2014. Based on the demographic development, it can be estimated that the
proportion has since increased.
Therefore, the real number of informal caregivers in Slovakia is higher than what the statistics show. If
an informal caregiver is not entitled to receive a carer’s allowance and does not use any form of outpatient long-
term care, the burden of care is great. This problem can be partially solved by the newly established “long-term
compensation for care of a sick relative” which can be received by a relative of a person in need of care upon
doctor’s indication; however, it is limited to 3 months. Given that the waiting periods for nursing homes for the
elderly and other residential and outpatient social care facilities are usually longer, this form of support is
insufficient.
Intersectoral coordination
Poor coordination between the Ministries of Health and of Social Affairs causes a situation where neither
of the services – healthcare and social care – is sufficiently integrated in joint facilities of the sectors.
This results in a lower quality of healthcare in social care facilities and, vice versa, poor social services
in healthcare facilities. The fragmentation among sectors and regions has been identified by a working group
of the EC as one of the obstacles of high-quality and accessible long-term care. It is true that quality assessments
of services in social care facilities (managed by the MoLSAF) are legally obligatory, but it only concerns social
services. In case of healthcare and nursing care, the assessment can only evaluate whether they are provided to
the client or not. Quality assessment for these services should be conducted by HCSA, however, the scope of
the assessment is not further determined by the law.
Lack of coordination between social and healthcare services is also manifested in the difficulties with
transferring a patient from inpatient care to a social service facility or home care. Placing a patient in a
social care facility requires an evaluation of their degree of reliance on care, which is a very lengthy process.
Given that hospitals do not have enough capacities for chronically ill patients and the capacities of hospices and
DOS are also insufficient, the patient often has to be discharged to home care before the evaluation is ready in
order for them to be placed in a social care facility.
Measures
Increase capacities and expenses on follow-up inpatient healthcare, hospices, mobile hospices and
nursing care agencies according to the amendment of the Law on Healthcare by 27 million euros
per year and by 15 million euros in the first year.
Increase funding to EU15 level by 340 million euros per year in a 10-year period.
Significantly strengthen home nursing care – ADOS, mobile hospices
Significantly strengthen community care – day health care centres, day social care centres, assisted
living
Broaden the scope of follow-up care
Provide sufficient financial compensation to informal caregivers and support their engagement in
the labour market (e.g. by flexible employment contracts) (EC, 2018).
127 Repková, K. Možnosť zavedenia poistenia v odkázanosti na pomoc inej osoby – analytické východiská. (March 13, 2019) 128 This sentence differs from the Slovak original due to a mistake in the original version.
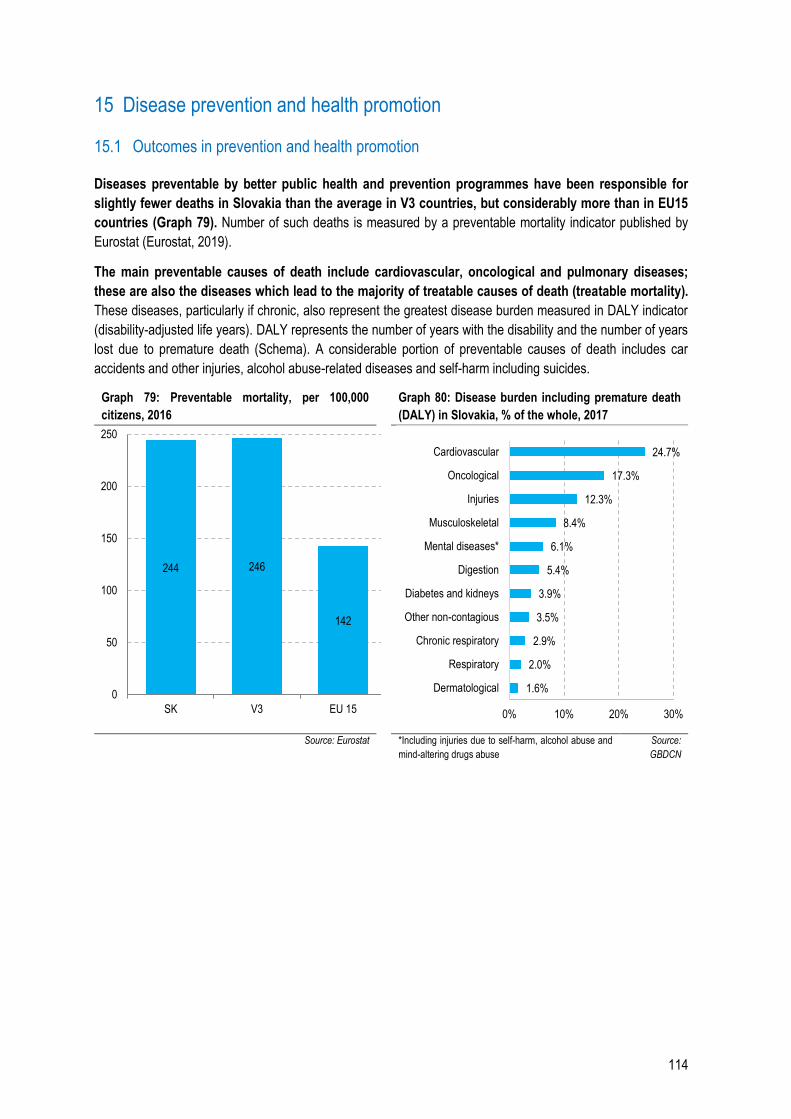
114
15 Disease prevention and health promotion
15.1 Outcomes in prevention and health promotion
Diseases preventable by better public health and prevention programmes have been responsible for
slightly fewer deaths in Slovakia than the average in V3 countries, but considerably more than in EU15
countries (Graph 79). Number of such deaths is measured by a preventable mortality indicator published by
Eurostat (Eurostat, 2019).
The main preventable causes of death include cardiovascular, oncological and pulmonary diseases;
these are also the diseases which lead to the majority of treatable causes of death (treatable mortality).
These diseases, particularly if chronic, also represent the greatest disease burden measured in DALY indicator
(disability-adjusted life years). DALY represents the number of years with the disability and the number of years
lost due to premature death (Schema). A considerable portion of preventable causes of death includes car
accidents and other injuries, alcohol abuse-related diseases and self-harm including suicides.
Graph 79: Preventable mortality, per 100,000
citizens, 2016
Graph 80: Disease burden including premature death
(DALY) in Slovakia, % of the whole, 2017
Source: Eurostat *Including injuries due to self-harm, alcohol abuse and
mind-altering drugs abuse
Source:
GBDCN
244 246
142
0
50
100
150
200
250
SK V3 EU 15
1.6%
2.0%
2.9%
3.5%
3.9%
5.4%
6.1%
8.4%
12.3%
17.3%
24.7%
0% 10% 20% 30%
Dermatological
Respiratory
Chronic respiratory
Other non-contagious
Diabetes and kidneys
Digestion
Mental diseases*
Musculoskeletal
Injuries
Oncological
Cardiovascular
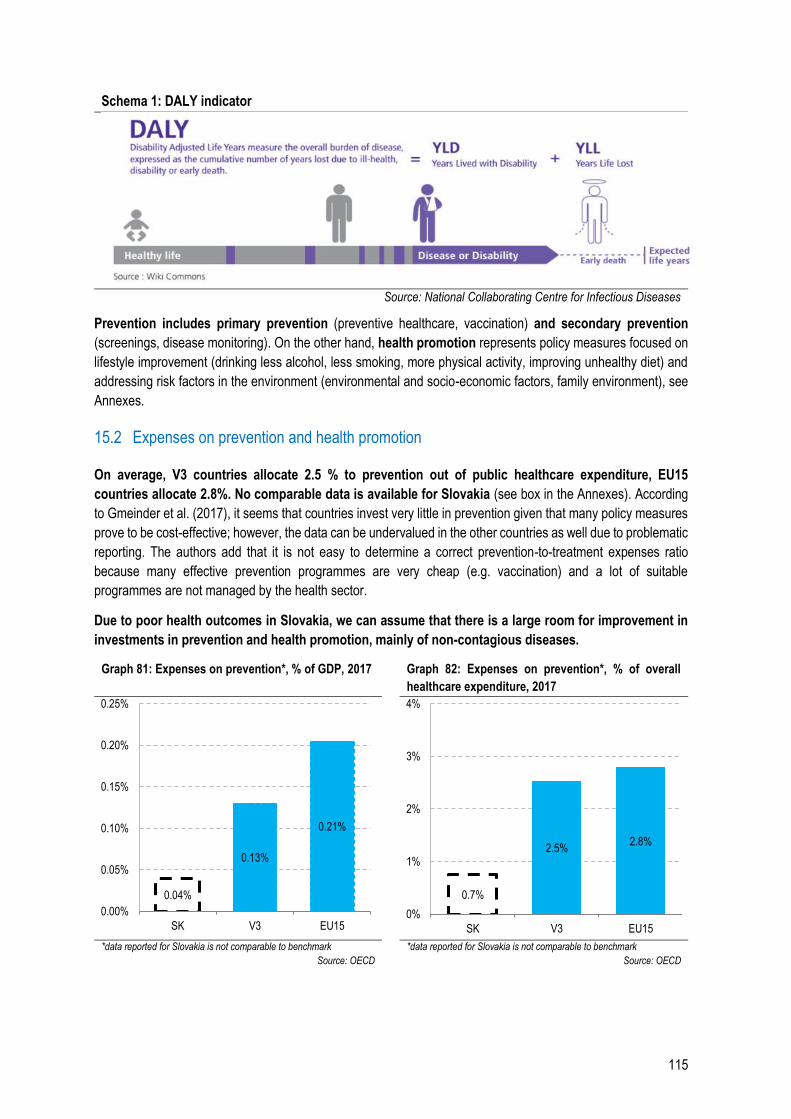
115
Schema 1: DALY indicator
Source: National Collaborating Centre for Infectious Diseases
Prevention includes primary prevention (preventive healthcare, vaccination) and secondary prevention
(screenings, disease monitoring). On the other hand, health promotion represents policy measures focused on
lifestyle improvement (drinking less alcohol, less smoking, more physical activity, improving unhealthy diet) and
addressing risk factors in the environment (environmental and socio-economic factors, family environment), see
Annexes.
15.2 Expenses on prevention and health promotion
On average, V3 countries allocate 2.5 % to prevention out of public healthcare expenditure, EU15
countries allocate 2.8%. No comparable data is available for Slovakia (see box in the Annexes). According
to Gmeinder et al. (2017), it seems that countries invest very little in prevention given that many policy measures
prove to be cost-effective; however, the data can be undervalued in the other countries as well due to problematic
reporting. The authors add that it is not easy to determine a correct prevention-to-treatment expenses ratio
because many effective prevention programmes are very cheap (e.g. vaccination) and a lot of suitable
programmes are not managed by the health sector.
Due to poor health outcomes in Slovakia, we can assume that there is a large room for improvement in
investments in prevention and health promotion, mainly of non-contagious diseases.
Graph 81: Expenses on prevention*, % of GDP, 2017 Graph 82: Expenses on prevention*, % of overall
healthcare expenditure, 2017
*data reported for Slovakia is not comparable to benchmark
Source: OECD
*data reported for Slovakia is not comparable to benchmark
Source: OECD
0.04%
0.13%
0.21%
0.00%
0.05%
0.10%
0.15%
0.20%
0.25%
SK V3 EU15
0.7%
2.5%2.8%
0%
1%
2%
3%
4%
SK V3 EU15
116
15.3 Effective and cost-effective prevention and health promotion programmes
Investments in effective prevention and health promotion programmes are at least as cost-effective as
the treatment of subsequent diseases (WHO, 2015b). The state can encourage healthier habits of the
population by imposing taxes, regulations, education or behavioural modelling. Preventive measures have
managed to significantly improve vaccination rate and early disease detection all over the world in the last
decades. They have also contributed to a lower number of accidents and injuries and lower consumption of
alcohol and cigarettes.
It is important but also complicated to identify programmes which really work. Very often, only a combination of
several policy measures is effective. OECD also warns that lower healthcare expenditure should not be the main
motivation for investments in prevention and health promotion. The most important benefits of prevention are
not lower expenses on treatment; the return on investment stems mainly from higher productivity, lower
burden on the social system and lower disparity in health and welfare of citizens (Devaux & Sassi, 2015).
Prevention
Childhood vaccination rate for measles in Slovakia is still over the critical 95% threshold, which is similar
to the average of V3 countries and now also EU15 countries (Graph 83). In the recent years, some parents
have become more and more reluctant to vaccinate their children out of unjustified fear of side effects, often as a
result of disinformation. In reality, measles are a severe viral disease which can develop into pneumonia,
encephalitis, diarrhoea and even cause blindness. Measles vaccination is very effective. To protect people who
cannot be vaccinated (e.g. due to a contraindication or low immunity), it is necessary to keep the vaccination rate
over 95%. There was a significant drop in vaccination rate in Slovakia between 2011 and 2015, but it has
increased slightly since 2016. In 2019, the MoH issued a ban on presence of unvaccinated children in
kindergartens129.
The proportion of older population vaccinated against the flu shows that the situation in Slovakia is much
worse than in the other compared countries (Graph 84). The indicator takes into account older population
who is especially prone to complications during a flu infection.
In order to improve vaccination rates, the Council of the European Union130 recommends:
implementation of national vaccination programmes and vaccination rate monitoring
coordination of member states’ vaccination programmes
better accessibility of vaccines
vaccination when a child enters school or an adult starts a new job
vaccinating closer to communities, especially in case of vulnerable groups and minorities, for example
in pharmacies, schools, workplaces
better awareness of the need for and effects of vaccination, building trust in healthcare system and fight
against disinformation.
129 https://www.health.gov.sk/Clanok?povinne-ockovanie-ochrana 130 https://eur-lex.europa.eu/legal-content/EN/TXT/PDF/?uri=CELEX:52018DC0244&from=EN
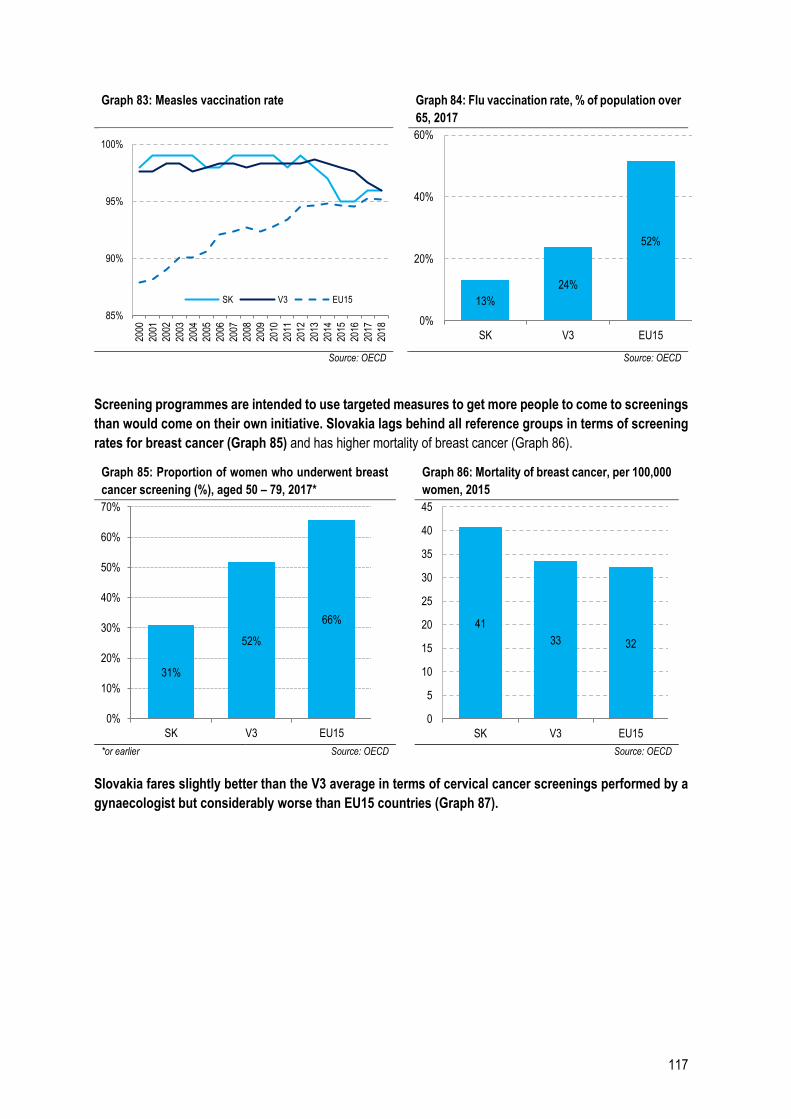
117
Graph 83: Measles vaccination rate Graph 84: Flu vaccination rate, % of population over
65, 2017
Source: OECD Source: OECD
Screening programmes are intended to use targeted measures to get more people to come to screenings
than would come on their own initiative. Slovakia lags behind all reference groups in terms of screening
rates for breast cancer (Graph 85) and has higher mortality of breast cancer (Graph 86).
Graph 85: Proportion of women who underwent breast
cancer screening (%), aged 50 – 79, 2017*
Graph 86: Mortality of breast cancer, per 100,000
women, 2015
*or earlier Source: OECD Source: OECD
Slovakia fares slightly better than the V3 average in terms of cervical cancer screenings performed by a
gynaecologist but considerably worse than EU15 countries (Graph 87).
85%
90%
95%
100%20
00
2001
2002
2003
2004
2005
2006
2007
2008
2009
2010
2011
2012
2013
2014
2015
2016
2017
2018
SK V3 EU15 13%
24%
52%
0%
20%
40%
60%
SK V3 EU15
31%
52%
66%
0%
10%
20%
30%
40%
50%
60%
70%
SK V3 EU15
41
33 32
0
5
10
15
20
25
30
35
40
45
SK V3 EU15
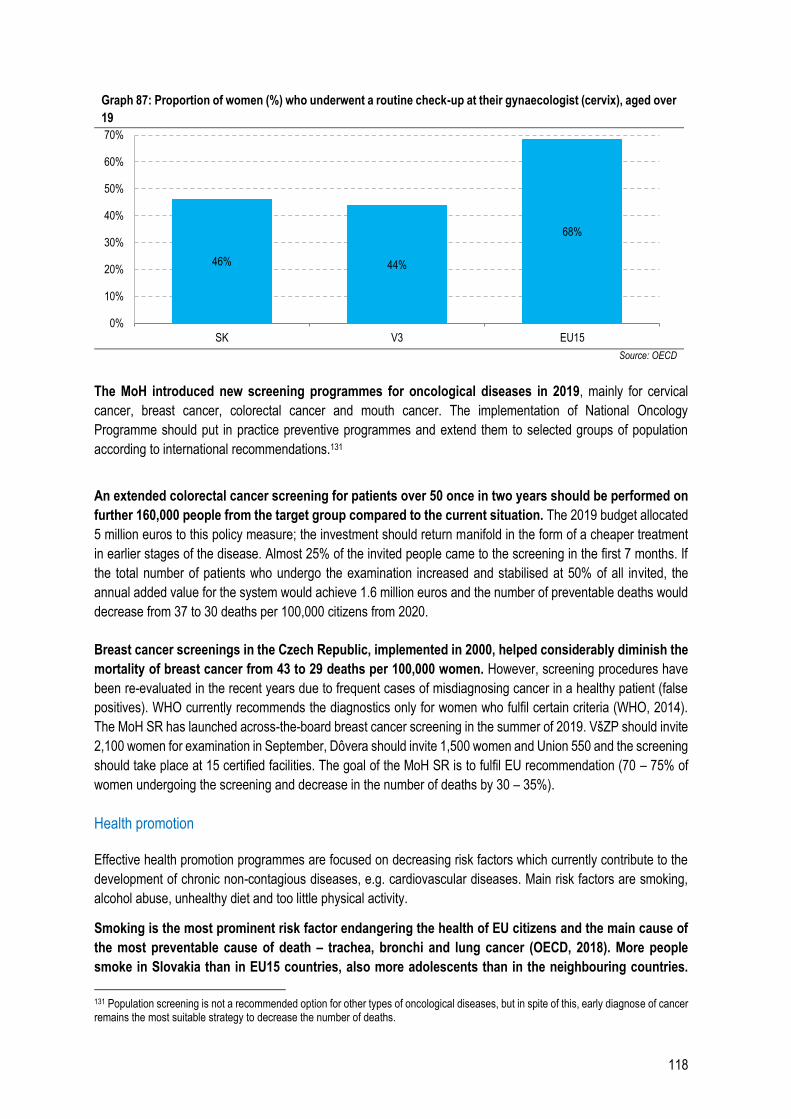
118
Graph 87: Proportion of women (%) who underwent a routine check-up at their gynaecologist (cervix), aged over
19
Source: OECD
The MoH introduced new screening programmes for oncological diseases in 2019, mainly for cervical
cancer, breast cancer, colorectal cancer and mouth cancer. The implementation of National Oncology
Programme should put in practice preventive programmes and extend them to selected groups of population
according to international recommendations.131
An extended colorectal cancer screening for patients over 50 once in two years should be performed on
further 160,000 people from the target group compared to the current situation. The 2019 budget allocated
5 million euros to this policy measure; the investment should return manifold in the form of a cheaper treatment
in earlier stages of the disease. Almost 25% of the invited people came to the screening in the first 7 months. If
the total number of patients who undergo the examination increased and stabilised at 50% of all invited, the
annual added value for the system would achieve 1.6 million euros and the number of preventable deaths would
decrease from 37 to 30 deaths per 100,000 citizens from 2020.
Breast cancer screenings in the Czech Republic, implemented in 2000, helped considerably diminish the
mortality of breast cancer from 43 to 29 deaths per 100,000 women. However, screening procedures have
been re-evaluated in the recent years due to frequent cases of misdiagnosing cancer in a healthy patient (false
positives). WHO currently recommends the diagnostics only for women who fulfil certain criteria (WHO, 2014).
The MoH SR has launched across-the-board breast cancer screening in the summer of 2019. VšZP should invite
2,100 women for examination in September, Dôvera should invite 1,500 women and Union 550 and the screening
should take place at 15 certified facilities. The goal of the MoH SR is to fulfil EU recommendation (70 – 75% of
women undergoing the screening and decrease in the number of deaths by 30 – 35%).
Health promotion
Effective health promotion programmes are focused on decreasing risk factors which currently contribute to the
development of chronic non-contagious diseases, e.g. cardiovascular diseases. Main risk factors are smoking,
alcohol abuse, unhealthy diet and too little physical activity.
Smoking is the most prominent risk factor endangering the health of EU citizens and the main cause of
the most preventable cause of death – trachea, bronchi and lung cancer (OECD, 2018). More people
smoke in Slovakia than in EU15 countries, also more adolescents than in the neighbouring countries.
131 Population screening is not a recommended option for other types of oncological diseases, but in spite of this, early diagnose of cancer remains the most suitable strategy to decrease the number of deaths.
46% 44%
68%
0%
10%
20%
30%
40%
50%
60%
70%
SK V3 EU15
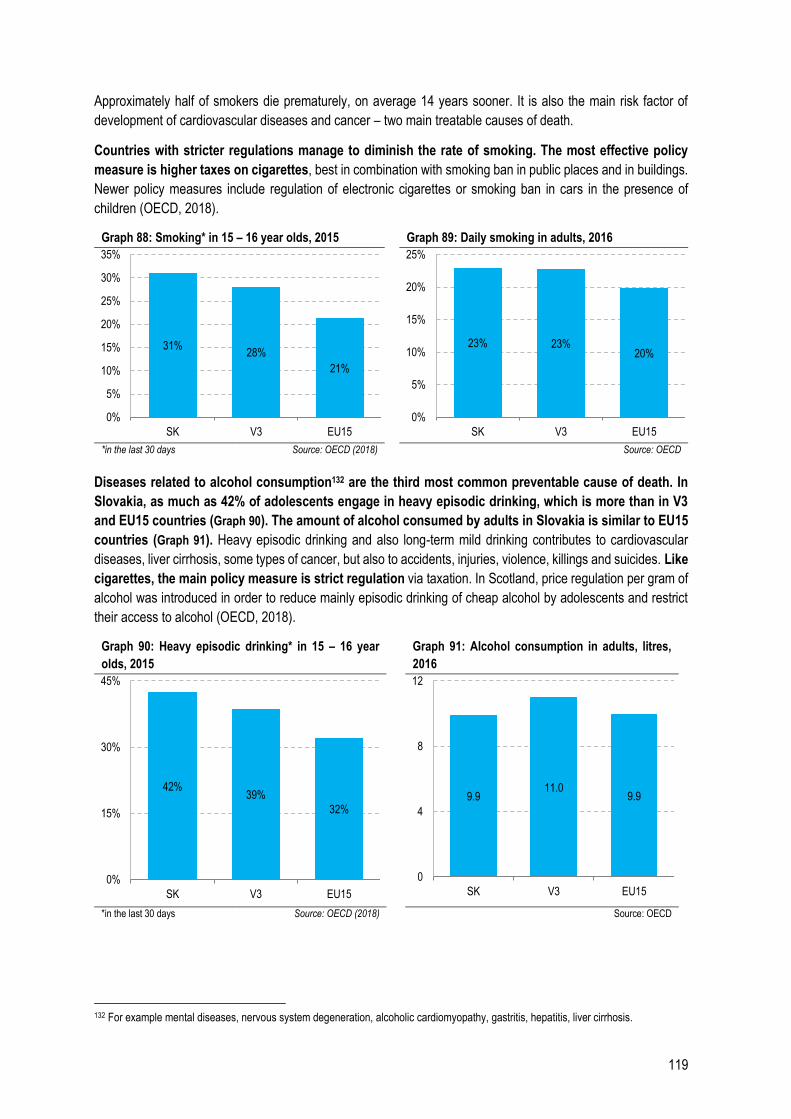
119
Approximately half of smokers die prematurely, on average 14 years sooner. It is also the main risk factor of
development of cardiovascular diseases and cancer – two main treatable causes of death.
Countries with stricter regulations manage to diminish the rate of smoking. The most effective policy
measure is higher taxes on cigarettes, best in combination with smoking ban in public places and in buildings.
Newer policy measures include regulation of electronic cigarettes or smoking ban in cars in the presence of
children (OECD, 2018).
Graph 88: Smoking* in 15 – 16 year olds, 2015 Graph 89: Daily smoking in adults, 2016
*in the last 30 days Source: OECD (2018) Source: OECD
Diseases related to alcohol consumption132 are the third most common preventable cause of death. In
Slovakia, as much as 42% of adolescents engage in heavy episodic drinking, which is more than in V3
and EU15 countries (Graph 90). The amount of alcohol consumed by adults in Slovakia is similar to EU15
countries (Graph 91). Heavy episodic drinking and also long-term mild drinking contributes to cardiovascular
diseases, liver cirrhosis, some types of cancer, but also to accidents, injuries, violence, killings and suicides. Like
cigarettes, the main policy measure is strict regulation via taxation. In Scotland, price regulation per gram of
alcohol was introduced in order to reduce mainly episodic drinking of cheap alcohol by adolescents and restrict
their access to alcohol (OECD, 2018).
Graph 90: Heavy episodic drinking* in 15 – 16 year
olds, 2015
Graph 91: Alcohol consumption in adults, litres,
2016
*in the last 30 days Source: OECD (2018) Source: OECD
132 For example mental diseases, nervous system degeneration, alcoholic cardiomyopathy, gastritis, hepatitis, liver cirrhosis.
31%28%
21%
0%
5%
10%
15%
20%
25%
30%
35%
SK V3 EU15
23% 23%20%
0%
5%
10%
15%
20%
25%
SK V3 EU15
42%39%
32%
0%
15%
30%
45%
SK V3 EU15
9.911.0
9.9
0
4
8
12
SK V3 EU15
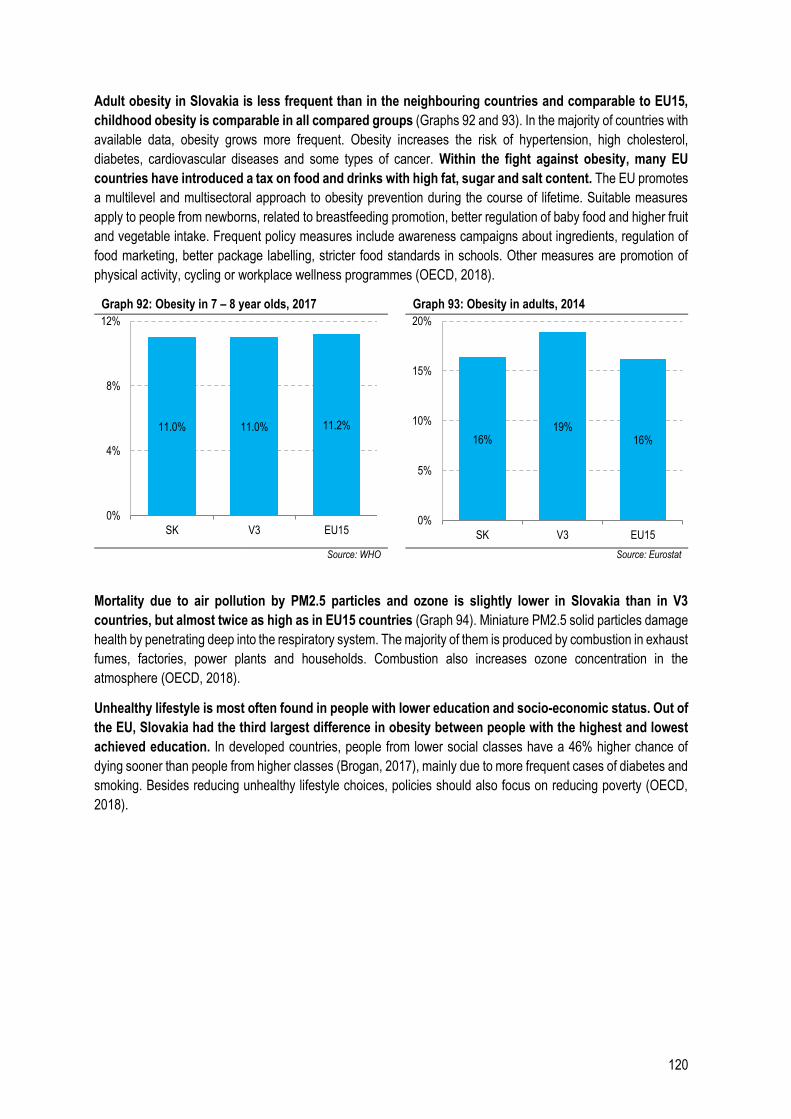
120
Adult obesity in Slovakia is less frequent than in the neighbouring countries and comparable to EU15,
childhood obesity is comparable in all compared groups (Graphs 92 and 93). In the majority of countries with
available data, obesity grows more frequent. Obesity increases the risk of hypertension, high cholesterol,
diabetes, cardiovascular diseases and some types of cancer. Within the fight against obesity, many EU
countries have introduced a tax on food and drinks with high fat, sugar and salt content. The EU promotes
a multilevel and multisectoral approach to obesity prevention during the course of lifetime. Suitable measures
apply to people from newborns, related to breastfeeding promotion, better regulation of baby food and higher fruit
and vegetable intake. Frequent policy measures include awareness campaigns about ingredients, regulation of
food marketing, better package labelling, stricter food standards in schools. Other measures are promotion of
physical activity, cycling or workplace wellness programmes (OECD, 2018).
Graph 92: Obesity in 7 – 8 year olds, 2017 Graph 93: Obesity in adults, 2014
Source: WHO Source: Eurostat
Mortality due to air pollution by PM2.5 particles and ozone is slightly lower in Slovakia than in V3
countries, but almost twice as high as in EU15 countries (Graph 94). Miniature PM2.5 solid particles damage
health by penetrating deep into the respiratory system. The majority of them is produced by combustion in exhaust
fumes, factories, power plants and households. Combustion also increases ozone concentration in the
atmosphere (OECD, 2018).
Unhealthy lifestyle is most often found in people with lower education and socio-economic status. Out of
the EU, Slovakia had the third largest difference in obesity between people with the highest and lowest
achieved education. In developed countries, people from lower social classes have a 46% higher chance of
dying sooner than people from higher classes (Brogan, 2017), mainly due to more frequent cases of diabetes and
smoking. Besides reducing unhealthy lifestyle choices, policies should also focus on reducing poverty (OECD,
2018).
11.0% 11.0% 11.2%
0%
4%
8%
12%
SK V3 EU15
16%19%
16%
0%
5%
10%
15%
20%
SK V3 EU15
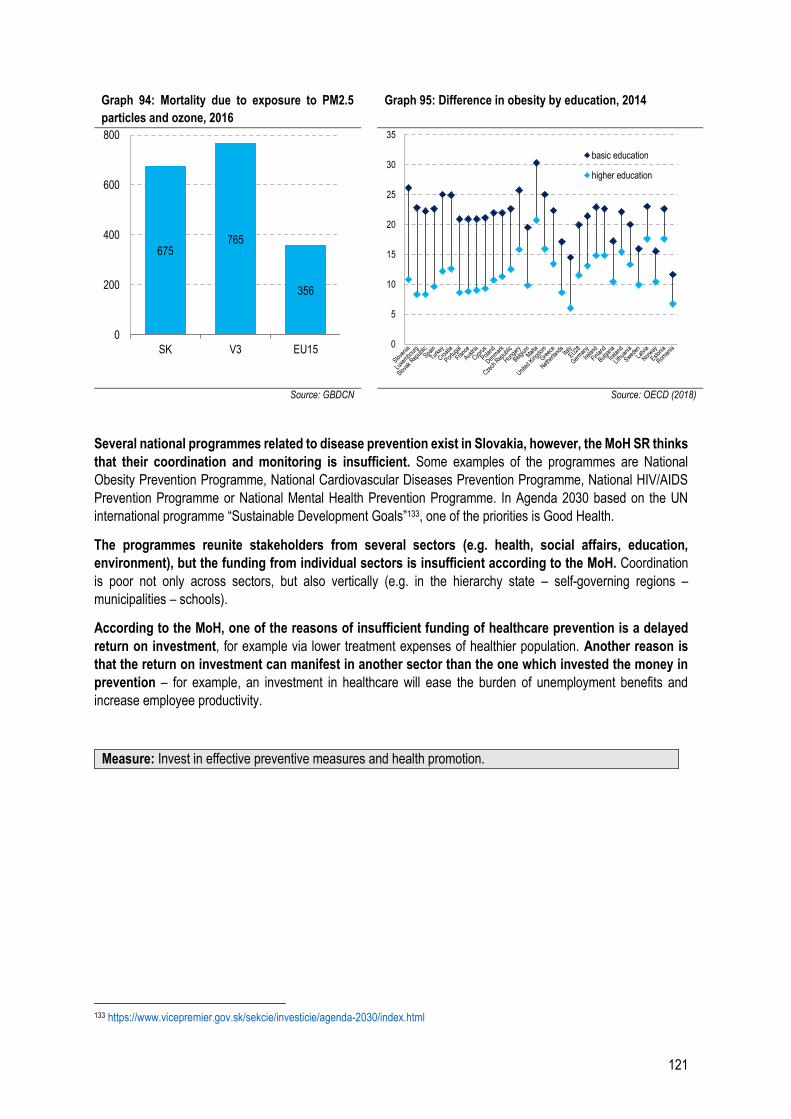
121
Graph 94: Mortality due to exposure to PM2.5
particles and ozone, 2016
Graph 95: Difference in obesity by education, 2014
Source: GBDCN Source: OECD (2018)
Several national programmes related to disease prevention exist in Slovakia, however, the MoH SR thinks
that their coordination and monitoring is insufficient. Some examples of the programmes are National
Obesity Prevention Programme, National Cardiovascular Diseases Prevention Programme, National HIV/AIDS
Prevention Programme or National Mental Health Prevention Programme. In Agenda 2030 based on the UN
international programme “Sustainable Development Goals”133, one of the priorities is Good Health.
The programmes reunite stakeholders from several sectors (e.g. health, social affairs, education,
environment), but the funding from individual sectors is insufficient according to the MoH. Coordination
is poor not only across sectors, but also vertically (e.g. in the hierarchy state – self-governing regions –
municipalities – schools).
According to the MoH, one of the reasons of insufficient funding of healthcare prevention is a delayed
return on investment, for example via lower treatment expenses of healthier population. Another reason is
that the return on investment can manifest in another sector than the one which invested the money in
prevention – for example, an investment in healthcare will ease the burden of unemployment benefits and
increase employee productivity.
Measure: Invest in effective preventive measures and health promotion.
133 https://www.vicepremier.gov.sk/sekcie/investicie/agenda-2030/index.html
675765
356
0
200
400
600
800
SK V3 EU150
5
10
15
20
25
30
35
basic education
higher education
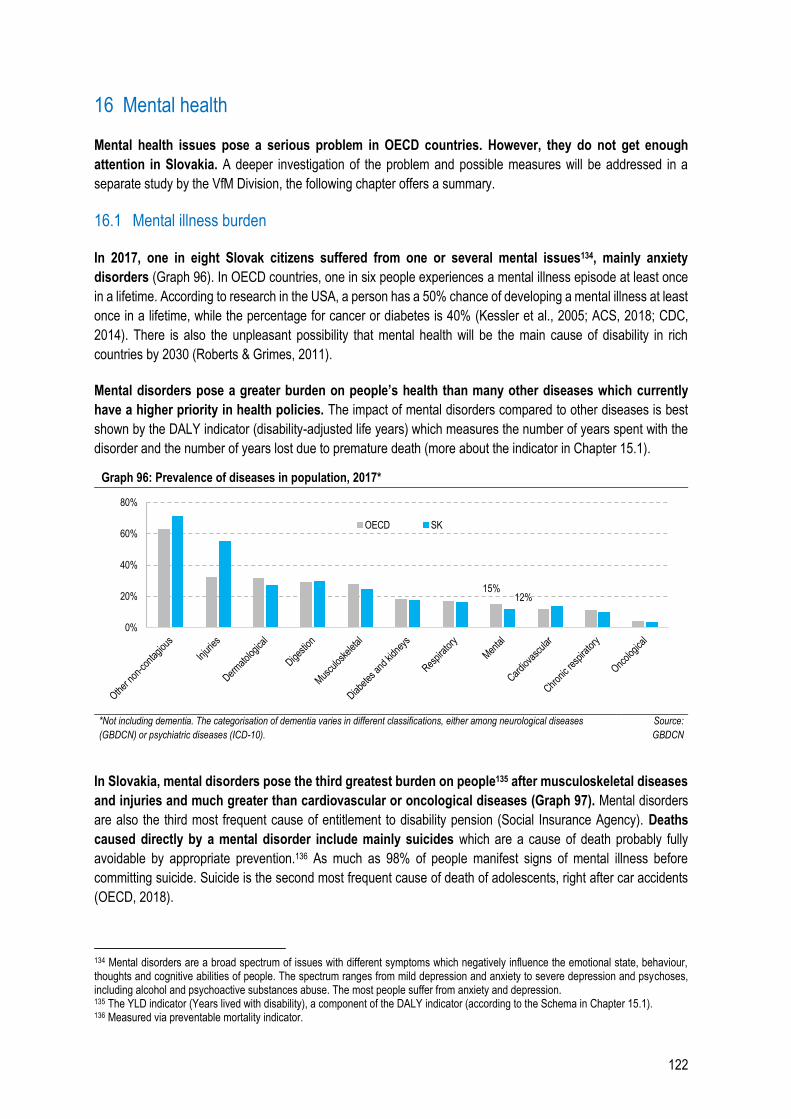
122
16 Mental health
Mental health issues pose a serious problem in OECD countries. However, they do not get enough
attention in Slovakia. A deeper investigation of the problem and possible measures will be addressed in a
separate study by the VfM Division, the following chapter offers a summary.
16.1 Mental illness burden
In 2017, one in eight Slovak citizens suffered from one or several mental issues134, mainly anxiety
disorders (Graph 96). In OECD countries, one in six people experiences a mental illness episode at least once
in a lifetime. According to research in the USA, a person has a 50% chance of developing a mental illness at least
once in a lifetime, while the percentage for cancer or diabetes is 40% (Kessler et al., 2005; ACS, 2018; CDC,
2014). There is also the unpleasant possibility that mental health will be the main cause of disability in rich
countries by 2030 (Roberts & Grimes, 2011).
Mental disorders pose a greater burden on people’s health than many other diseases which currently
have a higher priority in health policies. The impact of mental disorders compared to other diseases is best
shown by the DALY indicator (disability-adjusted life years) which measures the number of years spent with the
disorder and the number of years lost due to premature death (more about the indicator in Chapter 15.1).
Graph 96: Prevalence of diseases in population, 2017*
*Not including dementia. The categorisation of dementia varies in different classifications, either among neurological diseases
(GBDCN) or psychiatric diseases (ICD-10).
Source:
GBDCN
In Slovakia, mental disorders pose the third greatest burden on people135 after musculoskeletal diseases
and injuries and much greater than cardiovascular or oncological diseases (Graph 97). Mental disorders
are also the third most frequent cause of entitlement to disability pension (Social Insurance Agency). Deaths
caused directly by a mental disorder include mainly suicides which are a cause of death probably fully
avoidable by appropriate prevention.136 As much as 98% of people manifest signs of mental illness before
committing suicide. Suicide is the second most frequent cause of death of adolescents, right after car accidents
(OECD, 2018).
134 Mental disorders are a broad spectrum of issues with different symptoms which negatively influence the emotional state, behaviour, thoughts and cognitive abilities of people. The spectrum ranges from mild depression and anxiety to severe depression and psychoses, including alcohol and psychoactive substances abuse. The most people suffer from anxiety and depression. 135 The YLD indicator (Years lived with disability), a component of the DALY indicator (according to the Schema in Chapter 15.1). 136 Measured via preventable mortality indicator.
15%12%
0%
20%
40%
60%
80%
OECD SK
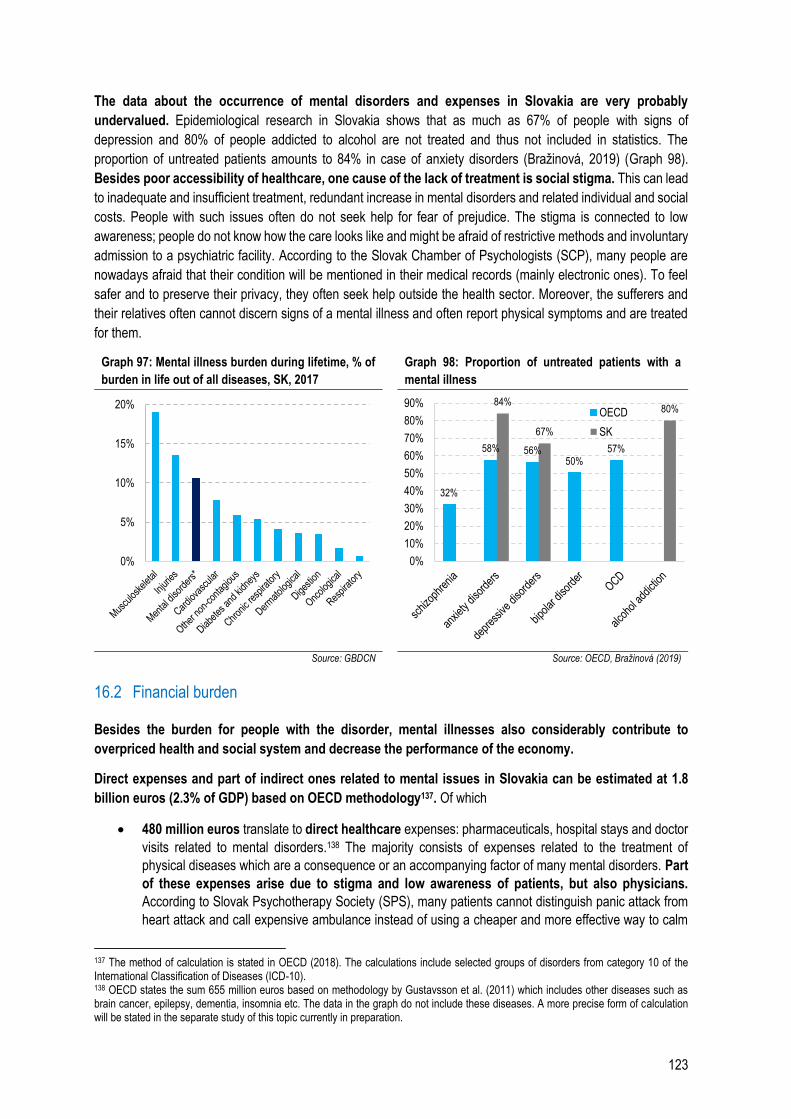
123
The data about the occurrence of mental disorders and expenses in Slovakia are very probably
undervalued. Epidemiological research in Slovakia shows that as much as 67% of people with signs of
depression and 80% of people addicted to alcohol are not treated and thus not included in statistics. The
proportion of untreated patients amounts to 84% in case of anxiety disorders (Bražinová, 2019) (Graph 98).
Besides poor accessibility of healthcare, one cause of the lack of treatment is social stigma. This can lead
to inadequate and insufficient treatment, redundant increase in mental disorders and related individual and social
costs. People with such issues often do not seek help for fear of prejudice. The stigma is connected to low
awareness; people do not know how the care looks like and might be afraid of restrictive methods and involuntary
admission to a psychiatric facility. According to the Slovak Chamber of Psychologists (SCP), many people are
nowadays afraid that their condition will be mentioned in their medical records (mainly electronic ones). To feel
safer and to preserve their privacy, they often seek help outside the health sector. Moreover, the sufferers and
their relatives often cannot discern signs of a mental illness and often report physical symptoms and are treated
for them.
Graph 97: Mental illness burden during lifetime, % of
burden in life out of all diseases, SK, 2017 Graph 98: Proportion of untreated patients with a
mental illness
Source: GBDCN Source: OECD, Bražinová (2019)
16.2 Financial burden
Besides the burden for people with the disorder, mental illnesses also considerably contribute to
overpriced health and social system and decrease the performance of the economy.
Direct expenses and part of indirect ones related to mental issues in Slovakia can be estimated at 1.8
billion euros (2.3% of GDP) based on OECD methodology137. Of which
480 million euros translate to direct healthcare expenses: pharmaceuticals, hospital stays and doctor
visits related to mental disorders.138 The majority consists of expenses related to the treatment of
physical diseases which are a consequence or an accompanying factor of many mental disorders. Part
of these expenses arise due to stigma and low awareness of patients, but also physicians.
According to Slovak Psychotherapy Society (SPS), many patients cannot distinguish panic attack from
heart attack and call expensive ambulance instead of using a cheaper and more effective way to calm
137 The method of calculation is stated in OECD (2018). The calculations include selected groups of disorders from category 10 of the International Classification of Diseases (ICD-10). 138 OECD states the sum 655 million euros based on methodology by Gustavsson et al. (2011) which includes other diseases such as brain cancer, epilepsy, dementia, insomnia etc. The data in the graph do not include these diseases. A more precise form of calculation will be stated in the separate study of this topic currently in preparation.
0%
5%
10%
15%
20%
32%
58% 56%50%
57%
84%
67%
80%
0%
10%
20%
30%
40%
50%
60%
70%
80%
90%OECD
SK
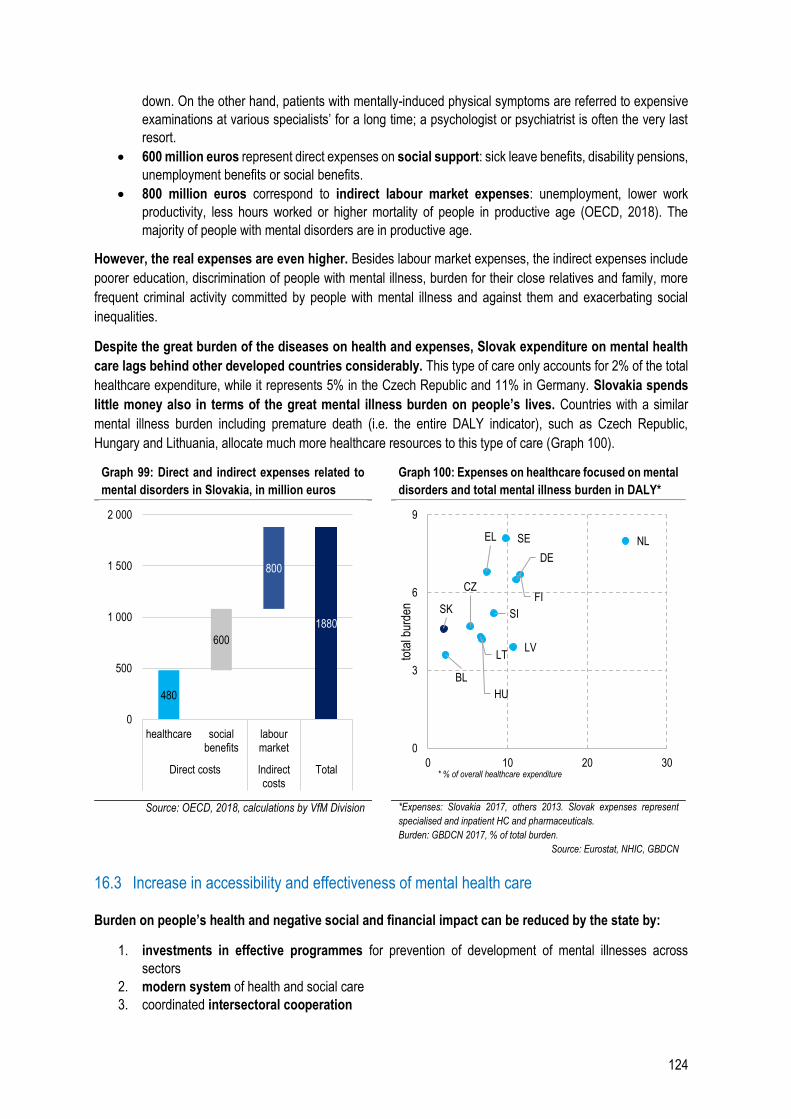
124
down. On the other hand, patients with mentally-induced physical symptoms are referred to expensive
examinations at various specialists’ for a long time; a psychologist or psychiatrist is often the very last
resort.
600 million euros represent direct expenses on social support: sick leave benefits, disability pensions,
unemployment benefits or social benefits.
800 million euros correspond to indirect labour market expenses: unemployment, lower work
productivity, less hours worked or higher mortality of people in productive age (OECD, 2018). The
majority of people with mental disorders are in productive age.
However, the real expenses are even higher. Besides labour market expenses, the indirect expenses include
poorer education, discrimination of people with mental illness, burden for their close relatives and family, more
frequent criminal activity committed by people with mental illness and against them and exacerbating social
inequalities.
Despite the great burden of the diseases on health and expenses, Slovak expenditure on mental health
care lags behind other developed countries considerably. This type of care only accounts for 2% of the total
healthcare expenditure, while it represents 5% in the Czech Republic and 11% in Germany. Slovakia spends
little money also in terms of the great mental illness burden on people’s lives. Countries with a similar
mental illness burden including premature death (i.e. the entire DALY indicator), such as Czech Republic,
Hungary and Lithuania, allocate much more healthcare resources to this type of care (Graph 100).
Graph 99: Direct and indirect expenses related to
mental disorders in Slovakia, in million euros
Graph 100: Expenses on healthcare focused on mental
disorders and total mental illness burden in DALY*
Source: OECD, 2018, calculations by VfM Division *Expenses: Slovakia 2017, others 2013. Slovak expenses represent
specialised and inpatient HC and pharmaceuticals.
Burden: GBDCN 2017, % of total burden.
Source: Eurostat, NHIC, GBDCN
16.3 Increase in accessibility and effectiveness of mental health care
Burden on people’s health and negative social and financial impact can be reduced by the state by:
1. investments in effective programmes for prevention of development of mental illnesses across
sectors
2. modern system of health and social care
3. coordinated intersectoral cooperation
480
1880
600
800
0
500
1 000
1 500
2 000
healthcare socialbenefits
labourmarket
Direct costs Indirectcosts
Total
BL
CZ
DE
EL
LVLT
HU
NL
SI
FI
SE
SK
0
3
6
9
0 10 20 30
tota
l bur
den
* % of overall healthcare expenditure
125
4. investments in research
Investments in prevention and health promotion programmes Investments in prevention programmes against development of mental disorders across sectors are one
of the most effective mental health measures and have a high return on investment (Patel et al., 2016).
One example can be found in the latest effectiveness analysis of eight selected programmes in healthcare,
education and social affairs which bring in 1.3 to 39 pounds per 1 invested pound in the UK in ten years,139
of which 1.26 pounds on average already in the first year (Public Health England, 2017). Measures with the
highest return on investment concerned self-harm prevention and social and emotional skills courses in schools.
Return on investment is reflected in saved money which would otherwise be spent on healthcare, police and legal
sector, also in improved school and employee attendance, higher employment rate and productivity.
An effective tool to identify appropriate measures is distribution by age groups because different risk
factors influence people of different ages. Measures focused on mental health promotion in early childhood
are the most effective. The period until three years of age is crucial for correct biological, cognitive and emotional
development of a child because the brain develops at the fastest pace. The concept of higher return on investment
in human resources in early childhood was mentioned also by economist James Heckman (2008). School is an
ideal place to tackle mental health of children and adolescents, mainly thanks to compulsory education.
Workplaces and employment promotion services are the most suitable places to intervene in adult population.
The importance of care not only about the physical, but also mental health of the elderly increases with
population ageing in European countries. Recommended measures for other age groups are summarised
in Table 41.
Table 41: Health promotion and prevention programmes per age group
Age group Types of programmes ROI per 1 invested pound (PHE, 2017)
Early childhood
• healthcare and social care for pregnant women, appropriate childbirth procedures and active support several weeks after childbirth (see Chapter Childbirth) • support programmes for play of children and parents and parenting skills
-
School age
• emotional literacy training for pupils, i.e. how to understand and contain one’s emotions, social skills development for children • educational skills training for parents, mainly in combination with prevention of behavioural difficulties in children • prevention and problem-solving programmes for bullying
5.1 pounds in 2 years
People in productive age
• employee stress prevention, screening, awareness, support of employees with mental disorders, prevention for the unemployed with no disorder and support of the unemployed with a disorder
2 – 2.4 pounds
The elderly • community programmes, hobby groups and senior clubs, intergenerational activities, senior volunteering or volunteer visits to less mobile seniors
1.3 pounds
Source: OECD, World Bank, PHE (2017)
In prevention, it is important to focus on factors which affect vulnerable groups and people regardless of
age. Risk factors include chronic diseases, family feuds, physical and sexual violence, loss of a close person,
long-term care of a sick relative, exposure to war, natural catastrophe and toxins. There are also interventions
which can help all population groups, such as reducing the stigma and raising awareness of mental health issues,
targeted screenings, human rights protection, cooperation of the police and justice in order to resolve family
conflicts, suicide prevention, reduction of the accessibility of alcohol. Especially vulnerable groups include people
at risk of poverty, the homeless, migrants and asylum seekers, members of the LGBT community and prisoners.
There are targeted programmes in Slovakia for almost all the aforementioned areas and population
groups, however, they are not a systemic solution. The majority of them are conducted by non-governmental
139 Individual interventions last for different periods of time (Table 41, column 3).
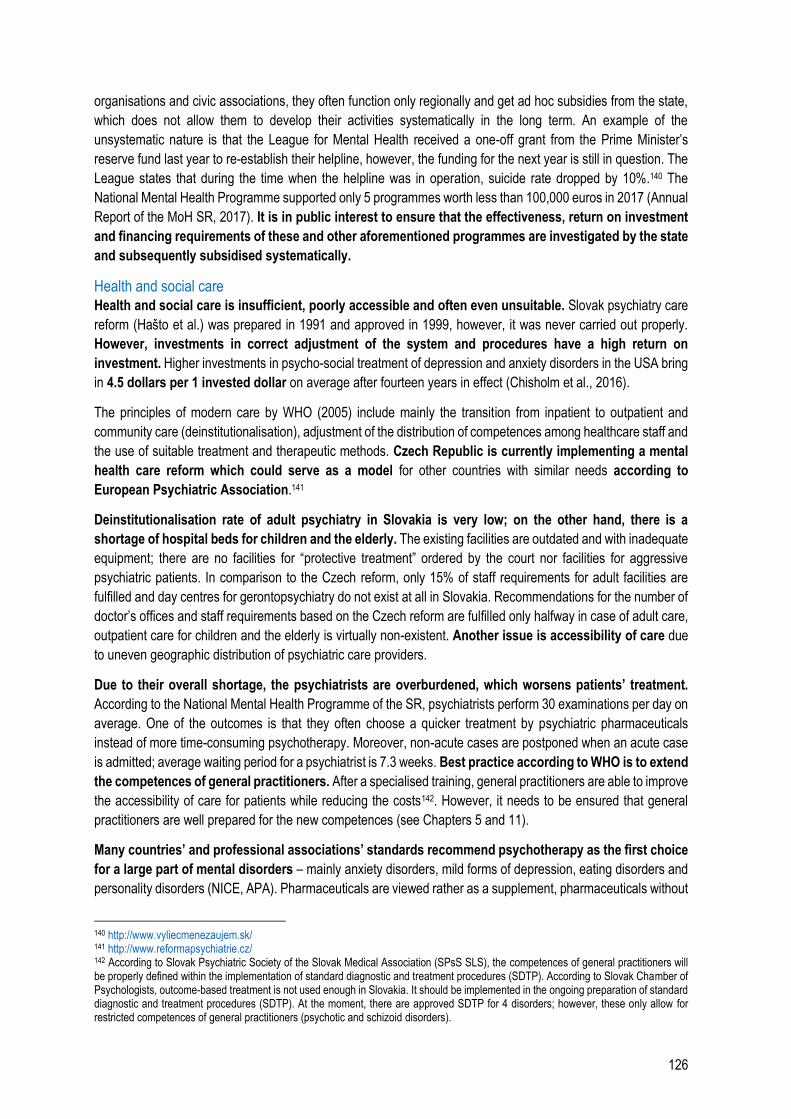
126
organisations and civic associations, they often function only regionally and get ad hoc subsidies from the state,
which does not allow them to develop their activities systematically in the long term. An example of the
unsystematic nature is that the League for Mental Health received a one-off grant from the Prime Minister’s
reserve fund last year to re-establish their helpline, however, the funding for the next year is still in question. The
League states that during the time when the helpline was in operation, suicide rate dropped by 10%.140 The
National Mental Health Programme supported only 5 programmes worth less than 100,000 euros in 2017 (Annual
Report of the MoH SR, 2017). It is in public interest to ensure that the effectiveness, return on investment
and financing requirements of these and other aforementioned programmes are investigated by the state
and subsequently subsidised systematically.
Health and social care Health and social care is insufficient, poorly accessible and often even unsuitable. Slovak psychiatry care
reform (Hašto et al.) was prepared in 1991 and approved in 1999, however, it was never carried out properly.
However, investments in correct adjustment of the system and procedures have a high return on
investment. Higher investments in psycho-social treatment of depression and anxiety disorders in the USA bring
in 4.5 dollars per 1 invested dollar on average after fourteen years in effect (Chisholm et al., 2016).
The principles of modern care by WHO (2005) include mainly the transition from inpatient to outpatient and
community care (deinstitutionalisation), adjustment of the distribution of competences among healthcare staff and
the use of suitable treatment and therapeutic methods. Czech Republic is currently implementing a mental
health care reform which could serve as a model for other countries with similar needs according to
European Psychiatric Association.141
Deinstitutionalisation rate of adult psychiatry in Slovakia is very low; on the other hand, there is a
shortage of hospital beds for children and the elderly. The existing facilities are outdated and with inadequate
equipment; there are no facilities for “protective treatment” ordered by the court nor facilities for aggressive
psychiatric patients. In comparison to the Czech reform, only 15% of staff requirements for adult facilities are
fulfilled and day centres for gerontopsychiatry do not exist at all in Slovakia. Recommendations for the number of
doctor’s offices and staff requirements based on the Czech reform are fulfilled only halfway in case of adult care,
outpatient care for children and the elderly is virtually non-existent. Another issue is accessibility of care due
to uneven geographic distribution of psychiatric care providers.
Due to their overall shortage, the psychiatrists are overburdened, which worsens patients’ treatment.
According to the National Mental Health Programme of the SR, psychiatrists perform 30 examinations per day on
average. One of the outcomes is that they often choose a quicker treatment by psychiatric pharmaceuticals
instead of more time-consuming psychotherapy. Moreover, non-acute cases are postponed when an acute case
is admitted; average waiting period for a psychiatrist is 7.3 weeks. Best practice according to WHO is to extend
the competences of general practitioners. After a specialised training, general practitioners are able to improve
the accessibility of care for patients while reducing the costs142. However, it needs to be ensured that general
practitioners are well prepared for the new competences (see Chapters 5 and 11).
Many countries’ and professional associations’ standards recommend psychotherapy as the first choice
for a large part of mental disorders – mainly anxiety disorders, mild forms of depression, eating disorders and
personality disorders (NICE, APA). Pharmaceuticals are viewed rather as a supplement, pharmaceuticals without
140 http://www.vyliecmenezaujem.sk/ 141 http://www.reformapsychiatrie.cz/ 142 According to Slovak Psychiatric Society of the Slovak Medical Association (SPsS SLS), the competences of general practitioners will be properly defined within the implementation of standard diagnostic and treatment procedures (SDTP). According to Slovak Chamber of Psychologists, outcome-based treatment is not used enough in Slovakia. It should be implemented in the ongoing preparation of standard diagnostic and treatment procedures (SDTP). At the moment, there are approved SDTP for 4 disorders; however, these only allow for restricted competences of general practitioners (psychotic and schizoid disorders).
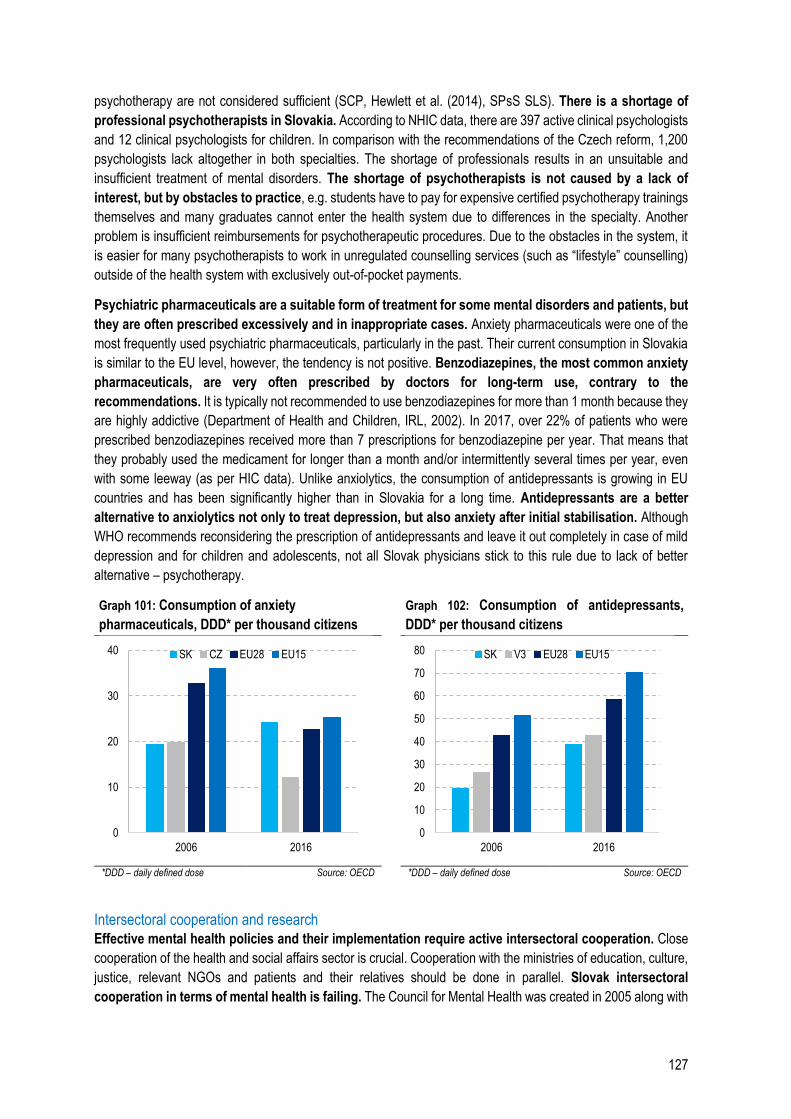
127
psychotherapy are not considered sufficient (SCP, Hewlett et al. (2014), SPsS SLS). There is a shortage of
professional psychotherapists in Slovakia. According to NHIC data, there are 397 active clinical psychologists
and 12 clinical psychologists for children. In comparison with the recommendations of the Czech reform, 1,200
psychologists lack altogether in both specialties. The shortage of professionals results in an unsuitable and
insufficient treatment of mental disorders. The shortage of psychotherapists is not caused by a lack of
interest, but by obstacles to practice, e.g. students have to pay for expensive certified psychotherapy trainings
themselves and many graduates cannot enter the health system due to differences in the specialty. Another
problem is insufficient reimbursements for psychotherapeutic procedures. Due to the obstacles in the system, it
is easier for many psychotherapists to work in unregulated counselling services (such as “lifestyle” counselling)
outside of the health system with exclusively out-of-pocket payments.
Psychiatric pharmaceuticals are a suitable form of treatment for some mental disorders and patients, but
they are often prescribed excessively and in inappropriate cases. Anxiety pharmaceuticals were one of the
most frequently used psychiatric pharmaceuticals, particularly in the past. Their current consumption in Slovakia
is similar to the EU level, however, the tendency is not positive. Benzodiazepines, the most common anxiety
pharmaceuticals, are very often prescribed by doctors for long-term use, contrary to the
recommendations. It is typically not recommended to use benzodiazepines for more than 1 month because they
are highly addictive (Department of Health and Children, IRL, 2002). In 2017, over 22% of patients who were
prescribed benzodiazepines received more than 7 prescriptions for benzodiazepine per year. That means that
they probably used the medicament for longer than a month and/or intermittently several times per year, even
with some leeway (as per HIC data). Unlike anxiolytics, the consumption of antidepressants is growing in EU
countries and has been significantly higher than in Slovakia for a long time. Antidepressants are a better
alternative to anxiolytics not only to treat depression, but also anxiety after initial stabilisation. Although
WHO recommends reconsidering the prescription of antidepressants and leave it out completely in case of mild
depression and for children and adolescents, not all Slovak physicians stick to this rule due to lack of better
alternative – psychotherapy.
Graph 101: Consumption of anxiety
pharmaceuticals, DDD* per thousand citizens
Graph 102: Consumption of antidepressants,
DDD* per thousand citizens
*DDD – daily defined dose Source: OECD *DDD – daily defined dose Source: OECD
Intersectoral cooperation and research Effective mental health policies and their implementation require active intersectoral cooperation. Close
cooperation of the health and social affairs sector is crucial. Cooperation with the ministries of education, culture,
justice, relevant NGOs and patients and their relatives should be done in parallel. Slovak intersectoral
cooperation in terms of mental health is failing. The Council for Mental Health was created in 2005 along with
0
10
20
30
40
2006 2016
SK CZ EU28 EU15
0
10
20
30
40
50
60
70
80
2006 2016
SK V3 EU28 EU15
128
the National Mental Health Programme and an Action Plan. According to SPsS SLS, only the bare minimum of
the necessary changes correctly outlined in the National Programme has been implemented and the Action Plan
supports various initiatives insufficiently and unsystematically. The cooperation between the health sector and
social system is virtually non-existent. However, the National Programme states that a person with mental
disorder is having a hard time taking care of themselves after being discharged from a healthcare facility, often
stops the treatment and their condition worsens unnecessarily.
To correctly adjust the system and monitor mental health outcomes, it is necessary to promote research,
mainly in terms of epidemiology. An overall picture of the real occurrence of mental disorders in Slovakia does
not exist even though it is the starting point for the next steps.
Measures:
Health and social care – update psychiatric care reform based on the example of ongoing reform in
the Czech Republic, focusing on the foundation of community centres and increasing staff
capacities. The Czech reform was approved in 2013 with a budget of 6 billion CZK for the first 5
years of implementation, which amounts to 113 million euros in Slovakia (adjusted by the
population)
Conduct epidemiology research to ascertain the real occurrence and disease burden in Slovakia
Create a strong intersectoral cooperation, mainly of the MoH SR and the MoLSAF and prepare a
common prevention and care strategy
Prevention and health promotion programmes – identify effective programmes, launch pilot
programmes, subsequently evaluate and extend them with a considerable and long-term financial
support from the state. Cover all groups with an emphasis on younger age groups.
Prepare standard procedures for mental diseases, focusing on psychotherapy and less
pharmacotherapy. Incorporate diagnostics and treatment of psychological symptoms into SDTP for
physical diseases.
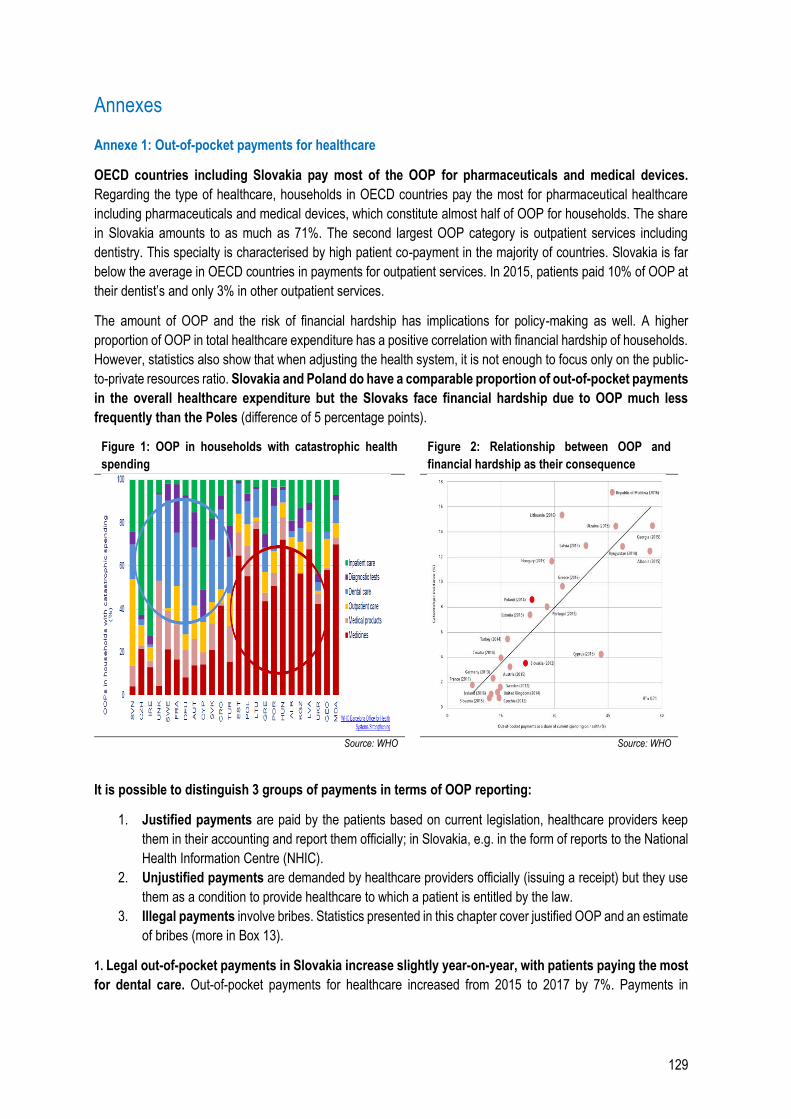
129
Annexes
Annexe 1: Out-of-pocket payments for healthcare
OECD countries including Slovakia pay most of the OOP for pharmaceuticals and medical devices.
Regarding the type of healthcare, households in OECD countries pay the most for pharmaceutical healthcare
including pharmaceuticals and medical devices, which constitute almost half of OOP for households. The share
in Slovakia amounts to as much as 71%. The second largest OOP category is outpatient services including
dentistry. This specialty is characterised by high patient co-payment in the majority of countries. Slovakia is far
below the average in OECD countries in payments for outpatient services. In 2015, patients paid 10% of OOP at
their dentist’s and only 3% in other outpatient services.
The amount of OOP and the risk of financial hardship has implications for policy-making as well. A higher
proportion of OOP in total healthcare expenditure has a positive correlation with financial hardship of households.
However, statistics also show that when adjusting the health system, it is not enough to focus only on the public-
to-private resources ratio. Slovakia and Poland do have a comparable proportion of out-of-pocket payments
in the overall healthcare expenditure but the Slovaks face financial hardship due to OOP much less
frequently than the Poles (difference of 5 percentage points).
Figure 1: OOP in households with catastrophic health
spending
Figure 2: Relationship between OOP and
financial hardship as their consequence
Source: WHO Source: WHO
It is possible to distinguish 3 groups of payments in terms of OOP reporting:
1. Justified payments are paid by the patients based on current legislation, healthcare providers keep
them in their accounting and report them officially; in Slovakia, e.g. in the form of reports to the National
Health Information Centre (NHIC).
2. Unjustified payments are demanded by healthcare providers officially (issuing a receipt) but they use
them as a condition to provide healthcare to which a patient is entitled by the law.
3. Illegal payments involve bribes. Statistics presented in this chapter cover justified OOP and an estimate
of bribes (more in Box 13).
1. Legal out-of-pocket payments in Slovakia increase slightly year-on-year, with patients paying the most
for dental care. Out-of-pocket payments for healthcare increased from 2015 to 2017 by 7%. Payments in
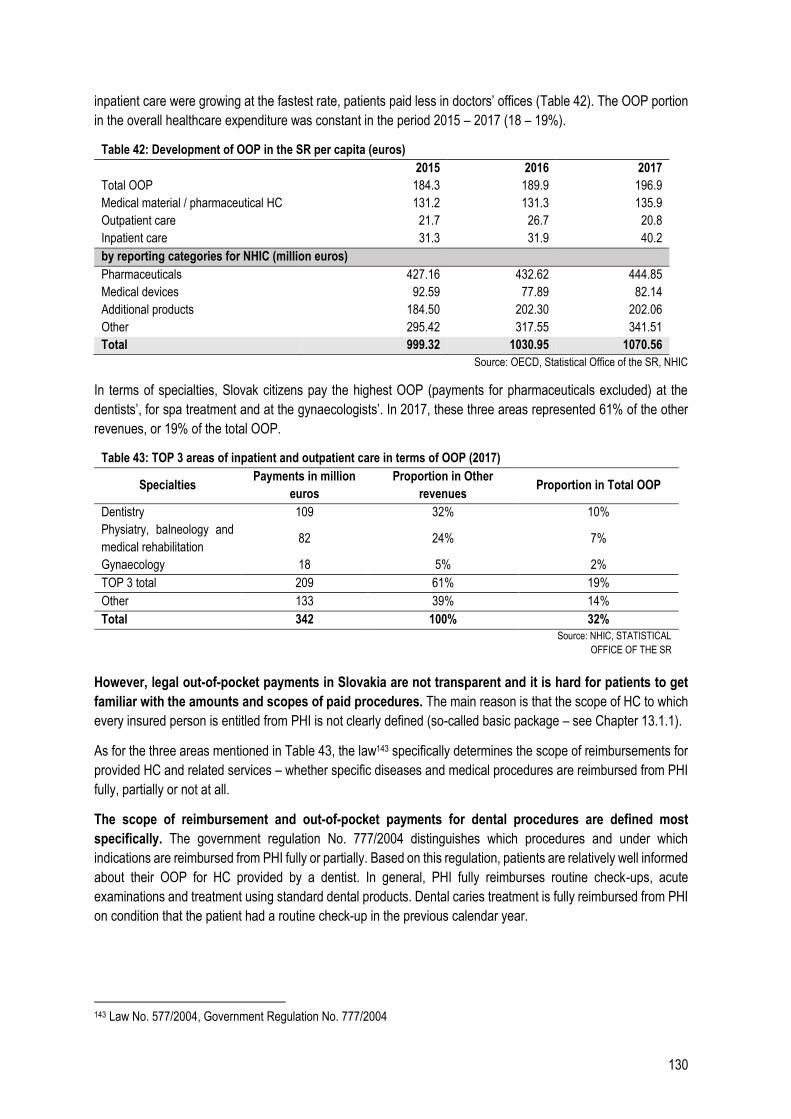
130
inpatient care were growing at the fastest rate, patients paid less in doctors’ offices (Table 42). The OOP portion
in the overall healthcare expenditure was constant in the period 2015 – 2017 (18 – 19%).
Table 42: Development of OOP in the SR per capita (euros)
2015 2016 2017
Total OOP 184.3 189.9 196.9
Medical material / pharmaceutical HC 131.2 131.3 135.9
Outpatient care 21.7 26.7 20.8
Inpatient care 31.3 31.9 40.2
by reporting categories for NHIC (million euros)
Pharmaceuticals 427.16 432.62 444.85
Medical devices 92.59 77.89 82.14
Additional products 184.50 202.30 202.06
Other 295.42 317.55 341.51
Total 999.32 1030.95 1070.56
Source: OECD, Statistical Office of the SR, NHIC
In terms of specialties, Slovak citizens pay the highest OOP (payments for pharmaceuticals excluded) at the
dentists’, for spa treatment and at the gynaecologists’. In 2017, these three areas represented 61% of the other
revenues, or 19% of the total OOP.
Table 43: TOP 3 areas of inpatient and outpatient care in terms of OOP (2017)
Specialties Payments in million
euros
Proportion in Other
revenues Proportion in Total OOP
Dentistry 109 32% 10%
Physiatry, balneology and
medical rehabilitation 82 24% 7%
Gynaecology 18 5% 2%
TOP 3 total 209 61% 19%
Other 133 39% 14%
Total 342 100% 32%
Source: NHIC, STATISTICAL
OFFICE OF THE SR
However, legal out-of-pocket payments in Slovakia are not transparent and it is hard for patients to get
familiar with the amounts and scopes of paid procedures. The main reason is that the scope of HC to which
every insured person is entitled from PHI is not clearly defined (so-called basic package – see Chapter 13.1.1).
As for the three areas mentioned in Table 43, the law143 specifically determines the scope of reimbursements for
provided HC and related services – whether specific diseases and medical procedures are reimbursed from PHI
fully, partially or not at all.
The scope of reimbursement and out-of-pocket payments for dental procedures are defined most
specifically. The government regulation No. 777/2004 distinguishes which procedures and under which
indications are reimbursed from PHI fully or partially. Based on this regulation, patients are relatively well informed
about their OOP for HC provided by a dentist. In general, PHI fully reimburses routine check-ups, acute
examinations and treatment using standard dental products. Dental caries treatment is fully reimbursed from PHI
on condition that the patient had a routine check-up in the previous calendar year.
143 Law No. 577/2004, Government Regulation No. 777/2004
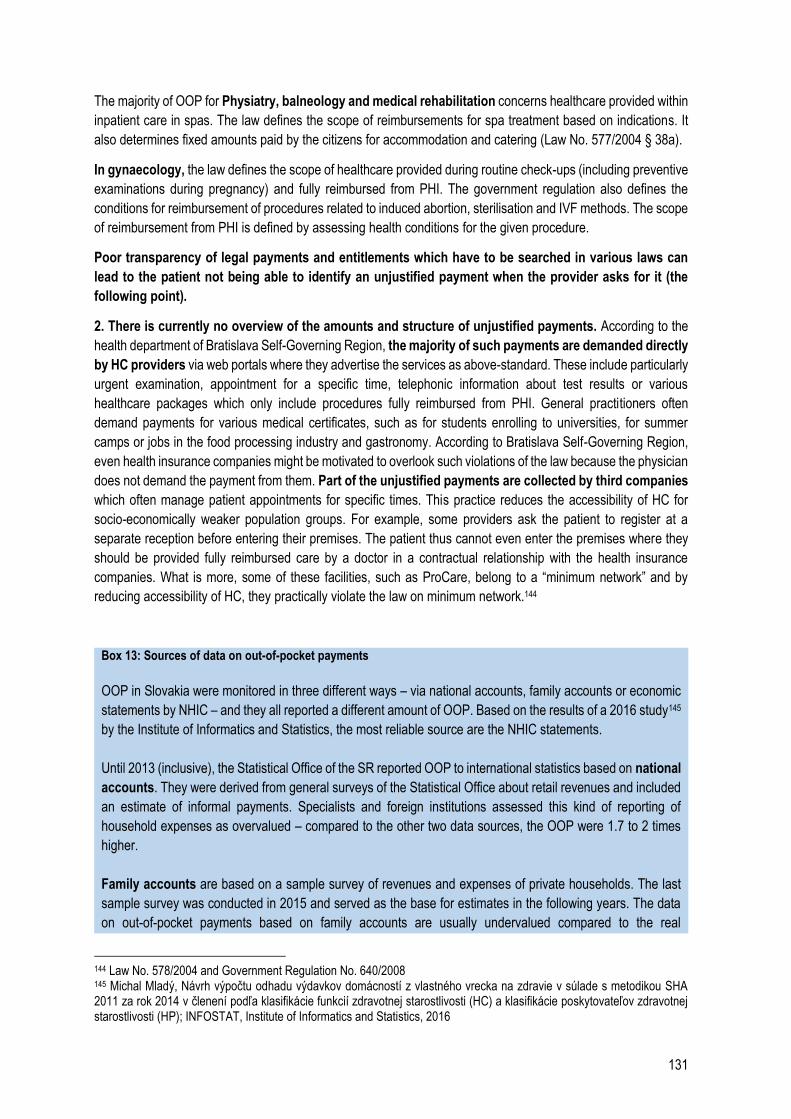
131
The majority of OOP for Physiatry, balneology and medical rehabilitation concerns healthcare provided within
inpatient care in spas. The law defines the scope of reimbursements for spa treatment based on indications. It
also determines fixed amounts paid by the citizens for accommodation and catering (Law No. 577/2004 § 38a).
In gynaecology, the law defines the scope of healthcare provided during routine check-ups (including preventive
examinations during pregnancy) and fully reimbursed from PHI. The government regulation also defines the
conditions for reimbursement of procedures related to induced abortion, sterilisation and IVF methods. The scope
of reimbursement from PHI is defined by assessing health conditions for the given procedure.
Poor transparency of legal payments and entitlements which have to be searched in various laws can
lead to the patient not being able to identify an unjustified payment when the provider asks for it (the
following point).
2. There is currently no overview of the amounts and structure of unjustified payments. According to the
health department of Bratislava Self-Governing Region, the majority of such payments are demanded directly
by HC providers via web portals where they advertise the services as above-standard. These include particularly
urgent examination, appointment for a specific time, telephonic information about test results or various
healthcare packages which only include procedures fully reimbursed from PHI. General practitioners often
demand payments for various medical certificates, such as for students enrolling to universities, for summer
camps or jobs in the food processing industry and gastronomy. According to Bratislava Self-Governing Region,
even health insurance companies might be motivated to overlook such violations of the law because the physician
does not demand the payment from them. Part of the unjustified payments are collected by third companies
which often manage patient appointments for specific times. This practice reduces the accessibility of HC for
socio-economically weaker population groups. For example, some providers ask the patient to register at a
separate reception before entering their premises. The patient thus cannot even enter the premises where they
should be provided fully reimbursed care by a doctor in a contractual relationship with the health insurance
companies. What is more, some of these facilities, such as ProCare, belong to a “minimum network” and by
reducing accessibility of HC, they practically violate the law on minimum network.144
Box 13: Sources of data on out-of-pocket payments
OOP in Slovakia were monitored in three different ways – via national accounts, family accounts or economic
statements by NHIC – and they all reported a different amount of OOP. Based on the results of a 2016 study145
by the Institute of Informatics and Statistics, the most reliable source are the NHIC statements.
Until 2013 (inclusive), the Statistical Office of the SR reported OOP to international statistics based on national
accounts. They were derived from general surveys of the Statistical Office about retail revenues and included
an estimate of informal payments. Specialists and foreign institutions assessed this kind of reporting of
household expenses as overvalued – compared to the other two data sources, the OOP were 1.7 to 2 times
higher.
Family accounts are based on a sample survey of revenues and expenses of private households. The last
sample survey was conducted in 2015 and served as the base for estimates in the following years. The data
on out-of-pocket payments based on family accounts are usually undervalued compared to the real
144 Law No. 578/2004 and Government Regulation No. 640/2008 145 Michal Mladý, Návrh výpočtu odhadu výdavkov domácností z vlastného vrecka na zdravie v súlade s metodikou SHA 2011 za rok 2014 v členení podľa klasifikácie funkcií zdravotnej starostlivosti (HC) a klasifikácie poskytovateľov zdravotnej starostlivosti (HP); INFOSTAT, Institute of Informatics and Statistics, 2016
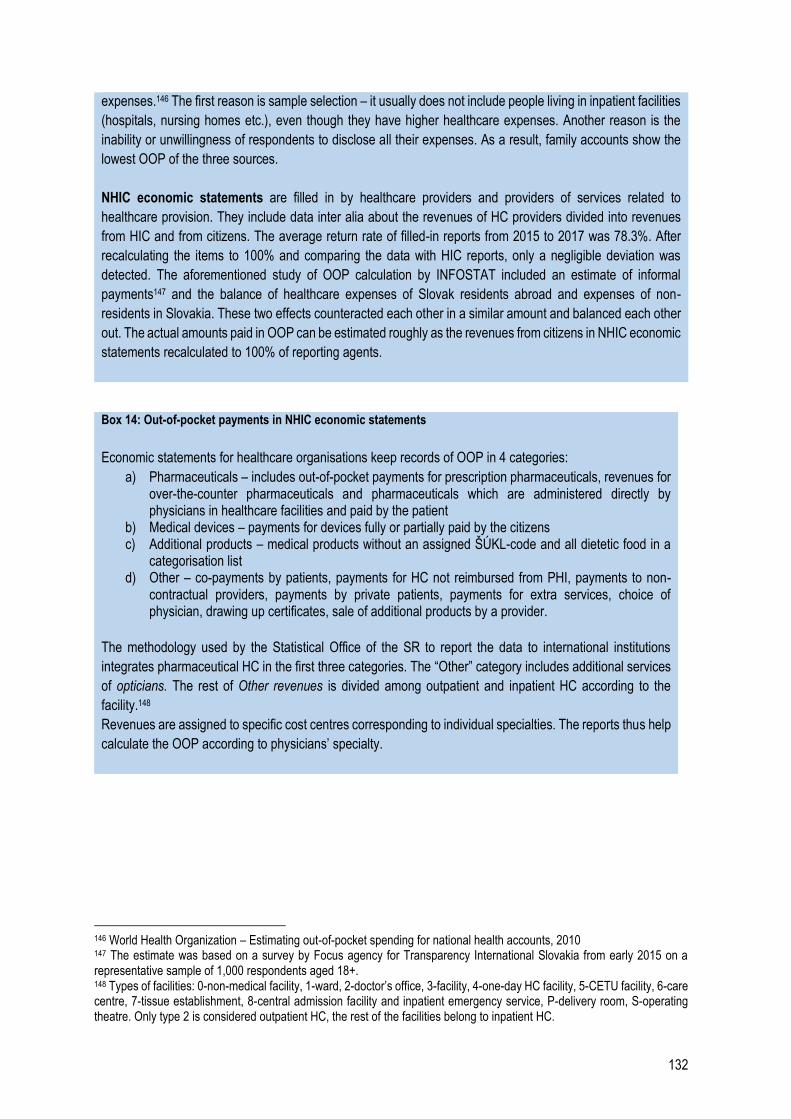
132
expenses.146 The first reason is sample selection – it usually does not include people living in inpatient facilities
(hospitals, nursing homes etc.), even though they have higher healthcare expenses. Another reason is the
inability or unwillingness of respondents to disclose all their expenses. As a result, family accounts show the
lowest OOP of the three sources.
NHIC economic statements are filled in by healthcare providers and providers of services related to
healthcare provision. They include data inter alia about the revenues of HC providers divided into revenues
from HIC and from citizens. The average return rate of filled-in reports from 2015 to 2017 was 78.3%. After
recalculating the items to 100% and comparing the data with HIC reports, only a negligible deviation was
detected. The aforementioned study of OOP calculation by INFOSTAT included an estimate of informal
payments147 and the balance of healthcare expenses of Slovak residents abroad and expenses of non-
residents in Slovakia. These two effects counteracted each other in a similar amount and balanced each other
out. The actual amounts paid in OOP can be estimated roughly as the revenues from citizens in NHIC economic
statements recalculated to 100% of reporting agents.
Box 14: Out-of-pocket payments in NHIC economic statements
Economic statements for healthcare organisations keep records of OOP in 4 categories:
a) Pharmaceuticals – includes out-of-pocket payments for prescription pharmaceuticals, revenues for over-the-counter pharmaceuticals and pharmaceuticals which are administered directly by physicians in healthcare facilities and paid by the patient
b) Medical devices – payments for devices fully or partially paid by the citizens c) Additional products – medical products without an assigned ŠÚKL-code and all dietetic food in a
categorisation list d) Other – co-payments by patients, payments for HC not reimbursed from PHI, payments to non-
contractual providers, payments by private patients, payments for extra services, choice of physician, drawing up certificates, sale of additional products by a provider.
The methodology used by the Statistical Office of the SR to report the data to international institutions
integrates pharmaceutical HC in the first three categories. The “Other” category includes additional services
of opticians. The rest of Other revenues is divided among outpatient and inpatient HC according to the
facility.148
Revenues are assigned to specific cost centres corresponding to individual specialties. The reports thus help
calculate the OOP according to physicians’ specialty.
146 World Health Organization – Estimating out-of-pocket spending for national health accounts, 2010 147 The estimate was based on a survey by Focus agency for Transparency International Slovakia from early 2015 on a representative sample of 1,000 respondents aged 18+. 148 Types of facilities: 0-non-medical facility, 1-ward, 2-doctor’s office, 3-facility, 4-one-day HC facility, 5-CETU facility, 6-care centre, 7-tissue establishment, 8-central admission facility and inpatient emergency service, P-delivery room, S-operating theatre. Only type 2 is considered outpatient HC, the rest of the facilities belong to inpatient HC.
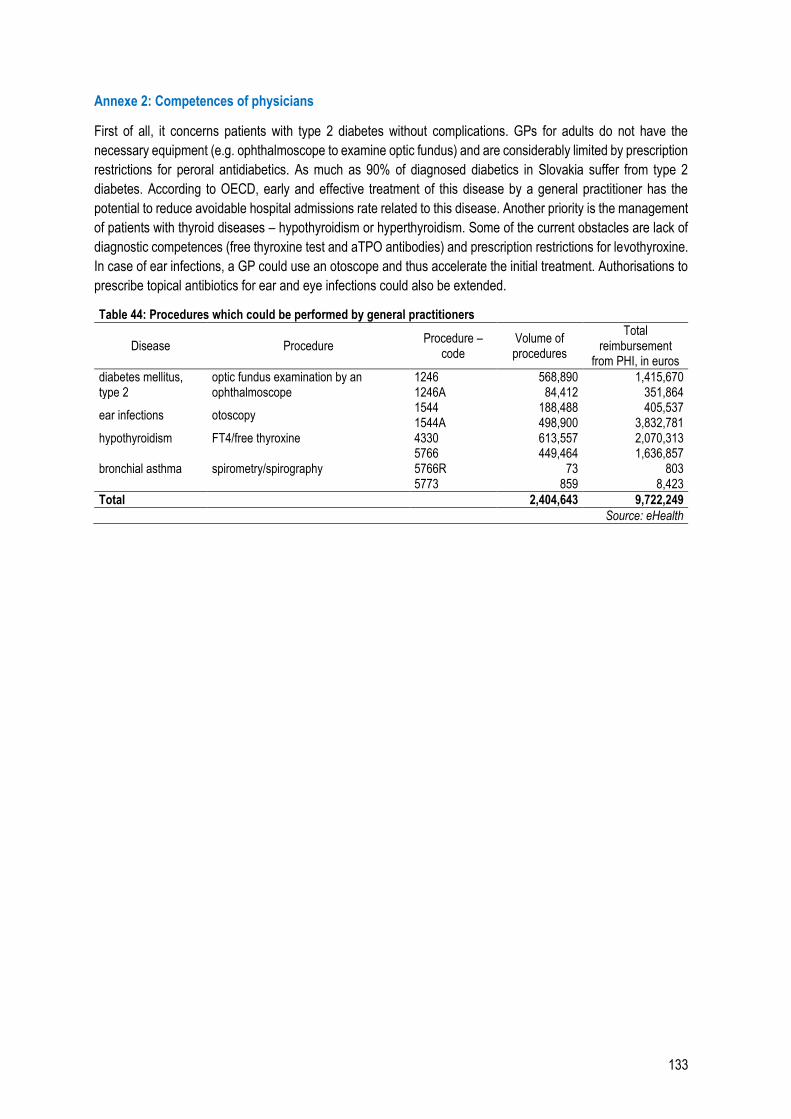
133
Annexe 2: Competences of physicians
First of all, it concerns patients with type 2 diabetes without complications. GPs for adults do not have the
necessary equipment (e.g. ophthalmoscope to examine optic fundus) and are considerably limited by prescription
restrictions for peroral antidiabetics. As much as 90% of diagnosed diabetics in Slovakia suffer from type 2
diabetes. According to OECD, early and effective treatment of this disease by a general practitioner has the
potential to reduce avoidable hospital admissions rate related to this disease. Another priority is the management
of patients with thyroid diseases – hypothyroidism or hyperthyroidism. Some of the current obstacles are lack of
diagnostic competences (free thyroxine test and aTPO antibodies) and prescription restrictions for levothyroxine.
In case of ear infections, a GP could use an otoscope and thus accelerate the initial treatment. Authorisations to
prescribe topical antibiotics for ear and eye infections could also be extended.
Table 44: Procedures which could be performed by general practitioners
Disease Procedure Procedure –
code Volume of procedures
Total reimbursement
from PHI, in euros
diabetes mellitus, type 2
optic fundus examination by an ophthalmoscope
1246 568,890 1,415,670 1246A 84,412 351,864
ear infections otoscopy 1544 188,488 405,537 1544A 498,900 3,832,781
hypothyroidism FT4/free thyroxine 4330 613,557 2,070,313
bronchial asthma spirometry/spirography 5766 449,464 1,636,857 5766R 73 803 5773 859 8,423
Total 2,404,643 9,722,249
Source: eHealth
134
Annexe 3: Healthcare systems
Public resources:
1. Taxes (general tax revenues of the state) – people pay various types of taxes to the budget, such as income
taxes, VAT or corporate taxes. The state then allocates part of these taxes to healthcare according to determined
priorities and provides healthcare to all citizens. Taxes are the main resource in the United Kingdom, Spain,
Denmark, Ireland. They include general taxes (a global budget package is collected and subsequently allocated
to different sectors) or earmarked healthcare taxes. Earmarked taxes can be paid e.g. by the EAP as income
taxes or some kind of consumption tax, such as tobacco tax (Australia, Scandinavian countries, Germany, Poland,
UK), alcohol tax (France, New Zealand) or lottery tax (UK).
2. Public health insurance (PHI) – funded mainly by contributions of economically active people and dedicated
directly to healthcare. Like every insurance, it is used to cover uncertain future expenses by redistributing the risk
of development of a disease to a large number of insured persons. The amount of future healthcare expenses for
individuals is uncertain because many diseases cannot be predicted. What is more, the treatment of some
diseases can even be unacceptably costly for individuals. Unlike commercial insurance of economically inactive
people (children, the retired, the unemployed), many countries pay the contributions from their own budget and
often regulate the amounts paid. Public health insurance (PHI) is the main resource in Germany, France or
Slovakia. It can be managed by one or several health insurance companies, public or private.
In terms of public resources, countries differ in whether they cover
part of the population (e.g. children, the elderly, the poor in the USA) or the entire population (France,
Slovakia)
selected services (such as the defined standard package in the Netherlands) or the entire healthcare
(Slovakia)
all expenses on treatment or patients pay OOP themselves
expenses only from a specific amount (so-called deductibles, e.g. in the Netherlands, where patients
had to pay the first 358 euros in 2017)
Private resources:
3. Private health insurance – the principle is similar to PHI, the insurance is bought as a product directly by
consumers who are then insured against the risk of high treatment expenses in the future. The amount paid (the
insurance premium) depends on the demand and offer but also on the buyer’s health condition. It is used mainly
in the USA and Switzerland. In the majority of developed countries, it covers only 10% of healthcare expenses.
4. Out-of-pocket payments – OOP are used less in rich countries (approximately 10 – 20% of the total healthcare
expenditure), for specific type of care or procedures, such as in dentistry or ophthalmology.
It is in public interest of the majority of developed countries to cover at least part of healthcare services
from public resources. In a free market, a consumer buys services depending on their health condition and
willingness to pay, which creates obstacles for poorer people and those with a very costly treatment. Since it is in
the interest of the majority of countries to give access to healthcare to all citizens – either for economic (healthy
people produce more) or social reasons – it is suitable to provide at least part of the funds from public resources
which can be better reallocated to poorer and sick citizens.
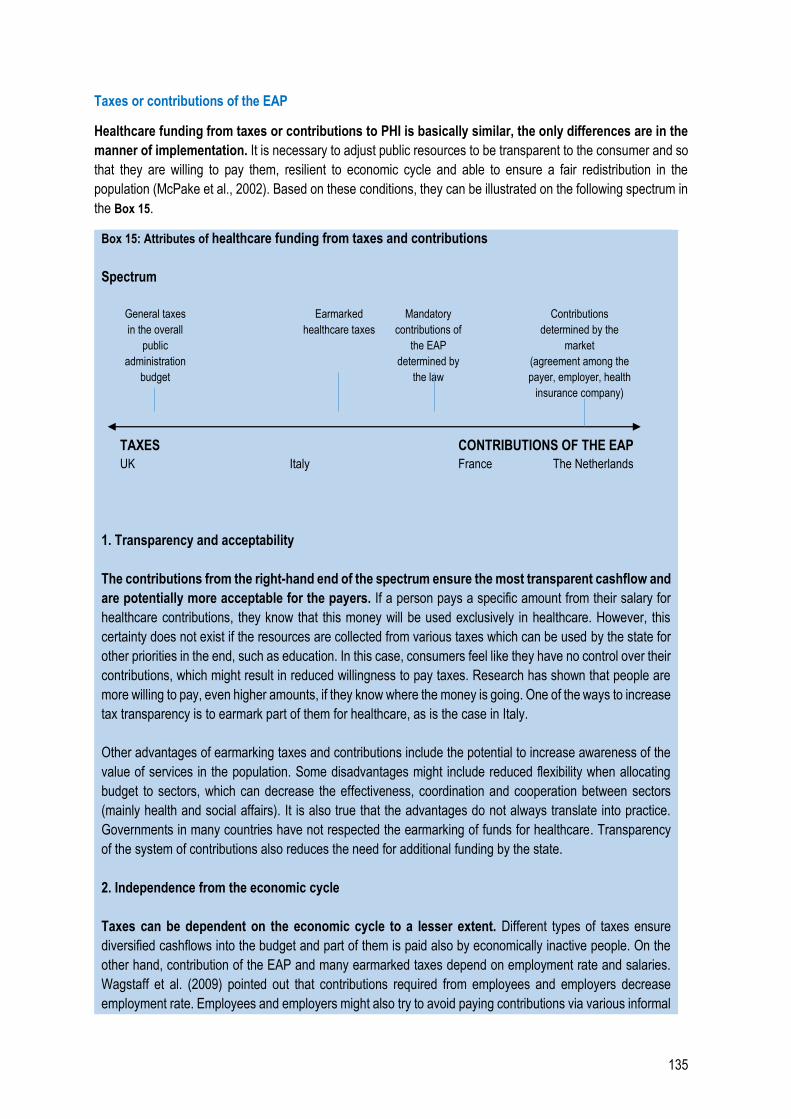
135
Taxes or contributions of the EAP
Healthcare funding from taxes or contributions to PHI is basically similar, the only differences are in the
manner of implementation. It is necessary to adjust public resources to be transparent to the consumer and so
that they are willing to pay them, resilient to economic cycle and able to ensure a fair redistribution in the
population (McPake et al., 2002). Based on these conditions, they can be illustrated on the following spectrum in
the Box 15.
Box 15: Attributes of healthcare funding from taxes and contributions
Spectrum
General taxes
in the overall
public
administration
budget
Earmarked
healthcare taxes
Mandatory
contributions of
the EAP
determined by
the law
Contributions
determined by the
market
(agreement among the
payer, employer, health
insurance company)
TAXES CONTRIBUTIONS OF THE EAP
UK Italy France The Netherlands
1. Transparency and acceptability
The contributions from the right-hand end of the spectrum ensure the most transparent cashflow and
are potentially more acceptable for the payers. If a person pays a specific amount from their salary for
healthcare contributions, they know that this money will be used exclusively in healthcare. However, this
certainty does not exist if the resources are collected from various taxes which can be used by the state for
other priorities in the end, such as education. In this case, consumers feel like they have no control over their
contributions, which might result in reduced willingness to pay taxes. Research has shown that people are
more willing to pay, even higher amounts, if they know where the money is going. One of the ways to increase
tax transparency is to earmark part of them for healthcare, as is the case in Italy.
Other advantages of earmarking taxes and contributions include the potential to increase awareness of the
value of services in the population. Some disadvantages might include reduced flexibility when allocating
budget to sectors, which can decrease the effectiveness, coordination and cooperation between sectors
(mainly health and social affairs). It is also true that the advantages do not always translate into practice.
Governments in many countries have not respected the earmarking of funds for healthcare. Transparency
of the system of contributions also reduces the need for additional funding by the state.
2. Independence from the economic cycle
Taxes can be dependent on the economic cycle to a lesser extent. Different types of taxes ensure
diversified cashflows into the budget and part of them is paid also by economically inactive people. On the
other hand, contribution of the EAP and many earmarked taxes depend on employment rate and salaries.
Wagstaff et al. (2009) pointed out that contributions required from employees and employers decrease
employment rate. Employees and employers might also try to avoid paying contributions via various informal
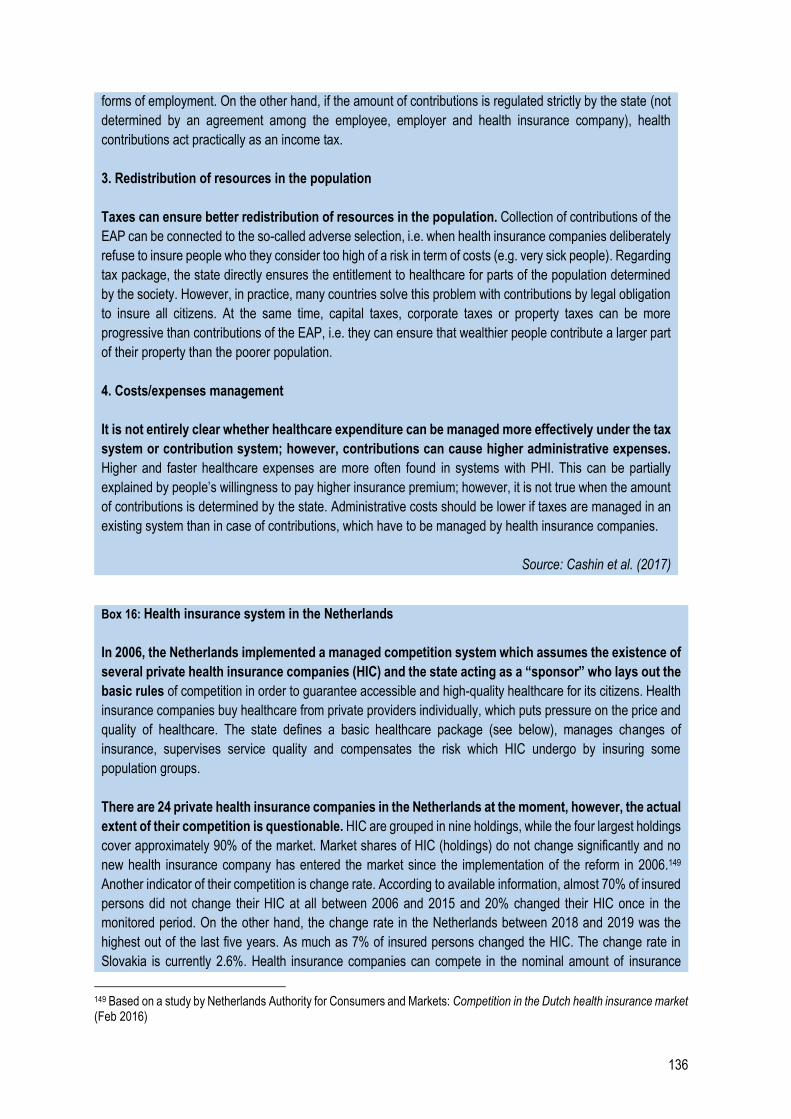
136
forms of employment. On the other hand, if the amount of contributions is regulated strictly by the state (not
determined by an agreement among the employee, employer and health insurance company), health
contributions act practically as an income tax.
3. Redistribution of resources in the population
Taxes can ensure better redistribution of resources in the population. Collection of contributions of the
EAP can be connected to the so-called adverse selection, i.e. when health insurance companies deliberately
refuse to insure people who they consider too high of a risk in term of costs (e.g. very sick people). Regarding
tax package, the state directly ensures the entitlement to healthcare for parts of the population determined
by the society. However, in practice, many countries solve this problem with contributions by legal obligation
to insure all citizens. At the same time, capital taxes, corporate taxes or property taxes can be more
progressive than contributions of the EAP, i.e. they can ensure that wealthier people contribute a larger part
of their property than the poorer population.
4. Costs/expenses management
It is not entirely clear whether healthcare expenditure can be managed more effectively under the tax
system or contribution system; however, contributions can cause higher administrative expenses.
Higher and faster healthcare expenses are more often found in systems with PHI. This can be partially
explained by people’s willingness to pay higher insurance premium; however, it is not true when the amount
of contributions is determined by the state. Administrative costs should be lower if taxes are managed in an
existing system than in case of contributions, which have to be managed by health insurance companies.
Source: Cashin et al. (2017)
Box 16: Health insurance system in the Netherlands
In 2006, the Netherlands implemented a managed competition system which assumes the existence of
several private health insurance companies (HIC) and the state acting as a “sponsor” who lays out the
basic rules of competition in order to guarantee accessible and high-quality healthcare for its citizens. Health
insurance companies buy healthcare from private providers individually, which puts pressure on the price and
quality of healthcare. The state defines a basic healthcare package (see below), manages changes of
insurance, supervises service quality and compensates the risk which HIC undergo by insuring some
population groups.
There are 24 private health insurance companies in the Netherlands at the moment, however, the actual
extent of their competition is questionable. HIC are grouped in nine holdings, while the four largest holdings
cover approximately 90% of the market. Market shares of HIC (holdings) do not change significantly and no
new health insurance company has entered the market since the implementation of the reform in 2006.149
Another indicator of their competition is change rate. According to available information, almost 70% of insured
persons did not change their HIC at all between 2006 and 2015 and 20% changed their HIC once in the
monitored period. On the other hand, the change rate in the Netherlands between 2018 and 2019 was the
highest out of the last five years. As much as 7% of insured persons changed the HIC. The change rate in
Slovakia is currently 2.6%. Health insurance companies can compete in the nominal amount of insurance
149 Based on a study by Netherlands Authority for Consumers and Markets: Competition in the Dutch health insurance market (Feb 2016)
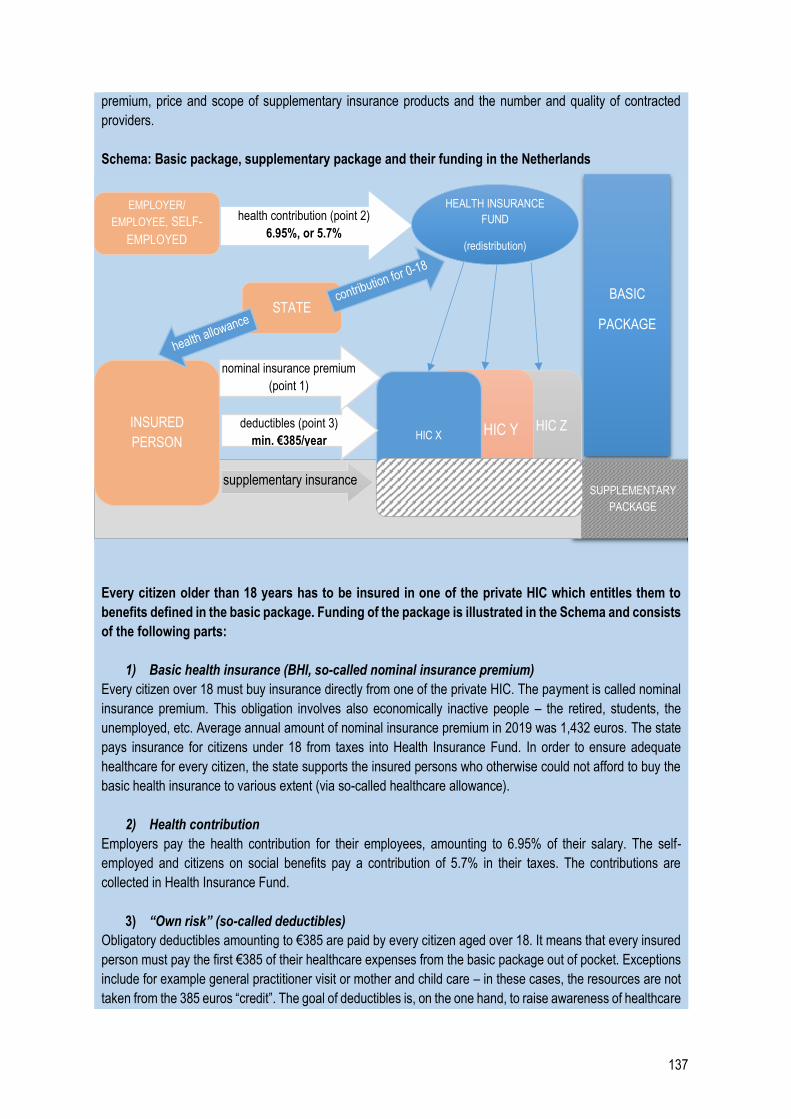
137
premium, price and scope of supplementary insurance products and the number and quality of contracted
providers.
Schema: Basic package, supplementary package and their funding in the Netherlands
Every citizen older than 18 years has to be insured in one of the private HIC which entitles them to
benefits defined in the basic package. Funding of the package is illustrated in the Schema and consists
of the following parts:
1) Basic health insurance (BHI, so-called nominal insurance premium)
Every citizen over 18 must buy insurance directly from one of the private HIC. The payment is called nominal
insurance premium. This obligation involves also economically inactive people – the retired, students, the
unemployed, etc. Average annual amount of nominal insurance premium in 2019 was 1,432 euros. The state
pays insurance for citizens under 18 from taxes into Health Insurance Fund. In order to ensure adequate
healthcare for every citizen, the state supports the insured persons who otherwise could not afford to buy the
basic health insurance to various extent (via so-called healthcare allowance).
2) Health contribution
Employers pay the health contribution for their employees, amounting to 6.95% of their salary. The self-
employed and citizens on social benefits pay a contribution of 5.7% in their taxes. The contributions are
collected in Health Insurance Fund.
3) “Own risk” (so-called deductibles)
Obligatory deductibles amounting to €385 are paid by every citizen aged over 18. It means that every insured
person must pay the first €385 of their healthcare expenses from the basic package out of pocket. Exceptions
include for example general practitioner visit or mother and child care – in these cases, the resources are not
taken from the 385 euros “credit”. The goal of deductibles is, on the one hand, to raise awareness of healthcare
BASIC
PACKAGE
SUPPLEMENTARY
PACKAGE
HIC Z HIC Y HIC X
INSURED
PERSON
deductibles (point 3)
min. €385/year
nominal insurance premium
(point 1)
app. €1,432/year
supplementary insurance
EMPLOYER/
EMPLOYEE, SELF-
EMPLOYED
HEALTH INSURANCE
FUND
(redistribution)
health contribution (point 2)
6.95%, or 5.7%
STATE
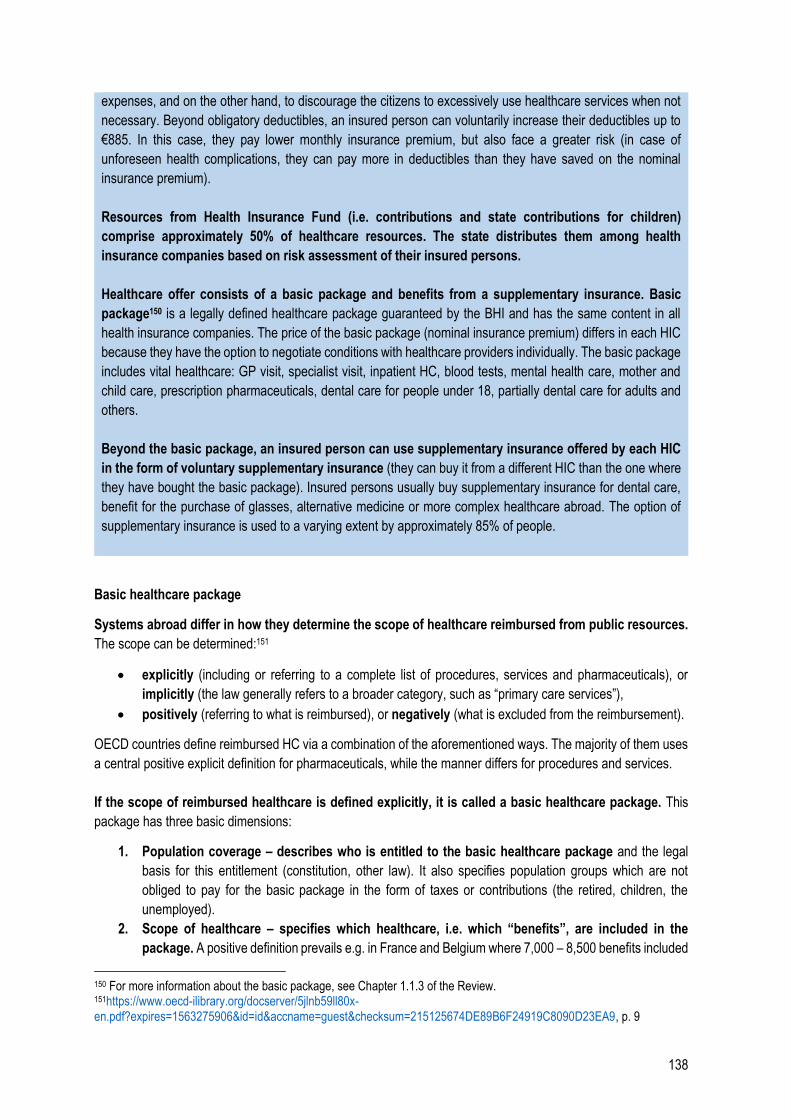
138
expenses, and on the other hand, to discourage the citizens to excessively use healthcare services when not
necessary. Beyond obligatory deductibles, an insured person can voluntarily increase their deductibles up to
€885. In this case, they pay lower monthly insurance premium, but also face a greater risk (in case of
unforeseen health complications, they can pay more in deductibles than they have saved on the nominal
insurance premium).
Resources from Health Insurance Fund (i.e. contributions and state contributions for children)
comprise approximately 50% of healthcare resources. The state distributes them among health
insurance companies based on risk assessment of their insured persons.
Healthcare offer consists of a basic package and benefits from a supplementary insurance. Basic
package150 is a legally defined healthcare package guaranteed by the BHI and has the same content in all
health insurance companies. The price of the basic package (nominal insurance premium) differs in each HIC
because they have the option to negotiate conditions with healthcare providers individually. The basic package
includes vital healthcare: GP visit, specialist visit, inpatient HC, blood tests, mental health care, mother and
child care, prescription pharmaceuticals, dental care for people under 18, partially dental care for adults and
others.
Beyond the basic package, an insured person can use supplementary insurance offered by each HIC
in the form of voluntary supplementary insurance (they can buy it from a different HIC than the one where
they have bought the basic package). Insured persons usually buy supplementary insurance for dental care,
benefit for the purchase of glasses, alternative medicine or more complex healthcare abroad. The option of
supplementary insurance is used to a varying extent by approximately 85% of people.
Basic healthcare package
Systems abroad differ in how they determine the scope of healthcare reimbursed from public resources.
The scope can be determined:151
explicitly (including or referring to a complete list of procedures, services and pharmaceuticals), or
implicitly (the law generally refers to a broader category, such as “primary care services”),
positively (referring to what is reimbursed), or negatively (what is excluded from the reimbursement).
OECD countries define reimbursed HC via a combination of the aforementioned ways. The majority of them uses
a central positive explicit definition for pharmaceuticals, while the manner differs for procedures and services.
If the scope of reimbursed healthcare is defined explicitly, it is called a basic healthcare package. This
package has three basic dimensions:
1. Population coverage – describes who is entitled to the basic healthcare package and the legal
basis for this entitlement (constitution, other law). It also specifies population groups which are not
obliged to pay for the basic package in the form of taxes or contributions (the retired, children, the
unemployed).
2. Scope of healthcare – specifies which healthcare, i.e. which “benefits”, are included in the
package. A positive definition prevails e.g. in France and Belgium where 7,000 – 8,500 benefits included
150 For more information about the basic package, see Chapter 1.1.3 of the Review. 151https://www.oecd-ilibrary.org/docserver/5jlnb59ll80x-en.pdf?expires=1563275906&id=id&accname=guest&checksum=215125674DE89B6F24919C8090D23EA9, p. 9
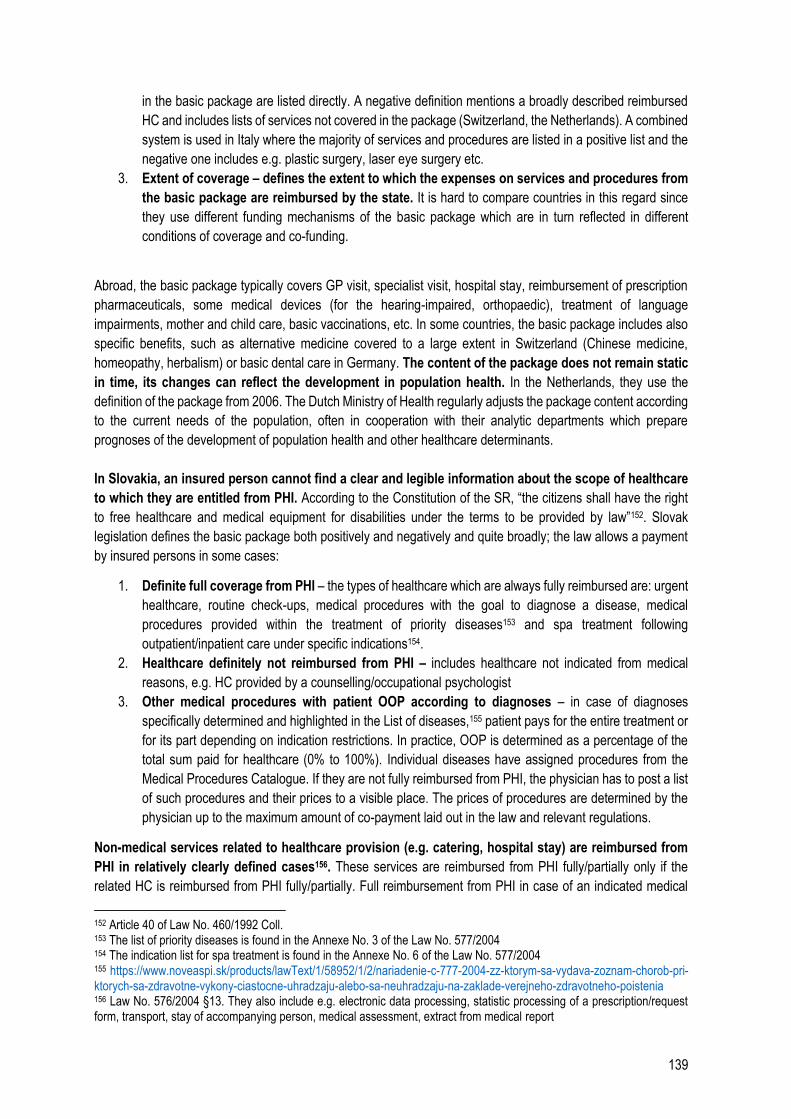
139
in the basic package are listed directly. A negative definition mentions a broadly described reimbursed
HC and includes lists of services not covered in the package (Switzerland, the Netherlands). A combined
system is used in Italy where the majority of services and procedures are listed in a positive list and the
negative one includes e.g. plastic surgery, laser eye surgery etc.
3. Extent of coverage – defines the extent to which the expenses on services and procedures from
the basic package are reimbursed by the state. It is hard to compare countries in this regard since
they use different funding mechanisms of the basic package which are in turn reflected in different
conditions of coverage and co-funding.
Abroad, the basic package typically covers GP visit, specialist visit, hospital stay, reimbursement of prescription
pharmaceuticals, some medical devices (for the hearing-impaired, orthopaedic), treatment of language
impairments, mother and child care, basic vaccinations, etc. In some countries, the basic package includes also
specific benefits, such as alternative medicine covered to a large extent in Switzerland (Chinese medicine,
homeopathy, herbalism) or basic dental care in Germany. The content of the package does not remain static
in time, its changes can reflect the development in population health. In the Netherlands, they use the
definition of the package from 2006. The Dutch Ministry of Health regularly adjusts the package content according
to the current needs of the population, often in cooperation with their analytic departments which prepare
prognoses of the development of population health and other healthcare determinants.
In Slovakia, an insured person cannot find a clear and legible information about the scope of healthcare
to which they are entitled from PHI. According to the Constitution of the SR, “the citizens shall have the right
to free healthcare and medical equipment for disabilities under the terms to be provided by law”152. Slovak
legislation defines the basic package both positively and negatively and quite broadly; the law allows a payment
by insured persons in some cases:
1. Definite full coverage from PHI – the types of healthcare which are always fully reimbursed are: urgent
healthcare, routine check-ups, medical procedures with the goal to diagnose a disease, medical
procedures provided within the treatment of priority diseases153 and spa treatment following
outpatient/inpatient care under specific indications154.
2. Healthcare definitely not reimbursed from PHI – includes healthcare not indicated from medical
reasons, e.g. HC provided by a counselling/occupational psychologist
3. Other medical procedures with patient OOP according to diagnoses – in case of diagnoses
specifically determined and highlighted in the List of diseases,155 patient pays for the entire treatment or
for its part depending on indication restrictions. In practice, OOP is determined as a percentage of the
total sum paid for healthcare (0% to 100%). Individual diseases have assigned procedures from the
Medical Procedures Catalogue. If they are not fully reimbursed from PHI, the physician has to post a list
of such procedures and their prices to a visible place. The prices of procedures are determined by the
physician up to the maximum amount of co-payment laid out in the law and relevant regulations.
Non-medical services related to healthcare provision (e.g. catering, hospital stay) are reimbursed from
PHI in relatively clearly defined cases156. These services are reimbursed from PHI fully/partially only if the
related HC is reimbursed from PHI fully/partially. Full reimbursement from PHI in case of an indicated medical
152 Article 40 of Law No. 460/1992 Coll. 153 The list of priority diseases is found in the Annexe No. 3 of the Law No. 577/2004 154 The indication list for spa treatment is found in the Annexe No. 6 of the Law No. 577/2004 155 https://www.noveaspi.sk/products/lawText/1/58952/1/2/nariadenie-c-777-2004-zz-ktorym-sa-vydava-zoznam-chorob-pri-ktorych-sa-zdravotne-vykony-ciastocne-uhradzaju-alebo-sa-neuhradzaju-na-zaklade-verejneho-zdravotneho-poistenia 156 Law No. 576/2004 §13. They also include e.g. electronic data processing, statistic processing of a prescription/request form, transport, stay of accompanying person, medical assessment, extract from medical report
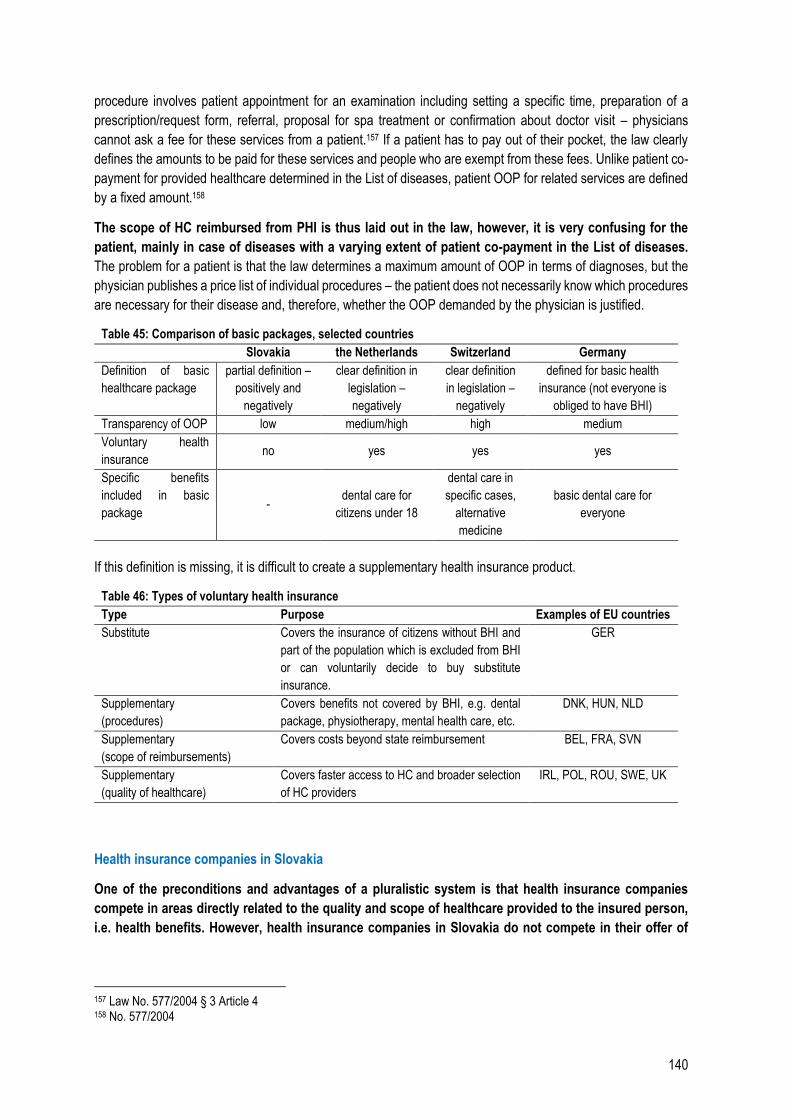
140
procedure involves patient appointment for an examination including setting a specific time, preparation of a
prescription/request form, referral, proposal for spa treatment or confirmation about doctor visit – physicians
cannot ask a fee for these services from a patient.157 If a patient has to pay out of their pocket, the law clearly
defines the amounts to be paid for these services and people who are exempt from these fees. Unlike patient co-
payment for provided healthcare determined in the List of diseases, patient OOP for related services are defined
by a fixed amount.158
The scope of HC reimbursed from PHI is thus laid out in the law, however, it is very confusing for the
patient, mainly in case of diseases with a varying extent of patient co-payment in the List of diseases.
The problem for a patient is that the law determines a maximum amount of OOP in terms of diagnoses, but the
physician publishes a price list of individual procedures – the patient does not necessarily know which procedures
are necessary for their disease and, therefore, whether the OOP demanded by the physician is justified.
Table 45: Comparison of basic packages, selected countries
Slovakia the Netherlands Switzerland Germany
Definition of basic
healthcare package
partial definition –
positively and
negatively
clear definition in
legislation –
negatively
clear definition
in legislation –
negatively
defined for basic health
insurance (not everyone is
obliged to have BHI)
Transparency of OOP low medium/high high medium
Voluntary health
insurance no yes yes yes
Specific benefits
included in basic
package -
dental care for
citizens under 18
dental care in
specific cases,
alternative
medicine
basic dental care for
everyone
If this definition is missing, it is difficult to create a supplementary health insurance product.
Table 46: Types of voluntary health insurance
Type Purpose Examples of EU countries
Substitute Covers the insurance of citizens without BHI and
part of the population which is excluded from BHI
or can voluntarily decide to buy substitute
insurance.
GER
Supplementary
(procedures)
Covers benefits not covered by BHI, e.g. dental
package, physiotherapy, mental health care, etc.
DNK, HUN, NLD
Supplementary
(scope of reimbursements)
Covers costs beyond state reimbursement BEL, FRA, SVN
Supplementary
(quality of healthcare)
Covers faster access to HC and broader selection
of HC providers
IRL, POL, ROU, SWE, UK
Health insurance companies in Slovakia
One of the preconditions and advantages of a pluralistic system is that health insurance companies
compete in areas directly related to the quality and scope of healthcare provided to the insured person,
i.e. health benefits. However, health insurance companies in Slovakia do not compete in their offer of
157 Law No. 577/2004 § 3 Article 4 158 No. 577/2004
141
health benefits. Despite differing partially in their offer of extra vaccination159, extra examinations160 and some
dental benefits, these differences are usually not communicated clearly to the potential insured person. For
example, in case of extra vaccinations, the reimbursement is bound to a specific type of vaccine, patient’s age
and various other conditions which make the offer more complicated. There are significant differences among
HIC in how visibly they advertise their offer of extra benefits on their web pages. Patients can find some benefits
only after purposefully searching subpages, while the home page focuses more on other types of benefits
described below. Therefore, it is hard for an insured person to compare the offer of health insurance companies
on their own. There has been no up-to-date and impartial platform that would collect and present the information
for comparison so far.
In the recent years, the most intense competition among health insurance companies has been taking
place particularly regarding benefits not related directly to quality or scope of healthcare for insured
persons; they can thus be called additional benefits.161 They include e.g. electronic services and mobile
applications. Other additional benefits are more advantageous offers on discount portals (they appear as the most
visible advertisement on website home pages), holiday stays, more advantageous travel insurance, discounts on
cosmetic products and supplementary products in some pharmacies etc. Health insurance companies typically
offer benefits after childbirth such as discounts and contributions for the purchase of products for newborns. Their
value does not differ significantly among the HICs.
In some cases, health insurance companies offer benefits which are not recommended by experts to be
used across-the-board. One of the health insurance companies offers free-of-charge lending of baby breathing
monitors for up to 6 months after birth. According to the manufacturers, the monitor is intended to detect a
respiratory arrest, particularly in case of sudden infant death syndrome (SIDS). American Academy of
Pediatrics162 and other experts163 have been long pointing out that the use of such devices at home does not
guarantee an early detection of health complications of a newborn, such as SIDS. They also agree that physicians
should recommend the use of the monitor only in specific cases (e.g. for prematurely born babies) and properly
train parents before use. According to the experts, the use of the monitors in other than specified cases often
leads to unjustified worries and inappropriate reactions (for example, parents excessively calling the rescue
service).
Risk equalisation among HIC
In a pluralistic system, health insurance companies receive money from PHI based on the number of
insured persons and their contributions. However, there is a risk that costly insured persons will not be
redistributed evenly among the HIC – e.g. all patients prone to illness might be insured in one health insurance
company and all healthy patients in another. Therefore, the costs of treatment of these patients will not correspond
to the revenues, which will create losses for one HIC, while the others will have extra money left. Due to this
inequality in revenues and expenses, HIC strive to get healthy insured persons and put the costly ones at
disadvantage.
159 vaccinations partially or fully reimbursed by the HIC beyond legal requirements, such as flu vaccine, hepatitis vaccine etc. 160 examinations partially or fully reimbursed by the HIC beyond legal requirements or entitlement to more examinations of a specific type than laid out in the law, such as urgent mammography etc. 161 according to an overview of offers on web pages of individual HIC 162 AAP TASK FORCE ON SUDDEN INFANT DEATH SYNDROME. SIDS and Other Sleep-Related Infant Deaths: Updated 2016 Recommendations for a Safe Infant Sleeping Environment. Pediatrics. 2016; 138(5): e20162938 163 Strehle EM, Gray WK, Gopisetti S, Richardson J, McGuire J, Malone S. Can home monitoring reduce mortality in infants at increased risk of sudden infant death syndrome? A systematic review Acta Paediatrica 2012; 101(1): 8 – 13.
142
In many countries, a fair redistribution of resources is ensured by a so-called risk equalisation
mechanism. It basically identifies the risk level of the insurance portfolio of each health insurance company and
subsequently transfers resources to HIC with more costly patients. When the system is set correctly, the HIC can
focus on effective treatment of patients with any risk profile since no group of patients is unprofitable for them in
the long term. Some type of risk equalisation mechanism is used by countries such as Belgium, Germany, the
Netherlands or Slovakia.
Box 17: The principle of redistribution mechanism
The “ex-ante” redistribution mechanism is based on a statistical model predicting future average
expenses per patient. The majority of prediction models uses:
Demographic indices – age, sex and type of insured person (economically active citizen or state-
insured person). The prediction of expenses relies on the fact that the elderly and children are sick
more often than young working people. The advantage of demographic indices is their high
capability to predict patient’s costs but also easy access to data.
Indices based on pharmaceuticals consumption (PCG indices) – future expenses per insured
person are predicted based on their long-term consumption of pharmaceuticals for a specific chronic
disease. When a patient uses pharmaceuticals for a long time, their expenses increase due to the
price of the pharmaceuticals and also related outpatient and inpatient care procedures. The model
works with the so-called pharmaceutical cost groups (PCG groups). Thanks to PCG indices, health
insurance companies are compensated for the treatment of chronically ill patients on average and
even have the motivation to create special programmes for the chronically ill in order to reduce
costs. If one HIC has a comparative advantage over the others (e.g. using equally effective but less
expensive treatment), the HIC can show profit after the redistribution of these patients.
Multi-annual cost indices (MACI) – reflecting actual expenses per insured person in the past.
These indices are advantageous if PCG groups are too broad (e.g. some autoimmune diseases are
much more expensive than others) or if a patient has high long-term costs but does not belong to
any PCG group. The advantage compared to PCG groups is that insured persons can be included
in the MACI groups fairly easily. The disadvantage can be that health insurance companies will be
less motivated to choose the most effective treatment because a more costly treatment can get the
patient classified in a higher MACI group and have part of the ineffective treatment compensated
by the redistribution mechanism. It should not be a problem in practice since health insurance
companies do not know in advance which insured persons will be classified in which MACI groups
(the thresholds change every year and HIC cannot learn them in advance). The MAC index monitors
the expenses in the last three years; therefore, a health insurance company probably would not
achieve a higher MACI group by increasing its expenses in one year. This course of action thus
would not be profitable. Another eventual problem is the approach of the HIC towards the patient –
while in case of PCG groups, health insurance companies can prepare programmes for the
management of specific diseases to include chronically ill patients and search for the most effective
treatment for them, with MACI, one group includes insured persons with very diverse diagnoses
and eventual sources of costly treatment.
Indices based on medical devices use – future expenses of an insured person are predicted
based on the use of a specific type of devices such as devices for the disabled, orthopaedic
prostheses or incontinence products. These devices are often expensive and not included in
demographic and PCG indices.
Diagnostic cost groups (DCG) – the use of diagnosis as a prediction parameter of future costs is
a logical and intuitive solution. For example, a patient with diagnosed chronic kidney disease will
143
very probably require increased healthcare costs in the following year. DCG overlaps with PCG
groups to a certain extent since diagnosed chronically ill patients often use pharmaceuticals for a
long time. However, this is not always true – for example, a patient with diagnosed infarction might
undergo rehabilitation treatment and eventually a surgery, but does not necessarily have to be
reported in the model as a chronically ill patient based on their pharmaceuticals consumption. The
implementation of this parameter is more difficult and less transparent than PCG or MAC indexes
because there are thousands of diagnoses which need to be grouped correctly in order to be usable
and useful in the model.
Length of insurance – the model predicts general average expenses for a certain insurance period,
e.g. 12 months. However, there is always a group of insured persons who are insured for a shorter
period – newborns, the deceased or new emigrants or immigrants. If a model is adjusted by the
number of months, it is taken into account that the more months, the lower the chance of too low or
too high expenses caused by a short time period observed.
The “ex-post” redistribution mechanism compensates the expenses on insured persons not included in the ex-ante model. No model, albeit very good, can provide for all patients; there are some with high expenses in the long term but the model does not assign them a high redistribution factor, for example because they do not belong to any defined group of chronic diseases. One example can be a patient with a very rare disease who uses very expensive pharmaceuticals for a long time and is unprofitable for the HIC. Even just a few of such insured persons can influence the outcomes of a health insurance company. The solution can thus be that all the HIC bear this risk together.
However, ex-post redistribution poses a considerable risk – if a health insurance company was always
compensated for all expenses on their insured persons, it would not have any motivation to reduce the costs
of treatment and look for more effective solutions, because they would not bring in any profit. The Dutch
redistribution model uses the ex-post mechanism only for a part of fixed expenses of healthcare facilities and
only redistributes approximately 0.9% of total healthcare resources by means of this mechanism. According
to consulting company Gupta, this mechanism should only be implemented in three specific cases: in order
to reduce the risk for an HIC; if an HIC cannot influence treatment costs; if an HIC is in transitional period
when the insurance portfolio is changing considerably by its extension.
Source: Institute of Health Policies
Slovakia uses a risk equalisation mechanism inspired by the Dutch model and is currently able to predict
“only” 24% of average expenses. This is the case of foreign models as well and it does not have to mean
that the redistribution is bad from the systemic point of view. The model is still partially responsible for an
imperfect redistribution of resources among health insurance companies. A model used until 2018 using only
demographic and PCG indexes164 could only predict 18%, which was increased by the addition of MAC indices165
(indices are explained in the box). As a result, the redistribution mechanism assigns too high or too low a rate to
the majority of insured persons – but if these deviations in under- and overcompensated insured persons are not
systematically different among HIC, the sum of deviations for each HIC will be close to zero if the number of
164 At the moment, 72 combinations of demographic features are used. Legislation can change; most recently a group of children aged 0 – 4 was divided into two groups, children aged 0 and 1 – 4, because newborns have considerably higher expenses than older children. 165 The current model works with 27 PCG groups of chronic diseases stated in the valid legislation, which may change. Each HIC has the right to propose changes in ATC and PCG groups and corresponding diagnoses, such as exclusion or addition, by June 30 in order to be included in the recalculation for the following year (e.g. by June 30, 2017 in order to be included in the recalculation for 2018). The precise calculation process is found in the Annexes.
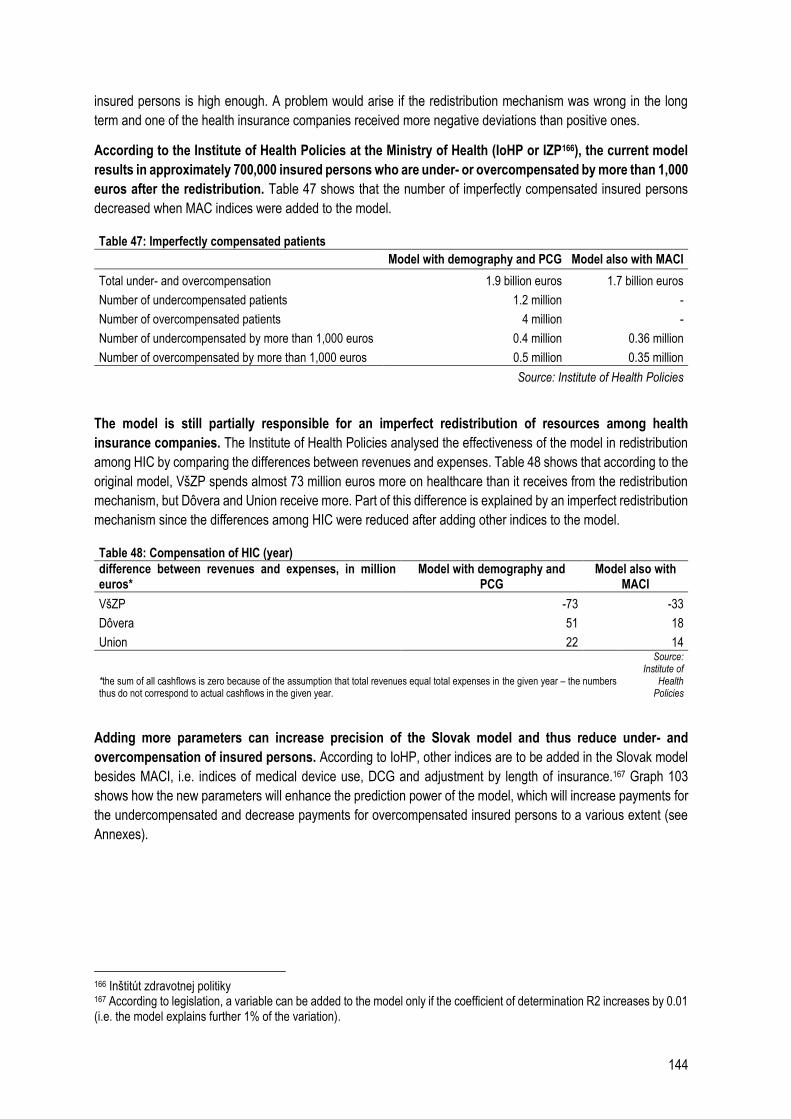
144
insured persons is high enough. A problem would arise if the redistribution mechanism was wrong in the long
term and one of the health insurance companies received more negative deviations than positive ones.
According to the Institute of Health Policies at the Ministry of Health (IoHP or IZP166), the current model
results in approximately 700,000 insured persons who are under- or overcompensated by more than 1,000
euros after the redistribution. Table 47 shows that the number of imperfectly compensated insured persons
decreased when MAC indices were added to the model.
Table 47: Imperfectly compensated patients Model with demography and PCG Model also with MACI
Total under- and overcompensation 1.9 billion euros 1.7 billion euros
Number of undercompensated patients 1.2 million -
Number of overcompensated patients 4 million -
Number of undercompensated by more than 1,000 euros 0.4 million 0.36 million
Number of overcompensated by more than 1,000 euros 0.5 million 0.35 million
Source: Institute of Health Policies
The model is still partially responsible for an imperfect redistribution of resources among health
insurance companies. The Institute of Health Policies analysed the effectiveness of the model in redistribution
among HIC by comparing the differences between revenues and expenses. Table 48 shows that according to the
original model, VšZP spends almost 73 million euros more on healthcare than it receives from the redistribution
mechanism, but Dôvera and Union receive more. Part of this difference is explained by an imperfect redistribution
mechanism since the differences among HIC were reduced after adding other indices to the model.
Table 48: Compensation of HIC (year)
difference between revenues and expenses, in million euros*
Model with demography and PCG
Model also with MACI
VšZP -73 -33
Dôvera 51 18
Union 22 14
*the sum of all cashflows is zero because of the assumption that total revenues equal total expenses in the given year – the numbers thus do not correspond to actual cashflows in the given year.
Source: Institute of
Health Policies
Adding more parameters can increase precision of the Slovak model and thus reduce under- and
overcompensation of insured persons. According to IoHP, other indices are to be added in the Slovak model
besides MACI, i.e. indices of medical device use, DCG and adjustment by length of insurance.167 Graph 103
shows how the new parameters will enhance the prediction power of the model, which will increase payments for
the undercompensated and decrease payments for overcompensated insured persons to a various extent (see
Annexes).
166 Inštitút zdravotnej politiky 167 According to legislation, a variable can be added to the model only if the coefficient of determination R2 increases by 0.01 (i.e. the model explains further 1% of the variation).
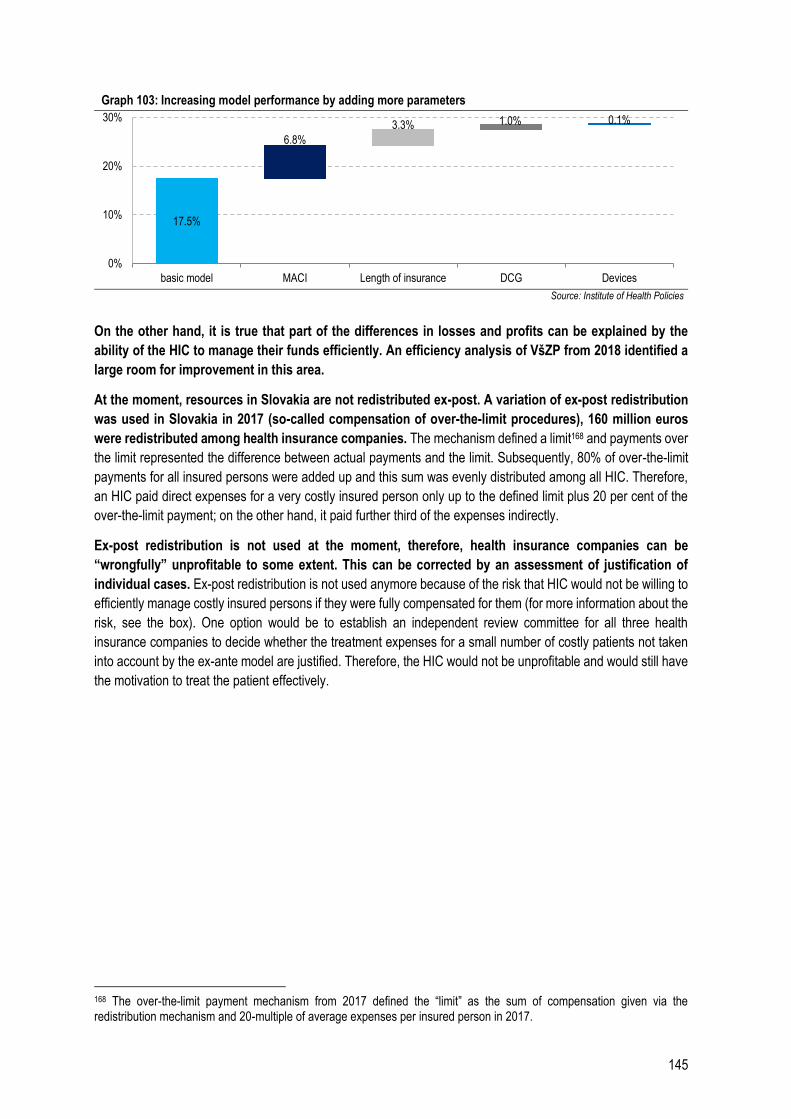
145
Graph 103: Increasing model performance by adding more parameters
Source: Institute of Health Policies
On the other hand, it is true that part of the differences in losses and profits can be explained by the
ability of the HIC to manage their funds efficiently. An efficiency analysis of VšZP from 2018 identified a
large room for improvement in this area.
At the moment, resources in Slovakia are not redistributed ex-post. A variation of ex-post redistribution
was used in Slovakia in 2017 (so-called compensation of over-the-limit procedures), 160 million euros
were redistributed among health insurance companies. The mechanism defined a limit168 and payments over
the limit represented the difference between actual payments and the limit. Subsequently, 80% of over-the-limit
payments for all insured persons were added up and this sum was evenly distributed among all HIC. Therefore,
an HIC paid direct expenses for a very costly insured person only up to the defined limit plus 20 per cent of the
over-the-limit payment; on the other hand, it paid further third of the expenses indirectly.
Ex-post redistribution is not used at the moment, therefore, health insurance companies can be
“wrongfully” unprofitable to some extent. This can be corrected by an assessment of justification of
individual cases. Ex-post redistribution is not used anymore because of the risk that HIC would not be willing to
efficiently manage costly insured persons if they were fully compensated for them (for more information about the
risk, see the box). One option would be to establish an independent review committee for all three health
insurance companies to decide whether the treatment expenses for a small number of costly patients not taken
into account by the ex-ante model are justified. Therefore, the HIC would not be unprofitable and would still have
the motivation to treat the patient effectively.
168 The over-the-limit payment mechanism from 2017 defined the “limit” as the sum of compensation given via the redistribution mechanism and 20-multiple of average expenses per insured person in 2017.
17.5%
6.8%
3.3% 1.0% 0.1%
0%
10%
20%
30%
basic model MACI Length of insurance DCG Devices
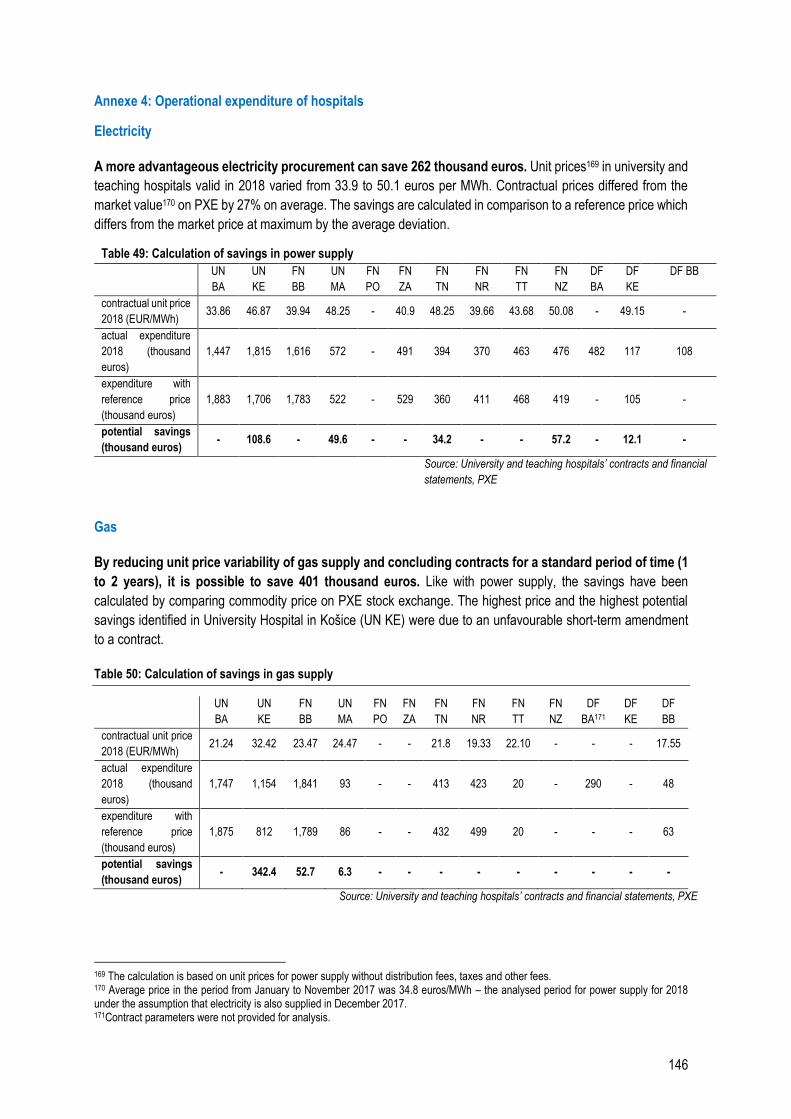
146
Annexe 4: Operational expenditure of hospitals
Electricity
A more advantageous electricity procurement can save 262 thousand euros. Unit prices169 in university and
teaching hospitals valid in 2018 varied from 33.9 to 50.1 euros per MWh. Contractual prices differed from the
market value170 on PXE by 27% on average. The savings are calculated in comparison to a reference price which
differs from the market price at maximum by the average deviation.
Table 49: Calculation of savings in power supply
UN
BA
UN
KE
FN
BB
UN
MA
FN
PO
FN
ZA
FN
TN
FN
NR
FN
TT
FN
NZ
DF
BA
DF
KE
DF BB
contractual unit price
2018 (EUR/MWh) 33.86 46.87 39.94 48.25 - 40.9 48.25 39.66 43.68 50.08 - 49.15 -
actual expenditure
2018 (thousand
euros)
1,447 1,815 1,616 572 - 491 394 370 463 476 482 117 108
expenditure with
reference price
(thousand euros)
1,883 1,706 1,783 522 - 529 360 411 468 419 - 105 -
potential savings
(thousand euros) - 108.6 - 49.6 - - 34.2 - - 57.2 - 12.1 -
Source: University and teaching hospitals’ contracts and financial
statements, PXE
Gas
By reducing unit price variability of gas supply and concluding contracts for a standard period of time (1
to 2 years), it is possible to save 401 thousand euros. Like with power supply, the savings have been
calculated by comparing commodity price on PXE stock exchange. The highest price and the highest potential
savings identified in University Hospital in Košice (UN KE) were due to an unfavourable short-term amendment
to a contract.
Table 50: Calculation of savings in gas supply
UN
BA
UN
KE
FN
BB
UN
MA
FN
PO
FN
ZA
FN
TN
FN
NR
FN
TT
FN
NZ
DF
BA171
DF
KE
DF
BB
contractual unit price
2018 (EUR/MWh) 21.24 32.42 23.47 24.47 - - 21.8 19.33 22.10 - - - 17.55
actual expenditure
2018 (thousand
euros)
1,747 1,154 1,841 93 - - 413 423 20 - 290 - 48
expenditure with
reference price
(thousand euros)
1,875 812 1,789 86 - - 432 499 20 - - - 63
potential savings
(thousand euros) - 342.4 52.7 6.3 - - - - - - - - -
Source: University and teaching hospitals’ contracts and financial statements, PXE
169 The calculation is based on unit prices for power supply without distribution fees, taxes and other fees. 170 Average price in the period from January to November 2017 was 34.8 euros/MWh – the analysed period for power supply for 2018 under the assumption that electricity is also supplied in December 2017. 171Contract parameters were not provided for analysis.
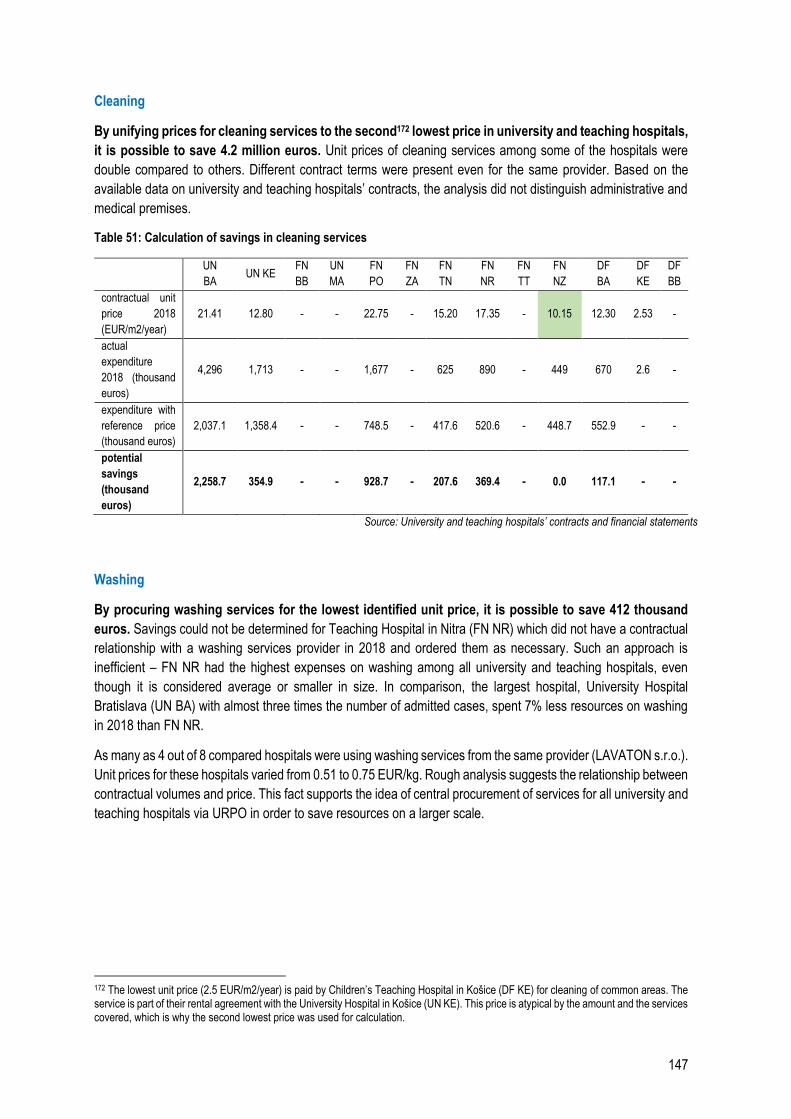
147
Cleaning
By unifying prices for cleaning services to the second172 lowest price in university and teaching hospitals,
it is possible to save 4.2 million euros. Unit prices of cleaning services among some of the hospitals were
double compared to others. Different contract terms were present even for the same provider. Based on the
available data on university and teaching hospitals’ contracts, the analysis did not distinguish administrative and
medical premises.
Table 51: Calculation of savings in cleaning services
UN
BA UN KE
FN
BB
UN
MA
FN
PO
FN
ZA
FN
TN
FN
NR
FN
TT
FN
NZ
DF
BA
DF
KE
DF
BB
contractual unit
price 2018
(EUR/m2/year)
21.41 12.80 - - 22.75 - 15.20 17.35 - 10.15 12.30 2.53 -
actual
expenditure
2018 (thousand
euros)
4,296 1,713 - - 1,677 - 625 890 - 449 670 2.6 -
expenditure with
reference price
(thousand euros)
2,037.1 1,358.4 - - 748.5 - 417.6 520.6 - 448.7 552.9 - -
potential
savings
(thousand
euros)
2,258.7 354.9 - - 928.7 - 207.6 369.4 - 0.0 117.1 - -
Source: University and teaching hospitals’ contracts and financial statements
Washing
By procuring washing services for the lowest identified unit price, it is possible to save 412 thousand
euros. Savings could not be determined for Teaching Hospital in Nitra (FN NR) which did not have a contractual
relationship with a washing services provider in 2018 and ordered them as necessary. Such an approach is
inefficient – FN NR had the highest expenses on washing among all university and teaching hospitals, even
though it is considered average or smaller in size. In comparison, the largest hospital, University Hospital
Bratislava (UN BA) with almost three times the number of admitted cases, spent 7% less resources on washing
in 2018 than FN NR.
As many as 4 out of 8 compared hospitals were using washing services from the same provider (LAVATON s.r.o.).
Unit prices for these hospitals varied from 0.51 to 0.75 EUR/kg. Rough analysis suggests the relationship between
contractual volumes and price. This fact supports the idea of central procurement of services for all university and
teaching hospitals via URPO in order to save resources on a larger scale.
172 The lowest unit price (2.5 EUR/m2/year) is paid by Children’s Teaching Hospital in Košice (DF KE) for cleaning of common areas. The service is part of their rental agreement with the University Hospital in Košice (UN KE). This price is atypical by the amount and the services covered, which is why the second lowest price was used for calculation.
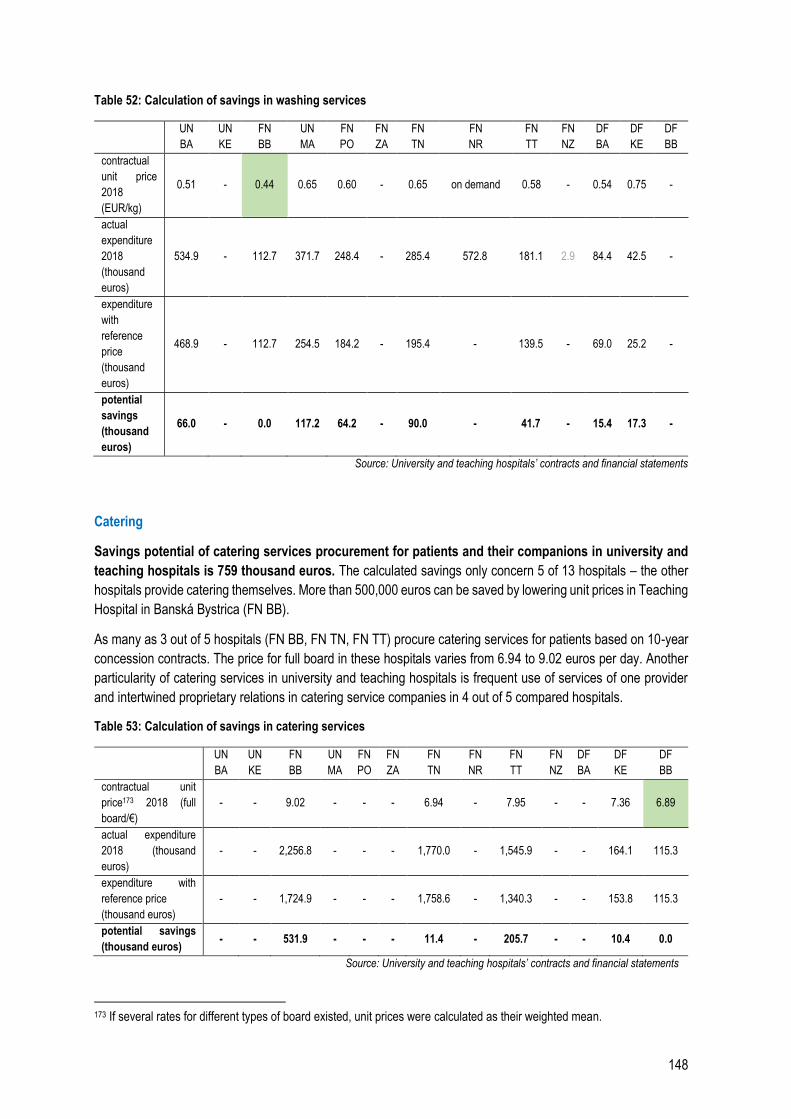
148
Table 52: Calculation of savings in washing services
UN
BA
UN
KE
FN
BB
UN
MA
FN
PO
FN
ZA
FN
TN
FN
NR
FN
TT
FN
NZ
DF
BA
DF
KE
DF
BB
contractual
unit price
2018
(EUR/kg)
0.51 - 0.44 0.65 0.60 - 0.65 on demand 0.58 - 0.54 0.75 -
actual
expenditure
2018
(thousand
euros)
534.9 - 112.7 371.7 248.4 - 285.4 572.8 181.1 2.9 84.4 42.5 -
expenditure
with
reference
price
(thousand
euros)
468.9 - 112.7 254.5 184.2 - 195.4 - 139.5 - 69.0 25.2 -
potential
savings
(thousand
euros)
66.0 - 0.0 117.2 64.2 - 90.0 - 41.7 - 15.4 17.3 -
Source: University and teaching hospitals’ contracts and financial statements
Catering
Savings potential of catering services procurement for patients and their companions in university and
teaching hospitals is 759 thousand euros. The calculated savings only concern 5 of 13 hospitals – the other
hospitals provide catering themselves. More than 500,000 euros can be saved by lowering unit prices in Teaching
Hospital in Banská Bystrica (FN BB).
As many as 3 out of 5 hospitals (FN BB, FN TN, FN TT) procure catering services for patients based on 10-year
concession contracts. The price for full board in these hospitals varies from 6.94 to 9.02 euros per day. Another
particularity of catering services in university and teaching hospitals is frequent use of services of one provider
and intertwined proprietary relations in catering service companies in 4 out of 5 compared hospitals.
Table 53: Calculation of savings in catering services
UN
BA
UN
KE
FN
BB
UN
MA
FN
PO
FN
ZA
FN
TN
FN
NR
FN
TT
FN
NZ
DF
BA
DF
KE
DF
BB
contractual unit
price173 2018 (full
board/€)
- - 9.02 - - - 6.94 - 7.95 - - 7.36 6.89
actual expenditure
2018 (thousand
euros)
- - 2,256.8 - - - 1,770.0 - 1,545.9 - - 164.1 115.3
expenditure with
reference price
(thousand euros)
- - 1,724.9 - - - 1,758.6 - 1,340.3 - - 153.8 115.3
potential savings
(thousand euros) - - 531.9 - - - 11.4 - 205.7 - - 10.4 0.0
Source: University and teaching hospitals’ contracts and financial statements
173 If several rates for different types of board existed, unit prices were calculated as their weighted mean.
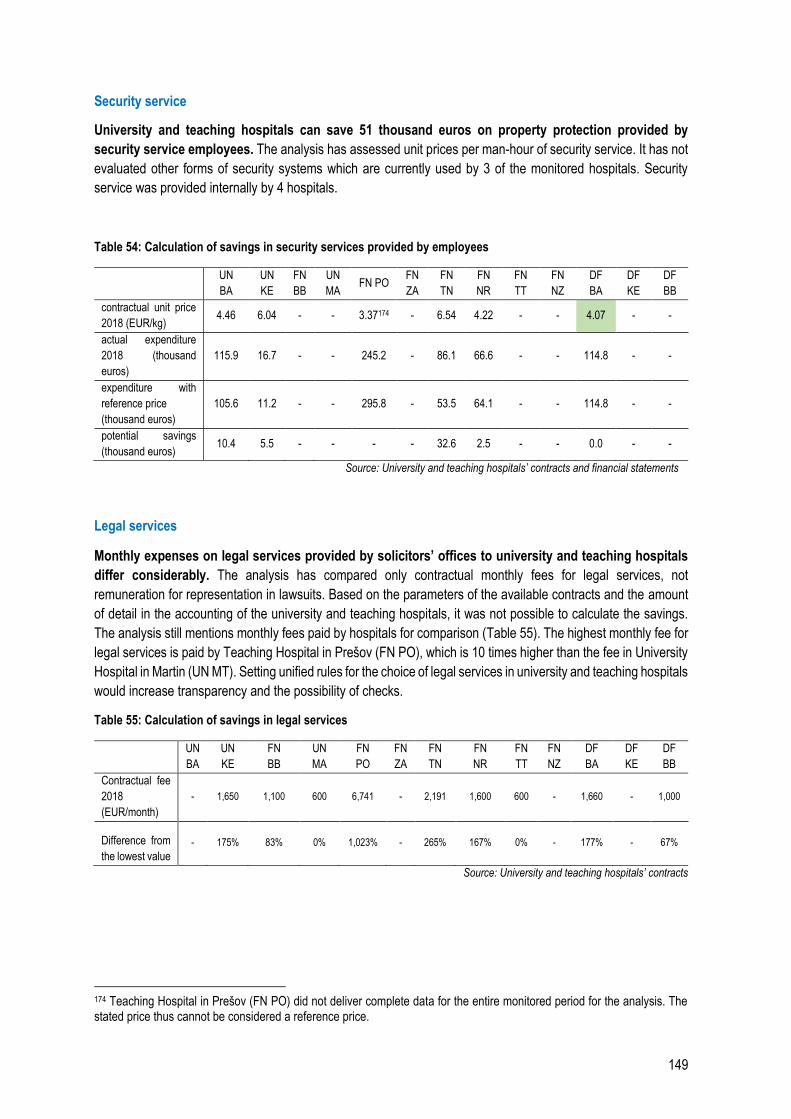
149
Security service
University and teaching hospitals can save 51 thousand euros on property protection provided by
security service employees. The analysis has assessed unit prices per man-hour of security service. It has not
evaluated other forms of security systems which are currently used by 3 of the monitored hospitals. Security
service was provided internally by 4 hospitals.
Table 54: Calculation of savings in security services provided by employees
UN
BA
UN
KE
FN
BB
UN
MA FN PO
FN
ZA
FN
TN
FN
NR
FN
TT
FN
NZ
DF
BA
DF
KE
DF
BB
contractual unit price
2018 (EUR/kg) 4.46 6.04 - - 3.37174 - 6.54 4.22 - - 4.07 - -
actual expenditure
2018 (thousand
euros)
115.9 16.7 - - 245.2 - 86.1 66.6 - - 114.8 - -
expenditure with
reference price
(thousand euros)
105.6 11.2 - - 295.8 - 53.5 64.1 - - 114.8 - -
potential savings
(thousand euros) 10.4 5.5 - - - - 32.6 2.5 - - 0.0 - -
Source: University and teaching hospitals’ contracts and financial statements
Legal services
Monthly expenses on legal services provided by solicitors’ offices to university and teaching hospitals
differ considerably. The analysis has compared only contractual monthly fees for legal services, not
remuneration for representation in lawsuits. Based on the parameters of the available contracts and the amount
of detail in the accounting of the university and teaching hospitals, it was not possible to calculate the savings.
The analysis still mentions monthly fees paid by hospitals for comparison (Table 55). The highest monthly fee for
legal services is paid by Teaching Hospital in Prešov (FN PO), which is 10 times higher than the fee in University
Hospital in Martin (UN MT). Setting unified rules for the choice of legal services in university and teaching hospitals
would increase transparency and the possibility of checks.
Table 55: Calculation of savings in legal services
UN
BA
UN
KE
FN
BB
UN
MA
FN
PO
FN
ZA
FN
TN
FN
NR
FN
TT
FN
NZ
DF
BA
DF
KE
DF
BB
Contractual fee
2018
(EUR/month)
- 1,650 1,100 600 6,741 - 2,191 1,600 600 - 1,660 - 1,000
Difference from
the lowest value
- 175% 83% 0% 1,023% - 265% 167% 0% - 177% - 67%
Source: University and teaching hospitals’ contracts
174 Teaching Hospital in Prešov (FN PO) did not deliver complete data for the entire monitored period for the analysis. The stated price thus cannot be considered a reference price.
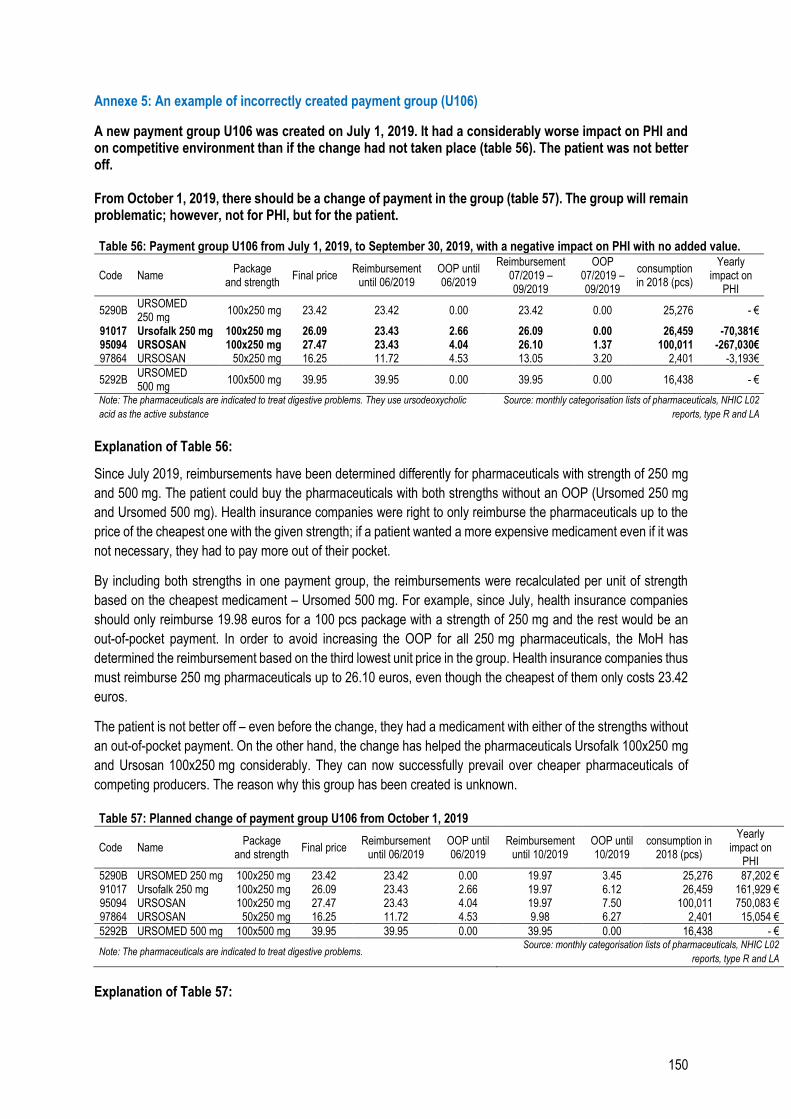
150
Annexe 5: An example of incorrectly created payment group (U106)
A new payment group U106 was created on July 1, 2019. It had a considerably worse impact on PHI and on competitive environment than if the change had not taken place (table 56). The patient was not better off. From October 1, 2019, there should be a change of payment in the group (table 57). The group will remain problematic; however, not for PHI, but for the patient. Table 56: Payment group U106 from July 1, 2019, to September 30, 2019, with a negative impact on PHI with no added value.
Code Name Package
and strength Final price
Reimbursement until 06/2019
OOP until 06/2019
Reimbursement 07/2019 – 09/2019
OOP 07/2019 – 09/2019
consumption in 2018 (pcs)
Yearly impact on
PHI
5290B URSOMED 250 mg
100x250 mg 23.42 23.42 0.00 23.42 0.00 25,276 - €
91017 Ursofalk 250 mg 100x250 mg 26.09 23.43 2.66 26.09 0.00 26,459 -70,381€ 95094 URSOSAN 100x250 mg 27.47 23.43 4.04 26.10 1.37 100,011 -267,030€ 97864 URSOSAN 50x250 mg 16.25 11.72 4.53 13.05 3.20 2,401 -3,193€
5292B URSOMED 500 mg
100x500 mg 39.95 39.95 0.00 39.95 0.00 16,438 - €
Note: The pharmaceuticals are indicated to treat digestive problems. They use ursodeoxycholic
acid as the active substance
Source: monthly categorisation lists of pharmaceuticals, NHIC L02
reports, type R and LA
Explanation of Table 56:
Since July 2019, reimbursements have been determined differently for pharmaceuticals with strength of 250 mg
and 500 mg. The patient could buy the pharmaceuticals with both strengths without an OOP (Ursomed 250 mg
and Ursomed 500 mg). Health insurance companies were right to only reimburse the pharmaceuticals up to the
price of the cheapest one with the given strength; if a patient wanted a more expensive medicament even if it was
not necessary, they had to pay more out of their pocket.
By including both strengths in one payment group, the reimbursements were recalculated per unit of strength
based on the cheapest medicament – Ursomed 500 mg. For example, since July, health insurance companies
should only reimburse 19.98 euros for a 100 pcs package with a strength of 250 mg and the rest would be an
out-of-pocket payment. In order to avoid increasing the OOP for all 250 mg pharmaceuticals, the MoH has
determined the reimbursement based on the third lowest unit price in the group. Health insurance companies thus
must reimburse 250 mg pharmaceuticals up to 26.10 euros, even though the cheapest of them only costs 23.42
euros.
The patient is not better off – even before the change, they had a medicament with either of the strengths without
an out-of-pocket payment. On the other hand, the change has helped the pharmaceuticals Ursofalk 100x250 mg
and Ursosan 100x250 mg considerably. They can now successfully prevail over cheaper pharmaceuticals of
competing producers. The reason why this group has been created is unknown.
Table 57: Planned change of payment group U106 from October 1, 2019
Code Name Package
and strength Final price
Reimbursement until 06/2019
OOP until 06/2019
Reimbursement until 10/2019
OOP until 10/2019
consumption in 2018 (pcs)
Yearly impact on
PHI
5290B URSOMED 250 mg 100x250 mg 23.42 23.42 0.00 19.97 3.45 25,276 87,202 € 91017 Ursofalk 250 mg 100x250 mg 26.09 23.43 2.66 19.97 6.12 26,459 161,929 € 95094 URSOSAN 100x250 mg 27.47 23.43 4.04 19.97 7.50 100,011 750,083 € 97864 URSOSAN 50x250 mg 16.25 11.72 4.53 9.98 6.27 2,401 15,054 €
5292B URSOMED 500 mg 100x500 mg 39.95 39.95 0.00 39.95 0.00 16,438 - €
Note: The pharmaceuticals are indicated to treat digestive problems. Source: monthly categorisation lists of pharmaceuticals, NHIC L02
reports, type R and LA
Explanation of Table 57:
151
In comparison to the previous table, since October, the reimbursement has not been determined based on the
third cheapest price per DDD but on the cheapest one (i.e. based on the medicament Ursomed 500 mg). Including
pharmaceuticals with strengths of both 250 mg and 500 mg will bring in savings of 1 million euros to PHI compared
to June, however, the total savings will be paid by the patient. The 500 mg medicament cannot be halved. Patients
with the most frequent indication weighing 61 – 80 kg use 750 mg per day, those weighing over 100 kg use
1,250 mg. Patients thus need to use also 250 mg packages, therefore, they cannot avoid the higher OOP.
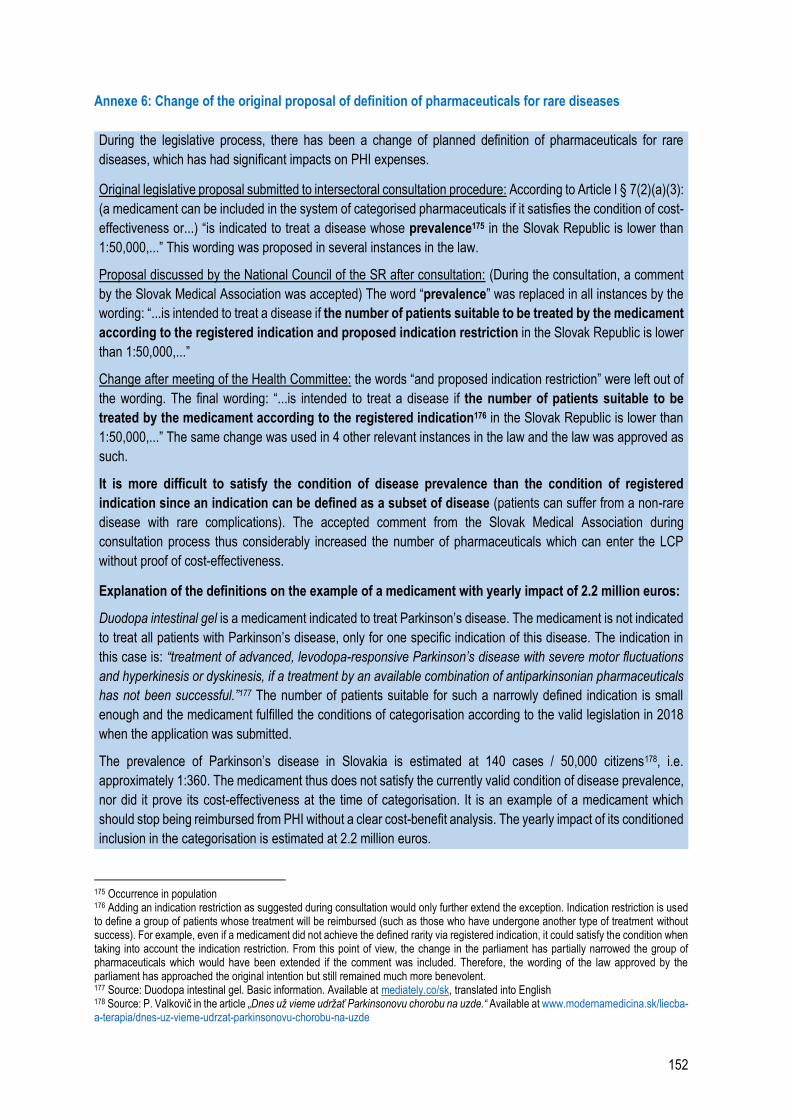
152
Annexe 6: Change of the original proposal of definition of pharmaceuticals for rare diseases
175 Occurrence in population 176 Adding an indication restriction as suggested during consultation would only further extend the exception. Indication restriction is used to define a group of patients whose treatment will be reimbursed (such as those who have undergone another type of treatment without success). For example, even if a medicament did not achieve the defined rarity via registered indication, it could satisfy the condition when taking into account the indication restriction. From this point of view, the change in the parliament has partially narrowed the group of pharmaceuticals which would have been extended if the comment was included. Therefore, the wording of the law approved by the parliament has approached the original intention but still remained much more benevolent. 177 Source: Duodopa intestinal gel. Basic information. Available at mediately.co/sk, translated into English 178 Source: P. Valkovič in the article „Dnes už vieme udržať Parkinsonovu chorobu na uzde.“ Available at www.modernamedicina.sk/liecba-a-terapia/dnes-uz-vieme-udrzat-parkinsonovu-chorobu-na-uzde
During the legislative process, there has been a change of planned definition of pharmaceuticals for rare
diseases, which has had significant impacts on PHI expenses.
Original legislative proposal submitted to intersectoral consultation procedure: According to Article I § 7(2)(a)(3):
(a medicament can be included in the system of categorised pharmaceuticals if it satisfies the condition of cost-
effectiveness or...) “is indicated to treat a disease whose prevalence175 in the Slovak Republic is lower than
1:50,000,...” This wording was proposed in several instances in the law.
Proposal discussed by the National Council of the SR after consultation: (During the consultation, a comment
by the Slovak Medical Association was accepted) The word “prevalence” was replaced in all instances by the
wording: “...is intended to treat a disease if the number of patients suitable to be treated by the medicament
according to the registered indication and proposed indication restriction in the Slovak Republic is lower
than 1:50,000,...”
Change after meeting of the Health Committee: the words “and proposed indication restriction” were left out of
the wording. The final wording: “...is intended to treat a disease if the number of patients suitable to be
treated by the medicament according to the registered indication176 in the Slovak Republic is lower than
1:50,000,...” The same change was used in 4 other relevant instances in the law and the law was approved as
such.
It is more difficult to satisfy the condition of disease prevalence than the condition of registered
indication since an indication can be defined as a subset of disease (patients can suffer from a non-rare
disease with rare complications). The accepted comment from the Slovak Medical Association during
consultation process thus considerably increased the number of pharmaceuticals which can enter the LCP
without proof of cost-effectiveness.
Explanation of the definitions on the example of a medicament with yearly impact of 2.2 million euros:
Duodopa intestinal gel is a medicament indicated to treat Parkinson’s disease. The medicament is not indicated
to treat all patients with Parkinson’s disease, only for one specific indication of this disease. The indication in
this case is: “treatment of advanced, levodopa-responsive Parkinson’s disease with severe motor fluctuations
and hyperkinesis or dyskinesis, if a treatment by an available combination of antiparkinsonian pharmaceuticals
has not been successful.”177 The number of patients suitable for such a narrowly defined indication is small
enough and the medicament fulfilled the conditions of categorisation according to the valid legislation in 2018
when the application was submitted.
The prevalence of Parkinson’s disease in Slovakia is estimated at 140 cases / 50,000 citizens178, i.e.
approximately 1:360. The medicament thus does not satisfy the currently valid condition of disease prevalence,
nor did it prove its cost-effectiveness at the time of categorisation. It is an example of a medicament which
should stop being reimbursed from PHI without a clear cost-benefit analysis. The yearly impact of its conditioned
inclusion in the categorisation is estimated at 2.2 million euros.
153
Annexe 7: Remuneration mechanisms
Hospitals in OECD countries are funded via four basic types of remuneration mechanisms.
1. Payment per case
a. Payment per diagnosis (DRG, diagnosis-related groups)
b. Payment for completed hospital stay
2. Fee-for-service (FFS)
3. Payment per diem
4. Prospective (global) budget
The characteristics, advantages and disadvantages of the mechanisms are summarised in the box.
Slovakia most frequently uses payments for completed hospital stay (inpatient care) to finance inpatient
healthcare (point 1b). Health insurance companies negotiate the amounts directly and individually with the
providers, i.e. hospitals. Therefore, one HIC can pay different sums to different hospitals for a completed hospital
stay within the same specialty. Payments for completed hospital stays do not include laboratory and imaging
procedures and some expensive types of medical material. A less frequent type of payment nowadays is payment
per diem (point 3). It is used in case of long-term hospital stays at internal medicine ward or psychiatry ward.
Besides inpatient care, hospitals in Slovakia provide also other types of HC, such as specialised
outpatient care (SOC) and common examination and treatment units (CETU). Different remuneration
mechanisms are used in these types of HC, mainly fee-for-service (point 2). The amounts paid for specific
procedures are negotiated by the HIC directly with providers; they determine a so-called unit price per procedure
point (each procedure has different number of points depending on complexity and costs). The MoH SR issues
an auxiliary list of procedures along with their evaluation in points. Its use in negotiations between an HIC and a
provider is voluntary. Fee-for-service is used also in one-day surgery and short-term hospital stay (up to 72 hours).
Remuneration mechanisms currently used in the Slovak system have various disadvantages (Table 58).
Payment for completed hospital stay may motivate providers to keep the length of stay as short as possible,
payment per diem can motivate them to keep it unreasonably long. Lump fee-for-service can lead to provision of
as many procedures as possible, often redundant ones, as well as to preferring certain procedures with a higher
payment over cheaper ones. This is why health insurance companies have established measures for the
providers in the form of financial limits, volume limits of provided procedures, approval of planned hospital stays
etc. However, these are not complex solutions.
Some health insurance companies have started using prospective global budget (point 4) in the recent
years to fund hospitals in Slovakia. It involves a fixed, usually monthly payment which covers a pre-determined
volume of HC regardless of the actual volume of HC provided by the hospital in the given period. It has been used
abroad in various forms, for example in Belgium, Denmark, Italy, Luxembourg.
The majority of remuneration mechanisms used in hospital funding in Slovakia nowadays should be
completely replaced by the DRG system in the future.
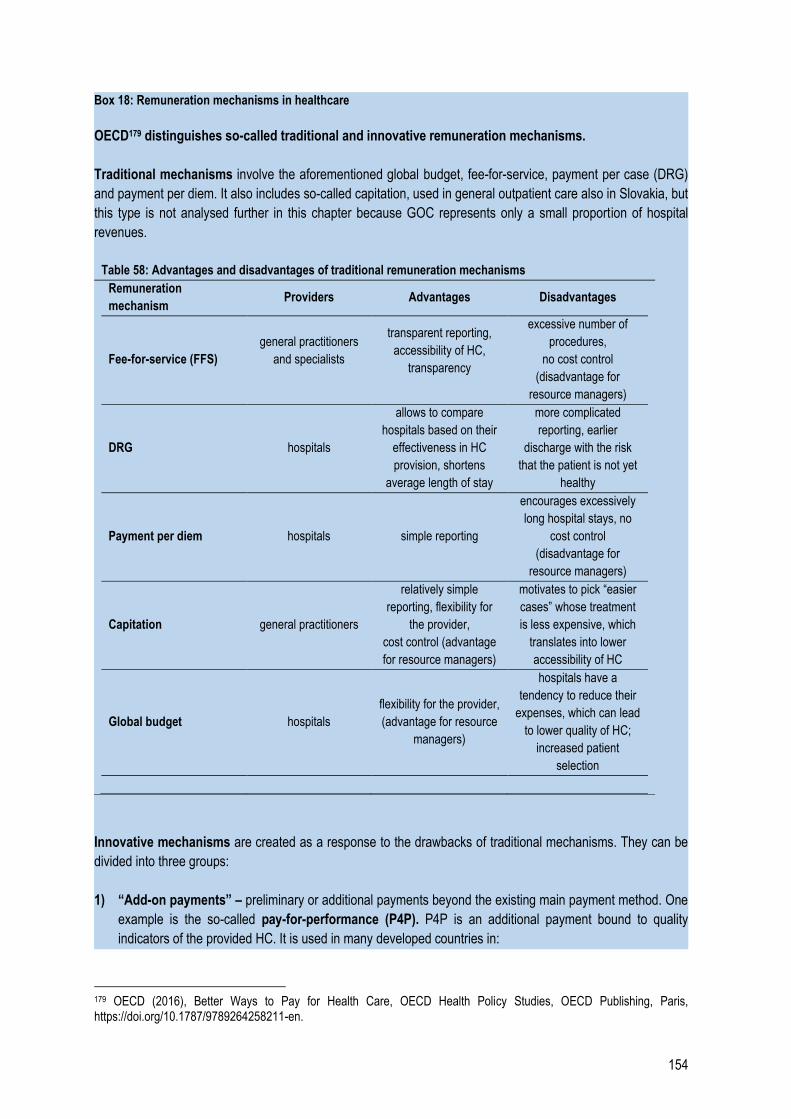
154
Box 18: Remuneration mechanisms in healthcare
OECD179 distinguishes so-called traditional and innovative remuneration mechanisms.
Traditional mechanisms involve the aforementioned global budget, fee-for-service, payment per case (DRG)
and payment per diem. It also includes so-called capitation, used in general outpatient care also in Slovakia, but
this type is not analysed further in this chapter because GOC represents only a small proportion of hospital
revenues.
Table 58: Advantages and disadvantages of traditional remuneration mechanisms
Remuneration
mechanism Providers Advantages Disadvantages
Fee-for-service (FFS)
general practitioners
and specialists
transparent reporting,
accessibility of HC,
transparency
excessive number of
procedures,
no cost control
(disadvantage for
resource managers)
DRG hospitals
allows to compare
hospitals based on their
effectiveness in HC
provision, shortens
average length of stay
more complicated
reporting, earlier
discharge with the risk
that the patient is not yet
healthy
Payment per diem hospitals simple reporting
encourages excessively
long hospital stays, no
cost control
(disadvantage for
resource managers)
Capitation general practitioners
relatively simple
reporting, flexibility for
the provider,
cost control (advantage
for resource managers)
motivates to pick “easier
cases” whose treatment
is less expensive, which
translates into lower
accessibility of HC
Global budget hospitals
flexibility for the provider,
(advantage for resource
managers)
hospitals have a
tendency to reduce their
expenses, which can lead
to lower quality of HC;
increased patient
selection
Innovative mechanisms are created as a response to the drawbacks of traditional mechanisms. They can be
divided into three groups:
1) “Add-on payments” – preliminary or additional payments beyond the existing main payment method. One
example is the so-called pay-for-performance (P4P). P4P is an additional payment bound to quality
indicators of the provided HC. It is used in many developed countries in:
179 OECD (2016), Better Ways to Pay for Health Care, OECD Health Policy Studies, OECD Publishing, Paris, https://doi.org/10.1787/9789264258211-en.
155
primary HC – this is where the P4P mechanism is used most often. The participation of providers in
the schema can be voluntary (AUS, FR, NZ, US, UK) or mandatory (TUR, CL). In the majority of cases,
the payment is bound to absolute or relative endpoints in preventive care, chronic disease
management, sometimes also to patient satisfaction (NZ, SWE). Unlike inpatient care, it is relatively
easy to bind pay-for-performance directly to a specific physician in primary HC, which is why, in most
cases, P4P functions individually.
specialists – like in primary HC, the participation of providers can be voluntary (FR, US) or mandatory
(ES, JAP). The payment is usually bound to chronic disease treatment or preventive care.
inpatient HC – P4P is used less in this type of healthcare. Clinical results and patient experience are
evaluated.
The P4P mechanism is a relatively new tool and it is used mainly as an addition to existing
remuneration mechanisms, which makes it hard to isolate its final impact on HC quality. P4P is
usually part of a more extensive reform of health system in the given country, such as the creation of Family
Health Units in Portugal, where P4P is partially used to evaluate healthcare staff. Only the implementation
of P4P itself creates the assumption of several beneficial systemic changes. They include, for example,
clear targets for providers, creation of measurable quality indicators of healthcare and more transparent
dialogue between providers and resource managers. It also requires a consistent methodology of data
collection and interpretation across HC entities.
Besides P4P, add-on payments include also “pay-for-coordination”. It is a preliminary payment
received by a HC provider (most often it is redistributed among general practitioners and specialists) for their
participation in the treatment of a patient with a chronic disease. It is used e.g. in France to treat diabetes
and in Germany to treat cardiovascular diseases.
2) “Bundled payments for episodes of care” – used in inpatient care. The mechanism is based on DRG.
However, in this case, one payment covers an entire “episode of care” which includes physician evaluation,
eventually post-op care, follow-up with a specialist, etc. This mechanism is very complicated from an
administrative point of view and requires strict coordination of data collection. In Sweden, this system is used
in some interventions (hip replacement, spine surgeries – pre/post-op care) or chronic diseases (diabetes).
In the Netherlands, bundles are used in some chronic diseases (diabetes, cardiovascular diseases). The
bundle is managed by a group of providers responsible for a patient with the diagnosis.
3) “Population-based payments” – groups of providers are evaluated based on the population they cover. In
the USA, this meant the creation of ACOs (Accountable Care Organisations) – groups of providers covering
a certain region who can differ in their exposure to risk. Some ACOs share only their profits, others both
profits and losses. A similar system is also used on a regional level, mainly in rural areas in Germany or
Spain.
Source: OECD (2016)
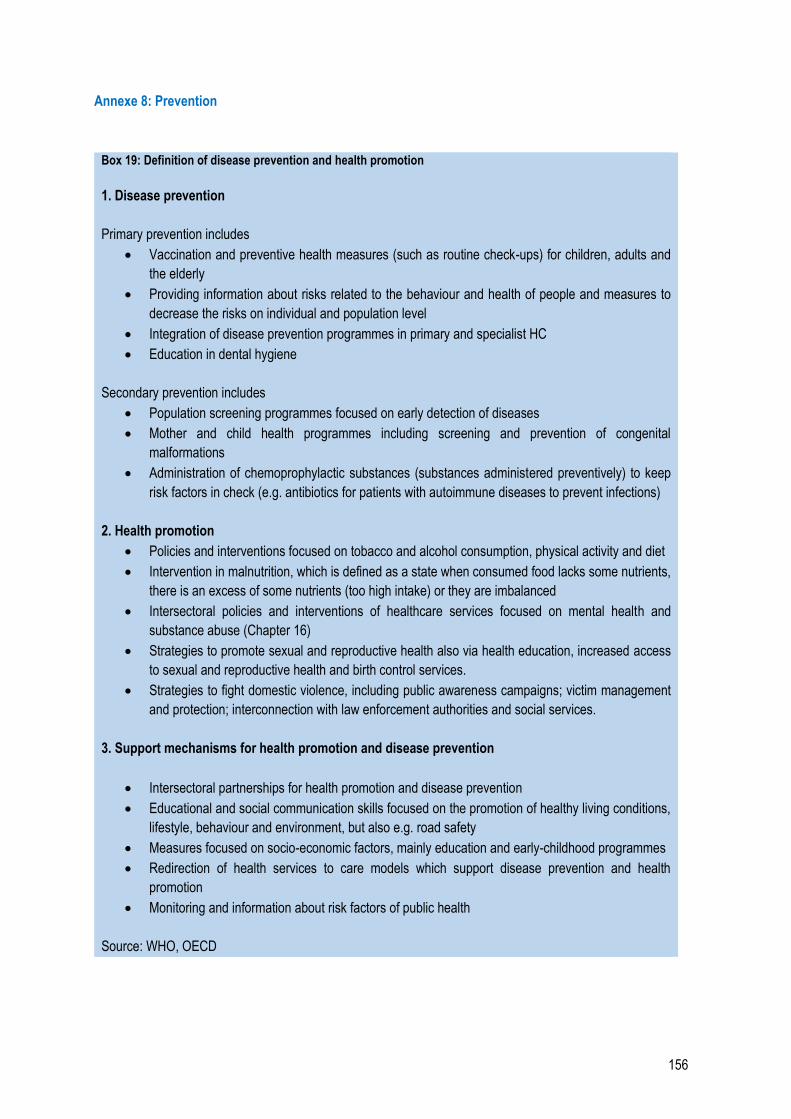
156
Annexe 8: Prevention
Box 19: Definition of disease prevention and health promotion
1. Disease prevention
Primary prevention includes
Vaccination and preventive health measures (such as routine check-ups) for children, adults and
the elderly
Providing information about risks related to the behaviour and health of people and measures to
decrease the risks on individual and population level
Integration of disease prevention programmes in primary and specialist HC
Education in dental hygiene
Secondary prevention includes
Population screening programmes focused on early detection of diseases
Mother and child health programmes including screening and prevention of congenital
malformations
Administration of chemoprophylactic substances (substances administered preventively) to keep
risk factors in check (e.g. antibiotics for patients with autoimmune diseases to prevent infections)
2. Health promotion
Policies and interventions focused on tobacco and alcohol consumption, physical activity and diet
Intervention in malnutrition, which is defined as a state when consumed food lacks some nutrients,
there is an excess of some nutrients (too high intake) or they are imbalanced
Intersectoral policies and interventions of healthcare services focused on mental health and
substance abuse (Chapter 16)
Strategies to promote sexual and reproductive health also via health education, increased access
to sexual and reproductive health and birth control services.
Strategies to fight domestic violence, including public awareness campaigns; victim management
and protection; interconnection with law enforcement authorities and social services.
3. Support mechanisms for health promotion and disease prevention
Intersectoral partnerships for health promotion and disease prevention
Educational and social communication skills focused on the promotion of healthy living conditions,
lifestyle, behaviour and environment, but also e.g. road safety
Measures focused on socio-economic factors, mainly education and early-childhood programmes
Redirection of health services to care models which support disease prevention and health
promotion
Monitoring and information about risk factors of public health
Source: WHO, OECD
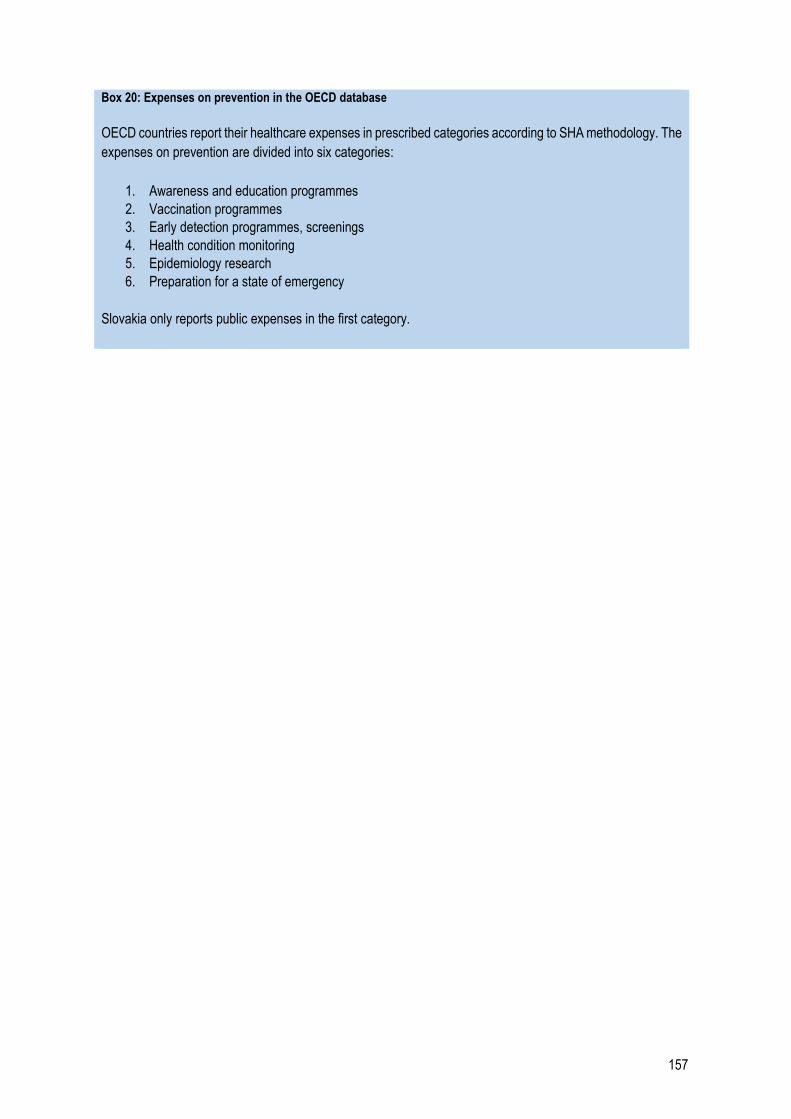
157
Box 20: Expenses on prevention in the OECD database
OECD countries report their healthcare expenses in prescribed categories according to SHA methodology. The
expenses on prevention are divided into six categories:
1. Awareness and education programmes
2. Vaccination programmes
3. Early detection programmes, screenings
4. Health condition monitoring
5. Epidemiology research
6. Preparation for a state of emergency
Slovakia only reports public expenses in the first category.
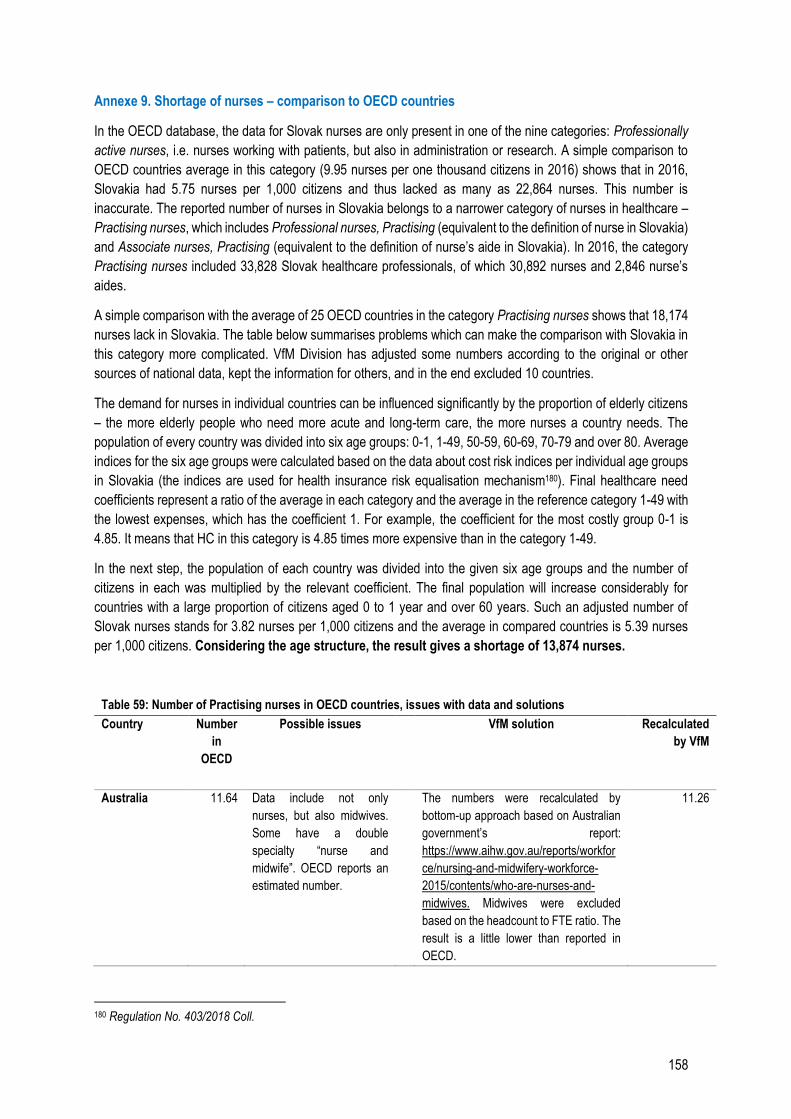
158
Annexe 9. Shortage of nurses – comparison to OECD countries
In the OECD database, the data for Slovak nurses are only present in one of the nine categories: Professionally
active nurses, i.e. nurses working with patients, but also in administration or research. A simple comparison to
OECD countries average in this category (9.95 nurses per one thousand citizens in 2016) shows that in 2016,
Slovakia had 5.75 nurses per 1,000 citizens and thus lacked as many as 22,864 nurses. This number is
inaccurate. The reported number of nurses in Slovakia belongs to a narrower category of nurses in healthcare –
Practising nurses, which includes Professional nurses, Practising (equivalent to the definition of nurse in Slovakia)
and Associate nurses, Practising (equivalent to the definition of nurse’s aide in Slovakia). In 2016, the category
Practising nurses included 33,828 Slovak healthcare professionals, of which 30,892 nurses and 2,846 nurse’s
aides.
A simple comparison with the average of 25 OECD countries in the category Practising nurses shows that 18,174
nurses lack in Slovakia. The table below summarises problems which can make the comparison with Slovakia in
this category more complicated. VfM Division has adjusted some numbers according to the original or other
sources of national data, kept the information for others, and in the end excluded 10 countries.
The demand for nurses in individual countries can be influenced significantly by the proportion of elderly citizens
– the more elderly people who need more acute and long-term care, the more nurses a country needs. The
population of every country was divided into six age groups: 0-1, 1-49, 50-59, 60-69, 70-79 and over 80. Average
indices for the six age groups were calculated based on the data about cost risk indices per individual age groups
in Slovakia (the indices are used for health insurance risk equalisation mechanism180). Final healthcare need
coefficients represent a ratio of the average in each category and the average in the reference category 1-49 with
the lowest expenses, which has the coefficient 1. For example, the coefficient for the most costly group 0-1 is
4.85. It means that HC in this category is 4.85 times more expensive than in the category 1-49.
In the next step, the population of each country was divided into the given six age groups and the number of
citizens in each was multiplied by the relevant coefficient. The final population will increase considerably for
countries with a large proportion of citizens aged 0 to 1 year and over 60 years. Such an adjusted number of
Slovak nurses stands for 3.82 nurses per 1,000 citizens and the average in compared countries is 5.39 nurses
per 1,000 citizens. Considering the age structure, the result gives a shortage of 13,874 nurses.
Table 59: Number of Practising nurses in OECD countries, issues with data and solutions
Country Number
in
OECD
Possible issues VfM solution Recalculated
by VfM
Australia 11.64 Data include not only
nurses, but also midwives.
Some have a double
specialty “nurse and
midwife”. OECD reports an
estimated number.
The numbers were recalculated by
bottom-up approach based on Australian
government’s report:
https://www.aihw.gov.au/reports/workfor
ce/nursing-and-midwifery-workforce-
2015/contents/who-are-nurses-and-
midwives. Midwives were excluded
based on the headcount to FTE ratio. The
result is a little lower than reported in
OECD.
11.26
180 Regulation No. 403/2018 Coll.
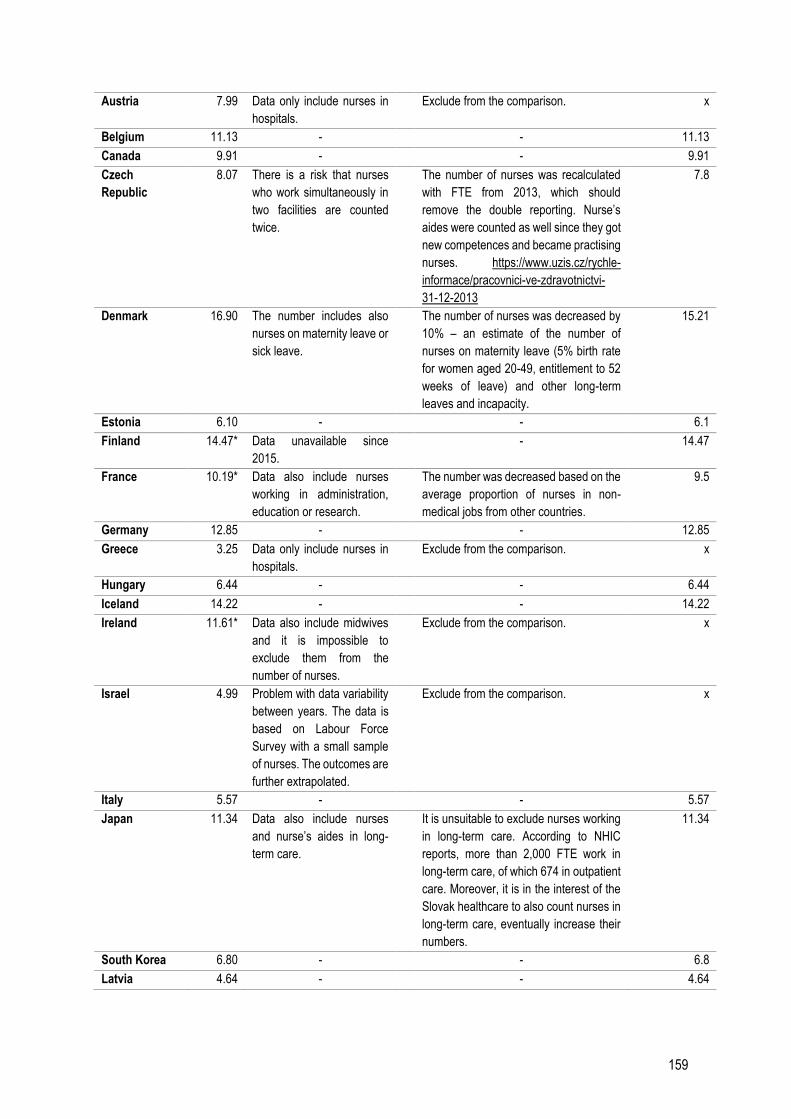
159
Austria 7.99 Data only include nurses in
hospitals.
Exclude from the comparison. x
Belgium 11.13 - - 11.13
Canada 9.91 - - 9.91
Czech
Republic
8.07 There is a risk that nurses
who work simultaneously in
two facilities are counted
twice.
The number of nurses was recalculated
with FTE from 2013, which should
remove the double reporting. Nurse’s
aides were counted as well since they got
new competences and became practising
nurses. https://www.uzis.cz/rychle-
informace/pracovnici-ve-zdravotnictvi-
31-12-2013
7.8
Denmark 16.90 The number includes also
nurses on maternity leave or
sick leave.
The number of nurses was decreased by
10% – an estimate of the number of
nurses on maternity leave (5% birth rate
for women aged 20-49, entitlement to 52
weeks of leave) and other long-term
leaves and incapacity.
15.21
Estonia 6.10 - - 6.1
Finland 14.47* Data unavailable since
2015.
- 14.47
France 10.19* Data also include nurses
working in administration,
education or research.
The number was decreased based on the
average proportion of nurses in non-
medical jobs from other countries.
9.5
Germany 12.85 - - 12.85
Greece 3.25 Data only include nurses in
hospitals.
Exclude from the comparison. x
Hungary 6.44 - - 6.44
Iceland 14.22 - - 14.22
Ireland 11.61* Data also include midwives
and it is impossible to
exclude them from the
number of nurses.
Exclude from the comparison. x
Israel 4.99 Problem with data variability
between years. The data is
based on Labour Force
Survey with a small sample
of nurses. The outcomes are
further extrapolated.
Exclude from the comparison. x
Italy 5.57 - - 5.57
Japan 11.34 Data also include nurses
and nurse’s aides in long-
term care.
It is unsuitable to exclude nurses working
in long-term care. According to NHIC
reports, more than 2,000 FTE work in
long-term care, of which 674 in outpatient
care. Moreover, it is in the interest of the
Slovak healthcare to also count nurses in
long-term care, eventually increase their
numbers.
11.34
South Korea 6.80 - - 6.8
Latvia 4.64 - - 4.64
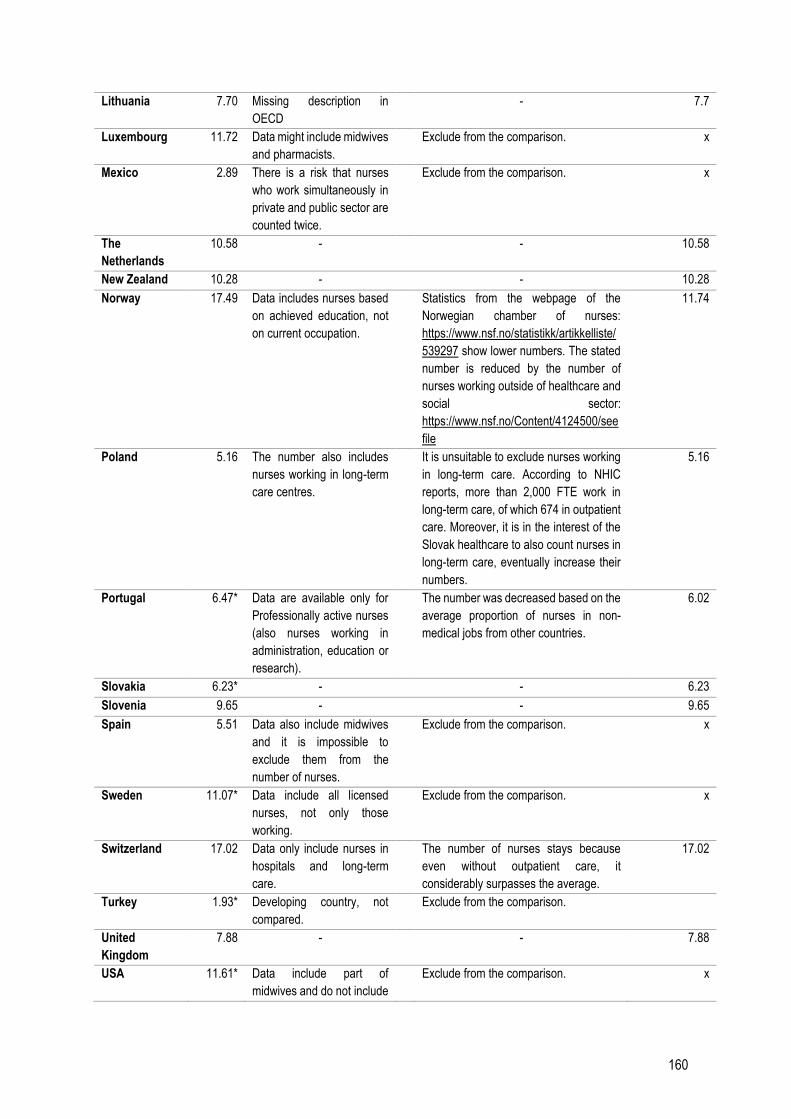
160
Lithuania 7.70 Missing description in
OECD
- 7.7
Luxembourg 11.72 Data might include midwives
and pharmacists.
Exclude from the comparison. x
Mexico 2.89 There is a risk that nurses
who work simultaneously in
private and public sector are
counted twice.
Exclude from the comparison. x
The
Netherlands
10.58 - - 10.58
New Zealand 10.28 - - 10.28
Norway 17.49 Data includes nurses based
on achieved education, not
on current occupation.
Statistics from the webpage of the
Norwegian chamber of nurses:
https://www.nsf.no/statistikk/artikkelliste/
539297 show lower numbers. The stated
number is reduced by the number of
nurses working outside of healthcare and
social sector:
https://www.nsf.no/Content/4124500/see
file
11.74
Poland 5.16 The number also includes
nurses working in long-term
care centres.
It is unsuitable to exclude nurses working
in long-term care. According to NHIC
reports, more than 2,000 FTE work in
long-term care, of which 674 in outpatient
care. Moreover, it is in the interest of the
Slovak healthcare to also count nurses in
long-term care, eventually increase their
numbers.
5.16
Portugal 6.47* Data are available only for
Professionally active nurses
(also nurses working in
administration, education or
research).
The number was decreased based on the
average proportion of nurses in non-
medical jobs from other countries.
6.02
Slovakia 6.23* - - 6.23
Slovenia 9.65 - - 9.65
Spain 5.51 Data also include midwives
and it is impossible to
exclude them from the
number of nurses.
Exclude from the comparison. x
Sweden 11.07* Data include all licensed
nurses, not only those
working.
Exclude from the comparison. x
Switzerland 17.02 Data only include nurses in
hospitals and long-term
care.
The number of nurses stays because
even without outpatient care, it
considerably surpasses the average.
17.02
Turkey 1.93* Developing country, not
compared.
Exclude from the comparison.
United
Kingdom
7.88 - - 7.88
USA 11.61* Data include part of
midwives and do not include
Exclude from the comparison. x
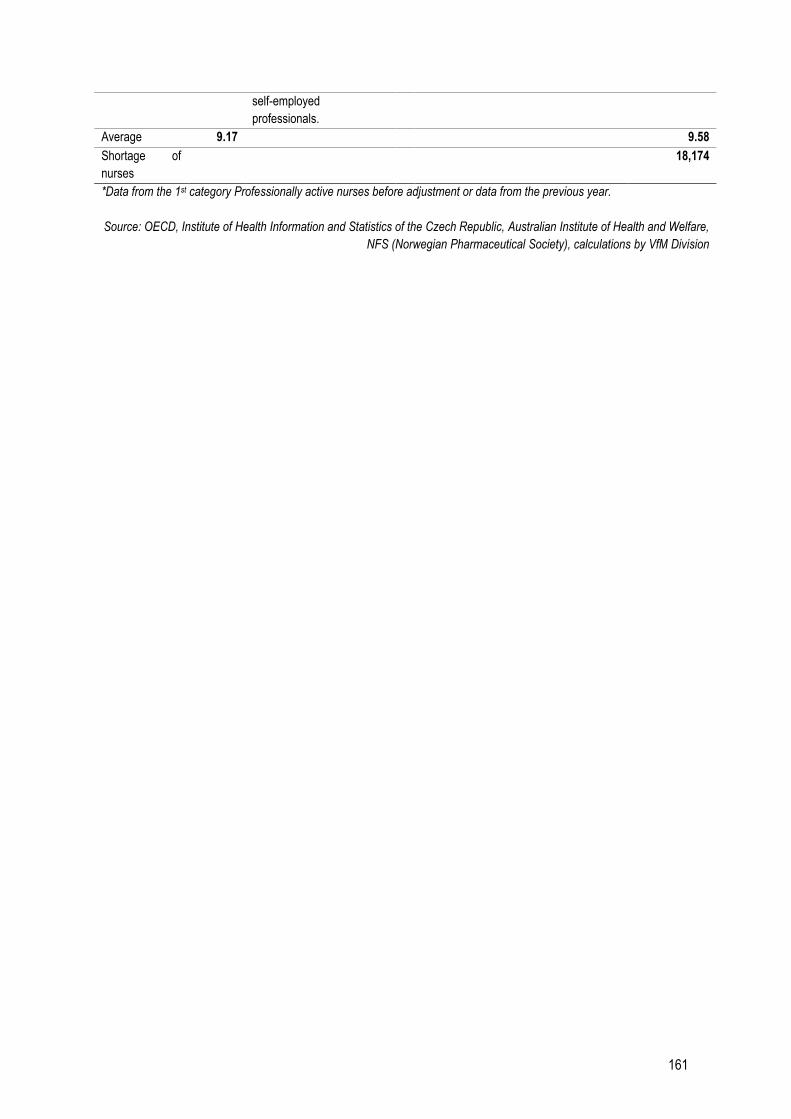
161
self-employed
professionals.
Average 9.17 9.58
Shortage of
nurses
18,174
*Data from the 1st category Professionally active nurses before adjustment or data from the previous year.
Source: OECD, Institute of Health Information and Statistics of the Czech Republic, Australian Institute of Health and Welfare,
NFS (Norwegian Pharmaceutical Society), calculations by VfM Division
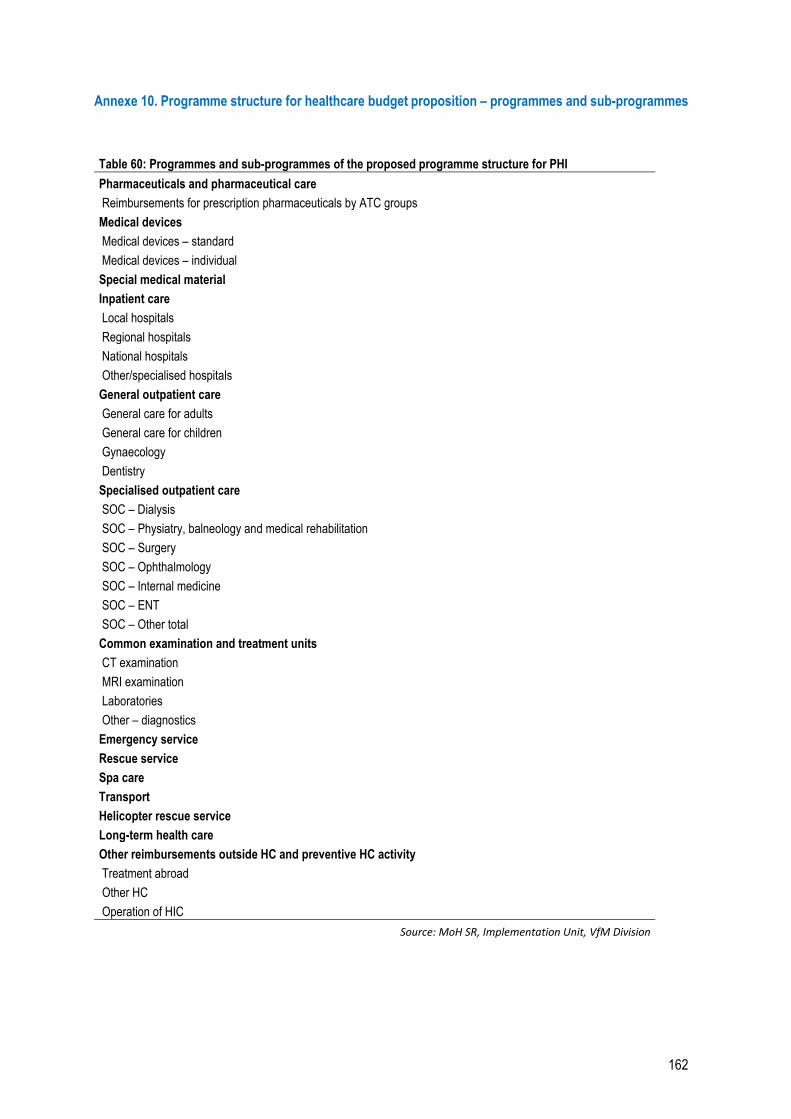
162
Annexe 10. Programme structure for healthcare budget proposition – programmes and sub-programmes
Table 60: Programmes and sub-programmes of the proposed programme structure for PHI
Pharmaceuticals and pharmaceutical care
Reimbursements for prescription pharmaceuticals by ATC groups
Medical devices
Medical devices – standard
Medical devices – individual
Special medical material
Inpatient care
Local hospitals
Regional hospitals
National hospitals
Other/specialised hospitals
General outpatient care
General care for adults
General care for children
Gynaecology
Dentistry
Specialised outpatient care
SOC – Dialysis
SOC – Physiatry, balneology and medical rehabilitation
SOC – Surgery
SOC – Ophthalmology
SOC – Internal medicine
SOC – ENT
SOC – Other total
Common examination and treatment units
CT examination
MRI examination
Laboratories
Other – diagnostics
Emergency service
Rescue service
Spa care
Transport
Helicopter rescue service
Long-term health care
Other reimbursements outside HC and preventive HC activity
Treatment abroad
Other HC
Operation of HIC
Source: MoH SR, Implementation Unit, VfM Division
163
References
American Cancer Society (ACS) (2018). Lifetime Risk of Developing or Dying From Cancer. Available at:
https://www.cancer.org/cancer/cancer-basics/lifetime-probability-of-developing-or-dying-from-cancer.html.
Amgros. (2019). Available at: amgros.dk.
Barbetta, G. P., Turati, G., & Zago, A. M. (2007). Behavioral differences between public and private not‐for‐profit hospitals
in the Italian national health service. Health economics, 16(1), p. 75-96.
Brazinova, A., Hasto, J., Levav, I., & Pathare, S. (2019). Mental Health Care Gap: The Case of the Slovak Republic.
Administration and Policy in Mental Health and Mental Health Services Research, p. 1-7. Available at:
https://www.ncbi.nlm.nih.gov/pubmed/31256291.
Brogan, C. (2017). Early death and ill health linked to low socioeconomic status. Available at:
https://www.imperial.ac.uk/news/177249/early-death-health-linked-socioeconomic-status/.
Cameron, D., Ubels, J., Norstroem, F. (2018). On what basis are medical cost-effectiveness thresholds set? Clashing
opinions and an absence of data: a systematic review. Global health action, 11.1: 1447828.
Canadian Agency for Drugs and Technologies in Health. (2019). Pharmacoeconomic Review Report (Resubmission).
Nusinersen (Spinraza). Available at: https://www.cadth.ca/sites/default/files/cdr/pharmacoeconomic/sr0576-spinraza-
resubmission-pharmacoeconomic-report.pdf.
Cashin, C., Sparkes, S., & Bloom, D. (2017). Earmarking for health: from theory to practice (No.
WHO/HIS/HGF/HFWorkingPaper/17.5). World Health Organization.
Centre for Disease Control and Prevention (CDC) (2014).Now, 2 Out of Every 5 Americans Expected to Develop Type 2
Diabetes During Their Lifetime. Available at: https://www.cdc.gov/diabetes/pdfs/newsroom/now-2-out-of-every-5-americans-
expected-to-develop-type-2-diabetes-during-their-lifetime.pdf.
Department of Health and Children, IRL. (2002). Available at: https://www.drugsandalcohol.ie/5349/1/1500-1388.pdf.
Devaux, M. and F. Sassi (2015), "The Labour Market Impacts of Obesity, Smoking, Alcohol Use and Related Chronic
Diseases", OECD Health Working Papers, No. 86, OECD Publishing, Paris, https://doi.org/10.1787/5jrqcn5fpv0v-en.
European Commission (EC) (2017). A European One Health Action Plan Against Antimicrobial Resistance (AMR).
European Commission (EC) (2017). The 2018 Ageing Report. https://ec.europa.eu/info/publications/economy-finance/2018-
ageing-report-underlying-assumptions-and-projection-methodologies_en.
European Commission (EC) (2018) Challenges in long-term care in Europe. ESPN.
https://ec.europa.eu/social/main.jsp?langId=en&catId.
European Medicines Agency. Summary of Product Characteristics. Spinraza 12mg. Available at:
https://www.ema.europa.eu/en/documents/product-information/spinraza-epar-product-information_sk.pdf.
Eurostat (2019). Preventable and treatable mortality statistics. Available at: https://ec.europa.eu/eurostat/statistics-
explained/index.php/Preventable_and_treatable_mortality_statistics.
Finstat. (2019). Database of financial data – economic results of Slovak companies. Available at: https://finstat.sk/databaza-
financnych-udajov?sort=profit-desc.
Folentová, V., (2019). Šéfuje kontrole liekov: Na túto prácu treba odvahu. Inšpektorke sa vyhrážali, pýtali sa jej, či si je istá,
že má v poriadku auto. Available at: https://dennikn.sk/1538353/sefuje-kontrole-liekov-na-tuto-pracu-treba-odvahu-
inspektorke-sa-vyhrazali-pytali-sa-jej-ci-si-je-ista-ze-ma-v-poriadku-auto/.
Gardner, J. (2019). Cost-effectiveness agency clears Biogen's Spinraza for UK patients. Available at:
https://www.biopharmadive.com/news/cost-effectiveness-agency-clears-biogens-spinraza-for-uk-patients/554863/
164
Global Burden of Disease Collaborative Network (GBDCN) (2018). Global Burden of Disease Study Results. IHME (Institute
for Health Metrics and Evaluation), Seattle. Available at: http://ghdx.healthdata.org/gbd-results-tool.
Gmeinder, M., Morgan, D., & Mueller, M. (2017). How much do OECD countries spend on prevention?. OECD Health
Working Papers, No. 101, OECD Publishing, Paris, Available at: https://www.oecd-ilibrary.org/social-issues-migration-
health/how-much-do-oecd-countries-spend-on-prevention_f19e803c-en.
Goliáš, P. (2018). Analýza stavu a možností širšieho využívania biosimilárnej liečby na Slovensku. Available at:
http://www.ineko.sk/file_download/1291/Anal%C3%BDzy+stavu+a+mo%C5%BEnost%C3%AD+%C5%A1ir%C5%A1ieho+
vyu%C5%BE%C3%ADvania+biosimil%C3%A1rnej+lie%C4%8Dby+na+Slovensku.pdf.
Gustavsson, A., Svensson, M., Jacobi, F., Allgulander, C., Alonso, J., Beghi, E.,... & Gannon, B. (2011). Cost of disorders of
the brain in Europe 2010. European neuropsychopharmacology, 21(10), p. 718-779.
Hašto, J., Breier, P., Černák, P. (1999). Reforma psychiatrickej starostlivosti v SR. Trenčín: Vydavateľstvo F.
Heckman, J. (2008). Return on Investment: Cost vs. Benefits. Available at:
https://childandfamilypolicy.duke.edu/pdfs/10yranniversary_Heckmanhandout.pdf.
Hewlett, E., Moran, V. (2014). Making Mental Health Count. FOCUS ON HEALTH. OECD.
Chisholm, D., Sweeny, K., Sheehan, P., Rasmussen, B., Smit, F., Cuijpers, P., & Saxena, S. (2016). Scaling-up treatment
of depression and anxiety: a global return on investment analysis. The Lancet Psychiatry, 3(5), 415-424.WHO (2005).
Implementation Unit (2018). Interim implementation report 2018. Available at:
https://www.vlada.gov.sk/data/files/7386_priebezna-implementacna-sprava-2018.pdf.
Institute of Health Policies (IoHP). (2019). Alternatívy riešenia garancie zmluvných objemov pri obstarávaní biosimilárnych a
generických liekov. Internal document.
Kessler, R. C., Berglund, P., Demler, O., Jin, R., Merikangas, K. R., & Walters, E. E. (2005). Lifetime prevalence and age-
of-onset distributions of DSM-IV disorders in the National Comorbidity Survey Replication. Archives of general psychiatry,
62(6), 593-602.
Kringos, D., W. Boerma, Y. Bourgueil, T. Cartier, T. Dedeu, T. Hasvold, A. Hutchinson, M. Lember, M. Oleszczyk, D. Rotar
Pavlic, I. Svab, P. Tedeschi, S. Wilm, A. Wilson, A. Windak, J. van der Zee, and P. Groenewegen. 2013b. “The Strength of
Primary Care in Europe: An International Comparative Study.” The British Journal of General Practice 63 (616): e742–e750.
Kruse, F. M., Stadhouders, N. W., Adang, E. M., Groenewoud, S., & Jeurissen, P. P. (2018). Do private hospitals outperform
public hospitals regarding efficiency, accessibility, and quality of care in the European Union? A literature review. The
International journal of health planning and management, 33(2), e434-e453.
Koezponti Statisztikai Hivatal (KSH). https://www.ksh.hu/?lang=en.
Matthauer & Wittenbecher (2013) Hospital payment systems based on diagnosis-related groups: experiences in low- and
middle-income countries. Bulletin of the World Health Organization. https://www.who.int/bulletin/volumes/91/10/12-
115931/en/.
McDaid, D., Park, A. L., Knapp, M., Wilson, E., Rosen, B., & Beecham, J. (2017). Commissioning cost-effective services for
promotion of mental health and wellbeing and prevention of mental ill-health. Public Health England. Available at:
https://assets.publishing.service.gov.uk/government/uploads/system/uploads/attachment_data/file/640714/Commissioning
_effective_mental_health_prevention_report.pdf.
MoF SR (2017). Metodika zostavovania scenára nezmenených politík. Available at:
http://www.finance.gov.sk/Default.aspx?CatID=9301
Mölstad, S., et al. (2017). Lessons learnt during 20 years of the Swedish strategic programme against antibiotic resistance.
Bulletin of the World Health Organization, 95(11), p. 764.
165
National Institute for Health and Care Excellence (2018). Appraisal consultation document Nusinersen for treating spinal
muscular atrophy. Available at: https://www.nice.org.uk/guidance/ta588/documents/appraisal-consultation-document.
NHIC. http://www.nczisk.sk/Pages/default.aspx.
NHS (2018). Where to give birth: the options. Available at: https://www.nhs.uk/conditions/pregnancy-and-baby/where-can-i-
give-birth/.
NICE (2019a). https://www.nice.org.uk/.
NICE (2019b). https://www.nice.org.uk/guidance/conditions-and-diseases/mental-health-and-behavioural-conditions.
OECD & Eurostat (2019). Avoidable mortality: OECD/Eurostat lists of preventable and treatable causes of death (2019
version). Available at: https://www.oecd.org/health/health-systems/Avoidable-mortality-2019-Joint-OECD-Eurostat-List-
preventable-treatable-causes-of-death.pdf.
OECD (2007). Performance Budgeting in OECD Countries. OECD Publishing. Paris. Available at:
https://www.bmf.gv.at/budget/haushaltsrechtsreform/OECD_Studie_Performance_Budgeting.pdf?67ruiz.
OECD (2016). Better Ways to Pay for Health Care, OECD Health Policy Studies, OECD. Available at:
https://www.oecd.org/publications/better-ways-to-pay-for-health-care-9789264258211-en.htm.
OECD (2017a). OECD work on health. Available at: http://www.oecd.org/health/Health-Brochure.pdf.
OECD (2017b). Performance budgeting. Government at a Glance 2017, OECD Publishing, Paris.
https://doi.org/10.1787/gov_glance-2017-40-en.
OECD (2017c). OECD Economic Surveys. Slovak Republic. Available at: https://read.oecd-ilibrary.org/economics/oecd-
economic-surveys-slovak-republic-2017_eco_surveys-svk-2017-en#page140.
OECD (2017d), Health at a Glance.
OECD (2018), Health at a Glance: Europe 2018.
OECD. Database: https://stats.oecd.org/.
Patel, V., Chisholm, D., Dua, T., Laxminarayan, R., & Medina-Mora, M. E. (2016). Mental, Neurological, and Substance Use
Disorders: Disease Control Priorities, (Volume 4). The International Bank for Reconstruction and Development/The World
Bank.
Pharmac. (2019). Available at: https://www.pharmac.govt.nz/.
Review on Antimicrobial Resistance. (2016). Tackling drug-resistant infections globally: final report and recommendations.
Available at: https://amr-review.org/.
Roberts, G., & Grimes, K. (2011). Return on Investment—Mental Health Promotion and Mental Illness Prevention. Canadian
Policy Network at the University of Western Ontario. Return on Investment.
Sandall J., Tribe, R.M., Avery L., Mola, G., Viesser, G. HA., Homer, C. SE. (2018). Short-term and long-term effects of
caesarean section on the health of women and children. The Lancet. Available at:
https://www.thelancet.com/journals/lancet/article/PIIS0140-6736(18)31930-5/fulltext.
Schäfer, W. L. A., W. G. W. Boerma, F. G. Schellevis, and P. P. Groenewegen. 2017. “GP Practices as a One-Stop Shop:
How Do Patients Perceive the Quality of Care? A Cross-Sectional Study in Thirty-Four Countries.” Health Services Research
(December). doi: 10.1111/1475-6773.12754.
Statistics Poland. https://stat.gov.pl/en/topics/health/.
State Institute for Drug Control of the Czech Republic. (2017). Postup pro posuzování analýzy nákladové efektivity. Available
at: http://www.sukl.cz/leciva/sp-cau-028.
166
State Institute for Drug Control of the Czech Republic. Available at:
http://www.sukl.cz/modules/medication/detail.php?code=0222208&tab=info.
Tesar, T., Obsitnik, B., Kaló, Z., & Kritensen, F. B. (2019). How Changes in Reimbursement Practices Influence the Financial
Sustainability of Medicine Policy: Lessons Learned from Slovakia. Frontiers in Pharmacology, 10, 664.
Tynkkynen, L. K., & Vrangbæk, K. (2018). Comparing public and private providers: a scoping review of hospital services in
Europe. BMC health services research, 18(1), 141.
Všeobecná zdravotná poisťovňa, Implementation Unit, Value for Money Division (2019). Implementačný plán VšZP. Revízia
výdavkov – hodnota za peniaze a zvýšenie efektivity procesov. Internal document.
Všeobecná zdravotní pojištovna ČR. (2019). Zdravotní výkony. Číselník 1218. Available at:
https://www.vzp.cz/poskytovatele/ciselniky/zdravotni-vykony.
WB (2018a).Competencies of general practitioners in the Slovak Republic: Scope for change.
WB (2018b).Expanding GP competencies in the Slovak Republic: policy routes and recommendations. Available at:
http://www.zvld.sk/wp-content/uploads/2017/11/Slovakia_GP_service_profile_FOR_EDITORS.pdf.
WHO (2007). Management Sciences for Health and World Health Organization. 2007. Drug and Therapeutics Committee
Training Course. Submitted to the U.S. Agency for International Development by the Rational Pharmaceutical Management
Plus Program. Arlington, VA: Management Sciences for Health.
WHO (2013). WHO recommendations on Postnatal care of the mother and newborn. Available at:
https://apps.who.int/iris/bitstream/handle/10665/97603/9789241506649_eng.pdf?sequence=1.
WHO (2015). Promoting Health, Preventing Disease the Economic Case: The Economic Case. OECD Publishing.
WHO (2015a). Postnatal Care for Mothers and Newborns Highlights from the World Health Organization 2013 Guidelines.
https://www.who.int/maternal_child_adolescent/publications/WHO-MCA-PNC-2.
WHO (2016). WHO recommendations on antenatal care for a positive pregnancy experience. Available at:
https://www.who.int/reproductivehealth/publications/maternal_perinatal_health/anc-positive-pregnancy-experience/en/.
WHO (2018a). WHO recommendations: non-clinical interventions to reduce unnecessary caesarean sections. Available at:
https://www.who.int/reproductivehealth/publications/non-clinical-interventions-to-reduce-cs/en/.
WHO (2018b). WHO recommendations: intrapartum care for a positive childbirth experience. Available at:
https://www.who.int/reproductivehealth/publications/intrapartum-care-guidelines/en/.
WHO (2018c). Use of ATC/DDD. Available at: https://www.whocc.no/use_of_atc_ddd/.
WHO (2019). Can people afford to pay for health care? Available at:
https://apps.who.int/iris/bitstream/handle/10665/311654/9789289054058-eng.pdf?sequence=1&isAllowed=y.
Winkler P., Španiel F., Csémy, L., Janoušková, M., Krejníková, L. (2013). Reforma systému psychiatrické péče: Psychiatrické
centrum Praha.
167
List of abbreviations
ADOS Agentúra domácej ošetrovateľskej starostlivosti (Home care and nursing agency)
AE Actual expenditure
AOPP Association for the Protection of Patients' Rights in Slovakia
APA American Psychiatric Association
ATC Anatomical Therapeutical Chemical Classification System of Pharmaceuticals
BCG Boston Consulting Group
BP Budget proposal
CADTH Canadian Agency for Drugs and Technologies in Health
CETU Common examination and treatment units (spoločné vyšetrovacie a liečebné zložky)
CMI Case-mix index
COFOG Classification of Functions of Government
CP Central procurement
CPI Consumer Price Index
CPP Centrally procured pharmaceuticals
CS Caesarean section
CT Computer tomography examination
CTG Cardiotocography
DALY Disability-Adjusted Life Years
DCG Diagnostic Cost Groups
DDD Daily defined dose
DF Children’s teaching hospital
DOS Dom ošetrovateľskej starostlivosti (type of nursing home)
DRG Diagnosis-related groups – payment per diagnosis
EBITDA Earnings before Interest, Taxes, Depreciation and Amortisation
EC European Commission
ECG Electrocardiography
EE Expected expenditure
ENT Otorhinolaryngology
EMA European Medicines Agency
ESA European system of accounts
EU European Union
EU15 Countries which entered the EU before 2004
EU28 Member states of the European Union
FFS Fee-for-service
FN Teaching hospital
FNPV Fond na podporu vzdelávania (Slovak Education Support Fund)
GBDCN Global Burden of Disease Collaborative Network
GDP Gross domestic product
GOC General outpatient care
GP General practitioner
HC Healthcare
HCSA Health Care Surveillance Authority
HIC Health insurance company
HTA Health technology assessment
ICD International Classification of Diseases
IFP Institute for Financial Policy
IoHP/IZP Institute of Health Policies (Inštitút zdravotnej politiky)
LCP List of categorised pharmaceuticals
LTC Long-term care
MACI Multi-annual cost index
MEA Managed entry agreement
MoF SR Ministry of Finance of the SR
MoH SR Ministry of Health of the SR
MoLSAF SR
Ministry of Labour, Social Affairs and Family of the SR
MP Minimum pay
MRC Marginalised Romany community
MRI Magnetic resonance imaging
NHIC National Health Information Centre
NHS National Health Service (UK)
NICE National Institute for Health and Care Excellence
NPC No-policy change
OECD Organisation for Economic Co-operation and Development
OOP Out-of-pocket payments for healthcare
OPIO Odkázanosť na pomoc inej osoby (Reliance on care by another person)
P4P Pay-for-performance
PC Policy change
PCG Index based on pharmaceuticals consumption
PCIP Potentially cost-ineffective pharmaceuticals
PHI Public health insurance
PXE Power Exchange Central Europe
QALY Quality-adjusted life year
SCP Slovak Chamber of Psychologists
SDTP Standard diagnostic and treatment procedures
SGR Self-Governing Region
SHA System of Health Accounts
ŠÚKL Štátny ústav pre kontrolu liečiv (State Institute for Drug Control)
168
SMM Special medical material
SOC Specialised outpatient care
SPsS SLS
Slovak Psychiatric Society
UN University hospital
URPO
Úrad pre riadenie podriadených organizácií (organisation managing teaching and university hospitals in Slovakia)
V3 Visegrád group without Slovakia
V4 Visegrád group countries
VAT Value-added tax
VfM Value for Money
VšZP Všeobecná zdravotná poisťovňa, a.s.
WB World Bank
WHO World Health Organisation
X-ray X-ray examination

169