fast oscillations associated with interictal spikes localize the epileptogenic zone in patients with...
TRANSCRIPT
www.elsevier.com/locate/ynimg
NeuroImage 39 (2008) 661–668Fast oscillations associated with interictal spikes localize theepileptogenic zone in patients with partial epilepsy
Adrian G. Guggisberg,a,d,⁎ Heidi E. Kirsch,a,b Mary M. Mantle,a
Nicholas M. Barbaro,c and Srikantan S. Nagarajana
aBiomagnetic Imaging Laboratory, Department of Radiology, University of California San Francisco (UCSF),513 Parnassus Ave S-362, San Francisco, CA 94143-0628, USAbDepartment of Neurology, University of California San Francisco (UCSF), USAcDepartment of Neurological Surgery, University of California San Francisco (UCSF), USAdDepartment of Neurology, University of Berne, Inselspital, 3010 Bern, Switzerland
Received 4 June 2007; revised 24 July 2007; accepted 14 September 2007Available online 29 September 2007
Although interictal epileptic spikes are defined as fast transientactivity, the spatial distribution of spike-related high-frequency powerchanges is unknown. In this study, we localized the sources of spike-locked power increases in the beta and gamma band with magne-toencephalography and an adaptive spatial filtering technique andtested the usefulness of these reconstructions for determining theepileptogenic zone in a population of 27 consecutive presurgicalpatients with medication refractory partial epilepsies. The reliability ofthis approach was compared to the performance of conventional MEGtechniques such as equivalent current dipole (ECD) models. In patientswith good surgical outcome after a mean follow-up time of 16 months(Engel class I or II), the surgically resected area was identified with anaccuracy of 85% by sources of spike-locked beta/gamma activity,which compared favorably with the accuracy of 69% found for ECDmodels of single spikes. In patients with a total of more than 50 spikesin their recordings, the accuracies increased to 100% vs. 88%,respectively. Imaging of spike-locked beta/gamma power changestherefore seems to be a reliable and fast alternative to conventionalMEG techniques for localizing epileptogenic tissue, in particular, ifmore than 50 interictal spikes can be recorded.© 2007 Elsevier Inc. All rights reserved.
Introduction
Magnetoencephalography (MEG) is increasingly used in thepresurgical management of patients with partial epilepsiesrefractory to combined pharmacotherapy. It has the advantage of
⁎ Corresponding author. Biomagnetic Imaging Laboratory, Department ofRadiology, University of California San Francisco (UCSF), 513 ParnassusAve S-362, San Francisco, CA 94143-0628, USA. Fax: +1 415 502 4302.
E-mail address: [email protected] (A.G. Guggisberg).Available online on ScienceDirect (www.sciencedirect.com).
1053-8119/$ - see front matter © 2007 Elsevier Inc. All rights reserved.doi:10.1016/j.neuroimage.2007.09.036
being completely non-invasive and of offering a broad set of high-resolution analysis techniques. By recording the minute extra-cranial magnetic fields produced by brain current sources, it cantrace field changes with a time resolution below 1 ms and permitsthe localization of sources with an accuracy of several millimeters(Wheless et al., 2004). Furthermore, it also allows the assessmentof the frequency content of neural oscillations. Thus, it is ideal forthe study of cerebral activity that changes rapidly over space, time,and frequency, such as epileptic discharges.
The most widely used MEG technique for localizing theepileptogenic zone in patients with partial epilepsy is visualidentification of interictal spikes in the raw MEG and calculatingthe location and orientation of equivalent current dipoles (ECD)that best account for the observed magnetic field (Vrba andRobinson, 2001; Wheless et al., 2004). Several studies have shownthat this method can provide reliable and useful information inpresurgical patients with partial epilepsy (Stefan et al., 2003; Wuet al., 2006; RamachandranNair et al., 2007) and have concludedthat non-invasive MEG techniques might eventually partly replaceinvasive intracranial recording techniques (Pataraia et al., 2004;Papanicolaou et al., 2005; Knowlton et al., 2006). However, theanalysis procedures require that each dipole is manually reviewedand classified as either corresponding to a real spike or ascorresponding to a non-epileptic origin, which can be time-consuming, requires trained and experienced scorers, and intro-duces a sizeable amount of subjectivity in the results.
Single epileptic spikes are defined as having a duration of lessthan 70 ms (IFSECN, 1974), which corresponds to an oscillationfrequency of greater than 7 Hz. Thus, epileptic spikes are mostlymanifested in the alpha, beta, and gamma frequency bands of MEGrecordings, and localizing sources of these higher-frequencyactivities seems to be a promising approach for localizingepileptogenic tissue. The more recently introduced adaptive spatialfiltering techniques such as synthetic aperture magnetometry
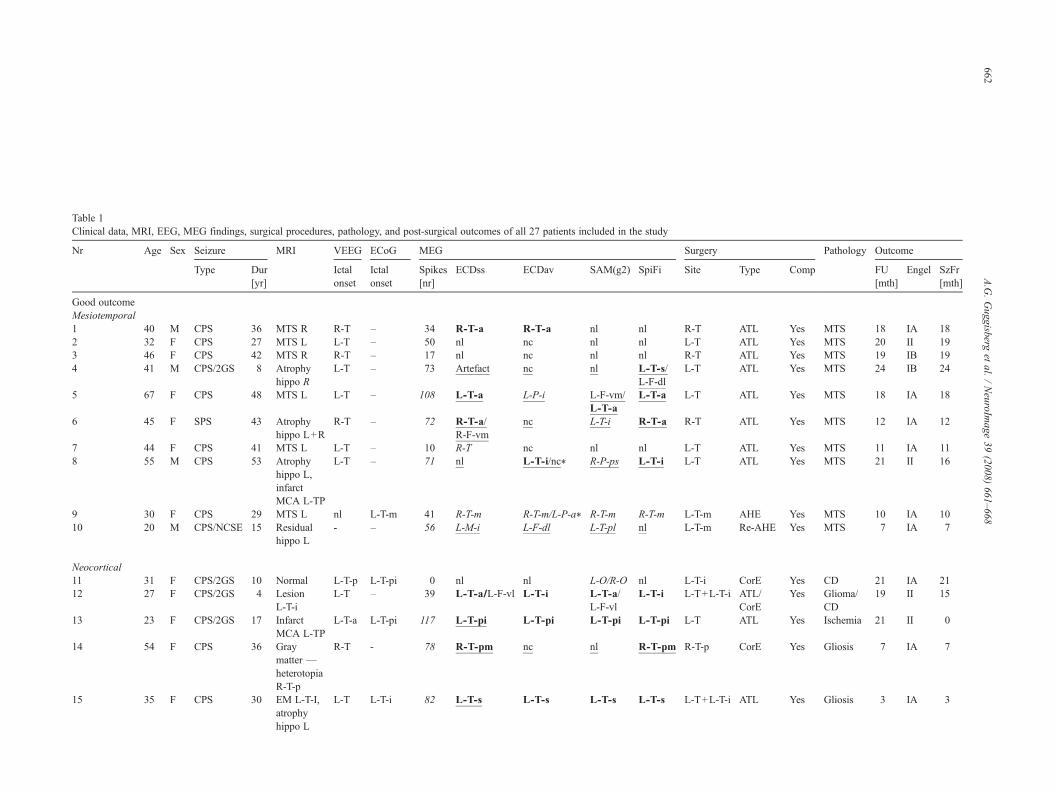
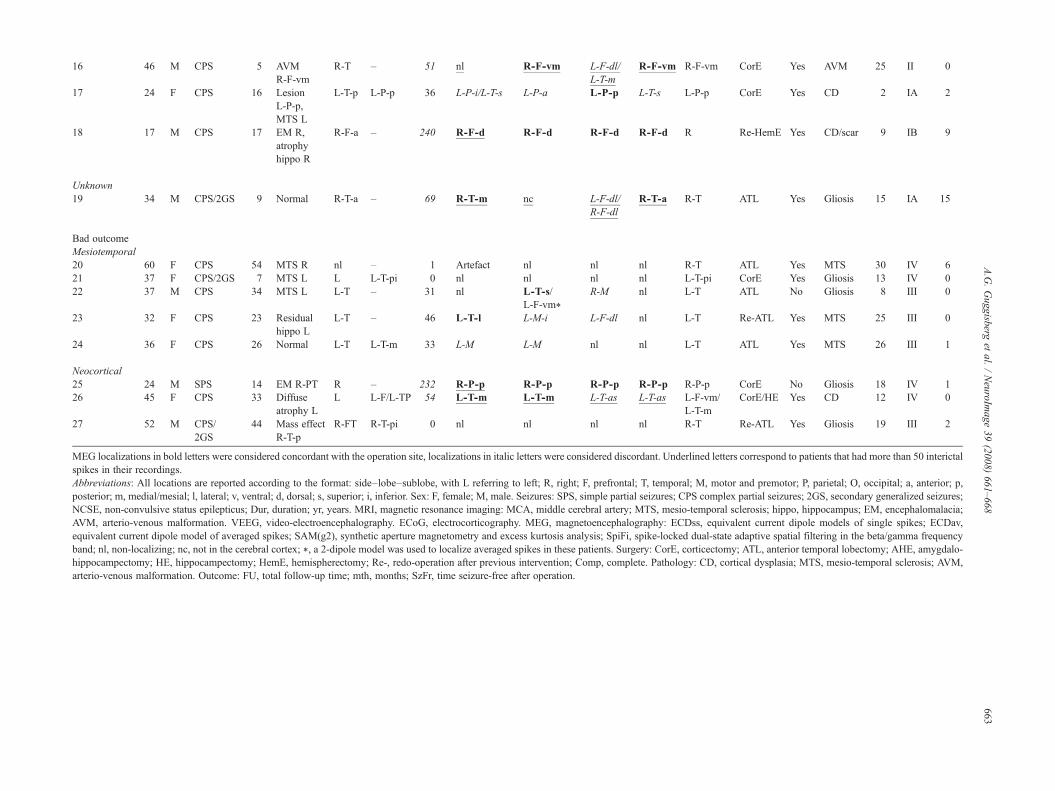
Table 1Clinical data, MRI, EEG, MEG findings, surgical procedures, pathology, and post-surgical outcomes of all 27 patients included in the study
Nr Age Sex Seizure MRI VEEG ECoG MEG Surgery Pathology Outcome
Type Dur[yr]
Ictalonset
Ictalonset
Spikes[nr]
ECDss ECDav SAM(g2) SpiFi Site Type Comp FU[mth]
Engel SzFr[mth]
Good outcomeMesiotemporal1 40 M CPS 36 MTS R R-T – 34 R-T-a R-T-a nl nl R-T ATL Yes MTS 18 IA 182 32 F CPS 27 MTS L L-T – 50 nl nc nl nl L-T ATL Yes MTS 20 II 193 46 F CPS 42 MTS R R-T – 17 nl nc nl nl R-T ATL Yes MTS 19 IB 194 41 M CPS/2GS 8 Atrophy
hippo RL-T – 73 Artefact nc nl L-T-s/
L-F-dlL-T ATL Yes MTS 24 IB 24
5 67 F CPS 48 MTS L L-T – 108 L-T-a L-P-i L-F-vm/L-T-a
L-T-a L-T ATL Yes MTS 18 IA 18
6 45 F SPS 43 Atrophyhippo L+R
R-T – 72 R-T-a/R-F-vm
nc L-T-i R-T-a R-T ATL Yes MTS 12 IA 12
7 44 F CPS 41 MTS L L-T – 10 R-T nc nl nl L-T ATL Yes MTS 11 IA 118 55 M CPS 53 Atrophy
hippo L,infarctMCA L-TP
L-T – 71 nl L-T-i/nc⁎ R-P-ps L-T-i L-T ATL Yes MTS 21 II 16
9 30 F CPS 29 MTS L nl L-T-m 41 R-T-m R-T-m/L-P-a⁎ R-T-m R-T-m L-T-m AHE Yes MTS 10 IA 1010 20 M CPS/NCSE 15 Residual
hippo L- – 56 L-M-i L-F-dl L-T-pl nl L-T-m Re-AHE Yes MTS 7 IA 7
Neocortical11 31 F CPS/2GS 10 Normal L-T-p L-T-pi 0 nl nl L-O/R-O nl L-T-i CorE Yes CD 21 IA 2112 27 F CPS/2GS 4 Lesion
L-T-iL-T – 39 L-T-a/L-F-vl L-T-i L-T-a/
L-F-vlL-T-i L-T+L-T-i ATL/
CorEYes Glioma/
CD19 II 15
13 23 F CPS/2GS 17 InfarctMCA L-TP
L-T-a L-T-pi 117 L-T-pi L-T-pi L-T-pi L-T-pi L-T ATL Yes Ischemia 21 II 0
14 54 F CPS 36 Graymatter —heterotopiaR-T-p
R-T - 78 R-T-pm nc nl R-T-pm R-T-p CorE Yes Gliosis 7 IA 7
15 35 F CPS 30 EM L-T-I,atrophyhippo L
L-T L-T-i 82 L-T-s L-T-s L-T-s L-T-s L-T+L-T-i ATL Yes Gliosis 3 IA 3
662A.G.Guggisberg
etal.
/NeuroIm
age39
(2008)661–668
16 46 M CPS 5 AVMR-F-vm
R-T – 51 nl R-F-vm L-F-dl/L-T-m
R-F-vm R-F-vm CorE Yes AVM 25 II 0
17 24 F CPS 16 LesionL-P-p,MTS L
L-T-p L-P-p 36 L-P-i/L-T-s L-P-a L-P-p L-T-s L-P-p CorE Yes CD 2 IA 2
18 17 M CPS 17 EM R,atrophyhippo R
R-F-a – 240 R-F-d R-F-d R-F-d R-F-d R Re-HemE Yes CD/scar 9 IB 9
Unknown19 34 M CPS/2GS 9 Normal R-T-a – 69 R-T-m nc L-F-dl/
R-F-dlR-T-a R-T ATL Yes Gliosis 15 IA 15
Bad outcomeMesiotemporal20 60 F CPS 54 MTS R nl – 1 Artefact nl nl nl R-T ATL Yes MTS 30 IV 621 37 F CPS/2GS 7 MTS L L L-T-pi 0 nl nl nl nl L-T-pi CorE Yes Gliosis 13 IV 022 37 M CPS 34 MTS L L-T – 31 nl L-T-s/
L-F-vm⁎R-M nl L-T ATL No Gliosis 8 III 0
23 32 F CPS 23 Residualhippo L
L-T – 46 L-T-l L-M-i L-F-dl nl L-T Re-ATL Yes MTS 25 III 0
24 36 F CPS 26 Normal L-T L-T-m 33 L-M L-M nl nl L-T ATL Yes MTS 26 III 1
Neocortical25 24 M SPS 14 EM R-PT R – 232 R-P-p R-P-p R-P-p R-P-p R-P-p CorE No Gliosis 18 IV 126 45 F CPS 33 Diffuse
atrophy LL L-F/L-TP 54 L-T-m L-T-m L-T-as L-T-as L-F-vm/
L-T-mCorE/HE Yes CD 12 IV 0
27 52 M CPS/2GS
44 Mass effectR-T-p
R-FT R-T-pi 0 nl nl nl nl R-T Re-ATL Yes Gliosis 19 III 2
MEG localizations in bold letters were considered concordant with the operation site, localizations in italic letters were considered discordant. Underlined letters correspond to patients that had more than 50 interictalspikes in their recordings.Abbreviations: All locations are reported according to the format: side–lobe–sublobe, with L referring to left; R, right; F, prefrontal; T, temporal; M, motor and premotor; P, parietal; O, occipital; a, anterior; p,posterior; m, medial/mesial; l, lateral; v, ventral; d, dorsal; s, superior; i, inferior. Sex: F, female; M, male. Seizures: SPS, simple partial seizures; CPS complex partial seizures; 2GS, secondary generalized seizures;NCSE, non-convulsive status epilepticus; Dur, duration; yr, years. MRI, magnetic resonance imaging: MCA, middle cerebral artery; MTS, mesio-temporal sclerosis; hippo, hippocampus; EM, encephalomalacia;AVM, arterio-venous malformation. VEEG, video-electroencephalography. ECoG, electrocorticography. MEG, magnetoencephalography: ECDss, equivalent current dipole models of single spikes; ECDav,equivalent current dipole model of averaged spikes; SAM(g2), synthetic aperture magnetometry and excess kurtosis analysis; SpiFi, spike-locked dual-state adaptive spatial filtering in the beta/gamma frequencyband; nl, non-localizing; nc, not in the cerebral cortex; ⁎, a 2-dipole model was used to localize averaged spikes in these patients. Surgery: CorE, corticectomy; ATL, anterior temporal lobectomy; AHE, amygdalo-hippocampectomy; HE, hippocampectomy; HemE, hemispherectomy; Re-, redo-operation after previous intervention; Comp, complete. Pathology: CD, cortical dysplasia; MTS, mesio-temporal sclerosis; AVM,arterio-venous malformation. Outcome: FU, total follow-up time; mth, months; SzFr, time seizure-free after operation.
663A.G.Guggisberg
etal.
/NeuroIm
age39
(2008)661–668
664 A.G. Guggisberg et al. / NeuroImage 39 (2008) 661–668
(SAM) indeed make it possible to reconstruct the sources of thespectral content of the electromagnetic brain activity (Van Veenet al., 1997; Vrba and Robinson, 2001; Sekihara et al., 2001, 2004,2005). However, high-frequency MEG activity is obviously notcomposed of epileptic spikes only, but also contains intrinsic,physiologic brain activity as well as noise. A reliable algorithm forlocalizing epileptic tissue therefore has to accomplish the task ofseparating these components. One solution that was previouslyproposed is based on the assumption that spikes have a greaterkurtosis than physiologic activity (Robinson et al., 2004). SAM(g2) therefore combines spatial filtering of beta and gamma activitywith a measure of excess kurtosis of the MEG signal and allows theautomatic creation of 3-dimensional images estimating the originof spikes in the brain. Several studies (Robinson et al., 2004; Ukaiet al., 2004; Kirsch et al., 2006) have demonstrated the usefulnessof this method when there is a single spike focus and a good signal-to-noise ratio. However, as ECD, this method requires manualverification of all obtained localizations, which again is time-consuming and susceptible to subjective criteria.
Here, we propose a different approach that requires manualintervention at an early analysis stage but then provides fullyautomated localization of epileptogenic tissue: in a first step,interictal epileptic spikes are manually marked in the MEGrecordings, and then the sources of spike-locked power changes inthe beta and gamma bands are localized using an adaptive spatialfiltering method. This study demonstrates the validity of thisalgorithm in a population of 27 consecutive patients with partialepilepsies and compares it with the validity of established MEGbased localizations of epileptogenic tissue. As gold standard fordetermining the correct location of the epileptogenic zone, we usethe location of surgically resected tissue in patients that have asignificant reduction in seizures after surgery.
Materials and methods
Patients
All 27 patients with medically refractory partial epilepsy whowere admitted to the Biomagnetic Imaging Laboratory formagnetic source imaging (MSI) between June 2004 and August2006 and who met the following inclusion criteria wereretrospectively included in the study: they had epilepsy surgeryat the Department of Neurological Surgery, UCSF, after MEG,and they had follow-up at the Department of Neurology, UCSF,for at least 2 months after surgery. All participants gave theirwritten informed consent to participate in the experiments, allprocedures were approved by the UCSF committee on humanresearch, and all experiments were conducted according to theDeclaration of Helsinki.
Structural images
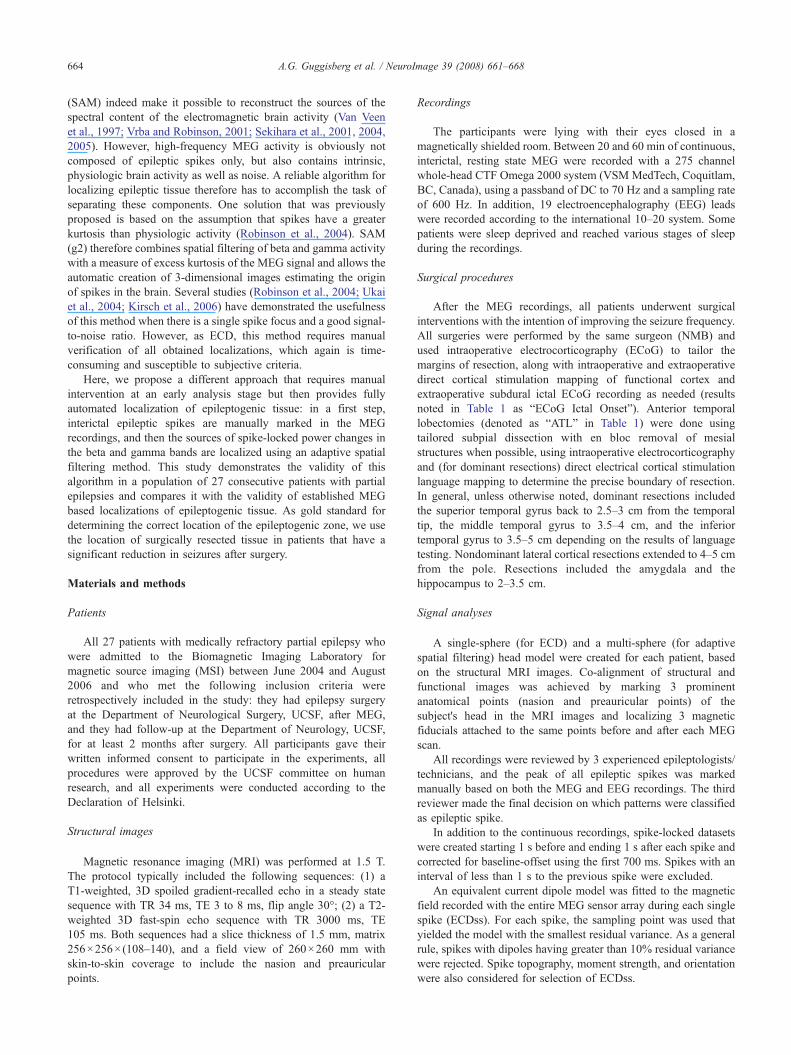
Magnetic resonance imaging (MRI) was performed at 1.5 T.The protocol typically included the following sequences: (1) aT1-weighted, 3D spoiled gradient-recalled echo in a steady statesequence with TR 34 ms, TE 3 to 8 ms, flip angle 30°; (2) a T2-weighted 3D fast-spin echo sequence with TR 3000 ms, TE105 ms. Both sequences had a slice thickness of 1.5 mm, matrix256×256×(108–140), and a field view of 260×260 mm withskin-to-skin coverage to include the nasion and preauricularpoints.
Recordings
The participants were lying with their eyes closed in amagnetically shielded room. Between 20 and 60 min of continuous,interictal, resting state MEG were recorded with a 275 channelwhole-head CTF Omega 2000 system (VSM MedTech, Coquitlam,BC, Canada), using a passband of DC to 70 Hz and a sampling rateof 600 Hz. In addition, 19 electroencephalography (EEG) leadswere recorded according to the international 10–20 system. Somepatients were sleep deprived and reached various stages of sleepduring the recordings.
Surgical procedures
After the MEG recordings, all patients underwent surgicalinterventions with the intention of improving the seizure frequency.All surgeries were performed by the same surgeon (NMB) andused intraoperative electrocorticography (ECoG) to tailor themargins of resection, along with intraoperative and extraoperativedirect cortical stimulation mapping of functional cortex andextraoperative subdural ictal ECoG recording as needed (resultsnoted in Table 1 as “ECoG Ictal Onset”). Anterior temporallobectomies (denoted as “ATL” in Table 1) were done usingtailored subpial dissection with en bloc removal of mesialstructures when possible, using intraoperative electrocorticographyand (for dominant resections) direct electrical cortical stimulationlanguage mapping to determine the precise boundary of resection.In general, unless otherwise noted, dominant resections includedthe superior temporal gyrus back to 2.5–3 cm from the temporaltip, the middle temporal gyrus to 3.5–4 cm, and the inferiortemporal gyrus to 3.5–5 cm depending on the results of languagetesting. Nondominant lateral cortical resections extended to 4–5 cmfrom the pole. Resections included the amygdala and thehippocampus to 2–3.5 cm.
Signal analyses
A single-sphere (for ECD) and a multi-sphere (for adaptivespatial filtering) head model were created for each patient, basedon the structural MRI images. Co-alignment of structural andfunctional images was achieved by marking 3 prominentanatomical points (nasion and preauricular points) of thesubject's head in the MRI images and localizing 3 magneticfiducials attached to the same points before and after each MEGscan.
All recordings were reviewed by 3 experienced epileptologists/technicians, and the peak of all epileptic spikes was markedmanually based on both the MEG and EEG recordings. The thirdreviewer made the final decision on which patterns were classifiedas epileptic spike.
In addition to the continuous recordings, spike-locked datasetswere created starting 1 s before and ending 1 s after each spike andcorrected for baseline-offset using the first 700 ms. Spikes with aninterval of less than 1 s to the previous spike were excluded.
An equivalent current dipole model was fitted to the magneticfield recorded with the entire MEG sensor array during each singlespike (ECDss). For each spike, the sampling point was used thatyielded the model with the smallest residual variance. As a generalrule, spikes with dipoles having greater than 10% residual variancewere rejected. Spike topography, moment strength, and orientationwere also considered for selection of ECDss.
665A.G. Guggisberg et al. / NeuroImage 39 (2008) 661–668
In addition, an ECD was also calculated for the average of allspikes (ECDav) using the averaged, baseline-corrected, spike-locked datasets. A 1-dipole model was used for most patients, butthe magnetic field map of 3 patients suggested the presence of 2distinctive dipoles, and a 2-dipole model was used in these cases(patients 8, 9, and 22).
For analysis of SAM(g2), the 2-minute MEG segments thatshowed the greatest amount of interictal epileptiform dischargesand no muscle artefacts were selected and subjected to estimationof excess kurtosis and band power between 20 and 70 Hz at each5×5×5 mm volume element in the brain (Kirsch et al., 2006;Robinson et al., 2004). The data reported here include all peaks ofthese SAM(g2) images without manual revision of locations in thesource waveforms.
For the method proposed here (spike-locked adaptive spatialfilter, SpiFi), we first assessed the time course and frequencypattern of spike-induced MEG changes by calculating a time–frequency transform for a subset of 19 equally spaced MEGsensors that were closest to the electrode positions in theinternational 10–20 system and thus covered the entire scalp.Overlapping time windows of 200 ms length were Hanning-windowed and Fourier-transformed, sliding the time window in25 ms steps (short-time Fourier transform). The resulting powerspectra of each time step were averaged over spike epochs and log-transformed. Power changes at each time–frequency point wereobtained by subtracting the mean baseline log-power spectrumfrom each spectral estimate (Zygierewicz et al., 2005). A dual-stateadaptive spatial filter (Van Veen et al., 1997; Vrba and Robinson,2001; Sekihara et al., 2001, 2004, 2005) was then used to calculatesource power changes in the beta and gamma frequency bands(∼12–55 Hz) during the interictal spikes from the recordings of allMEG sensors. Based on the results of the time–frequencytransforms, an active time window of 100 ms before to 100 msafter the spike peak and a baseline time window of 700 ms to500 ms before the spike peak were selected for all subjects. Theselection of the limits of the frequency band included foradaptive spatial filtering was found to be not critical: in all oursubjects, a broad generic band of 12 to 55 Hz essentially yieldedthe same activation patterns as more narrow bands that wereindividually determined within the beta/gamma range based ontime–frequency transforms. We report here the activations inthe individually determined frequency bands since they oftenshowed greater power changes than activations in the genericband.
All source localizations were done with the dipole fit andadaptive spatial filtering software provided by VSM MedTech(Coquitlam, BC, Canada), as well as custom in-house programs(Dalal et al., 2004).
Performance validation and statistical analyses
The surgical outcome was clinically assessed and classifiedaccording to the Engel criteria (Engel and Rasmussen, 1993). Forthe purpose of this study, the Engel classes I and II wereinterpreted as good outcome (G) and the Engel classes III and IVas bad outcome (B). The results of all MEG studies were classifiedinto one of the following 3 groups: MEG localization concordantwith surgical resection site, i.e. within 2 cm of the limits of theresection area (c), MEG localization discordant with surgicalresection (d), or MEG non-localizing (n). The non-localizinggroup included all of the following cases: technical failure due to
artefacts, no area localized due to insufficient spikes, diffuse ormulti-focal (N2) localizations, localizations outside the brain, orlocalizations in the basal ganglia/cerebellum. If an MEG studyshowed 2 different foci, it was classified as concordant (c) if atleast one of them was within 2 cm of the resection area. Thelocation of surgical resection could be inspected in post-surgicalMRIs or CTs in 13 patients and was estimated from the detaileddescriptions in the operation reports for the remaining patients.The data of the 25 patients with complete resections were used tocalculate:
– the sensitivity of each MEG analysis technique as: # of Gc /# of(Gc+Gn+Gd);
– the accuracy as: # of Gc /# of (Gc+Gd);– the positive predictive value as: # of Gc /# of (Gc+Bc).
Two patients with incomplete surgical resection (see Table 1)were excluded from this analysis. The analysis techniques weretested for an association with the site and outcome of the epilepsysurgery by subjecting the corresponding contingency tables toFisher–Freeman–Halton tests.
Results
Table 1 gives an overview of the clinical profiles, surgicalprocedures, and MEG localizations of all patients. The includedpatients had a mean age of 38 years (range 17–67), 17 werewomen. They suffered from seizures of various types and due todifferent focal pathologies for a mean duration of 27 years (4–54).After epileptic surgery, patients were followed up for an average of16 months (2–30). Nineteen patients (70.4%) had a good post-surgical outcome as defined by Engel class I (seizure freedom) or II(N85% reduction in seizure frequency).
Interictal epileptic spikes were associated with a short lasting,transient power increase in a relatively broad frequency bandranging from delta to beta and sometimes gamma rhythms(Figs. 1A and C). The beta rhythms started to increase earlierthan low-frequency rhythms, which is in agreement with the shapeof spikes and their subsequent slow waves. In addition, high-frequency power changes were typically more focal than low-frequency changes (see Figs. 1A and C).
Fig. 1 shows the sources of spike-locked beta/gamma activityof 2 typical patients and demonstrates that they were generally inagreement with the locations of spike ECD (Fig. 1B) and with thesurgical resection site (Figs. 1B and D).
Fig. 2 shows that, overall, the method proposed here had asuperior sensitivity, accuracy, and positive predictive value thanECD models and uncorrected SAM(g2): the sensitivity for ECDss,ECDav, uncorrected SAM(g2), and SpiFi was 47%, 37%, 32%,and 58%, respectively; the accuracy 69%, 64%, 40%, and 85%; thepositive predictive value 82%, 88%, 100%, and 100%. In patientswith more than 50 spikes, i.e., where sufficient data for calculationof the adaptive spatial filter weighting matrix were available, thesensitivity, accuracy, and positive predictive value of SpiFi was90.9%, 100%, and 100%, respectively, which is also superior to thevalues of all traditional methods. In patients with rare spikes, i.e.with insufficient data for the spatial filter, the proposed approachshowed the expected poor performance, but all traditional methodshad only marginally better results. Fig. 2 also shows that SpiFioutperformed traditional spike localization methods in patients
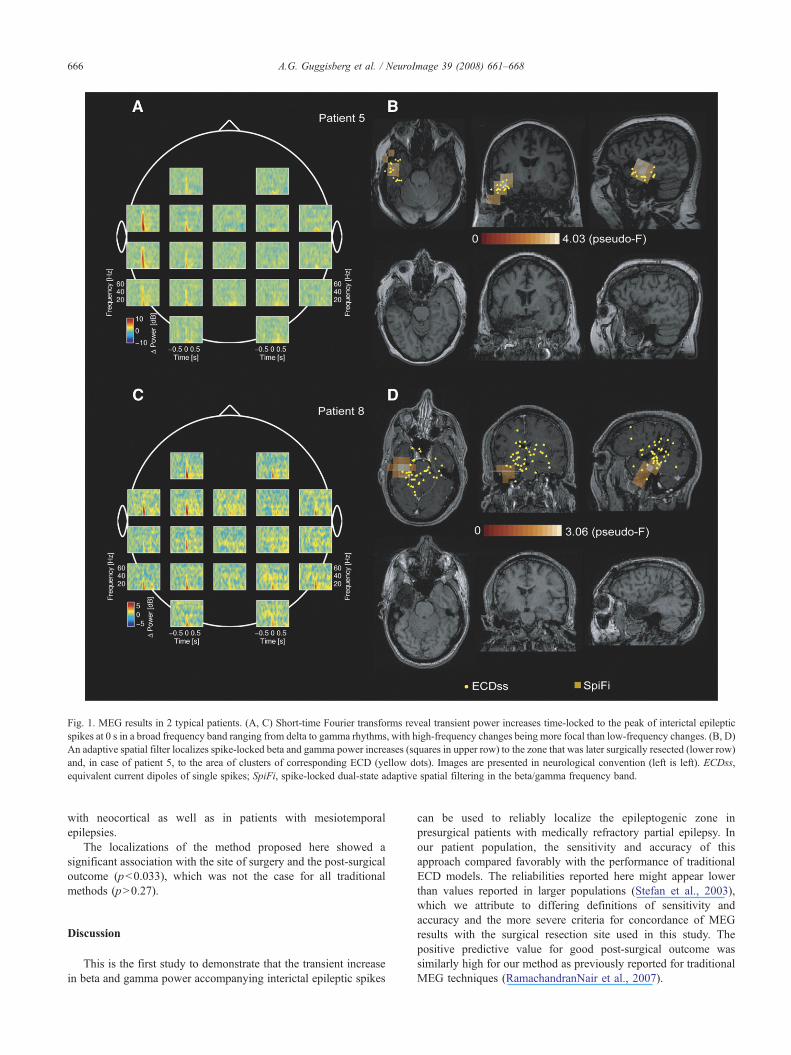
Fig. 1. MEG results in 2 typical patients. (A, C) Short-time Fourier transforms reveal transient power increases time-locked to the peak of interictal epilepticspikes at 0 s in a broad frequency band ranging from delta to gamma rhythms, with high-frequency changes being more focal than low-frequency changes. (B, D)An adaptive spatial filter localizes spike-locked beta and gamma power increases (squares in upper row) to the zone that was later surgically resected (lower row)and, in case of patient 5, to the area of clusters of corresponding ECD (yellow dots). Images are presented in neurological convention (left is left). ECDss,equivalent current dipoles of single spikes; SpiFi, spike-locked dual-state adaptive spatial filtering in the beta/gamma frequency band.
666 A.G. Guggisberg et al. / NeuroImage 39 (2008) 661–668
with neocortical as well as in patients with mesiotemporalepilepsies.
The localizations of the method proposed here showed asignificant association with the site of surgery and the post-surgicaloutcome (pb0.033), which was not the case for all traditionalmethods (pN0.27).
Discussion
This is the first study to demonstrate that the transient increasein beta and gamma power accompanying interictal epileptic spikes
can be used to reliably localize the epileptogenic zone inpresurgical patients with medically refractory partial epilepsy. Inour patient population, the sensitivity and accuracy of thisapproach compared favorably with the performance of traditionalECD models. The reliabilities reported here might appear lowerthan values reported in larger populations (Stefan et al., 2003),which we attribute to differing definitions of sensitivity andaccuracy and the more severe criteria for concordance of MEGresults with the surgical resection site used in this study. Thepositive predictive value for good post-surgical outcome wassimilarly high for our method as previously reported for traditionalMEG techniques (RamachandranNair et al., 2007).
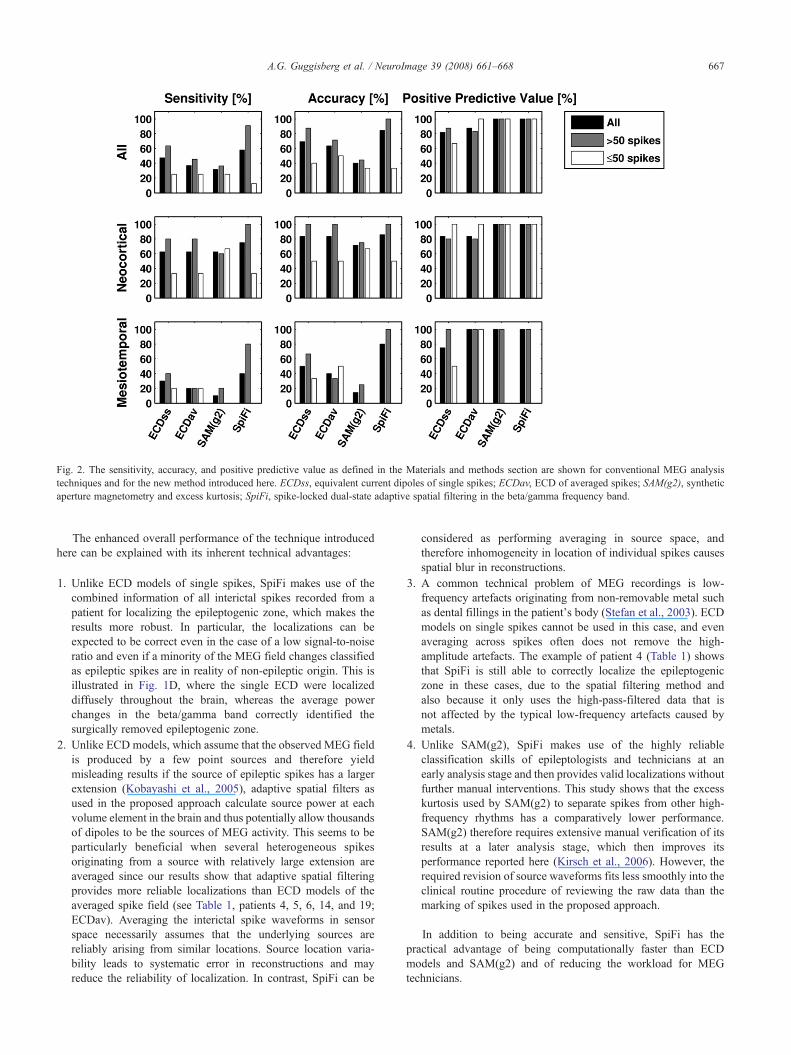
Fig. 2. The sensitivity, accuracy, and positive predictive value as defined in the Materials and methods section are shown for conventional MEG analysistechniques and for the new method introduced here. ECDss, equivalent current dipoles of single spikes; ECDav, ECD of averaged spikes; SAM(g2), syntheticaperture magnetometry and excess kurtosis; SpiFi, spike-locked dual-state adaptive spatial filtering in the beta/gamma frequency band.
667A.G. Guggisberg et al. / NeuroImage 39 (2008) 661–668
The enhanced overall performance of the technique introducedhere can be explained with its inherent technical advantages:
1. Unlike ECD models of single spikes, SpiFi makes use of thecombined information of all interictal spikes recorded from apatient for localizing the epileptogenic zone, which makes theresults more robust. In particular, the localizations can beexpected to be correct even in the case of a low signal-to-noiseratio and even if a minority of the MEG field changes classifiedas epileptic spikes are in reality of non-epileptic origin. This isillustrated in Fig. 1D, where the single ECD were localizeddiffusely throughout the brain, whereas the average powerchanges in the beta/gamma band correctly identified thesurgically removed epileptogenic zone.
2. Unlike ECD models, which assume that the observed MEG fieldis produced by a few point sources and therefore yieldmisleading results if the source of epileptic spikes has a largerextension (Kobayashi et al., 2005), adaptive spatial filters asused in the proposed approach calculate source power at eachvolume element in the brain and thus potentially allow thousandsof dipoles to be the sources of MEG activity. This seems to beparticularly beneficial when several heterogeneous spikesoriginating from a source with relatively large extension areaveraged since our results show that adaptive spatial filteringprovides more reliable localizations than ECD models of theaveraged spike field (see Table 1, patients 4, 5, 6, 14, and 19;ECDav). Averaging the interictal spike waveforms in sensorspace necessarily assumes that the underlying sources arereliably arising from similar locations. Source location varia-bility leads to systematic error in reconstructions and mayreduce the reliability of localization. In contrast, SpiFi can be
considered as performing averaging in source space, andtherefore inhomogeneity in location of individual spikes causesspatial blur in reconstructions.
3. A common technical problem of MEG recordings is low-frequency artefacts originating from non-removable metal suchas dental fillings in the patient's body (Stefan et al., 2003). ECDmodels on single spikes cannot be used in this case, and evenaveraging across spikes often does not remove the high-amplitude artefacts. The example of patient 4 (Table 1) showsthat SpiFi is still able to correctly localize the epileptogeniczone in these cases, due to the spatial filtering method andalso because it only uses the high-pass-filtered data that isnot affected by the typical low-frequency artefacts caused bymetals.
4. Unlike SAM(g2), SpiFi makes use of the highly reliableclassification skills of epileptologists and technicians at anearly analysis stage and then provides valid localizations withoutfurther manual interventions. This study shows that the excesskurtosis used by SAM(g2) to separate spikes from other high-frequency rhythms has a comparatively lower performance.SAM(g2) therefore requires extensive manual verification of itsresults at a later analysis stage, which then improves itsperformance reported here (Kirsch et al., 2006). However, therequired revision of source waveforms fits less smoothly into theclinical routine procedure of reviewing the raw data than themarking of spikes used in the proposed approach.
In addition to being accurate and sensitive, SpiFi has thepractical advantage of being computationally faster than ECDmodels and SAM(g2) and of reducing the workload for MEGtechnicians.
668 A.G. Guggisberg et al. / NeuroImage 39 (2008) 661–668
On the other hand, the method introduced here has thedisadvantage that the adaptive spatial filter used for sourcereconstruction requires a sufficient amount of recording time fora valid estimation of the sensor covariance and therefore of thesensor weighting matrix (Van Veen et al., 1997). With the settingsused in this study, at least 50 to 60 spikes were necessary forreliable localizations. In patients with rare interictal events, themethod performed poorly and worse than conventional methods(Fig. 2).
We may thus conclude that source reconstruction of spike-locked beta and high-gamma activity with adaptive spatial filters isa reliable and fast alternative for localizing the epileptogenic zonein patients with partial epilepsy who have a sufficient amount ofinterictal spikes in their recordings.
Acknowledgments
SSN was supported by NIH grants R01DC4855 andR01DC6435.
References
Dalal, S.S., Zumer, J.M., Agrawal, V., Hild, K.E., Sekihara, K., Nagarajan,S.S., 2004. NUTMEG: a neuromagnetic source reconstruction toolbox.Neurol. Clin. Neurophysiol. 52.
Engel Jr., J., Rasmussen, T.B., 1993. Outcome with respect to epilepticseizures, Surgical Treatment of the Epilepsies, 2nd ed. Raven Press, NewYork, pp. 609–621.
IFSECN, 1974. A glossary of terms most commonly used by clinicalelectroencephalographers. Electroencephalogr. Clin. Neurophysiol. 37,538–548.
Kirsch, H.E., Robinson, S.E., Mantle, M., Nagarajan, S., 2006. Automatedlocalization of magnetoencephalographic interictal spikes by adaptivespatial filtering. Clin. Neurophysiol. 117, 2264–2271.
Knowlton, R.C., Elgavish, R., Howell, J., Blount, J., Burneo, J.G.,Faught, E., Kankirawatana, P., Riley, K., Morawetz, R., Worthington, J.,Kuzniecky, R.I., 2006. Magnetic source imaging versus intracranialelectroencephalogram in epilepsy surgery: a prospective study. Ann.Neurol. 59, 835–842.
Kobayashi, K.,Yoshinaga, H.,Ohtsuka, Y.,Gotman, J., 2005.Dipolemodelingof epileptic spikes can be accurate or misleading. Epilepsia 46, 397–408.
Papanicolaou, A.C., Pataraia, E., Billingsley-Marshall, R., Castillo, E.M.,Wheless, J.W., Swank, P., Breier, J.I., Sarkari, S., Simos, P.G., 2005.Toward the substitution of invasive electroencephalography in epilepsysurgery. J. Clin. Neurophysiol. 22, 231–237.
Pataraia, E., Simos, P.G., Castillo, E.M., Billingsley, R.L., Sarkari, S.,Wheless, J.W., Maggio, V., Maggio, W., Baumgartner, J.E., Swank, P.R.,Breier, J.I., Papanicolaou, A.C., 2004. Does magnetoencephalographyadd to scalp video-EEG as a diagnostic tool in epilepsy surgery?Neurology 62, 943–948.
RamachandranNair, R., Otsubo, H., Shroff, M.M., Ochi, A., Weiss, S.K.,Rutka, J.T., Snead III, O.C., 2007. MEG predicts outcome followingsurgery for intractable epilepsy in children with normal or nonfocal MRIfindings. Epilepsia 48, 149–157.
Robinson, S.E., Nagarajan, S.S., Mantle, M., Gibbons, V., Kirsch, H., 2004.Localization of interictal spikes using SAM(g2) and dipole fit. Neurol.Clin. Neurophysiol. 74.
Sekihara, K., Nagarajan, S.S., Poeppel, D., Marantz, A., Miyashita, Y., 2001.Reconstructing spatio-temporal activities of neural sources using anMEG vector beamformer technique. IEEE Trans. Biomed. Eng. 48,760–771.
Sekihara, K., Nagarajan, S.S., Poeppel, D., Marantz, A., 2004. Performanceof an MEG adaptive-beamformer source reconstruction technique in thepresence of additive low-rank interference. IEEE Trans. Biomed. Eng.51, 90–99.
Sekihara, K., Sahani, M., Nagarajan, S.S., 2005. Localization bias andspatial resolution of adaptive and non-adaptive spatial filters for MEGsource reconstruction. NeuroImage 25, 1056–1067.
Stefan, H., Hummel, C., Scheler, G., Genow, A., Druschky, K., Tilz, C.,Kaltenhauser, M., Hopfengartner, R., Buchfelder, M., Romstock, J.,2003. Magnetic brain source imaging of focal epileptic activity: asynopsis of 455 cases. Brain 126, 2396–2405.
Ukai, S., Kawaguchi, S., Ishii, R., Yamamoto, M., Ogawa, A., Mizuno-Matsumoto, Y., Robinson, S.E., Fujita, N., Yoshimine, T., Shinosaki, K.,Takeda, M., 2004. SAM(g2) analysis for detecting spike localization: acomparison with clinical symptoms and ECD analysis in an epilepticpatient. Neurol. Clin. Neurophysiol. 57.
Van Veen, B.D., van, D.W., Yuchtman, M., Suzuki, A., 1997. Localization ofbrain electrical activity via linearly constrained minimum variancespatial filtering. IEEE Trans. Biomed. Eng. 44, 867–880.
Vrba, J., Robinson, S.E., 2001. Signal processing in magnetoencephalo-graphy. Methods 25, 249–271.
Wheless, J.W., Castillo, E., Maggio, V., Kim, H.L., Breier, J.I., Simos, P.G.,Papanicolaou, A.C., 2004. Magnetoencephalography (MEG) andmagnetic source imaging (MSI). Neurologist 10, 138–153.
Wu, J.Y., Sutherling, W.W., Koh, S., Salamon, N., Jonas, R., Yudovin, S.,Sankar, R., Shields, W.D., Mathern, G.W., 2006. Magnetic sourceimaging localizes epileptogenic zone in children with tuberous sclerosiscomplex. Neurology 66, 1270–1272.
Zygierewicz, J., Durka, P.J., Klekowicz, H., Franaszczuk, P.J., Crone, N.E.,2005. Computationally efficient approaches to calculating significantERD/ERS changes in the time–frequency plane. J. Neurosci. Methods145, 267–276.