mapping interictal oscillations greater than 200 hz recorded with intracranial macroelectrodes in...
TRANSCRIPT

BRAINA JOURNAL OF NEUROLOGY
Mapping interictal oscillations greater than 200 Hzrecorded with intracranial macroelectrodes inhuman epilepsyBenoıt Crepon,1,2,3,4 Vincent Navarro,1,2,3,4 Dominique Hasboun,1,2,3,4
Stephane Clemenceau,1,2,3,5 Jacques Martinerie,1,2,3 Michel Baulac,1,2,3,4 Claude Adam1,2,3,4
and Michel Le Van Quyen1,2,3
1 Centre de Recherche de l’Institut du Cerveau et de la Moelle Epiniere, INSERM UMRS 975, Paris, France
2 Universite Pierre et Marie Curie - Paris 6, Paris, France
3 CNRS UMR 7225, Paris, France
4 Epilepsy Unit, Groupe Hospitalier Pitie-Salpetriere Assistance Publique – Hopitaux de Paris, France
5 Neurosurgery Department, Groupe Hospitalier Pitie-Salpetriere, Assistance Publique – Hopitaux de Paris, France
Correspondence to: Michel le Van Quyen,
Centre de Recherche de l’Institut du Cerveau et de la Moelle Epiniere,
INSERM UMRS 975,
47 Bd de l’Hopital,
75651 Paris Cedex 13, France
E-mail: [email protected]
Interictal high-frequency oscillations over 200 Hz have been recorded with microelectrodes in the seizure onset zone of epileptic
patients suffering from mesial temporal lobe epilepsy. Recent work suggests that similar high-frequency oscillations can be
detected in the seizure onset zone using standard diagnostic macroelectrodes. However, only a few channels were examined in
these studies, so little information is available on the spatial extent of high-frequency oscillations. Here, we present data on
high-frequency oscillations recorded from a larger number of intracerebral contacts spatial (mean 38) in 16 patients. Data were
obtained from 1 h of interictal recording sampled at 1024 Hz and was analysed using a new semi-automatic detection procedure
based on a wavelet decomposition. A detailed frequency analysis permitted a rapid and reliable discrimination of high-frequency
oscillations from other high-frequency events. A total of 1932 high-frequency oscillations were detected with an average
frequency of 261� 53 Hz, amplitude of 11.9� 6.7 kV and duration of 22.7� 11.6 ms. Records from a patient often showed
several different high-frequency oscillation patterns. We classified 24 patterns from 11 patients. Usually (20/24 patterns) high-
frequency oscillations were nested in an epileptic paroxysm, such as a spike or a sharp wave, and typically high-frequency
oscillations (19/24) were recorded from just one recording contact. Unexpectedly in other cases, high-frequency oscillations
(5/24) were detected simultaneously on two or three contacts, sometimes separated by large distances. This large spatial extent
suggests that high-frequency oscillations may sometimes result from a neuronal synchrony manifest on a scale of centimetres.
High-frequency oscillations were almost always recorded in seizure-generating structures of patients suffering from mesial (9/9)
or polar (1/3) temporal lobe epilepsy. They were never found in the epileptic or healthy basal, lateral temporal or extra temporal
neocortex nor in the healthy amygdalo–hippocampal complex. These findings confirm that the generation of oscillations at
frequencies higher that 200 Hz is, at this scale, a specific, intrinsic property of seizure-generating networks in medial and polar
temporal lobes, which have a common archaic phylogenetic origin. We show that this activity can be detected and its spatial
extent determined with conventional intracranial electroencephalography electrodes in records from patients with temporal lobe
epilepsy. It is a reliable marker of the seizure onset zone that should be considered in decisions on surgical treatment.
doi:10.1093/brain/awp277 Brain 2010: 133; 33–45 | 33
Received May 12, 2009. Revised September 7, 2009. Accepted September 11, 2009. Advance Access publication November 17, 2009
� The Author (2009). Published by Oxford University Press on behalf of the Guarantors of Brain. All rights reserved.
For Permissions, please email: [email protected]
by guest on May 27, 2016
http://brain.oxfordjournals.org/D
ownloaded from

Keywords: high-frequency oscillations; mesial temporal lobe epilepsy; intracranial EEG; fast ripple; seizure onset zone
Abbreviations: EEG = Electroencephalography; FR = fast ripple; HFOs = high-frequency oscillations; HS = hippocampal sclerosis;MTL = mesial temporal lobe; SOZ = seizure onset zone; TF = time frequency; TP = temporal pole
IntroductionPresurgical evaluation of epilepsy patients aims to define the
seizure onset zone (Engel, 1996). Long-term video EEG recording
is a necessary procedure for the precise localization of this area in
refractory partial epilepsies (Wyllie, 1997; Engel and Pedley,
1998). Among investigation methods for this evaluation, intracra-
nial EEG remains the only way to record electrophysiological
activity directly from brain structures and to formulate hypotheses
about how they may be involved in epileptic processes (Talairach
et al., 1974). In this context, a large number of studies have been
dedicated to the analysis of the earliest EEG changes associated
with seizures (Spencer et al., 1992). Nevertheless, interpretation of
invasive ictal recordings requires that several stereotyped clinical
seizures be recorded and this can prolong the time needed to
several weeks. This time could be reduced if specific information
permits reliable localization of the seizure onset zone from
interictal markers.
Knowledge on the properties of electrophysiological signals
generated by the seizure onset zone between seizures remains
elusive. Brain structures involved in the seizure onset zone usually
produce transient interictal spikes. However, interictal epileptic
activities recorded with intracranial EEG are numerous and vari-
able, often arising from multiple sites which are seldom discretely
localized to the region of seizure onset (Alarcon et al., 1997).
More recently, it has been suggested that interictal high-frequency
oscillations (HFOs) may have a diagnostic value. In particular, fast
and abnormal HFOs with frequencies in the range 180–500 Hz
(fast ripples) have been recorded during interictal periods with
microelectrodes from the hippocampus and entorhinal cortex of
patients with mesial temporal lobe (MTL) epilepsy (Bragin et al.,
1999, 2002b; Staba et al., 2004). Similar events are detected in
rodent models of MTL epilepsy (Bragin et al., 2002a; Dzhala and
Staley, 2004; Foffani et al., 2007). Fast ripples occur at higher
frequencies in the epileptic MTL containing atrophic hippocampi
and amygdala than in contralateral MTL. They provide a promising
diagnostic marker for epileptic areas associated with hippocampal
sclerosis and consequent synaptic reorganization (Rampp et al.,
2006). Fast ripples may not only permit the localization of epileptic
networks, but also provide insight into mechanisms of epilepto-
genesis (Khalilov et al., 2005; Le Van Quyen et al., 2006).
However, microelectrode recordings raise concerns about patient
safety and neurosurgical procedures and may provide lower qual-
ity, less stable data than can be achieved in a routine presurgical
setting. Recently, Urrestarazu et al. (2007) convincingly showed
that interictal HFOs may be detected and used to localize the
seizure onset zone in intracranial records obtained from broad-
band depth electrodes of small size (surface area 0.9 mm2).
Using hybrid depth electrodes containing microwires and
macroelectrodes, Worrell et al. (2008) confirmed that HFOs can
be recorded in the hippocampal seizure onset zone with using
standard clinical macroelectrodes (surface area 9.3 mm2). They
report that the distribution of HFO frequencies recorded with
macroelectrodes falls off more rapidly than in records made with
microwires and observed HFO 4200 Hz only rarely. Due to the
low rate of detection of HFOs using clinical macroelectrodes, the
authors could not draw reliable conclusions on the spatial extent
of HFOs in epileptic patients.
The present studies were designed to obtain data on this
point. We asked whether HFOs were limited to a single recording
site or whether they could be detected at multiple sites in a
systematic analysis of multiple intracranial EEG records
obtained during interictal periods. Our data were obtained from
16 consecutive patients undergoing presurgical evaluation
for medically refractory focal epilepsy, with MTL or neocortical
epilepsy.
Patients and methods
PatientsWe studied 16 consecutive patients (eight male, mean age: 37 years)
with intractable partial epilepsy requiring an exploration with intracra-
nial electrodes between April 2002 and July 2006 at La Pitie Salpetriere
Epilepsy Unit. All patients had a comprehensive non-invasive evalua-
tion prior to intracranial exploration, including a detailed history
and neurological examination, neuropsychological testing sometimes
including a intracarotid amobarbital test, brain MRI, functional
nuclear neuroimaging [Positron Emission Tomography (PET) and
interictal-ictal single photon emission computed tomography] and
prolonged continuous scalp video-EEG recordings (Adam et al.
1997). All patients gave their informed consent and procedures
were approved by the local ethical committee (Comite de Protection
des Personnes).
Intracranial electrodes and clinical dataRecords were made continuously in the video-EEG unit from each
patient using intra-cranial depth electrodes and, occasionally, subdural
strips (Ad-Tech Medical Instruments, Racine, WI). The insertion of
depth electrodes with a Leksell frame was based on coordinates
obtained from a trajectory simulation on a 3D brain MRI. Subdural
strips were introduced through burr holes. Brain structures to be
explored were defined from hypotheses on the seizure onset zone
localization derived from non-invasive clinical evaluations (Table 1)
(Adam et al., 1996). Depth electrodes were composed of 4–10 cylin-
drical contacts 2.3 mm long, 1 mm in diameter, 10 mm apart centre to
centre, mounted on a 1 mm wide flexible plastic probe. Subdural elec-
trodes were strips with four to eight one-sided circular contacts,
2.3 mm in diameter and with a centre to centre separation of
10 mm. The effective surface area was 7.2 mm2 for depth contacts
and 4.15 mm2 for subdural contacts. The exploration of one patient
34 | Brain 2010: 133; 33–45 B. Crepon et al.
by guest on May 27, 2016
http://brain.oxfordjournals.org/D
ownloaded from

Tab
le1
Cli
nic
al,
neu
roim
agin
g,
elec
trophys
iogic
alan
doper
ativ
edat
aof
the
16
pat
ients
Pat
ient
Gen
der
/ag
eA
ge
of
onse
t(y
ears
)
Aura
Scal
pEE
GSO
ZIn
trac
rania
lEE
G:
SOZ
Icta
lSP
ECT
(hyp
erper
fusi
on)
PET
(hyp
om
etab
oli
smM
RI
Epil
epto
gen
iczo
ne
Surg
ery
Neu
ropat
holo
gy
Surg
ical
outc
om
e
AF
49
12
Vis
cera
l,dys
mnes
icR
-T,
L-T
R-T
m(3
),L-
Tm
(1)
R-H
S+
Tpw
gd
Bi-
Tm
R-A
MTR
HS
IA(3
year
s)
BF
28
25
Vis
cera
lR
-TR
-Tm
(3),
R-T
lb(9
)R
-Tm
blp
R-T
bl
NR
-Tm
bl
R-A
MTR
aH
SII
IA(5
year
s)
CM
41
0.3
Anxi
ety
R-T
,L-
TR
-Tm
(6)
R-T
,R
-Fo
R-T
pR
-HS
R-T
mR
-AM
TR
HS
IIA
(2ye
ars)
DM
33
15
Dys
mnes
icBi-
TR
-Tm
(12)
Bi-
Tm
pR
-Tm
pL-
Tp
R-H
SR
-Tm
R-A
MTR
HS
IIA
(1ye
ars)
EF
39
8V
isce
ral
R-T
R-T
m!
Bi-
T(9
)R
-HS
+Tpw
gd
R-T
mR
-AM
TR
HS
IIB
(1ye
ars)
FM
26
16
Vis
cera
l,olfac
tory
L-FT
L-Tm!
L-Tp(7
)Bi-
Tm
L-Tm
L-H
hyp
erin
tensi
tyL-
Tm
L-A
MTR
HS
IA(1
year
s)
GM
39
12
No
(com
ple
xse
izure
stra
ighta
way
)Bi-
TL-
Tm
(8)
Bi-
Tm
Bi-
Tm
L-H
mal
rota
tion
L-Tm
L-A
MTR
HS
IA(3
year
s)
HF
43
16
Dre
amy
stat
eR
-T,
L-T
L-Tm
(4),
R-T
p(2
)L-
TI
Bi-
Tm
pBi-
HS
L-Tm
,R
-Tp
IM
41
17
Dys
mnes
ic,
auditory
hal
luci
nat
ions
R-T
R-T
m(8
)R
-Tm
bN
R-T
m
JF
33
16
Vis
cera
lR
-T,
L-T
R-T
l(10),
L-Tp(2
)L-
Tm
pN
R-T
l,L-
Tp
KM
39
7N
o(c
om
ple
xse
izure
stra
ighta
way
)R
-TR
-Tp!
R-F
o(1
9)
R-T
pI,
CR
-FT
R-
Tpw
gd
R-T
p
LF
39
11
Wel
l-bei
ng,
auditory
illusi
on
R-T
R-T
b(a
nt!
post
)(2)
R-T
mR
-Tp
NR
-Tb
R-l
arge
AM
TR
Dys
gen
esic
abnorm
ality
IIA
(3ye
ars)
MM
45
12
Ocu
loce
phal
icve
rsio
nL-
TO
,L-
TL-
Tlp
ost
(50)
L-Tm
pL-
Tm
bl
NL-
Tpost
Lpost
T3
lobec
tom
yaG
liosi
sIV
B(4
year
s)
M’
L-Tlp
ost
(52)
NF
26
10
Vis
ual
hal
luci
nat
ion,
ocu
loce
phal
icve
rsio
nL-
TPO
,L-
TL-
Ob(5
)L-
ObTb
NL-
Ob
OF
35
24
Diz
zynes
s,vi
sual
hal
luci
nat
ion
R-T
,L-
TR
-Ob(6
),R
-Tpost
(8)
R-O
dys
pla
sia
R-O
b,
R-T
post
PM
35
6Par
esth
esia
R-P
R-P
(2)
R-T
PR
-PT
dys
pla
sia
R-P
Lesi
onec
tom
yD
yspla
sia
IC(6
year
s)
Pat
ients
are
nam
edby
ale
tter
from
Ato
P.
Sex
M=
mal
e;F
=fe
mal
e.Pat
ient
Mw
astw
ice
impla
nte
dan
din
cluded
inth
est
udy.
Seiz
ure
onse
tzo
ne
(SO
Z):
seiz
ure
onse
tzo
ne
asre
cord
edw
ith
scal
pEE
Gth
enin
trac
rania
lEE
G.
Com
ma
indic
ates
multip
lese
izure
onse
tzo
nes
.!
indic
ates
firs
tpro
pag
atio
n.
Num
ber
of
seiz
ure
sre
cord
edin
bra
cket
s.Su
rgic
aloutc
om
eac
cord
ing
Engel
’scl
assi
fica
tion
(Dura
tion
of
follo
wup
inbra
cket
s).
L=
left
;R
=right;
Bi=
bila
tera
l;T
=te
mpora
l(m
=m
esia
l;b
=bas
al;
l=la
tera
l;p
=pola
r),
F=
fronta
l(I
=in
ferior)
;O
=occ
ipital
;P
=par
ieta
l;C
=ci
ngula
r;I=
insu
lar;
H=
hip
poca
mpus.
SPEC
T=
single
photo
nem
issi
on
com
ple
ted
tom
ogra
phy;
HS
=hip
poca
mpal
scle
rosi
s;
Tpw
gd
=te
mpora
lpole
white-
gra
ym
atte
rded
iffe
rentiat
ion;
AM
TR
=an
terior
mes
ial
tem
pora
lre
sect
ion;
N=
norm
al;
ant=
ante
rior;
post
=post
erio
r.a
Pat
ients
with
limited
rese
ctio
n.
The
whole
puta
tive
epile
pto
gen
iczo
ne
was
not
rem
ove
dto
limit
cognitiv
eim
pai
rmen
ts.
Mapping interictal HFOs with standard EEG Brain 2010: 133; 33–45 | 35
by guest on May 27, 2016
http://brain.oxfordjournals.org/D
ownloaded from
comprised four to nine electrodes corresponding to an average of
38 contacts per patient as described in Table 2. Pre- and post-
implantation MRI scans were evaluated to locate each contact anato-
mically and precisely along the electrode trajectory. While electrodes
were inserted in different trajectories within the temporal lobe (lateral-
to-medial or posterior-to-anterior), their location could always be
identified in the amygdala, the hippocampal head, body and tail,
or in other medial temporal lobe structures.
All seizures recorded for each patient were visually identified and
reviewed. The structures where the earliest EEG changes appeared
during seizure we defined as the seizure onset zone. Secondary
implicated structures were defined as the first propagation zone.
Nine Patients (A–I) suffered from MTL epilepsy. Neuropathology
showed hippocampal sclerosis in Patients A–G. A second independent
epileptic focus was found in the ipsilateral temporal lobe for Patient B,
or in the contralateral temporal pole (H). Seizures originated from the
temporal neocortex in four Patients (J–M), in the occipital lobe for
Patients N and O and the parietal lobe for Patient P (Table 1).
High sampling data acquisitionIntracranial EEG data were acquired with a sampling rate of 1024 Hz
using a 128 channel Micromed system (16 bit, bandwidth at 3 dB:
0.1–320 Hz). Recording took place in a Faraday room and lasted
�1 h (mean 54 min). All patients were awake during recording. All
data were from interictal periods occurring at least 2 h from a seizure.
Data analysis: semi-automaticdetection of high-frequency oscillationsWe developed a procedure to detect HFO events that consisted of an
initial automatic detection followed by a visual confirmation by an
observer (B.C.) who was blind to clinical data and investigative
conclusions. This detection was independently performed on each
electrode contact (total number: 615; Table 2).
Highly sensitive automatic detectionof high-frequency oscillation eventsEEG was first studied using a local bipolar montage based on the
potential difference between pairs of adjacent contacts. An average
reference montage was subsequently shown to locate more precisely
high-frequency activity. First, after filtering data in the high-frequency
range between 180 and 400 Hz (using the MATLAB Signal Processing
Toolbox function ‘fir2’, a windowed digital Finite Impulse Response
filter with a magnitude gain near one between 180 and 400 Hz and
near zero below 170 Hz and above 420 Hz), the signal envelope was
computed using a Hilbert transform. Then, its local maxima (corre-
sponding to putative HFO events) were automatically detected
using a threshold set to 5 standard deviations (SD) of the envelope
calculated over the whole recording. This value of 5 was previously
used by Staba et al. (2004) in HFO detection. We further confirmed
the validity of this threshold by performing a sensitivity/specificity
analysis, using a full visual screen of HFOs in single-channel
epochs from five patients. A group of 148 HFOs, visually identified
by a human reviewer (B.C.), was used as a benchmark for measuring
the performance of our algorithm. The Receiver Operating
Characteristic (ROC) curve showed that a 5 SD threshold was
associated with a sensitivity of 100% and a specificity of 90.5%
(Supplementary Fig. 1). Similar to Worrell et al. (2008), we selected
a low specificity threshold to produce a detection procedure with
high sensitivity. We compared the performance of our algorithm to
that obtained from another HFO detection method (Gardner et al.,
2007) and the results were similar (Supplementary Fig. 1).
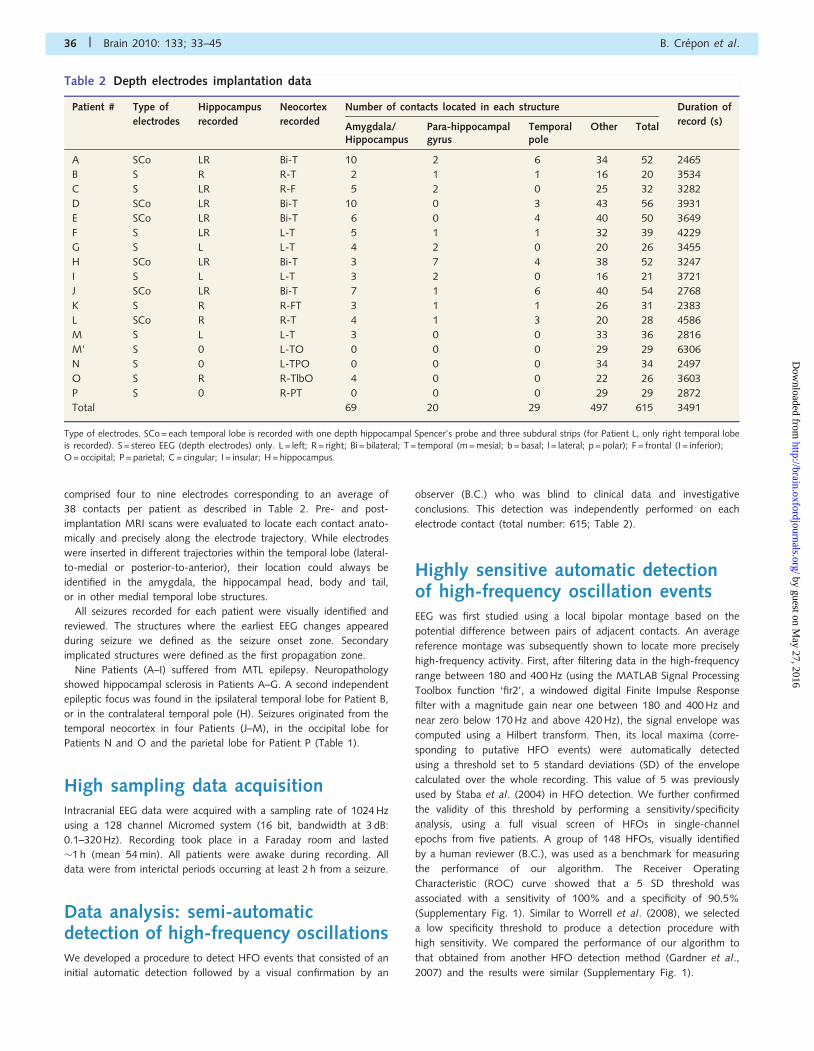
Table 2 Depth electrodes implantation data
Patient # Type of Hippocampus Neocortex Number of contacts located in each structure Duration of
electrodes recorded recorded Amygdala/Hippocampus
Para-hippocampalgyrus
Temporalpole
Other Total record (s)
A SCo LR Bi-T 10 2 6 34 52 2465
B S R R-T 2 1 1 16 20 3534
C S LR R-F 5 2 0 25 32 3282
D SCo LR Bi-T 10 0 3 43 56 3931
E SCo LR Bi-T 6 0 4 40 50 3649
F S LR L-T 5 1 1 32 39 4229
G S L L-T 4 2 0 20 26 3455
H SCo LR Bi-T 3 7 4 38 52 3247
I S L L-T 3 2 0 16 21 3721
J SCo LR Bi-T 7 1 6 40 54 2768
K S R R-FT 3 1 1 26 31 2383
L SCo R R-T 4 1 3 20 28 4586
M S L L-T 3 0 0 33 36 2816
M’ S 0 L-TO 0 0 0 29 29 6306
N S 0 L-TPO 0 0 0 34 34 2497
O S R R-TlbO 4 0 0 22 26 3603
P S 0 R-PT 0 0 0 29 29 2872
Total 69 20 29 497 615 3491
Type of electrodes. SCo = each temporal lobe is recorded with one depth hippocampal Spencer’s probe and three subdural strips (for Patient L, only right temporal lobeis recorded). S = stereo EEG (depth electrodes) only. L = left; R = right; Bi = bilateral; T = temporal (m = mesial; b = basal; l = lateral; p = polar); F = frontal (I = inferior);O = occipital; P = parietal; C = cingular; I = insular; H = hippocampus.
36 | Brain 2010: 133; 33–45 B. Crepon et al.
by guest on May 27, 2016
http://brain.oxfordjournals.org/D
ownloaded from

Visual validation of high-frequencyoscillation assisted by a time–frequency decompositionThis procedure detected many events, with frequent false positive
ones, which were then screened visually and discarded if necessary.
For this purpose, we developed a custom graphical user interface to
screen candidate HFO events visually. This interface displayed
the untreated signal together with two band-pass filtered signals and
a time frequency map using a wavelet decomposition for frequency
from 1 to 400 Hz (Le Van Quyen and Bragin, 2007). More precisely,
we used a complex Morlet wavelet w(t,f) with a Gaussian shape
in both time and frequency domains around a central time t and
frequency f: wðt; fÞ ¼ ��1=4:e�t2=2�2t :e2i�ft. A wavelet family is charac-
terized by a constant ratio f/�f that we set at 10 (�f = 1/2��t). The
time–frequency map E(t,f) of the signal is the square norm of the
result of convolution of a complex wavelet with the signal
s(t): Eðt; fÞ ¼ jwðt; fÞN
sðtÞj2. To improve visualization and contrast,
all time frequency maps represent log[E(t,f)] as log (mV2/s).
The simultaneous display of the filtered signal and its time frequency
map let us select HFO events according to several criteria: (i) HFOs
had to be visually detectable on the unfiltered signals as sinusoidal
waves; (ii) the time–frequency map of an HFO had to show a primary
peak in the frequency range 180–400 Hz. Indeed, artefactual high-
frequency activities can be caused by harmonics of lower frequency
activities or by sharp components of epileptiform discharges that
usually induce a broadband increase in the high-frequency range
that obscured HFO detection (Supplementary Fig. 2). Thus, we
excluded broad-band high-frequency activities related to isolated
spikes, but retained narrow-band HFOs with sufficient amplitudes
(above 8 SD), even if they co-occurred with a spike; and (iii) rare
high-frequency events, occurring less than once every 10 min, were
retained only if they recurred on a similar EEG background (for exam-
ple, at the same phase of a sharp wave or simultaneous to a paroxysm
on a nearby contact; Supplementary Fig. 3).
Quantification of high-frequencyoscillationEach selected HFO event was quantified by: (i) the amplitude of the
HFO (mV) defined by the local maximum of the envelope; (ii) the
duration of the event (ms) defined by the time for which the envelope
around the event remained above the half of the threshold, or
2.5 times the SD; and (iii) the maximum of the time frequency map
in the frequency band of interest defined by the power (mV2) and the
modal frequency (Hz) of the HFO. Calculations and analyses were
computed using MATLAB 7.3 software (The Mathworks Inc.,
Massachusetts).
Results
High-frequency oscillations detectionand quantificationWe identified HFOs in the intracranial EEG recordings of sixteen
patients using the two steps procedure. About 185 000 candidate
events were detected automatically and 1932 HFOs were selected
from these by visual inspection and time–frequency analysis.
These selected HFOs all had a circumscribed power increase in
the high-frequency range. Typical examples of HFOs from the
hippocampus are shown, with their corresponding time–frequency
decomposition, in Fig. 1. Histograms of all detected HFOs sorted
by frequency show a primary peak near 240 Hz (Fig. 2). The mean
frequency of all selected events was 261� 53 Hz (median 250 Hz),
the mean amplitude was 11.9� 6.7 mV (median 10.1 mV) and
mean duration was 22.7� 11.6 ms (i.e. 8.7 oscillations, median
20 ms). They occurred at a rate of 1.6 per min. About 95% of
HFOs were nested within a spike or a sharp wave, typically just
after the maximal deflexion. For a given recording contact, the
HFO always occurred at the same phase of the paroxysm. In
two patients (see Patient A of Fig. 1), these sharp-wave HFO
complexes occurred periodically every 1 to 2 s. In Patient C,
HFOs co-occurred at the same contact with lower frequency
oscillations (100–200 Hz).
Spatial and temporal extension ofhigh-frequency oscillationsFor each patient, HFOs were classed into distinct patterns based
on their anatomic location, EEG morphology, the simultaneous
occurrence of a paroxysm, frequency and their spatial extent.
When a HFO was recorded simultaneously on several contacts
within 10 ms, its spatial extent was defined by the number of
involved contacts and its location was defined by the maximal
amplitude. These features permitted the separation of several
different HFO patterns (range 1–5) for each patient (Table 3).
Most HFO patterns (19/24) were limited to a single recording
contact (Fig. 3A). We note that the associated sharp waves
typically had a larger spatial extent and were observed on several
nearby contacts (Fig. 4A). In five of 24 patterns, HFOs were
detected on two or three contacts, sometimes quite distant
(Fig. 4B). Anatomically, 18 patterns were recorded from the
amygdala or hippocampus (in all patients, 69 contacts were
located in these structures; Table 2 and Fig. 3B), four in parahip-
pocampal gyrus (20 contacts) and 2 in temporal polar cortex
(29 contacts), whereas no HFOs were observed in extra temporal
or temporal lateral neocortex (497 contacts). For 11 patterns
(Patients C, D and G), different HFOs followed each other in
time with a latency of more than 10 ms, suggesting a propagation
phenomenon. Figure 5 shows an example of HFOs nested in
interictal sharp waves generated in the body of right hippocampus
(Patient D, patterns D1 and D2). Another HFO of similar
frequency, duration and amplitude range, was recorded 24 ms
later on the next contact, in the tail of the hippocampus (patterns
D3 and D4 gathered). Finally, a ripple oscillation in the
100–200 Hz band was recorded in the head of the hippocampus.
We detected two patterns of propagation in this case: sometimes
the ripple temporally surrounded the HFO in the body of
hippocampus (pattern D2 in the body followed by D4 in the
tail), or the ripple followed it (pattern D1 in the body followed
by D3 in the tail).
In another example, from Patient G, 77 similar HFOs were
associated with a spike-and wave (pattern G1) recorded in the
head of left hippocampus. Sometimes (41/77) a small, slower
Mapping interictal HFOs with standard EEG Brain 2010: 133; 33–45 | 37
by guest on May 27, 2016
http://brain.oxfordjournals.org/D
ownloaded from

HFO was recorded on the same contact 85 ms before
(pattern G3). Often (64/77), the G1–HFO was followed by a
slower HFO on the last contact of the next electrode in the
head of the hippocampus (pattern G2).
Correlation between high-frequencyoscillations and the seizure onset zoneFor each of the nine patients suffering from MTL epilepsy (A to I,
Table 4), HFOs were generated in the seizure onset zone
(16 patterns), or in the first propagation zone (Patient A).
Figure 6 summarizes the exploration of Patient A: HFOs were
recorded in one contact of the head of the hippocampus during
a 410 interictal period. They predicted the seizure onset zone pre-
cisely and more rapidly than analysis of complex EEG records of
several weeks of interictal and ictal epileptic activities. HFOs were
detected unilaterally in five of seven patients in which both hip-
pocampi were recorded. They were usually recorded in the seizure
onset zone (10/13 contacts, Table 4), or in first propagation sites
(6/16 contacts). Three patterns were detected at other sites in
two patients with bi-temporal HFOs: for Patient C, HFOs were
recorded in both hippocampi, whereas seizures were detected only
in the right one. The pattern C5 was recorded in left hippocampus
where no seizure emerged during the invasive evaluation.
Nevertheless, previous non-invasive evaluations had shown that
seizures could emerge from both temporal lobes asynchronously.
The pattern C3 was recorded in the tail of right hippocampus, not
considered as seizure onset zone, but patterns C1 and C2,
100
200
300
100
200
3002 2
00
50 ms
500 µV
50 ms
500 µV
500 ms
500 µV
Fre
quen
cy (
Hz)
Raw signal
Raw signal
180 Hz lowpass filtered
180 Hz highpass filtered – 2-fold increased
Raw signal26 events
A
B C
0 time (ms) 2000 time (ms) 200
Figure 1 Representative examples of interictal HFOs recorded at the head-body junction of a sclerotic hippocampus (Patient A, pattern
A1). (A) Six seconds of raw intracranial EEG. HFOs are nested in sharp waves which appear periodically every 1.5 s. (B) Top: expanded traces
of the first sharp wave. The HFO can be seen in the raw signal just after the maximal deflexion of the wave. It is not visible in a standard EEG
record sampled at 400 Hz (blue, low-pass filtered signal). Bottom: the time–frequency map of the HFO. The power of the oscillation is
depicted by a colour scale code. The time–frequency map provides information on the stability of oscillation frequency with time and on the
spread of frequencies involved (black cross). (C) Top: expanded traces of 26 similar HFOs. Bottom: mean time–frequency map of all
recorded events.
0 10 20 30 40 50 600
100
200
300
400
Amplitude (µV)
Eve
nt c
ount
0 10 20 30 40 50 60 70 800
100
200
300
Duration (ms)
Eve
nt c
ount
150 200 250 300 350 4000
50
100
150
Frequency (Hz)
Eve
nt c
ount
A
C
B
Figure 2 Histograms of all selected HFOs (n = 1932) sorted by
amplitude (A), duration (B) and frequency (C). The white
dotted line indicates the median.
38 | Brain 2010: 133; 33–45 B. Crepon et al.
by guest on May 27, 2016
http://brain.oxfordjournals.org/D
ownloaded from

recorded in the seizure onset zone, were also visible in the tail. In
the case of Patient H, with a bi-temporal epilepsy, HFOs were
detected in both independent seizure onset zones: left entorhinal
cortex (pattern H1) and right temporal pole (pattern H3). HFOs
were also recorded in the left temporal pole (pattern H2), where
electrical stimulation typically provoked left temporal seizures.
For two patients, whose seizures were initiated just in the
temporal pole (Patients J and K; Tables 3 and 4), HFOs were
only recorded in the ipsilateral hippocampus. The seizure onset
zone of Patient L was localized to the anterior basal temporal by
intracranial EEG, but this electrode was no longer available when
the interictal recording for HFOs were made. In this patient, no
HFOs were detected, even though medial structures were
implicated secondarily in ictal events. Finally, no HFOs were
detected, either in neocortex or in mesiotemporal structures, for
four Patients (M–P) suffering from extra-temporal (1 parietal, 2
occipital) or lateral temporal epilepsies.
DiscussionThree main findings were obtained in this study. First, we
confirmed that HFOs between 180 and 400 Hz can be detected
in interictal periods with standard, large-sized intracranial macro-
electrodes. Secondly, while HFOs were generally limited to a single
contact, confirming a local spatial extent, they could be recorded
from up to three contacts, suggestive of a larger neural network.
Thirdly, HFOs were mostly recorded in the seizure onset zone for
each of the nine patients suffering from MTL epilepsy. In contrast,
they were never found outside the mesiotemporal structures or in
the healthy amygdala or hippocampus. Specifically HFOs were not
detected in patients suffering from neocortical epilepsy, suggesting
that they may be useful in routine invasive presurgical localization
of MTL epileptic foci.
Submillimetre high-frequencyoscillations 4200 Hz recorded withmacroelectrodesDiscrete fast ripple oscillations in the range of 250–500 Hz were
first described in human with microelectrodes that record a local
field potential from a volume of around 1 mm3 (Bragin et al.,
1999). More recently, using larger depth macroelectrodes
(0.8 mm2), HFOs were visually identified close to seizures (Jirsch
et al., 2006) or associated with interictal spikes (Urrestarazu et al.,
2007). Finally, interictal HFOs have been recorded with
Table 3 Summary of selected HFO patterns
No. Location Count Rate Frequency (Hz) Amplitude (kV) Duration (ms) Spatio-temporal remarksmin�1 mean (SD) mean (SD) mean (SD)
A1 Head–body junctionR hippocampus
38 0.92 264 (43) 16.4 (3.8) 19.5 (7.7)
B1 Head of R hippocampus 115 1.95 228 (30) 7.7 (1.7) 23.9 (6.9) AVI next white matter
B2 Tail of R hippocampus 165 2.8 250 (28) 10.7 (3.4) 20.4 (8.6)
C1 Depth of R collateral sulcus 57 1.04 251 (36) 9.6 (3) 21 (8.3) AVI R amygdala and tail of hippocampus
C2 Depth of R collateral sulcus 34 0.62 278 (20) 6.1 (1.5) 29 (11) AVI R amygdala and tail of hippocampus
C3 R amygdala–lateral basal 19 0.35 226 (26) 2.8 (0.9) 24.7 (4.7) 50 ms before C1
C4 Tail of R hippocampus 9 0.16 236 (12) 2.4 (0.5) 25.7 (7.9) 100 ms before C2
C5 L amygdala–hippocampusjunction
66 1.21 288 (42) 10.1 (2.8) 17.4 (7.7)
D1 Body of R hippocampus 62 0.89 329 (28) 8.2 (2.9) 21.2 (13)
D2 Body of R hippocampus 71 1.13 324 (35) 6.8 (1.6) 22.1 (14)
D3 Tail of R hippocampus 62 0.96 324 (39) 7.8 (2) 31.7 (14) 24 ms after D1
D4 Tail of R hippocampus 71 1.08 314 (44) 6.7 (1.6) 25.5 (16) 24 ms after D2
E1 R entorhinal cortex 315 5.18 219 (27) 10.4 (3.3) 20.7 (4.5) AVI R amygdala and head of hippocampus
F1 Head of L hippocampus 33 0.47 276 (43) 5.3 (1.4) 16.6 (3.2) AVI inferior circular sulcus of insula
G1 Head of L hippocampus 77 1.34 309 (52) 16.1 (6.2) 17.9 (13)
G2 Body of L hippocampus 64 1.11 267 (35) 18.4 (6.9) 18.5 (12) 12 ms after G1 (same sharp wave)
G3 Head of L hippocampus 41 0.71 244 (24) 4.4 (6.6) 22.9 (15) 85 ms before G1
G4 Head of L hippocampus 62 1.08 249 (25) 7 (1.8) 23.7 (7.8)
H1 L entorhinal cortex–nearamygdala
241 4.45 222 (27) 15.2 (7.3) 22.1 (11)
H2 L temporal pole–lateral 116 2.14 296 (51) 14.1 (6.1) 17.4 (12)
H3 R temporal pole–medial 30 0.55 259 (35) 2.7 (0.6) 20.3 (7)
I1 L amygdala–hippocampusjunction
281 4.53 238 (34) 16.7 (8.7) 21.7 (13)
J1 Head of L hippocampus 132 2.86 355 (39) 13.4 (9.3) 17.3 (14)
K1 Head of R hippocampus 13 0.33 242 (30) 18.1 (9.1) 24.7 (13)
Mean 1.58 270 (33) 9.9 (3.9) 21.9 (10)
For each patient, HFOs were categorized in different patterns based on anatomic location, EEG morphology, frequency and spatial extent. If a HFO was simultaneouslyrecorded on several contacts, its location was defined by the maximal amplitude, with secondary locations described in last column.
L = left; R = right; AVI = also visible in. SD = standard deviation.
Mapping interictal HFOs with standard EEG Brain 2010: 133; 33–45 | 39
by guest on May 27, 2016
http://brain.oxfordjournals.org/D
ownloaded from

conventional macroelectrodes of contact area greater than 1 mm2,
which presumably record the activity of 100 mm3 of brain tissue
(Worrell et al., 2008). Our study confirms that HFOs can be
detected when signals from conventional intracranial EEG macro-
electrodes are recorded at a high sampling rate (1024 Hz). These
HFOs have similar properties in terms of frequency, amplitude and
duration to those recorded with microelectrodes, they are also
nested within sharp wave and their localization is similar. On the
basis of these observations, we postulate that focal HFOs reflect
the same local, highly synchronous oscillations as those recorded
with microelectrodes. This conclusion is supported by the
co-occurrence of interictal fast ripples and HFOs in simultaneous
records made with microwires and macroelectrodes (Worrell et al.,
2008).
Furthermore, we detected distinct HFOs with novel spatiotem-
poral properties that occurred nearly simultaneously on several
EEG channels. Interictal HFOs were, for 5/24 patterns, recorded
from two or three contacts (with a separation of 10 mm between
adjacent contacts on the same electrode). Our data suggest that
networks that generate HFOs or through which they propagate
can extend over volumes of cm3. These HFOs presumably reflect
synchronization of distant neuronal structures since we sometimes
recorded HFOs on three contacts with those of the middle
electrode having the smallest amplitude (Fig. 4B, pattern E1).
These pathological hypersynchronies contrast with physiological
oscillations where the oscillation frequency is negatively correlated
with its amplitude, reflecting the volume of the generator network
according to a 1/f relation (Penttonen and Buzsaki, 2003; Buzsaki
and Draguhn, 2004). In contrast, for 11/24 patterns, HFOs
followed a reproducible spatiotemporal sequence. This implies
several interconnected networks that can both oscillate at high
frequency and also initiate similar oscillations in nearby structures;
presumably as occurs during seziure initiation. This interictal activ-
ity may then provide insights into dynamic processes that initiate a
seizure. Future studies should compare these interictal patterns
with high frequency synchronizations at seizure onset.
Conventional intracranial EEG can thus effectively detect and
characterize HFOs at frequencies above 180 Hz. Microelectrodes
detect activity from a volume limited to usually emerging at the
distal end of the macroelectrodes. Compared with microelec-
trodes, macroelectrodes may permit detection of HFOs within a
larger brain volume and so provide a better understanding of the
propagation of this high-frequency epileptic activity. Furthermore,
our use of standard intracranial electrodes permitted systematic
and simultaneous mapping of multiple cortical sites, providing an
original large-scale analysis of HFOs during the interictal period.
A strategy to detect high-frequencyoscillationsEven with presently available electrode, amplifier and high-
sampling data acquisition technology, HFOs are hard to detect
since their signal-to-noise ratio is low and they rarely occur at
one or a few recording sites. We feel that a visual detection of
HFOs, using digital techniques alone to examine long-term
records, may be impossible. While EEG screens typically display
between 5 and 20 s of data, a 300 ms window might be most
appropriate for the visual detection of HFOs (Schevon et al.,
2004). A close, visual reading of an interictal EEG with a 300 ms
per screen display for each of the recorded channels becomes
time-consuming and tiring. In our study of 16 patients, a mean
recording duration of 54 min represents 106 windows of 250 ms.
At one window per second, this analysis would take 4 months,
night and day. Thus, reliable automated methods seem to be
obligatory to localize and track HFOs in long-term records.
Nevertheless, the construction of a fully automated HFOs
detection system is not easy. The EEG signal is non-stationary
and both the variation in background activity and presence of
Figure 3 Spatial extent and location of the 24 HFO patterns.
(A) Histogram of HFO spatial extent, defined by the number of
contacts expressing, within a 10 ms time lag, a high-frequency
activity in selected HFO patterns. In most cases (19 patterns
out of 24), HFOs were recorded from a single contact. In other
patterns, HFOs were detected nearly simultaneously on two or
three contacts. (B) Anatomic location of HFO patterns. In most
cases (18 patterns out of 24), HFOs were recorded in the
amygdalo-hippocampal (AH) complex. Four cases were
observed in parahippocampal gyrus (PHG) and two other cases
in the temporal pole (TP). No HFOs were recorded in lateral
or basal temporal cortex or in locations outside the temporal
lobe.
40 | Brain 2010: 133; 33–45 B. Crepon et al.
by guest on May 27, 2016
http://brain.oxfordjournals.org/D
ownloaded from

EEG paroxysms complicate automated analyses (Liu et al., 2002).
Sudden variations, including epileptic spikes, have a wide band
spectrum and by producing high-frequency artefacts in filtered
data can lead to false detections by automatic algorithms.
Furthermore, while there is a consensus on the identification of
paroxysms like sharp waves (Gotman, 1980), no consensus exists
for HFOs. In particular, HFO morphology varies with distance
from their site of generation, leading to an imprecise, operator-
dependant characterization. We therefore developed a semi-
automatic detection strategy that reduced the need for human
supervision and overcame some difficulties associated with the
use of automated methods on single-channel data. Our highly
Figure 4 (A) A typical local HFO recorded from one contact at the left amygdalo-hippocampal junction (Top, Pattern I1). Note the
HFO is nested in a sharp wave which is detected without a HFO in two adjacent contacts (middle–bottom). (B) A representative
example of a HFO recorded from three contacts. Its amplitude is maximal in an electrode recording from entorhinal cortex (subdural
strip). Note that the HFO amplitude is minimal at contact 2, situated between contacts 1 and 3, suggesting a long-range
synchronization phenomenon rather than simple diffusion.
Mapping interictal HFOs with standard EEG Brain 2010: 133; 33–45 | 41
by guest on May 27, 2016
http://brain.oxfordjournals.org/D
ownloaded from

sensitive automatic detection paradigm generated many false
positive events which were then screened and discarded by
visual review. The custom graphical user interface we developed
to screen candidate HFO events displays short-time windows
containing raw signals, band-pass filtered signals and time–
frequency decompositions. The wavelet decomposition tool
works as a ‘mathematical microscope’ to dissect the instantaneous
frequency content of signal and enhance detection of
short-duration low-amplitude activities that are often masked by
high-amplitude, low-frequency and large-scale integrated EEG
activity (Le Van Quyen and Bragin, 2007).
If HFO events can be used as a more specific index of a seizure
onset zone than epileptic spikes, then it will be necessary to
distinguish them reliably from high-frequency components of
epileptic spikes. We attempted to resolve this essential issue by
imposing strict criteria for positive detection including the presence
of HFO in the raw EEG signal, a reproducibility of HFO form and
the presence of two separate maxima in time–frequency analyses,
one for HFO and another for the nested epileptic paroxysm.
High-frequency oscillations as a markerof mesial temporal lobe epilepsy:clinical relevanceFor the nine patients with MTL epilepsy, HFOs were always
recorded in the seizure-generating structures. The spatial proper-
ties and frequency content of these HFOs are similar to those
123456
-1
0
1
20 ms
1 mV
50 ms
5 mV
Amygdala
Head
Body
Body
Tail
Whitematter
Right amygdalahippocampusB C
0
400
0
400
0
400
0
400
0
400
0
400
0
400
0
400
0
400
0
400
0
400
0
400
A
1
2
3
4
5
6
D1 D2
D3 D4
R RRR
0 time (ms) 200 0 time (ms) 200
Figure 5 (A) Thirty-six consecutive HFOs (out of 133) recorded from the body of a sclerotic hippocampus (Patient D) are aligned with
inflexion of the nested sharp wave (bipolar montage, contact 3–4. For localization, see MRI). Two types of events with distinct
spatiotemporal patterns (17 and 19 events, respectively) can be distinguished (patterns D1 in black and D2 in blue). (B and C) Left:
spatial extent of events recorded from the right hippocampus (referential versus average montage) for each pattern. Right: mean time
frequency map of each pattern of HFOs. The sharp wave was detected throughout the amygdalo hippocampus complex. A sharp wave
and HFO in tail of hippocampus (contact 5, patterns D3 and D4; see arrows) occurs 24 ms after a similar complex in the body
(contact 4, patterns D1 and D2). While a HFO nested with a slower 130 Hz HFO (R) sometimes occurs after (B) (19 events out of 36,
patterns D1) and sometimes before (C) (17 events out of 36, patterns D2).
42 | Brain 2010: 133; 33–45 B. Crepon et al.
by guest on May 27, 2016
http://brain.oxfordjournals.org/D
ownloaded from

recorded from limbic epileptic structures with microelectrodes
in patients with MTL epilepsy (Bragin et al., 1999, 2002b;
Staba et al., 2004) as well as in excitotoxic models such as
kainate-induced epilepsy in rodents (Bragin et al., 2002a). These
findings suggest that events specific to MTL epilepsy produce
neural networks that can generate hypersynchronous,
high-frequency activity (4200 Hz). They may involve the synaptic
reorganization that is known to occur during secondary epilepto-
genic processes (Bragin et al., 2004; Khalilov et al. 2005, Le Van
Quyen et al., 2006). HFOs of a similar frequency content, around
240 Hz, have also been identified in patients just before seizure
onset at sites close to seizure initiation (Jirsch et al., 2006) as
well as in animal models of hippocampal seizures (Traub et al.,
2001; Khalilov et al. 2005; Khosravani et al., 2005). In contrast,
seizures arising from neocortical structures have been shown to
begin with lower-frequency fast oscillations in the gamma range
30–100 Hz (Allen et al., 1992; Alarcon et al., 1995; Worrell et al.,
2004). This suggests that neuronal networks specific to an
epileptic mesial temporal cortex produce hypersynchronous
events at frequencies above 200 Hz not only between seizures
but also at seizure onset. Thus HFOs may be a specific marker
of the mesial temporal seizure onset zone in patients with MTL
epilepsy (Bragin et al., 1999, 2002b; Staba et al., 2004;
Urrestarazu et al. 2007; Worrell et al., 2008). In five of the
patients examined in this study, scalp EEG records showed a
bi-temporal asynchronous or simultaneous seizure onset. In
each case, interictal HFO localization was concordant with the
site of seizure onset in mesial temporal limbic structures. Patient
A was particularly interesting: seizures were initiated indepen-
dently in both hippocampi; surgery of right hippocampus,
where HFOs took place, cured the epilepsy (Fig. 6). Of the
seven neuropathologically proven cases of hippocampal sclerosis,
three had a typical MRI and one had radiological hyperintensity
without atrophy. In all cases, HFOs were observed in the
amygdo–hippocampal complex. This suggests that HFOs provide
a good sensitivity for the identification of hippocampal sclerosis.
In five patients with neocortical epilepsies, HFOs were not
detected either in epileptic structures or in healthy regions of
neo or medial temporal cortex. These results seem to imply that
neocortical epileptic networks do not generate HFOs, which
appears to contradict other recent studies (Jacobs et al. 2008,
2009). A possible reason for these differences may result from
the nature of the epileptic syndrome. In our patients, no lesions
were detected by MRI, while a heterotopia or dysplasia was iden-
tified in the previously mentioned studies. Another reason may be
the electrode size. HFOs were first recorded with micro electrodes,
then with electrodes with infra millimetric active surface area,
but less easily with the larger contacts (Worell et al. 2008). The
absence of HFOs in mesial temporal limbic structures in three
neocortical patients confirms their negative predictive value for
seizure onset zone detection in hippocampus.
The temporal poles seems to represent a special entity. In one
patient, a seizure onset zone was associated with HFOs whereas
HFOs were present only in ipsilateral hippocampus for two others.
This suggests that mesocortex of temporal pole or para-
hippocampal gyrus, as well as the archeocortex of amygdala or
hippocampus, can generate such activity. In two patients with
seizure onsets in the temporal pole, the presence of HFOs in
ipsilateral hippocampus opens questions on the involvement of
temporal limbic structures in the epileptic network or their
modifications by frequent, early ictal propagation from the pole
(Kahane et al., 2002).
In conclusion, interictal HFOs 4200 Hz can be recorded with
macroelectrodes. They seem to provide useful additional evidence
for diagnostic analysis of intracranial EEG data. When present in
temporal polar epilepsies, they either reinforce a suspected polar
location or question whether hippocampal structures are involved
in a larger epileptic network. HFOs in cases of medial temporal
limbic epilepsies confirm the location of the seizure onsets, may
suggest a stronger implication of the parahippocampal gyrus and
Figure 6 Comparison of seizure onset zone (green), irritative
zone (yellow), epileptogenic zone (blue) and interictal HFO
zone (red) in Patient A. Scalp EEG showed asynchronous
bi-temporal interictal ictal activities. Bi-temporal intracranial
EEG recorded three complex partial seizures (emerging from
the head of the right hippocampus, spreading along
hippocampus, then to right temporal neocortex and finally
propagating to left temporal lobe) and one aura (emerging
from left temporal lobe with maximum amplitude in anterior
part of hippocampus). Interictal asynchronous spikes were
recorded in right hippocampus and both temporal poles, and
synchronous spikes in left hippocampus and lateral temporal
cortex. Patient is seizure free 3 years after resection of right
amygdala, hippocampus and anterior temporal lobe (blue
curve). Interictal HFOs around 260 Hz were recorded only in
the head–body junction of the right hippocampus (red arrow).
Mapping interictal HFOs with standard EEG Brain 2010: 133; 33–45 | 43
by guest on May 27, 2016
http://brain.oxfordjournals.org/D
ownloaded from

could help discriminate the ‘worst’ hippocampus to be surgically
removed. Finally, the absence of HFOs in neocortical epilepsies
further emphasizes that the hippocampus is unlikely to be involved
in seizure onset.
AcknowledgementsThe authors thank Richard Miles for helpful comments on the
manuscript and Laurent Hugueville for technical assistance with
the EEG amplification system.
FundingThis work was supported by the European Union-FP7 Project
EPILEPSIAE (Evolving Platform for Improving Living Expectation
of Patients Suffering from IctAl Events, Grant No 211713). B.C.
was supported by INSERM.
Supplementary materialSupplementary material is available at Brain online.
ReferencesAdam C, Clemenceau S, Semah F, Hasboun D, Samson S,
Aboujaoude N, et al. Variability of presentation in medial temporal
lobe epilepsy: a study of 30 operated cases. Acta Neurol Scand
1996; 94: 1–11.
Adam C, Clemenceau S, Semah F, Hasboun D, Samson S, Dormont D,
et al. Strategy of evaluation and surgical results in medial temporal
lobe epilepsy. Rev Neurol (Paris) 1997; 153: 641–651.
Alarcon G, Binnie CD, Elwes RD, Polkey CE. Power spectrum and
intracranial EEG patterns at seizure onset in partial epilepsy.
Electroencephalogr Clin Neurophysiol 1995; 94: 326–337.
Alarcon G, Seoane JJG, Binnie CD, Miguel MCM, Juler J, Polkey CE,
et al. Origin and propagation of interictal discharges in the
acute electrocorticogram. Implications for pathophysiology and
surgical treatment of temporal lobe epilepsy. Brain 1997; 120:
2259–2282.
Allen PJ, Fish DR, Smith SJ. Very high-frequency rhythmic activity during
SEEG suppression in frontal lobe epilepsy. Electroencephalogr Clin
Neurophysiol 1992; 82: 155–159.
Bragin A, Engel J, Wilson CL, Fried I, Buzsaki G. High-frequency
oscillations in human brain. Hippocampus 1999; 9: 137–142.Bragin A, Mody I, Wilson CL, Engel J. Local generation of fast ripples in
epileptic brain. J Neurosci 2002; 22: 2012–2021.
Bragin A, Wilson CL, Almajano J, Mody I, Engel J. High-frequency
oscillations after status epilepticus: epileptogenesis and seizure genesis.
Epilepsia 2004; 45: 1017–1023.Bragin A, Wilson CL, Staba RJ, Reddick M, Fried I, Engel J. Interictal
high-frequency oscillations (80-500 Hz) in the human epileptic brain:
entorhinal cortex. Ann Neurol 2002; 52: 407–415.
Buzsaki G, Draguhn A. Neuronal oscillations in cortical networks. Science
2004; 304: 1926–1929.
Draguhn A, Traub RD, Bibbig A, Schmitz D. Ripple (approximately
200-Hz) oscillations in temporal structures. J Clin Neurophysiol 2000;
17: 361–376.Dzhala VI, Staley KJ. Mechanisms of fast ripples in the hippocampus.
J Neurosci 2004; 24: 8896–8906.
Engel J. Surgery for seizures. N Engl J Med 1996; 334: 647–652.
Table 4 Locations of HFOs versus seizure onset/early propagation zones for Patients A–K
Patient Seizure onset zone First propagation zone HFOs recorded elsewhere
A 1. Head of R hippocampus Head–body junction of R hippocampus
2. Head and body of L hippocampus Tail of L hippocampus
B 1. Head of R hippocampus Tail of R hippocampus, T3 neocortex depth ofR superior temporal sulcus
2. T2 neocortex (basal anterior) T1 neocortex
C Depth of R collateral sulcus T2 neocortexR amygdala—lateral basal
L amygdala–hippocampusjunction
Tail of R hippocampusD Body of R hippocampus Tail of R hippocampus
R amygdala Head of R hippocampus
E Right inferior amygdaleHead of R hippocampus
R entorhinal cortex
F Head of L hippocampus L amygdala—lateral basal
G Body of L hippocampus Head of L hippocampus
Depth of R collateral sulcus
H 1. R temporal pole—medialDepth of R collateral sulcus
R orbital gyrus—lateral R orbital gyrus—posterior
2. Head of L hippocampus L entorhinalcortex
L amygdala—lateral basal L temporal pole—medial L temporal pole—lateral
I L amygdale–hippocampus junction L insulae
J 1. L temporal pole Head of L hippocampus
2. R temporal pole
K R temporal pole Head of R hippocampus
T1 neocortex
HFO locations are indicated in italics. Note that, in most of the cases, HFOs were detected within the seizure onset zone. Independent seizure onset zones are indicatedfor patients A, B, H and J by numbers 1 and 2.
44 | Brain 2010: 133; 33–45 B. Crepon et al.
by guest on May 27, 2016
http://brain.oxfordjournals.org/D
ownloaded from

Engel J, Pedley T, editors. Epilepsy: A Comprehensive Textbook.New York: Lippincott-Raven; 1998.
Foffani G, Uzcategui YG, Gal B, de la Prida LM. Reduced spike-timing
reliability correlates with the emergence of fast ripples in the rat
epileptic hippocampus. Neuron 2007; 55: 930–941.Gardner AB, Worrell GA, Marsh E, Dlugos D, Litt B. Human
and automated detection of high-frequency oscillations in clinical intra-
cranial EEG recordings. Clin Neurophysiol 2007; 118: 1134–1143.
Gotman J. Quantitative measurements of epileptic spike morphology inthe human EEG. Electroencephalogr Clin Neurophysiol 1980; 48:
551–557.
Jacobs J, LeVan P, Chander R, Hall J, Dubeau F, Gotman J. Interictalhigh-frequency oscillations (80-500 Hz) are an indicator of seizure
onset areas independent of spikes in the human epileptic brain.
Epilepsia 2008; 49: 1893–1907.
Jacobs J, Levan P, Chatillon C-E, Olivier A, Dubeau F, Gotman J. Highfrequency oscillations in intracranial EEGs mark epileptogenicity rather
than lesion type. Brain 2009; 132: 1022–37.
Jirsch JD, Urrestarazu E, LeVan P, Olivier A, Dubeau F, Gotman J. High-
frequency oscillations during human focal seizures. Brain 2006; 129:1593–1608.
Kahane P, Chabardes S, Minotti L, Hoffmann D, Benabid A-L, Munari C.
The role of the temporal pole in the genesis of temporal lobe seizures.
Epileptic Disord 2002; 4: S51–S58.Khalilov I, Le Van Quyen M, Gozlan H, Ben-Ari Y. Epileptogenic actions
of GABA and fast oscillations in the developing hippocampus. Neuron
2005; 48: 787–796.Khosravani H, Pinnegar CR, Mitchell JR, Bardakjian BL, Federico P,
Carlen PL. Increased high-frequency oscillations precede in vitro
low-Mg seizures. Epilepsia 2005; 46: 1188–1197.
Le Van Quyen M, Bragin A. Analysis of dynamic brain oscillations:methodological advances. Trends Neurosci 2007; 30: 365–373.
Le Van Quyen M, Khalilov I, Ben-Ari Y. The dark side of high-frequency
oscillations in the developing brain. Trends Neurosci 2006; 29:
419–427.Liu HS, Zhang T, Yang FS. A multistage, multimethod approach for
automatic detection and classification of epileptiform EEG. IEEE Trans
Biomed Eng 2002; 49: 1557–1566.
Penttonen M, Buzsaki G. Natural logarithmic relationship between brain
oscillators. Thalamus and Related Systems 2003; 48: 1–8.
Rampp S, Stefan H. Fast activity as a surrogate marker of epileptic
network function? Clin Neurophysiol 2006; 117: 2111–2117.Schevon CA, Thompson T, Hirsch LJ, Emerson RG. Inadequacy of
standard screen resolution for localization of seizures recorded from
intracranial electrodes. Epilepsia 2004; 45: 1453–1458.Spencer SS, Guimaraes P, Katz A, Kim J, Spencer D. Morphological
patterns of seizures recorded intracranially. Epilepsia 1992; 33:
537–545.Staba RJ, Wilson CL, Bragin A, Jhung D, Fried I, Engel J. High-frequency
oscillations recorded in human medial temporal lobe during sleep.
Ann Neurol 2004; 56: 108–115.Talairach J, Bancaud J, Szikla G, Bonis A, Geier S, Vedrenne C. [New
approach to the neurosurgery of epilepsy. Stereotaxic methodology
and therapeutic results. 1. Introduction and history] Neurochirurgie
1974; 20: 1–240.Traub RD, Whittington MA, Buhl EH, LeBeau FE, Bibbig A, Boyd S,
Cross H, Baldeweg T. A possible role for gap junctions in generation
of very fast EEG oscillations preceding the onset of, and perhaps
initiating, seizures. Epilepsia 2001; 42: 153–170.
Urrestarazu E, Chander R, Dubeau F, Gotman J. Interictal high-frequency
oscillations (100-500 Hz) in the intracerebral EEG of epileptic patients.
Brain 2007; 130: 2354–2366.
Urrestarazu E, Jirsch JD, LeVan P, Hall J, Avoli M, Dubeau F, et al. High-
frequency intracerebral EEG activity (100-500 Hz) following interictal
spikes. Epilepsia 2006; 47: 1465–1476.
Wyllie E. edn. The treatment of epilepsy: Principles and practice.
2nd edn., Baltimore: Williams & Wilkins; 1997.Worrell GA, Gardner AB, Stead SM, Hu S, Goerss S, Cascino GJ,
Meyer FB, Marsh R, Litt B. High-frequency oscillations in human
temporal lobe: simultaneous microwire and clinical macroelectrode
recordings. Brain 2008; 131: 928–937.
Worrell GA, Parish L, Cranstoun SD, Jonas R, Baltuch G, Litt B.
High-frequency oscillations and seizure generation in neocortical
epilepsy. Brain 2004; 127: 1496–1506.
Mapping interictal HFOs with standard EEG Brain 2010: 133; 33–45 | 45
by guest on May 27, 2016
http://brain.oxfordjournals.org/D
ownloaded from