exploration of copper deposits in wadi el regeita area, southern sinai, egypt, with contribution of...
TRANSCRIPT
ORIGINAL PAPER
Exploration of copper deposits in Wadi El Regeita area,Southern Sinai, Egypt, with contribution of remotesensing and geophysical data
S. M. Salem & Sultan Awad Arafa & T. M. Ramadan &
El Sayed A. El Gammal
Received: 27 September 2010 /Accepted: 3 May 2011# Saudi Society for Geosciences 2011
Abstract Three types of hydrothermal alterations arerecorded in Wadi El Regeita area, argillic, phyllic, andpropylitic. Whole-rock analysis of representative samplesof the alteration halo (1) shows a Cu, Au, and Ag contentup to 1.7 wt.%, 1.6 g/t, and 4 g/t, respectively; in thealteration halo (2), these metal contents are up to 1.3 wt.%,1.4 g/t, and 3 g/t, following the same order. The integratedremote sensing and geophysical data, as well as geologicalfield verification, show that Wadi El Regeita area includespromising Cu ores within two hydrothermal alterationhaloes. Spatial data analyses of lineaments from LandsatEnhanced Thematic Mapper (ETM) band ratio image (7/5,5/4, 3/1) reveal the presence of alteration haloes thatpotentially may host Cu mineralization at south and northof El Regita Cu mine. Gravity interpretation indicates thatthe surveyed area is dissected by NE–SW fault zones in thecentral part, near Wadi El Regeita Cu mine. Groundmagnetic survey data revealed that the surveyed area
includes six magnetic bodies at depths ranging from 32 to90 m, possibly recording the presence of mineralized andhydrothermally altered andesitic dykes. The half length ofthese dykes ranges from 600 to 1,070 m; their halfthickness from 30 to 123 m and their half width from 48to 531 m. Dyke locations coincide with surface alterationhaloes (1) and (2) as indicated by the ETM band ratioimage processing. The final assessment of the area,however, needs more detailed geological and geophysicalstudies with contributions of remote sensing techniques.
Keywords Mineralization . Copper . Sulfides . LandsatETM band ratio . Gravity magnetic anomaly
Introduction
Copper deposits are known in several areas in differentgeological environments in Sinai. Significant localitiesincluding Cu mineralization are: Wadis Samra, El Regeita,Rahaba, Bat’hat Um Rabei, Suweira, Abu El-Nimran, andFeiran. These deposits are epigenetic and structurallycontrolled (veins-like and fissure fillings) hosted in variousbasement igneous and metamorphic rocks, such as schist,granodiorite, granite, pegmatite, and quartz (Niazy et al.1995). Hume (1906) reported copper occurrences in thesoutheastern part of Sinai at Wadi Nasb. Lucas (1927)noticed that the site of extensive copper production inPharaonic times was in Palaeozoic sediments of westcentral Sinai. Since the 1950s, several studies on copperdeposits of Sinai were published (Abdel-Nasser and Chukri1958; Moustafa and Hilmy 1959; El-Shazly 1957, 1959;Said 1962; Hilmy and Mohsen 1965, 1966; Sheta 1969;Moharram et al. 1970; Hussein 1990, etc). Abdel-Nasserand Chukri (1958) reports extremely brief descriptions of
S. M. Salem : T. M. Ramadan : E. S. A. El GammalNational Authority of Remote Sensingand Space Sciences (NARSS),23 Jospeph Tito, Nozha El-Gedida,Cairo, Egypt
S. M. Saleme-mail: [email protected]
T. M. Ramadane-mail: [email protected]
E. S. A. El Gammale-mail: [email protected]
S. A. Arafa (*)National Research Institute for Astronomy and Geophysics,11722, Helwan,Cairo, Egypte-mail: [email protected]
Arab J GeosciDOI 10.1007/s12517-011-0346-z
copper localities in Sinai. Sheta (1969) described copperdeposits at Samra locality as malachite, azurite, andchrysocolla fracture infillings. Sulfides are often present inminor amounts; epidote, sericite, kaolinite, and chlorite arethe main associated minerals. Chloritization and coloriza-tion of the wall rocks adjoining copper ores is due to fluid/rock interaction coeval of ore deposition.
The main objectives of geological remote sensingresearches are the development of methods for mappingrock types. Kent and Quinn (1983) applied remote sensingin geology and have been used Landsat satellite images toselect potential areas for copper mineralization in southernSinai. Hydrothermally altered rocks have received consid-erable attention because of their potential economicimplications and favorable spectral characteristics forremote identification (Rowan et al. 2003; Abrams et al.1977, 1983; Goetz et al. 1983; Podwysocki 1983; Kruseet al. 1993; Swayze et al. 1998; Crosta et al. 2003; andGalvao et al. 2005). Niazy et al. (1995) mentioned inmonzogranite rocks, crosscut by andesitic dykes in ElRegeita Cu mine, three types of mineralized alterationzones; argillic, phyllic, and propylitic. The hydrothermalwall rock alterations are accompanied by high concen-trations of Cu, Mo, Sn, Zn, Ni, and other metals. XRDanalyses by the aforementioned authors show that theargillic zone is mainly composed of quartz, plagioclase,kaolinite (dickite), montmorillonite, illite, and gypsum.The phyllic zone is composed of quartz, sericite,hematite, and goethite, with secondary malachite andazurite. The propylitic alteration zone is rich in sulfides,iron oxides, and epidote.
Airborne magnetic geophysical data have been exten-sively used for mineral exploration, particularly in areaswith thick alteration zones. Reeves et al. (1990) distin-guished the typical features used to interpret and definegeological units from magnetic contour data. The magneticrelief shows if the field is rather featureless with a smooth“relief” or rugged and varying or changing quickly fromone local anomaly to another. Sharp gradients forminglinear boundaries between areas of different magneticlevels, and disruption and/or deflections of magnetictrends, can be used to trace boundaries between rockunits. Ramadan and Sultan (2004) used the integratedgeological, geophysical, and remote sensing interpretationfor detecting the sulfide bearing-zones at Wadi Al Allaqi,Eastern Desert Egypt.
Wadi El Regeita area lies at the northeastern side ofGabal Katherina in Southern Sinai (Egypt), located betweenlatitudes 28° 32′ and 28° 45′ N and longitudes 34° 00′ and34° 15′E (Fig. 1a). Copper mineralization in Wadi ElRegeita area occurs within hydrothermal alteration haloeshosted in andesite dykes that crosscut monzograniterocks. The aim of this paper is to identify new potential
Cu occurrences in Wadi El Regita area near the El RegitaCu mine, thus promoting the design of future mineralexploration surveys. Therefore, special attention wasdedicated to areas of relatively high magnetism to detecthidden andesitic dykes potentially bearing Cu-sulfidemineralization.
Data used and methodology
The present study is based on the integration of remote-sensing techniques and geophysical data (gravity andmagnetic), as well as geological field verification, foridentifying sulfide copper mineralization and sampling forwhole-rock analysis for Cu exploration in the Wadi ElRegeita area.
Remote sensing techniques
The use of satellite images for mineral exploration has beenvery successful in pointing out the presence of mineralssuch as alunite, pyrophyllite, kaolinite, sericite, illite,muscovite, smectite, and carbonate which are important inthe identification of hydrothermal alterations. Dehghani etal. (2004) separated a few hydrothermal alterations in theKhoy-Oshnavia district in northwestern Iran; Moghtaderi etal. (2007) separated some alkali metasomatose in theChadourmalou district in the vicinity of iron ore deposits;and Babaei (2006), Babaei and Azizi (2007), and Azizi etal. (2007) distinguished three propylitic, phyllic, andargillic alteration zones in northwestern Iran in theKurdistan region. A recent study by Azizi et al. (2009)showed the magnetite–apatite deposits in the near of study(Morvarid area) is not related to magma immiscibility butgenerated in hydrothermal evidence between 220 and420°C. Also, new geodynamic models which have beenproposed by Azizi and Jahangiri (2008) and Azizi andMoinevaziri (2009) infer the granitic and volcanic rocks inthe north and northwest of Iran are completely related tothe subduction zone in difference time. As usual, thesubduction zone is a special zone for gold–copper andiron, and skarn deposits.
For the present study, a Landsat Landsat EnhancedThematic Mapper (ETM) image (Path 175/Row 40)covering the study area was acquired on July 1999,radiometrically calibrated, geometrically corrected, andUniversal Transverse Mercator georeferenced. ETMLandsat data was processed by using the ERDAS imagine8.7 software on a Sunspark workstation at the NARSS’sImage Processing Lab. Three ETM bands have beenselected (bands 7, 4, 2 in R, G, B) because they containmost of the information about the geological features of
Arab J Geosci
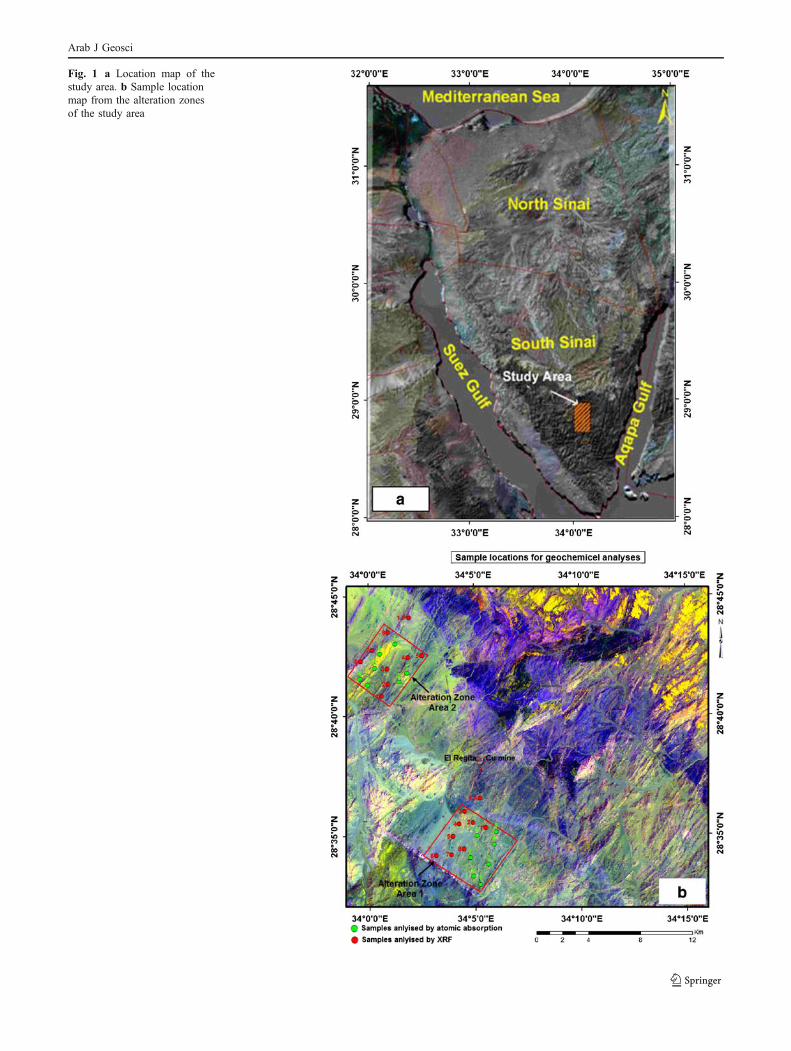
Fig. 1 a Location map of thestudy area. b Sample locationmap from the alteration zonesof the study area
Arab J Geosci
interest to this study. A false color composite image(bands 7, 4, 2), band ratios (7/5, 5/4, 3/1) in Red GreenBlue (RGB) color and Principal Component PC analysis(PC4, PC3, PC1) for the study area were used.
Geophysical methods
One hundred gravity stations were selected to cover WadiEl Regeita area and measured using a Lacoste & Romberginstrument with an accuracy 0.01 mGal. The gravitymeasurements were corrected to drift, latitude, tide, free-air, and topography. The corrected gravity values wereplotted, contoured, and processed to prepare a Bougueranomaly map with a 0.01 mGal contour interval.Moreover, 100 ground magnetic stations were measuredin the same locations of the gravity stations using twoproton magnetometers of 1 nT accuracy. The fieldmeasurements of the total intensity of the magnetic fieldwere carried out with an Envimag Magnetometer (ModelScintrex) of 1 nT sensitivity in the same locations of thegravity stations. The magnetic data were corrected todiurnal variation and IGRF. The corrected data werestored in a computer to carry out the gridding and contouringprocesses by Geosoft programs (Oasis Montaj 2007) toproduce a total intensity magnetic map.
Geological field verification and geochemical sampling
The hydrothermal alteration haloes (1) and (2) put inevidence by ETM band ratio image processing wereconfirmed in the field. Representative samples werecollected in order to obtain the main whole-rockgeochemical features; sample locations are shown in aprocessed ratio image bands (5/3, 5/1, 7/5; Fig. 1b). Theatomic absorption analysis using system (Model GBC-908) was carried out for seven selected samples of theargillic alteration halo (1) affecting the monzograniterock, as well as for seven samples of the propyliticalteration halo (2) affecting andesites. In addition, X-rayfluorescence (XRF) analyses for major oxides and traceelements by means of wet chemical techniques (Shapiroand Brannock 1962) for major oxides and X-ray fluores-cence (Phillips PW 1410 together with a MO-target tubeoperated at 50 kv and 30 mA) for trace elements wereperformed in eight samples from altered monzogranite ofhalo (1) normalized to the unaltered host monzograniterock, as well as for seven samples of altered andesites ofhalo (2) normalized to the fresh (unaltered andesitedykes). These analyses were carried out for copperexploration in the laboratories of Nuclear MaterialAuthority of Egypt.
Results and interpretations
Remote sensing
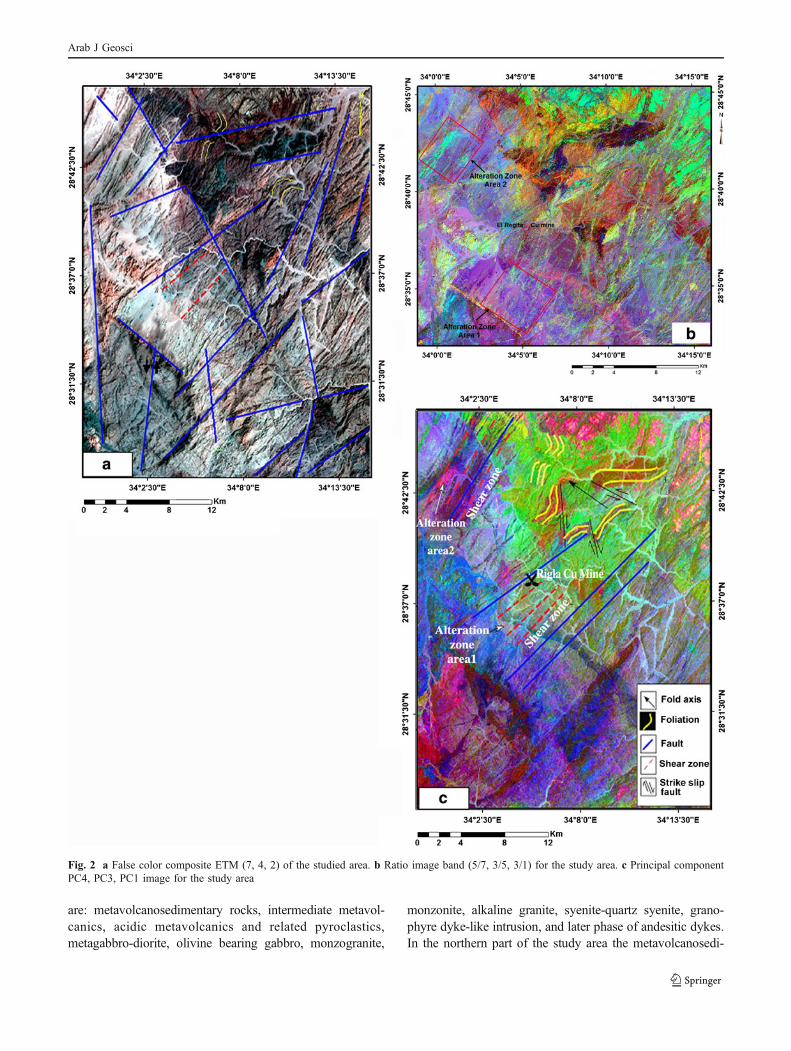
The false color composite image (bands 7, 4, 2 in RGB)was interpreted and provided an excellent base map,showing differences that reflect the prevailing geologicalfeatures, namely lineament/structural arrangements andcontrasts between plutonic and volcanic rocks. In falsecolor, the plutonic rocks appear as pale brown, themetavolcanics as dark greenish brown to dark brown, whilethe andesitic dykes as pale bluish brown to pale browncolor; this false color image also illustrates a generallineament trend in NE–SW direction (Fig. 2a). Therationing images bands were used for lithological discrim-ination; moreover, they helped in delimiting disturbedzones, potentially corresponding to hydrothermal alterationhaloes that may comprise copper mineralization. Resultsfrom ratio image bands (7/5, 5/4, 3/1) in RGB furthervalidated during geological field surveys, discriminatedbetween the different rock units and delineated twomineralized alteration zones. In this ratio image (7/5, 5/4,3/1), the monzogranite rocks appear in purple color, themetavolcanosedimentry rocks displayed in an interfer-ence colors from violet dark brown and greenish yellowto green color, intermediate to acidic metavolcanics asbluish reddish brown, olivine gabbro as red, gabbrodior-ite rocks in rose color, sedimentary rocks of ArabaFormation as pale green, and the alteration zonesappeared as violet and turquaz color. These alterationzones are far away from El Regeita copper mine by 4 kmsouth and 8 km northwest, covering about 25 and20 km2, respectively. They are illustrated on the ratioimage as area (1) and area (2) (Fig. 2b). Enhancedprincipal component images are suitable for structuralinterpretations, as the recognition of the pre-existing foldsof the metavolcanics in the north of the study area anddisplaying the later fault zones affected the monzogranitesthat control the localization of copper deposits in the studyarea. This image produced by principal componentanalysis (PC4, PC3, and PC1) and highlights the presenceof major NE–SW trending lineaments in addition to someNW–SE trending structural features as folding and faulting(Fig. 2c).
Geological setting
A new geological map for the study area (Fig. 3) wasproduced on the basis of field observation and remotesensing analysis. Many rock varieties of either volcanicsand plutonic intrusions emplaced in an intrusive relation-ships in the study area, starting from oldest to youngest they
Arab J Geosci
are: metavolcanosedimentary rocks, intermediate metavol-canics, acidic metavolcanics and related pyroclastics,metagabbro-diorite, olivine bearing gabbro, monzogranite,
monzonite, alkaline granite, syenite-quartz syenite, grano-phyre dyke-like intrusion, and later phase of andesitic dykes.In the northern part of the study area the metavolcanosedi-
Fig. 2 a False color composite ETM (7, 4, 2) of the studied area. b Ratio image band (5/7, 3/5, 3/1) for the study area. c Principal componentPC4, PC3, PC1 image for the study area
Arab J Geosci
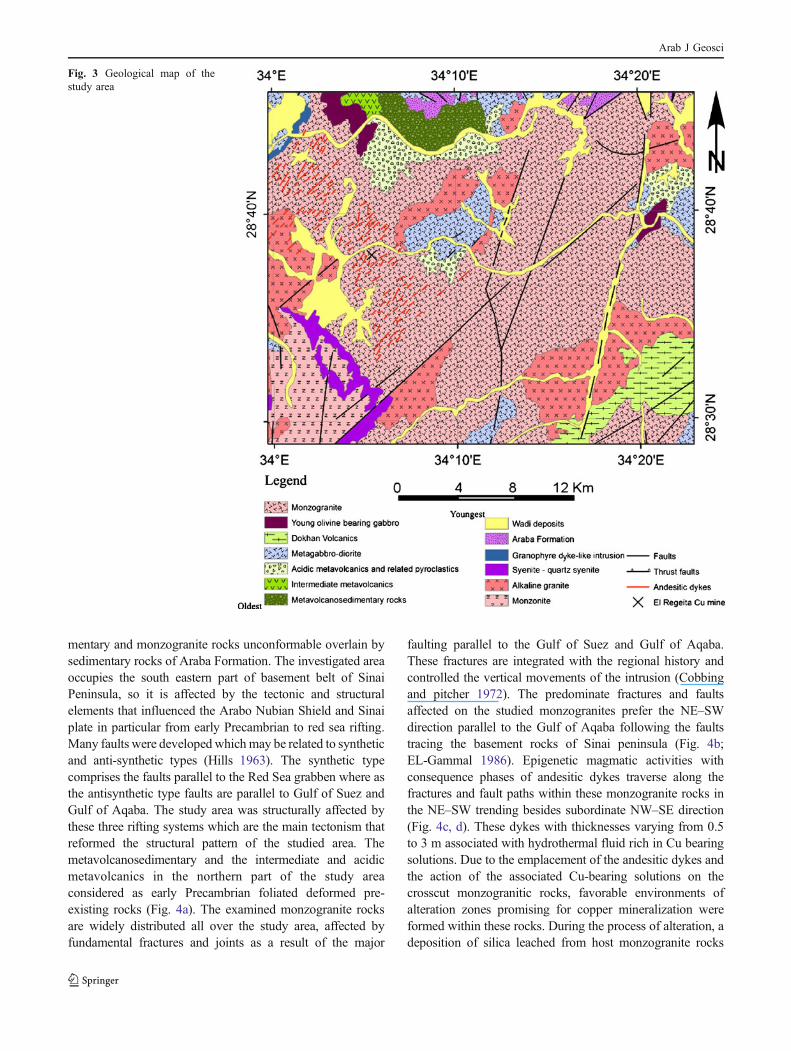
mentary and monzogranite rocks unconformable overlain bysedimentary rocks of Araba Formation. The investigated areaoccupies the south eastern part of basement belt of SinaiPeninsula, so it is affected by the tectonic and structuralelements that influenced the Arabo Nubian Shield and Sinaiplate in particular from early Precambrian to red sea rifting.Many faults were developedwhichmay be related to syntheticand anti-synthetic types (Hills 1963). The synthetic typecomprises the faults parallel to the Red Sea grabben where asthe antisynthetic type faults are parallel to Gulf of Suez andGulf of Aqaba. The study area was structurally affected bythese three rifting systems which are the main tectonism thatreformed the structural pattern of the studied area. Themetavolcanosedimentary and the intermediate and acidicmetavolcanics in the northern part of the study areaconsidered as early Precambrian foliated deformed pre-existing rocks (Fig. 4a). The examined monzogranite rocksare widely distributed all over the study area, affected byfundamental fractures and joints as a result of the major
faulting parallel to the Gulf of Suez and Gulf of Aqaba.These fractures are integrated with the regional history andcontrolled the vertical movements of the intrusion (Cobbingand pitcher 1972). The predominate fractures and faultsaffected on the studied monzogranites prefer the NE–SWdirection parallel to the Gulf of Aqaba following the faultstracing the basement rocks of Sinai peninsula (Fig. 4b;EL-Gammal 1986). Epigenetic magmatic activities withconsequence phases of andesitic dykes traverse along thefractures and fault paths within these monzogranite rocks inthe NE–SW trending besides subordinate NW–SE direction(Fig. 4c, d). These dykes with thicknesses varying from 0.5to 3 m associated with hydrothermal fluid rich in Cu bearingsolutions. Due to the emplacement of the andesitic dykes andthe action of the associated Cu-bearing solutions on thecrosscut monzogranitic rocks, favorable environments ofalteration zones promising for copper mineralization wereformed within these rocks. During the process of alteration, adeposition of silica leached from host monzogranite rocks
Fig. 3 Geological map of thestudy area
Arab J Geosci
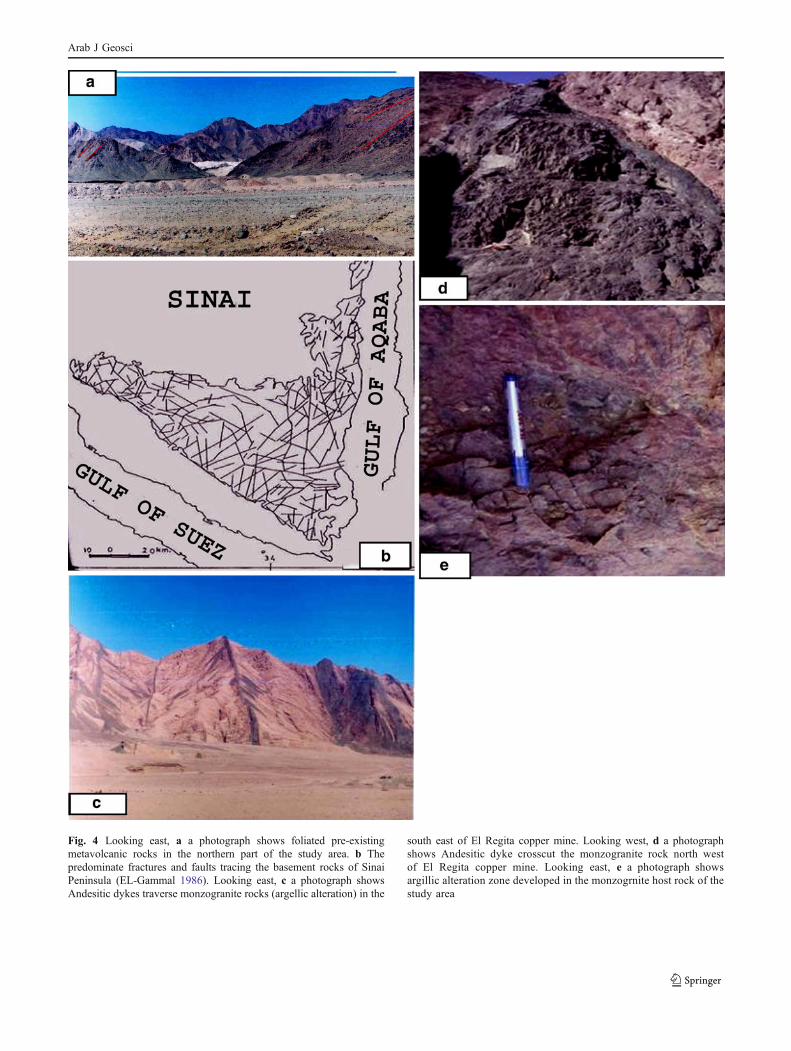
Fig. 4 Looking east, a a photograph shows foliated pre-existingmetavolcanic rocks in the northern part of the study area. b Thepredominate fractures and faults tracing the basement rocks of SinaiPeninsula (EL-Gammal 1986). Looking east, c a photograph showsAndesitic dykes traverse monzogranite rocks (argellic alteration) in the
south east of El Regita copper mine. Looking west, d a photographshows Andesitic dyke crosscut the monzogranite rock north westof El Regita copper mine. Looking east, e a photograph showsargillic alteration zone developed in the monzogrnite host rock of thestudy area
Arab J Geosci
resulted in forming quartz stockworks confined to themineralized andesitic dykes.
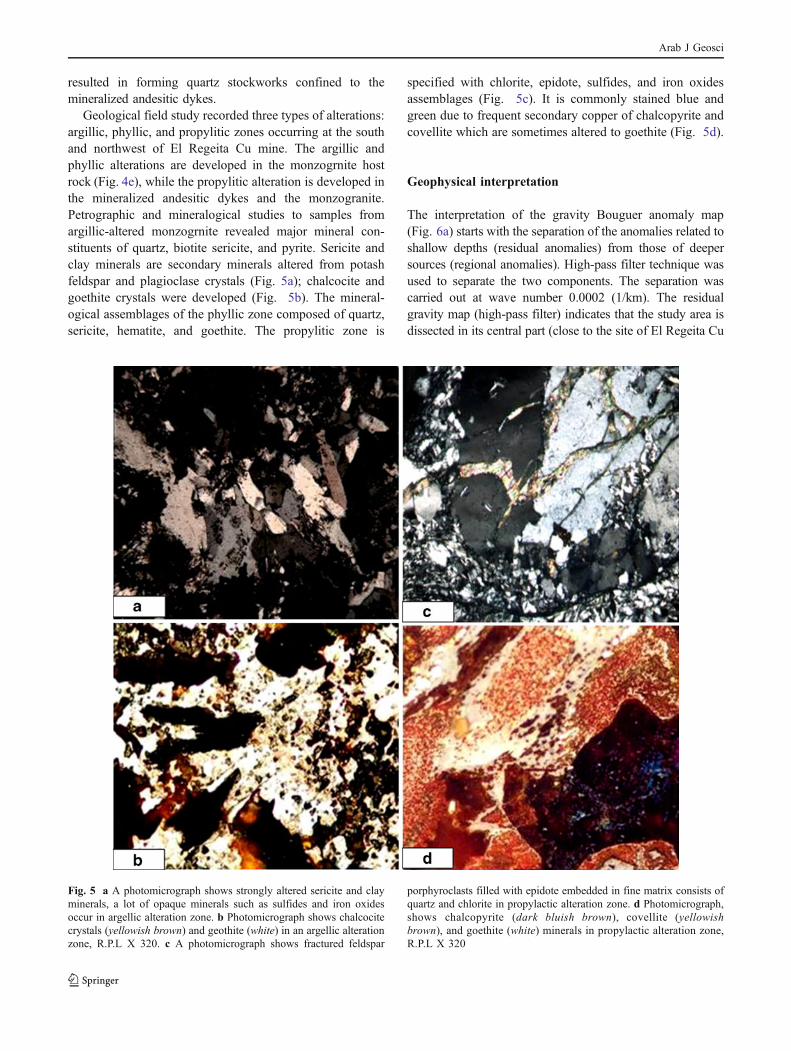
Geological field study recorded three types of alterations:argillic, phyllic, and propylitic zones occurring at the southand northwest of El Regeita Cu mine. The argillic andphyllic alterations are developed in the monzogrnite hostrock (Fig. 4e), while the propylitic alteration is developed inthe mineralized andesitic dykes and the monzogranite.Petrographic and mineralogical studies to samples fromargillic-altered monzogrnite revealed major mineral con-stituents of quartz, biotite sericite, and pyrite. Sericite andclay minerals are secondary minerals altered from potashfeldspar and plagioclase crystals (Fig. 5a); chalcocite andgoethite crystals were developed (Fig. 5b). The mineral-ogical assemblages of the phyllic zone composed of quartz,sericite, hematite, and goethite. The propylitic zone is
specified with chlorite, epidote, sulfides, and iron oxidesassemblages (Fig. 5c). It is commonly stained blue andgreen due to frequent secondary copper of chalcopyrite andcovellite which are sometimes altered to goethite (Fig. 5d).
Geophysical interpretation
The interpretation of the gravity Bouguer anomaly map(Fig. 6a) starts with the separation of the anomalies related toshallow depths (residual anomalies) from those of deepersources (regional anomalies). High-pass filter technique wasused to separate the two components. The separation wascarried out at wave number 0.0002 (1/km). The residualgravity map (high-pass filter) indicates that the study area isdissected in its central part (close to the site of El Regeita Cu
Fig. 5 a A photomicrograph shows strongly altered sericite and clayminerals, a lot of opaque minerals such as sulfides and iron oxidesoccur in argellic alteration zone. b Photomicrograph shows chalcocitecrystals (yellowish brown) and geothite (white) in an argellic alterationzone, R.P.L X 320. c A photomicrograph shows fractured feldspar
porphyroclasts filled with epidote embedded in fine matrix consists ofquartz and chlorite in propylactic alteration zone. d Photomicrograph,shows chalcopyrite (dark bluish brown), covellite (yellowishbrown), and goethite (white) minerals in propylactic alteration zone,R.P.L X 320
Arab J Geosci
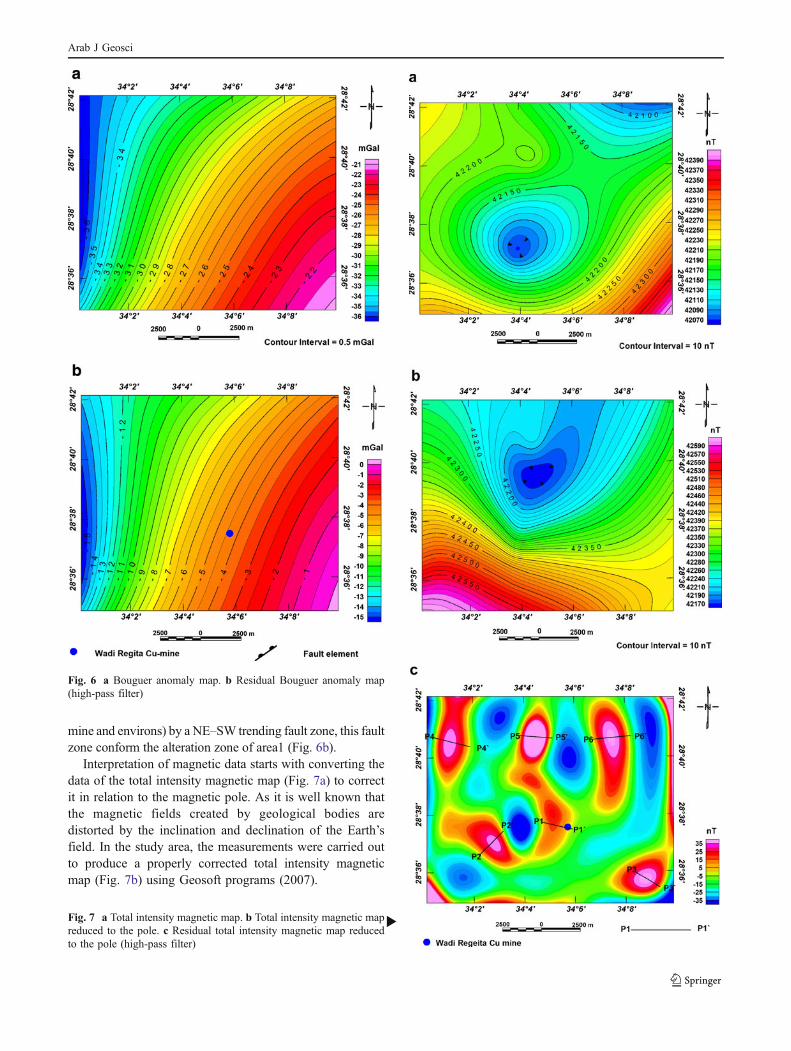
mine and environs) by a NE–SW trending fault zone, this faultzone conform the alteration zone of area1 (Fig. 6b).
Interpretation of magnetic data starts with converting thedata of the total intensity magnetic map (Fig. 7a) to correctit in relation to the magnetic pole. As it is well known thatthe magnetic fields created by geological bodies aredistorted by the inclination and declination of the Earth’sfield. In the study area, the measurements were carried outto produce a properly corrected total intensity magneticmap (Fig. 7b) using Geosoft programs (2007).
Fig. 6 a Bouguer anomaly map. b Residual Bouguer anomaly map(high-pass filter)
bFig. 7 a Total intensity magnetic map. b Total intensity magnetic mapreduced to the pole. c Residual total intensity magnetic map reducedto the pole (high-pass filter)
Arab J Geosci
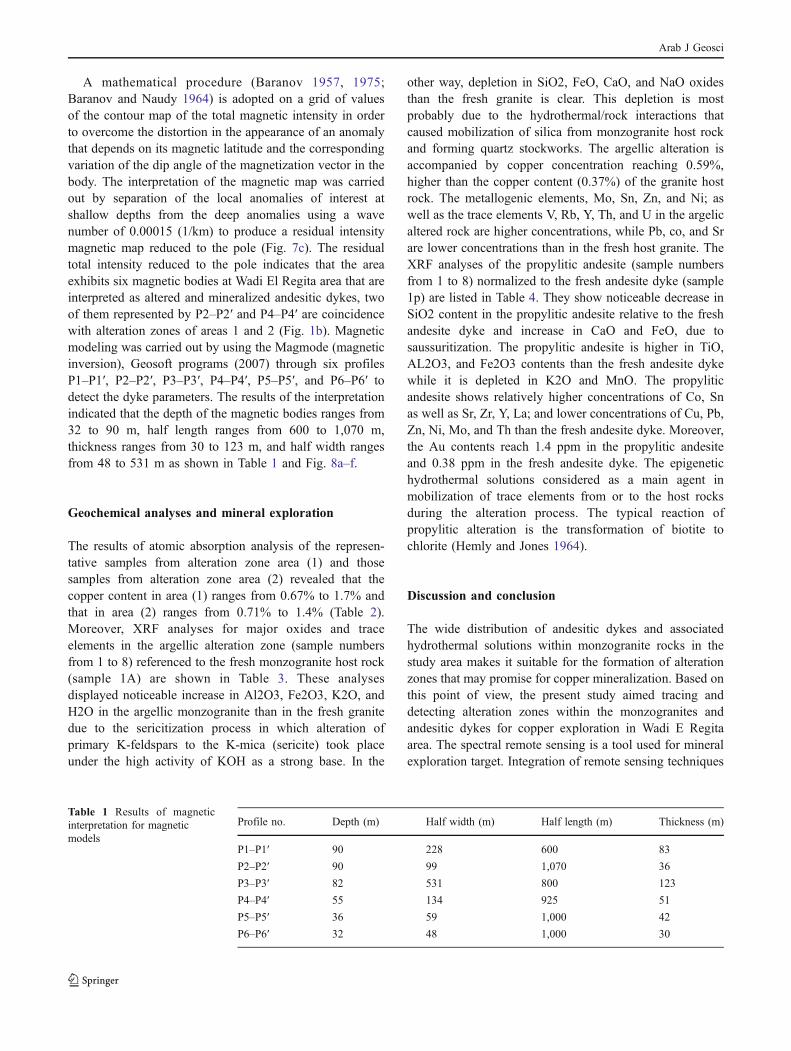
A mathematical procedure (Baranov 1957, 1975;Baranov and Naudy 1964) is adopted on a grid of valuesof the contour map of the total magnetic intensity in orderto overcome the distortion in the appearance of an anomalythat depends on its magnetic latitude and the correspondingvariation of the dip angle of the magnetization vector in thebody. The interpretation of the magnetic map was carriedout by separation of the local anomalies of interest atshallow depths from the deep anomalies using a wavenumber of 0.00015 (1/km) to produce a residual intensitymagnetic map reduced to the pole (Fig. 7c). The residualtotal intensity reduced to the pole indicates that the areaexhibits six magnetic bodies at Wadi El Regita area that areinterpreted as altered and mineralized andesitic dykes, twoof them represented by P2–P2′ and P4–P4′ are coincidencewith alteration zones of areas 1 and 2 (Fig. 1b). Magneticmodeling was carried out by using the Magmode (magneticinversion), Geosoft programs (2007) through six profilesP1–P1′, P2–P2′, P3–P3′, P4–P4′, P5–P5′, and P6–P6′ todetect the dyke parameters. The results of the interpretationindicated that the depth of the magnetic bodies ranges from32 to 90 m, half length ranges from 600 to 1,070 m,thickness ranges from 30 to 123 m, and half width rangesfrom 48 to 531 m as shown in Table 1 and Fig. 8a–f.
Geochemical analyses and mineral exploration
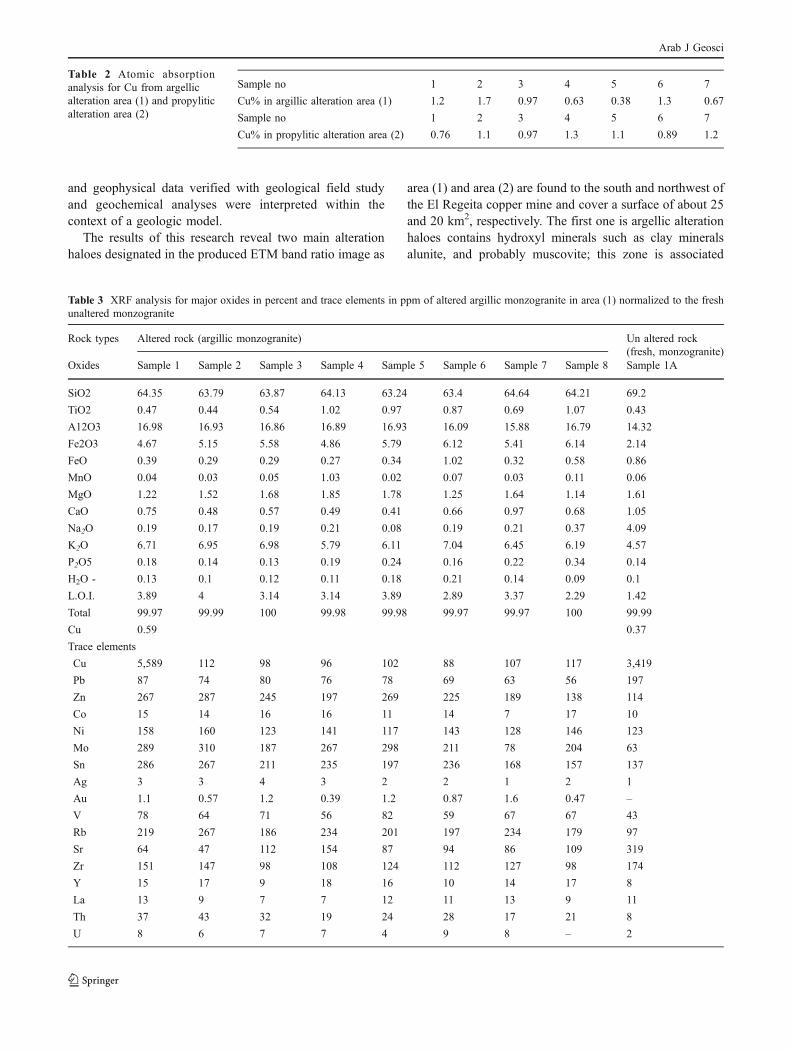
The results of atomic absorption analysis of the represen-tative samples from alteration zone area (1) and thosesamples from alteration zone area (2) revealed that thecopper content in area (1) ranges from 0.67% to 1.7% andthat in area (2) ranges from 0.71% to 1.4% (Table 2).Moreover, XRF analyses for major oxides and traceelements in the argellic alteration zone (sample numbersfrom 1 to 8) referenced to the fresh monzogranite host rock(sample 1A) are shown in Table 3. These analysesdisplayed noticeable increase in Al2O3, Fe2O3, K2O, andH2O in the argellic monzogranite than in the fresh granitedue to the sericitization process in which alteration ofprimary K-feldspars to the K-mica (sericite) took placeunder the high activity of KOH as a strong base. In the
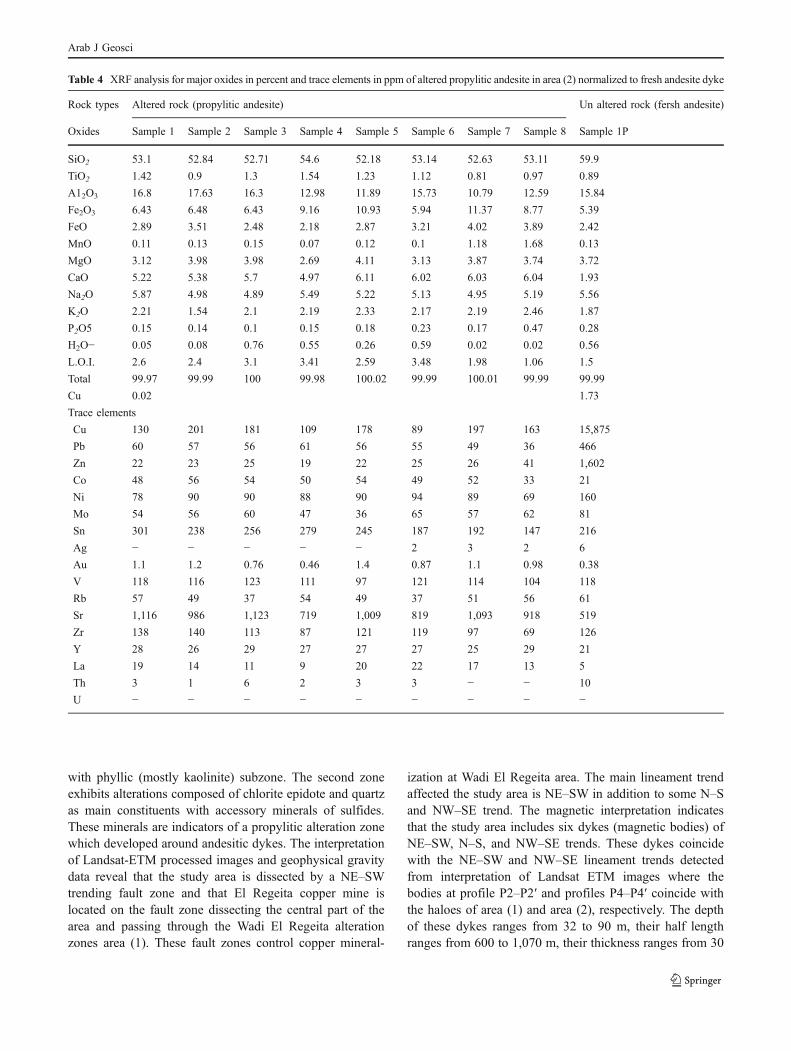
other way, depletion in SiO2, FeO, CaO, and NaO oxidesthan the fresh granite is clear. This depletion is mostprobably due to the hydrothermal/rock interactions thatcaused mobilization of silica from monzogranite host rockand forming quartz stockworks. The argellic alteration isaccompanied by copper concentration reaching 0.59%,higher than the copper content (0.37%) of the granite hostrock. The metallogenic elements, Mo, Sn, Zn, and Ni; aswell as the trace elements V, Rb, Y, Th, and U in the argelicaltered rock are higher concentrations, while Pb, co, and Srare lower concentrations than in the fresh host granite. TheXRF analyses of the propylitic andesite (sample numbersfrom 1 to 8) normalized to the fresh andesite dyke (sample1p) are listed in Table 4. They show noticeable decrease inSiO2 content in the propylitic andesite relative to the freshandesite dyke and increase in CaO and FeO, due tosaussuritization. The propylitic andesite is higher in TiO,AL2O3, and Fe2O3 contents than the fresh andesite dykewhile it is depleted in K2O and MnO. The propyliticandesite shows relatively higher concentrations of Co, Snas well as Sr, Zr, Y, La; and lower concentrations of Cu, Pb,Zn, Ni, Mo, and Th than the fresh andesite dyke. Moreover,the Au contents reach 1.4 ppm in the propylitic andesiteand 0.38 ppm in the fresh andesite dyke. The epigenetichydrothermal solutions considered as a main agent inmobilization of trace elements from or to the host rocksduring the alteration process. The typical reaction ofpropylitic alteration is the transformation of biotite tochlorite (Hemly and Jones 1964).
Discussion and conclusion
The wide distribution of andesitic dykes and associatedhydrothermal solutions within monzogranite rocks in thestudy area makes it suitable for the formation of alterationzones that may promise for copper mineralization. Based onthis point of view, the present study aimed tracing anddetecting alteration zones within the monzogranites andandesitic dykes for copper exploration in Wadi E Regitaarea. The spectral remote sensing is a tool used for mineralexploration target. Integration of remote sensing techniques
Profile no. Depth (m) Half width (m) Half length (m) Thickness (m)
P1–P1′ 90 228 600 83
P2–P2′ 90 99 1,070 36
P3–P3′ 82 531 800 123
P4–P4′ 55 134 925 51
P5–P5′ 36 59 1,000 42
P6–P6′ 32 48 1,000 30
Table 1 Results of magneticinterpretation for magneticmodels
Arab J Geosci
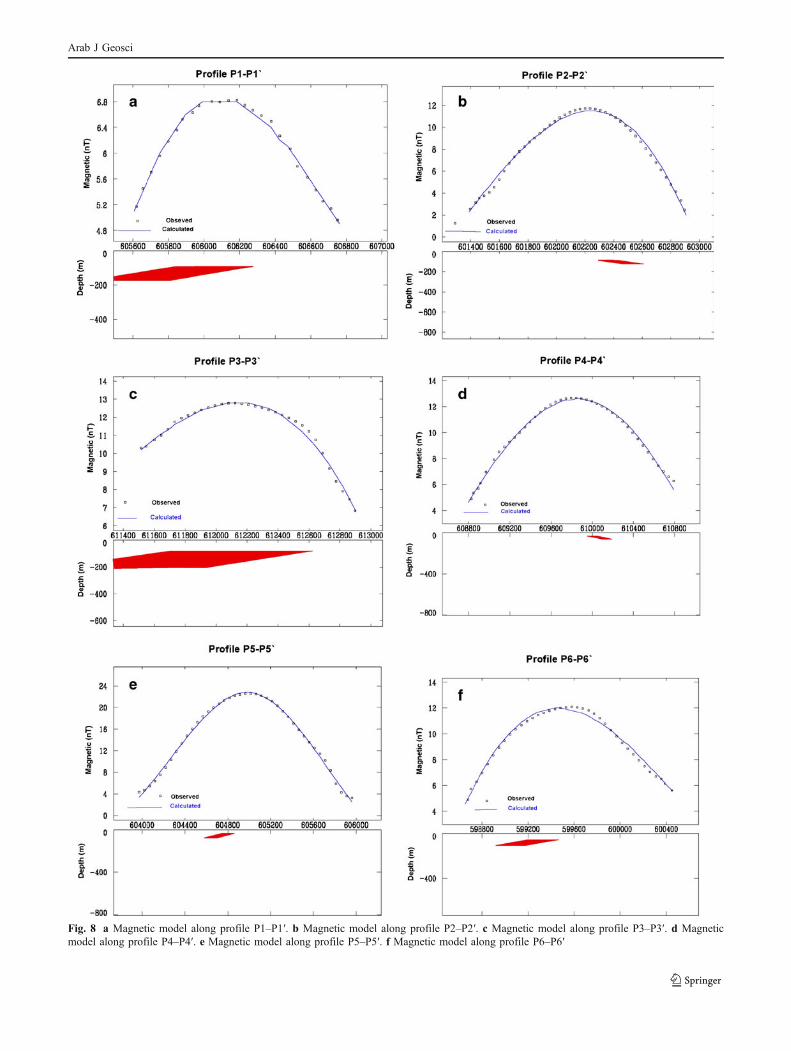
Fig. 8 a Magnetic model along profile P1–P1′. b Magnetic model along profile P2–P2′. c Magnetic model along profile P3–P3′. d Magneticmodel along profile P4–P4′. e Magnetic model along profile P5–P5′. f Magnetic model along profile P6–P6′
Arab J Geosci
and geophysical data verified with geological field studyand geochemical analyses were interpreted within thecontext of a geologic model.
The results of this research reveal two main alterationhaloes designated in the produced ETM band ratio image as
area (1) and area (2) are found to the south and northwest ofthe El Regeita copper mine and cover a surface of about 25and 20 km2, respectively. The first one is argellic alterationhaloes contains hydroxyl minerals such as clay mineralsalunite, and probably muscovite; this zone is associated
Sample no 1 2 3 4 5 6 7
Cu% in argillic alteration area (1) 1.2 1.7 0.97 0.63 0.38 1.3 0.67
Sample no 1 2 3 4 5 6 7
Cu% in propylitic alteration area (2) 0.76 1.1 0.97 1.3 1.1 0.89 1.2
Table 2 Atomic absorptionanalysis for Cu from argellicalteration area (1) and propyliticalteration area (2)
Table 3 XRF analysis for major oxides in percent and trace elements in ppm of altered argillic monzogranite in area (1) normalized to the freshunaltered monzogranite
Rock types Altered rock (argillic monzogranite) Un altered rock(fresh, monzogranite)
Oxides Sample 1 Sample 2 Sample 3 Sample 4 Sample 5 Sample 6 Sample 7 Sample 8 Sample 1A
SiO2 64.35 63.79 63.87 64.13 63.24 63.4 64.64 64.21 69.2
TiO2 0.47 0.44 0.54 1.02 0.97 0.87 0.69 1.07 0.43
A12O3 16.98 16.93 16.86 16.89 16.93 16.09 15.88 16.79 14.32
Fe2O3 4.67 5.15 5.58 4.86 5.79 6.12 5.41 6.14 2.14
FeO 0.39 0.29 0.29 0.27 0.34 1.02 0.32 0.58 0.86
MnO 0.04 0.03 0.05 1.03 0.02 0.07 0.03 0.11 0.06
MgO 1.22 1.52 1.68 1.85 1.78 1.25 1.64 1.14 1.61
CaO 0.75 0.48 0.57 0.49 0.41 0.66 0.97 0.68 1.05
Na2O 0.19 0.17 0.19 0.21 0.08 0.19 0.21 0.37 4.09
K2O 6.71 6.95 6.98 5.79 6.11 7.04 6.45 6.19 4.57
P2O5 0.18 0.14 0.13 0.19 0.24 0.16 0.22 0.34 0.14
H2O - 0.13 0.1 0.12 0.11 0.18 0.21 0.14 0.09 0.1
L.O.I. 3.89 4 3.14 3.14 3.89 2.89 3.37 2.29 1.42
Total 99.97 99.99 100 99.98 99.98 99.97 99.97 100 99.99
Cu 0.59 0.37
Trace elements
Cu 5,589 112 98 96 102 88 107 117 3,419
Pb 87 74 80 76 78 69 63 56 197
Zn 267 287 245 197 269 225 189 138 114
Co 15 14 16 16 11 14 7 17 10
Ni 158 160 123 141 117 143 128 146 123
Mo 289 310 187 267 298 211 78 204 63
Sn 286 267 211 235 197 236 168 157 137
Ag 3 3 4 3 2 2 1 2 1
Au 1.1 0.57 1.2 0.39 1.2 0.87 1.6 0.47 –
V 78 64 71 56 82 59 67 67 43
Rb 219 267 186 234 201 197 234 179 97
Sr 64 47 112 154 87 94 86 109 319
Zr 151 147 98 108 124 112 127 98 174
Y 15 17 9 18 16 10 14 17 8
La 13 9 7 7 12 11 13 9 11
Th 37 43 32 19 24 28 17 21 8
U 8 6 7 7 4 9 8 – 2
Arab J Geosci
with phyllic (mostly kaolinite) subzone. The second zoneexhibits alterations composed of chlorite epidote and quartzas main constituents with accessory minerals of sulfides.These minerals are indicators of a propylitic alteration zonewhich developed around andesitic dykes. The interpretationof Landsat-ETM processed images and geophysical gravitydata reveal that the study area is dissected by a NE–SWtrending fault zone and that El Regeita copper mine islocated on the fault zone dissecting the central part of thearea and passing through the Wadi El Regeita alterationzones area (1). These fault zones control copper mineral-
ization at Wadi El Regeita area. The main lineament trendaffected the study area is NE–SW in addition to some N–Sand NW–SE trend. The magnetic interpretation indicatesthat the study area includes six dykes (magnetic bodies) ofNE–SW, N–S, and NW–SE trends. These dykes coincidewith the NE–SW and NW–SE lineament trends detectedfrom interpretation of Landsat ETM images where thebodies at profile P2–P2′ and profiles P4–P4′ coincide withthe haloes of area (1) and area (2), respectively. The depthof these dykes ranges from 32 to 90 m, their half lengthranges from 600 to 1,070 m, their thickness ranges from 30
Table 4 XRF analysis for major oxides in percent and trace elements in ppm of altered propylitic andesite in area (2) normalized to fresh andesite dyke
Rock types Altered rock (propylitic andesite) Un altered rock (fersh andesite)
Oxides Sample 1 Sample 2 Sample 3 Sample 4 Sample 5 Sample 6 Sample 7 Sample 8 Sample 1P
SiO2 53.1 52.84 52.71 54.6 52.18 53.14 52.63 53.11 59.9
TiO2 1.42 0.9 1.3 1.54 1.23 1.12 0.81 0.97 0.89
A12O3 16.8 17.63 16.3 12.98 11.89 15.73 10.79 12.59 15.84
Fe2O3 6.43 6.48 6.43 9.16 10.93 5.94 11.37 8.77 5.39
FeO 2.89 3.51 2.48 2.18 2.87 3.21 4.02 3.89 2.42
MnO 0.11 0.13 0.15 0.07 0.12 0.1 1.18 1.68 0.13
MgO 3.12 3.98 3.98 2.69 4.11 3.13 3.87 3.74 3.72
CaO 5.22 5.38 5.7 4.97 6.11 6.02 6.03 6.04 1.93
Na2O 5.87 4.98 4.89 5.49 5.22 5.13 4.95 5.19 5.56
K2O 2.21 1.54 2.1 2.19 2.33 2.17 2.19 2.46 1.87
P2O5 0.15 0.14 0.1 0.15 0.18 0.23 0.17 0.47 0.28
H2O− 0.05 0.08 0.76 0.55 0.26 0.59 0.02 0.02 0.56
L.O.I. 2.6 2.4 3.1 3.41 2.59 3.48 1.98 1.06 1.5
Total 99.97 99.99 100 99.98 100.02 99.99 100.01 99.99 99.99
Cu 0.02 1.73
Trace elements
Cu 130 201 181 109 178 89 197 163 15,875
Pb 60 57 56 61 56 55 49 36 466
Zn 22 23 25 19 22 25 26 41 1,602
Co 48 56 54 50 54 49 52 33 21
Ni 78 90 90 88 90 94 89 69 160
Mo 54 56 60 47 36 65 57 62 81
Sn 301 238 256 279 245 187 192 147 216
Ag − − − − − 2 3 2 6
Au 1.1 1.2 0.76 0.46 1.4 0.87 1.1 0.98 0.38
V 118 116 123 111 97 121 114 104 118
Rb 57 49 37 54 49 37 51 56 61
Sr 1,116 986 1,123 719 1,009 819 1,093 918 519
Zr 138 140 113 87 121 119 97 69 126
Y 28 26 29 27 27 27 25 29 21
La 19 14 11 9 20 22 17 13 5
Th 3 1 6 2 3 3 − − 10
U − − − − − − − − −
Arab J Geosci
to 123 m, and their half width ranges from 48 to 531 m.These alteration zones are surface extensions of dykesdetected by interpretation of magnetic data. Geologicalstudies and geochemical analyses confirm the existence ofthese alteration zones, which include suitable economiccopper mineralization. The evidence points to deposition ofsulfides–chalcocite, chalcopyrite, and covellite by ascend-ing hydrothermal solutions which also altered the rocksadjacent to the fractures in which Cu deposits occurred.Azurite, malachite, chrysocolla, and other secondary copperminerals resulted from weathering of the deposits.
The authors believe that the study area is a promisinglocation for future copper exploration in this part of SouthSinai. This proposition has been validated by primarygeological and geochemical explorations. It is recommendedthat the information from remote sensing must be integratedwith all other available data such as geological, geophysical,and geochemical for detailed evaluation and assessment forCu and associated elements in Wadi E Regita area.
Acknowledgment The authors would like to thank Prof. Dr IbrahimEl Kassas and Prof Dr Omer Cherif, National Authority for RemoteSensing and Space sciences (NARSS), for their sincere help andvaluable discussions.
References
Abdel-Nasser S, Chukri B (1958) Prospecting and exploration inSouth Sinai, 1953–1954. Geological Survey of Egypt, Cairo,Paper No. 10, 26p.
Abrams MJ, Ashley RP, Rowan LC, Goetz AFH, Khale AB (1977)Mapping of hydrothermal alteration in Cuprite mining district,Nevada, using aircraft scanner images for the spectral region 0.46to 2.34 mm. Geology 5:713–718, Full Text via CrossRef
Abrams RP, Brown D, Leple L, Sadowski R (1983) Remote sensing ofporphyry copper deposits in Southern Arizona. Econ Geol78:591–604, Full Text via CrossRef | View Record in ScopusCited By in Scopus (30)
Azizi H, Rasouli AA, Babaei K (2007) Using SWIR bands fromASTER for discrimination of hydrothermal alternated mineral inthe northwest of Iran (SE Sanadaj city); a key for exploration ofcopper and gold mineralization. Res J Appl Sci 2(6):763–768
Azizi H, Jahangiri A (2008) Cretaceous subduction-related volcanism inthe northern Sanandaj–Sirjan Zone, Iran. J Geodyn 45:178–190,Article PDF (1,574K)ViewRecord in Scopus Cited By in Scopus (3)
Azizi MB, Akbarpour A (2009) Genesis of tertiary magnetite–apatitedeposits, southeast of Zanjan, Iran. Resour Geol 59:330–341, FullText via CrossRef View Record in Scopus Cited By in Scopus (0)
Azizi H, Moinevaziri H (2009) Review of the tectonic setting ofCretaceous to Quaternary volcanism in northwestern Iran. JGeodyn 47:167–179, Article | PDF (2014 K) | View Record inScopus | Cited By in Scopus (1)
Babaei K (2006) The study of ore potential in the NE of KurdistanProvince (Iran), M.Sc. Thesis. Tabriz University, Iran. 110 p.
Babaei K, Azizi H (2007) Discrimination of hydrothermal alteration inKurdistan Province. 25th Geology Symposium, Tehran, Iran
Baranov V (1957) A new method for interpretation of aeromagneticmaps: pseudo-gravimetric anomalies. Geophys 22(2):259–383
Baranov V, Naudy H (1964) Numerical calculation of the formula ofreduction to the magnetic pole. Geophys 29:67–79
Baranov V (1975) Potential fields and their transformation in appliedgeophysics. Geophys Prospect II:203–226
Cobbing EJ, Pitcher WS (1972) The coastal batholith of central Peru.Jurnal of Geol Soci of London 128, 5 Geoexploration Monographs,series 1–6, Gebrüder, Borntraeger, Berlin.
Crosta AP, De Sousa F, Azevedo C, Brodie F (2003) Targeting keyalteration minerals in epithermal deposits in Patagonia,Argentina, usingASTER imagery and principal component analysis.Int J Remote Sens 24:4233–4240, ViewRecord in Scopus | Cited Byin Scopus (9)
Dehghani M, Durocher C, Gingerich J (2004) Alteration extraction usingremote sensing data for mineral exploration. Available from: http://www.sciencedirect.com/science?_ob=RedirectURL&_method=externObjLink&_locator=url&_cdi=5738&_issn=02731177&_originPage=article&_zone=art_page&_plusSign=%2B&_targetURL=http%253A%252F%252Fwww.gisdevelopment.com.
EL-Gammal SA (1986) Geology of the granitoid rocks of the northernwestern part of the basement rocks in Sinaim Egypt. PhD thesis,Department of Geology, Faculty of Science, Al Azhar University.
EL-Shazly EM (1957) Classification of Egypt mineral deposits. EgyptJ Geol 1(No. 1):1–20
El-Shazly EM (1959) Notes on the mining map of Egypt. 20thInternational Geological Congress, Mexico (1956). Associationof African Geological Surveys. pp 423–437
Galvao LS, Filho RA, Vitorello I (2005) Use of ASTER short-waveinfrared bands for the spectral discrimination of hydrothermallyaltered-materials: Central Mexico. Int J Remote Sens 19:1981–2000
Goetz AFH, Rock BN, Rowan LC (1983) Remote sensing forexploration, an overview. Econ Geo 78:573–590, Full Text viaCrossRef | View Record in Scopus | Cited By in Scopus (43)
Hills ES (1963) Elements of structural geology. Methuen and Co.Ltd,London
Hemly JJ, Jones WR (1964) Chemical aspects of hydrothermalalteration with emphasis on hydrogen metasomatism. Econ Geol59:538–569
Hilmy ME, Mohsen LA (1965) Secondary copper minerals from WestCentral Sinai. J Geol U A R 9:1–12
Hilmy ME, Mohsen LA (1966) Geology of some occurrences ofcopper minerals in Sinai. Bulletin of the Faculty of Science. AinShams University, Cairo, pp 11 517–539
Hume WF (1906) The topography and geology of the Peninsula ofSinai (South Eastern Portion). Geological Survey of Egypt,Cairo, 280p
Hussein AA (1990) Mineral deposits. In: Said R (ed) The geology ofEgypt. A.A. Balkema, Rottendam, pp 511–566
Kent DC, Quinn KE (1983) Selection of potential mineral deposits inSouth Western Sinai, Using Landsat Images. Final Report on a NSFContract Remote Sensing Techniques No. INT-8005188, 78 p
Kruse FA, Lefkoff AB, Boardman JW, Heidebrecht KB, Shapiro AT,Barloon PJ, Goetz AFH (1993) The Spectral Image ProcessingSystem (SIPS)—interactive visualization and analysis of imagingspectrometer data. Remote Sens Environ 44:145–163, Abstract |PDF (2875 K) | View Record in Scopus | Cited By in Scopus(438)
Lucas A (1927) Copper in ancient Egypt. J Egypt Archaeology 13:169Moharram O, El-Ramly MF, Amer AF, Gachechilades DZ, Ivanov SS
Editors (1970) Studies on some mineral deposits of Egypt.Geological Survey of Egypt, Cairo, Egypt, 260p
Moghtaderi A, Moore F, Mohammadzadeh A (2007) The application ofadvanced space-borne thermal emission and reflection (ASTER)radiometer data in the detection of alteration in the Chadormalupaleocrater, Bafq region, Central Iran. J Asian Earth Sci 30(2):238–252, Article | PDF (2533 K) | View Record in Scopus | Cited By inScopus (1)
Arab J Geosci
Moustafa GA, Hilmy ME (1959) Contribution to the geology andmineralogy of the Hammash copper deposits, South EasternDesert of Egypt. Geological Survey of Egypt, Cairo, Egypt,report no 5, 16 pp
Niazy EA, Shalaly IM, Abd-Rahmin SH (1995) Wall rock alterationassociated with the copper mineralization of Wadi El-Regita,Southern Sinai, Egypt. Annals of the Geological Survey of EgyptVol. XX (1994–1995); 433–450
Oasis Montaj (2007) Geosoft mapping and processing system.Geosoft Inc, West Toronto
Podwysocki MH, Segal DB, Abrams MJ (1983) Use of multispectralimages for assessment of hydrothermal alteration in the Marysvale,Utah, mining area. Econ Geol 78:675–687, Full Text via CrossRef |View Record in Scopus | Cited By in Scopus (9)
Ramadan TM, Sultan AS (2004) Integration of remote sensing,geological and geophysical data for the identification of massivesulphide zones at Wadi Allaqi area, Middle East. J Ain ShamsUniv Earth Sci Ser 18:165–174
Reeves CV, Zeil PW, Yunaxuan Z (1990) Interpretation of airbornegeophysical surveys: some potential applications of image
processing techniques and Geographic Information System insystematic exploration strategy. ITC journal 4:126–136
Rowan LC, Hook SJ, Arams MJ, Mars JC (2003) Mapping hydro-themally altered rocks at the cuprite Nevada using the advancedspaceborne thermal emission and reflection radiometer (ASTER), anew satellite-imaging system. Econ Geol 98:1019–1027, Full Textvia CrossRef | View Record in Scopus | Cited By in Scopus (28)
Said R (1962) The geology of Egypt. Elsevier Publishing Co.,Amsterdam, 377p
Shapiro L, Brannock WW (1962) Rapid analysis of silicate, carbonateand phosphate rocks. U S Geol Surv Bull 1144-A:56 p
Sheta AI (1969) Geology of Sharm El-Sheikh area with specialreference to Kaolimitic deposits and other deposits. M.Sc. Thesis,Faculty of Science, Ain Shams University, Cairo, Egypt
Swayze GA, Clark RN, Goetz AFH, Livo KE, Sutley SS (1998) Usingimaging spectroscopy to better understand the hydrothermal andtectonic history of the Cuprite mining district, Nevada, In: GreenRO (Ed) Summaries of the Seventh JPL Airborne Earth ScienceWorkshop, vol. 1. Jet Propulsion Laboratory, Pasadena, California.JPL Publication 97, pp. 383–384
Arab J Geosci