geophysical constraints on the hydrogeologic and structural settings of the gulf of suez...
TRANSCRIPT
Geophysical Constraints on the Hydrogeologicand Structural Settings of the Gulf of Suez Rift-RelatedBasins: Case Study from the El Qaa Plain, Sinai, Egypt
Mohamed Ahmed • William Sauck • Mohamed Sultan •
Eugene Yan • Farouk Soliman • Mohamed Rashed
Received: 27 May 2013 / Accepted: 17 October 2013 / Published online: 9 November 2013� Springer Science+Business Media Dordrecht 2013
Abstract Groundwater has been identified as one of the major freshwater sources that
can potentially meet the growing demands of Egypt’s population. Gravity data (from 381
ground gravity stations) were collected, processed, and analyzed together with the avail-
able aeromagnetic (800 line-km) data to investigate the hydrogeologic and structural
settings, areal distribution, geometry, and water storage of the aquifers in El Qaa coastal
plain in the southwest Sinai Peninsula, and to assess their longevity given projected
extraction rates. Findings include (1) complete Bouguer anomaly and total magnetic
intensity maps show two connected sub-basins separated by a narrow saddle with an
average basin length of 43 km and an average width of 12 km; (2) two-dimensional
modeling of both gravity and magnetic data indicates basin fill with a maximum thickness
of 3.5 km; (3) using anomalous residual gravity, the volume of water in storage was
estimated at 40–56 km3; and (4) progressive increases in extraction rates over time will
deplete up to 40 % of the aquifers’ volume in 200–230 years and will cause the water
quality to deteriorate due to seawater intrusion in 45 years. Similar geophysical exploration
campaigns, if conducted over the entire coastal plains of the Red Sea and the Gulfs of Suez
and Aqaba, could assist in the development of sound and sustainable management schemes
for the freshwater resources in these areas. The adopted techniques could pave the way
toward the establishment of sustainable utilization schemes for a much larger suite of
similar aquifers worldwide.
M. Ahmed � W. Sauck � M. Sultan (&)Geosciences Department, Western Michigan University, 1903 W. Michigan Avenue, 1187 Rood Hall,Kalamazoo, MI, USAe-mail: [email protected]
M. Ahmed � F. Soliman � M. RashedGeology Department, Faculty of Science, Suez Canal University, Ismailia, Egypt
E. YanArgonne National Laboratory, Argonne, IL, USA
M. RashedGeophysics Department, Faculty of Earth Sciences, King Abdulaziz University, Jeddah, Saudi Arabia
123
Surv Geophys (2014) 35:415–430DOI 10.1007/s10712-013-9259-6

Keywords Gravity � Aeromagnetic � Sinai Peninsula � Groundwater � Sustainable
utilization
1 Introduction
Access to ‘‘potable’’ freshwater resources is a human right and a basic requirement for
economic development in any society. The characterization and understanding of the
geologic and hydrologic settings of, and the controlling factors affecting, freshwater sys-
tems are gaining increasing importance due to the challenges posed by increasing popu-
lations across the world. Such an understanding provides the foundation for the
development and the preservation of these resources in any region. These challenges are
amplified in arid and semiarid areas in the Middle East. One such area is in the country of
Egypt, a country that is seeking additional freshwater resources to support its increasing
population and is in need of such resources to pursue its plans for modernization and
development. The Nile River has been a vital surface freshwater resource for Egypt’s
population and has been used for the development of its agricultural and industrial sectors.
However, Egypt is currently using its total annual allocation of Nile River water, estimated
at 55 9 109 m3/year.
Given the scarcity of surface freshwater resources in Egypt, and the difficulties and
expenses entailed in channeling Nile River water to regions that are distant from the Nile
River valley, groundwater aquifers remain a viable alternative that could address Egypt’s
growing demands for freshwater resources. Egypt’s economy depends largely on the tourism
industry, which has been growing over the years. Along the Sinai coastlines, new cities,
resorts, and tourism facilities are being constructed to support this important industry
(Fig. 1a). The principal limitation on the development of such facilities is the paucity of
freshwater supplies. The identification and further development of groundwater aquifers in
these areas provide viable and cost-effective alternatives to the construction of desalinization
plants and extensive pipelines to channel freshwater from the distant Nile River valley.
In the Sinai Peninsula, highly productive wells are tapping aquifers that are formed of
fossil, modern, or mixtures of fossil and modern water (e.g., Sultan et al. 2011). These
include Quaternary alluvial, Lower Miocene sandstone, Jurassic to Cretaceous Nubian
sandstone, and Precambrian fracture basement aquifer systems. Determining the aquifer
geometry, volume of water in storage, and current and projected extraction rates is critical
for the development of sustainable management of these systems. We investigate these
parameters for one of most significant Gulf of Suez rift-related aquifers, the El Qaa Plain,
the main source of fresh water for the cities of El Tor, and Sharm El Sheikh (Fig. 1a). In
our investigations, we use (1) gravity and aeromagnetic data to map the aquifer areal
distribution and subsurface geometry, (2) gravity data to estimate the volume of water in
storage, and (3) the extracted information together with hydraulic gradient data to assess
the projected impacts of current management schemes on the longevity of these aquifers.
2 Geologic and Hydrogeologic Settings
The Gulf of Suez rift, the northward extension of the Red Sea rift (Said 1990), is an
inactive intercontinental rift (length 300 km; width 80 km) created by the stretching and
collapse of the continental crust (Garfunkel and Bartov 1977) between the Sinai micro
416 Surv Geophys (2014) 35:415–430
123

plate and the African plate (Landon 1994; Moustafa 2002) (inset; Fig. 1a). The rift started
in early Miocene (Alsharhan 2003; Moustafa 1993; Patton et al. 1994) and was associated
with uplift; the rift shoulders were elevated by as much as 4 km, exposing the underlying
crystalline rock and the overlying thick (up to 2.5 km) sedimentary successions to
extensive erosion (Garfunkel and Bartov 1977). The rifting was largely accommodated by
Fig. 1 a Geologic map of the El Qaa Plain region showing the distribution of Precambrian outcrops and thePhanerozoic rock units along the Gulf of Suez eastern margin [modified from Klitzsch et al. (1987) andMoustafa (2004)]. Also shown are the rift boundary (thick black line), main cities (red circles), main road(purple line), field gravity data (polygon a), and aeromagnetic data (polygon b). Inset shows the transferzones (orange and blue lines), and the thermal springs (colored crosses). b Geologic cross section along lineX–X0 shown in Fig. 1a modified from Moustafa (2004). c Geologic cross section along line Y–Y0, shown inFig. 1a, showing the generally SW-dipping normal faults and NE-dipping bedding and the aquifers unitsmodified from Pivnik et al. (2003)
Surv Geophys (2014) 35:415–430 417
123

extensional normal faults that strike north and northwest, forming a complex array of half-
grabens and asymmetric horsts (Pivnik et al. 2003). The uplift eroded the thick sedimentary
successions, whereas the extensional faults preserved these successions as subsided blocks
(half-grabens) under the Gulf of Suez and the marginal coastal plains. The subsided blocks
were subsequently filled by syn- and post-rift clastics shed from the uplifted blocks. The El
Qaa Plain basin, which is bounded to the east by a major extensional fault (Said 1990)
(Fig. 1a), is an example of this kind of basin. The rift-related basins are separated by
accommodation zones (Faulds and Varga 1998; Bosworth 1985; Lambiase and Bosworth
1995; Rosendahl et al. 1986). The latter are defined as zones of along-strike displacement
transfer between oppositely dipping rift-border and intrarift faults, also termed ‘‘transfer
zones’’ (Morley et al. 1990; Moustafa 1997, 2002), ‘‘interference accommodation zones’’
(Versfelt and Rosendahl 1989), or ‘‘hinge zones’’ (Alsharhan 2003). Two accommodation
zones (inset; Fig. 1a) were recognized north and south of the El Qaa Plain area, namely the
Morgan and the Zaafarana accommodation zones, respectively (Moustafa 1997).
Unfortunately, the pre-, syn-, and post-rift stratigraphic sections are not well defined in
the El Qaa Plain area (Fig. 1b). In contrast, the availability of seismic data allows for a
better definition of the stratigraphic section of the surrounding areas. In these areas, the
pre-rift stratigraphic section (Fig. 1b) consists of Precambrian basement that is uncon-
formably overlain by Cambrian to late Eocene sedimentary successions (Said 1990; Patton
et al. 1994; Schutz 1994). Thick sequences of Lower Cambrian–Lower Cretaceous clastics,
dominantly shallow marine to fluvial sandstones (Allam and Khalil 1989) also called the
Nubian Sandstone (Said 1962), are overlain by interbedded sandstones, limestones, and
shales of the Raha, Wata, Matulla, and Duwi formations (Ghorab 1961). These in turn are
overlain by thin Paleocene shales of the Esna Formation and early to middle Eocene
carbonates of the Thebes, Darat, Mokattam, Tanka, and Maadi formations (McClay et al.
1998; Patton et al. 1994). The pre-rift strata are unconformably overlain by late Oligocene–
early Miocene red beds and volcanics that were deposited in isolated, fault-bounded basins
(Sharp et al. 2000; Said 1962, 1990). These successions were followed by early to middle
Miocene, thick (up to 6 km) (Bosworth et al. 1998) syn-rift clastics of the Gharandal and
Ras Mallab groups (Sharp et al. 2000; McClay et al. 1998). The post-rift strata consist of
Pliocene clastics and Quaternary wadi and sabkha deposits (Moustafa 2004).
The El Qaa Plain basin has four aquifers (Quaternary alluvium, Lower Miocene clastics,
Nubian Sandstone, and Precambrian fractured basement; Fig. 1c) and three aquitard units
(massive basement, middle calcareous division, and Upper Miocene evaporites) (Gorski
and Ghodeif 2000). These aquifers are being recharged by modern precipitation and dis-
charge along deep-seated faults of the underlying Nubian Sandstone Aquifer waters (Sultan
et al. 2007). The Nubian Sandstone Aquifer is considered to be a ‘‘fossil’’ aquifer, a type of
aquifer believed to be largely recharged under previous wet climatic periods (Sturchio
et al. 2004). Regionally, the fossil groundwater in the Nubian Sandstone Aquifer moves
northward, toward the Mediterranean Sea, but locally in the El Qaa Plain, flow is west-
ward, toward the Gulf of Suez, and the aquifer discharges along the extensional faults
bounding the Gulf of Suez at high temperatures (up to 70 �C) within the coastal plain of the
Gulf of Suez and along its coastline (Sturchio et al. 1996).
Using geochemical and geophysical data and applying hydrologic models, it has been
demonstrated (Sultan et al. 2011) that the alluvial aquifers in Sinai, including those flooring
the El Qaa Plain, are receiving modern meteoric contributions in intervening dry climatic
periods such as the present time. Using isotopic and geochemical analyses along with field
and remote sensing data, Sultan et al. (2007) showed that discharge of the Nubian Sand-
stone Aquifer is occurring on a larger scale, primarily through deep-seated fault systems,
418 Surv Geophys (2014) 35:415–430
123

and that ascending groundwater discharges into relatively thick alluvial aquifers proximal
to the fault complex that defines the Nile River and the Gulf of Suez, including the El Qaa
Plain.
3 Data Acquisition and Processing
3.1 Land-Based Gravity Data
Data from a total of 381 ground gravity stations were collected throughout four field
seasons (December 2003, May and December 2005, and September 2011) in the El Qaa
Plain area (Fig. 1a, polygon a; Fig. 2). The Worden Master gravimeter, which has a
sensitivity of 0.01 mGal, was used in the gravity data collection. Each surveying day
started and ended with base station readings. Most of the gravity readings were taken along
profiles trending N60E, were tied by northwest (NW)–southeast (SE) traverses, and cov-
ered an 85 km 9 20 km area. The station interval along a typical profile ranged from 0.5
to 1.0 km, and the profile separation ranged from 1.0 to 5.0 km. Accurate horizontal and
vertical positioning of the gravity stations was done using paired Magellan ProMark X or
paired Trimble global positioning systems (GPS).
Gravity data reduction started with the differential processing of the daily GPS data for
accurate horizontal and vertical positioning of each gravity station. Following the accurate
positioning, a conventional processing regime was applied to the raw gravity measure-
ments including drift, tide, latitude, free-air, and Bouguer corrections. Terrain correction
was also applied using a 30-m horizontal resolution digital elevation model (DEM) data to
produce the complete Bouguer gravity map (Fig. 3a).
3.2 Aeromagnetic Data
A total of 800 line-km of aeromagnetic data in the northern El Qaa Plain area were acquired by
purchase (Fig. 1a, polygon b; Fig. 2). The aeromagnetic data were part of an airborne survey
conducted by the exploration division of the Egyptian Nuclear Material Authority in March
and April of 1998. A Scintrex Cesium magnetometer was used in data acquisition with in-
flight sensitivity of 0.001 nT, sampling at 0.1 s, and an average terrain clearance of 120 m.
Twenty-seven NW–SE-oriented paths covering a 65 km 9 15 km area with a flight path
separation of 1.0 km were acquired over the northern part of the El Qaa Plain area.
A conventional processing regime was applied to the raw total magnetic field data by
the Egyptian Nuclear Material Authority to produce residual magnetic anomalies (Fig. 3b).
The applied processing steps include the removal of the diurnal variation effects, heading
corrections, lag correction, removal of the International Geomagnetic Reference Field
(IGRF), and leveling (Elsirfe et al. 1998).
4 Discussion and Findings
4.1 Basin Geometry and Outlines
Both gravity and magnetic anomalies reveal the spatial distribution and relief of subsurface
basement rocks, which in turn mimic the subsurface basin depth and geometries in the
study area. Examination of the complete Bouguer gravity anomaly map [Fig. 3a; contour
Surv Geophys (2014) 35:415–430 419
123

interval (CI): 2 mGal] shows a NW–SE-trending gravity low, parallel to the Gulf of Suez,
occupying the central and northern parts of the mapped area. This anomalous feature
indicates a thick sedimentary section (i.e., basin) overlying a complex trough of basement
rocks. Contour spacing is closer along the east-northeast (ENE) side of the basin, indi-
cating the location of the controlling fault of the half-graben. The gravity low anomaly
feature is expressed as two elliptical shapes, A: -45 mGal and C: -48 mGal, which
represent two sub-basins connected by a narrow saddle, B: -42 mGal (Fig. 3a). The two
basins are connected to the Gulf of Suez by a north–south (N–S) trending channel like
feature of low gravity (D: -35 mGal; Fig. 3a). Examination of the southern part of the map
Fig. 2 Location map showing the spatial distribution and the measurement time of the gravity stations(colored circles) and the locations of the flight paths for the aeromagnetic survey (black lines). Also shownare the locations of the 2D modeling profiles (purple lines)
420 Surv Geophys (2014) 35:415–430
123
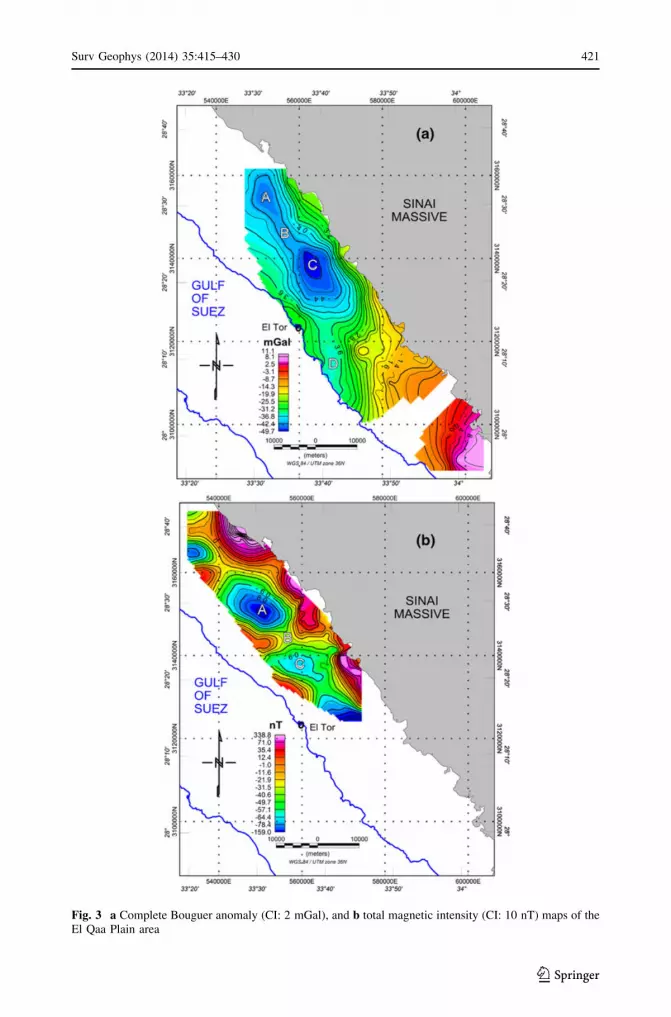
Fig. 3 a Complete Bouguer anomaly (CI: 2 mGal), and b total magnetic intensity (CI: 10 nT) maps of theEl Qaa Plain area
Surv Geophys (2014) 35:415–430 421
123

shows a gravity high (9 mGal; Fig. 3a), which indicates the presence of shallow basement
rocks to the south, or the presence of a high-density intrusive body within the country rock.
The residual magnetic anomalies map (Fig. 3b; CI: 10 nT) shows a NW–SE magnetic
low parallel to the Gulf of Suez. The magnetic low consists of two (A: -100 nT, and C:
-70 nT; Fig. 3b) near-circular magnetic anomalies separated by a narrow saddle (B: -40
nT; Fig. 3b). These anomalous features represent two subsurface basins with a thick
sedimentary section overlying deep basement rocks. These anomalous features are
equivalent to those shown in the complete Bouguer anomaly map (Fig. 3a). The difference
in the geometries between gravity and magnetic anomalies is attributed to one or more
parameters, including induced and remnant magnetization(s); differing magnetic suscep-
tibility of rocks having the same density; and the depth, strike, and magnetic inclination
and declination of the source bodies.
The gravity/magnetic field analytic signal maps, which are based on derivatives (hor-
izontal and vertical), were used to outline the areal distribution of the sources causing the
gravity/magnetic anomalies. Analytic signal represents a combination of the three deriv-
atives [horizontal (X and Y) and vertical (Z)]. Features striking perpendicularly, or at high
angles, to the direction of the applied derivatives were enhanced. The analytic signal was
used to define and delineate the main boundaries of the features causing the gravity and
magnetic anomalies, regardless of the structural dip of these features and independent of
the direction of the induced and/or remnant body magnetizations. The boundaries of these
features are located directly beneath the analytic signal maxima (Nabighian 1972; Roest
et al. 1992; MacLeod et al. 1993; Saibi et al. 2006; Doo et al. 2009).
Examination of the analytic signal maps of both gravity (Fig. 4a) and magnetic
(Fig. 4b) data generally shows the boundaries of the subsurface basins located beneath the
maximum amplitude of the analytic signal. These boundaries, in the case of the gravity
map, represent the subsurface faults (Fig. 4, black line) controlling the NE margin of the
basins, where high-density basement is juxtaposed next to lower-density basin fill. The two
investigated basins are bounded to the NE by normal faults striking NW–SE, parallel to the
Gulf of Suez direction. Curiously, neither the magnetic nor the gravity analytic signal maps
show the master half-graben fault as a continuous feature (although it probably is). These
maps also have broad areas of diffuse medium gradient; this may be related to choices of
parameters for the analytic signal processing rather than having real geologic significance.
Both maps do show a feature just N of El Tor that may be one or even a pair of intersecting
local faults. Unfortunately, the magnetic map does not extend far enough S to cover the
entire feature. This does coincide with the sudden SE termination of the tilted ridge, as well
as the location of the high-discharge Moses’ Spring. Figure 4 also gives an estimate of the
subsurface basin geometries (i.e., length and width). The average NW–SE length of the
basin is estimated to be 43 km. The basin width varies along the main NW–SE extension
of the basin. The average width at the north is estimated to be 12 km, which decreases to
7 km at the center of the basin, then reaches its maximum of 14 km at the southern parts of
the basin.
Calculation of the depth to the basement rocks is an important step in defining the
spatial variations in the thickness of the sedimentary cover and delineating the structural
relief of the underlying basement and its effect on the overlying sedimentary units. In this
study, a two-dimensional (2D) modeling was carried out simultaneously for both gravity
and magnetic data. The 2D modeling was carried out after removing the linear regional
field from each of the selected profiles. A trial and error technique was used to adjust the
initial model to match the observed anomalies, where the configuration of the model layers
was iteratively modified for best fit between the observed and the computed anomaly data.
422 Surv Geophys (2014) 35:415–430
123
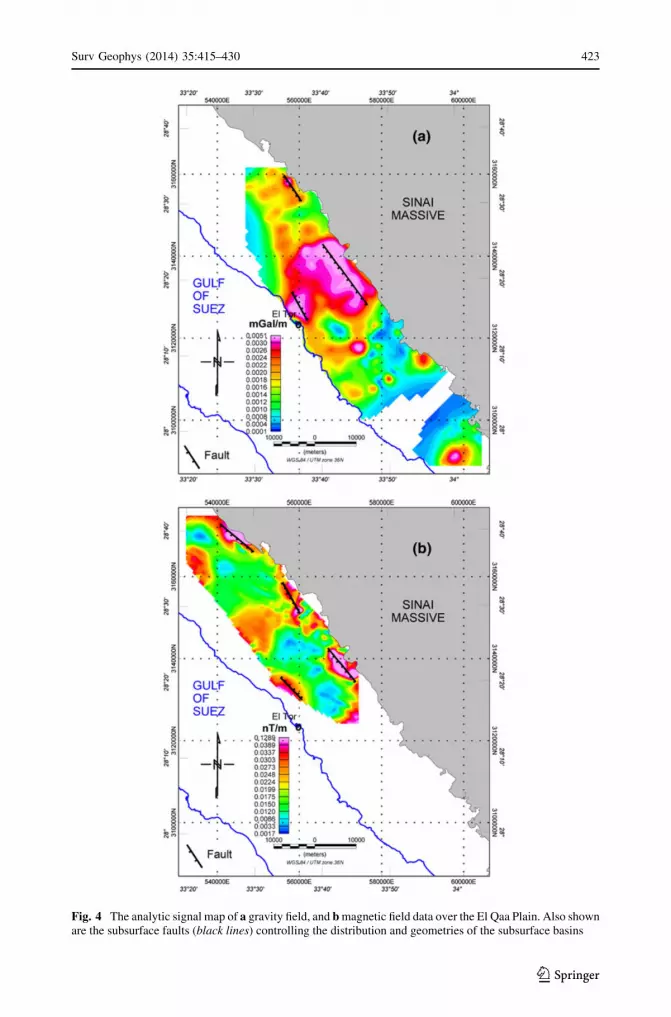
Fig. 4 The analytic signal map of a gravity field, and b magnetic field data over the El Qaa Plain. Also shownare the subsurface faults (black lines) controlling the distribution and geometries of the subsurface basins
Surv Geophys (2014) 35:415–430 423
123
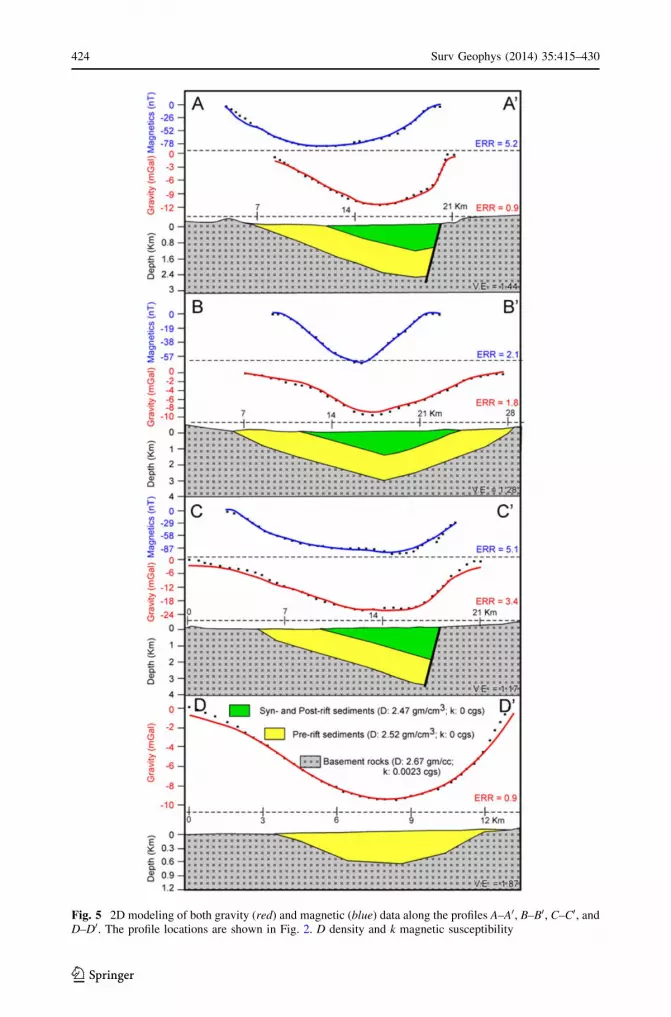
Fig. 5 2D modeling of both gravity (red) and magnetic (blue) data along the profiles A–A0, B–B0, C–C0, andD–D0. The profile locations are shown in Fig. 2. D density and k magnetic susceptibility
424 Surv Geophys (2014) 35:415–430
123

An understanding of the subsurface geology, as well as knowledge of the physical prop-
erties (e.g., density, magnetic susceptibility), and the total magnetic intensity, inclination,
and declination of the magnetic field for the investigated sequences are needed to develop
sound 2D models.
The density and magnetic susceptibility data used in this study were compiled from
previously published studies (Setto 1991; Omran 1982; Ismail 1998; Selim 2002; Sultan
et al. 2009; Rabeh and Miranda 2008; Rabeh et al. 2009) in areas surrounding, and with
similar geologic conditions to, the El Qaa Plain. The parameters of the geomagnetic field
were extracted from the National Oceanic and Atmospheric Administration (NOAA)
National Geophysical Data Center (NGDC) website (available at www.ngdc.noaa.gov/
geomagmodels/IGRFWMM.jsp). We created a three-layer, 2D model with two clastic
layers overlying a layer of basement rock with densities (from top to bottom) of 2.47 gm/cm3
(syn- and post-rift clastics), 2.52 gm/cm3 (pre-rift sediments), and 2.67 gm/cm3, respec-
tively, and magnetic susceptibilities of 0 cgs, 0 cgs, and 2.3 9 10-3 cgs, respectively,
where the total magnetic field, inclination, and declination were found to be 42,187 nT,
40.9�, and 2.4�, respectively.
Four 2D gravity and magnetic profiles (location; Fig. 2), trending NE–SW (A–A0, B–B0,and C–C0) and WNW–ESE (D–D0), covering the anomalous features (A, B, C, and D;
Fig. 3) were selected for modeling. All of the selected profiles show (1) a uniform
thickness (*1.5 km) of the pre-rift section; (2) uniform geometry (east dipping) of the pre-
rift sediments; and (3) bounding SW-dipping faults at the contact of the sedimentary
section with the basement rocks. Examination of the cross sections A–A0 and C–C0 (Fig. 5)
reveals a dipping and thickening of the syn- and post-rift sedimentary sections toward the
east. The thickness of the syn- and post-rift section increases from the west to the east (A–
A0: 1.5 km; C–C0: 2 km). Inspection of cross section B–B0 reveals a thick (* 1.5 km) syn-
and post-rift section at the central part of the profile that decreases in thickness toward the
eastern and western margins. Cross section D–D0 shows only the pre-rift section with a
maximum thickness (*0.7 km) at the central part that also decreased toward the east and
west margins of the profile.
4.2 Volume of Water
While an infinite number of geometries and density distributions can give rise to a single
residual gravity map of an area, a remarkable property of the gravity method is that the
total anomalous mass is precisely determined by the areal integration of the residual
gravity anomaly. The total anomalous mass (DM; missing in this case) is calculated using
Gauss’s theorem (Ramsey 1949) and is directly related to the integral of the residual
gravity anomalies (Dg(x, y)) over each unit cell (dxdy) included in the selected basin:
DM ¼ 1
2pG
Z1
�1
Z1
�1
Dg x; yð Þdxdy
If we assume that the missing mass is entirely due to two layers, air-filled pore space in
the unsaturated zone and water-filled pores below, it is possible to calculate the mass, and
hence the volume, of water in the basin. The adopted model depicts a basin of an area (S)
filled with alluvium sediments, with the lower surface of the alluvium bounded by bedrock.
Above the water table, the alluvium sediments with a thickness (h) have a matrix density
(q: 2.67 gm/cm3), and the pore spaces within the sediment are filled with air [qair: 0 gm/cm3;
Surv Geophys (2014) 35:415–430 425
123
density contrast (Dq2): -2.67 gm/cm3], whereas below the water table, the pore spaces are
saturated with water (qw: 1 gm/cm3; Dq1: -1.67 gm/cm3). The total anomalous missing
mass (DM) is the sum of the missing mass below the water table (DM1: saturated zone) and
the missing mass above the water table (DM2: unsaturated zone).
DM ¼ DM1 þ DM2
DM2 ¼ Dq2hS
DM1 ¼ DM�Dq2hS
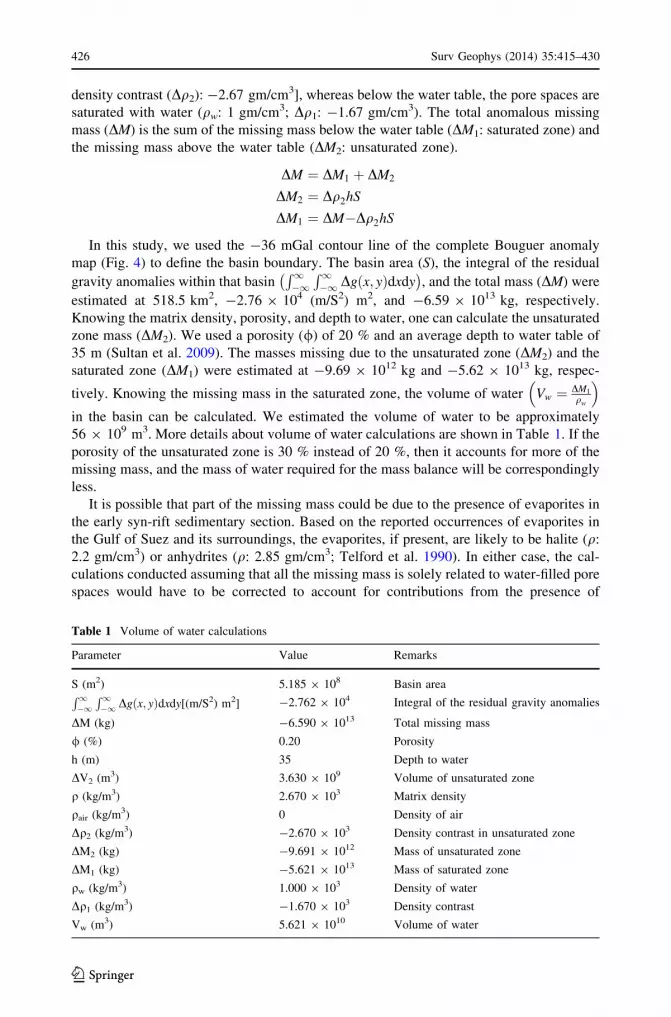
In this study, we used the -36 mGal contour line of the complete Bouguer anomaly
map (Fig. 4) to define the basin boundary. The basin area (S), the integral of the residual
gravity anomalies within that basinR1�1R1�1 Dg x; yð Þdxdy
� �, and the total mass (DM) were
estimated at 518.5 km2, -2.76 9 104 (m/S2) m2, and -6.59 9 1013 kg, respectively.
Knowing the matrix density, porosity, and depth to water, one can calculate the unsaturated
zone mass (DM2). We used a porosity (/) of 20 % and an average depth to water table of
35 m (Sultan et al. 2009). The masses missing due to the unsaturated zone (DM2) and the
saturated zone (DM1) were estimated at -9.69 9 1012 kg and -5.62 9 1013 kg, respec-
tively. Knowing the missing mass in the saturated zone, the volume of water Vw ¼ DM1
qw
� �in the basin can be calculated. We estimated the volume of water to be approximately
56 9 109 m3. More details about volume of water calculations are shown in Table 1. If the
porosity of the unsaturated zone is 30 % instead of 20 %, then it accounts for more of the
missing mass, and the mass of water required for the mass balance will be correspondingly
less.
It is possible that part of the missing mass could be due to the presence of evaporites in
the early syn-rift sedimentary section. Based on the reported occurrences of evaporites in
the Gulf of Suez and its surroundings, the evaporites, if present, are likely to be halite (q:
2.2 gm/cm3) or anhydrites (q: 2.85 gm/cm3; Telford et al. 1990). In either case, the cal-
culations conducted assuming that all the missing mass is solely related to water-filled pore
spaces would have to be corrected to account for contributions from the presence of
Table 1 Volume of water calculations
Parameter Value Remarks
S (m2) 5.185 9 108 Basin areaR1�1R1�1 Dg x; yð Þdxdy[(m/S2) m2] -2.762 9 104 Integral of the residual gravity anomalies
DM (kg) -6.590 9 1013 Total missing mass
/ (%) 0.20 Porosity
h (m) 35 Depth to water
DV2 (m3) 3.630 9 109 Volume of unsaturated zone
q (kg/m3) 2.670 9 103 Matrix density
qair (kg/m3) 0 Density of air
Dq2 (kg/m3) -2.670 9 103 Density contrast in unsaturated zone
DM2 (kg) -9.691 9 1012 Mass of unsaturated zone
DM1 (kg) -5.621 9 1013 Mass of saturated zone
qw (kg/m3) 1.000 9 103 Density of water
Dq1 (kg/m3) -1.670 9 103 Density contrast
Vw (m3) 5.621 9 1010 Volume of water
426 Surv Geophys (2014) 35:415–430
123

evaporites. The corrections for the presence of the anhydrite would increase the calculated
water volume, while the corrections for the presence of the halite would decrease the water
contribution to the negative anomaly. Inspection of published geologic maps (Klitzsch
et al. 1987) and available sparse borehole information did not reveal the presence of
significant evaporite successions in the El Qaa Plain basin. A minimal figure for water
volume can be obtained by presuming the presence of a 50 m thickness of halite, which
will reduce the volume of water to 40 9 109 m3 if we also assume the water table to be at
45 m (rather than 35 m) and the unsaturated zone porosity (/) to be 25 % (instead of
20 %).
4.3 Sustainable Utilization of El Qaa Plain Aquifers
Extraction rates from the Quaternary aquifer in the El Qaa Plain are on the rise. They were
0.18 9 106 m3/year in 1930 (Attia 1930), 1.1 9 106 m3/year in 1972 (Gilboa 1972),
9.5 9 106 m3/year in 2000 (Gorski and Ghodeif 2000), and 11.0 9 106 m3/year in 2011.
Given these progressive extraction rates over the past 80 years, we estimate (using a
second-order polynomial function) that extraction in 2020, 2050, and 2100 will reach
15 9 106, 30 9 106, and 65 9 106 m3/year, respectively.
The aquifer receives recharge from (1) infiltration from modern precipitation over the El
Qaa Plain and adjacent Sinai mountains, and (2) discharge from the underlying Nubian
Sandstone Aquifer that is occurring primarily through deep-seated fault systems where
ascending groundwater discharges into relatively thick alluvial aquifers bounded by the
fault complex within the El Qaa Plain (Sultan et al. 2007). A reasonable assumption to
make is that the system was at near steady-state conditions in the 1930s, given the small to
negligible extraction rates at the time. Under steady-state conditions, the recharge from the
ascending Nubian Sandstone Aquifer waters and from modern precipitation is balanced by
discharge to the Gulf of Suez.
If we adopt the modeled extraction rates described above, we estimate that in a period of
200–230 years, the volume of the El Qaa Plain Quaternary aquifer will be depleted by
40 %. The installation of water wells in a number of western states in the USA is regulated
so that the maximum allowed depletion does not exceed 40 % of the aquifer by volume
(McGuire et al. 2000). Depletion of aquifers beyond these limits could have significant
effects on aquifer recovery, stream and river systems, and riparian ecosystems. These
estimates are worst-case scenarios, given that the underlying assumption ignores the
increase in groundwater extraction in the Quaternary aquifer, which will potentially reduce
groundwater discharge, induce more ascending inflow from the underlying Nubian
Sandstone Aquifer, and increase groundwater lateral inflow to the El Qaa Plain Quaternary
aquifer from the surrounding areas. These potential gains, if considered, would partially
compensate for the increased groundwater loss from well extraction, resulting in an
increase in the estimated period for aquifer depletion. These estimates also ignore the
potential impact of increased extraction on seawater intrusion, which will affect the water
quality of the El Qaa Plain.
The mean groundwater level in the El Qaa Plain exceeds 20 m above mean sea level
(amsl). The eastern section of the plain has a gentle gradient (\ 0.0003) compared to the
western section (0.003) (Gorski and Ghodeif 2000). A first-order estimate for the maxi-
mum drawdown that can maintain a hydraulic gradient similar to that of the present is
approximately 10 m amsl (average for entire area). If we were to adopt the modeled
extraction rates described above, we estimate that the water levels will drop by 10 m in
Surv Geophys (2014) 35:415–430 427
123

45 years. At this time, the aquifer will be threatened by seawater intrusion and its water
quality will be undermined.
5 Summary and Implications
We applied an integrated approach including the analysis of ground gravity, as well as
aeromagnetic data to identify the structural and hydrogeologic settings, the areal distri-
bution and geometry of aquifer units, water volume, and water depletion rates in one of the
Gulf of Suez rift–related basins, El Qaa Plain basin in SW Sinai. Analysis and interpre-
tation of both gravity and magnetic data revealed a NW–SE-trending basin, parallel to the
Gulf of Suez, with an average length of 43 km and an average width ranging from 7 km
(central section) to 14 km (southern section). The 2D modeling of both gravity and
magnetic data indicates basin fill with a maximum thickness of 3.5 km. Using anomalous
residual gravity techniques, the volume of water in storage was estimated to range from
40 km3 (conservative limit) to 56 km3 (upper limit) in the selected basin.
Our findings indicate that while, over time, the progressive increase in extraction rates
could alleviate the increasing demands for freshwater supplies for the rapidly growing
tourism industry in the region, it will have some serious adverse effects on the aquifer. The
aquifer will be depleted by up to 40 % of its volume in 200–230 years and will cause the
water quality to deteriorate due to seawater intrusion in 45 years. The adopted techniques
used in this analysis could be readily extended to investigate the setting and sustainable
utilization of several similar fossil aquifers on the west side of the Gulf of Suez and along
the Red Sea coastal areas. Moreover, these adopted techniques could pave the way toward
the establishment of sustainable utilization schemes for a much larger suite of similar fossil
aquifers worldwide.
Acknowledgments Research is supported by a NATO Science for Peace (Grant SFP 982614) awarded toWestern Michigan University. We thank Dr. Kamal Ghodeif for providing static water level measurements.We also thank Dr. Khaled Mamoun, Mr. Islam Nagi, and Mrs. Lamees Mohamed for assisting in thecollection of the 2011 gravity data.
References
Allam A, Khalil H (1989) Geology and stratigraphy of Gebel Qabeliat area, Southwestern Sinai, Egypt.J Afr Earth Sci 9:59–67
Alsharhan AS (2003) Petroleum geology and potential hydrocarbon plays in the Gulf of Suez rift basin,Egypt. AAPG Bull 87:143–180
Attia MA (1930) Report on fresh water of El-Tor Quarry. Geological Survey of Egypt, CairoBosworth W (1985) Geometry of propagating continental rifts. Nature 316:625–627Bosworth W, Crevello P, Winn RD, Steinmetz J (1998) Structure, sedimentation, and basin dynamics during
rifting of the Gulf of Suez and north-western Red Sea. In: Purser BH, Bosence DW (eds) Sedimen-tation and tectonics in rift basins. Chapman and Hall, New York, pp 77–96
Doo W, Hsu S, Tsai C, Huang Y (2009) Using analytic signal to determine magnetization/density ratios ofgeological structures. Geophys J Int 179:112–124
Elsirfe AM, Aref A, Elawadi EA, Mahmoud AA, Sabry AM (1998) Airborne magnetic and gamma-rayspectrometric survey flown over Abu Zenima El Tor area, south western Sinia, Egypt: data acquisition,processing and interpretation. Scientific internal report, Nuclear Materials Authority, Egypt
Faulds JE, Varga RJ (1998) The role of accommodation zones and transfer zones in the regional seg-mentation of extended terranes. In: Faulds JE, Stewart JH (eds) Accommodation zones and transferzones: the regional segmentation of the Basin and Range province. Geological Society of AmericaSpecial Paper 323, pp 1–45
428 Surv Geophys (2014) 35:415–430
123

Garfunkel Z, Bartov Y (1977) The tectonics of the Suez rift. Geol Surv Israel Bull 71:1–44Ghorab MA (1961) Abnormal stratigraphic features in Ras Gharib oil field. Third Arab Petroleum Congress.
AlexandriaGilboa Y (1972) Survey of water resources at A-Tor. Tahal, Water Planning for Israel Ltd., Tel AvivGorski J, Ghodeif K (2000) Salinization of shallow water aquifer in El-Qaa coastal plain, Sinai, Egypt. In:
Sadurski A (ed) The 16th salt water intrusion meeting (SWIM), Miedzyzdroje–Wolin Island. NicholasCopernicus University, Poland, pp 63–72
Ismail AM (1998) Geophysical studies in Northern Part of Egypt. Cairo University, CairoKlitzsch E, List FK, Pohlmann G (1987) Geological map of Egypt, South Sinai sheet, Scale 1:500,000.
Cario, Egypt, The Egyptian General Petroleum Corporation/Conoco; Berlin Institut fur AngewandteGeodasie
Lambiase JJ, Bosworth W (1995) Structural controls on sedimentation in continental rifts. In: Lambiase JJ(ed) Hydrocarbon habitat in rift basins. Geological Society Special Publication 80, pp 117–144
Landon SM (1994) Interior rift basins. In: Landon SM (ed) Interior rift basins. A.APG Memoir 59, pp 1–4MacLeod IN, Jones K, Dai TF (1993) 3D analytic signal in the interpretation of total magnetic field data at
low magnetic latitudes. Explor Geophys 24:679–688McClay KR, Nichols GJ, Khalil SM, Darwish M, Bosworth W (1998) Extensional tectonics and sedi-
mentation, eastern Gulf of Suez, Egypt. In: Purser B, Bosence DW (eds) Sedimentation and tectonicsof the Gulf of Aden-Red Sea rift system. Chapman and Hall, London, pp 223–228
McGuire VL, Johnson MR, Schieffer RL, Stanton JS, Sebree SK, Verstraeten IM (2000) Water in storageand approaches to ground-water management, high plains Aquifer, vol 1243. US Geologic SurveyCircular Reston, Virginia
Morley CK, Nelson RA, Patton TL, Munn SG (1990) Transfer zones in the East African rift system and theirrelevance to hydrocarbon exploration in rifts. AAPG Bull 74:1234–1253
Moustafa AR (1993) Organic geochemistry of source rocks and related crude oils in the Gulf of Suez, Egypt,vol 147. Berlin Geowissenschaften Abbandlungen. Selbstverlag Fachbereich Geowissenschaften,Berlin
Moustafa AR (1997) Controls on the development and evolution of transfer zones: the influence of basementstructure and sedimentary thickness in the Suez rift and Red Sea. J Struct Geol 19:755–768
Moustafa AR (2002) Controls on the geometry of transfer zones in the Suez rift and northwest Red Sea:implications for the structural geometry of rift systems. AAPG Bull 86:979–1002
Moustafa AR (2004) Geologic maps of the Eastern Side of the Suez Rift (Western Sinai Peninsula), Egypt.AAPG/Datapages, CD-ROm, Tulsa
Nabighian MN (1972) The analytic signal of two-dimensional magnetic bodies with polygonal cross-section: its properties and use for automated anomaly interpretation. Geophysics 37:507–517
Omran M (1982) Combined gravity and seismic study on the Nile Delta Region. Mansoura University,Mansoura
Patton TL, Moustafa AR, Nelson RA, Abdine SA (1994) Tectonic evolution and structural setting of theSuez rift. In: Landon SM (ed) Interior rift basins. AAPG Memoir 59, pp 9–56
Pivnik DA, Ramzy M, Steer BL, Thorseth J, El Sisi Z, Gaafar I, Garing JD, Tucker RS (2003) Episodicgrowth of normal faults as recorded by syntectonic sediments, July oil field, Suez rift, Egypt. AAPGBull 87:1015–1030
Rabeh T, Miranda JM (2008) A tectonic model of the Sinai Peninsula based on magnetic data. J GeophysEng 5:69–479
Rabeh T, Miranda JM, Carvalho J, Bocin A (2009) Interpretation case study of the Sahl El Qaa area,southern Sinai Peninsula, Egypt. Geophys Prospect 57:447–459
Ramsey AS (1949) An introduction to the theory of Newtonian attraction. The University Press, CambridgeRoest WR, Verhoef J, Pilkington M (1992) Magnetic interpretation using the 3-D analytic signal. Geo-
physics 57:116–125Rosendahl BR, Reynolds DJ, Lorber PM, Burgess CF, McGill J, Scott D, Lambiase JJ, Derksen SJ (1986)
Structural expression of rifting: lessons from Lake Tanganyika, Africa. In: Frostick LE, Renaut RW,Reid I, Tiercelin JJ (eds) Sedimentation in the African rifts. Geological Society Special Publication 25,pp 29–43
Saibi H, Nishijima J, Ehara S, Aboud E (2006) Integrated gradient interpretation techniques for 2D and 3Dgravity data interpretation. Earth Planets Space 58:815–821
Said R (1962) The geology of Egypt. Elsevier, New YorkSaid R (1990) Cenozoic. In: Said R (ed) The geology of Egypt. A. A. Balkema, Rotterdam, pp 451–486Schutz KI (1994) Structure and stratigraphy of the Gulf of Suez, Egypt. In: Landon SM (ed) Interior rift
basins. AAPG Memoir 59, pp 57–96
Surv Geophys (2014) 35:415–430 429
123

Selim EI (2002) The use of the geophysical methods to study the subsurface structure in the SoutheasternMediterranean and North Sinai region. Mansoura University, Mansoura
Setto I (1991) A crustal modeling for the Nile Delta, Egypt. J Geol 34:279–292Sharp IR, Gawthorpe RL, Underhill JR, Gupta S (2000) Fault-propagation folding in extensional settings:
examples of structural style and synrift sedimentary response from the Suez rift, Sinai, Egypt. GSABull 112:1877–1899
Sturchio NC, Arehart GB, Sultan M, Sano Y, AboKamar Y, Sayed M (1996) Composition and origin ofthermal waters in the Gulf of Suez area, Egypt. Appl Geochem 11:471–479
Sturchio NC, Du X, Purtschert R, Lehmann BE, Sultan M, Patterson LJ, Lu ZT, Muller P, Bigler T, BaileyK, O’Connor TP, Young L, Lorenzo R, Becker R, El Alfy Z, El Kaliouby B, Dawood Y, AbdallahAMA (2004) One million year old groundwater in the Sahara revealed by krypton-81 and chlorine-36.Geophys Res Lett 31:L05503
Sultan M, Yan E, Sturchio N, Wagdy A, Milewski A, Abdel Gelil K, Manocha N, Becker R (2007) Naturaldischarge: a key to sustainable utilization of fossil groundwater: Amsterdam. J Hydrol 335:25–36
Sultan SA, Mohameden MI, Santos FM (2009) Hydrogeophysical study of the El Qaa Plain, Sinai, Egypt.Bull Eng Geol Environ 68:525–537
Sultan M, Metwally S, Milewski A, Becker D, Ahmed M, Sauck W, Soliman F, Sturchio N, Yan E, RashedM, Wagdy A, Becker R, Welton B (2011) Modern recharge to the Nubian Aquifer, Sinai Peninsula:geochemical, geophysical, and modeling constraints. J Hydrol 403:14–24
Telford WM, Geldart LP, Sheriff RE (1990) Applied geophysics. Cambridge University Press, CambridgeVersfelt J, Rosendahl BR (1989) Relationship between prerift structure and rift architecture in Lakes
Tanganyika and Malawi, East Africa. Nature 337:257–354
430 Surv Geophys (2014) 35:415–430
123