water balance in the guarani aquifer outcrop zone based on hydrogeologic monitoring
TRANSCRIPT

Journal of Hydrology (2007) 342, 261–269
ava i lab le a t www.sc iencedi rec t . com
journal homepage: www.elsevier .com/ locate / jhydrol
Water balance in the Guarani Aquifer outcrop zonebased on hydrogeologic monitoring
E. Wendland *, C. Barreto, L.H. Gomes
University of Sao Paulo, Department of Hydraulics and Sanitary Engineering, P.O. Box 359, Sao Carlos, SP 13560-970, Brazil
Received 3 November 2006; received in revised form 11 May 2007; accepted 24 May 2007
00do
*
95
KEYWORDSHydrogeology;Groundwater;Recharge;Infiltration;Monitoring;Base flow
22-1694/$ - see front mattei:10.1016/j.jhydrol.2007.05
Corresponding author. Tel50.E-mail address: [email protected]
r ª 200.033
.: +55 16
.br (E. W
Summary Main objective of this work was the study of the infiltration and rechargemechanisms in the Guarani Aquifer System (GAS) outcrop zone. The study was based onhydrogeologic monitoring, evapotranspiration and water balance in a pilot watershed.The pilot watershed (Ribeirao da Onca) is situated in the outcrop zone of the GuaraniAquifer between parallels 22�10 0 and 22�15 0 (south latitude) and meridians 47�55 0 and48�00 0 (west longitude). For the execution of the research project, a monitoring network(wells, rain gauge and linigraph) was installed in the watershed. Data have been system-atically collected during the period of a hydrological year. Water level fluctuation hasbeen used to estimate deep recharge and subsurface storage variation. The method usedto estimate the direct recharge adopted the hypothesis that the recession of the ground-water level obeys a function of power law type. Direct recharge is obtained through thedifference between the actual level of an unconfined aquifer and the level indicated byextrapolation of the recession curve, in a given period. Base outflow is estimated througha mixed function (linear and exponential). Outflow in the creek has been measured withcurrent meter and monitored continuously with a linigraph. The annual infiltration in 2005was estimated to be 350 mm, while the deep recharge, based on water balance, appearsto be 3.5% of the precipitation (1410 mm). These results indicate that the estimated longterm water availability of the Guarani Aquifer System should be studied more carefully.ª 2007 Elsevier B.V. All rights reserved.
Introduction
The Guarani Aquifer System (GAS) is one of the most impor-tant transboundary aquifers in the world. Located in the ter-
7 Elsevier B.V. All rights reserved
3373 9541; fax: +55 16 3373
endland).
ritory of four countries, Argentina, Brazil, Paraguay andUruguay, its area is estimated to 1.2 million km2. Due tothe strategic, social and economic importance of this aqui-fer for the four countries, it is necessary to make a coordi-nated use of this water resource. One of the basic steps fora suitable water management is the development of hydrog-eologic studies, aiming for the determination of the re-charge rate. The implementation of a monitoring system,
.

262 E. Wendland et al.
which allows the acquisition of detailed information aboutthe condition and behavior at specific sites of the GAS, isa prerequisite for an efficient management of the aquifer.Since the Ribeirao da Onca (Onca Creek) watershed presentsrepresentative characteristics for the outcrop zone of theGAS, it has been chosen for the present monitoring work.It should be mentioned that in some areas of Sao Paulo Statethe soil cover is up to tens of meter and, in contrast to theresearch area, contents clay.
The study area is located in the central region of Sao Pau-lo. This outcrop zone has major importance, due to thehigher exploitation and natural vulnerability. Strategic forthe aquifer sustainability, these supposed recharge areashave gained attention of many authors, aiming to under-stand the process and quantify the recharge in the region(Giampa and Souza, 1982; Contin Neto, 1987; Matos, 1987;Correa, 1995).
The Ribeirao da Onca watershed is equipped with data-logger for automatic groundwater and creek level monitor-ing. The 23 monitoring wells are strategically distributed inthe watershed, covering different soil uses. Daily precipita-tion measurements are collected from two rain gauges. Dis-charge at the creek is measured with a current meter every15 days. The watershed is located approximately 1.5 kmaway from CRHEA/USP (Center for Water Resources and Ap-plied Ecology of the University of Sao Paulo), where clima-tologic data are collected continuously. These equipmentsdeliver the necessary data for the GAS recharge evaluationin this region.
This paper presents monitoring data and correspondentevaluation for the year 2005 (Barreto, 2006).
Recharge estimate methods
There are various methods for aquifer recharge estimationas reviewed by Lerner et al., 1990; Simmers, 1989; Kinzel-bach, 2002; Sanford, 2002; Scanlon et al., 2002. The methodchosen depends on the objectives and expected precision ofresults, dimensions of the system and local hydrogeologicconditions. The estimation process is interactive and in-volves continuous refinement of evaluated recharge whenadditional data are collected.
According to the present state-of-art, the reliability ofthe methods cannot be evaluated. Given this difficulty,the uncertainty reduction can be achieved by simultaneousapplication of different methods (Lerner et al., 1990; Beek-man et al., 1996; De Vries and Simmers, 2002; Healy andCook, 2002; Scanlon et al., 2002; Maziero, 2005). This workpresents a joint application of the water balance (WB) andwater table fluctuation (WTF) methods.
Study area
The Ribeirao da Onca watershed is located between 22�10 0and 22�15 0 south and 47�55 0 and 48�00 0 west. Ribeirao daOnca is an affluent of Jacare-Guacu River according toFig. 1. The creek flows mainly over huge sandstone packet(Botucatu Formation) and at the basin outlet over the Bot-ucatu–basalt complex. Both units belong to Sao BentoGroup of Mesozoic age. Piramboia Formation appears sometens of meter below. Cenozoic soils present in the area re-
sult from sandstone weathering, showing homogeneouscomposition with no loam.
Climatic classification for the region following Koeppenindicates a humid subtropical climate with summer rains,showing a variation to tropical climate with dry winter.The mean annual precipitation is about 1300–1400 mm,while the mean temperature in the region is 20.5�C.
Water balance method
The water balance technique considers the main hydrologicprocesses as inputs and outputs of a volumetric balance.These variables are based on the most important hydrolog-ical phenomena, controlling the volumetric content in a gi-ven control volume during a defined period of time.
The present work assumes as control volume the satu-rated zone of the aquifer in the watershed (Fig. 2). Inputinto the system is given by the direct recharge, Rd, esti-mated by the WTF method. The direct recharge is equiva-lent to the amount of water infiltrated through the groundsurface. The variation in stored volume (DS) is obtainedfrom the monitored water level changes. Outputs fromthe system are the base flow (qb) and the deep recharge(Rp). The deep recharge refers to water movement into adeeper aquifer, which in this case is the BotucatuFormation.
This balance can be written as
Rd ¼ Rp þ qb þ DS: ð1Þ
All variables are expressed in terms of rates (e.g., mm/a).Eq. (1) does not consider ground water evaporation and
pumping. Evapotranspiration is supposed to be insignificantsince the groundwater level is more than 5.0 m belowground surface and capillarity is insufficient to rise thatheight in a sandy soil. In the study area there are no wellsexploiting groundwater so the pumping rate is zero.
Major advantage of the water balance method remains inthe fact that it uses generally available data (run off, waterlevels, etc.). However, the main limitation consists in thefact that the recharge evaluation depends on the precisionof the other measured and estimated components of theequation (Scanlon et al., 2002).
Water table fluctuation
The water table fluctuation (WTF) is the most widely usedtechnique for direct recharge rate estimation. This methodis applied for free surface aquifers and requires the defini-tion of the specific yield of a formation and the water levelvariation over time. The advantages of this method includeits simplicity and sensibility to the water movement processacross the unsaturated zone (Healy and Cook, 2002).
The WTF method is based on the assumption that waterlevel changes in unconfined aquifers are a result of infil-trated water that reaches the groundwater free surface.The recharge Rd is estimated as (Healy and Cook, 2002;Scanlon et al., 2002)
Rd ¼ Sydh
dt¼ Sy
DhDt
ð2Þ
Sy is the specific yield, h is the groundwater level, and t isthe time. The specific yield is approximately equal to the

Figure 2 Conceptual control volume for water balance.
Figure 1 Location of the Ribeirao da Onca watershed.
Water balance in the Guarani Aquifer outcrop zone based on hydrogeologic monitoring 263
Time
Δh
Wat
erle
vel
observed
extrapolated
Figure 3 Water level recession curve extrapolation in obser-vation well for recharge estimation.
47º54 W48º00 W
22º10 S
22º12 S
22º14 S
47º58 W 47º56 W
0 0.5 1 2Km
N
010203
0910
08
12
111413
2021
22 2315
161718
19
07
06
0504
LegendClimatologic stationPluviometerOutflowMonitoring wells
CoverSugar cane
Protection area
Eucalyptus
CitrusGrass
11 - 15wells
4-5-16-1708-12-13-14
01-02-03-0620-21-22-23
07-09-10
18-19
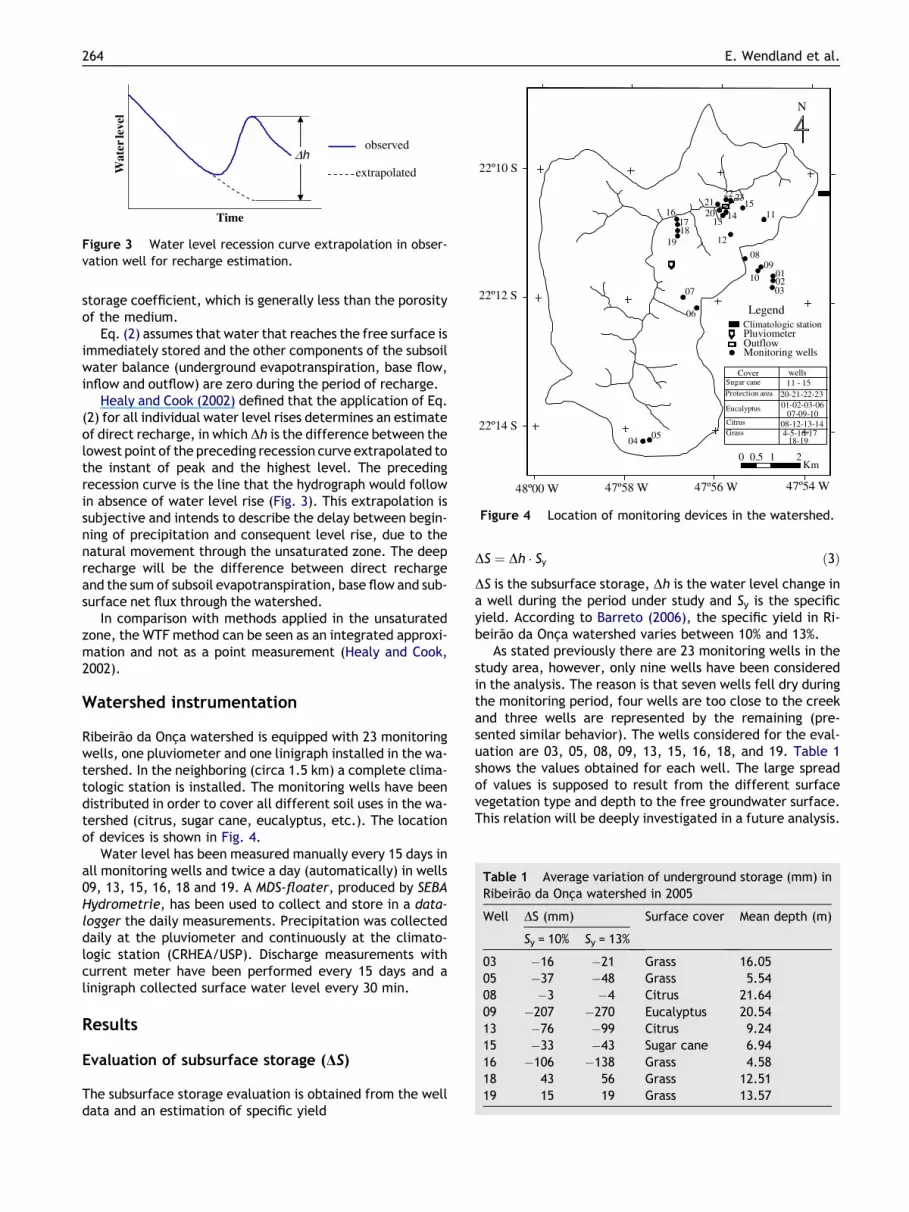
Figure 4 Location of monitoring devices in the watershed.
Table 1 Average variation of underground storage (mm) inRibeirao da Onca watershed in 2005
Well DS (mm) Surface cover Mean depth (m)
Sy = 10% Sy = 13%
03 �16 �21 Grass 16.0505 �37 �48 Grass 5.5408 �3 �4 Citrus 21.6409 �207 �270 Eucalyptus 20.5413 �76 �99 Citrus 9.2415 �33 �43 Sugar cane 6.9416 �106 �138 Grass 4.5818 43 56 Grass 12.5119 15 19 Grass 13.57
264 E. Wendland et al.
storage coefficient, which is generally less than the porosityof the medium.
Eq. (2) assumes that water that reaches the free surface isimmediately stored and the other components of the subsoilwater balance (underground evapotranspiration, base flow,inflow and outflow) are zero during the period of recharge.
Healy and Cook (2002) defined that the application of Eq.(2) for all individual water level rises determines an estimateof direct recharge, in which Dh is the difference between thelowest point of the preceding recession curve extrapolated tothe instant of peak and the highest level. The precedingrecession curve is the line that the hydrograph would followin absence of water level rise (Fig. 3). This extrapolation issubjective and intends to describe the delay between begin-ning of precipitation and consequent level rise, due to thenatural movement through the unsaturated zone. The deeprecharge will be the difference between direct rechargeand the sum of subsoil evapotranspiration, base flow and sub-surface net flux through the watershed.
In comparison with methods applied in the unsaturatedzone, the WTF method can be seen as an integrated approxi-mation and not as a point measurement (Healy and Cook,2002).
Watershed instrumentation
Ribeirao da Onca watershed is equipped with 23 monitoringwells, one pluviometer and one linigraph installed in the wa-tershed. In the neighboring (circa 1.5 km) a complete clima-tologic station is installed. The monitoring wells have beendistributed in order to cover all different soil uses in the wa-tershed (citrus, sugar cane, eucalyptus, etc.). The locationof devices is shown in Fig. 4.
Water level has been measured manually every 15 days inall monitoring wells and twice a day (automatically) in wells09, 13, 15, 16, 18 and 19. A MDS-floater, produced by SEBAHydrometrie, has been used to collect and store in a data-logger the daily measurements. Precipitation was collecteddaily at the pluviometer and continuously at the climato-logic station (CRHEA/USP). Discharge measurements withcurrent meter have been performed every 15 days and alinigraph collected surface water level every 30 min.
Results
Evaluation of subsurface storage (DS)
The subsurface storage evaluation is obtained from the welldata and an estimation of specific yield
DS ¼ Dh � Sy ð3Þ
DS is the subsurface storage, Dh is the water level change ina well during the period under study and Sy is the specificyield. According to Barreto (2006), the specific yield in Ri-beirao da Onca watershed varies between 10% and 13%.
As stated previously there are 23 monitoring wells in thestudy area, however, only nine wells have been consideredin the analysis. The reason is that seven wells fell dry duringthe monitoring period, four wells are too close to the creekand three wells are represented by the remaining (pre-sented similar behavior). The wells considered for the eval-uation are 03, 05, 08, 09, 13, 15, 16, 18, and 19. Table 1shows the values obtained for each well. The large spreadof values is supposed to result from the different surfacevegetation type and depth to the free groundwater surface.This relation will be deeply investigated in a future analysis.

Water balance in the Guarani Aquifer outcrop zone based on hydrogeologic monitoring 265
The final result for variation in underground storage in thebasin is given as an arithmetic mean for all wells. The an-nual subsurface variation in storage appears to be between�47 and �61 mm. These values indicate that in average thewater volume in the free aquifer decreased in the period be-tween 01/01/2005 and 31/12/2005.
Evaluation of direct recharge
Direct recharge estimation has been based on the analysis ofwater level variation and on the identification and extrapo-
-22
-21.5
-21
-20.5
-20
-19.5
-19
21/08/04 29/11/04 09/03/05
T
Lev
el (
m)
- re
f. s
oil
surf
ace
Naq = -5.08 ( p + 580.34 )
rxy=0.99
0.20
Figure 5 Groundwater level and extrapolate
-11.00
-10.50
-10.00
-9.50
-9.00
-8.50
-8.00
-7.50
-7.00
-6.50
31/07/04 08/11/04 16/02/05
T
Lev
el (
m)
- re
f. s
oil
surf
ace
Naq = -5.22( prxy=1
Figure 6 Groundwater level and extrapola
lation of recession curves, following the WTF method. Themethod consists of identification of recession periodsaccording to precipitation events observed in the periodand changes in the slope of the recession curve. After thisfirst identification, the longest one (or the one with moredata) is chosen and a power law function is associated
Naq ¼ a � ðp� p0Þb ð4Þ
Naq is the groundwater level, p is the number of days afterthe first day of monitoring, a, b and p0 are the best fitparameters.
17/06/05 25/09/05 03/01/06
ime
observedextrapolated recession curves
Naq = -4.34 ( p + 399.93 )
Naq = -4.00( p + 22.75 )0.26
rxy=0.99
0.23
rxy=0.99
d recession curves for eucalyptus (well 9).
27/05/05 04/09/05 13/12/05
EMPO
observed
extrapolated recession curves
+3.29 )
Naq = -5.19( p - 351.40 )
.00
0.12
0.12
rxy=1.00
ted recession curves for citrus (well 13).

266 E. Wendland et al.
Once the parameters are defined, the function is appliedto the other periods maintaining a and b close to the valuesof the first recession curve. The recession curves are extrap-olated to the instant of beginning of the next period. The di-rect recharge for the watershed is given as the arithmeticmean of direct recharge calculated by Eq. (2) at all monitor-ing wells.
Figs. 5–8 show the extrapolated curves for monitoringwells located in the areas of vegetation covers of eucalyp-tus, citrus, sugar cane and grass, respectively. It can be ob-served that, specially in the case of eucalyptus, therecharge process appears to be influenced by the soil usage.
-9.00
-8.50
-8.00
-7.50
-7.00
-6.50
-6.00
-5.50
01/08/04 09/11/04 17/02/05
Lev
el (
m)
- re
f. s
oil
surf
ace
Naq =-2.64( p + 237.10 )
Naq =-2.13( p + 53.47 )
rxy=1.00
0.31
rxy=1.00
0.31
Figure 7 Groundwater level and extrapolated
-17.50
-16.50
-15.50
-14.50
-13.50
-12.50
-11.50
09/11/04 29/12/04 17/02/05 08/04/05 28/
Lev
el (
m)
- re
f. so
il su
rfac
e
Naq =-2.64 ( p + 237.10 )
Naq =-2.13 (
rxy=1.00
0.31
rxy=1.00
Figure 8 Groundwater level and extrapola
The annual value of direct recharge obtained as thearithmetic mean of all monitoring wells, considering a spe-cific yield between 0.10 and 0.13 varied between 313 and407 mm in the period between 01/01/2005 and 31/12/2005. Table 2 shows the individual values for each well.
Evaluation of base flow
For hydraulically connected river–aquifer systems, the baseflow rate qb is a function of the difference (DH) betweengroundwater level and the free surface of the river, as sche-matized in Fig. 9.
28/05/05 05/09/05 14/12/05
Time
observedextrapolated recession curves
Naq =-2.35( p - 56.41 )
rxy=1.00
0.31
recession curves for sugar cane (well 15).
05/05 17/07/05 05/09/05 25/10/05 14/12/05
Time
observed
extrapolated recession curves
p + 53.47 )
Naq =-2.35 ( p -56.41 )
0.31
rxy=1.00
0.31
ted recession curves for grass (well 19).

Water balance in the Guarani Aquifer outcrop zone based on hydrogeologic monitoring 267
This mechanism, based on Darcy’s Law can be expressedby the function (Sophocleous, 2002)
qb ¼ a � DH ð5Þ
in which a is the leakage coefficient.
Table 2 Direct recharge (mm) estimated for each well in2005
Well Rd (mm) Surface cover Mean depth (m)
Sy = 10% Sy = 13%
03 215 278 Grass 16.0505 228 296 Grass 5.5408 534 694 Citrus 21.6409 37 48 Eucalyptus 20.5413 324 421 Citrus 9.2415 258 335 Sugar cane 6.9416 145 188 Grass 4.5818 541 703 Grass 12.5119 536 697 Grass 13.57
Figure 9 Representative scheme of interaction between anaquifer and a river.
1/1/
2005
31/1
/200
5
2/3/
2005
1/4/
2005
1/5/
2005
31/5
/200
5
30/6
/200
5
Time
0.40
0.50
0.60
0.70
0.80
0.90
1.00
1.10
1.20
1.30
Bas
e fl
ow (
m3/
s)
qb = 0.0143 .
Figure 10 Best adjustment
According to Sophocleous (2002) this linear function istoo simple. Actually the base flow recession is independentof the coefficient a. Rushton and Tomlinson (1979) proposeda non-linear function to represent the relation between flowand water level difference
qb ¼ b1ð1� e�c1DHÞ ð6Þ
in which b1 and c1 are constants. This function imposes limitson the base flow. When DH tends to zero, the value of qbalso tends to zero. When DH tends to infinity, qb tends tothe value of b1. This implies that the model reacts slowerto changes in the aquifer level when the base flow ap-proaches a maximum.
For cases with no limit on maximum base flow, Rushtonand Tomlinson (1979) propose a combination of bothfunctions
qb ¼ a1 � DH þ b2 � 1� e�c2 �DH� �
ð7Þ
in which a1, b2 and c2 are constants.Following these hypotheses, the base discharge (qb) in
the creek can be estimated for all monitoring wells either by
qb ¼Xn
i¼1bi � ð1� e�ci�DHiÞ ð8Þ
or
qb ¼Xn
i¼1ai � DHi þ bi � 1� e�ci �DHi
� �� �ð9Þ
in which ai, bi and ci are the parameters of the function andDHi is the difference between groundwater level and thefree surface of the river in a given period of time.
The formulations in Eqs. (8) and (9) stipulate individualcoefficients for the wells in the evaluation of base flow inresponse to water level variation in each well. As the base
0.00
20.00
40.00
60.00
80.00
100.00
120.00
140.00
30/7
/200
5
29/8
/200
5
28/9
/200
5
28/1
0/20
05
27/1
1/20
05
27/1
2/20
05
Pre
cip
itat
ion
(m
m)
hn + 2.2600 . (1 - e -(-8.2819) . )
measured
equation for base flow.

Table 3 Monthly estimate of base flow in Ribeirao da Onca for year 2005 using the equivalent water depth from the drainagearea
Time JAN FEV MAR ABR MAI JUN JUL AGO SET OUT NOV DEZ
Base flow (mm) 32 38 43 39 39 36 35 33 30 29 27 26
268 E. Wendland et al.
flow determination produces rather limited number of val-ues, it is difficult to obtain numerous parameters, no matterhow efficient the fitting procedure. An alternative methodfor evaluation of base flow is to assume that a unit water le-vel variation in any monitoring well produces the same basedischarge variation in the creek. The previous Eqs. (8) and(9) assume the following form:
qb ¼ b1 � ð1� e�c1 �RDHnÞ; ð10Þqb ¼ a1 � RDHn þ b1 � ð1� e�c1 �RDHnÞ ð11Þ
RDHn is the sum of level variations in all monitoring wells ina given period of time.
The function constants (ai, bi and ci) have been chosenbased on mean error and correlation coefficient betweencalculated and measured discharges.
Eq. (11) showed the best agreement with the observedvalues, using the data of water level changes in wells 05,08, 13, 15, 16, 18 and 19 (Fig. 10). The best fit produceda mean error of 0.02 m3/s with zero bias and a correlationcoefficient of 0.92 in the estimated base flow. The esti-mated peak discharge of 0.87m3/s compares well with theobserved value of 0.90m3/s. The parameters for the equa-tion are a = 0.0143, b = 2.2600 and c = �8.2819.
The annual base flow was estimated to be 22,115,035 m3,corresponding to an equivalent depth of 419 mm in year2005. Table 3 shows the obtained values for each month.
Water balance
The proposed method assumes as control volume the satu-rated zone of the aquifer in the watershed (Fig. 2). Thedeep recharge is the residual of equation
Rp ¼ Rd � qb � DS: ð12Þ
Considering the values obtained in the previous sections,the residual value for the water balance, assumed to be thedeep recharge, varies between �59 and 49 mm, accordingto Table 4. Preliminary works related to the GAS estimatedthe deep recharge at the outcrop areas in the order of 15%of the precipitation (Reboucas, 1976). More recently, Chang(2001) reevaluated the deep recharge with an estimatedavailability in the order of 4% of the precipitation. The pres-ent work shows a good agreement with the last estimate.
Table 4 Water balance (mm) for 2005
Component Sy = 10% Sy = 13%
Direct recharge (Rd) 313 407Subsurface storage variation (Ds) �47 �61Base flow (qb) 419 419Deep recharge (Rp) �59 49
Conclusion
This work aimed at an estimation of deep recharge, basedon hydrogeologic monitoring data. The water level variationhas been used to evaluate direct recharge, base flow andsubsurface storage.
Direct recharge in the Ribeirao da Onca watershed, esti-mated by the water table fluctuation method, presented avalue between 313 and 407 mm, corresponding to 22–29%of the total precipitation (1410 mm), respectively. A powerlaw function for the extrapolation of recession curves inmonitoring wells proved to be efficient. The correlation be-tween estimated and observed base flow values is close to1, with quadratic errors in the order of millimeters.
Deep recharge in year 2005, obtained from a water bal-ance, indicates a value between �59 and 49 mm, for spe-cific yield of 10% and 13%, respectively. The negativevalue does not make sense, since the watershed is locatedin a high altitude with no lateral influx. The positive resultindicates very low vertical flux, corresponding to 3.5% ofthe precipitation in the period.
The evaluation with the proposed water balance methodappears to be efficient since the uncertainty related toevapotranspiration estimation, soil moisture changes, totaldischarge in the creek and interception phenomena could bereduced. On the other hand, a strong dependence on thespecific yield estimation preserves a given uncertainty onthe evaluation based on groundwater level fluctuations.
Evaluation of monitoring data at the Ribeirao da Oncawatershed confirms the importance of the need for longtime studies. Also, the period of one year is not sufficient,since seasonal influences (extreme dry or wet year) cannotbe excluded. However, it served to establish the methodol-ogy for future work.
Acknowledgements
The authors are grateful to the reviewers for their helpfulcomments and suggestions, which improved the final qualityof the paper. The work was financially supported by the Uni-versity Fund for the Environmental Protection and Sustain-able Development of the Guarani Aquifer System Project,through SG/OEA. The authors also thank to CNPq/Brazilfor fellowships and to TUBerlin for technical support andcooperation.
References
Barreto, C.E.A.G. 2006. Balanco hıdrico em zona de afloramento doaquıfero Guarani a partir de monitoramento hidrogeologico embacia representativa. Dissertacao de Mestrado, Sao Carlos,EESC-USP-SHS.

Water balance in the Guarani Aquifer outcrop zone based on hydrogeologic monitoring 269
Beekman, H.E., Gieske, A., Selaolo, E.T., 1996. GRES: groundwaterrecharge studies in Botswana 1987–1996. Botswana J. Earth Sci.III, 1–17.
Chang, H.K. 2001. Uso atual e Potencial do Aquıfero Guarani –Brasil atividade 3b. Protecao Ambiental e GerenciamentoSustentavel Integrado do Aquıfero Guarani, Technical report(unpublished).
Contin Neto, D. 1987. Balanco Hıdrico em Bacia Hidrografica situadaem Regiao de Recarga do Aquıfero Botucatu. Tese de Doutorado,Sao Carlos, EESC-USP-SHS.
Correa, U.M.P. 1995. Estudo das Aguas Subterraneas das BaciasHidrograficas dos Rios Jacare-Guacu e Jacare-Pepira no Estado deSao Paulo. Dissertacao de Mestrado, EESC-USP-SHS, vol. 2, 107 p.
De Vries, J.J., Simmers, I., 2002. Groundwater recharge: anoverview of processes and challenges. Hydrogeol. J. 10, 5–17.
Giampa, C.E.Q., Souza, J.C. 1982. Potencial Aquıfero dos Basaltosda Formacao Serra Geral no Estado de Sao Paulo. 2�. CABAS,Salvador, BA, pp. 3–15.
Healy, R.W., Cook, P.G., 2002. Using groundwater levels toestimate recharge. Hydrogeol. J. 10, 91–109.
Kinzelbach, W. (Org). 2002. A survey of methods for groundwaterrecharge in arid and semi-arid regions. Early Warning andAssessment Report Series, UNEP/DEWA/RS.02/2. United NationsEnvironment Programme, Nairobe, Kenia.
Lerner, D.N., Issar, A.S., Simmers, I. 1990. Groundwater recharge:a guide to understanding and estimating natural recharge.
International Contributions to Hydrogeology, vol. 8. Interna-tional Association of Hydrogeologists, Verlag Heinz Heise.
Maziero, T.A. 2005. Monitoramento de agua subterranea em AreaUrbana: Aspectos Quantitativos. Dissertacao de Mestrado, SaoCarlos, EESC-USP-SHS.
Matos, I.S., 1987. Aplicacao de um Modelo de Balanco Hıdrico naBacia do Rio Jacare- Guacu. Dissertacao de Mestrado, SaoCarlos, SHS-EESC-USP.
Reboucas, A.C. 1976. Recursos hıdricos da Bacia do Parana, SaoPaulo, SP. Tese de Livre Docencia, Igc/USP, 143p.
Rushton, K.R., Tomlinson, L.M., 1979. Possible mechanismsfor leakage between aquifers and rivers. J. Hydrol. 40,49–65.
Sanford, W., 2002. Recharge and groundwater: an overview.Hydrogeol. J. 10, 110–120.
Scanlon, B.R., Healy, R.W., Cook, P.G., 2002. Choosing appropriatetechniques for quantifying groundwater recharge. Hydrogeol. J.10, 18–39.
Simmers, I. 1989. Natural groundwater recharge estimation insemiarid zones: some state-of-art observations. In: Proceedingsof the Sahel Forum, the State-of-Art of Hydrology and Hydrog-eology in the Arid and Semi-Arid Areas of Africa, Ouagadougou,Burkina Faso, February, pp. 374–386.
Sophocleous, M., 2002. Interaction between groundwater andsurface water; the state of the science. Hydrogeol. J. 10, 52–67.