detection and classification of neurotoxins using a novel short-term plasticity quantification...
TRANSCRIPT
Detection and classification of neurotoxins using a novel short-termplasticity quantification method
Ghassan Gholmieh a,*, Spiros Courellis a, Saman Fakheri a, Eric Cheung c,Vasilis Marmarelis a, Michel Baudry a,b, Theodore Berger a,b
a Department of Biomedical Engineering, University of Southern California, Hedco Neuroscience Bldg, 3614 Watt Way, Los Angeles, CA 90089-1451,
USAb Neuroscience Program, University of Southern California, Los Angeles, CA 90089-2520, USA
c Department of Biological Sciences, University of Southern California, Los Angeles, CA 90089-0371, USA
Received 15 August 2002; received in revised form 29 January 2003; accepted 8 March 2003
Abstract
A tissue-based biosensor is described for screening chemical compounds that rapidly affect the nervous system. The proposed
sensor is an extension of a previous work on cultured hippocampal slices [Biosens. Bioelectron. 16 (2001) 491]. The detection of the
chemical compounds is based on a novel quantification method of short-term plasticity (STP) of the CA1 system in acute
hippocampal slices, using random electrical impulse sequences as inputs and population spike (PS) amplitudes as outputs. STP is
quantified by the first and the second order kernels using a variant of the Volterra modeling approach. This approach is more
specific and time-efficient than the conventional paired pulse and fixed frequency train methods [J. Neurosci. Methods 2 (2002) 111].
Describing the functional state of the biosensor, the kernels changed accordingly as chemical compounds were added. The second
order kernel was decomposed into nine Laguerre functions. The corresponding Laguerre coefficients along with the first order
kernel were used as features for classification purposes. The biosensor was tested using picrotoxin (100 mM), trimethylopropane
phosphate (10 mM), tetraethylammonium (4 mM), valproate (5 mM), carbachol (5 mM), DAP5 (25 mM), CNQX (3 mM), and
DNQX (0.15, 1.5, 3, 5 and 10 mM). Each chemical compound gave a different feature profile corresponding to its pharmacological
class. The first order kernel and the Laguerre coefficients formed the input to an artificial neural network (ANN) comprised of a
single layer of perceptrons. The ANN was able to classify each tested compound into its respective class.
# 2003 Elsevier Science B.V. All rights reserved.
Keywords: CA1; Kernels; Nonlinear analysis; Paired pulse; Random train; Short-term plasticity
1. Introduction
Detection and characterization of chemical com-
pounds that affect the nervous system have potential
applications in the industrial and the military fields to
identify hazardous compounds that could be harmful to
civilian population and to military personnel. The major
disadvantage of the current sensors is their limited
ability to differentiate between various classes of che-
mical compounds. In order to test for a variety of
compounds, different calibrated apparatuses are needed
and unknown chemical compounds may be missed.
Therefore, there is a need to develop a new type of
sensor that can detect newly uncharacterized chemical
compounds. In this article, we propose a screening
biosensor based on the quantification of short-term
plasticity (STP) of the CA1 hippocampal system in vitro
using a newly developed approach.
The hippocampal slice with its preserved tri-synaptic
pathway (Andersen et al., 1971) has been a widely used
experimental preparation for investigating memory
mechanisms and drug effects, using long-term potentia-
tion (LTP) and STP (Bliss and Lomo, 1973; Alger and
Teyler, 1976; Fountain and Teyler, 1995; Xie et al.,
1997; Buonomano, 1999, 2000). STP based methods are
typically chosen to assess drug effects of rapidly acting
* Corresponding author. Tel.: �/1-213-740-8061; fax: �/1-213-740-
5687.
E-mail address: [email protected] (G. Gholmieh).
Biosensors and Bioelectronics 18 (2003) 1467�/1478
www.elsevier.com/locate/bios
0956-5663/03/$ - see front matter # 2003 Elsevier Science B.V. All rights reserved.
doi:10.1016/S0956-5663(03)00120-9
chemical compounds since they require less experimen-
tal time.
Current experimental methods for measuring STP are
mostly based on the analysis of paired pulse (Dobrunz etal., 1997; Leung and Fu, 1994; Creager et al., 1980) or
fixed frequency train stimulation (Papatheodoropoulos
and Kostopoulos, 2000; Buonomano, 1999; Pananceau
et al., 1998; Castro-Alamancos and Connors, 1997).
These methods lack the ability to test all the possible
time intervals in a time efficient manner. Based on a
variant of the Volterra modeling approach, we have
developed and implemented an efficient method tocharacterize and quantify STP using Poisson distributed
random train (RIT) stimulation (Gholmieh et al., 2002).
It can be viewed as a hybrid between the paired pulse
and the fixed frequency train approaches. However, it is
more time efficient than both of them. Responses to a
large variety of interimpulse intervals can be evaluated
in 3 min in contrast to several hours when using the
paired pulse approach (Gholmieh et al., 2001, 2002).The computed STP descriptors of the underlying non-
linear dynamics were the first and second order kernels
that describe the state of the system. The second order
kernel was further linearly decomposed into nine
Laguerre functions. The first order kernel and the
coefficients of the Laguerre expansion of the second
order kernel were used as features for the classification
of chemical compounds.The proposed biosensor is an extension of a pre-
viously introduced tissue-based biosensor for detecting
compounds affecting cognitive function (Gholmieh et
al., 2001). The biosensor consisted of hippocampal slices
cultured over a multielectrode array. The current
biosensor was tested using a more extensive list of
chemical compounds consisting of six different classes:
GABAA receptor antagonists (picrotoxin and TMPP),cholinergic agonists (carbachol), potassium channel
blockers (TEA), NMDA receptor antagonists (DAP5),
AMPA receptor antagonists (DNQX and CNQX), and
antiepileptic drugs-Na� and Ca�� channel blockers
(valproate). Each class gave a different feature profile.
The first order kernel and the Laguerre coefficients
formed the input to a artificial neural network (ANN)
comprised of a single layer of perceptrons. The ANNwas able to classify each tested compound into its
respective class.
The article is organized into three sections: (1)
Materials and Methods, that describes the experimental
setup, the data analysis approach, and the classification
algorithm; (2) Results, that presents the changes induced
by the chemical compounds on the Volterra kernels (and
the Laguerre coefficients), and the outcome of theclassification method; (3) Discussion, that concludes
the article by summarizing the advantages of the new
biosensor and comparing the obtained results with those
reported in the paired-pulse literature.
2. Materials and methods
2.1. Hardware materials
Electrophysiological recordings were conducted usinga multimicroelectrode plate (MMEP) setup (Gholmieh
et al., 2001). It consisted of a 64-electrode array (Gross
et al., 1993; Univ. North Texas, http://www.cnns.org),
pre-amp, data acquisition boards, and custom-designed
software. The gold plated electrode Indium-Tin Oxide
tips were arranged into an 8�/8 formation (MMEP-4
design) with an inter-electrode distance of 150 mm.
The signals were amplified �/2500 with the help ofcustom-built Plexon preamplifiers (http://www.plexo-
ninc.com). Two synchronized data acquisition boards
(Microstar; DAP 3200/214e series) were installed in
parallel in a Pentium II 450 MHz personal computer
and were able to handle 32 analog inputs with a
sampling rate of 7.35 kHz. The recorded responses
were evoked population spike (PS) field potential wave-
forms in the range of [200�/1500 mV]. Stimulation wasapplied through an analog output channel of one data
acquisition board to a Master-8 timing box (A.M.P.I).
The triggered Master-8 then sent two 5 V pulses, 50 ms
apart, to two stimulation boxes (Iso Flex, A.M.P.I.)
connected in parallel and opposite polarity to a twisted
Nichrome electrode. The software for data recording,
preprocessing, and on-line analysis was based on
Matlab.
2.2. Hippocampal slice preparation
Halothane anesthetized adult rats were decapitated.
The hippocampus was extracted and bathed in iced
aCSF. Transverse slices (thickness 400�/500 mm) were
collected using a Leika vibratome (VT 1000S) and were
left for 2 h in aCSF to recover at room temperature. Thecomposition of aCSF was: NaCl, 128 mM; KCl, 2.5
mM; NaH2PO4, 1.25 mM; NaHCO3, 26 mM; Glucose,
10 mM; MgSO4, 2 mM; ascorbic acid, 2 mM; CaCl2, 2
mM; aerated with 95% O2, 5% CO2. During the
recording phase, slices were perfused with aCSF at
room temperature (same composition as above but with
the MgSO4 concentration modified to 1 mM) and were
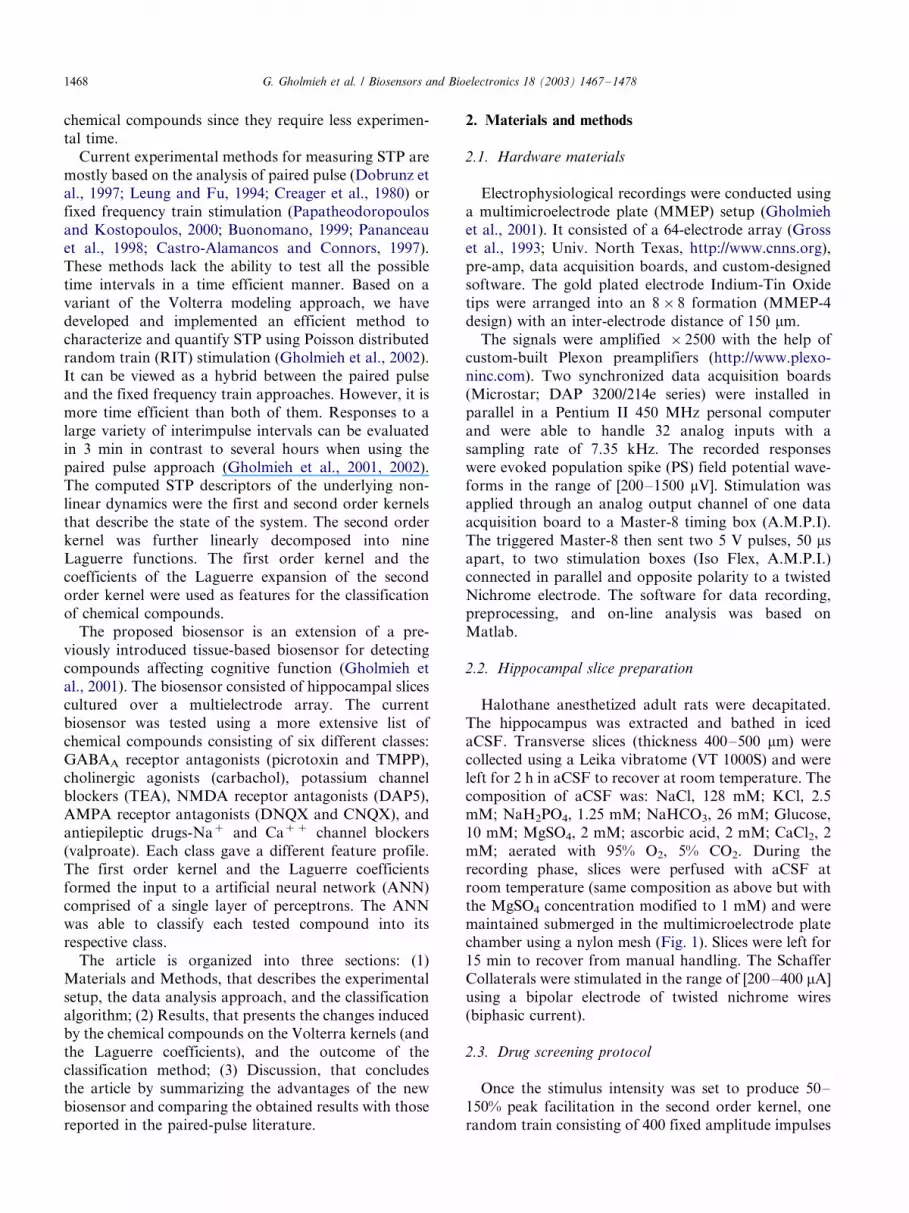
maintained submerged in the multimicroelectrode platechamber using a nylon mesh (Fig. 1). Slices were left for
15 min to recover from manual handling. The Schaffer
Collaterals were stimulated in the range of [200�/400 mA]
using a bipolar electrode of twisted nichrome wires
(biphasic current).
2.3. Drug screening protocol
Once the stimulus intensity was set to produce 50�/
150% peak facilitation in the second order kernel, one
random train consisting of 400 fixed amplitude impulses
G. Gholmieh et al. / Biosensors and Bioelectronics 18 (2003) 1467�/14781468
with Poisson distributed interimpulse intervals (mean
frequency of 2 Hz) was delivered to the Schaffer
collaterals using the Nichrome electrode. After bathing
the slice for 10 min with the chemical compound of
interest, another random train of electrical impulses was
sent. Nine sets of experiments were conducted. One set
was a negative control. The other sets included: picro-toxin (100 mM), TMPP (10 mM), TEA (4 mM),
valproate (5 mM), carbachol (5 mM), DAP5 (25 mM),
CNQX (3 mM), and DNQX. The DNQX set was further
divided into five subsets of different concentrations:
0.15, 1.5, 3, 5, and 10 mM.
2.4. Analytical methods
The data was analyzed using the Volterra modeling
approach adapted for random interimpulse intervalstimuli sequences and PS amplitude response sequence
(Courellis et al., 2000; Gholmieh et al., 2002). A second
order model was used, expressed by the following
equation:
y(ni)�k1�X
ni�mBnjBni
k2(ni�nj) (1)
where, ni is the time of occurrence of the i- th stimulus
impulse, nj is the time of occurrence of the j- th stimulus
impulse prior to the i-th stimulus impulse, y (ni) is theamplitude of the PS response to the i- th stimulus
impulse, m is the memory of the biological system, k1
is the first order kernel, and k2 is the second order
kernel. The first order kernel represents the mean PS
amplitude, while the second order kernel quantifies the
effect on the current PS amplitude of the interaction
between the current stimulus impulse and each past
stimulus impulse within the memory window m . Thesecond order kernel can be further decomposed into a
linear combination of L Laguerre functions (Marmar-
elis, 1993) in the form of:
k2(ni�nj)�XL�1
l�0
clLl(ni�nj) (2)
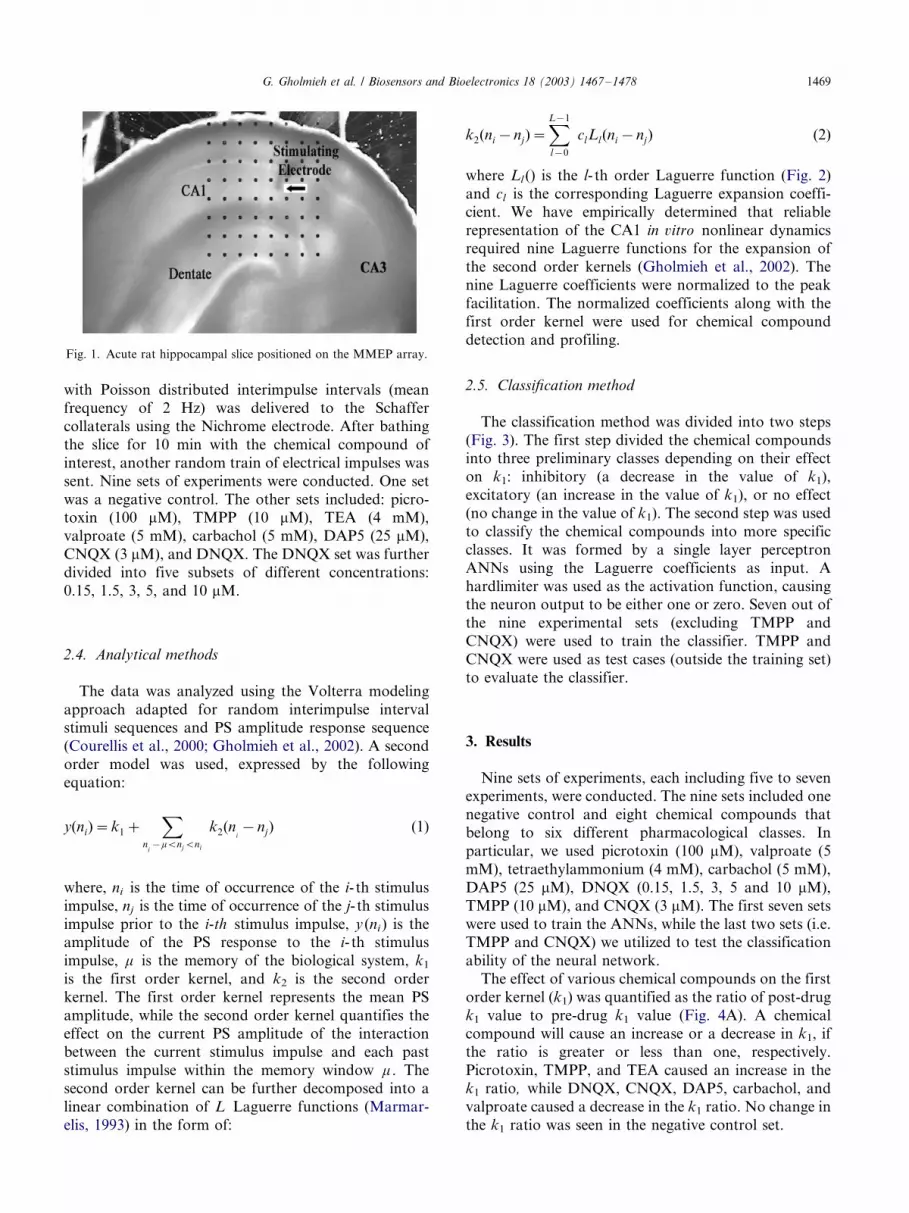
where Ll () is the l- th order Laguerre function (Fig. 2)
and cl is the corresponding Laguerre expansion coeffi-
cient. We have empirically determined that reliable
representation of the CA1 in vitro nonlinear dynamicsrequired nine Laguerre functions for the expansion of
the second order kernels (Gholmieh et al., 2002). The
nine Laguerre coefficients were normalized to the peak
facilitation. The normalized coefficients along with the
first order kernel were used for chemical compound
detection and profiling.
2.5. Classification method
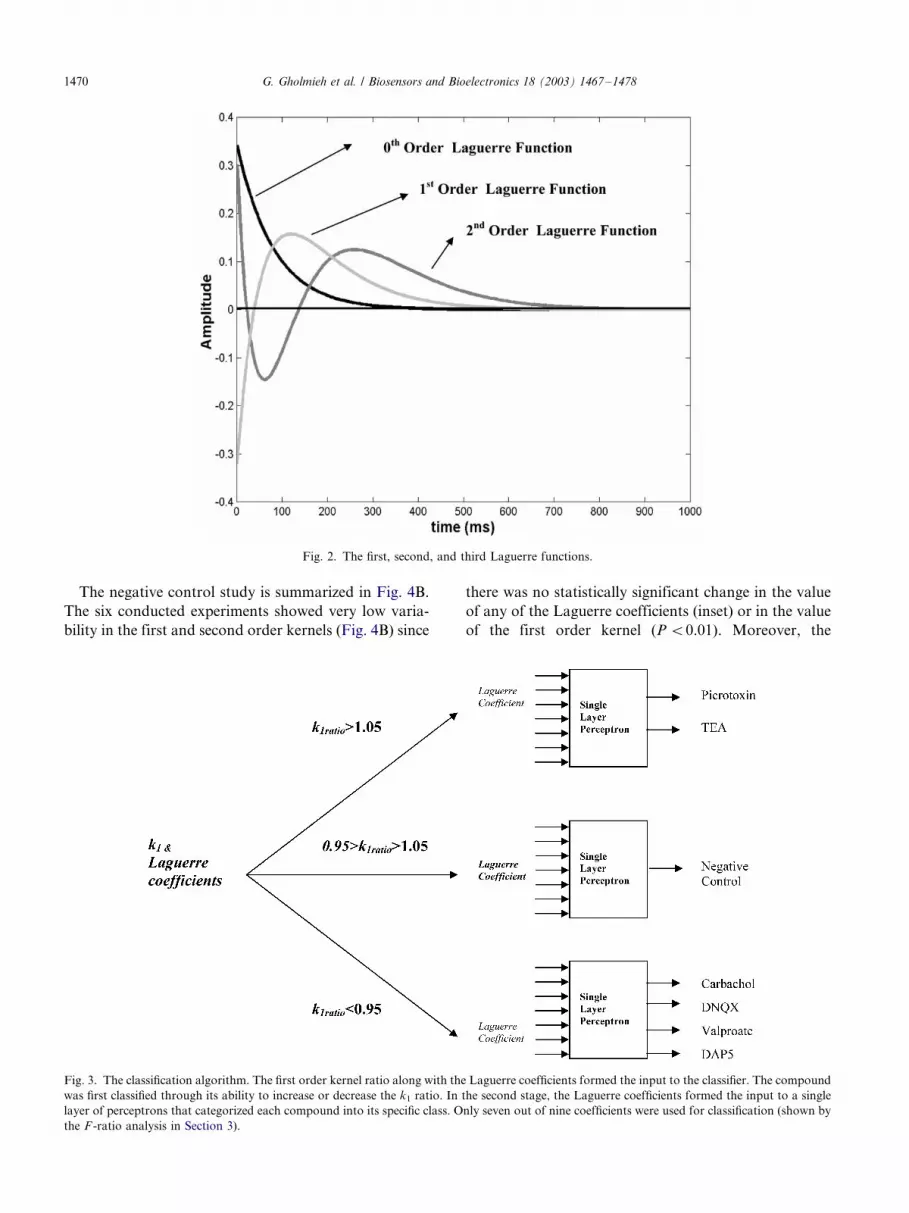
The classification method was divided into two steps
(Fig. 3). The first step divided the chemical compoundsinto three preliminary classes depending on their effect
on k1: inhibitory (a decrease in the value of k1),
excitatory (an increase in the value of k1), or no effect
(no change in the value of k1). The second step was used
to classify the chemical compounds into more specific
classes. It was formed by a single layer perceptron
ANNs using the Laguerre coefficients as input. A
hardlimiter was used as the activation function, causingthe neuron output to be either one or zero. Seven out of
the nine experimental sets (excluding TMPP and
CNQX) were used to train the classifier. TMPP and
CNQX were used as test cases (outside the training set)
to evaluate the classifier.
3. Results
Nine sets of experiments, each including five to sevenexperiments, were conducted. The nine sets included one
negative control and eight chemical compounds that
belong to six different pharmacological classes. In
particular, we used picrotoxin (100 mM), valproate (5
mM), tetraethylammonium (4 mM), carbachol (5 mM),
DAP5 (25 mM), DNQX (0.15, 1.5, 3, 5 and 10 mM),
TMPP (10 mM), and CNQX (3 mM). The first seven sets
were used to train the ANNs, while the last two sets (i.e.TMPP and CNQX) we utilized to test the classification
ability of the neural network.
The effect of various chemical compounds on the first
order kernel (k1) was quantified as the ratio of post-drug
k1 value to pre-drug k1 value (Fig. 4A). A chemical
compound will cause an increase or a decrease in k1, if
the ratio is greater or less than one, respectively.
Picrotoxin, TMPP, and TEA caused an increase in thek1 ratio, while DNQX, CNQX, DAP5, carbachol, and
valproate caused a decrease in the k1 ratio. No change in
the k1 ratio was seen in the negative control set.
Fig. 1. Acute rat hippocampal slice positioned on the MMEP array.
G. Gholmieh et al. / Biosensors and Bioelectronics 18 (2003) 1467�/1478 1469
The negative control study is summarized in Fig. 4B.
The six conducted experiments showed very low varia-
bility in the first and second order kernels (Fig. 4B) since
there was no statistically significant change in the value
of any of the Laguerre coefficients (inset) or in the value
of the first order kernel (P B/0.01). Moreover, the
Fig. 2. The first, second, and third Laguerre functions.
Fig. 3. The classification algorithm. The first order kernel ratio along with the Laguerre coefficients formed the input to the classifier. The compound
was first classified through its ability to increase or decrease the k1 ratio. In the second stage, the Laguerre coefficients formed the input to a single
layer of perceptrons that categorized each compound into its specific class. Only seven out of nine coefficients were used for classification (shown by
the F -ratio analysis in Section 3).
G. Gholmieh et al. / Biosensors and Bioelectronics 18 (2003) 1467�/14781470
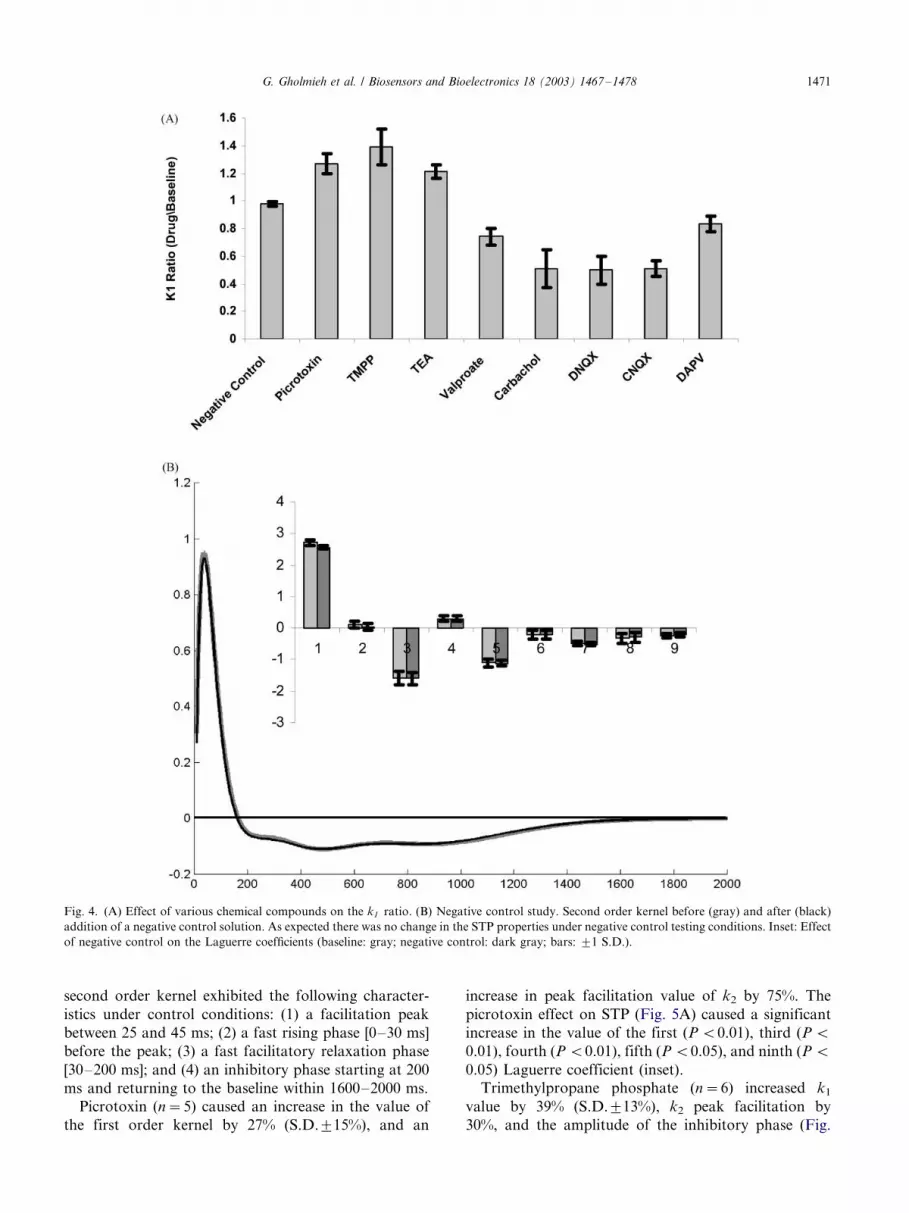
second order kernel exhibited the following character-
istics under control conditions: (1) a facilitation peak
between 25 and 45 ms; (2) a fast rising phase [0�/30 ms]
before the peak; (3) a fast facilitatory relaxation phase
[30�/200 ms]; and (4) an inhibitory phase starting at 200
ms and returning to the baseline within 1600�/2000 ms.
Picrotoxin (n�/5) caused an increase in the value of
the first order kernel by 27% (S.D.9/15%), and an
increase in peak facilitation value of k2 by 75%. The
picrotoxin effect on STP (Fig. 5A) caused a significant
increase in the value of the first (P B/0.01), third (P B/
0.01), fourth (P B/0.01), fifth (P B/0.05), and ninth (P B/
0.05) Laguerre coefficient (inset).Trimethylpropane phosphate (n�/6) increased k1
value by 39% (S.D.9/13%), k2 peak facilitation by
30%, and the amplitude of the inhibitory phase (Fig.
Fig. 4. (A) Effect of various chemical compounds on the k1 ratio. (B) Negative control study. Second order kernel before (gray) and after (black)
addition of a negative control solution. As expected there was no change in the STP properties under negative control testing conditions. Inset: Effect
of negative control on the Laguerre coefficients (baseline: gray; negative control: dark gray; bars: 9/1 S.D.).
G. Gholmieh et al. / Biosensors and Bioelectronics 18 (2003) 1467�/1478 1471

Fig. 5. Effect of various chemical compounds on the second order kernel and the corresponding Laguerre coefficients. Baseline second order kernel
and the corresponding Laguerre coefficients (Inset): shown in gray. Chemical compound effect on the second order kernel shown in black. The effect
of the chemical compound on the Laguerre coefficients shown in dark gray. (A) Picrotoxin. (B) TMPP. (C) Tetraethylammonium. (D) Carbachol. (E)
DNQX. (F) CNQX.
G. Gholmieh et al. / Biosensors and Bioelectronics 18 (2003) 1467�/14781472
5B). TMPP also caused a significant increase in the
value of the first (P B/0.05), third (P B/0.05), fifth (P B/
0.01), and seventh (P B/0.05) Laguerre coefficient (in-
set).TEA (n�/6) at 4 mM increased the value of k1 by 21%
(S.D.9/11%), decreased the peak facilitation value of k2
by 60%, increased the early inhibitory phase [5�/15 ms]
and the area of the late inhibitory phase [200�/1200 ms]
(Fig. 5C). TEA also caused statistically significant
change in the value of the first (P B/0.01), fourth (P B/
0.01), sixth (P B/0.05) and ninth (P B/0.05) Laguerre
coefficient (inset).Carbachol (n�/6) at 5 mM caused the STP properties
of CA1 to shift from facilitation to depression. In
addition to causing the k1 value to drop by 49%
(S.D.9/36%), carbachol caused the second order kernel
to become a negative exponential decaying function with
peak inhibition value of �/30% (Fig. 5D). The effect is
reflected in a statistically significant manner in the
Laguerre coefficients (inset). In particular, the value ofthe first and fourth coefficient became negative, and the
value of the second, third, fifth, and seventh Laguerre
coefficient was markedly decreased (P B/0.01).
DNQX at 3 mM (n�/6) caused a decrease in the value
of the first order kernel by 49% (S.D.9/24%) and in k2
peak facilitation value by 25% (Fig. 5E). The effect of
DNQX was further characterized through the changes
in the Laguerre Coefficients. Variations were observedin the value of the third (P B/0.01), fifth (P B/0.05),
seventh (P B/0.01), and ninth (P B/0.01) Laguerre
coefficient (inset). No significant change was seen in
the value of the first coefficient.
CNQX (n�/5) caused a decrease in the value of the
first order kernel by 50% (S.D.9/12%) and in the k2 peak
facilitation value by 15% (Fig. 5F). Like DNQX, no
significant change was seen in the value of the firstcoefficient, but a decrease was observed in the value of
the third, fifth (P B/0.05), seventh (P B/0.01), and ninth
(P B/0.01) coefficient.
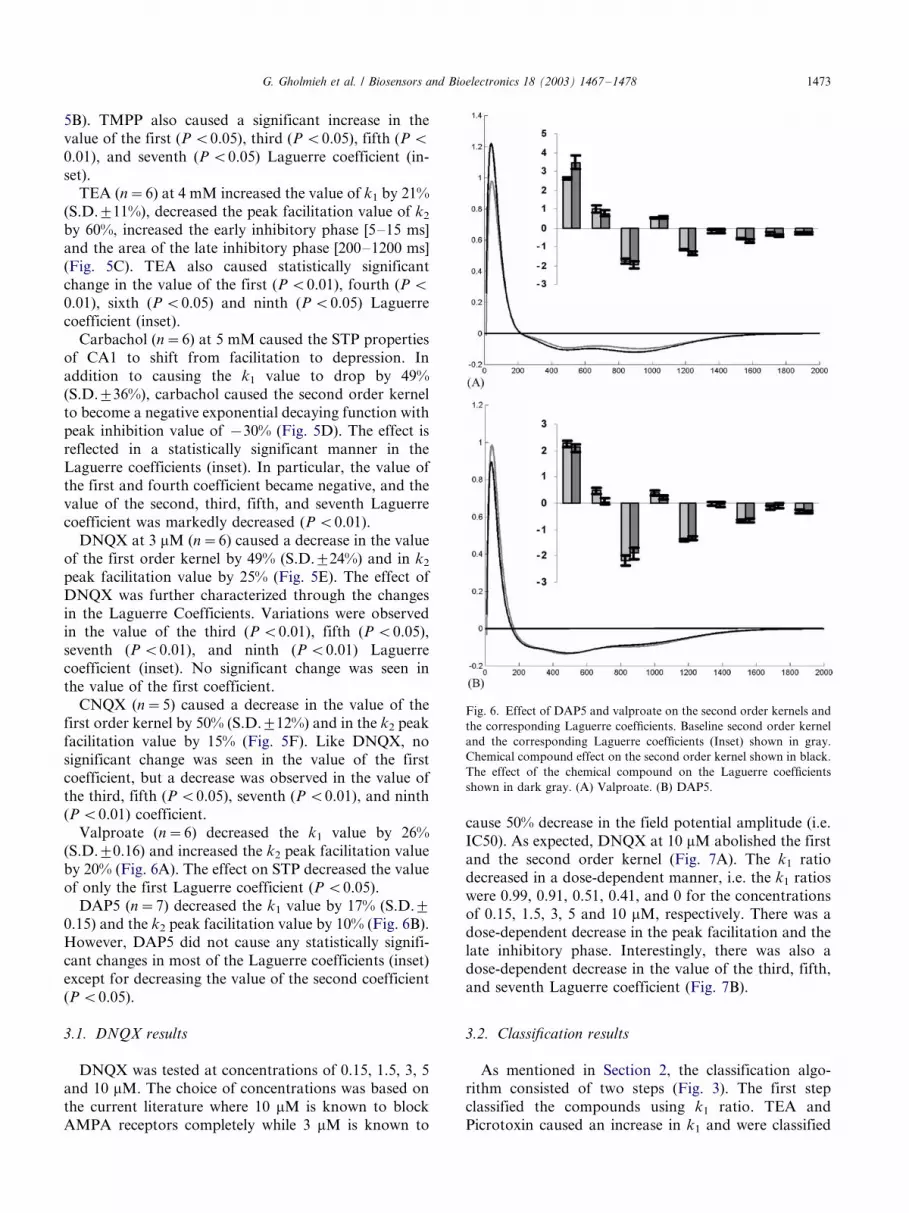
Valproate (n�/6) decreased the k1 value by 26%
(S.D.9/0.16) and increased the k2 peak facilitation value
by 20% (Fig. 6A). The effect on STP decreased the value
of only the first Laguerre coefficient (P B/0.05).
DAP5 (n�/7) decreased the k1 value by 17% (S.D.9/
0.15) and the k2 peak facilitation value by 10% (Fig. 6B).
However, DAP5 did not cause any statistically signifi-
cant changes in most of the Laguerre coefficients (inset)
except for decreasing the value of the second coefficient
(P B/0.05).
3.1. DNQX results
DNQX was tested at concentrations of 0.15, 1.5, 3, 5and 10 mM. The choice of concentrations was based on
the current literature where 10 mM is known to block
AMPA receptors completely while 3 mM is known to
cause 50% decrease in the field potential amplitude (i.e.
IC50). As expected, DNQX at 10 mM abolished the first
and the second order kernel (Fig. 7A). The k1 ratio
decreased in a dose-dependent manner, i.e. the k1 ratios
were 0.99, 0.91, 0.51, 0.41, and 0 for the concentrationsof 0.15, 1.5, 3, 5 and 10 mM, respectively. There was a
dose-dependent decrease in the peak facilitation and the
late inhibitory phase. Interestingly, there was also a
dose-dependent decrease in the value of the third, fifth,
and seventh Laguerre coefficient (Fig. 7B).
3.2. Classification results
As mentioned in Section 2, the classification algo-rithm consisted of two steps (Fig. 3). The first step
classified the compounds using k1 ratio. TEA and
Picrotoxin caused an increase in k1 and were classified
Fig. 6. Effect of DAP5 and valproate on the second order kernels and
the corresponding Laguerre coefficients. Baseline second order kernel
and the corresponding Laguerre coefficients (Inset) shown in gray.
Chemical compound effect on the second order kernel shown in black.
The effect of the chemical compound on the Laguerre coefficients
shown in dark gray. (A) Valproate. (B) DAP5.
G. Gholmieh et al. / Biosensors and Bioelectronics 18 (2003) 1467�/1478 1473

in the first preliminary class. The negative control
caused no change in the k1 ratio and formed the second
preliminary class. Valproate, DNQX, DAP5 and carba-
chol formed the third preliminary class through their
depressive effect on k1. The second step of the classifica-
tion algorithm consisted of feeding the Laguerre coeffi-
cient into the ANN.
In order to determine which coefficients were suitable
for the second classification step, we used one-way
ANOVA to analyze the pre-drug baseline among the
different experimental sets. Statistical analysis of the
pre-drug baseline parameters indicated that the first
order kernel and the first, third, fourth, fifth, sixth,
seventh, and eight Laguerre coefficient were sampled
from the same population (Table 1, FcriticalB/3.35). The
inset in Fig. 8 shows the averaged coefficients across the
different experimental sets with the corresponding
second order kernel shown in the background.
Since the second and the ninth coefficients were
statistically non-significant, the number of inputs to
the neural network was reduced to seven. Overall the
ANN was able to classify 81% of the forty-three training
experiments. The results were as follows: picrotoxin (4/
5), TEA (5/6), negative control (6/7), valproate (5/6),
carbachol (5/6), DAP5 (5/7), and DNQX (4/6). The
trained neural network classified the 1.5, 3 and 5 mM
sets of DNQX correctly, and the 0.15 mM set of DNQX
as negative control. The latter result was anticipated
since DNQX at a concentration of 0.15 mM did not
affect k1 or k2 (Fig. 7A). The classifier also classified
TMPP in the same class as picrotoxin and CNQX in the
same class as DNQX. This result was expected, since
Fig. 7. DNQX Effect on STP. (A) Dose-dependent decrease in the peak facilitation and the late inhibitory phase of the second order kernel. (B)
Dose-dependent decrease in the value of the third, fifth, and seventh Laguerre coefficient.
G. Gholmieh et al. / Biosensors and Bioelectronics 18 (2003) 1467�/14781474

TMPPP and picrotoxin belong to the same pharmaco-
logical class, and CNQX and DNQX also belong to the
same pharmacological class.
4. Discussion
A screening tool for classifying chemical compoundsthat affect the nervous system has been introduced. It is
based on a novel method for analyzing STP of the CA1
hippocampal region in vitro. It is an extension of a
previously described tissue-based biosensor for detecting
compounds affecting cognitive function (Gholmieh et
al., 2001). The proposed analytical approach uses the
first order kernel and the Laguerre coefficients of the
second order kernel as features for classification.
Using the proposed biosensor, the effects of the
following classes of chemical compounds were analyzed:
GABAA receptor antagonists (picrotoxin and TMPP),
cholinergic agonists (carbachol), potassium channel
blockers (TEA), NMDA receptor antagonists (DAP5),
AMPA receptor antagonists (DNQX and CNQX), and
antiepileptic drugs- Na� and Ca�� channel blockers
(valproate). All these chemical compounds produced
specific alterations in the value of the first order kernel
and the Laguerre coefficients of the second order kernel.
We compared the results obtained using our approach
to those obtained in the literature using the paired pulse
approach. Based on our recent work (Gholmieh et al.,
Table 1
Mean values and the standard deviations of the first order kernel and the nine Laguerre coefficients of the second order kernel for each set of
experiments before adding the chemical compound
Control Picrotoxin Valproate TEA Carbachol DNQX DAP5 F -value
N 7 5 6 6 6 6 7
k1 (mV) 484 (9/137) 399 (9/126) 248 (9/38) 250.13 (9/49) 391 (9/220) 329 (9/180) 346 (9/160) 2.10
Coeff 1 2.71 (9/0.21) 2.28 (9/0.36) 2.65 (9/0.21) 2.40 (9/0.15) 2.63 (9/0.32) 2.30 (9/0.23) 2.25 (9/0.31) 3.31
Coeff 2 0.11 (9/0.26) �/0.56 (9/0.38) 0.98 (9/0.49) 0.37 (9/0.59) 0.87 (9/0.49) �/0.28 (9/0.41) 0.47 (9/0.30) 6.33
Coeff 3 �/1.59 (9/0.53) �/1.50 (9/0.63) �/1.84 (9/0.30) �/2.34 (9/0.38) �/1.92 (9/0.46) �/1.65 (9/0.43) �/2.17 (9/0.52) 2.59
Coeff 4 0.30 (9/0.27) �/0.19 (9/0.64) 0.4 (9/0.28) 0.24 (9/0.20) 0.38 (9/0.15) 0.32 (9/0.22) 0.38 (9/0.24) 2.53
Coeff 5 �/1.10 (9/0.32) �/1.30 (9/0.66) �/1.18 (9/0.10) �/1.70 (9/0.26) �/1.08 (9/0.15) �/1.30 (9/0.26) �/1.39 (9/0.16) 2.56
Coeff 6 �/0.21 (9/0.37) 0.03 (9/0.46) �/0.20 (9/0.20) �/0.25 (9/0.26) �/0.07 (9/0.21) 0.28 (9/0.17) �/0.01 (9/0.20) 2.80
Coeff 7 �/0.49 (9/0.15) �/0.83 (9/0.44) �/0.58 (9/0.11) �/0.98 (9/0.16) �/0.64 (9/0.11) �/0.85 (9/0.26) �/0.66 (9/0.16) 3.15
Coeff 8 �/0.32 (9/0.41) �/0.13 (9/0.51) �/0.31 (9/0.23) �/0.37 (9/0.27) �/0.25 (9/0.24) �/0.07 (9/0.13) �/0.16 (9/0.24) 1.42
Coeff 9 �/0.23 (9/0.18) �/0.61 (9/0.05) �/0.25 (9/0.23) �/0.58 (9/0.14) �/0.39 (9/0.19) �/0.44 (9/0.14) �/0.31 (9/0.13) 5.17
N represents the number of experiments performed for each chemical compound.
Fig. 8. Average of the second order kernel (black) across the various experimental set baselines (pre-drug). The two gray lines delimit one standard
deviation. Inset: Average of the corresponding Laguerre coefficients.
G. Gholmieh et al. / Biosensors and Bioelectronics 18 (2003) 1467�/1478 1475
2002), changes in the amplitude of the conditioning
response were compared with changes in the value of k1,
and changes in the amplitude of the test response were
compared with changes in the value k1�/k2 max , since theinterimpulse interval chosen for testing chemical com-
pounds in most paired pulse studies usually corresponds
to the maximum possible facilitation.
GABAA inhibitors like picrotoxin and bicuculline are
well known for their ability to inhibit early postsynaptic
inhibitory potential (Davies et al., 1990; Lacaille, 1991).
We have found that picrotoxin (100 mM) increased the
value of the first order kernel by about 21%, andincreased the peak facilitation value of the second order
kernel by 70% (Fig. 5A). These results are consistent
with previous findings that GABAA antagonist in-
creased the PS amplitude of both the conditioning and
test response in paired pulse studies (Steffensen and
Henriksen, 1991; Leung and Fu, 1994).
Several recent studies have shown that TMPP induces
epileptiform activity in CA1 (Lin et al., 1998, 2001) byacting as a GABAA antagonist (Keefer et al., 2001; Kao
et al., 1999; Higgins and Gardier, 1990). Our results
confirm earlier reports by showing that TMPP increased
CA1 excitability by augmenting the value of the first
order kernel, the second order kernel, and the Laguerre
coefficients in a similar manner to picrotoxin (Fig. 5A,
B).
TEA was used in a concentration of 4 mM since 12.5and 25 mM caused seizure activity in preliminary
experiments. We observed an increase in the value of
k1 that is consistent with previous articles reporting that
TEA caused an increase in the CA1 field responses
(Southan and Owen, 1997; Song et al., 2001). In
addition, the second order kernel showed an increase
in the early inhibitory phase and a decrease in the peak
facilitation value of k2 (Fig. 5C).Carbachol, a cholinergic agonist, caused a suppres-
sion of the value of k1 and a dramatic shift of the second
order kernel from facilitation to depression (Fig. 5D).
The depressive effect on k1 and k2 is consistent with
previous reports of dose dependent field potential
suppression (Hesen et al., 1998; Yajeya et al., 2000).
AMPA receptors are thought to mediate the bulk
component of field potentials at the CA1 glutamatergicsynapses. DNQX and CNQX are well known for being
AMPA receptor antagonists (Andreasen et al., 1989).
Both compounds had no effect on the first coefficient
and caused a depressive effect on the third, fifth, and
seventh coefficient. The peak facilitation value of k2 for
DNQX and CNQX decreased by 23 and 14%, respec-
tively (Fig. 5E, F) without showing statistically signifi-
cant difference (P B/0.05). We also observed dose-dependent DNQX suppression of the first and second
order kernels (Fig. 7). The IC50 of DNQX on k1 was
found to be around 3 mM (consistent with a previous
report (Andreasen et al., 1989)) while the IC50 for the
second order kernel peak facilitation value was around 5
mM.
Valproate is anti-seizure medication that is known to
block Ca�� and Na� channels. We have observed adecrease in k1 value with a contrasting moderate
increase in k2 peak facilitation value, and an increase
in the value of only the first Laguerre coefficient. A
previous paired pulse study showed a decrease in the
conditioning response (Franceschetti et al., 1986) con-
sistent with the depressive effect of valproate on k1. The
effect of valproate on k1 and k2 partially mimicked the
effects caused by low calcium concentration. Lowcalcium concentration in the aCSF caused a decrease
in the value of k1 and an increase in the value of the first
Laguerre coefficient (unpublished observation). Pre-
vious IO and paired pulse studies showed that lowering
calcium concentration decreased the conditioning re-
sponse by shifting the IO curve to the right and
downward (Stringer and Lothman, 1988) and increased
the amplitude and shifted the stimulus-response curve ofthe conditioned response to the left (Sagratella et al.,
1991; Igelmund and Heinemann, 1995). These observa-
tions are consistent with the calcium channel blocking
effect of valproate.
DAP5 is an NMDA receptor antagonist. In our
study, DAP5 caused a decrease in the k1 value by 17%
and in the peak facilitation value of k2 by 10%. The
modest effect of DAP5 on the STP descriptors is due tothe relatively high concentration of magnesium in the
aCSF and the low mean frequency of stimulation. Our
results are consistent with a previous study (Muller and
Lynch, 1990) suggesting that the NMDA component of
the conditioning EPSP at 1 mM of Mg was around 10%
and that the peak facilitation of the test EPSP response
decreased by 10% upon the addition of the NMDA
channel blocker.The results of our study showed that each class of
compounds caused specific changes in the first order
kernel and the Laguerre coefficients of the second order
kernel. These features formed the basis for classification
using ANNs. The classifying ANN used a single layer
perceptrons and was able to classify each chemical
compound into its respective class. The ANN classified
the 0.15 mM DNQX set as negative control. The latterresult was expected since the 0.15 mM did not cause any
effect on the first and the second order kernels. More
interestingly, the trained neural network classified
correctly compounds outside the training sets, e.g.
TMPP and CNQX, into their respective pharmacologi-
cal class.
In conclusion, we have demonstrated that different
classes of chemical compounds can be successfullyclassified according to their effect on the first order
kernel and the Laguerre coefficients of second order
kernels describing STP at the CA1 hippocampal region
in vitro. Although our study assessed the immediate
G. Gholmieh et al. / Biosensors and Bioelectronics 18 (2003) 1467�/14781476
effect of the chemical compounds, the delayed effect of
each compound can also be explored by reapplying the
RIT sequence and computing the kernels every 10 min
or by using an ex-vivo slice approach, wherein an animalis exposed to the toxicant in advance of slice prepara-
tion.
Acknowledgements
This research was supported by grants from the Office
of Naval Research (ONR), the Defense Advanced
Research Projects Agency (DARPA), and the Biomedi-
cal Simulation Resource (BMSR).
References
Alger, B.E., Teyler, T.J.2, 1976. Long-term and short-term plasticity in
the CA1, CA3, and dentate regions of the rat hippocampal slice.
Brain Res. 110 (3), 463�/480.
Andersen, P., Bliss, T.V.P., Skrede, K.K., 1971. Lamellar organization
of hippocampal excitatory pathways. Exp. Brain Res. 13, 208�/211.
Andreasen, M., Lambert, J.D., Jensen, M.S., 1989. Effects of new non-
N -methyl-D-aspartate antagonists on synaptic transmission in the
in vitro rat hippocampus. J. Physiol. 414, 317�/336.
Bliss, T.V., Lomo, T., 1973. Long-lasting potentiation of synaptic
transmission in the dentate area of the anaesthetized rabbit
following stimulation of the perforant path. Journal of Physiology.
232 (2), 331�/356.
Buonomano, D.V., 1999. Distinct functional types of associative
Long-Term Potentiation in the neocortical and hippocampal
pyramidal neurons. J. Neurosci. 19 (16), 6748�/6754.
Buonomano, D.V., 2000. Decoding temporal information: a model
based on short-term synaptic plasticity. J. Neurosci. 20 (3), 1129�/
1141.
Castro-Alamancos, M.A., Connors, B.W., 1997. Distinct forms of
short-term plasticity at excitatory synapses of hippocampus and
neocortex. Proc. Natl. Acad. Sci. USA 94, 4161�/4166.
Creager, R., Dunwiddie, T., Lynch, G., 1980. Paired pulse and
frequency facilitation in the CA1 region of the in vitro rat
hippocampus. J. Neurophysiol. 299, 409�/424.
Courellis, S.H., Marmarelis, V.Z., Berger, T.W., 2000. Modeling
Event-Driven Nonlinear Dynamics in Neuronal Systems with
Multiple Inputs. Annual Conference Biomedical Engineering
Society, Seattle, WA.
Davies, C.H., Davies, S.N., Collingridge, G.L., 1990. Paired pulse
depression of monosynaptic GABA-mediated inhibitory postsy-
naptic responses in rat hippocampus. J. Physiol. 424, 513�/531.
Dobrunz, L.E., Huang, E.P., Stevens, C.F., 1997. Very short-term
plasticity in hippocampal synapses. Proceedings of the National
Academy of Sciences of the United States of America. 94 (26),
14843�/14847.
Fountain, S.B., Teyler, T.J., 1995. Brain slice techniques in neurotox-
icology. In: Chang, L.W., Slikker, W. (Eds.), Neurotoxicology:
Approaches and Methods. Academic Press, New York, pp. 517�/
535.
Franceschetti, S., Hamon, B., Heinemann, U., 1986. The action of
valproate on spontaneous epileptiform activity in the absence of
synaptic transmission and on evoked changes in [Ca2�/]o and
[K�/]o in the hippocampal slice. Brain Res. 386 (1-2), 1�/11.
Gholmieh, G., Soussou, W., Courellis, S., Marmarelis, V.Z., Berger,
T.W., Baudry, M., 2001. A biosensor for detecting changes in
cognitive processing based on nonlinear systems analysis. Biosens.
Bioelectron. 16 (7-8), 491�/501.
Gholmieh, G., Courellis, S., Marmarelis, V.Z., Berger, T.W., 2002. A
novel method for modeling short-term synaptic plasticity. J.
Neurosci. Methods 21 (2), 111�/127.
Gross, G.W., Rhoadas, B.K., Reust, D.L., Schwalm, R.C., 1993.
Stimulation of monolayer networks in culture through thin film
indium-tin oxide recording electrodes. J. Neurosci. Methods 50,
131�/143.
Hesen, W., Karten, Y.J., van de Witte, S.V., Joels, M., 1998. Serotonin
and carbachol induced suppression of synaptic excitability in rat
CA1 hippocampal area: effects of corticosteroid receptor activa-
tion. J. Neuroendocrinol. 10 (1), 9�/19.
Higgins, G.M., Gardier, R.W., 1990. gamma-Aminobutyric acid
antagonism produced by an organophosphate-containing combus-
tion product. Toxicol. Appl. Pharmacol. 105 (1), 103�/112.
Igelmund, P., Heinemann, U., 1995. Synaptic transmission and paired
pulse behaviour of CA1 pyramidal cells in hippocampal slices from
a hibernator at low temperature: importance of ionic environment.
Brain Res. 689 (1), 9�/20.
Kao, W.Y., Liu, Q.Y., Ma, W., Ritchie, G.D., Lin, J., Nordholm,
A.F., Rossi, J., III, Barker, J.L., Stenger, D.A., Pancrazio, J.J.,
1999. Inhibition of spontaneous GABAergic transmission by
trimethylolpropane phosphate. Neurotoxicology 20 (5), 843�/849.
Keefer, E.W., Gramowski, A., Stenger, D.A., Pancrazio, J.J., Gross,
G.W., 2001. Characterization of acute neurotoxic effects of
trimethylolpropane phosphate via neuronal network biosensors.
Biosens. Bioelectron. 16 (7-8), 513�/525.
Lacaille, J.C., 1991. Postsynaptic potentials mediated by excitatory
and inhibitory amino acids in interneurons of stratum pyramidale
of the CA1 region of rat hippocampal slices in vitro. Journal of
Neurophysiology. 66 (5), 1441�/1454.
Leung, L.S., Fu, X.W., 1994. Factors affecting paired pulse facilitation
in the hippocampal CA1 neurons in vitro. Brain Res. 650, 75�/84.
Lin, J., Cassell, J., Ritchie, G.D., Rossi, J., III, Nordholm, A.F., 1998.
Repeated exposure to trimethylolpropane phosphate induces
central nervous system sensitization and facilitates electrical
kindling. Physiol. Behav. 65 (1), 51�/58.
Lin, J., Ritchie, G.D., Stenger, D.A., Nordholm, A.F., Pancrazio, J.J.,
Rossi, J., III, 2001. Trimethylolpropane phosphate induces epilep-
tiform discharges in the CA1 region of the rat hippocampus.
Toxicology & Applied Pharmacology. 171 (2), 126�/134.
Marmarelis, V.Z., 1993. Identification of nonlinear biological systems
using Laguerre expansions of kernels. Ann. Biom. Eng. 21, 573�/
589.
Muller, D., Lynch, G., 1990. Synaptic modulation of N -methyl-D-
aspartate receptor mediated responses in hippocampus. Synapse 5,
94�/103.
Pananceau, M., Chen, H., Gustafsson, B., 1998. Short-term facilitation
evoked during brief afferent tetani is not altered by long-term
potentiation in the guinea-pig hippocampal CA1 region. J. Physiol.
508 (2), 503�/514.
Papatheodoropoulos, C., Kostopoulos, G., 2000. Dorsal-ventral
differentiation of short-term synaptic plasticity in rat CA1 hippo-
campal region. Neurosci. Lett. 286 (1), 57�/60.
Sagratella, S., Proietti, M.L., Frank, C., de Carolis, A.S., 1991. Effects
of some calcium antagonists and of calcium concentration changes
on CA1 paired pulse inhibition in rat hippocampal slices. Gen.
Pharmacol. 22 (2), 227�/230.
Song, D., Xiaping, X., Wang, Z., Berger, T.W., 2001. Differential
effect of TEA on long-term synaptic modification in hippocampal
CA1 and dentate gyrus in vitro. Neurobiol. Learn. Mem. 76, 357�/
387.
Southan, A.P., Owen, D.G., 1997. The contrasting effects of dendro-
toxins and other potassium channel blockers in the CA1 and
dentate gyrus regions of rat hippocampal slices. Br. J. Pharmacol.
122 (2), 335�/343.
G. Gholmieh et al. / Biosensors and Bioelectronics 18 (2003) 1467�/1478 1477

Steffensen, S.C., Henriksen, S.J., 1991. Effects of baclofen and
bicuculline on inhibition in the fascia dentata and hippocampus
regio superior. Brain Research. 538 (1), 46�/53.
Stringer, J.L., Lothman, E.W., 1988. In vitro effects of extracellular
calcium concentrations on hippocampal pyramidal cell responses.
Exp. Neurol. 101 (1), 132�/146.
Yajeya, J., De La Fuente, A., Criado, J.M., Bajo, V., Sanchez-
Riolobos, A., Heredia, M., 2000. Muscarinic agonist carbachol
depresses excitatory synaptic transmission in the rat basolateral
amygdala in vitro. Synapse 38 (2), 151�/160.
Xie, X., Liaw, J.S., Baudry, M., Berger, T.W., 1997. Novel expression
mechanism for synaptic potentiation: alignment of presynaptic
release site and postsynaptic receptor. Proc. Natl. Acad. Sci. USA
94 (13), 6983�/6988.
G. Gholmieh et al. / Biosensors and Bioelectronics 18 (2003) 1467�/14781478