sensitive and mutiplexed microrna quantification using
TRANSCRIPT

HAL Id: tel-02926834https://tel.archives-ouvertes.fr/tel-02926834
Submitted on 1 Sep 2020
HAL is a multi-disciplinary open accessarchive for the deposit and dissemination of sci-entific research documents, whether they are pub-lished or not. The documents may come fromteaching and research institutions in France orabroad, or from public or private research centers.
L’archive ouverte pluridisciplinaire HAL, estdestinée au dépôt et à la diffusion de documentsscientifiques de niveau recherche, publiés ou non,émanant des établissements d’enseignement et derecherche français ou étrangers, des laboratoirespublics ou privés.
Sensitive and mutiplexed microRNA quantification usingamplified time-gated Förster resonance energy transfer
Jingyue Xu
To cite this version:Jingyue Xu. Sensitive and mutiplexed microRNA quantification using amplified time-gated Försterresonance energy transfer. Optics [physics.optics]. Université Paris-Saclay, 2020. English. �NNT :2020UPASS137�. �tel-02926834�

Sensitive and Mutiplexed MicroRNA
Quantification Using Amplified
Time-Gated Förster Resonance
Energy Transfer
Thèse de doctorat de l'université Paris-Saclay
École doctorale n°575 :
electrical, optical, bio : physics and engineering (EOBE)
Spécialité de doctorat: Physique
Unité de recherche : Université Paris-Saclay, CEA, CNRS, Institute for Integrative
Biology of the Cell (I2BC), 91198, Gif-sur-Yvette, France
Référent : Faculté des sciences d’Orsay
Thèse présentée et soutenue en visioconférence totale,
le 23/07/2020, par
Jingyue XU
Composition du Jury
Philippe MINARD
Professeur, Université Paris-Saclay Président
Yolanda VIDA
Professeur, University of Málaga Rapporteur & Examinatrice
Cristian A. STRASSERT
Professeur, University of Münster Rapporteur & Examinateur
Xavier LE GUEVEL
Chargé de recherche, Université Grenoble-Alpes Examinateur
Niko HILDEBRANDT
Professeur, Université Paris-Saclay Directeur de thèse
Th
èse
de d
oct
ora
t
NN
T : 2
020U
PA
SS137

I
Acknowledgment
I would like to express my sincere gratitude to my supervisor Prof. Niko Hildebrandt, the
“Captain FRET” of our NanoBioPhotonics group, who offered me the opportunity to join
this family and provided me the freedom to explore in the “FRET world”. His continuous
scientific tuitions help me a lot when I faced the difficulties in research. But nothing was
more grateful than his enthusiasm and perpetual energy, which not only motivated me in
my study but also encouraged me a lot in my life. I appreciate all his contributions of time,
ideas, and funding to my PhD in the last four years.
My sincere thanks to Prof. Yolanda Vida and Prof. Cristian A. Strassert for being the
reviewers of my PhD thesis.
Many thanks to all my former and current members of the NanoBioPhotonics group for the
free and happy working atmosphere. Special thanks to Dr. Xue Qiu and Dr. Jiajia Guo for
their technical guidance and continuous encouragement; to Dr. Shashi Bhuckory for his
translation of my abstract and altruistic helps in my life; to Vjona Cifliku for spending the
last period of PhD and tough writing period with me together; to Dr. Monique Chan-Huot
and Dr. Thomas Plénat for teaching me French.
I thank China Scholarship Council for the funding and supporting of my PhD fellowship.
I also want to thank my family and dear friends for their love and company. Without them,
this work would have never been possible.
Last but not least, my deepest gratitude and respect go to all the medical staff in the world
during this COVID-19 health crisis. Life will get better, world will get better.

II
List of publications
Original publications
1. J. Xu, J. Guo, N. Golob-Schwarzl, J. Haybaeck, X. Qiu, and N. Hildebrandt. Single-
measurement multiplexed quantification of microRNAs from human tissue using catalytic
hairpin assembly and Förster resonance energy transfer. ACS Sensors 2020, 5, 1768–1776.
2. J. Xu, L. Francés-Soriano, J. Guo, T. Hallaj, X. Qiu, and N. Hildebrandt. Energy transfer
with nanoparticles for in vitro diagnostics. In: W. Parak and N. Feliu, Editors: Frontiers of
Nanoscience, Volume 16, Colloids for Nanobiotechnology. Elsevier 2020.
3. X. Qiu, J. Xu, J. Guo, A. Yahia-Ammar, N.-I. Kapetanakis, I. Duroux-Richard, J.J.
Unterluggauer, N. Golob-Schwarzl, C. Regeard, C. Uzan, S. Gouy, M. DuBow, J.
Haybaeck, F. Apparailly, P. Busson, and N. Hildebrandt. Advanced microRNA-based
cancer diagnostics using amplified time-gated FRET. Chemical Science 2018, 9, 8046-
8055.
4. X. Qiu, J. Guo, J. Xu, and N. Hildebrandt. Three-Dimensional FRET Multiplexing for
DNA Quantification with Attomolar Detection Limits. The Journal of Physical Chemistry
Letters 2018, 9, 4379−4384.
Poster presentations
1. Jingyue XU, Xue Qiu, Jiajia Guo, Akram Yahia Ammar, Niko Hildebrandt. Sensitive
and Specific Nucleic Acid Detection Based on Rolling Circle Amplification and Förster
Resonance Energy Transfer. 15th Conference on Methods and Applications in
Fluorescence (MAF 15). Bruges, Belgium, 2017.

III
Contents
1. Introduction ..................................................................................................................1
2. Background ...................................................................................................................7
2.1 MiRNA biomarkers .................................................................................................7
2.1.1 MiRNA biomarkers for cancers/tumors .............................................................9
2.1.2 MiRNA biomarkers for other diseases ............................................................. 11
2.2 MiRNA detection methods .................................................................................... 13
2.2.1 Introduction ..................................................................................................... 13
2.2.2 Conventional methods ..................................................................................... 14
2.2.3 Isothermal amplification-based methods .......................................................... 18
2.3 Förster resonance energy transfer ........................................................................... 25
2.3.1 FRET theory .................................................................................................... 26
2.3.2 FRET measurements ........................................................................................ 32
2.3.3 FRET application in miRNA detection ............................................................ 34
2.4 Lanthanides ........................................................................................................... 36
2.4.1 Luminescent lanthanide complexes .................................................................. 37
2.4.2 Luminescent Tb complexes as FRET donors ................................................... 41
2.5 Fluorescent dyes .................................................................................................... 44
2.5.1 Introduction ..................................................................................................... 44
2.5.2 Fluorescent dyes in FRET applications ............................................................ 46
2.6 Quantum dots......................................................................................................... 47
2.6.1 Photophysical properties .................................................................................. 47
2.6.2 QDs in FRET applications ............................................................................... 49

IV
3. Advanced miRNA diagnostics using RCA-amplified Tb-to-dye FRET ....................... 54
3.1 Introduction ........................................................................................................... 54
3.2 Materials and methods ........................................................................................... 56
3.2.1 Nucleic acid probes and exogenous targets ...................................................... 56
3.2.2 Photophysical analysis ..................................................................................... 58
3.2.3 Statistical analysis............................................................................................ 59
3.2.4 Amplified TG-FRET miRNA assays ............................................................... 59
3.2.5 RNA extraction ................................................................................................ 60
3.2.6 Absolute quantification of miRNA by amplified TG-FRET ............................. 64
3.2.7 RT-qPCR miRNA assays ................................................................................. 64
3.3 Results and discussion ........................................................................................... 65
3.3.1 Sensitivity and dynamic range ......................................................................... 65
3.3.2 Specificity and comparison to RT-qPCR ......................................................... 67
3.3.3 MiRNA detection in human plasma, tissue, and cells ....................................... 70
3.4 Conclusion ............................................................................................................. 75
4. Multiplexed miRNA diagnostics using CHA-amplified Tb-to-dye FRET .................... 77
4.1 Introduction ........................................................................................................... 77
4.2 Materials and methods ........................................................................................... 78
4.2.1 Nucleic acid probes and exogenous targets ...................................................... 78
4.2.2 Optical spectroscopy ........................................................................................ 79
4.2.3 TG-FRET miRNA assays ................................................................................ 80
4.2.4 Mathematical treatment of multiplexed signal deconvolution .......................... 80
4.2.5 RNA extraction ................................................................................................ 81
4.2.6 Absolute quantification of miRNA by TG-FRET ............................................. 82

V
4.2.7 RT-qPCR miRNA assays ................................................................................. 82
4.2.8 Statistical analysis............................................................................................ 83
4.2.9 Calculation of FRET parameters ...................................................................... 83
4.3 Results and discussion ........................................................................................... 84
4.3.1 Principle of CHA-TG-FRET miRNA assays .................................................... 84
4.3.2 Single miRNA assay performance ................................................................... 86
4.3.3 Single FRET-pair multiplexing ........................................................................ 88
4.3.4 Duplexed detection of miR-21 and miR-20a .................................................... 90
4.3.5 MiRNA quantification from human tissue samples .......................................... 93
4.4 Conclusion ............................................................................................................. 95
5. MiRNA nano-diagnostics using HRCA-amplified Tb-to-QD FRET ............................ 97
5.1 Introduction ........................................................................................................... 97
5.2 Materials and methods ........................................................................................... 99
5.2.1 Materials .......................................................................................................... 99
5.2.2 Optical spectroscopy ...................................................................................... 100
5.2.3 HRCA-amplified Tb-to-QD TG-FRET miRNA assays .................................. 100
5.2.4 Statistical analysis.......................................................................................... 101
5.2.5 Gel Electrophoresis ........................................................................................ 101
5.3 Results and discussion ......................................................................................... 102
5.3.1 Principle of HRCA-amplified TG-FRET ....................................................... 102
5.3.2 Feasibility of HRCA-amplified TG-FRET ..................................................... 104
5.3.3 Optimization of HRCA-amplified TG-FRET ................................................. 106
5.3.4 Sensitivity and specificity .............................................................................. 108
5.4 Conclusion ........................................................................................................... 109

VI
6. Summary and outlook ............................................................................................... 110
7. Appendix .................................................................................................................. 113
7.1 Abbreviations ...................................................................................................... 113
7.2 Instrument ............................................................................................................ 114
8. Bibliography ............................................................................................................. 116
9. Résumé en français ................................................................................................... 144

1
1. Introduction
MicroRNAs (miRNAs) are involved in virtually all physiologic processes, including
differentiation and proliferation, metabolism, hemostasis, apoptosis or inflammation. To
date, more than 30,000 miRNAs have been discovered, of which more than 2,500 can be
found in humans. Especially, the discovery of many different circulating miRNAs (in
biofluids of patients, e.g., serum, plasma, urine, cerebrospinal fluid, etc.) specific for
cancers (breast, colorectal, esophageal, gastric, liver, lung, ovarian, pancreatic, etc.), as well
as many other diseases (infectious disease, immunological disorder, cardiovascular disease,
neurological disease, etc.), have strongly driven the implementation of miRNAs as next-
generation biomarkers for prediction of the diseases, treatment response or prediction of
progression. Based on a new report by BCC Research Inc., the global market for miRNA
research tools, services, diagnostics, and drug discovery is estimated to reach nearly $1.4
billion in 2021 at a compound annual growth rate of 10.5% for 2016-2021. Compared to
the very recent discovery of circulating miRNAs, the diagnostic section of this overall
market is still extremely small, demonstrating the urgent need for developing approved
clinical miRNA diagnostics. Despite their short lengths combined with strong sequence
similarities between different miRNAs, many different technologies have been used for
their detection, in which the most commonly applied methods are reverse transcription
quantitative polymerase chain reaction (RT-qPCR), microarrays, next-generation
sequencing (NGS), in situ hybridization (ISH), and northern blotting (NB). However, the
main limitations are low sensitivity (microarray, NB) and throughput (ISH, NB, RT-qPCR),
expenditure of costs (microarray, NGS), lack of absolute quantification (microarray, NGS)
and high-order multiplexing from a single sample (RT-qPCR, NGS), time consuming
procedures, and difficulties associated with comparable results across different platforms.
Isothermal amplification has emerged as a powerful method for highly rapid, specific and
sensitive miRNA assays, which also possesses the compatibility with diversified detection
platforms, such as fluorescence, electrochemistry, and colorimetry.

2
The aim of this thesis is to address new routes of miRNA diagnostic tools, taking the
simplicity of a homogeneous immunoassay, the multiplexing capability of microarrays, the
sensitivity of RT-qPCR, and the throughput capacity of NGS within one single diagnostic
tool. The original concept is to combine the versatility and multiplexing capability of
luminescent Tb complexes (LTCs)-based time-gated Förster resonance energy transfer
(TG-FRET) measurement with isothermal amplification technology to design ultra-
sensitive and/or multiplexed miRNA biosensors. LTCs have long been used as an energy
transfer donor, and possess unique advantages for multiplexing detection due to their
multiple, sharp, and distinct emission peaks, as well as long excited-state lifetimes
compared to organic dyes and quantum dots (QDs). Organic dyes can be used in biological
systems with low toxicity. They have been the most frequently applied fluorophores for
FRET, and in combination with LTCs as donors, multiplexed biosensing approaches are
capable based on LTCs-to-dyes FRET. Notably, appropriate spectral crosstalk correction
needs to be taken for spectral multiplexing due to the broad emission profiles of the most
organic dyes. While QDs have unique advantages over organic dyes in FRET systems,
especially in LTCs donors-based FRET assays. QDs have better spectral overlap as well as
larger Förster distance with LTCs owing to their very broad absorption and extremely high
molar extinction coefficient and quantum yield. The narrow and size-tunable emission
bands make QDs excellent FRET acceptor candidates for multiplexing. Traditional FRET
measurements are hampered by short-lived (in the ns range) and high-background
fluorescence from buffers or samples. It can be eliminated by using TG-FRET, especially
using long-lived LTCs as donors and short-lived dyes/QDs as acceptors. Upon pulsed
excitation of a sample, by collecting photoluminescence (PL) intensities in time windows
much longer than the natural decay of the dyes/QDs, but still within the lifetime of the
LTCs decay, the direct excitation of the acceptors dyes/QDs and any background
autofluorescence can be efficiently suppressed, greatly simplifying analysis of the system.

3
The thesis can be divided into eight chapters. Following the introduction, the theoretical
and practical background of the research, and three individual studies are presented, then
completing by summary and outlook, appendix, and bibliography. Each study is
corroborated with introduction, materials and methods, results and discussion, and
conclusion.
In the first study, I present a miRNA detection assay using enzymatic rolling circle
amplification (RCA)-amplified LTCs-to-dye TG-FRET. My contribution to this study was
the analysis of the clinical samples, including sample preparation, RCA-FRET experiments,
RT-qPCR experiments, and data analysis. Dr. Jiajia Guo also contributed in the
experimental work, and Dr. Xue Qiu designed the study and wrote the manuscript. All
authors contributed in editing and writing of the manuscript and approved its final version
to the journal (X. Qiu, J. Xu, J. Guo, A. Yahia-Ammar, N.-I. Kapetanakis, I. Duroux-
Richard, J.J. Unterluggauer, N. Golob-Schwarzl, C. Regeard, C. Uzan, S. Gouy, M. DuBow,
J. Haybaeck, F. Apparailly, P. Busson, and N. Hildebrandt. Chemical Science 2018, 9,
8046-8055. Third paper in Section List of publication). The combination of RCA with
TG-FRET between LTCs donors and Cy5.5 acceptors resulted in single-nucleotide variant
specificity and sensitivity with limit of detection (LOD) down to 4.2 ± 0.5 attomole (30 ±
3 fM) for miR-21, 6.8 ± 0.8 attomole (48 ± 5 fM) for miR-132, and 14 ± 2 attomole (99 ±
10 fM) for miR-146a. Quantification of miR-21 from human tissues and plasma samples
revealed the relevance for breast and ovarian cancer diagnostics. Analysis of miR-132 and
miR-146a from acute monocytic leukemia cells (THP-1 cells) demonstrated the broad
applicability to different miRNAs and other types of clinical samples. Direct comparison
to the gold standard RT-qPCR showed advantages of amplified TG-FRET concerning
precision and specificity when quantifying low concentrations of miRNAs as required for
diagnostic applications. The results demonstrate that a careful implementation of RCA and
TG-FRET into one straightforward nucleic acid detection method can significantly advance
the possibilities of miRNA-based cancer diagnostics and research.

4
Figure 1.1 Schematic representation for miRNA detection assay using RCA-amplified LTCs-to-
dye TG-FRET.
The second study presents a temporal multiplexing assay for miRNA detection assay using
enzyme-free catalytic hairpin assembly (CHA)-amplified LTCs-to-dye TG-FRET. My
contribution to this study was designing the study, performing experiments, analyzing the
data, and writing the manuscript. Dr. Jiajia Guo and Dr. Xue Qiu also contributed in the
study designing. All authors contributed in editing and writing of the manuscript and
approved its final version to the journal (J. Xu, J. Guo, N. Golob-Schwarzl, J. Haybaeck,
X. Qiu, and N. Hildebrandt. ACS Sensors 2020, (accepted), DOI:
10.1021/acssensors.0c00432. First paper in Section List of publication). Implementing
TG-FRET into CHA can be used for the simultaneous quantification of two miRNAs (miR-
21 and miR-20a) with a single measurement from total RNA extracts of human tissues. A
single LTCs-to-Cy5.5 FRET-pair was conjugated at two specific distances within target-
specific CHA hairpin probes, such that each miRNA resulted in distinct amplified PL
decays that could be distinguished and quantified by TG PL intensity detection. Enzyme-
free amplification in a separation-free assay format and the absence of autofluorescence
background allowed for simple, specific, and sensitive detection with LOD down to 380 ±
40 attomoles (2.7 ± 0.3 pM) for miR-21 and 250 ± 60 attomoles (1.8 ± 0.4 pM) for miR-
20a. Reliable duplexed quantification of both miRNAs at low picomolar concentrations

5
was confirmed by analyzing total RNA extracts from different colon and rectum tissues
with single and dual target CHA-TG-FRET and RT-qPCR for comparison. These rapid,
simple and multiplexed miRNA biomarker assays present a capable method for clinical
diagnostics.
Figure 1.2 Schematic representation for multiplexed miRNAs (miR-21 and miR-20a) detection
assay using CHA-amplified LTCs-to-dye TG-FRET.
In the third study, I investigated a miRNA detection assay using enzymatic hyperbranched
rolling circle amplification (HRCA)-amplified LTCs-to-QD TG-FRET. My contribution to
this study was designing the study, performing experiments, and analyzing the data. Dr.
Xue Qiu also contributed in study design. The manuscript is under preparation. By
integrating autofluorescence-suppressed TG measurement into HRCA with exponential
amplification efficiency, it provides advantages of high sensitivity with a detection limit of
11 ± 4 attomole (80 ± 30 fM) and selectivity toward target miR-21 in extremely low
background noise, quick and simple one-step assay format. Target-primed and reverse
primer-initiated HRCA reaction can generate a large amount of single strand DNAs with
different lengths (HRCA product). By hybridizing with Tb-labeled reporter DNA probes,
and adaptor DNA probes that are on the surface of the QD via biotin and streptavidin
0 2 4 6100
1000
10000
PL in
tensity (
cou
nts
)
time (ms)
0 2 4 61
10
100
1000
10000
PL in
tensity (
cou
nts
)
time (ms)
0 2 4 6100
1000
10000
PL
inte
nsity (
co
unts
)
time (ms)0 2 4 6
1
10
100
1000
10000
PL in
tensity (
cou
nts
)
time (ms)
b
3*2*
1*miR- 21
1 2 3
1* 2* 3*
43*2*
Cy5.5
H2 f or miR- 21
2*
3 4* 3*
4
Tb
Cy5.51 2 3 4 3*
2*
Tb2* 3* 4* 341*
2*3*
Tb2* 3* 4* 34
Cy5.51 2 3 4 3*
2*
FRET
10 bps
H1 f or miR- 21
1 2 34
3*2* Cy5.5
a
3*2*
1*miR- 20a
1 2 3
1* 2* 3*
43*2*
Cy5.5
H2 f or miR- 20a
2*
3 4* 3*
4
Tb
2*Cy5.51 2 3 4 3*
Tb2* 3* 4* 341*
2*3*
Tb2* 3* 4* 34
Cy5.51 2 3 4 3*
2*
FRET
14 bps
H1 f or miR- 20a1 2 3
43*2*
Cy5.5
d
c miR- 21 sensor: FRET distance ~10 bps
miR- 20a senor: FRET distance ~14 bps
TG
Cy5. 5I
TG
Cy5. 5I
TG
TbI
TG
TbI
miRc ~TG
Cy5. 5ITG
TbI/Rat iomet ric
miR quant if icat ion
x = var
same
x and y
x = var
y = var
same
x and y
y = var

6
interaction, QD-DNA-LTCs complexes could from, inducing the shortened distance
between LTCs, resulting in LTCs-to-QD FRET. Besides, the proposed assay shows great
potential for broad applicability to different miRNAs and multiplexing capability,
demonstrating that it can be a promising alternative to current miRNA diagnostic
approaches.
Figure 1.3 Schematic representation for miRNA detection assay using HRCA-amplified LTCs-to-
QD TG-FRET.

7
2. Background
2.1 MiRNA biomarkers
MiRNAs are small (approximately 19-23 nucleotides) non-coding RNAs that were first
discovered in the nematode Caenorhabditis elegans in 1993 [1]. The production of mature
miRNA encompasses a great deal of RNA processing steps according to the biogenesis of
miRNA [2-4]. The basic process of miRNA expression and maturation is outlined in Figure
2.1. MiRNA coding genes are generally transcribed in the nucleus producing large capped
and polyadenylated primary miRNA transcript (pri-miRNA). The pri-miRNA sequence is
cleaved by the Drosha-DGCR8 complex to produce a stem-loop hairpin structure precursor
miRNA (pre-miRNA). This pre-miRNA is then transported to the cytoplasm by Exportin-
5-Ran-GTP. In the cytoplasm, the RNase Dicer complex with the double-stranded RNA-
binding protein TRBP cleaves the pre-miRNA hairpin to its mature length. The passenger
strand (anti-sense strand) of the mature miRNA is degraded, whereas the functional strand
(guide strand) is loaded together with Argonaute proteins (Ago) into the RNA-induced
silencing complex (RISC), where it guides RISC to silence target mRNAs through mRNA
cleavage, deadenylation or translational repression [2-5]. Acting as post-transcriptional
regulators of gene expression [6], mature miRNAs can repress protein synthesis by binding
to 3’-untranslated regions of mRNA and are involved in many biological processes, such
as development, cell proliferation, differentiation, and apoptosis [7]. Therefore, miRNAs
play an important role in the development and progression of cancer and various other
diseases [8-10].

8
Figure 2.1 MiRNA biogenesis process starts with transcription in the nucleus and ends with
affecting gene translation in the cytoplasm. (Reprinted with permission from reference [5].
Copyright 2016 American Chemical Society.)
Taking account into the cell-to-cell variations and complex stochastic nature of RNA
expression in cells [11], considerable information connecting cell function and miRNA
expression may be covered by cell population based miRNA analysis. Single-cells analysis
and tissues/organs cells analysis are crucial for miRNA expression profiling to understand
the involvement, functions and combinations of different miRNAs in disease development
at cellular level [8, 12, 13]. Many miRNAs are identified as key regulators of various
diseases via such analyses, which makes them very attractive therapeutic targets. Besides,
analysis of extracellular miRNAs circulating in the blood and other biofluids, such as serum,
urine and cerebrospinal fluid, is also highly relevant to the diagnosis of diseases. It is found
that a large amount of circulating miRNAs derived from various tissues/organs are present
in human serum and plasma in a remarkably stable form and are extremely resistant against
endogenous RNases [14, 15]. One explanation of the stability of circulating miRNAs is

9
associated with RNA-binding proteins, such as nucleophosmin (NPM1) [16] and
Argonaute2 (Ago2) [17]. Alternative explanation is that circulating miRNAs are contained
within microvesicles (e.g., exosomes, microparticles, and apoptotic bodies) and are
protected from the membrane structure [18, 19]. For instance, exosomes, a sort of small
membrane vesicles, have been reported to be abundant in plasma [20] and further have been
revealed to contain miRNAs that can be released into body fluids such as blood and urine
[21]. The possibility of direct detection in easily-accessible biofluid samples has opened up
new clinical avenues for miRNAs to be used as next generation biomarkers for diagnosis
and prognosis [13, 22-24].
2.1.1 MiRNA biomarkers for cancers/tumors
Human miRNAs appear to be frequently located at fragile sites or genomic regions related
to cancers [25], and play important role in onset, progression, and metastasis of cancers
[26]. The expression profiles of miRNAs differ between normal tissues and the tumors and
differ between tumor types [27]. Many studies have shown the alterations of miRNA
expression profiles in multiple cancers, including leukemia [28], breast cancer [29], lung
cancer [30], ovarian cancer [31], prostate cancer [32], pancreatic cancer [33], liver cancer
[34] and colorectal cancer [35]. Dysregulation of miRNAs in cancer can occur through
epigenetic changes and genetic alterations, which can affect the production of the primary
miRNA transcript, their processing to mature miRNAs and/or interactions with mRNA
targets [27]. It is reported that the tumor-specific genetic defects in the miRNA biogenesis
machinery, such as in the genes that encode TARBP2 [36], DICER1 [37, 38], Exportin-5
[39], DROSHA [40], DGCR8 [40] and AGO2 [40], are highly relevant to the cellular
transformation and carcinogenesis/anti-carcinogenesis process in different tumor and
cancer types.
MiRNAs can act as oncogenes as well as tumor suppressors [9, 41]. On one hand, miRNAs
that function as oncogenes can facilitate tumorigenesis including proliferation,
angiogenesis, invasion and migration [42]. For instance, miR-21, which locates in the
chromosomal region 17q23.1, its increased expression is among the most frequently

10
associated with poor outcome in human cancer [43]. It has been shown that miR-21 can
contribute to carcinogenesis through inhibition of apoptosis [44], or down-regulation of
other tumor suppressors, such as phosphatase and tensin homolog [45], tropomyosin1 [46]
and Sprouty2 [47]. Medina et al. found that the overexpression of miR-21 led to a pre-B
malignant lymphoid-like phenotype in vivo, and when miR-21 was inactivated, the tumors
regressed completely in a few days [48]. In addition, elevated expression levels of miR-21
have been found in a diverse subset of cancer cell lines and tissues (see Table 2.1). On the
other hand, miRNAs that function as tumor suppressors can regulate the cell cycle,
apoptosis, differentiation, DNA repair, angiogenesis, and metastasis [42]. For example, the
let-7 family, which consists of 12 human homologues, was the first miRNA identified in
humans [49]. Many human let-7 genes map to regions altered or deleted in human tumors,
indicating that these genes may function as tumor suppressors [50]. The explanation for let-
7 as a tumor suppressor is provided by the discovery that let-7 can regulate the expression
of RAS oncogenes [51]. The RAS genes encode protein kinases that bind guanine
nucleotides and are implicated in signal transduction processes [52]. About 20-30% of
human tumors possess mutations in RAS genes, and approximately one-third of human
lung adenocarcinomas carry RAS oncogenic mutations [52]. Besides, several studies show
the tumor suppressor activity of let-7 encompasses other tumor types (see Table 2.1). Taken
together, different or the same miRNAs can act as tumor suppressor or as oncogene in
different kinds of cancers or tumors. Table 2.1 summarizes several important miRNAs that
are associated with human cancers/tumors. In view of these findings, differentially
abundant miRNAs detected in blood [53], plasma [54, 55], serum [14], urine [56], cystic
fluid [57], pancreatic juice [58], and sputum [59] samples have been proposed as candidate
biomarkers of different types of cancer.

11
Table 2.1 Several important miRNAs that are associated with human cancers/tumors. (Adapted
with permission from reference [52]. Copyright 2013 John Wiley and Sons.)
MiRNAs Cancers/tumors association Function
miR-21
colorectal, lung, breast, liver, stomach, and
pancreatic cancers; chronic lymphocytic
leukemia; neuroblastoma; glioblastoma; diffuse
large B-cell lymphoma; acute myeloid
leukemia; Hodgkin’s lymphoma
oncogene
miR-17-92 cluster breast, lung, colon, stomach, and pancreatic
cancers; lymphomas oncogene
miR-155 lung, breast, and colon cancers; chronic
lymphocytic leukemia; B-cell lymphoma oncogene
miR-221 and miR-222 chronic lymphocytic leukemia; thyroid
carcinoma; hepatocellular carcinoma oncogene
miR-372 and miR-373 testicular tumors oncogene
let-7 family lung, breast, colon, stomach, and ovarian
cancers tumor suppressor
miR-15a and miR-16-1 prostate cancer; chronic lymphocytic leukemia;
multiple myelomas; pituitary adenomas tumor suppressor
miR-29
lung and breast cancers; acute myeloid
leukemia; chronic lymphocytic leukemia;
cholangocarcinoma
tumor suppressor
miR-31 breast cancer tumor suppressor
miR-34 colon, lung, breast, kidney, bladder, pancreatic,
and liver cancers; neuroblastoma; melanoma tumor suppressor
miR-126 colorectal, gastric, lung, prostate, bladder, and
breast cancers tumor suppressor
miR-145 breast and colon cancers tumor suppressor
miR-203 hepatocellular and pancreatic tumors tumor suppressor
2.1.2 MiRNA biomarkers for other diseases
In addition to cancers and tumors, miRNAs have shown to be associated with various
diseases, including diabetes, neurological disorders and cardiovascular diseases.
In diabetic and pre-diabetic conditions, the miRNAs expression profiles are altered both in
organs and in serum, consequently impairing insulin signaling, glucose, and lipid
homeostasis [42]. The identification of specific miRNA signatures predicting the
appearance of type 1 diabetes, type 2 diabetes, or their long-term complications would be
very useful to permit the instauration of appropriate prevention strategies [52]. The
expression of various serum miRNAs has been investigated in type 1 diabetes patients. As

12
a result, miR-152, miR-30a-5p, miR-181a, miR-24, miR-148a, miR-210, miR-27a, miR-
29a, miR-26a, miR-27b, miR-25, and miR-200a are found to be upregulated in type 1
diabetes patients [60]. With regard to type 2 diabetes, studies revealed that serum miR-126
and serum miR-23a can be valuable biomarkers for pre-diabetes and early detection of type
2 diabetes [61, 62]. In addition, serum miRNAs such as miR-29a, miR-222, and miR-132
are proposed to be candidate biomarkers for predicting gestational diabetes mellitus [63].
MiRNAs are essential for the correct function of the nervous system, which has the broadest
spectrum of miRNA expression of all human tissues. Around 70% of miRNAs are
expressed in brain, and many of them are specific to neurons [64]. The brain-specific miR-
9 and miR-134 are found to be involved in different aspects of neural development [65, 66].
Moreover, aberrant expression of miRNAs is associated with abnormal brain development
and the pathogenesis of several neurodevelopmental diseases, such as Tourette’s syndrome,
Alzheimer’s disease and Parkinson’s disease [67]. For instance, low miR-107 expression is
found in the cortex of Alzheimer’s disease patients [68], and the expression levels of blood
miR-1, miR-22*, and miR-29 can be useful biomarkers for Parkinson’s disease [69].
MiRNAs have been found to be key regulators of cardiac development as well as multiple
cardiovascular diseases [70]. MiRNAs are up or downregulated in vascular disease, heart
failure, ischemic cardiomyopathy, dilated cardiomyopathy, and aortic stenosis [71, 72].
Since miRNAs in the systemic circulation may reflect tissue damage, circulating miRNAs
such as miR-1, miR-208a, and miR-126 have been suggested as potential biomarkers for
the acute myocardial infarction diagnosis [73-75].
Besides, miRNAs are used as biomarkers for the diagnosis of various other diseases. For
example, circulating miR-122, miR-22, and miR-34a are found to be correlated with human
immunodeficiency virus, and can serve as biomarkers for liver injury in human
immunodeficiency virus patients [76]. Urinary miRNAs such as miR-1, miR-133, miR-223,
and miR-199 are dysregulated in patients with autosomal-dominant polycystic kidney
disease, and can be used as potential biomarkers of disease progression [77]. Plasma miR-
122 is proposed as a biomarker for hepatic diseases [78]. In addition, circulating miR-323-
3p is suggested as a biomarker for the diagnosis of ectopic pregnancy [79].

13
Taken together, understanding the functions of different individual and combined miRNAs,
identifying disease-relevant signatures of miRNAs, and detecting them as biomarkers in
tissues as well as in body fluids can be of paramount importance for both diagnostics and
therapy of cancers or other diseases.
2.2 MiRNA detection methods
2.2.1 Introduction
As the clinical and biological implications of miRNAs have been sufficiently elucidated, it
is of great significance to develop robust analytical technologies that facilitate routine
miRNA detection. While owing to the unique characteristics of miRNA, such as small size,
low abundance, sequence similarity, and their ability to regulate multiple targets, the
progress in miRNA detection modalities meets many challenges and remains to be
improved [6].
First, due to the small size as well as the GC content variation of miRNA, specific
thermodynamic constraints should be taken into account, which can potentially introduces
sequence-specific bias and significantly complicate the vast majority of hybridization-
based, especially polymerase chain reaction (PCR)-based, detection methods [80]. Second,
miRNAs are often expressed differing only by single nucleotides. The high sequence
similarity among family members makes the specific detection more difficult. Third,
miRNAs make up only a small fraction (roughly 0.01%) of the mass in total RNA extracted
from a sample of interest, and miRNA concentration in cellular can be as low as a few
molecules per cell [81]. The extremely low abundance of miRNA requires a highly sensitive
assay. Moreover, the abundance of particular miRNA sequences varies by as much as four
orders of magnitude from a few copies to over 50,000 copies per cell [82], thus, a wide
dynamic range of miRNA detection is also a necessity. Importantly, beyond specificity,
selectivity, and large dynamic range, another challenge is high-order multiplexing, whereby
levels of more than one miRNA are quantitated simultaneously and from a single sample.
Most mRNAs are regulated by one or more miRNAs [83], and further study revealed that

14
multiple miRNAs can target the same mRNA [84], adding complexity to the mechanisms
through which miRNAs regulate gene expression. Hence, it requires methods to detect
multiple miRNAs to fully understand the important and complex function of these
regulation mechanisms.
Given the aforementioned analytical challenges, considerable effort has been continuously
devoted to explore miRNA analysis strategies to meet the requirements for accuracy,
sensitivity, specificity, high-throughput, and capacity to high-order multiplexing.
2.2.2 Conventional methods
At present, the major approaches used to analyze miRNAs are reverse transcription
quantitative polymerase chain reaction (RT-qPCR), microarrays, next-generation
sequencing (NGS), in situ hybridization (ISH), and northern blotting (NB).
RT-qPCR. As the current gold standard for miRNA analysis, there already exists some
commercial assays and protocols, such as miRCURY LNA miRNA PCR Assays from
QIAGEN, TaqMan Assays from Thermo Fisher Scientific, and Two-tailed miRNA Assays
from TATAA Biocenter. As mentioned before, the small size of miRNA (roughly the same
size as traditional primer) complicates most PCR-based detection schemes. To overcome
this challenge, two strategies are most commonly used: (1) stem-loop RT-based miRNA
assays using TaqMan probe; (2) poly (A) tailing-based and direct RT-based miRNA assays
using SYBR green dye [85]. The overall workflow for both of these RT-qPCR approaches
are illustrated in Figure 2.2a. The principle of these RT-qPCR methods mainly relies on
reverse transcription of miRNA to complementary DNA (cDNA), followed by quantitative
PCR with real-time monitoring of reaction product accumulation using either intercalating
dye or TaqMan probe.
Microarray. Microarrays were among the first methods to be utilized for parallel analysis
of large amounts of miRNAs, that rely on nucleic acid hybridization between target
miRNAs and their corresponding complementary probes (Figure 2.2b). Several technical
variations of the approach have been developed independently including the probe design,
immobilization chemistry, sample labeling, and microarray chip signal detection methods
[86]. GeneChip miRNA Array from Thermo Fisher Scientific is one of the well-known

15
platforms for studying the role of miRNAs and their involvement in a broad spectrum of
developmental and physiological mechanisms.
NGS. The NGS technique has enabled another major approach for miRNA expression
profiling, of which unique is the ability to identify novel miRNA sequences that are not
already annotated in miRNA databases. The main NGS technologies have been reviewed
[87]. Generally, NGS begins with the preparation of a small cDNA library from the miRNA
sample of interest using a RT process similar to RT-qPCR. Adaptors are ligated to both the
5′ and 3′ ends of the cDNA products, and the resulting products are attached to either a
planar or bead based substrate (Figure 2.2c). This is then followed by the massively parallel
sequencing of millions of individual cDNA molecules from the library. Bioinformatic
analysis of the sequence reads identifies both known and novel miRNAs in the data sets
and provides relative quantification using a digital approach.
ISH. Since it was firstly used for miRNA detection in 2006 [88], ISH has become a
common and unique technique for miRNA profiling which identifies the native locations
of miRNA in a single cell, inside tissues, or in cell compartments. Depending on the
detection method, ISH can be divided into chromogenic enzyme-based ISH and fluorescent
ISH (FISH). Global miRNA expression analysis in tissues is typically performed with the
help of chromogenic enzyme-based ISH detection methods, while for more precise small
RNA localization studies, FISH imaging is more suitable [89]. Various approaches,
including modification of hybridization probes, cell fixation and permeabilization,
amplification of the target sequence and detection signal, enable the significant progress in
single molecule RNA FISH techniques [89, 90].
NB. At present, NB for miRNA analysis is a readily available technology for molecular
biology laboratories. Common protocol for NB involves miRNA isolation, polyacrylamide
gel electrophoresis, transfer of the separated sample to the blotting membrane, and
visualization via hybridization with a radioactively labeled DNA strand complementary to
the miRNA of interest. As NB involves a size-based separation step, it can simultaneously
detect both mature and precursor forms of a miRNA, which can be utilized for the studies
on miRNA processing mechanisms [91].

16
Figure 2.2 Schematic representation of major conventional methods for miRNA detection: a.
reverse transcription quantitative polymerase chain reaction (RT-qPCR); b. microarray; c. next-
generation sequencing (NGS). (Adapted with permission from reference [92]. Copyright 2012
Springer Nature.)
17
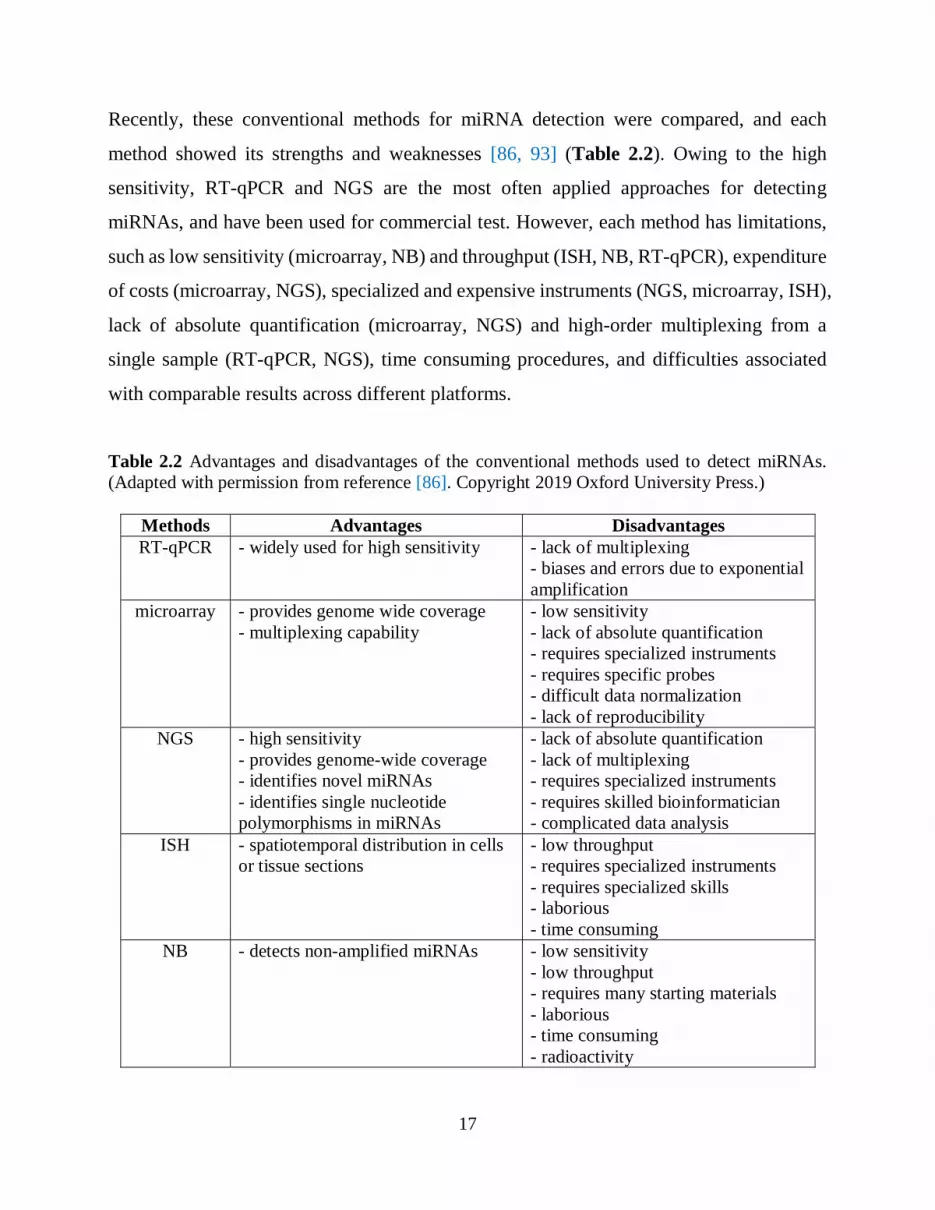
Recently, these conventional methods for miRNA detection were compared, and each
method showed its strengths and weaknesses [86, 93] (Table 2.2). Owing to the high
sensitivity, RT-qPCR and NGS are the most often applied approaches for detecting
miRNAs, and have been used for commercial test. However, each method has limitations,
such as low sensitivity (microarray, NB) and throughput (ISH, NB, RT-qPCR), expenditure
of costs (microarray, NGS), specialized and expensive instruments (NGS, microarray, ISH),
lack of absolute quantification (microarray, NGS) and high-order multiplexing from a
single sample (RT-qPCR, NGS), time consuming procedures, and difficulties associated
with comparable results across different platforms.
Table 2.2 Advantages and disadvantages of the conventional methods used to detect miRNAs.
(Adapted with permission from reference [86]. Copyright 2019 Oxford University Press.)
Methods Advantages Disadvantages
RT-qPCR - widely used for high sensitivity
- lack of multiplexing
- biases and errors due to exponential
amplification
microarray - provides genome wide coverage
- multiplexing capability
- low sensitivity
- lack of absolute quantification
- requires specialized instruments
- requires specific probes
- difficult data normalization
- lack of reproducibility
NGS - high sensitivity
- provides genome-wide coverage
- identifies novel miRNAs
- identifies single nucleotide
polymorphisms in miRNAs
- lack of absolute quantification
- lack of multiplexing
- requires specialized instruments
- requires skilled bioinformatician
- complicated data analysis
ISH - spatiotemporal distribution in cells
or tissue sections
- low throughput
- requires specialized instruments
- requires specialized skills
- laborious
- time consuming
NB - detects non-amplified miRNAs
- low sensitivity
- low throughput
- requires many starting materials
- laborious
- time consuming
- radioactivity

18
2.2.3 Isothermal amplification-based methods
Isothermal amplification has emerged as a powerful method for quantification of nucleic
acids and has already proven its utility for developing highly specific and sensitive miRNA
assays. Alternative to PCR methods that rely on the precise and complex thermocycling,
isothermal amplification-based methods can rapidly and efficiently amplify the short target
nucleic acids or the signal of a recognition event at constant temperature under simple
conditions. Since the first isothermal amplification technique was introduced to detect
miRNA [94], creative miRNA assays using isothermal amplification have been developed,
achieving miRNA detection with high specificity (single-nucleotide resolution) and
superior sensitivity (detection limit reaching femtomolar or attomolar level). Sequentially,
these methods are demonstrated to be capable for miRNA quantification in clinical samples
(tissues, serum, and plasma), and well suitable for miRNA in situ detection due to their
mild reaction conditions and localized amplification ability [95]. A multitude of isothermal
amplification techniques has been exploited. For instance, rolling circle amplification
(RCA), duplex-specific nuclease signal amplification (DSNSA), loop-mediated isothermal
amplification (LAMP), and strand-displacement amplification (SDA), that are mainly
realized by enzyme-based replication or digestion. Besides, isothermal amplification can
also be achieved via enzyme-free strand displacement processes, such as catalytic hairpin
assembly (CHA) and hybridization chain reaction (HCR). Table 2.3 summarizes the basic
mechanism and Figure 2.3 shows the schematic representation of these isothermal
amplification-based methods for miRNA detection, respectively. The appealing attributes
of isothermal amplification are: (1) the capability for rapid and high amplification (usually
amplification efficiency of 103-106 within 3h); (2) the programmability allowing for
construction of cascade amplification; (3) the compatibility with diversified detection
platforms, such as fluorescence, electrochemistry, and colorimetry [95]. These advantages
provide an excellent opportunity to build various sensitive and rapid bioassays for miRNA
detection.

19
Figure 2.3 Schematic representation of isothermal amplification-based methods for miRNA
detection: a. rolling circle amplification (RCA); b. duplex-specific nuclease signal amplification
(DSNSA); c. loop-mediated isothermal amplification (LAMP); d. strand-displacement
amplification (SDA); e. catalytic hairpin assembly (CHA); f. hybridization chain reaction (HCR).
(Adapted with permission from reference [95]. Copyright 2017 American Chemical Society.)

20
Table 2.3 Summary of the isothermal amplification-based methods for miRNA detection.
(Adapted with permission from reference [95]. Copyright 2017 American Chemical Society.)
Methods Amplification mechanism Enzyme Role of
miRNA
Linear or
exponential
amplification
RCA polymerase extension,
strand displacement DNA polymerase, ligase primer both
DSNSA cleaving DNA probe duplex-specific nuclease template linear
LAMP polymerase extension,
strand displacement DNA polymerase primer exponential
SDA
polymerase extension,
strand displacement,
nicking
DNA polymerase,
nicking endonuclease
primer or
initiator both
CHA strand displacement enzyme-free initiator linear
HCR strand displacement enzyme-free initiator linear
RCA. In the 1990s, it was reported that DNA polymerase can utilize circular templates to
make a long linear strand, containing multiple copies of a given sequence and this process
was referred to as RCA [96, 97]. RCA can be coupled to the ligation of a padlock probe (in
the presence of a target analyte) to provide sensitive detection of nucleic acids, and it was
firstly used to detect miRNA in 2006 [98]. The padlock probe is a single probe that contains
3’- and 5’-end sequences that bind to target miRNA sequences in a juxtapose manner to aid
a ligase-mediated circularization of the padlock probe if the 5’-end is phosphorylated. After
circularization of the padlock probe, target miRNA (or an external primer) and DNA
polymerase are used to produce long repeating DNA, which can generate amplification
with high efficiency sequences (Figure 2.3a). Besides padlock probes, dumbbell probes-
mediated RCA strategy is also widely used [99,100]. Subsequently, a target miRNA
recycled RCA assay with specially designed dumbbell probe is proposed without utilization
of ligases [101]. The dumbbell probe is already circularized but the primer-binding site is
sequestered in the duplex region of the dumbbell. Upon target binding, the duplex region
of dumbbell probe opens up to enable the primer to bind and the RCA process to begin.
In contrast to linear RCA techniques mentioned above, the proposal of exponential
amplification method hyperbranched RCA (HRCA) leads to the sensitivity significantly

21
improved, which is reported that more than 109 copies of the circle can be produced within
90 min at approximately 60 °C [102]. The schematic representation of HRCA is shown in
Figure 2.4. During the linear RCA process, the forward primer (usually the target miRNA)
produces a multimeric ssDNA RCA product, which then becomes the template for the
reverse primer. The DNA polymerase then extends the reverse primer, and during the
extension process the downstream DNA is displaced to generate branching or a ramified
DNA complex, which induces a discrete series of single-stranded DNA (ssDNA) or double-
stranded DNA (dsDNA) fragments of various lengths comprising one or multiple units of
the circular probe.
Figure 2.4 Schematic representation of HRCA strategy: (1) forward primer binds to ligated circular
probe and is extended by DNA polymerase; (2) the continuous amplification generates a long
ssDNA, which contains binding sites for reverse primer; (3) reverse primers bind to the long
ssDNA and are extended by DNA polymerase; (4) the nascent ssDNA generated from reverse
primer extension can also serve as templates to synthesize other primers. (Adapted with permission
from reference [103]. Copyright 2014 The Royal Society of Chemistry.)

22
In most cases, target miRNA is generally used as the template for selective ligation of a
padlock probe to generate the oligonucleotide circle. Due to the limited length of miRNA,
mismatch between miRNA and ssDNA padlock, even if there is a mismatch of only one
pair of bases, would lead to a significant decrease in melting temperature, which means an
extremely low possibility of oligonucleotide circle generation and thus forbidden RCA
[104]. In other words, using miRNA as a ligation template could provide improved
specificity in miRNA assays and single-base differences between miRNAs have been
correctly discriminated. Additionally, the exploitation of T4 RNA ligase 2 and SpintR
ligase (Chlorella virus DNA ligase) leads to the higher selectivity and sensitivity than the
commonly used T4 DNA ligase for RNA splinted DNA ligation [105-107]. RCA has been
widely used in miRNA detection due to its high sensitivity and specificity.
DSNSA. Duplex specific nuclease is an enzyme that shows a strong preference for cleaving
DNA in dsDNA or DNA-RNA hybrid duplexes with little activity against ssDNA or RNA,
exhibits good capability to discriminate perfectly matched short DNA duplexes from non-
perfectly matched ones [108]. By taking these particular properties of nuclease, DSNSA
possesses an intrinsic advantage for miRNA assay. As shown in Figure 2.3b, DSNSA is
achieved by the miRNA-mediated cycle of probe capturing, cleavage and fragment release.
In typical DSNSA-based miRNA detection methods, target miRNAs can continuously
capture specific DNA probes once they are released in reaction systems, no matter the
probes are designed to be linear- or hairpin-structured [109], fluorophore-labeled or label-
free [110]. Upon using differently labeled DNA probes, simultaneous detection of multiple
miRNAs can be realized [111, 112]. Moreover, low error rates occur owing to the one-step
amplification based on simple hybridization between the target miRNAs and probes.
LAMP. LAMP strategy was firstly introduced in 2000 [118], which exhibits great
sensitivity as a result of its exponential amplification feature. As illustrated in Figure 2.3c,
the LAMP system consists of a template DNA (M, F2c, F1c, B1, B2, B3), forward inner
primer (F1c, F2), backward inner primer (B1c, B2) and outer primer B3. In the initial step,
forward inner primer hybridizes to F2c in the template DNA and extends in the presence of
DNA polymerase. Afterwards, target miRNA hybridizes to M in the template DNA and

23
initiates the extension along the DNA template and the strand displacement DNA synthesis
with the help of DNA polymerase. Consequently, forward inner primer-linked ssDNA is
released and forms a stem-loop structure at the 5’-end through the hybridization between
F1 and F1c. At the 3’-end of this ssDNA, backward inner primer hybridizes to B2c to
perform the primer extension and then the outer primer B3 hybridizes to B3c in the 3’-end
of the ssDNA to perform the strand displacement DNA synthesis, releasing a backward
inner primer-linked ssDNA, which can form dumbbell structures at 3’- and 5’-end,
respectively. This auto-cycling strand displacement DNA synthesis can be repeated
continuously and leads to exponential amplification of miRNA. LAMP can amplify a few
copies of the target to 109 in less than one hour with high specificity [113].
However, the major disadvantages of LAMP strategy are the complicated design of primers
for stem-loop formation, effected performance due to the synergistic hybridization and
extension of the multiple primers along the long template, and the positive false signal
caused by the indirect evaluation methods [114]. Though several new ideas have been put
forward in order to overcome these shortcomings [115-117], there is still brilliant space for
retrofitting primers and detection probes to adapt to the detecting requirement.
SDA. SDA is a kind of isothermal reaction, of which the mechanism relies on nicking,
polymerase extension, and strand displacement. In terms of miRNA detection, two types of
SDA strategies have been developed allowing for exponential and linear signal
amplification (Figure 2.3d). In exponential amplification strategy, target miRNA works
as a primer and hybridizes with a carefully designed ssDNA template. Once captured by
the template, target miRNA is extended by DNA polymerase to generate one or more
recognition sites for nicking enzyme, and the released DNA strands trigger a downstream
detection signal. In some more complex cases, released DNA strands can be re-captured by
the same or another ssDNA template, acting as primers to trigger another amplification
SDA cycle. In linear amplification strategy, probe is designed as hairpin structure that the
primer hybridization region is blocked in the stem region. The primer in the reaction
solution can only be captured by probes that opened by target miRNA. Afterwards, a cycle

24
of miRNA-induced primer capturing, polymerase extension, and subsequent miRNA strand
release are created, resulting in a linear amplification of the signal.
The commonly used polymerases in SDA are Bst DNA polymerase [118], Klenow fragment
polymerase [119], and phi29 DNA polymerase [120], that have been widely reported to
construct sensitive miRNA sensing platforms. However, the conventional utilization of
enzymes hinders SDA from wider application because enzyme-mediated reactions are
restricted by temperature, ionic composition, and other factors [114]. Hence, the
developments of more transformational SDA methods are important.
CHA. Since originally developed in 2008 [121], CHA has received particular interest
owing to its excellent property of enzyme-free signal amplification. As illustrated in Figure
2.3e, two complementary nucleic acid hairpins are designed and the reaction is inactivated
in the absence of target. Only upon addition of the target miRNA which acts as initiator,
one of the hairpins can be opened based on the toehold-mediated strand displacement, and
then further enable the assembly of both hairpins to form double-stranded CHA product.
Subsequently, the spontaneously displaced and recycled miRNA can act as a catalyst to
induce more hairpin assembly events. However, the background signal caused by the
nonspecific CHA products in the absence of target may counteract the specificity of signal
amplification methodologies and compromise their analytical performance [122]. Aiming
at this challenge, an improved CHA strategy is proposed by introducing mismatched base
pairs into the breathing sites of the hairpin substrates [123]. This kind of mismatched CHA
amplification significantly decreased the background reaction signal, which improved the
properties of CHA-based biosensing strategies for miRNA detection [124-126].
CHA is a simple and nimble isothermal amplification method, which can be ascribed to its
enzyme-free peculiarity. It avoids the disadvantages of enzymatic reactions, including
particular reaction times and conditions to maintain the enzyme's activity. In addition, the
cyclic utilization of the target miRNA during CHA procedure make designed biosensors
achieve excellent sensitivity even in the low level of miRNA.

25
HCR. As another enzyme-free isothermal amplification method, the basic mechanism of
HCR was firstly reported by Pierce and Dirks in 2004 [127]. As seen from Figure 2.3f, two
species of hairpin DNA (H1, H2) are rationally designed, and one hairpin DNA (H1)
comprises sequences complementary to the target miRNA and another hairpin DNA (H2).
Only in the presence of initiator target miRNA, the hairpin structure of H1 can be opened,
and then hybridize with H2, forming a nicked long double-stranded DNA structure to
amplify the signal readout.
HCR shows great potential in biosensor because it can bind thousands of auxiliary hairpin
probes to amplify signal [128]. What's more, the enzyme-free reaction eliminates the
restrictions of enzyme-coupled methods. Nevertheless, deficiencies such as environmental
sensitivity still need to be addressed for more extensive applications in clinical miRNA
diagnostics.
2.3 Förster resonance energy transfer
Förster resonance energy transfer (FRET) is a well-established photophysical phenomenon,
by which energy transfers from a donor molecule in excited state to an acceptor molecule
in ground state over reasonable distances (typically 1-20 nm). Such energy transfer is a non-
radiative process (without emission of photon) and is the result of dipole-dipole interactions
between the donor and acceptor. If the donor-acceptor pair is correctly oriented and
luminescence spectrum of the donor overlaps with the absorption spectrum of the acceptor,
energy can be transferred leading to luminescence quenching of donor and emission from
FRET-sensitized acceptor (when the acceptor is luminescent).
The discovery of the FRET phenomenon could be traced back to the beginning of the
twentieth century [129, 130]. Afterwards in 1927, Jean Perrin [131] initially put forth a
classical explanation of this phenomenon, and proposed the relationship between the dipole
interactions and the transferred energy. Later in 1932, his son Francis Perrin [132]
developed a corresponding quantum mechanical theory based on Kallmann’s and London’s
results [133]. He recognized the influence of the spectral overlap between the emission

26
spectrum of donors and the absorption spectrum of acceptors on energy transfer efficiency.
However, the relation between easily accessible spectroscopic data and theoretical
equations was achieved by Theodor Förster [134-138]. By extending the Perrins’ original
ideas, he proposed a quantitative theory to describe the non-radiative energy transfer
depending on the spectral overlap and the intermolecular distance that are still valid today
thus enabling the possibility of many FRET applications in all kinds of natural sciences
[139]. To date, FRET has become an outstanding tool for the study of intermolecular
interactions with many applications in biological technologies, sensing, and conformational
studies.
The discussion below presents some basic knowledge of mechanisms in terms of FRET
theory (Section 2.3.1) and FRET measurement techniques (Section 2.3.2) that are mainly
extracted from reference [140], and a short review of FRET-based applications in miRNA
biosensing (Section 2.3.3).
2.3.1 FRET theory
The basic principle of FRET can be described in the Jablonski diagram. As illustrated in
Figure 2.5, the donor and acceptor possess several different electronic states, and the
energy transfer only happens when they share the same electronic transition (red, green and
purple line). It takes place from the state in which the donor is excited (D*) to a state in
which the acceptor is excited (A*), where an electronic transition from a higher to a lower
energy level in donor leads to an electronic transition from a lower to a higher energy level
in acceptor. Thus the shared electronic transition, the spectral overlap between donor
emission and acceptor absorbance in terms of spectroscopy, is an indispensable condition
for FRET. In addition, due to the dipole-dipole interaction, the distance between donor and
acceptor must be close but not too close. In fact, this dipole-dipole coupling should be
dominant at the usually considered FRET distance range of approximately 1-20 nm, where
orbital overlap-related mechanisms (for very short distances) and radiative mechanisms (for
long distances) play minor roles [140].

27
Figure 2.5 Basic FRET principle described in simplified energy level scheme (Jablonski diagram).
The donor is excited (hv) from an electronic ground state (D) to an excited state (D*), then goes to
an excited electronic ground state by inner relaxation (dotted arrow), then goes to ground state by
radiative decay (kD), non-radiative decay (kD-NR) or FRET (kFRET). The FRET process from D* to
A* occurs when they share the same electronic transition (the difference between the respective
energy levels need to be equal, vertical dashed lines in red, green and purple color). After FRET,
the acceptor is in an excited state (A*), followed by radiative decay (kA) or non-radiative decay (kA-
NR) to its ground state (A). (Adapted with permission from reference [140]. Copyright 2013 The
Wiley-VCH Verlag GmbH & Co. KGaA.)
The FRET rate (𝑘𝐹𝑅𝐸𝑇) can be described as following Equation 2.1:
𝑘𝐹𝑅𝐸𝑇 =9(ln 10)κ2Փ𝐷
128𝜋5𝑁𝐴𝑛4𝜏𝐷𝑟6 𝐽(𝜆) (2.1)
where κ2 is the orientation factor of coupled donor and acceptor transition dipole
moments, Փ𝐷 is the luminescence quantum yield of donor in absence of energy transfer,
𝑁𝐴 is Avogadro’s number (6.023 × 10²³ mol-1), 𝑛 is the refractive index of the medium, 𝜏𝐷
is the luminescence lifetime of donor (in the absence of acceptor), 𝑟 is the distance between
donor and acceptor, and 𝐽(𝜆) is the spectral overlap integral between the donor emission
and acceptor absorption defined in wavelength scale.

28
When the 𝑘𝐹𝑅𝐸𝑇 and other decay rates are in equilibrium (𝑘𝐹𝑅𝐸𝑇 = 𝑘𝐷 + 𝑘𝐷−𝑁𝑅 = 𝜏𝐷−1),
and the FRET efficiency (𝜂𝐹𝑅𝐸𝑇) is 50% at a distance 𝑟, this distance is commonly referred
as Förster distance 𝑅0, which can be calculated by replacing 𝑘𝐹𝑅𝐸𝑇 with 𝜏𝐷−1 and 𝑟 with 𝑅0
in Equation 2.2:
𝑅0 = (9(ln 10)κ2Փ𝐷
128𝜋5𝑁𝐴𝑛4 𝐽(𝜆))
1 6⁄
= 0.02108(κ2Փ𝐷𝑛−4𝐽(𝜆))1 6⁄
nm (2.2)
The spectral overlap integral 𝐽(𝜆) describes the degree of energetic resonance between
donor and acceptor (Figure 2.6), which is accessible with precise spectroscopy
measurements and is given by Equation 2.3:
𝐽 = ∫ 𝐼�̅�(𝜆) 𝜀𝐴(𝜆) 𝜆4𝑑𝜆 (2.3)
where 𝜀𝐴(𝜆) is the acceptor extinction coefficient (or molar absorptivity) spectrum, 𝐼�̅�(𝜆)
is the donor emission spectrum normalized to unity and is given by Equation 2.4:
∫ 𝐼�̅�(𝜆) 𝑑𝜆 = 1 (2.4)
Figure 2.6 The overlap (gray area) of the area normalized emission spectrum of donor (D) (cf.
Equation 2.4) and the extinction coefficient spectrum of acceptor (A) 𝜀𝐴 defines the overlap
integral 𝐽 (cf. Equation 2.3). (Adapted with permission from reference [140]. Copyright 2013 The
Wiley-VCH Verlag GmbH & Co. KGaA.)

29
Figure 2.7 a. The orientation of donor emission transition dipole moment �⃗�𝐷, the orientation of
acceptor absorption transition dipole moment �⃗�𝐴 , and connection vector 𝑟 . (Adapted with
permission from reference [141]. Copyright 2016 American Chemical Society.); b. The possible
virtual orientations of donor and acceptor transition dipole moments and the corresponding κ2.
(Adapted with permission from reference [142]. Copyright 2015 MDPI.)
In addition, another important variable for FRET is the orientation factor κ2 (in Equation
2.1 and Equation 2.2). Figure 2.7a describes the orientation of the donor and acceptor
dipole moments within the basic concept of FRET. With the different angles between the
transition dipole moments of donor (𝜇𝐷 ) and acceptor (𝜇𝐴) and the connection vector
between them (𝑟), κ2 can be calculated as following Equation 2.5:
κ2 = [�̂�𝐷 ∙ �̂�𝐴 − 3(�̂�𝐷 ∙ �̂�)(�̂�𝐴 ∙ �̂�)]2 = (cos 𝜃𝐷𝐴 − 3 cos 𝜃𝐷 cos 𝜃𝐴)2 (2.5)
where �̂�𝐷, �̂�𝐴, and �̂� represent the unit vectors of 𝜇𝐷, 𝜇𝐴, and 𝑟, respectively, 𝜃𝐷𝐴 is the
angle between the donor and acceptor transition dipole moments (𝜇𝐷 and 𝜇𝐴), 𝜃𝐷 and 𝜃𝐴
are the angles between the respective dipole moments and the donor-acceptor connection
vector (𝜇𝐷 and 𝑟, 𝜇𝐴 and 𝑟).

30
According to the Equation 2.5, κ2 can range from 0 to 4 depending on the relative
orientation of donor and acceptor transition dipole moments. As illustrated in Figure 2.7b
[142], κ2 can be 4 for head-to-tail parallel transition dipole moments, 1 for the parallel
transition dipole moments, and κ2 = 0 can occur for the perpendicular orientation. Often,
κ2 = 2 3⁄ is assumed to be a good approximation and is used for many practical FRET
application [140]. When both donor and acceptor can take any possible orientation during
the FRET time (1 𝑘𝐹𝑅𝐸𝑇⁄ ), which means that the average rotation rate is much larger than
the average FRET rate (𝑘𝑟𝑜𝑡𝑎𝑡𝑖𝑜𝑛 ≫ 𝑘𝐹𝑅𝐸𝑇), the system is in a dynamic averaging regime
and κ2 becomes 2 3⁄ . Even if one of the FRET pair shows average orientation and the other
has a fixed orientation, then κ2 can take values between 1 3⁄ and 4 3⁄ , for which 2 3⁄ is still
a decent approximation.
Taking Equation 2.1 and Equation 2.2 allows to the relation between the FRET rate
(𝑘𝐹𝑅𝐸𝑇), the luminescence decay time of donor (𝜏𝐷), and the donor-acceptor distance (𝑟).
As described in Equation 2.6, 𝑘𝐹𝑅𝐸𝑇 is inverse sixth power distance dependent (𝑟−6):
𝑘𝐹𝑅𝐸𝑇 = 𝜏𝐷−1
(
𝑅0
𝑟)
6
(2.6)
Then the FRET efficiency (𝜂𝐹𝑅𝐸𝑇) can be given by Equation 2.7:
𝜂𝐹𝑅𝐸𝑇 =𝑘𝐹𝑅𝐸𝑇
𝑘𝐹𝑅𝐸𝑇+𝑘𝐷+𝑘𝐷−𝑁𝑅 =
𝑘𝐹𝑅𝐸𝑇
𝑘𝐹𝑅𝐸𝑇+𝜏𝐷−1 =
1
1+(𝑟 𝑅0⁄ )6=
𝑅06
𝑅06+𝑟6
(2.7)
As shown in Figure 2.8, due to the 𝑟−6 distance dependency, FRET efficiency is mostly
sensitive in the region of 0.5 𝑅0 to 2.0 𝑅0 (gray area). Beyond this range, FRET is either
too efficient for shorter distances or negligible for longer distances.

31
Figure 2.8 FRET efficiency as a function of donor (D) to acceptor (A) distance (cf. Equation 2.7).
(Adapted with permission from reference [140]. Copyright 2013 The Wiley-VCH Verlag GmbH
& Co. KGaA.)
As FRET is a deactivation process of the excited donor, the photophysical properties of the
donor change in the FRET process. Thus, in terms of different spectroscopy, FRET
efficiency (𝜂𝐹𝑅𝐸𝑇 ) can be determined by measuring the luminescence intensity (𝐼), or
luminescence decay time (𝜏), or quantum yield (Փ) of the donor in the presence (𝐼𝐷𝐴, 𝜏𝐷𝐴,
Փ𝐷𝐴) and in the absence of the acceptor (𝐼𝐷, 𝜏𝐷, Փ𝐷), respectively (Equation 2.8).
𝜂𝐹𝑅𝐸𝑇 = 1 −𝐼𝐷𝐴
𝐼𝐷 = 1 −
𝜏𝐷𝐴
𝜏𝐷= 1 −
Փ𝐷𝐴
Փ𝐷 (2.8)
In summary, an effective FRET depends on several factors that must be carefully taken into
account before thinking about an application of FRET:
(i) Spectral overlap integral 𝐽(𝜆) : the donor emission spectrum must overlap with the
acceptor.absorption spectrum.
(ii) Distance between FRET pair 𝑟: due to the strong distance dependence (𝑟−6) of FRET
efficiency, a slight modification of 𝑟 can induce a significant change on FRET signals in
the range of 0.5 𝑅0 to 2.0 𝑅0. The distance 𝑟 should be neither too far nor too close (ca. 1-
20 nm).
(iii) The orientation factor κ2: the donor emission dipole moment, the acceptor absorption
dipole moment, and their separation vectors must be in favorable mutual orientation. κ2 is
usually assumed to be 2 3⁄ , which is the average value integrated over all possible angles
for freely rotating attached-lumiphores.

32
2.3.2 FRET measurements
Although FRET itself is non-radiative, luminescence is always involved in FRET. In order
to determine the FRET efficiency and FRET distance, emission changes of donor and
acceptor (in case it is luminescent) must be measured. Luminescence can be measured by
steady-state and time-resolved techniques, and time-resolved techniques can be divided into
time-domain and frequency-domain methods. This section gives a short overview of these
FRET measurement techniques in terms of luminescence spectroscopy.
Steady-state FRET measurements. Steady-state luminescence spectroscopy measures
emission spectra (emission intensity of the luminophores as a function of wavelength over
their entire time period of emission). It is achieved by exciting the luminophores at a fixed
wavelength, and then scanning over the wavelength of their emission, which is then
detected in selected wavelength intervals. In FRET experiments, steady-state measurement
offers the advantage that both donor and acceptor can be measured at the same time within
the same sample. Luminescence intensities (𝐼𝐷 , 𝐼𝐷𝐴 , 𝐼𝐴 , 𝐼𝐴𝐷 ,) can be extracted from the
measured overall spectrum and used for the calculation of FRET efficiency and distance.
However, as the measured overall spectrum contains both donor and acceptor emissions,
the spectral crosstalk between them should be taken into account. Moreover,
autofluorescence from the sample medium, sample scattering and reabsorption (inner filter
effects), and low signal-to-noise ratios are common sources of error that require an adequate
correction.
Time-resolved FRET measurements. Time-resolved luminescence spectroscopy
measures time-dependent luminescence intensity, which can be divided into time-domain
method and frequency-domain method. Time-domain method uses a short excitation pulse
of light, usually in the nanosecond range for lasers up to microsecond range for flash lamps.
The excitation pulse is ideally much shorter than the decay time of the sample. Frequency-
domain method uses intensity-modulated excitation light, the emitted light will follow this
modulation frequency with a time delay called phase shift or phase angle ( ϕ ). The
modulation frequency is typically in the same range as the reciprocal of the luminescence
decay time of the sample. Both methods can be used to determine luminescence decay times,

33
Figure 2.9 shows the typical examples of measurements, respectively. Compared to
frequency-domain method, time-domain method permits visualization of the luminescence
decay and provides straightforward dynamic information.
Figure 2.9 Typical examples of two time-resolved measurements for the determination of
luminescence decay times. a. Time-domain measurement; b. Frequency-domain measurement.
Excitation is displayed in black, emission with a decay time is displayed in grey. (Adapted with
permission from reference [140]. Copyright 2013 The Wiley-VCH Verlag GmbH & Co. KGaA.)
In time-domain methods, the mathematical description of luminescence decay (with 𝑖
decay times) is the luminescence intensity as a function of time (Equation 2.9):
𝐼 = ∑ 𝐴𝑖𝑖 𝑒𝑥𝑝 (−𝑡 𝜏𝑖⁄ ) (2.9)
where 𝐼 is the time-resolved luminescence intensity, 𝐴𝑖 is the amplitude of a certain
lifetime 𝜏𝑖 . The lifetime can be determined by fitting the data into the assumed decay
models. With the calculated lifetimes, FRET efficiencies and distances can be determined.
Steady-state measurement provides an average representation of the luminescence emission
while time-resolved measurement shows dynamic information, which is particularly useful
for biological molecule studies and cellular imaging (e.g., Fluorescence Lifetime Imaging
Microscopy-FLIM) [143]. In contrast with intensity based methods, fluorescence lifetime
is independent of concentration, sample absorption and excitation intensity. Moreover, the

34
utilization of donors with long decay times (e.g., lanthanide complexes) and acceptors (e.g.,
organic dyes) with short decay times (𝜏𝐴 ≪ 𝜏𝐷) allows the replacement of 𝜏𝐷𝐴 by 𝜏𝐴𝐷 in
Equation 2.8, and both quenched donor emission and sensitized acceptor emission can be
used for FRET analysis. Especially, the analysis with FRET-sensitized acceptor emission
can get rid of the pure donor emission, and therefore decrease the background signal (non-
FRET signal).
In this work, time-domain based time-resolved FRET measurements using lanthanide
complexes (Section 2.4) as donors and fluorescent dyes (Section 2.5) and QDs (Section
2.6) as acceptors were mainly employed.
2.3.3 FRET application in miRNA detection
Due to the strong distance dependence in the biological interaction range (1-20 nm), FRET
has been widely utilized as a “Spectroscopic Nano-Ruler” to monitor changes and
interactions in biological systems, such as molecular interactions among proteins and
nucleic acids, as well as their folding dynamics and conformational changes [144].
According to the aforementioned detection strategies in Section 2.2, FRET has been
applied in miRNA detection as it is a common approach to facilitate “on/off” detection
schemes, in which the FRET signal is “off” when the target is absence and “on” when the
target is present (or vice versa). Strategies are usually based on the specific hybridization
of complementary nucleic acids probes [145]. Molecular beacons (MBs) and binary probes
(BPs) are two very common hybridization probes that are designed based on well-
established photophysical principles to generate sequence-specific FRET signal in nucleic
acids detection [146].
Standard MBs contain a single-stranded oligonucleotide with an acceptor and a donor
attached at their opposite ends (Figure 2.10a). The central sequence of this oligonucleotide
(loop) is complementary to a specific target. Five or six bases are attached at each end of
the oligonucleotide (stem) in order to form Watson-Crick base pairs that force the acceptor
and donor to be in close proximity, resulting in the FRET-sensitized acceptor emission.
Only the presence of the target prompts the hybridization of the MB to the target, leading

35
to the open conformation of the MB. Consequently, the acceptor and the donor are spatially
separated, which produces a fluorescence signal from the donor.
In standard BPs, a donor and an acceptor are attached to the ends of two single-stranded
oligonucleotides, which are complementary to adjacent regions of a target (Figure 2.10b).
In the absence of target, the two oligonucleotide probes are distributed randomly and
separated in solution, leading to the fluorescence emission from the donor. Adding the
target brings the two oligonucleotide strands together and forces donor and acceptor into
close proximity. Upon exciting the donor, energy is transferred from the donor to the
acceptor, which results in significant emission from the acceptor.
Figure 2.10 Common designs for FRET hybridization probes. a. Standard MB; b. Standard BP.
(Adapted with permission from reference [146]. Copyright 2011 Springer Nature.)

36
2.4 Lanthanides
Lanthanides comprise 15 metallic chemical elements with atomic numbers from 57 to 71
(La, Ce, Pr, Nd, Pm, Sm, Eu, Gd, Tb, Dy, Ho, Er, Tm, Yb, and Lu), that are known as the
rare earth elements. It is difficult in obtaining a pure form of lanthanides due to the
similarity in chemical properties, which can be explained by the electronic configuration of
the atoms and their derived ions. The general electronic structure of the lanthanide elements
is [Xe]4f0-145d0-16s2, where the 4f orbitals are gradually filled from La (0) to Lu (14) making
them differ in the ability to absorb and emit light [147]. Usually, lanthanides are dominated
by the trivalent oxidation state (Ln3+) and Ln3+ ions in aqueous solutions are the most stable
state with electronic configuration as [Xe]4fn [148]. Particularly, Ce3+ can lose its single f
electron to form Ce4+ with the stable electronic configuration with an empty f orbital, and
Eu3+ can gain an electron to form Eu2+ with the 4f7 configuration that has the extra stability
of a half-filled orbital. The 4f orbital is the factor that distinguishes lanthanides from other
transition elements and has profound effect on lanthanides.
Most Ln3+ ions are luminescent, which arises from the transitions involved in redistribution
of electrons within 4f orbitals (f-f electronic transitions) and related to a rich variety of
energy levels (Figure 2.11a) [149]. The energies of these levels are well defined due to the
sterically shielding of 4f orbitals from surrounding environment by the filled 5s2 and 5p6
sub-shells, resulting in almost no perturbations in these electronic transitions, and
consequently appearing as several sharp and narrow emission bands specific for lanthanides
[149, 150]. Among them, Tb3+ and Eu3+ have relative sizeable energy gap (5D4 - 7FJ for
Tb3+, 5D0 - 7FJ for Eu3+), and various emission wavelengths to emit green and red lights
across a broad spectral range (> 100 nm) (Figure 2.11b), thus have been most widely used,
especially for the development of valuable luminescent probes [151, 152]. To summarize,
lanthanides possess easily recognizable and fascinating optical properties, allowing their
application in various areas, such as construction of efficient light conversion devices [153,
154], biomedical analysis and imaging [155], production of hybrid and multifunctional
materials [147, 156], and many others.

37
Figure 2.11 a. Partial energy level diagram for some Ln3+ ions. The main luminescent levels are
drawn in red, while the fundamental level is indicated in blue. (Adapted with permission from
reference [149]. Copyright 2005 American Chemical Society.); b. Commonly observed emission
wavelengths as a result of electronic transitions for Tb3+ (5D4 - 7FJ transitions) and Eu3+ (5D0 -
7FJ
transitions). (Adapted with permission from reference [151]. Copyright 2014 American Chemical
Society.)
2.4.1 Luminescent lanthanide complexes
As mentioned, the unusual luminescence properties of lanthanides originate from f-f
transitions. While according to the Laporte selection rule and sometimes due to the change
in spin multiplicity, such transitions have quite low probabilities [148]. Consequently, Ln3+
ions themselves display quite long lifetimes (ca. 400 𝜇s for Tb3+ and ca. 120 𝜇s for Eu3+ in
aqueous) and very low molar absorption coefficients (𝜀 < 1 M−1cm−1), which can be more
than 104 - 105 times lower than that of traditionally used organic fluorophores [157]. Unless
utilizing a high-power laser, the direct excitation of Ln3+ ions are very inefficient. However,
the problem of weak light absorption is overcome after the development of a so-called
“antenna effect” [158]. As shown in Figure 2.12a, some organic chromophores with strong
absorption can be coordinated with Ln3+ ions to form luminescent lanthanide complexes
(LLCs) as chelates or cryptates, that can be a light absorbing “antenna” to transfer absorbed
energy to lanthanide ion, and also serve as a “cage” to protect central lanthanide ion from
environmental luminescence quenching. As another consequence of the aforementioned

38
shielding, the 4f orbitals are minimally involved in chemical bonding. Thus, the antenna
ligands in the first and second coordination sphere perturb the electronic configurations of
the trivalent lanthanide ions only to a very limited extent [147], and the bonding is mainly
electrostatic and nondirectional, which imparts great flexibility on LLCs in terms of
coordination number and geometry [148]. In general, the LLCs in aqueous solutions exhibit
coordination numbers from 8 to 10, that are able to saturate the central Ln3+ coordination
sphere to prevent luminescent quenching by surrounding water molecules.
The commonly accepted antenna effect mechanism is proposed by Crosby and Whan [160]
and can be modelled using Jablonsky’s diagram (Figure 2.12b). Briefly, upon excitation,
ligand absorbs energy to its singlet excited state (S0 to S1), and then undergoes intersystem
crossing to its triplet excited state (S1 to T1), which has long lifetime due to the spin
restriction of the back transition into the ground states. Then intramolecular energy transfer
occurs from the ligand to the Ln3+ ion and populates the Ln3+ ion excited state (T1 to
(Ln3+)*), finally generating characteristic Ln3+ luminescence from the lowest excited state
to its ground state (5DJ to 7FJ). Given the short lifetimes of the S1 states for organic
chromophores, energy transfer is usually assumed as proceeding from the long-lived T1
states, although singlet states and charge transfer can also play a role [161, 162].
Figure 2.12 a. The scheme of LLCs using the chelating chromophoric (top) and appended
chromophoric (bottom) ligand designs and corresponding examples (right). (Adapted with
permission from reference [159]. 2015 Elsevier B.V.); b. Simplified Jablonski diagram for the
antenna effect of LLCs. (Adapted with permission from reference [151]. Copyright 2014 American
Chemical Society.)

39
Benefiting from specific “antenna effect”, LLCs provide a considerable variety of
advantages compared to other fluorophores [163]:
(i) The overall quantum yield of a LLC (Փ𝐿𝐿𝐶𝑙𝑖𝑔𝑎𝑛𝑑
), given by Equation 2.10, can be increased
by improving 𝜂𝐸𝑇 and Փ𝐿𝐿𝐶𝐿𝑛 :
Փ𝐿𝐿𝐶𝑙𝑖𝑔𝑎𝑛𝑑
= 𝑝ℎ𝑜𝑡𝑜𝑛𝑠 𝑒𝑚𝑖𝑡𝑡𝑒𝑑 𝑏𝑦 𝐿𝑛
𝑝ℎ𝑜𝑡𝑜𝑛𝑠 𝑎𝑏𝑠𝑜𝑟𝑏𝑒𝑑 𝑏𝑦 𝑙𝑖𝑔𝑎𝑛𝑑= 𝜂𝐸𝑇 × Փ𝐿𝐿𝐶
𝐿𝑛 (2.10)
where Փ𝐿𝐿𝐶𝑙𝑖𝑔𝑎𝑛𝑑
is the overall quantum yield of LLC from indirect excitation of the Ln3+ ion
through the antenna ligand, Փ𝐿𝐿𝐶𝐿𝑛 is the intrinsic quantum yield from direct excitation of the
Ln3+ ion, 𝜂𝐸𝑇 is the intramolecular energy transfer efficiency from ligand to Ln3+ ion.
Improved 𝜂𝐸𝑇 can be achieved by selecting the antenna ligand with a high intramolecular
energy transfer rate. Improved Փ𝐿𝐿𝐶𝐿𝑛 can be achieved by the Ln3+ ion carrier chelate, which
protects the centered Ln3+ ion from the aqueous matrix quenching, and thus minimizes the
nonradiative process.
(ii) Possibility to increase the molar absorption coefficients and vary absorption spectra by
choosing appropriate antenna ligands. In addition, the ligand absorption occurs at a shorter
wavelength compared to the intrinsic lanthanide absorption. Thus, the indirect excitation of
Ln3+ ions through their antenna ligands results in red shift of the lanthanide emission spectra
by more than hundred nanometers from the ligand absorption spectra, namely the large
effective “Stokes shift” (Figure 2.13a). The well-separated excitation and emission
wavelengths of the LLCs allow facile blocking of stray excitation light by cut-off filters
and/or dichroic mirrors.
(iii) LLCs possess long excited-state lifetimes, which are increased up to ms by
coordinating Ln3+ ions with chelate/cryptate ligands. It allows the possibility to use delayed
or time-gated acquisition of the emitted light measured by time-resolved spectroscopy
(mentioned in Section 2.3.2). Upon pulsed excitation of a sample, by measuring the long-
lived luminescence intensity decay in a time-window that opens after luminescence of other
components have already decayed, the relatively short-lived background can be efficiently

40
suppressed including the auto-fluorescence of sample or other fluorophores, as well as the
light scattering from excitation source. The scheme of time-resolved spectroscopy with
combination of temporal (time-window) and spectral (filter) resolution is illustrated in
Figure 2.13c using Eu complex as example.
Figure 2.13 a. Absorption and emission spectra, and b. Luminescence decay of Tb complex and
Eu complex. (Adapted with permission from reference [164]. Copyright 2018 Wiley-VCH Verlag
GmbH & Co. KGaA.); c. The scheme of time-resolved spectroscopy with combination of temporal
(time-window) and spectral (filter) resolution using Eu complex as example. (Adapted with
permission from reference [165]. Copyright 1995 Elsevier B.V.)
In summary, LLCs exhibit bright luminescence, large “Stokes shift” (not an actual Stokes
shift because ligand get excited and lanthanide ion emits), and long-lived luminescence
lifetimes, which makes them versatile luminescent probes for a wide variety of

41
bioanalytical assays [150, 152], especially ideal energy donors in time-resolved FRET-
based applications [166].
2.4.2 Luminescent Tb complexes as FRET donors
LLCs are frequently utilized as FRET donors paired with different fluorophores as
acceptors, which provides the capability for obtaining nanometric distance information and
offers “on/off” signaling for quantitative analysis in biological processes [167, 168]. In
preference to other lanthanide ions, luminescent Tb complexes (LTCs) have been the major
players in this field, particularly possessing an outstanding advantage of multiplexing
capability, which will be discussed hereinafter. The macrocylic ligand-based Lumi4-Tb
complex (Figure 2.14) is used in this thesis, which contains 2-hydroxyisophthalamide
ligands with a molar absorption coefficient of ca. 26,000 M−1𝑐𝑚−1 at 340 nm in aqueous
solution. It can be conjugated to the biomolecules through –NHS (N-hydroxysuccinimide)
functional groups.
Figure 2.14 Chemical structure of Lumi4-Tb complex, R represents the place for the functional
group. (Adapted with permission from reference [169]. Copyright 2014 Elsevier B.V.)
There are remarkable advantages distinguishing LTCs from other FRET donors [169]:
(i) Long decay time. Long-lived excited state is one of highlighted properties of LTCs
discussed in the last section. While, as mentioned in Section 2.3.2, the significant difference
in the excited-state lifetimes of donor and acceptor results in approximately equal
luminescence decay times for FRET-quenched donor and FRET-sensitized acceptor.

42
Therefore, the decay time of donor in the presence of acceptor (𝜏𝐷𝐴) can be replaced by the
decay time of acceptor in the presence of donor (𝜏𝐴𝐷) in Equation 2.8, and both quenched
donor emission and sensitized acceptor emission can be used for time-resolved FRET
analysis. Moreover, detection of FRET-sensitized acceptor luminescence combined with
time-windows can get rid of background signal including auto-fluorescence, direct acceptor
luminescence, or pure donor luminescence (assuming no spectral crosstalk). As a
consequence, concentration effects and incomplete bioconjugation arising from excessive
concentrations of donor or acceptor, unlabeled biomolecules, and free donor or acceptor
can be largely avoided.
(ii) Unpolarized emission. Due to the multiple transition dipole moments (unpolarized
emission), LTCs are able to act as randomized donors. Thus, the orientation factor κ2 value
can be limited between 1 3⁄ and 4 3⁄ as discussed in Section 2.3.1. In most cases, FRET
acceptor is generally labeled to a biomolecule that has fast isotropic rotation. Therefore, the
system is in a dynamic averaging regime and κ2 becomes 2 3⁄ . Even with an acceptor
having a fixed transition dipole moment, 2 3⁄ is still an appropriate approximation.
(iii) Multiplexing capability. The increasing demand for multiplexing, which enables the
simultaneous measurement of multiple distinctive species in a single sample, has promoted
the interests in lanthanide-based FRET biosensing approaches.
LTCs possess well-separated and narrow emission bands and are therefore superior for
spectral multiplexing. These emission bands are in a spectral range where many
fluorophores are excellent absorbers and therefore relatively large spectral overlap integrals
can be achieved. As shown in Figure 2.15a, both organic dyes and QDs have large spectral
overlap with LTCs and can act as FRET acceptors. By emitting light between or beyond
LTCs emission bands, simultaneous luminescence detection can be realized with the same
LTC donors paired with multiple acceptors. The utilization of optical transmission filters
enables the efficient spectral separation, especially for the QDs as they have narrower
symmetric emission profiles in contrast to dyes. Due to the broad emission profiles of most
organic dyes, several different dyes may emit in the same wavelength region of the optical
transmission filter, which is the so-called spectral crosstalk. Additional correction needs to

43
be performed to achieve efficient multiplexing and an example of such crosstalk correction
can be found in previous work of our group [170].
In addition to spectral multiplexing, temporal multiplexing can also be achievable if
different luminescence decay times are distinguishable. In terms of LTCs donor, different
decay times 𝜏𝐴𝐷 = 𝜏𝐷𝐴 due to the different efficiencies results from different donor-to-
acceptor distances for the same FRET pair. Taking the extremely long luminescence
lifetime of LTCs and the tunable distances between the same LTCs and different acceptors,
it is allowed for flexible designing of different FRET-quenched and FRET-sensitized decay
times. Besides, by introducing distinguishable spectra and intensities as another
multiplexing dimensions, combined temporal and spectral multiplexing (spectrotemporal
multiplexing) can be feasible and recently has been applied for simultaneous detection of
four different DNAs in single homogenous sample by our group (in Figure 2.15b) [171].
Figure 2.15 a. LTC-donor-based spectral multiplexed FRET using different organic dyes (left) and
QDs (right). Top: Broad spectral overlap between LTCs emission and the absorption of several
different acceptors. Bottom: Separation of the single LTCs emission bands allows the measurement
of different acceptors in wavelength ranges with very low LTCs intensity (represented by the
shaded bandpass filter transmission spectra). LTCs-emission-spectra in black. Left: OregonGreen
(blue), AlexaFluor555 (green), AlexaFluor568 (orange), Cy5 (red) and AlexaFluor700 (brown);
right: QD525 (blue), QD565 (green), QD605 (orange), QD655 (red), and QD705 (brown).
(Adapted with permission from reference [169]. Copyright 2014 Elsevier B.V.); b. Scheme of the
spectrotemporal multiplexing using time-resolved FRET with one LTCs as donor, two different
Cyanine dyes as acceptors, and two different time-windows for the simultaneous detection of four
different DNAs in single homogenous sample. (Adapted with permission from reference [171].
Copyright 2018 American Chemical Society.)

44
2.5 Fluorescent dyes
2.5.1 Introduction
Organic dyes are still playing the dominant role in the fluorescent labeling field, and also
act as the first type of dyes tested with novel or “nontraditional” materials. The common
fluorescent dyes are shown in Figure 2.16a. Their emissions can span ultraviolet to near-
infrared spectrum that are usually related to their structures. The ultraviolet dyes are
typically pyrene-, naphthalene-, and coumarin-based structures, while the visible or near-
infrared dyes include various fluorescein-, rhodamine-, and cyanine-based derivatives
(Figure 2.16b). Some redder dyes have low solubility in aqueous solvents limiting their
application, while fluorescein-based dyes have high solubility, but suffer from high rate of
photobleaching and self-quenching [168]. Cyanine dyes may alleviate some of these issues
[168]. As well-known biomolecular labels, they have been widely used for microarrays,
FRET experiments, imaging, and many other analyses in the recent decades [172-175].
Typically, cyanine dye family denotes a dye system with a polymethine chain between two
nitrogens (Figure 2.16b). These compounds are given common names according to the
number of carbon atoms between the dihydroindole units (e.g. Cy3 and Cy5) [176]. A
further elaboration of the structure enables to provide control over wavelength, and such
structural modification is designated with a “.5” suffix (e.g. Cy3.5 and Cy5.5) [176]. In this
thesis (in Section 3 and Section 4), Cy5.5 is used with a molar absorption coefficient of ca.
209,000 M−1𝑐𝑚−1 at 684 nm in aqueous solution. It can be conjugated to the biomolecules
through –NHS functional group.
In general, fluorescent dyes have several advantages including commercial availability,
cost-effectiveness, high quantum yields, and easy bioconjugation (via –NHS ester,
maleimide, hydrazide, or amine functional groups), and have been extensively used in
FRET applications [177]. Most importantly, there are widespread description of their FRET
properties in the literatures, demonstrating their accessibility to suitable design and flexible
utilization as FRET pair (donor and/or acceptor).

45
Figure 2.16 a. Common fluorescent dyes. Absorbance and emission maxima along with spectral
regions covered by a particular dye family are highlighted. FITC is fluorescein-based dyes;
TAMRA, TMR, and ROX are rhodamine-based dyes; Cy3 to Cy7 are cyanine-based dyes; b.
Chemical structures of common ultraviolet/visible/near-infrared fluorescent dyes. R marks the
typical position of substituents position; Rx marks the typical position of the bioconjugation linker.
(Adapted with permission from reference [168]. Copyright 2006 WILEY-VCH Verlag GmbH &
Co. KGaA, Weinheim.)

46
2.5.2 Fluorescent dyes in FRET applications
Fluorescent dyes are considered as “traditional” FRET dyes that represent the majority
donors or/and acceptors used in FRET applications. There are various resources available
to aid in choosing suitable dyes in FRET pairs, such as “The Molecular Probes Handbook”
written by Johnson and Spence [178], some web-based Fluorescent Spectraviewer
programs (Thermo Fisher, Bio-Rad, ZEISS, and etc.), and many other reviews [179-181].
Traditional dye-to-dye FRET system still occupy many current applications. It has
tremendous impact on biomedical research, specifically in the areas of nucleic acid analysis.
In nucleic acid biosensing, the probes are labeled with appropriate dyes to generate the
target-specific FRET signal through undergoing a target-induced conformation change (e.g.
MB) or a target-involved hybrid formation (e.g. BPs) (Section 2.3.3 Figure 2.10).
Particularly, in amplification-based detection technologies, for instance in PCR, the FRET
probes are cleaved during the reaction (e.g. TaqMan probes), or incorporated into amplified
DNA (e.g. Scorpion primers), not only realizing FRET but also monitoring the
amplification [182]. Nowadays, the TaqMan probes have been commercially used as RT-
qPCR reaction kit for miRNA detection. Apart from dye-to-dye combinations, fluorescent
dyes coupling with various other materials (e.g. quantum dots, upconversion nanoparticles,
graphene oxide) as FRET pairs have also been widely used in FRET-based nucleic acid
analysis [183-185].
Despite the wide utilization, there are inherent drawbacks of fluorescent dyes-based FRET
applications. Their broad absorption/emission profiles and small Stokes shifts often lead to
direct excitation of the acceptor, which complicates subsequent analysis. Especially for the
spectral multiplexing, when using different dyes, the spectral crosstalk due to their broad
emission spectra increases the complexity and requires an additional optical correction.
Lifetime multiplexing can sufficiently overcome these limitations as described in the
previous section. In this thesis, the lifetime multiplexing for simultaneous detection of
miRNAs is realized based on LTCs-to-Cy5.5 FRET and details are shown in Section 4.

47
2.6 Quantum dots
Quantum dots (QDs) are semiconductor nanocrystals that are typically composed of group
II-VI (e.g. CdS, CdSe, CdTe, ZnS, and etc.) or III-V (e.g. GaAs, GaN, InAs, and etc.)
elements, or their alloys (e.g. CdSeS, InGaN, InGaAs, and etc.) with small sizes range from
1 to 10 nm [186]. They provide unique and excellent photophysical properties that are
superior to traditional organic fluorophores. Besides, good biocompatible QDs can be
functionalized and bioconjugated with small biomolecules including nucleic acids, peptides,
and proteins, which enables recognition of biomarkers, targeting cells/tissues, and delivery
of drugs. As a consequence of these properties, QDs are frequently used in a large variety
of bioanalytical investigations.
2.6.1 Photophysical properties
QDs are crystalline materials with facets and a lattice structure analogous to the bulk
semiconductor materials, and possess electronic properties that are in intermediate regime
between bulk semiconductors and molecules [187, 188]. The electronic structure of bulk
semiconductor is characterized by a lower energy valence band (VB) that is occupied by
electrons, and a higher energy conduction band (CB) that is empty. Upon excitation, an
electron is promoted from the VB to CB leaving a positive hole in VB. The interaction
between the electron and the hole creates an exciton, and the distance between electron-
hole pair is referred to as the exciton Bohr radius. Typically, the VB and CB are separated
by a band gap depending on the semiconductor materials, and can be regarded as continuous
energy levels due to the large density of electronic states. While when the size of
semiconductor material becomes smaller and close to the exciton Bohr radius, the density
of electronics states is not sufficient to form complete band structures, and thus discrete
energy levels exist at the band edges. The energy levels become more separated as the size
become smaller, and consequently the energy band gap becomes larger (Figure 2.17a).
This phenomenon is known as quantum confinement, and most unique properties of QDs
originated from the quantum confinement effect. The difference in energy between the VB

48
and CB is conserved in the form of emitted photons, and therefore this band gap dictates
the energy (wavelength) of the light emitted from the QDs. As the QD energy band gap is
directly related to its diameter, QDs comprising the same semiconductor material can be
tuned to emit different wavelengths by simply changing their size (Figure 2.17b).
Figure 2.17 a. Discrete energy levels and band gap in semiconductor crystals with increasing
nanocrystal size. (Adapted with permission from reference [189]. Copyright 2015 MDPI.); b.
Progressive color and PL wavelength changes of CdSe/ZnS QDs with increasing nanocrystal size.
(Adapted with permission from reference [190]. Copyright 2011 American Chemical Society.)
In summary, QDs have extraordinary photophysical properties that make them excellent
fluorophores in biosensing applications [191, 192]:
(i) Narrow, symmetric, and size-dependent photoluminescence (PL) spectra continuously
across a broad range from the ultraviolet to near-infrared, making them ideal for spectral
multiplexing strategies.
(ii) Broad and continuous absorption profiles allow free selection of excitation wavelength.
(iii) High brightness due to high quantum yields and large absorption cross-sections.
(iv) High photostability making them resistant to photobleaching and chemical degradation.
(v) Large Stokes shifts compared to organic dyes that efficiently separates excitation and
emission lights.
(vi) Relatively large nanoparticle surface for a variety of functionalization schemes.

49
2.6.2 QDs in FRET applications
QDs display unique optical features and their nanoparticle properties make them superior
FRET partners that can serve as both donor and acceptor. As the FRET efficiency is highly
dependent on the donor and acceptor distance, QDs are frequently functionalized and
bioconjugated with small ligands or small-sized biomolecules to create stable QDs, as well
as the formation of the resulting QD bioconjugates. The FRET-sensitized QD emission
signal upon target recognition through biological binding event and/or conformational
change can be easily measured, and thus enables sensitive and specific detection of various
biomolecules of interest, such as nucleic acids, proteins, enzymes, or other biomolecules.
QDs are most frequently used as FRET donors that benefits from several advantages. The
extremely high extinction coefficients as well as broad absorption wavelength range enable
the efficient and selective excitation of QD donors. The size-tunable PL spectra enable to
adjust appropriate spectral overlap with various acceptors. The narrow and symmetric
emission spectra reduce the opportunity of donor emission leakage into the acceptor
detection channel, which favors multiplexing applications. Besides, the large surface area
of QDs provide more possibility to attach many acceptors onto the surface.
For nucleic acids detection, in addition to FRET donors, QDs also act as interfaces for the
immobilization of oligonucleotide probes. A hybridization event is usually used to bring
the acceptor in close proximity to the donor QD via several strategies, such as MBs, BPs,
intercalating dye, and displacement hybridization format (Figure 2.18). The basic principle
of MBs and BPs was described before. Ma et al. developed a novel two-dimensional dual-
modal MB for mRNA-activated cancer theranostics by constructing MB with a QD as
donor, a photosensitizer (chlorin e6) and a dark quencher (BHQ3) as acceptors (Figure
2.18a) [193]. This method overcomes the disadvantages of traditional MB, and provides
high imaging sensitivity and therapeutic efficacy. Based on BPs strategy, Zhang et al.
integrated an isothermal amplification method (HRCA) into QD-based FRET sensors and
realized simultaneous detection for two miRNAs with high sensitivity (Figure 2.18b) [194].
In the strategy based on intercalating dye, target oligonucleotide is directly hybridized with

50
QD-oligonucleotide conjugates, generating FRET signal between QD and intercalating dye.
Krull et al. constructed a paper-based platform using QD-DNA probes and intercalating
dye for the detection of gene sequence that are associated with spinal muscular atrophy
(Figure 2.18c) [195]. In strand displacement strategy, an initial FRET-on format generated
by hybridizing QD-oligonucleotide conjugates with dye-labeled oligonucleotides is
ultimately switched to FRET-off format in the presence of the target nucleic acid which
displaced the dye labeled DNA probe (Figure 2.18d) [196]. A target recycling miRNA
detection assay combined with isothermal amplification method (DSNSA) is performed
based on this strategy with the help of a duplex-specific nuclease [197]. The proposed
method is highly sensitive with the limit of detection as 42 fM (1.2 amol) for miR-148, and
shows excellent selectivity versus mismatched sequences and other miRNAs.
Figure 2.18 FRET-based biosensors using QDs as donors for nucleic acids detection. a. Schematic
illustration of a tumor mRNA detection based on MB strategy. (Adapted with permission from
reference [193]. Copyright 2015 The Royal Society of Chemistry.); b. Schematic illustration of
simultaneous detection for two miRNAs based on BPs strategy. (Adapted with permission from
reference [194]. Copyright 2018 The Royal Society of Chemistry.); c. Schematic illustration of a
gene sequence (associated with spinal muscular atrophy) detection based on intercalating dye
strategy. (Adapted with permission from reference [195]. Copyright 2019 The Royal Society of
Chemistry.); d. Schematic illustration of HBV DNA detection based on strand displacement
strategy. (Adapted with permission from reference [196]. Copyright 2013 The Springer Nature.)

51
Although QDs are most commonly used as FRET donors, QD acceptor-based FRET has
also been well established. The large absorption cross-sections of QDs result in very large
spectral overlap integrals and hence large Förster distances. The relatively large surfaces of
QDs provide multiple attaching sites of donors on the surfaces, leading to an increased
probability of FRET sensitization with the number of donors, while the FRET efficiency is
not affected. What’s more, their narrow and symmetric emission spectra favor multiplexed
detection without spectral crosstalk. However, two general drawbacks need to be taken into
account. First, the broad absorption spectra and high extinction coefficients of QDs hamper
the selective excitation of the respective FRET donors, because the QD acceptors are
efficiently excited at almost any wavelength independently of the donor. The second
problem arises from the difference in the excited-state lifetimes between donors and QD
acceptors. For instance, the lifetimes of dyes are usually a few ns with a monoexponential
decay process, whereas the lifetimes of QDs are usually tens to hundreds of ns with a
multiexponential decay. If both dye and QD are excited at the same time, there is a very
high probability that the dye will decay back to its ground state before the QD, and therefore
the possibility of FRET will be extremely low.
As sufficiently described before, the introduction of time-resolved spectroscopy using
LLCs as FRET donors, whose PL lifetimes are up to several ms, is one of the keys to solve
the problem of simultaneous donor and acceptor excitation. Time-resolved spectroscopy is
used to record the luminescence intensities of FRET pairs in individual detection channels
in a time-gated window (several µs after pulsed excitation). By collecting PL intensities in
time windows much longer than the natural decay of the QD, but still within the lifetime of
the LLCs decay, the direct excitation of the QD and any background autofluorescence will
not be recorded, thus greatly simplifying analysis of the system. Since 2005, our group has
shown that QDs can be used as efficient FRET acceptors when paired with Eu or Tb
complexes (LTCs) as donors in time-resolved FRET systems, and several biological assays
have been demonstrated using ratiometric output (the ratio of the time-gated PL intensities
of the FRET-sensitized acceptor and FRET-quenched donor) to quantify the analytes of
interest [198]. In our recent studies, multiplexed detection of several clinically relevant

52
biomarkers has been achieved specifically and sensitively using time-gated LTCs-to-QD
FRET strategy (Figure 2.19).
Figure 2.19 FRET-based biosensor using QDs as acceptors and LTCs as donors for clinically
relevant biomarkers detection. a. Schematic illustration of the duplexed detection for epidermal
growth factor receptors EGFR and HER2 with the combination of different types of antibodies
against EGFR and HER2. (Adapted with permission from reference [199]. Copyright 2016
American Chemical Society.); b. Left: Schematic illustration of the three FRET systems for
multiplexed miRNAs detection; Right: The three FRET systems can be distinguished by the PL
emission spectra of the QD acceptors, which are detected (together with the Tb PL spectrum) at
different detection channels (gray spectra in the background). (Adapted with permission from
reference [200]. Copyright 2015 American Chemical Society.)

53
QDs could engage in FRET with each other as a QD-to-QD FRET system [189]. A primary
advantage of QDs in QD-to-QD FRET sensing is their high photostability compared to
organic dyes or fluorescent proteins, making QDs uniquely suitable for longitudinal studies,
where measurements or images are taken repeatedly over extended periods of time. They
are good candidates for device-on-a-chip applications and for sensors designed to be
utilized outside of the laboratory setting. In addition, the extraordinary brightness of QDs
yields considerable fluorescence output with relatively fewer emitters and potentially
decreases the limit of detection in sensing applications. However, QD-to-QD FRET is
challenging due to the broad, overlapping excitation spectra from the two nanocrystals,
precluding the selective excitation of the donor. This induces crosstalk and creates a large
background signal, which is a major challenge in QD-to-QD FRET sensor design.

54
3. Advanced miRNA diagnostics using
RCA-amplified Tb-to-dye FRET
3.1 Introduction
MiRNA-based diagnostics has the potential to play a pivotal role for the prognosis,
diagnosis, management, and monitoring of diseases because varying expression levels can
be detected in most solid (cells, tissues) and liquid (blood, urine, saliva) clinical samples
[201-203]. Among the standard miRNA detection methods, such as RT-qPCR, NGS, or
microarrays, RT-qPCR is arguably the most suited technology for routine and simple use.
However, the necessity of reverse transcription and multiple primers, the sensitivity to
contamination generated by RNA extraction, and the rather extensive guidelines for
obtaining reliable results with qPCR present serious drawbacks for simple and reliable
analysis [204]. In addition, the large majority of clinical studies that have related different
miRNAs in solid (tissues) and liquid (blood) biopsies to various cancers, diabetes, sepsis,
infectious and cardiac diseases, have used relative concentrations because the absolute
quantitation is impossible with NGS and too imprecise with RT-qPCR [205, 206]. Selective,
sensitive, and precise absolute quantitation is one of the most important aspects for
translating the use of miRNA biomarkers to the clinic.
Many emerging technologies have been developed over the recent years that can overcome
the technical limitations of the standard technologies, and the most frequently applied
strategies are fluorescent-based detection and isothermal amplification with optical readout
[200, 207-210]. Isothermal amplification method provides detection of a nucleic acid target
sequence in a streamlined or exponential manner, and is not limited by the constraint of
thermal cycling, which has been a robust, reproducible, and simple amplification strategy.
As one common used isothermal amplification, target-primed RCA generates long ssDNA
with a tandem sequence, where target can be amplified 10,000-fold in a few hours. An
increasing number of RCA combined with different luminescence readout strategies has

55
been developed for specific and sensitive detection of miRNAs [99, 105, 120, 211-213].
However, few proposed technologies have been translated into routine clinical practice due
to the missing proofs for relevant clinical application. Highly important requirements for a
new technology to become a useful miRNA detection method, and to advance miRNA-
based diagnostics and translational research are not only sensitivity and specificity but also
the capability to be applicable to different types of clinical samples and to obtain useful
clinical information from those samples.
To advance this translational research endeavor, this work integrated the ratiometric and
single-step detection format of time-gated FRET (TG-FRET) from a Tb donor to a Cy5.5
acceptor in target-primed RCA (Figure 3.1). In contrast to many other emerging
technologies, the proposed method can not only detect very low amounts of miRNAs, but
also provides extremely high specificity against precursor miRNA (pre-miRNA) and
miRNAs with single nucleotide variations. We also demonstrated the immediate practical
applicability by precise quantification of endogenous miRNAs from various types of
clinical samples and for different pathologies, namely miR-21 from human plasma and
tissue related to ovarian and breast cancer [214, 215], miR-132 and miR-146a from in vitro
cultured acute monocytic leukemia cells (THP-1) related to innate immune responses [216].
At the low miRNA concentrations required for clinical diagnostics, amplified TG-FRET
provided both better specificity (distinction of single-nucleotide variations at varying
positions within the target) and higher precision (smaller distribution of concentrations and
better distinction between healthy and pathological samples) than the gold standard method
RT-qPCR.

56
Figure 3.1 Principle of miRNA detection by amplified TG-FRET. (A) After specific recognition
of miRNA by a linear padlock DNA (1), the DNA padlock nick is ligated over the miRNA target
splint using SplintR ligase (2) and the miRNA becomes a primer for a phi29 polymerase to
synthesize and displace (by RCA) complimentary DNA around the circularized padlock DNA (3).
After stopping RCA, the rolling circle product (RCP) is incubated with Tb (Lumi4-Tb) donor and
Cy5.5 acceptor labeled ssDNA, which hybridize to specific sequences that exist more than 1000-
fold on the amplified RCP concatemer. The close distance of Lumi4-Tb and Cy5.5 in the RCP
allows for Tb-to-Cy5.5 FRET, which is not possible if both are free in solution (not hybridized to
the RCP). Thus, the TG-FRET signal can be used for quantifying miRNA without any washing or
separation steps. (B) Ratiometric TG-FRET, which measures the ratio of FRET-sensitized Cy5.5
PL and FRET-quenched Tb PL within a specific time-window after pulsed excitation (to suppress
autofluorescence), is used to quantify the miRNA target in a 140 µl microwell within 5 seconds.
3.2 Materials and methods
3.2.1 Nucleic acid probes and exogenous targets
All sequences and modifications of nucleic acids are summarized in Table 3.1. All
oligonucleotides were purchased from Eurogentec. Phosphate DNAs were purified with
polyacrylamide gel electrophoresis. All other modified DNAs and RNAs were purified with
HPLC. Lumi4-Tb-NHS (Tb-NHS) was provided by Lumiphore, Inc. Tb-DNA conjugates
were obtained by mixing Tb-NHS in concentration excess to amino-functionalized
oligonucleotides in 100 mM carbonate buffer at pH 9.0. The mixtures were incubated

57
overnight at 4 ℃. The Tb-DNA conjugates were purified 3 times with HEPES buffer (100
mM, pH 7.4) by Zeba Spin Desalting Columns (7 kDa MWCO). Tb concentrations were
determined by absorbance measurements at ca. 340 nm using a molar absorptivity of ca.
26,000 M−1𝑐𝑚−1 as provided by the manufacturer. DNA was quantified by absorbance
measurements at ca. 260 nm. Conjugation ratios were determined by linear combination of
the respective absorbance values of Tb and oligo within the Tb-oligo conjugates and were
in all cases higher than 0.9 Tb/DNA.
Table 3.1 Sequences and modifications of all DNA and RNA probes and targets. Sequence
differences shown in red, sequence similarities shown in magenta, target-specific termini of
padlock DNA shown in blue, Tb-probe-complementary sequences shown in green, and Cy5.5-
probe-complementary sequences shown in orange.
Probe Sequence 5’-3’ Modification
miR-21 UAG CUU AUC AGA C UGA UGU UGA
miR-146a UGA GAA CUG AAU UCC AUG GGU U
miR-132 UAA CAG UCU ACA GCC AUG GUC G
pre-miR-21
UGU CGG G UAG CUU AUC AGA CUG AUG
UUG A CUG UUG AAU CUC AUG GCA ACA
CCA GUC GAU GGG CUG UCU GAC A
miR-2110 (A→G) UAG CUU AUC GGA CUG AUG UUG A
miR-214 (C→U) UAG UUU AUC AGA CUG AUG UUG A
miR-2117 (U→A) UAG CUU AUC AGA CUG AAG UUG A
RNAint (terminal) UAA AGU GCU UAU AG UGA UGU UGA
RNAint (internal) UAA AGU GCU UAU AG UGA UGU UGA
GCA GGU AG
padlock-21
TGA TAA GCT A ATA TAT GAT GG AAT
CAA GAC AAT ATT GTT GAT GCC GAA
TTT TTC AAG AG GAA ATG T TCA ACA
TCA GTC
5’-Phosphate
padlock-146a
TTC AGT TCT CA ATA TAT GAT GG AAT
CAA GAC AAT ATT GTT GAT GCC GAA
TTT TTC AAG AG GAA ATG T AAC CCA
TGG AA
5’-Phosphate
padlock-132
GTA GAC TGT TA ATA TAT GAT GG AAT
CAA GAC AAT ATT GTT GAT GCC GAA
TTT TTC AAG AG GAA ATG T CGA CCA
TGG CT
5’-Phosphate
Tb-probe AAT CAA GAC AAT ATT GTT 5’-C6 amino
Cy5.5-probe GAT GCC GAA TTT TTC AAG AG 5’-Cy5.5

58
3.2.2 Photophysical analysis
Absorption spectra (Lambda 35 UV/Vis System, PerkinElmer) and emission spectra
(FluoTime 300, PicoQuant) were recorded in HEPES buffer (100 mM, pH 7.4) and
deionized water (purifiedby Purelab Option-Q equipped with bio-filter, ELGA LabWater)
for Tb and Cy5.5 samples, respectively. All spectra are shown in Figure 3.2.
Förster distance (the donor-acceptor distance for which FRET is 50 % efficient) was 𝑅0 =
5.8 ± 0.2 nm and calculated using the Equation 3.1:
𝑅0 = 0.02108(κ2Փ𝐷𝑛−4𝐽(𝜆))1 6⁄
nm (3.1)
The orientation factor κ2 = 2 3⁄ because of random orientation of donor and acceptor
during the FRET time (dynamic averaging), which is well justified by the long PL lifetime
of the Tb donors and the unpolarized emission (fast isotropic rotation). The refractive index
was 𝑛 = 1.35 (aqueous buffer solution). The Tb-centered quantum yield was Փ𝐷 =
0.80 ± 0.05. The overlap integral 𝐽 was calculated by Equation 3.2:
𝐽 = ∫ 𝐼�̅�(𝜆)700 𝑛𝑚
475 𝑛𝑚𝜀𝐴(𝜆) 𝜆
4𝑑𝜆 (3.2)
where 𝐼�̅�(𝜆) is the emission intensity from the area-normalized (to unity) emission
spectrum of Tb donor and 𝜀𝐴(𝜆) is the molar absorptivity of the acceptor.
Figure 3.2 Absorption and emission spectra of the TG-FRET pair. (A) Spectra of Tb absorption
(black) and emission (green) that partly overlaps with the absorption of Cy5.5 (red). (B) Emission
spectra of Tb (green) and Cy5.5 (red). Optical bandpass filter transmission spectra, which represent
the detection channels for Tb and Cy5.5, are shown in gray.

59
3.2.3 Statistical analysis
For statistical analysis and the estimation of LODs, all samples were prepared 3 times and
measured in triplicates (𝑛 = 9) apart from the zero-concentration samples (without miRNA
targets), which were prepared 10 times and measured in triplicates (𝑛 = 30). For specificity
tests, all samples were prepared and measured once. For real sample detections, all samples
were prepared in duplicate and measured once (𝑛 = 2). All RT-qPCR measurements were
performed in duplicate and measured once (𝑛 = 2).
3.2.4 Amplified TG-FRET miRNA assays
In a typical assay, 1.5 nM padlock probe and an appropriate amount of the target miRNA
were prepared in 10 µl optimized SplintR DNA ligase reaction buffer (BUFFER-1, 50 mM
Tris–HCl, 10 mM MgCl2, 100 mM NaCl, 10 µM ATP, 10 mM DTT, pH 7.6), and the
mixture was incubated in a thermal cycler with a temperature control program (80 ℃ for 2
min, decreased from 80 ℃ to 22 ℃ with a 2 ℃ min−1 speed). Then, 21.5 U of SplintR
DNA ligase (New England Biolabs) prepared in 5 µl BUFFER-1 was added to the mixture
and incubated at 37 ℃ for 1 h. Afterwards, 15 µl phi29 DNA polymerase reaction buffer
(BUFFER-2, 1× buffer components: 50 mM Tris-Cl, 10 mM MgCl2, 10 mM (NH4)2SO4, 4
mM DTT, pH 7.4), which contained 5 U of phi29 DNA polymerase (New England Biolabs)
and 0.5 mM dNTP (New England Biolabs), was added and incubated at 37 ℃ for 3 h.
Before termination of the polymerization process, 2.5 nM Tb probe and 2.5 nM Cy5.5 probe
prepared in 120 µl hybridization buffer (BUFFER-3, 20 mM Tris-Cl, 500 mM NaCl, 0.1%
BSA, pH 8.0) were added and then incubated in a thermal cycler with a temperature control
program (65 ℃ for 10 min, decreased from 65 ℃ to 22 ℃ with a 2 ℃ min−1 speed, 22 ℃
for 10 min). From the total reaction volume of 150 µl, 140 µl were measured in 96-well
microtiter plates on the clinical immunofluorescence plate reader KRYPTOR (Thermo
Fisher Scientific) with time-gated (0.1-0.9 ms) PL intensity detection using optical
bandpass filters (Semrock) with 494 ± 12 nm for the Tb detection channel and 716 ± 24 nm
for the Cy5.5 detection channel.

60
3.2.5 RNA extraction
Tissue material was obtained with informed consent at the Medical University of Graz and
the St. John of God Hospital Graz under approval from the ethics committee of the Medical
University of Graz and the ethics committee of the St. John of God Hospital Graz (23-015
ex 10/11). All breast tissue samples were gathered in course of routine interventions and
autopsies, respectively, and used in an anonymized/pseudonymized way. The use was
approved by the responsible ethics committee. All plasma samples were collected from
anonymized patients with written informed consent under the agreement of the responsible
ethical committees (official permission n° 2746 by the “comité de protection des personnes
Ile de France III” – January 5, 2010). For all plasma samples, miRCURYTM RNA Isolation
Kit-Biofluids (Exiqon) was used for the extraction of small RNA. The extraction was
performed according to the manufacturer's instructions. In a typical experiment, 250 µl of
each plasma sample was centrifuged at 3000g for 5 min to pellet any debris and insoluble
components after thawing. 200 µl of supernatant was transferred to a new tube and 60 µl
Lysis solution and 1.2 µl MS2 RNA (Sigma-Aldrich) were added into the solution for 3
min at room temperature to lyse plasma components. After that, 20 µl protein precipitation
solution was added for 1 min at room temperature. The precipitated mixture was centrifuged
for 3 min at 11,000g and the clear supernatant was transferred into a new collection tube.
Then, 270 µl isopropanol was added to the collected supernatant, and the solution was
loaded to a microRNA Mini Spin Column for 2 min at room temperature. After centrifuging
for 30 s at 11,000g, the solution was washed once with 100 µl washing solution 1 and twice
with washing solution 2 (700 µl and 250 µl). Finally, the RNA was eluted with 50 µl RNase
free water, and all RNA extractions were stored at −80 ℃. Total RNA was isolated from
snap-frozen human breast tissue samples using Trizol reagent (Life Technologies),
followed by extraction with phenol-chloroform. THP-1 cells were grown in RPMI 1640
supplemented with 10% fetal calf serum, 1% penicillin/streptomycin, and L-glutamine.
THP-1 cells were not treated (0 h) or treated for 24 h (24 h) with LPS (1 µg ml−1). Total
RNAs were extracted using a miRNeasy Mini Kit with a Qiacube (QIAGEN), according to

61
the manufacturer's instructions. RNA concentrations were assessed using a NanoDrop
spectrophotometer (Thermo Fisher Scientific, Waltham, USA). Total RNA concentrations
and available volumes of all samples are given in Table 3.2. Relevant information on
human research participant are given in Table 3.3.
Table 3.2 Total RNA concentrations and sample volumes of clinical samples. Corresponding
Figures are shown on the left hand column.
Figure Extraction
from Sample name
Total RNA concentration
(ng µl-1)
Available volume
(µl)
3.6a
Plasma Control 1 14 50
Plasma Control 2 13 50
Plasma Control 3 10 50
Plasma Control 4 11 50
Plasma Control 5a (experiment 1) 12 50
Plasma Control 5b (experiment 2) 17 50
Plasma Control 6 13 50
Plasma Control 7 9 50
Plasma Control 8 11 50
Plasma Control 9 10 50
Plasma Control 10 11 50
Plasma Control 11 15 50
Plasma Control 12 19 50
Plasma Ovarian cancer 1 8 50
Plasma Ovarian cancer 2 15 50
Plasma Ovarian cancer 3 11 50
Plasma Ovarian cancer 4 13 50
Plasma Ovarian cancer 5 15 50
Plasma Ovarian cancer 6a (experiment 1) 10 50
Plasma Ovarian cancer 6b (experiment 2) 15 50
Plasma Ovarian cancer 7 11 50
Plasma Ovarian cancer 8 14 50
Plasma Ovarian cancer 9a (experiment 1) 12 50
Plasma Ovarian cancer 9b (experiment 2) 14 50
Plasma Ovarian cancer 10 12 50
Plasma Ovarian cancer 11 15 50
3.6b
Tissue Control 1 133 26
Tissue Control 2 204 28
Tissue Control 3 160 28
Tissue Control 4 456 28
Tissue Breast tumor 1 1149 56
Tissue Breast tumor 2 44 28
Tissue Breast tumor 3 163 28
Tissue Breast tumor 4 1113 28
Tissue Breast tumor 5 916 28
Tissue Breast tumor 6 77 28
3.6c
Cells 0 h - 0.25 mio cells 203 30
Cells 24 h - 0.25 mio cells 172 30
Cells 0 h - 3 mio cells 180 180
Cells 24 h - 3 mio cells 136 180

62
Table 3.3 Relevant information on human research participants.
P
lasm
a s
am
ple
s
Trea
tmen
t m
od
ali
ties
No
ne
No
ne
No
ne
No
ne
No
ne
No
ne
No
ne
No
ne
No
ne
No
ne
No
ne
No
ne
Neo
-ad
juvan
t ch
emo
ther
apy
, fo
llo
wed
by
deb
ulk
ing
su
rger
y a
nd
ad
juv
ant
chem
oth
erap
y
Dir
ect
deb
ulk
ing
su
rger
y a
nd
ad
juv
ant
chem
oth
erap
y
Neo
-ad
juvan
t ch
emo
ther
apy
, fo
llo
wed
by
deb
ulk
ing
su
rger
y a
nd
ad
juv
ant
chem
oth
erap
y
Dir
ect
deb
ulk
ing
su
rger
y a
nd
ad
juv
ant
chem
oth
erap
y
Dir
ect
deb
ulk
ing
su
rger
y a
nd
ad
juv
ant
chem
oth
erap
y
Neo
-ad
juvan
t ch
emo
ther
apy
, fo
llo
wed
by
deb
ulk
ing
su
rger
y a
nd
ad
juv
ant
ch
emo
ther
apy
Dir
ect
deb
ulk
ing
su
rger
y a
nd
ad
juv
ant
chem
oth
erap
y
Neo
-ad
juvan
t ch
emo
ther
apy
, fo
llo
wed
by
deb
ulk
ing
su
rger
y a
nd
ad
juv
ant
chem
oth
erap
y
Neo
-ad
juvan
t ch
emo
ther
apy
, fo
llo
wed
by
deb
ulk
ing
su
rger
y a
nd
ad
juv
ant
chem
oth
erap
y
Neo
-ad
juvan
t ch
emo
ther
apy
, fo
llo
wed
by
deb
ulk
ing
su
rger
y a
nd
ad
juv
ant
chem
oth
erap
y
Ch
emo
ther
apy
alo
ne
BR
CA
sta
tus
Wil
d t
yp
e
Wil
d t
yp
e
Wil
d t
yp
e
Wil
d t
yp
e
Wil
d t
yp
e
Wil
d t
yp
e
Wil
d t
yp
e
Wil
d t
yp
e
Wil
d t
yp
e
Wil
d t
yp
e
Wil
d t
yp
e
Wil
d t
yp
e
Wil
d t
yp
e
Wil
d t
yp
e
Wil
d t
yp
e
Wil
d t
yp
e
Un
kn
ow
n
Un
kn
ow
n
BR
CA
1
mu
tati
on
Un
kn
ow
n
Un
kn
ow
n
Wil
d t
yp
e
Wil
d t
yp
e
Tu
mo
r s
tag
e
No
ne
No
ne
No
ne
No
ne
No
ne
No
ne
No
ne
No
ne
No
ne
No
ne
No
ne
No
ne
IIIc
IIIb
IIIc
Ia
IIIc
IIIc
IIIc
IIIc
IIIc
IIIc
IIIc
Pa
tho
log
y
No
ne
No
ne
No
ne
No
ne
No
ne
No
ne
No
ne
No
ne
No
ne
No
ne
No
ne
No
ne
HG
SO
C
HG
SO
C
HG
SO
C
HG
SO
C
HG
SO
C
HG
SO
C
HG
SO
C
HG
SO
C
HG
SO
C
HG
SO
C
HG
SO
C
Ag
e
52
49
42
32
52
51
25
35
56
49
43
49
66
55
71
66
63
55
58
59
61
73
39
Gen
der
Fem
ale
Fem
ale
Fem
ale
Fem
ale
Fem
ale
Fem
ale
Fem
ale
Fem
ale
Fem
ale
Fem
ale
Fem
ale
Fem
ale
Fem
ale
Fem
ale
Fem
ale
Fem
ale
Fem
ale
Fem
ale
Fem
ale
Fem
ale
Fem
ale
Fem
ale
Fem
ale
Sa
mp
le
13
858
13
993
14
214
14
168
14
237
14
267
14
270
14
394
14
483
16
400
17
919
18
189
EX
O0
15
EX
O0
18
EX
O0
25
EX
O0
45
EX
O0
50
EX
O0
69
EX
O0
75
EX
O0
79
EX
O0
12
2
EX
O0
12
9
EX
O0
14
1

63
Tis
sue s
am
ple
s
Trea
tmen
t m
od
ali
ties
see
nB
1
no
bre
ast
can
cer-
spec
ific
tre
atm
ent
no
bre
ast
can
cer-
spec
ific
tre
atm
ent
no
bre
ast
can
cer-
spec
ific
tre
atm
ent
for
mo
re t
han
ten
yea
rs
no
su
rger
y, n
o b
reas
t ca
nce
r-sp
ecif
ic t
reat
men
t
dir
ect
surg
ery
(sa
mp
lin
g),
po
st o
per
ativ
e ra
dia
tio
n t
her
apy
,
adju
van
t an
ti-h
orm
on
e th
erap
y
dir
ect
surg
ery
(sa
mp
lin
g),
po
st o
per
ativ
e ra
dia
tio
n t
her
apy
,
adju
van
t an
ti-h
orm
on
e th
erap
y
dir
ect
surg
ery
(sa
mp
lin
g),
po
st o
per
ativ
e ra
dia
tio
n t
her
apy
,
pal
liat
ive
adju
van
t an
ti-h
orm
on
e th
erap
y
dir
ect
surg
ery
(sa
mp
lin
g),
po
st o
per
ativ
e ra
dia
tio
n t
her
apy
,
adju
van
t ch
emo
ther
apy
, ad
juvan
t an
ti-h
orm
on
e th
erap
y
dir
ect
surg
ery
(sa
mp
lin
g),
po
st o
per
ativ
e ra
dia
tio
n t
her
apy
,
adju
van
t an
ti-h
orm
on
e th
erap
y
Recep
tor s
tatu
s
- - - - estr
og
en r
ecep
tor:
mo
der
atel
y p
osi
tiv
e,
pro
ges
tero
ne
rece
pto
r: m
od
erat
ely
po
siti
ve,
no
Her
2 o
ver
exp
ress
ion
estr
og
en r
ecep
tor:
po
siti
ve,
pro
ges
tero
ne
rece
pto
r: p
osi
tiv
e, n
o H
er2
ov
erex
pre
ssio
n
estr
og
en r
ecep
tor:
po
siti
ve,
pro
ges
tero
ne
rece
pto
r: p
osi
tiv
e, n
o H
er2
ov
erex
pre
ssio
n
estr
og
en r
ecep
tor:
po
siti
ve,
pro
ges
tero
ne
rece
pto
r: n
egat
ive,
no
Her
2
ov
erex
pre
ssio
n
estr
og
en r
ecep
tor:
po
siti
ve,
pro
ges
tero
ne
rece
pto
r: p
osi
tiv
e, n
o H
er2
ov
erex
pre
ssio
n
estr
og
en r
ecep
tor:
po
siti
ve,
pro
ges
tero
ne
rece
pto
r: m
od
erat
ely
po
siti
ve,
no
Her
2
ov
erex
pre
ssio
n
Tu
mo
r s
tag
e
- - - - apT
-4b
, G
-3, V
-1,
L-1
, p
M-1
G1
pT
1c(
m)
N1
mi
(1/3
;sn
)
pT
1c,
G2
, p
N0
(sn
,
0/1
) p
Tis
(DC
IS),
G2
G3
pT
4b
L1
G-2
, p
T-X
G2
pT
2
Pa
tho
log
y
mat
eria
l fa
r aw
ay f
rom
nB
1
tum
or
no
his
tory
of
bre
ast
can
cer
no
his
tory
of
bre
ast
can
cer
his
tory
of
bre
ast
can
cer
for
the
no
t sa
mp
led
bre
ast
(mo
re
than
10
yea
rs a
go
)
po
orl
y d
iffe
ren
tiat
ed i
nv
asiv
e
bre
ast
can
cer
wit
ho
ut
spec
ial
sub
typ
e, m
etas
tasi
sin
g
hig
hly
dif
fere
nti
ated
in
vas
ive
du
ctal
bre
ast
can
cer
mo
der
atel
y d
iffe
ren
tiat
ed
inv
asiv
e d
uct
al b
reas
t ca
nce
r
po
orl
y d
iffe
ren
tiat
ed
in
vas
ive
du
ctal
bre
ast
can
cer,
met
asta
sisi
ng
mo
der
atel
y d
iffe
ren
tiat
ed
inv
asiv
e d
uct
al b
reas
t ca
nce
r
mo
der
atel
y d
iffe
ren
tiat
ed
inv
asiv
e d
uct
al b
reas
t ca
nce
r
Ag
e
55
78
80
70
55
49
50
65
47
77
Gen
der
Fem
ale
Fem
ale
Fem
ale
Fem
ale
Fem
ale
Fem
ale
Fem
ale
Fem
ale
Fem
ale
Fem
ale
Sa
mp
le
nn
B1
nn
B2
nn
B3
nn
B4
nB
1
nB
2
nB
3
nB
4
nB
5
nB
6

64
3.2.6 Absolute quantification of miRNA by amplified TG-FRET
Absolute concentrations of unknown miRNAs were determined by using a calibration curve
(FRET-ratio over concentration) constructed with the use of synthetic miRNAs with known
concentrations (between 0.05 and 1.0 pM within 140 µl solutions). Unknown miRNAs were
diluted at different dilution factors to be sure that their concentration range fitted the one of
the calibration curves.
3.2.7 RT-qPCR miRNA assays
TaqMan MicroRNA Assay Kits (Thermo Fisher) were used for all RT-qPCR experiments.
All plasma RNA extracts were diluted five times. Breast cancer tissue RNA extracts were
diluted to 0.5 ng µl−1 of total RNA, except for breast tumor samples 3, 4, and 6 (Table 3.2),
which were diluted to 0.25 ng µl−1 of total RNAs. All other RNA extracts were diluted to
2 ng µl−1 of total RNA. RT reactions were carried out with a TaqMan MicroRNA Reverse
Transcription Kit (Thermo Fisher) in 15 µl containing 5 µl of RNA extract, 0.15 µl of 100
mM dNTPs, 1 µl of Multiscribe reverse Transcriptase (50 U µl−1), 1.5 µl of 10× reverse
transcription buffer, 0.19 µl of RNase inhibitor (20 U µl−1), 3 µl of gene-specific primer,
and 4.16 µl of nuclease-free water. For synthesis of cDNA, the reaction mixtures were
incubated at 16 ℃ for 30 min, at 42 ℃ for 30 min, at 85 ℃ for 5 min, and then held at 4 ℃.
Then, 1.33 µl of cDNA solution was amplified using 10 µl of TaqMan Universal PCR
Master Mix II with UNG (Thermo Fisher), 1 µl of gene-specific primer and probe, and 7.67
µl of nuclease-free water in a final volume of 20 µl. Quantitative PCR was run on a
PikoReal Real-Time PCR System (Thermo Fisher Scientific), and the reaction mixtures
were incubated at 95 ℃ for 10 min, followed by 40 cycles of 95 ℃ for 15 s and 60 ℃ for
1 min. The quantitation cycles (Cq) were calculated with PikoReal software (Thermo
Scientific). Absolute concentrations of unknown miRNAs were determined by using a
calibration curve (Cq over concentration) constructed with the use of synthetic miRNAs
with known concentrations.

65
3.3 Results and discussion
3.3.1 Sensitivity and dynamic range
To quantify miRNA, amplified TG-FRET technology applies time-gated (0.1-0.9 ms after
pulsed excitation) ratiometric PL intensity (FRET-ratio) detection (Figure 3.1B) of Cy5.5
acceptors and Lumi4-Tb (Tb) donors (cf. Figure 3.2 for absorption/emission spectra and
FRET parameters), which only takes a few seconds on a KRYPTOR immunofluorescence
plate reader. We first evaluated the performance for miRNA quantification on exogenous
miR-21, miR-132, and miR-146a. SplintR ligase was used for efficient ligation of the DNA
padlock probes over the miRNA targets. Although shorter padlock probes were shown to
exhibit higher fluorescence intensities in RCA-FRET [212], we chose padlock probes of 77
and 78 nucleotides (see Table 3.1 for sequences of all RNAs and DNAs used in the study).
These relatively long DNAs allowed us to avoid overlap between the sequences that
recognized the miRNA targets and those that hybridized the Tb-donor and dye-acceptor
DNA probes and to optimize the FRET distance between Tb and dye inside the RCA
product. The actual Tb-dye distance in the rolling circle product (RCP, Figure 3.1A) was
18 base pairs (see Table 3.1 for complementary sequences between the padlock and the Tb
and dye probes). This distance would correspond to ca. 7 nm when using 0.34 nm per base
pair and 0.4 ± 0.1 nm for both Tb and Cy5.5 and was shown to be in excellent agreement
with time-resolved FRET measurements on dsDNA [217]. When comparing the PL decays
of the Tb-Cy5.5 FRET pair inside the RCP and inside dsDNA (Figure 3.3), the average
FRET-sensitized PL lifetime is significantly shorter for the RCP FRET-pair (0.4 ms vs. 2
ms), which means that the average FRET efficiency is higher (0.86 vs. 0.28). This
difference can be explained by the folded (coiled) structure of the RCP and a concomitant
closer donor-acceptor distance and/or the interaction of one donor with several acceptors,
both of which lead to higher FRET efficiencies. Despite the different behavior of the Tb-
dye FRET pair in a folded RCP concatemer, donor-acceptor distance adjustment (different
number of base pairs between Tb and dye) can still be used to produce distinct PL decays
that are applicable for multiplexed nucleic acid detection [171]. Another practical reason

66
of the non-overlapping sequences for miRNA targets and fluorescent probes was the
usability of the same Tb-donor and dye-acceptor probes for different miRNA targets (see
color code in Table 3.1). Taking into account the many different miRNAs that have been
related to various cancers, this versatile padlock design is an important advantage for
diagnostic applications.
Figure 3.3 PL decays of Cy5.5 for a Tb-Cy5.5 donor acceptor pair at 18 base pairs distances in a
dsDNA (red curve) and in a RCP concatemer (blue curve). A PL decay curve of Tb alone (black
curve, no Cy5.5 present) is shown for comparison and for intensity normalization of the two PL
decays (intensity normalized in the temporal region between 7 and 8 ms). The PL decay time of
the donor in the absence of the acceptor (𝜏𝐷𝐴) and of the acceptor in the presence of the donor
(average FRET decay time <𝜏𝐹𝑅𝐸𝑇>) are given inside the graph.
For all three miRNA targets the calibration curves (Figure 3.4A) showed increasing FRET-
ratio values with increasing miRNA concentrations. Limits of detection (LODs) were
determined (three standard deviations over the blank sample) as 4.2 ± 0.5 attomole (30 ± 3
fM) for miR-21, 6.8 ± 0.8 attomole (48 ± 5 fM) for miR-132, and 14 ± 2 attomole (99 ± 10
fM) for miR-146a (Figure 3.4B) and the dynamic concentration range spanned more than
3 orders of magnitude (~50 fM to ~50 pM, Figure 3.4C).

67
Figure 3.4 (A) Calibration curves for miR-21, miR-132, and miR-146a for concentrations between
0.05 and 1.0 pM within 140 µl solutions per microwell. (B) Enlarged view of the same calibration
curves in the 0 to 120 fM concentration range. LODs were determined as shown (using 3 standard
deviations of the blank) to 30 ± 3 fM for miR-21, 48 ± 5 fM for miR-132, and 99 ± 10 fM for miR-
146a. (C) Assay calibration curve of miR-21 over a larger concentration range (up to 50 pM) to
assess the dynamic range of amplified TG-FRET assays.
3.3.2 Specificity and comparison to RT-qPCR
Another important requirement for diagnostics is specificity at very low concentrations,
which we verified by challenging the miR-21 assay with various amounts of pre-miR-21 as
well as three modified miR-21 targets with single nucleotide variations at different
positions (Figure 3.5A). Compared to samples without target, pre-miR-21 did not lead to
any signal increase for TG-FRET (red curve in Figure 3.5B) but significantly reduced
quantification cycles (Cq) for RT-qPCR (red curve in Figure 3.5C), which will lead to an
overestimation (positive offset) of the real miR-21 target concentration (the lower the Cq
the higher the measured concentration). Although the Cq values for the miR-21 target were
much lower (black curve in Figure 3.5C), the nonspecific pre-miR-21 signal suggests that
the internal miR-21 sequence of pre-miR-21 (with additional 7 bases on the 50 end and 43
bases on the 30 end) can still be reverse transcribed and amplified by RT-qPCR albeit with
much lower efficiency compared to miR-21. For TG-FRET, it is very likely that the miR-
21 sequence inside pre-miR-21 will be specifically hybridized by the padlock DNA.
However, the two 3’ and 5’ overhangs prevent amplification by the phi29 polymerase.

68
Although it was shown that phi29 polymerase can provide 3’ to 5’ RNA exonucleolytic
activity, the efficiency was ~10-fold lower than for DNA [218]. We therefore assume that,
under our experimental conditions, the additional 43 bases on the 3’ end cannot be
hydrolyzed efficiently enough to initiate RCA. Concerning the single-nucleotide variations
of miR-21, only miR-2117 (U→A) at concentrations higher than 6 pM led to a significant
miR-21 signal for TG-FRET (green curve in Figure 3.5B). This nonspecific signal resulted
from a single-nucleotide variation at a distant position from the padlock nick on the longer
(12 nt) target-recognizing terminus of the padlock DNA (Figure 3.5A). The versatility of
the padlock design can overcome even such particular mismatches. Moving the nick closer
to the mismatch and/or shortening the length of the mismatch-recognizing terminus (10 nt)
completely removed the non-specific signal as shown by two other mismatched miR-21
variants (miR-2110 (A→G) and miR-214 (C→U) - blue and magenta curves in Figure 3.5B).
In contrast, the gold standard RT-qPCR was strongly influenced by all three mismatched
miR-21 (Figure 3.5C). Although the quantification cycles (Cq) were distinguishable from
the original miR-21 target, they significantly decreased to values far below that seen
without any target. While such mismatches will result in a positive offset of the real miR-
21 target concentration, the RT step of RT-qPCR can lead to negative concentration offsets.
The presence of internal or terminal RNA sequences that are complementary to the very
short hybridization sequence (~6 to 8 nt) of the RT stem-loop primer may be recognized by
the RT primer and therefore reduce RT efficiency and produce less cDNA (Figure 3.5D).
Indeed, both internal and terminal complementary sequences of otherwise unrelated RNAs
led to a significant decrease in the measured miR-21 concentrations (Figure 3.5E). Such
short sequences that are complementary to the RT stem-loop primer may exist in many
different RNAs present in real clinical samples and present a serious drawback for RT-
qPCR-based diagnostics. These results clearly show another important advantage of
amplified TG-FRET when it comes to clinical applications.

69
Figure 3.5 (A) The specificity of amplified TG-FRET and TaqMan RT-qPCR for miR-21 (black)
was challenged against pre-miR-21 (red) and three different targets with single nucleotide
variations compared to miR-21 (blue, green, and magenta). (B) For amplified TG-FRET, only the
mismatch at a remote position from the padlock nick on the longer (12 nt) target-recognizing
terminus led to a nonspecific signal at elevated concentrations of miRNA (miR-2117 (U→A), green
curve). The versatile probe design can overcome this problem by using a padlock probe with a nick
closer to the mismatch (miR-2110 (A→G), blue curve) or with the shorter target-recognizing
terminus (10 nt) over the mismatch (miR-214 (C→ U), magenta curve). Pre-miR-21 (red curve) did
not lead to any nonspecific signal either. The black curve shows the signal for the miR-21 target
(without any mismatches). (C) TaqMan RT-qPCR is strongly influenced by pre-miR-21 (red curve)
and all three single nucleotide variations (blue, green, and magenta curve), as shown by decreasing
quantification cycles (Cq) with increasing mismatch concentrations (within the same low picomolar
miRNA concentration range as for TG-FRET - cf. graph in B). Gray dashed line indicates Cq value
for samples without target. (D) The short target-hybridization sequence of the TaqMan RT-stem
loop primer can lead to reverse transcription of RNA that have the same internal or terminal
sequence than the target terminus. (E) Both internal and terminal interfering sequences led to
negative offsets (down to 40% for RNAint (terminal)) of the target concentration (10 pM).

70
3.3.3 MiRNA detection in human plasma, tissue, and cells
To demonstrate immediate applicability of amplified TG-FRET to biologically relevant
samples and research (Figure 3.6), we quantified hsa-miR-21 in 26 plasma samples related
to ovarian cancer (13 samples from ovarian cancer patients and 13 samples from healthy
individuals), hsa-miR-21 in 10 tissue samples related to breast cancer (4 healthy tissues and
6 primary tumor tissues), and hsa-miR-132 and hsa-miR-146a in lysate samples from 0.25
× 106 and 3 × 10⁶ THP-1 cells stimulated with lipopolysaccharide (LPS) for 0 h or 24 h.
For comparison, all samples were also quantified with TaqMan RT-qPCR.
Figure 3.6 Absolute concentrations (pM) of miR-21 in 26 plasma samples related to ovarian cancer
(a), and that (nM) in 10 tissue samples related to breast cancer (b). (c) Absolute concentrations
(pM) of miR-132 (left) and miR-146a (right) in LPS-stimulated THP-1 cells. All samples were also
quantified with TaqMan RT-qPCR (red columns in graph c).

71
Plasma samples are arguably the most challenging for miRNA-based diagnostics because
of the low miRNA concentrations and the large variations in miRNA expression. As shown
in Figure 3.7A, amplified TG-FRET values provided a much narrower distribution of
concentrations compared to RT-qPCR. When applying a threshold value (maximum
concentration in healthy samples without outliers), TG-FRET could reveal a significant
difference between healthy and ovarian cancer samples (62% above and 38% below
threshold line), whereas RT-qPCR showed only minor differences (17% above and 83%
below threshold line). Comparing all samples in a scatter plot (TG-FRET vs. RT-qPCR
concentrations, Figure 3.7B) showed the difference between both techniques. Although
samples were distributed below and above the ideal 1:1 line, a trend toward higher RT-
qPCR concentrations (~3:1) became evident. The scatter plot also showed a large
concentration distribution of both healthy and cancer samples and the better distinction of
cancer and healthy samples for TG-FRET. Although the results showed a better analytical
performance of TG-FRET, they also confirmed the challenges of miRNA quantification in
plasma and that larger sample cohorts are necessary to provide a clear clinical conclusion
[5]. Nevertheless, the outcome of this study on 26 different plasma samples clearly showed
that amplified TG-FRET has a large potential to add significant advantages to clinical
studies with large patient cohorts.
A narrower distribution of TG-FRET-determined concentrations was also found for breast
cancer tissues (Figure 3.8A). Although we disposed fewer samples compared to plasma, a
distinction of healthy from cancer samples was evident. One of the reasons may be the
higher absolute concentrations (pM in plasma and nM in tissue) because RT-qPCR is
known to be less precise at low target input [219]. Both amplified TG-FRET and RT-qPCR
could very well distinguish healthy and cancer tissue (100% of healthy samples below
threshold and 100% of cancer samples above threshold). Similar to the plasma results, miR-
21 concentration values for RT-qPCR were significantly higher (also approximately 3-fold)
compared to TG-FRET but there was much less distribution in the scatterplot when
comparing both techniques (Figure 3.8B). Although the patient cohort was relatively small,
the results clearly show that amplified TG-FRET can provide very useful clinical

72
information (healthy or cancer) at a relatively simple workflow without reverse
transcription and without interferences from reagents used in RNA extraction. TG-FRET
may therefore be used as a stand-alone or complementary analytical method to accomplish
higher precision in miRNA-based tissue diagnostics.
Figure 3.7 (A) Absolute quantification of hsa-miR-21 in human plasma (ovarian cancer) using
amplified TG-FRET (blue) and RT-qPCR (red). MiR-21 concentrations (in small-RNA extracts)
of 13 healthy control and 13 ovarian cancer samples were quantified. Circles around data points
indicate statistical outliers (in green for only one of the techniques, in black for both techniques).
Whiskers represent maximum and minimum values (without outliers) and horizontal lines
represents the median. Dotted lines represent a threshold value (maximum of healthy control
samples). More information about samples and human research participants can be found Table
3.2 and Table 3.3. All concentrations are given in copy number per ng of small RNA. Absolute
concentrations (pM) are shown in Figure 3.6a. (B) Scatterplot comparing RT-qPCR with TG-
FRET concentrations for the same samples. Healthy samples are shown in black and cancer
samples in magenta. For orientation, lines of perfect agreement (1:1) between the two techniques
and 3-fold higher RT-qPCR values (3:1) are shown. Circles around data points indicate the
statistical outliers from (A). Blue and red dashed lines present the threshold values from (A).

73
Figure 3.8 (A) Absolute quantification of hsa-miR-21 in human tissue (breast cancer) using
amplified TG-FRET (blue) and RT-qPCR (red). miR-21 concentrations (in total-RNA extracts) of
four healthy tissues (non-neoplastic breast) and six breast tumor tissues were quantified. Circle
around data point indicates statistical outlier. Whiskers represent maximum and minimum values
(without outlier) and horizontal lines represents the median. Dotted lines represent a threshold
value (maximum of healthy control samples). More information about samples and human research
participants can be found in Table 3.2 and Table 3.3. All concentrations are given in copy number
per ng of total RNA. Absolute concentrations (nM) are shown in Figure 3.6b. (B) Scatterplot
comparing RT-qPCR with TG-FRET concentrations for the same samples. Healthy samples are
shown in black and cancer samples in magenta. For orientation, lines of perfect agreement (1:1)
between the two techniques and 3-fold higher RT-qPCR values (3:1) are shown. Circle around data
point indicates the statistical outlier from (A). Blue and red dashed lines present threshold values
from (A).
To demonstrate successful application of amplified TG-FRET beyond cancer diagnostics
and for a third sample type, quantification of two other endogenous miRNAs (hsa-miR-132
and hsa-miR-146a) was performed in total-RNA extracts from LPS-stimulated THP-1 cells
(Figure 3.9). LPS stimulation resulted in a significant increase in miR-132 concentrations
for both smaller (250,000 cells) and larger (3 × 10⁶ cells) amounts of cells. The higher
amount of cells allowed us to produce more total-RNA but at approximately equal

74
concentrations (cf. Table 3.2). Similar to plasma and tissue measurements, concentration
values were (2.4 ± 1.1)-fold higher for RT-qPCR compared to TG-FRET. These higher
concentration values in all three types of clinical samples suggest that the positive
concentration offset of RT-qPCR (cf. Figure 3.5A-C) caused by miRs with very similar
sequences is significantly stronger than the negative concentration offset (cf. Figure 3.5E)
caused by the RT step of RT-qPCR. Absolute concentrations (cf. Figure 3.6) were similar
to plasma samples (pM concentration range). Average relative increases due to LPS
stimulation were 5.3/22-fold and 3.5/7.8-fold (smaller/larger amounts of cells) for TG-
FRET and RT-qPCR, respectively. The larger amount of cells was used for the
quantification of miR-146a. Concentration values were 14-fold lower (no stimulation) and
1.5-fold higher (24 h stimulation) for RT-qPCR, and this time the relative increases due to
LPS stimulation were 18-fold and 395-fold for TG-FRET and RT-qPCR, respectively. TG-
FRET showed better agreement with a previous study, which reported that both miR-132
and miR-146a showed equivalent elevation and that the one of miR-146a was circa 8-fold
(normalized to 5S RNA) [216]. Again, we used only few samples to demonstrate
quantification of miRNAs in cells and though the results were more consistent for TG-
FRET, a larger study would be necessary to confirm its better performance. However,
similar to the tissue samples, we could clearly show (and verify by RT-qPCR) that TG-
FRET can efficiently distinguish LPS-stimulated from non-stimulated cells and that this
new technology has the potential to become a useful tool for cell-based miRNA diagnostics.

75
Figure 3.9 Absolute quantification of hsa-miR-132 and hsa-miR-146a in in vitro cultured cells
(LPS stimulation) using amplified TG-FRET (blue) and RT-qPCR (red). miR-132 (left) and miR-
146a (right) concentrations (in total-RNA extracts) of THP-1 cells after 0 h and 24 h of stimulation
with LPS (1 𝜇g ml−1). Note: value of miR-146a for 0 h stimulation measured with RT-qPCR is 0.9
and therefore not visible within the concentration scale. More information about the samples can
be found in Table 3.2. All concentrations are given in copy number per ng of total RNA. Absolute
concentrations (pM) are shown in Figure 3.6c.
3.4 Conclusion
In this study, we have presented the development, characterization, and application of a
new amplified TG-FRET technology for absolute quantification of miRNA. Amplified TG-
FRET uses simple isothermal RCA and ratiometric TG-FRET detection for precise
quantification on a commercial clinical plate reader (KRYPTOR). The rapid miRNA assay
does not require any separation or washing steps and can directly quantify miRNA without
reverse transcription to cDNA. To fulfill the technological and clinical requirements we
designed TG-FRET for high sensitivity, specificity, and the use for quantifying miRNA
from human plasma, tissues, and cells. Careful characterization of sensitivity and

76
specificity for miR-21, miR-132, and miR-146a revealed LODs down to 4.2 attomoles (30
fM), efficient distinction against single-nucleotide variations and pre-miRNA, and
significant advantages in specificity compared to RT-qPCR.
To evaluate the immediate applicability to a broad range of biological or clinical studies,
we tested the assay performance on small groups of different types of samples (plasma,
tissue, and cells) with different pathological backgrounds (ovarian cancer, breast cancer,
and innate immune response) in a one-to-one comparison with TaqMan RT-qPCR. While
hsa-miR-21 quantification from tissue allowed for a clear distinction between healthy and
tumor tissue and hsa-miR-132 and has-miR-146a quantification from THP-1 cells provided
clear evidence for LPS-stimulated or non-stimulated cells, pathological evaluation of
plasma samples appeared more challenging. From the diagnostic point of view, TG-FRET
clearly outperformed RT-qPCR with 62% of cancer plasma samples detected above the
maximum concentration value of healthy control samples, whereas RT-qPCR only detected
17% above threshold. For most of the samples (independent of the sample type), RT-qPCR
detected higher concentrations (approximately 3-fold) than TG-FRET and RT-qPCR
determined concentrations with a significantly larger distribution. We attribute these higher
and broader values of RT-qPCR to specificity issues (cf. Figure 3.5), the susceptibility to
interferences with sample extraction reagents, and the lower precision of this exponential
amplification technique at low target input.
The ability to quantify different miRNAs from various types of clinically relevant samples,
to obtain significant pathological information from these measurements, the advantages in
simplicity and precision compared to RT-qPCR, and the adaptability of the isothermal and
washing-free procedure to life-cell imaging, will make TG-FRET a very useful tool (in
combination with other technologies or as stand-alone method) for advancing miRNA-
based diagnostics and research. Moreover, amplified TG-FRET has the potential to create
significant impact for the translation of miRNA biomarkers into the clinic.

77
4. Multiplexed miRNA diagnostics
using CHA-amplified Tb-to-dye FRET
4.1 Introduction
In the previous chapter, we have shown a precise, sensitive, and specific miRNAs assay
based on RCA-amplified Tb-to-dye TG-FRET. The absolute quantification of miRNAs
from human clinical samples not only revealed the relevance for breast and ovarian cancer
diagnostics, but also demonstrated the broad applicability to different miRNAs and other
types of clinical samples. The importance of specific disease signatures that are composed
of several different miRNA biomarkers have dramatically increased the demand for the
simultaneous measurement of multiple targets in a single sample, so-called multiplexed
biosensing [220, 221]. Additionally, more efficient clinical diagnostics and personalized
therapies require multiplexing technologies ranging from point-of-care testing to high-
throughput screening [222-224]. The large choice of commercially available fluorophores
with different photochemical and photophysical properties has become an important source
for the development of multiplexed PL detection [225]. The implementation of FRET
between two fluorophores into PL detection can combine the benefits of biological
recognition and multiplexing for molecular diagnostics [226]. While most PL multiplexing
approaches are based on spectral (or color) encoding with different fluorophores, which
require distinct detection channels and excitation wavelengths. Taking the extremely long
PL lifetime and multiplexing capabilities of LTCs, temporal encoding with one single
FRET pair can be efficiently exploited.
In contrast to RCA, another commonly used isothermal amplification strategy, CHA, is
enzyme-free and therefore avoids the drawbacks of enzymatic reactions, including
particular reaction times and conditions to maintain the enzyme's activity. Our group
demonstrated an enzyme-free HCR for temporally multiplexed miRNA quantification in a
previous study, but the proposed HCR-TG-FRET approach has not been capable of
detecting miRNAs in clinical samples [227]. Thus, the implementation of single FRET-pair

78
temporal multiplexing into other enzyme-free amplification techniques and the analytical
validation of its sensing performance on clinical samples are two challenges, which have
the potential to further advance rapid and multiplexed miRNA diagnostics.
This work is to achieve multiplexed miRNA diagnostics based on Tb-to-dye TG-FRET and
enzyme-free CHA amplification strategy with simplicity, rapidity, sensitivity, and
multiplexing at the same time. By using specifically designed hairpin probes that located a
single Tb-to-dye FRET pair at different donor-acceptor distances, the sensitive
quantification of miR-21 and miR-20a at picomolar concentrations is realized. The CHA-
TG-FRET approach displayed excellent performance in the simultaneous detection of
miRNAs from human tissue samples, which was verified by parallel measurement with the
standard method RT-qPCR. Being capable of multiplexed quantification of miRNAs from
clinical samples, CHA-TG-FRET presents an interesting and complementary sensing
approach for rapid miRNA-based clinical diagnostics and biomolecular research.
4.2 Materials and methods
4.2.1 Nucleic acid probes and exogenous targets
All sequences and modifications of nucleic acids are summarized in Table 4.1. All
oligonucleotides were purchased from Eurogentec and purified with HPLC. Lumi4-Tb-
NHS (Tb-NHS) was provided by Lumiphore. Cy5.5-NHS was purchased from Lumiprobe.
Tb-DNA and Cy5.5-DNA conjugates were obtained by mixing Tb-NHS or Cy5.5-NHS in
concentration excess to amino-functionalized oligonucleotides in 100 mM carbonate buffer
at pH 9.0. The mixtures were incubated overnight at 4 °C. The Tb-DNA and Cy5.5-DNA
conjugates were purified three times with HEPES buffer (100 mM, pH 7.4) by Zeba Spin
Desalting Columns (7 kDa molecular weight cutoff, MWCO). Tb concentrations were
determined by absorbance measurements at 340 nm using a molar absorptivity of 26,000
M−1𝑐𝑚−1 as provided by the manufacturer. Cy5.5 concentrations were determined by
absorbance measurements at 684 nm using a molar absorptivity of 209,000 M−1𝑐𝑚−1 as

79
provided by the manufacturer. DNA was quantified by absorbance measurements at 260
nm using molar absorptivities as provided by the manufacturer (H1 for miR-21: 464,100
M−1𝑐𝑚−1; H2 for miR-21: 424,600 M−1𝑐𝑚−1; H1 for miR-20a: 478,100 M-1cm-1; H2 for
miR-20a: 424,200 M−1𝑐𝑚−1 ). Complete fluorophore-DNA conjugation (~100 %) was
verified by linear combination of the respective absorbance values of Tb or Cy5.5 and DNA
within the Tb-DNA and Cy5.5-DNA conjugates.
Table 4.1 Sequences and modifications of all RNA targets and hairpin DNA probes. Nucleotides
with amino-modification for Cy5.5 conjugation are displayed in bold/underlined. Probe-specific
domains (cf. Figure 4.1) are presented in color as follows: 1/1*: red; 2/2*: blue; 3/3*: green; 4/4*:
magenta.
Probe Sequence 5’-3’ Modification
miR-21 UAG CUU AUC AGA CUG AUG UUG A
miR-20a UAA AGU GCU UAU AGU GCA GGU AG
miR-20b CAA AGU GCU CAU AGU GCA GGU AG
H1 for miR-21
(Cy5.5 acceptor probe)
TCA ACA TCA GTC TGA TAA GCT ACC
ATG TGT AGA TAG CTT ATC AGA C
dT-C6 amino
H2 for miR-21
(Tb donor probe)
AAG CTA TCT ACA CAT GGT AGC TTA
TCA GAC CCA TGT GTA GA
5’-C3 amino
H1 for miR-20a
(Cy5.5 acceptor probe)
CTA CCT GCA CTA TAA GCA CTT TAC
CAT GTG TAG ATA AAG TGC TTA TAG
dT-C6 amino
H2 for miR-20a
(Tb donor probe)
CAC TTT ATC TAC ACA TGG TAA AGT
GCT TAT AGC CAT GTG TAG A
5’-C3 amino
4.2.2 Optical spectroscopy
Absorption spectra (Lambda 35 UV/Vis System, PerkinElmer) and emission spectra
(Xenius, SAFAS) were recorded in HEPES buffer (100 mM, pH 7.4) and deionized water
(purified by Purelab Option-Q equipped with bio-filter, ELGA LabWater) for Tb and Cy5.5
samples, respectively.

80
4.2.3 TG-FRET miRNA assays
Before use, both H1 and H2 for each target were denatured at 90 °C for 5 min and then
cooled down (2 °C/min) to room temperature (25 °C) to form complete hairpin structures.
All FRET assays were prepared in TNaK Buffer (40 mM Tris‑HCl, 280 mM NaCl, 10 mM
KCl, 0.02% BSA, pH 7.5). These buffer conditions were optimized for obtaining high
FRET-ratios. Different buffer conditions will result in different assay performance and
therefore, assay calibration curves should be performed under the same conditions as the
final miRNA quantification assay. The single sensor assays contained 5 nM of H1, 5 nM
of H2 and increasing concentrations of target miRNAs (from 10 pM to 400 pM). Again, the
H1 and H2 probe concentrations were optimized and different probe concentrations require
the acquisition of separate assay calibration curves. All samples were prepared at once and
incubated at room temperature for 3 h. From the total reaction volume of 150 µl, 140 µl
were measured in black 96-well microtiter plates on the clinical immunofluorescence plate
reader KRYPTOR compact plus (Thermo Fisher Scientific) with TG (0.1-0.9 ms after
excitation pulse) PL intensity detection using optical bandpass filters (Semrock) with 494
± 12 nm for the Tb detection channel and 716 ± 24 nm for the Cy5.5 detection channel. The
duplexed sensor assays contained two different H1 (5 nM H1 for miR‑21 and 5 nM H1 for
miR‑20a) and two different H2 (5 nM H2 for miR‑21 and 5 nM H2 for miR‑20a). 140 µl
were measured in black 96‑well microtiter plates on a time-resolved fluorescence plate
reader (Edinburgh Instruments) using 4000 detection bins of 2 µs integration time, nitrogen
laser (MNL 100, LTB) excitation (337.1 nm, 20 Hz), and optical bandpass filters (Semrock)
with 494 ± 12 nm for the Tb detection channel and 716 ± 24 nm for the Cy5.5 detection
channel. For ratiometric analysis, FRET‑ratios were calculated by the ratio of Cy5.5 and
Tb TG PL intensities.
4.2.4 Mathematical treatment of multiplexed signal deconvolution
TG PL intensities (𝐼𝑇𝐺) of the Cy5.5 acceptors and Tb donors were determined in their
specific time windows (from the corresponding PL decay curves). These TG PL intensities

81
were then used to calculate a background-subtracted FRET‑ratios for each target
concentration 𝑐 = 𝑥 (Equation 4.1):
Δ𝐹𝑅𝐸𝑇‑𝑟𝑎𝑡𝑖𝑜 =𝐼𝐶𝑦5.5
𝑇𝐺 (𝑐=𝑥)
𝐼𝑇𝑏𝑇𝐺(𝑐=𝑥)
−𝐼𝐶𝑦5.5
𝑇𝐺 (𝑐=0)
𝐼𝑇𝑏𝑇𝐺(𝑐=0)
(4.1)
The concentration-dependent Δ𝐹𝑅𝐸𝑇‑𝑟𝑎𝑡𝑖𝑜 values were used to determine the calibration
curves for each miRNA target in each detection window (cf. Figure 4.4).
The slopes of the four linearly fitted calibration curves (𝑧𝑚𝑖𝑅‑21𝑇𝐺1 , 𝑧𝑚𝑖𝑅‑20𝑎
𝑇𝐺1 , 𝑧𝑚𝑖𝑅‑21𝑇𝐺2 , 𝑧𝑚𝑖𝑅‑20𝑎
𝑇𝐺2 )
from Figure 4.4b were used to determine the concentrations in the multiplexed assay that
led to the concentration recovery in Figure 4.5 by solving Equation 4.2 for the
concentrations 𝑐(miR‑21) and 𝑐(miR‑21) . Δ𝐹𝑅𝐸𝑇‑𝑟𝑎𝑡𝑖𝑜1 and Δ𝐹𝑅𝐸𝑇‑𝑟𝑎𝑡𝑖𝑜2 were the
Δ𝐹𝑅𝐸𝑇‑𝑟𝑎𝑡𝑖𝑜 values from two TG detection windows (TG1 and TG2) in the multiplexed
assay.
[Δ𝐹𝑅𝐸𝑇‑𝑟𝑎𝑡𝑖𝑜1
Δ𝐹𝑅𝐸𝑇‑𝑟𝑎𝑡𝑖𝑜2] = [
𝑐(miR‑21)𝑐(miR‑20a)
] × [𝑧𝑚𝑖𝑅‑21
𝑇𝐺1 𝑧𝑚𝑖𝑅‑20𝑎𝑇𝐺1
𝑧𝑚𝑖𝑅‑21𝑇𝐺2 𝑧𝑚𝑖𝑅‑20𝑎
𝑇𝐺2] (4.2)
4.2.5 RNA extraction
Tissue material was obtained with informed consent at the Medical University of Graz and
the St. John of God Hospital Graz under approval from the ethics committee of the Medical
University of Graz and the ethics committee of the ST. John of God Hospital Graz. Total
RNA was isolated from snap-frozen human colon or rectum tissue samples using Trizol
Reagent (Life Technologies), followed by extraction with phenaol-chloroform. Total RNA
concentrations and available volumes of all samples are given in Table 4.2.
Table 4.2 Total RNA concentrations and sample volumes of clinical tissue samples.
Sample name Patient number
(internal database) Extracted from
Concentration of
Total RNA in ng/µl
A 3 Colon, tumor 1076
B 11 Colon, healthy 576
C 9 Rectum, tumor 575
D 10 Rectum, tumor 386
E 17 Rectum, healthy 103

82
4.2.6 Absolute quantification of miRNA by TG-FRET
Absolute concentrations of unknown miRNAs were determined by using calibration curves
(Δ𝐹𝑅𝐸𝑇‑𝑟𝑎𝑡𝑖𝑜 over concentration) constructed with the use of synthetic (exogenous)
miRNAs with known concentrations (between 10 pM and 400 pM within 140 µl solutions).
Due to the unknown concentrations of miRNAs in the total RNA tissue extracts, samples
were diluted at different dilution factors to make sure that their concentration range fitted
the one of the calibration curves. Final dilution factors of the samples were 4-fold (sample
A for single target detection), 2-fold (samples B, C, D, and E for single target and samples
A and C for duplexed target detection), and 1-fold (samples B, D, and E for duplexed target
detection), where 𝑥-fold corresponded to a volume fraction of 1 𝑥⁄ inside the final sample
volume of 10 µl. These 10 µl were added to 140 µl of TG-FRET miRNA assays reagents
such that the concentrations of the reagents inside the final 150 µl mixtures were the same
as for the TG-FRET miRNA assays for exogenous targets (vide supra) and the total sample
dilution corresponded to 15𝑥. Thus, the miR-21 and miR-20a concentrations determined
by TG-FRET were multiplied by 15𝑥 to obtain the miRNA concentrations in the total RNA
extracts. These miRNA concentrations (in mol/µl) were divided by the total RNA
concentrations (in ng/µl – cf. Table 4.2) and multiplied by the Avogardo constant
(6.022 × 10²³𝑚𝑜𝑙−1) to obtain the miRNA concentration in units “copies of miRNA per
ng of total RNA” as presented in Figure 4.6.
4.2.7 RT-qPCR miRNA assays
TaqMan MicroRNA Reverse Transcription Kit (Thermo Fisher) in 15 µl containing 5 µl of
RNA extract, 0.15 µl of 100 mM dNTPs, 1 µl of Multiscribe reverse Transcriptase (50
U/µl), 1.5 µl of 10× reverse transcription buffer, 0.19 µl of RNase inhibitor (20 U/µl), 3 µl
of gene-specific primer, and 4.16 µl of nuclease-free water. For synthesis of cDNA, the
reaction mixtures were incubated at 16 °C for 30 min, at 42 °C for 30 min, at 85 °C for 5
min, and then held at 4 °C. Then, 1.33 µl of cDNA solution was amplified using 10 µl of
TaqMan Universal PCR Master Mix II without UNG (Thermo Fisher), 1 µl of gene-specific
primer and probe, and 7.67 µl of nuclease-free water in a final volume of 20 µl. Quantitative

83
PCR was run on a StepOnePlus (96-well) Real-Time PCR System (Thermo Fisher
Scientific), and the reaction mixtures were incubated at 95 °C for 10 min, followed by 40
cycles of 95 °C for 15 s and 60 °C for 1 min. The quantitation cycles (Cq) were calculated
with StepOnePlus Systems software (Thermo Fisher Scientific). Absolute concentrations
of unknown miRNAs were determined by using a calibration curve (Cq over concentration)
constructed with the use of synthetic (exogenous) miRNAs with known concentrations
using the same procedure as mentioned above.
4.2.8 Statistical analysis
For statistical analysis and the estimation of LODs, all samples were prepared 3 times and
measured in triplicates (𝑛 = 9). The zero concentration samples (without target miRNAs)
were prepared 10 times and measured in triplicates (𝑛 = 30). Samples of multiplexed
assays with varying target concentrations were prepared in duplicate and measured once
(𝑛 = 2). For real sample detections, all samples were prepared in duplicate and measured
once (𝑛 = 2). All RT-qPCR measurements were performed in duplicate and measured once
(𝑛 = 2).
4.2.9 Calculation of FRET parameters
Förster distance (the donor-acceptor distance for which FRET is 50 % efficient) for the Tb-
to-Cy5.5 FRET pair (𝑅0 = 5.8 ± 0.2 nm) was calculated using Equation 3.1 (vide supra).
The orientation factor κ2 was taken as 2 3⁄ because of random orientation of donor and
acceptor during the FRET time (dynamic averaging), which is well justified by the long PL
lifetime of the Tb donors and the unpolarized emission (fast isotropic rotation). The
refractive index was 𝑛 = 1.35 (aqueous buffer solution). The Tb-centered quantum yield
was Փ𝐷 = 0.80 ± 0.05 . The overlap integral 𝐽 was calculated by Equation 3.2 (vide
supra), where 𝐼�̅�(𝜆) is the emission intensity from the area-normalized (to unity) emission
spectrum of Tb donor and 𝜀𝐴(𝜆) is the molar absorptivity of the acceptor.

84
4.3 Results and discussion
4.3.1 Principle of CHA-TG-FRET miRNA assays
As shown in Figure 4.1, two hairpin probes (H1 and H2) for each miRNA target (miR-21
and miR-20a) were carefully designed to efficiently follow the target-mediated CHA
process. H1 and H2 can hybridize to form a H1:H2 duplex, since H1 contains a DNA
segment that is complementary to a segment of hairpin H2. However, the spontaneous
hybridization of the two hairpins is kinetically hindered by occluding complementary
regions within the intramolecular hairpin secondary structures. A segment (1*) of the target
miRNA serves as a toehold to initiate hybridization with the complementary segment (1)
of H1 followed by branch migration, which opens hairpin H1 and forms a miRNA:H1
intermediate. In this intermediate, a segment (3*) of H1 is no longer occluded and can bind
to the complementary segment (3) of H2, again initiating a branch migration reaction to
form a miRNA:H1:H2 complex. This complex is inherently unstable and target miRNA
dissociates from the H1:H2 complex, which completes the reaction and results in a partly
double-stranded H1:H2 complex and a recycled target miRNA. Thus, a single miRNA
target can act as a catalyst to trigger many cycles of CHA and produce many copies of
dsDNA H1:H2 complexes. To quantify miRNA-dependent CHA, the 3’ ends of H2 probes
(for both target miRNAs) were labeled with a Tb FRET-donor, whereas a Cy5.5 FRET-
acceptor was labeled to a specific thymine within H1. Thereby, we obtained distinct donor-
acceptor distances ( 𝑟 ) for the different target miRNAs. Due to the strong distance
dependence of the FRET efficiency (~𝑟−6), different values of 𝑅 led to different PL decays
of the FRET-quenched donors and FRET-sensitized acceptors (the closer the distance, the
faster the decay). The different PL decays were then used for a straightforward temporal
multiplexing by TG PL intensity detection. FRET-ratios, which were used for quantifying
the miRNA target concentrations (Figure 4.3 and Figure 4.4, Equation 4.1 and Equation
4.2), were measured on two commercially available time-resolved fluorescence plate
readers. The ratiometric detection of TG PL intensities of Cy5.5 acceptor and Tb donor
allowed for precise and reproducible (low coefficients of variation) CHA-TG-FRET assays.

85
Figure 4.1 Principle of CHA-TG-FRET probes for multiplexed quantification of two miRNAs.
Target miR-21 (a) and miR-20a (b) were mixed with both Cy5.5-acceptor labeled H1 probes and
Tb-donor labeled H2 probes. Specific sequences in H1, H2, and target miRNAs, each of which
represents a short fragment (usually <12 nt) of DNA or RNA, are presented with numbered
domains (1 to 4). Complementarity between these domains is denoted by an asterisk (e.g., 1 and
1*). The miRNA targets serve as a toehold to initiate the opening of hairpin H1, which then opens
hairpin H2 to form a dsDNA H1:H2 complex and displace the miRNA target. The released miRNA
can then be recycled for another “H1 + H2 → H1:H2” reaction. Signal amplification by CHA was
performed at room temperature for 3 h and resulted in the formation of many H1:H2 complexes,
in which the Tb-to-Cy5.5 distance was 10 bps for the miR-21-specific complex (a) and 14 bps for
the miR-20a-specific complex (b). Cy5.5 and Tb PL decay curves of increasing concentrations (0
pM to 400 pM from bottom to top) of miR-21 (c) and miR-20a (d) at constant concentrations (5
nM Cy5.5-acceptor labeled H1 and 5 nM Tb-donor labeled H2) of the miR-21 or miR-20a hairpin
probes. The distinct PL decays were used to specifically quantify the different miRNAs.
Ratiometric measurements (Δ𝐹𝑅𝐸𝑇‑𝑟𝑎𝑡𝑖𝑜, Equation 4.1) of Cy5.5 and Tb TG PL intensities
(𝐼𝑇𝐺(𝑥)) in variable time windows (width 𝑥 and delay 𝑦) after the excitation pulse were used for
quantifying miRNA target concentrations. In the case of duplexed miRNA quantification from a
single sample within a single measurement, two different time windows were used (cf. Figure 4.4)
and the two Δ𝐹𝑅𝐸𝑇‑𝑟𝑎𝑡𝑖𝑜𝑠 mathematically correlated (Equation 4.2).

86
4.3.2 Single miRNA assay performance
To evaluate the versatility and sensitivity of CHA-TG-FRET, we first tested the single
sensor performance for the two prototypical miRNAs miR-21 and miR-20a, which were
found to be upregulated in different cancers (miRCancer database reports 248 and 50
cancer-related upregulations for hsa-miR-21 and hsa-miR-20a, respectively) [228, 229].
For both targets, we used a TG detection window with width of 𝑥 = 0.8 ms and a delay of
𝑦 = 0.1 ms after the excitation pulse. Each ratiometric measurement (Cy5.5 and Tb TG PL
intensities) on the KRYPTOR immunofluorescence plate reader took only a few seconds.
Target selectivity was firstly tested by measuring the FRET-ratios of the miR-20a sensor in
the presence of 0 to 400 pM miR-20b, which has only two mismatched nucleotides
compared to miR-20a (cf. Table 4.1). No significant increase of the FRET-ratio was found
over the entire concentration range of miR-20b (Figure 4.2), which showed the excellent
specificity of the CHA-TG-FRET probe for its related target.
Figure 4.2 Specificity of the CHA-TG-FRET assay for miR-20a was tested against the same
concentrations of the 2-nt mismatched miR-20b (compared to miR-20a). Only miR-20a resulted in
a sensor response, whereas miR-20b did not lead to an increase of the FRET-ratio over the entire
concentration range.
0 100 200 300 400
0.00
0.02
0.04
0.06
0.08
0.10
0.12 miR-20a
miR-20b
µF
RE
T-r
atio
cmiR (pM)
D

87
Then the sensitivity of the sensor was evaluated. For both miRNA targets, the calibration
curves (Figure 4.3A) showed increasing FRET-ratios with increasing miRNA
concentrations in a linear dynamic concentration range between 0 and 400 pM. LODs were
determined (three standard deviations over the blank sample) as 380 40 attomoles (2.7
0.3 pM in the 140 µl detection volume) of miR-21 and 250 60 attomoles (1.8 0.4 pM
in the 140 µl detection volume) of miR-20a (Figure 4.3B).
Figure 4.3 (A) CHA-TG-FRET miRNA assay calibration curves for miR-21 (a) and miR-20a (b).
Δ𝐹𝑅𝐸𝑇‑𝑟𝑎𝑡𝑖𝑜𝑠 were calculated in TG PL detection windows from 0.1 to 0.9 ms. Error bars depict
standard deviations from 9 measurement for c > 0 and from 30 measurement for 𝑐 = 0 . (B)
Determination of LODs by plotting the calibration curves and linear fits (graph A) in the low
concentration range. Δ𝐹𝑅𝐸𝑇‑𝑟𝑎𝑡𝑖𝑜 values three standard deviations (3σ, as calculated from 30
measurement of Δ𝐹𝑅𝐸𝑇‑𝑟𝑎𝑡𝑖𝑜 at 𝑐 = 0, i.e. the blank sample) above the Δ𝐹𝑅𝐸𝑇‑𝑟𝑎𝑡𝑖𝑜 of the
blank were correlated with the linear calibration curve to determine the LOD concentrations (red).

88
4.3.3 Single FRET-pair multiplexing
The different labeling positions of Cy5.5 in H1 for miR-21 and H1 for miR-20a resulted in
different FRET distances (and concomitant FRET efficiencies) between Tb and Cy5.5 in
the double-stranded H1:H2 complexes after CHA amplification (Figure 4.1a and Figure
4.1b). Therefore, the two miRNA sensors provided two distinct FRET-sensitized Cy5.5 PL
decay curves (left graphs in Figure 4.1c and Figure 4.1d). The FRET-quenched Tb PL
decay curves (right graphs in Figure 4.1c and Figure 4.1d) were also different, which is
less visible due to the relatively strong background of unquenched Tb-probes (those that
did not participate in FRET). When assuming a distance of ~0.33 nm between two base
pairs of dsDNA in solution [230], the Tb-Cy5.5 distances would correspond to ~3.3 nm (10
bps) for the miR-21 FRET-probe and ~4.6 nm (14 bps) for the miR-20a FRET-probe.
Fitting the PL decay curves from Figure 4.1 for the actual FRET contributions resulted in
slightly longer distances of 4.2 0.2 nm (Table 4.3) and 5.1 0.2 nm (Table 4.4). These
longer distances are reasonable when taking into account the linkers (C6 for Cy5.5 and C3
for Tb – cf. Table 4.1) between the fluorophores and the DNA labeling position as well as
the additional linker in Tb [167]. It also shows that an actual measurement (using the FRET
pair as molecular ruler) is better than a simple estimation based on the number of base pairs.
While the actual distances were of minor importance for the miRNA sensors, the
differences in amplitude averaged PL decay times (~400 µs for the miR-21 FRET-probe
and ~900 µs for the miR-20a FRET-probe, cf. Table 4.3 and Table 4.4) and concomitant
distinct PL decays were significantly more important to realize a multiplexed miRNA
detection with a single FRET pair (vide infra). Adjusting the donor-acceptor distance by
the different number of base pairs between Tb and Cy5.5 and a direct distance-analysis by
Tb-to-Cy5.5 FRET are straightforward design and characterization tools for the
development of single FRET-pair multiplexed detection of miRNAs.

89
Table 4.3 Fit results of PL decay curves (Figure 4.1c) for the donor-acceptor distances in the miR-
21 FRET-probe. Fitting method is described in reference [217].
Table 4.4 Fit results of PL decay curves (Figure 4.1d) for the donor-acceptor distances in the miR-
20a FRET-probe. Fitting method is described in reference [217].

90
4.3.4 Duplexed detection of miR-21 and miR-20a
Following the single FRET-pair temporal multiplexing concept mentioned above, we
optimized the assay for the simultaneous quantification of miR-21 and miR-20a from a
single sample. Figure 4.4a shows the target-concentration-dependent PL decays of the
duplexed assay in the presence of miR-21 (left), miR-20a (center), and both miR-21 and
miR-20a (right) ). As expected, the PL decays of the dual-target samples presented a
convolution of the shorter and longer PL decays of the miR-21 and miR-20a sensors,
respectively. To accomplish simple deconvolution of the two contributions, we applied two
different TG detection windows (also shown in Figure 4.4a). For temporal multiplexing,
the number of detection windows should match the number of targets and the temporal
delays and widths of the windows should be adapted to the PL decays. In particular, the
different targets need to provide distinct concentration-dependent PL intensity increase to
the different windows and these intensities should be as high as possible. Therefore, the
later windows are usually selected with a longer width. The detection width should not be
too long either because the signal-to-background ratio is lower at later times of the PL decay
curves. In our case, the first window (TG1, with width of 𝑥 = 0.7 ms and a delay of 𝑦 =
0.1 ms after the excitation pulse) showed obvious concentration-dependent intensity
increases for both miR-21 and miR-20a, whereas the second one (TG2, with width of 𝑥 =
1.0 ms and a delay of 𝑦 = 1.0 ms) was significantly more specific for miR-20a (low
concentration-dependent concentration increase for miR-21). For both TG detection
windows, the FRET-ratios increased linearly with increasing target concentrations (Figure
4.4b) and the sum of the single FRET-ratios (for each target) corresponded very well to the
FRET-ratio of the mixed samples. These two properties confirmed that the two detection
windows were well suited for duplexed detection. Using the four slopes of the single target
calibration curves (black and red curves in Figure 4.4b), the concentrations of each target
in the mixed samples can be determined by the Δ𝐹𝑅𝐸𝑇‑𝑟𝑎𝑡𝑖𝑜 values in both TG detection
windows (blue data points in Figure 4.4b) and Equation 4.2, which presents a simple linear
equation with a 2×2 matrix of the calibrated slopes.

91
The advantage of using both sensors and temporal multiplexing is that the two different
miRNA targets can be quantified simultaneously from the same sample with a single
measurement. Taking into account that there is no single disease-specific miRNA, the
quantification of several different miRNA targets (so-called disease-specific miRNA
signatures) by a single measurement is faster and requires less reagents and less patient
sample volume. Nevertheless, the advantages of single-sample multiplexing are always
accompanied by the disadvantage of slightly reduced sensitivity and accuracy. Therefore,
it is important to verify if the compromise between rapidity, reduced sample volume, and
lower costs on the one and reduced sensitivity and accuracy on the other side is suitable for
efficient target quantification. To test the performance of the single FRET-pair dual target
CHA-TG-FRET miRNA assay under more challenging duplexing conditions, we prepared
13 samples with varying concentrations of the two miRNA targets. Figure 4.5 shows the
selective, sensitive, and precise recovery of both miR-21 and miR-20a at varying low
picomolar concentrations from the 13 different samples with quite high accuracy. For the
14 miRNA concentrations (those data points that were not zero), the accuracies (deviations
from the known concentrations) were within 5 % for seven values, 10 to 20 % for five
values, and 20 to 30 % for two values. The deviations from the 12 “zero-concentrations”
were below 1 pM for five values, between 2 pM and 5 pM for six values, and 7 pM for one
value.

92
Figure 4.4 (a) PL decay curves of the duplexed CHA-TG-FRET miRNA assay measured in the
Cy5.5-acceptor detection channels for increasing concentrations (0 pM to 400 pM from bottom to
top) of miR-21, miR-20a, and both miR-21 and miR-20a in a single sample. (b) Concentration
dependent FRET-ratios calculated from the TG PL intensities detected in TG1 and TG2 from the
PL decay curves in graph a. Green data points present the sum of black and red data points for each
concentration. The dotted lines present the single-target calibration curves, whose slopes
( zmiR-21
TG1 = 1.94×10⁻⁴ pM-1 ; zmiR-20a
TG1 = 4.31×10⁻⁴ pM-1 ; zmiR-20a
TG1 = 4.31×10⁻⁴ pM-1 ;
zmiR-20a
TG2 = 2.06×10⁻⁴ pM-1 ) were used to calculate target concentrations for CHA-TG-FRET
multiplexed assays using the Δ𝐹𝑅𝐸𝑇‑𝑟𝑎𝑡𝑖𝑜 values of the mixed samples (blue data points) and
Equation 4.2. All assays contained all four hairpin probes (H1 and H2 for miR-21 probes, H1 and
H2 for miR-20a – cf. Figure 4.1a and Figure 4.1b) in the same sample.
0 100 200 300 400
0.00
0.02
0.04
0.06
0.08
0.10
0F
RE
T-r
atio
cmiR (pM)0 100 200 300 400
0.00
0.05
0.10
0.15
0.20
0.25
0F
RE
T-r
atio
cmiR (pM)
TG2 (1 ms - 2 ms)
0 1 2 3 4
10
100
1000
PL
inte
nsity (
co
un
ts)
time (ms)
miR-21and
miR-20a
TG1 TG2
0 1 2 3 4
10
100
1000
PL in
ten
sity (
cou
nts
)
time (ms)
miR-20a
TG1 TG2
bTG1 (0. 1 ms - 0. 8 ms)
a
0 1 2 3 4
10
100
1000
PL
in
tensity (
co
un
ts)
time (ms)
TG1
miR-21
TG2D D
miR-21 and miR-20amiR-20amiR-21
miR-21 + miR-20a (sum)
miR-21 and miR-20amiR-20a
miR-21
miR-21 + miR-20a (sum)

93
Figure 4.5 Concentration recovery of miR-21 and miR-20a from 13 samples with different
concentrations of both targets using the duplexed CHA-TG-FRET miRNA assay. Dotted lines
present known concentrations, data point present measured concentrations (error bars represent
standard deviations from two measurements per sample).
4.3.5 MiRNA quantification from human tissue samples
To demonstrate the applicability of CHA-TG-FRET to clinically relevant samples, we
quantified miR-21 and miR-20a in total RNA extracts from arbitrarily selected human
tissue samples (cf. Table 4.2). Both single and duplexed target CHA-TG-FRET as well as
RT-qPCR (for comparison with a standard method) were used to quantify the two miRNAs.
Figure 4.6 shows the concentrations of miR-21 and miR-20a for each sample measured
with the three different methods. Single-target, duplexed, and RT-qPCR all detected very
similar absolute concentrations of both miRNAs without systematic deviation from one to
the other method, which shows that the multiplexed CHA-TG-FRET sensor provided
excellent sensitivity and selectivity for miR-21 and miR-20a even in clinical samples. When
comparing the single target to the duplexed results, one can find significant differences in
samples A and C for miR-21 and in samples D and E for miR-20a. Considering that only
one of the miRNA targets showed different concentrations (whereas the other target showed
1 2 3 4 5 6 7 8 9 10 11 12 13
0
100
200
300
400
cm
iR (
pM
)
sample number
miR-21 miR-20a

94
very similar concentrations for that same sample), we do not believe that these differences
were caused by the duplexing approach but rather by the complex total RNA sample with
many different RNAs (including miRNAs). None of the methods could provide a clear
distinction of the type of tissue (A and B were colon samples; C, D, and E were rectum
samples) or if the tissue was from a tumor (A, C, D) or healthy (B, E). However, this proof-
of-concept experiment with only few arbitrarily selected samples did not aim at a clinical
analysis but rather a demonstration of the capability of CHA-TG-FRET to quantify absolute
concentrations of different miRNAs in a multiplexed format in clinical samples. Taking
into account that the concentrations of miR-21 were much higher than miR-20a (as
expected from the usually well expressed miR-21 in many different types of cancer-related
biological samples [228, 229]), most measured concentrations were significantly above the
LODs of CHA-TG-FRET, and all concentrations corresponded well to the RT-qPCR values,
it can be assumed that the determined concentrations are realistic and multiplexed CHA-
TG-FRET may become a useful complementary tool for miRNA-based clinical diagnostics.
Figure 4.6 Absolute quantification of miR-21 (left) and miR-20a (right) in total RNA extracts from
colon (A, B) and rectum (C, D, E) tissues with (A, C, D) and without (B, E) tumors. Single-target
CHA-TG-FRET (magenta), duplexed CHA-TG-FRET (orange), and RT-qPCR (cyan) led to very
similar concentrations. All concentrations were normalized to the concentrations of total RNA in
the tissue extracts. Picomolar concentrations in the experimental volumes (used for measurements)
and in the total RNA extracts as well as dilution factors (from samples to measurement volumes)
can be found in Table 4.5.
0
3x10⁵
6x10⁵
9x10⁵
miR
-20a p
er
ng o
f to
tal R
NA
0
1x10⁶
2x10⁶
3x10⁶
miR
-21
per
ng o
f to
tal R
NA
A B C D E
Samples (patients) A B C D E
Samples (patients)
co
pie
s p
er
ng
of
tota
l R
NA
co
pie
s p
er
ng
of
tota
l R
NA
CHA-TG-FRET (single)CHA-TG-FRET (duplexed)
RT-qPCR
miR- 21 miR- 20a

95
Table 4.5 Concentrations of miR-21 and miR-20a in the experimental volumes and in the total
RNA extracts and dilution factors used to dilute the total RNA extract samples to measurement
volumes. Total RNA concentrations in copies per ng total RNA are the same as in Figure 4.6.
4.4 Conclusion
The enzyme-free amplification strategy of CHA provides significant advantages for a
simple and cost-effective application in sensitive nucleic acid biosensing. Implementing
Tb-to-dye TG-FRET probes with their benefits of a rapid, separation-free assay format,
absence of sample autofluorescence, and capability of multiplexing, into CHA can further
increase the versatility, rapidity, and simplicity of CHA-based miRNA sensing. To
demonstrate this promising combination, we developed a single FRET-pair CHA-TG-
FRET probe for multiplexed miRNA detection. Tb donors were labeled to the 3’ ends of
the CHA hairpin probes, whereas Cy5.5 acceptors were labeled to specific thymines inside
the probes, which allowed us to tune the Tb-donor to Cy5.5-acceptor distance. Two FRET
probes for miR-21 and miR-20a were designed with specific donor-acceptor distances that
Sample nameDilution factor from
total RNA extract150 µL mix (in pM) Total RNA (in pM)
Total RNA (in copies
per ng total RNA)150 µL mix (in pM) Total RNA (in pM)
Total RNA (in copies
per ng total RNA)
A 60 40 2400 1.3E+06 22 1320 7.4E+05
B 30 63 1890 2.0E+06 6.8 204 2.1E+05
C 30 83 2490 2.6E+06 7.3 219 2.3E+05
D 30 11 330 5.1E+05 7.3 219 3.4E+05
E 30 3.5 105 6.1E+05 1.8 54 3.2E+05
Sample nameDilution factor from
total RNA extract150 µL mix (in pM) Total RNA (in pM)
Total RNA (in copies
per ng total RNA)150 µL mix (in pM) Total RNA (in pM)
Total RNA (in copies
per ng total RNA)
A 30 132 3960 2.2E+06 44 1320 7.4E+05
B 15 134 2010 2.1E+06 14 210 2.2E+05
C 30 111 3330 3.5E+06 7.9 237 2.5E+05
D 15 27 405 6.3E+05 9 135 2.1E+05
E 15 8.8 132 7.7E+05 6 90 5.3E+05
Sample nameDilution factor from
total RNA extract
5 µL (10ng total RNA)
sample (in pM)Total RNA (in pM)
Total RNA (in copies
per ng total RNA)
5 µL (10ng total RNA)
sample (in pM)Total RNA (in pM)
Total RNA (in copies
per ng total RNA)
A 538 7.4 4007 2.2E+06 3.5 1865 1.0E+06B 288 6.5 1885 2.0E+06 0.8 228 2.4E+05C 287 10.3 2968 3.1E+06 0.9 255 2.7E+05D 193 2.2 419 6.5E+05 0.8 159 2.5E+05
E 51 4.9 248 1.4E+06 2.2 113 6.6E+05
RT-qPCR c(miR-21) c(miR-20a)
c(miR-21) c(miR-20a)CHA-TG-FRET
CHA-TG-FRET DUPLEXED c(miR-21) c(miR-20a)

96
resulted in target-specific PL decays of the Cy5.5 FRET acceptors. The different decays
allowed us to use two different TG detection windows for a simple PL intensity
measurement that could specifically quantify the two different miRNA targets from a single
sample with a single measurement and a single FRET pair. The ratiometric CHA-TG-FRET
assays provided high precision, accuracy, reproducibility, and specificity (tested against a
miRNA target with two mismatched nucleotides), low limits of detection (380 40
attomoles for miR-21 and 250 60 attomoles for miR-20a), and the simultaneous
quantification of both miRNAs at different picomolar concentrations from the same sample.
The potential application for clinical studies was demonstrated by quantifying miR-21 and
miR-20a from total RNA extracts of five different human tissue samples (colon and rectum
samples with and without tumors) by single-, duplexed-CHA-TG-FRET and RT-qPCR for
comparison. In comparison to the RT-qPCR, CHA-TG-FRET amplifies signal by recycling
the target, making it much less susceptible to sample cross contamination. CHA-TG-FRET
is also much simpler than RT-qPCR because it requires neither reverse transcription of the
target nor enzymes for amplification. The amplification is isothermal (no thermal cycling
required) and linear (exponential amplification leads to larger errors due to contamination
and non-specific amplification) and multiplexing can be performed in a single sample, with
a single measurement, and a single excitation wavelength. The simple sample preparation
and rapid ratiometric measurement are also advantageous concerning reliability and
accuracy of the results, which are more complicated for RT-qPCR., PCR can provide much
lower detection limits (down to single copies of nucleic acids) than CHA-TG-FRET, which
is certainly advantageous for samples with extremely low target concentrations.
While this proof-of-concept used two different miRNAs as targets for clinical diagnostics
in tissues, it can be extended to other clinical samples, different miRNA targets, different
nucleic acid biomarkers, and higher order multiplexing by using more colors and more
FRET-distances. Together with complementary established and emerging technologies,
CHA-TG-FRET can become a useful method for nucleic acid analysis and quantification
in human samples for biomolecular research and clinical diagnostics.

97
5. MiRNA nano-diagnostics using
HRCA-amplified Tb-to-QD FRET
5.1 Introduction
In the previous chapters, we have shown two sensitive and specific miRNA detection
methods that combine isothermal amplification with Tb-to-Cy5.5 FRET. The utilization of
Tb complexes and dyes as FRET pairs has the benefit of both small donors and acceptors,
which allows for facile conjugation of nucleic acids (FRET probes) and more precise donor-
acceptor distance tuning. Compared to dyes, QDs have superior photophysical properties
that can be effective energy acceptors. Their large absorption cross-sections result in very
large spectral overlap integrals and hence long Förster distances, allowing for significantly
longer FRET distances. Moreover, in color-multiplexing approach, the disadvantage of
organic dyes for FRET applications is their spectral crosstalk, which predominantly results
from the dye emissions of shorter wavelengths into the bandpass filters of longer
wavelength dyes due to the significant overlap between the different dye emission spectra
and needs to render tedious correction of measured signals. On the contrary, narrow and
symmetric emission spectra of QDs favor their multiplexed detection without spectral
crosstalk, and their size tunability enables using several different-sized QD acceptors for
the same donor. In the previous work in our group [200], spectral multiplexed miRNA
diagnostic has been realized by using Tb-to-QD-based FRET. Only 30 min of sample
incubation and 7.5 s of measurement were required to selectively quantify three different
miRNAs. As no amplification technology was used, the main drawback of this sensor is the
relatively low sensitivity. However, the implement of amplification technology with QD-
based FRET sensor is not as straightforward as with dye-based FRET sensor, and only a
few studies on amplified QD-based FRET sensor for miRNA detection assay have been
reported.

98
To date, hyperbranched rolling circle amplification (HRCA) has been widely used for
biosensing various targets, including miRNAs [194, 231], DNAs [232, 233], mutations
[234, 235], proteins [236, 237] and small molecules [238, 239]. By introducing a second
primer complementary to the RCA products, the linear RCA can be converted to HRCA,
which significantly improves the amplification efficiency (~109-fold). Most importantly, it
can generate numerous varying length DNA segments because the HRCA products are
different from the RCA product (which are long and coiled DNA concatemers) [240]. Thus,
QDs with relatively large size can be easier implemented into HRCA product for generating
FRET signal. Few studies [194, 231] demonstrated the integration of HRCA with QD-to-
dyes FRET for miRNAs detection and even realized the simultaneous detection of multiple
miRNAs. However, steady-state measurements contain sample autofluorescence and the
emission from multiple probes cannot be suppressed.
This work integrated TG measurement into HRCA for sensitive miRNA detection, which
provides extremely low background noise, and a quick and simple one-step assay format.
Hsa-miR-21 was selected as target. Target-primed and reverse primer-initiated HRCA
reaction can generate a large amount of single strand DNAs with different lengths. They
can be hybridized with Tb-labeled reporter DNA probes, and then hybridized with the
adaptor DNA probes that are on the surface of the QD via biotin and streptavidin interaction.
The formation of QD-DNA-Tb complexes shorten the distance between Tb and QD,
allowing for Tb-to-QD FRET. The FRET-sensitized QD PL and FRET-quenched Tb PL
within a specific time-window is measured and ratiometric TG-FRET signal is used to
quantify target miRNA. The low LOD (down to attomole) and high selectivity
demonstrated the unprecedented performance of this HRCA-amplified Tb-to-QD FRET
assay.

99
5.2 Materials and methods
5.2.1 Materials
Lumi4-Tb-NHS (Tb-NHS) was provided by Lumiphore Inc. Qdot705 ITK Streptavidin
Conjugate Kit was purchased at Invitrogen by Life Technologies. Sequences and
modifications of all DNA and RNA oligonucleotides are summarized in Table 5.1. All
oligonucleotides were purchased from Eurogentec and purified with HPLC. Zeba Spin
Desalting Columns (7 kDa MWCO) were purchased from Thermo Fisher Scientific.
SplintR ligase, phi29 DNA polymerase, dNTP and nuclease-free water were purchased
from New England Biolabs. Deionized water was purified by Purelab Option-Q equipped
with bio-filter, ELGA LabWater.
Table 5.1 Sequences and modifications of all DNA and RNA probes and targets. Target-specific
termini of padlock DNA shown in blue, reverse primer-specific sequences shown in underline, Tb-
probe-complementary sequences shown in green, and QD-probe-complementary sequences shown
in red.
Probe Sequence 5’-3’ Modification
miR-21 UAG CUU AUC AGA CUG AUG UUG A
miR-20b CAA AGU GCU CAU AGU GCA GGU AG
padlock-21
TGA TAA GCT A GAA AG ACG GAC TCG
CAT TCA CTG TCT AAC AAT ATT GTC TTG
ATT GAA GAC AGA CGA CAG AAC AG TCT
TCA ACA TCA GTC
5’-Phosphate
reverse primer GAC AGA CGA CAG AAC AG
reporter probe
(Tb-probe) AAT CAA GAC AAT ATT GTT 3’ C6 amino
adapter probe
(QD-probe) CAG TGA ATG CGA GTC CGT CT 5’ TEG biotin

100
5.2.2 Optical spectroscopy
Absorption spectra (Lambda 35 UV/Vis System, PerkinElmer) and emission spectra
(SAFAS) for Tb and QD samples were recorded in HEPES buffer (100 mM, pH 7.4) and
hybridization buffer, respectively. All spectra are shown in Figure 5.1.
Figure 5.1 Absorption and emission spectra of the TG-FRET pair. (A) Spectra of Tb emission
(green) that partly overlaps with the absorption of QD705 (red). (B) Emission spectra of Tb (green)
and QD705 (red). Optical bandpass filter transmission spectra, which represent the detection
channels for Tb and QD705, are shown in gray.
5.2.3 HRCA-amplified Tb-to-QD TG-FRET miRNA assays
In a typical assay, 5 nM padlock probe and an appropriate amount of the target miRNA
were prepared in 10 µl optimized SplintR ligase reaction buffer (BUFFER-1, 50 mM Tris-
HCl, 10 mM MgCl2, 100 mM NaCl, 10 µM ATP, 1 mM DTT, pH 7.5), and the mixture
was incubated in a thermal cycler with a temperature control program (80 ℃ for 2 min,
then decreased from 80 ℃ to 22 ℃ with a 2 ℃ min−1 speed). Then, 21.5 U of SplintR
ligase prepared in 5 µl BUFFER-1 was added and incubated at 37 ℃ for 1 h. Afterwards,
35 µl phi29 DNA polymerase reaction buffer (BUFFER-2, 1× buffer components: 50 mM
Tris-Cl, 10 mM MgCl2, 10 mM (NH4)2SO4, 4 mM DTT, pH 7.5), which contained 5 µM
reverse primer, 5 U of phi29 DNA polymerase and 0.2 mM dNTP, was added and incubated
at 37 ℃ for 2 h. After polymerization and reverse transcription process, 20 nM reporter
probe (Tb-DNA conjugate) prepared in 50 µl hybridization buffer (BUFFER-3, 20 mM
101
Tris-Cl, 500 mM NaCl, 0.1% BSA, pH 8.0) was added and then incubated in a thermal
cycler with a temperature control program (80 ℃ for 2 min, then 65 ℃ for 10 min, then
decreased from 65 ℃ to 22 ℃ with a 2 ℃ min−1 speed). Upon termination of hybridization
between reporter probe and HRCA product, 50 µl 10 nM adapter probe (QD-sAv-Biot-
DNA conjugate, which was prepared in advance by mixing 0.5 nM streptavidin-conjugated
ITK Qdot705 with 10 nM biotinylated DNA in BUFFER-3 at room temperature for 30 min)
was added and incubated at room temperature for 30 min. From 150 µl total reaction
volume, 140 µl were measured in black 96-well microtiter plates on KRYPTOR compact
plus (Thermo Fisher Scientific) with time-gated (0.1 to 0.9 ms) PL intensity detection using
optical bandpass filters (Semrock) with 494 ± 12 nm for the Tb detection channel and 716
± 20 nm for the QD705 detection channel. For ratiometric analysis, FRET-ratios were
calculated by the ratio of QD705 and Tb time-gated PL intensities.
5.2.4 Statistical analysis
For statistical analysis and the estimation of LODs, all samples were prepared 3 times and
measured in triplicates (𝑛 = 9). The zero concentration samples (without target miRNAs)
were prepared 5 times and measured in triplicates (𝑛 = 15).
5.2.5 Gel Electrophoresis
8% polyacrylamide gel was prepared (7.9 ml deionized water, 4 ml 30% acrylamide, 3 ml
pH 8.0 5× TBE buffer, 0.11 ml 10% ammonium peroxodisulfate and 20 µl TEMED). 10 μl
portion of each sample was loaded into the lane, and electrophoresis was performed on a
Mini-PROTEAN Tetra electrophoresis system (Bio-Rad) at a constant potential of 200 V
for 20 min with 0.5× TBE (pH 8.0) as running buffer. SYBR green I (Thermo Fisher) was
used as DNA stain. The gel was visualized under UV light.

102
5.3 Results and discussion
5.3.1 Principle of HRCA-amplified TG-FRET
The principle of miRNA detection by HRCA-amplified TG-FRET is shown in Figure 5.2.
We designed padlock-DNA template using miR-21 as target and one reverse primer for
HRCA (Table 5.1). First, target miR-21 is specifically hybridized by the two ends of the
linear padlock-DNA that circularizes upon target recognition. Then, the padlock nick is
ligated over the target splint, which makes the target a primer for a polymerase to synthesize
complementary DNA around the circular probe DNA, producing a long DNA strand with
repeated sequences (rolling circle product). Meanwhile, the reverse primer may specifically
bind to the complementary region of the RCA product to initiate the HRCA reaction. It
produces large amounts of single-stranded DNAs with various lengths, which can hybridize
with Tb-labeled reporter probes (donor DNA probes) and QD705-sAv-Biot-DNA adapter
probes (acceptor DNA probes). The close distance of Tb and QD705 allows for Tb-to-
QD705 FRET, which is not possible if both are free in solution (no hybridized to HRCA
product). Ratiometric TG-FRET signal is used to quantify target miRNA, which measures
the ratio of FRET-sensitized QD705 PL and FRET-quenched Tb PL within a specific time-
window after pulsed excitation (to suppress autofluorescence).

103
Figure 5.2 The principle of miRNA detection by HRCA-amplified TG-FRET. (A) After specific
recognition of miRNA by a linear padlock-DNA, the padlock-DNA nick is ligated over the miRNA
target splint using SplintR ligase, and the miRNA becomes a primer for a phi29 polymerase to
synthesize and displace complimentary DNA around the circularized padlock-DNA, producing a
long DNA strand (RCA product). The reverse primers specifically bind to the complementary
region of the RCA product to initiate the HRCA reaction, producing large amounts of single-
stranded DNAs with various lengths (HRCA products). The HRCA products are incubated with
Tb donor (reporter ssDNA probes labeled with Tb) and QD705 acceptor DNA probes (adapter
ssDNA probes conjugated to QD705 via streptavidin-biotin interaction), and the close distance of
Tb and QD705 allows for Tb-to-QD705 FRET. Thus, the TG-FRET signal can be used for
quantifying miRNA without any washing or separation steps. (B) Ratiometric TG-FRET, which
measures the ratio of FRET-sensitized QD705 PL and FRET-quenched Tb PL within a specific
time-window after pulsed excitation (to suppress autofluorescence), is used to quantify the miRNA
target in a 140 µl microwell. Black/blue decay curves present signals without/with target miRNA.
The FRET-sensitized QD-acceptor intensity strongly increases with the presence of target, whereas

104
the overall Tb-donor signal is not significantly quenched (also free Tb DNA probes in solution
emit PL).
5.3.2 Feasibility of HRCA-amplified TG-FRET
To verify the products of the HRCA products, we performed gel electrophoresis (Figure
5.3). The gel showed two main bands, one for the padlock-DNA and another for the HRCA
products. Lane 1 only contained the padlock-DNA without any HRCA steps as control.
Lane 2 contained the padlock and reverse primer, and HRCA steps were performed as the
description in Section 5.2.3 in the absence of miR-21. Notably, for the same padlock-DNA,
the molecular weight in lane 1 (weak band around 100 bp, DNA ladder marker as control
in lane M) was different than in lane 2 (weak band around 75 bp). This difference was
caused by the differences in padlock conformation. Lane 1 contains only the padlock and
self-hybridization within the padlock sequence can make the DNA slightly more coiled or
and/or less charged such that it migrates less in the gel. In lane 2, the RCA step heated and
then slowly cooled down the padlock, such that the padlock conformation was opened to
better hybridize to the target. This “actual” ssDNA conformation of the padlock should
therefore be closer to its actual sequence length. In the presence of padlock and miR-21 but
absence of reverse primer (lane 3), a strong band with high molecular weight appeared,
which presents the long ssDNA RCA product. When padlock, miR-21, and the reverse
primer were present (lane 4), a broad band with different molecular weights became visible,
indicating the miRNA-specific formation of HRCA ssDNA products of different lengths.

105
Figure 5.3 Electrophoresis gel for DNA ladder marker (lane M), padlock (lane 1), HRCA product
in the absence (lane 2) and presence (lane 4) of target miR-21, HRCA product in the absence of
reverse primer (lane 3).
We further measured the time-resolved PL decay curves of FRET-sensitized QD705 and
FRET-quenched Tb (Figure 5.4A) with different target miR-21 concentrations (between 0
pM and 500 pM). With increasing miR-21 concentrations, the intensities of FRET-
sensitized QD705 significantly increased and the intensities of FRET-quenched Tb slightly
decreased, which confirms the target concentration-dependent HRCA production and the
possibility for miRNA quantification. Figure 5.4B shows the calibration curve of miR-21
over a larger concentration range which spanned around 2 orders of magnitude (from 3 pM
to 500 pM) to assess the dynamic range of HRCA-amplified TG-FRET assays. The
ratiometric PL intensity (FRET-ratio) increases as a function of miR-21 concentration in
that concentration range and shows a linear correlation with the miR-21 concentration in
the range from 0 pM to ~10 pM. In Chapter 3, we presented a RCA-amplified TG-FRET
technology for absolute quantification of miRNAs (miR-21, miR-132 and miR-146a).
Compared to the quadratic calibration curve, the linear calibration curve (in the lower
concentration range) of this study provides the capability of multiplexed miRNA detection
from a single sample.

106
Figure 5.4 (A) Time-resolved PL decay curves of FRET-sensitized QD705 and FRET-quenched
Tb, and (B) calibration curve of miR-21 over a lager concentration range from 0 pM to 500 pM
within 140 µl solutions per microwell.
5.3.3 Optimization of HRCA-amplified TG-FRET
We optimized the experimental conditions including the concentrations of padlock and
reverse primer, HRCA reaction time, and concentration ratio of adapter probes per QD705.
As shown in Figure 5.5A, the relative FRET-ratio improved with increasing concentration
of padlock from 0.1 to 5 nM, whereas it decreased at the concentration of 50 nM. A high
concentration of padlock can lead to high HRCA efficiency, but the excess padlock may
hybridize with RCA products, adapter probes and reporter probes. This might increase the
HRCA background signal and prevent the formation of Tb-DNA-QD705 complexes that
are the prerequisite for FRET. In contrast, a low concentration of padlock can decrease the
background, but it might induce low amplification efficiency due to the lack of padlock
templates. Thus, 5 nM was selected as the optimum concentration of padlock for HRCA
reaction. For the concentration of reverse primers, the FRET-ratio significantly increased
at a concentration of 5 µM, followed by a decrease at higher concentration (Figure 5.5B),
which was most probably caused by primer dimerization and nonspecific amplification.
Thus, 5 µM reverse primer was selected as the optimum concentration for subsequent
experiments. Then we optimized the HRCA reaction time, and the results showed that the
relative FRET-ratio value increased with increasing reaction time (Figure 5.5C). As a
compromise between high but not too long amplification, we selected 2h as the HRCA

107
reaction time for subsequent experiments. As shown in Figure 5.5D, the relative FRET-
ratio increased when the concentration ratio between adapter probe and QD705 increased
from 1:1 to 20:1, but it tended to saturate beyond the ratio of 20:1 and even decrease for
60:1. Thus, 20:1 (10 nM : 0.5 nM) was used as the optimum concentration ratio between
adapter probe and QD705.
Figure 5.5 Optimization for padlock concentration (A), reverse primer concentration (B), HRCA
reaction time (C) and concentration ratio between adapter probe and QD705 (adapter probe:QD705)
(D) in the presence of 50 pM miR-21.

108
5.3.4 Sensitivity and specificity
Under the optimized experimental conditions, I further investigated the sensitivity of the
proposed method for miR-21 quantification. To quantify miRNA, TG PL intensities (ITG)
of the QD705 acceptor and Tb donor were determined in a specific time window (from the
corresponding PL decay curves between 0.1 and 0.9 ms). These TG PL intensities were
then used to calculate a Δ𝐹𝑅𝐸𝑇‑𝑟𝑎𝑡𝑖𝑜 (the FRET-ratio subtracted by the FRET-ratio
without target) for each target concentration 𝑐 = 𝑥 (Equation 5.1):
Δ𝐹𝑅𝐸𝑇‑𝑟𝑎𝑡𝑖𝑜 =𝐼𝑄𝐷705
𝑇𝐺 (𝑐=𝑥)
𝐼𝑇𝑏𝑇𝐺(𝑐=𝑥)
−𝐼𝑄𝐷705
𝑇𝐺 (𝑐=0)
𝐼𝑇𝑏𝑇𝐺(𝑐=0)
(5.1)
The concentration-dependent Δ𝐹𝑅𝐸𝑇‑𝑟𝑎𝑡𝑖𝑜 values were used to determine the calibration
curves for the miRNA target. The calibration curve (Figure 5.6A) showed increasing
Δ𝐹𝑅𝐸𝑇‑𝑟𝑎𝑡𝑖𝑜 values with increasing miR-21 concentrations in a concentration range
between 0 pM and 15 pM. The LOD was estimated (three standard deviations over the
blank sample calculated from n = x measurements) to be 11 ± 4 attomole (80 ± 30 fM).
The target specificity of HRCA-amplified TG-FRET was evaluated against miR-20b
(Figure 5.6B). Concentration-dependent increasing Δ𝐹𝑅𝐸𝑇‑𝑟𝑎𝑡𝑖𝑜 values exclusively
occured for target miR-21. Taking into account our previous study on specificity of RCA-
amplified TG-FRET miRNAs detection in Chapter 3, it showed excellent specificity
against precursor miRNA (pre-miRNA) and miRNAs with single nucleotide variations. The
versatility of the padlock design can overcome the mismatch-caused positive offset.
Besides, the 3’ to 5’ exonucleolytic activity and highly accurate replication of phi29 DNA
polymerase can also correct errors caused by incorporation of mismatched
deoxyribonucleotides as well as pre-miRNAs which have two 3’ and 5’ overhangs. Overall,
HRCA-amplified TG-FRET quantification of miRNA provided excellent performance
concerning sensitivity and specificity.

109
Figure 5.6 (A) Assay calibration curve showed linearly increasing Δ𝐹𝑅𝐸𝑇‑𝑟𝑎𝑡𝑖𝑜 values (the
FRET-ratio subtracted by the FRET-ratio without target) over target miR-21 concentration with a
LOD of 11 ± 4 attomole (80 ± 30 fM). (B) Target specificity was demonstrated against various
amounts of miR-20b.
5.4 Conclusion
In summary, we have demonstrated a nanosensor with the integration of HRCA and TG-
FRET for sensitive detection of miRNA based on QD as acceptor and Tb as donor. The
exponential amplification efficiency of HRCA and the autofluorescence-suppressed TG-
FRET measurement ensure the high sensitivity with a detection limit of 11 ± 4 attomole
(80 ± 30 fM) for the target hsa-miR-21. In addition, the versatility of the target miRNA-
specific padlock design that can overcome the mismatch-caused positive offset and the
specific hybridization of HRCA products with both capture probes and reporter probes
guarantee the high selectivity of the proposed method. More importantly, it has great
potential for multiplexing miRNA diagnostics because of the flexible design of padlocks
toward different miRNAs and the multiplexing capability of QDs without any crosstalk
corrections. As the proposed proof-of-concept is a promising and ongoing project, in which
the multiplexing adaption to actual clinical samples remained to be demonstrated, we
expect that the proposed HRCA-amplified Tb-to-QD nanosensor can become a very useful
alternative to current miRNA diagnostic approaches.

110
6. Summary and outlook
This thesis presents three successful LTCs-based FRET biosensors for miRNA biomarker
diagnostics based on isothermal amplification methods and TG measurements. To
overcome the analytical challenges arising from the unique characteristics of miRNAs
(small size, low abundance, sequence similarity, etc.), three different isothermal
amplification methods (RCA, CHA, HRCA) were exploited and carefully designed into
individual biosensors. TG measurement in combination with long-lived LTCs as donor and
short-lived Cy5.5 or QD as acceptors was used to avoid the background interferences
including auto-fluorescence of the biological matrix as well as the light scattering from the
excitation source. By collecting both FRET-sensitized and FRET-quenched donor PL
intensities from individual detection channels, the ratiometric output (the ratio of the time-
gated PL intensities of the FRET-sensitized acceptor and FRET-quenched donor) was
calculated to quantify the target miRNAs. All of these biosensors provide a homogeneous
and one-step assay format, and benefits of sensitivity, selectivity, simplicity, and robustness.
All assays were designed to be detected on a clinically approved fluorescence plate reader,
which allows the analysts to perform direct clinical application without introducing new
instruments.
In the first work, we took the advantages of RCA method, developing an extremely
sensitive and specific biosensor for quantifying miRNAs, which was verified to have better
performance than TaqMan RT-qPCR. By altering the design of the padlocks toward
different miRNAs (miR-21, miR-132 and miR-146a), three miRNAs-specific RCA-
amplified biosensors were constructed based on the same strategy, demonstrating the
flexibility and versatility of this concept. More importantly, the ability to quantify different
miRNAs from various types of clinically relevant samples (human plasma, tissues, and
cells), and to obtain significant pathological information from these measurements, indicate
that this strategy can be used for advanced miRNA-based diagnostics and research. In
another study [171], multiplexing detection for DNAs was realized based on the same

111
strategy. We combined spectral multiplexing (by introducing different dyes) with temporal
multiplexing (by tuning the distances between Tb-to-different dyes), and realized high-
order multiplexed detection for four different DNAs.
As the defined structure of dsDNA and the site-specific modifications are available for
nucleic acids, it is more straightforward to locate small molecular FRET pairs (LTCs or
dyes) and control their distances, which is highly important for temporal multiplexing. In
the second work, temporal multiplexed miRNAs detection was achieved by tuning the Tb-
to-Cy5.5 distances in two distinct signaling duplexes, resulting in distinct PL decay times
of the same FRET pair. We selected two different TG windows to collect PL intensities that
fulfill the following prerequisites: i) different target miRNAs have distinct contributions,
and ii) there are enough photons in the selected time windows to provide sensitive
determination of the targets. The contributions of different miRNAs in different TG
windows were deconstructed by a simple matrix calculation, realizing the simultaneous
quantification of two distinct miRNAs in a single sample. Unlike other multiplexing
strategies that utilize different parameters (e.g., different colors or polarizations), the
proposed biosensor only needs one single measurement to distinguish different miRNAs,
which will decrease the consumption of analytical reagents and the amounts of clinical
samples needed. However, compared to other two-enzyme-involved amplified (RCA,
HRCA) biosensors, this CHA-amplified biosensor suffers from the relatively lower
sensitivity. While it is still sufficient to detect directly in tissue samples, the lower
sensitivity limits its application in plasma samples that contain extremely low amounts of
miRNAs. Nevertheless, it is superior in simplify, rapidity, cost-effectiveness, and
multiplexing capability.
QDs are excellent FRET acceptor candidates owing to their intrinsic photophysical
properties. Especially, their narrow emission bands and size-tunable emission peaks make
them superior in multiplexing then dyes. In the third work, we developed a HRCA-
amplified nanosensor based on Tb-to-QD FRET. Unfortunately, the implementation of
amplification technology with QD-based FRET sensor is not as straightforward as with

112
dye-based FRET sensor. The compatibility and affinity effectiveness of amplified DNA
products and QD are uncertain and often unpredictable. For realizing a sensitive detection
we tried different strategies, such as using various endonucleases for obtaining different
formats of amplified DNA products, QDs with different size, different padlocks and
experimental conditions and, not all attempts could led to the expected results. Nevertheless,
I finally managed to develop a highly sensitive miRNA assay based on Tb-to-QD FRET
and HRCA. The proof-of-concept was successful but further steps, such as actrual
multiplexing and adaption to real clinical samples, are still necessary to translate this
nanosensor into clinical diagnostics. Nevertheless, it presents a promising alternative for
sensitive miRNA diagnostic and has a strong potential to achieve spectral multiplexing with
several different QD colors, or even high-order spectrotemporal multiplexing by tuning
distances between each Tb-to-QD FRET pair.

113
7. Appendix
7.1 Abbreviations
miRNA microRNA
RT-qPCR reverse transcription quantitative polymerase chain reaction
NGS next-generation sequencing
ISH in situ hybridization
NB northern blotting
LTCs luminescent Tb complexes
FRET Förster resonance energy transfer
TG-FRET time-gated FRET
QD quantum dot
PL photoluminescence
RCA rolling circle amplification
LOD limit of detection
THP-1 cells acute monocytic leukemia cells
CHA catalytic hairpin assembly
HRCA hyperbranched rolling circle amplification
PCR polymerase chain reaction
cDNA complementary DNA
ssDNA single-stranded DNA
dsDNA double-stranded DNA
DSNSA duplex-specific nuclease signal amplification
LAMP loop-mediated isothermal amplification
SDA strand-displacement amplification
HCR hybridization chain reaction
MB molecular beacon
BPs binary probes

114
LLCs luminescent lanthanide complexes
NHS N-hydroxysuccinimide
VB valence band
CB conduction band
pre-miRNA precursor miRNA
Tb Lumi4-Tb
RCP rolling circle product
LPS lipopolysaccharide
7.2 Instrument
Time-resolved FRET measurements were performed by two fluorescence plate readers.
Figure 7.1a is a modified KRYPTOR compact PLUS (Thermo Fisher Scientific, France)
using 500 detection bins of 2 μs integration time. The system has an integrated pulsed
nitrogen laser with an excitation wavelength of 337 nm and a repetition rate of 20 Hz.
Figure 7.1b is a prototype from Edinburgh Instruments (UK) developed during a joined
project and referred in this work as plate reader. The system allows time-resolved FRET
assay measurements using 4000 detection bins of 2 μs integration time. The excitation
source was a pulsed nitrogen laser (MNL 100, LTB Berlin) with an excitation wavelength
of 337 nm and a repetition rate of 20 Hz.
The instrumental construction for all used plate readers is shown in Figure 7.1c. After
sample excitation, a dichroic mirror is used to separate the emission signals from the sample
into two individual detection channels. This separation allows the simultaneous
measurement of the FRET acceptor signals (ChA) and the FRET donor signals (ChD) using
two photomultiplier tubes (PMTs). A further selection of the emission wavelengths inside
the channels is obtained by the use of bandpass filters (Semrock), which are optimized for
the emission detection of the LTCs and for the Cy5.5 dyes or QD.

115
Figure 7.1 Two fluorescence plate readers used in this thesis. (a) Modified KRYPTOR compact
plus (Thermo Fisher Scientific. (b) Prototype from Edinburgh Instruments developed during a
joined project. (c) Simplified schematic instrumental construction.

116
8. Bibliography
[1] B. Wightman, I. Ha, and G. Ruvkun, “Posttranscriptional regulation of the
heterochronic gene lin-14 by lin-4 mediates temporal pattern formation in C. elegans,”
Cell, vol. 75, no. 5, pp. 855–862, 1993.
[2] J. Winter, S. Jung, S. Keller, R. I. Gregory, and S. Diederichs, “Many roads to
maturity: MicroRNA biogenesis pathways and their regulation,” Nat. Cell Biol., vol.
11, no. 3, pp. 228–234, 2009.
[3] M. Ha and V. N. Kim, “Regulation of microRNA biogenesis,” Nat. Rev. Mol. Cell
Biol., vol. 15, no. 8, pp. 509–524, 2014.
[4] S. Lin and R. I. Gregory, “MicroRNA biogenesis pathways in cancer,” Nat. Rev.
Cancer, vol. 15, no. 6, pp. 321–333, 2015.
[5] R. M. Graybill and R. C. Bailey, “Emerging Biosensing Approaches for microRNA
Analysis,” 2016.
[6] H. Dong, J. Lei, L. Ding, Y. Wen, H. Ju, and X. Zhang, “MicroRNA: Function,
detection, and bioanalysis,” Chem. Rev., vol. 113, no. 8, pp. 6207–6233, 2013.
[7] B. C. Bernardo, F. J. Charchar, R. C. Y. Lin, and J. R. Mcmullen, “A MicroRNA
Guide for Clinicians and Basic Scientists : Background and Experimental
Techniques,” "Heart, Lung Circ., vol. 21, no. 3, pp. 131–142, 2012.
[8] G. A. Calin and C. M. Croce, “MicroRNA signatures in human cancers,” Nat. Rev.
Cancer, vol. 6, no. 11, pp. 857–866, 2006.
[9] A. Esquela-Kerscher and F. J. Slack, “Oncomirs - MicroRNAs with a role in cancer,”
Nat. Rev. Cancer, vol. 6, no. 4, pp. 259–269, 2006.

117
[10] N. Pencheva and S. F. Tavazoie, “Control of metastatic progression by microRNA
regulatory networks,” Nat. Cell Biol., vol. 15, no. 6, pp. 546–554, 2013.
[11] J. M. Raser and E. K. O’Shea, “Control of stochasticity in eukaryotic gene
expression,” Science, vol. 304, no. 5678, pp. 1811–1814, 2004.
[12] F. Tang, P. Hajkova, S. C. Barton, K. Lao, and M. A. Surani, “MicroRNA expression
profiling of single whole embryonic stem cells,” Nucleic Acids Res., vol. 34, no. 2,
pp. 1–7, 2006.
[13] J. Lu et al., “MicroRNA expression profiles classify human cancers,” Nature, vol.
435, no. 7043, pp. 834–838, 2005.
[14] X. Chen et al., “Characterization of microRNAs in serum: A novel class of
biomarkers for diagnosis of cancer and other diseases,” Cell Res., vol. 18, no. 10, pp.
997–1006, 2008.
[15] P. S. Mitchell et al., “Circulating microRNAs as stable blood-based markers for
cancer detection,” Proc. Natl. Acad. Sci. U. S. A., vol. 105, no. 30, pp. 10513–10518,
2008.
[16] K. Wang, S. Zhang, J. Weber, D. Baxter, and D. J. Galas, “Export of microRNAs and
microRNA-protective protein by mammalian cells,” Nucleic Acids Res., vol. 38, no.
20, pp. 7248–7259, 2010.
[17] J. D. Arroyo et al., “Argonaute2 complexes carry a population of circulating
microRNAs independent of vesicles in human plasma,” Proc. Natl. Acad. Sci. U. S.
A., vol. 108, no. 12, pp. 5003–5008, 2011.
[18] J. Skog et al., “Glioblastoma microvesicles transport RNA and proteins that promote
tumour growth and provide diagnostic biomarkers,” Nat. Cell Biol., vol. 10, no. 12,
pp. 1470–1476, 2008.

118
[19] Y. Zhang et al., “Secreted Monocytic miR-150 Enhances Targeted Endothelial Cell
Migration,” Mol. Cell, vol. 39, no. 1, pp. 133–144, 2010.
[20] M. P. Caby, D. Lankar, C. Vincendeau-Scherrer, G. Raposo, and C. Bonnerot,
“Exosomal-like vesicles are present in human blood plasma,” Int. Immunol., vol. 17,
no. 7, pp. 879–887, 2005.
[21] H. Valadi, K. Ekström, A. Bossios, M. Sjöstrand, J. J. Lee, and J. O. Lötvall,
“Exosome-mediated transfer of mRNAs and microRNAs is a novel mechanism of
genetic exchange between cells,” Nat. Cell Biol., vol. 9, no. 6, pp. 654–659, 2007.
[22] M. Weiland, X. H. Gao, L. Zhou, and Q. S. Mi, “Small RNAs have a large impact:
Circulating microRNAs as biomarkers for human diseases,” RNA Biol., vol. 9, no. 6,
pp. 850–859, 2012.
[23] N. Rosenfeld et al., “MicroRNAs accurately identify cancer tissue origin,” Nat.
Biotechnol., vol. 26, no. 4, pp. 462–469, 2008.
[24] S. L. Yu et al., “MicroRNA Signature Predicts Survival and Relapse in Lung Cancer,”
Cancer Cell, vol. 13, no. 1, pp. 48–57, 2008.
[25] G. A. Calin et al., “Human microRNA genes are frequently located at fragile sites
and genomic regions involved in cancers,” PNAS, vol. 101, no. 9, pp. 2999–3004,
2004.
[26] J. Wang, J. Chen, and S. Sen, “MicroRNA as Biomarkers and Diagnostics,” J. Cell.
Physiol., vol. 231, no. 1, pp. 25–30, 2016.
[27] M. Esteller, “Non-coding RNAs in human disease,” Nat. Rev. Genet., vol. 12, no. 12,
pp. 861–874, 2011.

119
[28] G. A. Calin et al., “MicroRNA Profiling Reveals Distinct Signatures in B Cell
Chronic Lymphocytic Leukemias,” PNAS, vol. 101, no. 32, pp. 11755-11760, 2004.
[29] M. V. Iorio et al., “MicroRNA gene expression deregulation in human breast cancer,”
Cancer Res., vol. 65, no. 16, pp. 7065–7070, 2005.
[30] N. Yanaihara et al., “Unique microRNA molecular profiles in lung cancer diagnosis
and prognosis,” Cancer Cell, vol. 9, no. 3, pp. 189–198, 2006.
[31] M. V. Iorio et al., “MicroRNA signatures in human ovarian cancer,” Cancer Res.,
vol. 67, no. 18, pp. 8699–8707, 2007.
[32] K. P. Porkka, M. J. Pfeiffer, K. K. Waltering, R. L. Vessella, T. L. J. Tammela, and
T. Visakorpi, “MicroRNA expression profiling in prostate cancer,” Cancer Res., vol.
67, no. 13, pp. 6130–6135, 2007.
[33] J. Wang and S. Sen, “MicroRNA functional network in pancreatic cancer: From
biology to biomarkers of disease,” J. Biosci., vol. 36, no. 3, pp. 481–491, 2011.
[34] Y. H. Lee and G. G. Song, “Circulating microRNAs (cmiRNAs) as novel potential
biomarkers for hepatocellular carcinoma,” Neoplasma, vol. 60, no. 5, pp. 607–616,
2013.
[35] X. J. Chen et al., “Clinical value of integrated-signature miRNAs in colorectal cancer:
miRNA expression profiling analysis and experimental validation,” Oncotarget, vol.
6, no. 35, pp. 37544–37556, 2015.
[36] S. A. Melo et al., “A TARBP2 mutation in human cancer impairs microRNA
processing and DICER1 function,” Nat. Genet., vol. 41, no. 3, pp. 365–370, 2009.

120
[37] M. S. Kumar, J. Lu, K. L. Mercer, T. R. Golub, and T. Jacks, “Impaired microRNA
processing enhances cellular transformation and tumorigenesis,” Nat. Genet., vol. 39,
no. 5, pp. 673–677, 2007.
[38] D. A. Hill et al., “DICER1 mutations in familial pleuropulmonary blastoma,” Science,
vol. 325, no. 5943, p. 965, 2009.
[39] S. A. Melo et al., “A genetic defect in exportin-5 traps precursor MicroRNAs in the
nucleus of cancer cells,” Cancer Cell, vol. 18, no. 4, pp. 303–315, 2010.
[40] J. T. Huang, J. Wang, V. Srivastava, S. Sen, and S. M. Liu, “MicroRNA machinery
genes as novel biomarkers for cancer,” Front. Oncol., vol. 4 MAY, no. May, pp. 1–
10, 2014.
[41] M. Matsuoka and M. Ashikari, “A quantitative trait locus regulating rice grain width,”
Nat. Genet., vol. 39, no. 5, pp. 583–584, 2007.
[42] Y. Hu, W. Lan, and D. Miller, “Bioinformatics in MicroRNA Research, Methods in
Molecular Biology,” vol. 1617, pp. 169–177, 2017.
[43] V. S. Nair, L. S. Maeda, and J. P. A. Ioannidis, “Clinical outcome prediction by
MicroRNAs in human cancer: A systematic review,” J. Natl. Cancer Inst., vol. 104,
no. 7, pp. 528–540, 2012.
[44] J. A. Chan, A. M. Krichevsky, and K. S. Kosik, “MicroRNA-21 is an antiapoptotic
factor in human glioblastoma cells,” Cancer Res., vol. 65, no. 14, pp. 6029–6033,
2005.
[45] F. Meng, R. Henson, H. Wehbe-Janek, K. Ghoshal, S. T. Jacob, and T. Patel,
“MicroRNA-21 Regulates Expression of the PTEN Tumor Suppressor Gene in
Human Hepatocellular Cancer,” Gastroenterology, vol. 133, no. 2, pp. 647–658,
2007.

121
[46] S. Zhu, M. L. Si, H. Wu, and Y. Y. Mo, “MicroRNA-21 targets the tumor suppressor
gene tropomyosin 1 (TPM1),” J. Biol. Chem., vol. 282, no. 19, pp. 14328–14336,
2007.
[47] J. R. M. Sophie Mokas et al., “Uncoupling Stress Granule Assembly and Translation
Initiation Inhibition,” Mol. Biol. Cell, vol. 20, no. August, pp. 2673–2683, 2009.
[48] P. P. Medina, M. Nolde, and F. J. Slack, “OncomiR addiction in an in vivo model of
microRNA-21-induced pre-B-cell lymphoma,” Nature, vol. 467, no. 7311, pp. 86–
90, 2010.
[49] B. J. Reinhart et al., “The 21-nucleotide let-7 RNA regulates developmental timing
in Caenorhabditis elegans,” Nature, vol. 403, no. 6772, pp. 901–906, 2000.
[50] G. Adrian et al., “Human MicroRNA Genes Are Frequently Located at Fragile Sites
and Genomic Regions Involved in Cancers,” PNAS, vol. 101, no. 9, pp. 2999–3004,
2004.
[51] S. M. Johnson et al., “RAS is regulated by the let-7 microRNA family,” Cell, vol.
120, no. 5, pp. 635–647, 2005.
[52] I. Medicine, “MicroRNAs in medicine,” In Medicine. 2008.
[53] H. M. Heneghan, N. Miller, R. Kelly, J. Newell, and M. J. Kerin, “Systemic miRNA‐
195 Differentiates Breast Cancer from Other Malignancies and Is a Potential
Biomarker for Detecting Noninvasive and Early Stage Disease,” Oncologist, vol. 15,
no. 7, pp. 673–682, 2010.
[54] J. Wang et al., “MicroRNAs in plasma of pancreatic ductal adenocarcinoma patients
as novel blood-based biomarkers of disease,” Cancer Prev. Res., vol. 2, no. 9, pp.
807–813, 2009.

122
[55] Z. Huang, D. Huang, S. Ni, Z. Peng, W. Sheng, and X. Du, “Plasma microRNAs are
promising novel biomarkers for early detection of colorectal cancer,” Int. J. Cancer,
vol. 127, no. 1, pp. 118–126, 2010.
[56] L. Mengual, J. J. Lozano, M. Ingelmo-Torres, C. Gazquez, M. J. Ribal, and A.
Alcaraz, “Using microRNA profiling in urine samples to develop a non-invasive test
for bladder cancer,” Int. J. Cancer, vol. 133, no. 11, pp. 2631–2641, 2013.
[57] J. Wang et al., “Next generation sequencing of pancreatic cyst fluid microRNAs from
low grade-benign and high grade-invasive lesions,” Cancer Lett., vol. 356, no. 2, pp.
404–409, 2015.
[58] J. Wang et al., “Circulating microRNAs in pancreatic juice as candidate biomarkers
of pancreatic cancer,” J. Cancer, vol. 5, no. 8, pp. 696–705, 2014.
[59] L. Xing, N. W. Todd, L. Yu, H. Fang, and F. Jiang, “Early detection of squamous
cell lung cancer in sputum by a panel of microRNA markers,” Mod. Pathol., vol. 23,
no. 8, pp. 1157–1164, 2010.
[60] L. B. Nielsen et al., “Circulating levels of MicroRNA from children with newly
diagnosed type 1 diabetes and healthy controls: Evidence that miR-25 associates to
residual beta-cell function and glycaemic control during disease progression,” Exp.
Diabetes Res., vol. 2012, 2012.
[61] Y. Liu et al., “The role of circulating microRNA-126 (miR-126): A novel biomarker
for screening prediabetes and newly diagnosed type 2 diabetes mellitus,” Int. J. Mol.
Sci., vol. 15, no. 6, pp. 10567–10577, 2014.
[62] Z. Yang et al., “Serum miR-23a, a potential biomarker for diagnosis of pre-diabetes
and type 2 diabetes,” Acta Diabetol., vol. 51, no. 5, pp. 823–831, 2014.

123
[63] C. Zhao et al., “Early second-trimester serum miRNA profiling predicts gestational
diabetes mellitus,” PLoS One, vol. 6, no. 8, 2011.
[64] X. Cao, G. Yeo, A. R. Muotri, T. Kuwabara, and F. H. Gage, “Noncoding RNAs in
the Mammalian Central Nervous System,” Annu. Rev. Neurosci., vol. 29, no. 1, pp.
77–103, 2006.
[65] C. Zhao, G. Sun, S. Li, and Y. Shi, “A feedback regulatory loop involving
microRNA-9 and nuclear receptor TLX in neural stem cell fate determination,” Nat.
Struct. Mol. Biol., vol. 16, no. 4, pp. 365–371, 2009.
[66] G. M. Schratt et al., “A brain-specific microRNA regulates dendritic spine
development,” Nature, vol. 439, no. 7074, pp. 283–289, 2006.
[67] M. F. Mehler and J. S. Mattick, “Noncoding RNAs and RNA editing in brain
development, functional diversification, and neurological disease,” Physiol. Rev., vol.
87, no. 3, pp. 799–823, 2007.
[68] W. X. Wang et al., “The expression of microRNA miR-107 decreases early in
Alzheimer’s disease and may accelerate disease progression through regulation of β-
site amyloid precursor protein-cleaving enzyme 1,” J. Neurosci., vol. 28, no. 5, pp.
1213–1223, 2008.
[69] R. Margis, R. Margis, and C. R. M. Rieder, “Identification of blood microRNAs
associated to Parkinsonós disease,” J. Biotechnol., vol. 152, no. 3, pp. 96–101, 2011.
[70] L. E. Philippen, E. Dirkx, P. A. da Costa-Martins, and L. J. De Windt, “Non-coding
RNA in control of gene regulatory programs in cardiac development and disease,” J.
Mol. Cell. Cardiol., vol. 89, pp. 51–58, 2015.
[71] A. Zampetaki and M. Mayr, “MicroRNAs in vascular and metabolic disease,” Circ.
Res., vol. 110, no. 3, pp. 508–522, 2012.

124
[72] S. P. R. Romaine, M. Tomaszewski, G. Condorelli, and N. J. Samani, “MicroRNAs
in cardiovascular disease: An introduction for clinicians,” Heart, vol. 101, no. 12, pp.
921–928, 2015.
[73] J. Ai et al., “Circulating microRNA-1 as a potential novel biomarker for acute
myocardial infarction,” Biochem. Biophys. Res. Commun., vol. 391, no. 1, pp. 73–77,
2010.
[74] G. K. Wang et al., “Circulating microRNA: A novel potential biomarker for early
diagnosis of acute myocardial infarction in humans,” Eur. Heart J., vol. 31, no. 6, pp.
659–666, 2010.
[75] A. Zampetaki et al., “Prospective study on circulating microRNAs and risk of
myocardial infarction,” J. Am. Coll. Cardiol., vol. 60, no. 4, pp. 290–299, 2012.
[76] A. Zampetaki et al., “Circulating miRNAs as marker for liver injury in HIV patients,”
Hepatology, vol. 61, no. 1, pp. 46–55, 2014.
[77] I. Z. Ben-Dov et al., “Urine microRNA as potential biomarkers of autosomal
dominant polycystic kidney disease progression: Description of miRNA profiles at
baseline,” PLoS One, vol. 9, no. 1, pp. 1–8, 2014.
[78] Y. Zhang et al., “Plasma microRNA-122 as a biomarker for viral-, alcohol-, and
chemical-related hepatic diseases,” Clin. Chem., vol. 56, no. 12, pp. 1830–1838, 2010.
[79] Z. Zhao et al., “Circulating microRNA miR-323-3p as a biomarker of ectopic
pregnancy,” Clin. Chem., vol. 58, no. 5, pp. 896–905, 2012.
[80] A. J. Qavi, J. T. Kindt, and R. C. Bailey, “Sizing up the future of microRNA analysis,”
Anal. Bioanal. Chem., vol. 398, no. 6, pp. 2535–2549, 2010.
[81] L. P. Lim et al., “The microRNAs of,” Genes Dev., pp. 991–1008, 2003.

125
[82] D. P. Bartel, “MicroRNAs: Genomics, Biogenesis, Mechanism, and Function,” Cell,
vol. 116, no. 2, pp. 281–297, 2004.
[83] R. C. Friedman, K. K. H. Farh, C. B. Burge, and D. P. Bartel, “Most mammalian
mRNAs are conserved targets of microRNAs,” Genome Res., vol. 19, no. 1, pp. 92–
105, 2009.
[84] S. Wu et al., “Multiple microRNAs modulate p21Cip1/Waf1 expression by directly
targeting its 3′ untranslated region,” Oncogene, vol. 29, no. 15, pp. 2302–2308, 2010.
[85] C. Chen, R. Tan, L. Wong, R. Fekete, and J. Halsey, “PCR Protocols-Chapter 8:
Quantitation of MicroRNAs by Real-Time RT-qPCR,” Methods Mol. Biol, vol. 687,
no. 4, pp. 113–134, 2011.
[86] A. R. Chandrasekaran, J. A. Punnoose, L. Zhou, P. Dey, B. K. Dey, and K. Halvorsen,
“DNA nanotechnology approaches for microRNA detection and diagnosis,” Nucleic
Acids Res., vol. 47, no. 20, pp. 10489–10505, 2019.
[87] M. L. Metzker, “Sequencing technologies the next generation,” Nat. Rev. Genet., vol.
11, no. 1, pp. 31–46, 2010.
[88] P. T. Nelson, D. A. Baldwin, W. P. Kloosterman, S. Kauppinen, R. H. A. Plasterk,
and Z. Mourelatos, “RAKE and LNA-ISH reveal microRNA expression and
localization in archival human brain,” RNA, vol. 12, no. 2, pp. 187–191, 2006.
[89] M. O. Urbanek, A. U. Nawrocka, and W. J. Krzyzosiak, “Small RNA detection by in
situ hybridization methods,” Int. J. Mol. Sci., vol. 16, no. 6, pp. 13259–13286, 2015.
[90] V. P. Dave et al., “MicroRNA amplification and detection technologies:
opportunities and challenges for point of care diagnostics,” Lab. Investig., vol. 99,
no. 4, pp. 452–469, 2019.

126
[91] S. Streit, C. W. Michalski, M. Erkan, J. Kleeff, and H. Friess, “Northern blot analysis
for detection and quantification of RNA in pancreatic cancer cells and tissues,” Nat.
Protoc., vol. 4, no. 1, pp. 37–43, 2009.
[92] C. C. Pritchard, H. H. Cheng, and M. Tewari, “MicroRNA profiling: Approaches and
considerations,” Nat. Rev. Genet., vol. 13, no. 5, pp. 358–369, 2012.
[93] P. Mestdagh et al., “Evaluation of quantitative miRNA expression platforms in the
microRNA quality control (miRQC) study,” Nat. Methods, vol. 11, no. 8, pp. 809–
815, 2014.
[94] H. T. Allawi et al., “Quantitation of microRNAs using a modified Invader assay,”
RNA, vol. 10, pp. 1153–1161, 2004.
[95] R. Deng, K. Zhang, and J. Li, “Isothermal Amplification for MicroRNA Detection:
From the Test Tube to the Cell,” Acc. Chem. Res., vol. 50, no. 4, pp. 1059–1068,
2017.
[96] A. Fire and S. Q. Xu, “Rolling replication of short DNA circles,” PNAS, vol. 92, no.
10, pp. 4641–4645, 1995.
[97] D. Liu, S. L. Daubendiek, M. A. Zillman, K. Ryan, and E. T. Kool, “Rolling circle
DNA synthesis: Small circular oligonucleotides as efficient templates for DNA
polymerases,” J. Am. Chem. Soc., vol. 118, no. 7, pp. 1587–1594, 1996.
[98] J. Sp, K. J, and K. J. A, “microRNA detection system based on padlock probes and
rolling circle amplification,” RNA, vol. 12, pp. 1747–52, 2006.
[99] Y. Zhou, Q. Huang, J. Gao, J. Lu, X. Shen, and C. Fan, “A dumbbell probe-mediated
rolling circle amplification strategy for highly sensitive microRNA detection,”
Nucleic Acids Res., vol. 38, no. 15, 2010.

127
[100] J. Chen et al., “Isothermal Amplification on a Structure-Switchable Symmetric
Toehold Dumbbell-Template: A Strategy Enabling MicroRNA Analysis at the
Single-Cell Level with Ultrahigh Specificity and Accuracy,” Anal. Chem., vol. 90,
no. 1, pp. 859–865, 2018.
[101] Y. Long, X. Zhou, and D. Xing, “An isothermal and sensitive nucleic acids assay by
target sequence recycled rolling circle amplification,” Biosens. Bioelectron., vol. 46,
pp. 102–107, 2013.
[102] P. M. Lizardi, X. Huang, Z. Zhu, P. Bray-Ward, D. C. Thomas, and D. C. Ward,
“Mutation detection and single-molecule counting using isothermal rolling-circle
amplification,” Nat. Genet., vol. 19, no. 3, pp. 225–232, 1998.
[103] L. Yan et al., “Isothermal amplified detection of DNA and RNA,” Mol. Biosyst., vol.
10, no. 5, pp. 970–1003, 2014.
[104] H. L. Chen et al., “Nucleic acid amplification-based methods for microRNA
detection,” Anal. Methods, vol. 7, no. 6, pp. 2258–2263, 2015.
[105] Y. Cheng, X. Zhang, Z. Li, X. Jiao, Y. Wang, and Y. Zhang, “Highly Sensitive
Determination of microRNA Using Target-Primed and Branched Rolling-Circle
Amplification,” Angew. Chemie, vol. 121, no. 18, pp. 3318–3322, 2009.
[106] G. J. S. Lohman, Y. Zhang, A. M. Zhelkovsky, E. J. Cantor, and T. C. Evans,
“Efficient DNA ligation in DNA-RNA hybrid helices by Chlorella virus DNA ligase,”
Nucleic Acids Res., vol. 42, no. 3, pp. 1831–1844, 2014.
[107] J. Jin, S. Vaud, A. M. Zhelkovsky, J. Posfai, and L. A. McReynolds, “Sensitive and
specific miRNA detection method using SplintR Ligase,” Nucleic Acids Res., vol. 44,
no. 13, pp. e116, 2016.

128
[108] V. E. Anisimova, D. V. Rebrikov, P. A. Zhulidov, D. B. Staroverov, S. A. Lukyanov,
and A. S. Shcheglov, “Renaturation, activation, and practical use of recombinant
duplex-specific nuclease from Kamchatka crab,” Biochem., vol. 71, no. 5, pp. 513–
519, 2006.
[109] T. Tian et al., “Sensitive and convenient detection of microRNAs based on cascade
amplification by catalytic dnazymes,” Chem. Eur. J., vol. 19, no. 1, pp. 92–95, 2013.
[110] S. Wang et al., “Novel amplex red oxidases based on noncanonical DNA structures:
Property studies and applications in microRNA detection,” Anal. Chem., vol. 86, no.
6, pp. 2925–2930, 2014.
[111] B. C. Yin, Y. Q. Liu, and B. C. Ye, “One-step, multiplexed fluorescence detection of
microRNAs based on duplex-specific nuclease signal amplification,” J. Am. Chem.
Soc., vol. 134, no. 11, pp. 5064–5067, 2012.
[112] Y. Wang, C. Lau, and J. Lu, “Target-initiated labeling for the dual-amplified
detection of multiple microRNAs,” Anal. Chim. Acta, vol. 992, pp. 76–84, 2017.
[113] T. Notomi et al., “Loop-mediated isothermal amplification of DNA,” Nucleic Acids
Res., vol. 28, no. 12, p. e63, 2000.
[114] J. Ye, M. Xu, X. Tian, S. Cai, and S. Zeng, “Research advances in the detection of
miRNA,” J. Pharm. Anal., vol. 9, no. 4, pp. 217–226, 2019.
[115] Y. S. Jiang, S. Bhadra, B. Li, Y. R. Wu, J. N. Milligan, and A. D. Ellington, “Robust
Strand Exchange Reactions for the Sequence-Specific, Real-Time Detection of
Nucleic Acid Amplicons,” Anal. Chem., vol. 87, no. 6, pp. 3314–3320, 2015.
[116] Y. Sun, H. Tian, C. Liu, Y. Sun, and Z. Li, “One-step detection of microRNA with
high sensitivity and specificity: Via target-triggered loop-mediated isothermal

129
amplification (TT-LAMP),” Chem. Commun., vol. 53, no. 80, pp. 11040–11043,
2017.
[117] W. Liu et al., “Establishment of an accurate and fast detection method using
molecular beacons in loop-mediated isothermal amplification assay,” Sci. Rep., vol.
7, no. January, 2017.
[118] R. Duan et al., “Lab in a tube: Ultrasensitive detection of MicroRNAs at the single-
cell level and in breast cancer patients using quadratic isothermal amplification,” J.
Am. Chem. Soc., vol. 135, no. 12, pp. 4604–4607, 2013.
[119] B. Z. Chi, R. P. Liang, W. Bin Qiu, Y. H. Yuan, and J. D. Qiu, “Direct fluorescence
detection of microRNA based on enzymatically engineered primer extension poly-
thymine (EPEPT) reaction using copper nanoparticles as nano-dye,” Biosens.
Bioelectron., vol. 87, pp. 216–221, 2017.
[120] A. Chen, S. Ma, Y. Zhuo, Y. Chai, and R. Yuan, “In Situ Electrochemical Generation
of Electrochemiluminescent Silver Naonoclusters on Target-Cycling Synchronized
Rolling Circle Amplification Platform for MicroRNA Detection,” Anal. Chem., vol.
88, no. 6, pp. 3203–3210, 2016.
[121] P. Yin, H. M. T. Choi, C. R. Calvert, and N. A. Pierce, “Programming biomolecular
self-assembly pathways,” Nature, vol. 451, no. 7176, pp. 318–322, 2008.
[122] X. Chen, N. Briggs, J. R. McLain, and A. D. Ellington, “Stacking nonenzymatic
circuits for high signal gain,” PNAS., vol. 110, no. 14, pp. 5386–5391, 2013.
[123] Y. S. Jiang, S. Bhadra, B. Li, and A. D. Ellington, “Mismatches improve the
performance of strand-displacement nucleic acid circuits,” Angew. Chemie - Int. Ed.,
vol. 53, no. 7, pp. 1845–1848, 2014.

130
[124] Y. Zhang et al., “A simple electrochemical biosensor for highly sensitive and specific
detection of microRNA based on mismatched catalytic hairpin assembly,” Biosens.
Bioelectron., vol. 68, pp. 343–349, 2015.
[125] J. Li et al., “An enzyme-free surface plasmon resonance biosensor for real-time
detecting microRNA based on allosteric effect of mismatched catalytic hairpin
assembly,” Biosens. Bioelectron., vol. 77, pp. 435–441, 2016.
[126] X. Li et al., “A novel surface plasmon resonance biosensor for enzyme-free and
highly sensitive detection of microRNA based on multi component nucleic acid
enzyme (MNAzyme)-mediated catalyzed hairpin assembly,” Biosens. Bioelectron.,
vol. 80, pp. 98–104, 2016.
[127] R. M. Dirks and N. A. Pierce, “Triggered amplification by hybridization chain
reaction,” PNAS, vol. 101, no. 43, pp. 15275–15278, 2004.
[128] Y. X. Chen, K. J. Huang, and K. X. Niu, “Recent advances in signal amplification
strategy based on oligonucleotide and nanomaterials for microRNA detection-a
review,” Biosens. Bioelectron., vol. 99, no. August 2017, pp. 612–624, 2018.
[129] J. Franck, “The theory of Klein and Rosseland applied to fluorescence,
photochemical processes and the electron emission from hot substances,” ZPhys-e.A:
Hadrons Nucl., vol. 9, pp. 259–266, 1922.
[130] G. Cario and J. Franck, “The dissociation of hydrogen molecules by means of excited
mercury atoms,” ZPhys-e.A: Hadrons Nucl., vol. 11, pp. 161–166, 1922.
[131] J. Perrin, C. R. Hebd, “Fluorescence and molecular Induction by resonance,” Seances
Acad. Sci., vol. 184, pp. 1097–1100, 1927.
[132] F. Perrin, “Interaction entre atomes normal et activé. Transferts d’activation.
Formation d’une molécule activée,” Ann. Phys., vol. 12, pp. 283–314, 1932.

131
[133] J. Frenkel, “Über quantenmechanische Energieübertragung zwischen atomaren
Systemen,” Zeitschrift für Phys., vol. 58, no. 11–12, pp. 794–804, 1929.
[134] T. Förster, “Energiewanderung und Fluoreszenz,” Naturwissenschaften, vol. 33, pp.
166–175, 1946.
[135] C. Schaefer and F. Reiche, “Ein Beitrag zur Theorie der Gitterinversion,” Ann. Phys.,
vol. 337, no. 8, pp. 577–588, 1910.
[136] T. Förster, “Zwischenmolekulare Energiewanderung und Fluoreszenz,” Ann. Phys.,
vol. 437, no. 1–2. pp. 55–75, 1948.
[137] T. Förster, “Experimentelle und theoretische Untersuchung des
zwischenmolekularen Übergangs von Elektronenanregungsenergie,” Zeitschrift fur
Naturforsch. - Sect. A J. Phys. Sci., vol. 4, no. 5, pp. 321–327, 1949.
[138] T. Mechanisms and O. F. Electronic, “Transfer Mechanisms of Electronic Excitation,”
10th Spiers Memorial. Lectrure, no. 10, pp. 7–17, 1959.
[139] R. M. Clegg, “The history of FRET : From conception through the labors of birth,”
Rev. Fluoresc., vol. 3, pp. 1–45, 2006.
[140] N. Hildebrandt, “How to Apply FRET: From Experimental Design to Data Analysis,”
FRET - Förster Reson. Energy Transf. From Theory to Appl., pp. 105–163, 2013.
[141] N. Hildebrandt et al., “Energy transfer with semiconductor quantum dot
bioconjugates: A versatile platform for biosensing, energy harvesting, and other
developing applications,” Chem. Rev., vol. 117, no. 2, pp. 536–711, 2017.
[142] D. Shrestha, A. Jenei, P. Nagy, G. Vereb, and J. Szöllősi, “Understanding FRET as a
Research Tool for Cellular Studies,” Int. J. Mol. Sci., vol. 16, no. 4, pp. 6718-6756,
2015.

132
[143] J. R. Lakowicz, Principles of fluorescence spectroscopy. 2006.
[144] H. Sahoo, “Förster resonance energy transfer - A spectroscopic nanoruler: Principle
and applications,” J. Photochem. Photobiol. C Photochem. Rev., vol. 12, no. 1, pp.
20–30, 2011.
[145] V. V. Didenko, “DNA probes using fluorescence resonance energy transfer (FRET):
Designs and applications,” Biotechniques, vol. 31, no. 5, pp. 1106–1121, 2001.
[146] J. Guo, J. Ju, and N. J. Turro, “Fluorescent hybridization probes for nucleic acid
detection,” Anal. Bioanal. Chem., vol. 402, no. 10, pp. 3115–3125, 2012.
[147] K. Binnemans, “Lanthanide-based luminescent hybrid materials,” Chem. Rev., vol.
109, no. 9, pp. 4283–4374, 2009.
[148] E. G. Moore, A. P. S. Samuel, and K. N. Raymond, “From antenna to assay: lessons
learned in lanthanide luminescence,” Acc. Chem. Res., vol. 42, no. 4, pp. 542–552,
2009.
[149] J. C. G. Bünzli and C. Piguet, “Taking advantage of luminescent lanthanide ions,”
Chem. Soc. Rev., vol. 34, no. 12, pp. 1048–1077, 2005.
[150] I. Hemmilä and V. Laitala, “Progress in lanthanides as luminescent probes,” J.
Fluoresc., vol. 15, no. 4, pp. 529–542, 2005.
[151] M. C. Heffern, L. M. Matosziuk, and T. J. Meade, “Lanthanide probes for
bioresponsive imaging,” Chem. Rev., vol. 114, no. 8, pp. 4496–4539, 2014.
[152] J. C. G. Bünzli, “Luminescent lanthanide probes as diagnostic and therapeutic tools,”
Met. Ions Biol. Syst., vol. 42, pp. 39–75, 2004.

133
[153] O. Chau, D. Goeleven, and R. Oujja, “Spectroscopic properties and design of highly
luminescent lanthanide coordination complexes,” Coord. Chem. Rev., vol. 196, no.
2000, pp. 165–195, 2014.
[154] J. Kido, H. Hayase, K. Hongawa, K. Nagai, and K. Okuyama, “Bright red light-
emitting organic electroluminescent devices having a europium complex as an
emitter,” Appl. Phys. Lett., vol. 65, no. 17, pp. 2124–2126, 1994.
[155] J. C. G. Bünzli, “Lanthanide luminescence for biomedical analyses and imaging,”
Chem. Rev., vol. 110, no. 5, pp. 2729–2755, 2010.
[156] J. Rocha, L. D. Carlos, F. A. A. Paz, and D. Ananias, “Luminescent multifunctional
lanthanides-based metal-organic frameworks,” Chem. Soc. Rev., vol. 40, no. 2, pp.
926–940, 2011.
[157] V. V. Zherdeva and A. P. Savitsky, “Using lanthanide-based resonance energy
transfer for in vitro and in vivo studies of biological processes,” Biochemistry
(Moscow), vol. 77, no. 13, pp. 1553–1574, 2012.
[158] S. I. Weissman, “Intramolecular energy transfer the fluorescence of complexes of
Europium,” J. Chem. Phys., vol. 10, no. 4, pp. 214–217, 1942.
[159] J. C. G. Bünzli, “Lanthanide light for biology and medical diagnosis,” J. Lumin., vol.
170, pp. 866–878, 2016.
[160] G. A. Crosby, R. E. Whan, and R. M. Alire, “Intramolecular energy transfer in rare
earth chelates. Role of the triplet state,” J. Chem. Phys., vol. 34, no. 3, pp. 743–748,
1961.
[161] C. Andraud, “Efficient sensitization process of europium, ytterbium and neodymium
through charge-transfer excited state,” Inorg. Chem., vol. 47, no. 22, pp. 10258–
10268, 2008.

134
[162] S. V. Eliseeva and J. C. G. Bünzli, “Lanthanide luminescence for functional materials
and bio-sciences,” Chem. Soc. Rev., vol. 39, no. 1, pp. 189–227, 2010.
[163] O. A. Goryacheva, N. V. Beloglazova, A. M. Vostrikova, M. V. Pozharov, A. M.
Sobolev, and I. Y. Goryacheva, “Lanthanide-to-quantum dot Förster resonance
energy transfer (FRET): Application for immunoassay,” Talanta, vol. 164, no.
September 2016, pp. 377–385, 2017.
[164] C. Chen et al., “Single-Nanoparticle Cell Barcoding by Tunable FRET from
Lanthanides to Quantum Dots,” Angew. Chemie - Int. Ed., vol. 57, no. 41, pp. 13686–
13690, 2018.
[165] I. Hemmilii, “Luminescent lanthanide chelates-a way to more sensitive diagnostic
methods,” J. Alloys Compd., vol. 225, pp. 480–485, 1995.
[166] J. Yuan and G. Wang, “Lanthanide-based luminescence probes and time-resolved
luminescence bioassays,” Trends Analyt. Chem., vol. 25, no. 5, pp. 490–500, 2006.
[167] J. Guo et al., “Conformational Details of Quantum Dot-DNA Resolved by Förster
Resonance Energy Transfer Lifetime Nanoruler,” ACS Nano, vol. 13, no. 1, pp. 505–
514, 2019.
[168] K. E. Sapsford, L. Berti, and I. L. Medintz, “Materials for fluorescence resonance
energy transfer analysis: Beyond traditional donor-acceptor combinations,” Angew.
Chemie - Int. Ed., vol. 45, no. 28, pp. 4562–4589, 2006.
[169] N. Hildebrandt, K. D. Wegner, and W. R. Algar, “Luminescent terbium complexes:
Superior Förster resonance energy transfer donors for flexible and sensitive
multiplexed biosensing,” Coord. Chem. Rev., vol. 273–274, pp. 125–138, 2014.

135
[170] Z. W. Jin et al., “A Rapid, Amplification-Free, and Sensitive Diagnostic Assay for
Single-Step Multiplexed Fluorescence Detection of MicroRNA,” Angew. Chemie -
Int. Ed, vol. 54, pp. 10024 –10029, 2015.
[171] X. Qiu, J. Guo, J. Xu, and N. Hildebrandt, “Three-Dimensional FRET Multiplexing
for DNA Quantification with Attomolar Detection Limits,” J. Phys. Chem. Lett., vol.
9, no. 15, pp. 4379–4384, 2018.
[172] D. V. Nguyen, A. B. Arpat, N. Wang, and R. J. Carroll, “DNA microarray
experiments: Biological and technological aspects,” Biometrics, vol. 58, no. 4, pp.
701–717, 2002.
[173] U. Schobel, H. J. Egelhaaf, A. Brecht, D. Oelkrug, and G. Gauglitz, “New donor
acceptor pair for fluorescent immunoassays by energy transfer,” Bioconjug. Chem.,
vol. 10, no. 6, pp. 1107–1114, 1999.
[174] M. Bates, B. Huang, G. T. Dempsey, and X. Zhuang, “Multicolor super-resolution
imaging with photo-switchable fluorescent probes,” Science, vol. 317, no. 5845, pp.
1749–1753, 2007.
[175] A. Waggoner, “Fluorescent labels for proteomics and genomics,” Curr. Opin. Chem.
Biol., vol. 10, no. 1, pp. 62–66, 2006.
[176] L. D. Lavis and R. T. Raines, “Bright ideas for chemical biology,” ACS Chem. Biol.,
vol. 3, no. 3, pp. 142–155, 2008.
[177] T. Ueno and T. Nagano, “Fluorescent probes for sensing and imaging,” Nat. Methods,
vol. 8, no. 8, pp. 642–645, 2011.
[178] G. Y. Wiederschain, “The Molecular Probes handbook. A guide to fluorescent probes
and labeling technologies,” Biochem., vol. 76, no. 11, pp. 1276–1276, 2011.

136
[179] P. G. Wu and L. Brand, “Resonance energy transfer: Methods and applications,” Anal.
Biochem., vol. 218, no. 1. pp. 1–13, 1994.
[180] R. M. De Lorimier et al., “Construction of a fluorescent biosensor family,” Protein
Sci., vol. 11, no. 11, pp. 2655–2675, 2009.
[181] V. Buschmann, K. D. Weston, and M. Sauer, “Spectroscopic study and evaluation of
red-absorbing fluorescent dyes,” Bioconjug. Chem., vol. 14, no. 1, pp. 195–204, 2003.
[182] B. Juskowiak, “Nucleic acid-based fluorescent probes and their analytical potential,”
Anal. Bioanal. Chem., vol. 399, no. 9, pp. 3157–3176, 2011.
[183] F. Khakbaz and M. Mahani, “Micro-RNA detection based on fluorescence resonance
energy transfer of DNA-carbon quantum dots probes,” Anal. Biochem., vol. 523, pp.
32–38, 2017.
[184] H. Ren et al., “Sandwich DNA Hybridization Fluorescence Resonance Energy-
Transfer Strategy for miR-122 Detection by Core-Shell Upconversion Nanoparticles,”
ACS Appl. Mater. Interfaces, vol. 10, no. 30, pp. 25621–25628, 2018.
[185] H. Zhang et al., “Universal Fluorescence Biosensor Platform Based on Graphene
Quantum Dots and Pyrene-Functionalized Molecular Beacons for Detection of
MicroRNAs,” ACS Appl. Mater. Interfaces, vol. 7, no. 30, pp. 16152–16156, 2015.
[186] A. P. Alivisatos, “Semiconductor Clusters, Quantum Nanocrystals , and Quantum
dots,” Adv. Sci., vol. 271, no. 5251, pp. 933–937, 2010.
[187] E. Petryayeva, W. R. Algar, and I. L. Medintz, “Quantum dots in bioanalysis: A
review of applications across various platforms for fluorescence spectroscopy and
imaging,” Appl. Spectrosc., vol. 67, no. 3, pp. 215–252, 2013.

137
[188] F. O. R. T. W. Orth, T. Exas, and Q. Aprimer, “Quantum Dots: A Primer.” vol. 56,
no. 1, pp. 16A–27A, 2002.
[189] K. F. Chou and A. M. Dennis, “Förster resonance energy transfer between quantum
dot donors and quantum dot acceptors,” Sensors (Switzerland), vol. 15, no. 6, pp.
13288–13325, 2015.
[190] W. R. Algar, K. Susumu, J. B. Delehanty, and I. L. Medintz, “Semiconductor
quantum dots in bioanalysis: Crossing the valley of death,” Anal. Chem., vol. 83, no.
23, pp. 8826–8837, 2011.
[191] U. Resch-Genger, M. Grabolle, S. Cavaliere-Jaricot, R. Nitschke, and T. Nann,
“Quantum dots versus organic dyes as fluorescent labels,” Nat. Methods, vol. 5, no.
9, pp. 763–775, 2008.
[192] M. Chern, J. C. Kays, S. Bhuckory, and A. M. Dennis, “Sensing with
photoluminescent semiconductor quantum dots,” Methods Appl. Fluoresc., vol. 7, no.
1, p. 12005, 2019.
[193] D. Wu et al., “A two-dimensional molecular beacon for mRNA-activated intelligent
cancer theranostics,” Chem. Sci., vol. 6, no. 7, pp. 3839–3844, 2015.
[194] J. Hu, M. H. Liu, and C. Y. Zhang, “Integration of isothermal amplification with
quantum dot-based fluorescence resonance energy transfer for simultaneous
detection of multiple microRNAs,” Chem. Sci., vol. 9, no. 18, pp. 4258–4267, 2018,.
[195] A. Shahmuradyan, M. Moazami-Goudarzi, F. Kitazume, G. S. Espie, and U. J. Krull,
“Paper-based platform for detection by hybridization using intrinsically labeled
fluorescent oligonucleotide probes on quantum dots,” Analyst, vol. 144, no. 4, pp.
1223–1229, 2019.

138
[196] S. Huang, H. Qiu, Q. Xiao, C. Huang, W. Su, and B. Hu, “A simple QD-FRET
bioprobe for sensitive and specific detection of hepatitis B virus DNA,” J. Fluoresc.,
vol. 23, no. 5, pp. 1089–1098, 2013.
[197] Y. Wang et al., “Duplex-Specific Nuclease-Amplified Detection of MicroRNA
Using Compact Quantum Dot − DNA Conjugates,” ACS Appl. Mater. Interfaces, vol.
10, no. 34, pp. 28290-28300, 2018.
[198] N. Hildebrandt, L. J. Charbonnière, M. Beck, R. F. Ziessel, and H. G.
Löhmannsröben, “Quantum dots as efficient energy acceptors in a time-resolved
fluoroimmunoassay,” Angew. Chemie - Int. Ed., vol. 44, no. 46, pp. 7612–7615, 2005.
[199] X. Qiu, K. D. Wegner, Y. T. Wu, P. M. P. Van Bergen En Henegouwen, T. L.
Jennings, and N. Hildebrandt, “Nanobodies and antibodies for duplexed
EGFR/HER2 immunoassays using terbium-to-quantum dot FRET,” Chem. Mater.,
vol. 28, no. 22, pp. 8256–8267, 2016.
[200] X. Qiu and N. Hildebrandt, “Rapid and Multiplexed MicroRNA Diagnostic Assay
Using Quantum Dot-Based Förster Resonance Energy Transfer,” ACS Nano, vol. 9,
no. 8, pp. 8449–8457, 2015.
[201] D. Gustafson, K. Tyryshkin, and N. Renwick, “microRNA-guided diagnostics in
clinical samples,” Best Pract. Res. Clin. Endocrinol. Metab., vol. 30, no. 5, pp. 563–
575, 2016.
[202] A. Kappel and A. Keller, “MiRNA assays in the clinical laboratory: Workflow,
detection technologies and automation aspects,” Clin. Chem. Lab. Med., vol. 55, no.
5, pp. 636–647, 2017.
[203] K. W. Witwer, “Circulating MicroRNA biomarker studies: Pitfalls and potential
solutions,” Clin. Chem., vol. 61, no. 1, pp. 56–63, 2015.

139
[204] S. A. Bustin et al., “The MIQE guidelines: Minimum information for publication of
quantitative real-time PCR experiments,” Clin. Chem., vol. 55, no. 4, pp. 611–622,
2009.
[205] P. Verma, R. K. Pandey, P. Prajapati, and V. K. Prajapati, “Circulating microRNAs:
Potential and emerging biomarkers for diagnosis of human infectious diseases,”
Front. Microbiol., vol. 7, no. AUG, pp. 1–7, 2016.
[206] J. E. Zhang, “microRNA: Emerging biomarkers in human disease and profiling
challenges,” Biochem., vol. 38, no. 2, pp. 26–29, 2016.
[207] P. Shah et al., “Locking-to-unlocking system is an efficient strategy to design
DNA/silver nanoclusters (AgNCs) probe for human miRNAs,” Nucleic Acids Res.,
vol. 44, no. 6, 2015.
[208] F. Xu et al., “Ultrasensitive and Multiple Disease-Related MicroRNA Detection
Based on Tetrahedral DNA Nanostructures and Duplex-Specific Nuclease-Assisted
Signal Amplification,” ACS Appl. Mater. Interfaces, vol. 8, no. 49, pp. 33499–33505,
2016.
[209] C. Hong, A. Baek, S. S. Hah, W. Jung, and D. E. Kim, “Fluorometric Detection of
MicroRNA Using Isothermal Gene Amplification and Graphene Oxide,” Anal.
Chem., vol. 88, no. 6, pp. 2999–3003, 2016.
[210] Y. Zhao, F. Chen, Q. Li, L. Wang, and C. Fan, “Isothermal Amplification of Nucleic
Acids,” Chem. Rev., vol. 115, no. 22, pp. 12491–12545, 2015.
[211] H. X. Jiang, Z. Z. Liang, Y. H. Ma, D. M. Kong, and Z. Y. Hong, “G-quadruplex
fluorescent probe-mediated real-time rolling circle amplification strategy for highly
sensitive microRNA detection,” Anal. Chim. Acta, vol. 943, pp. 114–122, 2016.

140
[212] X. Wu, S. Zhu, P. Huang, and Y. Chen, “Highly specific quantification of microRNA
by coupling probe-rolling circle amplification and Förster resonance energy transfer,”
Anal. Biochem., vol. 502, pp. 16–23, 2016.
[213] X. Zhang, H. Liu, R. Li, N. Zhang, Y. Xiong, and S. Niu, “Chemiluminescence
detection of DNA/microRNA based on cation-exchange of CuS nanoparticles and
rolling circle amplification,” Chem. Commun., vol. 51, no. 32, pp. 6952–6955, 2015.
[214] J. K. Chan et al., “The inhibition of miR-21 promotes apoptosis and chemosensitivity
in ovarian cancer,” Gynecol. Oncol., vol. 132, no. 3, pp. 739–744, 2014.
[215] C. Zhang et al., “MiR-21: A gene of dual regulation in breast cancer,” Int. J. Oncol.,
vol. 48, no. 1, pp. 161–172, 2016.
[216] K. D. Taganov, M. P. Boldin, K. J. Chang, and D. Baltimore, “NF-κB-dependent
induction of microRNA miR-146, an inhibitor targeted to signaling proteins of innate
immune responses,” PNAS, vol. 103, no. 33, pp. 12481–12486, 2006.
[217] X. Qiu, J. Guo, Z. Jin, A. Petreto, I. L. Medintz, and N. Hildebrandt, “Multiplexed
Nucleic Acid Hybridization Assays Using Single-FRET-Pair Distance-Tuning,”
Small, vol. 13, no. 25, pp. 1–6, 2017.
[218] A. Lagunavicius, Z. Kiveryte, V. Zimbaite-Ruskuliene, T. Radzvilavicius and A.
Janulaitis, “Duality of polynucleotide substrates for Phi29 DNA polymerase: 3’→5’
RNase activity of the enzyme,” RNA, vol. 14, pp. 503–513, 2008.
[219] P. Mestdagh et al., “Evaluation of quantitative miRNA expression platforms in the
microRNA quality control (miRQC) study,” Nat. Methods, vol. 11, no. 8, pp. 809–
815, 2014.

141
[220] C. P. Bracken, H. S. Scott, and G. J. Goodall, “A network-biology perspective of
microRNA function and dysfunction in cancer,” Nat. Rev. Genet., vol. 17, no. 12, pp.
719–732, 2016.
[221] Y. Fan, S. Wang, and F. Zhang, “Optical Multiplexed Bioassays for Improved
Biomedical Diagnostics,” Angew. Chemie - Int. Ed., vol. 58, no. 38, pp. 13208–13219,
2019.
[222] F. L. Guest, P. C. Guest, and D. Martins-De-Souza, “The emergence of point-of-care
blood-based biomarker testing for psychiatric disorders: Enabling personalized
medicine,” Biomark. Med., vol. 10, no. 4, pp. 431–443, 2016.
[223] M. Kaufmann, M. Keppens, and E. D. Blair, “A perspective analysis: Companion
diagnostics: An evolving paradigm in 21st century healthcare,” Per. Med., vol. 12,
no. 4, pp. 389–402, 2015.
[224] R. Duncan, M. Kourout, E. Grigorenko, C. Fisher, and M. Dong, “Advances in
multiplex nucleic acid diagnostics for blood-borne pathogens: Promises and pitfalls,”
Expert Rev. Mol. Diagn., vol. 16, no. 1, pp. 83–95, 2016.
[225] B. Hötzer, I. L. Medintz, and N. Hildebrandt, “Fluorescence in nanobiotechnology:
Sophisticated fluorophores for novel applications,” Small, vol. 8, no. 15, pp. 2297–
2326, 2012.
[226] X. Qiu and N. Hildebrandt, “A clinical role for Förster resonance energy transfer in
molecular diagnostics of disease,” Expert Rev. Mol. Diagn., vol. 19, no. 9, pp. 767–
771, 2019.
[227] J. Guo, C. Mingoes, X. Qiu, and N. Hildebrandt, “Simple, Amplified, and Multiplexed
Detection of MicroRNAs Using Time-Gated FRET and Hybridization Chain
Reaction,” Anal. Chem., vol. 91, no. 4, pp. 3101–3109, 2019.

142
[228] miRCancer - microRNA Cancer Association Database http://mircancer.ecu.edu/.
[229] M. Mandelkern, J. G. Elias, D. Eden, and D. M. Crothers, “The dimensions of DNA
in solution,” J. Mol. Biol., vol. 152, no. 1, pp. 153–161, 1981.
[230] B. Xie, Q. Ding, H. Han, and D. Wu, “MiRCancer: A microRNA-cancer association
database constructed by text mining on literature,” Bioinformatics, vol. 29, no. 5, pp.
638–644, 2013.
[231] X. Zhang et al., “Ligation-promoted hyperbranched rolling circle amplification
enables ultrasensitive detection of microRNA in clinical specimens,” Sensors
Actuators, B Chem., vol. 277, no. September, pp. 634–639, 2018.
[232] B. Zou, Y. Ma, H. Wu, and G. Zhou, “Signal amplification by rolling circle
amplification on universal flaps yielded from target-specific invasive reaction,”
Analyst, vol. 137, no. 3, pp. 729–734, 2012.
[233] Y. Zhang, L. Chen, K. Hsieh, and T. H. Wang, “Ratiometric Fluorescence Coding
for Multiplex Nucleic Acid Amplification Testing,” Anal. Chem., vol. 90, no. 20, pp.
12180–12186, 2018.
[234] X. H. Li et al., “Hyperbranched rolling circle amplification (HRCA)-based
fluorescence biosensor for ultrasensitive and specific detection of single-nucleotide
polymorphism genotyping associated with the therapy of chronic hepatitis B virus
infection,” Talanta, vol. 191, no. July 2018.
[235] L. Zhang et al., “Ultrasensitive biosensing of low abundance BRAF V600E mutation
in real samples by coupling dual padlock-gap-ligase chain reaction with
hyperbranched rolling circle amplification,” Sensors Actuators, B Chem., vol. 287,
no. January, pp. 111–117, 2019.

143
[236] H. Shi, X. Mao, X. Chen, Z. Wang, K. Wang, and X. Zhu, “The analysis of proteins
and small molecules based on sterically tunable nucleic acid hyperbranched rolling
circle amplification,” Biosens. Bioelectron., vol. 91, no. October 2016, pp. 136–142,
2017.
[237] X. Zhu et al., “An ultrasensitive aptameric sensor for proteins based on
hyperbranched rolling circle amplification,” Chem. Commun., vol. 49, no. 86, pp.
10115–10117, 2013.
[238] J. Chen et al., “Highly sensitive fluorescent sensor for mercury based on
hyperbranched rolling circle amplification,” Analyst, vol. 140, no. 3, pp. 907–911,
2015.
[239] Y. Zhang et al., “Fluorescence aptasensor for Ochratoxin A in food samples based
on hyperbranched rolling circle amplification,” Anal. Methods, vol. 7, no. 15, pp.
6109–6113, 2015.
[240] P. M. Lizardi, X. Huang, Z. Zhu, P. Bray-Ward, D. C. Thomas, and D. C. Ward,
“Mutation detection and single-molecule counting using isothermal rolling-circle
amplification,” Nat. Genet., vol. 19, no. 3, pp. 225–232, 1998.

144
9. Résumé en français
Les microARNs (miARNs) sont impliqués dans pratiquement tous les processus
physiologiques, y compris la différenciation et la prolifération, le métabolisme, l'hémostase,
l'apoptose ou l'inflammation. À ce jour, plus de 30,000 miARNs ont été découverts, dont
plus de 2,500 peuvent être trouvés chez l'homme. La découverte de nombreux types
miARNs circulants (dans les fluides biologiques des patients, par exemple, le sérum, le
plasma, l’urine, le liquide céphalorachidien, etc.) spécifiques aux cancers (sein, colorectal,
œsophagien, gastrique, hépatique, pulmonaire, ovarien, pancréatique, etc.), ainsi que de
nombreuses autres maladies (maladies infectieuses, troubles immunologiques, maladies
cardiovasculaires, neurologiques, etc.), ont fortement stimulé la mise en œuvre des
miARNs comme biomarqueurs de nouvelle génération pour la prédiction des maladies, la
réponse au traitement ou la prédiction de la progression. D'après un nouveau rapport de
BCC Research Inc., le marché mondial des outils de recherche sur les miARNs, services,
diagnostics et découverte de médicaments devraient atteindre près de 1.4 milliard de dollars
en 2021 à un taux de croissance annuel composé de 10.5% pour 2016-2021. Compte tenu
de la récente découverte des miARNs circulants, le secteur diagnostic de ce marché global
est encore extrêmement petit, démontrant le besoin urgent de développer des tests de
diagnostics miARNs cliniquement approuvés. Malgré leurs séquences courtes combinées à
de fortes similitudes de séquence entre différents miARNs, de nombreuses types de
technologies ont été utilisées pour leur détection. Les plus couramment utilisées sont la
réaction en chaîne par polymérase quantitative à transcription inverse (RT-qPCR),
microarray, séquençage à haut débit (NGS), hybridation in situ (ISH), northern blotting
(NB). Cependant, les principales limitations sont la faible sensibilité (microarray, NB) et le
débit (ISH, NB, RT-qPCR), les coûts (microarray, NGS), le manque de quantification
absolue (microarray, NGS) et le multiplexage à partir d'un seul échantillon (RT-qPCR,
NGS), coûteux en temps et difficultés associées à des résultats comparables sur différentes
plates-formes. L'amplification isotherme est devenue une méthode puissante pour les
dosages de miARNs très rapides très rapides, spécifiques et sensibles, qui possède

145
également la compatibilité avec des plateformes de détection diverse, telles que la
fluorescence, l'électrochimie et la colorimétrie.
Le but de cette thèse est d'aborder de nouvelles voies d'outils de diagnostic de miARNs, en
prenant la simplicité d'un immunodosage homogène, la capacité de multiplexage de
microarrays, la sensibilité de RT-qPCR et la capacité de débit de NGS dans un seul outil de
diagnostic. Le concept consiste à combiner la polyvalence et la capacité de multiplexage
des complexes luminescents de Tb (LTC) basés sur la mesure du transfert d'énergie par
résonance de type Förster à sélection temporelle (TG-FRET) avec la technologie
d'amplification isotherme pour concevoir des biocapteurs miARNs ultra-sensibles et/ou
multiplexés. Les LTC utilisés comme donneur de transfert d'énergie et possédant des
avantages uniques pour la détection multiplexée en raison de leurs pics d'émission multiples,
nets et distincts, ainsi que de longues durées de vie de leur état excité par rapport aux
colorants organiques et aux points quantiques (QD). Les colorants organiques peuvent être
utilisés dans des systèmes biologiques à faible toxicité. Ils ont été les fluorophores les plus
utilisés dans la technique de FRET, et en combinaison avec les LTC en tant que donneurs,
le développement de biocapteurs multiplexées sont réalisable basées sur les LTCs-colorants
FRET. Notamment, une correction appropriée de l’interférence spectrale doit être prise
pour le multiplexage spectral en raison des larges profils d'émission des fluorophores
organiques. Bien que les QD aient des avantages uniques par rapport aux colorants
organiques dans les systèmes de FRET, en particulier dans les tests FRET basés sur les
donneurs de LTC, les QD ont un meilleur chevauchement spectral ainsi qu'une plus grande
distance de Förster avec les LTC en raison de leur absorption très large et d'un coefficient
d'extinction molaire et rendement quantique extrêmement élevé. Les bandes d'émission
étroites et ajustables en taille font que les QD sont d'excellents candidats d’accepteurs de
FRET pour le multiplexage. Les mesures traditionnelles de FRET sont troublées par la
courte durée de vie (dans la gamme du ns) et la fluorescence de fond élevée des tampons
ou des échantillons. En utilisant TG-FRET, en particulier en utilisant des LTC à longue
durée de vie comme donneurs et des colorants/QD à courte durée de vie comme accepteurs,
lors de l'excitation pulsée d'un échantillon, en collectant la durée de vie de la

146
photoluminescence (PL) dans des fenêtres temporelles beaucoup plus longue que la
décroissance naturelle des colorants/QD, mais toujours pendant la durée de vie de la
décroissance des LLC, l'excitation directe des colorants/QD accepteurs et toute
autofluorescence peuvent être efficacement supprimées, ce qui simplifie considérablement
analyse du système.
Cette thèse peut être divisée en huit chapitres. Après l'introduction, le contexte, trois études
individuelles sont présentées, puis complétées par un résumé et des perspectives, une
annexe et une bibliographie. Chaque étude est corroborée par l'introduction, le matériel et
les méthodes, les résultats et la discussion, et la conclusion.
Dans la première étude, je présente un essai de détection de miARNs utilisant une
amplification enzymatique à cercle circulaire (RCA) LTCs-à-colorant TG-FRET. Ma
contribution à cette étude a été l’investigation des échantillons cliniques, en particulier, la
préparation d'échantillons, les expériences RCA-FRET, les expériences RT-qPCR et
l'analyse des données. Dr. Jiajia Guo a également contribué aux travaux expérimentaux et
Dr. Xue Qiu a conçu les études et rédigé le manuscrit. Tous les auteurs ont contribué à
l'édition et à la rédaction du manuscrit et ont approuvé sa version finale à la revue (X. Qiu,
J. Xu, J. Guo, A. Yahia-Ammar, N.-I. Kapetanakis, I. Duroux-Richard, J.J. Unterluggauer,
N. Golob-Schwarzl, C. Regeard, C. Uzan, S. Gouy, M. DuBow, J. Haybaeck, F. Apparailly,
P. Busson, and N. Hildebrandt. Chemical Science 2018, 9, 8046-8055. Troisième article de
la Section List of publications). La combinaison de RCA avec TG-FRET entre les
donneurs de LTC et les accepteurs Cy5.5 a abouti à une seule spécificité et sensibilité de la
variante nucléotidique avec une limite de détection (LOD) jusqu'à 4.2 ± 0.5 attomole (30 ±
3 fM) pour miR-21, 6.8 ± 0.8 attomole (48 ± 5 fM) pour miR-132 et 14 ± 2 attomole (99 ±
10 fM) pour le miR-146a. La quantification du miR-21 à partir des tissus humains et des
échantillons de plasma a révélé la pertinence pour le diagnostic du cancer du sein et de
l'ovaire. Cette étude a démontré la large applicabilité à différents miARNs et à d'autres
types d'échantillons cliniques. La comparaison directe avec l'étalon ou RT-qPCR a montré
les avantages du TG-FRET amplifié en ce qui concerne la précision et la spécificité lors de
la quantification de faibles concentrations de miARN comme requis pour les applications

147
diagnostiques. La mise en œuvre efficace du RCA et du TG-FRET dans une méthode de
détection d'acide nucléique simple peut considérablement faire avancer les possibilités de
diagnostic et de recherche sur le cancer à base de miARN.
Figure 1.1 Représentation schématique du test de détection de miARN utilisant des LTCs à
colorant TG-FRET amplifiés par RCA.
La deuxième étude présente un essai de multiplexage temporel pour la détection de miARN
utilisant des LTCs-to-dye TG-FRET amplifiés par enzyme catalytique sans enzyme (CHA).
Ma contribution à cette étude a été la conception d'étude, la réalisation d'expériences,
l'analyse des données et la rédaction du manuscrit. Dr. Jiajia Guo et Dr. Xue Qiu ont
également contribué à la conception d'étude. Tous les auteurs ont contribué à l'édition et à
la rédaction du manuscrit et ont approuvé sa version finale à la revue (J. Xu, J. Guo, N.
Golob-Schwarzl, J. Haybaeck, X. Qiu, and N. Hildebrandt. ACS Sensors 2020, (accepted),
DOI: 10.1021/acssensors.0c00432. Premier article de la Section List of publications).
L'implémentation de TG-FRET dans CHA peut être utilisée pour la quantification
simultanée de deux miARN (miR-21 et miR-20a) avec une seule mesure à partir d'extraits
d'ARNs totaux de tissus humains. Une seule paire de FRET LTCs-à-Cy5.5 a été conjuguée
à deux distances spécifiques dans les sondes en épingle à cheveux CHA spécifiques aux
cibles, de sorte que chaque miARN a entraîné des PL amplifiées distinctes qui pouvaient
être distinguées et quantifiées par détection d'intensité TG PL. L'amplification sans enzyme

148
dans un format de dosage sans séparation et l'absence d'autofluorescence permettait une
détection simple, spécifique et sensible avec une LOD jusqu'à 380 ± 40 attomoles (2.7 ±
0.3 pM) pour miR-21 et 250 ± 60 attomoles (1.8 ± 0.4 pM) pour miR-20a. Une
quantification fiable en duplex des deux miARNs à de faibles concentrations picomolaires
a été confirmée par l'analyse des extraits d'ARN totaux de différents tissus du côlon et du
rectum avec CHA-TG-FRET et RT-qPCR à cible unique et double pour comparaison. Ces
tests de biomarqueurs miARN rapides, simples et multiplexés présentent une méthode
efficace pour les diagnostics cliniques.
Figure 1.2 Représentation schématique pour l'analyse de détection des miARN multiplexés (miR-
21 et miR-20a) à l'aide de LTC à colorant TG-FRET amplifiés par CHA.
Dans la troisième étude, j'ai étudié la détection de miARN utilisant une amplification
enzymatique à cercle roulant hyperbranché (HRCA) LTCs-to-QD TG-FRET. Ma
contribution à cette étude a été la conception d'étude, la réalisation d'expériences et l'analyse
des données. Dr. Xue Qiu a également contribué à la conception d'étude. Le manuscrit est
en préparation. En intégrant la mesure de TG dépourvue d’autofluorescence dans HRCA
avec une efficacité d'amplification exponentielle, elle offre des avantages de haute
0 2 4 6100
1000
10000
PL in
tensity (
cou
nts
)
time (ms)
0 2 4 61
10
100
1000
10000
PL in
tensity (
cou
nts
)
time (ms)
0 2 4 6100
1000
10000
PL
inte
nsity (
co
unts
)
time (ms)0 2 4 6
1
10
100
1000
10000
PL in
tensity (
cou
nts
)
time (ms)
b
3*2*
1*miR- 21
1 2 3
1* 2* 3*
43*2*
Cy5.5
H2 f or miR- 21
2*
3 4* 3*
4
Tb
Cy5.51 2 3 4 3*
2*
Tb2* 3* 4* 341*
2*3*
Tb2* 3* 4* 34
Cy5.51 2 3 4 3*
2*
FRET
10 bps
H1 f or miR- 21
1 2 34
3*2* Cy5.5
a
3*2*
1*miR- 20a
1 2 3
1* 2* 3*
43*2*
Cy5.5
H2 f or miR- 20a
2*
3 4* 3*
4
Tb
2*Cy5.51 2 3 4 3*
Tb2* 3* 4* 341*
2*3*
Tb2* 3* 4* 34
Cy5.51 2 3 4 3*
2*
FRET
14 bps
H1 f or miR- 20a1 2 3
43*2*
Cy5.5
d
c miR- 21 sensor: FRET distance ~10 bps
miR- 20a senor: FRET distance ~14 bps
TG
Cy5. 5I
TG
Cy5. 5I
TG
TbI
TG
TbI
miRc ~TG
Cy5. 5ITG
TbI/Rat iomet ric
miR quant if icat ion
x = var
same
x and y
x = var
y = var
same
x and y
y = var

149
sensibilité avec une limite de détection de 11 ± 4 attomole (80 ± 30 fM) et sélectivité vis-
à-vis du miR-21 cible dans un bruit de fond extrêmement faible, format de test en une seule
étape rapide et simple. La réaction HRCA amorcée et amorcée par une cible peut générer
une grande quantité d'ADN simple brin de différentes longueurs (produit HRCA). En
s'hybridant avec des sondes d'ADN reporter marquées au Tb et des sondes d'ADN
adaptatrices qui sont à la surface du QD via l'interaction biotine et streptavidine, les
complexes QD-ADN-LTC pourraient se former, induisant la distance raccourcie entre les
LTC, résultant en LTCs-à-QD FRET. En outre, le test proposé montre un grand potentiel
pour une large applicabilité à différents miARNs et capacité de multiplexage, démontrant
qu'il peut être une alternative prometteuse aux approches actuelles de diagnostic de
miARNs.
Figure 1.3 Représentation schématique pour l'analyse de détection de miARN en utilisant des LTC
amplifiés HRCA en TG-FRET QD.

Université Paris-Saclay Espace Technologique / Immeuble Discovery Route de l’Orme aux Merisiers RD 128 / 91190 Saint-Aubin, France
Titre : Quantification sensible et mutiplexée des microARNs en utilisant le transfert d'energie par résonance
de type Förster amplifié et résolu en temps
Mots clés : FRET, miARN, complexe de lanthanide, amplification isotherme, spectroscopie résolue en temps
Résumé : En tant que biomarqueurs de nouvelle
génération, les microARNs sont associés à de
nombreux cancers et maladies, ce qui a conduit à une
forte demande pour le développement de méthodes
cliniques de diagnostic des microARNs. Les
technologies d'amplification isotherme, telles que
l'amplification en cercle roulant et l'assemblage
catalytique en épingle à cheveux, sont devenues des
méthodes puissantes pour les dosages très rapides,
spécifiques et sensibles des microARNs. Cette thèse
se concentre sur le développement de biocapteurs
de microARNs basés sur les technologies
d'amplification isotherme et le transfert d'énergie par
résonance de type Förster résolu en temps des
complexes de lanthanide aux colorants organiques
ou aux points quantiques. Les biocapteurs de
microARNs amplifiés proposés ont des limites de
détection très basses et sont utilisables dans des
échantillons cliniques humains, révélant avec
succès leurs pertinence pour le diagnostic du
cancer. Comme la détection simultanée de
plusieurs microARNs est très demandée, la
détection temporelle multiplexée de microARNs
est également effectuée basée sur les de durées de
vie à l'état excité distinctes des complexes Tb et des
colorants. De plus, le nanocapteur microARN
amplifié basé sur des points Tb à quantique FRET,
a démontré la possibilité d'une détection spectrale
multiplexée de microARNs avec une sensibilité et
une sélectivité élevées.
Title : Sensitive and mutiplexed microRNA quantification using amplified time-gated Förster resonance
energy transfer
Keywords : FRET, miRNA, lanthanide complex, isothermal amplification, time-resolved spectroscopy
Abstract : As new generation of biomarkers,
microRNAs are associated with many cancers and
diseases, which has led to a great demand for
developing clinical miRNA diagnostic methods.
Isothermal amplification technologies, such as rolling
circle amplification and catalytic hairpin assembly,
have emerged as powerful methods for highly rapid,
specific and sensitive microRNA assays. This thesis
focuses on developing microRNA biosensors based
on isothermal amplification technologies and time-
resolved Förster resonance energy transfer from
lanthanide complexes to organic dyes or quantum
dots. The proposed amplified microRNA biosensors
have very low limits of detections, and are applied
to human clinical samples, successfully revealing
the relevance for cancer diagnostics. As
simultaneous detection of multiple microRNAs is
highly demanded, temporal multiplexed detection
of microRNAs is also realized based on
distinguishable excited-state lifetimes of Tb
complexes and dyes. Moreover, the amplified
microRNA nanosensor based on Tb-to-quantum
dots FRET demonstrated the possibility of spectral
multiplexed detection of microRNAs with high
sensitivity and selectivity.