microrna networks in mouse lung organogenesis
TRANSCRIPT

MicroRNA Networks in Mouse Lung OrganogenesisJie Dong1, Guoqian Jiang2, Yan W. Asmann2, Sandra Tomaszek1, Jin Jen3, Thomas Kislinger4,5, Dennis A.
Wigle1*
1 Division of General Thoracic Surgery, Mayo Clinic Cancer Center, Mayo Clinic, Rochester, Minnesota, United States of America, 2 Division of Biomedical Statistics and
Informatics, Department of Health Sciences Research, Mayo Clinic, Rochester, Minnesota, United States of America, 3 Pulmonary Medicine, Mayo Clinic Cancer Center,
Mayo Clinic, Rochester, Minnesota, United States of America, 4 Department of Medical Biophysics, University of Toronto, Toronto, Ontario, Canada, 5 Ontario Cancer
Institute, Princess Margaret Hospital, Toronto, Ontario, Canada
Abstract
Background: MicroRNAs (miRNAs) are known to be important regulators of both organ development and tumorigenesis.MiRNA networks and their regulation of messenger RNA (mRNA) translation and protein expression in specific biologicalprocesses are poorly understood.
Methods: We explored the dynamic regulation of miRNAs in mouse lung organogenesis. Comprehensive miRNA and mRNAprofiling was performed encompassing all recognized stages of lung development beginning at embryonic day 12 andcontinuing to adulthood. We analyzed the expression patterns of dynamically regulated miRNAs and mRNAs using anumber of statistical and computational approaches, and in an integrated manner with protein levels from an existing mass-spectrometry derived protein database for lung development.
Results: In total, 117 statistically significant miRNAs were dynamically regulated during mouse lung organogenesis andclustered into distinct temporal expression patterns. 11,220 mRNA probes were also shown to be dynamically regulated andclustered into distinct temporal expression patterns, with 3 major patterns accounting for 75% of all probes. 3,067 directmiRNA-mRNA correlation pairs were identified involving 37 miRNAs. Two defined correlation patterns were observed uponintegration with protein data: 1) increased levels of specific miRNAs directly correlating with downregulation of predictedmRNA targets; and 2) increased levels of specific miRNAs directly correlating with downregulation of translated targetproteins without detectable changes in mRNA levels. Of 1345 proteins analyzed, 55% appeared to be regulated in thismanner with a direct correlation between miRNA and protein level, but without detectable change in mRNA levels.
Conclusion: Systematic analysis of microRNA, mRNA, and protein levels over the time course of lung organogenesisdemonstrates dynamic regulation and reveals 2 distinct patterns of miRNA-mRNA interaction. The translation of targetproteins affected by miRNAs independent of changes in mRNA level appears to be a prominent mechanism ofdevelopmental regulation in lung organogenesis.
Citation: Dong J, Jiang G, Asmann YW, Tomaszek S, Jen J, et al. (2010) MicroRNA Networks in Mouse Lung Organogenesis. PLoS ONE 5(5): e10854. doi:10.1371/journal.pone.0010854
Editor: Jeffrey A. Whitsett, Cincinnati Children’s Hospital Medical Center, United States of America
Received February 10, 2010; Accepted May 5, 2010; Published May 26, 2010
Copyright: � 2010 Dong et al. This is an open-access article distributed under the terms of the Creative Commons Attribution License, which permitsunrestricted use, distribution, and reproduction in any medium, provided the original author and source are credited.
Funding: Dr. Wigle is supported by an NIH K12 Career Development Award through the Mayo Clinic Cancer Center, and a Career Development Award from theInternational Society for Heart and Lung Transplantation (ISHLT). The funders had no role in study design, data collection and analysis, decision to publish, orpreparation of the manuscript.
Competing Interests: The authors have declared that no competing interests exist.
* E-mail: [email protected]
Introduction
MiRNAs are a class of small RNAs (,21–24 nt) that regulate the
expression of target genes at the post-transcriptional level. They are
first transcribed from miRNA genes in the genome as primary
miRNA (pri-miRNAs) and then processed by an RNase III enzyme,
Drosha, into premature miRNAs (pre-miRNAs) with hairpin
structures. With the help of Exportin 5, pre-miRNAs are then
transported into the cytoplasm, where they are cleaved by another
RNase III enzyme, Dicer. The cleavage results in double-stranded
duplexes. Usually, one strand of a duplex becomes the mature
miRNA [1]. Mature miRNAs are then recruited into nucleoprotein
complexes called RNA-induced silencing complexes (RISC). Based
on the pairing of miRNAs and their target sites, the complexes can
inhibit translation by either degradation of the messenger RNAs
(mRNAs), or by blocking translation without degrading the targets
[1,2].
Individual miRNAs may target multiple mRNAs. Conversely,
individual mRNAs may contain sequences complementary to
multiple miRNA family members [3,4]. It is estimated that
miRNAs may be responsible for regulating the expression of
nearly one-third of the human genome [5]. MiRNAs are known to
play multiple roles in carcinogenesis, immune responses and organ
development [6,7], and have been implicated in many critical
cellular processes, including apoptosis, proliferation, and differen-
tiation [8]. Despite the identification of more than 800 mature
human miRNAs and 700 mouse miRNAs, much remains to be
discovered about their functional targets and biologic role.
The development of the mouse lung is initiated at embryonic
day 9.5(E9.5), followed by the morphologically characterized
PLoS ONE | www.plosone.org 1 May 2010 | Volume 5 | Issue 5 | e10854

pseudoglandular (E11.5–16.5), canalicular (E16.5–17.5), saccular
(E17.5–P5) and alveolar stages (P5–30). The primitive airways
begin as a ventral outpouching of foregut epithelium, with almost
immediate branching to form the two main stem bronchi.
Interactions between the surrounding mesenchyme and the
developing airway epithelium function to promote further
branching morphogenesis through the pseudoglandular and
canalicular stages up to E17.5. Alveolarization begins in the
saccules of the lung in parallel with development of the alveolar
capillary bed, and proceeds up to completion at approximately 1
month of age [9,10]. As in the organogenesis of many structures,
formation of the lung is dependent on a myriad of interactions
among signaling molecules and their receptors that mediate cell
proliferation, differentiation, and other diversified functions under
the control of complex regulatory networks [9].
Genetically engineered mouse mutant models using gene
knockout [11], conditional alleles [12,13], or transgenic misex-
pression [14] have all been used to gain insight into the specific
genetic pathways controlling lung morphogenesis. Conditional
ablation of Dicer in the mouse lung produces an abnormal
phenotype with a dramatic reduction in branching morphogenesis
[15]. Mice with deletion of the miR17-92 cluster die shortly after
birth with lung hypoplasia and cardiac anomalies [16]. It is
unknown if other individual or microRNA clusters exist with
significant roles in lung organogenesis.
A number of miRNA profiling studies evaluating mouse and rat
lung development have recently emerged and demonstrated the
dynamic regulation of miRNAs during lung organogenesis. Williams
et al performed miRNA profiling at 3 time points (P1, P14 and P60)
of the developing mouse lung using a panel of 156 individual
miRNAs [17]. They demonstrated that the overall expression profile
was similar for mouse and human tissue, suggesting evolutionary
conservation of miRNA expression during lung development. Lu et al
performed miRNA cloning and sequencing at 2 time points (E11.5
and E17.5) and identified differences in the relative abundance of
miRNAs across the 2 time points [18]. Further transgenic
experiments suggest that miRNAs encoded by the miR-17-92 cluster
positively promote proliferation of epithelial progenitor cells and
inhibit their differentiation [19]. Bhaskaran et al performed miRNA
profiling at 7 time points in rat lung development using an in-house
platform and identified 21 miRNAs in 4 clusters that showed
significant changes in expression [20]. No studies yet reported have
explored interactions in the regulatory control of mRNA modules by
individual or groups of miRNAs.
The purpose of this study was to identify and systematically
explore dynamically regulated miRNAs and potential miRNA-
mRNA interaction networks specific to mouse lung development.
We performed comprehensive miRNA and mRNA profiling over
a 7-point time course, encompassing all recognized stages of lung
development beginning at embryonic day 12 and continuing to
adulthood. We also systematically predicted potential direct
mRNA targets of miRNAs through both miRNA-mRNA and
miRNA-protein correlations. The results demonstrate evidence for
two distinct patterns of miRNA-mRNA interaction, and reveal
that translation of target proteins affected by miRNAs, indepen-
dent of changes in mRNA level, appears to be a prominent
mechanism of developmental regulation in lung organogenesis.
Methods
Preparation of timed-pregnant mice and isolation of totalRNA
Approval of the study protocol was obtained from The Mayo
Clinic Institutional Animal Care and Use Committee. All mice
were maintained in a specific-pathogen-free animal facility at
Mayo Clinic and all animal experiments were carried out
according to the provisions of the Animal Welfare Act, PHS
Animal Welfare Policy, and the principles of the NIH Guide for
the Care and Use of Laboratory Animals. ICR female mice were
bred for timed pregnancies. The day of plug observation was
considered day 0 of gestation. Lungs were isolated by manual
dissection with the aid of a dissecting microscope where necessary.
Lungs were washed with PBS. Total RNA was isolated from
pooled whole lungs using Trizol (Invitrogen) for mRNA expression
microarray and mir VanaTM miRNA Isolation Kit (Ambion) for
ABI microRNA real-time PCR array according to the manufac-
turer’s instructions. RNA quality and integrity was confirmed by
denaturing gel electrophoresis.
mRNA and miRNA arraysThe mRNA expression profiling was performed using the
Affymetrix GeneChip Mouse Genome 430 2.0 Array containing
probes to query more than 39,000 transcripts. The reverse
transcription, labeling and hybridization of mRNA were per-
formed in the Mayo Microarray Shared Resource. The data has
been submitted to the Gene Expression Omnibus (GEO) database
with accession number GSE20954.
MiRNA expression profiling was performed using the Taqman
Rodent MicroRNA Array Card A and Card B (Applied
Biosystems) containing all 521 mature mouse miRNAs in miRBase
10.1 http://microrna.sanger.ac.uk. In brief, miRNA was reverse
transcribed to cDNA using the Megaplex TM RT Rodent Primers
Pool and the TaqMan MicroRNA Reverse Transcription Kit.
Quantitative 384 well TaqMan Low Density Array real-time PCR
was run on the ABI PRISM 7900 System using the TaqMan
Universal PCR Master Mix. Raw miRNA array data was
analyzed by using RQ manager software on the ABI system. All
undetectable data and the data with CT values greater than 35
were treated as 35 [21]. Normalized CT (DCT) was calculated by
comparing each miRNA value to that of small nuclear U6 RNA.
The U6 RNA is a common internal control for each microRNA
array card. The copy number of miRNAs in each cell (assuming
each cell contains 30 pg of total RNA) was calculated from a
formula 10(40-CT
)/3.34/22 that was estimated using synthetic lin-4
miRNA [22]. The data has been submitted to the GEO database
with accession number GSE21052.
Data processing and analysisBoth mRNA and miRNA array data analysis was performed
with the Partek Genomics Suite 6.4 software. For mRNA
expression data, Affymetrix CEL files were imported. The data
were normalized with the Robust Multichip Average Algorithm
[23] and converted to log2 values. For miRNA expression data, the
DCT value was directly imported as a log2 value. The greater the
DCT value, the lower the miRNA expression value (i.e. copy
number). Log data were used for hierarchical clustering and
statistical analysis.
The normalized data were subsequently analyzed by principal
component analysis (PCA) to determine if any intrinsic clustering
or outliers existed within the data set. A combination of descriptive
statistics such as Min/Max (i.e. minimum/maximum; we use
minimum for miRNA as the greater the copy number the smaller
the expression value), Range (the difference between maximal and
minimal values across 7 time points) and the False Discovery Rate
(FDR) adjusted p-values derived from statistical analysis were used
to identify significantly altered miRNAs and mRNA probes.
We analyzed the time course data using 2 different statistical
approaches, ANOVA and a time-course specific statistical method
Lung MicroRNA Networks
PLoS ONE | www.plosone.org 2 May 2010 | Volume 5 | Issue 5 | e10854

implemented in an open source software program, the Extraction
of Differential Gene Expression (EDGE, available at http://www.
genomine.org/edge/) [24]. The cut-off values of the descriptive
statistics were empirically set up at a strict level to minimize off-
target correlations derived from ANOVA. A comparative analysis
using the EDGE approach was performed to exclude observations
made on the basis of a single statistical approach.
Hierarchical cluster analyses were performed using dChip
software (www.dchip.org) on filtered datasets to identify temporal
expression patterns of miRNA and mRNA levels in mouse lung
development.
Pearson correlation analysis was performed between two sets of
time-course expression values for significant miRNAs and mRNA
probes to identify negatively correlated miRNA-mRNA pairs
within certain cut off values. The computational mRNA targets of
each significant miRNA retrieved from the miRBase (version 5)
and TargetScanMouse (5.1) databases were used for validation,
with the assumption that overlaps between negatively correlated
mRNA targets and computationally detected mRNA targets may
imply direct mRNA targets for each miRNA. g:Profiler was used
to convert Transcript IDs from miRBase into Affymetrix
mouse430 Probe Set IDs [25].
A protein profiling dataset generated by shotgun mass
spectrometry from a previous study [26] was used to explore
microRNA-protein correlations. The protein profiling data is a
time course study of protein expression levels with 6 time points,
encompassing the protein data from early embryonic stage E13.5
through adulthood during ICR mouse lung development using
gel-free two-dimensional liquid chromatography coupled to
shotgun tandem mass spectrometry (MudPIT). We integrated
the expression values of each protein detected from three organelle
fractions (i.e. nuclear, mitochondrion, cytosol fractions) into a
unified value and then converted these into log2 values. Pearson
correlation analysis was performed between the time-course
expression values of significant miRNAs and the protein data
across 6 time points with a mapping of the two time courses (E14
to E13.5, E16 to E16, E18 to E18, P2 to P2, P10 to P14 and Adult
to Adult). g:Profiler was used to convert the protein UNIProtKB
IDs into the Affymetrix mouse 430 Probe Set IDs. A similar
approach was used to identify the direct miRNA targets through
comparison with the miRBase file.
Gene ontology biological process and pathway analysisGene ontology (GO) biological process annotations and
pathway annotations (GenMapp, KEGG) were performed against
Affymetrix annotation files using Partek software. We performed
GO analysis and pathway analysis to gain insight into biological
processes and pathways in lung development among different
expression patterns of mRNAs, among direct mRNA targets of
different expression patterns of miRNAs, and among direct
mRNA targets of each miRNA.
Genome localization of miRNAsThe UCSC Genome Brower (genome.ucsc.edu) was used to
visualize and analyze the chromosome localization for total mouse
miRNAs and significant miRNAs involved in lung development.
Results
In total, the expression values of 45,101 probes for mRNA
profiling in 7 time points (2 samples in each time point) were
obtained after normalization. The normalized expression values of
521 miRNAs in the same 7 time points (2 samples in each time
point) were also obtained. The 3-D graphical visualization of the
principal component (PCA) analysis for both mRNA and miRNA
expression values from replicate samples in each time point have
similar patterns (Figure 1).
Three criteria were used for identifying mRNA probes and
miRNAs which changed significantly in expression level during
different time points of lung development. For mRNA expression
data, the cut-off value for the descriptive statistic Max was set as
.7, and the cut-off value of Range as .1.2 (i.e. fold change.2.3).
The p value for ANOVA analysis was set as p,0.05 and further
adjusted by FDR (Step Up, FDR,0.05) to p,0.03. From these
filters, 11,220 probes were identified as dynamically regulated
across the time course. Using the EDGE statistical approach,
11,118 probes were identified as dynamically regulated across the
time course. The overlap between the 2 approaches was 11,046
probes in total, or 98.45% of all probes identified by ANOVA.
For miRNA expression data, a cut-off value for Min was set as
DCT ,10 and a cut-off value for Range was .2.2 (i.e. fold
change.4.6). The p value for ANOVA was set as p,0.05 and
further adjusted by FDR (FDR,0.05) to p,0.017. In total, 117
Figure 1. Scatter plots of miRNA and mRNA data by Principle Component Analysis (PCA). (A) Expression array data for mRNA. (B)Expression array data for miRNA. Samples are colored by different mouse lung development time points. The same color represents the replicatesamples.doi:10.1371/journal.pone.0010854.g001
Lung MicroRNA Networks
PLoS ONE | www.plosone.org 3 May 2010 | Volume 5 | Issue 5 | e10854
dynamically regulated miRNAs were identified through these
filters. Using the EDGE approach, 121 dynamically regulated
miRNAs were identified, with 116 (99.15%) overlapping with
those identified by ANOVA. Of these 116 miRNAs, miR-466d-3p
(1520 fold), miR-449a (975 fold), miR-29a (479 fold), miR-146b
(278 fold) and miR-409-3p (255 fold) were the top five miRNAs
which had the highest fold changes across the dataset. miR-126-
3p, miR-24, miR-16, miR-19b, and miR-17 were the top five
miRNAs with the highest absolute expression values. Of these,
MiR-126-3p has the highest expression value with DCT value 0.14
(i.e. copy number 159299).
mRNA expressionFor characterizing the expression patterns of lung development,
hierarchical clustering analysis was performed to generate a
dendrogram of both mRNA and miRNA data sets that met the
above criteria.
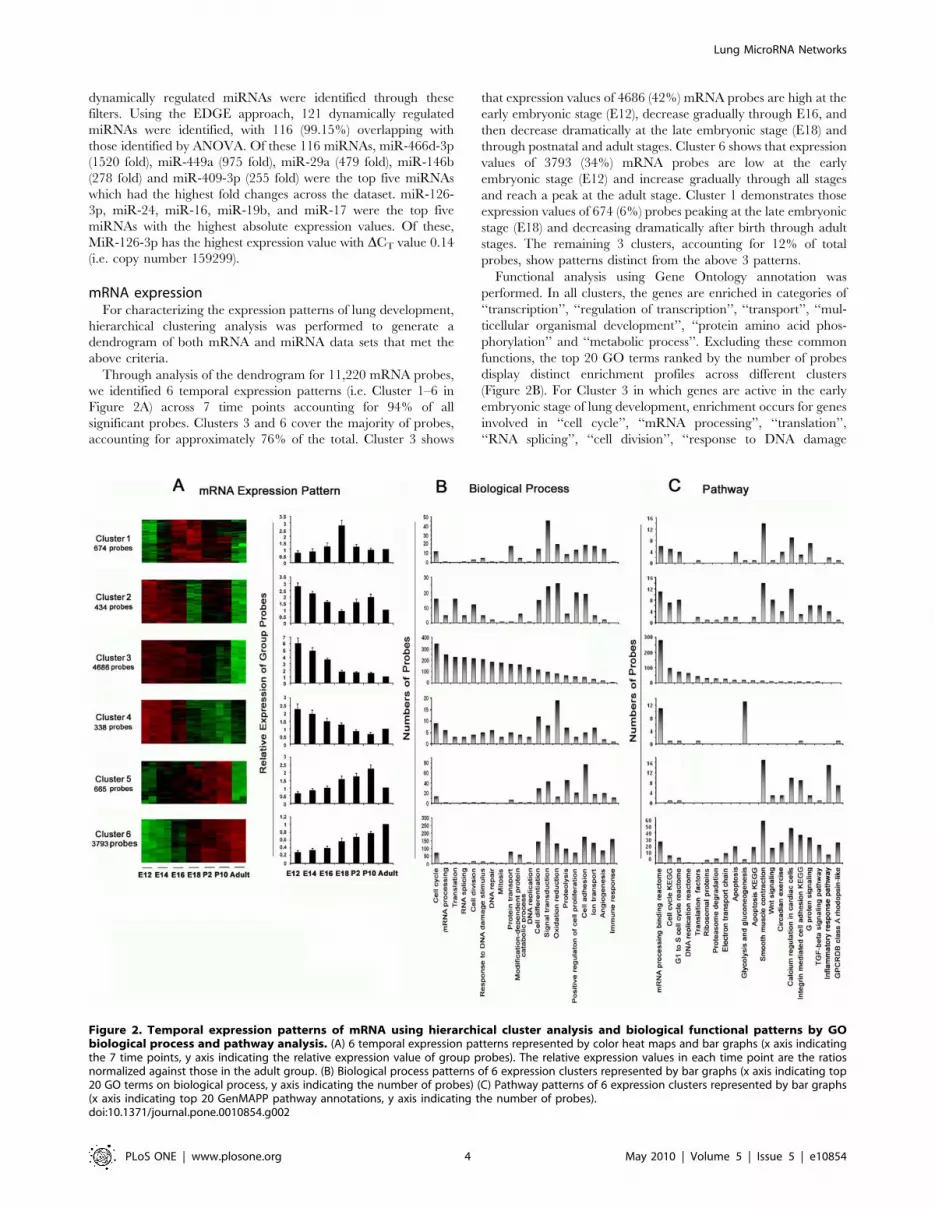
Through analysis of the dendrogram for 11,220 mRNA probes,
we identified 6 temporal expression patterns (i.e. Cluster 1–6 in
Figure 2A) across 7 time points accounting for 94% of all
significant probes. Clusters 3 and 6 cover the majority of probes,
accounting for approximately 76% of the total. Cluster 3 shows
that expression values of 4686 (42%) mRNA probes are high at the
early embryonic stage (E12), decrease gradually through E16, and
then decrease dramatically at the late embryonic stage (E18) and
through postnatal and adult stages. Cluster 6 shows that expression
values of 3793 (34%) mRNA probes are low at the early
embryonic stage (E12) and increase gradually through all stages
and reach a peak at the adult stage. Cluster 1 demonstrates those
expression values of 674 (6%) probes peaking at the late embryonic
stage (E18) and decreasing dramatically after birth through adult
stages. The remaining 3 clusters, accounting for 12% of total
probes, show patterns distinct from the above 3 patterns.
Functional analysis using Gene Ontology annotation was
performed. In all clusters, the genes are enriched in categories of
‘‘transcription’’, ‘‘regulation of transcription’’, ‘‘transport’’, ‘‘mul-
ticellular organismal development’’, ‘‘protein amino acid phos-
phorylation’’ and ‘‘metabolic process’’. Excluding these common
functions, the top 20 GO terms ranked by the number of probes
display distinct enrichment profiles across different clusters
(Figure 2B). For Cluster 3 in which genes are active in the early
embryonic stage of lung development, enrichment occurs for genes
involved in ‘‘cell cycle’’, ‘‘mRNA processing’’, ‘‘translation’’,
‘‘RNA splicing’’, ‘‘cell division’’, ‘‘response to DNA damage
Figure 2. Temporal expression patterns of mRNA using hierarchical cluster analysis and biological functional patterns by GObiological process and pathway analysis. (A) 6 temporal expression patterns represented by color heat maps and bar graphs (x axis indicatingthe 7 time points, y axis indicating the relative expression value of group probes). The relative expression values in each time point are the ratiosnormalized against those in the adult group. (B) Biological process patterns of 6 expression clusters represented by bar graphs (x axis indicating top20 GO terms on biological process, y axis indicating the number of probes) (C) Pathway patterns of 6 expression clusters represented by bar graphs(x axis indicating top 20 GenMAPP pathway annotations, y axis indicating the number of probes).doi:10.1371/journal.pone.0010854.g002
Lung MicroRNA Networks
PLoS ONE | www.plosone.org 4 May 2010 | Volume 5 | Issue 5 | e10854
stimulus’’, ‘‘DNA repair’’, ‘‘mitosis’’ and ‘‘DNA replication’’. This
is in contrast to Cluster 6 where genes are predominantly active in
adult stages, with enrichment in genes involved in ‘‘signal
transduction’’, ‘‘cell differentiation’’, ‘‘immune response’’, ‘‘cell
adhesion’’, ‘‘oxidation reduction’’, and ‘‘angiogenesis’’.
Pathway analysis using GenMAPP and KEGG annotations was
performed for all 6 clusters. Figure 2C shows a comparison of the
top 20 pathways ranked by the number of genes. No common
pathway was identified across all 6 clusters. For Cluster 3, genes
are enriched for pathways ‘‘mRNA processing binding reactome’’,
‘‘cell cycle KEGG’’, ‘‘G1 to S cell cycle reactome’’, and ‘‘DNA
replication reactome’’; whereas for Cluster 6, genes are enriched in
pathways ‘‘smooth muscle contraction’’, ‘‘G protein signaling’’,
‘‘integrin-mediated cell adhesion KEGG’’, ‘‘TGF beta signaling
pathway’’ and ‘‘Wnt signaling’’. For Cluster 1, genes are enriched
rich for ‘‘smooth muscle contraction’’ and ‘‘G protein signaling’’.
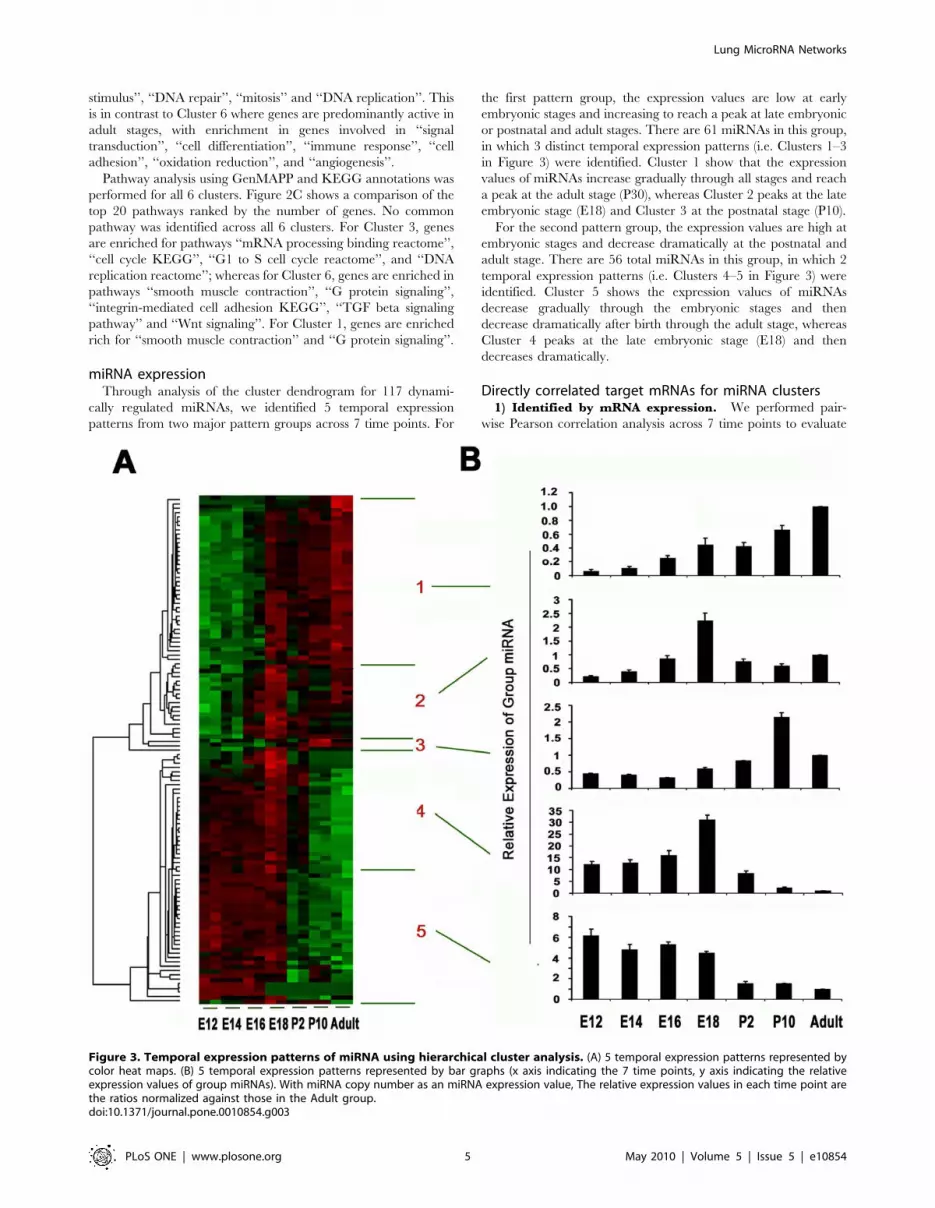
miRNA expressionThrough analysis of the cluster dendrogram for 117 dynami-
cally regulated miRNAs, we identified 5 temporal expression
patterns from two major pattern groups across 7 time points. For
the first pattern group, the expression values are low at early
embryonic stages and increasing to reach a peak at late embryonic
or postnatal and adult stages. There are 61 miRNAs in this group,
in which 3 distinct temporal expression patterns (i.e. Clusters 1–3
in Figure 3) were identified. Cluster 1 show that the expression
values of miRNAs increase gradually through all stages and reach
a peak at the adult stage (P30), whereas Cluster 2 peaks at the late
embryonic stage (E18) and Cluster 3 at the postnatal stage (P10).
For the second pattern group, the expression values are high at
embryonic stages and decrease dramatically at the postnatal and
adult stage. There are 56 total miRNAs in this group, in which 2
temporal expression patterns (i.e. Clusters 4–5 in Figure 3) were
identified. Cluster 5 shows the expression values of miRNAs
decrease gradually through the embryonic stages and then
decrease dramatically after birth through the adult stage, whereas
Cluster 4 peaks at the late embryonic stage (E18) and then
decreases dramatically.
Directly correlated target mRNAs for miRNA clusters1) Identified by mRNA expression. We performed pair-
wise Pearson correlation analysis across 7 time points to evaluate
Figure 3. Temporal expression patterns of miRNA using hierarchical cluster analysis. (A) 5 temporal expression patterns represented bycolor heat maps. (B) 5 temporal expression patterns represented by bar graphs (x axis indicating the 7 time points, y axis indicating the relativeexpression values of group miRNAs). With miRNA copy number as an miRNA expression value, The relative expression values in each time point arethe ratios normalized against those in the Adult group.doi:10.1371/journal.pone.0010854.g003
Lung MicroRNA Networks
PLoS ONE | www.plosone.org 5 May 2010 | Volume 5 | Issue 5 | e10854

potential correlations between 117 miRNA and 11,220 mRNA
expression levels. With setting a cut off value as coefficient .|0.9|,
we detected 69,725 miRNA-mRNA pairs with negative
correlation and 47,532 pairs with positive correlation. We found
that for each miRNA, the greater the number of negatively
correlated pairs, a corresponding greater number of positive
correlation pairs also existed. Interestingly, for those miRNAs in
Cluster 2, 3 and 4, almost no correlated pairs were identified. In
Cluster 5, about 2/3 of miRNAs do not have correlated pairs
identified. Table S1 shows the correlation analysis results of all 117
miRNAs which are sorted by clusters and number of probes.
To test if the miRNA-correlated mRNA genes are direct
miRNA targets, we downloaded the miRBase database and
compared the computational targets of each miRNA with the
miRNA negatively correlated mRNA probes. In total, 148,840
miRNA-mRNA probe pairs were identified from the miRBase
database. 3,067 unique pairs were filtered out as direct miRNA
targets with coefficient ,20.9 (Table S1). We found that all of the
miRNAs having direct targets identified are distributed in Cluster
1 and 5. In total, 80 out of 117 miRNAs did not have direct targets
identified as they did not have negatively correlated mRNAs. For
those miRNAs in Cluster 2, 3 and 4, no direct targets were
identified. About 2/3 of miRNAs in Cluster 5 do not have direct
targets identified.
For comparison with miRBase, the TargetScan database was
also used to predict direct miRNA targets. In total, 330 direct
miRNA targets were filtered out and only 7 miRNAs had direct
targets identified. All of them are in cluster 1 and 5 (Table S1),
indicating that the TargetScan database is more stringent with
potentially lower sensitivity than miRBase.
2) Identified by protein expression. We performed pair-
wise Pearson correlation analysis across 6 time points to evaluate
potential correlations between the expression levels of 117
miRNAs and 3330 UniProtKB proteins. After mapping the
UNIProtKB IDs of 3330 proteins onto 6326 Affymetrix mouse430
Probe Set IDs and setting the cut off value as coefficient .|0.8|,
we detected 41,774 miRNA-protein pairs with negative
correlation. By comparing the miRBase computational targets of
each miRNA/mRNA pair with the miRNA/negatively correlated
protein pair, 1345 unique miRNA/protein pairs were identified as
direct miRNA targets (Table S2). Most of the identified miRNAs
had direct mRNA targets identified except for three, indicating
that correlation with protein levels has a higher yield of
computationally predicted mRNA targets versus those obtained
by mRNA profiling alone (97.4% versus 31.6%). Interestingly,
54.9% of the mRNA probes identified as direct targets through
protein expression data do not belong to the significantly changed
subset (n = 11220) of mRNAs.
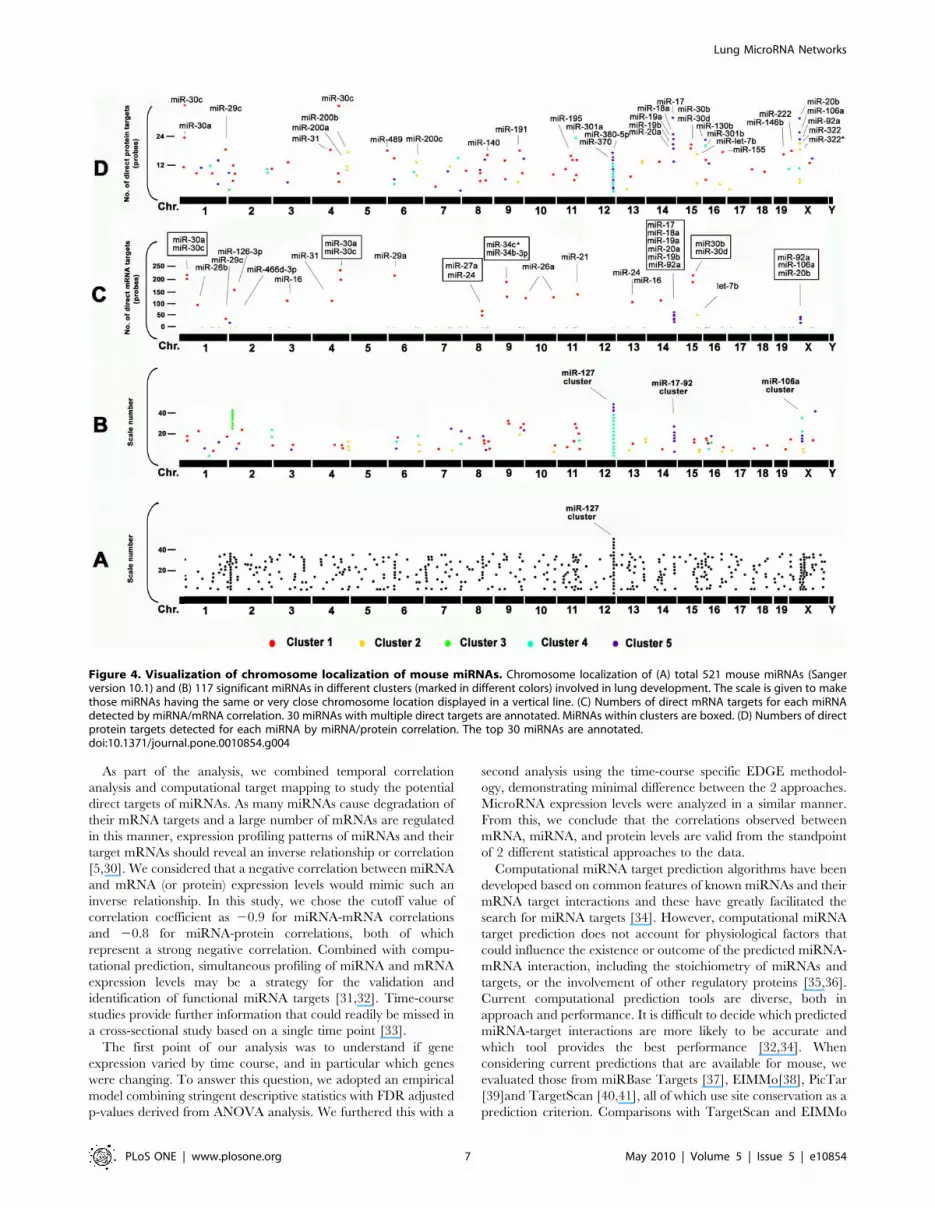
Genome localization of miRNAsMiRNAs are found throughout mammalian genomes. Half of the
known miRNAs are located inside or close to fragile sites which are
genomically unstable and common breakpoints associated with
cancer. Nearly 40% of miRNAs exist in genomic clusters. Some
clusters reflect the processing of a number of miRNAs from a single
large polycistronic transcript such that presumably all of the
miRNAs are under control of the same promoter and in the same
transcriptional orientation [27]. With the stringent criteria that a
cluster should consist of more than two members positioned within
1 Mb, there are 22 miRNA clusters identified in mouse [27,28,29].
The largest is the miR-127 cluster with greater than 50 members on
mouse chromosome 12 (Chr.12). Other large clusters include the
miR-29a cluster on Chr.6, the miR-23a cluster on chr.8, the miR-
17-92 cluster on Chr.14 and the miR-106a cluster on Chr.X
(Figure 4A). Significant miRNAs dynamically regulated in lung
development were positioned throughout the genome except for
Chr.5 and Chr.Y (Figure 4B). 23 miRNAs belonging to the miR-
127 cluster were increased, whereas all 6 miRNAs in the miRNA-
17-92 cluster (mir-17, 18a, 19a, 19b-1, 20a, and 92-1) and 3
miRNAs (mir-20b, 90a-2 and 106a) in the miR-106a cluster that all
belong to miRNA cluster 5 were dramatically decreased (Figure 4).
Interestingly, almost all 23 miRNAs in the miR-127 cluster that
have the same strand orientation belong to miRNA Cluster 4 and
have highest expression around E18. Within the miR-127 cluster,
no miRNA targets were identified by miRNA/mRNA pairing
(Figure 4C), while all had direct mRNA targets when miRNA/
protein pairs were analyzed, such as miR-380-5p, miR-370, and
miR-434. This suggests that the miR-127 cluster may be involved in
part of the regulation of the start of alveolar formation by inhibiting
mRNA translation of specific targets without changes in mRNA
levels. A number of further targets were identified through miRNA/
protein correlations, such as the mir-200 family (miR-200a, miR-
200b and miR-200c), miR-191, miR-195, miR-301, and miR-322
(Figure 4D).
Pathway involvement for individual miRNAsIn this study, we found that a number of miRNA families are
dynamically regulated during mouse lung development. This
includes miRNA families miR-30 (miR-30a, miR-30d, miR-30e,
miR-30b, miR-30c, miR-30e*), miR-24 (miR-24, miR-24-2*),
miR-26 (miR-26a, miR-26b), miR-29 (miR-29a, miR-29c), miR-
34 (miR-34b-3p, miR-34c*) in Cluster 1 which has high expression
in the adulthood stage, and miR-20 (miR-20a, miR-20b) in cluster
5 which has high expression in the early stages of lung
organogenesis. To computationally explore the potential function-
al relevance of dynamically regulated miRNAs during lung
development, we employed biological process and pathway
analysis. We found that miRNAs within the same family or same
genome localization cluster have similar biological functions and
appeared to be involved in similar pathways. For example, there
are 5 miRNA members in the miR-30 family that are involved in
TGF Beta signaling pathway through the gene ‘‘Tgfbr1’’ and 5
miRNAs (miR-17a, 18a, 20a, 20b, 92a) in miR-17-92 cluster that
are involved the same pathway through the gene Smad6. There
are 4 miRNAs (miR-30b, let-7b, 18a, and 19a) that are involved in
the Wnt signaling pathway through the genes Fzd2, Racgap1, Myc
and Prkce. A list of 30 miRNAs with their respective correspond-
ing top 10 GO biological process terms, pathways and pathway-
related target gene names is shown in Table S3.
Discussion
In this study, we explored the dynamic regulation of micro-
RNA, mRNA, and protein levels over the time course of lung
organogenesis using a systematic genome-wide approach. First, we
performed genome-wide mRNA and miRNA profiling across all
recognized stages of lung development beginning at early
embryonic stages and continuing to adulthood. Second, we
identified the subset of mRNAs and miRNAs for which expression
values changed significantly across the time course using statistical
analysis. Thirdly, we clustered the significant subsets to identify
their temporal expression patterns with GO functional enrichment
and pathway analysis. Fourthly, we performed both miRNA-
mRNA and miRNA-protein correlation analyses and integrated
these with computational target predictions to study potential
direct targets of miRNAs. Lastly, we explored the biological
function and pathway roles of miRNAs involved in lung
development through their mRNA or protein targets.
Lung MicroRNA Networks
PLoS ONE | www.plosone.org 6 May 2010 | Volume 5 | Issue 5 | e10854
As part of the analysis, we combined temporal correlation
analysis and computational target mapping to study the potential
direct targets of miRNAs. As many miRNAs cause degradation of
their mRNA targets and a large number of mRNAs are regulated
in this manner, expression profiling patterns of miRNAs and their
target mRNAs should reveal an inverse relationship or correlation
[5,30]. We considered that a negative correlation between miRNA
and mRNA (or protein) expression levels would mimic such an
inverse relationship. In this study, we chose the cutoff value of
correlation coefficient as 20.9 for miRNA-mRNA correlations
and 20.8 for miRNA-protein correlations, both of which
represent a strong negative correlation. Combined with compu-
tational prediction, simultaneous profiling of miRNA and mRNA
expression levels may be a strategy for the validation and
identification of functional miRNA targets [31,32]. Time-course
studies provide further information that could readily be missed in
a cross-sectional study based on a single time point [33].
The first point of our analysis was to understand if gene
expression varied by time course, and in particular which genes
were changing. To answer this question, we adopted an empirical
model combining stringent descriptive statistics with FDR adjusted
p-values derived from ANOVA analysis. We furthered this with a
second analysis using the time-course specific EDGE methodol-
ogy, demonstrating minimal difference between the 2 approaches.
MicroRNA expression levels were analyzed in a similar manner.
From this, we conclude that the correlations observed between
mRNA, miRNA, and protein levels are valid from the standpoint
of 2 different statistical approaches to the data.
Computational miRNA target prediction algorithms have been
developed based on common features of known miRNAs and their
mRNA target interactions and these have greatly facilitated the
search for miRNA targets [34]. However, computational miRNA
target prediction does not account for physiological factors that
could influence the existence or outcome of the predicted miRNA-
mRNA interaction, including the stoichiometry of miRNAs and
targets, or the involvement of other regulatory proteins [35,36].
Current computational prediction tools are diverse, both in
approach and performance. It is difficult to decide which predicted
miRNA-target interactions are more likely to be accurate and
which tool provides the best performance [32,34]. When
considering current predictions that are available for mouse, we
evaluated those from miRBase Targets [37], EIMMo[38], PicTar
[39]and TargetScan [40,41], all of which use site conservation as a
prediction criterion. Comparisons with TargetScan and EIMMo
Figure 4. Visualization of chromosome localization of mouse miRNAs. Chromosome localization of (A) total 521 mouse miRNAs (Sangerversion 10.1) and (B) 117 significant miRNAs in different clusters (marked in different colors) involved in lung development. The scale is given to makethose miRNAs having the same or very close chromosome location displayed in a vertical line. (C) Numbers of direct mRNA targets for each miRNAdetected by miRNA/mRNA correlation. 30 miRNAs with multiple direct targets are annotated. MiRNAs within clusters are boxed. (D) Numbers of directprotein targets detected for each miRNA by miRNA/protein correlation. The top 30 miRNAs are annotated.doi:10.1371/journal.pone.0010854.g004
Lung MicroRNA Networks
PLoS ONE | www.plosone.org 7 May 2010 | Volume 5 | Issue 5 | e10854

require stringent seed pairing, while miRBase requires moderately
stringent seed pairing. Although evaluation of proteomic changes
after miRNA addition or deletion provides evidence that tools
stringently requiring seed pairing perform better than those tools
with more moderately stringent cutoffs [42,43], perfect base pair
matching does not guarantee interaction between specific miRNAs
and target genes [35]. Wobble base pairs are often tolerated in
target sites [44,45]. For the current study, both miRBase and
TargetScan were used to predict direct miRNA targets by
comparing negatively correlated mRNA expression with compu-
tational predictions. 3,067 unique miRNA-mRNA pairs (involving
37 unique miRNAs) were identified using miRBase whereas 330
pairs (7 unique miRNAs) were identified using the TargetScan
database. We considered it appropriate to use the miRBase target
prediction database given the relatively higher prediction sensitiv-
ity, although it is not clear how much specificity is lost with this
approach.
Initially, we examined miRNA-mRNA correlations to predict
the direct targets of 117 dynamically regulated miRNAs.
Surprisingly, 68.4% (80) of miRNAs in this group did not have
any direct targets identified based on a correlation coefficient
cutoff value of 20.9. To examine this further, we relaxed the
cutoff values and found that 51.3% (60) of miRNAs with a cutoff
value of correlation coefficient 20.8, and 33.3% (39) of miRNAs
for a cutoff of 20.7, do not have direct targets identified (Table
S1). The results imply that a large number of miRNAs
dynamically regulated during lung organogenesis may not directly
cause degradation of mRNA targets. As miRNAs have the
potential to modulate protein translation independent of degrad-
ing the mRNA for a specific target, we analyzed our data in the
context of a previously published protein database for lung
development [26]. Looking for negative correlations between
miRNA level and protein expression based on spectral counts, we
found that a higher number of miRNAs, 114 (97.4%) had a direct
target protein identified (Table S2). Importantly, 54.9% of
mRNAs for which a corresponding direct target protein was
identified do not belong to the subset of significantly varying
mRNAs during lung development, implying that a number of
miRNAs may effect decreased protein expression even though
they do not cause detectable changes in mRNA level. In other
words, a large number of protein level changes may occur that
would not be apparent from the study of mRNA data alone.
The underlying mechanisms explaining these observations
remain to be investigated. Selbach et al pointed out that whether
the mRNA is cleaved or whether productive translation is
inhibited depends on the complementarity of the miRNA to the
mRNA. If the complementarity is not enough for cleavage but still
involves some degree of binding, then translation will be repressed
[42]. However, it has been demonstrated that although some
targets are repressed without detectable changes in mRNA levels,
those translationally repressed by more than a third also displayed
detectable mRNA decreases, and, for the more highly repressed
targets, mRNA degradation usually comprised the major compo-
nent of repression. The impact of miRNAs on the proteome
indicated that for most interactions miRNAs act as rheostats to
make fine-scale adjustment to protein output [43]. Our data
suggest there are at least two major functional patterns of miRNA
regulation of gene and protein levels in mouse lung development:
1) directly downregulating mRNA levels; 2) directly repressing
translation of genes without detectable changes in mRNA levels.
Individual miRNAs may target hundreds of mRNAs and
individual genes may be regulated by a number of miRNAs or
multiple members of same miRNA family. Individual miRNAs
have predicted propensity to target genes with related functions
which can provide insight into the biological roles of individual
miRNAs [34,38]. The function of the target genes for Cluster 1
miRNAs are highly related with cell proliferation as they are
enriched for GO biological processes ‘‘cell cycle’’, ‘‘mitosis’’,
‘‘DNA replication’’ ‘‘DNA repair’’, and ‘‘RNA splicing’’. Specif-
ically, we identified a number of genes such as E2F1, P53, c-Myc,
CDK2, and others that regulate progenitor cell fate and play
important roles in lung development and lung cancer [9,10]. In
addition, a number of studies have reported that c-Myc expression
is repressed by let-7, that p53 interacts with miR-34, and that
growth arrest can be induced by miR-34 through modulation of
the E2F pathway in human colon cancer cells [46,47,48]. In
Cluster 5, we noticed that cluster miR-17-92 and cluster miR-106a
had high expression in early embryonic development of the lung
then steady declines through the remainder of development and
into adulthood. A number of studies have demonstrated the
miRNAs in these two clusters play critical roles in lung
development and lung cancer [16,19,49,50]. The potential
mechanisms involved may include activation of targets such as
RbI2, E2F1-3, and PTEN that are all known cell cycle regulators
[19,51,52]. However, Carraro et al reports that function of the
miR-17-92 cluster may be to maintain the structural homeostasis
of developing lung epithelium through the targets Mapk14 and
stat3, as systematic inhibition of miR-17 did not produce an arrest
of proliferation [53]. In this study, the direct mRNA targets of
miRNA-17-92 appeared to be a group of genes that have lowest
expression in early embryonic development and highest expression
in adulthood. The expression pattern indicates that the cluster
most likely plays a role in the later stages of lung development after
lung branching morphogenesis is complete. GO biological process
analysis shows that the function of these genes focus on ‘‘protein
phosphorylation’’, ‘‘metabolic process’’, ‘‘signal transduction’’,
‘‘intercellular signaling cascade’’, ‘‘cell adhesion’’ and ‘‘angiogen-
esis’’. Pathway analyses demonstrate that the miRNA-17-92
cluster is involved in G-protein signaling, the Wnt pathway
through Prkce as well as TGF-beta pathway signaling through
Smad6 (which is already confirmed by [54]).
Our results provide important insights into the global dynamics
of miRNA networks and their mediation of mRNA translation
into protein products. A number of limitations to the current study
should be noted. One is the fact that the discovery and
characterization of new miRNAs is an ongoing process. A further
limitation is the fact that analyses of RNA and protein in this study
were derived from bulk whole lung, and do not provide
representation of the myriad of cell types and their organization
present in the developing or adult lung. An important extension to
the current study will be to localize the dynamically regulated
miRNAs identified to specific regional niches within the
developing lung.
In this study, we analyzed the expression patterns of
dynamically regulated miRNA, mRNA and proteins during lung
development. Furthermore, we developed a novel approach to
systematically predict potential direct targets of miRNAs from the
data through both miRNA-mRNA and miRNA-protein correla-
tion analysis and computational target mapping. Systematic
analysis of microRNA, mRNA, and protein levels over the time
course of lung organogenesis demonstrates dynamic regulation
and reveals 2 distinct patterns of miRNA-mRNA interaction: 1)
increased levels of specific miRNAs directly correlating with
downregulation of predicted mRNA targets; and 2) increased
levels of specific miRNAs directly correlating with downregulation
of translated target proteins without detectable changes in mRNA
levels. The data also suggests that the translation of target proteins
affected by miRNAs independent of changes in mRNA level
Lung MicroRNA Networks
PLoS ONE | www.plosone.org 8 May 2010 | Volume 5 | Issue 5 | e10854

appears to be a prominent mechanism of developmental
regulation in lung organogenesis.
Supporting Information
Table S1 Correlation analysis and direct target prediction
results of 117 significant miRNAs by miRNA/mRNA correlations
in mouse lung development.
Found at: doi:10.1371/journal.pone.0010854.s001 (0.18 MB
PDF)
Table S2 Correlation analysis and direct target predication
results of 117 significant miRNA by miRNA/protein correlations
in mouse lung development.
Found at: doi:10.1371/journal.pone.0010854.s002 (0.12 MB
PDF)
Table S3 A list of 30 miRNAs having direct targets identified by
miRNA/mRNA correlation, with their respective corresponding
top 10 GO biological process terms, all pathways and pathway-
related target gene names.
Found at: doi:10.1371/journal.pone.0010854.s003 (0.04 MB
PDF)
Author Contributions
Conceived and designed the experiments: JD DAW. Performed the
experiments: JD. Analyzed the data: JD GJ YWA. Contributed reagents/
materials/analysis tools: JD DAW. Wrote the paper: JD GJ ST JJ TK
DAW.
References
1. Du T, Zamore PD (2005) microPrimer: the biogenesis and function of
microRNA. Development 132: 4645–4652.
2. Lytle JR, Yario TA, Steitz JA (2007) Target mRNAs are repressed as efficiently
by microRNA-binding sites in the 59 UTR as in the 39 UTR. Proc Natl Acad
Sci U S A 104: 9667–9672.
3. Chen JF, Mandel EM, Thomson JM, Wu Q, Callis TE, et al. (2006) The role of
microRNA-1 and microRNA-133 in skeletal muscle proliferation and differen-tiation. Nat Genet 38: 228–233.
4. Rajewsky N (2006) microRNA target predictions in animals. Nat Genet 38
Suppl: S8–13.
5. Lim LP, Lau NC, Garrett-Engele P, Grimson A, Schelter JM, et al. (2005)Microarray analysis shows that some microRNAs downregulate large numbers
of target mRNAs. Nature 433: 769–773.
6. Alvarez-Garcia I, Miska EA (2005) MicroRNA functions in animal development
and human disease. Development 132: 4653–4662.
7. Lu J, Getz G, Miska EA, Alvarez-Saavedra E, Lamb J, et al. (2005) MicroRNA
expression profiles classify human cancers. Nature 435: 834–838.
8. Croce CM, Calin GA (2005) miRNAs, cancer, and stem cell division. Cell 122:
6–7.
9. Maeda Y, Dave V, Whitsett JA (2007) Transcriptional control of lung
morphogenesis. Physiol Rev 87: 219–244.
10. Dong J, Kislinger T, Jurisica I, Wigle DA (2009) Lung cancer: developmental
networks gone awry? Cancer Biol Ther 8: 312–318.
11. Sekine K, Ohuchi H, Fujiwara M, Yamasaki M, Yoshizawa T, et al. (1999)
Fgf10 is essential for limb and lung formation. Nat Genet 21: 138–141.
12. Yanagi S, Kishimoto H, Kawahara K, Sasaki T, Sasaki M, et al. (2007) Pten
controls lung morphogenesis, bronchioalveolar stem cells, and onset of lung
adenocarcinomas in mice. J Clin Invest 117: 2929–2940.
13. Zhang Y, Goss AM, Cohen ED, Kadzik R, Lepore JJ, et al. (2008) A Gata6-Wnt
pathway required for epithelial stem cell development and airway regeneration.
Nat Genet 40: 862–870.
14. Reymann S, Borlak J (2008) Transcription profiling of lung adenocarcinomas of
c-myc-transgenic mice: identification of the c-myc regulatory gene network.
BMC Syst Biol 2: 46.
15. Harris KS, Zhang Z, McManus MT, Harfe BD, Sun X (2006) Dicer function is
essential for lung epithelium morphogenesis. Proc Natl Acad Sci U S A 103:
2208–2213.
16. Ventura A, Young AG, Winslow MM, Lintault L, Meissner A, et al. (2008)
Targeted deletion reveals essential and overlapping functions of the miR-17
through 92 family of miRNA clusters. Cell 132: 875–886.
17. Williams AE, Moschos SA, Perry MM, Barnes PJ, Lindsay MA (2007)Maternally imprinted microRNAs are differentially expressed during mouse
and human lung development. Dev Dyn 236: 572–580.
18. Lu Y, Okubo T, Rawlins E, Hogan BL (2008) Epithelial progenitor cells of the
embryonic lung and the role of microRNAs in their proliferation. Proc Am
Thorac Soc 5: 300–304.
19. Lu Y, Thomson JM, Wong HY, Hammond SM, Hogan BL (2007) Transgenic
over-expression of the microRNA miR-17-92 cluster promotes proliferation and
inhibits differentiation of lung epithelial progenitor cells. Dev Biol 310: 442–
453.
20. Bhaskaran M, Wang Y, Zhang H, Weng T, Baviskar P, et al. (2009) MicroRNA-
127 modulates fetal lung development. Physiol Genomics 37: 268–278.
21. Liang Y, Ridzon D, Wong L, Chen C (2007) Characterization of microRNA
expression profiles in normal human tissues. BMC Genomics 8: 166.
22. Chen C, Ridzon DA, Broomer AJ, Zhou Z, Lee DH, et al. (2005) Real-time
quantification of microRNAs by stem-loop RT-PCR. Nucleic Acids Res 33:
e179.
23. Irizarry RA, Hobbs B, Collin F, Beazer-Barclay YD, Antonellis KJ, et al. (2003)
Exploration, normalization, and summaries of high density oligonucleotide arrayprobe level data. Biostatistics 4: 249–264.
24. Storey JD, Xiao W, Leek JT, Tompkins RG, Davis RW (2005) Significance
analysis of time course microarray experiments. Proc Natl Acad Sci U S A 102:12837–12842.
25. Reimand J, Kull M, Peterson H, Hansen J, Vilo J (2007) g:Profiler–a web-based
toolset for functional profiling of gene lists from large-scale experiments. NucleicAcids Res 35: W193–200.
26. Cox B, Kislinger T, Wigle DA, Kannan A, Brown K, et al. (2007) Integrated
proteomic and transcriptomic profiling of mouse lung development and Nmyctarget genes. Mol Syst Biol 3: 109.
27. Huppi K, Volfovsky N, Mackiewicz M, Runfola T, Jones TL, et al. (2007)
MicroRNAs and genomic instability. Semin Cancer Biol 17: 65–73.
28. Altuvia Y, Landgraf P, Lithwick G, Elefant N, Pfeffer S, et al. (2005) Clustering
and conservation patterns of human microRNAs. Nucleic Acids Res 33:
2697–2706.
29. Sewer A, Paul N, Landgraf P, Aravin A, Pfeffer S, et al. (2005) Identification of
clustered microRNAs using an ab initio prediction method. BMC Bioinformatics6: 267.
30. Bagga S, Bracht J, Hunter S, Massirer K, Holtz J, et al. (2005) Regulation by let-
7 and lin-4 miRNAs results in target mRNA degradation. Cell 122: 553–563.
31. Huang JC, Babak T, Corson TW, Chua G, Khan S, et al. (2007) Using
expression profiling data to identify human microRNA targets. Nat Methods 4:
1045–1049.
32. Wang YP, Li KB (2009) Correlation of expression profiles between microRNAs
and mRNA targets using NCI-60 data. BMC Genomics 10: 218.
33. Jayaswal V, Lutherborrow M, Ma DD, Hwa Yang Y (2009) Identification ofmicroRNAs with regulatory potential using a matched microRNA-mRNA time-
course data. Nucleic Acids Res 37: e60.
34. Bartel DP (2009) MicroRNAs: target recognition and regulatory functions. Cell136: 215–233.
35. Didiano D, Hobert O (2006) Perfect seed pairing is not a generally reliable
predictor for miRNA-target interactions. Nat Struct Mol Biol 13: 849–851.
36. Doench JG, Sharp PA (2004) Specificity of microRNA target selection in
translational repression. Genes Dev 18: 504–511.
37. Griffiths-Jones S, Saini HK, van Dongen S, Enright AJ (2008) miRBase: tools formicroRNA genomics. Nucleic Acids Res 36: D154–158.
38. Gaidatzis D, van Nimwegen E, Hausser J, Zavolan M (2007) Inference ofmiRNA targets using evolutionary conservation and pathway analysis. BMC
Bioinformatics 8: 69.
39. Krek A, Grun D, Poy MN, Wolf R, Rosenberg L, et al. (2005) CombinatorialmicroRNA target predictions. Nat Genet 37: 495–500.
40. Friedman RC, Farh KK, Burge CB, Bartel DP (2009) Most mammalian
mRNAs are conserved targets of microRNAs. Genome Res 19: 92–105.
41. Grimson A, Farh KK, Johnston WK, Garrett-Engele P, Lim LP, et al. (2007)
MicroRNA targeting specificity in mammals: determinants beyond seed pairing.
Mol Cell 27: 91–105.
42. Selbach M, Schwanhausser B, Thierfelder N, Fang Z, Khanin R, et al. (2008)
Widespread changes in protein synthesis induced by microRNAs. Nature 455:
58–63.
43. Baek D, Villen J, Shin C, Camargo FD, Gygi SP, et al. (2008) The impact of
microRNAs on protein output. Nature 455: 64–71.
44. Miranda KC, Huynh T, Tay Y, Ang YS, Tam WL, et al. (2006) A pattern-basedmethod for the identification of MicroRNA binding sites and their correspond-
ing heteroduplexes. Cell 126: 1203–1217.
45. Vella MC, Choi EY, Lin SY, Reinert K, Slack FJ (2004) The C. elegansmicroRNA let-7 binds to imperfect let-7 complementary sites from the lin-41
39UTR. Genes Dev 18: 132–137.
46. Ji Q, Hao X, Zhang M, Tang W, Yang M, et al. (2009) MicroRNA miR-34inhibits human pancreatic cancer tumor-initiating cells. PLoS One 4: e6816.
47. Kim HH, Kuwano Y, Srikantan S, Lee EK, Martindale JL, et al. (2009) HuR
recruits let-7/RISC to repress c-Myc expression. Genes Dev 23: 1743–1748.
Lung MicroRNA Networks
PLoS ONE | www.plosone.org 9 May 2010 | Volume 5 | Issue 5 | e10854

48. Tazawa H, Tsuchiya N, Izumiya M, Nakagama H (2007) Tumor-suppressive
miR-34a induces senescence-like growth arrest through modulation of the E2Fpathway in human colon cancer cells. Proc Natl Acad Sci U S A 104:
15472–15477.
49. He L, Thomson JM, Hemann MT, Hernando-Monge E, Mu D, et al. (2005) AmicroRNA polycistron as a potential human oncogene. Nature 435: 828–833.
50. Lee EJ, Baek M, Gusev Y, Brackett DJ, Nuovo GJ, et al. (2008) Systematicevaluation of microRNA processing patterns in tissues, cell lines, and tumors.
Rna 14: 35–42.
51. Sylvestre Y, De Guire V, Querido E, Mukhopadhyay UK, Bourdeau V, et al.(2007) An E2F/miR-20a autoregulatory feedback loop. J Biol Chem 282:
2135–2143.
52. Dews M, Homayouni A, Yu D, Murphy D, Sevignani C, et al. (2006)
Augmentation of tumor angiogenesis by a Myc-activated microRNA cluster. Nat
Genet 38: 1060–1065.
53. Carraro G, El-Hashash A, Guidolin D, Tiozzo C, Turcatel G, et al. (2009) miR-
17 family of microRNAs controls FGF10-mediated embryonic lung epithelial
branching morphogenesis through MAPK14 and STAT3 regulation of E-
Cadherin distribution. Dev Biol 333: 238–250.
54. Petrocca F, Vecchione A, Croce CM (2008) Emerging role of miR-106b-25/
miR-17-92 clusters in the control of transforming growth factor beta signaling.
Cancer Res 68: 8191–8194.
Lung MicroRNA Networks
PLoS ONE | www.plosone.org 10 May 2010 | Volume 5 | Issue 5 | e10854