generic approach for the sensitive absolute quantification of large undigested peptides in plasma...
TRANSCRIPT

G
C
Gps
Ha
b
c
d
e
a
ARR2AA
KLPAUE
1
tuotpfpca
db
0d
ARTICLE IN PRESS Model
HROMA-352575; No. of Pages 8
Journal of Chromatography A, xxx (2011) xxx– xxx
Contents lists available at SciVerse ScienceDirect
Journal of Chromatography A
jou rn al h om epage: www.elsev ier .com/ locat e/chroma
eneric approach for the sensitive absolute quantification of large undigestedeptides in plasma using a particular liquid chromatography–mass spectrometryetup
amid Reza Sobhia,b,1, Bilgin Vatansevera,c,d,1, Arno Wortmanne, Eric Grouzmannc, Bertrand Rochata,∗
Quantitative Mass Spectrometry Facility, University Hospital of Lausanne, CHUV, BH18-228, 1011 Lausanne, SwitzerlandDepartment of Chemistry, Tehran Payamenoor University, Tehran, IranClinical Pharmacology, University Hospital of Lausanne, CHUV, Lausanne, SwitzerlandNon-Clinical Development DMPK, Global Bioanalytics, Bioanalytical NCE Laboratory, Merck Serono, Colleretto Giacosa (TO), ItalyAnalytical and Formulation Development, F. Hoffmann-La Roche Ltd., Basel, Switzerland
r t i c l e i n f o
rticle history:eceived 1 September 2011eceived in revised form3 September 2011ccepted 26 September 2011vailable online xxx
eywords:C–MS
a b s t r a c t
A generic LC–MS approach for the absolute quantification of undigested peptides in plasma at mid-picomolar levels is described. Nine human peptides namely, brain natriuretic peptide (BNP), substanceP (SubP), parathyroid hormone 1–34 (PTH), C-peptide, orexines A and B (Orex-A and -B), oxytocin (Oxy),gonadoliberin-1 (gonadothropin releasing-hormone or luteinizing hormone-releasing hormone, LHRH)and �-melanotropin (�-MSH) were targeted. Plasma samples were extracted via a 2-step procedure:protein precipitation using 1 vol of acetonitrile followed by ultrafiltration of supernatants on membraneswith a MW cut-off of 30 kDa. By applying a specific LC–MS setup, large volumes of filtrates (e.g., 2 × 750 �L)were injected and the peptides were trapped on a 1 mm i.d. × 10 mm length C8 column using a 10× on-line
eptidebsolute quantificationltrafiltrationxtraction protocol
dilution. Then, the peptides were back-flushed and a second on-line dilution (2×) was applied during thetransfer step. The refocalized peptides were resolved on a 0.3 mm i.d. C18 analytical column. Extractionrecovery, matrix effect and limits of detection were evaluated. Our comprehensive protocol demonstratesa simple and efficient sample preparation procedure followed by the analysis of peptides with limits ofdetection in the mid-picomolar range. This generic approach can be applied for the determination of mosttherapeutic peptides and possibly for endogenous peptides with latest state-of-the-art instruments.
. Introduction
The absolute quantification of native or therapeutic pep-ides is crucial when studying their fate and attempting tonderstand their pharmacological action(s). Indeed, the kineticsf peptides in plasma or tissue is controlled by the activi-ies of many proteases/peptidases [1,2]. Proteases will generateeptides from proteins or pro-peptides and will further trans-orm them into active or inactive fragments underlying theroteome–protease–peptidome relationship and peptidomics con-ept [1–3]. Therefore, it is necessary to quantify peptides withccuracy and specificity.
Please cite this article in press as: H.R. Sobhi, et al., J. Chromatogr. A (2011)
During the last few decades, immunoassays have been the stan-ard methodology for the sensitive quantification of peptides iniomatrices. Until recently mass spectrometry has always been
∗ Corresponding author. Tel.: +41 21 314 41 58; fax: +41 21 314 42 88.E-mail address: [email protected] (B. Rochat).URL: http://www.unil.ch/qmsf (B. Rochat).
1 Both authors have contributed equally to this work.
021-9673/$ – see front matter © 2011 Elsevier B.V. All rights reserved.oi:10.1016/j.chroma.2011.09.072
© 2011 Elsevier B.V. All rights reserved.
considered to be less sensitive than immunoassays, especially forthe quantification of large peptides (>2000 amu). However, recentdevelopments in LC–MS technology have challenged this idea.
In addition, the use of antibodies that are not fully ableto distinguish between peptidic fragments derived from thesame native peptide, can explain the limitations of manyimmunoassays when applied to pharmacokinetic studies ofpeptides. This lack of assay specificity generally results inpoor pharmacokinetic–pharmacodynamic (PK–PD) relationships.Therefore, mass spectrometry has a key role to play in the dynamicstudy of the peptidome since it can achieve specific identificationand absolute quantification (isotopic dilution assay) of peptides.
The peptidome, composed of thousands of native peptides, isstill a terra incognita [1] and is a very promising field of investigationin attempting to discover biomarkers and signaling messengers[1,2,4]. However, there is still a need for a generic analyti-cal approach for quantitative peptidomics including hydrophobic
, doi:10.1016/j.chroma.2011.09.072
and hydrophilic peptides. At present, the development of sen-sitive methods for peptide determination can be dramaticallytime consuming. This becomes apparent when considering thatthe peptidome is mostly composed of large (15–50 amino acids;

ING Model
C
2 matog
M(
mSs[LwpoaatL[t[lwmmt
o(tauscm
td(cuoasPurtah
F2
ARTICLEHROMA-352575; No. of Pages 8
H.R. Sobhi et al. / J. Chro
W <15 kDa) and amphiphilic peptides found at picomolar levels1–100 pg/mL) in biomatrices [2,5–7].
In the literature, numerous methods for the quantitative deter-ination of peptides have been published and reviewed [8–10].
ample preparation can use one or a combination of multipleteps such as protein precipitation [11–15], solid phase extraction15–17], peptide or protein tryptic digestions [17–19], decoupledC fractionation [16,20], ultrafiltration [21,22], immuno-extractionith grafted antibodies on beads [19,20,23,24] or on LC stationaryhases [25]. The mass spectrometer is usually coupled to a normalr nano-LC–ESI system [14–16,20–24] and in some cases directly to
MALDI source [20–27]. When LC systems are used, various setupsre employed: classical 1D-LC with nano to narrow columns (75 �mo 2.1 mm i.d. columns, respectively) [24,25], pre-concentration-C with trap and analytical columns of various inner diameters16,20], 2D-LC with 2 or 3 columns [25,26] with, in some cases, theransfer of the “hart-cut” fraction only onto the analytical column14,15,26]. All the above mentioned protocols have yielded simi-ar results with regards to their limits of quantification/detection,
ith peptide levels determined at low to mid-pM range. However,ost of the published methods require time consuming develop-ent and are very targeted to a specific peptide or applicable only
o small hydrophilic peptides (<20 amino acids).Therefore there are still challenges in developing LC–MS meth-
ds for quantitative determination of large undigested peptides10–50 amino acids length corresponding to most signaling pep-ides) at picomolar levels in plasma and other biomatrices. Inddition, taking into account that there are currently no widelysed protocols for the determination of native peptides using masspectrometry [8–10], bioanalysts must still face critical choicesoncerning biomatrice pre-treatment, sample extraction, chro-atography, LC setup and MS detection.In this article, a generic approach for the analysis of large pep-
ides at picomolar levels by LC–MS is described and has beeneveloped around some working hypotheses that we have definedFig. 1). This generic approach results in a simple extraction pro-edure using protein precipitation with 1 vol of MeCN followed byltrafiltration on a membrane with a 30 kDa molecular weight cut-ff (MWCO) and the direct injection of large extracted volumes on
specific LC–MS setup (Fig. 2). First, in the pre-concentration (PC)tep, large volumes of extracts are injected (typically 2 × 750 �L).eptides are trapped onto a 1 mm i.d. × 10 mm length C8 trap col-mn by applying a 10× on-line dilution of the sample (sample
Please cite this article in press as: H.R. Sobhi, et al., J. Chromatogr. A (2011)
efocalization; 1stR). Interestingly, injection of extracts that con-ain a high content of organic solvent (typically 50% MeCN) is ansset since organic solvents can strongly reduce adsorption of largeydrophobic or amphiphilic peptides on surfaces [8,9,28–30]. In
ig. 1. Working hypotheses for the development of a generic approach for the determR-PC-LC–MS: 2 refocalization with pre-concentration LC–MS method.
PRESSr. A xxx (2011) xxx– xxx
addition, there is no need for a drying-reconstitution step thatfrequently leads to important loss of peptides [10]. Secondly, thecolumn switching setup allows a back-flushing of the trapped ana-lytes from the enrichment column to the 0.3 mm i.d. C18 analyticalcolumn. During the transfer between the 2 columns, the eluentcontaining the peptides is diluted (second refocalization; 2ndR),allowing the peptides to be refocalized on the analytical column.Finally, the peptides are resolved by a stepwise gradient whichyields narrow LC peaks (typically 4–5 s at half height at 8 �L/min).This column switching setup consisting of 2 refocalization steps fol-lowed by a sample pre-concentration (2R-PC-LC–MS), was coupledto a linear ion trap mass spectrometer (Fig. 2).
Nine human peptides have been selected to validate thisgeneric procedure: brain natriuretic peptide (BNP), C-peptide (C-Pep), �-melanotropin (�-MSH), substance P (SubP), luteinizinghormone-releasing hormone (LHRH), Ocytocine (Ocyto), orexinesA and B (Orex-A/-B) and parathyroid hormone 1–34 (PTH). Theircharacteristics are given in Table 1. They have been spiked andextracted from human plasma and analyzed on the specific LC setupdescribed herein (Fig. 2). Using 750 �L of citrated plasma, the limitsof detection (LOD) of the peptides studied were determined to bein the mid-pM range and the calibration curves yielded good corre-lation coefficients even though no isotopic internal standards (IS)were used.
2. Experimental
2.1. Chemicals and materials
Water was obtained from Milli-Q system (Millipore,Switzerland). Both Formic acid and Guanidinium HCl (Guan-HCl)were purchased from Sigma–Aldrich (Switzerland). HPLC-grade acetonitrile was purchased from Biosolve ULC/MS (TheNetherlands). The peptides were obtained either from Bachem AG(Switzerland) or American Peptide Company (USA). Stock solutionswere prepared according to the manufacturer’s recommendationsand usually diluted with water to 1 mg/mL in the silanized glassvial containing the dry peptide. Classical plastic tubes and tipswere used. Polypropylene injection tubes with the capacity of1.8 mL were used. The centrifugal filter units, purchased fromMillipore (Switzerland) were Amicon Ultra-4 containing a regen-erated cellulose membrane of 3 cm2 with a 30 kDa MW cut-off. Theblood collection tubes were citrate S-monovettes, purchased from
, doi:10.1016/j.chroma.2011.09.072
SARSTEDT Corp. (Switzerland). Protein precipitation was done at1850 × g, 15 min, 4 ◦C on a Beckman J6B centrifuge. Ultrafiltrationwas performed at 9605 × g, 60 min, 4 ◦C on a Beckman Avanti-J-30Icentrifuge with a JLA-16-250, 25◦ fixed angle rotor.
ination of large peptides in plasma by LC–MS. MWCO: molecular weight cut-off;
ARTICLE IN PRESSG Model
CHROMA-352575; No. of Pages 8
H.R. Sobhi et al. / J. Chromatogr. A xxx (2011) xxx– xxx 3
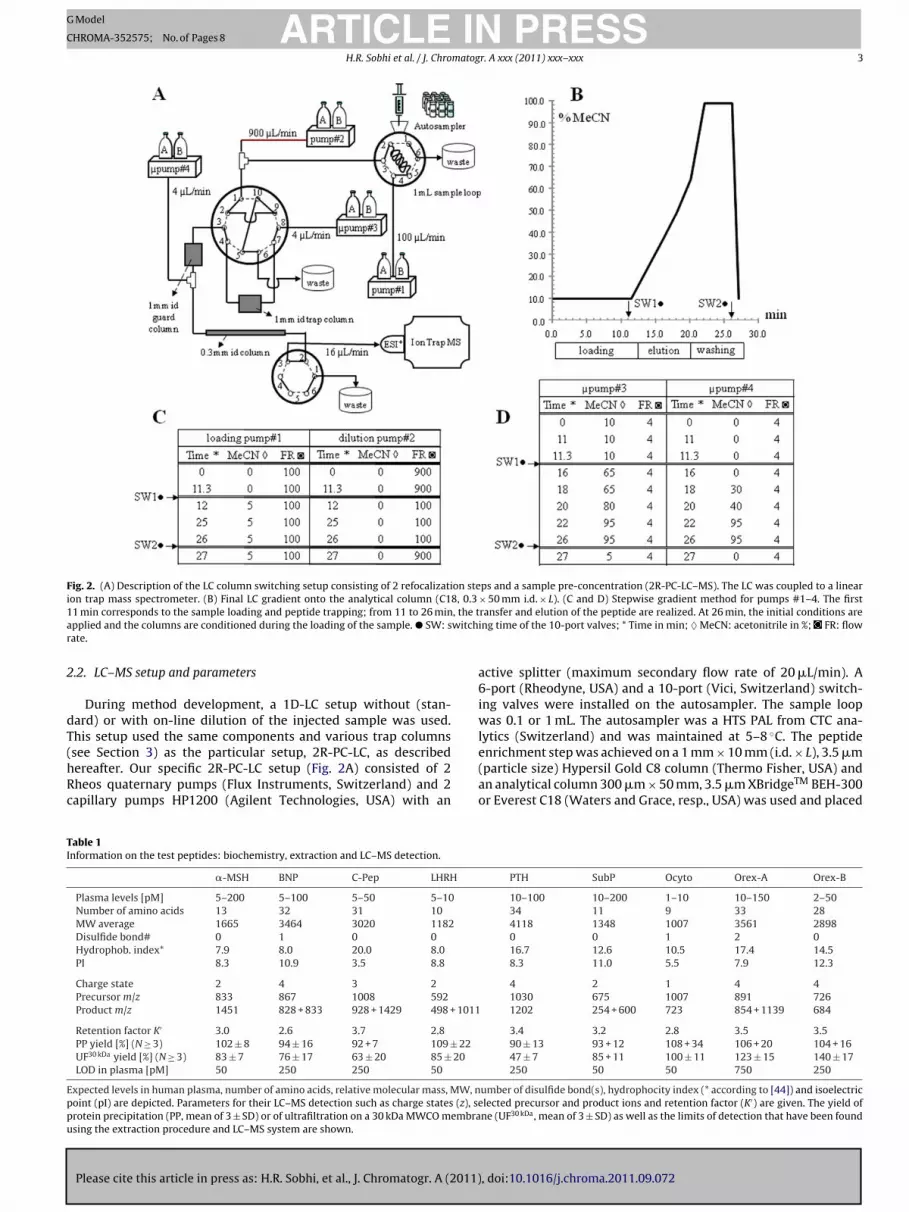
Fig. 2. (A) Description of the LC column switching setup consisting of 2 refocalization steps and a sample pre-concentration (2R-PC-LC–MS). The LC was coupled to a linearion trap mass spectrometer. (B) Final LC gradient onto the analytical column (C18, 0.3 × 50 mm i.d. × L). (C and D) Stepwise gradient method for pumps #1–4. The first1 , the ta witchr
2
dT(hRc
TI
Eppu
1 min corresponds to the sample loading and peptide trapping; from 11 to 26 minpplied and the columns are conditioned during the loading of the sample. � SW: sate.
.2. LC–MS setup and parameters
During method development, a 1D-LC setup without (stan-ard) or with on-line dilution of the injected sample was used.his setup used the same components and various trap columns
Please cite this article in press as: H.R. Sobhi, et al., J. Chromatogr. A (2011)
see Section 3) as the particular setup, 2R-PC-LC, as describedereafter. Our specific 2R-PC-LC setup (Fig. 2A) consisted of 2heos quaternary pumps (Flux Instruments, Switzerland) and 2apillary pumps HP1200 (Agilent Technologies, USA) with an
able 1nformation on the test peptides: biochemistry, extraction and LC–MS detection.
�-MSH BNP C-Pep LHRH
Plasma levels [pM] 5–200 5–100 5–50 5–10
Number of amino acids 13 32 31 10
MW average 1665 3464 3020 1182
Disulfide bond# 0 1 0 0
Hydrophob. index* 7.9 8.0 20.0 8.0
PI 8.3 10.9 3.5 8.8
Charge state 2 4 3 2
Precursor m/z 833 867 1008 592
Product m/z 1451 828 + 833 928 + 1429 498 + 1011
Retention factor K′ 3.0 2.6 3.7 2.8
PP yield [%] (N ≥ 3) 102 ± 8 94 ± 16 92 + 7 109 ± 22
UF30 kDa yield [%] (N ≥ 3) 83 ± 7 76 ± 17 63 ± 20 85 ± 20
LOD in plasma [pM] 50 250 250 50
xpected levels in human plasma, number of amino acids, relative molecular mass, MW, noint (pI) are depicted. Parameters for their LC–MS detection such as charge states (z), serotein precipitation (PP, mean of 3 ± SD) or of ultrafiltration on a 30 kDa MWCO membrasing the extraction procedure and LC–MS system are shown.
ransfer and elution of the peptide are realized. At 26 min, the initial conditions areing time of the 10-port valves; * Time in min; ♦ MeCN: acetonitrile in %; FR: flow
active splitter (maximum secondary flow rate of 20 �L/min). A6-port (Rheodyne, USA) and a 10-port (Vici, Switzerland) switch-ing valves were installed on the autosampler. The sample loopwas 0.1 or 1 mL. The autosampler was a HTS PAL from CTC ana-lytics (Switzerland) and was maintained at 5–8 ◦C. The peptide
, doi:10.1016/j.chroma.2011.09.072
enrichment step was achieved on a 1 mm × 10 mm (i.d. × L), 3.5 �m(particle size) Hypersil Gold C8 column (Thermo Fisher, USA) andan analytical column 300 �m × 50 mm, 3.5 �m XBridgeTM BEH-300or Everest C18 (Waters and Grace, resp., USA) was used and placed
PTH SubP Ocyto Orex-A Orex-B
10–100 10–200 1–10 10–150 2–5034 11 9 33 284118 1348 1007 3561 28980 0 1 2 016.7 12.6 10.5 17.4 14.58.3 11.0 5.5 7.9 12.3
4 2 1 4 41030 675 1007 891 726
1202 254 + 600 723 854 + 1139 684
3.4 3.2 2.8 3.5 3.590 ± 13 93 + 12 108 + 34 106 + 20 104 + 1647 ± 7 85 + 11 100 ± 11 123 ± 15 140 ± 17250 50 50 750 250
umber of disulfide bond(s), hydrophocity index (* according to [44]) and isoelectriclected precursor and product ions and retention factor (K′) are given. The yield ofne (UF30 kDa, mean of 3 ± SD) as well as the limits of detection that have been found

ING Model
C
4 matog
ifmowDtwiwrwsi1Bi5
meTF(laL1ustap3(eiD
wtl
2
ScwtatotptmapgaotHwa
ARTICLEHROMA-352575; No. of Pages 8
H.R. Sobhi et al. / J. Chro
n an oven set at 60 ◦C. The mobile phases comprised of A: 1% (v/v)ormic acid (FA) in water and B: MeCN with 1% FA (v/v). The full LC
ethodology is described in Fig. 2B–D. The loading step consistedf two large injection volumes (typically 2 injections of 750 �L)ith the flow rate of pump #1 set at 100 �L/min with 100% A.uring the sample loading onto the trap column, a 10× on-line dilu-
ion was achieved with pump #2 set at a flow rate of 900 �L/minith 100% A (Fig. 2B; 1stR). Eleven minutes after loading the second
njection, the 10-port valve was switched and the trapped analytesere back-flushed by the capillary pump #3 (�pump #3). The flow
ate of �pump #3 was set at 4 �L/min and a stepwise gradientas initiated according to Fig. 2C. In addition, �pump #4 was also
et at 4 �L/min with 100% A, enabling the peptides to be refocal-zed (2ndR) on the C18 0.3 mm i.d. analytical column (Fig. 2C). At8–21 min, peptides were eluted and both �pumps were set at 95%
for washing the LC system. At 27 min all pumps were set to thenitial conditions. The total run time with 2 injections was about0 min/sample.
Peptide detection was performed using a LTQ Linear Ion Trapass spectrometer from Thermo Fisher (USA) working with an
lectrospray Discovery probe in the positive ionization mode (ESI+).he LC–MS system was controlled using Xcalibur software (Thermoisher, USA). For the ESI source, the sheath and auxiliary gasnitrogen) flow-rates, the capillary voltage and the heated capil-ary temperature were set according to the LC flow rates at 30–50nd 10–20 arbitrary units, +4 kV and 280 ◦C, respectively. With theIT–MS, the helium gas pressure in the collision cell was set at
mTorr (0.13 Pa) as a default value recommended by the MS man-facturer. The maximum injection time and isolation width wereet at 20 ms and 5 arbitrary units, respectively. Scan rate was seto normal speed corresponding to one mass unit resolution. All MScquisitions were acquired in the centroid mode. Chromatographiceaks were slightly smoothed using the boxcar algorithm (set at–5). The chromatographic peaks were composed of at least 6 scansunsmoothed data). ESI and MS parameters such as the collisionnergies (collision induced dissociation, CID) were optimized dur-ng the tuning of peptides (direct infusion of the pure standards).eclustering potential (in-source dissociation) was set at 15–50 V.
From the MS acquisitions, extracted ion chromatograms (XICs)ere built with one or some peptide-specific fragment ions iden-
ified during the tuning. Selected precursor and product ions areisted in Table 1.
.3. Sample preparation
Plasma samples were taken from healthy volunteers in 9 mL-monovette tubes containing citrate and they were immediatelyentrifuged (1850 × g, 4 ◦C, 12 min). The resulting supernatantsere transferred into polypropylene tubes and kept at −20 ◦C until
he day of analysis. They were rapidly thawed in a RT water bathnd immediately kept on ice and used as blank or spiked with theest peptides. The test peptides were added in plasma maintainedn ice and Guan-HCl was rapidly added to inhibit protease activi-ies (<10 min). However, our procedure does not fully consider theossible protease-mediated degradation of native peptides fromhe moment of blood withdrawal and centrifugation step to the
oment when plasma is eventually stored at −20 ◦C or −80 ◦C. Eachnalyst will have to fully consider and test a sample withdrawalrocedure. Various protocols can be chosen but were not investi-ated here because the test peptides were spiked in cold plasmafter the withdrawal step. The generic procedure for the extractionf the peptides is as follows: (1) plasma pretreatment: 750 �L of
Please cite this article in press as: H.R. Sobhi, et al., J. Chromatogr. A (2011)
he citrated plasma samples were mixed with 190 �L of 6 M Guan-Cl diluted in water (1.2 M final). Guan-HCl, a chaotropic agent,as added to unfold proteins and peptides, break protein–protein
nd peptide–protein interactions, reduce peptide adsorption as
PRESSr. A xxx (2011) xxx– xxx
well as inhibit or reduce protease activities; the resulted mixturewas kept on ice for 90 min and vortex-mixed every 30 min. (2)Protein precipitation: 940 �L of MeCN containing the internal stan-dard peptide at 1 nM was added to the plasma-Guan mix (1:1, v/v,aqueous/MeCN); after vortex-mixing, the plasma–MeCN solutionswere centrifuged at 1850 × g, 4 ◦C for 15 min. (3) Ultra-filtration:1500 �L of the supernatant was withdrawn and diluted with 500 �Lof H2O (reducing MeCN content to 37.5%) prior to its transfer toan ultrafiltration cartridge. The ultrafiltration cartridges were cen-trifuged at 9605 × g, 4 ◦C for 60 min. In order to reduce the release ofpolyethylene-glycol (PEG) in the filtrate, ultrafiltration cartridgeswere pre-washed using 4 mL of MeOH:H2O (2:8, v/v) (centrifu-gation 3000 × g, 4 ◦C for 10 min). (4) Finally, 1.6 mL of the filtratewas transferred into 1.8 mL polypropylene injection tubes, of which1.5 mL (2 × 750 �L) of the filtrate was injected into the LC–MS.
2.4. Overall protocol evaluation
The generic protocol was evaluated according to protein precipi-tation (PP) and ultrafiltration (UF) recoveries and matrix effects. Forthis purpose, test peptides were spiked in plasma at 1 or 5 nM beforeor after PP or in the supernatant before or after UF. The LC–MS peakarea ratios of spike before/after samples were determined for PPor UF recoveries. Matrix effects were evaluated quantitatively andqualitatively. Quantitative matrix effects were determined withspiked peptides at 5 nM in plasma filtrate (complete extractionprocedure) and in MeCN:water (37.5:62.5, v/v; corresponding tothe filtrate organic composition). The LC–MS peak area ratios ofspike matrix/no matrix samples were calculated for matrix effectdetermination. Qualitative matrix effects were determined usinga post-analytical column infusion of some test peptides at 250 nM(the infusion flow rate was 2 �L/min and merged with the mobilephase at 8 �L/min using a tee connector). The supernatant plasmafiltrates and control solutions (MeCN–water mix and filtrates fromthe full extraction of water) were injected. Peptide signal traceswere determined for the entire analytical run using XIC MS2 or MS3
product scan acquisitions for low and high detection specificity,respectively. Both chromatograms were compared, especially atthe specific time window of the peptide retention times.
Eventually, the calibration samples with spiked peptides inhuman plasma were extracted with the generic protocol and theresulting curves plotted using internal standard (IS) methodology.In order to achieve enough data points per peak, all peptides weredivided into two groups. A maximum of five product scan eventswere acquired and the XICs were plotted. SubP and LHRH were usedas IS’s and both were freshly prepared in MeCN at 1 nM and addedto plasma (see Section 2.3). The limits of detection, correspondingto an observed S/N ratio >3, curve fitting equations and coefficientof determination (R2) were also determined.
3. Results and discussion
3.1. Sample preparation and recoveries
During the early stages of our extraction protocol development,various contaminants were observed within our chromatograms(ion series). These contaminants came from plastic beads found inLithium–Heparin blood collection tubes and filtration cartridges.Using citrated plasma (no plastic beads in the S-monovettes) anda pre-clean step of the filter units (see Section 2), plastic con-taminants were almost completely removed. Guan-HCl had no
, doi:10.1016/j.chroma.2011.09.072
impact on plasma nor supernatant acidity (pH neutral) nor thepeptide recovery after protein precipitation (PP; Table 1) and noeffect on the efficiency of peptide trapping (data not shown). Theprotocol of sample preparation using PP with 1 vol MeCN and

ING Model
C
matog
uposwttnaMofa(cva1
Lncmtm5upspht(cHa
FMsgdS
ARTICLEHROMA-352575; No. of Pages 8
H.R. Sobhi et al. / J. Chro
ltrafiltration can virtually be applied to most therapeutic or nativeeptides. According to a previous report [31], the addition of 1r 1.5 vol of MeCN to plasma sample appeared to be a univer-al procedure to remove the most abundant and high moleculareight proteins from plasma. Indeed, MeCN is frequently used for
he depletion of plasma proteins in drug and peptide determina-ions [9,32]. Nevertheless, various PP mixtures were tested (dataot shown; methanol, various acids such as (v/v) 6% perchloriccid, 5% trichloroacetic acid, 5% trifluoroacetic acid, 2 volumes ofeCN and some acid/organic mixtures). Only the addition of 1 vol
f MeCN to plasma showed an excellent extraction recovery (≥90%)or all test peptides (Table 1). The PP recovery of PTH revealed that
co-precipitation occurs if ≥2 vol of MeCN are added to plasmarecovery ≤50%; data not shown). These findings showing such ao-precipitation at high MeCN content, are in agreement with pre-ious reports [8,33,34]. Therefore, a generic approach to depletebundant plasma proteins by PP, should consist of the addition of
(or 1.5) volume of MeCN added to the plasma sample [31].Direct injections of large volumes of PP supernatant onto our
C setup were tested but appeared to be incompatible with ourarrow capillary columns (e.g., limited number of injections beforelogging). Therefore, a better clean-up of the PP supernatants wasandatory. Thus, we transferred the PP supernatants into ultrafil-
ration (UF) 4 mL cartridges consisting of a regenerated celluloseembrane with a 30 kDa MWCO. The use of the more restricted
and 10 kDa MWCO membrane can improve supernatant clean-p but decreased significantly the test peptide UF recovery (mosteptides had UF recovery <50% and in some cases <10%; data nothown). Various filtration cartridges are available from various sup-liers. The compatibility of the filter cartridges (membrane and esp.older) with MeCN is a critical parameter. We constantly moni-ored the appearance of contaminants within our chromatograms
Please cite this article in press as: H.R. Sobhi, et al., J. Chromatogr. A (2011)
e.g., PEG ion series at m/z 44). As mentioned by the supplier, Ami-on Ultra-4 units from Millipore were compatible with 40% MeCN.owever, in order to reduce the release of PEG in the filtrates,
clean-up step of the cartridge was performed (see Section 2).
ig. 3. (A and B) Effect of an on-line dilution of large injected volume, 1stR, on peptides teCN:H2O (1:1, v/v) was injected on a 1 mm × 10 mm (i.d. × L) C8 column. With a 5× on-
ystem (see the arrows). In contrast, with a 10× dilution (B), the peptides are fully focuseradient is shown on the bottom chromatograms with a dashed line. See additional infouring peptide transfer from the trap to the analytical column. Compared with the absenee additional information in Sections 3 and 3.3.
PRESSr. A xxx (2011) xxx– xxx 5
Finally, it must be noted that the cost of ultrafiltration is equivalentto that of solid phase extraction.
Various LC–MS methods use a drying-reconstitution step inorder to concentrate the extracted peptides prior to their injectioninto the LC system [12,15,17,23]. However, from the beginning ofthe study one of our strategic goals was to avoid such concentrationsteps that are known to be a high risk for peptide loss or incline tochemical modification [35–38]. However, in order to improve sen-sitivity with this procedure, the LC system had to be compatiblewith large injection volumes containing high organic content. Thiswas realized by an on-line dilution of the injected sample (1stR, seethereafter; Fig. 2).
3.2. Peptide trapping
Large injection volumes of peptide solution containing 50%MeCN were tested on a C8 1 mm × 10 mm trap column using a 1D-LC setup with an on-line dilution of the injected sample. Using aloading pump, samples were removed from the loop at a flow rateof 100 �L/min and, using a dilution pump, mobile phase containingthe injected peptides were diluted 10× on-line with 1% FA in water.After 11 min, a delay allowing the 1 mL injection loop to be flushedand the peptides to reach the column, a LC gradient (300 �L/min,0–98% B in 5 min) was initiated with the dilution pump. With no or5× on-line dilution, most peptides are eluted at or near the deadvolume of the LC system (Fig. 3A and B; RT < 2 min). In contrast, witha 10× on-line dilution, all peptides tested here were fully focused onthe top of the trap column and therefore eluted within the stepwisegradient (data shown for 4 peptides only; Fig. 3A and B).
There are many publications that have previously reported onand evaluated large injection volumes (e.g., 0.5–1 mL) on variouscolumns of specific inner diameters [39–43]. They indicate that
, doi:10.1016/j.chroma.2011.09.072
large injected volumes onto capillary or narrow bore columns isa good strategy to improve the limit of detection. The refocal-ization on the trap column will depend on different parameters:mainly the injection solvent elution strength (e.g., % MeCN), the
rapping capacity. (A) Sample volume of 1 mL containing the peptides dissolved inline dilution (A), most peptides are eluted at or near the dead volume of the 1D-LCd on the top of the trap column and therefore elute within the gradient. Stepwise
rmation in Sections 3 and 3.2. (C and D) Effect of the second on-line dilution, 2ndR,ce of dilution (C), a 2× on-line dilution (D) significantly improves LC peak widths.

ING Model
C
6 matog
asppCcpwOi((wih#
taaitvcAtndncora
3
uitHiuwgi[dsiata
wf(cspn2
t2
a
ARTICLEHROMA-352575; No. of Pages 8
H.R. Sobhi et al. / J. Chro
nalyte retention factor and the column efficiency (e.g., i.d., length,tationary phase etc.) [42]. Various other trap columns with com-arable length and i.d. and various stationary phases were tested:olystyrene–divinylbenzene (PS–DVB), polymer based turboflowyclone® and Cyclone-P®, hypercarb or hydrophilic interactionhromatography phase (HILIC). They demonstrated poorer trap-ing efficiency with the tested peptides: broad or asymmetric peakidths and lower column trapping efficiency (data not shown).nly C18 stationary phases demonstrated a similar trapping capac-
ty. Considering the hydrophobicity index [44] of the test peptidesranging from 10 to 20), this result indicates that the 1 mm × 10 mmi.d. × L) C8 column is an excellent choice to trap most peptideshen the MeCN content of the mobile phase is ≤5%. In addition,
mprovement of trapping capacity have been achieved by usingeptafluoro- or trifluoro-acetic acid in the mobile phase of pumps1 and #2 (data not shown) [45].
The capability to trap peptides with large injection volumes con-aining a high organic percentage on an enrichment column is andvantage of this procedure since it can strongly reduce the surfacedsorption of large hydrophobic/amphiphilic peptides. Moreover,t avoids a drying-reconstitution step which can lead to loss of pep-ides [10]. In addition, the present procedure enables large injectionolumes, up to 1.5 mL (2 × 750 �L). This would seem more effi-ient than multiple smaller volume injections, e.g., 50–100 �L [41].lso, multiple injections do not always guarantee reliable peptide
rapping efficiency from the 1st to the last injection. Our prelimi-ary results using multiple injections showed a slight but constantecrease in peptide peak area/injection volume ratio, with theumber of consecutive injections (1–15) (data not shown). It indi-ates an incomplete peptide trapping with multiple injections withur conditions. In addition, 15 consecutive injections of 100 �Lather than 2 injections of 750 �L/sample is more time consumingnd will faster deteriorate the injection system.
.3. Peptide second refocusing
Within the literature, pre-concentration or 2-dimensional col-mn switching setups (PC-LC and 2D-LC, respectively) were used to
mprove separation efficiency, minimize the matrix effect, improvehe LOD’s and help achieve larger sample volume loadings [10].ypothetically, if similar quantities are loaded on column, a gain
n sensitivity is proportional to the ratio of the square of the col-mn i.d.: [(i.d. column #1)2/(i.d. column #1)2] [46]. It means that ife replace a 1 mm i.d. column with a 0.3 mm one, the theoretical
ain will be 11×. However, previous data has shown that the gains usually much lower than predicted although it is still significant47]. According to the literature, it is crucial to minimize the analyteispertion and to control the biomatrix and contaminant loadingince, once concentrated on the thinner column, they could signif-cantly impair ionization yield or chromatography. Thus, variousuthors have described on-line dilution during analyte transfer tohe analytical column in order to have narrower LC-peak widthsnd better LC resolution [45,48,39,26,49].
Thus, in order to improve LC resolution, a 2× on-line dilutionith FA 1% in water was applied during the transfer of peptides
rom the 1 mm i.d. trap column to the 0.3 mm i.d. analytical column2ndR, Fig. 2A). Compared with the absence of dilution, it signifi-antly improves LC peak widths for all tested peptides as well as theeparation efficiency (Fig. 3C and D). At low flow rates (<10 �L/min),eak widths are strongly dependant on post-column dispersion andon-specific binding. However, we have determined the gain ofndR. It appeared that the peak widths at half height of tested pep-
Please cite this article in press as: H.R. Sobhi, et al., J. Chromatogr. A (2011)
ides (unsmoothed data) are reduced between 1.4× and 2.5× whenndR was applied.
More generally, both on-line dilutions with pumps #2 and #4llow coupling of complementary stationary phases (e.g., C8/18 and
PRESSr. A xxx (2011) xxx– xxx
HILIC or CN) for peptide analysis [14,50]. Moreover, the pressureon the 0.3 mm × 50 mm capillary columns was <100 bar at a flowrate of 8 �L/min (4 and 4 �L/min for pumps #3 and #4). This iscompatible with and up to a 7 times dilution (4 + 24 �L/min forpumps #3 and #4, respectively) or with longer columns (L = 100 or150 mm) if a 2× dilution is applied as 2ndR.
3.4. Matrix effects, calibration curves and limits of detection
At first, significant positive matrix effects were observed sug-gesting an underestimation of the peptide peak area in controlsolutions or an overestimation of peak area due to the presenceof interfering ions in the matrix. In order to verify these initialresults, XIC chromatograms from MS3 acquisitions or with morespecific product ions were acquired and various solvent compo-sitions were used for the determination of control values. Fromall these measurements, the matrix effects, expressed as % ± SD ofmean control values (N = 3), were established as follows: 95 ± 13,134 ± 13, 45 ± 14, 109 ± 21, 72 ± 20, 132 ± 11, 27 ± 16, 70 ± 9 and55 ± 7 for �-MSH, BNP, C-Pep, SubP, PTH, LHRH, Orex-A, Orex-Band Ocyto, respectively. These quantitative results have to be con-sidered with care since all the parameters that can influence thisdetermination are not always apparent or controlled. For exam-ple, the risk of peptide loss by adsorption in the injector syringein the presence or absence of a matrix is difficult to evaluate.However, the matrix effect was also evaluated qualitatively usingMS2 product scan acquisitions with post-column infusion of someof the test peptides (see Section 2). Specific XIC infusion chro-matograms after the injections (1.5 mL) of water:MeCN controlsamples (62.5:37.5, v/v), extracted control samples (water sam-ple following the entire extraction procedure) and plasma extracts,were superimposed. No matrix effects were observed in the timewindow of the 5 test peptides showing the shortest retention times(Fig. 4). However, a significant negative matrix effect (up to a 2–3fold signal decrease) was observed in the time window of the testpeptides with the longest retention times. Finally, these qualita-tive and quantitative evaluations confirmed that matrix effect isinsignificant or moderate in the elution time window of the testpeptides.
Calibration curves were plotted for all test peptides. The curveswere treated as either linear or quadratic depending on the bestfit. Such quadratic fittings can be explained by the lack of iso-topic peptides used as IS and by the peptide charge states thatcan change within the concentration range of the calibration. Theprecision and accuracy of the calibrator determinations did notfulfil international guidelines (±15% and 85–115%, respectively).Accuracy and precision values ranged between 60% and 140% and±40%, respectively. Interestingly, for �-MSH, the external standardmethodology gave a better precision than the internal standardmethodology employing LHRH as IS. Indeed, the mean precisionswere 14.3% and 28.8% with the external and the internal stan-dard methodologies, respectively. It clearly indicates that isotopicIS are mandatory for precise and accurate data. However, the cal-ibration curves indicate that the sample preparation and LC–MSanalyses is robust enough for the quantification of all peptidestested here at mid-range picomolar levels in plasma. It would haveprobably fulfilled international guidelines if isotopic IS had beenused.
Limits of detection were evaluated (S/N >3) and are reportedin Table 1. Representative chromatograms (magnified or not) atthe LOD level (Fig. 5A and C) or of blank extracts containing the IS(Fig. 5B and D) and some calibration curves (Fig. 5E–G) are depicted.
, doi:10.1016/j.chroma.2011.09.072
The smaller peptides displayed higher sensitivities than the largerones with LOD’s in the range of 50 pM and 250 pM, respectively(Table 1). This is consistent with the idea that ionization yieldof peptides is inversely correlated to their molecular weights. As

ARTICLE IN PRESSG Model
CHROMA-352575; No. of Pages 8
H.R. Sobhi et al. / J. Chromatogr. A xxx (2011) xxx– xxx 7
Fig. 4. Matrix effect visualization in the entire LC–MS run. Post-column infusion of LHRH and Ocyto allow to draw the XIC traces and ionization intensity during the LC–MSa a extri with tp
rs<
3
fm
FD
nalysis. A 1.5 mL volume (2 × 0.75 mL) of water extract (dashed line) or blank plasmnjections of water gave similar traces than water extract (not shown). As observed
eptides showing the longest retention time.
eported by Legido-Quigley et al. [47] and as we observed, the sen-itivity gain by changing a 1 mm to a 0.3 mm analytical column was4× rather than the theoretical 11 times.
.5. Room for improvement
Please cite this article in press as: H.R. Sobhi, et al., J. Chromatogr. A (2011)
Whereas the present protocol is generic and compatible toast method development, there is still some room for improve-
ent. First of all, the LOD’s (50–750 pM) appears to be too high
ig. 5. LC–MS extracted ion chromatograms at the LOD plasma levels. The entire (A and B; containing the IS) plasma extracts. IS: internal standard; RT: retention time; AA: peak
act (plain line) are injected in duplicates and signal intensities are depicted. Similarhe traces of LHRH and Ocyto infusion, moderate matrix effects are observed for the
for many endogenous peptides in vivo. Indeed, expected levelsof signaling peptides in plasma is expected to range from 1 to50 pM in plasma. Interestingly, new generation mass spectrome-ters are significantly more sensitive than our 8-year-old linear iontrap. Thus, this apparent gain in sensitivity (estimated to be ≥10×)
, doi:10.1016/j.chroma.2011.09.072
should eventually allow the detection of native peptides plasmalevels in vivo, thus enabling researchers to study their kineticswithin humans. Secondly, this protocol has been tested on pep-tide mixtures spiked in plasma. No specific MS parameters have
) or magnified (C and D) LC runs are depicted for spiked (A and C) and blank (B andarea. The arrows indicate the RT of peptides in the blank plasma extract.

ING Model
C
8 matog
bitiFtciurtTttHsbiir
seprpcctp
4
sttsatbuIectd
mtteo
A
Rtailda
[[[
[
[[
[[[
[
[
[
[
[
[
[[
[
[
[
[
[
[[[[
[
[[
[
[[[[[[
[[
ARTICLEHROMA-352575; No. of Pages 8
H.R. Sobhi et al. / J. Chro
een tuned for a single peptide. Moreover, no peptide-specificsotopic standards have been added to plasma, although the addi-ion of isotopic standards and peptides carriers would certainlymprove the determination variability and decrease peptide losses.or instance, orexin A calibration curve intercepts the y-axis belowhe x-axis suggesting a loss of this peptide at the lowest con-entrations (Fig. 5E). Another concern is the total run time. Its about 50 min and corresponds to sample loading, 2 large vol-me injections, peptide trapping and the full chromatographicun after the back-flush. It is rather long when sequences con-ain calibrators, quality controls and tens of unknown samples.his is compatible with low-throughput analyses such as pep-idomics or short sequence of pharmacokinetic studies rather thanhe higher throughput found in routine or pharmaceutical labs.owever, this long total run time could be reduced to 20–30 min if
maller volumes were injected, if samples were loaded in the loopefore the end of the run (look-ahead injection) or if larger column
.d.’s were used allowing higher flow rates (2 or 3 mm and 1 mmnstead of 1 and 0.3 mm i.d. for the trap and analytical columns,espectively).
Finally, the described LC setup with an on-line dilution of loadedamples, is also compatible with off-line and on-line solid phasextraction (SPE), a type of extraction that is recommended foreptides by some authors.[10] In the case of off-line SPE, the drying-econstitution step would be useless and a large volume of eluates,ossibly diluted but still containing about 50% of organic content,ould be injected. With on-line SPE, a PP as pre-extraction stepould be performed and the supernatant could be injected becausehe on-line dilution of the sample should allow the trapping ofeptides.
. Conclusion
We have established a generic protocol for the determination ofmall and large peptides by LC–MS. It employs a protein precipita-ion followed by an ultrafiltration step as sample preparation withhe direct injection of the extract filtrate on a pre-concentration LCetup including 2 on-line refocalizations of analytes. This approachppears to be flexible because various protein precipitation solu-ions as well as ultrafiltration membrane cut-off can be tested andecause this particular LC-setup is compatible with various col-mn stationary phases, mobile phases and column inner diameters.
n addition, no drying steps are required and high MeCN contentxtracts (40–50%) is used throughout the procedure. These factorsoncerning the sample preparation appear to be an asset of this pro-ocol, especially when considering the high risk of peptide lossesuring extraction steps.
This protocol would also allow relatively rapid method develop-ent for many other sensitive peptide determinations, a tricky and
ime-consuming task. Finally, this generic extraction procedure forhe analysis of small and large peptides with various sequences, iso-lectric points and hydrophobicities, would appear to be a methodf choice for future peptidomic-type studies.
cknowledgements
We are thankful to Selina Günther, Nunzio Salluce, Fabienawyler, Sabine Lahrichi, Séverine Moret for their technical assis-ance, Prof. Thierry Buclin for salary funding, Professor Oleg Krokhinnd Dr Hugues Henry for fruitful discussions and to Dr. Steve Bruce
Please cite this article in press as: H.R. Sobhi, et al., J. Chromatogr. A (2011)
n the editing of this manuscript for publication. The authors wouldike to warmly thank the Michel Tossizza Foundation and the Fondsu Dr Ernest Rub, which contribute to the purchase of the LTQ-MSnd a capillary pump, respectively.
[
[
[
PRESSr. A xxx (2011) xxx– xxx
References
[1] P. Schulz-Knappe, M. Schrader, H.D. Zucht, Comb. Chem. High ThroughputScreen 8 (2005) 697.
[2] K. Boonen, J.W. Creemers, L. Schoofs, Bioessays 31 (2009) 300.[3] V. Hook, L. Funkelstein, D. Lu, S. Bark, J. Wegrzyn, S.R. Hwang, Annu. Rev. Phar-
macol. Toxicol. 48 (2008) 393.[4] H. Tammen, A. Peck, P. Budde, H.D. Zucht, Expert Rev. Mol. Diagn. 7 (2007) 605.[5] R. Richter, P. Schulz-Knappe, M. Schrader, L. Ständker, M. Jürgens, H. Tammen,
W.G. Forssmann, J. Chromatogr. B 726 (1999) 25.[6] L. Hu, K.S. Boos, M. Ye, R. Wu, H. Zou, J. Chromatogr. A 1216 (2009) 5377.[7] P. Schulz-Knappe, H.D. Zucht, G. Heine, M. Jürgens, R. Hess, M. Schrader, Comb.
Chem. High Throughput Screen 4 (2001) 207.[8] H. John, M. Walden, S. Schäfer, S. Genz, W.G. Forssmann, Anal. Bioanal. Chem.
378 (2004) 883.[9] I. van den Broek, R.W. Sparidans, J.H. Schellens, J.H. Beijnen, J. Chromatogr. B
872 (2008) 1.10] M. Ewles, L. Goodwin, Bioanalysis 3 (2011) 1379.11] F. Becher, A. Pruvost, G. Clement, J.C. Tabet, E. Ezan, Anal. Chem. 78 (2006) 2306.12] D. Chang, S.J. Kolis, K.H. Linderholm, T.F. Julian, R. Nachi, A.M. Dzerk, P.P. Lin,
J.W. Lee, S.K. Bansal, J. Pharm. Biomed. Anal. 38 (2005) 487.13] A. Brockmann, S.P. Annangudi, T.A. Richmond, S.A. Ament, F. Xie, B.R. Southey,
S.R. Rodriguez-Zas, G.E. Robinson, J.V. Sweedler, Proc. Natl. Acad. Sci. U.S.A. 106(2009) 2383.
14] K. Heinig, T. Wirz, Anal. Chem. 81 (2009) 3705.15] U. Lövgren, S. Johansson, L.S. Jensen, C. Ekström, A. Carlshaf, J. Pharm. Biomed.
Anal. 53 (2010) 537.16] M. Lortie, S. Bark, R. Blantz, V. Hook, Anal. Biochem. 394 (2009) 164.17] Z. Yang, J. Ke, M. Hayes, M. Bryant, F.L. Tse, J. Chromatogr. B 877 (2009) 1737.18] M. Berna, L. Ott, S. Engle, D. Watson, P. Solter, B. Ackermann, Anal. Chem. 80
(2008) 561.19] J.R. Whiteaker, L. Zhao, L. Anderson, A.G. Paulovich, Mol. Cell Proteomics 9
(2010) 184.20] C.X. Zhang, B.V. Weber, J. Thammavong, T.A. Grover, D.S. Wells, Anal. Chem. 78
(2006) 1636.21] U. Kobold, T. Dülffer, M. Dangl, A. Escherich, M. Kubbies, R. Röddiger, J.A. Wright,
Clin. Chem. 54 (2008) 1584.22] R. Goda, H. Masumoto, O. Okazaki, K. Sudo, Biomed. Chromatogr. 22 (2008)
1279.23] T. Oe, B.L. Ackermann, K. Inoue, M.J. Berna, C.O. Garner, V. Gelfanova, R.A. Dean,
E.R. Siemers, D.M. Holtzman, M.R. Farlow, I.A. Blair, Rapid Commun. Mass Spec-trom. 20 (2006) 3723.
24] M. Dubois, F. Becher, A. Herbet, E. Ezan, Rapid Commun. Mass Spectrom. 21(2007) 352.
25] H. Neubert, J. Gale, D. Muirhead, Clin. Chem. 56 (2010) 1413.26] E. Rogatsky, V. Tomuta, H. Jayatillake, G. Cruikshank, L. Vele, D.T. Stein, J. Sep.
Sci. 30 (2007) 226.27] J. Villanueva, J. Philip, D. Entenberg, C.A. Chaparro, M.K. Tanwar, E.C. Holland,
P. Tempst, Anal. Chem. 76 (2004) 1560.28] P.M. Van Midwoud, L. Rieux, R. Bischoff, E. Verpoorte, H.A. Niederländer, J.
Proteome Res. 6 (2007) 781.29] H. Tammen, I. Schulte, R. Hess, C. Menzel, M. Kellmann, P. Schulz-Knappe, Comb.
Chem. High Throughput Screen 8 (2005) 725.30] A. Pezeshki, V. Vergote, S. Van Dorpe, B. Baert, C. Burvenich, A. Popkov, B. De
Spiegeleer, J. Pharm. Biomed. Anal. 49 (2009) 607.31] R. Kay, C. Barton, L. Ratcliffe, B. Matharoo-Ball, P. Brown, J. Roberts, P. Teale, C.
Creaser, Rapid Commun. Mass Spectrom. 22 (2008) 3255.32] S. Souverain, S. Rudaz, J.L. Veuthey, J. Pharm. Biomed. Anal. 35 (2004) 913.33] B. Winther, P. Moi, E. Paus, J.L. Reubsaet, J. Sep. Sci. 30 (2007) 2638.34] L.P. Aristoteli, M.P. Molloy, M.S. Baker, J. Proteome Res. 6 (2007) 571.35] S.D. Speicher, O. Kolbas, S. Harper, S.W. Speicher, J. Biomol. Technol. 11 (2000)
74.36] A. Pezeshki, V. Vergote, S. Van Dorpe, B. Baert, C. Burvenich, A.B. Popkov, J.
Pharm. Biomed. Anal. 49 (2009) 607.37] K. Bluemlein, A. Raab, J. Feldmann, Anal. Bioanal. Chem. 393 (2009) 357.38] J.L. Reubsaet, J.H. Beijnen, A. Bult, R.J. van Maanen, J.A. Marchal, W.J. Underberg,
J. Pharm. Biomed. Anal. 17 (1998) 955.39] S.R. Wilson, F. Boix, A. Holm, P. Molander, E. Lundanes, T. Greibrokk, J. Sep. Sci.
28 (2005) 1751.40] M. Li, Y. Alnouti, R. Leverence, H. Bi, A.I. Gusev, J. Chromatogr. B 825 (2005) 152.41] M.L. Storme, R.S. t’Kindt, J.F. Van Bocxlaer, J. Sep. Sci. 32 (2009) 2346.42] M.J. Mills, J. Maltas, W.J. Lough, J. Chromatogr. A 759 (1997) 1.43] W. Naidong, Y.L. Chen, W. Shou, X. Jiang, J. Pharm. Biomed. Anal. 26 (2001) 753.44] O.V. Krokhin, V. Spicer, Anal. Chem. 81 (2009) 99522.45] Y. Alnouti, K. Srinivasan, D. Waddell, H. Bi, O. Kavetskaia, A.I. Gusev, J. Chro-
matogr. A 1080 (2005) 99.46] J. Abian, A.J. Oosterkamp, E. Gelpí, J. Mass Spectrom. 34 (1999) 244.47] C. Legido-Quigley, N.W. Smith, D. Mallet, J. Chromatogr. A 976 (2002) 11.
, doi:10.1016/j.chroma.2011.09.072
48] S. Rinne, C. Ramstad Kleiveland, M. Kassem, T. Lea, E. Lundanes, T. Greibrokk, J.Sep. Sci. 30 (2007) 1860.
49] I.P. Kema, W.G. Meijer, G. Meiborg, B. Ooms, P.H. Willemse, E.G. de Vries, Clin.Chem. 47 (2001) 1811.
50] S. Di Palma, P.J. Boersema, A.J. Heck, S. Mohammed, Anal. Chem. 83 (2011) 3440.